Embed Size (px)
Citation preview

DEPT. OF HEALTH AND SOCIAL SERVICES
OFFICE OF THE COMMISSIONER
FRANK H. MURKOWSKI, GOVERNOR
P.O. BOX 110601JUNEAU, ALASKA 9981 '·0601PHONE: (907) 465-3030FAX: (907) 465-3068
mLY 2006
Enclosed is the final report, Alaska Long Term Care and Cost Study, from the Public
Consulting Group (pCG), funded by the Alaska Mental Health Trust Authority and the
Department of Health and Social Services. This study provides an analysis of existing
long term care services in Alaska in 2006, a comparison ofthose services to long term care
systems in selected other states, and recommendations for improving Alaska's long term
care delivery system. Accompanying the recommendations is a cost comparison of
Alaska's system with and without the recommended changes, as well as a transition plan
for implementing changes.
The Department and The Trust recognize the need for carefully planned long term care
services as our state's population increases and ages. This report must be viewed in the
context of an increasingly complex and changing health care environment. both in Alaska
and nation wide. Alaska is planning for the future needs of the state through this study and
other similar efforts such as the Medicaid 20 year cost projection study completed by the
Lewin Group in 2006. The upcoming legislative Medicaid review due for completion in
the fall of2006 will also provide more helpful information. Additionally. the Trust and the
Department are engaging the Bristol Observatory to begin data collection to conduct
prevalence surveying for targeted groups of beneficiaries.
For many Trust beneficiaries. the programs outlined or suggested in the peG study
exemplify the reason the Trust was created: to provide quality community based services

that reduce the need for institutionalized services. Some recommendations from the Long
Term Care study affirm activities the Department already routinely performs. such as the
continued use of the Eden Model in the Pioneer Homes. (p. 39) and support of improving
the coordination and quality of the four waiver program in existence.
In other cases, the recommendations reinforce goals that the Department and the Trust are
already working toward, e.g.. developing a strategy for workforce recruitment and
retention in the long term care service delivery system (p. 32). Others have been or are in
the process of implementation, such as coordinating administration and delivery of
Personal Care Services and OAlAPD waiver services (p. 50) and developing a strategy for
renewal of the home and community-based waivers (p.50).
The Department and the Trust agree that now is a critical time in the development of an
effective and efficient long tenn care system. The evolution of fiscal and policy issues at
the federal, state and local level will all impact what is needed and what is achievable. In
order to develop a comprehensive review of these factors, the Department and the Trust
have agreed to convene a work group on beneficiary services to gather and update
information from the field, identify issues that need to be addressed and recommend policy
options for implementation to ensure that the needs of Trust beneficiaries and other
Alaskans who require long term supportive care services are appropriately met.
Karleen K. JacksoCommissionerDepartment of Health & Social Services
If eChief Executive DirectorAlaska Mental Health Trust

State of Alaska
Department of Health and Social Services Finance and Management Services
Division of Senior and Disabilities Services
AAALLLAAASSSKKKAAA LLLOOONNNGGG TTTEEERRRMMM CCCAAARRREEE
AAANNNDDD CCCOOOSSSTTT SSSTTTUUUDDDYYY
Final Report February 2006

State of Alaska Department of Health and Social Services
ALASKA LONG TERM CARE AND COST STUDY
FINAL REPORT
TABLE OF CONTENTS Section Page Executive Summary 1 I. Purpose 4
II. Methodology 7 III. System Analysis 9 IV. Comparison State Study 12
V. Increasing the Role of Other Payers in Alaska’s Long Term Care System 17 VI. Recommendations for Improving Alaska’s Long Term Care Delivery System 22
• Overarching Recommendations 24 • Nursing Home Recommendations 36 • Pioneer Home Recommendations 39 • General Relief Assisted Living Facilities Recommendations 43 • Medicaid PCA Services Recommendations 44 • Waiver Program Recommendations 46 • Grant Program Recommendations 62
VII. Cost Comparison for Improving Alaska’s Long Term Care Delivery System 64 VIII. Transition Plan 81 Appendices 87
Appendix A: System Analysis Appendix B: Assessment of Long Term Care Systems in Comparison States Appendix C: Preliminary Data Request Appendix D: List of Stakeholders Interviewed & Public Feedback Received Appendix E: HCBS Waiver Cost Proposal Worksheet Appendix F: March 6, 1997 Medicaid Letter, ‘Guidelines Regarding What Constitutes
an ICF/MR Level of Care under a Home and Community-Based Services Waiver’
Appendix G: Fiscal Impact of 2004 Regulations on Waiver Expenditures Appendix H: OA Waiver Users, Days of Service, and Costs, FY 94-04 Appendix I: APD Waiver Users, Days of Service, and Costs, FY 94-04 Appendix J: MR/DD Waiver Users, Days of Service, and Costs, FY 94-04 Appendix K: CCMC Waiver Users, Days of Service, and Costs, FY 9404
Appendix L: Nursing Home Bed Demand and Estimated Future Costs Appendix M: Data Analysis of Long Term Care Services in Alaska Census Areas Index of Tables 173 List of Acronyms 175

State of Alaska Department of Health and Social Services
ALASKA LONG TERM CARE AND COST STUDY
FINAL REPORT
Final Report Page 1
EXECUTIVE SUMMARY The Alaska Department of Health and Social Services (DHSS), Finance and Management Services (FMS), in conjunction with the Division of Senior and Disabilities Services (DSDS), contracted with Public Consulting Group, Inc. (PCG) in September of 2005 for the purpose of reviewing and evaluating the programmatic and fiscal components of Alaska’s long term care system. Individuals served by Alaska’s long term care system—people who are aging, people with dementia, people with traumatic brain injuries, people with physical disabilities, and people with developmental disabilities—currently face a system challenged by the state’s vast geographic composition, extreme climate and dramatically changing demographics, which remains fragmented and without an overarching infrastructure. DHSS also continues to struggle with Medicaid budget growth and cost effectiveness. As a result, Alaska suffers from parallel systems of care, ineffective rates, and a continuum of long term care that does not provide complete and consistent delivery of services. Moreover, the unique evolutionary nature of Alaska’s system has made it increasingly difficult to accurately measure performance and outcomes across a wide range of providers. These factors provided the catalyst for Alaska’s request of PCG to conduct a comprehensive system analysis and recommend possible solutions for change. PCG employed the following methodology in order to complete a system analysis of Alaska’s long term care system and develop recommendations for change over periods of 3, 10, and 20 years:
• Completion of the project kick-off conference call; • Development and execution of a comprehensive data collection process; • Scheduling of an on-site visit to conduct stakeholder interviews and gather additional data; • Analysis of collected data in order to draft the Interim Report; • Acquisition of stakeholder feedback on the Interim Report; and, • Revision of the Interim Report with stakeholder input to produce a draft of the Final Report.
First, PCG completed a system analysis, which revealed that there remains much work to be done for a complete integration of aging services and disabilities services in Alaska. Based on extensive interviews with key staff and stakeholders and a thorough review of program documents, the program areas still function primarily independent of one another. As such, there remains a fair amount of misunderstanding on the similarities and differences between the individuals who are served by DSDS. In addition, the following findings regarding the current system of long term care in the state were made: 1. Since there is limited availability of community services in Alaska, many individuals are placed
in nursing facilities that do not desire nursing home settings.
2. There is a perception among private providers that Pioneer Homes receive more funding and attention from the state system than other assisted living facilities.
3. There is unused capacity in the Pioneer Homes.
4. The Pioneer Homes need to improve their ability to collect, analyze and report Medicaid-related information.
5. General Relief Assisted Living Homes services should continue to be provided to Alaska’s consumers.
6. Determination of need for PCA services has not used a consistent assessment process.

State of Alaska Department of Health and Social Services
ALASKA LONG TERM CARE AND COST STUDY
FINAL REPORT
Final Report Page 2
7. Oversight and monitoring of the PCA program has not yet been fully addressed.
8. There are key issues regarding PCA staff availability and training that need to be addressed.
9. PCA and waiver services substantially overlap: both programs are used by the same consumers, who receive similar services from similar providers.
10. HCBS Waivers renewals will need to be done using the new waiver format which includes new requirements for quality assurance and stakeholder input.
11. Current approaches to the delivery of case coordination, plan of care development, and quality assurance need to be reviewed and modified based on an objective assessment of need.
12. Alaska does not currently have HCBS waivers for people with Traumatic Brain injury (TBI) or Alzheimer’s Disease and Related Dementias (ADRD).
13. The lack of consistent cost reporting standards leads to duplicate counting of indirect or inclusion of non-allowable costs.
14. Grant dollars from sources such as the Alaska Mental Health Trust Authority, which are used to pilot new and innovative service approaches, do not appear to include a process to evaluate the success of the pilot, the outcomes achieved and whether or not the pilot should become an ongoing part of the base budget. Without this type of routine mechanism, the sustainability and importance of these pilots is not routinely reviewed.
Then, a comparison state study involving 6 states was undertaken to: (a) ascertain the directions in which other states’ long term care systems are moving; (b) identify effective, unique programs and services in other states; (c) detail the reimbursement methodologies and rate setting strategies in other states; and (d) from the analysis of comparison state information, recommend programs, services, reimbursement methodologies, and rate setting strategies for integration into the current long term care operations, to enhance or expand the state’s system of care. Wyoming, Maine, Michigan, Minnesota, Vermont, and New Mexico were selected by Alaska for review because of their notable programs and services, similar geographic challenges and demographic constitution, and unique reimbursement methodologies. The overarching findings and implications from this study assisted in the development of the report’s recommendations. Next, PCG analyzed the current role of other payers in Alaska’s long term care system and developed recommendations surrounding the feasibility of enhancing their participation as a means to defray the current and future costs for long term care services. The opportunities PCG views as available to Alaska to defray long term care costs are as follows: increase individual responsibility (self-pay) options; expand options for and aggressively market private long term care insurance (LTCI); increase participation from tribal health providers to leverage 100% federal reimbursements; expand the partnership with the Veterans’ Administration (VA); and, improve the Estates Recovery Program in Alaska. Then we developed recommendations for Alaska’s system of long term care, based on what services currently exist or do not exist as part of Alaska’s continuum of care. While there are multiple service options for Alaskans with long term care needs, we believe that steps need to be taken to enhance and expand existing services, as well as develop new services where gaps currently exist. In developing our recommendations, PCG sought to minimize the fiscal impact of proposed changes. Where possible, we made recommendations that do not require expensive administrative and financial changes to state
State of Alaska Department of Health and Social Services
ALASKA LONG TERM CARE AND COST STUDY
FINAL REPORT
Final Report Page 3
budgets, computer systems, or staff levels and do not require providers to incur significant costs to alter their service delivery. We separated our recommendations into Alaska’s major long term program settings to more clearly illustrate the areas in which the state’s LTC system faces the most significant challenges. These categories include:
• Overarching Recommendations • Nursing Home Recommendations • Pioneer Homes Recommendations • General Relief Assisted Living Facilities Recommendations • Personal Care Assistant Services Recommendations • Waiver Program Recommendations • Grant Program Recommendations
Finally, PCG developed a Transition Plan to assist the State of Alaska to restructure the system of long term care over the next 3, 10, and 20 years. The Transition Plan provides DHSS with a framework for addressing the recommendations in this report with respect to the resources available. We identified recommendations that can be addressed by DHSS over 3-year and 10-year time periods. While we did not suggest that any of the proposed recommendations be addressed beyond the 10-year time period, we have provided DHSS with some key elements that should be kept in mind for the 20-year time period. The Transition Plan will serve as a blueprint for change as DHSS and its constituents begin to redesign Alaska’s long term care service delivery system. In conjunction with the recommendations and Transition Plan, the PCG team identified which recommendations may require legislative changes, delineated the party responsible for undertaking each particular effort, and noted the fiscal impact of each recommendation and their respective source of funds.

State of Alaska Department of Health and Social Services
ALASKA LONG TERM CARE AND COST STUDY
FINAL REPORT
Final Report Page 4
I. PURPOSE The Alaska Department of Health and Social Services, Finance and Management Services, in conjunction with the Division of Senior and Disabilities Services, contracted with Public Consulting Group, Inc. in September of 2005 for the purpose of reviewing and evaluating the programmatic and fiscal components of Alaska’s long term care system. Individuals served by Alaska’s long term care system—people who are aging, people with dementia, people with traumatic brain injuries, people with physical disabilities, and people with developmental disabilities—currently face a system challenged by the state’s vast geographic composition, extreme climate and dramatically changing demographics, which remains fragmented and without an overarching infrastructure. DHSS also continues to struggle with Medicaid budget growth and cost effectiveness. As a result, Alaska suffers from parallel systems of care, ineffective rates, and a continuum of long term care that does not provide complete and consistent delivery of services. Moreover, the unique evolutionary nature of Alaska’s system has made it increasingly difficult to accurately measure performance and outcomes across a wide range of providers. These factors provided the catalyst for Alaska’s request of PCG to conduct a comprehensive system analysis and recommend possible solutions for change. As noted in the RFP, the expected outcomes of this project were delineated as follows:
(1) A comprehensive review and analysis of Alaska’s long term care delivery system. This system analysis should include the following DSDS programs: the Senior and Community Developmental Disabilities Grants; Medicaid 1915(c) waiver services rendered under the Older Alaskan (OA); Adults with Physical Disabilities (APD); Developmental Disabilities (DD); Children with Complex Medical Conditions (CCMC) Waivers; Medicaid Personal Care Assistant (PCA) services; the General Relief Assisted Living Homes program; and the Division of Alaska Pioneers' Home services, as well as any other services and funding sources presently available in Alaska for addressing the long term care needs of the target populations.
The analysis provided to the state should address whether the needs of the target populations are being met by existing programs, and if so, whether the mix of services available is appropriate and efficient. Additionally, the cost per client for services should be assessed, and the analysis should make an effort to include findings on any variance of costs attributable to geography, economies of scale variances, or reimbursement methodologies. On a summary level, the completed system analysis should accurately identify the efficiencies and inefficiencies of Alaska’s system of providing long term care.
(2) A comparison of Alaska’s long term care delivery system with that of other states. As part of this project, Alaska is seeking information from other states as to how they provide similar long term care services to their residents, the cost of those services, and the specific rate setting methodologies. The data obtained from this research will help guide the state’s decisions regarding recommended changes to their long term care system.

State of Alaska Department of Health and Social Services
ALASKA LONG TERM CARE AND COST STUDY
FINAL REPORT
Final Report Page 5
(3) Recommendations for improving Alaska’s long term care delivery system over the next 3, 10, and 20 years.
Another outcome expected by Alaska through this engagement is a set of recommendations for improving the state’s long term care delivery system. The recommendations proposed should suggest: modifications to the mix of long term care services currently offered by the state; an appropriate structure of reimbursement methodologies for long term care service providers in Alaska; available strategies to increase the role of other payers within the system of care; and a cost comparison between Alaska’s long term care system at present and that of a system that has implemented all recommendations proposed. Projections for state and total expenditures for 3, 10, and 20 years in the future should be included within this set of recommendations.
(4) Develop and propose a transition plan that offers strategies for change.
The final outcome of this project that has been identified by the Alaska Department of Health and Social Services is a proposed, detailed set of strategies for implementing the recommendations for system of care change that have been suggested. These strategies should combine seamlessly into a transition plan for Alaska. The plan should break down the integration of each suggested change into distinct steps and include a timeline for each step of implementation. Additionally, the transition plan should take into consideration the internal architecture of Alaska’s Department of Health and Social Services, as well as the uniqueness of Alaska itself—for instance, its geography, population of residents, and cultural mix.
The challenges faced in planning a system of long term care for the State of Alaska reflect the uniqueness of the state. Almost every state faces issues of geography, cultural diversity and community integration. However, these factors are magnified in Alaska by the vastness of the geography and the multitude of cultures that are encompassed within the state. Consequently, Alaska’s vast geography and cultural diversity have a significant impact on the integration of the state’s long term care system and those individuals who utilize its services. Throughout the process of developing this report, stakeholders have expressed that a key component for the long term care system must be a focus on community services that support people with developmental disabilities, physical disabilities, traumatic brain injury, and seniors in order to allow these individuals to live and work in the community of their choice. At the same time, there was acknowledgement of limits to what can be provided in every community setting within the state, and that the health, safety, and well-being of people must be assured. This may mean that options and choices become more limited as needs increase or end-of-life issues are faced. The values which guided the development of this report included:
• the provision of an integrated, seamless array of supports and services; • support for people to live in their own home or community as long as possible; • ensuring that cultural values and mores are integral to the system design; • acknowledgement that geographic realities impact citizens’ choices and options; and, • incorporating quality assurance measures into the system, to ensure that health, safety and
well-being are regarded as essential and so that it is acknowledged that resources are not endless.

State of Alaska Department of Health and Social Services
ALASKA LONG TERM CARE AND COST STUDY
FINAL REPORT
Final Report Page 6
These principles should be kept in mind when reviewing the findings and recommendations of this report and as decisions are made regarding what changes will be made to this evolving system.

State of Alaska Department of Health and Social Services
ALASKA LONG TERM CARE AND COST STUDY
FINAL REPORT
Final Report Page 7
II. METHODOLOGY A. Project Kick-Off Conference Call PCG began this engagement with the facilitation of a project kick-off meeting via conference call. The PCG project team spoke with staff members participating in this engagement from the Advisory Committee, made up of members from the Office of the Commissioner, Finance and Management Services, Division of Senior and Disabilities Services, Division of Behavioral Health, Alaska Commission on Aging, Governor's Council of Disabilities and Special Education and The Alaska Mental Health Trust Authority via conference call in order to provide team member introductions, ensure that all project goals and objectives were understood, and that the scope of work described in the project work plan included all of the necessary steps to achieve the desired outcomes. During this meeting, PCG had the opportunity to discuss and determine which data elements needed collection from the Alaska staff by completing a walk-through of an initial data request document. The walk-through also allowed for responsible parties to be delineated for each data request item. Further, our discussion provided Alaska team members with the opportunity to relay their thoughts, suggestions, and concerns with regard to the project, which were noted by the PCG team. B. Data Collection Process After the initial data request document was revised with input from the Project Kick-Off Meeting, including the delineation of a responsible party for each data item, it was distributed among the Alaska team members. Data was forwarded to PCG as it was collected by Alaska staff. Upon receipt of data items, the data request document was updated by PCG and shared with Alaska. The completed data request document has been included in Appendix C of this report. Smaller follow-up data requests were sent to individual staff in Alaska by PCG team members if there was a need for further information. The members of the Alaska team provided extensive, valuable data request information in a timely fashion, in a true spirit of effective cooperation. C. On-Site Visit During the first and second weeks of November, the PCG team traveled on-site to Juneau, Fairbanks, and Anchorage to collect further data by conducting interviews with a representative state staff and relevant stakeholders. Additionally, the PCG team attended several task force meetings in order to gain stakeholder feedback: team members attended sessions of the 2005 Aging and Disability Policy Summit on November 7, 2005 in Anchorage and attended the Real Choice Systems Change Consumer Task Force meeting on November 8, 2005 in Anchorage. Several team members also participated in guided tours of long term care facilities in order to obtain a first-hand account of this particular type of long term care program. D. Drafting the Interim Report After the site visit, the PCG project team gathered, sorted, and analyzed all of the data received and information collected as part of and independent from the site. A number of follow-up interviews were conducted with Alaska stakeholders to ensure that a broad range of perspectives were known and incorporated into the report. PCG developed a final version of the Interim Report once all of these steps

State of Alaska Department of Health and Social Services
ALASKA LONG TERM CARE AND COST STUDY
FINAL REPORT
Final Report Page 8
were complete. The Interim Report was then submitted to DHSS for review along with the intent of distributing it to stakeholders to collect input on the findings and interim recommendations. E. Acquisition of Stakeholder Feedback Gathering stakeholder input on the Interim Report was considered a high priority by both the state and PCG throughout this project. Substantial steps were taken during the data collection and discovery phase of this project to interview stakeholders with a variety of perspectives and involvement in the long term care service delivery system across the state. In order to ensure that stakeholders also had the opportunity to provide input on the findings and recommendations of the Interim Report, PCG and DHSS distributed the report to stakeholders statewide. Once received, stakeholders were provided with the opportunity to provide comments via mail, electronic mail, and in person at a scheduled meeting that was held via statewide video conferencing. Stakeholder input was a focal point throughout the development of this report and will continue to be an element that influences all project deliverables for DHSS. F. Revision of the Interim Report/Drafting of the Final Report The stakeholder feedback obtained through the distribution and presentation of the Interim Report was analyzed by the PCG project team and then incorporated to produce a draft version of the Final Report. The input received was also critically assessed by the PCG team so that the report’s recommendations best align with the long term and short-term goals of DHSS, FMS and DSDS. Along with finalizing the recommendations for the long term care system in Alaska, this phase of work also involved the development of a plan for introducing the recommendations into the current system of care that is present in Alaska. This transition plan was written as specifically as possible to ensure proper oversight of the changes and a smooth shift towards an enhanced long term care service delivery system. A final round of revisions by the Alaska team was completed prior to the realization of this Final Report.

State of Alaska Department of Health and Social Services
ALASKA LONG TERM CARE AND COST STUDY
FINAL REPORT
Final Report Page 9
III. SYSTEM ANALYSIS Note: PCG’s exhaustive System Analysis, which contains an overview of the long term care programs currently operated by the State of Alaska, documents PCG’s analysis of each program along with findings from that analysis, and denotes the strengths and limitations of the system, can be found in Appendix A of this report. Present Infrastructure The Department of Health and Social Services (DHSS) is the umbrella agency that includes the following divisions: Senior and Disabilities Services; Alaska Pioneer Homes; Public Assistance; Public Health; Children’s Services; Health Care Services; Juvenile Justice; Financial Management Services; and Behavioral Health. In addition, there are Boards and Commissions associated with DHSS, including but not limited to: the Alaska Commission on Aging; the Alaska Mental Health Board; the Governor’s Advisory Board on Alcoholism and Drug Abuse; the Governor’s Council on Disabilities and Special Education; the Medical Care Advisory Committee; the Pioneer Homes Advisory Board; and the Suicide Prevention Council. Creation of the Division of Senior and Disabilities Services (DSDS) Prior to July 2003, the Division of Senior Services (DSS), which included the administration of the OA and APD waivers, was housed within the Department of Administration. Then, in July of 2003, a significant system change occurred in Alaska: DSS was combined with the developmental disabilities division of DMHDD to form the Division of Senior and Disabilities Services (DSDS), to be housed under DHSS. The Mental Health division of DMHDD became part of Behavioral Health, which is also housed under DHSS. DSDS was created for the purpose of integrating the focus and approach of the service systems for Alaskan citizens needing long term care services. There remains much work to be done for a complete integration of aging services and disability services in Alaska. Based on extensive interviews with key staff and stakeholders, as well as a thorough review of program documents, the program areas still function primarily independent of one another. As such, there remains a fair amount of misunderstanding on the similarities and differences between the individuals who are served by the program areas. While both the aging population and the disabled population are recipients of long term care services, individuals with developmental disabilities are likely to receive a certain level of support throughout their entire life, which will vary in intensity based on the individual’s developmental needs, natural supports, and ability to gain and maintain skills. On the other hand, for seniors, the need for long term care comes later in life. However, individuals with developmental disabilities, with physical disabilities, and the aging all want to live as independently as possible, in their home communities, in their own homes, and maintain relationships with family and friends for social and cultural reasons. The type and cost of life-long services and supports is also significantly different for these populations. The recommendations of this report will address the issue of the division merger and how to further integrate staff and services from the program areas.

State of Alaska Department of Health and Social Services
ALASKA LONG TERM CARE AND COST STUDY
FINAL REPORT
Final Report Page 10
Target Population The specific populations covered by this long term care study include: the aging population; individuals with dementia; individuals with traumatic brain injuries; individuals with physical disabilities; and individuals with developmental disabilities. The scope of this study did not exclusively address individuals whose primary disabilities are mental illness or substance abuse. However, we have made attempts to address the co-occurring mental health and substance abuse elements of long term care for the relevant target populations.
Table III-1: Estimated Consumers Served Annually by DHSS, Distributed by Target Populations (FY05)
Target Population Number Served by DHSS
(Annual Approximation) Aged 12,300 Individuals with Dementia 1,700 Individuals with Traumatic Brain Injury (TBI) Unknown Individuals with Physical Disabilities 1,250 Individuals with Developmental Disabilities (DD) 2,700
Source: State of Alaska, Department of Health and Social Services Services for the aging population, adults with physical disabilities, and persons with developmental disabilities are provided through the Division of Senior and Disabilities Services. The Division has nine service principles upon which its work is based:
• services promote personal dignity and respect and provide an opportunity for individuals to receive services that further their physical, mental, spiritual and emotional health;
• individuals attain and maintain personal and stable financial independence at the highest level for as long as possible;
• individuals are offered support and services necessary to live and age in their chosen community in the least restrictive (developmentally and age appropriate) environment and are free to pursue their life goals;
• services are designed and delivered to build communities where all members are included, respected and valued;
• personal choice, satisfaction, safety and positive outcomes are the focus of services for individuals and their families;
• services incorporate the cultural and value system of the individual;
• integrated and comprehensive services are readily available and accessible to individuals where they live;
• individuals and their families identify, design, control, implement and evaluate their services; and,
• service is provided by competent, adequately trained and compensated staff that are chosen by individuals and their families.

State of Alaska Department of Health and Social Services
ALASKA LONG TERM CARE AND COST STUDY
FINAL REPORT
Final Report Page 11
The principle statements of DSDS are listed here to reinforce their significance to the residents of Alaska and also because the PCG team used each of these principles as a touchstone to evaluate the recommendations that have resulted from this study of Alaska’s long term care system. For each of the six programs housed within Alaska’s long term care service delivery system, as denoted below, the PCG team: generated an overview of the program’s structure and a synopsis of the services managed by the program; provided an analysis of each program revealing whether or not the needs of target populations are being met, if services within the program are appropriate and efficient, if the funding for the program is sufficient/appropriate, an analysis of costs per client for the program, and any findings on variance of costs attributable to geography, economies of scale variances, or reimbursement methodologies; described any Commissions and Boards in the state that influence long term care policy and funding for the program; and designated specific findings for each program stemming from our comprehensive analysis:
• Nursing Homes • Pioneer Homes • General Relief Assisted Living Facilities • Medicaid PCA Services • Waiver Programs • Grant Programs
In reviewing the System Analysis section of this report, the reader should note that each set of program-specific findings that resulted from our review of Alaska’s current system of long term care services address both programmatic and reimbursement issues and are denoted as such. An additional note for readers is that the report’s recommendations for improving Alaska’s system of long term care, stated in Section VI, are based on the findings asserted in the System Analysis. Therefore, we suggest that the System Analysis section, found in Appendix A of this report, is read and understood prior to the review of our recommendations. Reading in this sequence will allow the reader to develop a full awareness of the Alaska long term care system currently in place, its strengths and shortcomings, before envisioning the long term care system as proposed by PCG through our recommendations.

State of Alaska Department of Health and Social Services
ALASKA LONG TERM CARE AND COST STUDY
FINAL REPORT
Final Report Page 12
IV. COMPARISON STATE STUDY Note: The background research and information obtained from the six comparison states included in this study, which produced the findings conveyed within this section of the report, can be found in Appendix B. Purpose
A review and analysis of other states’ long term care systems was included under the scope of work for this engagement, as outlined in the project’s original Request for Proposals (RFP). More specifically, the RFP asked for a direct comparison of Alaska’s present system of long term care with those systems present in at least two other states in order to determine the extent to which Alaska’s system offers a range of services comparable to others, with respect to efficiency and cost effectiveness. The goal of this comparison state study was to: (a) ascertain the directions in which other states’ long term care systems are moving; (b) identify effective, unique programs and/or services in other states; (c) detail the reimbursement methodologies and rate setting strategies in other states; and (d) from the analysis of comparison state information, recommend programs, services, reimbursement methodologies, and/or rate setting strategies to the State of Alaska for integration into their present long term care operations, in order to enhance or expand the state’s system of care. Methodology To produce this review and analysis of comparison state long term care systems, the PCG team first queried the Alaska project team for the names of several states that might be of interest to cover within this study, due of their notable programs and services, similar geographic challenges and demographic constitution, or unique reimbursement methodologies. An in-depth discussion with the Alaska team about this topic lead to the development of a list of six states to include in the comparison state study: Wyoming, Maine, Michigan, Minnesota, Vermont, and New Mexico.
Once the comparison states had been decided upon, a list of correlating contacts was generated. Contacts were identified either through assistance from the Alaska project team, from sources previously identified and utilized by PCG team members, or from independent research.
Next, a data request for distribution to the comparison states was produced through discussions between PCG and Alaska and through internal discussions as a project team. The completed data request inquired about each state’s available spectrum of long term care programs and services, then asked for detail on the populations served by these programs and services, the accessibility of mental health and/or substance abuse services in relation to each program, if any providers received 100% FFP for being an Indian Health Service provider, the main stream of funding for each program, the cost per diem for each program and/or service, and the rate setting methodologies used. The data request also asked for each state to identify problems, issues, or service gaps present in any of the programs listed and to note whether any current or proposed initiatives, designed to control costs, existed in the state. Each data request was sent to the state contacts via email, along with an attached cover letter from Alaska’s Medicaid Director.
State of Alaska Department of Health and Social Services
ALASKA LONG TERM CARE AND COST STUDY
FINAL REPORT
Final Report Page 13
If responses were not received from states by the deadline of November 11, 2005, as noted in the cover letter and email correspondence, each individual was contacted by PCG to determine the status of the data request. Additionally, Alaska’s Medicaid Director sent out an additional request to all state Medicaid Directors for their assistance with responding to the questionnaire, which greatly influenced our collection of data. The follow-up communication to the states generated insightful questionnaire responses from three of the selected comparison states by the time of this report, although all six said they would provide a written response by the time of the final report. The data analysis that follows below covers all six of these selected states. Overarching Findings and Implications for Alaska
1. In 2001, Medicaid was the second-largest budget item for most states and paid for 44 percent of
the nation’s estimated $132 billion in long term care (LTC) spending.1 While institutional care consumes 70 percent of Medicaid LTC spending, public demand and the 1999 Olmstead Supreme Court decision now requires that states expand alternative home and community-based service programs.2
In 2004, Alaska spent approximately 26.6% more of its Medicaid LTC funding than the national average on community-based services, including HCBS waiver services, personal care services, and Medicaid home health services. Conversely, Alaska spent 26.6% less of its Medicaid LTC funding on institutional services, including nursing home care and ICF-MR services. Please see Table IV-1 below for further detail on these statistics.
Alaska’s spending in the two areas of Medicaid-funded long term care—namely, more than the
national average on community-based services and less than the national average on institutional services—creates a positive impact on the long term care of Alaskans, as this strategy supports the concept of allowing individuals to remain in their homes and receive treatment in a setting that is most comfortable to them. Therefore, Alaska’s plan for allocation of long term care funds should remain unchanged in order to further shift away from higher costing, more restrictive institutional care and to increase investment in the provision of services for its citizens through community-based approaches to service delivery.
1 National Association of State Budget Officers, 2001 State Expenditure Report (Washington: NASBO, 2002); and K. Levit et al., "Trends in U.S. Health Care Spending, 2001," Health Affairs 22, no. 1 (2003): 154–164. 2 Centers for Medicare and Medicaid Services, "Americans with Disabilities/Olmstead Decision," cms.hhs.gov/olmstead/default.asp (21 October 2004); S. Eiken and B. Burwell, Medicaid HCBS Waiver Expenditures, FY 1995 through FY 2001 (Cambridge, Mass.: Medstat Group, 13 May 2002); D. Grabowski et al., "Recent Trends in State Nursing Home Payment Polices," Health Affairs, 16 June 2004, content.healthaffairs.org/cgi/content/abstract/hlthaff.w4.363 (2 August 2004); NewsHour with Jim Lehrer/Kaiser Family Foundation/Harvard School of Public Health, National Survey on Nursing Homes (Washington: Henry J. Kaiser Family Foundation, October 2001); and A. Stewart, J. Teitelbaum, and S. Rosenbaum, Implementing Community Integration: A Review of State Olmstead Plans (Washington: George Washington University Medical Center, Center for Health Care Strategies, 2002).

State of Alaska Department of Health and Social Services
ALASKA LONG TERM CARE AND COST STUDY
FINAL REPORT
Final Report Page 14
Table IV-1: Distribution of Medicaid Long Term Expenditures, Institutional vs. Community-Based Services, FY 2004
Minnesota $1,373,147,365 55.9%Michigan $677,712,212 28.2%New Mexico $422,462,453 67.6%Maine $273,534,108 46.9%Alaska $175,663,579 62.1%Vermont $143,355,562 57.7%Wyoming $88,804,680 53.4%United States $31,718,200,608 35.5%
Minnesota $1,085,121,954 44.1%Michigan $1,723,158,272 71.8%New Mexico $202,759,233 32.4%Maine $309,491,556 53.1%Alaska $107,091,559 37.9%Vermont $105,193,772 42.3%Wyoming $77,461,323 46.6%United States $57,596,852,858 64.5%
Minnesota Michigan New Mexico Maine Alaska Vermont Wyoming United States
$248,549,334$166,266,003
State Community-Based Services*
*Includes HCBS waivers, personal care and home health services.
$583,025,664
State Institutional LTC Services**
Expenditures % of Total Medicaid LTC Dollars
$89,315,053,466
Expenditures % of Total Medicaid LTC Dollars
**Includes nursing homes services and ICF-MR services.
Total LTC Expenditures
$2,458,269,319$2,400,870,484
$625,221,686
$282,755,138
State
Source: MEDSTAT data obtained from DHSS.
2. A single point of entry into the long term care system of a state for each type of population is
stressed in many of the comparison states, including Minnesota, Michigan, and Maine. This is something that Alaska’s present system of long term care is without. A service methodology with a single point of entry could be implemented in Alaska and would greatly enhance their residents’ access to services.
3. Many states are using the Internet for long term care purposes, such as assessments, service updates, and provider contact information, because of geographic challenges. In Michigan and Maine, this is the case. Alaska’s long term care system should consider the utilization of online service assessments, although there will be some technological challenges in implementing this process, as the launch of this technology would assist DHSS in managing one of its many challenges, the rural geography of the state.
4. A more comprehensive Quality Assurance (QA) methodology needs to be integrated into Alaska’s long term care system. Both Minnesota and Maine have incorporated successful QA processes into their state’s continuum of care. Alaska should review the QA measures that

State of Alaska Department of Health and Social Services
ALASKA LONG TERM CARE AND COST STUDY
FINAL REPORT
Final Report Page 15
Minnesota and Maine regularly utilize in order to develop their own process for quality assurance in long term care services.
5. Increased capacity in the state for assisted living care for those individuals with Alzheimer’s
disease were settings noted by Alaska stakeholders as needed in Alaska’s current system of long term care. Minnesota and Vermont have both expanded their capacity for serving these individuals in specialized assisted living settings. Minnesota has created what it calls Memory Care Facilities, a specialized type of assisted living that is designed for persons with Alzheimer’s disease or other Dementias. These facilities provide all of the services normally available in assisted living centers, as well as additional safety and supervision services. Vermont operates similar settings: nursing homes that specialize solely in Alzheimer’s care.
6. Michigan and Vermont have both applied for and received a waiver from CMS that assists
individuals with traumatic brain injury (TBI). Michigan’s program is for adults, and provides inpatient and outpatient intensive rehabilitation services to those needing specialized services. This program has been successful in Michigan, enough so that the state is considering an application for a home and community-based waiver to expand the covered services and populations of this program. Vermont’s program diverts individuals from placement in institutional settings and/or to return Vermonters with a moderate-to-severe traumatic brain injury from out-of-state facilities. The project has successfully demonstrated that individuals with a moderate-to-severe traumatic brain injury were appropriately served in community placements. Through collaboration with the Vermont Division of Mental Health, a long term option for individuals requiring ongoing intensive one-to-one support has also been added to this program.
7. Minnesota and New Mexico have both been successful in using resources other than Medicaid to
pay for long term care. The eldercare loan program in Minnesota provides personal loans of up to $50,000 for creditworthy family members to pay for long term care for their older relatives. The concept is said to be similar to the student loan program but for elders. Similarly, New Mexico relies less heavily on Medicaid than Alaska to pay for its residents’ utilization of nursing facilities. In 2001, New Mexico allowed for 69.4% of its nursing facility costs to be paid by Medicaid, while Alaska allowed for 83.9% to be covered by Medicaid. This means that while New Mexico allowed for 22.1% of total costs to be paid through out-of-pocket spending, private spending, or other spending, Alaska only allowed 8.3% of these costs to be paid through these resources. Alaska can be more pro-active in getting its long term costs paid for by means other than Medicaid, as demonstrated by the strategies of Minnesota and New Mexico.
8. Alaska should actively monitor Michigan’s Program for All-Inclusive Care for the Elderly
(PACE). This program provides community-based residential care to the physically disabled, aging population. PACE is particularly important for Alaska to note because it allows for access to mental health and substance abuse services, which is not the case for most of the state’s current programs.
9. Vermont has two comprehensive care programs operating at present that could significantly
enhance the long term care received by Alaska’s residents. The Senior Companion Program provides supportive services to adults who are home-bound and frail, especially those who need companionship for themselves or respite for their caregivers. Volunteers over the age of 60 provide this service. Besides companionship and respite, some Senior Companions provide

State of Alaska Department of Health and Social Services
ALASKA LONG TERM CARE AND COST STUDY
FINAL REPORT
Final Report Page 16
assistance with common chores, such as preparing a meal or simple personal care. The Dementia Respite Program makes respite funds available to families that provide care to an elderly family member with Dementia. This program is able to provide a limited amount of funding to caregivers of a person diagnosed with progressive Dementia. This funding is available to caregivers on a yearly basis to provide respite services as defined by each family. Alaska has similar services to Vermont in this respect; however, Alaska does not have an ADRD waiver.
10. Similar to Wyoming and Michigan, nursing facilities in Alaska use cost reports as the tool for
establishing rates within a prospective system. 11. Both Alaska and Wyoming use individual budgets for persons utilizing waiver services.
Michigan uses historical costs to determine the rate structure for waiver services. 12. Michigan uses rates that are set by individual counties for services such as Personal Care, while
Alaska has the same rate throughout the entire state. Currently, Alaska does not provide geographical adjusters for Personal Care and certain other services.

State of Alaska Department of Health and Social Services
ALASKA LONG TERM CARE AND COST STUDY
FINAL REPORT
Final Report Page 17
V. INCREASING THE ROLE OF OTHER PAYERS IN ALASKA’S LONG TERM CARE SYSTEM
As the demand for long term care services increases nationally due to the aging of the baby-boomer population and other demographic changes, it is increasingly important to identify opportunities that expand the role of payers other than Medicaid to help finance state systems of long term care. Therefore, PCG analyzed the current role of other payers in Alaska’s long term care system and developed recommendations surrounding the feasibility of enhancing their participation as a means to defray the current and future costs of long term care services. Specifically, PCG reviewed the following areas:
• Individual responsibility (self pay) and responsible family members • Long term care insurance • Participation of tribal health providers • The Veteran’s Administration • Estate Recovery
A detailed explanation of the opportunities that PCG views as available to Alaska in order to defray long term care costs is outlined below, in the form of recommendations to the state. A. Increase individual responsibility (self-pay) options.
Some states qualify children for Medicaid, regardless of their parents’ income under TEFRA provisions, and charge a premium or other fees to their families. These fees are typically charged on a tiered basis, with low income families paying few, if any, fees. This would offset Medicaid spending by the state because it requires individuals and/or their family members to pay for a greater share of the long term care supports and services received. Alaska could review the work of Minnesota and Arkansas in this area, as they are examples of two states that currently take advantage of this option.
B. Expand options for and aggressively market private long term care insurance (LTCI). The state may wish to consider promoting the purchase of private long term care insurance to offset future Medicaid expenditures. There are two basic approaches that Alaska can take: 1) increase awareness about LTCI; or 2) take actions that effectively lower the price of purchasing insurance. A number of states have launched efforts to educate consumers about the importance of long term care insurance and many state insurance departments offer comparisons of the features and premiums of insurers offering policies in their state. However, most of these educational efforts have had limited success. Therefore, Alaska’s state Medicaid agency may be in a stronger position to market LTCI than its insurance department. One of the major predictors of who will buy LTCI is the recent incidence of a family member needing long term care insurance; thus, marketing efforts could be targeted to the family members of individuals receiving Medicaid-funded long term care. This would effectively target individuals who are at relatively high risk of needing state-funded long term care in the future. Alaska is currently embarking on developing an Aging and Disability Resource Center under the joint AoA/CMS grant program; informational resources about private LTCI could easily be incorporated into this program. The state could also take the following steps to reduce the price of LTCI:

State of Alaska Department of Health and Social Services
ALASKA LONG TERM CARE AND COST STUDY
FINAL REPORT
Final Report Page 18
• Alaska could make a group offering of LTCI available to any resident of the state, a benefit
which is currently only available to state employees. Typically, group policies can be anywhere from 10% to 20% cheaper than individual policies.
• The state could establish a separate, self-funded LTCI pool for Alaskans managed by another
entity. This could be a model similar to that developed by the State of California public employees’ retirement system (CalPERS).
• Alaska could develop public-private partnerships, designed to provide easier access to
Medicaid benefits for consumers who purchase long term care insurance. The most extensive public-private partnership to date is the Robert Wood Johnson (RWJ) Foundation’s Public/Private Partnership for Long Term Care Insurance. These programs allow individuals to bypass asset spend-down requirements and become Medicaid eligible when they purchase a Partnership Long Term care insurance policy (although they are still subject to Medicaid income restrictions). Four states are currently running these programs: California, Connecticut, Indiana, and New York. Although there are regulatory barriers in place for other states to develop these programs, recent proposed legislation has aimed at removing these obstacles.
C. Increase participation from tribal health providers to leverage 100% federal reimbursements. Opportunities currently exist for tribal health providers in the Northern and Western parts of the state to increase their provision of Medicaid long term care services. Alaska could selectively work with these 638 organizations (the Indian Self-Determination and Education Assistance Act, Public Law No. 93-638, provided for certain tribal health care facilities, known as 638 facilities, operated under lease agreements with IHS to be treated as IHS facilities) to ensure that their costs are reimbursable with 100% federal fund match for Medicaid eligible persons. Individuals on waiver programs or waiting for waiver services could then transfer to one of these 638 providers, which would expand their menu of services. This transfer should first be targeted to those consumers who have high-cost care plans, both on the MRDD waiting list and MRDD waiver program. Existing Department policy is to emphasize the support of 638 organizations—this recommendation proposed by PCG is consistent with that policy. The table below, from IHS utilization files, shows Alaska’s tribal health long term care providers; the larger providers in the Northern and Western parts of the state are the objects of this recommendation.

State of Alaska Department of Health and Social Services
ALASKA LONG TERM CARE AND COST STUDY
FINAL REPORT
Final Report Page 19
Table V-1: Alaska Native Active User Populations (2004)
Source: IHS User Population Report (B), Version 75, December 22, 2004 D. Expand the partnership with the Veterans’ Administration (VA). The State of Alaska has a large percentage of veterans—10 percent, as documented in the 2005 Veterans Administration population data. Therefore, all potential opportunities Alaska has to address the growing health and long term care needs of its residents need to include expanding its partnership with the federal Veteran’s Administration. One example of the linkage between the VA and the Alaska long term care system is the large amount of Veterans that reside within the Pioneer Homes and typically have Veteran’s Administration health coverage. In conjunction with this, in 2003, a Pioneer Home in Palmer received approval for conversion to a VA home after obtaining a specific license from the VA and completing specific reconstruction. Alaska also received a $2.4 million dollar grant in order to construct/renovate the Home, which will open in late spring of 2006 and accommodate 79 licensed placements. At present, the VA reimburses for two levels of care, skilled nursing and a lower level of care, domiciliary. Although the Home in Palmer will not get reimbursed for skilled care, it will get reimbursed $27.19 per day for its lowest level of care. This represents a significant opportunity to increase the role of the Veteran’s Administration in financing services that otherwise are paid for by consumers and families or are state-funded. PCG recommends that the state continue to expand opportunities with the VA by increasing the number of licensed placements serving Alaskan Veterans or by petitioning the VA to establish a rate for skilled care and increase the rate for domiciliary care. The latter would be done by accumulating cost information in a cost report or other tool to clearly demonstrate that the cost of care is in excess of the reimbursements provided by the federal government.

State of Alaska Department of Health and Social Services
ALASKA LONG TERM CARE AND COST STUDY
FINAL REPORT
Final Report Page 20
E. Improve the Estate Recovery Program in Alaska. Since the beginning of the Medicaid program in 1965, states have been permitted to recover from the estates of deceased Medicaid recipients age 55 and above who had no surviving spouse, minor child, or adult disabled child. States have also been permitted to impose liens on real property of Medicaid recipients. In 1993, Congress passed a law (known as OBRA ’93) that required all states to implement a mandatory Medicaid Estate Recovery program. It is important to note that Estate Recovery and Tax Equity and Fiscal Responsibility Act (TEFRA) are not the same, although the programs often overlap and have some similarities. TEFRA involves filing a lien against a living recipient's home when they begin residency in a long term care facility, which is not enforced until transfer of the home or death. Estate Recovery involves filing an estate claim against a deceased recipient's available probate assets (which can include cash, stocks, personal property, home, etc.) and is subject to limitations of the state probate code. However, both Estate Recovery and TEFRA are authorized by federal law under 42 U.S.C. §1396p. Several years ago, the only states that did not have an Estate Recovery program in place were Alaska, Texas, Georgia and Michigan. Yet today every state has a program in place, with the exception of Michigan, which is currently developing a program of Estate Recovery. Alaska implemented Estate Recovery and TEFRA recovery programs in 2004 as a means of defraying the high cost of medical services, including long term care. As a result, the state currently has a total of $4,821,091 in estate claims that have been filed, with actual recoveries totaling $107,922 to date. With regard to TEFRA, $1,754,623 in open liens have been filed to date; however, nothing has yet been recovered. The low recovery by the state can be partially attributed to the typically long recovery period (18 months is average), the low death rate of recipients who recently had liens placed upon their property, the state's decision not to implement recoveries "retroactively" (i.e., where people had not been previously notified of Estate Recovery provisions) against any recipients, and federal law prohibiting the recovery of tribal lands and holdings. Comments received from stakeholders in Alaska indicated that Medicaid Estate Recovery systems are appropriate, but they need to be fair and include basic protections for heirs, which could include:
• delayed recovery of real property that is used as an heir’s sole place of residency until the property is transferred by the heir;
• waiver/delay of recovery on any income-producing property to the extent necessary to ensure that the heir has a reasonable income;
• waiver or reduction of the amount of Estate Recovery for low-income heirs; • reimbursement to the state over an extended period of time in lieu of Estate Recovery; and, • allowance for heirs to show that they provided care, support, or other contributions that
delayed or reduced the need for Medicaid-covered services, with a division of the estate proportionately based on the contributions made by Medicaid and the heirs.
Below are specific recommendations for Alaska to consider in seeking the maximization of Estate Recoveries within the state:

State of Alaska Department of Health and Social Services
ALASKA LONG TERM CARE AND COST STUDY
FINAL REPORT
Final Report Page 21
1. Eliminate the "minimum asset threshold" for recovery. Current state rules impose a generous $75,000 minimum asset threshold for recovery, which disallows recovery against all "small" cases. In practice, this exemption exempts the vast majority of all cases, as the exemption is provided regardless of whether other family members exist who would benefit from it, if eligibility fraud has occurred, or if the remaining heirs are already wealthy. The result is a windfall to many persons or simply to other estate creditors. Other problems with this exemption is the fact that federal law does not provide authorization for the exemption, and appraisal and evaluation of the estate's true value is often ambiguous and subject to debate, making it difficult to administer. The State Plan was amended in December of 2004 to eliminate this threshold, but the regulations have not been changed to reflect the State Plan amendment; therefore, DHCS should encourage the timely issuance of regulations consistent with its State Plan amendment language.
2. Permit probate initiation on behalf of the state as a creditor. Some probate cases are never
opened, despite the existence of assets. This may occur inadvertently, because no family exists, or purposefully, by those who try to take advantage of the statute of limitations to avoid creditor claims. DHCS is potentially missing many cases and recoveries. This is a situation that can be rectified—Alaska can identify these cases and have counsel initiate probate as a creditor in order to properly probate the known assets. This would only require an internal policy agreement to initiate.
3. Require attorneys to notify DHCS about probate. Personal Representatives and their attorneys
are failing to properly notify DHCS that an estate proceeding where a Medicaid recipient is involved has been opened. Therefore, some cases are being missed by the state or are discovered too late. Late discovery means that the chances of recovery are greatly diminished, as the court or the personal representative has most likely already distributed the assets. To remedy this situation, attorneys should be required to provide DHCS with direct written notice of all probate cases filed by mailing a Notice to Creditors. This will require a statutory (or possibly a regulation) change.
4. Expand the Definition of Probate in the State Medicaid Plan. Many types of assets are easily
excluded by elder law attorneys / estate planners from Estate Recovery, including life estates, annuities, insurance policies, certain trusts, and so forth; therefore, DHCS cannot recover its claim against these types of assets, even though they may be considerable. The state can change the definition of which assets are properly recoverable by amending its State Plan. Alaska has given this recommendation serious consideration in the past, and the states of California, Iowa, Montana and Nevada have all utilized an expanded definition with good success.
5. Improve the MMIS system. Additionally, a better information system could be put in place that
closely tracks the assets of those individuals receiving LTC services. The MMIS system currently in place in the state could incorporate a module that completes this asset tracking; this would allow the state to know when a consumer has passed away and the assets that he/she holds.

State of Alaska Department of Health and Social Services
ALASKA LONG TERM CARE AND COST STUDY
FINAL REPORT
Final Report Page 22
VI. RECOMMENDATIONS FOR IMPROVING ALASKA’S LONG TERM CARE DELIVERY SYSTEM
The key findings that resulted from our review of Alaska’s current long term care service system and delineated in the System Analysis section of this report (Appendix A) addressed both programmatic and reimbursement issues; these findings, along with the findings from the comparison state study, served as the basis of our recommendations for improving long term care service delivery in Alaska. The recommendations reflect our thoughts regarding the direction in which the state should move over the next 3, 10, and 20 years. It is important to note that these recommendations have not been ordered based on available resources: some of these recommendations do not require additional resources, and those recommendations that do require additional resources will have to be carefully considered and prioritized by the state, so that they can be addressed at a time when the necessary resources become available to the Department. In developing our recommendations, PCG seeks to minimize the fiscal impact of proposed changes. Where possible, we make recommendations that do not require expensive administrative and financial changes to state budgets, computer systems, or staff levels, and do not require providers to incur significant costs to alter how their service delivery is done. Additionally, where we believe change will require significant investment in additional resources, we state as such. Based on interviews with key stakeholders as well as reviews of program and financial data, we support the recent methodological changes implemented by state staff but believe that more can be done to create a sustainable and more rational system, with sound accounting and reimbursement principles incorporated throughout the programs. Our recommendations range from changes to the calculation of specific per diems to architectural changes in how programs are organized. From a programmatic perspective, our recommendations are based on what services currently exist or do not exist as part of Alaska’s continuum of services. While there are multiple service options for Alaskans with long term care needs, we believe that steps need to be taken in order to enhance and expand existing services, as well as develop new services where gaps currently exist. From a reimbursement perspective, PCG favors a cost-based system for long term care. Important components include checks and balances in the reimbursement system, including the use of standard cost reports, desk reviews, on-site audits, billing audits and verification of submitted claims. In states that can collect standard, system-wide data on individual impairments, we favor a case-mix approach that links the reimbursement level to the level of care needed by the individual. PCG believes that reimbursement should encourage providers to operate in an economical and efficient manner and compensate them for their work, rather than reimburse them for less than cost. In general, reimbursement should be fair and applied equitably to all providers without special benefits for select providers. Reimbursement systems should compensate providers so that incentives are in place for the continued provision of needed services, especially in rural areas. Within the constraints of CMS policy and federal law, PCG encourages states to understand their costs and make sure that allowable costs are fully claimed for federal reimbursement. As part of its review of reimbursement, PCG has pointed out opportunities for the state to increase its federal reimbursement. From PCG’s perspective, compared to best national practices, reimbursement in Alaska’s long term care
State of Alaska Department of Health and Social Services
ALASKA LONG TERM CARE AND COST STUDY
FINAL REPORT
Final Report Page 23
program is mixed. Nursing facility reimbursement and the grant distribution formula in Title III and IV use methods are highly similar to those found in other states. With exceptions, reimbursement procedures for the Pioneer Homes are similar to nursing facility reimbursement. However, waiver and personal care reimbursement is a mixture of rates established in regulations, costs established by cost reports, self-reported costs, projected costs, and ad hoc benefits given to particular providers, with costs taken from Older American Act programs. We have separated our recommendations into the major long term program settings in order to more clearly illustrate the areas in which Alaska’s long term care system faces the most significant challenges. These categories include:
• Overarching Recommendations • Nursing Home Recommendations • Pioneer Homes Recommendations • General Relief Assisted Living Facilities Recommendations • Personal Care Assistant Services Recommendations • Waiver Program Recommendations • Grant Program Recommendations
Our hope is that the recommendations presented here will assist Alaska in moving towards a more appropriate mix of services and a more comprehensive continuum of services.

State of Alaska Department of Health and Social Services
ALASKA LONG TERM CARE AND COST STUDY
FINAL REPORT
Final Report Page 24
Overarching Recommendations A. Complete the integration of senior and disabilities services under Division of Senior and
Disabilities Services (DSDS). A merger in 2003 combined the state’s aging system with its developmental disabilities system to create DSDS. However, while the two service areas of aging and disabilities are now organized under the same administrative entity, these two service systems still appear to operate in separate silos. Furthermore, it appears that there is a lack understanding of the roles and functions as well as the similarities and differences among the two service areas and the populations served. This parallel work was evidenced in practice and in interviews conducted with staff and other stakeholders. Staff within DSDS have a perception of “us versus them” when it comes to the provision of aging and developmental disability services. There is a strong belief that there is an inherent inadequacy in terms of how the two service areas are approached, how they are funded, and how they are prioritized. The direct result of this apparent schism between the two service areas runs risks, which include but are not necessarily limited to: consumers not being assessed and referred to appropriate services across the two systems; unnecessary duplication of PCA and waiver services across the Older Alaskan, Adults with Physical Disabilities, and Developmental Disabilities Waivers; and an ineffective quality assurance process when the desired outcomes for the individuals and the services provided are not understood by all staff. To help bridge this apparent disconnect between the two service areas, DSDS needs to cultivate a better understanding of each system amongst its staff. One potential solution is to convene an annual or semi-annual DSDS staff retreat that can serve as information and planning sessions for aging and disability staff. Such an event would provide a structured setting for staff to discussing the current needs of the respective populations and to determine how the two service system can support and collaboratively provide care for Alaskan consumers. Another potential solution to break-down these silos would be the formation of cross-functional aging and disability teams. These cross-functional teams would be able to communicate weekly, if not daily, on the needs, assessment, service provision, and service availability for people using the aging and disability service system. These are just two of many potential solutions that DSDS can implement to help cultivate a more collaborative culture between the aging and disability systems. DSDS should not limit itself to the solutions presented here when determining how to address this recommendation area. Fiscal Impact: Increased training might help with integration. There would be an administrative cost for training activities, including any staff training done during an annual or semi-annual DHSS event, and staff time spent on cross-functional activities. B. Conduct a statewide long term care strategic planning process. This long term care study provides the State of Alaska with recommended changes to the system for the next 3, 10, and 20 years. However, given that the foundation for this study is a review of the current system, it will not function as a standing, statewide strategic plan for long term care services. In our review of a myriad of documents and reports, one key document that was found missing was a statewide strategic plan for long term care. In order to ensure that Alaska’s service system continues to be

State of Alaska Department of Health and Social Services
ALASKA LONG TERM CARE AND COST STUDY
FINAL REPORT
Final Report Page 25
responsive to its consumers’ needs, to providers, and to all other stakeholders, we recommend that a 3-5 year statewide strategic plan for long term care be developed within the state. A statewide strategic planning process will require DSDS and all other relevant state staff to collaborate with the complete array of stakeholders who receive and those who provide long term care services across the state. This plan will provide DSDS with a blueprint to set goals, strategies, and performance outcomes over a 3-5 year period that can be used to guide the service system as it continues to grow and expand. Developing a statewide plan for 3-5 years in length will also allow DSDS to respond and recalibrate its direction as the consumer’s needs and funding changes. Two critical elements that would need to be included in this strategic planning process are an effort to plan with regard to geographic issues and a consideration of cultural/population issues. Both of these elements have an impact on the array of available services, the continuum of care in each region of the state, and the way in which care meets or overlooks the cultural needs and values of Alaska’s diverse population. In order to ensure that thorough attention is paid to geographic needs, the plan should at a minimum:
• address urban, rural, and remote areas; • describe services available in each region of the state; • describe services missing in each region of the state; and, • address the transportation challenges facing each region and how these challenges can be
overcome to provide needed services in the region. In order to ensure that thorough attention is paid to cultural and population needs, the plan should at a minimum:
• recognize and discuss strategies for serving the different populations receiving long term care services, which include:
o Older Alaskans (OA); o individuals with mental retardation and developmental disabilities (MR/DD); o individuals with physical disabilities (APD); o individuals with Traumatic Brain Injury (TBI); o individuals with Alzheimer’s Disease and Related Disorders (ADRD); and, o individuals with co-occurring disorders (e.g. MH/DD, SA/DD, SS/MH, SS/SA).
• recognize and discuss strategies to address Alaska’s ethnically and culturally diverse population, which includes but is not necessarily limited to:
o Alaskan Natives; o Koreans; o Russians; and, o Filipinos.
One approach to ensure that on-going strategic planning occurs even after the strategic plan is complete is for DHSS to establish an annual statewide long term care conference to promote collaboration and communication or use an existing annual conference. For example, the “Full Lives” conference is held annually in April and is attended by 400+ direct service providers and supervisors. Alaska has numerous statewide organizations which deliver long term care. To promote communication among the organizations, Alaska currently convenes a statewide policy seminar every year. However,

State of Alaska Department of Health and Social Services
ALASKA LONG TERM CARE AND COST STUDY
FINAL REPORT
Final Report Page 26
communication across groups and across the state regarding long term care issues remains inconsistent and fragmented – in part due to the state’s geography and in part due to the evolving status of the state’s long term care system. To ensure that all stakeholders are involved in the continuous development of Alaska’s long term care system, and to ensure that all needs of consumers are represented, DHSS should consider convening an annual statewide conference on long term care. This annual event would provide the state with an opportunity to bring together all of the key stakeholders across the state along with national experts in the long term care field. To ensure that each key area of long term care is thoroughly addressed during the conference, the agenda of the conference could be broken down into separate tracks for aging and elderly services, physical disability services, and developmental disability services, as well as joint sessions to foster a collaborative approach to assessment and service provision. Most importantly, this type of event will help to cultivate a culture of communication and collaboration across the DHSS agencies, an aspect that seems to have been negatively impacted by the 2003 merger. By convening this annual long term care conference, DHSS likely would be able to solicit the participation of the CMS regional office and national experts in the field to share their expertise on issues pertinent to Alaska’s consumers, providers, and service delivery system as a whole. It will be important in this process to look at how long term care direct care services for the target populations interface with other critical needs such as housing, employment, financing and advocacy issues. One example of a collaborative approach is how Indian Health Services facilities can be further utilized to provide waiver services to the individuals using the long term care service system. This has been done successfully with Yukon Kuskokwim Health Corporation, a Tribal 638 health provider. Questions and issues like this require an in-depth review in order to generate reasonable suggestions for reducing the waiting list, improving the financing and expanding long term care service delivery. Alaska should also remember that a good strategic plan includes a Vision Statement that would keep policymakers focused on how the system of long term care will unfold in Alaska over the next 3, 5, and 10 years. As part of its strategic planning, the state needs to draw from the work of the long term care reports that have been written in recent years. One recent report on Alaskan Native long term care examines population trends and identifies the number of persons currently receiving help within each census area and the number that will need help in future. This information could be used in the strategic plan, for example, to address how the state can aid Tribal 638 health providers to expand their long term care services. The statewide strategic planning process would also benefit the state’s current infrastructure of task forces, commissions, and boards. DSDS would be able to evaluate the current relationships that the existing task forces and boards have with the state as well as the relationships that the various task forces, commissions, and boards have amongst themselves. Any relationships that do not exist or that need to be further developed can be addressed as part of the strategic planning process. Fiscal Impact: Staff time necessary to plan and hold an annual event would be administrative costs necessary to create a strategic plan. This is an important and complex activity that takes contacts, meetings and writing to accomplish. One FTE would be required to work this task effectively. The exact costs would vary depending on the scope of activities. Medicaid-related activities associated with the
State of Alaska Department of Health and Social Services
ALASKA LONG TERM CARE AND COST STUDY
FINAL REPORT
Final Report Page 27
plan may be matchable. To the extent that any training or interagency collaboration occurs, it would be possible for the state to claim FFP to help cover costs. In addition, continuing education units may be available for certain classes that meet the requirements for certification. In conjunction with this annual conference approach, DHSS could also consider incorporating long term care issues within other DHSS-sponsored conferences such as behavioral health, public health, disease prevention and promotion. C. Develop usable management reports from the MMIS. DHSS currently lacks the infrastructure to track and develop detailed data reports of long term care capacity, provision, and utilization. For example, there is no computerized database of assessments, providers and plans of care that can summarize the number of providers or activities of daily living (ADLS) levels that individuals in different care setting have. It is also difficult to study specific populations such as Alaskan Natives or study geographical regions with the current system. Interviews with key stakeholders revealed that program managers have insufficient capacity to produce reports that could help them better manage the service delivery system and provide more timely responses to data and service requests. Adding the capability for DHSS to produce data and management reports on an annual and/or quarterly basis would enhance the Department’s ability to manage the state’s long term care system, as the reports would track system capacity and utilization and send alerts to address specific Departmental needs on a regular basis. One key component that is currently limiting the ability of DHSS to perform this function is its shortage of staff. PCG believes that the Department’s capacity to develop these reports and utilize this data management function could be improved by the addition of at least one FTE at the Research Analyst level within DSDS. This infrastructure could also be enhanced through the investment in and development of a more comprehensive MMIS system. Upgrading the current MMIS system will provide DHSS with an enhanced ability to track data and produce management reports integral to management and further development of the long term care system. The second improvement is to develop long term care databases containing essential client information. It is possible to fund these as MMIS activities if data in the databases was used in rate setting or another Medicaid activity such as prior authorization, or care coordination. Department staff lacks essential information necessary to manage client operations. The Department would benefit by collecting assessments, plans of care, and care coordination records into standardized electronic formats—files with web-based screens that allow for inputting forms and producing reports from the data base. These are serious technological and business infrastructure changes that will require staff time and equipment such as servers, and may require contracted expenses. The cost per database is variable, depending on the approach used; however, the cost would be federally matchable at 75% as a data processing expense. Estimated state developmental costs could be $50,000 to $150,000 per database, not including training and yearly maintenance. The third improvement is a need for the expansion of MMIS reporting capabilities. At present, it is difficult to obtain MMIS information on tribal status or ethnicity of persons and the services they use. An agenda of information needed can be developed and added to the contractual language in the next bidding for MMIS providers to rectify this problem. This would have a minimal fiscal impact since it would be part of the new contract.

State of Alaska Department of Health and Social Services
ALASKA LONG TERM CARE AND COST STUDY
FINAL REPORT
Final Report Page 28
Fiscal Impact: This recommendation will have an administrative impact on DHSS. PCG identified the need for department staff and managers to have more data and research support. PCG believes that the Department’s capacity to develop these reports and utilize this data management function could be improved by the addition of at least one FTE at the Research Analyst level within DSDS. Assigning this function to DSDS is a more preferable placement than locating this analyst in a Department-wide research unit so that particular knowledge of and expertise in the area of DSDS can be acquired by the FTE, which in turn would generate more specific and valuable data and research. D. Develop a universal screening and referral tool. Currently, the state does not utilize one universal tool to screen and refer consumers to services. Instead, the current assessment forms vary across providers. The absence of this practice makes the assessment conducted by the state and its contracted assessment provider, Arbitre, much more cumbersome and time-consuming than necessary. In addition, the absence of a universal screening and referral tool increases the difficulty of having a uniform process for provider audits and any potential investigations of fraud, abuse, and neglect. The development and incorporation of a universal screening and referral would streamline the assessment process with Arbitre and result in quicker determination of service need and provider identification for consumers of long term care services. A universal tool would collect consistent demographic information across all people screened. In addition, the tool would have questions that would indicate the need for further, more specific screening of an individual to determine the most appropriate service referrals to meet the person’s needs. A reasonable comparison to how this could work is the nursing home pre-admission screening process. The development of a universal screening and referral tool may be the precursor to discussions about development of a single point of entry system for long term care services, a facet that is present in many of the long term care systems studied in the comparison state study. It should also be noted that appropriate training on the use of the tool is of importance. This training could be incorporated into University of Alaska professional development programs and offered on a regular basis. Fiscal Impact: As the incorporation of this recommendation will be a multi-year project, the fiscal impact is dependent on how the project is managed. If development work is folded into existing efforts, such as the real choice systems grant, Aging and Disability Resource Centers work, or work with the grant programs, then costs will be lower. However, if a part-time or full-time staff person is hired to develop a form or revise an existing form, state costs will be higher. Encouraging the use of the I&R tool will incur costs of training and staff time, even if a pre-existing tool is available in Word or PDF format. E. Enhance the quality assurance system. As the long term care service system in Alaska continues to grow, it will be critical to the quality of services for the quality assurance process to become more comprehensive. Two major hurdles to a more comprehensive process is the lack of a sufficient number of staff and lack of clear definition of the quality assurance process. One way in which the quality assurance process is impacted is in its review of facilities. Currently, the assisted living licensing category is a large licensing category that contains providers of varying sizes and structures. The current size of licensed assisted living facilities, according to May 2005 data, range from 1 resident per provider to 204 residents per provider. Stakeholder feedback indicates that as a result of this all-encompassing licensing category, reviews are not conducted frequently for smaller providers and that the focus of quality reviews are on larger providers and look mostly at Medicaid compliance issues.

State of Alaska Department of Health and Social Services
ALASKA LONG TERM CARE AND COST STUDY
FINAL REPORT
Final Report Page 29
Another challenge facing the quality assurance process is how to monitor quality of the PCA program due to number of PCA providers and the nature of the individualized care. The quality assurance process has been improving but there are still steps that need to be taken to make sure that quality is a major focus of the state’s long term care system. The emphasis on quality assurance cuts across service sustainability issues which are addressed as part of these findings and initial recommendations. One immediate step to enhance the quality assurance process is to ensure that adequate staff is in place to provide the level of quality assurance required by such a geographically diverse state. Another step is to develop a clearer definition regarding what DHSS wants its quality assurance process to encompass, the role of quality assurance within the long term care service system, and the benchmarks and quality indicators the state wants to measure. The state should also consider the implementation of a program-by-program quality framework that looks at the services, at service delivery, service outcomes for individuals and at the state itself. Alaska has received a CMS quality assurance grant to assist them in looking at the current system and needed changes to implement the CMS Quality Framework as a model. Utilization of information in the comparison states specifically for Minnesota and Maine will be useful to Alaska as they define their approach to the Quality Framework requirements. One specific strategy to enhance the current process is to build in a regular review of care plans as part of the quality assurance process. Care plans are currently completed by the provider agency-based service coordinator and do not appear to be reviewed by the state in all cases. One of the concerns with care plans not being reviewed by the state is that there is a heightened risk of care providers not meeting all of the requirements or delivering all of the services contained within the consumer’s plan of care. This has been noted as a problem by Alaska staff as it pertains to the Personal Care Assistant Program (PCA), this issue has been addressed in part by soon to be adopted regulations. However, the issue remains for other programs. In order to further develop a quality assurance infrastructure within the long term care system, the state should build in a requirement to regularly review the care plans against service delivery and ensure that all requirements within the plan are being met by the providers. As noted in the comparison state study of this report, the states of Minnesota and Maine have quality assurance programs that should be reviewed and considered by the State of Alaska as enhancements and changes to the current quality assurance system are made. Improving the frequency of quality assurance reviews of providers and care plans would have an administrative impact on the Division. The level of staff added would depend on the sustainability of funding. It may be possible to change provider fees to recapture some of the costs of the staff increase. The state would need to review the cost allocation plan to see how these increased quality assurance costs are treated in the plan. Fiscal Impact: Based on our review and DHSS staff interviews, there are currently four quality assurance employees on staff, which is not enough, as reflected by state staff and stakeholders. PCG recommends that two quality assurance FTEs be designated for each of the four regions identified in the Department’s 2006 Budget Overview, which will require four additional FTEs. DSDS will need to review the use of any additional FTE, and can modify these numbers based on the varying number of placements per service region or recipients.

State of Alaska Department of Health and Social Services
ALASKA LONG TERM CARE AND COST STUDY
FINAL REPORT
Final Report Page 30
F. Evaluate and make changes to the care coordination system. Objective care coordination is the first line of quality and cost control in long term care programs. The state needs to either hire its own coordinators, for example in Juneau and Anchorage, or contract for more independent care coordination, perhaps with a federally qualified Quality Improvement Organization. One reason why the cost of personal care services expanded so fast was the lack of “gate keeping” in the administrative operation of the program. Programs lacking statewide and consistently applied care coordination cost more money. The state’s current practices of having regional or central office staff review higher cost or longer-hour cases is helpful but cannot be the main or sole method of cost control and quality review. Provider agencies hire the care coordinators on the waiver side and there is the appearance that essential objectivity is missing from care coordination. While there are some independent care coordinators who work with the OA and APD waivers, most of the existing care coordination is done by provider staff. The distributed nature of the current care coordination leads to concerns about the absence of checks on the quality of work done by care coordinators and the fragmentation of information on the implementation of care plans. It is possible that an agency can be paid $200 per month even though their care coordinator did not work on that case for that month. In its research, PCG came across consumer complaints that coordinators work for the agency and not the consumer. In addition, the APS Healthcare audit reported a lack of cooperation among agencies. It found that “...numerous Assisted Living Facilities stated they were ‘discouraged’ from contacting Care Coordinators to update assessments prior to the annual assessment even if dramatic changes had occurred. These providers felt pressured not to request updated assessments.” Given the annual average costs of care coordination under the waivers, it would be cost effective for the state to hire staff or contract for the staff. Currently, the state is paying $200 per month per person for care coordination. Using a caseload standard of 30-35 persons per care coordinator for individuals with mental retardation and developmental disabilities and redirecting the $200, $6,000 to $7,000 a month would be available to fund each position. Alaska should continue to maximize the recovery of care coordination expenditures from all available funding sources including Medicaid. Fiscal Impact: The state would incur administrative costs to improve its care coordination program. One way to better coordinate and improve care coordination might be through the use of a single provider or by having state employees perform the care coordination. Any such change should be cost neutral. G. Revise specific service definitions and expand types of covered services. Current DHSS service categories and service definitions are very broad. As a result, it is difficult to have clear expectations and understanding by staff and stakeholders involved with the systems. For example, all non-institutional long term care settings in Alaska are currently licensed as “assisted living facilities.” This fosters a lack of clarity regarding specific facility setting expectations. The assisted living settings range in size from 1 or 2-bed “Mom and Pop” settings to much larger 204-resident provider-based facilities to state-operated settings. While DHSS maintains internal service distinctions for the facilities licensed in this category for rate setting processes, the current system should be redesigned in order to provide a more distinct breakdown of facility types by size. This would include an examination of licensure requirements, service provision, and quality assurance expectations.
State of Alaska Department of Health and Social Services
ALASKA LONG TERM CARE AND COST STUDY
FINAL REPORT
Final Report Page 31
The revision of service definitions is not limited to assisted living facilities. We recommend that revisions of service definitions and the expansion of the types of covered services should be applied to, at a minimum, the following service areas:
• HCBS Waiver service definitions; • community services options for senior citizens including companion and respite specifically
for people with Alzheimer’s; • capacity for crisis placements and/or crisis response teams in the rural areas of the state; and, • access to substance abuse and mental health services.
Detailed recommendations on these areas are included as part of the specific program categories within this section. Information in the comparison state study from Vermont discusses the provision of companion services and respite care for people with Alzheimer’s. This activity will be the administrative responsibility of DSDS. However, the Division will need to work with the provider community as definitions are revised and potential service expansions are included. Fiscal Impact: This is ongoing program and policy work, which can be accomplished as part of normal program maintenance. H. Develop access to substance abuse and mental health services. Our findings indicate that a significant number of consumers of Alaska long term care services have co-occurring substance abuse and mental health service needs. However, due to an apparent lack of coordination of substance abuse, mental health, and long term care services, individuals with multiple service needs are not receiving all necessary treatment. An improvement in the provision of ancillary services across these areas will help improve care. One way in which Alaska can accomplish this is to ensure the collaboration of these three service system so that consumers with co-occurring needs are identified, assessed, and referred to appropriate services. To accomplish this, DHSS should develop cross-functional assessment teams that are trained to identify these co-occurring needs. DHSS should also review the current continuum of care and develop ancillary services that do not exist. In addition, DHSS should provide staff training on a quarterly or semi-annual basis that trains staff from these different service systems on the needs and services available to consumers with multiple needs. The numbers that PCG has been provided with on co-occurring mental health and substance abuse (MH/SA) include the following3:
• There are an estimated 40,412 adults & children experiencing SMI or SED in Alaska.
• According to a survey of mental health providers in Alaska, 67% of providers estimate between 25% and 75% of mental health clients have a co-occurring substance abuse disorder.
• There are an estimated 65,015 people in Alaska (14.9% of total adult population 18+) that
have substance use disorders. 3 Data in these four bullets come from C & S Management Associates, Final Report of the Steering Committee, Substance Abuse/Mental Health Integration Project, June 2000 – August 2001, Anchorage, AK, Prepared for: State of Alaska, Department of Health and Social Services, 2001.

State of Alaska Department of Health and Social Services
ALASKA LONG TERM CARE AND COST STUDY
FINAL REPORT
Final Report Page 32
• According to a survey of substance abuse providers in Alaska, 42% of providers estimate
between 25% and 75% of substance abuse clients have a co-occurring mental health disorder. Fiscal Impact: PCG cannot estimate of what increased access to these services will cost. The amount and kind of access will depend on the Department’s existing programs, its costs, and its priorities for future services. The recommendation does not require any additional staff to be hired to form cross-functional teams. The intent of the recommendation is that the teams would be comprised of staff members already employed by the Department; it would be a collaboration of staff to keep both service areas aware and up-to-date regarding the respective populations, services available, and services needed. I. Enhance provider requirements. Current provider requirements can be improved in order to further develop Alaska’s long term care service system. Our review of the assisted living licensing regulations indicate that all assisted living facilities are licensed under the same category and that all providers, regardless of facility size, are held to the same licensing standards. While there is a technical distinction that separates the assisted living licensing category into probationary license and standard license categories, 7 AAC 75.020 does not appear to contain any substantive program difference for a type of license. This was confirmed in our various interviews with stakeholders who did not note any substantive program distinction within the assisted living licensing category. One of the problems resulting from this current licensing structure reflected in stakeholder feedback is facilities of disparate sizes being held to the same requirements. For instance, a facility with 3 assisted living placements is required to meet the same licensing standards and criteria as a facility with 30 placements. In such a case, either the smaller facility is required to meet an unreasonable degree of physical plant licensing criteria or the larger facility is required to meet a lesser degree of requirements. There is also a problem of perceptions and expectations that stakeholders have regarding the licensing process. The broad categorization of the assisted living facilities licensing has lead people to believe that there is no distinction and that all facilities, regardless of size, are held to the same quality requirements and standards. It would be beneficial for the state, for the consumers, and for the providers, to ensure that quality requirements are appropriate to the number of people served and the size of the setting in which services are provided. The state also needs to address the perception problem regarding assisted living licensing. Fiscal Impact: This recommendation would have a modest administrative impact. It requires some staff time by licensing and program staff to review assisted living regulations and determine if substantive program distinctions should be made within the assisted living licensing category. J. Develop a strategy for workforce recruitment and retention in the long term care system. Many of the comparison states accounted for this problem, which is an issue for Alaska as well. There is a shortage of long term care direct service staff across the state, especially in rural areas, according to feedback from various stakeholders. There are two distinct components that comprise the workforce recruitment and retention problem in Alaska.

State of Alaska Department of Health and Social Services
ALASKA LONG TERM CARE AND COST STUDY
FINAL REPORT
Final Report Page 33
First, direct service staff, such as registered nurses and Personal Care Attendants, have become difficult to recruit and retain. As a result, consumers are not receiving the services they need in some of the more rural and isolated parts of the state. Second, salaries paid to direct care service staff are also a critical issue facing the state. Currently, registered nurses are paid a higher salary by the private provider hospitals than by the state. While these two issues can be addressed as two separate issues, it is possible that lower wages will continue to impact the State’s ability to recruit and retain qualified direct service staff. In order to address the workforce issues currently facing Alaska’s long term care system, DHSS needs to take the necessary steps of developing wages for direct service staff that are more competitive with those at private providers and develop wages for PCA that will make available PCA-eligible providers in the rural areas. DHSS also needs to continue with provider outreach in order recruit the necessary staff to meet critical service needs across the state, especially in the rural and frontier areas of Alaska. The state should continue to focus on and build upon the current C-PASS Real Systems Change Grant initiatives. Fiscal Impact: There would be an administrative impact consisting of costs necessary to staff a workforce recruitment activity and develop a strategy. The cost would be variable depending on the level of effort put into the activity and number of staff involved. If wage increases are a selected strategy, DSDS will need to figure out how it addresses this issue, will need to determine which service professionals are targeted, and the increases to grant. Fiscal impacts could be modeled based on the number of hours of service paid for in MMIS. K. Develop capacity for crisis placements and/or crisis response teams in the rural areas of the
state. DHSS should develop capacity within its existing continuum of care for crisis placements that can serve the rural areas of the state. One of the common criticisms amongst stakeholders is that individuals residing in the rural areas are forced to either travel to the urban centers or not receive adequate care when they experience a health crisis. There is either no community service, including Personal Care Assistants available or able to serve the consumer during crisis or their Personal Care Assistants. Crisis placements would be able to provide a level of care that does not currently exist in the community. The primary purpose of these placements would be to provide necessary services anywhere between a minimum of a few hours to a maximum of seven days to those individuals in crisis situations. Introducing crisis capacity to Alaska’s system of long term care would alleviate some of the pressure that is currently placed on the available community services across the state, including PCA services which in many of the more isolated communities likely serve as the primary resource for services in the community. The development of crisis capacity would most likely not look the same across the state. This capacity should be tailored to address the specific cultural and geographic needs of regions in Alaska. It could result in innovative and creative models that are specific to Alaska. Establishing crisis response teams would be a useful supplement to any crisis placements developed or could be established as a stand-alone service. These teams would be able to respond quickly when a consumer experiences a crisis. These teams would also help the consumer stay on track with his or her person-centered service/treatment goals and objectives and would work with the individual to promote recovery and gain independence in managing daily life. Given the geographic challenges facing Alaska’s long term care system, expanding the system of care to include crisis response teams within each region

State of Alaska Department of Health and Social Services
ALASKA LONG TERM CARE AND COST STUDY
FINAL REPORT
Final Report Page 34
and for example located at each Senior Center, could provide for an added support to consumers that would significantly increase system efficiency by reducing strain on other community services. Cost of developing these services will be dependant on geographic resources and capacity, including the availability of hospital-based, nursing facility-based and community-based service settings. The costs are also dependent on the availability of qualified healthcare providers (e.g. registered nurses, psychologists, behavior management specialists) to serve as the crisis response teams. These crisis services would function as a safety net for the long term care system. Such an approach would also support the concept of supporting individuals to remain in their homes and receive services in a setting that is most comfortable to them. Fiscal Impact: PCG is not recommending a specific number of teams or placements, but it would be useful to implement a single crisis response program in a rural area to gain familiarity with the program. Again, the eventual sizing of the program is something that DSDS would need to evaluate either through the strategic planning process or through a separate needs assessment. However, should DSDS wish to implement this concept, the National Alliance on Mental Illness (NAMI) has a model that projects the annual cost of a crisis team model at about $800,000 - $1,000,000 per team per year, based on serving 100 consumers and the use of 10-12 staff members per year. If this recommendation is pursued, DSDS would need to determine: 1) how this service fits into its continuum; 2) how much of this service it needs; 3) how this service will be structured (small facility vs. larger acute care setting vs. single bed providers); and 4) where, by region, this service would be located. With regard to crisis respite beds, based on work PCG has done for the State of Washington, we estimate that a rate of $190 per crisis respite bed would be required at an annual cost to the state of approximately $58,948, assuming an 85% occupancy rate. L. Monitor the development of rural PACE models in the lower 48 to determine the feasibility of
implementing a model in Alaska. As discussed in the report titled “Long Term Care Needs of Alaska Native Elders”4, we agree that a federal model for long term care services that has potential benefit to Alaska is the Program for All-Inclusive Care for the Elderly (PACE). This program should be taken into consideration when looking at how to further develop Alaska’s long term care system. The PACE program arrived as a new capitated benefit under the Balanced Budget Act of 1997. According to CMS, the program was “developed to address the needs of long term care clients, providers, and payers. For most participants, the comprehensive service package permits them to continue living at home while receiving services rather than be placed in an institutional setting. Capitated financing allows providers to deliver all services participants need rather than be limited to those reimbursable under the Medicare and Medicaid fee-for-service systems.”5 The Balanced Budget Act established PACE as a permanent service within the Medicare program and allows states to provide this service to Medicaid eligible consumers as a State Plan service. In order to be eligible for PACE services, a consumer must live in a PACE service area, be 55 years or older, and be eligible for nursing home level of care.
4 Branch, K., “Long Term Care Needs of Alaska Native Elders”, Alaska Native Tribal Heatlh Consortium, Anchorage, AK, August 2005. 5 Centers for Medicare and Medicaid Services, “Program of All-Inclusive Care for the Elderly (PACE) History”, http://www.cms.hhs.gov/pace/pacegen.asp, September 16, 2004.

State of Alaska Department of Health and Social Services
ALASKA LONG TERM CARE AND COST STUDY
FINAL REPORT
Final Report Page 35
The PACE program was modeled on a program in San Francisco and is located primarily in urban areas. However, the Rural Pace Technical Assistance Program has been established through the U.S. Department of Health and Human Services, Health Resources & Services Administration (DHHS-HRSA), to assist rural providers in delivering PACE to rural communities6. Oklahoma has a pilot project for rural PACE and this will yield useful data and information for Alaska. According to the DHHS-HRSA website, the goals of the program include the following:
• develop strategies for successfully adapting PACE to rural communities; • identify health professional training needs to support PACE in rural communities; and, • provide education and technical assistance to rural providers interested in exploring rural
PACE opportunities. DHSS should consider the feasibility of implementing this program. Given the primarily urban implementation of this program, DHSS should work with the CMS regional office to initiate discussion of how this program could be developed to meet its rural service and cultural needs. Given the State Plan requirement, DHSS would also have to engage CMS in a process to amend its existing State Plan if this service option is pursued. This is an ideal opportunity to work with tribal 638 health providers who already provide the primary and acute care for most elders in rural areas. Fiscal Impact: Implementing this recommendation would have some administrative costs, as it would require one staff FTE to do program support activities such as writing regulations, initiating MMIS changes, talking with potential providers, and monitoring the program once it is established. The program could be done in cost neutral manner by setting a PACE capitation rate that does not exceed the fee-for-services costs that the PACE enrollees would have otherwise incurred. Further, if tribal health providers are utilized, Alaska might get 100 percent federal match for the Medicaid portion. M. The recommendations raised in the APS Healthcare billing audit of March 2005 need to be
systematically addressed. The findings of the APS audit contain excellent recommendations for strengthening the PCA and waiver programs. Its 17 recommendations cover actions that both providers and the state can make to improve operations. For example, the audit found that many providers did not keep good records showing the time spent providing services. The audit also found that providers reported delays in getting prior authorization approvals. Fiscal Impact: The seventeen recommendations in the APS audit would require state administrative time to create new policies, different provider communications, and training to mitigate the problems found. Following through on the issues raised in this audit could potentially result in a cost savings for the state. The audit took a 9% sample of assisted living and personal care claims and found $250,000 in overpayments; the state should review the costs of making a 100% review of all claims versus how much of the potential $2.5 million can be recovered.
6 “Rural Pace”, U.S. Department of Health and Human Services, Health Resources and Services Administration, http://ruralhealth.hrsa.gov/pace/, date accessed: December 6, 2005.
State of Alaska Department of Health and Social Services
ALASKA LONG TERM CARE AND COST STUDY
FINAL REPORT
Final Report Page 36
Nursing Home Recommendations A. Expand community services options for senior citizens based on opportunities and available
resources. One of the major themes that arose in interviews with stakeholders was the lack of community services options for seniors. Many stakeholders expressed their concern that seniors do not have the appropriate service mix that supports them to stay in their homes. The most significant service gap cited is the lack of services that supports seniors to stay in their home during the day. In previous years, the state offered respite care services for family members who went to work during the day and needed respite service to care for their aging loved ones during the day while they were gone. However, due to CMS rules and regulations regarding respite care services, this service was ended with nothing comparable taking its place. Stakeholders have indicated that the lack of daytime care services has resulted in either family members staying home or seniors needing admission to nursing homes or assisted living services. In order to address this important issue facing Alaska’s seniors and their families, DHSS should develop Companion care services. Companion care services, cited by many stakeholders as a needed service, would allow family members to work and seniors to stay in their homes during the day. Consequently, seniors not desiring care in the nursing home setting would avoid being placed in nursing homes and occupying placements that could be used by individuals who need to be in nursing facilities. Based on our understanding, there is pending legislation (HB 303) that is looking to add companion services to the Alaska HCBS waiver. Companion care services would also help fill the service gap left by the 2004 reduction of respite care hours to a maximum of 10 hours per week, which has been cited by numerous stakeholders as a significant reduction in the service options for seniors and adults with disabilities. DHSS should review the previous decision to limit respite hours to 10 per week to ensure that it is not having a negative impact on individuals and families who need respite services that comply with the federal definition. In addition, DHSS should give serious consideration to the addition of companion care services to address the gap left by the clarification on the appropriate use of respite services. Companion care services could be added with adequate limits, controls, and oversight as part of the current waivers, should DHSS choose to pursue this option. In addition to these service recommendations for seniors, DHSS should take steps to assure that a Senior Center exists in each of the state’s regions and that each of these Senior Centers is equipped and staffed with the resources necessary to meet the needs of the residents of the regions villages. This is an existing, familiar service setting that has proven to be effective within the current continuum. Many stakeholders have noted that this is a resource that many seniors depend on, especially for the provision of meals and the transportation. Steps should be taken to ensure that the Senior Centers and the services provided are sustained at their current level and expanded where Senior Centers may not be meeting the service demand. In addition to providing some needed consumer services, steps could be taken by DHSS to modify the Senior Centers to serve as a more comprehensive resource center similar to the Area Agency on Aging model used in other states. Steps to achieve this could be taken through Alaska’s current Aging & Disability Resource Center grant given that one of the goals of this grant is to develop a single point of entry into the long term care system. Senior Centers could help serve this role. PCG recommends that the approximately 31 state and federally funded senior centers continue to be supported. PCG understands that there are geographical imbalances in the distribution of the centers, e.g.

State of Alaska Department of Health and Social Services
ALASKA LONG TERM CARE AND COST STUDY
FINAL REPORT
Final Report Page 37
11 in the Kenai Peninsula, but only one in Bethel and one in Dillingham. However, the existing centers should be supported, and, if possible, cuts that have been made to their budget in recent years should be restored Fiscal Impact: This recommendation arose out of comments made by consumers about the cut of respite services and the need for alternatives, given these cuts. The 2004 regulations had more impact on respite care than any other service, comprising approximately $4.5 million of the $6 million in savings from the regulations. Should these services be restored as companion services, the estimated cost would be $4.5 million in state and Federal funds. State staff expressed a concern that there could be additional cost if persons who were in assisted living, where they effectively get companion services, shifted to home services that cost more in total than assisted living would cost. B. Consider a provider assessment on nursing facilities. PCG suggests that DHSS explore the feasibility, including the estimated costs and benefits, of implementing a provider tax, or as it is sometimes called, a provider “assessment.” The initial reaction to this recommendation will be that the CMS will not allow it. However, while it is true that in recent years CMS has rigorously attempted to reduce federal reimbursement to Medicaid by lowering the use of targeted case management, intergovernmental transfers, and any state Medicaid procedures that CMS deems abusive, at the same time, CMS has continued to permit states to use provider assessments in their nursing facility programs. Permissible healthcare-related taxes are discussed in the Code of Federal Regulations at 42 CFR 433.68, and requires that the taxes: 1) be broad-based; 2) be uniformly imposed throughout a jurisdiction; and 3) do not violate the hold harmless provisions of the regulations. It also states that a healthcare-related tax will be considered “broad-based” if the tax is imposed on at least all the health care items or services in the class, or all providers of such items, or services furnished by all non-public providers in the state. Additionally, 42 CFR 433.68(d) says that a healthcare-related tax is considered to be imposed uniformly if the amount of the tax is the same for each item being taxed (ex: days, placements, or receipts) and that a tax is permissible if it does not exceed 6% of the taxpayers’ revenue. For purpose of illustration, the state would levy a six cent tax or assessment on every dollar of provider revenue, which the state would collect from the provider and put in the Treasury. The provider would report that six cent assessment on the cost report submitted to the state and the state, in turn, would recognize the six cents as being an allowable cost. The state would then raise the per diem rate to include the new allowable cost—therefore, the six cents would be claimed as part of its federal Medicaid expenses and the federal government would reimburse the state matching funds. In Alaska, the federal funds matching rate is approximately 50 percent, so in this example, the federal government would reimburse the state three cents of the additional six cents in spending. The state does not incur new spending since it received the six cents from providers, and the three cents represents additional funding that can be spent to improve the program. Provider assessments can be implemented in different ways, within the latitude provided by federal regulations. However, provider assessments procedures are often complicated by federal-state and provider-state relations. Implementing a nursing home provider assessment would require staff time for consultation with the nursing facilities and CMS, as well as analysis and implementation.

State of Alaska Department of Health and Social Services
ALASKA LONG TERM CARE AND COST STUDY
FINAL REPORT
Final Report Page 38
Alaska is now one of the 20 states that has not availed itself of a provider assessment on its nursing facilities. The majority of states, about 60%, now use such assessments. Often the impetus for using such assessments comes from the provider community; the funds generated from these assessments can provide additional resources to improve the quality of care in nursing homes or fund technological changes that can improve the quality of care, such as the use of electronic medical record technology or other telemedicine initiatives, as described in the May 2001 Myers and Stauffer report on telemedicine in Alaska.
Table VI-1: Nursing Facility Reimbursement Methodology Summary
Fiscal Impact: Taking into account the state spending of approximately $68.6 million in FY 2005, and the federal regulations that set 6% as the maximum provider-related health care assessment that the state could receive from nursing home providers, a provider would yield approximately $4 million in new revenue for Alaska that could be used to promote quality assurance activities in nursing homes. Alaska’s regular FMAP percentage for FFY 2008 and afterwards is 50.00% -- applying this to $68.6 million results in approximately $2 million in new federal revenue that could be obtained to provide additional staff, more quality of care monitoring, or improved technological capabilities.

State of Alaska Department of Health and Social Services
ALASKA LONG TERM CARE AND COST STUDY
FINAL REPORT
Final Report Page 39
Pioneer Homes Recommendations A. Develop a strategy to address the perception of the Pioneer Homes’ role in Alaska’s long term
care system. There appears to be a perception amongst assisted living providers in Alaska that the Pioneer Homes throughout the state have an inherent advantage due to the fact that these facilities are part of the state system. One distinct difference between the Pioneer Homes and the other private assisted living facilities, however, is that the Pioneer Homes do not get to choose which consumers will be admitted and which consumers will not. As long as the consumer meets the level of care requirements and there is available capacity, the Pioneer Homes admit the individual, this is often referred to as a “no eject, no reject” policy and is a positive aspect of this service option for the consumer. Pioneer Homes have had a long history of serving Alaskans with long term care needs and will have a role that evolves as the needs of consumers evolve. To address the perception of Pioneer Homes that private providers have, DHSS should take steps that better communicate the role of the Pioneer Homes in the long term care system and how the Homes interact from a service standpoint with both the state and private providers. DHSS should consider this as part of the strategic planning process discussed above. Fiscal Impact: The recommendation would involve staff time to develop, clarify, and communicate the role that the Pioneer Homes have in the state’s long term care system. B. Continue to use the Eden Model in the Pioneer Homes. Pioneer Homes currently utilize the Eden approach to providing care. This model provides Alaskans with a care setting that focuses on quality of life by creating better social and physical environments. This type of setting and approach makes the Pioneer Homes very desirable living settings. All Pioneer Homes utilize this approach; it is important that this approach continue regardless of the shift toward using more Medicaid and VA funding to finance the Homes. Fiscal Impact: This has a minor administrative impact and represents the continued encouragement to use the Eden philosophy in the operation of the Homes. C. Revise the cost and reimbursement structure of the Pioneer Homes to create a more cost
effective system. Based on our review of the Pioneer Homes, the following steps could be taken by DHSS:
(i) The Pioneer Homes should undertake a planned conversion of Level I placements and make those changes necessary to accommodate more Level II and Level III residents.
Based on our analysis, there appears to be low occupancy rates for Level I placements. PCG suggests that the Pioneer Homes undertake a planned conversion of Level I placements and make those changes necessary to accommodate more Level II and Level III residents. As the description of the services above indicates, these changes may entail staff training, additional staff, or a change in the mix of staff, a selective focus on certain homes such as Sitka or Anchorage because of their low occupancies, and resulting increased costs. It is not clear what the net cost would be since these conversion and operating costs could be offset by increased Medicaid reimbursement.

State of Alaska Department of Health and Social Services
ALASKA LONG TERM CARE AND COST STUDY
FINAL REPORT
Final Report Page 40
Fiscal Impact: The Pioneer Homes currently receive an average, blended rate from Medicaid for each Medicaid day regardless of the specific impairments of the Medicaid eligible person. A review of Alaska wages in the database of the Department of Labor and Workforce Development shows that personal case and home health aide workers make between $11 and $14 per hours. An additional higher acuity person could require 2-3 hours of staff time a day and over the long run would raise the Medicaid rate by those hourly costs. Assuming $20 hour and $40 to $60 per day in additional costs, 20 higher acuity persons could cost the state approximately $800-$1,200 a day in total funds.
(ii) Ensure that Medicaid pays its share of the costs of taking care of Medicaid eligible persons in the Homes.
Compared to other assisted living programs, the Pioneer Homes are expensive. In FY 2005, the Homes spent about $36.9 million to take care of 454 persons per month at an average yearly cost of approximately $81,400 per person. This is high compared to the costs of operating non-public assisted living programs. Therefore, a need is present to ensure that Medicaid pays its fair share of costs for taking care of Medicaid eligible persons in the Homes, and the Homes need to continue their efforts to have new residents, where appropriate, apply for Medicaid. The Pioneer Homes also need to watch the income and assets of current residents to monitor changing eligibility while in the Home. This recommendation is an affirmation that the state should continue its policy of identifying persons who are or might be Medicaid eligible. However, increased revenue and a higher percent of individuals enrolled in Medicaid may still be attainable with additional attention paid to this area. Fiscal Impact: Some additional staff time may be necessary to improve related Medicaid data collection and reporting.
(iii) Review the state’s action of treating all meal-related costs as unallowable costs and
change the analysis of salaries and square footage to reflect this addition. The Pioneer Homes rate setting methodology should be reviewed for treating all meal-related costs as unallowable. It may be necessary to visit and talk with nutrition and dietary staff members, read job descriptions, and review their daily tasks in order to determine if allowable costs can be documented or allocated, as this information is not currently developed in the cost reports. For example, to what extent does dietary staff review medical records in preparing menus for individuals? Does dietary staff feed people in the dining area or otherwise cue or assist persons to eat? Helping someone to eat is a reimbursable cost of providing assistance with an activity of daily living. When the waivers are renewed, waiver language should be tightened to include references to meal-related costs in assisted living programs. The effect of this change on other assisted living homes also needs to be considered. PCG recommends that the state review its treatment of meal-related costs in the rate setting of the Pioneer Homes, as the current methodology excludes both direct and indirect costs associated with all meal preparation costs. This might be restrictive, since it may include activities that are reimbursable. Fiscal Impact: Food service personnel costs run from approximately $400,000 to $1.2 million per year in the Homes. Given the amounts excluded, there may be a modest savings of $200,000 to $250,000 a year.

State of Alaska Department of Health and Social Services
ALASKA LONG TERM CARE AND COST STUDY
FINAL REPORT
Final Report Page 41
(iv) The costs of operating the Pioneer Homes as identified in the Department’s Public
Assistance Allocation Plan (PACAP) should be taken into account in developing the Medicaid rate for the Homes.
The preparation of the public assistance allocation plan should be coordinated with the Medicaid rate setting for the Pioneer Homes. The FY 03 Statewide Cost Allocation Plan (SWCAP) contains $1.6 million in FY01 costs for the Pioneer Homes; the corresponding amount for FY06 needs to be included in the rate setting and allocated to Medicaid. As of December 2005, 75 residents of the homes were enrolled in Medicaid out of the approximately 450 persons in the Homes. This ratio, or its quarterly equivalent, could be used in the cost allocation plan to allocate amounts to the rate setting cost pools. If data on days were available, then it could be used to allocate a portion of the cost allocation plan amount to the Pioneer Home rate setting. Fiscal Impact: Using a 75/450 or one-sixth ratio on the FY01 total of $1.6 million would have added about $250,000 to the rate setting cost pools; an amount which would be higher in FY 06.
(v) Use actual patient days instead of licensed capacity in per diem. The state should consider using actual patient days in the calculation of the reimbursement rate instead of licensed bed capacity. Changes in licensed bed capacity have lagged the number of actual beds available in the Homes and, unlike private providers, the Homes do not also automatically bill for 14 days of respite care. Therefore, general funds spent on the Medicaid program should be matched to the fullest extent allowable. PCG believes the state should consider using alternative reimbursement formulas for public versus private providers. The state is inappropriately penalizing itself for the Pioneer Homes’ low occupancy instead of recouping 100% of its allowable Medicaid costs. The amount of allowable costs could be divided by actual patient days rather than licensed capacity. Calculating the rate using actual patient days has a noticeable impact on the per diems. For example, in the budget detail forms available to PCG, this alternative way of creating the rate increased Sitka’s rate by $40 per day, Fairbanks’ rate by $8, Anchorage’s rate by $26, Ketchikan’s rate by $17, and Juneau’s rate by $14 per day. Given projections of Medicaid days by home, it would be possible to perform a fiscal impact analysis of these savings. As the Homes become more successful in identifying persons who are potentially eligible for Medicaid these savings will grow. Fiscal Impact: Some administrative cost would be entailed in changing the rate methodology and establishing separate reimbursement regulations for Pioneer Homes.
(vi) Conduct a separate study of financing issues. The state might consider a study of financing issues in the Pioneer Homes. The state should ensure that it is not spending general fund dollars unnecessarily. For example, the issues of separately billing for pharmacy and other medical expenses, and the matter of patient Supplemental Security Income (SSI) merit a separate study.

State of Alaska Department of Health and Social Services
ALASKA LONG TERM CARE AND COST STUDY
FINAL REPORT
Final Report Page 42
PCG recommends that Alaska examine the receipt of SSI by residents of the Homes. State policy currently assumes that persons in Pioneer Homes are “inmates of public institutions,” as this phrase is defined in federal law, and thus are not eligible to receive 100% of their SSI benefits. Fiscal Impact: This review would entail the administrative time necessary to research what other states are doing, research what the Federal regulations and case law say on the matter, and then revisit the issue with the Social Security Administration. There may be potential savings to residents of the Homes or the State if client cost share can be increased.
Table VI-2: Pioneer Homes Reimbursement Methodology Summary

State of Alaska Department of Health and Social Services
ALASKA LONG TERM CARE AND COST STUDY
FINAL REPORT
Final Report Page 43
General Relief Assisted Living Facilities Recommendations A. Develop a process that ensures the quick determination of Medicaid eligibility for persons
served in this program. Currently, this program is paid for using 100% state general funds. To be paid at the waiver rate, a provider must care for a consumer that meets the nursing home level of care for the OA/APD waiver. Since individuals can be transitioned from this program to waiver services, it is essential that Medicaid eligibility for these individuals be determined as soon as possible, which would expedite enrollment in the appropriate waiver.
Table VI-3: General Relief Assisted Living Facilities Reimbursement Methodology Summary
Fiscal Impact: This recommendation seeks to ensure that general relief clients are quickly processed to determine their Medicaid eligibility. It would require some administrative time to ensure that a process is in place and to ensure that it is being used effectively.

State of Alaska Department of Health and Social Services
ALASKA LONG TERM CARE AND COST STUDY
FINAL REPORT
Final Report Page 44
Medicaid Personal Care Assistant (PCA) Services Recommendations A. Ensure that PCA services are available throughout the rural areas of the state which will
require strategic planning and determination of available resources. Interviews with state staff and stakeholders indicated that there is need for more PCA services in the rural areas of the state. While PCA services exist as a community option, there is additional need that is not being met. In order to address the additional need for community services, it is not the most practical or appropriate approach to build additional nursing facility placements in the rural areas. PCA services would be able to cover the target service populations across the state and would support people in their homes and with their natural supports. A well-designed PCA program in the rural areas will also be able to address the cultural issues and values of Alaska’s diverse consumer population. Most importantly, this service can provide a community-based level of service for individuals which supports them in remaining in their own homes and communities as long as is appropriate and to only utilize nursing facility service options when absolutely necessary due to medical needs that cannot be met at home. Fiscal Impact: Based on the percentage difference between the number of persons 60+ and the number of unduplicated persons using home and community based services, in current dollars, an amount roughly equivalent to 12% of total current expenditures would be needed to bring underserved areas into balance (3% in the Northwest, 7% in the Interior and 2% in the Southwest for areas outside of Bethel). In FY 2005, the state spent approximately $68.6 million on nursing homes, $109 million on waivers, and about $80 million on personal care, a total of $258 million. Therefore, bringing long term care services levels in rural areas up to other areas would require approximately $31 million in state and federal funds. Expanding PCA services alone would take approximately 12% of the $80 million total, or approximately $9.6 million in state and federal funds. The Department’s “tribal agenda” has recognized the advantage of using tribal 638 providers, given the possibility of receiving 100% federal match for Medicaid services provided by these providers to Alaskan Natives. State costs can be reduced to the extent that PCA or wavier services can be provided through these 638 providers. B. Enhance quality assurance and continuous quality improvement for Personal Care Assistant
Services. The Personal Care Assistant (PCA) program has shown tremendous growth in Alaska over the past several years. According to a DHSS Fact Sheet released on November 29, 2005, PCA services grew from serving 1,300 consumers and costing $7.6 million in 2000 to serving 3,800 consumers and costing $79 million in fiscal year 20057. The state has recently adopted regulations to better manage the current PCA program with the hope of avoiding any substantial reduction in services in the future. Staff and stakeholders interviewed indicated that one of their main concerns regarding PCA services in the future pertains to quality assurance of PCA services. They believe that the PCA program needs additional attention from the state regarding plan of care development and monitoring, as well as ongoing quality assurance and fraud prevention. Included among new regulations adopted by the state are steps to address issues that impact quality. For instance, as stated in the Fact Sheet released by DHSS, key regulations
7 “Personal Care Assistant Program regulations adopted”, Fact Sheet, Department of Social and Health Services Press Release, State of Alaska, November 29, 2005.

State of Alaska Department of Health and Social Services
ALASKA LONG TERM CARE AND COST STUDY
FINAL REPORT
Final Report Page 45
adopted regarding client eligibility, client assessment, and plan of care include but are not necessarily limited to the following:
• adopts a standard assessment tool for all clients called the Personal Care Assessment Tool (PCAT);
• requires that DSDS conducts the assessment for PCA services instead of the PCA agency; • requires prior authorization of all PCA services by DSDS; and, • defines the minimum qualifications and experience, Medicaid certification, and training
required of PCA providers. With the release of these regulations, the DHSS has developed a more structured and formal PCA system across the state. Several of the adopted regulations, including the ones noted above, will help the state address the quality assurance issues raised by staff and stakeholders. However, while DHSS implements these new regulations, it needs to consider how to develop a comprehensive quality assurance and continuous quality improvement process that addresses the rural and individualized nature of PCA services. Having a quality assurance system that can ensure services outlined are being delivered in the quantity and manner requested will help the state ensure that PCA services are provided in a controlled manner without any significant disruptions or scale-backs in service availability due to fraud and abuse.
Fiscal Impact: This recommendation has an administrative impact and would require some additional staff time based on the level of effort spent on the quality assurance activities. However, the cost of implementing this recommendation could be offset by program savings both by improving provider compliance and because higher quality of care will can help to avoid the need for crisis care.
Table VI-4: Personal Care Reimbursement Methodology Summary

State of Alaska Department of Health and Social Services
ALASKA LONG TERM CARE AND COST STUDY
FINAL REPORT
Final Report Page 46
Waiver Program Recommendations A. Continue to develop strategies to consistently manage the developmental disabilities waiting
list. The State of Alaska currently maintains a waiting list for developmental disabilities services. The waiting list for services has been growing as the number of individuals with developmental disabilities requesting services has increased. The state Developmental Disabilities Wait List Report for FY 2004 indicated that 1,002 individuals were on the wait list in FY 20048. Of these 1,002 individuals, the Report notes that 82%, or 825, are 22 years old or younger. Alaska may need to develop public policy guidelines which address parental responsibility, a resource for establishing this policy would be to review the criteria used by CMS when approving services for HCBS waivers for children’s services. Essentially, this criterion does not provide for claiming of federal matching dollars for activities/services that parents provide for non-disabled children. For example, costs for before-school or after-school childcare are not matched, but dollars may be matched for the provision of additional staff support so that a child with a disability can be served in a typical child care setting. Waiting list growth is attributed to several key areas. These areas include: state population growth; increased longevity; advances in medical technology and practice; redirected demand; changes in eligibility; individual and family expectations; and family/caregiver circumstances. In order to be placed on the waiting list, consumers must first request services by completing the Eligibility Determination application as well as the Wait List Criteria Assessment. (A new Wait List Criteria Assessment must be completed if the consumer’s life situation changes significantly.) Once these forms are completed, consumers are assessed and assigned a score based on how soon services are needed. The score is also adjusted for how long a consumer has been on the waiting list (one additional point for each month on the waiting list, up to 60 months). The waiting list is prioritized based on the assessment score with the list being ranked from highest to lowest total score. The Waiting List Report also notes that for individuals who have the highest need or who have been on the waiting list the longest are able to receive core services, as long as this is within the limits of appropriation. According to the FY 2004 report, 784 consumers on the waiting list, or 78.2 percent, received services through the Community DD Grant Programs. As an attempt to manage this increasing need, Alaska has developed a waiting list structured in a way that attempts to meet the service needs of consumer with the highest needs while also offering core services to individuals who have been awaiting services the longest. The main problems of Alaska’s DD waitlist are that it includes individuals who:
• are already receiving CCMC waiver services; • are already receiving full services through grant dollars; • for various reasons, will never qualify for a waiver; • are uninterested in waiver or grant services until some future date; and/or, • only want Respite Care.
8 Developmental Disabilities Waiting List Report (July 1, 2003 through June 30, 2004), State of Alaska Department of Health and Social Services, February 2005.

State of Alaska Department of Health and Social Services
ALASKA LONG TERM CARE AND COST STUDY
FINAL REPORT
Final Report Page 47
In FY 2004, DHSS developed a demonstration program with the Bethel/Wade Hampton Census Area to demonstrate new methods and finding mechanism for moving people off of the waiting list. According to the FY 2004 Report, collaboration with Yukon Kuskokwim Health Corporation, a Tribal 638 entity, successfully moved individuals off the waiting list and resulted in cost savings for this area. Alaska has also taken steps through its Real Choice Systems Change Grant to address waiting list management. Objective 3.2 of its Real Choice Work Plan Extension Request seeks to “Establish a Task Force to examine Alaska’s current Developmental Disabilities Waiting List to assure 1) the criteria are consistent, objective and meaningful; 2) the list is accurate; 3) it is maintained with an established database; and 4) is managed to promote parity.” This approach will help address the efficacy of the current waiting list process and help determine what future steps need to be taken. While these approaches have helped address the service or support needs of many individuals on the waiting list, additional steps need to be taken by DHSS to ensure that consumers in need of services receive these services and that the number of individuals on the waiting list continues to decline. First, core services should be expanded to cover all individuals on the waiting list so that consumers do not end up in a crisis while awaiting services. These additional services could also be funded through STAR grants and additional Community DD Grant Program funds. Second, despite the fact that individuals can be moved off of the wait list and into services each day, DHSS needs to take steps to eliminate the waiting list altogether . As the work continues to better manage the waiting list the state will need to determine when they have maximized the benefit of current resources and when the time is right to request and invest additional resources into the service system. Any new investments should be directed to the HCBS Waiver programs, to ensure that there is an adequate level of resources to meet consumers assessed needs. DHSS should also consider the development of a supports waiver to complement the current comprehensive waiver; this is discussed in more detail later in the report. In summary, the state might explore a four-step process to address its waitlist. This process would include:
• developing a Supports Waiver; • using state dollars freed up by moving individuals to the Supports Waiver to serve more
individuals on the waiting list; • efficiently manage the grants to maximize the number of individuals served • determine who has an immediate need for additional services on the waitlist • requesting additional appropriation to serve individuals on the waiting list; and, • facilitating a discussion with the legislature to determine an annual appropriation that would
prevent substantial growth of the waiting list. Fiscal Impact: In the recommendation, there are suggestions for the expansion of "core services", the creation of a supports waiver, and obtaining additional funding from the legislature. Again, costs would vary depending on what services the state chooses to add, and how selective the eligibility standards are. The creation of a supports waiver is potentially cost effective if core services funded by 100% state general fund dollars can be provided as part of the Medicaid program.
State of Alaska Department of Health and Social Services
ALASKA LONG TERM CARE AND COST STUDY
FINAL REPORT
Final Report Page 48
B. Review the state’s level of care interpretations and implementation for the MR/DD waiver and consider changes as part of the waiver renewal process.
Alaska currently interprets its level of care criteria in a manner which may be restrictive in terms of the types of services that individuals are able to receive. The way in which current level of care definitions are applied in the MR/DD waiver is a potential problem to Alaska’s long term care system because it may limit how many people qualify for the HCBS Waivers, access federal matching dollars and avoid placement in more restrictive environments. The waiver should be utilized to support people in the community as long as health, safety and well being can be assured. When individual needs exceed the ability to ensure that health, safety and well being are met, then placement alternatives must be provided. For the HCBS waivers, the federal government permits states to establish their own methodology for determining whether or not applicants for waiver services meet the state’s level of care criteria. States may use the same method used for determining placement in an institutional setting or a different methodology as long as they can demonstrate that the alternative process it plans to use is ‘valid, reliable and full comparable’ to the process used in determining admission to a Medicaid certified institution (State Medicaid Manual, Section 4442.5B.5). In particular, Alaska should review the March 6, 1997 Medicaid letter which was titled ‘Guidelines Regarding what Constitutes and ICF/MR Level of Care Under a Home and Community-Based Services Waiver’ (a copy of this letter is found in Appendix F). A couple of key elements in this letter that are especially relevant to Alaska follow:
• many people in need of HCBS waivers do not “resemble” individuals served in an institutional setting; and,
• the letter states that “prior to the inception of the waiver program, individuals in institutions exhibited a broad range of functional abilities. As the balance of care has subsequently shifted from institutional to home and community-based care, the more severely disabled individuals have tended to remain in institutions.”
This statement is a recognition that HCBS waiver LOC criteria is predicated on a 1981 ICF/MR eligibility standard under which individuals were admitted to an ICF/MR who, due to the availability of HCBS services, would not be considered appropriate for institutional care placement today, including smaller, community-based facilities. CMS further addressed this question when it proposed that applicable laws and/or regulatory requirements be revised to: “allow states that tighten eligibility for [admissions to] hospitals and Intermediate Care Facilities for the Mentally Retarded (ICF/MR) to do so without simultaneously narrowing eligibility for Medicaid Home and Community Based Services (HCBS) waiver eligibility.” This proposal was included in a portion of a report to the President on the New Freedom Imitative (see level of care document for reference citation). This recommendation was not put into regulations but is a clear admission on the part of CMS that states need to be given the ability to support individuals in the community who are distinctly different from those who were served in ICF/MRs prior to HCBS waivers. The language that is contained in the authorizing statutes under Section 1915 (c)(1) of the Social Security Act which stated that “but for the provision of such [HCBS] services” would be eligible for institutional care is key to this interpretation. CMS has approved a number of support service HCBS waivers for individuals with developmental disabilities supports the concept that individuals when provided with modest levels of support services can be prevented from needing or requiring an ICF-MR level of care.

State of Alaska Department of Health and Social Services
ALASKA LONG TERM CARE AND COST STUDY
FINAL REPORT
Final Report Page 49
In addition, the 1997 letter mentioned earlier notes that the concept of “active treatment” is not applicable to the provision of HCBS waiver services. This is also consistent with the approach that individuals who do not need “continuous, aggressive” services and supports can be served in HCBS waiver programs. The waiver renewal process provides an opportunity for Alaska to determine if they should develop a separate supports waiver which does not provide 24 hour services to individuals. We suggest that DHSS revisit its level-of-care definitions for the MR/DD, OA, and APD waivers and modifies the definitions in order to be more fitting to consumer care needs. Service definitions for the Older Alaskan, Adults with Physical Disabilities, and Developmental Disabilities Waivers should also be revisited and reviewed. There is more than sufficient support that any such revisions of the service definitions would be consistent with CMS definition and criteria. This recommendation is relevant to the waiver renewal process in which DHSS is currently engaged. Amending the current waivers at this time to address this issue would not be advisable given the length of time it would take to process a potential amendment and given that the current waivers are up for renewal in July 2006. In conjunction, part of the problem with the level of care determinations in Alaska, specifically in the MR/DD waiver program, is a direct relation to the use of the ICAP as the tool to determine level of care. A more appropriate tool, such as the Supports Intensity Scale developed by AAMR, would more specifically identify consumer needs and help the state more accurately target services to the MR/DD population. Fiscal Impact: This could have a longer-term fiscal impact for DSDS due to an increased number of individuals served, but additional steps are needed to figure out exactly what the impact of this recommendation would be. For example, one way to estimate the number of new persons who would receive services under a revised LOC definition would be to complete a record review of individuals currently not able to access services, then compare what the revised LOC would look like to cross-walk how a different LOC would affect these individuals and why. Since states can limit the number of people on waivers, the fiscal impact would largely be a legislative decision about how much expansion the Legislature is willing to make. A consequence of lowering the standard without authorizing the expansion of the waiver is that people with lower needs would be allowed onto the waiver, while others with higher needs could be placed on the waiting list. C. Consider the addition of a provision for consumer-directed personal care services to the
MR/DD waiver program and the interface with the Medicaid State Plan PCA services. Currently, consumers enrolled on the MR/DD waiver use a substantial amount of supported living services. The high utilization of this service may be due in part to the absence of PCA services on the waiver. Comparatively, supported living is a higher cost service than PCA services and is meant to address different needs. PCA services for the MR/DD population in HCBS Waivers are often used as a supplement to State Plan PCA services in other states; this is utilized when the individual’s need requires more PCA care than the State Plan allows per consumer. By adding PCA services to the waiver, consumers may be able to access the additional personal care services they need (beyond what is provided in the State Plan) and will not have to do so through the higher cost of supported living waiver service. Alaska should engage in a process to determine the pros and cons of this possibility to see if it logically provides a change that is beneficial to both the consumers and the Medicaid system.

State of Alaska Department of Health and Social Services
ALASKA LONG TERM CARE AND COST STUDY
FINAL REPORT
Final Report Page 50
In addition, there needs to be a clarification of the definitions of in-home services and PCA services, to ensure that the definitions are distinct and do not overlap. Individuals should still have the option to receive either or both services based on assessed need. Fiscal Impact: PCG believes that adding services will have a modest effect on the Department, since persons are currently obtaining those services in other ways, ex: through supported living. There might also be cost reductions from reduction of supported living services due to the addition of PCA. D. Personal Care services need to be coordinated with OA/APD waiver services. Currently, there is no care coordination for personal care services, but there is on the waiver. The consumer-directed Personal Care program lacks the oversight that care coordination potentially provides. As currently structured, the OA/APD waivers do not have an in-home service option, except for limited chore and meal service. The absence of the option causes waiver recipients to rely heavily on PCA services. Use of personal care services by OA/APD recipients is substantial. The waiver and personal care programs have different administrative procedures, different data systems, and different plans of care while providing highly similar services to the same group of people. Moreover, the state pays substantially different rates for these similar services. This overlap has consequences: it fragments care plans, increases quality of care problems, and uses unnecessary administrative resources. One way of coordinating the two programs is to expand the in-home service options on the waiver to include services that compliment or enhance those received in the Personal Care program. If waiver participants were encouraged to use these services, the result would be better quality of care for waiver participants and better cost control over the PCA program. An appropriate approach would be to require the wavier care coordinators to include coordination of PCA services in the individual care plans so a complete picture of services received is provided and the services are coordinated.. This would require discussion with care coordinators and potential regulatory changes to the PCA regulations. Economies of scale can be obtained by relying on the waiver care coordination rather than funding a separate care coordination function for personal care. Care coordinators would review the person’s status more frequently than the once-every-six month’s visit from a nurse from the PCA program. Fiscal Impact: This is a budget-neutral suggestion. No new services are being proposed and no new eligibles are being created. There is some administrative cost of policy implementation, for example, time with clients and providers, writing new regulations, etc. Non-waiver Medicaid eligibles would continue to receive the same services. E. DHSS should immediately develop a strategy for renewal of its current waivers. The current four HCBS Waivers are due for renewal in July 2006 and work is now beginning on them. Given that CMS now has a new waiver template and additional waiver requirements, it would be advisable for Alaska to make substantial progress as soon as possible. Two elements of the waiver application that are new include the requirement for the state to provide specific detail on how the Quality Framework requirements will be met and, second, evidence that the waiver application was provided to stakeholders for feedback and that input was received and utilized during the development of the waiver.

State of Alaska Department of Health and Social Services
ALASKA LONG TERM CARE AND COST STUDY
FINAL REPORT
Final Report Page 51
One option for waiver renewal would be to renew the waivers as they currently exist and, after approval, make technical changes to add services that are not currently included. The second option would be to develop new waivers once renewal has been approved and make technical changes to remove any services that will be covered under the new waiver. A third option would be to develop a supports waiver once waiver renewal has been obtained; this waiver would offer Federal Financial Participation (FFP) for the services that are currently being offered through state-funded Core Services. (Core Services are limited to $3,000 per person and offered to individuals on the Waitlist who receive no other services from the Division. Early availability of Core Services may alleviate crisis until individuals are in need of long term care and are selected off of the Waiting List). Additionally, state funds that are freed up (a result of moving individuals off of the DD Waitlist and onto the supports waiver) could be used to serve more individuals on the DD Waitlist. In response to the prevalence of Traumatic Brain Injury in Alaska (105 per 100,000), there has been work in Alaska to establish a TBI waiver. Interviews with staff and stakeholders revealed that the current service system does not have the infrastructure to fully address the unique and complex needs of the TBI population. Given this difficulty, the state needs more specialized services to effectively address the needs of this population; therefore, we recommend the development of a TBI waiver. The comparison state analysis revealed that Vermont and Minnesota have waiver services for individuals with Alzheimer’s disease and related dementias (ADRD). Given the need for services of this population in Alaska, we recommend that Alaska explore the development of a 1915(c) or 1115 waiver program for ADRD. The development of a 1915(c) waiver would be the most practical approach and the Vermont waiver could be a model for Alaska. As part of the service recommendations included earlier in this section of the report, we suggest that DHSS revisit and rewrite its current waivers for Older Alaskans, Adults with Physical Disabilities, and Developmental Disabilities, as well as write a Supports Waiver. By separating the current waiver into a Comprehensive Waiver and a Supports Waiver, Alaska would be better able to manage its limited resources. A Supports Waiver can be an effective management tool. Pursuing this step will allow DHSS to expand and provide additional services required by these populations and also to claim additional FFP on the services provided. If Alaska pursues the strategic planning recommendation made earlier in this report, it would be appropriate to include discussion and analysis of the feasibility of an 1115 Research and Demonstration waiver. This type of waiver would allow Alaska to include a number of populations currently served through individual / distinct waivers and would expand covered population; however, it seems at this time that Alaska needs to better utilize and analyze existing and new information before undertaking the development of this type of waiver. An 1115 Waiver may be a realistic long term goal for Alaska. Fiscal Impact: Approximately 20 states have a brain injury waiver. Wyoming and Vermont, with smaller populations than Alaska, spend $2.2 million to $2.5 million on their waivers. In Wyoming, in FY ’03, 80 individuals were served at a cost of $2.2 million, for an average cost per person of $27,580. In Vermont in 2001, 50 persons were served at an average cost of about $44,000. The next larger states, Idaho and New Hampshire with 1.2 million people each spend $1.2 million and $8 million respectively on their brain injury waivers. Given what other states do a fiscal impact of about $2.5 million for Alaska seems reasonable. The state could also begin this as a model waiver with a capped enrollment and

State of Alaska Department of Health and Social Services
ALASKA LONG TERM CARE AND COST STUDY
FINAL REPORT
Final Report Page 52
anticipate serving approximately 50 to 100 persons depending on the range of services offered under the waiver. F. Evaluate the need for objective, independent care coordination. Another improvement that might be made is to create objective, independent care coordination. The care coordination for individuals on the MR/DD waiver is currently completed by care coordinators who are hired by the agencies that provide the service. This same situation also exists on the OA and APD waivers, although some independent care coordinators are associated with these waivers. Care coordination establishes the level of services needed and monitors the fit between the changing needs of the person and how effective services are in helping the person. We found that the situation concerning assessments is similar to the one that currently exits with care coordination, in that there is a lack of consistency. The assessment determines the person’s eligibility for services: it gets the person in the door. Because provider agencies complete these assessments and there is no central reporting or database collection of results, inconsistency is present. Additionally, there are no economies of scale in the provision of the assessments. Many of these problems are being rectified by the state; however, parallel problems in care coordination have not been tackled and have materially contributed to the substantial and unexpected cost overruns in the personal care program. These suggestions emphasize the need for better control, accountability and objectivity in the current reimbursement process. A system of independent care coordination, such as the interdisciplinary team of primary care physicians, nurses, social workers, rehabilitation therapists, home health workers, and others that the PACE model relies upon, would assist in this effort. Alaska should remember that any model or approach to independent care coordination considered would need to allow for enough flexibility in structure that issues such as geographic proximity, and number of people served could realistically be addressed. The important features of independence from direct service provision can be addressed in a number of ways, which do not necessitate a separate agency, but do include assurances of policy and supervision ‘firewalls’ that ensure independence from direct service provision. Fiscal Impact: This is also a cost-neutral suggestion. Again, administrative staff time will be necessary to implement this recommendation. G. Implement a standardized method of collecting habilitation costs from MRDD providers and pay providers in a consistent and equitable manner. In the last four years, the state has made major and commendable steps to rationalize the management and reimbursement of home and community based programs, particularly its decision to use contracted assessments for waivers and PCA. The 2004 regulations provided an across-the-board tightening of loopholes in how waiver services were reimbursed; the new regulations for personal care will result in similar improvements. PCG believes that more improvements are possible in the consistency and accountability of the reimbursement methodology that is used to pay for residential and day habilitation services in the MR/DD waiver. An examination of how rates are set shows that the state has little control over the millions of dollars spent for these services. Providers submit budget detail forms for each client served, and these budget detail forms self-reported selected costs. State staff has little capability to determine if accurate,

State of Alaska Department of Health and Social Services
ALASKA LONG TERM CARE AND COST STUDY
FINAL REPORT
Final Report Page 53
duplicate, or unallowable costs are included on the budget detail forms without substantial effort to validate these amounts directly with providers. The number of files increases each year but the staff to review them does not, so monitoring becomes more difficult over time. The end result is a negotiated process. Residential and day habilitation services are large parts of the budget, so efforts to end a widespread pattern of negotiated rates could begin here. All MR/DD and CCMC waiver services, except daily respite, are individually negotiated on each plan of care. Chore services do not have a statewide rate, and payments for supported employment vary from $20 to $50, depending on the plan. Fiscal Impact: Improvements in these practices could be implemented in a cost-neutral way without a regulatory reduction in provider rates. Savings would occur over time as costs were understood and controlled better. Savings are hard to estimate but could be 1 to 3 percent of total expenditures. Administrative staff time will be necessary to implement the activities stemming from this recommendation.
(i) Providers of residential habilitation in assisting living homes should submit an annual cost report to the state and the state should develop standardized methods for reimbursing residential habilitation costs based on the collected cost reports.
The rate setting environment is markedly different between the MR/DD, the CCMC, and the OA/APD procedure codes. These differences have their origin in the different histories of the programs and the state organizations that supervised them prior to their consolidation in the Division of Senior and Disabilities Services. Before the state can reimburse costs well, it must first understand them. In FY 2005, the residential habilitation and day habilitation programs in the MR/DD and CCMC waivers cost close to $60 million: The state lacks essential cost reporting to manage this amount. Currently, each provider submits their own costs on their own forms and it is difficult to check to see if the costs are accurate or are in fact incurred. Providers now submit cost information to the state, but what is now submitted should be consolidated so that a provider only needs to submit one cost report, one time, which should be used in conjunction with a standardized rate-setting methodology. Improvements are needed to uniformly collect provider costs and set rates in an economically and efficient manner. Providers now submit a cost proposal and the state prior-authorizes each service, up to the amount in the cost proposals. Approximately 1,000 of these cost proposals were sent to state staff in FY 2005. As the MR/DD costs sheets presented in this report exemplify, these are more like individual contracts in which the state will pay a different rate to different agencies for the same service. The costs and care plans of providers are proposed, perhaps negotiated over, and then approved. For example, as a result of the negotiations, some contracts contain adjustments and/or additional itemized costs, which are added on top of direct service costs. These lead to a certain inequity among payments to providers, since not everyone gets the same “adjustment” even though similar services are being reimbursed. Currently, the provider costs sheets show indirect costs being added to the rate and then administrative and general percentages (A&G) are added on top of the indirect rate. Without a cost report showing all costs incurred by the home, there is no way of telling if the indirect amounts are being double-counted in the A&G cost. Moreover, the use of standardized cost report forms will highlight and better identify the

State of Alaska Department of Health and Social Services
ALASKA LONG TERM CARE AND COST STUDY
FINAL REPORT
Final Report Page 54
special items that some providers have been allowed to insert in their costs. Having all providers submit standardized cost reports may achieve some economies of scale for the state. Alaska can improve its reimbursement by having each provider of residential habilitation submit a cost report to the state on a standardized cost report form developed by the state. The rate setting for OA and APD residential services uses a standard cost report form that providers prepare and submit. Data from these report forms is collected in a single data base and each provider’s expenditures by cost center can be compared with statewide averages. The use of a standard cost-report based reimbursement method in the MR/DD waiver would represent a significant improvement over the current unmanageable negotiations that now set the rates. PCG makes no recommendation as to whether this should be a prospective or retrospective reimbursement. These form(s) could report costs incurred during the provider’s last completed fiscal year and could be trended forward to present a prospective rate for the current year, or projected budgets could be reported on the forms and then audited after the year is over. Or a mixture of projected and actual costs could be used. One option is to use the procedures currently used to pay assisted living homes for residential supported living arrangements. The same procedures could be applied to the MRDD and CCMC residential reimbursement. Once the state has cost report information, the state staff that complete rate setting tasks can review and compare costs across providers, do desk audits of the cost reports, analyze allowability of costs, and develop rates and discuss them with providers. These forms can also be used to collect ownership information that is not collected at present. For example, there may be situations where someone owns a home and provides residential services but an agency contracts with the home and bills for the services. With better cost report information, the state can monitor the contracting to prevent “factoring” and other inappropriate contractual relationships that might be occurring. There are administrative costs in improving the reimbursement. However, there are potential program savings to the extent this more consistent and rational methodology will result in lower costs. Fiscal Impact: This recommendation will have administrative impacts. At least two if not more additional FTEs will be required to handle the increased workload. Alternatively, the work could be contracted out to a firm that is familiar with cost-based rate setting for states. Program savings are difficult to quantify but there should be some when a more consistent system is developed.
(ii) Auditing of submitted cost reports and waiver claims. The state has lacked essential auditing controls over waiver costs. This is changing with the recent contract with an auditing company. However, the state should have a program that ensures that services billed and paid for were in fact provided for the clients. This is especially true when the same agency is receiving payment for similar services during overlapping time periods. An example of this is shown in the budget detail form in Appendix E where the same agency provides the care coordination, the residential and day habilitation, the hourly respite, and the daily respite for an individual. Fiscal Impact: The APS Healthcare Audit has shown the cost effectiveness of auditing. While there are administrative costs of auditing cost reports and claims, there will be disallowed costs and overpayment recoveries that should offset some auditing cost.

State of Alaska Department of Health and Social Services
ALASKA LONG TERM CARE AND COST STUDY
FINAL REPORT
Final Report Page 55
(iii) Agencies billing for multiple homes should submit an annual cost allocation plan to
the state showing how agency costs are distributed across all their homes and other activities of the agency.
Those provider agencies that operate multiple homes should submit a cost allocation plan containing the per-home allocated costs. This practice is followed in other chain situations, such as nursing facility and hospital reimbursement. For example, at present, the state cannot study all of a provider’s budget detail forms for all of its clients. The state cannot take the A&G amounts charged on each budget detail form, sum them to see the total amount of A&G amounts charged by an agency, and then compare the amount charged to the agency’s administrative costs. This is a weakness in the rate setting methodology which relies on A&G percentages instead of using audited and allocated cost from a previous time period projected forward. Fiscal Impact: There is some administrative workload in reviewing these cost reports. However, this situation only applies to a few agencies and there could be savings to the state in the prevention of duplicate costs.
(iv) Tighten up on the use of compression in residential habilitation and day habilitation.
The current rate setting methodology reimburses more than a per diem cost each day. The use of a “compression” factor adds a percentage to the rate. “Compression” is the practice of dividing costs by the number of days in a year minus the days a resident will be gone from the home. The provider is paid 100% of all estimated costs even though the resident may not be in the home for all of the days. As implemented the use of compression could reimburse providers for variable costs that they do not in fact incur. Compression as currently used does not factor in variable costs. Moreover, the amount of the increase depends on the number of days the rate is “compressed” and is negotiable. The amount of compression depends on the negotiating skill of the provider and it is possible to ask to use significant compression such as 180 days. State employees interviewed were uncertain if there was an edit that prevents a compressed rate from being billed for more days than there are in the compression. In other words, take a yearly cost, divide it into 330 days, use that rate, but then bill for 356 days. PCG recommends that edits be tightened up. The state also gets close to paying twice for the same service when it reimburses one provider with a compressed rate and then pays the same or different provider for respite care for the same days that are included in the compression. A potential overlap of payments here should be examined. Fiscal Impact: The system needs working edits that prevent a provider from billing for more than the number of days that the rate is compressed. The practice becomes abusive when the state is paying for both a compressed rate and for the days of care provided outside of the assisted living home. For example, if the state is also paying for respite care when the recipient is not in the home, but the provider is getting a compressed rate for those days.
(v) Cap administrative expenses associated with a single client’s care. The state should not pay providers for unnecessary administrative costs. On the one hand, it is reasonable to add administrative and general (A&G) costs to the reimbursement cost pools. However, a review of

State of Alaska Department of Health and Social Services
ALASKA LONG TERM CARE AND COST STUDY
FINAL REPORT
Final Report Page 56
budget detail sheets shows that multiple additions of various overhead costs create a cost per person of $15,000 to $20,000 to cover this overhead. At these rates you could hire one person full time to take care of the administrative processing for three to four clients. There is no crosswalk in the budget detail to the provider’s financial statements so it is hard to match overhead costs per person with the provider’s reported administrative costs. In lieu of a rate setting system that captures all direct and indirect costs, the state should put a capped dollar amount on the total amount of A&G that it will pay for any single person. Fiscal Impact: Savings could be estimated by taking all recipients and comparing the difference between the rates without and without a cap on administrative costs. The state does not know have a database that would allow modeling of these changes.
(vi) The 26% discount used on the supported residential living arrangements per diem when three or more days of adult day care are used should also be applied to residential habilitation when three or more days of day habilitation are used.
Why should the state pay twice for the same service? The intent of this discount is to recapture unnecessary costs. If a resident is going to be absent from the home for significant periods, then the state should not pay the residential provider and the day habilitation provider for the same services on the same day. Instead, the residential provider should have its rate lowered to recognize the absence of the client from the home. Where are state controls in a situation where the same provider provides the residential and day habilitation and the respite care? This logic of excluding unnecessary payments is already recognized in regulation and should be applied to the residential habilitation program as well. Fiscal Impact: Savings could be estimated by taking all recipients and comparing the difference between the habilitation rates without and without the correction for the overlap. The state does not know of a database that would allow modeling of these changes.
(vii) Consolidate residential habilitation codes. The differences between residential shared care, foster care, and group homes procedure codes are subtle and the codes have marginal differences among them. The codes do not represent different services, service locations, or provider types because the same provider and same services are provided in each. The codes also appear to be used for record keeping; to track children from adults. This is a weak reason for having a procedure code. While shared care and family habilitation reflect different care strategies, they highly similar and one code could be used with them. The use of these codes should be reviewed to see if a valid program reason exists for continuing to use them. Fiscal Impact: This is a cost-neutral activity that should involve minimal administrative time. H. Rewrite service descriptions of intensive active treatment/therapy. As noted above, the wording of the intensive active treatment/therapy service does not clearly identify it as a professional service, document the list of professionals that can bill for services, set time limits on how long such a treatment will be paid for, or require that the service, if covered by Medicaid, should be

State of Alaska Department of Health and Social Services
ALASKA LONG TERM CARE AND COST STUDY
FINAL REPORT
Final Report Page 57
billed as a state Medicaid plan service. Without clarification of its intent, the code has the danger of becoming a catch-all category. For example, in budget detail sheets reviewed by PCG staff, monthly and quarterly nursing assessments were billed under this procedure code. If a nurse is needed to perform activities, it may be more cost effective to provide nursing services under the private duty nurse service of the regular Medicaid State Plan. Fiscal Impact: This is an administrative task that could yield some savings in program by preventing unnecessary utilization, such as paying for similar services on the same day. I. Conduct Edit Review in the Medicaid Management Information System (MMIS) to quantify and fix the edits. The use of edits on waiver procedure codes by the claims processing system should be reviewed to ensure that necessary edits are in place and that they are in conformity with current policy. There is uncertainty as to how efficiently the fiscal intermediary keeps up with program changes. Edits are complicated and require the assistance of the state’s Medicaid fiscal intermediary to create and maintain them. For example, there is no edit to prevent a licensed home for billing for more than the regulated number of residents, for billing for the regulated number of residents plus their daily respite, or billing for multiple residents who may or may not live in that home. There are edits for not billing for waiver services on the same day as someone is in a hospital or nursing home. There are also edits to prevent billing for the same person for both a group home rate and a daily or hourly respite charge. But there are no edits controlling multiple respite providers on the same day for the same residential habilitation provider. Given the complexities of the edits, it makes sense for state staff to ensure that all necessary edits are in the claims processing system and that existing reimbursement policy is correctly expressed by these edits. Fiscal Impact: This is a small study and will require some program and data processing staff, possibly a committee, to complete. Alternatively, it could be contracted out for an estimated $65,000 or less depending on the scope of the work. J. Administrative code at 7 AAC 43.1055 regulating specialized medical equipment and supplies
should be changed to require that the state reimburse average manufacturer’s cost or that the supplier must provide evidence of competitive bidding.
Currently, providers of specialized medical equipment and supplies tell the state what the cost of the supplies will be. There is a regulation that Medicaid not pay more for equipment and supplies than private parties would pay; however, a few private parties pay for this equipment and supplies. As a result, the state has no assurance that it is paying the lowest cost possible. The state is now issuing new regulations regarding specialized medical equipment and these need to require that the state pay average manufacturer’s cost, pay the results of a competitive bidding process, or explore a similar rate structure for grant and waivers services offered by the same agency in the same region. For example, three competitive bids could be collected to establish a range of actual costs that can be applied to future purchases.

State of Alaska Department of Health and Social Services
ALASKA LONG TERM CARE AND COST STUDY
FINAL REPORT
Final Report Page 58
Fiscal Impact: In FY 2005, the state spent about $720,000 in state and federal funds to provide specialized medical equipment to about 1,000 persons on the waiver. Tightening the buying process would require staff time to rewrite regulations and hear comments from the effected public. The benefits are difficult to quantify but include more competitive purchasing and a modest 5-7% lowering of state costs.
Table VI-5: OA Waiver Reimbursement Methodology Summary

State of Alaska Department of Health and Social Services
ALASKA LONG TERM CARE AND COST STUDY
FINAL REPORT
Final Report Page 59
Table VI-6: APD Waiver Reimbursement Methodology Summary

State of Alaska Department of Health and Social Services
ALASKA LONG TERM CARE AND COST STUDY
FINAL REPORT
Final Report Page 60
Table VI-7: MR/DD Waiver Reimbursement Methodology Summary

State of Alaska Department of Health and Social Services
ALASKA LONG TERM CARE AND COST STUDY
FINAL REPORT
Final Report Page 61
Table VI-8: CCMC Waiver Reimbursement Methodology Summary

State of Alaska Department of Health and Social Services
ALASKA LONG TERM CARE AND COST STUDY
FINAL REPORT
Final Report Page 62
Grant Program Recommendations A. Develop a strategy to sustain grant-funded pilot projects and services. Based on our review of the current system, the lack of continuity of care appears to have resulted in a fragmented approach to long term care. Many of the current services are funded through grant programs from the state. However, the programs started through these grants apparently are unable to sustain themselves past the life of the grant. This is due in part to a lack of infrastructure to track outcomes and effectiveness of the programs, waning interest from the funders (i.e. the legislators and the state), and absence of commitment to these programs through inclusion in the state’s budget. The state needs to develop a consistent approach for evaluating the quality and outcomes achieved in pilot projects. The state will want to evaluate the benefit of developing a process that addresses how sustained state funding may be achieved for pilot programs that are deemed important to continue. Providers and the state will want to explore ways in which programs can be sustained through means that do not rely solely on grant and budget funding. The Alaska Mental Health Trust Authority (AMHTA) is a primary funding source for many of these short-term projects, and the need for long term sustained funding for successful projects and models should be addressed to the AMHTA in addition to DHSS and the Alaska Legislature. Fiscal Impact: Administrative time and planning efforts required, but program costs are not anticipated. B. Account levels and financial practices within DD grants need to be monitored and state
responsibility for accounts consolidated under one financial unit to ensure consistency of expenditures and reallocation of funds as needed.
State staff commented about the variability of rates paid to vendors by grantees and that at present, some agencies are allowed to keep funds that go unspent, while people wait for services. These concerns can be addressed by consolidating state financial responsibility for DD grants under one financial unit. Accounting policies and Department regulations may need to be changed to clarify the state's expectations about procedures for paying providers with grant money and how unspent funds should be reallocated. Moving funds between agencies allows for meeting the needs of more recipients who are waiting for services and efficiently spends General Fund resources. Fiscal Impact: This consolidation could occur within an existing unit by adding 1-2 FTEs. Administrative and training time may be required, but program costs are not anticipated. C. The state should issue a report comparing the rates paid by grantees for selected services such
as meals and transportation, compare rates paid across providers, and compare rates paid by Medicaid for the same service in the same geographical region.
State staff members are concerned about the consistency of rates under the grants, with the rates for similar services paid by Medicaid. For example, the grantee receiving $21 per meal under the OAA grant but being paid a negotiated Medicaid waiver rate of $13 per meal is troublesome. It is appropriate to be concerned about this area; therefore, PCG recommends that a more formal, systematic comparison be made to map the practice.
Fiscal Impact: This recommendation requires administrative time and planning efforts, but program costs are not anticipated.

State of Alaska Department of Health and Social Services
ALASKA LONG TERM CARE AND COST STUDY
FINAL REPORT
Final Report Page 63
The Deficit Reduction Act of 2005 The Deficit Reduction Act of 2005 (DRA), passed by the House on February 2, 2006 and signed by President Bush, creates several new options for states to consider with regard to their long term care systems. These new options for LTC include: 1) a state Medicaid plan option for home and community based services, which would cover multiple target populations; 2) an option for self-directed personal assistance services; and, 3) the addition of an eligibility category for families who care for a child with a disability at home. These are important options for Alaska to consider in going forward with several of the recommendations offered in this report, including comprehensive strategic planning, re-evaluating the Medicaid eligibility categories available to Alaskans, and enhancing the breadth of home and community-based services offered within the state. In particular, two mandatory changes through the incorporation of the DRA will have a noticeable effect in Alaska. The first is the new provision that requires a clarification of the utilization and purpose of targeted case management (TCM). The second is the provision for “money to follow the person” when leaving an ICF-MR or Nursing Facility, which creates a competitive grant process to which states will need to apply. CMS is directed to publish regulations for each of these provisions, which will occur within the next few months. The specific impact that the DRA or these two particular provisions may have on Alaska as well as on the recommendations made in this report will not be clear until those CMS regulations are published.

State of Alaska Department of Health and Social Services
ALASKA LONG TERM CARE AND COST STUDY
FINAL REPORT
Final Report Page 64
VII. COST COMPARISON FOR IMPROVING ALASKA’S LONG TERM CARE DELIVERY SYSTEM
A key component of the Long Term Care and Cost Study is the presentation of a cost comparison between Alaska’s current long term care system and a system that implements the programmatic and reimbursement recommendations presented earlier in this report. In order to produce this cost comparison, PCG relied upon Alaska population projections from the U.S. Census as well as utilization and expenditure data received from several Alaska sources, including the MMIS and other DHSS reports. We have estimated the long term care program costs for the next 3, 10, and 20 years in Alaska in conjunction with projections of population, Medicaid providers, consumers, and expenditures within Alaska’s census areas. The effects of PCG’s recommendations on future long term care expenditures have also been included in this section of our report. The anticipated need for future nursing home beds in Alaska was a particular element that was also considered for this report and is included in Appendix L of this report. In summary, Section VII includes a detailed discussion of the following topics: A. Analysis of Current Long Term Care Services and Spending in Alaska
• State of Alaska Population Trends • Consumer Demographics and Utilization of LTC Services in 2005 • Medicaid and Other LTC State and Federal Expenditures 1997-2005
B. Analysis of Projected Long Term Care Services and Spending in Alaska
• Trends in Demographics and Service Consumption • Costs of Demographic and Service Consumption Estimates • Cost Comparison of Recommended Changes to LTC System of Care

State of Alaska Department of Health and Social Services
ALASKA LONG TERM CARE AND COST STUDY
FINAL REPORT
Final Report Page 65
A. Analysis of Current Long Term Care Services and Spending in Alaska In order to produce this cost comparison, we relied upon Alaska population projections as well as projections of Medicaid providers, recipients, and expenditures, each by census area. A map of the census areas utilized for these projections, which was obtained from the Alaska Department of Labor and Workforce Development.
Table VII-1: Alaska Census Areas
State of Alaska Population Trends The following table illustrates a projection of Alaska’s population by age from the U.S. Census. Table VII-2 shows the numbers and percent change in population for Alaska age groups from 2005 to 2015 and 2025; the figures show that the number of Alaskans is projected to grow by 159,771 between 2005 and 2025, which is a 24% increase. The table also shows that in Alaska in 2005, the U.S. Census found that there were 62,984 residents 61 years and older, who comprised approximately 9.53% of the population. The projection for 2025 is that 145,059 residents will be 61 years of age and older, and will comprise 17.67 % of the population. Of the 159,771 residents added to the Alaska population between 2005 and 2025, about 82,000 or 51% will be 61 years of age and older. The state needs to plan for growth in the age of Alaskans, as this will have a direct relationship to the projected future demand for LTC services and their related expenditures. About 4,000 residents a year who are aged 61 years and older will be added to the population every year for the next 20 years until about 1/6th of the population is over the age of 61. PCG’s recommendations strongly encourage the state to undertake a serious statewide planning effort, consider filling gaps in services, build an infrastructure

State of Alaska Department of Health and Social Services
ALASKA LONG TERM CARE AND COST STUDY
FINAL REPORT
Final Report Page 66
to support program expansion, and improve its financial control over program expenditures. These recommendations have been organized for purposes of the cost comparison in the following categories: Administrative Actions related to Program Activities; Administrative Actions related to Reimbursement Methods; Program Expansion; and Cost Savings.
Table VII-2: Alaska Population Change (By Age for the Years 2005, 2015, 2025)
Persons By Age
Projection 2005
Projection 2015
Projection 2025
Change from 2005
to 2015
% Change 2005 to
2015
Change from 2005
to 2025
% Change 2005 to
20250-5 60,865 76,718 82,673 15,853 26.05% 21,808 35.83%6-10 48,206 57,384 69,164 9,178 19.04% 20,958 43.48%11-15 52,106 47,375 61,673 (4,731) -9.08% 9,567 18.36%16-20 57,261 45,941 55,678 (11,320) -19.77% (1,583) -2.76%21-25 52,760 57,609 56,147 4,849 9.19% 3,387 6.42%26-30 42,375 64,939 57,451 22,564 53.25% 15,076 35.58%31-35 44,180 55,335 63,690 11,155 25.25% 19,510 44.16%36-40 46,173 41,292 65,725 (4,881) -10.57% 19,552 42.35%41-45 54,754 41,487 53,151 (13,267) -24.23% (1,603) -2.93%46-50 55,758 42,592 38,219 (13,166) -23.61% (17,539) -31.46%51-55 48,806 49,051 37,011 245 0.50% (11,795) -24.17%56-60 34,882 46,568 35,240 11,686 33.50% 358 1.03%61-65 22,670 38,176 37,492 15,506 68.40% 14,822 65.38%66-70 14,533 27,089 35,419 12,556 86.40% 20,886 143.71%71-75 10,422 17,420 29,200 6,998 67.15% 18,778 180.18%76-80 7,536 10,430 20,046 2,894 38.40% 12,510 166.00%81-85 3,959 5,466 10,129 1,507 38.07% 6,170 155.85%85+ 3,864 7,672 12,773 3,808 98.55% 8,909 230.56%Total 661,110 732,544 820,881 71,434 10.81% 159,771 24.17%
Source: U.S. Census Bureau, Population Division, Interim State Population Projections, 2005. File 3. Interim State Projections of Population by Single Year of Age: July 1, 2004 to 2030 Table VII-2 also shows the impact of the “baby boomers.” The age cohorts born after World War II are a population bulge, while the cohorts after them are smaller. The right hand column of Table VII-2, titled % Change 2005 to 2025, shows this demographic bulge. By 2025, growth rates for the residents aged 61 and over are positive, but the growth rate for residents aged 55-60 is only 1.03%. The rates of the next three cohorts under 55-60 are negative. The existence of this bulge implies that larger capital facility projects, such as building new nursing homes, could possibly result in over-building after the population surge passes. This implication informs the report’s recommendation regarding nursing homes that is discussed later in this section. Consumer Demographics and Utilization of LTC Services in 2005 Before itemizing population and service demand forecasts and detailing their fiscal impacts, it is useful to understand current service provision and consumer utilization of services within the state. Table VII-3 shows the ages of consumers using the state’s waiver programs, Pioneer Homes, and nursing homes. The Table uses unduplicated counts of consumers, as shown in the column labeled “Undup. Total of

State of Alaska Department of Health and Social Services
ALASKA LONG TERM CARE AND COST STUDY
FINAL REPORT
Final Report Page 67
Consumers.” Waiver figures are based on eligibility codes (persons eligible for waiver services and using any Medicaid service) provided by DHSS. Personal care programs were not included, as they are heavily used by consumers who also use waiver services. There are 4,552 unduplicated Medicaid consumers in long term care programs in 2005. As anticipated, the proportion of the population using these services increases with age: more than 38% of all consumers are age 61 years and older, with nearly 14% of total consumers age 85+.
Table VII-3: Consumers of Medicaid LTC Services as a Percent of Total Population, FY 2005
Consumers 2005 2005 2005 2005 2005 2005 Undup. 2005 Percentage of By Age OA APD MRDD CCMC Nursing Pioneer Total of Census Persons using
Waiver Waiver Waiver Waiver Homes Homes Consumers service by age0-5 0 0 4 76 0 76 60,865 0.12%6-10 0 0 45 51 0 88 48,206 0.18%11-15 0 0 115 63 3 0 172 52,106 0.33%16-20 0 0 122 46 2 0 166 57,261 0.29%21-25 1 18 148 16 4 0 179 52,760 0.34%26-30 0 30 134 0 3 0 166 42,375 0.39%31-35 0 29 102 0 13 0 140 44,180 0.32%36-40 0 52 108 0 18 0 170 46,173 0.37%41-45 2 105 95 0 29 0 219 54,754 0.40%46-50 3 143 66 0 49 0 248 55,758 0.44%51-55 5 185 47 0 46 0 262 48,806 0.54%56-60 5 204 22 0 65 0 276 34,882 0.79%61-65 33 228 5 0 73 23 289 22,670 1.27%66-70 213 39 7 0 89 23 296 14,533 2.04%71-75 254 1 8 0 125 45 360 10,422 3.45%76-80 338 1 0 0 151 90 444 7,536 5.89%81-85 353 2 0 0 165 68 478 3,959 12.07%85+ 380 2 0 0 189 203 523 3,864 13.54%Total 1587 1,039 1,028 252 1,024 450 4,552 661,110
Note: Age 85 numbers overlap between state data and US Census data. Source: DHSS staff Medicaid and Other LTC State and Federal Spending 1997 - 2005 Alaska has made considerable investments in developing a system of care to support the needs of older and disabled residents. The development of home and community-based services and supports has required significant state financial commitments and is still dependent on the need for federal financial participation (i.e. Medicaid and Medicare) to continue to meet the needs of Alaskans. Table VII-4 shows that extensive program growth has fueled formidable increases in program costs. Table VII-4 also shows both state and Federal spending on selected Medicaid programs, including nursing homes, waiver services, and personal care. Expenses of the Medicaid program are paid for by both state and Federal funds. The proportion paid for by the state is specified each year by the federal government. Disregarding the difference in state and federal fiscal years, in state fiscal year 2005, the Federal government paid approximately 57.58% of the $257,850,739 spent on these programs in 2005 and the state paid 42.42% or $109,380,284.

State of Alaska Department of Health and Social Services
ALASKA LONG TERM CARE AND COST STUDY
FINAL REPORT
Final Report Page 68
Table VII-4: Selected Medicaid LTC Expenditures, 1997-2005
Nursing Wavier Personal Total of these YearlyHomes Services* Care Programs Increases
1997 43,559,385 21,340,951 3,629,742 68,530,077$ 1998 44,743,237 29,879,703 4,253,576 78,876,516$ 15.10%1999 47,416,865 37,405,899 4,788,144 89,610,908$ 13.61%2000 49,096,935 49,543,110 5,598,978 104,239,024$ 16.32%2001 51,004,585 72,084,958 5,914,078 129,003,621$ 23.76%2002 59,984,379 90,812,021 12,514,945 163,311,345$ 26.59%2003 61,367,167 105,762,714 39,328,013 206,457,894$ 26.42%2004 57,256,446 114,736,533 64,880,363 236,873,342$ 14.73%2005 68,604,849 109,552,685 79,693,206 257,850,739$ 8.86%
Source: All data on payments from MMIS, includes both state and federal expenditures Note: Waiver services does not include all Medicaid services that waiver program enrollees may receive The long term care expenditures presented in Table VII-4 do not include non-Medicaid costs for Pioneer Homes paid through general funds nor grant funding that supported senior programs and programs serving persons with disabilities—therefore, expenditures on total long term care were even higher than those listed for each year. State General Fund expenditures on Pioneer Homes have been declining. In 1997, the state spent approximately $30.4 million in state funds to operate the Pioneer Homes. Then, because of increased consumer payments, state portion of funding dropped to about a net of $23.4 million in state funds in 2005. In coming years, the increased Medicaid funding now being realized by the Homes will further decrease the percentage of total Pioneer Home expenditures paid for by the state. Table VII-5 below provides detail about spending on home and community based care programs. This analysis shows that approximately $187 million of the total $257.8 million in FY 2005 (see Table VII-4) was spent on five provider types that form the core of home and community based services in Alaska: care coordination services, care coordinators, home and community based care, personal care, and residential supported living.

State of Alaska Department of Health and Social Services
ALASKA LONG TERM CARE AND COST STUDY
FINAL REPORT
Final Report Page 69
Table VII-5: Area Senior Population Compared with Dollars Spent by Area For Medicaid Home and Community-Based Services, FY 2005
60+ pop. in ACA State
Plan
Percent of Persons 60 + in
Area
FY 2005 Percent of
expenditures
Care Coordination
service expenditures
Care Coordinator expenditures
HCB Provider expenditures
Personal Care service
expenditures
Residential Supported
Living expenditures
NORTHWESTNorth Slope Borough 504 0.97% 0.11% 10,920$ 2,240$ 196,310$ -$ -$
Northwest Arctic Borough 495 0.95% 0.15% 7,355$ -$ 271,622$ -$ -$ Nome Census Area 803 1.54% 0.05% 10,800$ 611$ 80,991$ -$ -$
Total Northwest Population 1,802 3.46% 0.31% 29,075$ 2,851$ 548,923$ -$ -$ INTERIOR
Denali Borough 120 0.23% 0.00% -$ -$ -$ -$ -$ Fairbanks North Star Borough 5,723 10.98% 7.69% 328,985$ 204,079$ 8,262,462$ 4,129,753$ 1,501,573$ Yukon-Koyukuk Census Area 671 1.29% 0.00% -$ -$ -$ -$ -$
Southeast Fairbanks Census Area 602 1.16% 0.32% 12,905$ 200$ 106,061$ 480,319$ -$ Total Interior Population 7,116 13.65% 8.01% 341,890$ 204,279$ 8,368,523$ 4,610,071$ 1,501,573$
SOUTHWESTWade Hampton Census Area 506 0.97% 0.00% -$ -$ -$ -$ -$ Lake and Peninsula Borough 156 0.30% 0.00% -$ -$ -$ -$ -$
Bethel Census Area 1,086 2.08% 1.25% 124,565$ 15,566$ 1,690,009$ 520,261$ -$ Dillingham Census Area 414 0.79% 0.67% 10,240$ 13,115$ 146,297$ 786,393$ 303,300$
Bristol Bay Borough 92 0.18% 0.00% -$ -$ -$ -$ -$ Aleutian Islands East Borough 151 0.29% 0.00% -$ -$ -$ -$ -$
Aleutian Islands West Census Area 235 0.45% 0.00% -$ -$ -$ -$ -$ Total Southwest Population 2,640 5.07% 1.92% 134,805$ 28,681$ 1,836,305$ 1,306,654$ 303,300$
SOUTHEASTYakutat City and Borough 58 0.11% 0.01% -$ -$ 25,471$ -$ -$
Skagway-Hoonah-Angoon Census 417 0.80% 0.09% -$ -$ 167,978$ -$ -$ Haines City and Borough 342 0.66% 0.04% 5,000$ 1,435$ 72,372$ -$ -$ Juneau City and Borough 2,746 5.27% 6.37% 346,610$ 131,935$ 7,106,577$ 4,233,927$ 135,618$
Sitka City and Borough 1,058 2.03% 0.57% 29,870$ 58,370$ 402,555$ 436,380$ 141,699$ Wrangell-Petersburg Census Area 913 1.75% 0.18% 41,200$ -$ 229,724$ -$ 67,987$ Prince of Wales-Outer Ketchikan 602 1.16% 0.01% -$ -$ 15,308$ 10,763$ -$
Ketchikan Gateway Borough 1,516 2.91% 1.39% 154,279$ 4,750$ 1,937,142$ 268,496$ 233,683$ Total Southeast Population 7,652 14.68% 8.67% 576,959$ 196,490$ 9,957,127$ 4,949,565$ 578,986$
SOUTHCENTRALMatanuska-Susitna Borough 5,114 9.81% 11.51% 807,603$ 234,074$ 10,433,057$ 7,388,134$ 2,731,054$
Kenai Peninsula Borough 5,285 10.14% 10.56% 558,705$ 332,370$ 9,868,884$ 6,852,755$ 2,196,526$ Kodiak Island Borough 967 1.86% 0.94% 74,845$ 21,035$ 1,501,467$ 14,099$ 157,056$
Valdez-Cordova Census Area 869 1.67% 1.09% 30,640$ 55,414$ 1,138,346$ 823,539$ -$ Total Southcentral Population 12,235 23.48% 24.11% 1,471,793$ 642,893$ 22,941,754$ 15,078,526$ 5,084,636$
ANCHORAGEAnchorage Municipality 20,672 39.66% 56.98% 2,498,654$ 877,905$ 35,476,370$ 53,677,396$ 14,344,954$
TOTAL STATE POPULATION 52,117 187,570,937$ 5,053,176$ 1,953,098$ 79,129,001$ 79,622,212$ 21,813,450$ Source: Population figures from Alaska Commission on Aging and FY 2005 data on payments from MMIS Note: Costs are based on provider type by census area request, which did not restrict claims records by age and summarized costs by provider type The population estimates by area for persons who are 60 years of age and greater is taken from the Alaska Commission on Aging “State Plan for Services June 14, 2004 – June 13, 2006.” This estimate is in the current State Plan and using it here is consistent with its use in the Plan. Table VII-5 and the tables in Appendix M consider the distribution of Medicaid services by reviewing the location of providers, the geographical residence of persons who receive services, and the amount of money spent by census area. The tables compare the distribution of older persons with the distributions of long term care providers, where persons receiving service live, and where Medicaid expenditures are paid. The analysis indicates that a higher amount of dollars is spent in the more populated areas of the state as compared to less populated areas. It is reasonable that populated areas have more services and less populated areas have fewer services. However, these tables show that, in general, less populated areas

State of Alaska Department of Health and Social Services
ALASKA LONG TERM CARE AND COST STUDY
FINAL REPORT
Final Report Page 70
have fewer services even when controlling for the population size of older adults. These findings are similar to the conclusions drawn by the Alaska Native Tribal Health Consortium in its report.9 The figures reported in Table VII-5 are important in supporting the rationale behind PCG’s recommendation to expand personal care services to rural areas. Medicaid programs are designed to help individuals in need receive medical services and the state program is required to make comparable services available throughout the state unless a waiver of comparability is obtained from the federal Medicaid agency, CMS. The lack of comparability is an imbalance and over the long-run, the state should plan to increase its long term care services to less populated areas. There are numerous difficulties in expanding long term care services. The need to expand long term care programs in less populated areas operates in a context of worse health deficits. Less populated areas in Alaska have significant documented infrastructure and social service needs. While health disparities between Alaska Natives and other populations have lessened, they continue to persist. These differences begin at birth, with higher infant mortality rates for Alaska Natives (7.1 for Natives versus 4.5 for white Alaskans10) and continue with a life expectancy for Alaska Natives at 69.4 years, compared to 74.7 years for all Alaskans.11 The challenge is clear for the state: it must build a long term care infrastructure in less populated areas despite the social and geographical issues, existing waiting lists for services, and the difficulties of managing popular programs with rising costs. To let matters continue will mean that increasing numbers of individuals over the age of 60 in these areas will continue to have less access and receive fewer services than people in more populated areas. The tables in Appendix M quantify, by census area, the human impact of an increased growth in older individuals. B. Analysis of Projected Long Term Care Services and Spending in Alaska Trends in Demographics and LTC Service Consumption (2005 – 2025) According to U.S. Census data, approximately 159,000 more residents are projected to be living in the state by the year 2025, and about half of these new individuals will be over the age of 60. This will have a substantial impact on the demand for long term care services in Alaska. The poor, elderly residents who use Medicaid typically have multiple impairments and consume large amounts of personal care services, services from adult day health programs, chore services, meal services, and often need help with transportation and housing from programs such as residential living. These individuals have multiple, difficult to solve, interacting needs, and require active care coordination and quality assurance monitoring. As the number of these people and their service needs are increasing each year, the state needs ways to provide these services in the communities where people live so that folks do not have to relocate to regional centers to obtain their services. Table VII-6 below shows that, assuming constant utilization of services, the number of long term consumers using waiver services, nursing homes, and Pioneer Homes is projected to nearly double by the 9Alaska Native Tribal Health Consortium, Division of Community Health Services, “Long Term Care Needs of Alaska Native Elders”, May 2005; p. 50. 10 2002 Annual Report Alaska Bureau of Vital Statistics 11 Indian Health Service, Alaska Area, Division of Planning, Evaluation and Health Statistics, 2005 Special Reports, at http://www.alaska.ihs.gov/dpehs/ak-dpehs-sp-ak-natives.asp

State of Alaska Department of Health and Social Services
ALASKA LONG TERM CARE AND COST STUDY
FINAL REPORT
Final Report Page 71
year 2025, from 4,552 to 8,655 consumers. This projection is similar to the findings by the Alaska Native Tribal Health Consortium in its report on the Long Term Care needs of Alaskan Tribal Elders.12
Table VII-6: Estimates of New Consumers of Waiver Services, Nursing Homes, and Pioneer Homes as Percent of Population in 2025
Age of Current Users 2005 Current Users Census New Users Total of
Persons FY 2005 Census Percent of Population Increase FY 2025 Current and2005 Census 2005 to 2025 New Users
0-5 76 60,865 0.12% 21,808 27 103 6-10 88 48,206 0.18% 20,958 38 126 11-15 172 52,106 0.33% 9,567 32 204 16-20 166 57,261 0.29% (1,583) (5) 161 21-25 179 52,760 0.34% 3,387 11 190 26-30 166 42,375 0.39% 15,076 59 225 31-35 140 44,180 0.32% 19,510 62 202 36-40 170 46,173 0.37% 19,552 72 242 41-45 219 54,754 0.40% (1,603) (6) 213 46-50 248 55,758 0.44% (17,539) (78) 170 51-55 262 48,806 0.54% (11,795) (63) 199 56-60 276 34,882 0.79% 358 3 279 61-65 289 22,670 1.27% 14,822 189 478 66-70 296 14,533 2.04% 20,886 425 721 71-75 360 10,422 3.45% 18,778 649 1,009 76-80 444 7,536 5.89% 12,510 737 1,181 81-85 478 3,959 12.07% 6,170 745 1,223 85+ 523 3,864 13.54% 8,909 1,206 1,729 Total 4,552 661,110 159,771 4,103 8,655
Sources: US Census data and MMIS/DHSS staff Note: Total using Waivers and Homes are counts of people eligible and using Medicaid services due to waiver program eligibility, or any persons on Medicaid using NH or PH services
Medicaid Costs of Demographic and Service Consumption Estimates (2005 – 2025) The Department contracted with the Lewin Group and ECONorthwest to make a forecast of Medicaid enrollment and spending in Alaska, for the period 2005-2025. This report was released on February 15, 2006.13 The 128-page report projects current trends forward in utilization, enrollment, and costs for all Medicaid services. The report’s findings about the growth of nursing home, personal care and home and community-based waiver services are relevant to our projections about Alaska’s long term care services. The Lewin report projects that the number of Alaskans using personal care services would increase at a rate of 9.7% per year, resulting in a seven-fold increase to approximately 35,000 consumers in 2025. Similarly, consumers of home and community-based waiver services would increase at a rate of 9.0% per year, resulting in more than six-fold increase to approximately 25,000 consumers in 2025. These forecasts seem high since they imply that many of the 82,000 new seniors over the age of 60 would enroll in Medicaid and receive personal care and/or home and community based waiver services.
12Ibid. p. 72 13 The Lewin Group and ECONorthwest, “Long Term Forecast of Medicaid Enrollment and Spending in Alaska: 2005-2025” February 15, 2006. The report is currently available at http://www.hss.state.ak.us/das/.

State of Alaska Department of Health and Social Services
ALASKA LONG TERM CARE AND COST STUDY
FINAL REPORT
Final Report Page 72
Medicaid expenditures for personal care and home and community-based waiver were expected to grow at rates higher than the expected demand for these services. The report found that state matching dollars spent on personal care services would increase at a rate of 12.8% per year, resulting in an almost twelve-fold increase from approximately $49 million in 2005 to $630 million in 2025, and that state matching dollars spent on home and community-based waiver services would increase at a rate of 11.8% per year, resulting in a more than ten-fold increase from approximately $49 million in 2005 to $520 million in 2025. Combining the state spending on personal care and home and community-based waivers, the state dollars spent would reach approximately $1.15 billion in 2025. Below are two PCG Medicaid forecasts, resulting from the projected and current data that is available on the future of Alaska’s long term care service system. The forecasts shown in Table VII-7 and Table VII-8 assume that the state will continue to receive a 50% match on its Medicaid expenditures. While The Deficit Reduction Omnibus Reconciliation Act of 2006 allows Alaska to keep the FY 2005 regular FMAP at 57.58% for Fiscal Years 2006 and 2007, after FY 2007, it reverts to the regular formula (50%). Table VII-4 above shows combined state and federal spending on these programs for the years 1997-2005 and serves as the baseline for expenditures for the following analysis. Table VII-7 below shows a projection of state and federal spending based on estimates of average annual percent changes from 2006 to 2025 as shown in the Lewin report. The rate for nursing homes is 7.0%, with 11.3% as the rate for HCBS waiver services, and 12.3% as the rate for personal care14. Table VII-7 shows that substantial increases in both state and federal expenditures would result by 2025 if these three programs increased at these rates. The results are shown in nominal dollars, which includes inflation. In aggregate, total expenditures increase at roughly 11% per year.
14 Ibid. Table 20 p. 63.

State of Alaska Department of Health and Social Services
ALASKA LONG TERM CARE AND COST STUDY
FINAL REPORT
Final Report Page 73
Table VII-7: Current State and Federal Medicaid Spending, Projected Forward 2005-2025 (Based on Annual Average Total Spending Rates by Program in Nominal Dollars)
Nursing Wavier Personal Total Homes Services Care
2006 73,407,188$ 121,932,139$ 89,495,470$ 284,836,803$ 2007 78,545,691$ 135,710,470$ 100,503,413$ 314,761,581$ 2008 84,043,889$ 151,045,754$ 112,865,332$ 347,956,983$ 2009 89,926,962$ 168,113,924$ 126,747,768$ 384,790,663$ 2010 96,221,849$ 187,110,797$ 142,337,744$ 425,672,400$ 2011 102,957,378$ 208,254,317$ 159,845,286$ 471,058,993$ 2012 110,164,395$ 231,787,055$ 179,506,257$ 521,459,719$ 2013 117,875,903$ 257,978,992$ 201,585,526$ 577,442,434$ 2014 126,127,216$ 287,130,618$ 226,380,546$ 639,640,394$ 2015 134,956,121$ 319,576,378$ 254,225,353$ 708,759,867$ 2016 144,403,049$ 355,688,509$ 285,495,071$ 785,588,646$ 2017 154,511,263$ 395,881,310$ 320,610,965$ 871,005,555$ 2018 165,327,051$ 440,615,898$ 360,046,114$ 965,991,082$ 2019 176,899,945$ 490,405,495$ 404,331,786$ 1,071,639,245$ 2020 189,282,941$ 545,821,316$ 454,064,596$ 1,189,170,873$ 2021 202,532,747$ 607,499,125$ 509,914,541$ 1,319,948,433$ 2022 216,710,039$ 676,146,526$ 572,634,030$ 1,465,492,616$ 2023 231,879,742$ 752,551,083$ 643,068,015$ 1,627,500,863$ 2024 248,111,324$ 837,589,355$ 722,165,381$ 1,807,868,084$ 2025 265,479,116$ 932,236,953$ 810,991,723$ 2,008,709,817$
Table VII-8 below shows projected state and federal expenditures by year, assuming trends in spending from the years 1997-2005 continue into the future—until 2025. The average annual rate of increase based on the trend data for this period is about 5.55%. The trend analysis does take into account historical increases in utilization and the results are shown in nominal dollars. Expenditure growth, consistent with spending trends from 1997-2005, would result in a 275% increase in state and Federal dollars required to support Alaska’s long term care system by 2025. The differences between Table VII-7 and Table VII-8 demonstrate the impact of the different assumptions on the spending forecasts.

State of Alaska Department of Health and Social Services
ALASKA LONG TERM CARE AND COST STUDY
FINAL REPORT
Final Report Page 74
Table VII-8: Current State and Federal Medicaid Spending Projected Forward 2005-2025 (Based on Spending Trends in Nominal Dollars)
Nursing Wavier Personal Total Homes Services Care
2006 68,379,555 135,574,283 71,355,387 275,309,226$ 2007 71,321,381 148,664,283 80,724,219 300,709,883$ 2008 74,263,206 161,754,282 90,093,051 326,110,540$ 2009 77,205,032 174,844,282 99,461,883 351,511,197$ 2010 80,146,857 187,934,281 108,830,715 376,911,854$ 2011 83,088,683 201,024,280 118,199,547 402,312,511$ 2012 86,030,508 214,114,280 127,568,379 427,713,168$ 2013 88,972,334 227,204,279 136,937,212 453,113,825$ 2014 91,914,159 240,294,279 146,306,044 478,514,482$ 2015 94,855,985 253,384,278 155,674,876 503,915,139$ 2016 97,797,811 266,474,278 165,043,708 529,315,796$ 2017 100,739,636 279,564,277 174,412,540 554,716,453$ 2018 103,681,462 292,654,277 183,781,372 580,117,110$ 2019 106,623,287 305,744,276 193,150,204 605,517,767$ 2020 109,565,113 318,834,275 202,519,036 630,918,424$ 2021 112,506,938 331,924,275 211,887,868 656,319,081$ 2022 115,448,764 345,014,274 221,256,700 681,719,738$ 2023 118,390,589 358,104,274 230,625,532 707,120,395$ 2024 121,332,415 371,194,273 239,994,364 732,521,052$ 2025 124,274,240 384,284,273 249,363,196 757,921,709$
The state needs to plan for growth. The tables developed in this section show that the state is facing a significant future liability, since the number of residents over the age of 61 will increase from 10% of the population to 16%, and half of new residents added to the population in the next 20 years will be 61 or over. Budget projections of future spending increase substantially when inflation is taken into account. Whether the percentage increases in Table VII-7 are used or the trend data in Table VII-8 is utilized, the results produce very large dollar estimates of required future spending. While caught between increased demographic demand and unsustainable budget increases, the state still faces the challenging task of rebalancing its services to provide equitable and comparable services to its rural areas. The following section highlights many of PCG’s recommendations for meeting these future challenges. PCG’s recommendations focus on building the state’s capacity to plan and administer larger programs, maintaining current funding levels such as continuing to support existing senior centers, and expanding those services that require the least physical infrastructure-building. For example, companion care and personal care can be lower-cost alternatives to more expensive residential programs. Targeted model waivers, such as one for traumatic brain injury, can be controlled innovations that are made without expansive eligibility changes. Maintaining current funding levels for existing programs, such as senior centers, makes more sense than weakening them through budget cuts as the need for their services increases.

State of Alaska Department of Health and Social Services
ALASKA LONG TERM CARE AND COST STUDY
FINAL REPORT
Final Report Page 75
Cost Comparison of Recommended Changes to LTC System of Care PCG presented fifty-five (55) recommendations for change to the current long term care system in Alaska within this report. For the purposes of the cost comparison, we have organized those recommendations into the following tables and categories:
• Table VII-9: Administrative Actions related to Program Activities • Table VII-10: Administrative Actions related to Reimbursement Methods • Table VII-11: Recommendations for Program Expansion and/or New Programs • Table VII-12: Recommendations for Cost Savings
About 43 of the recommendations, or nearly 80%, require administrative action, which will help the Department manage its current services and plan for the orderly expansion of future programs. Implementing these actions will require staff time, the addition of new staff (approximately 12 FTEs), other administrative expenses such as training, and data processing equipment and software improvements. Table VII-9 identifies recommendations that will result in better administrative control, better program operations, and better quality programs. Where possible, the fiscal impact of each recommendation has been provided and a funding source has also been identified.
Table VII-9: Recommendations for Administrative Actions Related to Program Activities
Recommendation Fiscal Impact Funding Source
Complete integration of senior and disabilities services under DSDS
Possible training costs Current Funding
Conduct a statewide long term care strategic planning process 1 Administrative FTE and additional staff time
Current Funding
Develop usable management reports from the MMIS 1 Research Analyst FTE, staff time, and approx.
$150,00 - $450,000
Might be eligible for 75% MMIS FFP
Address the perception of Pioneer Homes in Alaska's long term care system
Staff time Current Funding
Conduct Edit Review in the MMIS to quantify and fix the edits
Staff time or approx. $65,000 for contractor
Current Funding
Continue to use the Eden Model in the Pioneer Homes Staff time and ongoing operations cost
Current Funding
Ensure the timely determination of Medicaid eligibility Staff time, possible program savings
Current Funding
Evaluate and make changes to the care coordination system Staff time, requires fiscal analysis
Current Funding
Develop a strategy to sustain grant-funded pilot projects/services
Staff time Current Funding
Develop a universal screening and referral tool Possibly 1/2 to 1 FTE, plus training costs
Current & New Funding
Enhance quality assurance 4 FTEs New Funding (some or all allowable for
Medicaid FFP)
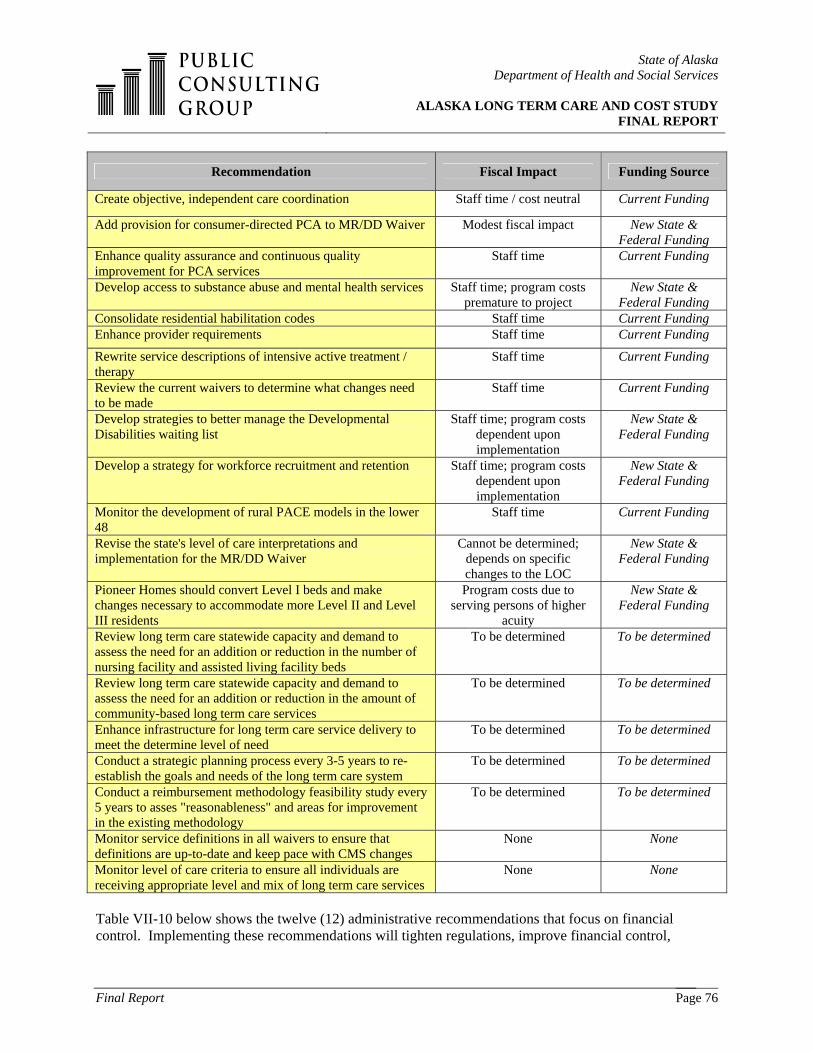
State of Alaska Department of Health and Social Services
ALASKA LONG TERM CARE AND COST STUDY
FINAL REPORT
Final Report Page 76
Recommendation Fiscal Impact Funding Source
Create objective, independent care coordination Staff time / cost neutral Current Funding
Add provision for consumer-directed PCA to MR/DD Waiver Modest fiscal impact New State & Federal Funding
Enhance quality assurance and continuous quality improvement for PCA services
Staff time Current Funding
Develop access to substance abuse and mental health services Staff time; program costs premature to project
New State & Federal Funding
Consolidate residential habilitation codes Staff time Current Funding Enhance provider requirements Staff time Current Funding
Rewrite service descriptions of intensive active treatment / therapy
Staff time Current Funding
Review the current waivers to determine what changes need to be made
Staff time Current Funding
Develop strategies to better manage the Developmental Disabilities waiting list
Staff time; program costs dependent upon implementation
New State & Federal Funding
Develop a strategy for workforce recruitment and retention Staff time; program costs dependent upon implementation
New State & Federal Funding
Monitor the development of rural PACE models in the lower 48
Staff time Current Funding
Revise the state's level of care interpretations and implementation for the MR/DD Waiver
Cannot be determined; depends on specific changes to the LOC
New State & Federal Funding
Pioneer Homes should convert Level I beds and make changes necessary to accommodate more Level II and Level III residents
Program costs due to serving persons of higher
acuity
New State & Federal Funding
Review long term care statewide capacity and demand to assess the need for an addition or reduction in the number of nursing facility and assisted living facility beds
To be determined To be determined
Review long term care statewide capacity and demand to assess the need for an addition or reduction in the amount of community-based long term care services
To be determined To be determined
Enhance infrastructure for long term care service delivery to meet the determine level of need
To be determined To be determined
Conduct a strategic planning process every 3-5 years to re-establish the goals and needs of the long term care system
To be determined To be determined
Conduct a reimbursement methodology feasibility study every 5 years to asses "reasonableness" and areas for improvement in the existing methodology
To be determined To be determined
Monitor service definitions in all waivers to ensure that definitions are up-to-date and keep pace with CMS changes
None None
Monitor level of care criteria to ensure all individuals are receiving appropriate level and mix of long term care services
None None
Table VII-10 below shows the twelve (12) administrative recommendations that focus on financial control. Implementing these recommendations will tighten regulations, improve financial control,
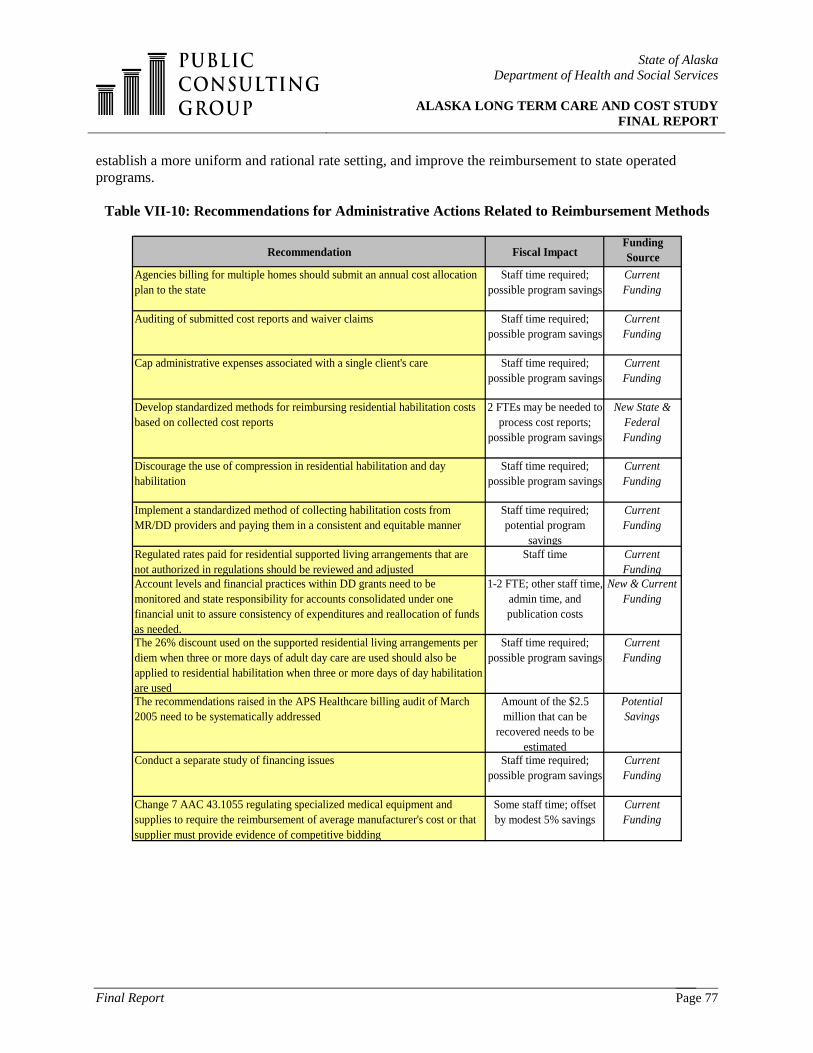
State of Alaska Department of Health and Social Services
ALASKA LONG TERM CARE AND COST STUDY
FINAL REPORT
Final Report Page 77
establish a more uniform and rational rate setting, and improve the reimbursement to state operated programs.
Table VII-10: Recommendations for Administrative Actions Related to Reimbursement Methods
Recommendation Fiscal ImpactFunding Source
Agencies billing for multiple homes should submit an annual cost allocation plan to the state
Staff time required; possible program savings
Current Funding
Auditing of submitted cost reports and waiver claims Staff time required; possible program savings
Current Funding
Cap administrative expenses associated with a single client's care Staff time required; possible program savings
Current Funding
Develop standardized methods for reimbursing residential habilitation costs based on collected cost reports
2 FTEs may be needed to process cost reports;
possible program savings
New State & Federal Funding
Discourage the use of compression in residential habilitation and day habilitation
Staff time required; possible program savings
Current Funding
Implement a standardized method of collecting habilitation costs from MR/DD providers and paying them in a consistent and equitable manner
Staff time required; potential program
savings
Current Funding
Regulated rates paid for residential supported living arrangements that are not authorized in regulations should be reviewed and adjusted
Staff time Current Funding
Account levels and financial practices within DD grants need to be monitored and state responsibility for accounts consolidated under one financial unit to assure consistency of expenditures and reallocation of funds as needed.
1-2 FTE; other staff time, admin time, and publication costs
New & Current Funding
The 26% discount used on the supported residential living arrangements per diem when three or more days of adult day care are used should also be applied to residential habilitation when three or more days of day habilitation are used
Staff time required; possible program savings
Current Funding
The recommendations raised in the APS Healthcare billing audit of March 2005 need to be systematically addressed
Amount of the $2.5 million that can be
recovered needs to be estimated
Potential Savings
Conduct a separate study of financing issues Staff time required; possible program savings
Current Funding
Change 7 AAC 43.1055 regulating specialized medical equipment and supplies to require the reimbursement of average manufacturer's cost or that supplier must provide evidence of competitive bidding
Some staff time; offset by modest 5% savings
Current Funding

State of Alaska Department of Health and Social Services
ALASKA LONG TERM CARE AND COST STUDY
FINAL REPORT
Final Report Page 78
Only four recommendations involve programs that require new state and federal program spending. All of these recommendations are discussed in great detail earlier in the report. One recommendation seeks to improve short term crisis response capabilities, while the most expensive recommendation creates more comparability in service provision between rural and more densely populated areas. Two other recommendations are to fill service gaps by providing more companion care and different wavier services.
Table VII-11 Recommendations for Program Expansion and/or New Programs
Develop capacity for crisis beds and/or crisis response teams in rural areas $800,000 per crisis response team developed
New State & Federal Funding
Ensure PCA services are available throughout the rural areas Approximately $9.6M annually
New State & Federal Funding
Expand community service options for senior citizens
As much as $4.5M annually for providing additional companion
services
New State & Federal Funding
Revise specific service definitions and expand types of covered services. For example add a waiver for persons who have Traumatic Brain Injuries
Variable staff costs for review; adding a TBI
waiver could cost $2.5M annually in state and
federal funds
New State & Federal Funding
Table VII-12 contains eight suggestions for cost savings. Five of the eight refer to rate setting procedures used with the Pioneer Homes. Implementing these recommendations would require some additional staff time and could be done in a cost-neutral manner. Conservatively, we estimate that this could produce approximately $500,000 in cost savings. One of the most important recommendations highlighted in our report calls for the implementation of a more rational and consistent reimbursement method for residential and day habilitation services. Similarly, we estimate that this could produce an additional $500,000 in cost savings. The recommendation of implementing a provider assessment could produce nearly $2 million in additional federal funds, but will require federal approval before these dollars can be realized. Recommendations for opportunities to secure 100% federal matching funds for expansion of tribal activities are difficult to predict, but our experience suggests that Alaska should consider them strongly. An example is the successful Yukon-Kuskokwim Health Corporation MRDD project, which helped about 45 Medicaid DD waiver clients and created a savings of about $500,000. The 2005 “Long Term Care Needs of Alaska Native Elders” report estimated that about 550 Alaskan natives had LTC needs of a sufficient magnitude to require nursing home or waiver services, a number projected to double by the year 202015. During the period of July 1, 2005 through December 31, 2005, there were approximately 265 Alaskan Natives on waivers and as of December 31, 2005, approximately 6% of the 973 MRDD waiver 15 Branch, K., “Long Term Care Needs of Alaska Native Elders”, Alaska Native Tribal Health Consortium Anchorage, AK, August 2005, p. 67.

State of Alaska Department of Health and Social Services
ALASKA LONG TERM CARE AND COST STUDY
FINAL REPORT
Final Report Page 79
recipients (58 consumers) self-reported that they were Alaska Natives. Given the size of this potential customer base, perhaps an additional 2-3 projects of similar size and savings to the Yukon-Kuskokwim Health Corporation project could be accomplished if providers were found and rates were increased (potential providers may desire an increase in rates to provide services in the more rural areas, which could be as much as 50%, 75% or even 100%). Given the dispersion of rural population, it is also reasonable to assume that these projects would be phased over a period of 5-6 years. Alaska can enhance the recovery of Medicaid costs for long term care services by implementing enhancements to the current Estates Recovery program. Eliminating the "minimum asset threshold" for recovery, permitting probate initiation on behalf of the state as a creditor, requiring attorneys to notify DHCS about probate, and expanding the definition of probate in the State Medicaid Plan are several options that should be considered.
Table VII-12 Recommendations for Cost Savings
Recommendation Fiscal Impact Funding Source
Review treating all meal-related costs as being unallowable costs Staff time required; program savings Current Funding
Revise the cost and reimbursement structure of the Pioneer Homes Staff time required; possible program savings Current Funding
Costs of operating the Pioneer Homes as identified in the PACAP should be taken into account in developing the Medicaid rate
Staff time required; possible program savings Current Funding
Use a consistent reimbursement methodology to pay for residential and day habilitation services in the MR/DD Waiver
Although implemented in a cost-neutral way,
efficiencies could save $500,000 in state funds
Current Funding
Use actual patient days instead of licensed capacity in per diem Staff time required; possible program savings Current Funding
Ensure that Medicaid pays its share of Pioneer Home costs Staff time required; possible program savings
Would have off-setting of state general funds if the
state drew down FFP
Consider a provider assessment on nursing facilities Estimated $2 million in additional federal funds Potential Savings
Work with tribal organizations Potential savings of approximately $1.5 million Potential Savings
Expand Estate Recovery Opportunities $1-2 M annually Potential Savings
Table VII-13 below summarizes the annual fiscal impact of the most significant recommendations, including both new programs and costs savings.

State of Alaska Department of Health and Social Services
ALASKA LONG TERM CARE AND COST STUDY
FINAL REPORT
Final Report Page 80
Table VII-13: Report Recommendations with Financial Impacts and
Estimated Timelines for Implementation
Recommendations Cost in state and Federal funds
Year of Implementation
TBI Waiver 2,500,000$ 2008PCA services 9,600,000$ 2007, 2008, 2009Restoring companion services 4,500,000$ 2008Crisis response team 800,000$ 2007Total Cost 17,400,000$
Provider Tax 1,500,000$ 2007Reimbursement Changes 1,100,000$ 2007Working with Tribal Organzations 1,500,000$ 2008, 2010, 2012Pioneer Homes 500,000$ 2006Total Savings 4,600,000$
For comparison purposes, total FY05 LTC programming cost:
$257,850,739
Potential Program Costs (annual)
Potential Program Savings (annual)
*Dollar amounts in Table VII-13 are current dollar amounts.
Table VII-14 shows the net effect of these costs and savings when projected out to the year 2025. The fiscal impact of PCG’s recommendations varies between $14.9 million in state funds to $36.9 million in 2025 depending on the spending projections assumed.
Table VII-14: The Fiscal Impact of PCG Recommendations
Projections of Current State Spending in Medicaid
LTC
State Spending in 2005
State Spending in 2025 without
recommendations
State Spending in 2025 with
recommendations
Difference of recommendations in
state funds
Avg Annual % Change 2005-2025
Estimated annual average increases by program 109,380,284$ 1,004,354,908$ 1,041,267,141$ 36,912,232$ 11.00%Trend Analysis 1997-2005 109,380,284$ 378,960,854$ 393,813,088$ 14,852,233$ 5.50% * Table VII-14 above specifically refers to state general funds.

State of Alaska Department of Health and Social Services
ALASKA LONG TERM CARE AND COST STUDY
FINAL REPORT
Final Report Page 81
VIII. TRANSITION PLAN The recommendations provided in this report are based on our current understanding of the State of Alaska’s long term care system and reflect our thoughts regarding the direction in which the state should move over the next 3, 10, and 20 years. It is important to reiterate to the reader that our recommendations have not been ordered based on available resources; some of the recommendations do not require additional resources, and those recommendations that do require additional resources will have to be carefully considered and prioritized by DHSS as resources become available. To assist DHSS with the prioritization of recommendations, we have developed a Transition Plan to assist the State of Alaska in restructuring the system of long term care over the next 3, 10, and 20 years. The Transition Plan provides DHSS with a framework for addressing the recommendations in this report with respect to the resources available. We have identified recommendations that can be addressed by DHSS over 3-year and 10-year time periods. While we did not suggest that any of the proposed recommendations be addressed beyond the 10-year time period, we have provided DHSS with some key elements that should be kept in mind for the 20-year time period. Given the number of recommendations provided in this report, it is not an expectation that DHSS will be able to address every recommendation within the respective time periods. For instance, depending on priorities, some recommendations placed in the 3-year time period may not be addressed until after the first three years of implementation. DHSS will need to prioritize their efforts based on what it views to be the most urgent needs of the system and address recommendations accordingly. PCG’s Transition Plan provides DHSS with further guidance by identifying which recommendations do not require legislative changes and which recommendations may require legislative changes. We have also included our determinations for the party responsible for undertaking the effort, the fiscal impact summary, and the source of funds. By identifying a source as “current funding”, PCG is referring to the normal state budgeting that each year provides some additional administrative and program increases to cover normal program growth. Where additional staff or program funds are required above the amounts normally added they are identified The Transition Plan will serve as a blueprint for change as DHSS and its constituents begin to redesign Alaska’s long term care service delivery system.

State of Alaska Department of Health and Social Services
ALASKA LONG TERM CARE AND COST STUDY
FINAL REPORT
Final Report Page 82
1.0 Complete integration of senior and disabilities services under DSDS DSDS Possible training costs Current Funding
2.0 Conduct a statewide long term care strategic planning process DHSS & Stakeholders 1 FTE of administrative cost; additional staff time Current Funding
3.0 Develop usable management reports from the MMIS DHSS 1 FTE Research Analyst; staff time, and approximately $150,00 - $450,000
Might be eligible for 75% MMIS FFP
4.0 Address the perception of Pioneer Homes in Alaska's long term care system DHSS & Pioneer Homes Administrators Staff time Current Funding
5.0 Agencies billing for multiple homes should submit an annual cost allocation plan to the state DHSS Staff time required; possible program savings Current Funding
6.0 Auditing of submitted cost reports and waiver claims DHSS Staff time required; possible program savings Current Funding
7.0 Cap administrative expenses associated with a single client's care DHSS Staff time required; possible program savings Current Funding
8.0 Conduct Edit Review in the MMIS to quantify and fix the edits DHSS Staff time or $65,000 or less for contractor Current Funding
9.0 Continue to use the Eden Model in the Pioneer Homes DHSS & Pioneer Homes Administrators Staff time and ongoing operations cost Current Funding
10.0 Develop standardized methods for reimbursing residential habilitation costs based on collected cost reports DHSSAt least 2 FTEs may be needed to
process cost reports; possible program savings
New State & Federal Funding
11.0 Discourage the use of compression in residential habilitation and day habilitation. DHSS Staff time required; possible program savings Current Funding
12.0 Ensure the timely determination of Medicaid eligibility DHSS Staff time required; possible program savings Current Funding
13.0 Implement a standardized method of collecting habilitation costs from MR/DD providers and paying them in a consistent and equitable manner DHSS Staff time required; potential program
savings Current Funding
14.0 Review treating all meal-related costs as being unallowable costs DHSS Staff time required; program savings Current Funding
15.0Account levels and financial practices within DD grants need to be monitored and state responsibility for accounts consolidated under one financial unit to assure consistency of expenditures and reallocation of funds as needed.
DHSS 1 - 2 FTE; other staff time, administrative time, and publication costs New & Current Funding
RESPONSIBILITY
I. Steps Not Requiring Legislative Changes
LONG TERM CARE TRANSITION PLAN -- PHASES & KEY STEPS
3-YEAR TRANSITION PLAN FISCAL IMPACT SOURCE OF FUNDS

State of Alaska Department of Health and Social Services
ALASKA LONG TERM CARE AND COST STUDY
FINAL REPORT
Final Report Page 83
16.0 Revise the cost and reimbursement structure of the Pioneer Homes DHSS & Pioneer Homes Administrators
Staff time required; possible program savings Current Funding
17.0The 26% discount used on the supported residential living arrangements per diem when three or more days of adult day care are used should also be applied to residential habilitation when three or more days of day habilitation are used
DHSS Staff time required; possible program savings Current Funding
18.0 Costs of operating the Pioneer Homes as identified in the PACAP should be taken into account in developing the Medicaid rate DHSS Staff time required; possible program
savings Current Funding
19.0 Use a consistent reimbursement methodology to pay for residential and day habilitation services in the MR/DD Waiver DHSS Staff time is required; could be
implemented in a cost-neutral way Current Funding
20.0 Use actual patient days instead of licensed capacity in per diem DHSS Staff time required; possible program savings Current Funding
21.0 Ensure that Medicaid pays its share of Pioneer Home costs DHSS & Medicaid Agency
Staff time required; possible program savings
Would have off-setting of state general funds if
the state drew down FFP
22.0 Evaluate and make changes to the care coordination system DHSS Staff time; needs fiscal analysis Current Funding
23.0 Develop a strategy to sustain grant-funded pilot projects/servicesDHSS, Mental Health
Trust Authority, & Other Grant Funders
Staff time Current Funding
24.0 Develop a universal screening and referral tool DHSS Possibly .5 to 1 FTE, plus training costs Current & New Funding
25.0 The recommendations raised in the APS Healthcare billing audit of March 2005 need to be systematically addressed DHSS Amount of the $2.5 million that can be
recovered needs to be estimated Potential Savings
26.0 Conduct a separate study of financing issues DHSS Staff time required; possible program savings Current Funding
27.0 Enhance the quality assurance system DHSS 4 FTEsNew Funding (Some or
all allowable for Medicaid FFP)
28.0 Create objective, independent care coordination DHSS Staff time required, but cost neutral Current Funding
29.0 Add provision for consumer-directed PCA to MR/DD Waiver DHSS & CMS Regional Office Modest fiscal impact New State & Federal
Funding30.0 Enhance quality assurance and continuous quality improvement for PCA services DHSS Staff time Current Funding
31.0 Develop access to substance abuse and mental health services DHSS Staff time; program costs premature to project
New State & Federal Funding
LONG TERM CARE TRANSITION PLAN -- PHASES & KEY STEPS
3-YEAR TRANSITION PLAN (cont.) RESPONSIBILITY FISCAL IMPACT SOURCE OF FUNDS
I. Steps Not Requiring Legislative Changes

State of Alaska Department of Health and Social Services
ALASKA LONG TERM CARE AND COST STUDY
FINAL REPORT
Final Report Page 84
1.0 Change 7 AAC 43.1055 regulating specialized medical equipment and supplies to require the reimbursement of average manufacturer's cost or that supplier must provide evidence of competitive bidding DHSS Some staff time; offset by modest 5%
savings Current Funding
2.0 Consider a provider assessment on nursing facilities DHSS Estimated $2.0 million in additional federal funds Potential Savings
3.0 Consolidate residential habilitation codes DHSS A modest amount of staff time Current Funding4.0 Enhance provider requirements DHSS Program and licensing staff time Current Funding5.0 Rewrite service descriptions of intensive active treatment / therapy DHSS A modest amount of staff time Current Funding
6.0 Review the current waivers to determine what changes need to be made DHSS & CMS Regional Office Staff time Current Funding
II. Steps That May Require Legislative Changes
LONG TERM CARE TRANSITION PLAN -- PHASES & KEY STEPS
3-YEAR TRANSITION PLAN (cont.) RESPONSIBILITY FISCAL IMPACT SOURCE OF FUNDS

State of Alaska Department of Health and Social Services
ALASKA LONG TERM CARE AND COST STUDY
FINAL REPORT
Final Report Page 85
1.0 Develop strategies to better manage the Developmental Disabilities waiting list DHSS Staff time; program costs dependant upon implementation
New State & Federal Funding
2.0 Develop a strategy for workforce recruitment and retention DHSS & Provider Agencies
Staff time; program costs dependant upon implementation
New State & Federal Funding
4.0 Develop capacity for crisis beds and/or crisis response teams in rural areas DHSS $800,000 per crisis response team developed
New State & Federal Funding
5.0 Ensure PCA services are available throughout the rural areas DHSS Approximately $9.6 million New State & Federal Funding
6.0 Expand community service options for senior citizens DHSS As much as $4.5 million for providing additional companion services
New State & Federal Funding
7.0 Monitor the development of rural PACE models in the lower 48 DHSS & CMS Regional Office Staff time Current Funding
8.0 Work with tribal organizations DHSS Potential savings of approximately $1.5 million Potential Savings
1.0 Revise the state's level of care interpretations and implementation for the MR/DD Waiver DHSS & CMS Regional Office
Cannot be determined; depends on the specific changes to the LOC
New State & Federal Funding
2.0 Revise specific service definitions and expand types of covered services. For example add a waiver for persons who have Traumatic Brain Injuries
DHSS & CMS Regional Office
Variable staff costs for review. Adding a TBI waiver could cost $2.5 million in
state and federal funds
New State & Federal Funding
3.0 Pioneer Homes should convert Level I beds and make changes necessary to accommodate more Level II and Level III residents
DHSS & Pioneer Homes Administrators
Program costs due to serving persons of higher acuity
New State & Federal Funding
II. Steps That May Require Legislative Changes
RESPONSIBILITY
I. Steps Not Requiring Legislative Changes
LONG TERM CARE TRANSITION PLAN -- PHASES & KEY STEPS
10-YEAR TRANSITION PLAN FISCAL IMPACT SOURCE OF FUNDS

State of Alaska Department of Health and Social Services
ALASKA LONG TERM CARE AND COST STUDY
FINAL REPORT
Final Report Page 86
1.0 Review long term care statewide capacity and demand to assess the need for an addition or reduction in the number of nursing facility and assisted living facility beds DHSS To be determined To be determined
2.0 Review long term care statewide capacity and demand to assess the need for an addition or reduction in the amount of community-based long term care services DHSS To be determined To be determined
3.0 Enhance infrastructure for long term care service delivery to meet the determine level of need DHSS To be determined To be determined
4.0 Conduct a strategic planning process every 3-5 years to re-establish the goals and needs of the long term care system DHSS To be determined To be determined
5.0 Conduct a reimbursement methodology feasibility study every 5 years to asses "reasonableness" and areas for improvement in the existing methodology DHSS To be determined To be determined
1.0 Monitor service definitions in all waivers to ensure that definitions are up-to-date and keep pace with CMS changes DHSS None None
2.0 Monitor level of care criteria to ensure that all individuals are receiving the appropriate level and mix of longterm care services DHSS None None
RESPONSIBILITY
II. Steps That May Require Legislative Changes
LONG TERM CARE TRANSITION PLAN -- PHASES & KEY STEPS
20-YEAR TRANSITION PLAN FISCAL IMPACT SOURCE OF FUNDS
I. Steps Not Requiring Legislative Changes

State of Alaska Department of Health and Social Services
ALASKA LONG TERM CARE AND COST STUDY
FINAL REPORT
Final Report Page 87
APPENDICES

State of Alaska Department of Health and Social Services
ALASKA LONG TERM CARE AND COST STUDY
FINAL REPORT
Final Report Page 88
APPENDIX A: SYSTEM ANALYSIS The key findings stemming from our review of Alaska’s current long term care service system that are delineated in this section address both programmatic and reimbursement issues. PCG’s system analysis covered the six programs housed within Alaska’s long term care system:
• Nursing Homes • Pioneer Homes • General Relief Assisted Living Facilities • Medicaid PCA Services • Waiver Programs • Grant Programs
The analysis of each program reveals whether or not the needs of target populations are being met, if services within the program are appropriate and efficient, if the funding for the program is sufficient / appropriate, an analysis of costs per client for the program, and any findings on variance of costs attributable to geography, economies of scale variances, or reimbursement methodologies. This section also describes the Commissions and Boards that influence long term care policy and funding. 1. Nursing Homes Nursing homes are residential facilities that provide the following services: medical services; room and board; assistance with activities of daily living; and recreation. Nursing homes in Alaska have provided and continue to provide an important level of service to Alaska’s citizens that require a high level of daily medical and personal care. Currently, there are 14 licensed nursing homes throughout the state, in: Cordova, Fairbanks (the Denali Care Center), Soldotna (Heritage Place), Ketchikan (New Horizons), Kodiak, Anchorage (Mary Conrad and Providence Extended Care Center), Norton Sound (Quyanna Care), Petersburg, Seward (Providence Wesley Care Center), Sitka, Homer (South Peninsula Hospital), Juneau (Wildflower Court), and Wrangell. In October 2005, a nursing home in Valdez opened. However, we have not included it any of the analysis for this report, since there is no data history for the home. All nursing facilities in Alaska, regardless of size, are issued the same type of license from the Division of Public Health.

State of Alaska Department of Health and Social Services
ALASKA LONG TERM CARE AND COST STUDY
FINAL REPORT
Final Report Page 89
Table A-1: Number of Licensed Nursing Home Placements in Alaska, FY 2001 – FY 2005
Nursing Home FY 2001 FY 2002 FY 2003 FY 2004 FY 2005Cordova 10 10 10 10 10Fairbanks 90 90 90 90 90Heritage Place 60 60 60 60 60Ketchikan 42 46 46 46 35Kodiak 19 19 19 19 19Mary Conrad 90 90 90 90 90Norton Sound 15 15 15 15 16Petersburg 15 15 15 15 15Providence Extended Care 224 224 224 224 224Seward 40 40 40 40 40Sitka 10 10 15 15 15South Peninsula Hospital 24 25 25 25 25Wildflower Court 44 44 44 50 50Wrangell 14 14 14 14 14Total 697 702 707 713 703
Source: Office of Rate Review, Alaska Department of Health and Social Services. Based on DHSS data, there were 720 licensed nursing home placements in FY 2005. The number of licensed nursing home placements has increased by 7.1%, or 48 placements, since FY 2001. However, the number of licensed placements decreased by 1.4%, or 10 placements from FY 2004 to FY 2005. Meanwhile, total occupancy of licensed nursing home placements across the state was approximately 81% in FY 2004 (FY 2005 data was not available).
Table A-2: Nursing Home Occupancy Rates in Alaska, FY 2001 – FY 2005
FY 2001 FY 2002 FY 2003 FY 2004 FY 2005
91.34% 83.42% 52.66%89.00% 90.58% 86.72% 87.33%86.74% 89.74% 87.93% 90.39%
41.90% 33.31% 39.11% 50.40%98.31% 98.39% 95.20%
98.12% 97.81% 97.46% 97.59%96.31% 97.22% 90.01%80.60% 81.50% 92.66%
92.42% 93.59% 91.59% 89.85%60.62% 71.35% 62.84%
98.58% 93.89% 69.37% 80.60%92.90% 97.01% 99.09% 97.46%94.32% 109.79% 96.97% 100.20%99.08% 97.98% 75.34% 57.93% 57.03%
88.53% 83.55% 80.99%
CordovaFairbanksHeritage PlaceKetchikanKodakMary ConradNorton SoundPetersburgProvidence Extended SewardSitkaSouth PeninsulaWildflower CourtWrangellTotal
Source: Office of Rate Review, Alaska Department of Health and Social Services.

State of Alaska Department of Health and Social Services
ALASKA LONG TERM CARE AND COST STUDY
FINAL REPORT
Final Report Page 90
Currently, Alaska is transitioning consumers out of nursing homes who express an interest, have services available to them, and where transition is possible. According to the DHSS Nursing Facility Transition Report16, there have been 99 transitions as of September 30, 2005, with the average cost per transition incurred by the state at the rate of $1,775 per transition (with a range of $13.65 to $5,000.00). To date, the persons transitioned have included the following:
• 3 individuals with developmental disabilities; • 55 adults with physical disabilities; and, • 41 older Alaskans.
DHSS estimates that approximately $14,564,055 would have been incurred to keep these 99 consumers at their respective nursing homes. In contrast, the total annual waiver and PCA costs for these individuals amounts to approximately $5,718,937; a subsequent savings of $8,845,118. This is an example of where the state has continued a cost effective program after federal grant funds ended. While Alaska has transitioned individuals out of the state’s nursing facilities, nursing homes still continue to provide needed services to individuals requiring the respective level of care.
Table A-3: Trend of Licensed Nursing Home Beds in Alaska, 1967-2005
0100200300400500600700800
1967
1970
1973
1976
1979
1982
1985
1988
1991
1994
1997
2000
2003
Source: Health Planning and Systems Development, Alaska Department of Health
and Social Services. Programmatic Findings 1. The Certificate of Need Program has been effective for Alaska’s nursing homes. Based on interviews with state staff and key stakeholders, we concluded that the Alaska Certificate of Need Program (CON) is managed effectively and efficiently, and is a process that is beneficial to the overall system of services. For example, when a moratorium on the addition of new nursing facility placements was utilized in 1995 for the purposes of producing an incentive for a balanced mix of nursing facility placements and assisted living placements, the desired goal was achieved.
16 “Nursing Facility Transition Report,” Department of Health and Social Services, State of Alaska, September 30, 2005.

State of Alaska Department of Health and Social Services
ALASKA LONG TERM CARE AND COST STUDY
FINAL REPORT
Final Report Page 91
The process utilized in Alaska for CON provides assistance to facilities to enable them to thoroughly think through the decision-process of whether or not to increase their number of placements prior to an actual CON application. As a result, the process is seen as a valuable tool. The state once had a licensing option for nursing homes to increase placements by 10% per year without a Certificate of Need. This is no longer operative; rather, there is a provision that a nursing home may build new placements with a cost of up to $1 million without a CON. While this provision may aid nursing homes to build placements, there is also a low occupancy penalty, which reduces the capital portion of the per diem rate for facilities that operate at less than 85% of occupancy; thus it does not provide an incentive to build unneeded placements. There are also “swing placements” in the state—placements that can be used as hospital or nursing home placements, which are used to provide additional bed capacity. 2. Since there is limited availability of community services in Alaska, many individuals are placed
in nursing facilities that do not desire nursing home level of care. One of the key findings that arose from our interviews with key staff and stakeholders in Alaska was that while nursing facilities provide an important level of care for individuals with high level of care needs, many individuals who require a nursing home level of care but desire to be served in their communities are being admitted to these facilities due to a lack of community service options. A specific example cited by stakeholders was the elimination of day-time respite care services for seniors in 2004. Prior to the elimination of this service for seniors, family members were able to work during the day while their loved ones were able to remain in the home—a possibility because of the provision of respite care. However, no similar services were offered in its place. As a result, family members were forced to stay home and not work, or seniors were forced into nursing homes even though they did not desire a nursing home level of care, due to the fact that they could not function independently during the day while their family members were at work. This apparent gap in community services for seniors has not allowed seniors to age in place in their own homes. Cost Findings 1. PCG has found that the methodology used to reimburse Nursing Homes in Alaska is appropriate
for the state’s circumstances. Some state staff members related that the rates at smaller nursing homes might seem high, especially those homes affiliated with hospitals. Alaska has the highest rates for nursing home care in the country. 17 To follow up on these concerns, PCG reviewed page A-8-1 of the Alaska Medicare cost reports, which showed how the “home office” costs of the hospitals were allocated between the hospital and its associated nursing home: home office costs (i.e. hospital administration) were included in the determination of the nursing home’s prospective rate. PCG’s review of this rate setting methodology resulted in a finding that there is no reason to reduce nursing home reimbursement to smaller rural homes, as the rates do not appear unreasonable.
17MetLife Mature Market Institute, The MetLife Market Survey of Nursing Home & Home Care Costs September 2005

State of Alaska Department of Health and Social Services
ALASKA LONG TERM CARE AND COST STUDY
FINAL REPORT
Final Report Page 92
Table A-4 below shows the per diem received by each Alaskan nursing home in recent years. Five nursing homes had a Medicaid reimbursement per diem higher that $500 in FY 2005; they are bolded in the table. Also shown are the bed sizes, occupancy rates, and Medicaid reimbursement for the fourteen Alaskan nursing homes shown. This table reveals that the five nursing homes with the highest per diems are smaller, having about 110 placements or approximately 1/7th the number of placements in the state. Two of five have a very low occupancy rate. The Kaiser Foundation collects national statistics comparing state Medicaid programs.18 Their data shows that in 2003, the national occupancy rate for nursing homes was 85.5%. Alaska had an occupancy rate of 80.1%, the 42nd lowest rate in the country. Kaiser data also shows that the national percentage of persons over the age of 65 in a nursing home was 3.8%, with Alaska’s percentage at 1.4%, the 51st lowest rate in the country. PCG did not study why the occupancy level of particular homes is high or low, but we were able to ascertain that compared to other states, Alaska has a low occupancy rate in its nursing homes and a very small percentage of persons over the age of 65 in its homes
Table A-4: Selected Data on Nursing Homes
XIX Per Diem XIX Per Diem XIX Per Diem XIX Per Diem # beds XIX $ OccupancyFY 2003 FY 2004 FY 2005 FY 2006 FY 2005 FY 2004 FY 2004
Cordova 624.90$ 642.46$ 741.01$ 760.09$ 10 1,198,994$ 52.66%Fairbanks 365.02$ 382.17$ 393.38$ 404.27$ 90 8,431,462$ 87.33%Soldotna 212.61$ 218.43$ 224.43$ 238.98$ 60 3,231,666$ 90.39%Ketchikan 539.08$ 552.62$ 561.13$ 623.49$ 35 1,857,659$ 39.11%Kodiak 329.07$ 319.00$ 328.69$ 338.10$ 19 1,763,653$ 95.20%Anchorage 255.53$ 281.79$ 290.24$ 298.43$ 90 7,286,856$ 97.59%Nome 614.35$ 631.33$ 682.48$ 16 2,617,479$ 90.01%Petersburg 304.26$ 330.59$ 339.98$ 349.65$ 15 1,281,983$ 92.66%Anchorage 350.16$ 436.70$ 448.67$ 460.97$ 224 16,515,310$ 89.85%Seward 350.16$ 436.70$ 448.67$ 460.97$ 57 5,214,418$ 62.84%Sitka 452.71$ 568.59$ 584.81$ 601.51$ 15 2,155,721$ 80.60%Homer 465.51$ 495.55$ 509.57$ 523.99$ 25 3,543,816$ 97.46%Juneau 445.48$ 422.51$ 433.19$ 443.90$ 50 5,521,559$ 100.20%Wrangell 362.63$ 546.74$ 480.68$ 494.49$ 14 1,361,829$ 57.93%Total 720 61,982,405$ Source: Office of Rate Review, Alaska Department of Health and Social Services. A company called MEDSTAT, under contract with CMS, collects and makes available multi-year history on CMS 64 expenditures. A review of this database shows that Alaska nursing home per capita costs are average compared with other states. In 2004, total Medicaid dollars spent on nursing homes in Alaska divided by the population of the state, produces an average cost of $163.50 per person in the state, versus a national cost of $156.10 per person in the state. This calculation ranked Alaska at 25th among the states. Four of the nursing homes are publicly-owned, while the other ten are run by non-profit organizations; however, all are reimbursed using the same methodology. Nursing home reimbursement is regulated under the authority of Alaska Statutes, at AS 47.07.070: this statute authorizes payments for health facilities and sets almost no specifics as to how nursing homes shall be reimbursed, except for AS
18 The Kaiser Family Foundation, www.statehealthfacts.org.

State of Alaska Department of Health and Social Services
ALASKA LONG TERM CARE AND COST STUDY
FINAL REPORT
Final Report Page 93
47.07.070 (b), which states that rates for payments will occur within appropriation levels and will be based on reasonable costs related to patient care as well as audit and inspections reports. Nursing home rate setting is implemented in regulation at 7 AAC 43.670-7 AAC 43.709. Four of the fourteen nursing homes are stand-alone homes and submit a Medicare 2540 cost report. The other 10 nursing homes are co-located within hospitals and fill out a Medicare 2552 cost report, which has “step-down” procedures that allocate the amount of cost that is associated with the hospital and its nursing home. 7 AAC 43.685 establishes specific methodologies. In particular, it states that a “re-basing” will be done no less than every four years; although the department may perform a re-basing sooner than every four years. 7 AAC 43.686 includes additional clarifications and limitations on costs reported in the Medicare cost reporting process. The nursing home rate is a prospective rate, with four components: 1) a capital component covering routine expenses; 2) a non-capital component covering routine expenses; 3) a capital component for ancillary services; and 4) a non-capital component for ancillary services. Costs from the base year of the cost reports are divided into these four pools and then reviewed for allowability by state staff. Other than the Medicare-based use of lesser of costs or charges tests and an occupancy factor on capital costs, there are no percentile screens or limits on allowable costs. Routine costs are divided by total facility days and ancillary costs are divided by allowable paid Medicaid days, with ancillary costs in the calculations are Medicaid-specific. Cost control is exercised by: a) desk audits and discussions with providers about allowable costs the use of cost to charge tests; b) an occupancy limit on capital expenses; and c) infrequent rebasing. For example, two nursing homes, Ketchikan General Hospital and Wrangell Medical Center, have an occupancy penalty in the base year that carries into all years before the next rebasing. Cost control is also exercised by the state’s nursing facility transition program (NFT), which is an accomplishment given that the program had only one staff person and the state’s few nursing homes are geographically spread over a big state. 2. Pioneer Homes At present, the Division of Alaska Pioneer Homes operates six Pioneer Homes, discussed in administrative regulations at 7 AAC 74.010 - 7 AAC 74.990. The first Pioneer Home was built in 1913 in Sitka as a residential facility for indigent prospectors and others, who spent their working years in Alaska and became dependent in retirement. The Sitka Home was rebuilt in 1957. Five additional homes were built in other areas of the state from the late sixties through 1988, when the last home was built in Juneau. Over time, the Homes redirected their focus from independent living to an environment appropriate for individuals with more severe functional, physical and emotional needs. In the mid-nineties, the Homes opened special care units with a focus on Alzheimer's disease and other forms of dementia. In 1994, the homes fully converted to an assisted living service definition and ceased being licensed as nursing homes. The Pioneer Homes are now licensed as assisted living facilities and provide an array of services to elderly Alaskans who need assistance with activities of daily living and who also may require nursing

State of Alaska Department of Health and Social Services
ALASKA LONG TERM CARE AND COST STUDY
FINAL REPORT
Final Report Page 94
care or other physical and/or emotional support services. The Pioneer Homes currently serve people in Anchorage, Fairbanks, Juneau, Ketchikan, Palmer and Sitka at an average length of stay of three to four years. To be eligible to live in a Pioneer Home, an individual must be 65 years old and have lived in Alaska for one year prior to their date of application to enter a Home. Services are funded by resident payments, a state payment assistance program, and, for those who are eligible, by Medicaid and Medicare. There is a process is in place to evaluate the residents for eligibility under the OA waiver and to enroll them as appropriate, and efforts are underway to determine if other services provided can be billed to Medicaid or Medicare. At present, there are three levels of care provided in the Homes. A five level system was used previously, but the top three levels were merged into one to consolidate the levels of care. Hospice care is funded separately. The Pioneer Homes are overseen by the Pioneer Homes Advisory Board, while the administrators of the Pioneer Homes are screened and recommended by the Division director and appointed by the Governor. The Pioneer Home in Palmer is now being renovated to become the state’s first Veterans Home, with a grand opening scheduled for the spring of 2006. The facility will house 75% veterans and 25% non-veterans. None of the current residents in the Palmer Pioneer Home will be asked to relocate, and none of the veterans in the other Homes will be forced to move to the Palmer Veterans Home. Programmatic Findings 1. The Pioneer Homes adhere to a ‘no eject, no reject policy,’ unlike private assisted living facilities. If a person presents themselves to a Pioneer Home and they meet the admission requirements, including level of care assessment, then the person can be admitted. The homes do not refuse people nor discharge them from the home because of increasing service needs. This is an important distinction between the Pioneer Homes and other privately operated assisted living settings, where people can be rejected or ejected based on service needs or other issues. 2. There is a perception among private providers that Pioneer Homes receive more funding and
attention from the state system than other assisted living facilities. Based on interviews with state staff as well as other stakeholders involved in the Alaska long term care system, it was often voiced that Pioneer Homes received preferential treatment with regard to the receipt of state funding as well as oversight. There was no objective evidence found to support this conclusion. 3. The appointment process of Pioneer Home administrators varies significantly from that of private
assisted living facilities. Pioneer Home administrators are appointed by the Governor. This practice means that these key positions can change as administrations change without regard to the administrator’s performance and qualifications of the current administrators. Challenges could include continuity of administrative leadership and delivery of care.
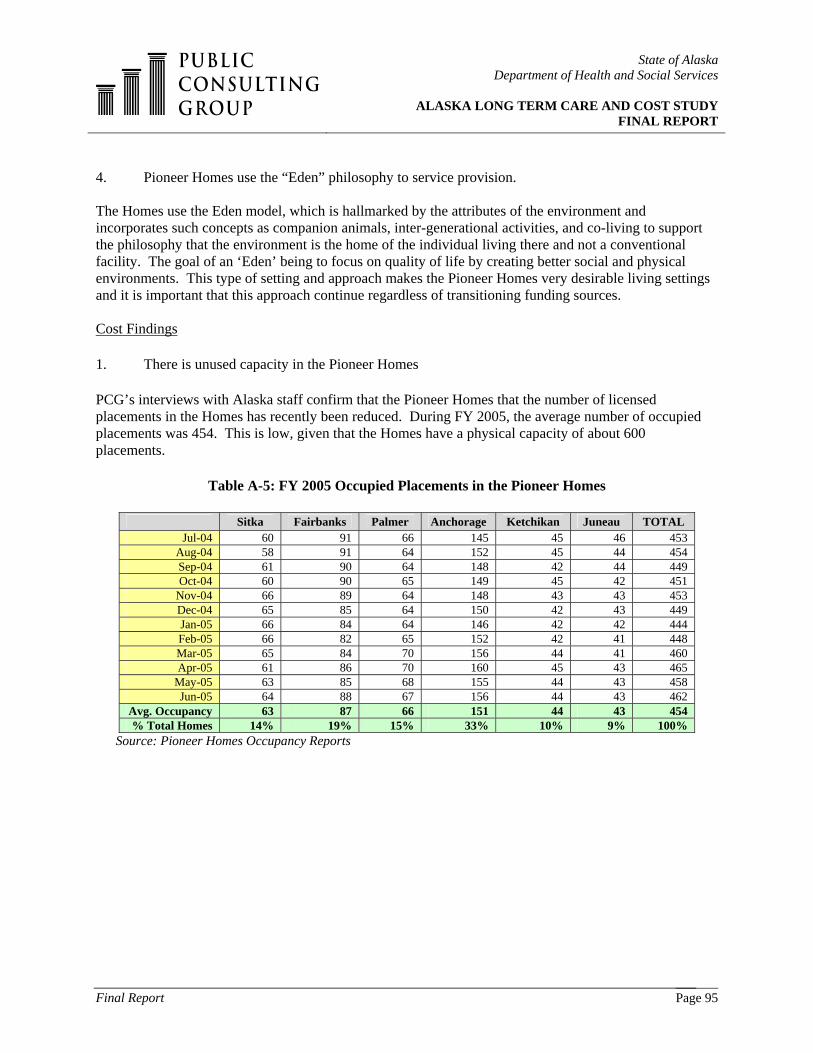
State of Alaska Department of Health and Social Services
ALASKA LONG TERM CARE AND COST STUDY
FINAL REPORT
Final Report Page 95
4. Pioneer Homes use the “Eden” philosophy to service provision. The Homes use the Eden model, which is hallmarked by the attributes of the environment and incorporates such concepts as companion animals, inter-generational activities, and co-living to support the philosophy that the environment is the home of the individual living there and not a conventional facility. The goal of an ‘Eden’ being to focus on quality of life by creating better social and physical environments. This type of setting and approach makes the Pioneer Homes very desirable living settings and it is important that this approach continue regardless of transitioning funding sources. Cost Findings
1. There is unused capacity in the Pioneer Homes
PCG’s interviews with Alaska staff confirm that the Pioneer Homes that the number of licensed placements in the Homes has recently been reduced. During FY 2005, the average number of occupied placements was 454. This is low, given that the Homes have a physical capacity of about 600 placements.
Table A-5: FY 2005 Occupied Placements in the Pioneer Homes
Sitka Fairbanks Palmer Anchorage Ketchikan Juneau TOTAL Jul-04 60 91 66 145 45 46 453
Aug-04 58 91 64 152 45 44 454 Sep-04 61 90 64 148 42 44 449 Oct-04 60 90 65 149 45 42 451
Nov-04 66 89 64 148 43 43 453 Dec-04 65 85 64 150 42 43 449 Jan-05 66 84 64 146 42 42 444 Feb-05 66 82 65 152 42 41 448 Mar-05 65 84 70 156 44 41 460 Apr-05 61 86 70 160 45 43 465
May-05 63 85 68 155 44 43 458 Jun-05 64 88 67 156 44 43 462
Avg. Occupancy 63 87 66 151 44 43 454 % Total Homes 14% 19% 15% 33% 10% 9% 100%
Source: Pioneer Homes Occupancy Reports

State of Alaska Department of Health and Social Services
ALASKA LONG TERM CARE AND COST STUDY
FINAL REPORT
Final Report Page 96
0100
200300400500
600700
Jul-9
6
Jul-9
7
Jul-9
8
Jul-9
9
Jul-0
0
Jul-0
1
Jul-0
2
Jul-0
3
Jul-0
4
Num
ber
of B
eds
Total BedsOccupied Beds
Table A-6: Total Licensed and Occupied Placements of Pioneer Homes, FY 1997 – FY 2005
Source: Pioneer Homes Occupancy Reports
The Homes have also lowered their licensed bed capacity. As of October 2005, Sitka had 75 licensed placements and 81% occupancy, Fairbanks had 96 placements and 91% occupancy, Palmer had 79 placements and 87% occupancy, Anchorage had 165 placements and 95% occupancy, Ketchikan had 48 placements and 92% occupancy, and Juneau had 48 placements and 87% occupancy. Whether the placements are licensed or not, the low occupancy can be attributed to what are called Level I placements. Level I services include: the provision of housing and meals; emergency assistance; and opportunities for recreation. This level of service does not include staff assistance with activities of daily living, medication administration, or health-related services; although the Pioneer Home’s pharmacy may supply prescribed medications. Meanwhile, Level II services include: the provision of housing and meals; emergency assistance; staff assistance, including assistance with activities of daily living, medication administration, recreation, and health-related services; assistance provided by a staff member, including supervision, reminders, and hands-on assistance with the resident performing the majority of the effort; and no service provision during the night shift. Lastly, Level III services include: the provision of housing and meals; emergency assistance; staff assistance, including assistance with activities of daily living, medication administration, recreation, and health-related services; hands-on assistance, with the staff member performing the majority of the effort; assistance to the resident throughout a 24-hour day, including the provision of care in a transitional setting. The Homes can also provide Day Services to non-residents for up to 8 hours a day between 6:00 a.m. and 6:00 p.m., including meals and other Level III services. Respite services, including room and board, is also available on a limited basis for up to 14 consecutive days, 24 hours a day.19 Table A-7 below, provided from the DHSS Budget for FY 2006, shows the occupancy levels of the Pioneer Homes by each level of care. As presented in the table, the demand for level I placements steadily dropped throughout the 1990s; this finding was reinforced in the state’s 1999 Legislative Report.
19 Alaska administrative regulations, 7 AAC 74.010. Quality and Levels of Service.

State of Alaska Department of Health and Social Services
ALASKA LONG TERM CARE AND COST STUDY
FINAL REPORT
Final Report Page 97
Table A-7: Occupancy Level by Level of Care
Source: Pioneer Homes Occupancy Reports One probable cause for this drop in demand was the state’s creation of more home and community based services (HCBS) in the mid 1990s. Another possible cause of a demand drop may have been cost share requirements for residents beginning in 1996: as an example, in 2001, Pioneer Home residents paid approximately $13.5 million in payments, which equals about one-third of the Homes’ total revenue. Currently, the Pioneer Homes have fewer available placements at the higher levels of care, but that is where the demand for services lies, according to staff interviewed. The result is a demand for services in the Homes, with the state is using approximately 75% of the physical capacity of the Homes to provide services to 450 placements out of 600. 2. Alaska needs to maximize their Medicaid Reimbursement for the Pioneer Homes. The Homes are currently financed by a combination of state general fund, federal Medicaid reimbursement, and resident fees. Since the Homes are not licensed as nursing facilities or another type of Medicare provider, they cannot provide post hospitalization or Part B benefits to Medicare beneficiaries. The Homes have not historically received Medicaid reimbursement. The Department’s budget for FY 2006 contains the following description of the Homes:
“… in FY 2005, due to a change in federal law and department policy, the Pioneer Homes became eligible to be licensed Medicaid providers and Pioneer Home residents became eligible to apply for Medicaid benefits. Currently, all six Pioneer Homes and the centralized Pioneer Home Pharmacy are licensed Medicaid providers. This significant change allows the division access to federal funding; thereby reducing the general funds required to operate the homes and subsidize residents who are not able to pay the full monthly charges. Although Alaska statute permits Medicaid to be made mandatory by regulation, implementation of Medicaid in the Pioneer Homes is presently a voluntary application process. As of November 2004, 61 percent of Pioneer Home residents were subsidized by the state through the division’s Payment Assistance Program.”
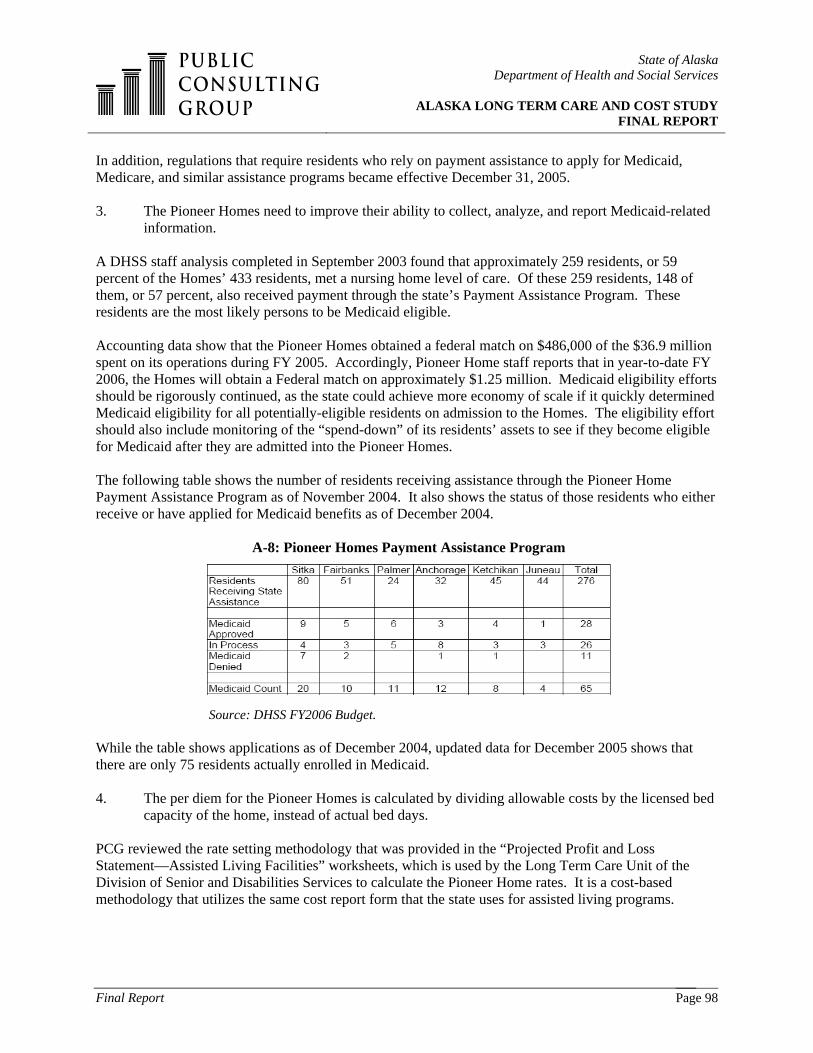
State of Alaska Department of Health and Social Services
ALASKA LONG TERM CARE AND COST STUDY
FINAL REPORT
Final Report Page 98
In addition, regulations that require residents who rely on payment assistance to apply for Medicaid, Medicare, and similar assistance programs became effective December 31, 2005. 3. The Pioneer Homes need to improve their ability to collect, analyze, and report Medicaid-related
information. A DHSS staff analysis completed in September 2003 found that approximately 259 residents, or 59 percent of the Homes’ 433 residents, met a nursing home level of care. Of these 259 residents, 148 of them, or 57 percent, also received payment through the state’s Payment Assistance Program. These residents are the most likely persons to be Medicaid eligible. Accounting data show that the Pioneer Homes obtained a federal match on $486,000 of the $36.9 million spent on its operations during FY 2005. Accordingly, Pioneer Home staff reports that in year-to-date FY 2006, the Homes will obtain a Federal match on approximately $1.25 million. Medicaid eligibility efforts should be rigorously continued, as the state could achieve more economy of scale if it quickly determined Medicaid eligibility for all potentially-eligible residents on admission to the Homes. The eligibility effort should also include monitoring of the “spend-down” of its residents’ assets to see if they become eligible for Medicaid after they are admitted into the Pioneer Homes. The following table shows the number of residents receiving assistance through the Pioneer Home Payment Assistance Program as of November 2004. It also shows the status of those residents who either receive or have applied for Medicaid benefits as of December 2004.
A-8: Pioneer Homes Payment Assistance Program
Source: DHSS FY2006 Budget. While the table shows applications as of December 2004, updated data for December 2005 shows that there are only 75 residents actually enrolled in Medicaid. 4. The per diem for the Pioneer Homes is calculated by dividing allowable costs by the licensed bed
capacity of the home, instead of actual bed days. PCG reviewed the rate setting methodology that was provided in the “Projected Profit and Loss Statement—Assisted Living Facilities” worksheets, which is used by the Long Term Care Unit of the Division of Senior and Disabilities Services to calculate the Pioneer Home rates. It is a cost-based methodology that utilizes the same cost report form that the state uses for assisted living programs.

State of Alaska Department of Health and Social Services
ALASKA LONG TERM CARE AND COST STUDY
FINAL REPORT
Final Report Page 99
As of October 31, 2005, the average Medicaid rate for the six homes was $160.52. The highest was the Juneau Pioneer Home at $176.82 and the lowest was Fairbanks Pioneer Home at $143.13. PCG’s review did not compare rates paid to privately-owned assistant living homes with rates paid to the Pioneer Homes. PCG’s review of the rate setting methodology raised three points that merit more examination:
i) The reimbursement philosophy assumes that one method of reimbursement should be applied to all assisted living homes, regardless of their size or whether they are owned by private parties, non-profit organizations, or public entities. Federal practice permits states to set different reimbursement procedures for public, non-profit, and private providers—Alaska might consider this. For example, Georgia, Idaho, Mississippi, Maryland, South Dakota, Virginia, and West Virginia all reimburse their state-owned nursing facilities differently than their private or non-profit facilities, and Louisiana reimburses its public Intermediate Care Facilities (ICFs) differently from its private ICFs.
ii) The billing of separate pharmacy costs merits further examination. Medical and
pharmacy costs are excluded from the rate setting worksheets at present, with the notation that they are billed separately. A fiscal review should be undertaken to look at the options of continuing separate billing versus including the pharmacy costs in the rate. Medication management costs are often included in assisted living reimbursement in other states; this point should be discussed with CMS regional office staff to see if CMS has a policy preference about this inclusion.
iii) The manner in which room and board is excluded from waiver rates also needs review.
The provision of three meals a day is currently non-allowable and should be so for the Pioneer Homes; however, meal-related costs, such as the dietician ensuring medical directions regarding diet, are correctly followed and helping residents eat are allowable expenses. A good review of daily staff activities, budget practices, and current use of the square footage allocated to dietary might yield some savings for the Homes.
5. Pioneer Homes’ Medicaid rates exclude the allocated costs of the Department's Public Assistance Cost Allocation Plan (PACAP). PCG reviewed the Statewide Cost Allocation Plan (SWCAP) that is used by DHSS. Costs associated with the Pioneer Homes in the Plan are not allocated to any Federal cost reports in the current CAP methodology, but are part of the state’s cost of operating the Homes. For example, the FY03 SWCAP contains $1.6 million in FY01 costs for the Pioneer Homes. Because of the move of the Pioneer Homes from the Department of Administration (DOA) to the Department of Health and Social Services (DHSS), the SWCAP no longer isolates the Pioneer Homes as a cost center. Instead, the Pioneer Homes receive an allocation through the Department's Public Assistance Cost Allocation Plan (PACAP). The PACAP identifies Department costs associated with Federal programs. These PACAP costs could be allocated within each Home, based on the number of Medicaid residents in the Homes. The methodology would determine the percentage of Medicaid residents in each Home, take the amount of PACAP cost allocated to that Home, and put that percentage of the PACAP cost into the cost pool used to make the Medicaid rate for the Home.

State of Alaska Department of Health and Social Services
ALASKA LONG TERM CARE AND COST STUDY
FINAL REPORT
Final Report Page 100
6. Federal Supplemental Security Income in Pioneer Homes needs to be reviewed. Through interviews with state staff, PCG learned that there are issues surrounding the Homes’ receipt of Federal benefits. The policy that is utilized at present is that residents of the Homes are not eligible for the Federal Supplemental Security Income (SSI) program, as they are ‘inmates’ of public institutions. Usually the word ‘inmates’ refers to a court-ordered situation, which is grounds for reopening the issue with the Social Security Administration to determine the foundation for this policy. While there is a general rule in section 1611(e)(1)(A) of the Social Security Act that persons are ineligible for SSI for a month if they are inmates of public institutions, there are exceptions in subparagraphs (B) through (E) and (G) of the Act. For example, Subparagraph (B) provides an exception for medical treatment facilities, with a reduced SSI benefit, and subparagraph (G) provides for greater SSI benefits than (B), where a stay in a medical treatment facility is not expected to exceed 3 months. There are other exceptions as well, including an exception for publicly-operated community residences that serve no more than 16 residents. 3. General Relief Assisted Living Homes In Alaska, people receiving financial support for assisted living care can be utilizing Medicaid, General Relief, Adult Public Assistance, Social Security, or SSI. Specifically, General Relief assistance provides basic care for Alaskans who do not have the resources to meet an immediate need and who are ineligible for other assistance programs, such as waivers. General Relief Assisted Living is a temporary solution until the person needing services returns home or becomes eligible for a state service and is transitioned to an another program, such as a Medicaid waiver. The Alaska state website indicates that “Alaska's General Relief Assistance (GRA) program pre-dates statehood and was created during a period when federally-funded assistance programs were not as extensive as they are today.” Programmatic Findings 1. General Relief Assisted Living Homes services should continue to be provided to Alaska’s
consumers. General Relief Assisted Living Homes is a program that meets a critical need of the Alaska long term care delivery system. This service provides adult protective services to individuals who are victims of abuse and neglect, which is a critical feature for any LTC system. General Relief Assisted Living Homes is a safety net service that provides basic resources to individuals who have immediate needs and who are ineligible for other assistance programs, such as home and community-based waivers. If individuals remain on this funding source for an extended period of time, there could be program implications if needs for habilitation or other support services are not addressed once the person’s situation is stabilized. However, there was no indication of this activity from our review of the General Relief Assisted Living Homes program or from our interviews with stakeholders.

State of Alaska Department of Health and Social Services
ALASKA LONG TERM CARE AND COST STUDY
FINAL REPORT
Final Report Page 101
Cost Findings
1. The State should continue to check the Medicaid eligibility of persons using the General Relief Assisted Living program.
Alaska’s General Relief Assisted Living program is small, with about $3 million in FY 05 expenditures, an increase of about 38 percent from the prior fiscal year. The table below depicts monthly expenditures, client count, cost per client, and the percentage change in expenditures from the prior year. PCG believes that a client’s Medicaid eligibility will reduce the burden for the state to fully fund the expenditures and will allow federal funds to help with the costs associated with client treatment.
Table A-9: The General Relief Assisted Living Program
FY 2002 FY 2003 FY 2004 FY 2005 Monthly Expenditures $2,761,857 $1,955,794 $2,153,206 $2,981,157 Avg. Client Count 218 229 210 246 Cost per Client per month $1,072 $711 $856 $1,014 Expenditure % Change 0% -29% 10% 38%
Source: Division of Senior and Disabilities Services 4. Medicaid Personal Care Assistant Services Personal care is a service offered under Alaska’s Medicaid plan, which means that all persons on Medicaid are eligible to receive these services. The Personal Care Program provides home care services statewide to functionally disabled and handicapped citizens of all ages, as well as to the frail elderly, to enable these individuals to live in their own home or community as a viable alternative to large congregate living facilities that may result in people moving away from their home communities and cultural base. To quality for this type of service, the individual must be in need of assistance with activities of daily living, such as bathing, dressing, and grooming, and have needs that require a semi-skilled or skilled level of care. These services are all provided by Personal Care Assistants (PCAs) and are typically provided in the home of the care recipient. Alaska’s Medicaid plan permits two types of personal care services:
i) Self-directed: An individual hires and trains a PCA of their choice, then authorizes the assistant’s timesheets that are submitted to an Agency, which then bills the state for the care. The recipient of PCA services is considered the employer and thus supervises the assistant’s work. Approximately 35 agencies in Alaska currently participate in this version of the program.
ii) Agency-based: An Agency hires and supervises the care of a licensed PCA who has completed the required 40 hours of training. Approximately 45 agencies in Alaska currently participate in this version of the program; however, few are active.
Agency-based services have existed for over 10 years, while self-directed services have operated since 2001. According to a DHSS Fact Sheet released on November 29, 2005, PCA services grew from serving

State of Alaska Department of Health and Social Services
ALASKA LONG TERM CARE AND COST STUDY
FINAL REPORT
Final Report Page 102
1,300 consumers and costing $7.6 million in 2000 to serving 3,800 consumers and costing $79 million in fiscal year 200520. The following table provides some additional detail regarding PCA growth.
Table A-10: Personal Care Assistant Program Changes, 2000-2006
Clients Served Expenditures
2000* 1,300 $7.6 million FY 2005 3,800 $79 million
*Year 2000 data contains only agency-directed PCA statistics; FY 2005 and FY 2006 include agency-directed and consumer-directed PCA services. Source: State of Alaska, Department of Health and Social Services
Due to the geography of Alaska, another important area of emphasis is the development of services in the state’s rural areas. As part of this effort, the Alaska Mental Health Trust Authority has provided grant dollars to develop rural long term care services that enhance the ability of elders to remain in their own home and community when care and assistance is needed. Programmatic Findings 1. Determination of need for PCA services has not used a consistent assessment process. There is an issue of consistency concerning the assessments completed that determine not only the need for PCA services, but also the scope and duration of the services. This issue surfaced in discussions and interviews with both state agency staff and stakeholders. The new regulations, which are newly promulgated and will become effective this Spring, will address this issue and should enhance the confidence level that the assessments are not being used appropriately. One issue that remains regarding the assessment process is the timeliness of the assessment analysis and the resulting service authorization—the state has committed to an efficient process. 2. PCA plans of care have not been clearly based on assessed need. The quality and adequacy of care plans were also raised in many of the discussions with stakeholders and state staff as an overriding issue with the PCA service delivery process. This is to be expected - if the assessment process is weak, the plan of care will not be much stronger. The new regulations require coordination of PCA services with home and community-based waiver plans of care, but they do not address the issue of an adequate care coordination process. 3. Determining the use of paid and unpaid staff to perform PCA services is not part of the
assessment process. The assessment process should address not only the need for paid PCA services, but also the availability of non-paid, natural support systems that the individual has access to for the purposes of meeting their needs. Much concern was expressed that the only options addressed were paid care and that paid care was unnecessarily supplanting the provision of natural supports.
20 “Personal Care Assistant Program regulations adopted”, Fact Sheet, Department of Social and Health Services Press Release, State of Alaska, November 29, 2005.

State of Alaska Department of Health and Social Services
ALASKA LONG TERM CARE AND COST STUDY
FINAL REPORT
Final Report Page 103
4. Oversight and monitoring of the PCA program has not yet been fully addressed. The oversight and monitoring of the delivery of PCA services is another area in which state staff as well as numerous stakeholders raised quality concerns. In the new regulations, the state has addressed at least one area by defining provider qualifications and training. The remaining issues include how ongoing auditing/monitoring will be accomplished and how to strike a balance between the responsibility of the individual recipient, the provider of the PCA service(s), and the state. 5. There are key issues regarding staff availability and training that need to be addressed. The provision of PCA services is a key component in providing a continuum of long term care services that supports seniors, people with physical disabilities, and people with developmental disabilities to remain in their own homes and communities. In order to provide these services, there must be an available and adequately-trained work force. Many of the people interviewed for this project expressed concerns about the quantity as well as the quality of the work force. This was an issue brought to our attention as a concern that had an impact on people residing in urban, rural and frontier areas of Alaska. Training requirements are addressed in the new regulations, but concerns remain about how the training will be accessed and paid for. Recruitment and retention of PCA staff are overriding issues yet to be addressed. 6. Outreach to recruit PCA providers in the rural areas of the state has become more difficult. Many of the issues outlined above are further exacerbated in the rural and frontier areas of the state, where the pool of available and/or interested PCA providers may be limited, access and payment for required training is an issue, and monitoring and oversight is more complex. In addition, several of the newly-adopted requirements to become a PCA provider have increased the difficulty of recruiting PCA providers in rural areas, especially in the villages. Several of the criteria that increase this difficulty include the requirements for minimum education, experience, and Medicaid certification. The new regulations also likely increased the need for outreach to the rural areas by requiring that consumers have a power of attorney instead of a personal representative. The appointment of a power of attorney requires the individual to go through a much more formal legal process of identifying and arranging a representative, whereas a personal representative is a much more informal and easy process. The state will need to provide appropriate outreach and assistance to consumers and their selected power of attorney to ensure that all necessary legal steps are taken to establish this relationship. 7. There is a concern amongst stakeholders that the new process for obtaining PCA services will
result in long delays in service authorization. During PCG’s interviews with stakeholders, it was indicated that there is concern about the new regulations and their process, which involves several new steps to obtaining PCA services and will cause a substantial delay in obtaining services. Stakeholders stated that the current process for obtaining PCA services (prior to the adoption to of the new regulations) takes approximately 3-4 days for a consumer to receive care; the concern is that the new process will involve weeks of waiting to receive services. The new process, based on our understanding, contains the steps indicated in the following chart.

State of Alaska Department of Health and Social Services
ALASKA LONG TERM CARE AND COST STUDY
FINAL REPORT
Final Report Page 104
Cost Findings 1. The rates for the hourly reimbursement of PCA services is set at $21 per hour and $200 for the
procedure code that bills for an entire day; these rates were established in regulation on August 7, 1996 and have not been changed since.
The $21 per hour rate was established based on provider comments, which stated that the rate was sufficient to cover an individual provider’s hourly service provision. However, at the time the rate was established, there was not a consumer-directed PCA program; therefore, one problem with this rate is that the agency-directed personal care model takes RN assessments into account while the consumer-directed personal care model does not. Under the new regulations, a contractor will do the assessment for both the consumer-directed and the agency-directed personal care programs. Regulations at 7 AAC 43.790 limit the hourly reimbursement to eight hours a day or 35 hours a week, unless the Department approves a service plan that requires more. Data for expenditures in the PCA programs is shown below; the start-up of the consumer-directed personal care program in 2002 can

State of Alaska Department of Health and Social Services
ALASKA LONG TERM CARE AND COST STUDY
FINAL REPORT
Final Report Page 105
account for sudden changes in expenditures. State staff also report that a cap on waiver respite care hours to 10 hours week, enacted in May 2004, may have increased use of personal care services, as PCA services have no limit on hours per week.
Table A-11: Expenditures in Agency-Based PCA Services, FY 1997 – FY 2005 Procedure Code 0761P, PC Services Per Hour FY 1997 FY 1998 FY 1999 FY 2000 FY 2001 FY 2002 FY 2003 FY 2004 FY 2005Unduplicated yearly recipients 897 1,051 1,068 1,220 1,237 1,272 1,439 1,991 1,596 Average monthly users 420 525 536 682 673 611 538 631 500 Total amount paid per year $ 3,598,710 $ 4,205,076 $ 4,741,344 $ 5,532,109 $ 5,807,042 $ 5,283,358 $ 6,153,445 $ 10,070,440 $ 6,542,777 Claims paid 8,900 10,540 15,208 25,269 24,637 13,914 18,101 28,052 86,771 Cost per recipient $ 4,012 $ 4,001 $ 4,439 $ 4,535 $ 4,694 $ 4,154 $ 4,276 $ 5,058 $ 4,099 Procedure Code 0762P, PC Services Per Day FY 1997 FY 1998 FY 1999 FY 2000 FY 2001 FY 2002 FY 2003 FY 2004 FY 2005Unduplicated yearly recipients 1 1 2 6 24 7 7 20 37Average monthly users 1.0 1.0 1.8 2.2 4.0 2.3 1.6 2.8 8.1Total amount paid per year $ 29,700 $ 48,450 $ 25,500 $ 31,819 $ 51,536 $ 32,475 $ 34,467 $ 36,257 $ 151,385 Claims paid 14 26 15 46 127 62 26 81 698Cost per Recipient $ 29,700 $ 48,450 $ 12,750 $ 5,303 $ 2,147 $ 4,639 $ 4,924 $ 1,813 $ 4,091 Procedure Code 0760P, RN Evaluation FY 1997 FY 1998 FY 1999 FY 2000 FY 2001 FY 2002 FY 2003 FY 2004 FY 2005Unduplicated yearly recipients 32 1 113 134 208 107 36 26Average monthly users 4.6 1.0 10.7 11.8 18.7 10.6 3.1 3.0Total amount paid per year $ 1,332 $ 50 $ 21,300 $ 35,050 $ 55,500 $ 29,250 $ 9,250 $ 6,250 Claims paid 32 1 118 141 224 119 37 26Cost per Recipient $ 42 $ 50 $ 188 $ 262 $ 267 $ 273 $ 257 $ 240
Note: Procedure code 0761P includes t1019 without U3 modifier and 0761P without JQ modifier. Procedure code 0762P includes t1020 without U3 modifier and 0762P without JQ modifier. Source: Department of Health and Senior Services
Table A-12: Expenditures in Consumer-Directed PCA Services, FY 1997 – FY 2005 Procedure Code #10761P with JQ Modifier Per Hour FY 1997 FY 1998 FY 1999 FY 2000 FY 2001 FY 2002 FY 2003 FY 2004 FY 2005Unduplicated yearly recipients 0 0 0 0 0 809 2,017 2,938 3,348 Average monthly users 0 0 0 0 0 421 1,150 1,854 2,357 Total amount paid per year -$ -$ -$ -$ -$ 6,957,573$ 32,493,813$ 53,913,616$ 72,016,311$ Claims paid 0 0 0 0 0 10,050 56,874 106,849 688,472 Cost per recipient 8,600$ 16,110$ 18,350$ 21,510$ Procedure Code #20762P with JQ Modifier Per Day FY 1997 FY 1998 FY 1999 FY 2000 FY 2001 FY 2002 FY 2003 FY 2004 FY 2005Unduplicated yearly recipients 1 1 2 6 24 19 42 106 76Average monthly users 1 1 1 2 4 9 17 31 26 Total amount paid per year 29,700$ 48,450$ 25,500$ 31,819$ 51,536$ 212,289$ 637,038$ 853,800$ 982,734$ Claims paid 14 26 15 46 127 235 890 1,236 4,592 Cost per recipient 29,700$ 48,450$ 12,750$ 5,303$ 2,147$ 11,173$ 15,168$ 8,055$ 12,931$ Note: Procedure code 0761P includes t1019 with U3 modifier and 0761P with JQ modifier. Procedure code 0762P includes t1020 with U3 modifier and 0762P with JQ modifier. Source: Department of Health and Senior Services
2. PCA and waiver services substantially overlap: both programs are used by the same persons, who
receive similar services from similar providers.

State of Alaska Department of Health and Social Services
ALASKA LONG TERM CARE AND COST STUDY
FINAL REPORT
Final Report Page 106
The following table shows, by waiver, the number of persons who use personal care and the funds spent on PCA services. Comparing these waiver-related expenditures to the total expenditures shown in the tables above concludes that two-thirds of the persons on the APD waiver use personal care and half of the individuals on the OA waiver use personal care. As such, these persons spend about 45% of the total personal care dollars.
Table A-13: Use of Personal Care Services by Persons on Medicaid Waivers, FY 2004
PCA Program Users PCA Program Expenditures APD Waiver
Agency Based 88 $ 1,349,453 Consumer Directed 515 $ 11,700,322
All 603 $ 13,049,775 CCMC Waiver
Agency Based 6 $ 206,558 Consumer Directed 74 $ 1,903,850
All 80 $ 2,110,408 MRDD Waiver
Agency Based 11 $ 203,347 Consumer Directed 73 $ 2,054,149
All 84 $ 2,257,496 OA Waiver
Agency Based 123 $ 1,480,581 Consumer Directed 598 $ 12,035,362
All 721 $ 13,515,943 TOTAL
Agency Based 228 $ 3,239,939 Consumer Directed 1,260 $ 27,693,683
All Waiver Users 1,488 $ 30,933,622 Source: Division of Senior and Disabilities Services
PCA and Waiver services are actually combined into one large complicated meshing. There is a constant flux of recipients and providers across these programs and the eligibility requirements are similar. OA and APD waiver recipients use more personal care services than MRDD and CCMC waiver recipients, and primarily utilize the consumer-directed option under PCA services. One likely reason for this is that there is no in-home services option under the OA and APD waiver to correspond with the supported living option under the MRDD and CCMC waiver. 3. MMIS edits do not reconcile to current program policies. Program policies now contain waiver restrictions that prevent payments for duplicate services; however, state staff was not always sure whether the edits were in place and working. For example, it is possible for two individual PCAs to bill for services on the same day for the same client, and for both assistants to be paid. The APS Healthcare billing audit of March 2005 reported examples of where policy actions were not reflected in the computer edits:

State of Alaska Department of Health and Social Services
ALASKA LONG TERM CARE AND COST STUDY
FINAL REPORT
Final Report Page 107
“In June 2004, DHSS implemented a regulatory change whereby a Personal Care Agency could no longer provide services to a person living in an assisted living home. This change is contained in 7AAC 43.760. APS Healthcare completed an analysis of the claims extract presented by DHSS for the time period January – November 2004. This analysis revealed that eleven (11) recipients had simultaneous dates of billing for personal care services and assisted living services after this date. Six (6) of these recipients had persistent and long term billing over several months while the remaining five (5) recipients appeared to be transition issues where services overlapped by a day or two. The services provided by these personal care service agencies are eligible for repayment.
An additional concern with this simultaneous billing relates to assisted living home regulation 7AAC 43.1058 (m) which allowed assisted living homes time to make adjustments to staffing and consider negotiation of their rates based on the loss of personal care services that were previously allowed. The grandfathering provision ended September 30, 2004. There were three (3) recipients for whom billing of Assisted living Homes services and Personal Care Services continued beyond the 9/30/04 deadline for adjustments.”
4. Expenditures and persons served by the agency-directed program have dropped in recent years. A look at the procedure codes shows that the agency-directed approach appears to have been dropped by most recipients and providers in Alaska. There may have been cost advantages for providers to convert to managing recipients in a consumer-directed manner. 5. The increase in PCA expenditures was the catalyst for the new regulations. The increase in expenditures on the PCA program created a need for the Department to obtain a supplemental appropriation from the Legislature. This request brought legislative scrutiny to the expenditures, as exemplified in the Legislative Research report of February 16, 2004. House Bill 67, which took effect July 1, 2005, directed the Department to issue new regulations:
“It is the intent of the legislature that the Department of Health and Social Services implement regulation changes to 7 AAC 43.750-795 to control and reduce costs of the Personal Care Attendant (PCA) program by: 1) clearly defining recipient eligibility in the "purpose and scope" section where, absent PCA assistance, an individual would require hospitalization or nursing home care; 2) clearly defining recipient eligibility in the "purpose and scope" section where, absence of PCA assistance would result in the individual's loss of employment; 3) deleting "stand-by" assistance as an allowable PCA task; 4) clearly stating that Instrumental Activities of Daily Living (IADLs) are not allowable unless specifically related to an approved task for an Activity of Daily Living (ADL) need; 5) adopting an objective client assessment tool that results in a reliable and consistent care plan to be used by PCA providers, PCA agencies and the department; 6) requiring physical certification of an individual's condition as stated in the PCA assessment to confirm need for services; 7) requiring that if more than one PCA recipient resides in the same home, only one PCA provider is allowed for both recipients; 8) tightening enrollment criteria for all providers to require specific training and experience; 9) requiring Medicaid certification for PCA provider agencies; 10) requiring that the owner/manager of a PCA agency meet specified minimum level of education and administrative or business experience in a related field; 11) clearly stating that an individual's assessment function will be conducted by department

State of Alaska Department of Health and Social Services
ALASKA LONG TERM CARE AND COST STUDY
FINAL REPORT
Final Report Page 108
staff or the department's designee;) requiring prior authorization by department staff or the department's designee for all PCA services; 13) including a new regulation that prevents the individual solicitation of clients by PCA agencies and provides consequences for such actions; and 14) review consumer directed services to determine processes or procedures to improve program effectiveness.”
These directed legislative changes fell into three groups:
a) Eligibility for the program was tightened by requiring that a person had to need substantial assistance with two activities of daily living instead of one, and that without the services the person would have a risk of being hospitalized, placed in a nursing home, or unemployed.
b) Assessments for the program were also tightened by requiring that a physician has to
certify the need for personal care services by documenting the existence of the medical condition claimed on the intake form. This is a departure from past practice, which did not require: verification for a plan of care used less than 35 hours a week; that a new assessment tool be used with each assessment; and that the state or its designee—rather then the provider of PCA services—conduct the assessment. The legislature also requires the coordination of personal care and waiver services under the changes.
c) Provider activities were also tightened in both the agency and consumer-directed
programs. Training, utilization of PCAs, and the use of multiple assistants in the same home were all subject to new restrictions. Restrictions on provider marketing were also added.
5. Waiver Programs Alaska currently has four 1915 (c) Medicaid Home and Community-Based Service Waivers: Older Alaskans (OA); Adults with Physical Disabilities (APD); Mental Retardation and Developmental Disabilities (MR/DD); and Children with Complex Medical Conditions (CCMC). All four of these waivers are scheduled to be renewed in July of 2006. Discussions and decisions regarding changes to these waivers are currently underway, including the preparation of the new applications.

State of Alaska Department of Health and Social Services
ALASKA LONG TERM CARE AND COST STUDY
FINAL REPORT
Final Report Page 109
Table A-14: Summary of Alaska’s 1915(c) Waivers
Waiver OA APD MR/DD CCMC Renewal Date 2006 2006 2006 2006 Institutional Comparison NF NF ICF-MR NF Target Group Aged Disabled MR/DD Disabled Age restrictions 65 & older 21-64 None 0-21
Other restrictions None Physical disabilities; could
be 65+
None Severe chronic physical condition
Institutional Cost Cap No No No No Statewide Yes Yes Yes Yes Services Case management X X X X Homemaker Home Health Aide Personal Care Respite X X X X Adult Day X X Habilitation X X X Residential X X X Day X X X Prevocational Supported employment X X X Environmental Adapt. X X X X Skilled Nursing Transportation X X X X Specialized ME X X X X Chore Services X X X X PERS Companion Services Private Duty Nursing Family training Adult Residential Care Extended State Plan Other 1 Meals Meals Meals Meals
Other 2 Residential
Supported Living Residential
Supported Living Intensive Active
Treatment/ Therapies Intensive Active
Treatment/ Therapies
Other 3 Specialized Private Duty
Nursing
Intensive Active Treatment/ Therapies
Specialized Private Duty Nursing
Other 4
Specialized Private
Duty Nursing Chronic Mental Illness Operating Agency DSDS DSDS DSDS DSDS
OA Division of Medicaid agency
Yes Yes Yes Yes
CM in-house or contract Contract, but can be in-house
Contract, but can be in-house
Contract, but can be in-house
Contract, but can be in-house
Covers all inst eligible Yes Yes Yes Yes 300% SSI* Yes Yes Yes Yes
Post eligibility spend-down Instit. special income level -
$1656
Instit. special income level -
$1656
Instit. special income level - $1656
Instit. special income level - $1656
Spousal Impoverishment Yes Yes Yes Yes

State of Alaska Department of Health and Social Services
ALASKA LONG TERM CARE AND COST STUDY
FINAL REPORT
Final Report Page 110
Waiver OA APD MR/DD CCMC Schedule for reevaluations 12 months 12 months 12 months 12 months
Criteria Mix of ADLs, IADLs, Medical & Other criteria
Mix of ADLs, IADLs, Medical &
Other criteria
Must meet 1 of 5 categories (MR, RC,
CP, Epil, Autism) and apply ICAP scores
NF criteria + life-threatening conditions,
extraordinary supervision & frequent specialized treatments
2005 1587 1212 1112 209 2006 1734 1365 1168 226
*amount capped by Legislature at $1,656.00 per month Programmatic Findings 1. HCBS Waivers will need to use the new waiver format which includes new requirements for
quality assurance and stakeholder input All four of Alaska’s HCBS waivers are up for renewal in July of 2006. At the time of our site visit and review in November of 2005, the state staff had not yet started the renewal process. Given that CMS now has a new waiver template and additional waiver requirements, it would be advisable for Alaska to start the writing process as soon as possible. Due to the new waiver template and process, states are now required to submit new applications for each waiver, which is much more complicated than the previous renewal process. CMS recommends submission at a minimum of 90 days prior to expiration and preferably 120 days prior. Two other aspects that are new include the requirements for the state to provide specific detail on how the Quality Framework requirements will be met as a part of each waiver and to also provide evidence that the waiver application was provided to stakeholders and that input was received and utilized in the development of the application. 2. Level of Care criteria and need for active treatment for the MR/DD waiver appear to adhere to
very stringent criteria
Alaska currently interprets its level of care criteria in a manner which may be restrictive in terms of the types of services that individuals are able to receive. The way in which current level of care definitions are applied in the MR/DD waiver is a potential problem to Alaska’s long term care system because it may limit how many people are able to qualify for the HCBS Waivers, access to federal matching dollars, and may not aid in the avoidance of placement in more restrictive environments. The waiver should be utilized to maintain people in the community as long as health, safety and well being can be assured. When individual needs exceed the ability to ensure that criteria for health, safety, and well being are being met, then placement alternatives must be provided. For the HCBS waivers, the federal government permits states to establish their own methodology for determining whether or not applicants meet the state’s level of care criteria. States may use the same method used for determining placement in an institutional setting or a different methodology, so long as they can demonstrate that the alternative process used is ‘valid, reliable and full comparable’ to the process used in determining admission to a Medicaid certified institution (State Medicaid Manual, Section 4442.5B.5). 3. Current approaches to the delivery of care coordination, plan of care development, and quality
assurance need to be reviewed and modified based on an objective assessment of desired goals.

State of Alaska Department of Health and Social Services
ALASKA LONG TERM CARE AND COST STUDY
FINAL REPORT
Final Report Page 111
Care coordination is provided through each of the four waivers and can be done by state staff, provider staff, or independent providers. Based on our analysis, as well as input received from stakeholder interviews, there are a myriad of concerns and perceptions which directly relate to the plan of care development, implementation, and assurance of quality. Major concerns that were expressed include: caseload size; independence of care coordination from actual service provision; and standards for care coordination, including issues of plan of care development and monitoring. With regard to the independence (or lack thereof) in the delivery of care coordination from service provision, there is acknowledgement that independent care coordination may not be feasible in many of the rural or frontier areas of the state. At a minimum, clear expectations that act as firewalls between direct service provision and support and ensure independence need to be provided. One comment that arose from stakeholders and state staff was that plan of care development should be based on consistent assessment of need, focused on achievement of outcomes, and support consumer direction and self-determination. The concern was also expressed that plan of care development for the CCMC waiver is currently done in a vacuum and that for the OA waiver, the amount of telephone and email utilization instead of personal contact was high. Stakeholders acknowledged a need for services and/or supports to be provided in response to the plans of care, which should be reviewed for delivery and to ensure that outcomes are achieved. An additional aspect of quality assurance that stakeholders would also like to see enhanced is a process for an assessment of consumer satisfaction. 4. The current MR/DD and OA/APD HCBS waiver structure and service mix should be examined to
ensure maximum benefit and coverage for Alaska’s consumers. Currently, the MR/DD waiver is structured so that any qualified individual may receive a comprehensive array of services, including 24-hour support. The addition of a support services waiver, which would provide less than 24-hour services to people living with their families or independently who need support services but do not require a comprehensive set of paid service interventions, would assist the state greatly. As in a comprehensive waiver, the services in a supports waiver can have objective and uniform criteria for eligibility/access and can have a capped scope and duration. In order to use these types of approaches, you must ensure that criteria are objective and measurable, and that the application is uniformly applied to all eligible enrollees. Interviews with stakeholders (both consumers and providers), as well as information discussed at the policy summit and Consumer Task Force Meeting, revealed that the array of services available through the waivers is an area where improvements and changes are needed. A specific area of concern included insuring that the waivers encourage consumer-directed services and self-determination. Concern was also expressed that people with DD may gain access to the APD waiver when access to the MR/DD in not available to them. Without factual data to support the claim, it would first be necessary to review current APD enrollees to determine diagnosis and evaluate what services are being received on the APD waiver. Then a determination should be made if there are services on the APD that are only accessed by people with DD that should be eliminated from that waiver. Another area of potential overlap that was mentioned during interviews was that there are some people who are utilizing both HCBS waivers and the Medicaid State Plan rehabilitation option for mental illness and substance abuse.

State of Alaska Department of Health and Social Services
ALASKA LONG TERM CARE AND COST STUDY
FINAL REPORT
Final Report Page 112
Interviewees also mentioned that certain waiver services should be added, including: crisis services; in-home support; family support; and wrap-around services. Certain waiver service definitions were also suggested, including: supported employment; personal care; day habilitation; and adult day care. These service definitions should be clear and provide flexibility and access. Specific only to the CCMC waiver, the need to address provision of day care for children was mentioned. 5. Provider qualifications, standards for provider quality and provider capacity impact the delivery
of waiver services. From our analysis and interviews, it was determined that provider qualifications need to be reviewed to ensure that they are appropriate to the type of service provided, but are not so stringent that they serve as a deterrent to actual provision of the service due to unnecessarily burdensome requirements. Two examples were noted: 1) requirements for the provision of transportation services that are seen as overly restrictive; and 2) a prohibition on paying family caregivers for providing services or supports for adult children. Quality standards for performance by providers and the auditing of compliance with the standards were also noted by stakeholders and state staff as areas that should be improved. The lack of staff to conduct quality auditing was indicated as one particular rationale for this problem. Stakeholders noted that the waiver currently limits the amount of a service that can be provided, which results in limiting the capacity of providers to develop and provide the service. This comment was specifically directed to the availability of adult day care for elderly individuals enrolled in the OA and APD waivers living in assisted living homes. 6. Alaska does not currently have HCBS waivers for people with Traumatic Brain injury (TBI) or Alzheimer’s Disease and Related Dementias (ADRD). The Division of Behavioral Health is currently the lead entity in Alaska for the development of a TBI service system. Alaska has been the recipient of HRSA planning grants to study and plan for a system of comprehensive services for persons with TBI. As a result of the planning work, the Alaska Traumatic Brain Injury Advisory Board was established and a statewide needs assessment was completed in February of 2003. The incidence of TBI in Alaska is 105 per 100,000 population, or 28% higher than the national rate of 82 per 100,00021. Consumers with TBI currently receive limited services from the Division of Behavioral Health. State staff and stakeholders indicated that the array of long term care services available to the TBI population is limited and does not address the specific needs and complex care necessary to serve these individuals. One specific gap is the lack of community-based services specifically gauged to meet the needs of these individuals; therefore, the development of a Home and Community-Based Services Waiver for the TBI population needs to be addressed. 21 Sallee, Diane, MS; Martha Moore, MS; and Mark Johnson, MPA. “Traumatic Brain Injury in Alaska, 1996-1998.” http://www.hss.state.ak.us/DPH/chems/injury_prevention/Assets/Reports/alaska%20tbi%201996-1998.pdf#search='Traumatic%20Brain%20Injury%20in%20Alaska%2C%2019961998’.

State of Alaska Department of Health and Social Services
ALASKA LONG TERM CARE AND COST STUDY
FINAL REPORT
Final Report Page 113
Similarly, Alaska does not currently have a HCBS waiver for people with Alzheimer’s Disease and Related Dementias (ADRD). The state’s current waiver programs do not provide services to people with ADRD because the individuals are generally screened out as part of the level of care determination. Therefore, Alaska has two opportunities to consider: 1) examine the current method of determining level of care and decide if ADRD individuals are in fact being screened out, and whether or not the current level of care needs to be adjusted in order to accommodate their inclusion; or 2) develop a new ADRD waiver with a level of care that carves these individuals in and includes services that are specific to the needs of the people who meet this categorical definition. Regardless of the choice made, Alaska needs to ensure that services are provided to individuals who qualify under the ADRD category and that appropriate services are developed to meet the needs of this growing population. Cost Findings 1. The July 2004 waiver regulations saved the state $6 million in expenditures. Alaska state staff provided budget detail sheets to PCG for our analysis. The sheets delineated information on waiver users and the costs of their services for Fiscal Years 1994 through 2005. Our review revealed that the waiver programs have followed a common sequence of events since their start in the mid-1990s: first, they all had low enrollment numbers during their first 2-3 years; next, when success in building the system’s infrastructure was apparent, further growth occurred in the late 1990s and early 2000; and finally, state staff have to create numerous policies, procedures, and infrastructure to support a more complicated program and regulations slow the added number of eligible individuals. Also revealed was a significant change was made in the OA/APD waiver program procedures in July of 2004, when the state took control over the assessments by contracting with an outside firm to perform them. Prior to that, there were federal and state concerns over the statewide consistency of assessments and there appeared a conflict of interest as providers and their care coordinators were completing the assessments. The waiver regulations that went into effect July 1, 2004 were the first regulatory changes since the waivers were implemented in 1993-1994. The biggest changes were:
• a freeze on waiver rates, which has only been stayed for a five-week period in 2005; • allowable daily respite care days were dropped from 21 to 14; • hourly respite care was limited to 520 hours a year; • respite care billing codes were changed and additional documentation of family respite was
required; • additional billing codes were added to reflect hourly and daily family and agency respite
services; • chore services were limited to 5 hours per week with exceptions for people with respiratory
services served under the CCMC program; • reimbursement for specific environmental modifications and specialized medical equipment
was tightened; • duplicate payments for residential habilitation services were controlled by reducing separate
payments for meal preparation, chores, transportation, and personal care assistants;

State of Alaska Department of Health and Social Services
ALASKA LONG TERM CARE AND COST STUDY
FINAL REPORT
Final Report Page 114
• the number of recipients receiving habilitative care in assisted living homes was limited to 3 on the MRDD waiver and 2 on the CCMC waiver;
• the requirement that homes should be licensed was put into regulations; and, • care coordination payments for assessment and re-assessments were adjusted.
Approximately $6 million in reduced costs are shown in the CMS 372 reports for services discussed in the July 2004 regulations. This cost reduction took place despite an increase in consumers utilizing the three largest waiver programs; however, all four waivers deceased in cost per day from FY 2004 to FY 2005. The regulations also had a cost avoidance impact on top of the $6 million, so the $6 million is a minimum estimate of the cost effectiveness from the July 2004 regulations. As exemplified in the July 2004 regulations, as programs mature, their user growth and costs can be more appropriately regulated and level off. 2. Waiver costs are not going up at the same rate as the addition of new individuals to the waiver.
There is an upward trend for the waivers in adding new users; however, with the exception of the OA waiver, costs are not going up at the same rate as the increase in users. The table below compares costs from FY 2000 to FY 2005 and shows the percentage change by waiver for the number of unduplicated users, the average length of stay, and the cost per user per day.
Table A-15: Comparison of Changes by Waiver, Years 2000-2004
SFY 2000 SFY 2005 % Change
APD Number of unduplicated users 498 938 88.35%APD Average Length of Stay 285 293 2.81%APD Cost Per User Per Day 40.95$ 54.05$ 31.99%
CMCC Number of unduplicated users 112 215 91.96%CMCC Average Length of Stay 315 327 3.81%CMCC Cost Per User Per Day 96.15$ 115.54$ 20.16%
MRDD Number of unduplicated users 694 1,003 44.52%MRDD Average Length of Stay 335 357 6.57%MRDD Cost Per User Pe Day 134.24$ 176.05$ 31.14%
OA Number of unduplicated users 925 1,409 52.32%OA Average Length of Stay 280 287 2.50%OA Cost Per User Per Day 43.77$ 68.24$ 55.91%
Source: Data from CMS 372 Reports.
Next is an illustration of the number of users of Alaska’s four waivers, from Fiscal Year 1994 to Fiscal Year 2005. The OA Wavier has the greatest use, with approximately 1,400 users in FY 2005.

State of Alaska Department of Health and Social Services
ALASKA LONG TERM CARE AND COST STUDY
FINAL REPORT
Final Report Page 115
Table A-16: Consumers of Waiver Services
-200400600800
1,0001,2001,4001,600
SFY1994
SFY1995
SFY1996
SFY1997
SFY1998
SFY1999
SFY2000
SFY2001
SFY2002
SFY2003
SFY2004
SFY2005
APDCCMCMRDDOA
Source: CMS 372 Data. 3. There is no consistent care coordination across the waivers. All users of waiver services receive care coordination; however, it is generally delivered by staff members who work for the provider agencies, although there is some independent care coordination on the OA and APD waivers. The care coordination received varies across the waivers because of the variety of services offered under each and received by consumers in the four waiver programs. For example, chore services, transportation, and specialized equipment and supplies are predominately used by adults with physical disabilities and older Alaskans. In addition, APD and OA waiver users are the only Alaskans who can use residential supported living arrangements and adult day care, under the service definitions. Meanwhile, MRDD and CMCC waiver users, along with APD waiver users that have a DD diagnosis, utilize residential and day habilitation. The MRDD and CCMC waivers have an in-home option, but the OA and APD waivers do not because they have no equivalent to residential habilitation; instead, OA and APD waiver users receive in-home services through the PCA program. Similarly, while persons on the APD, CCMC and MRDD waivers are eligible to use intensive active treatment/therapy, the highest utilization of this service is within the CMCC program. Persons on the APD waiver make almost no use of it and persons on the OA waiver cannot use intensive active treatment/therapy. In addition to differences in services provided across the waivers, a greater amount of money is spent on environmental modifications for OA waiver users than for any other waiver users. 4. The state is achieving an economy of scale in its assessment program. In 2004, the state paid care coordination claims for 3,250 persons, at an average cost of $2,084 per person. In relation, in 2005, the state paid claims for 3,512 persons at an average cost of $2,042 per person. Therefore, from 2004 to 2005, the number of consumers increased while the cost per case remained flat: this indicates that the state is achieving an economy of scale in the 3,500 assessments it pays for, since the per unit costs are not increasing with a larger volume of consumers.
5. There is uncertainty that the MMIS edits are correctly mirroring the payment policy limits of the
waivers. In Alaska, waiver services are paid using “procedure codes” that uniquely identify the specific service that Medicaid or the state should be paying for. When a provider submits a claim using the recipient’s

State of Alaska Department of Health and Social Services
ALASKA LONG TERM CARE AND COST STUDY
FINAL REPORT
Final Report Page 116
Medicaid number, a prior authorization number, and a procedure code, the computer edits the claim and then looks up the rate or amount that the provider should be paid for that procedure code. An example of MMIS edits not reflecting the payment policy limits of the waivers is illustrated with the purchasing of specialized medical equipment and supplies. While there are approximately 25-30 procedure codes set aside for this activity in Alaska, there is no requirement in regulation that the average manufacturer’s price be paid for these specialized supplies or that suppliers must obtain competitive bids to show they have acquired the lowest-cost product. Currently, manufacturers dictate the price that the state will pay for these supplies. In Alaska, there are policy limits on which procedure codes can be paid in conjunction with other procedure codes. In looking at the state’s waiver programs, there are limits that only one unit per day will be paid for, that no other services will be paid on respite days, and that no waiver services will be paid while the recipient is in the hospital or nursing home. A fiscal intermediary operates the state’s Medicaid claims processing system, with a computer using “edit codes” to carry out the payment policy limits. Staff members interviewed about the claims processing system revealed that it was not always the case that all edits supposedly in the Medicaid Management Information System (MMIS) were either operating properly, or were in fact even there. 6. Alaska’s rate setting methodology for habilitation services under the waivers uses “compression.” 7. Providers self-report selected costs in Alaska and this leads to inconsistency in rate setting. 8. The lack of consistent cost reporting standards leads to duplicate counting of indirect or inclusion
of non-allowable costs. 9. The cost estimates for Intensive Active Treatment / Therapies are difficult to reconcile with the
waiver language. 10. Provider administrative costs for the waivers appear high. 11. In the waiver programs, there is no routine auditing of provider costs or verification of submitted
claims. Cost Findings 6-11 were developed upon a comprehensive review of Alaska’s rate setting methodology. We started with a review of the state’s CMS 372 forms, which showed residential habilitation as the largest single service paid by Medicaid for the MRDD and CCMC waivers. As an example, in 2005, $47 million was spent on residential habilitation out of the $63 million total for the MRDD waiver. While persons on the APD waiver with a DD type diagnosis are also eligible to use the service, utilization rates are low. Procedure codes are used to pay for residential habilitation services under these waivers.

State of Alaska Department of Health and Social Services
ALASKA LONG TERM CARE AND COST STUDY
FINAL REPORT
Final Report Page 117
Table A-17: Residential and Day Habilitation Codes
T2017-U4 In-home habilitation, residential, waiver; per 15 minutes S5140-U2 and S5145-U2
Shared care services, adult (age 18 and over); per diem Shared care services, child (through age 17); per diem
S5140 and S5145
Family habilitation home services, adult (age 18 and over); per diem Family habilitation home services, child (through age 17); per diem
T2017 Supported living habilitation, residential, waiver; per 15 minutes T2016 Group home habilitation, residential, waiver; per diem T2021 Day habilitation, residential, waiver; per 15 minutes
The rates and units of service provided under the procedure codes must have a prior authorization. This process is done through the submission of a budget detail sheet to the state, which is shown in Appendix E of this report. A narrative of the case as part of the plan of care is also required with the submission of the budget detail sheet. Because the state does not require the use of a standardized budget detail form, provider agencies use their own format of budget detail form. State staff review these different forms, but do not have sufficient information about provider costs to judge whether costs are reported similarly or accurately. In addition, average costs across providers cannot be compared because there is no standardized format to the form. The budget detail forms contain ad hoc amounts that increase the rates for some providers but not others; therefore, the reimbursement has the superficial appearance of a cost-based system, but in fact, it is not. The example budget detail sheet, presented in Appendix E, shows calculations for adult family habilitation services provided, procedure code S5140. The first row of calculations states that the provider’s cost per day is $85.00 and when multiplied by 337 days of service, it is a yearly cost of $29,835. The second line divides this yearly cost by days to get a rate of $88.53 per day. This rate setting method results in a per diem payment to the provider that is higher than the provider’s self-reported per diem expenses, a method referred to as “compression” by Alaska state staff. This means that total cost is “compressed” into a smaller number of days and that a higher cost per day is used to reimburse the provider. The argument supporting this rate setting practice is that the resident will not be using the home’s services for all of the reported days. In this example, the budget detail form then assumes that the resident will be in the home for 337 days and will leave for home visits or other travel and then will return to the home. The payment justification is that the provider still has overhead and other costs to meet even though the resident is in the home just 337 days out of the year’s 365 days. The budget detail form goes on to add travel expenses at 40 cents per mile, a 13.52% Administrative and General (A & G) overhead charge, and two other adjustments. The resulting amount is divided by the 337 days to get the final rate of $112.20 per day. The $112.20 is said to be a negotiated rate, because of the method of rate setting, which is neither detailed in regulation nor established through the use of a standardized cost report. This would be the amount reported to the state and upon approval, keyed into the fiscal intermediary’s prior authorization sub-system. See 7 AAC 43.1058 and 7 AAC 43.1060. The number of days and rate per day are entered into the state’s Medicaid Management Information System (MMIS) and can be viewed in the state’s prior authorization screens. A print of a prior authorization screen, know as the AKCF screen, for this particular case is shown below. The name of the person, as well as his/her Medicaid number and date of birth, have been deleted from the screen.

State of Alaska Department of Health and Social Services
ALASKA LONG TERM CARE AND COST STUDY
FINAL REPORT
Final Report Page 118
Table A-18: Example of Prior Authorization Screen AKCF ALASKA ONLINE PRIOR AUTHORIZATION CHANGED 11/10/05 AUTH #: 34077998 TOA: C STATUS: A REV TYPES: ___ ___ ___ PROV #: IND: N RECIP #: M CNTL #: 0600019571 FROM: 07 01 05 THRU: 06 30 06 SUBM: 00 00 00 APPR: 07 22 05 DOB : ELIG: 04 00 - 11 05 TYPE: 74 SI ATT: __ __ __ SUB ID 0004302 OPER: DOCS: DD1761 ORIGIN : ___ ___ ___ ___ DEST: ___ ___ ___ ___ INV PRC TTH SURF DIAG SURG AUTHORIZATION USED CLAIMS TYP PROC/NDC MOD TOS CODE CODE DATE UNITS AMOUNT UNITS AMOUNT DATE 02 S5140 8 000000 00337 3781140 00110 1234200 111805 02 S5150 8 000000 01920 0744960 00724 0280912 111105 02 S5151 8 000000 00014 0350000 00011 0275000 111805 02 T2021 8 000000 04416 3448896 01782 1391742 111805 As the AKCF screen shows, this person also receives day habilitation. Accordingly, the budget detail form shows that the agency providing the recipient’s day habilitation requested prior authorization for 4,416 units or 1,104 hours per year, a little more than 3 hours a day for 365 days a year. This rate is also “compressed”: the cost per day is based on 4,608 units, but the cost is compressed to 4,416 units, which means that the provider is receiving a rate 4.35% higher than its reported costs. 6.25% is added for relief providers, an additional $863.88. At $3.13 a unit, this pays for an additional 276 units or 69 hours more of day habilitation. Then, 48 hours of staff meetings and 57 hours of staff training are added at a cost of $12 per hour. Next, the above amounts are multiplied by a 42% fringe benefit rate and another $1,459 for employee commuting costs is added to reflect the day habilitation transportation costs for 240 days, assuming 15 miles per day at a cost of $0.40 per mile. A $200 charge is also added for program supplies, and the result is multiplied by an A&G rate of 13.52%. Added to this total is $7,003 for add-on expenses described as ‘fixed costs.’ The sum of all of these hourly estimates, meetings, trainings, commuting, A&G, and fixed costs is $34,591. The addition of fixed costs and the use of special adjustments creates the possibility of unallowable costs being entered into the rate, so with the MRDD waiver language that excludes “…the costs of facility maintenance, upkeep and improvement, other than such costs for modifications or adaptations to a facility required to assure the health and safety of residents, or to meet the requirements of the applicable life safety code,” these costs may be incorrectly added to the total cost. The second page of the budget detail form shows a different care plan, which itemizes costs for a person receiving MRDD waiver services for a total of $153,773.63. In this case, instead of one provider with a large residential cost, we have multiple providers who bill separately. One provider completes the care coordination and is also one of the agency-based hourly respite providers, although using a different business identity to provide the respite hours; another provider is for agency-based hourly respite services as well as supported living and chore services; and, two more providers provide intensive active treatment and transportation. The major cost here is for supported living services at $116,246, under procedure code T2017. In this case, staffing is the biggest expense of the care plan, as one staff person comes to the person’s apartment for 11 hours each weekday and a second person comes for 10 hours each weekend day. As such, an additional 32.6% for staff fringe benefits is added, as are indirect costs for hiring and training of staff and recruiting and advertising for positions. An additional $7,253 for “Juneau

State of Alaska Department of Health and Social Services
ALASKA LONG TERM CARE AND COST STUDY
FINAL REPORT
Final Report Page 119
infrastructure” and two additional overhead charges at 32.6% each are also included, and there is also an additional $2,604 for program “support,” which brings the total of direct and indirect costs to $98,538. Then 17.97% (or $17,707) is added for A&G costs, which leads to the possibility that indirect costs could be double-counted. The end result is an expensive model, since it relies on a staff-to-client ratio of 1:1 to support this person. The last service priced in this example budget is Intensive Active Treatment, T2034. In the language of the MRDD waiver, this service is defined as:
“a treatment or therapy provided by a professional that is oriented to a client-specific problem. These time-limited interventions are designed to address a family problem, or a personal, social, behavioral, mental or substance abuse disorder in order to maintain or improve effective functioning. Intensive active treatment services are determined necessary when intervention requires precision and knowledge possessed only by specific disciplines, and specially trained professionals. Services may be utilized when an individual needs intervention to decelerate regression of behaviors; the recipient requires rapid skill development and acquisition; or the service is necessary to prevent institutionalization.”
In FY 2005, approximately 11% of the persons served on the MRDD waiver used this intensive active treatment service, at a cost of about $486,000. By its definition, it appears to be a short-term emergency category to pay for professional services; however, the wording of this service does not clearly identify it as a professional service, nor list the professionals that can bill for it, nor set time limits on how long such a treatment will be paid for, nor require that the service, if covered by Medicaid, should be billed as a state Medicaid plan service. Given this need for clarity, the T2034 code has the possibility of being a catchall category for a variety of services. The total cost of the care plan in this example budget is $153,774. Not counting the itemized indirect costs, the four itemized A&G components listed total $20,824. If the indirect administrative costs of staff, training, supplies, employee mileage, and meetings are also factored in, the administrative costs would be about $5,000 higher, resulting in a total administrative cost of 23.6%. In contrast, typical managed health care administrative costs are 12.4%22. 12. Shared Care and Family Habilitation procedure codes overlap. Shared Care is a transitional program in which the family cannot fully take care of the person requiring services, but continues to provide some care. Shared Care is paid through procedure codes S5140 U2 for persons 18 and over, while S5145 U2 is used for persons under 18 years of age. Under these procedure codes, the family can make arrangements to have their child or family member stay up to 180 days a year at the home of someone else. Family Habilitation Home services are paid for with procedure code S5140 for persons 18 and over and with code S5145 for persons under 18 years of age. This type of service is used when it is not possible to care for an individual in the family home or when more than 180 days of shared care is requested. The person lives full time at the licensed home, visiting their own home when they can.
22 Lemieux, Jeff. AHIP Center for Policy and Research, America’s Health Insurance Plans, “Perspective: Administrative Costs of Private Health Insurance Plans,” 2005.

State of Alaska Department of Health and Social Services
ALASKA LONG TERM CARE AND COST STUDY
FINAL REPORT
Final Report Page 120
It is not clear how family habilitation home services differ from residential foster home habilitation, S5140. The same services in licensed assistant living homes are provided under these procedure codes. The difference between the codes is one of age, indicating the codes are only being used for record keeping. It is also unclear as to how Shared Care, codes S5140 U2 and S5145 U2, differ from Family Habilitation. 13. The rate setting system for the OA and APD waivers has controls for duplicate payments that are
not found in the MRDD residential payments. 14. The payment system on the OA and APD uses cost reports submitted to the state, whereas the
negotiated rates used on with MRDD and CCMC waivers do not use cost reports. 15. One residential provider is being paid a rate that is neither authorized in regulations nor
developed through the rate setting system. The OA waiver language describes Residential Support Living Arrangements as:
Services in a variety of settings in which assistance with activities of daily living and other services are provided. This service is designed for those recipients who can no longer live alone and who do not yet need the 24-hour skilled medical care provided by a nursing home in Alaska, but who would be placed in a nursing facility for lack of other placement alternatives. The types of services provided in these settings may include: meals; housekeeping; transportation; assistance with eating, bathing, dressing, grooming, toileting, transferring and walking; personal laundry; medication monitoring; and social and recreational activities.
Payments for residential supported living arrangements are not made for room and board, the cost of administering a facility or group home, or the costs of facility maintenance, upkeep, and improvement, other than such costs for modifications or adaptations to a facility required to assure the health and safety of residents or to meet the requirements of the applicable life safety code.
This language is also found in the CMS State Medicaid Directors letter of February 28, 1999, and it is consistent with Federal policy. Residential Supported Living Arrangements services are billed using procedure code T2031. The rate setting for Residential Supported Living Arrangements is very different than the methodology used for Habilitation, because of the following:
• Rate setting for residential supported living arrangements is completed through the
authority and definitions in 7 AAC 43.1058 and 7 AAC 43.1060 or through a rate set by DSDS using standardized cost report forms. Approximately 75 homes have their rates set in regulation and 75 have their rates set by DSDS using the standardized cost report forms.

State of Alaska Department of Health and Social Services
ALASKA LONG TERM CARE AND COST STUDY
FINAL REPORT
Final Report Page 121
• Information from cost reports is collated into a database so that the costs of each provider can be arrayed by type of cost. This enables the rate setting unit to determine if a submitted cost report is within an appropriate range compared to other homes. The database is supplemented by research showing Alaska-specific costs for housing, labor, and other assisted living home costs.
• The methodology includes a control over care plans that include both assisted living
services and day care. Therefore, a person going to day care for three or more days in a seven-day period has their assisted living payment rate decreased by 26%, as per 7 AAC 43.1058(h). A parallel cost control is not found with the administration of the MRDD procedure codes.
A review of the approximately 150 Residential Supported Living Arrangements rates showed that one home has a daily per diem that is substantially higher than other homes. When asked about this, state staff responded that this rate was authorized by a former director. 16. OA and APD persons make extensive use of personal care services. The table below shows that the OA and APD waiver users make considerable use of the personal care program. The reason for this is because there are no in-home services options within the OA and APD waivers that are comparable to the supported living option under the MRDD and CCMC waivers.
Table A-19: Use of Personal Care by Waiver Users, FY 2005
Agency Based 88 $1,349,453Consumer Directed 515 $11,700,322All 603 $13,049,775
Agency Based 6 $206,558Consumer Directed 74 $1,903,850All 80 $2,110,408
Agency Based 11 $203,347Consumer Directed 73 $2,054,149All 84 $2,257,496
Agency Based 123 $1,480,581Consumer Directed 598 $12,035,362All 721 $13,515,943
Agency Based 228 $3,239,939Consumer Directed 1,260 $27,693,683All Waiver Users 1,488 $30,933,622
OA Waiver
All 4 Alaskan Waivers
Personal Care Program Users
Personal Care Program Expenditures
APD Waiver
CCMC Waiver
MRDD Waiver

State of Alaska Department of Health and Social Services
ALASKA LONG TERM CARE AND COST STUDY
FINAL REPORT
Final Report Page 122
17. Geographical adjustments made to the rates of assisted living programs are appropriate.
There are regulatory geographical adjustments made in payments for environmental modifications at 7 AAC 43.1054. This regulation allows for transportation and freight charges to rural communities.
There are also geographical modifiers used in the rates paid for home and community based services, described in administrative code at 7 AAC 43.1058, section (h)(6):
a base service rate…will be adjusted to reflect regional differences in the cost of doing business, based on the region in which the provider is located; based upon the designated planning regions described in Table 1 of the Alaska Commission on Aging State Plan for Services 2001 - 2003, dated June 14, 2001 and adopted by reference, the rate adjustments are as follows:
(a) for the Anchorage region - no adjustment; (b) for the south central region, other than Anchorage - 1.04; (c) for the southeast region - no adjustment; (d) for the interior region - 1.15; (e) for the southwest region - 1.33; (f) for the northwest region - 1.38.”
In conjunction, PCG looked at the Geographic Cost-of Education Index that was contained in the Alaska School District Cost Study Report of January 2003 by the American Institutes for Research. The Index was created using four categories of school district costs: personnel, energy, supplies, material and capital, and travel. The Index provides weights for 53 geographical areas; applying these weights to the six census areas in the regulation shows that the weightings in the regulations closely match the weights in the Index. Therefore, the weights in the regulation appear reasonable. 6. Grant Programs Services for seniors and people with developmental disabilities are funded through Title XIX Home and Community-Based Waivers and through grant programs. Grant funds are available through three separate funding sources: the U.S. Administration on Aging, the Alaska Mental Health Trust Authority and state general funds. Grant programs for seniors include:
Home and community based services for seniors which include adult day programs, senior in-home services, a statewide Alzheimer’s education, and family caregiver support program. The target population for these services are physically frail individuals 60 years of age or older, individuals of any age with Alzheimer’s disease or related disorders, and care givers.
Mental Health Trust Authority Projects (MHTAAR) grants are administered through the Senior
and Disabilities Services Division and provide services to persons of any age with Alzheimer’s or related disorder, persons over age 60 who experience mental illness and chronic alcoholism, and education and caregiver support.

State of Alaska Department of Health and Social Services
ALASKA LONG TERM CARE AND COST STUDY
FINAL REPORT
Final Report Page 123
Nutrition, Transportation, and Support Services fund non-profit agencies to provide meals to individuals in private homes ore group settings, health and nutrition education, and transportation services for seniors.
Senior Residential Services fund two rural senior assisted living residences for individuals who
have relocated from surrounding villages. The assisted living settings in Kotzebue and Tanana primarily serve Alaska Natives who need assistance with their activities of daily living, such as medication monitoring, skilled nursing care, meals, personal care, and housekeeping.
For individuals with developmental disabilities, grant programs include:
• Community Developmental Disabilities Grant Program (CDDG) funds: supported employment, respite care, care coordination, day habilitation, care coordination, specialized equipment and CORE Services for people with developmental disabilities. In some cases residential services are provided in group home or independent living settings. These services are provided to people who do not meet current HCBS waiver eligibility or whose families are their primary care givers.
In FY 2006, the state will spend approximately $10.6 million through its Community Developmental Disabilities Grants program to help persons with developmental disabilities who do not qualify for waiver services. In FY 2004, the Department’s grant programs helped approximately 2,200 persons in 90 communities.
• Protection of Rights and Investigation of Abuse provides and training and assistance to
individuals with developmental disabilities and their families on such topics as information and referral, negotiation and mediation, administrative grievances and actions, legal consultation and remedies.
• Short-term assistance and Referral Programs (STAR) provide funds to cover things such as environmental modifications, adaptive equipment, behavioral training, personal care or medical appointments to assist individuals with developmental disabilities and their families to address short-term needs which left un-addressed could lead to crisis and the need for higher cost services. On a limited basis living expenses, emergency transportation or clothing may be provided if there is no other public or private funding source. At the end of FY 2004, there were approximately 1,000 persons on the waiting list for waiver services. The Core Services Program (CORE) and Short Term Assistance and Referral Program (STAR) were able to provide some support to about 80% of the persons on the list and their families through grant funding. However, there are no current databases that show all of the services that people received from the CORE and STAR grant programs or how well the services match up against the needs they have. Moreover, the financing of these grant programs are complicated by a high cost per case and an imbalance of funds compared to services. More than one person interviewed with regard to receiving grant program services while on the waiting list described getting on the waiver as similar to winning the lottery. This image is apt, considering that in FY 2004, only 29 of the 1,000 persons on the waiting list were actually admitted to waiver services.
• Mini-grants are one-time awards of not more than $2500 to individuals for the purpose of
meeting health or safety needs. The funds can pay for therapeutic devices, access to medical, dental, and vision care.

State of Alaska Department of Health and Social Services
ALASKA LONG TERM CARE AND COST STUDY
FINAL REPORT
Final Report Page 124
PCG focused attention on the following important grant-funded programs in Alaska: Real Choice Systems Change In 2001, CMS awarded Alaska one of the first preliminary planning grants to explore approaches to consumer directed services in the Medicaid waiver program. In 2002, Alaska was awarded $1.3 million through a Real Choices Systems Change grant to implement consumer direction option in the Medicaid waiver program. There are two primary goals for this grant: 1) to assist people with disabilities and elderly individuals with participation in systems change activities and; 2) to develop and implement a model of consumer-directed services in the Medicaid waiver program. Under the direction of DSDS, the grant money funds the Council on Disabilities and Special Education to hire staff to support the Alaska Systems Change Consumer Task Force. The Task Force is composed of consumers, family members, advocates and agency representatives. In 2004, the group presented a recommendation for a “…sustainable alternative for offering individuals with disabilities and seniors the option to direct and manage their own services” (Letter to Commissioner from Governor’s Council on Disabilities and Special Education), which proposed the writing of a new 1915 (c) self-directed waiver utilizing the CMS Independence Plus waiver template. The tables below shows the grant amounts awarded.
Table A-20: Funding Information for Alaska’s Real Choice Systems Change Grant
(As of 2005)
Fiscal Year Awarded 2002Grand Total of Grant Award $1,385,000.00
Year 1 $315,483.00 Year 2 $530,541.00 Year 3 $538,976.00
Year 1 $123.90 Year 2 $94,714.23
Funding Information for Alaska's Real Choice Systems Change Grant (as of 2005)
Total CMS Grant Award Budget
Amount of CMS Funding Drawn Down
Source: 2005 Annual CMS Systems Change Grant Report. There are two primary goals for the Nursing Facilities Real Systems Choice Grant: 1) to provide services to transition individuals from nursing facilities to the community and; 2) to provide services to divert hospitalized people from nursing facility placement to community placement.

State of Alaska Department of Health and Social Services
ALASKA LONG TERM CARE AND COST STUDY
FINAL REPORT
Final Report Page 125
Table A-21: Funding Information for Alaska’s Nursing Facility Transition Grant (As of 2005)
Fiscal Year Awarded 2001Grand Total of Grant Award $800,000.00
Year 1 $222,751.00 Year 2 $280,479.00 Year 3 $277,786.00
Year 1 $4,293.00 Year 2 $124,274.00 Year 3 $277,786.00
Year 1 $11,138.00 Year 2 $14,024.00 Year 3 $14,156.00
Year 1 $11,138.00 Year 2 $14,024.00 Year 3 $14,156.00
Source: 2005 Annual CMS Systems Change Grant Report.
Amount of Grantee's Match Fund Expenditures
Funding Information for Alaska's Nursing Facility Transition Grant (As of 2005)
Total of Grantee Match Budget
Total CMS Federal Fund Grant Award Budget
Amount of Grantee's Federal Fund Expenditures
C-PASS The Personal Assistance Service and Supports grant, administered by the University of Alaska, has three primary goals: 1) to develop statewide training curricula, standard, and competency testing for assistants working within agency-based PCA programs; 2) to provide technical assistance and training to provider agencies and consumers regarding consumer-directed philosophy; and 3) to provide increased training opportunities for personal assistants. To date, the grant has fulfilled its first goal with the completion of a 40-hour PCA Training Curriculum.
Table A-22: Funding Information for Alaska’s C-PASS Grant (As of 2005)
Fiscal Year Awarded 2001Grand Total of Grant Award $900,000.00
Year 1 $355,877.00 Year 2 $418,467.00 Year 3 $320,767.00
Funding Information for Alaska's Community Integrated Personal Assistance Services and Supports Project (C-PASS) Grant
(As of 2005)
Total CMS Federal Fund Grant Award Budget
Source: 2005 Annual CMS Systems Change Grant Report.

State of Alaska Department of Health and Social Services
ALASKA LONG TERM CARE AND COST STUDY
FINAL REPORT
Final Report Page 126
Quality Assurance and Improvement Grant The State of Alaska also has a Quality Assurance and Quality Improvement grant from the Center for Medicare and Medicaid Services, which has a life of three years. The objectives of the grant are: 1) to develop a quality of life assessment tool and methodology; 2) assist in the implementation of a new quality management database system that will more effectively track complaints and incident reports across all state agencies and departments; and 3) to evaluate the project’s effectiveness toward meeting the state’s goals and objectives.
Table A-23: Funding Information for Alaska’s Quality Assurance and
Quality Improvement in HCBS Grant (as of 2005)
Fiscal Year Awarded 2004Grand Total of Grant Award N/A
Year 1 $117,581.00 Year 2 $145,134.00 Year 3 $155,134.00
Funding Information for Alaska's Quality Assurance and Quality Improvement in Home and Comunity-Based Services Grant
(As of 2005)
Total CMS Federal Fund Grant Award Budget
Source: 2005 Annual CMS Systems Change Grant Report. Programmatic Findings 1. Examine the use of state-only dollars to fund support services to determine the extent to which
they can be further matched through the state Medicaid program. It is important to note that it will never be possible for all state-only dollars to be matched because not all individuals served will be Medicaid eligible.
2. Dollars from some of the grant sources are used to fund the infrastructure. When grant dollars in
these programs are reduced, a proactive approach needs to be used to assess the impact on the infrastructure to ensure there are not unintended consequences.
3. Grant dollars from sources such as the Alaska Mental Health Trust Authority; which are used to
pilot new and innovative service approaches do not appear to include a process to evaluate the success of the pilot, the outcomes achieved and whether or not the pilot should become an ongoing part of the base budget. Without this type of routine mechanism, the sustainability and importance of these pilots is not routinely reviewed.
Cost Findings 1. Title III and Title V funding of grant programs is delineated by the Federal government and the
match is mandatory.

State of Alaska Department of Health and Social Services
ALASKA LONG TERM CARE AND COST STUDY
FINAL REPORT
Final Report Page 127
States receiving federal Older Americans Act (OAA) funds are required to develop a State Plan for Services, which must describe how the state will use the OAA funds. The Administration on Aging, within the federal Department of Health and Human Services, approves these Plans. The Alaska Commission on Aging State Plan for Services covers the period June 2004 to June 2006, and in September of 2005, the Administration on Aging approved extension of this Plan through June 13, 2008. Grant funding is allocated to regions in the state based on a funding formula contained within the State Plan. This funding method is applied to Title III services and Title V funds and the Senior Community Service Employment Program, also funded through the OAA. The Alaska Department of Labor administers the Senior Community Service Employment Program. In FY 2006, approximately $1.9 million in senior in-home services grants were awarded to approximately 11 grantees, $5 million in nutrition, transportation and supports (NTS) was awarded to approximately 37 grantees, and $900,000 in family care giving was awarded to 8 grantees. The funding formula used to distribute these funds was reviewed by PCG. The State Plan used information from the 2000 U.S. Census and updates from the Alaska Department of Labor to revise its funding method for the period 2003-2007. The method takes five factors into account: 1) the number of persons who are 60 years of age and greater; 2) minority status; 3) federal poverty level; 4) the number of frail elderly, defined as the number of persons over 80 years of age; and, 5) the number living in rural areas. Each of the five factors is weighted; for example, the “60+ population” factor is weighted by 12.50%. The percentage for each factor is multiplied by its weight, and these five products result in the assignment of dollars to census areas. For example, as shown in the table below, the Northwest census area had 1,802 persons over the age of 60, accounting for 3.46% of all persons in the state over the age of 60, so the Northwest region gets 7.1% of the grant funding, because: (12.5%*3.46%+12.5%*10.58%+25%*2.60%+25%*3.61%+25*15.28%) = 7.1%. The “Senior Program Data Report Presented February 8, 2004 to the Adult Commission on Aging” found that while Anchorage has 40% of the aged population in the state, the city receives 30% of the grant funds because of rural requirements in the grant distribution.

State of Alaska Department of Health and Social Services
ALASKA LONG TERM CARE AND COST STUDY
FINAL REPORT
Final Report Page 128
Table A-24: Funding Methodology for Title III & V Programs
2003-2007 Funding Method for Title III & V Programs 60+ pop Minority
200% Poverty
Frail (80+ pop) Rural
Total Allocation
% of Avail Funds
Available Funds $1,000,000 12.5% 12.5% 25% 25% 25% 99.8% 100%NORTHWEST
North Slope Borough 504 442 48 7,385 Northwest Arctic Borough 495 456 76 7,208
Nome Census Area 803 640 108 9,196 Total Northwest Population 1,802 1,538 676 232 23,789
% of Statewide 3.46% 10.58% 2.60% 3.61% 15.28% Total Northwest Allocation $4,322 $13,224 $6,511 $9,015 $38,197 $71,269 7.1%
INTERIORDenali Borough 120 31 8 1,893
Fairbanks North Star Borough 5,723 982 717 1,693 Yukon-Koyukuk Census Area 671 502 97 6,551
Southeast Fairbanks Census Area 602 115 53 6,174 Total Interior Population 7,116 1,630 3,503 875 16,311
% of Statewide 13.65% 11.21% 13.50% 13.60% 10.48% Total Interior Allocation $17,067 $14,015 $33,740 $33,999 $26,190 $125,011 12.5%
SOUTHWESTWade Hampton Census Area 506 476 35 7,028 Lake and Peninsula Borough 156 129 15 1,823
Bethel Census Area 1,086 1,050 174 16,006 Dillingham Census Area 414 338 59 4,922
Bristol Bay Borough 92 50 7 1,258 Aleutian Islands East Borough 151 133 8 2,697
Aleutian Islands West Census Area 235 208 18 5,465 Total Southwest Population 2,640 2,384 878 316 39,199
% of Statewide 5.07% 16.40% 3.38% 4.91% 25.18% Total Southwest Allocation $6,332 $20,498 $8,457 $12,279 $62,941 $110,506 11.1%
SOUTHEASTYakutat City and Borough 58 32 2 808
Skagway-Hoonah-Angoon Census Area 417 162 47 3,436 Haines City and Borough 342 53 47 2,392 Juneau City and Borough 2,746 636 422 0
Sitka City and Borough 1,058 384 176 8,835 Wrangell-Petersburg Census Area 913 207 136 6,684
Prince of Wales-Outer Ketchikan Census Area
602 290 33 6,146
Ketchikan Gateway Borough 1,516 371 275 14,070 Total Southeast Population 7,652 2,135 3,905 1,138 42,371
% of Statewide 14.68% 14.69% 15.04% 17.69% 27.21% Total Southeast Allocation $18,353 $18,357 $37,612 $44,218 $68,034 $186,574 18.7%
SOUTHCENTRALMatanuska-Susitna Borough 5,114 400 520 6,009
Kenai Peninsula Borough 5,285 564 542 8,157 Kodiak Island Borough 967 515 112 13,913
Valdez-Cordova Census Area 869 233 128 5,949 Total South central Population 12,235 1,712 6,131 1,302 34,028
% of Statewide 23.48% 11.78% 23.62% 20.24% 21.86% Total South central Allocation $29,345 $14,720 $59,052 $50,591 $54,638 $208,345 20.8%
ANCHORAGEAnchorage Municipality 20,672 5,139 10,863 2,571 0
% of Statewide 39.66% 35.35% 41.85% 39.96% 0.00% Total Anchorage Allocation $49,581 $44,186 $104,629 $99,899 $0 $298,295 29.8%
Total State Population 52,117 14,538 25,956 6,434 155,698 TOTAL STATE ALLOCATION $125,000 $125,000 $250,000 $250,000 $250,000 $1,000,000 100.0%

State of Alaska Department of Health and Social Services
ALASKA LONG TERM CARE AND COST STUDY
FINAL REPORT
Final Report Page 129
State staff members are understandably concerned about the comparability of rates for Medicaid services against those services paid for under the grants. Rates paid under a fee-for-service Medicaid program are not quite the same as rates paid as part of a contract. Grantees have a fixed amount to spend and allocate their resources across areas. The budgets of the grantees would need to be reviewed alongside the payment of transportation and other local services. Given the timeframes of the project and the lack of centralized data sources, PCG did not talk to grantees, review their budgeting, or collect data on the rates paid to vendors under the state’s grant programs; therefore, this report does not compare Medicaid rates to the rates paid under the grant program or make recommendations for adjusting rates. The state could issue a report comparing rates paid by each grantee for selected services and compare grantee costs. These collected costs should also be compared to the corresponding Medicaid rate for services in the grantees’ geographical region. The Role of Alaska’s Commissions and Boards The section below describes the Commissions and Boards that influence long term care policy and funding. The Alaska Mental Health Trust Authority operates under the direction of a Board of Trustees who are appointed by the Governor. The Trustees manage and administer trust funds to ensure a comprehensive integrated mental health program for Alaskans who experience mental illness, developmental disabilities, chronic alcoholism or Alzheimer’s disease and related dementia. The Trust coordinates with other state agencies regarding programs that improve the lives of its beneficiaries. The Trust annually submits a budget and proposed plan of implementation to the Governor and legislative Budget and Audit Committee. In addition, an annual report is submitted to the Legislature, Governor and the public. The Governor’s Council on Disabilities and Special Education serves a variety of federal and state roles, including the State Council on Developmental Disabilities; the Interagency Coordinating Council for Infants and Toddlers with Disabilities; the Special Education Advisory Panel; and the Governing Body of the Special Education Service Agency. In addition, the Council makes recommendations on funding needs for individuals with developmental disabilities and their families to the Alaska Mental Health Trust Authority and tracks legislation action that impacts the lives of families and individuals with disabilities. The Council receives funding from the DSDS which pays for the staff support for the Consumer Task Force for the Real Choices System Change grant. The Council does oversee the implementation of the federally-funded Medicaid Infrastructure Comprehensive Employment grant. The Council is working with a variety of stakeholders who are working to implement the following vision: Alaskans who experience disabilities are employed at a rate as close as possible to that of the general population. Over the next five years the grant has established eight specific goals for implementation. The Alaska Commission on Aging The mission of the Alaska Commission on Aging is to advocate for polices, programs and services that promote the dignity and independence of Alaska’s seniors. In conjunction with the Alaska DHSS, which was designated by the Governor as the new designated state unit on aging (SUA) in November 2003, the Commission develops a state plan for services with input from stakeholders and the public. The Plan includes an intra-state funding formula to allocate pass-thru

State of Alaska Department of Health and Social Services
ALASKA LONG TERM CARE AND COST STUDY
FINAL REPORT
Final Report Page 130
funds received from the U.S. Administration on Aging. The Commission also works closely with the other partner boards and the Alaska Mental Health Trust Authority for policy change and program development, providing funding recommendations to the Legislature, and collaborates on advocacy issues to address the Legislature and Alaska’s Congressional delegation. The Pioneer Homes Advisory Committee has eight Board members who are appointed by the Governor. The Chair serves as a member of the Alaska Commission on Aging. The Board’s function is to conduct annual inspections of property and procedures at the Alaska Pioneer Homes and to recommend changes and improvements to the Governor.
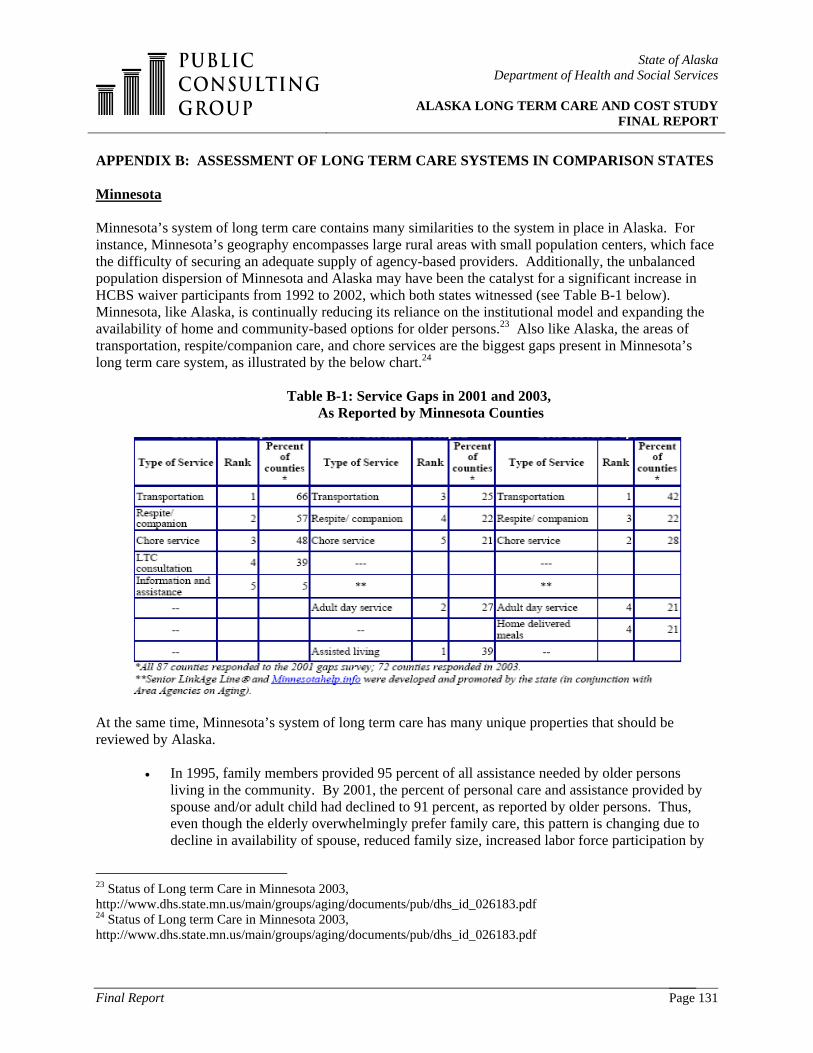
State of Alaska Department of Health and Social Services
ALASKA LONG TERM CARE AND COST STUDY
FINAL REPORT
Final Report Page 131
APPENDIX B: ASSESSMENT OF LONG TERM CARE SYSTEMS IN COMPARISON STATES Minnesota
Minnesota’s system of long term care contains many similarities to the system in place in Alaska. For instance, Minnesota’s geography encompasses large rural areas with small population centers, which face the difficulty of securing an adequate supply of agency-based providers. Additionally, the unbalanced population dispersion of Minnesota and Alaska may have been the catalyst for a significant increase in HCBS waiver participants from 1992 to 2002, which both states witnessed (see Table B-1 below). Minnesota, like Alaska, is continually reducing its reliance on the institutional model and expanding the availability of home and community-based options for older persons.23 Also like Alaska, the areas of transportation, respite/companion care, and chore services are the biggest gaps present in Minnesota’s long term care system, as illustrated by the below chart.24
Table B-1: Service Gaps in 2001 and 2003,
As Reported by Minnesota Counties
At the same time, Minnesota’s system of long term care has many unique properties that should be reviewed by Alaska.
• In 1995, family members provided 95 percent of all assistance needed by older persons living in the community. By 2001, the percent of personal care and assistance provided by spouse and/or adult child had declined to 91 percent, as reported by older persons. Thus, even though the elderly overwhelmingly prefer family care, this pattern is changing due to decline in availability of spouse, reduced family size, increased labor force participation by
23 Status of Long term Care in Minnesota 2003, http://www.dhs.state.mn.us/main/groups/aging/documents/pub/dhs_id_026183.pdf 24 Status of Long term Care in Minnesota 2003, http://www.dhs.state.mn.us/main/groups/aging/documents/pub/dhs_id_026183.pdf

State of Alaska Department of Health and Social Services
ALASKA LONG TERM CARE AND COST STUDY
FINAL REPORT
Final Report Page 132
women, and geographic mobility. There is a growing use of paid services to supplement what families do. For example, the proportion of older Minnesotans (and their caregivers) that purchased services available “for hire,” such as cleaning services, paid transportation, and personal care, increased dramatically over the years, from about 4 percent in 1988 to 20 percent in 2001. The lack of family members to provide assistance to older relatives is a growing issue in Greater Minnesota; because of many years of out-migration, the western and southwestern tiers of Minnesota counties have high proportions of older residents and few younger family members to provide help.25
• A framework of quality assurance for community-based, long term care was developed by a
work group in 2002. The framework included seven essential elements for QA: 1) accurate and timely consumer information about options in a variety of formats; 2) supports to help consumers and families use consumer-directed services; 3) building a community presence in local long term care services through volunteers, community integration, ongoing communication between community and provider, etc.; 4) continuous quality improvement, including regular use of consumer feedback; 5) consumers that understand their rights and have access to the means to exercise their rights; 6) consumer protection and access to complaint offices and ombudsman services; and 7) rules and regulations that are responsive to the consumer and to the special program integrity issues faced by home and community-based options. Additionally, Minnesota applied for and received a federal grant to improve quality assurance in its home and community-based waiver services.26
• Minnesota has developed Memory Care Facilities, a specialized type of assisted living
designed for persons with Alzheimer’s or other dementias, which provide all the services available in assisted living as well as additional safety and supervision services.27
• A new program to help families pay for eldercare has begun in parts of the United States, and
legislation was introduced in 2003 to establish a version of that program in Minnesota. This program provides personal loans of up to $50,000 for creditworthy family members to pay for long term care for their older relatives. The concept is said to be similar to the student loan program but for elders.28
• In order to bring these health care elements into a single system, Minnesota was the first state
in the country to develop a model to provide primary, acute, and the full range of long term care through a special federally approved demonstration program. Minnesota Senior Health Options (MSHO) delivers all needed Medicare and Medicaid benefits through an integrated care coordination model to a voluntarily enrolled group of older persons who are both Medicare and Medicaid eligible. Over 5,000 individuals in 10 Minnesota counties receive their care through a provider network they select, contracted through one of three
25 Status of Long term Care in Minnesota 2003, http://www.dhs.state.mn.us/main/groups/aging/documents/pub/dhs_id_026183.pdf 26 Status of Long term Care in Minnesota 2003, http://www.dhs.state.mn.us/main/groups/aging/documents/pub/dhs_id_026183.pdf 27 Status of Long term Care in Minnesota 2003, http://www.dhs.state.mn.us/main/groups/aging/documents/pub/dhs_id_026183.pdf 28 Status of Long term Care in Minnesota 2003, http://www.dhs.state.mn.us/main/groups/aging/documents/pub/dhs_id_026183.pdf

State of Alaska Department of Health and Social Services
ALASKA LONG TERM CARE AND COST STUDY
FINAL REPORT
Final Report Page 133
participating health plans. While enrollees live both in nursing homes and community settings, capitation payments are adjusted in order to keep individuals in the community as long as possible.29
• The below table indicates that Minnesota allocated their MR/DD HCBS waiver funding
differently than Alaska did in 2002. Minnesota spent less (at approximately $50,000 per participant) than Alaska (at approximately $60,000 per participant). Additionally, HCBS waiver spending per participant increased in Alaska between 2000 and 2002, yet decreased in Minnesota between those same years.
Table B-2: Minnesota’s MR/DD HCBS Waivers
Source: Braddock, D., Hemp, R., Parish, S., & Westrich, J. (2005). The state of the states in developmental disabilities, 2005. Washington, DC: American Association on Mental Retardation.
• In 2003, the Minnesota Legislature called for the Department of Human Services to complete a study of non-government resources for long term care, to look at the feasibility of various options that might be available to help non-Medicaid eligible individuals and families use their own resources to pay for needed services. The study uncovered the following resources: i) health insurance options, especially the inclusion of long term care in Medicare supplemental plans; ii) long term care insurance options, including incentives to purchase LTCI and expansion of both individual and group-based LTCI products; iii) life insurance annuities and combined life and LTCI products; iv) reverse mortgage products and other options that make use of home equity; v) universal long term care tax/savings plans; vi) personal savings and pensions; and vii) family care, including incentives for families to directly provide services or pay for services through special loans. Alaska may be able to research some or all of these options as new strategies for assisting the non-Medicaid eligible to receive needed services.
29 Status of Long term Care in Minnesota 2003, http://www.dhs.state.mn.us/main/groups/aging/documents/pub/dhs_id_026183.pdf

State of Alaska Department of Health and Social Services
ALASKA LONG TERM CARE AND COST STUDY
FINAL REPORT
Final Report Page 134
• Minnesota has a comprehensive single entry point for accessing long term care that serves a broad population of older persons and persons with disabilities. This implication is especially important for Alaska’s present, fragmented system.
Expenditure and Reimbursement Analysis The following table compares the expenditures of long term care services that are currently provided in Minnesota and Alaska. Alaska’s expenditures on nursing home services includes approximately $45 million in expenditures for residential psychiatric treatment centers; if these expenditures were excluded, the per capita expenses reported for Alaska for nursing facilities in each of the comparisons shown in Appendix B would be lower. However, comparison states might also include different types of medical institutions in their reported CMS 64 nursing facility expenditures. Therefore, in this comparison of states, all reported nursing facility expenditures are included to ensure comparability of data.
Table B-3: LTC Expenditures, Minnesota and Alaska
Nursing Home Services $107,091,559 $163.50 $904,205,889 $177.30ICF-MR Total (C+D)* $0 $0.00 $180,916,065 $35.47ICF-MR Public $0 $0.00 $12,876,312 $2.52ICF-MR Private $0 $0.00 $168,039,753 $32.95Personal Care $69,817,279 $106.59 $203,181,578 $39.84HCBS Waivers-Total (G+H) $105,206,504 $160.62 $1,097,327,435 $215.16HCBS Waivers-MR/DD $56,880,732 $86.84 $811,967,693 $159.21HCBS Waivers-A/D $40,394,774 $61.67 $230,961,282 $45.29Home Health $639,796 $0.98 $72,638,352 $14.24Total Home Care $175,663,579 $268.19 $1,373,147,365 $269.24Total Long-term Care (A+B+J) $282,755,138 $431.69 $2,458,269,319 $482.01P.A.C.E. $0 $0.00 $0 $0.00
Alaska Minnesota
FY 2004 Medicaid Expenditures
FY 2004 Per Capita
FY 2004 Medicaid Expenditures
FY 2004 Per Capita
*ICF/MR expenditures refer to Intermediate Care Facilities that only serve people with mental retardation or other developmental disabilities. Source: CMS / MEDSTAT Data. When comparing the cost of LTC services that are offered in Minnesota to those offered in Alaska, PCG found that:
• the difference in nursing home expenditures on a per capita basis is approximately 8.5% ($163.50 versus $177.30); • ICF/MR expenditures in Minnesota were in excess of $180 million, versus $0 for Alaska; • Personal Care services in Minnesota are much less expensive when compared to similar
services in Alaska ($106.59 versus $39.84); • Minnesota’s waiver services are more expensive than similar services in Alaska ($215.16
versus $160.62); • Minnesota utilizes Home Health Care services substantially more than Alaska ($72.6 million
versus $639,796); • Minnesota spends approximately 12% more on total long term care services than Alaska
($482.01 versus $431.69); and,

State of Alaska Department of Health and Social Services
ALASKA LONG TERM CARE AND COST STUDY
FINAL REPORT
Final Report Page 135
• In FY 2004, neither Minnesota nor Alaska reported any PACE expenditures.
Table B- 4: Minnesota’s LTC Reimbursement Methodologies
Prospective PaymentsDistinguishes Between State Owned and Non State OwnedEstablish Geographic GroupsCase MixUsed Geographic Regions Until July 1 1999Limits on Admin Expense Depending on Facility Size
Intermediate Care Facilities for the Mentally Retarded
Avg payment rate: $220.93
The total payment rate, less property, is increased by a percentage established by the legislature, on an annual basis, property payment rate is not adjusted - the last time the property rate was adjusted was 10/1/2000, when a minimum floor was establish
Board and Care FY05 Statewide avg rate = $137.67
Operating per diems are increased by legislationProperty per diems are increased by inflation for APS and cost-based for Rule 50Other per diems are NOT increased for APS and cost-based for Rule 50
Home Care 16,750 $9,800 Annually per Recepient State set
Alterantive Care Varies Some state set, most county negotiated
Elderly Waiver 17,467 Avg daily payment rate: $30.26 Some state set, most county negotiated
Community Alternatives for Individuals with Disabilities 10,023 Avg daily payment
rate: $53.90 Some state set, most county negotiated
Waiver for persons with Mental Retardation or Related Conditions
MR/RC Waiver (DD Waiver)15,090 Avg daily payment
rate: $154.53 Some state set, most county negotiated
Community Alternative Care 236 Avg daily payment rate: $425.04 Some state set, most county negotiated
Traumatic Brain Injury Waiver 1,308 Avg daily payment rate: $159.96 Some state set, most county negotiated
Reimbursement Methodology
Skilled Nursing Facilities FY05 Statewide avg rate = $137.67
ServicesPopulation
Served Expenditure
The table above provides several conclusions. Minnesota sets rates and reimburses nursing facilities utilizing a prospective system similar to that of Alaska; however, Minnesota also uses geographic grouping to adjust costs. This is a methodology that Alaska should consider. Also, Minnesota serves a far greater population through its waiver programs when compared to Alaska. For example, Minnesota serves 15,000 people through its DD waiver vs. 1,000 people served for the DD waiver in Alaska. In addition, Minnesota’s traumatic brain injury (TBI) program is based on a state/county negotiated rate. Finally, the majority of waiver services in Minnesota are county-negotiated, while Alaska has a statewide single rate for most services.
Michigan The following chart illustrates selected information from Michigan’s response to PCG’s questionnaire on the state’s system of long term care. Provided is an overview of the programs and services that are currently existing in Michigan’s system of long term care.

State of Alaska Department of Health and Social Services
ALASKA LONG TERM CARE AND COST STUDY
FINAL REPORT
Final Report Page 136
Table B-5: Michigan’s Current System of Long Term Care (As of December 2005)
Name of LTC Program
Description of Program/Services
Populations served by this program
Identified problems, issues, or service gaps
Current / proposed initiatives designed
to control costs Habilitation Supports Waiver (HSW), a 1915(c) Waiver
HCBS to support individuals with DD who would otherwise require ICF/MR level of care.
DD; all ages covered but must be Medicaid eligible.
Increasing demand for individualized housing and employment.
None.
Home Help (personal care)
Personal care to those with identified deficits in activities of daily living.
DD, Physical Disabilities, Aging.
Service not covered for those w/ cognitive deficits or outside patient's home.
None.
MiChoice program (HCBS Waiver)
Community-based services to divert individuals from entering nursing homes.
DD, Physical Disabilities, Aging.
Missing 24 hour patient care.
None.
Nursing Facilities Skilled/Basic care. Aging; must meet criteria for Medicaid reimbursement.
None. Transition from NF to community; NH LOC determination req’d.
PACE (Program of All-Inclusive Care for the Elderly)
Community-based and residential care for the elderly (55+).
Physical Disabilities and Aging are covered; DD is not.
Program currently limited to persons residing in Wayne County.
None.
Private Duty Nursing
Care for beneficiaries under age 21 requiring continuous nursing care.
DD and Physical Disabilities covered; Aging is not.
More available providers needed.
None.
Traumatic Brain Injury
Intensive rehab services (in/out-patient) with prior approval; does not cover residential services.
DD, Physical Disabilities, Aging; limited to 18+.
Does not cover individuals with cognitive deficits. Limited # of services.
Considering a HCBS Waiver to expand covered services and population.
Ventilator Dependent Care
Ventilator dependent care in a NF setting.
DD, Physical Disabilities, Aging.
None. None.
Similar to Alaska, Michigan’s system of care includes a Health and Community-Based Services (HCBS) waiver for personal care services for the DD population, the physically disabled, and the aging; does not allow for access to mental health and/or substance abuse services through the programs listed above, which was noted as a growing problem by both states; is transitioning as many individuals as possible from nursing facilities to community settings through waiver services, in order to cut costs and promote the further utilization of community-based care; and is trying to manage the problems of: i) not allowing for care coverage on a 24-hour basis in consumers’ homes, so that respite care cannot be provided while a caretaker sleeps or goes to work; and ii) not having enough providers in the state to successfully maintain a fully-covered level of care. However, Michigan’s programs and services for these populations are distinct from those present in Alaska because:
• Michigan has implemented two programs that Alaska lacks but badly needs: a Traumatic Brain Injury (TBI) program for adults and the Program for All-Inclusive Care for the Elderly (PACE). Michigan’s Medicaid-funded Traumatic Brain Injury (TBI) program for adults provides inpatient and outpatient intensive rehabilitation services to those needing specialized services. This program has been successful in Michigan, enough so that the state is considering an application for a home and community-based waiver to expand the covered services and populations of this program. Michigan’s Program for All-Inclusive Care for the Elderly (PACE) provides community-based residential care to the physically disabled, aging

State of Alaska Department of Health and Social Services
ALASKA LONG TERM CARE AND COST STUDY
FINAL REPORT
Final Report Page 137
population. PACE is particularly important for Alaska to note because it allows for access to MH/SA services, which is not the case for most of the state’s current programs.
• The table below illustrates that for the past few years, HCBS waiver spending per participant
has been increasing in Alaska (from $50,000 in 2000 to $60,000 in 2002), yet decreasing in Michigan (from $60,000 in 2000 to $42,000 in 2002).
Table B-6: Michigan’s MR/DD HCBS Waivers
Source: Braddock, D., Hemp, R., Parish, S., & Westrich, J. (2005). The state of the states in developmental disabilities, 2005. Washington, DC: American Association on Mental Retardation.
• Michigan has a self-assessment tool that can be accessed via the Internet to help individuals
and family caregivers identify service needs and potential services to fill those needs. This tool may help Alaska because of the geographic dispersion of its residents.
• As of 2002, Michigan was operating a greater proportion of for-profit nursing homes (50-
70%) than Alaska (less than 50%)30 Expenditure and Reimbursement Analysis The following table compares the expenditures of long term care services that are currently provided by Michigan and Alaska.
30 Gregory, Steven R. and Mary Jo Gibson for AARP. Across the States 2002: Profiles of Long term Care.

State of Alaska Department of Health and Social Services
ALASKA LONG TERM CARE AND COST STUDY
FINAL REPORT
Final Report Page 138
Table B-7: LTC Expenditures, Michigan and Alaska
Nursing Home Services $107,091,559 $163.50 $1,704,056,909 $168.52ICF-MR Total (C+D)* $0 $0.00 $19,101,363 $1.89ICF-MR Public $0 $0.00 $19,101,363 $1.89ICF-MR Private $0 $0.00 $0 $0.00Personal Care $69,817,279 $106.59 $212,089,379 $20.97HCBS Waivers-Total (G+H) $105,206,504 $160.62 $448,173,666 $44.32HCBS Waivers-MR/DD $56,880,732 $86.84 $384,952,089 $38.07HCBS Waivers-A/D (OA+APD) $40,394,774 $61.67 $63,221,577 $6.25Home Health $639,796 $0.98 $17,449,167 $1.73Total Home Care (E+F+I) $175,663,579 $268.19 $677,712,212 $67.02Total Long-term Care (A+B+J) $282,755,138 $431.69 $2,400,870,484 $237.43P.A.C.E. $0 $0.00 $1,680,014 $0.17
Alaska Michigan
FY 2004 Medicaid Expenditures
FY 2004 Per Capita
FY 2004 Medicaid Expenditures
FY 2004 Per Capita
*ICF/MR expenditures refer to Intermediate Care Facilities that only serve people with mental retardation or other developmental disabilities. Source: CMS / MEDSTAT Data When comparing the expenditures for long term care services in these two states, we found that:
• the difference in nursing home expenditures on a per capita basis is approximately 3.0% ($163.50 versus $168.52);
• ICF/MR expenditures in Michigan were in excess of $19M versus $0 for Alaska; • Personal Care services in Michigan are much less expensive when compared to similar
services in Alaska ($106.59 versus $20.97); • Michigan’s waiver services are less expensive than similar services in Alaska ($44.32 versus
$160.62); • Michigan utilizes Home Health Care services substantially more than Alaska ($17 million
versus $639,796); and • Michigan spends approximately 44% less on total long term care services than Alaska
($237.43 versus $431.69). Table B-8 presents the actual expenses as reported by state staff in Michigan with regard to per diem costs of programs and the rate setting methods used to support those services.

State of Alaska Department of Health and Social Services
ALASKA LONG TERM CARE AND COST STUDY
FINAL REPORT
Final Report Page 139
Table B-8: Michigan’s LTC Reimbursement Methodologies
Name of Long Term Care Program
Per Diem Cost Rate Setting Methodologies Used
Habilitation Supports Waiver (HSW), a 1915(c) Waiver
Payments vary by region, age and gender of enrollee.
Prospective capitation payment based on historical costs.
Home Help (personal care) Most less than $35/day, may be more; depends on patient's need
Rates set by individual counties.
MiChoice program (HCBS Waiver) $38.00/day in services, $9.37day in admin costs Based on historical costs for patient population
Nursing Facilities Average NF per diem rate is $107.77 Prospective payment system.PACE (Program of All-Inclusive Care for the Elderly)
Medicaid eligible $3,832/mth; Medicare & Medicaid eligible $2,450/mth; Medicare makes separate monthly capitation payment.
Prospective capitation payment based on historical costs.
Private Duty Nursing Not Available Fee for service fee screens.Traumatic Brain Injury Up to $283/day, depending on patient’s needs. Negotiated rates
Ventilator Dependent Care Individual rates by provider (range $343 - $452/day)
Negotiated rates
The table above provides a few conclusions. Michigan sets rates and reimburses nursing facilities utilizing a prospective system similar to that of Alaska. Also, spending for waiver programs in Michigan is set based on historical costs. Lastly, Michigan’s traumatic brain injury (TBI) program is based on a negotiated rate. New Mexico New Mexico’s system of long term care is very similar to that of Alaska for several reasons. New Mexico has received #3 ranking in the United States of highest percentage of Minority / Ethnic residents, while Alaska received a #6 ranking. In addition, New Mexico’s 19 Pueblos, 2 Apache tribes, and the Navajo Nation can be described as rural and predominantly isolated from urban areas. This isolation impacts the tribes’ abilities to access services as well as the resources available for their elderly populations. This situation mirrors the geographic challenges faced by Alaska tribes in accessing long term care services. With regard to HCBS waiver services, both states have seen a dramatic increase in the number of participants in the past decade, and both spend a similar amount per participant on HCBS waiver services (please reference Table B-9 below).

State of Alaska Department of Health and Social Services
ALASKA LONG TERM CARE AND COST STUDY
FINAL REPORT
Final Report Page 140
Table B-9: New Mexico’s MR/DD HCBS Waivers
Source: Braddock, D., Hemp, R., Parish, S., & Westrich, J. (2005). The state of the states in developmental disabilities, 2005. Washington, DC: American Association on Mental Retardation.
New Mexico’s present system of long term care is unique from Alaska’s, however, because New Mexico relies less heavily on Medicaid to pay for its residents’ utilization of nursing facilities. In 2001, New Mexico allowed for 69.4% of its nursing facility costs to be paid by Medicaid, while Alaska allowed for 83.9% to be covered by Medicaid (see Table B-10 below). This means that while New Mexico allowed for 22.1% of total costs to be paid through out-of-pocket spending, private spending, or other spending, Alaska only allowed 8.3% of these costs to be paid through these resources.
Table B-10: Nursing Facility Residents by Primary Payer Source, 200131
Additionally, as of 2002, the State of New Mexico was operating a greater proportion of for-profit nursing homes (at 50-70%) than Alaska was (at less than 50%).32
31 Gregory, Steven R. and Mary Jo Gibson for AARP. Across the States 2002: Profiles of Long term Care. 32 Gregory, Steven R. and Mary Jo Gibson for AARP. Across the States 2002: Profiles of Long term Care.

State of Alaska Department of Health and Social Services
ALASKA LONG TERM CARE AND COST STUDY
FINAL REPORT
Final Report Page 141
Expenditure and Reimbursement Analysis The following table compares the expenditures of long term care services that are currently provided by New Mexico and Alaska:
Table B-11: LTC Expenditures, New Mexico and Alaska
Nursing Home Services $107,091,559 $163.50 $179,818,250 $94.49ICF-MR Total (C+D)* $0 $0.00 $22,940,983 $12.06ICF-MR Public $0 $0.00 $0 $0.00ICF-MR Private $0 $0.00 $22,940,983 $12.06Personal Care $69,817,279 $106.59 $178,003,798 $93.54HCBS Waivers-Total (G+H) $105,206,504 $160.62 $244,022,187 $128.23HCBS Waivers-MR/DD $56,880,732 $86.84 $200,875,481 $105.56HCBS Waivers-A/D (OA+APD) $40,394,774 $61.67 $42,858,938 $22.52Home Health $639,796 $0.98 $436,468 $0.23Total Home Care (E+F+I) $175,663,579 $268.19 $422,462,453 $222.00Total Long-term Care (A+B+J) $282,755,138 $431.69 $625,221,686 $328.55P.A.C.E. $0 $0.00 $140,563 $0.07
Alaska New Mexico
FY 2004 Medicaid Expenditures
FY 2004 Per Capita
FY 2004 Medicaid Expenditures
FY 2004 Per Capita
*ICF/MR expenditures refer to Intermediate Care Facilities that only serve people with mental retardation or other developmental disabilities. Source: CMS / MEDSTAT data
When comparing the long term care services offered in New Mexico with those offered in Alaska, we found that:
• nursing home expenditures in New Mexico, on a per capita basis, are 42% lower than similar services in Alaska ($94.5 versus $163.5);
• ICF/MR expenditures in New Mexico were in excess of $22 million versus $0 in Alaska; • Personal Care services in New Mexico are less expensive when compared to similar services
in Alaska ($106.59 versus $93.54); • New Mexico’s waiver services are cost less per capita than similar services in Alaska
($128.23 versus $160.62); • New Mexico utilizes fewer Home Health Care services ($436,468 versus $639,796); and • New Mexico spends approximately 24% less on total long term care services than Alaska per
capita ($328.55 versus $431.69). This may be attributable to the fact that New Mexico has greatly expanded the use of Non-Medicaid spending, including out-of-pocket and private spending, to supplement the LTC system.

State of Alaska Department of Health and Social Services
ALASKA LONG TERM CARE AND COST STUDY
FINAL REPORT
Final Report Page 142
Maine
Similar to Alaska, the State of Maine has a system of long term care in place that:
• Reports an annual spending on nursing facilities that has trended down over the past several years and concurrently reports a significant expansion in Medicaid-funded home care services, resulting in an increase in total long term care expenditures.33
• Includes specialized residential placements, such as assisted living or community-based
services, such as adult day care for persons with complex physical or cognitive conditions, which are available only on a limited basis.34
• Expects an increase in the demand for services that is particularly alarming when contrasted
to the shrinking pool of working-aged people available to provide care. Although future birth rates and in-migration are difficult to predict, forecasters estimate that Maine will have 9,000 fewer citizens between the ages of 20 and 44 in 2035 than it had in 1995. The trend in that direction has already begun, and, if it continues as expected, the labor shortage promises to be among the most significant barriers to providing long term care in the future. This is a similar situation that is facing Alaska’s system of long term care.
• Nationally, 25% of all elders reside in rural areas.35 However, in Alaska and Maine, this
figure is much higher—over 35% in Alaska and 50% in Maine.36 Elders in rural areas are likely to have more health care needs, nutritional risk, and higher incidence of chronic health conditions. Service use in the rural communities is often hampered by geographic inaccessibility, lack of transportation, limited service availability, and the inability on the part of older adults to pay for needed care; in short, elders who reside in rural areas have poorer access to care, poorer health status, and require greater levels of care compared to their urban counterparts.37
• As Table B-12 illustrates, that there has been a dramatic increase in HCBS waiver participants in both Maine and Alaska since 1992, which follows the national trend in this area of care as well.
33 Long Term Care in Maine: A Progress Report. State of Maine, 119th Legislature, Second Regular Session, Joint Standing Committee on Health and Human Services, January 2000. 34 Long Term Care in Maine: A Progress Report. State of Maine, 119th Legislature, Second Regular Session, Joint Standing Committee on Health and Human Services, January 2000. 35 Kinsella, K., and V. Velkoff. U.S. Census Bureau, Series P95/01-1. An Aging World: 2001. Washington: U.S. Government Printing Office, 2001. 36 Coalition for a Maine Aging Initiative. Getting Old in Maine: A Coalition for a Maine Aging Initiative Policy Report. Coalition for a Maine Aging Initiative, 2001. 37 Porell, F., and H. Miltiades. (2002). “Regional Differences in Functional Status Among the Aged.” Social Science and Medicine. 54 (2002): 1181-98.

State of Alaska Department of Health and Social Services
ALASKA LONG TERM CARE AND COST STUDY
FINAL REPORT
Final Report Page 143
Table B-12: Maine’s MR/DD HCBS Waivers
Source: Braddock, D., Hemp, R., Parish, S., & Westrich, J. (2005). The state of the states in developmental disabilities, 2005. Washington, DC: American Association on Mental Retardation.
Maine also has unique system of care properties that may influence Alaska’s system, including:
• A higher level of Medicaid spending per participant with regard to HCBS MR/DD Waivers than Alaska, as depicted in Table B-12 above.
• Maine has employed the following strategies to improve its residents’ access to home and
community-based services. These strategies are particularly important given Maine’s exceptionally high rural and aged population. Given Alaska’s similar demography and geography, these strategies could have some influence on Alaska’s system of care.
o Provision of information via the Internet; o Collaboration with advocacy/consumer organizations to disseminate information about
HCBS; o Creation of a toll-free information hot-line to respond to inquiries about HCBS and to
provide information on how to access HCBS; o Establishment of a visible point or points of entry to HCBS; and o Release of Public Service Announcements pertaining to HCBS.
• An automated system in Maine, called MECARE, collects and tracks consumer assessment
information. All of this information undergoes a measurement to determine the quality of services. The Quality Review Committee advises the Elder Independence of Maine and the Regional Quality Assurance Committees, which meet quarterly to review cases and to discuss system issues. Additional quality assurance activities include: consumer surveys; record reviews; staff training requirements; licensing standards; provider audits; mandatory reporting of abuse, neglect, or exploitation; appeals; financial audits; and data analysis. This automated system of assessment collection is something that Alaska should consider for their system of long term care; in addition, the quality assurance methods that have been developed in Maine may provide a successful QA plan for Alaska.
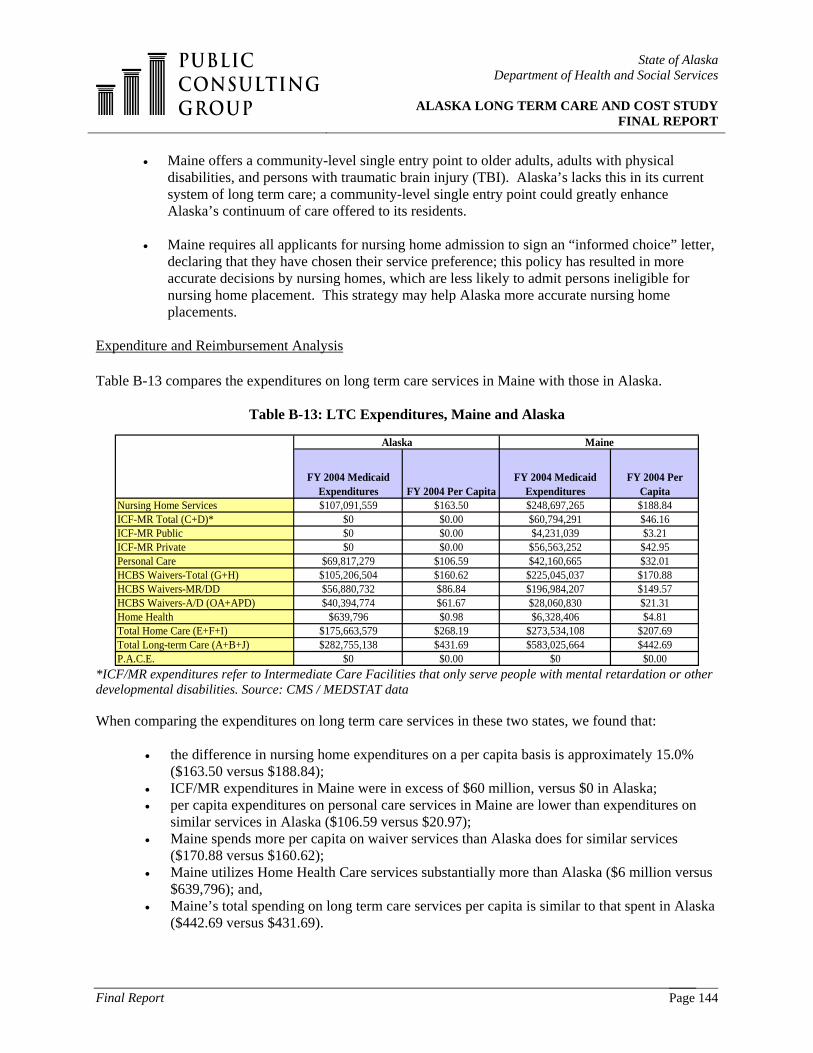
State of Alaska Department of Health and Social Services
ALASKA LONG TERM CARE AND COST STUDY
FINAL REPORT
Final Report Page 144
• Maine offers a community-level single entry point to older adults, adults with physical disabilities, and persons with traumatic brain injury (TBI). Alaska’s lacks this in its current system of long term care; a community-level single entry point could greatly enhance Alaska’s continuum of care offered to its residents.
• Maine requires all applicants for nursing home admission to sign an “informed choice” letter, declaring that they have chosen their service preference; this policy has resulted in more accurate decisions by nursing homes, which are less likely to admit persons ineligible for nursing home placement. This strategy may help Alaska more accurate nursing home placements.
Expenditure and Reimbursement Analysis Table B-13 compares the expenditures on long term care services in Maine with those in Alaska.
Table B-13: LTC Expenditures, Maine and Alaska
Nursing Home Services $107,091,559 $163.50 $248,697,265 $188.84ICF-MR Total (C+D)* $0 $0.00 $60,794,291 $46.16ICF-MR Public $0 $0.00 $4,231,039 $3.21ICF-MR Private $0 $0.00 $56,563,252 $42.95Personal Care $69,817,279 $106.59 $42,160,665 $32.01HCBS Waivers-Total (G+H) $105,206,504 $160.62 $225,045,037 $170.88HCBS Waivers-MR/DD $56,880,732 $86.84 $196,984,207 $149.57HCBS Waivers-A/D (OA+APD) $40,394,774 $61.67 $28,060,830 $21.31Home Health $639,796 $0.98 $6,328,406 $4.81Total Home Care (E+F+I) $175,663,579 $268.19 $273,534,108 $207.69Total Long-term Care (A+B+J) $282,755,138 $431.69 $583,025,664 $442.69P.A.C.E. $0 $0.00 $0 $0.00
Alaska Maine
FY 2004 Medicaid Expenditures FY 2004 Per Capita
FY 2004 Medicaid Expenditures
FY 2004 Per Capita
*ICF/MR expenditures refer to Intermediate Care Facilities that only serve people with mental retardation or other developmental disabilities. Source: CMS / MEDSTAT data When comparing the expenditures on long term care services in these two states, we found that:
• the difference in nursing home expenditures on a per capita basis is approximately 15.0% ($163.50 versus $188.84);
• ICF/MR expenditures in Maine were in excess of $60 million, versus $0 in Alaska; • per capita expenditures on personal care services in Maine are lower than expenditures on
similar services in Alaska ($106.59 versus $20.97); • Maine spends more per capita on waiver services than Alaska does for similar services
($170.88 versus $160.62); • Maine utilizes Home Health Care services substantially more than Alaska ($6 million versus
$639,796); and, • Maine’s total spending on long term care services per capita is similar to that spent in Alaska
($442.69 versus $431.69).

State of Alaska Department of Health and Social Services
ALASKA LONG TERM CARE AND COST STUDY
FINAL REPORT
Final Report Page 145
Vermont The following table illustrates the current system of long term care present in the State of Vermont. Information depicted in this table reflects Vermont’s response to PCG’s questionnaire on long term care programs and services.
Table B-14: Vermont’s Current System of Long Term Care (As of December 2005)
Name of LTC
Program Description of Services Populations Served
Problems, issues, or service gaps within this program
Current / proposed initiatives designed to control costs
Participant-Directed Attendant Care
Assistance with ADLs and IADLs
Aging / Disabled 18+
Limited funding; availability of paid caregivers
Attendant Services Assistance with ADLs and IADLs
Aging / Disabled 18+
Limited funding; availability of paid caregivers
Waiting List
Adult Day Services Aging / Disabled 18+
Limited funding; transportation; geographical distribution
Funding formula, by region
Day Health Rehabilitation Services
Adult Day Aging / Disabled 18+
Transportation; geographical distribution; Medicaid eligibility
Choices for Care 1115 Medicaid Waiver
Comprehensive LTC program - includes NF and HCBS
Aging / disabled 18+
Limited funding; LTC Medicaid eligibility; availability of paid caregivers
Inherent design of 1115; consumer and surrogate direction; working on monthly rates/ cash and counseling
Developmental Services 1915c Medicaid Waiver
Developmental Disabilities
Limited funding Prioritize access; waiting list
Flexible Family Funds DD Limited funding Waiting list
Traumatic Brain Injury 1915c Waiver
Rehabilitation and LTC TBI Limited funding Prioritize access
Children's Personal Care Services
Assistance with ADLs and IADLs
Children with Disabilities (under 21)
Availability of paid caregivers
Similarities that are present in both the Alaska and Vermont system of long term care include the following: a waiting list for services exists for residents with DD; both struggle (and will increasingly struggle in the future) to find and maintain the presence of quality, experienced caregivers for the residents requiring services in the long term care system; both states have transportation issues within their long term systems of care. Getting adults with physical disabilities, adults with developmental disabilities, and the elderly to and from appointments with service providers throughout a rural state is a challenge that each state must handle on a daily basis; and, like Maine and Alaska, Vermont manages geographic distribution issues within their long term care system. In 2000, Vermont ranked 1st in the nation for its population of residents over the age of 65 living in rural areas; in comparison, Alaska was ranked 19th.38 These statistics are important when looking at the states’ access to care complications and transportation issues (as noted above).
38 Gregory, Steven R. and Mary Jo Gibson for AARP. Across the States 2002: Profiles of Long term Care.

State of Alaska Department of Health and Social Services
ALASKA LONG TERM CARE AND COST STUDY
FINAL REPORT
Final Report Page 146
However, there are also significant differences in the care systems of Alaska and Vermont:
• Vermont’s demography is distinctly different than Alaska’s: as of 2000, Vermont’s ethnic and minority population over the age of 65 only made up 1.6% of its total population. In comparison, the ethnic and minority population in Alaska was 26.9% of its total population.39 Alaska’s heightened percentage of ethnic and minority residents brings additional cultural challenges into its system of long term care.
• There are Traumatic Brain Injury (TBI)-specific services present through a waiver in Vermont, which are not available in Alaska, as there is no TBI waiver. In 1991, the Vermont Department of Aging and Disabilities and the Vermont Department of Social Welfare began the operation of a three-year pilot project offering community-based rehabilitative services to the TBI population. The goal of this program was to divert individuals from placement in institutional settings and/or to return Vermonters with a moderate-to-severe traumatic brain injury from out-of-state facilities. Prior to the development of this service, individuals were placed in expensive out-of-state facilities, and often stayed there for years with little hope of returning to their home communities. The project demonstrated that individuals with a moderate-to-severe traumatic brain injury were appropriately served in community placements. Effective October 1, l994, this community-based program, serving individuals 16 years of age and older, was approved and financed as a Medicaid Waiver Program (TBI waiver) under the administration of the Vermont Division of Vocational Rehabilitation. It was renewed by the state in October of 1997 and October of 2002. Through collaboration with the Vermont Division of Mental Health, a long term option for individuals requiring ongoing intensive one-to-one support has also been added to this program.
• Vermont operates a Senior Companion Program. Senior Companions provide supportive services to home-bound frail adults, especially those who need companionship for themselves or respite for their caregivers. Volunteers over the age of 60 provide this service. Besides companionship and respite, some Senior Companions provide assistance with common chores, such as preparing a meal or simple personal care. Alaska operates a small Senior Companion Program funded by OAA that is not available in many rural communities. This was repeatedly brought up as a requested service in our interviews with Alaska stakeholders.
• Vermont also operates a Dementia Respite Program. The Vermont Department of Aging and Independent Living awarded a grant to the state’s five Area Agencies on Aging to administer a program that makes respite funds available to families that provide care to an elderly family member with Dementia. This program is able to provide a limited amount of funding to caregivers of a person diagnosed with progressive Dementia. This funding is available to caregivers on a yearly basis to provide respite services as defined by each family. As with the Senior Companion Program, this service was repeatedly mentioned as a needed service in Alaska by stakeholders that were interviewed as part of this study.
• Overall, less is spent annually on HCBS waiver services per participant in Vermont than in
Alaska (see Table B-15 below). Annual Medicaid spending on HCBS waiver services has
39 Gregory, Steven R. and Mary Jo Gibson for AARP. Across the States 2002: Profiles of Long term Care.

State of Alaska Department of Health and Social Services
ALASKA LONG TERM CARE AND COST STUDY
FINAL REPORT
Final Report Page 147
increased in Alaska since 2000 (from $50,000 per participant to $60,000 per participant), but has remained static in Vermont (at $40,000 per participant).
Table B-15: Vermont’s MR/DD HCBS Waivers
Source: Braddock, D., Hemp, R., Parish, S., & Westrich, J. (2005). The state of the states in developmental disabilities, 2005. Washington, DC: American Association on Mental Retardation.
• Vermont relies less heavily on Medicaid to pay for the use of its nursing facilities. As shown in Table B-16 below, Vermont allowed for 67.6% of its nursing facility costs to be covered by Medicaid in 2001, while Alaska allowed for 83.9% to be covered by Medicaid. This means that while Vermont allowed for 22% of the costs to be paid by out-of-pocket spending, private insurance, or other spending, Alaska only allowed 8.3% of costs to be paid by these resources.
Table B-16: Nursing Facility Residents by Primary Payer Source, 200140
Expenditure and Reimbursement Analysis Table B-17 illustrates a comparison of the expenditures on long term care services in Vermont with those in Alaska.
40 Gregory, Steven R. and Mary Jo Gibson for AARP. Across the States 2002: Profiles of Long term Care.
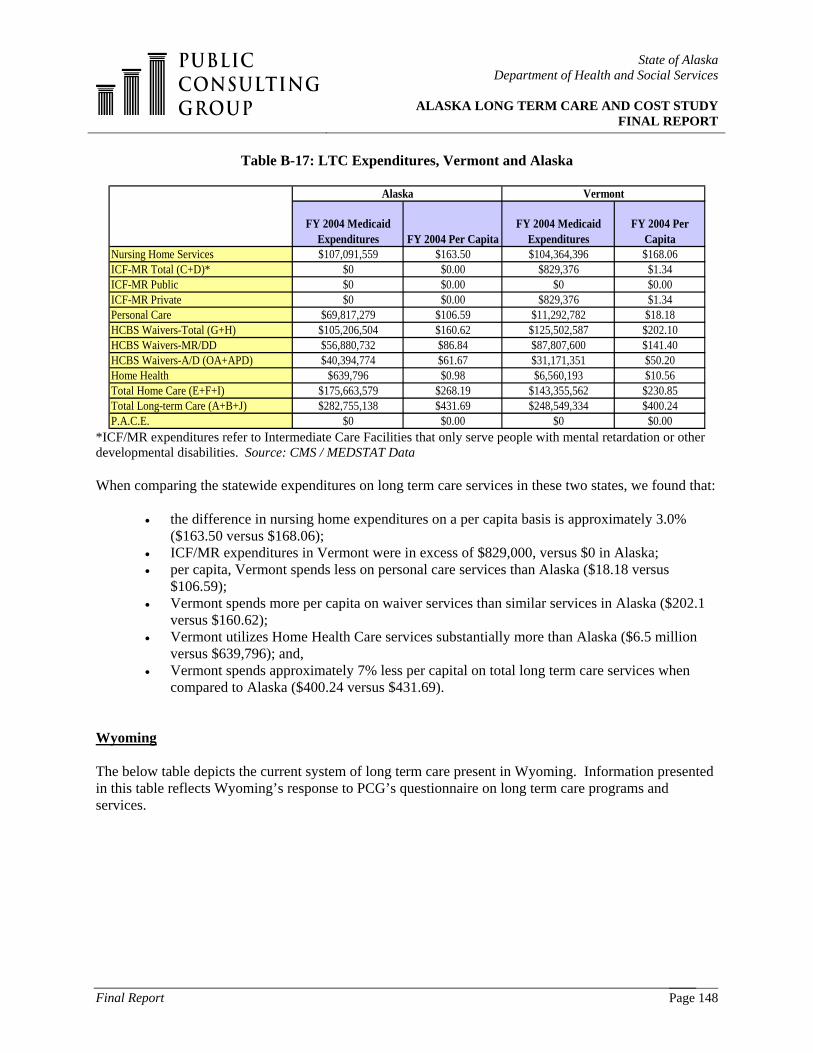
State of Alaska Department of Health and Social Services
ALASKA LONG TERM CARE AND COST STUDY
FINAL REPORT
Final Report Page 148
Table B-17: LTC Expenditures, Vermont and Alaska
Nursing Home Services $107,091,559 $163.50 $104,364,396 $168.06ICF-MR Total (C+D)* $0 $0.00 $829,376 $1.34ICF-MR Public $0 $0.00 $0 $0.00ICF-MR Private $0 $0.00 $829,376 $1.34Personal Care $69,817,279 $106.59 $11,292,782 $18.18HCBS Waivers-Total (G+H) $105,206,504 $160.62 $125,502,587 $202.10HCBS Waivers-MR/DD $56,880,732 $86.84 $87,807,600 $141.40HCBS Waivers-A/D (OA+APD) $40,394,774 $61.67 $31,171,351 $50.20Home Health $639,796 $0.98 $6,560,193 $10.56Total Home Care (E+F+I) $175,663,579 $268.19 $143,355,562 $230.85Total Long-term Care (A+B+J) $282,755,138 $431.69 $248,549,334 $400.24P.A.C.E. $0 $0.00 $0 $0.00
Alaska Vermont
FY 2004 Medicaid Expenditures FY 2004 Per Capita
FY 2004 Medicaid Expenditures
FY 2004 Per Capita
*ICF/MR expenditures refer to Intermediate Care Facilities that only serve people with mental retardation or other developmental disabilities. Source: CMS / MEDSTAT Data When comparing the statewide expenditures on long term care services in these two states, we found that:
• the difference in nursing home expenditures on a per capita basis is approximately 3.0% ($163.50 versus $168.06);
• ICF/MR expenditures in Vermont were in excess of $829,000, versus $0 in Alaska; • per capita, Vermont spends less on personal care services than Alaska ($18.18 versus
$106.59); • Vermont spends more per capita on waiver services than similar services in Alaska ($202.1
versus $160.62); • Vermont utilizes Home Health Care services substantially more than Alaska ($6.5 million
versus $639,796); and, • Vermont spends approximately 7% less per capital on total long term care services when
compared to Alaska ($400.24 versus $431.69). Wyoming The below table depicts the current system of long term care present in Wyoming. Information presented in this table reflects Wyoming’s response to PCG’s questionnaire on long term care programs and services.

State of Alaska Department of Health and Social Services
ALASKA LONG TERM CARE AND COST STUDY
FINAL REPORT
Final Report Page 149
Table B-18: Wyoming’s Current System of Long Term Care (As of December 2005)
Name of Long Term Care
Program Description of Services Populations Served Problems, issues, or
service gaps within this program?
LTC Nursing Facilities 39 facilities throughout the state
DD, Physical Disabilities, Aging
Due to rural geography of state, may only have 1 provider per county
State-licensed shelter care DD, Physical Disabilities, Aging
Lack of information
Wyoming Retirement Center (state-owned SNF)
LTC nursing facility DD, Physical Disabilities, Aging
Maintaining adequate staffing
ICF-MR Provides residential housing and treatment as required
DD, Physical Disabilities, Aging
ICF-MI Provides residential housing and treatment as required
DD, Physical Disabilities, Aging
LTC / HCBS Provides care in the community for nursing home eligible
Primarily aged and disabled, but some DD
Distance between provider agencies; limited "slots" resulting in a waiting list
Assisted Living Facility HCBS Waiver
Provides care in an assisted living facility for nursing home eligible
Primarily aged and disabled, but some DD
Large areas of the state do not have participating providers
Wyoming’s system of long term care presented the longest list of similarities of any state included as part of this comparison state study:
• Both states have noted that there is a lack of qualified providers for their long term care services, which can be greatly attributed to rural geography.
• Wyoming has found that is it increasingly hard to maintain adequate staffing levels in its Nursing Facilities, possibly because of the level of wages paid to employees in the facilities or because of the rural geography of the state. This is the same problem that Alaska’s Pioneer Homes have uncovered.
• Wyoming and Alaska both have significant distance separating the long term care provider
agencies in the state. This is important to note because the states are also dealing with a concurrent issue of transportation gaps, which in turn produces barriers to accessing care for residents needing long term care services.
• Both states currently have a growing Waiting List in place for residents requiring services for
developmental disabilities.
• Some large areas of the state lack access to services—this is true of both Wyoming and Alaska, and is another issue relating to the expansive geography of the states.

State of Alaska Department of Health and Social Services
ALASKA LONG TERM CARE AND COST STUDY
FINAL REPORT
Final Report Page 150
• In both Wyoming and Alaska, less than 50 percent of the state’s nursing facilities were for-
profit in 2001.41
• In 2000, Wyoming led all other states in the number of Medicare-certified home health agencies per 1,000 persons age 65 and older that were operating. States following Wyoming closely in this number were Louisiana, Texas, Arkansas, and Alaska. 42 Similarly, five states in the country—Alaska and Wyoming among the set—allocated 50 percent or more of their Medicaid long term care expenditures to home and community-based services in 2001.43 These two statistics show that both states rely heavily upon community-based services, which is a trend that is occurring throughout the country.
• Accordingly, there has been a significant increase in the number of HCBS MRDD waiver
participants in both Wyoming and Alaska (see Table B-19 below).
Table B-19: Wyoming’s MR/DD HCBS Waiver Participants
Source: Braddock, D., Hemp, R., Parish, S., & Westrich, J. (2005). The state of the states in developmental disabilities, 2005. Washington, DC: American Association on Mental Retardation.
At the same time, there are several differences between the long term care systems in the two states. Nationally, the number of Americans age 65-74 will rise from 6.5 percent in 2000 to 9.7 percent in 2020. Wyoming is one of the states with the highest shares of persons in this age group by 2020, with a share of 11.5 percent or higher. 44 Alaska was not among the states in this group. Medicare reimbursement per home health visit averaged $81 in 2000 in the U.S. as a whole. However, while Alaska had one of the highest rates in the country at $138, Wyoming had one of the lowest rates, ranging from $60-$68. 45
Expenditure and Reimbursement Analysis Table B-20 compares the expenditures on long term care services in Wyoming with the expenditures on long term care services in Alaska. 41 Gregory, Steven R. and Mary Jo Gibson for AARP. Across the States 2002: Profiles of Long term Care. 42 Gregory, Steven R. and Mary Jo Gibson for AARP. Across the States 2002: Profiles of Long term Care. 43 Gregory, Steven R. and Mary Jo Gibson for AARP. Across the States 2002: Profiles of Long term Care. 44 Gregory, Steven R. and Mary Jo Gibson for AARP. Across the States 2002: Profiles of Long term Care. 45 Gregory, Steven R. and Mary Jo Gibson for AARP. Across the States 2002: Profiles of Long term Care.

State of Alaska Department of Health and Social Services
ALASKA LONG TERM CARE AND COST STUDY
FINAL REPORT
Final Report Page 151
Table B-20: LTC Expenditures, Wyoming and Alaska
Nursing Home Services $107,091,559 $163.50 $60,552,927 $119.67ICF-MR Total (C+D)* $0 $0.00 $16,908,396 $33.42ICF-MR Public $0 $0.00 $16,908,396 $33.42ICF-MR Private $0 $0.00 $0 $0.00Personal Care $69,817,279 $106.59 $0 $0.00HCBS Waivers-Total (G+H) $105,206,504 $160.62 $83,450,059 $164.92HCBS Waivers-MR/DD $56,880,732 $86.84 $71,983,911 $142.26HCBS Waivers-A/D (OA+APD) $40,394,774 $61.67 $8,251,579 $16.31Home Health $639,796 $0.98 $5,354,621 $10.58Total Home Care (E+F+I) $175,663,579 $268.19 $88,804,680 $175.50Total Long-term Care (A+B+J) $282,755,138 $431.69 $166,266,003 $328.59P.A.C.E. $0 $0.00 $0 $0.00
Alaska Wyoming
FY 2004 Medicaid Expenditures
FY 2004 Per Capita
FY 2004 Medicaid Expenditures
FY 2004 Per Capita
*ICF/MR expenditures refer to Intermediate Care Facilities that only serve people with mental retardation or other developmental disabilities. Source: CMS / MEDSTAT Data. When comparing the expenditures on long term care services in these two states, we found that:
• the difference in nursing home expenditures on a per capita basis is approximately 26.0% ($163.50 versus $119.67);
• ICF/MR expenditures in Wyoming were in excess of $16 million versus $0 in Alaska; • Wyoming does not offer Personal Care services; • expenditures on a per capita basis for Wyoming’s waiver services are similar to Alaska’s
($164.92 versus $160.62); • Wyoming utilizes Home Health Care services substantially more than Alaska ($5 million
versus $639,796); and, • Wyoming spends approximately 23% less per capita on total long term care services when
compared to Alaska ($328.59 versus $431.69). The following table, B-21, presents the actual expenses from Wyoming regarding per diem costs of programs and the rate setting methods used to support those services.
Table B-21: Wyoming’s LTC Reimbursement Methodologies
Name of Long Term Care Program Per Diem Cost of Program
Assisted Living Facility HCBS Waiver ~$43.00/day
N/A~$40.00/day
~$326.03/dayAverage Cost NF
ICF-MILTC / HCBS
Average Cost $128.84/day
~$25/day
LTC Nursing FacilitiesState-licensed shelter careWyoming Retirement Center state-owned SNFICF-MR

State of Alaska Department of Health and Social Services
ALASKA LONG TERM CARE AND COST STUDY
FINAL REPORT
Final Report Page 152
The rate setting methodology for HCBS in Wyoming utilizes individual budgets and state appropriations. Wyoming’s individual budgeting process allows for the total dollar value of services and supports consumed by an individual to be easily accessed and analyzed. The individual budgeting process assumes that no two people have the exact same kind of service needs and that those individuals with greater needs should receive more resources to pay for additional or more intensive services. The allocation of dollars is based on a person’s service needs, the setting in which they receive services, and the history of their service use in the past six months. However, there are limits put on the amount of money an individual can receive in a certain amount of time. The Alaska waiver program does not differentiate from a person who needs more services from a person who needs fewer services. Wyoming reimburses nursing facilities primarily on a prospective rate with a 90% occupancy requirement. Additional methodologies used by Wyoming include negotiated rates for extraordinary recipients and contracted rates.

State of Alaska Department of Health and Social Services
ALASKA LONG TERM CARE AND COST STUDY
FINAL REPORT
Final Report Page 153
APPENDIX C: PRELIMINARY DATA REQUEST
Date Requested Received Responsible PartyComprehensive inventory of all current DSDS LTC programs and their services 9/30/2005 Yes Pat SidmoreList of agency and stakeholder contacts to interview 9/30/2005 Yes Jennifer KleinList of possible states to be considered for peer state study and a list of any agency contacts that DSDS agency staff has within these states
9/30/2005 Yes PCG
List of any current national LTC trends or evidence-based practices of interest to the State of Alaska 9/30/2005 Discussed PCGMost recent Medicaid state plan sections: specifically, referring to nursing facilities (Relevant limitations on service coverage would be in State Plan Attachment 3.1-A, items 4a and 15b and corresponding items in the "Supplement"; rate setting for LTC)
9/30/2005 Yes Jon Sherwood
Alaska’s 1915(c) waivers 9/30/2005 Yes DHSS WebsiteDocumentation relating to Pioneer Homes, Nursing Facilities, Senior and Community Developmental Disabilities Grants, and any state institutions that serve individuals with DD that should be considered
9/30/2005 Yes Jon Sherwood, David Pierce, Dave Williams, Millie Ryan, Linda Gohl, Pat Sidmore
CMS 372 and 64 going back as far back as available; as well as reports from AK's Medicaid Management Information System (MMIS). 9/30/2005 Yes Jill Lewis with assistance from Michelle Gross for 64 and Pat Sidmore for 372
Other reports documenting the status of long term care in Alaska, including reports prepared for the legislature 9/30/2005 Yes Jon SherwoodProgress reports for the State’s Real Choice Systems Change and Medicaid Infrastructure Grants In-Step, Comprehensive Integrated Mental Health Plan of December 2001
9/30/2005 Yes Pat Sidmore with assistance from Millie Ryan on Real Choice information
The American Indian and Alaska Native Roundtable Final Report of 2002 9/30/2005 Yes Jennifer KleinThe Developmental Disabilities Wait List Report published in November 2002 9/30/2005 Yes Pat Sidmore Any studies done prior to the March 2003, such as the announcement of the transfer of senior service from the Department of Administration to the Department of Health and Social Services
9/30/2005 Yes Jon Sherwood with assistance from Linda Gohl
Documents used for soliciting providers (RFPs, Human Care Agreements, etc.) 9/30/2005 Yes Pat SidmoreCopies of provider contracts 9/30/2005 Yes Pat SidmoreProcurement regulations 9/30/2005 Yes Jennifer KleinDescriptions of rate methodologies, including notes or memos that support the development of rate methodologies for Pioneer Homes, Nursing Facilities, Assisted Living Direct Cost/A&G Rate Methodology, DD services
9/30/2005 Yes Jon Sherwood with assistance from Virginia Smiley, Jack Nielson, and Kevin Perron
Organizational Chart 9/30/2005 Yes Jennifer KleinApplications for Real Choice Systems Change and Medicaid Infrastructure Grants 9/30/2005 Yes Pat SidmoreRelevant passed and proposed legislation within the past 10 years 9/30/2005 Yes Jon SherwoodIf a data warehouse exists, a description of the variables included 9/30/2005 Yes Jill LewisCopies of the codebook(s) for specific date sets 9/30/2005 N/A Jill LewisClarification on what programs AK would like us to review 9/30/2005 Yes Jon Sherwood list of programs
found in 3. C. of RFP5 years of data on total expenditures, state expenditures, annual unduplicated recipients, and average monthly recipients for each program 9/30/2005 Yes
Jill Lewis w/assistance from Pat Sidmore
5 years of data on the FFP rate and the State’s best forecast as to what the FFP rate will be in future years 9/30/2005 Yes Jill Lewis5 years of the CMS 2082 to create a forecasting base for predicting the numbers of Medicaid recipients 9/30/2005 Addressed; N/A Jon SherwoodCopies of any State statutes and administrative rules that define reimbursement and any copies of working papers that provide justification for reimbursement 9/30/2005 Yes Jon Sherwood
Longitudinal data on Pioneer Homes 11/6/2005 Yes Virginia SmileyLongitudinal data on Nursing homes 11/8/2005 Yes Jack NielsonAge data for waiver recipients 11/9/2005 Yes Jill Lewis
Data Element Requested
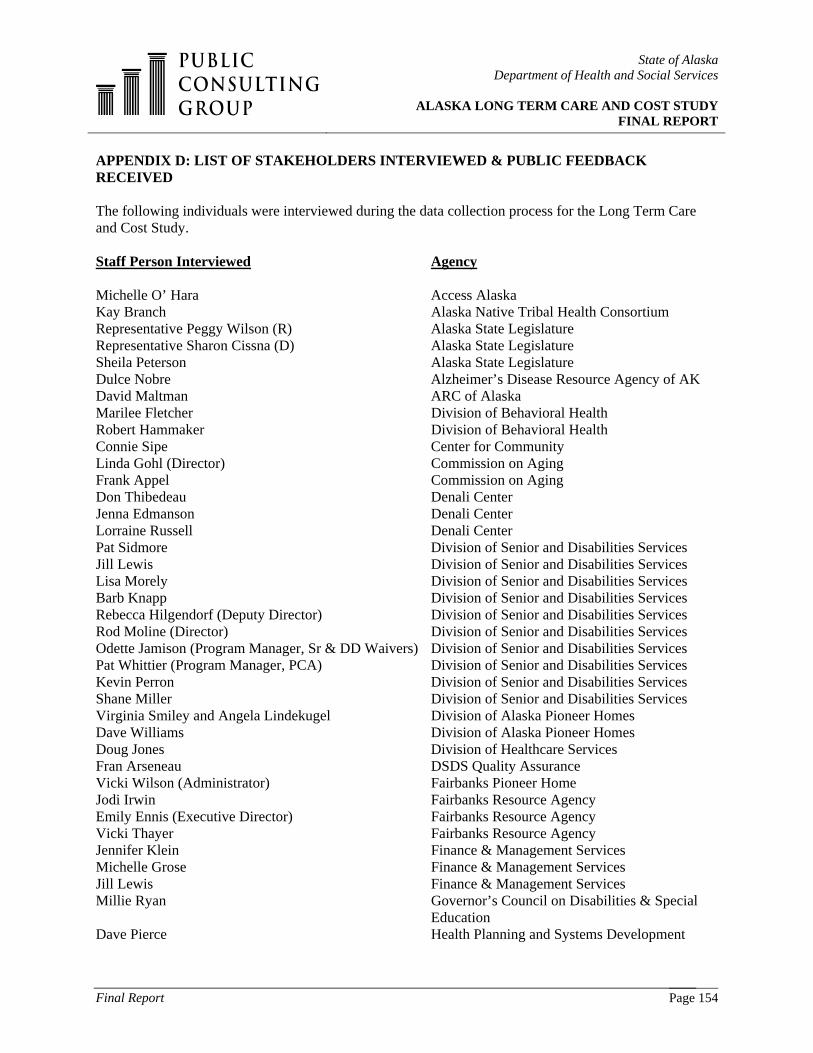
State of Alaska Department of Health and Social Services
ALASKA LONG TERM CARE AND COST STUDY
FINAL REPORT
Final Report Page 154
APPENDIX D: LIST OF STAKEHOLDERS INTERVIEWED & PUBLIC FEEDBACK RECEIVED The following individuals were interviewed during the data collection process for the Long Term Care and Cost Study. Staff Person Interviewed Agency Michelle O’ Hara Access Alaska Kay Branch Alaska Native Tribal Health Consortium Representative Peggy Wilson (R) Alaska State Legislature Representative Sharon Cissna (D) Alaska State Legislature Sheila Peterson Alaska State Legislature Dulce Nobre Alzheimer’s Disease Resource Agency of AK David Maltman ARC of Alaska Marilee Fletcher Division of Behavioral Health Robert Hammaker Division of Behavioral Health Connie Sipe Center for Community Linda Gohl (Director) Commission on Aging Frank Appel Commission on Aging Don Thibedeau Denali Center Jenna Edmanson Denali Center Lorraine Russell Denali Center Pat Sidmore Division of Senior and Disabilities Services Jill Lewis Division of Senior and Disabilities Services Lisa Morely Division of Senior and Disabilities Services Barb Knapp Division of Senior and Disabilities Services Rebecca Hilgendorf (Deputy Director) Division of Senior and Disabilities Services Rod Moline (Director) Division of Senior and Disabilities Services Odette Jamison (Program Manager, Sr & DD Waivers) Division of Senior and Disabilities Services Pat Whittier (Program Manager, PCA) Division of Senior and Disabilities Services Kevin Perron Division of Senior and Disabilities Services Shane Miller Division of Senior and Disabilities Services Virginia Smiley and Angela Lindekugel Division of Alaska Pioneer Homes Dave Williams Division of Alaska Pioneer Homes Doug Jones Division of Healthcare Services Fran Arseneau DSDS Quality Assurance Vicki Wilson (Administrator) Fairbanks Pioneer Home Jodi Irwin Fairbanks Resource Agency Emily Ennis (Executive Director) Fairbanks Resource Agency Vicki Thayer Fairbanks Resource Agency Jennifer Klein Finance & Management Services Michelle Grose Finance & Management Services Jill Lewis Finance & Management Services Millie Ryan Governor’s Council on Disabilities & Special
Education Dave Pierce Health Planning and Systems Development

State of Alaska Department of Health and Social Services
ALASKA LONG TERM CARE AND COST STUDY
FINAL REPORT
Final Report Page 155
Bob Dreyer Long Term Care Ombudsman Jeff Jesse Mental Health Trust Nancy Burke Mental Health Trust Steve Williams Mental Health Trust Jon Sherwood Office of Program Review Jerry Fuller (Medicaid Director) Office of Program Review Renee Gayhart Office of Performance Review Jack Nielson Office of Rate Review Neal Kutchins Office of Rate Review Sue Samet Provider, Providence House and Ed’s Place Marianne Mills Southeast AK Senior Services Program Director Consumer Task Force Meeting Stakeholders Darlene Lord Tanana Chiefs Conference Jennifer Lewis TBI Coordinator Karen Ward University of AK, Anchorage Denise Daniello University of AK, Fairbanks Geriatric Center PCG received feedback and input on the Interim Report from a number of organizations and individuals interested in the Alaska long term care system and how it is shaped in the future. The following organizations provided comments:
• Alaska Native Tribal Health Consortium • Tanana Chiefs Conference • Alaska Commission on Aging • AARP of Alaska • Alzheimer’s Disease Resource Agency of Alaska • Assisted Living Association of Alaska • Palmer Senior Citizens Services, Inc. • Adult Learning Programs of Alaska • Hope Community Resources, Inc. • Marlow Manor Assisted Living • Southcentral Foundation • Supported Services • Real Choice Systems Change Consumer Task Force • Ready Care, a Division of Job Ready, Inc. • University of Alaska • Individual care coordinators • Individual service coordinators • Division of Senior and Disabilities Services • Office of the Long Term Care Ombudsman
All comments received were reviewed by the PCG project team and a determination was made on how it could or could not be used in preparing the Final Report. Comments fell into the following four categories:

State of Alaska Department of Health and Social Services
ALASKA LONG TERM CARE AND COST STUDY
FINAL REPORT
Final Report Page 156
• Technical corrections that needed to be made because of the impact on the accuracy of the Interim Report;
• Requests for clarification of information presented that would aid the reader in more fully
understanding the findings, information or recommendations presented in the Interim Report;
• Suggestions or recommendations on additional considerations or information that the commenter wanted to see considered as part of the Final Report; and,
• Editorial comments either in agreement or disagreement with components of the Interim Report.
Comments that fell into the first two categories listed were utilized to make changes in the Final Report. Comments in the third category were addressed to the extent possible. When the comment would have necessitated completion of work beyond the scope of the current project, they were not utilized or a notation in the report was made that future work may want to address the suggestion. In some cases, the comments would have necessitated attempts to secure additional data and information that would was not readily available and would have delayed compliance with the current work schedule. Finally, comments of an editorial nature were not incorporated in the Final Report.

State of Alaska Department of Health and Social Services
ALASKA LONG TERM CARE AND COST STUDY
FINAL REPORT
Final Report Page 157
APPENDIX E: HCBS WAIVER COST PROPOSAL WORKSHEET

State of Alaska Department of Health and Social Services
ALASKA LONG TERM CARE AND COST STUDY
FINAL REPORT
Final Report Page 158
APPENDIX F: MARCH 6, 1997 MEDICAID LETTER, ‘GUIDELINES REGARDING WHAT CONSTITUTES AND ICF/MR LEVEL OF CARE UNDER A HOME AND COMMUNITY-BASED SERVICES WAIVER’

State of Alaska Department of Health and Social Services
ALASKA LONG TERM CARE AND COST STUDY
FINAL REPORT
Final Report Page 159

State of Alaska Department of Health and Social Services
ALASKA LONG TERM CARE AND COST STUDY
FINAL REPORT
Final Report Page 160

State of Alaska Department of Health and Social Services
ALASKA LONG TERM CARE AND COST STUDY
FINAL REPORT
Final Report Page 161
APPENDIX G: FISCAL IMPACT OF 2004 REGULATIONS ON WAIVER EXPENDITURES
APD Waiver 01 Lag 02 Lag 03 Lag 04 Lag 05 Initial
Difference (04 Lag - 05 Initial)
Respite Care $ 1,642,461 $ 2,656,308 $ 3,595,261 $ 3,354,562 $ 1,812,349 1,542,213$ Intensive active Treatment/therapy $ 6,379 $ 10,221 $ 3,623 $ 18,115 $ 9,177 8,938$ Environmental modifications $ 343,448 $ 330,489 $ 401,412 $ 252,908 $ 169,691 83,217$
Specialized equipment and supplies $ 482,014 $ 469,626 $ 383,901 $ 294,856 $ 269,121 25,735$ Chore services $ 944,763 $ 1,408,520 $ 1,649,602 $ 1,415,369 $ 1,131,010 284,359$
1,944,462$
CMCC Waiver 01 Lag 02 Lag 03 Lag 04 Lag 05 Initial
Difference (04 Lag - 05 Initial)
Respite Care $ 740,006 $ 861,490 $ 787,014 $ 879,669 $ 711,770 167,899$ Residential habilitation $ 4,132,129 $ 5,363,675 $ 5,632,727 $ 5,339,255 $ 5,234,694 104,561$
Specialized equipment and supplies $ 517,778 $ 413,157 $ 276,429 $ 146,597 $ 128,250 18,347$ Chore services $ 58,412 $ 81,385 $ 93,523 $ 94,073 $ 20,542 73,531$
364,338$
MRDD Waiver 01 Lag 02 Lag 03 Lag 04 Lag 05 Initial
Difference (04 Lag - 05 Initial)
Respite Care $ 1,794,455 $ 2,288,243 $ 2,295,028 $ 2,384,183 $ 2,357,376 26,807$ Supported employment $ 2,995,372 $ 3,994,816 $ 3,858,939 $ 3,915,292 $ 3,805,997 109,295$ Environmental modifications $ 197,605 $ 249,200 $ 80,205 $ 42,002 $ 39,745 2,257$ Transportation $ 56,436 $ 100,935 $ 109,087 $ 115,082 $ 98,288 16,794$
Specialized equipment and supplies $ 549,005 $ 449,450 $ 181,561 $ 149,215 $ 67,987 81,228$ Chore services $ 89,957 $ 124,561 $ 82,017 $ 81,414 $ 41,179 40,235$
276,616$
OA Waiver 01 Lag 02 Lag 03 Lag 04 Lag 05 Initial
Difference (04 Lag - 05 Initial)
Respite Care $ 3,145,315 $ 4,700,598 $ 6,334,544 $ 5,924,919 $ 3,067,993 2,856,926$ Environmental modifications $ 463,560 $ 399,284 $ 471,750 $ 427,025 $ 217,487 209,538$
Specialized equipment and supplies $ 552,936 $ 632,082 $ 400,465 $ 285,241 $ 260,864 24,377$ Chore services $ 876,857 $ 1,469,201 $ 1,773,256 $ 1,624,493 $ 1,311,355 313,138$ Meals $ 543,331 $ 732,544 $ 839,737 $ 814,598 $ 786,509 28,089$
3,432,068$ Total all Waivers 6,017,484$

State of Alaska Department of Health and Social Services
ALASKA LONG TERM CARE AND COST STUDY
FINAL REPORT
Page 162
APPENDIX H: OA WAIVER USERS, DAYS OF SERVICE, AND COSTS, FY 94-04 0261 OA
FY94 from 95 Initial
FY95 from 96 Lag
FY96 from 97 Lag
FY97 from 98 Lag
FY98 from 99 Lag
FY99 from 00 Lag
FY00 from 01 Lag 01 Initial 01 lag 02 Initial 02 Lag 03 Initial 03 Lag 04 Initial 04 Lag 05 Initial
Care Coordination Co 122 194 403 519 690 901 1,082 1,108 1,226 1,242 1,312 1,316 1,253 1,266 1,373 Respite Care 6 28 63 110 133 175 260 352 355 499 505 607 608 566 573 464 Adult Day Care 17 40 54 83 108 133 159 199 199 211 214 213 213 234 236 300 Res habDay habSupported employmentIntensive Active Treatment/TherapyEnvironmental modifications 1 4 5 30 40 50 69 83 83 96 98 104 105 80 83 45Transportation 15 55 93 161 230 325 424 530 540 622 626 653 653 639 645 670Specialized equipment and supplies 5 31 71 162 230 298 451 591 615 644 667 614 613 485 510 44Chore services 1 9 16 55 94 186 301 386 388 475 477 531 532 443 448 338Meals 22 64 91 141 198 283 353 438 454 484 485 479 480 466 471 468RSLA 9 38 85 177 227 282 350 362 363 445 446 483 483 496 500 617SPN 0 4 0 1 2 9 41 89 90 100 102 96 96 91 94 85Unduplicated count 43 127 206 415 529 712 925 1,100 1,128 1,261 1,269 1,335 1,339 1,276 1,290 1,409
0261 OA FY94 from 95 Initial
FY95 from 96 Lag
FY96 from 97 Lag
FY97 from 98 Lag
FY98 from 99 Lag
FY99 from 00 Lag
FY00 from 01 Lag 01 Initial 01 Lag 02 Initial 02 Lag 03 Initial 03 Lag 04 Initial 04 Lag 05 Initial
Total days waiver coverage 4,993 28,833 51,137 96,613 142,686 192,578 258,965 312,197 312,477 366,974 372,292 396,311 400,469 380,673 395,673 404,849 Avg. length of stay 116 211 248 233 270 270 280 284 277 291 293 297 299 298 307 287Total cost 170,605$ 966,350$ 2,136,998$ 4,647,726$ 6,647,674$ 8,554,566$ 11,335,060$ 15,111,616$ 15,249,364$ 19,668,716$ 19,806,878$ 25,245,793$ $ 25,205,377 $ 26,994,396 27,268,428$ 27,627,601$ Average cost per day 34.17$ 33.52$ 41.79$ 48.11$ 46.59$ 44.42$ 43.77$ 48.40$ 48.80$ 53.60$ 53.20$ 63.70$ 62.94$ 70.91$ 68.92$ 68.24$ x Avg length of stay 3,968$ 7,072$ 10,364$ 11,209$ 12,579$ 11,994$ 12,256$ 13,747$ 13,518$ 15,597$ 15,588$ 18,919 18,819 21,132 21,157$ 19,585$
0261 OA FY94 from 95 Initial
FY95 from 96 Lag
FY96 from 97 Lag
FY97 from 98 Lag
FY98 from 99 Lag
FY99 from FY00 Lag
FY00 from 01 Lag 01 Initial 01 lag 02 Initial 02 Lag 03 Initial 03 Lag 04 Initial 04 Lag 05 Initial
Care Coordination 49,385$ 182,715$ 302,620$ 631,297$ 926,325$ 1,198,661$ 1,607,471$ 1,954,116$ 1,972,786$ 2,312,679$ $2,344,224 $2,547,103 $2,549,919 $2,393,248 2,420,453$ 2,592,408$ Respite Care 14,636$ 109,910$ 367,131$ 870,902$ 981,436$ 1,250,279$ 1,917,103$ 3,109,432$ 3,145,315$ 4,685,567$ $4,700,598 $6,337,254 $6,334,544 $5,820,044 5,924,919$ 3,067,993$ Adult Day Care 35,147$ 195,451$ 329,768$ 442,394$ 636,275$ 824,666$ 896,506$ 1,111,364$ 1,112,084$ 1,329,992$ $1,330,707 $1,494,130 $1,484,108 $1,611,773 1,617,488$ 1,734,854$ Res habDay habSupported employment
Intensive active Treatment/therapyEnvironmental modifications 4,145$ 21,861$ 10,370$ 177,058$ 195,476$ 297,342$ 365,261$ 463,560$ 463,560$ 379,672$ $399,284 $470,090 $471,750 $410,907 427,025$ 217,487$ Transportation 6,595$ 32,132$ 62,978$ 85,730$ 155,844$ 229,359$ 289,229$ 398,127$ 404,109$ 652,211$ $655,016 $792,333 $790,731 $868,671 883,172$ 910,117$ Specialized equipment and supplies 4,120$ 15,676$ 47,459$ 116,708$ 146,572$ 192,060$ 351,991$ 509,301$ 552,936$ 587,756$ $632,082 $397,264 $400,465 $264,912 285,241$ 260,864$ Chore services 192$ 4,314$ 10,563$ 42,374$ 106,272$ 238,431$ 486,555$ 858,720$ 876,857$ 1,460,492$ $1,469,201 $1,771,230 $1,773,256 $1,592,629 1,624,493$ 1,311,355$ Meals 12,147$ 59,166$ 91,780$ 146,682$ 220,095$ 296,838$ 374,537$ 534,932$ 543,331$ 729,447$ $732,544 $839,285 $839,737 $810,583 814,598$ 786,509$ RSLA 44,238$ 344,127$ 914,330$ 2,134,399$ 3,279,160$ 4,020,202$ 5,002,826$ 6,039,135$ 6,043,292$ 7,365,748$ $7,371,645 $10,435,974 $10,399,737 $13,082,731 13,128,966$ 16,620,789$ Specialized private duty nursing -$ 1,000$ -$ 181$ 219$ 6,728$ 43,581$ 132,929$ 135,094$ 165,152$ $171,577 $161,130 $161,130 $138,898 142,074$ 110,849$
170,605$ 966,352$ 2,136,999$ 4,647,725$ 6,647,674$ 8,554,566$ 11,335,060$ 15,111,616$ 15,249,364 19,668,716$ $19,806,878 $25,245,793 $25,205,377 $26,994,396 27,268,428$ 27,627,601$ Cost Per User 3,968$ 7,609$ 10,374$ 11,199$ 12,566$ 12,015$ 12,254$ 13,738$ 13,519$ 15,598$ $15,608 $18,911 $18,824 $21,155 21,138$ 19,608$

State of Alaska Department of Health and Social Services
ALASKA LONG TERM CARE AND COST STUDY
FINAL REPORT
Page 163
APPENDIX I: APD WAIVER USERS, DAYS OF SERVICE, AND COSTS, FY 94-04 0262 APD
FY94 from 95 Initial
FY95 from 96 Lag
FY96- from 97 Lag
FY97 from 98 Lag
FY98 from 99 Lag
FY99 from 00 Lag
FY00 from 01 Lag 01 Initial 01 Lag 02 Initial 02 Lag 03 Initial 03 Lag 04 Initial 04 Lag 05 Initial
Care Coordination 2 21 62 88 144 341 489 620 654 795 807 845 846 784 794 927Respite Care 1 7 17 24 28 80 110 169 183 292 295 360 359 361 363 294Adult Day Care 0 4 6 5 5 15 28 49 54 48 48 51 51 66 66 111Res hab 11 30 41 26 23 21 19 21 23 23 18 18 17 19 28Day hab 0 1 4 8 3 3 2 2 4 4 4 5 5 8 8 15Supported employment 2 2 5 6 2 2 2 3 4 3 3 3 3 3 3 5Intensive Active Tmnt/Therapy 0 0 0 3 1 0 0 1 3 2 2 1 1 2 3 3Environmental modifications 0 0 5 6 9 30 33 57 58 83 84 91 92 60 60 51Transportation 0 4 10 18 47 137 208 290 310 414 419 445 446 422 424 440
Specialized equipment & supplies 0 6 15 26 58 150 241 325 349 441 451 472 473 397 403 442Chore services 1 4 9 19 36 142 220 304 322 406 408 434 435 364 365 323Meals 0 3 8 9 24 89 114 186 198 251 252 291 291 274 279 316RSLA 0 1 4 8 31 83 116 130 143 180 185 188 188 197 200 224SPN 0 0 0 0 0 4 20 41 43 55 55 61 61 65 68 76Unduplicated count 2 22 66 88 145 345 498 629 664 809 815 858 859 795 806 938
0262 APDFY94 from 95 Initial
FY95 from 96 Lag
FY96 from 97 Lag
FY97 from 98 Lag
FY98 from 99 Lag
FY99 from 00 Lag
FY00 from 01 Lag 01 Initial 01 Lag 02 Initial 02 Lag 03 Initial 03 Lag 04 Initial 04 Lag 05 Initial
Total days waiver coverage 344 5,003 16,962 27,961 30,517 85,890 141,779 187812 196,259 240,527 242,255 265,910 268,950 265,910 253,349 274,973 Avg. length of stay 172 227 257 318 210 249 285 299 296 297 297 310 313 310 314 293Total cost 19,536$ 290,582$ 1,016,252$ 1,705,663$ 1,563,617$ 3,692,586$ 5,805,609$ 8,180,085$ $ 8,779,340 11,543,708$ 11,612,426$ 13,910,263$ $ 14,190,975 $ 14,778,256 14,979,834$ 14,861,368$ Average Cost per day 56.79$ 58.08$ 59.91$ 61.00$ 51.24$ 42.99$ 40.95$ 43.55$ 44.73$ 47.99$ 47.93$ 52.31$ 52.76$ 55.58$ 59.13$ 54.05$ x Avg length of stay 9,768$ 13,185$ 15,398$ 19,398$ 10,760$ 10,705$ 11,670$ 13,023$ 13,241$ 14,254$ 14,237$ 16,217$ 16,515$ 17,229$ 18,566$ 15,836$
0262 APDFY94 from 95 Initial
FY95 from 96 Lag
FY96 from 97 Lag
FY97 from 98 Lag
FY98 from 99 Lag
FY99 from 00 Lag
FY00 from 01 Lag 01 Initial 01 Lag 02 Initial 02 Lag 03 Initial 03 Lag 04 Initial 04 Lag 05 Initial
Care Coordination 2,995$ 28,445$ 106,252$ 175,461$ 207,253$ 561,419$ 893,831$ 1,177,276$ 1,238,159$ 1,511,140$ 1,531,085$ 1,694,746$ 1,697,191$ 1,586,499$ 1,602,269$ 1,789,263$ Respite Care 1,656$ 21,779$ 68,264$ 148,654$ 166,266$ 488,280$ 989,104$ 1,558,104$ 1,642,461$ 2,647,816$ 2,656,308$ $3,612,322 $3,595,261 $3,318,677 3,354,562$ 1,812,349$ Adult Day Care -$ 13,919$ 30,091$ 34,469$ 27,114$ 56,630$ 127,662$ 216,638$ 236,822$ 271,253$ 273,690$ $294,604 $294,604 $366,330 368,409$ 406,329$ Residential habilitation 24,075$ 182,478$ 626,064$ 948,733$ 577,800$ 663,026$ 674,557$ 866,320$ 957,039$ 1,004,585$ 1,004,585$ 860,490$ 860,490$ 965,960$ 1,031,275$ 1,144,327$ Day habilitation -$ 2,070$ 17,528$ 74,298$ 19,499$ 30,085$ 15,904$ 20,085$ 48,659$ 53,873$ 53,873$ 49,039$ 49,039$ 84,432$ 84,622$ 144,373$ Supported employment 10,102$ 7,649$ 42,896$ 38,612$ 19,478$ 27,470$ 35,749$ 39,297$ 42,798$ 35,808$ 35,808$ 32,402$ 32,402$ 47,333$ 47,333$ 55,274$
Intensive active Treatment/therapy -$ -$ -$ 7,415$ 477$ -$ -$ 3,795$ 6,379$ 10,221$ 10,221$ 3,623$ 3,623$ 10,621$ 18,115$ 9,177$ Environmental modifications -$ -$ 19,865$ 42,837$ 53,249$ 172,181$ 176,773$ 334,498$ 343,448$ 325,608$ 330,489$ 392,147$ 401,412$ 252,908$ 252,908$ 169,691$ Transportation -$ 2,626$ 7,795$ 12,677$ 27,699$ 104,859$ 182,753$ 279,686$ 312,947$ 479,115$ 486,746$ 674,674$ 675,058$ 743,401$ 760,032$ 801,220$ Specialized equipment and supplies -$ 13,213$ 19,524$ 47,225$ 56,949$ 214,154$ 348,150$ 431,504$ 482,014$ 452,993$ 469,626$ 382,273$ 383,901$ 284,036$ 294,856$ 269,121$ Chore services 60$ 6,476$ 25,648$ 40,154$ 71,385$ 287,662$ 558,725$ 900,454$ 944,763$ 1,402,906$ 1,408,520$ 1,645,825$ 1,649,602$ 1,404,120$ 1,415,369$ 1,131,010$ Meals 184$ 5,103$ 7,459$ 6,706$ 20,760$ 98,734$ 151,355$ 263,196$ 281,389$ 437,440$ 437,440$ 591,264$ 591,264$ 620,921$ 626,650$ 654,635$ RSLA -$ 6,825$ 45,020$ 128,421$ 315,689$ 1,004,246$ 1,620,161$ 2,019,291$ 2,168,167$ 2,810,224$ 2,832,269$ 3,881,166$ 3,865,683$ 4,995,198$ 5,019,866$ 6,367,761$ Specialized private duty nursing -$ -$ -$ -$ -$ 1,060$ 30,885$ 69,940$ 74,295$ 100,726$ 81,766$ 91,205$ 91,445$ 97,820$ 103,567$ 106,837$
19,536$ 290,583$ 1,016,406$ 1,705,662$ 1,563,617$ 3,709,806$ 5,805,609$ 8,180,084$ 8,779,340$ 11,543,708$ 11,612,426$ 14,205,780$ 14,190,975$ 14,778,256$ 14,979,834$ 14,861,368$ Cost Per User 9,768$ 13,208$ 15,400$ 19,383$ 10,784$ 10,753$ 11,658$ 13,005$ 13,222$ 14,269$ 14,248$ 16,557$ 16,520$ 18,589$ 18,585$ 15,844$

State of Alaska Department of Health and Social Services
ALASKA LONG TERM CARE AND COST STUDY
FINAL REPORT
Page 164
APPENDIX J: MR/DD WAIVER USERS, DAYS OF SERVICE, AND COSTS, FY 94-04 0260 MRDD
FY94 from 95 Initial
FY95 from 96 Lag
FY96- from 97 Lag
FY97 from 98 Lag
FY98 from 99 Lag
Revised FY99 from 00 Lag
FY00 from 01 Lag 01 Initial 01 Lag 02 Initial 02 Lag 03 Initial 03 Lag 04 Initial 04 Lag 05 Initial
Care Coordination 21 90 135 343 426 501 694 794 813 856 878 919 923 970 975 1,000 Respite Care 5 18 32 60 102 163 275 352 363 412 248 452 454 472 475 423 Adult Day CareRes hab 21 83 129 329 408 481 629 716 728 797 816 859 861 890 895 897 Day hab 1 21 41 97 136 188 243 283 288 329 344 440 441 450 453 491 Supported employment 14 32 42 60 60 66 129 265 266 307 315 322 322 311 315 318
Intensive Active Treatment/Therapy 4 6 7 8 2 7 11 37 44 71 79 89 90 102 105 114 Environmental modifications 0 2 7 7 7 14 17 27 30 44 47 17 17 10 10 6 Transportation 0 0 0 1 3 12 26 35 37 42 42 42 42 42 43 42
Specialized equipment and supplies 0 0 2 6 22 24 50 101 106 100 110 82 80 61 65 42 Chore services 0 0 1 3 8 15 26 35 35 44 44 28 28 31 31 14 Meals 0 0 0 0 0 2 3 5 5 5 5 4 4 3 3 5 RSLASPN 0 0 0 0 1 1 1 3 2 1 1 1 1 0Unduplicated count 21 90 138 343 427 505 694 797 814 860 866 931 935 970 976 1,003
0260 MRDDFY94 from 95
InitialFY95 from 96
LagFY96 from 97
LagFY97 from 98
LagFY98 from 99
Lag FY99 from 00
LagFY00 from 01
Lag 01 Initial 01 Lag 02 Initial 02 Lag 03 Initial 03 Lag 04 Initial 04 Lag 05 InitialTotal days waiver coverage 3,752$ 25,439 44,238 115,611 145,614 176,292 237,207 274,445 277,023 310,254 311,194 332,458 333,733 349,044 351,845 357,916 Avg. length of stay 179$ 283 321 337 341 349 335 344 340 358 351 357 357 360 360 357
Total cost 3,310,158$ 2,527,868$ 4,268,157$ 15,033,061$ 19,297,374$ 23,732,677$ 31,843,025$ 42,385,106$ 43,012,273 51,704,972$ 54,817,050$ 57,618,903$ 57,608,188$ $ 61,276,911 62,743,746$ 63,010,075$ Average cost per day 882$ 99.37$ 96.48$ 130.03$ 132.52$ 134.62$ 134.24$ 154.44$ 155.27$ 166.65$ 176.15$ 173.31$ 172.62$ 175.56$ 178.33$ 176.05$ x avg length of stay 157,921$ 28,122$ 30,971$ 43,821$ 45,191$ 46,983$ 44,971$ 53,127$ 52,790$ 59,662$ 61,829$ 61,872$ 61,624$ 63,200$ 64,198$ 62,849$
0260 MRDDFY94 from 95 Initial report
FY95 from 96 lag report
FY96- from 97 lag report
FY97 from 98 lag report
FY98 from 99 lag report
FY99 from 00 lag report
FY00 from 01 Lag
01 Initial report 01 lag initial 02 lag 02 Initial 03 03 Lag O4 Initial 04 Lag O5 Initial
Care Coordination 32,995$ 192,729$ 283,100$ 822,130$ 964,505$ 1,149,760$ 1,540,915$ 1,794,631$ 1,824,316$ 1,981,671$ 2,014,036$ 2,149,923$ 2,152,818$ 2,280,780$ 2,313,299$ 2,338,844$ Respite Care 15,721$ 66,639$ 151,212$ 241,811$ 352,768$ 624,560$ 1,109,448$ 1,748,376$ 1,794,455$ 232,226$ 2,288,243$ 2,291,807$ 2,295,028$ 2,320,051$ 2,384,183$ 2,357,376$ Adult Day CareRes hab 307,403$ 1,884,244$ 3,255,395$ 12,578,505$ 16,038,436$ 19,154,086$ 25,079,773$ 31,481,431$ 31,878,620$ 40,091,007$ 40,904,220$ 43,396,114$ 43,375,715$ 45,697,190$ 46,869,878$ 47,052,144$ Day hab 2,368$ 110,714$ 244,366$ 801,652$ 1,191,478$ 1,995,061$ 2,675,979$ 3,454,933$ 3,512,230$ 4,212,595$ 4,280,563$ 5,134,988$ 5,143,791$ 6,300,956$ 6,406,262$ 6,713,179$ Supported employment 73,312$ 211,368$ 352,512$ 545,440$ 610,232$ 592,930$ 1,017,018$ 2,980,164$ 2,995,372$ 3,917,183$ 3,994,816$ 3,861,726$ 3,858,939$ 3,879,514$ 3,915,292$ 3,805,997$
Intensive Active Treatment/Therapy 21,932$ 50,196$ 44,768$ 41,357$ 16,489$ 12,496$ 19,469$ 64,285$ 93,066$ 375,567$ 399,692$ 318,556$ 319,859$ 414,057$ 462,241$ 486,684$ Environmental modifications 0 11,978$ 45,538$ 54,522$ 29,653$ 89,608$ 92,149$ 176,301$ 197,605$ 238,821$ 249,200$ 80,205$ 80,205$ 42,002$ 42,002$ 39,745$ Transportation 0 -$ -$ 70$ 1,706$ 11,236$ 29,412$ 53,004$ 56,436$ 97,897$ 100,935$ 109,087$ 109,087$ 114,571$ 115,082$ 98,288$
Specialized equipment and supplies 0 -$ 1,085$ 7,936$ 84,048$ 68,123$ 217,187$ 534,995$ 549,005$ 431,645$ 449,450$ 185,192$ 181,561$ 142,324$ 149,215$ 67,987$ Chore services 0 -$ 1,058$ 5,637$ 7,710$ 32,409$ 57,747$ 89,957$ 89,957$ 115,026$ 124,561$ 82,137$ 82,017$ 80,588$ 81,414$ 41,179$ Meals 0 -$ -$ -$ -$ 2,008$ 3,128$ 4,440$ 4,440$ 7,734$ 7,734$ 7,098$ 7,098$ 4,878$ 4,878$ 8,652$ RSLASpecialized private duty nursing 0 $ - -$ -$ 350$ 400$ 800$ 3,530$ 3,530$ 3,600$ 3,600$ 2,070$ 2,070$ -$
$ 453,731 2,527,868$ 4,379,034$ 15,099,060$ 19,297,374$ 23,732,677$ 31,843,025$ 42,386,047$ 43,012,273 51,704,972$ 54,817,050$ 57,618,903$ 57,608,188$ 61,276,911$ 62,743,746$ 63,010,075$ Cost Per User 21,606$ 28,087$ 31,732$ 44,021$ 45,193$ 46,995$ 45,883$ 53,182$ 52,841$ 60,122$ 63,299$ 61,889$ 61,613$ 63,172$ 64,287 62,822
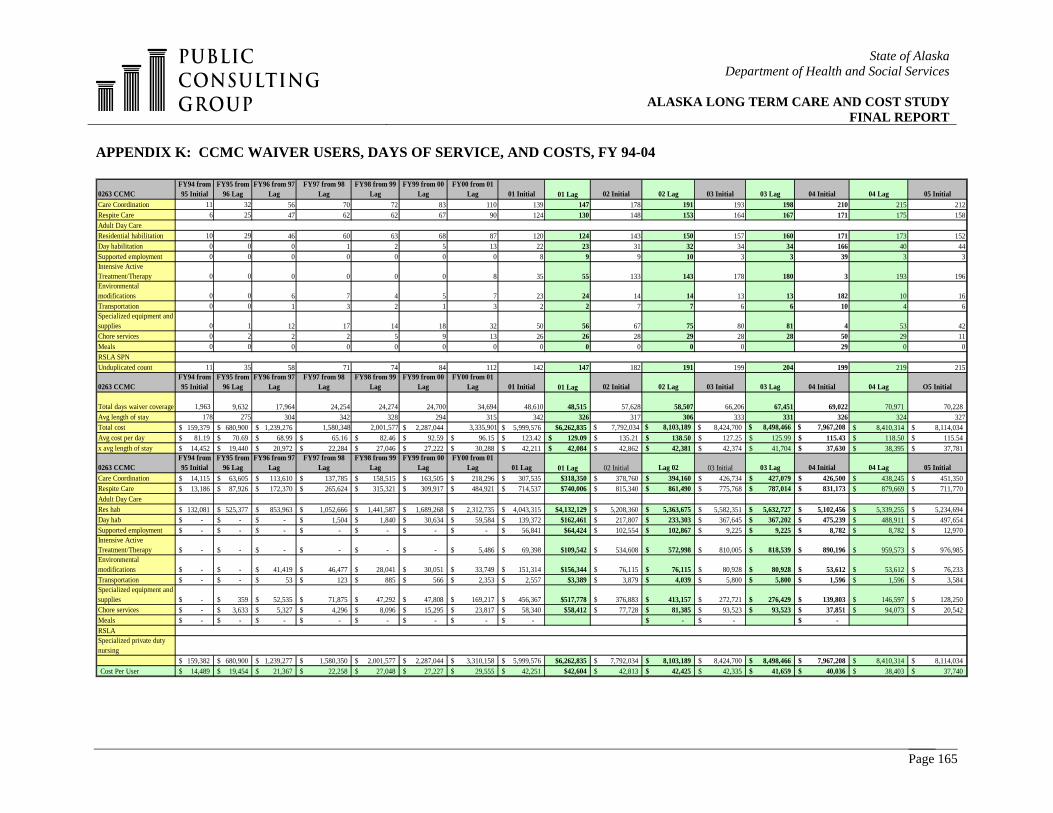
State of Alaska Department of Health and Social Services
ALASKA LONG TERM CARE AND COST STUDY
FINAL REPORT
Page 165
APPENDIX K: CCMC WAIVER USERS, DAYS OF SERVICE, AND COSTS, FY 94-04 0263 CCMC
FY94 from 95 Initial
FY95 from 96 Lag
FY96 from 97 Lag
FY97 from 98 Lag
FY98 from 99 Lag
FY99 from 00 Lag
FY00 from 01 Lag 01 Initial 01 Lag 02 Initial 02 Lag 03 Initial 03 Lag 04 Initial 04 Lag 05 Initial
Care Coordination 11 32 56 70 72 83 110 139 147 178 191 193 198 210 215 212Respite Care 6 25 47 62 62 67 90 124 130 148 153 164 167 171 175 158Adult Day CareResidential habilitation 10 29 46 60 63 68 87 120 124 143 150 157 160 171 173 152Day habilitation 0 0 0 1 2 5 13 22 23 31 32 34 34 166 40 44Supported employment 0 0 0 0 0 0 0 8 9 9 10 3 3 39 3 3Intensive Active Treatment/Therapy 0 0 0 0 0 0 8 35 55 133 143 178 180 3 193 196Environmental modifications 0 0 6 7 4 5 7 23 24 14 14 13 13 182 10 16Transportation 0 0 1 3 2 1 3 2 2 7 7 6 6 10 4 6Specialized equipment and supplies 0 1 12 17 14 18 32 50 56 67 75 80 81 4 53 42Chore services 0 2 2 2 5 9 13 26 26 28 29 28 28 50 29 11Meals 0 0 0 0 0 0 0 0 0 0 0 0 29 0 0RSLA SPNUnduplicated count 11 35 58 71 74 84 112 142 147 182 191 199 204 199 219 215
0263 CCMCFY94 from 95 Initial
FY95 from 96 Lag
FY96 from 97 Lag
FY97 from 98 Lag
FY98 from 99 Lag
FY99 from 00 Lag
FY00 from 01 Lag 01 Initial 01 Lag 02 Initial 02 Lag 03 Initial 03 Lag 04 Initial 04 Lag O5 Initial
Total days waiver coverage 1,963 9,632 17,964 24,254 24,274 24,700 34,694 48,610 48,515 57,628 58,507 66,206 67,451 69,022 70,971 70,228 Avg length of stay 178 275 304 342 328 294 315 342 326 317 306 333 331 326 324 327Total cost 159,379$ 680,900$ 1,239,276$ 1,580,348 2,001,577 2,287,044$ 3,335,901 5,999,576$ $6,262,835 $ 7,792,034 $ 8,103,189 $ 8,424,700 $ 8,498,466 $ 7,967,208 8,410,314$ 8,114,034$ Avg cost per day 81.19$ 70.69$ 68.99$ 65.16$ 82.46$ 92.59$ 96.15$ 123.42$ 129.09$ 135.21$ 138.50$ 127.25$ 125.99$ 115.43$ 118.50$ 115.54$ x avg length of stay 14,452$ 19,440$ 20,972$ 22,284$ 27,046$ 27,222$ 30,288$ 42,211$ 42,084$ 42,862$ 42,381$ 42,374$ 41,704$ 37,630$ 38,395$ 37,781$
0263 CCMCFY94 from 95 Initial
FY95 from 96 Lag
FY96 from 97 Lag
FY97 from 98 Lag
FY98 from 99 Lag
FY99 from 00 Lag
FY00 from 01 Lag 01 Lag 01 Lag 02 Initial Lag 02 03 Initial 03 Lag 04 Initial 04 Lag 05 Initial
Care Coordination 14,115$ 63,605$ 113,610$ 137,785$ 158,515$ 163,505$ 218,296$ 307,535$ $318,350 378,760$ 394,160$ 426,734$ 427,079$ 426,500$ 438,245$ 451,350$ Respite Care 13,186$ 87,926$ 172,370$ 265,624$ 315,321$ 309,917$ 484,921$ 714,537$ $740,006 815,340$ 861,490$ 775,768$ 787,014$ 831,173$ 879,669$ 711,770$ Adult Day CareRes hab 132,081$ 525,377$ 853,963$ 1,052,666$ 1,441,587$ 1,689,268$ 2,312,735$ 4,043,315$ $4,132,129 5,208,360$ 5,363,675$ 5,582,351$ 5,632,727$ 5,102,456$ 5,339,255$ 5,234,694$ Day hab -$ -$ -$ 1,504$ 1,840$ 30,634$ 59,584$ 139,372$ $162,461 217,807$ 233,303$ 367,645$ 367,202$ 475,239$ 488,911$ 497,654$ Supported employment -$ -$ -$ -$ -$ -$ -$ 56,841$ $64,424 102,554$ 102,867$ 9,225$ 9,225$ 8,782$ 8,782$ 12,970$ Intensive Active Treatment/Therapy -$ -$ -$ -$ -$ -$ 5,486$ 69,398$ $109,542 534,608$ 572,998$ 810,005$ 818,539$ 890,196$ 959,573$ 976,985$ Environmental modifications -$ -$ 41,419$ 46,477$ 28,041$ 30,051$ 33,749$ 151,314$ $156,344 76,115$ 76,115$ 80,928$ 80,928$ 53,612$ 53,612$ 76,233$ Transportation -$ -$ 53$ 123$ 885$ 566$ 2,353$ 2,557$ $3,389 3,879$ 4,039$ 5,800$ 5,800$ 1,596$ 1,596$ 3,584$ Specialized equipment and supplies -$ 359$ 52,535$ 71,875$ 47,292$ 47,808$ 169,217$ 456,367$ $517,778 376,883$ 413,157$ 272,721$ 276,429$ 139,803$ 146,597$ 128,250$ Chore services -$ 3,633$ 5,327$ 4,296$ 8,096$ 15,295$ 23,817$ 58,340$ $58,412 77,728$ 81,385$ 93,523$ 93,523$ 37,851$ 94,073$ 20,542$ Meals -$ -$ -$ -$ -$ -$ -$ -$ -$ -$ -$ RSLASpecialized private duty nursing
159,382$ 680,900$ 1,239,277$ 1,580,350$ 2,001,577$ 2,287,044$ 3,310,158$ 5,999,576$ $6,262,835 7,792,034$ 8,103,189$ 8,424,700$ 8,498,466$ 7,967,208$ 8,410,314$ 8,114,034$ Cost Per User 14,489$ 19,454$ 21,367$ 22,258$ 27,048$ 27,227$ 29,555$ 42,251$ $42,604 42,813$ 42,425$ 42,335$ 41,659$ 40,036$ 38,403$ 37,740$

State of Alaska Department of Health and Social Services
ALASKA LONG TERM CARE AND COST STUDY
FINAL REPORT
Page 166
APPENDIX L: NURSING HOME BED DEMAND AND ESTIMATED FUTURE COSTS The chart below, taken from the System Analysis presented in Appendix A, shows that the growth of licensed beds has leveled off since the early 1990’s. While Alaska has transitioned individuals out of the state’s nursing facilities, nursing homes still continue to provide needed services to individuals requiring the appropriate level of care.
Trend of Licensed Nursing Home Beds in Alaska, 1967-2005
0100200300400500600700800
1967
1970
1973
1976
1979
1982
1985
1988
1991
1994
1997
2000
2003
Source: Health Planning and Systems Development, Alaska Department of Health
and Social Services. PCG found little data to support a near term increase in the number of licensed beds, based on our review of current nursing home utilization (detailed in the System Analysis section within this report), national trends, our recommendations for the state’s log term care programs, as well as the continuation of current licensing and program practices within the state. 46 Because there is expected to be a doubling of potential long term care users over the next 20 years, it is implied that the state will need some expansion of its nursing beds. However, we project that the growth of nursing home beds in Alaska could remain flat for the next 5 to 7 years, if Alaska were to:
• promote the further expansion of capacity in the state’s home and community-based long term care services;
• continue to support a system of consumer-direction and individual choice, which in turn
will broaden the range of long term care providers instead of the over-utilization of certain long term care provider types and the under-utilization of others;
• consider the implementation of recommendations included within this report, which seek
to increase the capacity of community supports and services utilized by Alaska consumers of long term care. Among these programmatic recommendations are to ensure that PCA services are available throughout the rural areas of the state, to consider the addition of personal care services to the MRDD waiver program, to develop capacity for
46 See also the Information Insights “Long Term Care Services Survey & Recommendations for Change to Alaska Long Term Care Certificate of Need Regulations” Final Report, October 2000.

State of Alaska Department of Health and Social Services
ALASKA LONG TERM CARE AND COST STUDY
FINAL REPORT
Page 167
crisis placements and/or crisis response teams, and to begin a PACE program in the state’s rural areas.
• consider the incorporation of new national best practices that arise over the next 10 years
that include the goals of reducing nursing home care and concurrently increasing community living options; and,
• utilize all available capacity in the state’s nursing homes and Pioneer Homes. (As stated
in the System Analysis, at present, overall occupancy in the state’s nursing homes and Pioneer Homes is approximately 80%, with incremental bed growth allowed. In addition, state licensing allows for the use of “swing placements,” which provide added nursing home bed capacity. The remaining 20% of occupancy room, along with incremental bed growth and swing beds, will allow for nursing bed growth to remain flat over the next 5 to 7 years.)
However, within 10 years of this report, additional nursing home capacity will be needed in the state, specifically in the North Slope, Northwest Arctic and Bristol Bay, Lake, and Peninsula area in the Southwest of the state. This nursing bed need is anticipated by PCG due to the population growth projected for 2025 (please see population projections earlier in this section) in combination with the current utilization of the nursing homes in these areas. Over the long term, the State should be cautious about building capital projects given the decline in older populations after baby boomers. Therefore, the needs for more nursing capacity should be revisited in 2010. The July 2003 “Alaska State Veterans Home Feasibility Study” prepared for the Alaska State Legislature Legislative Budget and Audit Committee found that it would take about $9.8 million to build a new 60-bed free standing facility near Anchorage of 30 beds of nursing level of care and 30 of assisted living.
State of Alaska Department of Health and Social Services
ALASKA LONG TERM CARE AND COST STUDY
FINAL REPORT
Page 168
APPENDIX M: DATA ANALYSIS OF LONG TERM CARE SERVICES IN ALASKA CENSUS AREAS
The following tables have been developed using MMIS data and support PCG’s analysis concerning the distribution of long term care services among Alaska census areas. The analysis presented here is intended to demonstrate the disparity in services among the Alaska census areas and reinforces our recommendation to expand PCA services to rural areas. At present, the Northwest, Interior, and Southwest census areas have the greatest gaps between provider locations, consumers, service provision, and dollars expended for services. For example, Anchorage has about 40% of the 60+ population as residents, 48% of the state’s providers, 52% of LTC consumers, and 57% of the total amount expended on LTC; which implies that fewer dollars per person are spent on LTC in the more rural areas of the state. Table M-1 shows the current location of Medicaid providers throughout the state. The table shows that in FY 2005, 6 of the 26 census areas had no home and community-based providers, while another 11 had three or fewer providers, with the largest numbers located in the Anchorage, Fairbanks, and Juneau metropolitan areas. This same pattern exists for the 112 care coordination agencies who submitted bills to the MMIS during FY05—9 of the 26 census areas had no care coordination agencies, 12 areas had three or fewer care coordination agencies, with the majority located in urban areas.

State of Alaska Department of Health and Social Services
ALASKA LONG TERM CARE AND COST STUDY
FINAL REPORT
Page 169
Table M-1: Distribution of Residents and Medicaid Enrolled Providers by Geographical Area
60+ Pop. From ACA State Plan
% Residents in
Area
FY05 Total LTC Providers
FY05 % of Providers
Care Coordination
agenciesCare
CoordinatorsHCBS
Providers
Personal Care
Agencies
Residential Supported
Living
North Slope Borough 504 0.97% 3 0.41% 1 1 1 0 0Northwest Arctic Borough 495 0.95% 3 0.41% 1 0 2 0 0
Nome Census Area 803 1.54% 5 0.68% 1 2 2 0 0Total Northwest Population 1,802 3.46% 11 1.49% 3 3 5 0 0
Denali Borough 120 0.23% 0 0.00% 0 0 0 0 0Fairbanks North Star Borough 5,723 10.98% 61 8.25% 6 24 13 7 11Yukon-Koyukuk Census Area 671 1.29% 0 0.00% 0 0 0 0 0
Southeast Fairbanks Census Area 602 1.16% 10 1.35% 2 1 5 2 0Total Interior Population 7,116 13.65% 71 9.61% 8 25 18 9 11
Wade Hampton Census Area 506 0.97% 0 0.00% 0 0 0 0 0Lake and Peninsula Borough 156 0.30% 0 0.00% 0 0 0 0 0
Bethel Census Area 1,086 2.08% 12 1.62% 2 6 3 1 0Dillingham Census Area 414 0.79% 6 0.81% 1 2 1 1 1
Bristol Bay Borough 92 0.18% 0 0.00% 0 0 0 0 0Aleutian Islands East Borough 151 0.29% 0 0.00% 0 0 0 0 0
Aleutian Islands West Census Area 235 0.45% 0 0.00% 0 0 0 0 0Total Southwest Population 2,640 5.07% 18 2.44% 3 8 4 2 1
Yakutat City and Borough 58 0.11% 1 0.14% 0 0 1 0 0Skagway-Hoonah-Angoon Census 417 0.80% 2 0.27% 0 0 2 0 0
Haines City and Borough 342 0.66% 4 0.54% 1 1 2 0 0Juneau City and Borough 2,746 5.27% 39 5.28% 7 16 10 3 3
Sitka City and Borough 1,058 2.03% 9 1.22% 1 4 2 1 1Wrangell-Petersburg Census Area 913 1.75% 7 0.95% 1 0 4 0 2Prince of Wales-Outer Ketchikan 602 1.16% 3 0.41% 0 0 2 1 0
Ketchikan Gateway Borough 1,516 2.91% 15 2.03% 3 2 4 3 3Total Southeast Population 7,652 14.68% 80 10.83% 13 23 27 8 9
Matanuska-Susitna Borough 5,114 9.81% 102 13.80% 21 16 36 6 23Kenai Peninsula Borough 5,285 10.14% 75 10.15% 12 7 32 8 16
Kodiak Island Borough 967 1.86% 9 1.22% 2 2 3 1 1Valdez-Cordova Census Area 869 1.67% 15 2.03% 2 4 5 4 0
Total Southcentral Population 12,235 23.48% 201 27.20% 37 29 76 19 40
Anchorage Municipality 20,672 39.66% 358 48.44% 48 76 73 22 139Total State Population 52,117 100.00% 739 100.00% 112 164 203 60 200
INTERIOR
NORTHWEST
ANCHORAGE
SOUTHCENTRAL
SOUTHEAST
SOUTHWEST
Source: Alaska State Plan on Aging and MMIS Data An unduplicated count of consumers 60+ currently utilizing home and community-based services is detailed in the next table, by geographical area.

State of Alaska Department of Health and Social Services
ALASKA LONG TERM CARE AND COST STUDY
FINAL REPORT
Page 170
Table M-2: Area Population Compared with Consumers of at Least One Medicaid
Home and Community-Based Service in FY 2005
60+ population
From ACA State Plan
% Population Unduplicated No. Consumers
FY05 % Recipients
Received Care Coordination
services
Received Care Coordinator
services
Received HCB
Provider Services
Received Personal
Care Services
North Slope Borough 504 0.97% 6 0.13% 6 6 6 0Northwest Arctic Borough 495 0.95% 6 0.13% 4 0 6 0
Nome Census Area 803 1.54% 13 0.28% 13 2 13 0Total Northwest Population 1,802 3.46% 25 0.53% 23 8 25 0
Denali Borough 120 0.23% 0 0.00% 0 0 0 0Fairbanks North Star Borough 5,723 10.98% 289 6.16% 266 228 209 289Yukon-Koyukuk Census Area 671 1.29% 0 0.00% 0 0 0 0
Southeast Fairbanks Census Area 602 1.16% 33 0.70% 11 1 9 33Total Interior Population 7,116 13.65% 322 6.86% 277 229 218 322
Wade Hampton Census Area 506 0.97% 0 0.00%Lake and Peninsula Borough 156 0.30% 0 0.00% 0 0 0 0
Bethel Census Area 1,086 2.08% 188 4.00% 90 17 78 188Dillingham Census Area 414 0.79% 43 0.92% 6 10 4 43
Bristol Bay Borough 92 0.18% 0 0.00% 0 0 0 0Aleutian Islands East Borough 151 0.29% 0 0.00% 0 0 0 0
Aleutian Islands West Census Area 235 0.45% 0 0.00% 0 0 0 0Total Southwest Population 2,640 5.07% 231 4.92% 96 27 82 231
Yakutat City and Borough 58 0.11% 5 0.11% 0 0 5 0Skagway-Hoonah-Angoon Census 417 0.80% 13 0.28% 0 0 13 0
Haines City and Borough 342 0.66% 7 0.15% 5 2 7 0Juneau City and Borough 2,746 5.27% 233 4.96% 226 133 187 233
Sitka City and Borough 1,058 2.03% 155 3.30% 35 57 31 155Wrangell-Petersburg Census Area 913 1.75% 26 0.55% 23 0 26 0Prince of Wales-Outer Ketchikan 602 1.16% 8 0.17% 0 0 8 3
Ketchikan Gateway Borough 1,516 2.91% 84 1.79% 84 12 83 47Total Southeast Population 7,652 14.68% 531 11.31% 373 204 360 438
Matanuska-Susitna Borough 5,114 9.81% 609 12.97% 609.00 247.00 434.00 462.00Kenai Peninsula Borough 5,285 10.14% 434 9.24% 364.00 232.00 400.00 434.00
Kodiak Island Borough 967 1.86% 43 0.92% 43.00 22.00 40.00 22.00Valdez-Cordova Census Area 869 1.67% 71 1.51% 29.00 43.00 55.00 71.00
Total Southcentral Population 12,235 23.48% 1,157 24.64% 1,045 544 929 989
Anchorage Municipality 20,672 39.66% 2,429 51.74% 1,753 942 1,543 2,429
Total State Population 52,117 4,695 3,567 1,954 3,157 4,409
SOUTHEAST
SOUTHCENTRAL
ANCHORAGE
NORTHWEST
INTERIOR
SOUTHWEST
Source: FY 2005 data on persons using services from MMIS by provider type and census area Note: Count of persons receiving services are not restricted by age To generate Table M-3, we reviewed the current distribution of persons 60+ in the state in order to project where this population will live in the future. This table is of note because the location of the 60+ population has a direct influence on the anticipated demand for long term care services in each geographical region. Table M-4 further shows the growth of older Alaskans by census areas.

State of Alaska Department of Health and Social Services
ALASKA LONG TERM CARE AND COST STUDY
FINAL REPORT
Page 171
Table M-3: Population of Geographical Areas within Alaska (For the Years 2008, 2015 and 2025)
60+ Pop. From
ACA State Plan % in area 2008 2015 2025
Additonal Pop 2008 to
2015
Additonal Pop 2008 to
2025
North Slope Borough 504 0.97% 781 1,115 1,475 334 694 Northwest Arctic Borough 495 0.95% 767 1,095 1,448 328 681
Nome Census Area 803 1.54% 1,244 1,776 2,349 532 1,105 Total Northwest Population 1,802 3.46% 2,792 3,986 5,272 1,194 2,480
Denali Borough 120 0.23% 186 265 351 79 165 Fairbanks North Star Borough 5,723 10.98% 8,868 12,659 16,745 3,791 7,876 Yukon-Koyukuk Census Area 671 1.29% 1,040 1,484 1,963 444 923
Southeast Fairbanks Census Area 602 1.16% 933 1,332 1,761 399 829 Total Interior Population 7,116 13.65% 11,027 15,741 20,821 4,714 9,794
Wade Hampton Census Area 506 0.97% 784 1,119 1,481 335 696 Lake and Peninsula Borough 156 0.30% 242 345 456 103 215
Bethel Census Area 1,086 2.08% 1,683 2,402 3,178 719 1,495 Dillingham Census Area 414 0.79% 642 916 1,211 274 570
Bristol Bay Borough 92 0.18% 143 204 269 61 127 Aleutian Islands East Borough 151 0.29% 234 334 442 100 208
Aleutian Islands West Census Area 235 0.45% 364 520 688 156 323 Total Southwest Population 2,640 5.07% 4,091 5,840 7,724 1,749 3,633
Yakutat City and Borough 58 0.11% 90 128 170 38 80 Skagway-Hoonah-Angoon Census Area 417 0.80% 646 922 1,220 276 574
Haines City and Borough 342 0.66% 530 757 1,001 227 471 Juneau City and Borough 2,746 5.27% 4,255 6,074 8,035 1,819 3,779
Sitka City and Borough 1,058 2.03% 1,639 2,340 3,096 701 1,456 Wrangell-Petersburg Census Area 913 1.75% 1,415 2,020 2,671 605 1,257
Area 602 1.16% 933 1,332 1,761 399 829 Ketchikan Gateway Borough 1,516 2.91% 2,349 3,353 4,436 1,004 2,086
Total Southeast Population 7,652 14.68% 11,858 16,926 22,389 5,069 10,531
Matanuska-Susitna Borough 5,114 9.81% 7,925 11,312 14,963 3,388 7,038 Kenai Peninsula Borough 5,285 10.14% 8,190 11,691 15,463 3,501 7,274
Kodiak Island Borough 967 1.86% 1,498 2,139 2,829 641 1,331 Valdez-Cordova Census Area 869 1.67% 1,347 1,922 2,543 576 1,196 Total Southcentral Population 12,235 23.48% 18,959 27,064 35,798 8,105 16,839
Anchorage Municipality 20,672 39.66% 32,034 45,727 60,484 13,693 28,451 Total State Population 52,117 100.00% 80,761 115,284 152,489 34,523 71,728
SOUTHCENTRAL
ANCHORAGE
NORTHWEST
INTERIOR
SOUTHWEST
SOUTHEAST
Note: 60+ populations taken from State Plan on Aging and 2000 U.S. Census. Columns may not sum due to rounding. Source: Alaska State Plan on Aging

State of Alaska Department of Health and Social Services
ALASKA LONG TERM CARE AND COST STUDY
FINAL REPORT
Page 172
Table M-4: Estimated Demand for LTC Services by Geographical Area, FY 2008 to FY 2015
% Residents in Area
Additional Pop 60+ 2008
to 2015Ages 60-64
Ages 65-74
Ages 75-84 Ages 85+
North Slope Borough 0.97% 334 122 131 60 20 Northwest Arctic Borough 0.95% 328 120 129 59 20
Nome Census Area 1.54% 532 195 209 96 32 Total Northwest Population 3.46% 1,194 437 468 216 73
Denali Borough 0.23% 79 29 31 14 5 Fairbanks North Star Borough 10.98% 3,791 1,386 1,488 685 232 Yukon-Koyukuk Census Area 1.29% 444 163 174 80 27
Southeast Fairbanks Census Area 1.16% 399 146 156 72 24 Total Interior Population 13.65% 4,714 1,724 1,850 852 288
Wade Hampton Census Area 0.97% 335 123 132 61 20 Lake and Peninsula Borough 0.30% 103 38 41 19 6
Bethel Census Area 2.08% 719 263 282 130 44 Dillingham Census Area 0.79% 274 100 108 50 17
Bristol Bay Borough 0.18% 61 22 24 11 4 Aleutian Islands East Borough 0.29% 100 37 39 18 6
Aleutian Islands West Census Area 0.45% 156 57 61 28 10 Total Southwest Population 5.07% 1,749 640 686 316 107
Yakutat City and Borough 0.11% 38 14 15 7 2 Skagway-Hoonah-Angoon Census Area 0.80% 276 101 108 50 17
Haines City and Borough 0.66% 227 83 89 41 14 Juneau City and Borough 5.27% 1,819 665 714 329 111
Sitka City and Borough 2.03% 701 256 275 127 43 Wrangell-Petersburg Census Area 1.75% 605 221 237 109 37
Prince of Wales-Outer Ketchikan Census 1.16% 399 146 156 72 24 Ketchikan Gateway Borough 2.91% 1,004 367 394 182 61
Total Southeast Population 14.68% 5,069 1,854 1,989 917 310
Matanuska-Susitna Borough 9.81% 3,388 1,239 1,329 613 207 Kenai Peninsula Borough 10.14% 3,501 1,280 1,374 633 214
Kodiak Island Borough 1.86% 641 234 251 116 39 Valdez-Cordova Census Area 1.67% 576 211 226 104 35
Total Southcentral Population 23.48% 8,105 2,964 3,180 1,465 495
Anchorage Municipality 39.66% 13,693 5,008 5,374 2,476 836 Total State Population 38,579
SOUTHCENTRAL
ANCHORAGE
NORTHWEST
INTERIOR
SOUTHWEST
SOUTHEAST
Note: 60+ populations taken from State Plan on Aging and 2000 U.S. Census. Columns may not sum due to rounding. Source: Alaska State Plan on Aging

State of Alaska Department of Health and Social Services
ALASKA LONG TERM CARE AND COST STUDY
FINAL REPORT
Page 173
INDEX OF TABLES Table III-1 Estimated Consumers Served Annually by DHSS, Distributed by Target
Populations (FY05) Table IV-1 Distribution of Medicaid Long Term Expenditures, Institutional vs. Community-
Based Services, FY 2004 Table V-1 Alaska 2004 Native Active User Populations Table VI-1 Nursing Facility Reimbursement Methodology Summary Table VI-2 Pioneer Homes Reimbursement Methodology Summary Table VI-3 General Relief Assisted Living Facilities Reimbursement Methodology Summary Table VI-4 Personal Care Reimbursement Methodology Summary Table VI-5 OA Waiver Reimbursement Methodology Summary Table VI-6 APD Waiver Reimbursement Methodology Summary Table VI-7 MR/DD Waiver Reimbursement Methodology Summary Table VI-8 CCMC Waiver Reimbursement Methodology Summary Table VII-1 Alaska Census Areas Table VII-2 Alaska Population Change (By Age for the Years 2005, 2015, 2025) Table VII-3 Consumers of Medicaid LTC Services as Percent of Total Population, FY 2005 Table VII-4 Selected Medicaid LTC State and Federal Expenditures, 1997-2005 Table VII-5 Area Population Compared with Dollars Spent by Area for Medicaid Home and
Community-Based Services, FY 2005 Table VII-6 Estimates of New Consumers of Waiver Services, Nursing Homes, and Pioneer
Homes as Percent of Population in 2025 Table VII-7 Current State and Federal Medicaid Spending, Projected Forward 2005-2025
(Based on Annual Average Total Spending Rates by Program in Nominal Dollars)
Table VII-8 Current State and Federal Medicaid Spending Projected Forward 2005-2025 (Based on Spending Trends in Nominal Dollars)
Table VII-9 Recommendations for Administrative Actions Related to Program Activities Table VII-10 Recommendations for Administrative Actions Related to Reimbursement
Methods Table VII-11 Recommendations for Program Expansion and/or New Programs Table VII-12 Recommendations for Cost Savings Table VII-13 Report Recommendations with Financial Impacts and Estimated Timelines for
Implementation Table VII-14 The Fiscal Impact of PCG Recommendations Table A-1 Number of Licensed Nursing Home Placements in Alaska, FY 2001 – FY 2005 Table A-2 Nursing Home Occupancy Rates in Alaska, FY 2001 – FY 2005 Table A-3 Trend of Nursing Home Placements in Alaska, 1967-2005 Table A-4 Selected Data on Nursing Homes Table A-5 FY 2005 Occupied Placements in the Pioneer Homes Table A-6 Total Licensed and Occupied Placements of Pioneer Homes, FY 1997 – FY 2005 Table A-7 Occupancy Level by Level of Care Table A-8 Pioneer Homes Payment Assistance Program Table A-9 The General Relief Assisted Living Program Table A-10 Personal Care Assistant Program Changes, 2000-2006 Table A-11 Expenditures in Agency-Based PCA Services, FY 1997 – FY 2005

State of Alaska Department of Health and Social Services
ALASKA LONG TERM CARE AND COST STUDY
FINAL REPORT
Page 174
Table A-12 Expenditures in Consumer-Directed PCA Services, FY 1997 – FY 2005 Table A-13 Use of Personal Care Services by Persons on Medicaid Waivers, FY 2004 Table A-14 Summary of Alaska’s 1915(c) Waivers Table A-15 Comparison of Changes by Waiver, Years 2000-2004 Table A-16 The Number of Persons Using Waivers Table A-17 Residential and Day Habilitation Codes Table A-18 Example of Prior Authorization Screen Table A-19 Use of Personal Care by Persons on Waivers, FY 2005 Table A-20 Funding Information for Alaska’s Real Choice Systems Change Grant (As of
2005) Table A-21 Funding Information for Alaska’s Nursing Facility Transition Grant (As of 2005) Table A-22 Funding Information for Alaska’s C-PASS Grant (As of 2005) Table A-23 Funding Information for Alaska’s Quality Assurance and Quality Improvement
in HCBS Grant (as of 2005) Table A-24 Funding Methodology for Title III & V Programs Table B-1 Service Gaps in 2001 and 2003, As Reported by Minnesota Counties Table B-2 Minnesota’s MR/DD HCBS Waivers Table B-3 LTC Expenditures, Minnesota and Alaska Table B-4 Minnesota’s LTC Reimbursement Methodologies Table B-5 Michigan’s Current System of Long Term Care (As of December 2005) Table B-6 Michigan’s MR/DD HCBS Waivers Table B-7 LTC Expenditures, Michigan and Alaska Table B-8 Michigan’s LTC Reimbursement Methodologies Table B-9 New Mexico’s MR/DD HCBS Waivers Table B-10 Nursing Facility Residents by Primary Payer Source, 2001 Table B-11 LTC Expenditures, New Mexico and Alaska Table B-12 Maine’s MR/DD HCBS Waivers Table B-13 LTC Expenditures, Maine and Alaska Table B-14 Vermont’s Current System of Long Term Care (As of December 2005) Table B-15 Vermont’s MR/DD HCBS Waivers Table B-16 Nursing Facility Residents by Primary Payer Source, 2001 Table B-17 LTC Expenditures, Vermont and Alaska Table B-18 Wyoming’s Current System of Long Term Care (As of December 2005) Table B-19 Wyoming’s MR/DD HCBS Waiver Participants Table B-20 LTC Expenditures, Wyoming and Alaska Table B-21 Wyoming’s LTC Reimbursement Methodologies Table M-1 Distribution of Residents and Medicaid Enrolled Providers by Geographical Area Table M-2 Area Population Compared with Consumers of at Least One Medicaid Home and
Community-Based Service in FY 2005 Table M-3 Population of Geographical Areas within Alaska (for the Years 2008, 2015, and
2025) Table M-4 Estimated Demand for LTC Services by Geographical Area, FY 2008 to FY
2015

State of Alaska Department of Health and Social Services
ALASKA LONG TERM CARE AND COST STUDY
FINAL REPORT
Page 175
LIST OF ACRONYMS A&G Administrative and general percentages A/PIA Aleutian/Pribilof Islands Association AAC Alaska Administrative Code AAMR American Association on Mental Retardation ADRD Alzheimer’s Disease and Related Dementias AMHTA The Alaska Mental Health Trust Authority APD Adults with Physical Disabilities APS APS Healthcare, Inc. BBAHC The Bristol Bay Area Health Care Foundation BBNA The Bristol Bay Native Association CalPERS State of California public employees’ retirement system CCMC Children with Complex Medical Conditions CDDG Community Developmental Disabilities Grant Program CFR Code of Federal Regulations CMS Centers for Medicaid Services CON Certificate of Need CORE The Core Services Program C-PASS Community Integrated Personal Assistance Services and Supports DAB U.S. Health and Human Services Departmental Appeals Board DBH Division of Behavioral Health DD Developmental Disability/Disabilities DHCS Division of Health Care Services DHHS-HRSA U.S. Department of Health and Human Services-Health Resources and Services
Administration DHSS Department of Health and Social Services DMHDD Department of Mental Health and Developmental Disabilities DOA Department of Administration DRA Deficit Reduction Act of 2005 DSDS Division of Senior and Disabilities Services DSS Division of Senior Services EAT The Eastern Aleutian Tribes FFP Federal Financial Participation FMAP Federal Medal Assistance Percentage FMS Finance and Management Services FTE Full Time Employee FY Fiscal Year GF General Funds HB House Bill HCBS Home and Community-Based Services IADL Instrumental Activity of Daily Living ICF/MR Intermediate Care Facility for the Mentally Retarded IHS Indian Health Service LOC Level of Care LTC Long Term Care LTCI Long Term Care Insurance MECARE Maine’s automated consumer assessment information system

State of Alaska Department of Health and Social Services
ALASKA LONG TERM CARE AND COST STUDY
FINAL REPORT
Page 176
MH/DD Mental Health / Developmental Disabilities MHTAAR Mental Health Trust Authority Projects MMIS Medicaid Management Information System MRDD Mental Retardation / Developmental Disabilities Waiver MSHO Minnesota Senior Health Options NAMI National Alliance on Mental Illness NF Nursing Facilities NFT Nursing Facility Transition plan NH Nursing Homes NSB The North Slope Bureau NSHC The Norton Sound Health Corporation OA Older Alaskans Waiver OAA Older Americans Act PACAP Public Assistance Cost Allocation Plan PACE Program for All-Inclusive Care for the Elderly PCA Personal Care Attendant PCAT Personal Care Assessment Tool PCG Public Consulting Group, Inc. QA Quality Assurance RFP Request for Proposals RWJ Robert Wood Johnson Foundation SA/DD Substance Abuse / Developmental Disability SAMHSA Substance Abuse and Mental Health Services Administration SCF Southcentral Foundation SNF Skilled Nursing Facility SRS Senior Residential Services SS/MH Senior Services / Mental Health SS/SA Senior Services / Substance Abuse SSI Supplemental Security Income STAR Short Term Assistance and Referral Program SUA State Unit on Aging SWCAP Statewide Cost Allocation Plan TBI Traumatic Brain Injury TCM Targeted Case Management TEFRA Tax Equity and Fiscal Responsibility Act VA Veteran’s Administration YKHC The Yukon-Kuskokwim Health Corporation