Embed Size (px)
Citation preview

Submitted to:
Pennsylvania Commission on Crime and Delinquency
Prepared by:
Karen Shastri, Ph. D. Katz Graduate School of Business
University of Pittsburgh
Holly Wald, Ph.D. HPW Associates, LLC
William Nearhoof
WCN Consulting, Inc.
Raymond Aull CBIZ Trilinc Consulting, Inc.
Fall 2003
FINAL REPORT
A PROCESS EVALUATION OF THE PCCD-FUNDED OFFENDER PROCESSING TECHNOLOGY
LIVE SCAN AND CPIN

TABLE OF CONTENTS
EXECUTIVE SUMMARY ……………………………………………………... i
I. INTRODUCTION ..................................................................................................... 1 A. Background............................................................................................................. 1 B. Booking Process and Configuration of the Technology......................................... 2 C. Goals of This Project .............................................................................................. 3
II. RESEARCH METHODOLOGY, INSTRUMENTATION AND ANALYSIS........ 4 A. Research Methodology ........................................................................................... 4 B. Data Collection Instruments ................................................................................... 5
1. Mail Survey......................................................................................................... 5
2. Site Visits ............................................................................................................ 6 3. Technical Assessment......................................................................................... 6 4. State Level Interviews......................................................................................... 6 5. Secondary Data ................................................................................................... 6
C. Presentations of Findings by Research Question.................................................... 7 III. RECOMMENDATIONS......................................................................................... 27 Map 1 .................................................................................................................................. 8 Map 2 ................................................................................................................................ 14 Map 3 ................................................................................................................................ 19 Map 4 ................................................................................................................................ 23

i
EXECUTIVE SUMMARY
In April 2002, the Pennsylvania Commission on Crime and Delinquency (PCCD) funded a statewide process evaluation of offender processing technology. First, the Live Scan system provides booking centers with computer technology to digitally capture fingerprints and demographic information from arrested individuals for processing by Automated Fingerprint Identification System (AFIS). Second, the Commonwealth Photo Imaging Network (CPIN) is a digital photo technology network throughout the state that captures photographs and allows the images to be searched and viewed for investigative purposes.
There are primarily two types of processes for booking an arrestee. In the first scenario, the suspect is taken to the police department by the arresting officer where the initial paperwork is completed. Formal booking occurs by first capturing a digital photograph of the arrestee followed by securing fingerprints .that are transmitted to the PSP Central Repository to determine if the individual has a previous criminal history. A RAP sheet is sent back for those individuals who are already in the system that includes a State Identification Number (SID). If the individual is not found in the system, a new SID is generated. The arrestee is then held for a preliminary arraignment, which takes place in the office of the DJ or in some instances, via video arraignment. Each arrest has its own unique Offense Tracking Number (OTN). If an OTN is not supplied by the arresting office conducting the booking, an OTN is assigned by the Central Repository and returned with the RAP information through the Commonwealth Law Enforcement Activity Network (CLEAN). The OTN is then supplied to the DJ at the time of the arraignment.
In the second scenario, the officer obtains basic information on the individual at the time of apprehension and is released. For example, offenses such as Driving under the Influence (DUI) or retail theft will be processed in this manner. A complaint is filed with the DJ, who issues a fingerprint order and a summons to appear at an arraignment hearing. The suspect is provided a deadline to appear at the identified police department to be fingerprinted and formally booked.
With each scenario, in frequent cases the arraignment occurs without any
information regarding the previous criminal history of the suspect, that is, the RAP sheet. Although the format for the booking process is similar, the booking configuration
varies by locality and type of police department. Some have centralized booking centers; others have regionalized centers. Typically, the staff at these sites is specially trained for and dedicated to the task of booking offenders. For the former, the arresting officer brings the suspect to one of these locations and is able to return to the streets since his/her services are not needed to process the individual. Examples of centralized facilities include the Berks County Sheriff’s Office and the Cumberland County District Attorney’s Office. Philadelphia utilizes a regionalized system where there are booking

ii
centers in several locations across the city. In each of the examples, individuals are booked, held and arraigned at these locations by using video conferencing technology.
In the more traditional approach, the arresting officer performs the actual booking
that is he/she completes the paperwork, captures the photographs and prints, waits to receive the RAP sheet and escorts the suspect to the DJ’s office for the preliminary arraignment. This type of configuration is the model used by the Pennsylvania State Police as well as a number of local police departments. Based upon the DJ’s decision, the officer will escort the arrestee to the county jail or back to the community in which the suspect resides. In some instances, however, the arresting officer for the PSP does not personally photograph or fingerprint the suspect. Instead, the arrestee is instructed to return to the police barracks when a Records and Identification (R&I) officer is available to perform these activities.
Five primary aspects serve as the foundation for this project:
• utilization • access to the equipment and the generated output • technology, with respect to the reliability and infrastructure • training and technical support • public safety • saturation
The purpose of this study is to present a descriptive analysis of the strengths, weaknesses, benefits and impacts of Live Scan and CPIN. Data sources used in the evaluation are: mail surveys complete by Primary Users/Operators, Managers of departments with equipment, Managers of departments that use the equipment at other sites, i.e. Secondary Users, District Attorneys (DA), and District Justices/Magistrates/Bail Commissioners (DJ); site visits to 10 randomly selected counties distributed by region of the state; technical infrastructure assessment, interviews of state agencies that utilize the output from the system; and secondary data sources, including fingerprint quality reports generated by the PSP and the Pennsylvania Uniform Crime Reports.
The five PCCD-research questions that are addressed serve as the focus of this report. They include:
1. How accessible is the offender identification equipment to police and prosecutors, and is the technology being used by other agencies in the local or regional area?
2. What is the current utilization rate of the equipment at existing sites?
3. Has statewide use of the computer technology equipment led to improved public safety, and have we improved the quality, accuracy, and timeliness of offender identification and processing through technological advances?
4. Is the current infrastructure sufficient to support the statewide network of Live Scan fingerprinting and digital photos technology? If not, how can improvements be most efficiently implemented?
iii
5. Have we reached a “saturation” point in terms of placing this technology across the state? If not, how should the network be expanded?
A multimodal approach was used in the evaluation of the offender processing
technology. It consisted of the following:
• Mail survey of primary and secondary users • Site visits at a random sample of locations across the states that house the systems
or have access to the output of the systems • Telephone survey of state level agency representatives • Technical assessment at the state and site level, which consisted of interviews
and physical inspections of the systems. • Secondary data consisting of quality reports compiled by the PSP to evaluate the
quality of the prints submitted by the Live Scan sites, and Uniform Crime Reports for each of the counties in the Commonwealth.
General Findings
Overall, the technology is being accessed by the local and state police. Secondary
police tend to access the equipment more through local police departments that the PSP. Further, DAs and DJs have access to the RAP sheets but in many cases are unaware of how it is generated. DJs do not always use the criminal histories available from this technology for various reasons as previously described. Use of the RAP sheet may increase awareness of an offender’s previous history and aid in public safety. DAs use the RAP sheets for preliminary hearings, but attaining this information is dependent upon the system that transmits it, which should also be reviewed.
The technology and the output from the technology are being utilized both at the
local and state level. However, the results also indicate that the equipment is not being utilized to its fullest potential. Factors that need to be addressed include the availability of appropriate and frequent training, standards for using the system based on the type of offense, using dedicated staff to operate the equipment, and educating staff in how to access and use the output from the system in performing other law enforcement functions.
In terms of public safety, there is no evidence to suggest that arrest rates have
changed as a result of having the technology in place. However, it may be a function of the short time period used to analyze arrest rates.
Some of the benefits related to public safety include:
• Faster turnaround time in receiving the RAP sheet from the PSP Central Repository
• Faster turnaround time from apprehension to the time of preliminary arraignment • Faster identification of suspects

iv
• Reduction in duplication of records, in particular, when booking arrestees with multiple offenses. However, there is also a likelihood of utilizing more time that would affect public
safety if the officer inputs data infrequently. This may slow down the process considerably if he/she was not comfortable with using the equipment, did not understand the training for the equipment or did not receive adequate training for using the equipment. In this case, the booking may take longer than the reported average of 20 minutes.
Time savings exist when police are able to drop off a suspect for processing and
return to patrol. However, for police employed in communities where they must travel to a booking site, there is a trade-off between the time saved using the electronic process and the additional time consumed in the following areas that are not necessarily mutually exclusive:
• Traveling to the booking site • Booking the arrestee personally and doing it on an infrequent basis • Two officers may be required by their respective department to accompany the
offender to the booking site • The officer(s) may be required to stay with the arrestee until the time of the
preliminary arraignment With respect to the technology infrastructure, the telecommunications
connections are reliable and do not significantly affect the availability of or the ability to use the equipment. There was some variation related to the wait between the time the photographing and fingerprinting processes were completed and when the RAP sheets began to print, that is, from five minutes on the lower end to thirty minutes on the upper end.
There was a general consensus that the interface and functionality of the CPIN
upgrade were far superior to the previous version. However, according to the users, it was noticeably slower.
Additionally, there are concerns related to backup schedules for the CPIN data
and contingency plans in case of power surges or outages. Based on analyses related to expansion, additional sites are needed. For
expansion purposes, costs and savings both indirect and tangible need to be identified and analyzed.
Additionally, factors to consider include:
• The Live Scan/CPIN sites are primarily located in areas with a population of at least 100,000. The only counties that do not have the equipment but have a population size meeting those criteria are Mercer and Monroe
• The sites are primarily located in higher crime areas with the exception of Mercer, Monroe, Lawrence, Crawford, Clearfield and Somerset

v
• The sites with the greatest square mileage and the lowest arrests do not have the equipment and may not need to have it due to the low volume of arrests
• The counties with the largest square mileage do not have the equipment. The above factors should be considered in determining whether and where other
sites should be added to house the equipment. Other aspects to be considered include whether additional expansion is needed in the more heavily populated areas or within a concentrated area, as well as the type of configuration for housing the equipment. For example, should it be centralized or regionalized. The justification for centralized facilities is that everything occurs in the same location; the arresting officer can leave the arrestee at the site and return to patrol. However, transportation time may be costly to the police department without the equipment. Regionalized facilities can serve the same function as centralized but they could be situated in strategic corners of the county, therefore reducing travel time for arresting officers. Political factors also need to be considered, as some police departments may be resistant towards having booking activities being specific to a particular department or staff member.
In conclusion, based on the above analyses as well as the surveys and site visits,
more sites should be identified to house the Live Scan and CPIN equipment. Given that one of the aims of this technology is improved public safety, which is achieved by quickly identifying and processing arrestees, it is important to have a more complete statewide database.
Recommendations
Access and Utilization • Marketing the equipment to other police departments as well as other organizations
that need criminal histories • Determining the best configuration for a specific location, i.e., centralized,
regionalized, or free standing • Exploring other mechanisms for sharing of technology and resources, as learned in
State College and Erie • Processing activities should be conducted by dedicated staff • Developing an initial training model to be used for statewide training for Live Scan
and CPIN that includes the booking process. Suggested models are o At specific sites o Through the State Police Academy utilizing the equipment and includes
hands-on operations o Through MPOTEC utilizing the equipment and includes hands-on
operations • Developing an ongoing training model for staff to be conducted on a regular basis
o Using continuing education credits as a mechanism for ensuring the appropriate personnel are regularly trained
• Educating criminal justice employees in utilizing the systems to its fullest potential, e.g. lineups and ids
vi
• Develop standards for the booking process, i.e., booking at time of apprehension vs. fingerprint orders
Public Safety • Encouraging DJs to utilize RAP sheets • Using JNET as a vehicle for accessing RAP sheets • Discouraging the use of manual fingerprinting • Ensuring that dispositions and other appropriate are recorded on the RAP sheet • Developing quality assurance procedures • Developing a more comprehensive outcome study concerning the Live Scan and
CPIN technology with respect to arrests and criminal activity Infrastructure • Providing a mechanism to correct errors in the criminal history input after it has been
submitted to the Central Repository • Exploring cost effective alternatives for connecting to PSP through utilizing existing
high speed connections • Studying tradeoffs related to staff and travel time in determining the configuration of
a booking site • Exploring the benefits of integrating and creating other reporting systems • Replacing current Live Scan printers with newer more reliable models capable of
producing higher quality prints • Issuing a set of CPIN database backup procedures that includes a specified individual
to monitor the backup at all locations • Developing a CPIN and Live Scan disaster recovery plan at each location • Encouraging locations to create custom photo databases where appropriate to increase
the utilization of the technology Expansion • Evaluating the costs (indirect and tangible) of any future expansion needs • Taking into consideration political factors related to the configuration of a booking
site • Evaluate the resources for funding the expansion, e.g. county resources • Including areas with high crime rates that do not have the technology in expansion
plans
1
I. INTRODUCTION
A. Background In March 2002, the Pennsylvania Commission on Crime and Delinquency
(PCCD) funded a statewide process evaluation of offender processing technology, Live Scan and CPIN. Live Scan, the fingerprint technology, has been utilized in Pennsylvania since 1989. Several factors contributed to this adoption of Live Scan within the Commonwealth, that is, missing records related to the arrest of criminals, a labor intensive fingerprinting process, and poor quality fingerprints that were never re-taken and re-submitted to the Pennsylvania State Police (PSP) Central Repository. This device was first installed in the Lower Paxton Police Department for monitoring and evaluation purposes. Additionally, the acquisition of an Automated Fingerprint Identification System (AFIS) in 1990 allowed for automated processing of fingerprint cards as well as crime scene latent fingerprints.
Following the installation of the AFIS, further technology was deployed that took
advantage of the processing capabilities of the AFIS. In June 1996, the Commonwealth, with the cooperation of Pennsylvania Chiefs Police Association (PA Chiefs), procured 43 electronic Live Scan fingerprint devices. These devices were strategically located around the Commonwealth and allowed for the electronic fingerprint images to be manually input to the AFIS. In October 1997 these electronic images were transmitted via a communications network to the Central Repository providing the beginning of a totally automated process.
The Philadelphia Police Department also processed fingerprints for their own
internal use and procured their own AFIS. In March 1998, the PSP Central Repository and the Philadelphia Police Department installed an automated connection between the two, which provides an electronic link between the largest local department in the state and the Central Repository; resulting in real time processing of fingerprints.
An additional need existed for law enforcement and other criminal justice
agencies to capture, share and access photographs of individuals who were arrested or incarcerated. The Philadelphia Police Department had installed and made an automated mug shot system operational in 1984. In June 2000, the Commonwealth Photo Image Network (CPIN) became totally operational using the Philadelphia system as a model. Image capture equipment was procured and interfaced to the Live Scan equipment located in the various agencies throughout the state. These two input media were totally integrated with the existing AFIS and the Automated Criminal History System.
To date there are electronic Live Scan and CPIN systems located in local law
enforcement and State Police agencies, as well as various prisons and probation/parole offices.

2
B. Booking Process and Configuration of the Technology There are primarily two types of processes for booking an arrestee. In the first
scenario, the suspect is taken to the police department by the arresting officer where the initial paperwork is completed. Formal booking occurs by first capturing a digital photograph of the arrestee followed by securing fingerprints .that are transmitted to the PSP Central Repository to determine if the individual has a previous criminal history. A RAP sheet is sent back for those individuals who are already in the system that includes a State Identification Number (SID). If the individual is not found in the system, a new SID is generated. The arrestee is then held for a preliminary arraignment, which takes place in the office of the DJ or in some instances, via video arraignment. Each arrest has its own unique Offense Tracking Number (OTN). If an OTN is not supplied by the arresting office conducting the booking, an OTN is assigned by the Central Repository and returned with the RAP information through the Commonwealth Law Enforcement Activity Network (CLEAN). The OTN is then supplied to the DJ at the time of the arraignment. Additionally, an Offense Tracking Number (OTN) is assigned when the DJ’s office enters the information for the arrest into their Administrative Office of Pennsylvania Courts (AOPC) system. If the county has a bail office, a bail interview is conducted and the bail recommendation is faxed by the bail office to the DJ. The DJ then sets bail at the preliminary arraignment; however, if there is no bail office, the DJ is directly responsible for setting bail. Once the person makes bail he/she is released. Otherwise, he/she is held at the county prison. Alternatively, if the DJ decides the crime is too serious for bail, the offender is transported to jail with no chance of release through bail.
In the second scenario, the officer obtains basic information on the individual at
the time of apprehension and is released. For example, offenses such as Driving under the Influence (DUI) or retail theft will be processed in this manner. A complaint is filed with the DJ, who issues a fingerprint order and a summons to appear at an arraignment hearing. The suspect is provided a deadline to appear at the identified police department to be fingerprinted and formally booked.
With each scenario, in frequent cases the arraignment occurs without any
information regarding the previous criminal history of the suspect, that is, the RAP sheet. Although the format for the booking process is similar, the booking configuration
varies by locality and type of police department. Some have centralized booking centers; others have regionalized centers. Typically, the staff at these sites is specially trained for and dedicated to the task of booking offenders. For the former, the arresting officer brings the suspect to one of these locations and is able to return to the streets since his/her services are not needed to process the individual. Examples of centralized facilities include the Berks County Sheriff’s Office and the Cumberland County District Attorney’s Office. Philadelphia utilizes a regionalized system where there are booking centers in several locations across the city. In each of the examples, individuals are booked, held and arraigned at these locations by using video conferencing technology.

3
In the more traditional approach, the arresting officer performs the actual booking that is he/she completes the paperwork, captures the photographs and prints, waits to receive the RAP sheet and escorts the suspect to the DJ’s office for the preliminary arraignment. This type of configuration is the model used by the Pennsylvania State Police as well as a number of local police departments. Based upon the DJ’s decision, the officer will escort the arrestee to the county jail or back to the community in which the suspect resides. In some instances, however, the arresting officer for the PSP does not personally photograph or fingerprint the suspect. Instead, the arrestee is instructed to return to the police barracks when a Records and Identification (R&I) officer is available to perform these activities.
C. Goals of This Project Five primary aspects serve as the foundation for this project:
• utilization • access to the equipment and the generated output • technology, with respect to the reliability and infrastructure • training and technical support • public safety • saturation
The purpose of this study is to present a descriptive analysis of the strengths, weaknesses, benefits and impacts of Live Scan and CPIN. Data sources used in the evaluation are: mail surveys complete by Primary Users/Operators, Managers of departments with equipment, Managers of departments that use the equipment at other sites, i.e. Secondary Users, District Attorneys (DA), and District Justices/Magistrates/Bail Commissioners (DJ); site visits to 10 randomly selected counties distributed by region of the state; technical infrastructure assessment, interviews of state agencies that utilize the output from the system; and secondary data sources, including fingerprint quality reports generated by the PSP and the Pennsylvania Uniform Crime Reports.
The five PCCD-research questions that are addressed serve as the focus of this report. They include:
1. How accessible is the offender identification equipment to police and prosecutors, and is the technology being used by other agencies in the local or regional area?
2. What is the current utilization rate of the equipment at existing sites?
3. Has statewide use of the computer technology equipment led to improved public safety, and have we improved the quality, accuracy, and timeliness of offender identification and processing through technological advances?
4. Is the current infrastructure sufficient to support the statewide network of Live Scan fingerprinting and digital photos technology? If not, how can improvements be most efficiently implemented?
4
5. Have we reached a “saturation” point in terms of placing this technology across the state? If not, how should the network be expanded?
The primary purpose of this evaluation is to provide information that addressed the above questions and offer recommendations for improvement, where needed. The following sections provide a synopsis of the research methodology; findings that relate to the PCCD research based questions; and recommendations relevant to this technology.
II. RESEARCH METHODOLOGY, INSTRUMENTATION AND ANALYSIS
A. Research Methodology A multimodal approach was used in the evaluation of the offender processing
technology. It consisted of the following:
• Mail survey of primary and secondary users: o Primary users were defined as individuals who manage the location that
houses the technology and the operators who perform the booking process utilizing the Live Scan and CPIN systems
o Secondary users were defined as individuals who have access to the output of the technology, i.e. DA and DJ, as well as police departments that utilize the technology at the primary location.
o The Interim Report provides in-depth findings of the mail survey for the primary users and the managers of these sites (See Attachment I.).
• Site visits at a random sample of locations across the states that house the systems or have access to the output of the systems o The Site Visit Report provides in-depth findings of the site visits (See
Attachment II.). • Telephone survey of state level agency representatives
o The purpose of determining the usage of the output from the process. State agencies that participated in the survey are: Attorney General’s office, Justice Network (JNET), Pennsylvania State Police, Administrative Office of Pennsylvania Courts (AOPC), Department of Corrections, Juvenile Court Judges’ Commission (JCJC), and the Pennsylvania State Parole Board.
o The State Representative Interview Report provides in-depth findings from the interviews (See Attachment II.).
• Technical assessment at the state and site level, which consisted of interviews and physical inspections of the systems. o The Technical Infrastructure Assessment Report provides in-depth findings
resulting from the technical assessment (See Attachment II.). • Secondary data consisting of quality reports compiled by the PSP to evaluate the
quality of the prints submitted by the Live Scan sites, and Uniform Crime Reports for each of the counties in the Commonwealth.

5
B. Data Collection Instruments
1. Mail Survey A closed ended self-administered questionnaire for the Primary Users was
comprised of several sections:
• Demographics • Equipment usage: purpose, types of prints/photos, and frequency of use • Satisfaction with system: turnaround time, training, support, and maintenance • Comparisons to prior system used, if applicable • Factors that affect use of technology • Types of arraignments used: video or other • Suggestions to improve use of technology, if applicable • Comments regarding the processes
A survey was also mailed to the managers of the police stations/booking
centers/troops where Live Scan and CPIN were used in the Commonwealth. Questions similar to those for the operators were posed to these department heads in the closed ended section. Additionally, several other sections were included in this survey:
• Closed Ended Questions • Booking configuration for the county • Contractual relationships with other organizations for providing/offering
o Live Scan and CPIN services: names, types, fees, and frequency of use • Open Ended Questions were also posed to determine additional information
related to costs and benefits Further, surveys were sent to those parties that use the information generated by
Live Scan and CPIN, but do not directly input the data on arrestees. These surveys sought to determine the extent to which other parties were aware of how the RAP sheet and other pertinent information were generated by Live Scan and CPIN. The District Attorneys and a sample of District Justices/Magistrates/Bail Commissioners were the primary respondents to the Secondary User Survey. Specific questions included:
• Demographic information similar to that requested from the Primary Users • Reason for receiving information • Types and volume of output received from Live Scan and CPIN • Levels of satisfaction with the information received: quality and turnaround time • Comparisons to prior system used, if applicable • Factors that affect usage of technology • Types of arraignments used • Suggestions to improve use of technology, if applicable • Comments regarding the processes

6
2. Site Visits Site visits were conducted at local and state police locations in 10 counties in the
state and were representative of the current regions where Live Scan and CPIN are in use. A total of 9 local, 4 PSP, 2 sheriff and 1 district attorney departments were visited.
Managers of the departments and operators (where available) and police who use the equipment of the primary site (where available) were personally interviewed. The interview schedule addressed the following areas:
• Number of Live Scan and CPIN sites in the county • Utilization of the respective sites • Booking process • Training received and sufficiency of training • Impact of the technology on public safety and crime solving, cooperation among
law enforcement agencies, information sharing, efficiency in processing arrestees, and resource sharing
• Sufficiency of Live Scan and CPIN sites • Sufficiency of resources related to the purchase and support of the technology
Managers were also asked to provide information related to cost and focused on the costs to maintain and operate the systems. DAs and DJs were also interviewed to determine their perceptions and knowledge related to how the criminal history is generated: access to the RAP sheet, generation of it, methods used to obtain criminal histories, and satisfaction with the current methods and information provided.
Finally, a technology assessment was conducted that focused on communications and the network, platform and database, and devices needed to utilize the technology.
3. Technical Assessment The technical assessment was conducted at two levels, state and local department.
It consisted of interviews at the state level and technical assessments at the sites visited that house the equipment.
4. State Level Interviews As mentioned above, representatives from seven state agencies participated in a
telephone interview. Aspects discussed include the representative’s involvement in offender identification efforts, quality of output related to these endeavors, and suggested improvements.
5. Secondary Data One approach to address the issues related to utilization and future expansion was
to perform analyses on selected secondary data sources. With respect to utilization, quality reports maintained by the PSP covering the years 2000 through 2002 were accessed and analyzed to determine if there were differences in the quality of the captured fingerprints over time, and/or by type of department, i.e. local or PSP. The
7
purpose is to determine how differences in quality may relate to issues such as training of users or configurations of department. These reports were entered into a database and statistically analyzed to address these two issues.
To address the issue of future expansion, crime data for each county and each of the six human service regions in Pennsylvania were accessed from Uniform Crime Reports. The purpose is to determine what areas might have the volume of activity to warrant future investment in the technology, as well as determine the current performance of the technology with respect to population statistics, officers employed in the counties and the crime data. These data were converted to an Access database and linked to ArcView GIS to display the patterns found and to aid in developing recommendations regarding plans for future expansion.
C. Presentations of Findings by Research Question 1. How accessible is the offender identification equipment to police and
prosecutors, and is the technology being used by other agencies in the local or regional area?
As presented in Map 1, the concentration of equipment is primarily in the eastern
part of the state. However, other equipment is located in the central, northwestern, and southwestern parts of Pennsylvania. According to the 2000 population statistics for Pennsylvania (www.census.gov),
• 15 of the sites are in counties with a population of 250,000 or more • 13 have a population between 250,000 and 500,000 • 5 of the sites have a population of less than 100,000.
These statistics suggest that the equipment is distributed around the state and within many of the areas with the more concentrated population. However, the map does indicate some larger counties, in terms of population size, still lack the technology to electronically fingerprint and photograph offenders. Additionally, the northern and central parts of the state do not have access to many sites with the equipment.

8
Map 1
Within the counties that have the technology, there are a number of formats by
which the police may have access to Live Scan and CPIN: • Local police and/or state police having access to it • Police at departments where the equipment is located • Police at departments that do not have the equipment but take offenders to
departments with the equipment to be processed. Within the counties that have sites, the Live Scan and CPIN sites for local and
PSP departments primarily operate on a 24-hour basis according to 93 percent of the managers’ responses from the mail survey. As presented in the Interim Report on the Mail Survey for Managers and Users, the number of officers that use the Live Scan equipment range from 11 individuals to over 50. These statistics are valid for both, the local and state police managers. However, the response related to a staff of over 50 may refer to the entire department, where all officers were trained to operate the equipment. Then again, it may refer to larger police departments, such as Philadelphia. Similar statistics also pertain to the CPIN equipment. While the majority of the local police departments have had access to the equipment for more than 4 years, most of the PSP troops had the equipment installed within the last 3 years. Site visits also indicated that the CPIN upgrade was in operation. Overall, the operators of the equipment from the local and PSP offices have been using it over a range of 1 to 6 years.
9
If the ability to use the equipment is based on experience, education and age, the respondents of the mail survey (primary operators and managers, alike) are capable of working with this technology. Over 50 percent of these users have at least 6 years of experience in their current positions, have some form of college education, and are at least 31 years old. (See the Interim Report for details.) These results are consistent across the local and state police respondents.
Approximately 80 percent of the individuals responding to the mail surveys
indicated that a full-time police officer is responsible for booking an arrestee. However, there are sites that have dedicated booking agents. For the counties where local police have the equipment, 23 percent of the respondents indicated that bookings agents processed arrestees.
The equipment was used to book for the primary department, as well as for other
departments. According to approximately 30 percent of all managers, 1 to 5 agencies were provided Live Scan and CPIN services either by bringing an arrestee to the site to process themselves or to have an officer assigned to the site to conduct the processing. Many of the local police managers listed more than 5 agencies as having access to their equipment compared to PSP managers that specified providing services from zero (0) to 5 agencies. This is an interesting detail given the equipment at the primary sites was intended to be used by offices in near proximity.1
During the site visits, it was learned that some secondary police officers and
managers were trained in using the equipment. It seems that marketing or publicizing the availability of equipment to other police departments and organizations may promote further use and provide a more complete database within the state. Additionally, the central booking centers are purportedly accessible to all departments within the county, and one that was visited in particular had brochures promoting their ability to book the arrestee and hold until preliminary arraignment while the arresting officer is allowed to return to his/her community. It seems that more central/regional sites that are within near proximity to more offices may encourage access to using the Live Scan and CPIN technology.
Another finding from the site visit was that although counties may have funded
the equipment, the departments were directing where the equipment should be placed. While the technology has been useful, an analysis of locations that facilitate the processing of offenders by more departments should be reviewed. As model locations, the Penn State and State College police jointly acquired the equipment and share this technology. Additionally, Erie city and the PSP located in Erie County provide this service to other police departments in their area. Each has a dedicated staff to book arrestees. As a mechanism to share information and resources, the primary and secondary users in this county trade Live Scan and CPIN services for other services available through secondary departments.
1 The service was provided for those departments with signed agreements with the Chief of Police at the primary site. The agreements should be on file at the PA Chiefs.

10
The Live Scan and CPIN equipment is useful for investigations and line-ups as well as booking offenders. The findings from the Interim Report as well as the site visits suggest that accessing this technology is also dependent upon the levels of satisfaction associated with turnaround time for obtaining a RAP sheet, training on the equipment, technical support and maintenance. The responses from the primary operators and the managers suggest that turnaround time is faster and this result was confirmed during the site visits. However, training was a concern as determine by the mail survey responses as follows:
• 73 percent of the entire sample indicated they were satisfied with the Live Scan
training for finger prints (79 percent for the local and 62 percent for the PSP) • In terms of the CPIN training, the following statistics indicated satisfaction levels
o 74 percent overall (78 percent local and 66 percent PSP) for facial photos training
o 69 percent overall (72 percent local and 65 percent PSP) for full body photos o 70 percent overall (73 percent local and 64 percent PSP) for tattoos, jewelry,
and piercing o 49 percent overall (54 percent local and 38 percent PSP) for line-ups o 54 percent overall (59 percent local and 43 percent PSP) investigative
searches • The results for managers were similar. (See Section C.2. for a more complete
discussion regarding training and utilization.) Other secondary users of the technology refer to those individuals who should
have access to the output generated from the Live Scan and CPIN. Specifically, District Attorneys (DAs) and District Justices/District Magistrates/Bail Commissioners (DJs) represent key offices that utilize the information generated by the technology and found in the RAP sheets. A mail survey was disseminated to these secondary users to determine their perceptions regarding access to the criminal history. Overall the DAs and DJs have limited knowledge as to how this is produced. The DJs have a better understanding of the method used to process the arrestee since they are directly involved in the preliminary arraignments. The DAs, with the exception of the Philadelphia system, usually do not get involved at this stage and therefore are less likely to know the origin of the RAP sheet (from this electronic system versus any other system). The DAs use the criminal histories for other hearings, so they do get a history at some point in time.
Some DJs interviewed at the site visits expressed an interest in receiving the RAP
sheet for each preliminary arraignment since they do not always have access to this criminal history. As an example, the DA’s office in Montgomery County issued a strong recommendation that the DJs obtain a criminal history for all preliminary arraignments since one individual was released following his arraignment. Shortly thereafter, this individual shot and killed a policeman in the county. Since that occurrence, the police attempt to provide the RAP sheet, as requested by the DA.
Many counties utilize the fingerprint order (as discussed earlier) for certain
arrestees rather than immediately process and subsequently hold the individual until the

11
preliminary arraignment. In this case, a RAP sheet is not generated when the police file the complaint. It requires the offender to appear at a police station at some future date to be processed.
The prosecutors (or DAs), as mentioned earlier in this section, are not involved in
the preliminary arraignment. According to the DAs interviewed the criminal history is eventually obtained in order to prepare for the preliminary hearing.2
The Philadelphia County DAs are also present at the preliminary arraignments
and therefore, have access to the RAP sheets at that time. Since Philadelphia has its own system, these data can be accessed directly from their own court system. The individual interviewed for the site visit 3 also noted that accessing criminal histories from other locations through JNET was time consuming. This could discourage the access of records from other locations throughout Pennsylvania.
Overall, the technology is being accessed by the local and state police. Secondary
police tend to access the equipment more through local police departments that the PSP. Further, DAs and DJs have access to the RAP sheets but in many cases are unaware of how it is generated. DJs do not always use the criminal histories available from this technology for various reasons as previously described. Use of the RAP sheet may increase awareness of an offender’s previous history and aid in public safety. DAs use the RAP sheets for preliminary hearings, but attaining this information is dependent upon the system that transmits it, which should also be reviewed.
2. What is the current utilization rate of the equipment at existing sites? One of the aims of this evaluation was to determine the extent to which the
individuals at the locations that house the Live Scan and CPIN equipment actually utilize it. Utilization is measured in terms of nature, types and frequency of use, as well as factors effecting operation of the systems. Nature includes use of the automated system or manual, i.e. ink prints or Polaroid photos. Types include booking at the primary site, booking for secondary police locations, investigations, applications and crime solving. Frequency relates to how often these activities generally occur. Other factors relating to utilization include the quality of the prints captured and other aspects that might affect the extent to which the equipment is being operated.
As indicated in the mail survey, the primary reasons given for capturing prints
through Live Scan are: • Booking for own department, 93.2% of the total respondents
o 94.3% for the Local Police o 95.5% for the PSP.
2 The defendant is made aware of the charges he/she will face during the preliminary arraignment, generally within 6 hours from the time of arrest, and bail is set; and the preliminary hearing is the “probable cause” or preliminary (Source: Pennsylvania Criminal Justice Manual). 3 This individual was interviewed on the telephone since the DAs office was unable to provide a representative during the time of the site visit.

12
• Investigations, 60.2% for the total respondents o 59.6% for the local police o 61.4% for the PSP
• Booking for other departments, 52.8% for the total respondents o 61.5% for the local police and o 39.8% for the PSP.
Manual fingerprinting also continues to be used at these sites. However, the total
number of respondents that stated they use this method of fingerprinting is much lower than the number for Live Scan usage. For example, 467 respondents use Live Scan for booking purposes for their own department but only 184 use the ink and paper process for that purpose. The manual process is primarily used by both agencies for booking for their own departments, 36.9% for the overall sample, 32.0% for the local police and 46.0% for the PSP.
Results related to utilization of CPIN are similar to those for Live Scan. Again,
mail survey findings indicate that: • 73.7% of the overall respondents use CPIN Capture and Retrieve for
booking for their own department, o 76.4% for the local police o 72.2% for the PSP;
• 38.8% of the overall respondents use the same system to book for other departments,
o 45.2% for the local police o 29.0% for the PSP; and
• 49.2% of the overall respondents use this system for investigations, o 50.6% for the local police o 48.9% for the PSP.
Responses to the site visit interviews indicate that the primary reasons manual ink
prints are conducted relate to the capturing of Palm and fingertip prints or the processing of applications. One location with equipment located on a lower level, which is not handicapped accessible, captures manual prints for arrestees who are disabled and unable to walk the stairs. However, other respondents indicated that some police continue to capture manual ink prints as they feel more comfortable performing the activity the “old fashioned” way.
With respect to the frequency of use, the majority of the activities includes:
weekly bookings for one’s own department and other departments and monthly investigations. Specific to Live Scan, 61-80% of the prints are taken each month; with regard to CPIN 80 - 100% of the facial photos, full body photos, tattoos, jewelry, and piercing and scars and marks are captured.
As part of the site visit, the users were also asked what other types of prints and/or
photos, if any, are taken. They responded with: rolled ink prints for comparing to latent prints; Polaroids for Megan’s law records; thumb prints for felony sex offenses; ink tips

13
and palms; portable ink system for handicapped arrestees; and cards and Polaroids when the system is down.
Another factor that may be related to utilization of the Live Scan technology
relates to the quality of the prints captured. Quality was an issue cited by respondents to the state level interviews. They indicated that there was consistency in the output received; however, more steps should be taken to ensure the quality. For example, one interviewee suggested that quality assurance procedures should be developed and implemented.
For the past several years, the PSP has collected data rating the quality of the
prints received from Live Scan sites. The quality ratings were A, B and C, with A being the best quality. Based on discussions with PSP representatives, the differences between A and B prints were negligible, and therefore combined for the purpose of this evaluation. This information was examined from two perspectives: the differences in percentages of A/B prints captured by the various sites; and whether there was a significant difference in the quality of the prints over time between local and PSP sites.
As indicated in Map 2, quality data for 2002 were available for 13 PSP and 40
local police sites. The results provide a breakdown of the percent of prints submitted that were A/B quality. This breakdown falls into the following ranges: less then 90%, 90-93%, 93-95%, 95-97% and 97-100%. For example, if Site A submitted 1000 prints, and 930 fell into the A/B category, then it was considered that 93% of the prints submitted were of A/B quality. By using a cutoff of 93%, it was found that 77 percent of the prints submitted by the PSP and 86 percent of the local police sites that submitted prints sites fell into the 93% and above range. The data suggest that more of the local sites submitted higher quality prints than the PSP sites, but the difference is not very large. Additionally, more of the sites from the eastern end of the state submitted higher quality prints when compared to the western end of the Commonwealth. This may be a function of configuration, i.e. there are more central booking sites on the eastern end, the closer physical proximity allows for easier access to users from similar departments, or it could be that the sites have higher volume resulting in greater staff comfort in operating the equipment.

14
Map 2
These records were also analyzed to determine if there were any statistical.
differences in the quality of prints submitted, over time and between local and PSP sites. The data used for the following analyses included all counties which reported quality data for the years 2000, 2001, and 2002. The initial sample of 86 departments was reduced to 53, as those were the only ones that had 36 months of data. The final sample of 53 consisted of 13 PSP departments and 40 local police departments.
In order to determine if trends were present in the quality data obtained from
counties across the state, two separate analyses were conducted. The first was a Chi-Square trend analysis while the second consisted of a Repeated Measures Analysis of Variance (ANOVA). Each of these statistical techniques is commonly used to test for differences across multiple measurements. Utilizing the previously mentioned techniques, the following analyses were conducted: (1) The 53 sites; (2) a comparison of data submitted by PSP & local; (3) The same analyses as 1 and 2 excluding Philadelphia; (4) The 53 cases after obtaining a simple random sample of 100 time measurements. Results were interpreted to be statistically significant at the .05 level
For each of the analyses mentioned above, the only consistent findings related to
the quality of the prints and type of agency. That is, the number of A quality prints was significantly different than the number of C quality prints. It should be mentioned that the B prints were combined with the A prints due to these print qualities being essentially

15
the same. The type of agency was also found to be consistently significant, indicating that PSP and local police departments did differ with respect to print quality. However, the significance of this finding is largely due to the difference in the amount of prints obtained rather than the difference in the quality of these prints. To minimize this difference, Philadelphia was removed from the dataset and analyses were conducted. The findings were very similar. To further explore possible differences between PSP and local police departments, a simple random sample of observations was obtained from each type of department and analyses were conducted. Again, results showed a difference between PSP and local in terms of print quality, but again it may not be accurate to interpret this as local departments providing better quality prints due to the number of prints obtained differing to a great degree within local and PSP departments.
In conclusion, it appears that the departments obtained a high number of A/B
quality prints. In addition, it also is apparent that local departments are capturing a greater number of prints than PSP departments. A statistically significant difference in the quality of the prints was not found nor was there any evidence that a trend existed. There was a drop in the total number of prints obtained from 2000 to 2001, but the total number of prints increased to a number similar to that of 2000 in 2002.
In addition to examining the extent to which the users and managers have access
to the equipment, as well as the frequency and reason for use of Live Scan and CPIN, the evaluation also sought to determine if the technology was being utilized to its fullest potential and to identify the factors that might be affecting the extent to which it is being used. Based on the findings of the mail survey, site visit and state level interviews, the additional factors affecting utilization concern training, user comfort and overall attitudes related to the use of automated vs. manual systems for booking purposes, as well as the role of the police officer in booking activities.
As presented in the interim report, the majority of the respondents indicated that
they received a minimal amount of training, i.e. less than 2 hours. The responses were similar for CPIN. Site visit interview results were similar to the findings presented in the interim report. Two thirds of the managers interviewed indicated that initial Live Scan training received was eight hours or less; for new staff, the training ranged from one-half hour to 40 hours (the 40 hour training was at a centralized booking center). CPIN responses for training were very similar to those for the Live Scan training. The sites that received more training were central booking centers and departments with a large volume of activity, such as Philadelphia. In terms of ongoing training, few of the respondents indicated that any was received.
The user/operators interviewed as the site visit were asked how much initial and
ongoing training they received in both systems. There is variation in the responses related to ongoing training. However, initial training was more consistent. With respect to Live Scan, two of the operators did not receive any training, and 25 percent received one hour and an additional 25 percent reported that they received 2 to 4 hours of training. The results for CPIN are similar. The amount of training is less than what the managers believe their employees were actually reporting.

16
Training of the individuals who perform the booking process was also an issue
cited in the state level interviews. Such training could focus on increasing an individual’s level of comfort in using the technology, as well as in determining where and when to assign tracking numbers.
Another aspect affecting utilization concerns user comfort in the operation of the
Live Scan and CPIN systems. This factor is associated with training and volume, i.e. if more intensive training was received or provided on a periodic basis, the staff would feel more comfortable in operating the equipment. Additionally, if they operated it on a consistent and frequent basis, they would become more at ease in its use.
This factor was further substantiated in the site visits. For example, it seems that
a fingerprint order was issued more frequently by PSP than by local police. It may be attributable to the nature of the offense, but it may also be related to staff comfort in operating the equipment. For example, an officer may be more likely to delay the fingerprinting process by filing complaints that result in fingerprint orders rather than apprehend someone and have to process the arrestee him/herself. One PSP representative suggested that having dedicated staff was preferable as some officers may not view this task as police work. Consequently, some troopers may recommend a fingerprint order rather processing at the time of apprehension. The officer may reason that dedicated personnel that use the technology on a regular and frequent basis perform this task more efficiently.
Furthermore, a local respondent indicated that phone calls were received at home
by individuals who infrequently use the system to perform a booking activity and have questions related to operating the equipment. One of the suggested means to resolve this issue is to have dedicated personnel to operate the Live Scan and CPIN equipment.
Another aspect that may affect utilization by secondary users, i.e. police that do
not have the technology, is the distance traveled to access the equipment and the size of the police department. Results from the site visit interviews indicated that the distances traveled to the Live Scan/CPIN site ranged from 1.5 to 8 miles. This requires more time to transport and wait for the arrestee to be processed; it may also prove to be difficult for small departments as it reduces the number of available police officers in the community performing other law enforcement functions.
Finally, the results of the evaluation indicated that Live Scan and CPIN were
being utilized primarily for booking activities. However, it was also confirmed that the systems are not being used to their fullest potential. With respect to CPIN, it was acknowledged that the system is excellent for performing line-ups and suspect identification. However, few knew how many databases were available through CPIN, and not many knew how to access it.4
4 It is important to note that all of the sites visited had recently received the CPIN upgrade, but did not receiving training on it. The lack of training may be the reason why some of the respondents were unaware of the number of databases available in the system.

17
Interviews at the state level indicated that the system is isolated and not integrated
with other systems. However, it has the potential to be used by other systems to help complete criminal complaints. When asked how their agency utilizes the information generated through CPIN and Live Scan, it is apparent that the various state level agencies used it for a variety of different purposes. For example, the court system used it to create a cross reference table between offender and court cases, to gather specific information from the Philadelphia and Pittsburgh Police departments and to add the SID number to the court case when it becomes available. The Commission on Sentencing used the information indirectly, as under statue a guideline is prepared for each sentenced person and prior conviction information was used in determining the appropriate sentence for a newly convicted individual.
Other uses cited include:
• Distributing of the Live Scan and CPIN information to other users via JNET • Creating, maintaining and updating information for the RAP sheets • Updating the most current photo of a parolee • Identifying an offender and obtaining a SID • Verifying a person through prints and photos • Providing bookings for those offenders who have reached DOC.
In conclusion, the technology and the output from the technology are being
utilized both at the local and state level. However, the results also indicate that the equipment is not being utilized to its fullest potential. Factors that need to be addressed include the availability of appropriate and frequent training, standards for using the system based on the type of offense, using dedicated staff to operate the equipment, and educating staff in how to access and use the output from the system in performing other law enforcement functions.
3. Has statewide use of the computer technology equipment led to improved
public safety, and have we improved the quality, accuracy, and timeliness of offender identification and processing through technological advances?
For the purpose of this evaluation, public safety is associated with the crime rate,
police returning to the streets faster within their respective communities and police apprehending criminals more quickly. While it is difficult to identify completely accurate statistics on crime rates, one data source used throughout the United States to gauge crime trends is the Uniform Crime Report (UCR). Given the focus of this evaluation, UCR reports documenting these data were utilized because the arrests suggest one individual per booking, even if an individual is booked for more than one offense. If the Live Scan and CPIN technology has had an impact on improved public safety, in terms of arrests, it could be interpreted in one of two ways. First, the number of arrests may decline since there is an increased probability of identifying a suspect and linking him/her to previous crimes. This may discourage individuals from committing any further offenses or they may be incarcerated. Alternatively, the number of arrests may increase because the booking and identification processes are facilitated with the technology and

18
may encourage police facilitate the process for identifying and apprehending more suspects. During the site visit interviews, one of the department managers suggested that the number of arrests had increased as a result of having the equipment. One note of caution, however, is that there are obviously a number of other factors that could affect rates of crime, such as population and economic status of the individuals and the community.
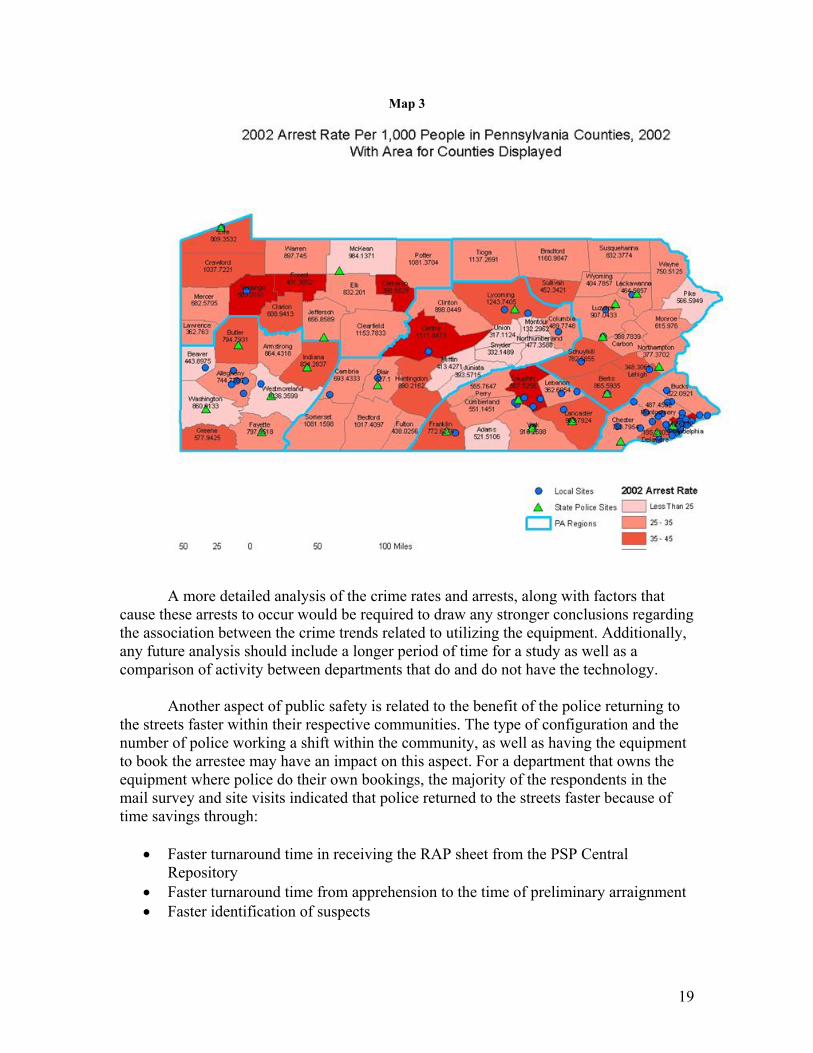
Map 3 highlights the areas with Live Scan and CPIN for 2002 along with
information related to Part I and Part II total arrests per 1,000 citizens for these counties. The map is also scaled for square mileage by county. A comparison of the data for 2002 with 2001 suggests that there is no apparent change in arrests over this period of time. Further, according to the UCR, the total of Part I and Part II arrests in 2002 and 2001 were 395,654 and 393,758 for the counties with the equipment; and for the counties without the equipment, the number of arrests were 48,109 and 48,663, respectively. The counties with the equipment had an increase in arrests of 0.5 percent and the counties without the equipment had a decrease of 1.1 percent.5 Using a t-test6 to analyze this difference, there does not appear to be any statistical significance between the counties with and the counties without the equipment over the 2001/2002 time period.
5 While total arrests did not decrease from 2001 to 2002, the Part I arrests, or more serious arrests, did for both the counties with and without the equipment. The Part I arrests for 2001 and 2002, respectively, for the counties with the equipment were 75,048 and 69,522; the numbers for the counties without the equipment were 8,015 and 8,238. A percentage change was also considered to evaluate the differences to eliminate any problems with size (e.g., there are more crimes in Philadelphia than the other areas). There was still no significant statistical difference. 6 A t-test is a statistical technique to determine the difference between means. In this case, it was examining the difference in the mean or average number of crimes comparing counties with and without the equipment for a given year.
19
Map 3
A more detailed analysis of the crime rates and arrests, along with factors that
cause these arrests to occur would be required to draw any stronger conclusions regarding the association between the crime trends related to utilizing the equipment. Additionally, any future analysis should include a longer period of time for a study as well as a comparison of activity between departments that do and do not have the technology.
Another aspect of public safety is related to the benefit of the police returning to
the streets faster within their respective communities. The type of configuration and the number of police working a shift within the community, as well as having the equipment to book the arrestee may have an impact on this aspect. For a department that owns the equipment where police do their own bookings, the majority of the respondents in the mail survey and site visits indicated that police returned to the streets faster because of time savings through:
• Faster turnaround time in receiving the RAP sheet from the PSP Central
Repository • Faster turnaround time from apprehension to the time of preliminary arraignment • Faster identification of suspects

20
• Reduction in duplication of records, in particular, when booking arrestees with multiple offenses. However, there is also a likelihood of utilizing more time that would affect public
safety if the officer inputs data infrequently. This may slow down the process considerably if he/she was not comfortable with using the equipment, did not understand the training for the equipment or did not receive adequate training for using the equipment. In this case, the booking may take longer than the reported average of 20 minutes. Another potential cost to this system relates to submitting incorrect information to the Central Repository. Once it has been transmitted it is difficult and time consuming to correct. For example, an individual was arrested at one station but the booking was put through under his brother’s name. This type of error could create problems and significant costs in the future. The users of the system should have some avenue for making these changes, without interrupting the integrity of the system itself.
Time savings exist when police are able to drop off a suspect for processing and
return to patrol. However, for police employed in communities where they must travel to a booking site, there is a trade-off between the time saved using the electronic process and the additional time consumed in the following areas that are not necessarily mutually exclusive:
• Traveling to the booking site • Booking the arrestee personally and doing it on an infrequent basis • Two officers may be required by their respective department to accompany the
offender to the booking site • The officer(s) may be required to stay with the arrestee until the time of the
preliminary arraignment The advantage in having a dedicated centralized or regional booking center would
eliminate at least two of the issues associated with the secondary police arrests and the problem for the primary user of inputting the data on an infrequent basis.
Representatives of state agencies interviewed indicated that public safety has
improved with Live Scan and CPIN in several ways: • State Identification Numbers (SID) are assigned through this process • Offenders can be linked to previous crimes • More accurate and updated information on offenders for probations, courts and
detention centers has been realized through this technology.7 Finally, the site visit to Philadelphia provided insights to further use of the data
other than the identification and investigation processes. They also link the output to an upfront records management system (i.e., Preliminary Arraignment Reporting System or PARS) that eliminates the redundancy of data input. For the criminal justice system in this city/county, this has become an invaluable tool since there are limitations on the
7 During the site visits the police officers also suggested that the information was not only more accurate but confidentiality was also enhanced through this process.
21
length of time a person can be held prior to a preliminary arraignment.8 Reports generated by PARS provide documentation on the length of time a person is held, and any bottlenecks that may occur can be identified and eliminated. Additionally, this system serves as an excellent tool to analyze and manage the activities that are associated with booking and holding an individual.
4. Is the current infrastructure sufficient to support the statewide network
of Live Scan fingerprinting and digital photos technology? If not, how can improvements be most efficiently implemented?
A technical assessment was conducted to determine the performance of the
technology as it relates to sufficiency. (See Technology Infrastructure Assessment Report.) This analysis was primarily conducted through the site visits where users were interviewed and the equipment was evaluated to determine its utility. It seems that the telecommunications connections are reliable and do not significantly affect the availability of or the ability to use the equipment. There was some variation related to the wait between the time the photographing and fingerprinting processes were completed and when the RAP sheets began to print, that is, from five minutes on the lower end to thirty minutes on the upper end. Given that relatively high speed connections continue to be used the variations in turnaround times may be due to the time of day or the volume of activity for the PSP servers. As it is possible that some of the non-PSP locations may be sharing bandwidth with other county traffic, e.g. JNET, several minutes may be added to the turnaround time. A rollout of new servers throughout the state for the Enterprise Network was begun in September 2003 and should serve to further improve the speed and reliability of the PSP connection.
The Assessment Site Survey also focused on the reliability and adequacy of the
CPIN and Live Scan hardware, software, and database. There was a general consensus that the interface and functionality of the CPIN upgrade were far superior to the previous version. However, according to the users, it was noticeably slower. The upgrade has a number of new features. Most notable are:
• Ability to print cropped images • Enhanced report gathering capability • Ability to print large groups of photos not via the line-up mode • Improved ability to search for tattoos or other views • Ability to create custom reports • Ease in retrieving saved line-ups • Ease in creating and retrieving missing and wanted posters • More robust computers and operating system • Ease of doing expungements
Details of the specifications of the new equipment deployed in the upgrade are
listed in the Technology Infrastructure Assessment Report. Based on the information
8 Philadelphia was sued years ago because they had an individual locked up for a longer period of time than allowed; this person died while waiting in jail for this hearing.
22
supplied, the upgraded CPIN hardware appeared to be sufficient to effectively support the application. The main digital photo databases that are part of the base system are replicated from the central PSP server to every location and are synchronized through a cloning process. The current size of the CPIN database is 110 GB and it is estimated to grow at a rate of 20 GB per year. According to this projection, the 200 GB hard drive will reach capacity in approximately four years at which time a major upgrade will be needed. This would appear to be a planned obsolescence so as not to waste funds on unnecessary storage capacity. This is the case since hardware should be replaced every three or four years due to rapid advances in technology.
Site visit results indicated there was a wide range of time frames for the life of
Live Scan; with one location being in operation less than three months, and several others many years, with an overall average of seven years. It should be noted that the PA Chiefs has issued an RFP for Live Scan fingerprinting and related electronic fingerprint/palm scanning, capturing, and transmission equipment in a NIST/FBI standard format. Systems to be considered must be based on a modular design to allow for upgrade as future requirements develop, and to meet existing fingerprint/palm print requirements. Additionally, several users expressed some concern with the print quality feedback mechanism on the Live Scan devices and the Live Scan printers.
In addition to the standard CPIN databases, the CPIN server has the ability to
establish custom photo databases. Most locations reported utilizing only the standard ones, but several had separate employee photo databases. This feature may be underutilized. Use of this feature should be encouraged when a site’s operations would be enhanced with the digital photo technology. Any function that requires the use of photographs to be stored on a long term basis and possibly shared across a network would lend itself to this technology.
The site visit also evaluated backup schedules for the CPIN server as well as
offsite storage for the backup media. According to the responses, some standards are needed related to backup. Users reported that they did not know if they should backup the database, or how often this task should be done. This indicates that this aspect should be included in future training programs. Custom databases would be lost without local backup; and recovery would be faster with offsite backup on CD or tape, where offsite storage should be set up to conform to standard industry practice. Each site should assign a staff person the task of monitoring the backup process to assure that it is carried out properly and according to a defined schedule.
As part of the site visit, respondents were asked about contingency plans in the
event that CPIN or Live Scan equipment was temporarily unavailable for use. The responses were broken down into four categories: (1) to take the person to another CPIN or Live Scan location, (2) to reschedule the booking process, (3) to use an alternate means for capturing photos or prints, i.e. Polaroid pictures or ink and cards, and (4) no plan at all. The results suggest that the largest numbers of respondents would reschedule the process, implying that most locations prefer photographing and fingerprinting individuals through CPIN and Live Scan.

23
According to the individuals interviewed from state agencies, several issues were
highlighted: • Many sites continue to use print cards, even though the infrastructure is secure
through JNET • Standardized and automated quality assurance procedures and personnel need to
be incorporated into the system • Problems with this technology are not in identifying need but a lack of up-front
political and/or policy support and then the on-going operational support to encourage acquisition and use of the equipment. As mentioned by a state agency representative, if JNET were utilized, it would
provide a secure vehicle for submitting and extracting criminal history data. Twelve (12) of the sites, as presented in Map 4 are located in counties with JNET servers. The current infrastructure may possibly be enhanced if this technology is integrated by accessing these JNET servers.
Map 4
24
One other aspect of this study was to determine if video arraignments were integrated into the preliminary arraignment structure. This specific form of preliminary arraignments was set up in a number of sites. Those that used it were largely satisfied with its performance and its ability to cut time and costs. However, downtime was also an issue, e.g. the Philadelphia court system frequently experienced downtime causing a delay in hearings for the arrestee.
5. Have we reached a “saturation” point in terms of placing this technology
across the state? If not, how should the network be expanded? As previously discussed, one of the aims of this study is to determine if the
current configuration of Live Scan and CPIN sites provides sufficient coverage across the state as well as to provide suggestions for further expansion. During the site visits, managers were asked, from their perspective, if the number of Live Scan and CPIN sites was sufficient and if their county had sufficient resources to finance additional equipment and the related operations. Over 50 percent of the respondents stated that more equipment was needed, either in specific locations around the county to better serve the entire region or through a centralized booking center. In terms of county resources, the majority of the managers believed that there were sufficient funds to support the purchase of additional equipment, staff and staff training, and space to house the equipment. Additionally, several felt that the resources were available for the technology (equipment, staff, training, and operations) only because of grants to fund this endeavor. Similar responses were provided by operators of the equipment and managers of secondary police departments.
One also needs to be aware of the trade-off between the costs and benefits related
to expansion. In terms of public safety and, as mentioned in Section C - 3, the turnaround time to obtain a RAP sheet, the time from apprehension to the preliminary arraignment and identification of an offender was faster. There was also a reduction in duplication of records. However, there were also costs associated with using this technology. If the booking site was not organized with a dedicated staff, the officer might need to input the data; this may be a concern if an officer books on an infrequent basis. Additional costs linked to secondary users traveling to the booking location relate to travel time (rather than using the ink and Polaroid processes), requiring more than one officer to accompany the arrestee, and remaining with the arrestee until the preliminary arraignment.
Other time savings related to the booking process have been identified as the
turnaround time for receiving criminal histories as well line-ups provided through CPIN. Previously, these processes took several days; currently, the criminal history is available within 15 minutes and line-ups can be created within a very short period of time. These are indirect benefits that have public safety implications and should be given adequate attention to expansion considerations, even though these measures are intangible.
In addition to the indirect costs and benefits associated with public safety
discussed above, there are also real costs that should be considered for expansion

25
purposes. First, for police officers that used the Live Scan and CPIN equipment, the average hourly rate was $25 for the local police and $26 for the PSP; if individuals other than police were assigned this task, then the average hourly pay rate was $15. The average amount of time to book an offender was quoted as being approximately 20 minutes per arrest. Therefore, the cost of time for local police to book an arrestee is approximately $8.33 (i.e., 1/3 of an hour at $25 per hour), for PSP troopers, $8.67 (i.e., 1/3 of an hour at $26 per hour), and for individuals that are not police $5.00 (i.e., $5.00 of an hour at $15 per hour). During 2002, there were an average of 1,182 arrests at local sites and 739 for the PSP. This information translates into costs of booking for these arrests as follows:
• $9,850 for local police bookings by police officer • $5,910 for local police bookings by individuals other than police • $7,390 for PSP bookings by PSP troopers • $6,405 for PSP bookings by individuals other than PSP
In order to compare other processes (including ink and Polaroids) to a standard, these figures can be used as a guide.
Costs related to the equipment are also a concern for determining the amount of
financing for any type of configuration. While the PSP Central Headquarters provides the resources for the PSP sites, local departments and/or their respective counties supply the necessary finances for their equipment. There are various packages for Live Scan maintenance: customer, contractor performance and/or preventive maintenance. The costs vary accordingly. Most departments chose the customer performance plan, with a current cost of $4,930.00. CPIN maintenance costs, at a minimum for the Capture/Retrieve function, were $3,400.00 for the current year; and are expected to increase by $500.00 for the next calendar year with incremental maintenance costs for the remaining functions (ID Card Add on, Webretrieve (JNET) and Regional Server).
Additionally, line costs, such as T-1 line connections, are an expensive
component of the connection with the PSP Central Repository. The average cost for these lines is $3,500.00. It was revealed during the site visit, that the Berks County Sheriff’s Booking Center was provided the T-1 line at no cost. It was not clear to the manager why this option was available but this should be further investigated to determine if other departments might be able to benefit from a similar situation. The PA Chiefs have been a fundamental influence in developing and expanding the Live Scan and CPIN equipment for local departments. It may be an advantage if they can identify better solutions for communication lines to facilitate the transmission of data and usage of the technology. JNET servers have been recognized as a potential link for these sites if the departments are able to connect to them. The maximum costs for these sites have been estimated as the costs for a local phone call.
Additionally, for expansion purposes, costs related to utilities, space for holding
the equipment and the operations need to be considered. (This information was not available through the surveys or the site visits.)
26
Other incidental costs include the cost of items such as: paper for printing CPIN photos when required ($1 per photo), disks for back-ups, towels, gloves and Corn Huskers for the fingerprint process, laser and ink cartridges. These additional costs are insignificant compared to the amount expended for the equipment, maintenance, line costs and labor to input the data but should still be considered for any future expansion and to maintain at least the current levels of electronic bookings.
Two of the managers surveyed indicated that their department charged the
arrestees $200 for the booking process, only if they were subsequently convicted. Further, the rate of collection on this amount was estimated to be about 60 percent. Another manager stated that his department charged $15 for other agencies/departments to use the equipment. Standards should be considered for determining if it is appropriate to charge offenders and other departments for this service, the amount of the charge, and the approach to collect the fee.
The majority of the state agency representatives interviewed indicated that there
were not a sufficient number of Live Scan and CPIN sites across the state. Some suggested that equipment should be available and accessible in every county, that more local police should own the technology, and that it should be expanded to juvenile probation. One representative mentioned that the fact that the Department of Corrections (DOC) still receives inmates without the SID and that most county prison reports do not contain the information generated through the Live Scan and CPIN is an indication of a limitation in the number of systems across the Commonwealth.
Additionally, to utilize these systems to its fullest potential, it is important to link
systems and increase the database by having more individuals booked through Live Scan and CPIN.
Other aspects explored in determining whether a saturation point has been
reached with respect to the offender identification technology include the current location of Live Scan/CPIN sites, the arrest rate in counties across the state, and the size of the counties. As indicated in Map 1, the majority of the sites are located in highly populated areas, i.e. the southeastern section of the Commonwealth, south central section around Harrisburg, southwestern section around Pittsburgh and the northwestern section at Erie. Sites are virtually nonexistent in the northern and southern sections of the state.
As displayed in the maps, several findings emerge:
• The Live Scan/CPIN sites are primarily located in areas with a population of at least 100,000. The only counties that do not have the equipment but have a population size meeting those criteria are Mercer and Monroe (Map 1)
• The sites are primarily located in higher crime areas with the exception of Mercer, Monroe, Lawrence, Crawford, Clearfield and Somerset (Map 3)
• The sites with the greatest square mileage and the lowest arrests do not have the equipment and may not need to have it due to the low volume of arrests (Map 3)
• The counties with the largest square mileage do not have the equipment.

27
The above factors should be considered in determining whether and where other sites should be added to house the equipment. Other aspects to be considered include whether additional expansion is needed in the more heavily populated areas or within a concentrated area, as well as the type of configuration for housing the equipment. For example, should it be centralized or regionalized. The justification for centralized facilities is that everything occurs in the same location; the arresting officer can leave the arrestee at the site and return to patrol. However, transportation time may be costly to the police department without the equipment. Regionalized facilities can serve the same function as centralized but they could be situated in strategic corners of the county, therefore reducing travel time for arresting officers. Political factors also need to be considered, as some police departments may be resistant towards having booking activities being specific to a particular department or staff member.
In conclusion, based on the above analyses as well as the surveys and site visits,
more sites should be identified to house the Live Scan and CPIN equipment. Given that one of the aims of this technology is improved public safety, which is achieved by quickly identifying and processing arrestees, it is important to have a more complete statewide database.
III. RECOMMENDATIONS As a result of this study, a number of recommendations are listed below for
consideration to improve the Live Scan and CPIN operations, utilization of the equipment, and levels of satisfaction associated with using the equipment. Before any expansion plans are drafted, those involved in this decision should determine the goals for the expansion. The following recommendations are categorized as follows:
• Access and Utilization • Public Safety • Infrastructure • Expansion Access and Utilization • Marketing the equipment to other police departments as well as other organizations
that need criminal histories • Determining the best configuration for a specific location, i.e., centralized,
regionalized, or free standing • Exploring other mechanisms for sharing of technology and resources, as learned in
State College and Erie • Processing activities should be conducted by dedicated staff • Developing an initial training model to be used for statewide training for Live Scan
and CPIN that includes the booking process. Suggested models are o At specific sites o Through the State Police Academy utilizing the equipment and includes
hands-on operations
28
o Through MPOTEC utilizing the equipment and includes hands-on operations
• Developing an ongoing training model for staff to be conducted on a regular basis o Using continuing education credits as a mechanism for ensuring the
appropriate personnel are regularly trained • Educating criminal justice employees in utilizing the systems to its fullest potential,
e.g. lineups and ids • Develop standards for the booking process, i.e., booking at time of apprehension vs.
fingerprint orders Public Safety • Encouraging DJs to utilize RAP sheets • Using JNET as a vehicle for accessing RAP sheets • Discouraging the use of manual fingerprinting • Ensuring that dispositions and other appropriate are recorded on the RAP sheet • Developing quality assurance procedures • Developing a more comprehensive outcome study concerning the Live Scan and
CPIN technology with respect to arrests and criminal activity Infrastructure • Providing a mechanism to correct errors in the criminal history input after it has been
submitted to the Central Repository • Exploring cost effective alternatives for connecting to PSP through utilizing existing
high speed connections • Studying tradeoffs related to staff and travel time in determining the configuration of
a booking site • Exploring the benefits of integrating and creating other reporting systems • Replacing current Live Scan printers with newer more reliable models capable of
producing higher quality prints • Issuing a set of CPIN database backup procedures that includes a specified individual
to monitor the backup at all locations • Developing a CPIN and Live Scan disaster recovery plan at each location • Encouraging locations to create custom photo databases where appropriate to increase
the utilization of the technology Expansion • Evaluating the costs (indirect and tangible) of any future expansion needs • Taking into consideration political factors related to the configuration of a booking
site • Evaluate the resources for funding the expansion, e.g. county resources • Including areas with high crime rates that do not have the technology in expansion
plans