Embed Size (px)
Citation preview

EMERGING SUBSTANCES OF CONCERN IN BIOSOLIDS:CONCENTRATIONS AND EFFECTS OF TREATMENT PROCESSES
Final Report – Literature ReviewCCME Project # 447-2009
September 11, 2009
Submitted to:
CANADIAN COUNCIL OF MINISTERS OF THE ENVIRONMENT123 Main Street, Suite 360
Winnipeg, MBR3C 1A3
Submitted by:
Hydromantis, Inc.Hamilton, ON
University of WaterlooWaterloo, ON
Trent UniversityPeterborough, ON
This report was prepared by Hydromantis, Inc., University of Waterloo and TrentUniversity, under contract to the Canadian Council of Ministers of the Environment(CCME). It contains information which has been prepared for, but not approved by, CCME.CCME is not responsible for the accuracy of the information contained herein and does notwarrant, or necessarily share or affirm, in any way, any opinions expressed therein.
PN 1440
© Canadian Council of Ministers of the Environment, 2010

CCME Final ReportESOCs in Biosolids: Concentrations and Effects of Treatment Processes Literature Review
Hydromantis, Inc., University of Waterloo and Trent University i
ACKNOWLEDGEMENTS
This report was prepared for the Biosolids Task Group (BTG) of the Canadian Council of Ministers of theEnvironment (CCME). The authors appreciate the valued comments received from Task Group membersfrom their review of the draft manuscript.
This report was prepared for CCME’s BTG by Hydromantis, Inc. of Hamilton, ON.Hugh Monteith, P.Eng. (Project Manager)Lars Sterne, P.Eng.Shujun Dong, P.Eng.
The electronic literature search was completed by:Wayne J. Parker, Ph.D., P.Eng., Dept. of Civil and Environmental Engineering, University ofWaterloo, ON
Contributions to the literature review and helpful comments and were contributed by:Wayne J. Parker, Ph.D., P.Eng., Dept. of Civil and Environmental Engineering, University ofWaterloo, ON
Chris Metcalfe, Ph.D., Environmental and Resource Studies, Trent University, Peterborough, ON

CCME Final ReportESOCs in Biosolids: Concentrations and Effects of Treatment Processes Literature Review
Hydromantis, Inc., University of Waterloo and Trent University ii
ACRONYMS
ADBI polycyclic musk fragrance, trade name CelestolideAHMI (or AHDI) polycyclic musk fragrance, trade name PhantolideAHTN polycyclic musk fragrance, trade name TonalideAMX derivative nitro musk fragrance, amino Musk xyleneAP alkylphenolAPE alkylphenol ethoxylateATII polycyclic musk fragrance, trade name TraesolideBEHP bis(2-ethylhexyl) phthalateBLS fluorescent whitening agentBPA Bisphenol ABFR brominated flame retardantsDAF dissolved air flotationDAS 1 fluorescent whitening agentDDE dichlorodiphenyldichloroethyleneDDT dichlorodiphenyltrichloroethaneDPE diphenyl etherDPMI polycyclic musk fragrance, trade name CashmeranDSBP fluorescent whitening agentEE2 17α-ethinylestradiolE1 estroneE2 17β-estradiolE3 estriolEO ethoxylateESOC emerging substance of concernHBCD hexabromocyclododecaneHCH hexachlorocyclohexaneHHCB polycyclic musk fragrance, trade name GalaxolideIFAS integrated fixed-film activated sludgeLAS linear alkylbenzene sulphonatesMA nitro musk fragrance, trade name Musk ambretteMEE2 mestranolMGD million gallons per dayMK nitro musk fragrance, trade name Musk ketoneMM nitro musk fragrance, trade name Musk moskeneMT nitro musk fragrance, trade name Musk tibeteneMX nitro musk fragrance, trade name Musk xylenena not analysednd not detectedng/g nanograms/gramN-MePFOSAA 2-(N-methylperfluorooctanesulfonamido)acetateN-EtPFOSAA 2-(N-ethylperfluorooctanesulfonamido)acetateNP nonylphenolNPE nonylphenol ethoxylate

CCME Final ReportESOCs in Biosolids: Concentrations and Effects of Treatment Processes Literature Review
Hydromantis, Inc., University of Waterloo and Trent University iii
OP octylphenolPBDE polybrominated diphenyl ethersPCP pentachlorophenol or personal care productPFDA perfluorodecanoic acidPFDS perfluorodecane sulfonatePFDoDA perfluorododecanoic acidPFHxS perfluorohexanesulfonatePFNA perfluorononanoic acidPFOA perfluorooctanoic acidPFOS perfluorooctanesulfonatePFOSA perfluorooctane sulfonamidePFOSSA perfluorooctanesulfonamidoacetatePFTA perfluotetradecanoic acidPFUnDA perfluoroundecanoic acidRAS return activated sludgeSRT solids retention timeTBBPA tetrabromobisphenol ATNSSS Targeted National Sewage Sludge SurveyTS total solidsWAS waste activated sludge
CCME Final ReportESOCs in Biosolids: Concentrations and Effects of Treatment Processes Literature Review
Hydromantis, Inc., University of Waterloo and Trent University iv
EXECUTIVE SUMMARY
INTRODUCTIONThe Biosolids Task Group (BTG) established by the Canadian Council of Ministers of theEnvironment (CCME) is mandated to study and make recommendations on biosolidsmanagement at the national level. Wastewater treatment facilities (WWTF) across Canadagenerate residual wastewater solids (sewage sludge) that require treatment for safeguardinghuman health and the environment prior to their use or disposal. Options for disposal, recoveryor recycling of biosolids include energy, nutrient or material recovery, landfilling, incineration,managed land application, land reclamation, and commercial product recovery (compost andpellets).
In this report, the term sludge or raw sludge is most closely identified with the European Uniondefinition “sewage sludge”, which is a “mixture of water and solids, separated from varioustypes of water as a result of natural or artificial processes at urban wastewater treatment plants”.The European concept of “treated sludge” can more closely be identified with the material called“biosolids” in this report. In this report, the tern biosolids is applied to a treated materialproduced from raw sludge by processes such as anaerobic and aerobic digestion, composting,thermal or air drying, and alkaline stabilization with additives such as lime or cement kiln dust.
The end use of the biosolids is often governed by the constituent quality of the biosolids, such asnutrients, metals, pathogens and trace constituents. Concentrations of nutrients and metals inbiosolids have been widely documented in the past, as have some trace organic constituents suchas dioxins and furans, polyaromatic hydrocarbons (PAHs) and polychlorinated biphenyls(PCBs). Conversely, there is a notable lack of a database regarding the presence in Canadianbiosolids of a certain class of wastewater constituents termed emerging substances of concern(ESOCs). These ESOCs include an array of pharmaceuticals, personal care products,brominated flame retardants and industrial contaminants (such as plasticizers and surfactants).
At the present time, the ability to detect ESOCs in biosolids at the ng/L or ng/g TS (dry wt)exceeds the understanding of the scientific and public communities of any potential riskassociated with their detected presence. Thus the detection ESOCs in biosolids does notautomatically imply that there is a risk for human health or the environment associated withproper biosolids management. The data presented in the review may contribute to further riskassessments, which consider other factors such as the persistence in the soil, the bioaccumulationin the food-chain and the toxicity of the compounds to humans and animals, to determine if theseESOCs should be regulated in the future.
While there is documentation in the literature of ESOCs in biosolids, especially in America andEurope), no focused study has been completed yet on a complete and recent inventory of ESOCsin Canadian biosolids. This literature review documents the occurrence of ESOCs and otherselected compounds in sludges and biosolids with a focus on the effectiveness of sludgetreatment processes to reduce concentrations. It will provide a basis for conducting a targetedsampling program which CCME can use to evaluate and manage the risks associated with

CCME Final ReportESOCs in Biosolids: Concentrations and Effects of Treatment Processes Literature Review
Hydromantis, Inc., University of Waterloo and Trent University v
ESOCs in biosolids destined for managed land application, land reclamation, production ofcommercial soil amendments and energy production.
METHODOLOGYFollowing a computerized literature search, a citation review template was created in MS-Excelto capture the relevant data extracted form each citation. Two major categories were identifiedfor the concentration data provided, namely for “occurrence” purposes, and for “process removalefficiency” purposes. Data classified for occurrence assessment were those in raw sludge or intreated biosolids streams which had not been adjusted in any manner, such as by spiking toelevate concentrations. Removal efficiencies reported in the original literature were used whenreported. Data identified for assessment of process removal efficiencies included reportedremoval efficiencies based on processes deliberately spiked prior to treatment, as well as non-spiked treatment processes. The scale of the tests was identified in the spreadsheet summaries toallow assessment of possible differences between laboratory or pilot-scale studies, and thoseconducted at full-scale.
The major categories of substances identified for review in the literature include: Industrial chemicals (plasticizers, pesticides, perfluorinated organic compounds, solvents,
etc.) Alkylphenols and their ethoxylates Brominated flame retardants Hormones and sterols Pharmaceuticals Personal Care Products Certain metals (arsenic, silver selenium, mercury, etc.) Other (e.g. polyaromatic hydrocarbons, polychlorinated dioxins and furans)
At the start of the literature review, other potential categories were identified, such asnanoparticles and prions. Although publications involving risk assessments or laboratory spikingstudies of prions were identified, no citations were found in the literature regarding theconcentration of these substances in biosolids. Consequently and thus they were dropped fromthe literature review.
Categories of biosolids treatment processes in this review include: Anaerobic digestion Aerobic digestion Composting Lime addition Heat drying Other drying (e.g. air or solar drying) Other treatment Unknown
LITERATURE REVIEW SUMMARYIndustrial ChemicalsThe compounds included in the industrial category in this review are diverse in their chemical

CCME Final ReportESOCs in Biosolids: Concentrations and Effects of Treatment Processes Literature Review
Hydromantis, Inc., University of Waterloo and Trent University vi
properties and uses. The occurrence data are found more readily than are removal efficiencydata. The plasticizer bis(2-ethylhexyl)phthalate has been characterized more frequently than haveother phthalate esters or similar compounds. Limited data suggest it can be removed by somesludge treatment processes, including anaerobic digestion. The plastic-associated chemical BPAis detected in most raw and digested sludges. Limited data reviewed herein indicate it isrelatively unchanged by most biosolids treatment processes, based on a comparison withconcentrations in other sludges. Although perfluorooctanoic acid (PFOA) andperfluorooctanesulfonate (PFOS) are the dominant species of the most frequently reported
perfluorinated organic compounds, other less well recognized compounds may well be present atsimilar concentrations as well. Biotransformation of PFOS and PFOA in both aerobic andanaerobic environments may play a role in the presence of the compounds such as 2-(N-methylperfluorooctanesulfonamido)acetate and 2-(N-ethylperfluorooctanesulfonamido)acetate.
Relative to the other ESOCs discussed in this review, which are often observed in the ng/g TSconcentration range, linear alkylbenzene sulfonates (LAS) are present at concentrations that areorder of magnitude higher. In limited data, sludges aerobically digested sludge from Germanyand untreated sludges from Spain had lower concentrations of LAS than did anaerobicallydigested sludges from the same and other countries. The most commonly reported phenoliccompound was pentachlorophenol (PCP). Data reviewed indicated that PCP concentrations insludge can be reduced during anaerobic digestion. Pesticide residues in the μg/g TS range werereported in a variety of sludge types in France by Ruel et al. (2008), demonstrating thepersistence of these compounds. A comprehensive comparison of pesticide concentrations insludges from other countries is lacking. Solvent data were limited but were generally identifiedat the ng/g TS concentration level in sludge samples. In general, there was almost a completelack of removal efficiency data by different biosolids treatment processes for the industrialchemicals.
Alkylphenols and their EthoxylatesThere appear to be differences in alkylphenol (AP) and their associated ethoxylate (APE)
concentrations between biosolids samples collected from different countries, possibly due todifferent regulations for detergent product formulation. In raw sludges or aerobically digestedsludges, concentrations of mono- and di-ethoxylated species of nonylphenol (NP) may occur atconcentrations approximately equal to or even slightly greater than the parent nonylphenol. Ofthe biosolids treatment processes examined, anaerobic digestion consistently has the highestconcentrations of 4-NP, as a result of anaerobic biotransformation processes converting mono-and di-ethoxylated species to the parent compound. Composting appears to result in lowerconcentrations of APs and APEs than does drying or lime treatment. Limited data suggest thatlime treatment may result in lower reduction of APEs compared to composting or dryingprocesses. A composting period of between 40 and 70 days is needed to reduce the starting levelof 4-NP by over 90%.
Brominated Flame RetardantsThe main group of compounds in the brominated flame retardant (BFR) category is the polybrominateddiphenyl ethers (PBDEs). There are apparent differences in concentrations of different PBDEisomers in North America and other countries (e.g., Europe, Kuwait, and Australia). The isomerdecabromodiphenyl ether (decabromo DPE, or BDE 209) was observed in all the samples at thehighest concentration of any of the isomers, followed by the penta BDE99 and tetra BDE47
CCME Final ReportESOCs in Biosolids: Concentrations and Effects of Treatment Processes Literature Review
Hydromantis, Inc., University of Waterloo and Trent University vii
isomers. Available data indicate that the concentrations of the PBDE isomers are substantiallylower in the solids streams prior to secondary treatment (e.g. primary sludge), and moreconcentrated in the solids streams following secondary treatment (i.e., return activated sludge,and dewatered secondary or mixed sludge). Anaerobic digestion may result in a reduction ofdecabromodiphenyl ether, but concentrations of lower brominated congeners may increase due to
this biotransformation. There was insufficient information to determine if other biosolids treatmentprocesses can result in reduction of PBDEs. Few occurrence data were identified for other BFRssuch as tetrabromobisphenol A (TBBPA) and hexabromocyclododecane (HBCD). No reductionefficiency data for the BFRs in biosolids treatment processes were observed in the literature.
Pharmaceutical CompoundsThis class of ESOCs in sludges and biosolids includes many different sub-classes with differenttherapeutic uses. There is a wide range of data available for the different pharmaceuticals thatmay be present in sludges and biosolids. Some compounds like the anti-epileptic carbamazepinehave been widely characterized, while others have only one or two references in the literature.As a result of there being limited occurrence data for many pharmaceuticals, there are even fewerdata available investigating the reduction of these drugs in biosolids treatment processes.Anaerobic digestion is the treatment process for which most data on pharmaceuticalconcentrations prior to and after treatment have been recorded. Reduction of the compoundsappears to be highly specific to each class of pharmaceutical.
Hormones and SterolsThe hormones 17α-ethinylestradiol (EE2), estrone (E1) and 17β-estradiol (E2) are among themost frequently characterized compounds of this category in sludges and biosolids. Estrone (E1)is higher in concentration than these other common estrogenic compounds. The concentration ofthe natural hormone progesterone was the highest of the other estrogens observed. Concentrationsof androgens in sludges were reported less frequently than estrogens. Concentrations of plantsterols in sludges and biosolids were among the highest observed in this literature review, withconcentrations in the tens of thousands of ng/g TS. Composting and heat drying resulted in lowerconcentrations of the phytosterols in the biosolids; anaerobic digestion treatment had the highestconcentrations of the four treatment methods. Concentrations of the animal sterols reported insludges varied substantially from one reference or source to the next, but were in any case amongthe highest concentrations observed in this review. Composting resulted in the lowest observedconcentrations of both cholesterol and 3β-coprostanol in different biosolids treatment processes.
Removal efficiencies up to 85% were recorded for both 17α-ethinylestradiol (EE2) and a mixtureof estrone (E1) and 17β-estradiol (E2) in both thermophilic and mesophilic anaerobic digestion.Removal efficiency data for hormones and sterols in other biosolids treatment processes arescarce.
Personal Care ProductsThe publications reviewed have centred almost exclusively on the presence of the anti-bacterialstriclosan and triclocarban, synthetic musk fragrance compounds, and limited data on fluorescentwhitening agents, quaternary ammonium compounds and siloxanes. There is negligible focus onother personal care products (PCP) compounds, such as parabens, sunscreen agents or insectrepellents, identified in CCME’s Review of the State of Knowledge of Municipal EffluentScience and Research: Review of Effluent Substances. Triclosan is found in sludge and biosolidssamples at a concentration approximately an order of magnitude higher than is hexachlorophene.

CCME Final ReportESOCs in Biosolids: Concentrations and Effects of Treatment Processes Literature Review
Hydromantis, Inc., University of Waterloo and Trent University viii
Concentration data for triclocarban in sludges and biosolids are extremely sparse. There is noapparent reduction of triclosan by anaerobic digestion or other biosolids treatment processes suchas composting, lime addition or heat treatment.
Polycyclic musks are present at higher concentrations than nitro musks. HHCB and AHTN arethe predominant polycyclic musks, followed by ATII. The two main nitro musks identified insludge samples were Musk ketone and Musk xylene. Full-scale anaerobic digestion does notappear to reduce concentrations of polycyclic musks in sludges, with concentrations in thedigested sludges higher than in the raw sludge. Laboratory spiked anaerobic digestion studiesindicate reductions in AHTN and HHCB concentrations are possible. Aerobic treatment appearsto cause a reduction in concentrations of polycyclic musks. There are insufficient data reportedin the literature to determine the effectiveness of the different biosolids treatment processes forreductions of the compounds.
Documentation of the occurrence of the disinfectant quaternary ammonium compounds insludges and biosolids is limited, but reported concentrations of the compounds are significantlyhigher than for many of the other types of ESOCs. Occurrence and concentrations of siloxanes insludges and biosolids are poorly documented.
There are insufficient data reported in the literature to determine the effectiveness of the differentbiosolids treatment processes for reductions of most of the personal care products.
Metals and MetalloidsThe substances included in this review include a number of elements that include both metalsand metalloids, such as arsenic and selenium, which will be referred to as “metals” forsimplicity. The concentration database for metals and metalloids is limited because this reviewwas focused on data from the year 2000 on, and much of the documented research on metalsoccurred previously. After iron and aluminum, the metals of highest concentration are zinc andcopper, two metals commonly used in household plumbing. There are few data characterizingconcentrations of elements such as antimony, beryllium, thallium, titanium, and vanadium inbiosolids. Organotin compounds are present in sludges at low concentrations of less than 1mg/kg TS (less than 1,000 ng/g TS). Limited data suggest the organotin compounds are notreduced in concentration by anaerobic digestion.
Other SubstancesThis section brings together compounds which were not readily included in the previoussections. The major groupings include the polyaromatic hydrocarbons (PAHs) andpolychlorinated polyaromatic compounds (biphenyls (PCBs); dibenzofurans (PCDFs); anddibenzo-p-dioxins (PCDDs). The upper range of naphthalene, methylnaphthalene isomers andbenzo(a)anthracene were at or above 100,000 ng/g TS in the literature review of Harrison et al.(2006), although a survey of Canadian sludges resulted in median concentrations typically lyingin the range of 100 to 1,500 ng/g TS. The simplest PAHs, naphthalene and phenanthrene,consisting of two and three fused benzene rings, respectively, have the highest medianconcentrations of the PAHs in a survey of Canadian sludges. Data on the effect of biosolidstreatment processes on reducing concentrations of PAHs are very limited. For the lowermolecular weight PAHs anthracene and phenanthrene, composted and air dried biosolids haveapparent lower concentrations than biosolids produced by heat drying or after anaerobic

CCME Final ReportESOCs in Biosolids: Concentrations and Effects of Treatment Processes Literature Review
Hydromantis, Inc., University of Waterloo and Trent University ix
digestion. Anaerobic digested sludge had the highest concentrations of the PAHs examined in the
biosolids from different treatment processes. For the literature surveyed, the range and means of thePCDDs and PCDFs reported from different countries appear to be very similar, with mean valuesin the range of 0.020 ng TEQ/g TS. More recent data from Québec and Ontario (unpublished) indicatea median of 0.008 ng TEQ/g TS for land applied biosolids.
ANALYSIS OF LITERATURE REVIEWThe interpretation of the published results on occurrence, concentrations and removalefficiencies of contaminants in sludges and biosolids is complex. Terminology of residualwastewater solids, as used by the different authors in the publications, is not consistent.References to “sludge” in the publications reviewed are construed to mean “untreated sewagesludge”. Often, however, the word sludge may be used when in fact the more appropriate termmay be “biosolids”, as the residual solids have been subjected to a stabilization process. In muchof the data reviewed, including other literature reviews, the sludges or biosolids are not specifiedby type (raw or treated, primary or secondary, etc) which makes the effort of determining if someprocesses are more beneficial than others in minimizing the concentrations of these substances.Some reviews, which summarize concentration data, group different types of sludges togetherwithout regard to the nature of the sludges.
There is a great disparity in published literature in the attention devoted to the occurrence ofdifferent ESOCs in sludges and biosolids. Some compounds have been examinedcomprehensively, and there is a substantial database on occurrence of these substances.Examples of the well-documented substances include the plasticizer bis(2-ethylhexyl)phthalate,the surfactant nonylphenol and some of its ethoxylates, the synthetic musk fragrances HHCB andAHTN, the flame retardants polybrominated diphenyl ethers, and the bacteriostat triclosan. Inother cases however, there is a significant lack of information on concentrations of othersubstances in sludges and biosolids, including many antibiotics and other pharmaceuticals.CCME’s report on the State of Knowledge of Municipal Effluent Science and Researchidentified many classes of personal care products in treated effluents, including parabens (anti-microbial preservatives), sunscreen agents and insect repellents, for which no occurrence data insludges or biosolids were found. Lack of adequate analytical protocols may hinder this effort.
In much of the data reviewed, including other literature reviews, the sludges or biosolids are notspecified by type (raw or treated, primary or secondary, etc.) which makes the effort ofdetermining if some processes are more beneficial than others in minimizing the concentrationsof these substances. Some reviews, which summarize concentration data, group different typesof sludges together without regard to the nature of the sludges. There appeared in the review tobe evidence that sludges from some countries have lower concentrations than others, which maybe reflective of manufacturing or use restrictions.
The concentrations of different ESOCs reviewed in this report can vary widely in sludges andbiosolids, from the low part per billion (ng/g TS) (e.g. estrogens and androgens to the part perthousand level, for plant and animal sterols, and from literature in the 1990s, linear alkylbenzenesurfactants. LAS concentrations may now be lower, but there is a scarcity of recent data forthese compounds.

CCME Final ReportESOCs in Biosolids: Concentrations and Effects of Treatment Processes Literature Review
Hydromantis, Inc., University of Waterloo and Trent University x
High concentrations (e.g., mg/g TS range) of substances identified in the sludges and biosolidsare not necessarily a cause for concern. The plant and animal sterols for example are naturalproducts that may serve as an anthropogenic indicator or marker. Conversely, very low (e.g.,ng/g TS range) concentrations of substances such as hormones, polybrominated diphenyl ethersand perfluorinated organic compounds that may be found in biosolids destined for landapplication are likely to be of greater concern due to their potential for endocrine disruption orpersistence, bioaccumulation or toxicity.
With respect to different biosolids treatment processes, in most publications only the final treatedbiosolids concentrations are typically documented. Without the accompanying raw sludgeconcentrations, an evaluation of the effectiveness of the processes becomes more tenuous. In thedata provided by Kinney et al. (2006), there appears to be evidence of some reduction in ESOCconcentrations resulting from certain biosolids treatment processes such as composting or drying,based only on differences in concentrations between the treated biosolids. Without raw sludgedata, however, no firm conclusions can be drawn.
The treatment process most characterized for ability to reduce contaminant concentrations is theanaerobic digestion process. For example in the studies by Carballa et al. (2006, 2007a, 2007b),concentrations of a variety of contaminants are provided for both raw sludge and sludgesdigested under different temperature regimes and retention times. From this review it appearsthat certain ESOCs can be reduced by anaerobic digestion, while others are recalcitrant (e.g.,Bisphenol A, musk fragrances, triclosan), or perhaps even increased in concentration (e.g., 4-nonylphenol) by anaerobic biotransformation processes.
It is evident from this review that published knowledge of the potential for reduction of specific ESOCs inwastewater sludges by composting, alkaline stabilization or drying processes is incomplete
There is a major lack of published data regarding ESOC occurrence, concentration and removalin septage. Only one study published after the year 2000 was identified here, making acomparison of concentrations in septage relative to other wastewater sludges or biosolidsdifficult. No studies on the effectiveness of treatment of septage for reduction of ESOCconcentrations were identified.
Many ESOCs are hydrophilic, such as many drugs and does not tend to remain in biosolids butrather in the treated water. However, many of the ESOCs examined in this review arehydrophobic, they concentrate in the residual wastewater solids (sludges). The understanding ofthe fate of these compounds by different biosolids processes is largely unknown. Because landapplication of biosolids is an important management technique in Canada, it is desirable tominimize any potential adverse effects to the terrestrial environment due to amendment of soilswith biosolids. Consequently, there is a need to understand whether certain biosolids treatmentprocesses are better than others at reducing concentrations of ESOCs in wastewater sludges.Should it be determined from literature studies or actual testing that certain types of ESOCsremain unaffected by biosolids treatment processes, then other means of limiting theconcentrations of these recalcitrant compounds in biosolids should be explored, such as bysource control, pretreatment and sewer use limits, or more extreme measures such as product re-formulations or outright bans on manufacture or use.

CCME Final ReportESOCs in Biosolids: Concentrations and Effects of Treatment Processes Literature Review
Hydromantis, Inc., University of Waterloo and Trent University xi
RECOMMENDATIONSBased on the literature review and above assessment, the following recommendations areoffered:
1. There is a need to define criteria for what is an adequate database for characterization ofcontaminants in sludges and biosolids, then to apply the criteria to the compiled data. Anexample of the review criteria might consist of a minimum number of qualified references(e.g., n=6), and specified relative standard deviation about a mean concentration (e.g.RSD = 25%).
2. Where there are insufficient data, the availability of adequate analytical protocols for theESOCs of interest needs to be determined by qualified analytical personnel. If adequateanalytical procedures are not available, then method development should be set as apriority.
3. If acceptable analytical protocols are available, the sampling survey proposed as part ofthis study to investigate the ability of biosolids treatment processes to reduceconcentrations of ESOCs in sewage sludge and biosolids should be .initiated. Assessmentof biosolids treatment effectiveness requires both raw and treated biosolids samples, aswell as any potential process sidestreams to aid in mass balance closures.
4. As part of the biosolids treatment survey, sites with septage treatment should be includedso that a database of ESOCs in septage can be expanded.
5. In the proposed survey of biosolids treatment processes, within budgetary limits, differenttypes of pharmaceuticals, synthetic musk fragrances and Bisphenol A should be includedas primary target analytes. Secondarily, as budgetary limitations permit, classes ofESOCs such as human hormones, brominated flame retardants, perfluorinated organiccompounds, quaternary ammonium compounds, and siloxanes should be analysed.
6. Should it be determined from literature studies or actual testing that certain types ofESOCs remain unaffected by biosolids treatment processes, then other means of limitingthe concentrations of these recalcitrant compounds in biosolids should be explored, suchas by source control, pretreatment and sewer use limits, or more extreme measures suchas product re-formulations or outright bans on manufacture or use. Such actions should bconsistent across Canada. With respect to non-persistent ESOCs in biosolids applied toland, a mitigating approach may be to prescribe an interim period between the time ofland application and the beginning of seeding or grazing to allow soil microbes time todegrade the compounds.
7. Lastly, data produced by this and similar reviews, and by the forth-coming fieldinvestigation, need to be transferred out to appropriate agencies and researchers.

CCME Final ReportESOCs in Biosolids: Concentrations and Effects of Treatment Processes Literature Review
Hydromantis, Inc., University of Waterloo and Trent University xii
Table of Contents
ACKNOWLEDGEMENTS ................................................................................. I
ACRONYMS...................................................................................................... II
EXECUTIVE SUMMARY................................................................................... IV
TABLE OF CONTENTS....................................................................................XII
LIST OF TABLES .............................................................................................XV
1.0 INTRODUCTION ........................................................................................11.1 BACKGROUND........................................................................................................11.2 PROJECT OBJECTIVES ..........................................................................................2
2.0 METHODOLOGY OF REVIEW..................................................................32.1 LITERATURE SEARCH AND IDENTIFICATION................................................32.2 LITERATURE COMPILATION...............................................................................32.3 CLASSIFICATION OF SUBSTANCES...................................................................42.4 CLASSIFICATION OF BIOSOLIDS TREATMENT PROCESSES .......................5
3. CONTAMINANTS IN SLUDGES AND BIOSOLIDS .....................................63.1 INDUSTRIAL COMPOUNDS..................................................................................63.1.1 Introduction...........................................................................................................63.1.2 Plasticizers and Metabolites ..............................................................................63.1.3 Bisphenol A ..........................................................................................................93.1.4 Perfluorinated Organic Acid and Derivative Compounds ......................................113.1.5 Surfactants...............................................................................................................143.1.6 Phenolic Compounds ..............................................................................................153.1.7 Pesticides.................................................................................................................173.1.8 Solvents...................................................................................................................183.1.9 Miscellaneous Compounds .....................................................................................193.1.10 Section Summary..................................................................................................193.2 ALKYLPHENOL AND THEIR ETHOXYLATES ..................................................203.2.1 Introduction.............................................................................................................203.2.2 Occurrence Data......................................................................................................213.2.3 Section Summary....................................................................................................293.3 BROMINATED FLAME RETARDANTS ...............................................................30

CCME Final ReportESOCs in Biosolids: Concentrations and Effects of Treatment Processes Literature Review
Hydromantis, Inc., University of Waterloo and Trent University xiii
3.3.1 Introduction.............................................................................................................303.3.2 Occurrence Data......................................................................................................303.3.3 Effect of Treatment Processes ................................................................................373.3.4 Section Summary....................................................................................................383.4 PHARMACEUTICAL COMPOUNDS.....................................................................393.4.1 Introduction.............................................................................................................393.4.2 Antibiotics...............................................................................................................393.4.3 Nervous System ......................................................................................................483.4.4 Analgesics and Anti-Inflammatory Drugs ..............................................................533.4.5 Bacteriostat Antibiotics...........................................................................................553.4.6 Cardiovascular Pharmaceuticals .............................................................................563.4.7 Alimentary Tract Pharmaceuticals..........................................................................563.4.8 Blood-Modifying Pharmaceuticals .........................................................................573.4.9 Respiratory and Anti-Allergenic Pharmaceuticals..................................................573.4.10 Anti-Parasitic and Anti-Fungal Pharmaceuticals..................................................593.4.11 Miscellaneous Pharmaceuticals ............................................................................603.4.12 Section Summary..................................................................................................603.5 HORMONES AND STEROLS .................................................................................613.5.1 Hormones................................................................................................................613.5.2 Sterols .....................................................................................................................633.5.3 Section Summary....................................................................................................653.6 PERSONAL CARE PRODUCTS..............................................................................663.6.1 Introduction.............................................................................................................663.6.2 Antimicrobials.........................................................................................................663.6.3 Fragrance Compounds ............................................................................................693.6.4 Fluorescent Whitening Agents................................................................................783.6.5 Quaternary Ammonium Compounds......................................................................793.6.6 Siloxanes .................................................................................................................803.6.7 Section Summary....................................................................................................823.7 METALS AND METALLOIDS................................................................................823.7.1 Introduction.............................................................................................................823.7.2 Occurrence Data......................................................................................................833.7.3 Organotin Compounds ............................................................................................833.7.4 Section Summary....................................................................................................853.8 OTHER SUBSTANCES............................................................................................853.8.1 Introduction.............................................................................................................853.8.2 Polyaromatic Hydrocarbons....................................................................................863.8.3 Polychlorinated Polyaromatics ...............................................................................863.8.4 Section Summary....................................................................................................89
4. CONTAMINANTS IN SEPTAGE...................................................................90
5. ANALYSIS OF LITERATURE REVIEW FINDINGS......................................92

CCME Final ReportESOCs in Biosolids: Concentrations and Effects of Treatment Processes Literature Review
Hydromantis, Inc., University of Waterloo and Trent University xiv
6. RECOMMENDATIONS .................................................................................96
REFERENCES..................................................................................................97

CCME Final ReportESOCs in Biosolids: Concentrations and Effects of Treatment Processes Literature Review
Hydromantis, Inc., University of Waterloo and Trent University xv
List of Tables
Table 1. Concentrations of Phthalate Esters in Municipal Wastewater Solids ............................................. 7Table 2. Concentrations of Other Plasticizers and Metabolites in Primary-Assisted Clarifier Sludge......... 8Table 3. Concentrations of Plasticizers and Chemical Intermediates following Biosolids Treatment
Processes ............................................................................................................................................... 8Table 4. Removal of the Plasticizer BEHP in Biosolids Treatment Processes ............................................. 9Table 5. Concentrations of Bisphenol A in Canadian Sludges (Lee and Peart, 2002)................................ 10Table 6. Concentrations of Bisphenol A in Other Sludges and Biosolids .................................................. 11Table 7. Concentrations of Bisphenol A following Biosolids Treatment Processes (Kinney et al., 2006) 11Table 8. Concentrations of More Common Perfluorinated Organic Acids and Derivatives in Sludges
and Biosolids....................................................................................................................................... 13Table 9. Concentrations of Additional Perfluorinated Organic Acids and Derivatives in Sludges and
Biosolids (Schultz et al., 2006)........................................................................................................... 14Table 10. Concentrations of Linear Alkylbenzene Sulfonates in Sludges and Biosolids ........................... 15Table 11. Pentachlorophenol (PCP) Concentrations in Canadian Municipal Sludges (Lee and Peart, 2002)
............................................................................................................................................................ 16Table 12. Concentrations of Phenolic Compounds in Sludges and Biosolids ............................................ 17Table 13. Concentrations of Pesticide Compounds in Sludges and Biosolids............................................ 18Table 14. Concentrations of Solvents in Sludges and Biosolids................................................................. 19Table 15. Concentrations (g/g TS) of Alkylphenol (AP) and Ethoxylates (EO) in Canadian Municipal
Sludges and Biosolids (Lee and Peart, 2002)...................................................................................... 22Table 16. Supplementary Concentration Data for APEs in Canadian Sludges and Biosolids.................... 23Table 17. Concentrations of Nonylphenol in Sludges and Biosolids from Other Countries ...................... 24Table 18. Concentrations of Nonylphenol Ethoxylates and Other Alkylphenol in Sludges and Biosolids 25Table 19. Concentrations of Alkylphenols and their Ethoxylates after Biosolids Treatment ..................... 27Table 20. Removal Efficiencies of 4-NP by Biosolids Composting........................................................... 29Table 21. Removal Efficiencies of APs and Ethoxylates by Biosolids Treatment Processes..................... 29Table 22. PBDE Concentrations in Kelowna, BC Wastewater Solids Streams (from Rayne and Ikonomou,
2005) ................................................................................................................................................... 31Table 23. Concentrations of Major PBDE Isomers in Windsor Little River WW Solids (Song et al., 2006)
............................................................................................................................................................ 32Table 24. PBDE Concentrations in Sludges and Biosolids from Australian Urban Municipalities (Clarke
et al., 2008) ......................................................................................................................................... 33Table 25. PBDE Concentrations in Sludges and Biosolids from Australian Rural Municipalities (Clarke et
al., 2008) ............................................................................................................................................. 34Table 26. PBDE Concentrations in Sludges and Biosolids Based on U.S. EPA’s Targeted National
Sewage Sludge Survey (US EPA 2009) ............................................................................................. 35Table 27. Occurrence data for PBDEs in Biosolids Samples from Other Countries .................................. 36Table 28. Comparison of PBDE Concentrations in Four Biosolids Treatment Processes (LaGuardia et al.,
2004). .................................................................................................................................................. 37Table 29. Concentrations of Brominated Flame Retardants in Sludge Before and After Anaerobic
Digestion (Gerecke et al., 2006) ......................................................................................................... 38Table 30. Categories and Pharmaceuticals Identified in this Review......................................................... 40Table 31. Classes of Antibiotics and Compounds Noted in Literature Review of Biosolids ..................... 41Table 32. Concentrations of Tetracycline Antibiotics in Sludges and Biosolids........................................ 41Table 33. Effect of Storage Treatment on Tetracyclines in Aerobically Digested Biosolids (Wu et al.,
2008) ................................................................................................................................................... 42Table 34. Concentrations of Sulfonamide Antibiotics in Sludges and Biosolids ....................................... 43Table 35. Effect of Anaerobic Digestion Conditions on Removal Efficiency of Sulfamethoxazole.......... 43

CCME Final ReportESOCs in Biosolids: Concentrations and Effects of Treatment Processes Literature Review
Hydromantis, Inc., University of Waterloo and Trent University xvi
Table 36. Concentrations of Fluoroquinolone and Quinolone Antibiotics in Sludges and Biosolids........ 44Table 37. Concentrations of Three Fluoroquinolones in Sludge and Biosolids......................................... 45Table 38. Concentrations of Macrolide Antibiotics in Sludges and Biosolids ........................................... 46Table 39. Effect of Temperature and Retention Time on Removal of Roxithromycin in Anaerobic
Digestion ............................................................................................................................................. 46Table 40. Effect of Storage Treatment on Macrolides in Aerobically Digested Biosolids (Wu et al.,
2008) ................................................................................................................................................... 47Table 41. Concentrations of Beta-Lactam Antibiotics in Sludges and Biosolids (U.S. EPA, 2009) .......... 47Table 42. Concentrations of Lincosamide Antibiotics in Sludges and Biosolids ....................................... 48Table 43. Effect of Storage Treatment on Clindamycin in Aerobically Digested Biosolids (Wu et al.,
2008) ................................................................................................................................................... 48Table 44. Occurrence Data for Carbamazepine in Sludges and Biosolids.................................................. 49Table 45. Concentrations of Carbamazepine in Treated Biosolids............................................................. 49Table 46. Metabolites of Carbamazepine in Sludge (Miao et al., 2005) .................................................... 50Table 47. Effect of Anaerobic Digestion Treatments on Removal of Carbamazepine (Carballa et al.,
2007a) ................................................................................................................................................. 50Table 48. Effect of Pre-Ozonation on Anaerobic Digestion of Carbamazepine (Carballa et al., 2007b)... 51Table 49. Concentrations of Representative Anti-Anxiety and Anti-Depressants in Sludges and
Biosolids ............................................................................................................................................. 51Table 50. Concentrations of Mood-altering Pharmaceuticals in Sludges and Biosolids (Gielen, 2007) .... 52Table 51. Concentrations of Psycho-Stimulants in Sludges ....................................................................... 52Table 52. Occurrence of Analgesics and Non-Steroidal Anti-Inflammatory Drugs (NSAIDs) in
Sludges and Biosolids ......................................................................................................................... 54Table 53. Effect of Anaerobic Digestion Treatments on Removal of NSAIDs .......................................... 55Table 54. Effect of Pre-Ozonation on Anaerobic Digestion of NSAIDs (Carballa et al., 2007b).............. 55Table 55. Concentrations of Trimethoprim in Sludges and Biosolids ........................................................ 55Table 56. Concentrations of Cardiovascular Pharmaceuticals in Sludges and Biosolids ........................... 56Table 57. Concentrations of Alimentary Tract Pharmaceuticals in Sludges and Biosolids........................ 57Table 58. Concentrations of Blood-Modifying Pharmaceuticals in Sludges and Biosolids ....................... 58Table 59. Concentrations of Anti-Allergenic Pharmaceuticals in Sludges and Biosolids ......................... 58Table 60. Concentrations of Two Anti-Allergenics following Biosolids Treatment Processes ................. 59Table 61. Concentrations of Anti-Parasitics and Anti-Fungals in Sludges and Biosolids .......................... 59Table 62. Concentrations of Miscellaneous Pharmaceuticals in Sludges and Biosolids ............................ 60Table 63. Concentrations of Common Estrogenic Compounds in Sludges and Biosolids ......................... 61Table 64. Concentrations of Other Estrogenic Compounds in Sludges and Biosolids (U.S. EPA, 2009) .. 62Table 65. Effect of Anaerobic Digestion Conditions on Removal Efficiency of Estrogenic Compounds .62Table 66. Concentrations of Androgenic Compounds in Sludges and Biosolids ....................................... 63Table 67. Concentrations of Plant Sterols in Sludges and Biosolids .......................................................... 64Table 68. Concentrations of Plant Sterols following Biosolids Treatment Processes (Kinney et al.,
2006) ................................................................................................................................................... 64Table 69. Concentrations of Animal Sterols in Sludges and Biosolids ...................................................... 65Table 70. Concentrations of Animal Sterols following Biosolids Treatment Processes (Kinney et al.,
2006) ................................................................................................................................................... 65Table 71. Occurrence of Triclosan and Hexachlorophene in Canadian Municipal Sludges and
Biosolids (Lee and Peart, 2002) .......................................................................................................... 67Table 72. Concentration of Triclosan in Other Sludge and Biosolids Samples .......................................... 68Table 73. Concentration of Triclosan following Biosolids Treatment Processes ....................................... 68Table 74. 74Identification and Formulations of Common Synthetic Fragrance Compounds.................... 69Table 75. Fragrance Concentrations in Canadian Municipal Sludges (Lee et al., 2003)............................ 71Table 76. Polycyclic Musk Compounds in Canadian Sludge and Biosolids Samples................................ 72Table 77. Nitro Musk Compounds in Canadian Sludge and Biosolids Samples ........................................ 73

CCME Final ReportESOCs in Biosolids: Concentrations and Effects of Treatment Processes Literature Review
Hydromantis, Inc., University of Waterloo and Trent University xvii
Table 78. Concentrations of Polycyclic Musk Compounds in Biosolids from Other Studies ................... 75Table 79. Concentrations of Other Fragrance Compounds in Biosolids..................................................... 76Table 80. Comparison of Fragrance Compound Concentrations in Biosolids Treatment Processes......... 77Table 81. Removal Efficiencies of Two Polycyclic Musks by Anaerobic Digestion (Carballa et al.,
2007a) ................................................................................................................................................. 77Table 82. Effect of Pre-Ozonation on Anaerobic Digestion of Two Polycyclic Musks (Carballa et al.,
2007b) ................................................................................................................................................. 78Table 83. Concentration of Fluorescent Whitening Agents in Biosolids (Harrison et al., 2006) ............... 78Table 84. Concentrations of the QAC Ditallowdimethylammonium Cation in Anaerobically Digested
Biosolids from 6 Swiss Wastewater Treatment Plants (Fernández et al., 1996). ............................... 79Table 85. Removal of Siloxanes D4 and D5 by Chemical Oxidation (Appels et al., 2008)....................... 81Table 86. Concentrations of Metals in Sewage Sludges and Biosolids. ..................................................... 84Table 87. Concentrations of Organotin Compounds in Sludges................................................................. 84Table 88. Concentrations of Polyaromatic Hydrocarbons in Sludges ........................................................ 87Table 89. Concentrations of Polyaromatic Hydrocarbons following Biosolids Treatment Processes
(Kinney et al., 2006) ........................................................................................................................... 87Table 90. Concentrations of Polychlorinated Polyaromatics in Sludges .................................................... 88Table 91. Occurrence and Concentrations of ESOCs in Septage ............................................................... 91Table 92. Approximate Range of Concentrations of ESOCs in Sludges and Biosolids ............................. 93Table 93. Potential of Biosolids Treatment Processes for Reduction of ESOCs in Sewage Sludge ......... 94

CCME Final ReportESOCs in Biosolids: Concentrations and Effects of Treatment Processes Literature Review
Hydromantis, Inc., University of Waterloo and Trent University 1
1.0 INTRODUCTION
1.1 BACKGROUND
The Biosolids Task Group (BTG) established by the Canadian Council of Ministers of theEnvironment (CCME) is mandated to study and make recommendations on biosolidsmanagement at the national level. Wastewater treatment facilities (WWTF) across Canadagenerate residual wastewater solids (biosolids) that require treatment for safeguarding humanhealth and the environment prior to their use or disposal. Options for disposal, recovery orrecycling of biosolids include energy, nutrient or material recovery, landfilling, incineration,managed land application, land reclamation, and commercial product recovery (compost andpellets).
This report examines the occurrence of wastewater constituents termed emerging substances ofconcern (ESOCs) in residual solids from municipal wastewater treatment. The residual solids invarious usages have been termed simply as “sludge” or alternatively as “biosolids”. The FinalReport of the recent US. EPA Targeted National Sewage Sludge Survey (U.S. EPA, 2009) beganwith this definition:
“Sewage sludge is the solid, semisolid, or liquid organic material that results fromthe treatment of domestic wastewater by municipal wastewater treatment plants,also known as publicly owned treatment works (POTWs). The U.S. EnvironmentalProtection Agency (EPA) uses the terms sewage sludge and biosolidsinterchangeably, but others often refer to biosolids as sewage sludge that has hadadditional processing for land application.”
The ambiguity with respect whether the raw unprocessed material has been subjected to furtherprocessing or treatment can be observed in this definition. By contrast, the European Union (EU,2000) differentiates between sludge, sewage sludge and treated sludge.
Sludge: “mixture of water and solids separated from various types of water as aresult of natural or artificial processes.”Sewage sludge: “sludge from urban water treatment plants”, whereby ‘urbanwastewater’ is understood as: “domestic wastewater or the mixture of domesticwastewater with industrial wastewater and/or run-off rain water”. The definition of“domestic wastewater” is: “wastewater from residential settlements and services,which originates predominantly from the human metabolism and from householdactivities”.Treated sludge: Sludge which has undergone a treatment process so as tosignificantly reduce its biodegradability and its potential to cause nuisance as wellas health and environmental hazards when it is used on land.
In this report, the term sludge or raw sludge is most closely identified with the European Uniondefinition “sewage sludge”, which is a “mixture of water and solids, separated from varioustypes of water as a result of natural or artificial processes at urban wastewater treatment plants”.The European concept of “treated sludge” can more closely be identified with the material called“biosolids” in this report. In this report, the tern biosolids is applied to a treated material

CCME Final ReportESOCs in Biosolids: Concentrations and Effects of Treatment Processes Literature Review
Hydromantis, Inc., University of Waterloo and Trent University 2
produced from raw sludge by processes such as anaerobic and aerobic digestion, composting,thermal or air drying, and alkaline stabilization with additives such as lime or cement kiln dust.
The end use of the biosolids is often governed by the constituent quality of the biosolids, such asnutrients, metals, pathogens and trace constituents. Concentrations of nutrients and metals inbiosolids have been widely documented in the past, as have some trace organic constituents suchas dioxins and furans, polyaromatic hydrocarbons (PAHs) and polychlorinated biphenyls(PCBs). Conversely, there is a notable lack of a database regarding the presence in Canadianbiosolids of a certain class of wastewater constituents termed emerging substances of concern(ESOCs). These ESOCs include an array of pharmaceuticals, personal care products, brominatedflame retardants and industrial contaminants (such as plasticizers and surfactants).
At the present time, the ability to detect ESOCs in biosolids at the ng/L or ng/g TS (dry wt)exceeds the understanding of the scientific and public communities of any potential riskassociated with their detected presence. Thus the detection ESOCs in biosolids does notautomatically imply that there is a risk for human health or the environment associated withproper biosolids management. The data presented in the review may contribute to further riskassessments, which consider other factors such as the persistence in the soil, the bioaccumulationin the food-chain and the toxicity of the compounds to humans and animals, to determine if theseESOCs should be regulated in the future.
While there is documentation in the literature of ESOCs in biosolids, especially in America andEurope, no focused study has been completed yet on a complete and recent inventory of ESOCsin Canadian biosolids. Consequently, CCME has issued a Request for Proposals to document theoccurrence of ESOCs in biosolids and to conduct a targeted sampling program which willprovide a basis for CCME to understand the current state of knowledge and to determine whetherCanadian approaches to biosolids management are sustainable.
1.2 PROJECT OBJECTIVES
The objectives of this project are to:1. Prepare a comprehensive review of research on ESOCs in biosolids within Canada and
elsewhere based on technical literature and wastewater sector contacts;2. Complete a survey and analyze biosolids samples with respect to ESOCs;3. Identify those ESOCs of potential concern in Canadian biosolids;4. Review and recommend treatment technologies that mitigate EC concentrations in biosolids;5. Suggest Best Management Practices (BMPs);6. Identify knowledge gaps and research needs for ESOCs with respect to biosolids;7. Produce a final report of the project to the Contract and Project Authorities by October 30,
2009.
This report responds to Objective 1.

CCME Final ReportESOCs in Biosolids: Concentrations and Effects of Treatment Processes Literature Review
Hydromantis, Inc., University of Waterloo and Trent University 3
2.0 METHODOLOGY OF REVIEW
2.1 LITERATURE SEARCH AND IDENTIFICATION
In December of 2008, a computerised literature search was executed by Dr. Wayne Parker at theUniversity of Waterloo with the objective of identifying citations pertaining to biosolids andcontaminants.
The computerised literature search was supplemented with telephone calls to experts on the topicof ESOCs in biosolids. Telephone discussions were held with:
Dr. Mel Webber of Webber Environmental, Burlington, ON Shirley Anne Smythe of Environment Canada, Burlington, ON Dr. George O’Connor of the Dept. of Soil and Water Science, the University of Florida at
Gainesville Dr. Sally Brown of the University of Washington.
2.2 LITERATURE COMPILATION
A citation review template was created in MS-Excel to capture the relevant data extracted fromeach citation. An initial data review session with Hydromantis and Dr. Parker assessed thenature and quality of the information extracted to mid-January. Two major categories wereidentified for the concentration data provided, namely for “occurrence” purposes, and for“process removal efficiency” purposes. Data classified for occurrence assessment were those inraw sludge or in treated biosolids streams which had not been adjusted in any manner, such as byspiking to elevate concentrations. Removal efficiencies reported in the original literature wereused when reported. The Project Team decided not to calculate removal efficiencies from any ofthe original data after it appeared that values of the efficiencies calculated by the Team mightdiffer form those in the original literature. Data identified for assessment of process removalefficiencies included reported removal efficiencies based on processes deliberately spiked priorto treatment, as well as non-spiked treatment processes. The scale of the tests was identified toallow assessment of possible differences between laboratory or pilot-scale studies, and thoseconducted at full-scale.
During the data review, it became clear that a number of issues needed to be addressed ininterpreting the data. Analytical procedures needed to be checked to determine the basis of thematrix reported. For example, in some cases, only the liquid fraction of the sample was analyzed,while in other cases the analysis was performed on the whole sample including solids. In yetother cases, the total concentration was estimated using the analysed liquid concentration, towhich was added a contaminant mass associated with the solids, estimated from a solids partitioncoefficient, to obtain the total concentration.
A second issue was consistency in the reported use of units of concentration. The units ofmeasurement were variously reported on a volumetric liquid basis (e.g., ng/L), a solids massbasis (e.g., ng/g dry solids), or in other units such as ng/g of organic carbon.

CCME Final ReportESOCs in Biosolids: Concentrations and Effects of Treatment Processes Literature Review
Hydromantis, Inc., University of Waterloo and Trent University 4
The research team determined that because of the large number of potential contaminants toreport, and the number of citations for reviewing, that data entry consistency was necessary. Aprincipal concern was the manner in which non-detectable concentrations were entered in themaster spreadsheet. If a compound was included in the analytical test group, but was reported inthe original reference as non-detected, it was so classified in the spreadsheet. If a contaminantwas not included in the analytical test group, the cell was left blank. The distinction is necessaryto differentiate between compounds that were looked for but were not detected (affects theoccurrence interpretation) and those that were not included for identification (no impact onoccurrence assessment).
The reporting (or not) of contaminants in sludges and biosolids is highly dependent on inter-actions between the target compound, the matrix to be analysed, the analytical procedure, andanalytical equipment used. Analytical techniques continue to be refined, reducing limits ofquantitation to ever lower levels. As a consequence, certain compounds reported as non-detectable as little as five to ten years previously can now be observed at reportableconcentrations in the technical literature. Even as the detection limits become lower, however,than be a significant range in detection limits between compounds in the same target class. Forexample, in the same analytical procedure, the detection limit of the analgesic compoundacetaminophen may be several orders of magnitude higher than an antibiotic such aserythromycin. Lastly, there are still some target compounds for which methods may not havebeen adequately developed when dealing with complex matrices such as sludges and biosolids.
Presentation of the data in a publication required another decision regarding presentation. Meanor median values were also entered in the spreadsheet if reported in the original citations. Whenseveral concentrations within a category were documented within the same citation, a rangecould then be reported (e.g. n.d. – 20 ng/L).
2.3 CLASSIFICATION OF SUBSTANCES
The major categories of substances identified in the literature review include:
Industrial chemicals (plasticizers, pesticides, perfluorinated organic compounds, solvents,etc.)
Alkylphenols and their ethoxylates Flame retardants Hormones, steroids and sterols Pharmaceuticals Personal Care Products Certain metals (arsenic, silver selenium, mercury, etc.) Other (e.g. polyaromatic hydrocarbons, polychlorinated dioxins and furans)
At the start of the literature review, other potential categories were identified, such asnanoparticles and prions. No literature citations were found for these substances, and thus theywere dropped from the literature review.

CCME Final ReportESOCs in Biosolids: Concentrations and Effects of Treatment Processes Literature Review
Hydromantis, Inc., University of Waterloo and Trent University 5
2.4 CLASSIFICATION OF BIOSOLIDS TREATMENT PROCESSES
Categories of biosolids treatment processes in this review include: Anaerobic digestion Aerobic digestion Composting Lime addition Heat drying Other drying (e.g. air or solar drying) Other treatment Unknown

CCME Final ReportESOCs in Biosolids: Concentrations and Effects of Treatment Processes Literature Review
Hydromantis, Inc., University of Waterloo and Trent University 6
3. CONTAMINANTS IN SLUDGES AND BIOSOLIDS
3.1 INDUSTRIAL COMPOUNDS
3.1.1 Introduction
The compounds included in this section are those which are produced or used as industrialchemical products or intermediates. This review is not intended to provide a complete historicalrecord of concentrations of all industrial compounds in sludges and biosolids, as past surveyscompleted through the 1970s and through 1990s have documented these as “legacy”contaminants from the U.S. EPA’s Priority Pollutant List. The intent of this review is to providemore recent data from approximately 2000 onward to the present.
The main categories of industrial compounds examined in this Section include: Plasticizers and Bisphenol A Perfluorinated organic acid and derivative compounds Pesticides Surfactants (excluding alkylphenol and ethoxylates, discussed separately) Chlorophenols Solvents, and Miscellaneous compounds not covered elsewhere.
3.1.2 Plasticizers and Metabolites
Plasticizers are added to polymeric materials to increase flexibility and suppleness. Phthalate andadipate esters are two common classes of plasticizers. A main health concern appears to thepotential for harm to developing male reproductive organs (e.g., Our Stolen Future, 2009).Health Canada in June 2009 proposed a ban on six common phthalate esters used in themanufacture of children’s plastic toys (Mittelstaedt, 2009).
Concentrations of phthalate esters found recently in the literature are provided in Table 1. Datafor an array of phthalate esters provided by Harrison et al. (2006) in their sludge literature reviewand by Tan et al. (2007) for return activated sludge samples, clearly shows that bis(2-ethylhexyl)phthalate (BEHP) is the predominant compound in this class, at concentrations several orders ofmagnitude higher than the other phthalate esters. Concentration data from several nationsprovided in Table 1 focus almost exclusively on BEHP, without analysis or reporting of the otherphthalate compounds. The mean concentration of BEHP in Swedish sludges at 24,500 ng/g TSappeared to be lower than the concentrations reported in sludges from other countries.
In addition to phthalate esters, other similar types of compounds are used as plasticizers.Concentrations of the compounds bis(2-ethylhexyl) terephthalate and bis(2-ethylhexyl) adipateare shown in Table 2 for two sludge samples from a chemically enhanced primary treatmentfacility in Montreal (Barnabé et al., 2008).

CCME Final ReportESOCs in Biosolids: Concentrations and Effects of Treatment Processes Literature Review
Hydromantis, Inc., University of Waterloo and Trent University 7
Table 1. Concentrations of Phthalate Esters in Municipal Wastewater Solids
Concentration (ng/g TS)c
Sludge Source Dimethylphthalate
Diethylphthalate
Di-n-butylphthalate
Butylbenzylphthalate
Bis (2-ethylhexyl)phthalate
Di-n-octylphthalate
Reference
U.S.A. Biosolids (n=9)3,460 – 31,700
(10,500)b,hKinney et al.(2006)
Not specified (literaturereview) 26 18 393 201 62,480 570
Harrison et al.(2006)
Return activated sludge(plant 1)
notanalysed 39.9±24.3a 149±80.4 25.7±9.4 9,910 ± 2,770
notanalysed
Return activated sludge(plant 2)
notanalysed 17.2±12.0 12.6±3.4 11.0±9.5 2,200 ± 1,480
notanalysed
Tan et al. (2007)
Norway sewage sludgesd27,000 - 115,000(83,000)b,g
Sweden sewage sludgesd25,000 - 661,000(170,000) b,g
Denmark sewage sludgesd3,900 - 170,000(24,500) b,g
Jaganyi (2007)
Canadian sludge(1995-1998)e
1,600 - 245,000(160,000) n=6?
Webber andNichols (1995)
Homogenized sludgef 80,000 ± 10,000g
Dewatered sludgef 90,000 ± 12,000 g
Barnabé et al.(2008)
a mean ± standard deviation b range (median) c equivalent to parts per billiond based on definition of sewage sludge used in Jaganyi (2007), this material is believed to be an untreated or “raw” sludgef from chemically assisted primary treatment only g number of samples not specified in citation h ng/g OC

CCME Final ReportESOCs in Biosolids: Concentrations and Effects of Treatment Processes Literature Review
Hydromantis, Inc., University of Waterloo and Trent University 8
Table 2. Concentrations of Other Plasticizers and Metabolites in Primary-Assisted ClarifierSludge
Concentration (ng/g TS)
Sludge Source Bis (2-ethylhexyl)terephthalate
Bis (2-ethylhexyl)adipate
2-ethyl-hexanol
2-ethyl-hexanal
2-ethyl-hexanoicacid
Reference
Homogenizedsludge
45,000 ±2,300a
34,000 ±1,000
12,500± 900
34,000 ±1,400
20,700 ±400
Dewatered sludge104,000 ±
5,00340,000 ±
10,0004,500 ±
30085,000 ±
3,40014,600 ±
300
Barnabéet al.(2008)
a mean ± standard deviation based on minimum of 3 replicate analyses
Comparing concentrations of these two compounds with those of BEHP in the same sludges inTable 1 indicate that the terephthalate and adipate esters are present in similar concentrations tothe BEHP. The chemicals 2-ethylhexanol and 2-ethylhexanal are metabolites of the bis(2-ethylhexyl) organic acid esters (phthalates, adipates, terephthalates, etc.). The aldehyde (2-ethylhexanal) was observed at a higher mean concentration than was the alcohol (2-ethylhexanol)in the data of Barnabé et al. (2008), particularly in the dewatered sludge sample.
Concentrations of plasticizer and chemical intermediate compounds in treated biosolids samplesare presented in Table 3. The highest concentration of BEHP was observed in the group ofbiosolids treatment data developed by Ruel et al. (2008), consisting of anaerobically digested,limed and dried biosolids. BEHP concentrations in the other reported literature were in the rangeof 15,000 to 53,000 ng/g TS.
Table 3. Concentrations of Plasticizers and Chemical Intermediates following BiosolidsTreatment Processes
Concentration (ng/g TS)
BiosolidsTreatment
Bis (2-ethyl-hexyl)phthalate
Bis (2-ethylhexyl)terephthalate
Bis (2-ethylhexyl)adipate
2-ethyl-hexanol
2-ethyl-hexanal Reference
Dried sludge15,000 ±
2000a 12,200 ± 60019,300 ±
1,000 nd ndBarnabé etal., (2008)
Anaerobicdigestion, limed,drying
2,197,000 ±11,000,000b
Ruel et al.,(2008)
CompostingIn = 53,000out = 15,000
Heat dryingIn = 44,000out = 34,000
Gibson etal., (2007)
Compost27,900 -154,000
Williams(2007)
nd = not detecteda mean ± standard deviation based on minimum of 3 replicate analysesb mean ± standard deviation from literature database; number not specified

CCME Final ReportESOCs in Biosolids: Concentrations and Effects of Treatment Processes Literature Review
Hydromantis, Inc., University of Waterloo and Trent University 9
Barnabé et al. (2008) reported on concentrations of three plasticizers in dried sludge from theMontreal QC, chemically-assisted primary treatment plant. Gibson et al. (2007) providedconcentrations of BEHP at the inlet and outlets of composting and heat drying processes.Composting appeared to result in lower concentrations than heat drying, but the data are limited.
Removal in Biosolids Treatment ProcessesRemoval efficiency data in biosolids treatment processes were only found for BEHP (Table 4).Composting appeared to result in effective reduction of BEHP, with removal efficiencies of 64%and 70% reported by Gibson et al. (2007) and Williams (2007), respectively. The limited datasuggested heat drying and anaerobic digestion were less effective at reducing the concentration ofBEHP in feed sludge than was composting.
Table 4. Removal of the Plasticizer BEHP in Biosolids Treatment Processes
Treatment Process Removal Efficiency (%)composting 64% 70%heat dry 23%anaerobic digestion 32%Reference Gibson et al. (2007) Williams (2007)
3.1.3 Bisphenol A
Bisphenol A (BPA) is mostly used to manufacture polycarbonate plastics and epoxy resins. Usesof the compound are for food and beverage storage, and in sealants in canned food products.Entry to the wastewater system is possible through food preparation and clean-up, and throughhuman excretion after oral intake. The primary concerns with BPA related to food and drinkpackaging relate to possible harmful effects on the brain, behaviour and prostate gland offoetuses, infants and children (U.S. NIH, 2009).
Bisphenol A has received considerable attention in wastewater sludges and biosolids. Lee andPeart (2002) included BPA as a target analyte in a survey of Canadian raw and digested sludges.The data are summarized in Table 5. The highest concentration of BPA in that survey (39,800ng/g TS) was observed in raw sludge from the Toronto Highland Creek Wastewater TreatmentPlant, whereas the minimum concentration was noted in a digested sludge sample from the NorthToronto sewage treatment facility. Other high concentrations of BPA were observed on thedigested sludges of highly urbanized centres such as Windsor (ON), Galt (ON), Hamilton (ON)and Edmonton (AB). Median concentrations of BPA in the raw and digested sludge samples were280 and 555 ng/g TS, leading to the conclusion that BPA is not removed during sludge anaerobicdigestion.
Concentrations of BPA in other sludge samples are summarized in Table 6. The range ofconcentrations in this table from minimum to maximum is very broad, as indicated by the rangesupplied by Harrison et al. (2006). The observed minimum value of 0.1 ng/g TS recorded byHarrison et al. (2006) is lower than the values of 3 – 4 ng/g TS reported by Tan et al. (2007) forreturn activated sludges. The high value of 32,100,000 ng/g TS from Harrison et al. (2006) is

CCME Final ReportESOCs in Biosolids: Concentrations and Effects of Treatment Processes Literature Review
Hydromantis, Inc., University of Waterloo and Trent University 10
several orders of magnitude higher than maximum values found in the other literature cited inTable 5.
Table 5. Concentrations of Bisphenol A in Canadian Sludges (Lee and Peart, 2002)
Municipal Treatment Plant and Sludge Type Bisphenol A (BPA)concentration (ng/g TS)
Edmonton (Goldbar) Raw 310Regina Raw 280Adelaide Raw 250Burlington Raw 190Ottawa Raw 450Toronto (Ashbridges Bay) Raw 180Toronto (Highland Creek) Raw 39,800Toronto (Humber) Raw 1,710Toronto (North) Raw 320Montreal (MUC-PSI) Raw 1,060Quebec City Raw 160Quebec City Raw 130
Vancouver Digested 300Vancouver Digested 440Calgary (Bonnybrook) Digested 800Calgary (Fish Creek) Digested 790Edmonton (Goldbar) Digested 3,180Regina Digested 490Saskatoon Digested 260Saskatoon Digested 1,170Burlington Digested 1,860Galt Digested 9,560Guelph Digested 460Hamilton Digested 4,440Ingersoll Digested 470Kitchener Digested 230Ottawa Digested 640Waterloo Digested 2,540Windsor Digested 11,100Toronto (Ashbridges Bay) Digested 620Toronto (Humber) Digested 280Toronto (North) Digested 100Granby Digested 240Moncton Digested 130Truro Digested 300
Median raw 280Median digested 555

CCME Final ReportESOCs in Biosolids: Concentrations and Effects of Treatment Processes Literature Review
Hydromantis, Inc., University of Waterloo and Trent University 11
Table 6. Concentrations of Bisphenol A in Other Sludges and Biosolids
Sludge Source Sludge TypeConcentration
(ng/g TS)Reference
raw sludge 70 – 11,000 (680)a
Toronto sewage sludge digested sludge 120 – 13,000 (1090)Webber andSidwha (2005)
(Literature review) not specified 0.10 – 32,100,000Harrison et al.(2006)
Greek sludgedewatered secondary oranaerobic digested sludge 560 – 1,750 (530)
Stasinakis et al.(2008)
Plant A 3.8±4.3b
Return activated sludgePlant B 3.1±1.2
Tan et al. (2007)
Various Not specified 4 – 1,363 Williams (2007)
Plant G Waste activated sludge 1,620c
Plant H Dewatered 1,090c
Kinney et al.(2006)
a range (median); n=16 (raw sludge); n=18 (digested sludge) b mean standard deviationc ng/g organic carbon
Biosolids Treatment ProcessesOnly limited data were identified which characterised the concentrations of BPA resulting frombiosolids treatment processes. BPA concentrations in several treatment processes documented byKinney et al. (2006) are summarised in Table 7. Of the various treatment processes, theconcentration of BPA was lowest in the heat dried biosolids and highest in the anaerobicallydigested sludge. Additional data are needed to determine if these trends can be extrapolated on amore universal basis.
Table 7. Concentrations of Bisphenol A following Biosolids Treatment Processes (Kinney etal., 2006)
Biosolids TreatmentConcentration
(ng/g OC)heat drying 1,680composting 4,690 – 9,030other drying 3,550Anaerobic digestion 14,400
3.1.4 Perfluorinated Organic Acid and Derivative Compounds
Perfluorinated organic compounds and derivative products have been used as stain repellents forfabrics, non-stick cookware and food wrappers, personal care products and fire-fighting foams.The major producer of the compounds in North America, the 3M Company, voluntarily phasedout production in the year 2000. These compounds are highly persistent (Sinclair and Kannan,2006) and bioaccumulative (Swackhamer et al., 2004). Environment Canada has determined thathuman exposure to perfluorinated substances is below levels that would cause adverse healtheffects. Environment Canada has determined however, that accumulation of compounds such asperfluorooctane sulphonate (PFOS) and perfluorooctanoic acid (PFOA) may have adverse effectsin species at risk, such as polar bears and birds. (Health Canada, 2009a,b). In addition PFOA has

CCME Final ReportESOCs in Biosolids: Concentrations and Effects of Treatment Processes Literature Review
Hydromantis, Inc., University of Waterloo and Trent University 12
been implicated as a carcinogen to rats, to adversely affect the immune system in mice and tocause adverse reproductive and developmental toxicity in rodents (Health Canada, 2009b). Theprobable source of the compounds in domestic wastewater is through routine household activitiessuch as bathing, cooking dishwashing and laundry.
Concentrations of the perfluorinated compounds in various sludges and biosolids are provided inTable 8. There are many compounds in this class as is evident from the table. In many othersludges, the predominant compounds are the perfluorooctanoic acid (PFOA) and perfluorooctanesulfonate (PFOS). The maximum concentration of PFOA found in this review was 241 ng/g TSfound in a sample of a sludge from New York state (Sinclair and Kannan, 2006) and themaximum for PFOS was 160 ng/g TS in a sample of Oregon sludge (Schultz et al., 2006).Concentrations of perfluorodecanoic acid (PFDA) and perfluoroundecanoic acid (PFUnDA) werefound at higher mean concentrations of 52 and 60 ng/g TS, respectively in sludge from Plant A inNYS in the testing by Sinclair and Kannan (2006), although in most other studies thesecompounds had much lower concentrations. In the only study in this review withperfluorodecane sulfonate (PFDS) as a target compound, Schultz et al. (2006) observedconcentrations of a similar magnitude as those for PFOS. Perfluorohexane sulfonate (PFHxS)and perfluorododecanoic acid (PFDoDA) were found in relatively low concentrations comparedto the predominant compounds identified above.
Several other perfluorinated organic compounds were identified by Schultz et al. (2006) in thestudy of sludges from an Oregon treatment plant. Data for most of these compounds areprovided in Table 9. The magnitude of these compounds, with the exception of theperfluotetradecanoic acid (PFTA), is at least as great as for the more commonly analyzed PFOAand PFOS compounds. The presence of the compounds 2-(N-methylperfluorooctanesulfonamido)acetate (N-MeFOSAA) and 2-(N-ethylperfluorooctanesulfonamido)acetate (N-EtFOSAA) are thought to occur as metabolites ofparent sulfonamido alcohols during aerobic secondary treatment with adsorption on the settledmixed liquor (Schultz et al., 2006). These data indicate that more compounds can be detected insludge samples when the target analyte list is expanded.
No removal efficiency data in biosolids treatment processes were found for these chemicals. Thedata presented by Schultz et al. (2006) indicate that biotransformation of these compounds andprecursor compounds can occur in both aerobic and anaerobic environments, complicating effortsto quantify “removals” through the treatment processes.

CCME Final ReportESOCs in Biosolids: Concentrations and Effects of Treatment Processes Literature Review
Hydromantis, Inc., University of Waterloo and Trent University 13
Table 8. Concentrations of More Common Perfluorinated Organic Acids and Derivatives in Sludges and Biosolids
Concentration (ng/g TS)
CompoundPerfluoro-octanoicacid(PFOA)
Perfluoro-octanesulfonate(PFOS)
Perfluoro-octanesulfonamide(PFOSA)
Perfluoro-hexanesulfonate(PFHxS)
Perfluoro-nonanoicacid(PFNA)
Perfluoro-decanoicacid(PFDA)
Perfluoro-decanesulfonate(PFDS)
Perfluoroundecanoicacid(PFUnDA)
Perfluoro-dodecanoicacid(PFDoDA)
Reference
Sewage sludge- Denmark
0.7-19.7(4)
a4.8-74.1(18.4) 0.5-3.6 (0.8)
0.4-10.7(3.6)
0.4-8.0(1.5)
1.2-32.0(7.2)
0.5-4.4(1.2)
Bossi literaturereview
0.3-0.7(0.5) 0.3-1.0 (0.6)
0.09-0.01(0.01)
<0.6-0.2(0.1)
Bossi et al.,(2008)
Plant A:dewatered cake 39 154 24 <2.5 <13 47 6.9 12Plant A: solardried sludge 8.3-219 8.2-110 <2.5-21 <2.5 <2.5-4.4 2.5-34 <2.5-7.7 <2.5-28Plant B:dewatered cake 15 20 <2.5 <2.5 <2.5-11 19-41 <2.5 <2.5-10
Plant B: Ash 7.0 - 35 <2.5 - 50 <2.5 - 7.0 <2.5 <2.5 7.0 - 35 <2.5 <2.5
Loganathanet al.,(2007)
NYS Plant A69 - 241(144) 26 - 65 (37)
<10 - 18(<10)
25 - 91(52)
35 - 115(60)
NYS Plant B18 - 89(80)
<1-0 - 34(25) <10
<25 - 39(27) <25
Sinclair andKannan(2006)
Primary Sludge<6 - 12(7.1) 18 - 3.8 (53)
nd - 12(3.4)
nd - 10(4.2)
1.6 - 3.9(2.8)
14 - 2.9(19.4)
2.0 - 4.2(2.6)
1.3 - 1.6(1.5)
Return Activ.Sludge
<6 - 8.2(6.7) 31 - 55 (43) nd
3.1 - 4.9(3.8
7.2 - 0.8(9.1)
94 - 140(130)
7.7 - 0.5(9.2)
6.1 - 7.8(7.1)
ThickenedSludge <6 20 - 18 (42) nd nd
3.4 - 5.3(3.9)
57 - 71(62)
3.9 - 5.0(4.4)
4.1 - 5.1(4.3)
AnaerobicDigestedSludge <3
81 - 160(100) nd
9.2 - 0.3(9.9)
5.4 - 6.4(5.9)
90 - 93(91)
5.9 - 8.4(6.8)
3.6 - 4.2(3.8)
Schultz etal., (2006)
nd = not detected a range (mean)

CCME Final ReportESOCs in Biosolids: Concentrations and Effects of Treatment Processes Literature Review
Hydromantis, Inc., University of Waterloo and Trent University 14
Table 9. Concentrations of Additional Perfluorinated Organic Acids and Derivatives inSludges and Biosolids (Schultz et al., 2006)
Concentration (ng/g TS)Sludge Type
PFOSAA N-MePFOSAA N-EtPFOSAA PFTAPrimary Sludge <3 - 3.4 (<3)a 5.2 - 8.9 (6.3) 15 - 5.8 (20) ndReturn Activated Sludge 14 - 23 (19) 99-61 (140) 90 -140 (120) <3
Thickened Sludge 6.2 - 7.6 (6.9) 35 - 52 (41) 43 - 52 (48)0.9 - 1.3
(1.2)Anaerobic DigestedSludge 9.4 - 12.4 (11)
130 - 140(130) 91 - 100 (98) <3
PFOSSA = perfluorooctanesulfonamidoacetateN-MePFOSAA = 2-(N-methylperfluorooctanesulfonamido)acetateN-EtPFOSAA = 2-(N-ethylperfluorooctanesulfonamido)acetatePFTA = perfluotetradecanoic acida range (mean)
3.1.5 Surfactants
Linear alkylbenzene sulphonates are a class of surfactants widely used in commercial products,but especially in detergent formulations. In wastewater treatment, because of relatively highsolid:liquid partition coefficients, these surfactants tend to sorb onto wastewater solids and thusconcentrate in the residual solids. There are two main concerns related to these compounds inbiosolids destined for land application. The first issue is the potential adverse effects on soilbiota, with reported effective concentrations of 1,143 to 1437 µg/g DM in soil, causing anadverse effect to 50% of several microbial species (Jacobsen et al., 2004). The second concern isthat the surfactants can increase the mobilization of other hydrophobic contaminants in the soil,resulting in higher concentrations of the contaminants in leachate and drainage water (Jacobsen etal., 2004).
Because of the significant body of data on alkylphenols and their ethoxylates, a separate sectionhas been devoted to those compounds. Otherwise, data identified in the more recent literatureexamine the linear alkylbenzene sulphonates (LAS). Concentration data for this class ofsurfactants is presented in Table 10. Relative to the other ESOCs discussed in this review, LASare present at very high concentrations. Note that concentration units are expressed as µg/g TS(equivalent to parts per million), rather than the more usual concentration units of ng/g TS(equivalent to parts per billion) for ESOCs. In the review by Jaganyi (2007), aerobically digestedsludge from Germany and untreated sludges from Spain had lower concentrations of LAS thandid anaerobically digested sludges from the same and other countries. Similarly, in the review byAngelidaki et al. (2004), the concentrations range of LAS in aerobically digested sludges wasmuch lower than the range in anerobically digested sludges.
Other data presented by Cavalli (2004) indicated that LAS was much less likely to bebiodegraded in an anaerobic sludge environment than in aerobic sludge. Use of the OECDbiodegradability screening test indicated that LAS was not biodegradable in anaerobic tests after28 days. Further inhibition concentrations of LAS in anaerobic sludge digestion were identifiedin Cavalli (2004) as 25 mg/L, corresponding to 17 μg/g TS on a dry weight basis. In
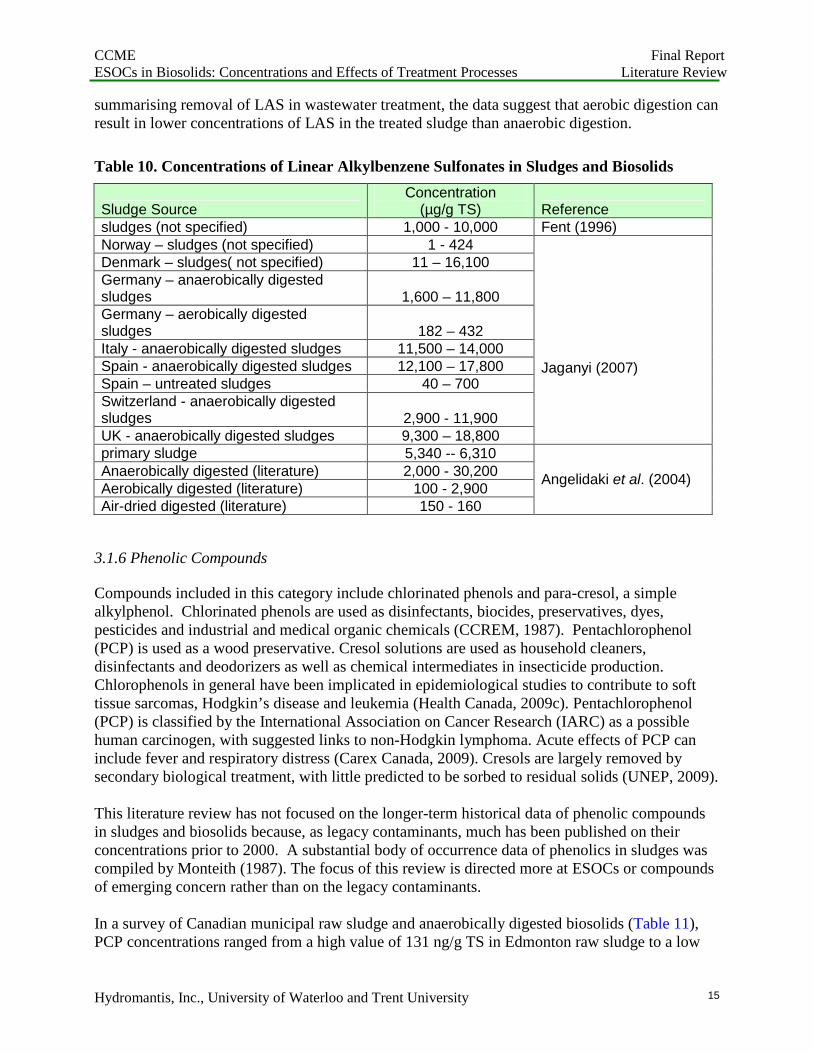
CCME Final ReportESOCs in Biosolids: Concentrations and Effects of Treatment Processes Literature Review
Hydromantis, Inc., University of Waterloo and Trent University 15
summarising removal of LAS in wastewater treatment, the data suggest that aerobic digestion canresult in lower concentrations of LAS in the treated sludge than anaerobic digestion.
Table 10. Concentrations of Linear Alkylbenzene Sulfonates in Sludges and Biosolids
Sludge SourceConcentration
(µg/g TS) Referencesludges (not specified) 1,000 - 10,000 Fent (1996)Norway – sludges (not specified) 1 - 424Denmark – sludges( not specified) 11 – 16,100Germany – anaerobically digestedsludges 1,600 – 11,800Germany – aerobically digestedsludges 182 – 432Italy - anaerobically digested sludges 11,500 – 14,000Spain - anaerobically digested sludges 12,100 – 17,800Spain – untreated sludges 40 – 700Switzerland - anaerobically digestedsludges 2,900 - 11,900UK - anaerobically digested sludges 9,300 – 18,800
Jaganyi (2007)
primary sludge 5,340 -- 6,310Anaerobically digested (literature) 2,000 - 30,200Aerobically digested (literature) 100 - 2,900Air-dried digested (literature) 150 - 160
Angelidaki et al. (2004)
3.1.6 Phenolic Compounds
Compounds included in this category include chlorinated phenols and para-cresol, a simplealkylphenol. Chlorinated phenols are used as disinfectants, biocides, preservatives, dyes,pesticides and industrial and medical organic chemicals (CCREM, 1987). Pentachlorophenol(PCP) is used as a wood preservative. Cresol solutions are used as household cleaners,disinfectants and deodorizers as well as chemical intermediates in insecticide production.Chlorophenols in general have been implicated in epidemiological studies to contribute to softtissue sarcomas, Hodgkin’s disease and leukemia (Health Canada, 2009c). Pentachlorophenol(PCP) is classified by the International Association on Cancer Research (IARC) as a possiblehuman carcinogen, with suggested links to non-Hodgkin lymphoma. Acute effects of PCP caninclude fever and respiratory distress (Carex Canada, 2009). Cresols are largely removed bysecondary biological treatment, with little predicted to be sorbed to residual solids (UNEP, 2009).
This literature review has not focused on the longer-term historical data of phenolic compoundsin sludges and biosolids because, as legacy contaminants, much has been published on theirconcentrations prior to 2000. A substantial body of occurrence data of phenolics in sludges wascompiled by Monteith (1987). The focus of this review is directed more at ESOCs or compoundsof emerging concern rather than on the legacy contaminants.
In a survey of Canadian municipal raw sludge and anaerobically digested biosolids (Table 11),PCP concentrations ranged from a high value of 131 ng/g TS in Edmonton raw sludge to a low
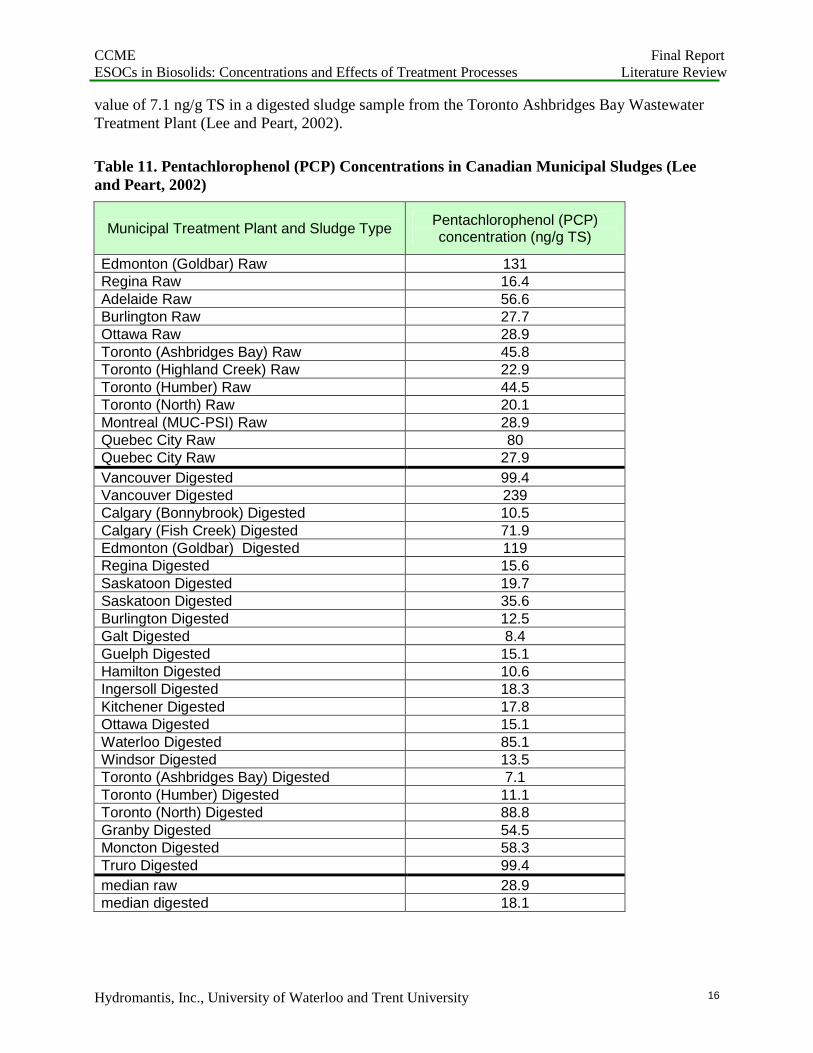
CCME Final ReportESOCs in Biosolids: Concentrations and Effects of Treatment Processes Literature Review
Hydromantis, Inc., University of Waterloo and Trent University 16
value of 7.1 ng/g TS in a digested sludge sample from the Toronto Ashbridges Bay WastewaterTreatment Plant (Lee and Peart, 2002).
Table 11. Pentachlorophenol (PCP) Concentrations in Canadian Municipal Sludges (Leeand Peart, 2002)
Municipal Treatment Plant and Sludge TypePentachlorophenol (PCP)concentration (ng/g TS)
Edmonton (Goldbar) Raw 131Regina Raw 16.4Adelaide Raw 56.6Burlington Raw 27.7Ottawa Raw 28.9Toronto (Ashbridges Bay) Raw 45.8Toronto (Highland Creek) Raw 22.9Toronto (Humber) Raw 44.5Toronto (North) Raw 20.1Montreal (MUC-PSI) Raw 28.9Quebec City Raw 80Quebec City Raw 27.9
Vancouver Digested 99.4Vancouver Digested 239Calgary (Bonnybrook) Digested 10.5Calgary (Fish Creek) Digested 71.9Edmonton (Goldbar) Digested 119Regina Digested 15.6Saskatoon Digested 19.7Saskatoon Digested 35.6Burlington Digested 12.5Galt Digested 8.4Guelph Digested 15.1Hamilton Digested 10.6Ingersoll Digested 18.3Kitchener Digested 17.8Ottawa Digested 15.1Waterloo Digested 85.1Windsor Digested 13.5Toronto (Ashbridges Bay) Digested 7.1Toronto (Humber) Digested 11.1Toronto (North) Digested 88.8Granby Digested 54.5Moncton Digested 58.3Truro Digested 99.4
median raw 28.9median digested 18.1
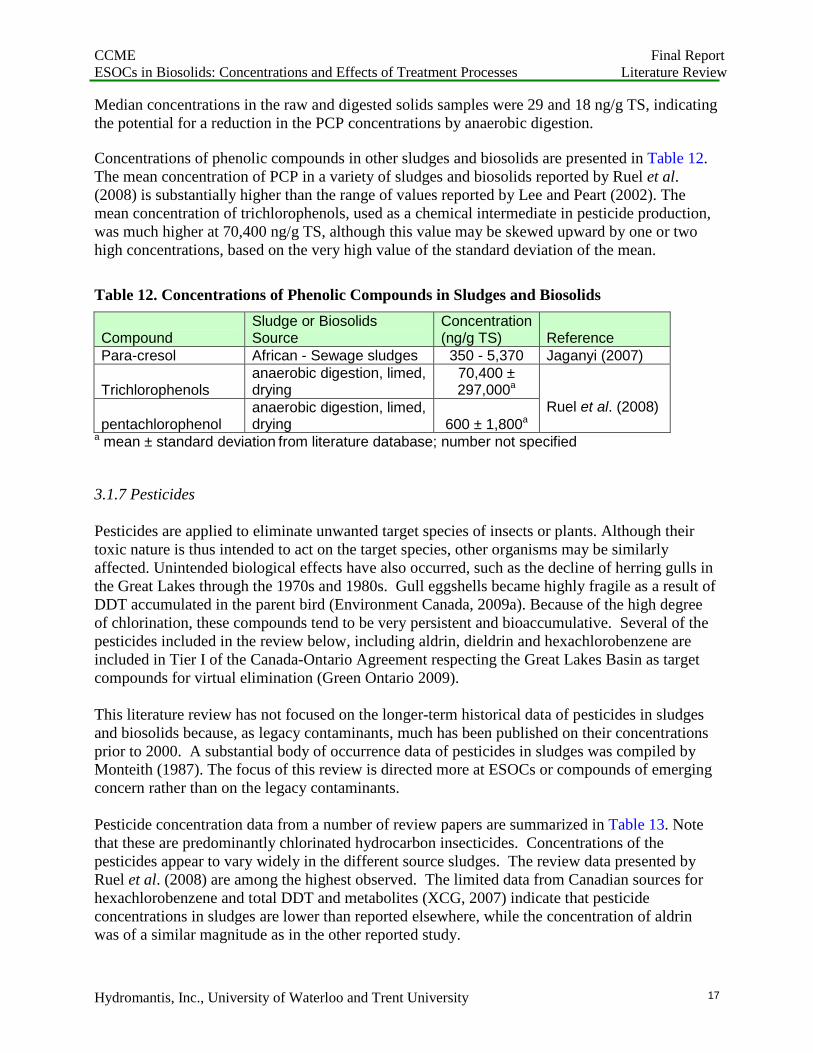
CCME Final ReportESOCs in Biosolids: Concentrations and Effects of Treatment Processes Literature Review
Hydromantis, Inc., University of Waterloo and Trent University 17
Median concentrations in the raw and digested solids samples were 29 and 18 ng/g TS, indicatingthe potential for a reduction in the PCP concentrations by anaerobic digestion.
Concentrations of phenolic compounds in other sludges and biosolids are presented in Table 12.The mean concentration of PCP in a variety of sludges and biosolids reported by Ruel et al.(2008) is substantially higher than the range of values reported by Lee and Peart (2002). Themean concentration of trichlorophenols, used as a chemical intermediate in pesticide production,was much higher at 70,400 ng/g TS, although this value may be skewed upward by one or twohigh concentrations, based on the very high value of the standard deviation of the mean.
Table 12. Concentrations of Phenolic Compounds in Sludges and Biosolids
CompoundSludge or BiosolidsSource
Concentration(ng/g TS) Reference
Para-cresol African - Sewage sludges 350 - 5,370 Jaganyi (2007)
Trichlorophenolsanaerobic digestion, limed,drying
70,400 ±297,000a
pentachlorophenolanaerobic digestion, limed,drying 600 ± 1,800a
Ruel et al. (2008)
a mean ± standard deviation from literature database; number not specified
3.1.7 Pesticides
Pesticides are applied to eliminate unwanted target species of insects or plants. Although theirtoxic nature is thus intended to act on the target species, other organisms may be similarlyaffected. Unintended biological effects have also occurred, such as the decline of herring gulls inthe Great Lakes through the 1970s and 1980s. Gull eggshells became highly fragile as a result ofDDT accumulated in the parent bird (Environment Canada, 2009a). Because of the high degreeof chlorination, these compounds tend to be very persistent and bioaccumulative. Several of thepesticides included in the review below, including aldrin, dieldrin and hexachlorobenzene areincluded in Tier I of the Canada-Ontario Agreement respecting the Great Lakes Basin as targetcompounds for virtual elimination (Green Ontario 2009).
This literature review has not focused on the longer-term historical data of pesticides in sludgesand biosolids because, as legacy contaminants, much has been published on their concentrationsprior to 2000. A substantial body of occurrence data of pesticides in sludges was compiled byMonteith (1987). The focus of this review is directed more at ESOCs or compounds of emergingconcern rather than on the legacy contaminants.
Pesticide concentration data from a number of review papers are summarized in Table 13. Notethat these are predominantly chlorinated hydrocarbon insecticides. Concentrations of thepesticides appear to vary widely in the different source sludges. The review data presented byRuel et al. (2008) are among the highest observed. The limited data from Canadian sources forhexachlorobenzene and total DDT and metabolites (XCG, 2007) indicate that pesticideconcentrations in sludges are lower than reported elsewhere, while the concentration of aldrinwas of a similar magnitude as in the other reported study.

CCME Final ReportESOCs in Biosolids: Concentrations and Effects of Treatment Processes Literature Review
Hydromantis, Inc., University of Waterloo and Trent University 18
Table 13. Concentrations of Pesticide Compounds in Sludges and Biosolids
Concentration (ng/g TS)
Compound
34Canadianstabilizedsludges(1987)
Canadiansludge(1995-1998)
anaerobicdigestion,limed, drying
Swisssludges UK sludges
Frenchsludges
Aldrin 300 4100 ± 7000a10 - 200
(30)b
Chlorpyrifos 500c
Dieldrin26,300 ±30,000a
100 -2,000
10 - 5,300(500)
Diuron11.2 -46.6
Total pp’-DDT& op’-DDT &pp'-DDE 17 100 - 500Endosulfan 300c
Endrin 500 ± 500a10 - 700
(100)Heptachlor 4,900 ± 3,300a
Hexachloro-benzene 10 5.4 1,200 ± 1,500a
Hexachloro-cyclohexane;Lindane; γ-HCH
12,300 ±22,000a 100 - 900
10 - 70,000(400)
ReferenceXCG (2007) Ruel et al.
(2008)Fent(1996)
Rogers(1996)
Ghanemet al.(2007)
a mean ± standard deviation from literature database; number not specified b range (mean)c no standard deviation calculated due to analytical difficulties
3.1.8 Solvents
As with the pesticide group, many solvents were included in the original U.S. EPA PriorityPollutant list of the 1980s and have received significant attention previously. Because the focusof this review is directed more at ESOCs or compounds of emerging concern in sludges andbiosolids than on the legacy contaminants, the review is limited in scope.
Concentration data for some common industrial solvents in sludge and biosolids are presented inTable 14. Concentrations of solvents reported in Canadian sludges (XCG, 2007) are less than 500ng/g TS. Concentrations reported in different treated biosolids by Ruel et al. (2008) were presentat substantially higher concentrations than those reported by XCG (2007).

CCME Final ReportESOCs in Biosolids: Concentrations and Effects of Treatment Processes Literature Review
Hydromantis, Inc., University of Waterloo and Trent University 19
Table 14. Concentrations of Solvents in Sludges and Biosolids
Concentration (ng/g TS)
Compound Canadian sludges(1995-1998)
34 Canadianstabilisedsludges(1987)
anaerobicdigestion, limed,drying
Benzene 0.04 - 483 (45)a 1,0001-2-Dichloroethane ndDichloromethane 5 - 19 (8)Carbon tetrachloride ndTrichloroethylene 0.3 - 380 (167)1,1,1- Trichloroethane nd 200Tetrachloroethylene nd - 231 (59) 300 8,100Reference XCG (2007) Ruel et al., (2008)
nd = not detected a range (mean)
3.1.9 Miscellaneous Compounds
Few compounds are included in this group. The substance 4-chloroaniline (PCA) is used as achemical intermediate in the production of a number of products, including agriculturalchemicals, azo dyes and pigments, and pharmaceutical and personal care products. In aerobicaquatic environments, PCA is determined to be inherently biodegradable, but exhibits noappreciable biodegradation under anaerobic conditions. It has a relatively low affinity forsorbing to soils, and so leaching of PCA from biosolids to groundwater may occur, especially insoils of low organic matter content and elevated pH. Bioaccumulation in aquatic organisms isconsidered unlikely (WHO, 2003). Health effects in exposed occupational workers includedevelopment of methemoglobinemia and anemia. Other effects include damage to kidneys andliver (WHO, 2003).
In the U.S. EPA’s TNSSS, 4-chloroaniline was found at a median concentration of 513 ng/g TS(U.S. EPA, 2009).
3.1.10 Section Summary
The compounds included in this review are diverse in their chemical properties and uses. Theoccurrence data are found more readily than are removal efficiency data. The main summarypoints follow.
1. The plasticizer BEHP has been characterized more frequently than have other phthalateesters or similar compounds. Limited data suggest it can be removed by some biosolidstreatment processes, including anaerobic digestion.
2. The plastic-associated chemical BPA is detected in most raw and digested sludges.Limited data reviewed indicate it is relatively unchanged by most biosolids treatmentprocesses, based on a comparison with concentrations in other sludges.
3. Although the perfluorinated organic compound perfluorooctanoic acid (PFOA) andperfluorooctanesulfonate (PFOS) are found in the highest concentrations of those reported

CCME Final ReportESOCs in Biosolids: Concentrations and Effects of Treatment Processes Literature Review
Hydromantis, Inc., University of Waterloo and Trent University 20
most frequently, other less well recognized compounds may well be present at highconcentrations as well. Biotransformation in both aerobic and anaerobic environmentsmay play a role in the presence of the compounds such as 2-(N-methylperfluorooctanesulfonamido)acetate and 2-(N-ethylperfluorooctanesulfonamido)acetate.
4. Relative to the other ESOCs discussed in this review, linear alkylbenzene sulfonates arepresent at very high concentrations. The data reviewed indicate that aerobic digestion canresult in lower concentrations of LAS in the treated biosolids than can anaerobicdigestion.
5. The most commonly reported phenolic compound was pentachlorophenol. Data reviewedindicated that PCP concentrations in sludge can be reduced during anaerobic digestion.
6. Very high pesticide residues were reported in a variety of sludge types by Ruel et al.(2008), demonstrating the persistence of these compounds. A comprehensive comparisonof pesticide concentrations in sludges from other countries is lacking.
7. Solvent data were limited but were generally identified at low concentrations in sludgesamples.
8. In general, there was almost a complete lack of removal efficiency data by differentbiosolids treatment processes for the industrial chemicals.
3.2 ALKYLPHENOL AND THEIR ETHOXYLATES
3.2.1 Introduction
Alkylphenol ethoxylates (APEs) are among the most commonly used surfactants (surface activeagents) around the world. Nonylphenol ethoxylates account for approximately 80% of the totaluse, while octylphenol ethoxylates represent most of the remaining 20% (Melcer et al., 2007).Thepredominant uses of APEs are in pulp and paper production, textile manufacturing and in theproduction of crop protection chemicals (Melcer et al., 2007).
Under the appropriate conditions, APEs are biologically transformed to the AP intermediate,which has been implicated in aquatic toxicity responses in fish, mammals, invertebrates andalgae, although it was not found to be bioaccumulative (Environment Canada, 2009b). The APshave also been implicated as weakly estrogenic compounds, in particular capable of inducingfeminization of male fish.
APEs enter municipal wastewater treatment facilities in industrial wastewater discharges tomunicipal sewers, as well as being present in domestic sewage. During biological (secondary ortertiary) wastewater treatment, alkylphenols (APs) with longer polyethoxylate chains arebiotransformed to mostly mono- or di-ethoxylated APs, or to the parent AP itself (Melcer et al.2007). Biological treatment also results in formation of carboxylated forms of the APEs, whichare more soluble than the mono- or di-ethoxylated APs. As the polyethoxylate chain decreases,the compound becomes more hydrophobic (less water soluble), causing the compound to adsorbonto wastewater and sludge particles (Melcer et al. 2007). As a result, wastewater sludge streamstend to concentrate the metabolites AP and mono- or di-ethoxylated APs.

CCME Final ReportESOCs in Biosolids: Concentrations and Effects of Treatment Processes Literature Review
Hydromantis, Inc., University of Waterloo and Trent University 21
3.2.2 Occurrence Data
Raw and anaerobically digested municipal sludges from Canadian municipalities were surveyedfor alkylphenols (AP) and their ethoxylates by Lee and Peart (2002). The results are provided inTable 15. Concentrations of the alkylphenols and their ethoxylates are observed at higherconcentrations than many of the other ESOCs. Concentration units reported for these compoundsare in the g/g TS range, rather than in the ng/g TS range. In raw sludges, concentrations of 4-nonylphenol (NP) tended to dominate, but in a number of samples, the mono-ethoxylated NP anddi-ethoxylated NP were of similar or greater magnitude (e.g., London Adelaide, Quebec City,Montreal). After anaerobic digestion, the concentration of 4-NP was substantially increasedcompared to levels in corresponding raw sludges. The median value of 4-NP in digested sludgesamples was 413 g/g TS, compared to a median concentration of 91 g/g TS in the raw sludgesamples. Concentrations of the di-ethoxylated NP and higher congeners were lower in digestedsludges than in the raw sludges, suggesting transformation of the higher-ethoxylated species tothe parent 4-NP and the mono-ethoxylated NP. Another AP compound, 4-tert-octyl phenol wasreported in the study. The median concentration of 10.4 g/g TS in the digested sludge washigher than the median value of 4.75 g/g in the raw sludge.
Concentrations of APs and their ethoxylates in Toronto sludges reported by Webber and Sidwha(2005) are presented in Table 16. Concentrations of 4-NP were higher in digested sludges than inthe raw sludge samples. Data from another Canadian survey (XCG Consultants, 2007) reportedthat 4-NP in mixed raw and digested sludges was the predominant form, approximately an orderof magnitude higher than the mono-ethoxylated form of higher ethoxylated species (Table 16).

CCME Final ReportESOCs in Biosolids: Concentrations and Effects of Treatment Processes Literature Review
Hydromantis, Inc., University of Waterloo and Trent University 22
Table 15. Concentrations (g/g TS) of Alkylphenol (AP) and Ethoxylates (EO) in CanadianMunicipal Sludges and Biosolids (Lee and Peart, 2002)
Municipal Treatment Plantand Sludge Type
4-nonylphenol(NP)
NPmono-EO(NP1EO)
NPdi-EO(NP2EO)
NPtri-EO(NP3EO)
HigherNP-EOsNP(4-17)EO
4-tert-octylphenol
Edmonton (Goldbar) Raw 237 107 22 5.3 28.4 6.9Regina Raw 97.7 26.9 11.8 20.1 194 4Adelaide Raw 20.1 60.9 60.2 23.3 10.6 2.9Burlington Raw 90.3 98.7 38.5 9.6 44.7 8Ottawa Raw 53.6 13.9 10.6 8.1 43.5 4.3Toronto (Ashbridges Bay)Raw 126 129 73.7 11.9 3.5 8.6Toronto (Highland Creek)Raw 112 94.9 40.5 13.8 15.7 13.6Toronto (Humber) Raw 125 62.9 91.7 28.9 13 5.2Toronto (North) Raw 92.7 69.4 34.6 <2 <2 5.4Montreal (MUC-PSI) Raw 11.3 27.9 35.7 43.1 467 2.6Quebec City Raw 12.4 24.6 19.8 15.1 141 2.9Quebec City Raw 33.1 20.5 24.1 12.4 145 3.3
Vancouver Digested 457 124 26.6 17.7 47.6 10.7Vancouver Digested 468 74.1 31.6 7.7 4.5 10.4Calgary (Bonnybrook)Digested 413 154 33.1 <2 8.1 6.2Calgary (Fish Creek)Digested 393 154 20.5 16.5 5.1 6Edmonton (Goldbar)Digested 848 160 36.8 6 11.1 11.3Regina Digested 568 228 1.8 1.9 11.5 10.8Saskatoon Digested 26.5 39.3 39.3 6.8 2.1 1.9Saskatoon Digested 139 97.2 24.8 4.5 <2 3.8Burlington Digested 435 66 3.2 <2 17.7 13.1Galt Digested 1210 126 24.1 12.4 23 20.5Guelph Digested 1230 130 36.4 8.4 120 43.9Hamilton Digested 403 114 26.4 6.9 5.5 15.6Ingersoll Digested 232 32 6.7 3.9 67 8.5Kitchener Digested 617 19.8 3 <2 <2 11.6Ottawa Digested 298 83.7 11 2 <2 7.2Waterloo Digested 518 146 38 4.1 5.9 8.2Windsor Digested 203 307 127 34.7 139 13Toronto (Ashbridges Bay)Digested 450 36.8 4.7 1.5 <2 12.8Toronto (Humber) Digested 495 53.2 16.8 4.6 25.1 12.3Toronto (North) Digested 233 28 2.2 <2 <2 6.5Granby Digested 18.3 46.8 64.8 8.1 7.7 1.3Moncton Digested 4.6 29.8 17.8 10.9 55.7 0.8Truro Digested 18.3 30.4 68 15.8 9.9 2.1
Median raw 91.5 61.9 35.15 13.8 43.5 4.75Median digested 413 83.7 24.8 6.9 11.3 10.4
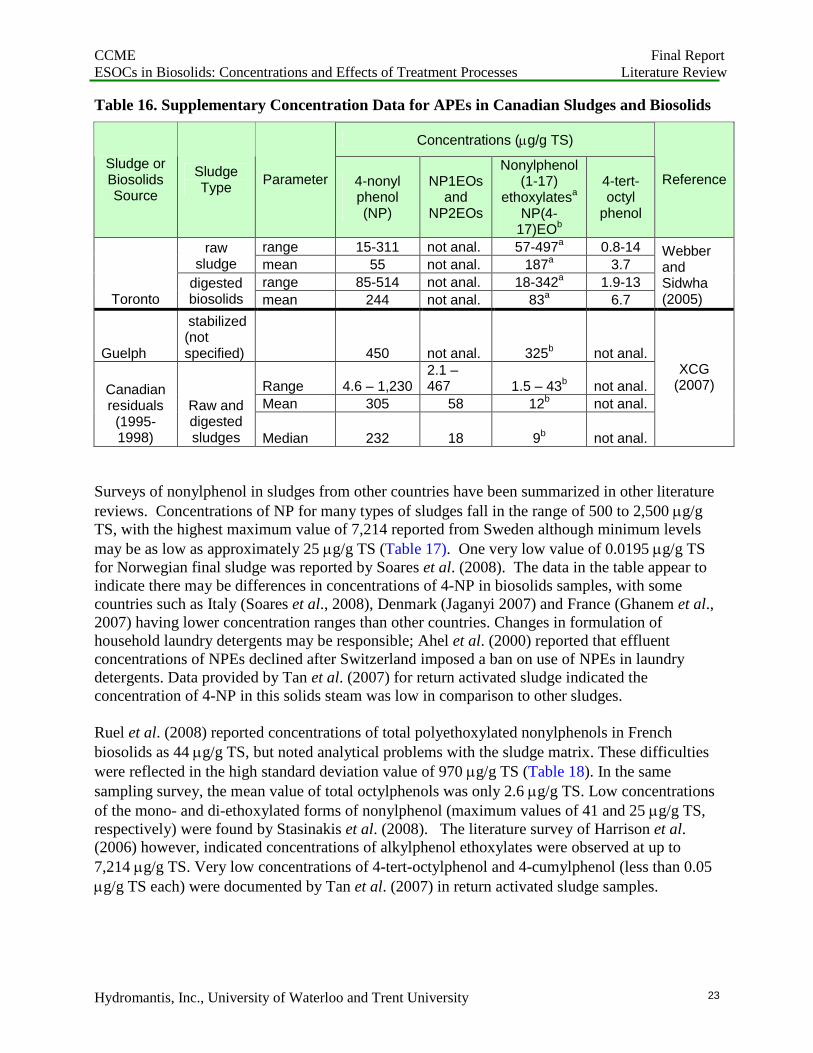
CCME Final ReportESOCs in Biosolids: Concentrations and Effects of Treatment Processes Literature Review
Hydromantis, Inc., University of Waterloo and Trent University 23
Table 16. Supplementary Concentration Data for APEs in Canadian Sludges and Biosolids
Concentrations (g/g TS)
Sludge orBiosolidsSource
SludgeType
Parameter 4-nonylphenol(NP)
NP1EOsand
NP2EOs
Nonylphenol(1-17)
ethoxylatesa
NP(4-17)EOb
4-tert-octyl
phenol
Reference
range 15-311 not anal. 57-497a 0.8-14rawsludge mean 55 not anal. 187a 3.7
range 85-514 not anal. 18-342a 1.9-13Toronto
digestedbiosolids mean 244 not anal. 83a 6.7
WebberandSidwha(2005)
Guelph
stabilized(notspecified) 450 not anal. 325b not anal.
Range 4.6 – 1,2302.1 –467 1.5 – 43b not anal.
Mean 305 58 12b not anal.Canadianresiduals
(1995-1998)
Raw anddigestedsludges Median 232 18 9b not anal.
XCG(2007)
Surveys of nonylphenol in sludges from other countries have been summarized in other literaturereviews. Concentrations of NP for many types of sludges fall in the range of 500 to 2,500 g/gTS, with the highest maximum value of 7,214 reported from Sweden although minimum levelsmay be as low as approximately 25 g/g TS (Table 17). One very low value of 0.0195 g/g TSfor Norwegian final sludge was reported by Soares et al. (2008). The data in the table appear toindicate there may be differences in concentrations of 4-NP in biosolids samples, with somecountries such as Italy (Soares et al., 2008), Denmark (Jaganyi 2007) and France (Ghanem et al.,2007) having lower concentration ranges than other countries. Changes in formulation ofhousehold laundry detergents may be responsible; Ahel et al. (2000) reported that effluentconcentrations of NPEs declined after Switzerland imposed a ban on use of NPEs in laundrydetergents. Data provided by Tan et al. (2007) for return activated sludge indicated theconcentration of 4-NP in this solids steam was low in comparison to other sludges.
Ruel et al. (2008) reported concentrations of total polyethoxylated nonylphenols in Frenchbiosolids as 44 g/g TS, but noted analytical problems with the sludge matrix. These difficultieswere reflected in the high standard deviation value of 970 g/g TS (Table 18). In the samesampling survey, the mean value of total octylphenols was only 2.6 g/g TS. Low concentrationsof the mono- and di-ethoxylated forms of nonylphenol (maximum values of 41 and 25 g/g TS,respectively) were found by Stasinakis et al. (2008). The literature survey of Harrison et al.(2006) however, indicated concentrations of alkylphenol ethoxylates were observed at up to7,214 g/g TS. Very low concentrations of 4-tert-octylphenol and 4-cumylphenol (less than 0.05g/g TS each) were documented by Tan et al. (2007) in return activated sludge samples.

CCME Final ReportESOCs in Biosolids: Concentrations and Effects of Treatment Processes Literature Review
Hydromantis, Inc., University of Waterloo and Trent University 24
Table 17. Concentrations of Nonylphenol in Sludges and Biosolids from Other Countries
Country Sludge Treatment4-nonylphenol(g/g TS) Reference
Anaerobic Digestion 450-2530
Aerobic Digestion 120-650Switzerland
Final sludge 540-1000
Aerobic Digestion 80-500Germany
Unidentified 128.2
Anaerobic Digestion 754
Heat treatment 496
Lime treatment 470USA
Composting 64
Raw Sludge before anaerobic digestion 242Italy
Sludge after anaerobic digestion 308
Norway Final sludge 0.0195
Soares et al. (2008)
Norway Biosolids 25-2298
Sweden Biosolids 23-7214
Denmark Biosolids 0.3-537
Africa Biosolids 0.15-2790
Jaganyi (2007)
Return Activated sludge Plant #1 0.429±0.238 a
AustraliaReturn Activated sludge Plant #2 0.0205±0.005
Tan et al. (2007)
France
Mixed sludge sources (anaerobicallydigested, composted, limed or dried) indifferent conventional secondary or tertiaryplants
132 ± 730 Ruel et al. (2008)
Aerobically digested biosolids nd-180U.S.A.
Anaerobically digested biosolids 300-1300
Xia et al. (2005)
GreeceDewatered anaerobically digested ordewatered secondary sludge
<0.04 -0.45Stasinakis et al.
(2008 )
Unknown/not specified prior to pelletization 16.5 – 125
Unknown/not specified prior to composting 75.6-173
Unknown/not specified prior to limetreatment (Plant 2)
49.6-136France
Unknown/not specified prior to limetreatment (Plant 3)
89.8-217
Ghanem et al.(2007)
U.S.A. Digested sludge (aerobic and anaerobic)13-898
Heidler and Halden(2008)
Mexico and UKAnaerobically digested sludge beforecomposting
114 Gibson et al. (2007)
nd=not detected. a mean ± standard deviation

CCME Final ReportESOCs in Biosolids: Concentrations and Effects of Treatment Processes Literature Review
Hydromantis, Inc., University of Waterloo and Trent University 25
Table 18. Concentrations of Nonylphenol Ethoxylates and Other Alkylphenol in Sludges and Biosolids
Concentration (g/g TS)
Biosolids Type
Nonylphenolmonoethoxylate(NP1EO)
Nonylphenoldiethoxylate(NP2EO)
Nonylphenol(1-17) ethoxylatesNP(1-17)EO
Alkylphenolcarboxylates
4-tert-octylphenol 4-Cumylphenol Reference
dewateredanaerobically digestedor dewateredsecondary sludge
1.01 - 41.3 <0.96 - 24.7Stasinakis et
al. (2008)
mixed sludge sources(anaerobicallydigested, composted,limed or dried) indifferent conventionalsecondary or tertiarytreatment plants
44 ± 970 a 2.6 ± 4 (asOctyl phenols)
Ruel et al.(2008)
Unknown/not specified nd–7214 10–14Harrison et al.
(2006)
Return activatedsludge Plant #1
0.035±0.0029 a 0.0015±0.0013
Return activatedsludge Plant #2
0.0056±0.0024a BDL
Tan et al.(2007)
nd=not detected; BDL=below detection limit.a mean ± standard deviation

CCME Final ReportESOCs in Biosolids: Concentrations and Effects of Treatment Processes Literature Review
Hydromantis, Inc., University of Waterloo and Trent University 26
3.2.3 Effect of Sludge Treatment Processes on Occurrence of Alkylphenols and Ethoxylates
A number of published studies have compared concentrations of the alkylphenols resulting fromdifferent types of sludge treatment processes (Table 19). The different studies reviewed herehave been grouped by the biosolids treatment process.
In Kinney et al. (2006), concentrations are expressed g/g OC, rather than the more commonunits of g/g total solids (TS). Assuming that carbon in the solids is organic carbon, and that C isapproximately 50 % of activated sludge biomass (Metcalf & Eddy, 1991), then concentrationsexpressed on an organic carbon basis would be approximately halved if expressed on a totalsolids basis. Concentrations of 4-nonylphenol are substantially higher following anaerobicdigestion than after other forms of treatment (e.g., Kinney et al., 2006). Giger et al. (1984) wereamong the early researchers to propose that the hydrophobic NP1EO and NP2EO compoundsassociated with wastewater solids were degraded biologically to NP in anaerobic digestion.Studies by Hale and LaGuardia (2002) and LaGuardia et al. (2004) indicate that composting anddrying result in lower levels of nonylphenol and ethoxylates, but that concentrations followinglime treatment may not be much different than after anaerobic digestion. Composting appearedto result in the most consistent low concentrations of the tested alkylphenols and surfactants,presumably due to a prolonged retention time for aerobic biodegradation at elevated temperaturesduring the curing period.
3.2.4 Removal Efficiencies of Biosolids Treatment Processes
Fewer studies actually reported removal efficiencies of APs and their ethoxylates. The effect ofdifferent durations of the composting period on the reduction of 4-nonylphenol has been studiedby Xia et al. (2005) and Das and Xia (2008). Their results, summarised in Table 20, indicate thata composting period of between 40 and 70 days is needed to reduce the starting level of 4-NP byover 90%. A higher proportion of wood shavings mixed with the biosolids resulted in a lowerinitial concentration of the 4-NP and a faster rate of reduction of the 4-NP.
In Table 21, Gibson et al. (2007) found that composting resulted in a higher removal efficiencyof 4-NP than did heat drying, in general agreement with most other observed data in Table 19.Conversely, Ghanem et al. (2007) noted only an 18% reduction in 4-NP with composting,compared to removal efficiency of 72% for drying by pelletization. Removals by lime treatmentwere variable.

CCME Final ReportESOCs in Biosolids: Concentrations and Effects of Treatment Processes Literature Review
Hydromantis, Inc., University of Waterloo and Trent University 27
Table 19. Concentrations of Alkylphenols and their Ethoxylates after Biosolids Treatment
Concentration (g/g TS unless otherwise specified)
Biosolids Treatment 4-nonylphenol(NP)
Nonylphenolmono-ethoxylate(NP1EO)
Nonylphenoldiethoxylate(NP2EO)
Total ofnonylphenols(NPs),NP1EOs andNP2EOs
Octylphenols(OP)
Reference
Anaerobically digested WAS 1,520 79.4 0.793 3.50 g/g OC Kinney et al. (2006)
anaerobically digested biosolids 758-981Hale and LaGuardia(2002)
Anaerobically digested biosolids-A 683 28.4 <1.5 9.9Anaerobically digested biosolids-B 720 25.7 <1.5 12.6Anaerobically digested biosolids-C 779 102 32.6 11Anaerobically digested biosolids-D 701 55.8 <1.5 11.7Anaerobically digested biosolids-E 887 64.9 22.7 6.7
LaGuardia et al.(2004)
Fresh biosolids (anaerobic) 300-1300 Xia et al. (2005)Anaerobically digested biosolidsSTP 1 (n=3)
1840 ± 61 a
Anaerobically digested biosolidsSTP 2 (n=6)
1790 ± 68
Anaerobically digested biosolidsSTP 3 (n=3)
1480 ± 38
Anaerobically digested biosolidsSTP 4 (n=6)
1240 ± 161
Anaerobically digested biosolidsSTP 5 (n=3)
1130 ± 188
Pryor et al. (2002)
anaerobically digested biosolids 900Brown et al.(in press)
composted WAS2.18-491g/g OC
3.96-17.2g/g OC
2.85-7.01g/g OC
0.90-4.21g/g OC
Kinney et al. (2006)
composted biosolids 6.1-176Hale and LaGuardia(2002)
Composted biosolids-A 5.4 0.7 <1.5 <0.5LaGuardia et al.(2004)
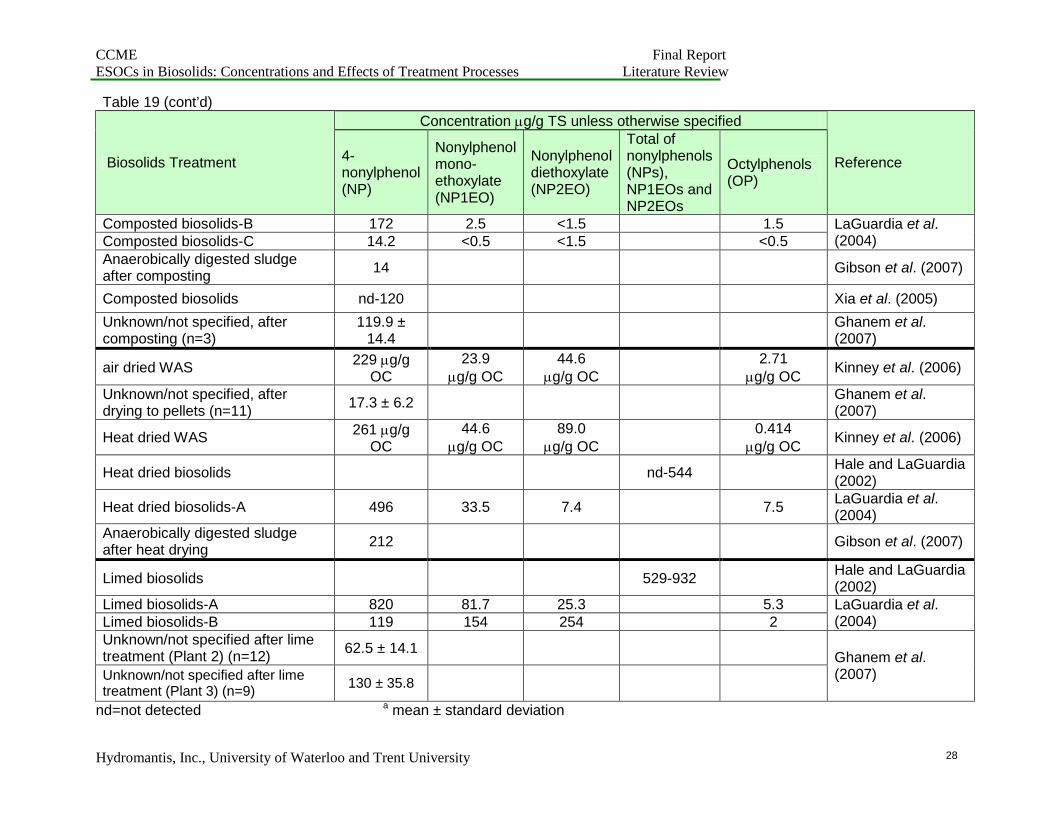
CCME Final ReportESOCs in Biosolids: Concentrations and Effects of Treatment Processes Literature Review
Hydromantis, Inc., University of Waterloo and Trent University 28
Table 19 (cont’d)
Concentration g/g TS unless otherwise specified
Biosolids Treatment 4-nonylphenol(NP)
Nonylphenolmono-ethoxylate(NP1EO)
Nonylphenoldiethoxylate(NP2EO)
Total ofnonylphenols(NPs),NP1EOs andNP2EOs
Octylphenols(OP)
Reference
Composted biosolids-B 172 2.5 <1.5 1.5Composted biosolids-C 14.2 <0.5 <1.5 <0.5
LaGuardia et al.(2004)
Anaerobically digested sludgeafter composting
14 Gibson et al. (2007)
Composted biosolids nd-120 Xia et al. (2005)
Unknown/not specified, aftercomposting (n=3)
119.9 ±14.4
Ghanem et al.(2007)
air dried WAS229 g/g
OC23.9
g/g OC44.6
g/g OC2.71
g/g OCKinney et al. (2006)
Unknown/not specified, afterdrying to pellets (n=11)
17.3 ± 6.2Ghanem et al.(2007)
Heat dried WAS261 g/g
OC44.6
g/g OC89.0
g/g OC0.414
g/g OCKinney et al. (2006)
Heat dried biosolids nd-544Hale and LaGuardia(2002)
Heat dried biosolids-A 496 33.5 7.4 7.5LaGuardia et al.(2004)
Anaerobically digested sludgeafter heat drying
212 Gibson et al. (2007)
Limed biosolids 529-932Hale and LaGuardia(2002)
Limed biosolids-A 820 81.7 25.3 5.3Limed biosolids-B 119 154 254 2
LaGuardia et al.(2004)
Unknown/not specified after limetreatment (Plant 2) (n=12)
62.5 ± 14.1
Unknown/not specified after limetreatment (Plant 3) (n=9)
130 ± 35.8
Ghanem et al.(2007)
nd=not detected a mean ± standard deviation

CCME Final ReportESOCs in Biosolids: Concentrations and Effects of Treatment Processes Literature Review
Hydromantis, Inc., University of Waterloo and Trent University 29
Table 20. Removal Efficiencies of 4-NP by Biosolids Composting
% Reduction of 4-NP after Time of Composting in DaysBiosolids:Woodshaving ratio 8 20 40 70
43:57 76% 80% 90% no data65:35 22% 70% 78% 92%84:16 7% 60% 70% 92%
Reference Xia et al. (2005) Das and Xia (2008)
Table 21. Removal Efficiencies of APs and Ethoxylates by Biosolids Treatment Processes
Constituent Sludge TypeRemovalEfficiency % Reference Country
Unknown/not specified, afterdrying to pellets
72
Unknown/not specified, aftercomposting
18
Unknown/not specified afterlime treatment (Plant 2)
31
Unknown/not specified afterlime treatment (Plant 3)
19
Ghanem et al.(2007)
France
Composted anaerobicallydigested sludge
88
4-nonylphenol
Heat dried anaerobicallydigested sludge
39
Gibson et al.(2007)
Mexicoand UK
AP Polyethoxylates Aerobic/Anaerobic 40-100 Lindberg (2005)Sweden
3.2.3 Section Summary
The important points from this section follow.1. There appear to be differences in APE and AP concentrations between biosolids samples
collected from different countries, possibly due to different regulations for detergentproduct formulation.
2. In raw sludges or aerobically digested sludges, concentrations of mono- and di-ethoxylated species of NP may occur at concentrations approximately equal to or evenslightly greater than nonylphenol.
3. Of the biosolids treatment processes examined, anaerobic digestion consistently has thehighest concentrations of 4-NP, as a result of anaerobic biotransformation processesconverting mono- and di-ethoxylated species to the non-substituted AP.
4. Composting appears to result in lower concentrations of APs and APEs than does dryingor lime treatment. Limited data suggest that lime treatment may result in lower reductionof APEs compared to composting or drying processes.
5. A composting period of between 40 and 70 days is needed to reduce the starting level of4-NP by over 90%.

CCME Final ReportESOCs in Biosolids: Concentrations and Effects of Treatment Processes Literature Review
Hydromantis, Inc., University of Waterloo and Trent University 30
3.3 BROMINATED FLAME RETARDANTS
3.3.1 Introduction
Polybrominated diphenyl ethers (PBDEs) are compounds used as flame retardants in a widevariety of applications. They have been historically sold as commercial mixtures having apredominant homolog class (compounds with the same number of bromine substituents located atdifferent locations on the diphenyl ether structure). The main commercial classes of the PBDEssometimes referred to generically as brominated flame retardants (BFRs) are the pentabromo-,octabromo- and decabromo diphenyl ethers (US DHHS, 2004). PBDEs cannot be manufacturedor used in Canada, and use of the pentabromo- and octabromo- diphenyl ethers is prohibited inCanada (Canada Gazette, 2008). Only the decabromo diphenyl ether (DPE) product is allowedfor use in Canada.
PBDEs are added to plastics to reduce flammability and fire damage; products incorporatingthese retardants are used in domestic, commercial and industrial settings, and includepolyurethane furniture foam, carpets, high impact cases, circuit boards, appliances and electricalequipment (USGS, 2004). As the products age, the PBDEs can dissociate from the host plastic tobecome part of indoor dust. Cleaning by wet mopping of floors and washing of dusting cloths orfloor-mats is therefore a probable source of entry to wastewater treatment facilities. Atwastewater treatment facilities, the PBDEs, because of high octanol:water partition coefficients,are expected to sorb strongly to wastewater solids, and thus end up mainly in the residualwastewater solids.
The environmental and health concerns with PBDEs centre on their persistence, potential toxicityand ability to bioaccumulate. Elevated concentrations of the compounds have been found inhuman breast milk, particularly in North America (USGS, 2004), and in Arctic mammals near thetop of the food chain (ringed seals and beluga whales) (Environment Canada, 2006). In humans,these compounds can disrupt thyroid hormone activity due to the similarity of PBDE metabolitesto the hormone thyroxin, and may impair neurodevelopment (USGS, 2004).
3.3.2 Occurrence Data
Among the most detailed concentration data of PBDEs in Canadian wastewater solids is that ofRayne and Ikonomu (2005) for the Kelowna, BC wastewater treatment plant. Isomerconcentrations were documented for primary sludge, anaerobically fermented primary sludge,return activated sludge dissolved air flotation float solids, and dewatered centrifuge cake. Thedata are produced in Table 22, converted to a dry solids basis for comparison with other literatureconcentration data. The isomer decabromo DPE (BDE 209) was observed in all the samples atthe highest concentration of any of the isomers, followed by the penta BDE99 and tetra BDE47isomers. The data indicate that the concentrations of the PBDE isomers are substantially lower inthe solids streams prior to secondary treatment (primary sludge before and after anaerobicfermentation), and more concentrated in the solids streams following secondary treatment (i.e.,return activated sludge, dissolve air flotation (DAF) float and centrifuge cake).

CCME Final ReportESOCs in Biosolids: Concentrations and Effects of Treatment Processes Literature Review
Hydromantis, Inc., University of Waterloo and Trent University 31
Table 22. PBDE Concentrations in Kelowna, BC Wastewater Solids Streams (from Rayne and Ikonomou, 2005)
Concentration (ng/g TS)BDPE Isomer Primary
sludgeFermented
Primary sludgeReturn
Activated SludgeDAF
sludgeBiosolids
2,4-Dibromodiphenyl Ether (di BDE7) 0.0070 0.0059 0.0620 0.0898 0.0806
2,4' + 3,3'- Dibromodiphenyl Ether (di BDE8/11) 0.0070 0.0151 0.0728 0.0820 0.0764
3,4'- Dibromodiphenyl Ether (di BDE13) 0.0070 0.0189 0.0661 0.0980 0.0753
4,4'- Dibromodiphenyl Ether (di BDE15) 0.0651 0.0551 0.477 0.408 0.348
2,2',4- Tribromodiphenyl Ether (tri BDE-17) 0.379 0.343 5.70 8.57 4.88
2,3',4- Tribromodiphenyl Ether (tri BDE25 0.0279 0.0415 0.326 0.422 0.279
2,4,4'-Tribromodiphenyl Ether (tri BDE 28) 1.15 1.05 8.71 10.74 7.67
2,2',4,4'-Tetrabromodiphenyl Ether (tetra BDE47) 58.46 57.97 469.50 553.22 401.95
2,2',4,5'-Tetrabromodiphenyl Ether (tetra BDE49) 1.67 1.67 13.80 17.10 11.82
2,3',4,4'-Tetrabromodiphenyl Ether (tetra BDE66) 1.33 1.35 11.21 12.63 9.17
2,3',4',6-Tetrabromodiphenyl Ether (tetra BDE-71) 0.160 0.132 1.72 3.76 1.47
3,3',4,4'-Tetrabromodiphenyl Ether (tetra BDE77) 0.0070 0.0164 0.0459 0.0258 0.106
2,2',4,4',5-Pentabromodiphenyl Ether (penta BDE85) 3.19 2.44 25.47 30.53 22.16
2,2',4,4',5-Pentabromodiphenyl Ether (penta BDE99) 71.81 61.70 603.46 738.35 523.98
2,2',4,4',6-Pentabromodiphenyl Ether (penta BDE100) 10.65 10.67 87.50 111.50 79.64
2,3,3',4,4'-Pentabromodiphenyl Ether (penta BDE105) 0.0139 0.0065 0.129 0.0426 0.118
2,3',4,4',6-Pentabromodiphenyl Ether(penta BDE119) 0.0488 0.0474 0.503 0.608 0.437
3,3',4,4',5-Pentabromodiphenyl Ether (penta BDE126) 0.0581 0.0384 0.167 0.0426 0.192
2,2',3,4,4',5'-Hexabromodiphenyl Ether (hexa BDE 138) 0.990 0.842 8.04 8.63 6.73
2,2',3,4,4',6'-Hexabromodiphenyl Ether (hexa BDE140) 0.204 0.206 1.99 2.19 1.67
2,2’,4,4’,5,5’-Hexabromodiphenyl Ether (hexa BDE 153) 10.89 8.90 86.29 98.47 78.06
2,2’,4,4’,5,6’-Hexabromodiphenyl Ether (hexa BDE 154) 5.61 4.99 51.18 57.36 43.89
2,2’,4,4’,6,6’-Hexabromodiphenyl Ether (hexa BDE155) 0.265 0.228 2.08 2.54 1.82
2,2',3,4,4',5,6-Heptabromodiphenyl Ether (hepta BDE181) 0.0163 0.0242 0.0796 0.0949 0.1214
2,2’,3,4,4’,5’,6-Heptabromodiphenyl Ether (hepta BDE 183) 2.41 1.35 9.43 10.72 8.16
2,3,3‘,4,4‘,5,6-heptabromodiphenyl ether (BDE-190) 0.100 0.080 0.442 0.512 0.480
2,2',3,3',4,4',5,5',6-Nonabromodiphenyl Ether (nona BDE206) 2.04 2.31 11.91 14.93 11.06
2,2',3,3',4,4',5,6,6'-Nonabromodiphenyl Ether (nona BDE207) 2.17 2.99 14.64 18.94 14.44
2,2',3,3',4,5,5',6,6'-Nonabromodiphenyl Ether (nona BDE208) 0.251 0.407 2.03 2.30 1.932,2',3,3',4,4',5,5',6,6'-Decabromodephenyl Ether (deca BDE209) 122.44 146.15 553.46 691.20 558.66
TOTAL PBDEs 300.10 310.65 1989.45 2421.57 1809.15

CCME Final ReportESOCs in Biosolids: Concentrations and Effects of Treatment Processes Literature Review
Hydromantis, Inc., University of Waterloo and Trent University 32
Data for PBDEs in wastewater solids from the Windsor Little River treatment plant are providedby Song et al. (2006). The concentrations of eight major isomers monitored in the study aresummarized in Table 23.
Table 23. Concentrations of Major PBDE Isomers in Windsor Little River WW Solids(Song et al., 2006)
Concentration, ng/g TSmean ± std. dev.a
PBDE IsomerPrimarysludge
Waste activatedsludge
2,4,4'-Tribromodiphenyl Ether (tri BDE 28) 8.0 ± 3.1 14 ± 62,2',4,4'-Tetrabromodiphenyl Ether (tetra BDE47) 586 ± 207 963 ± 4152,2',4,4',5-Pentabromodiphenyl Ether (penta BDE99) 757 ± 272 1247 ± 5162,2',4,4',6-Pentabromodiphenyl Ether (penta BDE100) 122 ± 42 167 ± 1292,2',3,4,4',5'-Hexabromodiphenyl Ether (hexa BDE 138) 9.1 ± 4.3 17 ± 62,2’,4,4’,5,5’-Hexabromodiphenyl Ether (hexa BDE 153) 84 ± 27 109 ± 822,2’,4,4’,5,6’-Hexabromodiphenyl Ether (hexa BDE 154) 49 ± 19 71 ± 542,2’,3,4,4’,5’,6-Heptabromodiphenyl Ether (hepta BDE 183) 12 ± 6 22 ± 10
a mean standard deviation of 3 samples
Decabromo (BDE209) was not monitored in this study. The two isomers detected at the highestconcentrations in both sludge types were the penta BDE99 and the tetra BDE47. As wasobserved with the data from Rayne and Ikonomou (2005), the WAS sample exhibited higherconcentrations of the monitored isomers than did the primary sludge.
One of the more comprehensive studies on PBDEs in municipal biosolids was completed inAustralia (Clarke et al., 2008), comparing concentrations in eight urban and eight rural biosolidssamples. Table 24 presents the concentration data for the different PBDE isomers included in theanalytical method for the urban wastewater treatment plants sampled. Decabromo DPE(BDE209) was present at the highest concentration (mean 881 ng/g TS). It is of interest thatthree of the four plants identified as having anaerobic digestion as part of the treatment haveconcentration of decabromo DPE, and indeed many of the isomers, higher than the mean value.Because of the limited sample size, however, it is not clear whether this represents an actualphenomenon that occurs with anaerobic digestion, or whether it is an artifact of the limitedsample size. The apparent higher concentration of the decabromo DPE in the anaerobicallydigested sludge samples is contrary to expected dehalogenation reaction which occurs underanaerobic conditions. For example, Shin et al. (2006) observed a decline of decabromo DPE(BDE209) under batch anaerobic test at both 35 and 55 oC, with concomitant increases in lowerbrominated congeners. Because the concentrations of many of the lower brominated isomers inanaerobically digested sludges are higher than the mean value of urban biosolids samples, it islikely the observation is due to the randomness of the samples rather than due to higher levelsattributed to the anaerobic digestion process.
Results for the eight rural samples in the Australian survey are provided in Table 25. Only one ofthe rural plants utilized anaerobic digestion as a biosolids treatment process, while most reliedinstead on dewatering and drying of the biosolids. Decabromo DPE was present in all the

CCME Final ReportESOCs in Biosolids: Concentrations and Effects of Treatment Processes Literature Review
Hydromantis, Inc., University of Waterloo and Trent University 33
Table 24. PBDE Concentrations in Sludges and Biosolids from Australian Urban Municipalities (Clarke et al., 2008)
Concentration of PBDE congeners (ng/g TS) by designated plant and sludge treatment
U1 U5 U6 U8 U2 U3 U4 U7
BDPE IsomerAn Dig +Dewater
An Dig +Dewater
An Dig +Dewater
An Dig +Dewater Dewater
DAFfiltration IFAS
Dewater+ Lime
Mean ±Std Dev.
2,2',4-Tribromo DPE (BDE17) 0.96 0.16 7.75 1.85 2.7 2.7 0.27 0.46 2.1 ± 2.5
2,4,4'-Tribromo DPE (BDE28) + (BDE33) 2 <0.2 4.55 5.2 3.1 25 1.1 0.85 6±8.6
2,2',4,4'-Tetrabromo DPE (tetra BDE47) 120 17 205 285 180 36 72 45 120±95
2,2',4,5'-Tetrabromo DPE (BDE49) 3.8 1.9 7.95 8.45 5.6 2.3 2.3 1.5 4.2±2.8
2,3',4,4'-Tetrabromo DPE (BDE66) 3.3 0.59 7.15 7.7 6.1 1.4 2.9 1.5 3.8±2.8
3,3',4,4'-Tetrabromo DPE (BDE77) 0.049 <0.004 0.58 0.092 0.055 0.0099 <0.01 <0.03 0.2±0.2
2,2',4,4',5-Pentabromo DPE (BDE85) 4.8 1 8.8 11.5 6.7 1.1 3.1 1.8 4.9±3.9
2,2',4,4',5-Pentabromo DPE (BDE99) 130 22 230 315 190 31 84 48 131±106
2,2',4,4',6-Pentabromo DPE (BDE100) 26 4.4 47.5 63.5 39 8.6 16 9.6 27±21.0
2,3',4,4',6-Pentabromo DPE (BDE119) <0.9 0.04 0.695 0.465 <1 <0.1 <0.4 0.11 0.33±0.31
2,2',3,4,4',5'-Hexabromo DPE (BDE138) 3.3 2.7 1.9 2.6±0.7
2,2',3,4,4',6-Hexabromo DPE (BDE139) 1.5 0.31 2.8 3.15 2 0.49 0.82 0.42 1.4±1.1
2,2',3,4,4',6'-Hexabromo DPE (BDE140) 0.45 0.16 1.27 0.84 0.71 0.18 0.29 0.13 0.5±0.41
2,2’,4,4’,5,5’-Hexabromo DPE (BDE153) 13 4.9 23 28 20 4.8 8.2 4.4 13.3±9.3
2,2’,4,4’,5,6’-Hexabromo DPE (BDE154) 10 3.2 19.5 24.5 16 4.3 6.1 3.9 10.9±8.1
2,2',3,3',4,4',6-Heptabromo DPE (BDE171) <0.09 0.41 3.87 0.375 <0.2 0.097 <0.4 0.099 0.97±1.63
2,2',3,4,4',5,5'-Heptabromo DPE (BDE180) 0.37 0.81 3.95 0.615 1.7 0.14 0.29 0.11 1±1.3
2,2’,3,4,4’,5’,6-Heptabromo DPE (BDE183) 9.6 15 13 10 19 3.9 5.1 1.9 9.7±5.9
2,2’,3,4,4’,6,6’-Heptabromo DPE (BDE184) 0.16 0.2 2.23 0.41 0.39 0.094 0.11 0.064 0.46±0.73
2,2’,3,3’,4,4’,5’,6-Octabromo DPE (BDE196) 4.7 <2 7.4 4.2 7.7 <0.2 <1 1.6 5.1±2.5
2,2’,3,3’,4,4’,6,6’-Octabromo DPE (BDE197) 2.9 8.4 8.75 4.3 3.6 0.89 1.1 0.85 3.8±3.2
2,2',3,3',4,4',5,5'-Octabromo DPE (BDE201) 1.1 14 4.85 1.3 <4 <1 <0.7 0.38 4.3±5.7
2,2’,3,4,4’,5,5’,6-Octabromo DPE (BDE203) <3 40 8.35 5.1 <3 <1 <2 1.3 13.7±17.8
2,2',3,3',4,4',5,5',6-Nonabromo DPE (BDE206) 32 98 30 27.5 9.7 3.1 4.5 6 26±31
2,2',3,3',4,4',5,6,6'-Nonabromo DPE (BDE207) 13 110 19.5 12.5 12 5.7 6 6.3 23±35
2,2',3,3',4,5,5',6,6'-Nonabromo DPE (BDE208) 7.9 97 15.7 7.95 6.5 2.7 2.8 3.7 18±32
2,2',3,3',4,4',5,5',6,6'-Decabromo DPE(BDE209)
1170 3780 530 910 360 93 81 130 880±1200
An Dig = Anaerobic Digestion DAF=dissolved air flotation IFAS= integrated fixed-film activated sludge
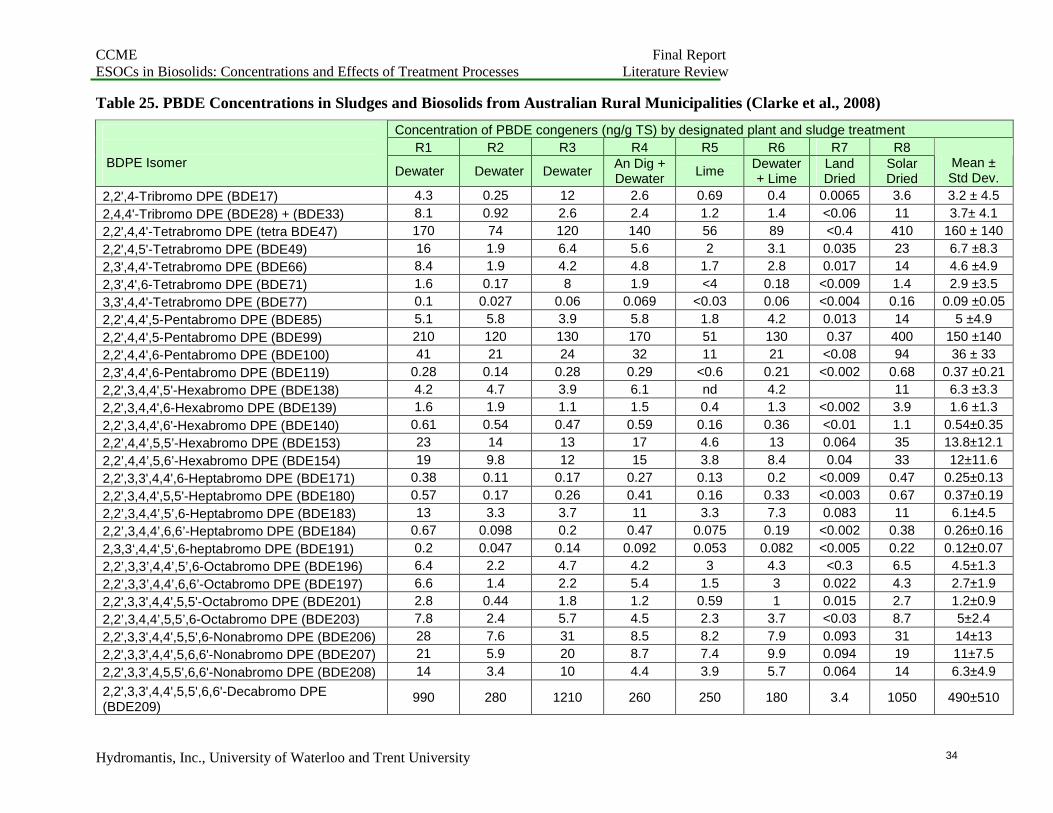
CCME Final ReportESOCs in Biosolids: Concentrations and Effects of Treatment Processes Literature Review
Hydromantis, Inc., University of Waterloo and Trent University 34
Table 25. PBDE Concentrations in Sludges and Biosolids from Australian Rural Municipalities (Clarke et al., 2008)
Concentration of PBDE congeners (ng/g TS) by designated plant and sludge treatment
R1 R2 R3 R4 R5 R6 R7 R8BDPE Isomer
Dewater Dewater DewaterAn Dig +Dewater
LimeDewater+ Lime
LandDried
SolarDried
Mean ±Std Dev.
2,2',4-Tribromo DPE (BDE17) 4.3 0.25 12 2.6 0.69 0.4 0.0065 3.6 3.2 ± 4.5
2,4,4'-Tribromo DPE (BDE28) + (BDE33) 8.1 0.92 2.6 2.4 1.2 1.4 <0.06 11 3.7± 4.1
2,2',4,4'-Tetrabromo DPE (tetra BDE47) 170 74 120 140 56 89 <0.4 410 160 ± 140
2,2',4,5'-Tetrabromo DPE (BDE49) 16 1.9 6.4 5.6 2 3.1 0.035 23 6.7 ±8.3
2,3',4,4'-Tetrabromo DPE (BDE66) 8.4 1.9 4.2 4.8 1.7 2.8 0.017 14 4.6 ±4.9
2,3',4',6-Tetrabromo DPE (BDE71) 1.6 0.17 8 1.9 <4 0.18 <0.009 1.4 2.9 ±3.5
3,3',4,4'-Tetrabromo DPE (BDE77) 0.1 0.027 0.06 0.069 <0.03 0.06 <0.004 0.16 0.09 ±0.05
2,2',4,4',5-Pentabromo DPE (BDE85) 5.1 5.8 3.9 5.8 1.8 4.2 0.013 14 5 ±4.9
2,2',4,4',5-Pentabromo DPE (BDE99) 210 120 130 170 51 130 0.37 400 150 ±140
2,2',4,4',6-Pentabromo DPE (BDE100) 41 21 24 32 11 21 <0.08 94 36 ± 33
2,3',4,4',6-Pentabromo DPE (BDE119) 0.28 0.14 0.28 0.29 <0.6 0.21 <0.002 0.68 0.37 ±0.21
2,2',3,4,4',5'-Hexabromo DPE (BDE138) 4.2 4.7 3.9 6.1 nd 4.2 11 6.3 ±3.3
2,2',3,4,4',6-Hexabromo DPE (BDE139) 1.6 1.9 1.1 1.5 0.4 1.3 <0.002 3.9 1.6 ±1.3
2,2',3,4,4',6'-Hexabromo DPE (BDE140) 0.61 0.54 0.47 0.59 0.16 0.36 <0.01 1.1 0.54±0.35
2,2’,4,4’,5,5’-Hexabromo DPE (BDE153) 23 14 13 17 4.6 13 0.064 35 13.8±12.1
2,2’,4,4’,5,6’-Hexabromo DPE (BDE154) 19 9.8 12 15 3.8 8.4 0.04 33 12±11.6
2,2',3,3',4,4',6-Heptabromo DPE (BDE171) 0.38 0.11 0.17 0.27 0.13 0.2 <0.009 0.47 0.25±0.13
2,2',3,4,4',5,5'-Heptabromo DPE (BDE180) 0.57 0.17 0.26 0.41 0.16 0.33 <0.003 0.67 0.37±0.19
2,2’,3,4,4’,5’,6-Heptabromo DPE (BDE183) 13 3.3 3.7 11 3.3 7.3 0.083 11 6.1±4.5
2,2’,3,4,4’,6,6’-Heptabromo DPE (BDE184) 0.67 0.098 0.2 0.47 0.075 0.19 <0.002 0.38 0.26±0.16
2,3,3‘,4,4‘,5‘,6-heptabromo DPE (BDE191) 0.2 0.047 0.14 0.092 0.053 0.082 <0.005 0.22 0.12±0.07
2,2’,3,3’,4,4’,5’,6-Octabromo DPE (BDE196) 6.4 2.2 4.7 4.2 3 4.3 <0.3 6.5 4.5±1.3
2,2’,3,3’,4,4’,6,6’-Octabromo DPE (BDE197) 6.6 1.4 2.2 5.4 1.5 3 0.022 4.3 2.7±1.9
2,2',3,3',4,4',5,5'-Octabromo DPE (BDE201) 2.8 0.44 1.8 1.2 0.59 1 0.015 2.7 1.2±0.9
2,2’,3,4,4’,5,5’,6-Octabromo DPE (BDE203) 7.8 2.4 5.7 4.5 2.3 3.7 <0.03 8.7 5±2.4
2,2',3,3',4,4',5,5',6-Nonabromo DPE (BDE206) 28 7.6 31 8.5 8.2 7.9 0.093 31 14±13
2,2',3,3',4,4',5,6,6'-Nonabromo DPE (BDE207) 21 5.9 20 8.7 7.4 9.9 0.094 19 11±7.5
2,2',3,3',4,5,5',6,6'-Nonabromo DPE (BDE208) 14 3.4 10 4.4 3.9 5.7 0.064 14 6.3±4.9
2,2',3,3',4,4',5,5',6,6'-Decabromo DPE(BDE209)
990 280 1210 260 250 180 3.4 1050 490±510

CCME Final ReportESOCs in Biosolids: Concentrations and Effects of Treatment Processes Literature Review
Hydromantis, Inc., University of Waterloo and Trent University 35
rural biosolids samples at the highest concentration of any isomer, as was the case with the urbanbiosolids samples. The sample derived for solar drying had the highest concentrations of almostall isomers in the rural biosolids samples. There are insufficient data to determine whether it isthe sludge itself or the treatment method that results in the high concentrations relative to theother rural samples.
Based on statistical analysis, Clarke et al. (2008) concluded that the sum of the PBDE isomerswere not statistically different between the urban and rural biosolids. The authors furtherconcluded that the lower brominated isomers, representative of the Penta-DPE commercialformula were consistent between urban and rural biosolids, and thus were likely of domesticsources. Greater variability between the concentrations of decabromo DPE in urban and ruralbiosolids was observed however, suggesting to the authors that industrial sources were likely themain contributors to the presence of decabromo DPE in biosolids.
The recently published US EPA’s Targeted National Sewage Sludge Survey documentedconcentrations of many target analytes including PBDEs. Biosolids from a total of 74 municipaltreatment plants in 35 states were included in this comprehensive national survey. The data werestatistically analyzed to determine median, mean and standard deviations for the targetcontaminants. The results for the PBDEs are presented in Table 26. The sludges represent awide range of process types, geographic locations and treatment plant capacities, although allfacilities tested had a treatment capacity greater than 3780 m3/d (1 MGD) with a minimum ofsecondary treatment (US EPA 2009).
Table 26. PBDE Concentrations in Sludges and Biosolids Based on U.S. EPA’s Targeted NationalSewage Sludge Survey (US EPA 2009)
Concentration (ng/g TS)PBDE Isomer median mean std dev
2,4,4'-Tribromodiphenyl Ether (tri BDE28) + tri BDE33 8.90 15.35 24.07
2,2',4,4'-Tetrabromodiphenyl Ether (tetra BDE47) 570.4 709.2 523.8
2,3',4,4'-Tetrabromodiphenyl Ether (tetra BDE66) 12.00 17.40 18.55
2,2',4,4',5-Pentabromodiphenyl Ether (penta BDE85) 23.00 27.94 22.00
2,2',4,4',5-Pentabromodiphenyl Ether (penta BDE99) 574.6 716.4 533.4
2,2',4,4',6-Pentabromodiphenyl Ether (penta BDE100) 120.0 150.4 143.8
2,2',3,4,4',5'-Hexabromodiphenyl Ether (hexa BDE138) 7.00 10.75 12.63
2,2’,4,4’,5,5’-Hexabromodiphenyl Ether (hexa BDE153) 54.12 68.33 52.69
2,2’,4,4’,5,6’-Hexabromodiphenyl Ether (hexa BDE154) 46.50 59.90 57.92
2,2’,3,4,4’,5’,6-Heptabromodiphenyl Ether (hepta BDE183) 10.00 16.66 20.472,2',3,3',4,4',5,5',6,6'-Decabromodephenyl Ether (decaBDE209) 1,163 2,181 3,463
Number of POTW samples = 78
The data show that decabromo BDE209 is present at the highest concentration in the sludgestested, almost twice the concentration of the isomers with next highest concentrations, the pentaBDE99 and tetra BDE47.
Occurrence data retrieved from the literature for other countries are summarized in Table 27.

CCME Final ReportESOCs in Biosolids: Concentrations and Effects of Treatment Processes Literature Review
Hydromantis, Inc., University of Waterloo and Trent University 36
Table 27. Occurrence data for PBDEs in Biosolids Samples from Other Countries
Biosolids Source
2,2',4,4'-Tetrabromo
DPE(BDE47)
2,2',4,4',5-Pentabromo
DPE(BDE99)
2,2',4,4',6-Pentabromo
DPE(BDE100)
2,2’,4,4’,5,5’-Hexa-bromoDPE
(BDE 153)
2,2’,4,4’,5,6’-Hexa-bromoDPE
(BDE 154)
2,2’,3,4,4’,5’,6-Hepta-
bromoDPE
(BDE 183)
2,2',3,3',4,4',5,5',6,6'-Deca-bromo
DPE(BDE209)
Reference
Palo Alto STPCA, U.S. 722-778 894-973 158-172 83-91 61-72 not anal.
from Song etal. (2006)
11 U.S. sites 359-754 931-1157 89-255 56-199 58-172 85-4890from Gevaoet al. (2008)
European STPs 15-91 19-120 3.5-28 1.0-15.5 0.7-14.8 not anal.from Song et
al. (2006)
Spain 5 sites17.0-40.9
(22.9)a25.0-50.9
(26.9)5.60-11.0
(6.29)3.31-5.70
(3.68)2.47-4.08
(3.42)3.66-29.6
(3.90)80.6-1082
(393)Eljarrat(2008)
Spain 6 sites 1.8-83.6 23.4-64.2 0.2-14 1.2-7 1.1-5.8 8.5-275from Gevaoet al. (2008)
Kuwait Treatmentplant 1
0.24-2.72(0.97)
0.61-5.96(1.95)
0.06-0.85(0.29)
0.04-0.62(0.19)
0.06-1.05(0.31)
0.04-0.78(0.21)
4.8-157.5(48.5)
Gevao et al.2008
Kuwait Treatmentplant 2
0.95-7.81(4.16)
2.04-14.74(8.4)
0.82-2.3(1.34)
0.24-1.37(0.82)
0.35-1.98(1.18)
0.15-0.86(0.44)
16.4-1595.6(360.4)
Gevao et al.2008
Kuwait Treatmentplant 3
0.97-2.35(1.86)
1.53-4.84(3.8)
0.28-0.75(0.4)
0.16-0.54(0.40)
0.18-0.81(0.58)
0.11-0.50(0.33)
28.4-286.8(136.5)
Gevao et al.2008
Sweden 14 sites <2-80 <2-104 <2-25 <dl-16.4 <dl-10.4 785-18032from Gevaoet al. (2008)
Stockholm,Sweden 39-91 48-120 11-28 not anal. not anal. not anal.
from Gevaoet al. (2008)
Klippen, Sweden 22 18 5.4 not anal. not anal. not anal.from Gevaoet al. (2008)
Rimbo, Sweden 53 53 13 not anal. not anal. not anal.from Gevaoet al. (2008)
Bjergmarken, DN 96.8 86.2 19.1 7.8 6.1 248from Gevaoet al. (2008)
a median value in parentheses; dl = detection limit

CCME Final ReportESOCs in Biosolids: Concentrations and Effects of Treatment Processes Literature Review
Hydromantis, Inc., University of Waterloo and Trent University 37
The data indicate that the isomer concentrations are much higher in biosolids samples from theU.S. than from samples from European facilities or from the sited in Kuwait. The meanconcentration data from the US EPA’s sludge survey in Table 26 are similar to the U.S.concentration values in Table 27. Canadian concentration data presented in Tables 22 and 23 aremore similar to the U.S. values, while the Australian data found in Tables 24 and 25 lie betweenthe North American and European/Kuwaiti data.
3.3.3 Effect of Treatment Processes
LaGuardia et al. (2004) compared PBDE concentrations in four biosolids treatment processes,including composting, lime treatment, heat drying, and anaerobic digestion. The concentrationdata from these treatments are provided in Table 28.
Table 28. Comparison of PBDE Concentrations in Four Biosolids Treatment Processes(LaGuardia et al., 2004).
TreatmentProcess
2,2',4,4'-TetrabromodiphenylEther(BDE47)
2,2',4,4',5-PentabromodiphenylEther(BDE99)
2,2',4,4',6-PentabromodiphenylEther(BDE100)
2,2’,4,4’,5,5’-HexabromodiphenylEther(BDE153)
2,2’,4,4’,5,6’-HexabromodiphenylEther(BDE154)
2,2',3,3',4,4',5,5',6,6'-DecabromodiphenylEther(BDE209)
Compost-A 498 743 106 55.6 98.8 308Compost-B 754 1157 167 87.9 121 1460Compost-C 536 516 112 71.8 58.2 368
AverageCompost 596 805 128 72 93 712Lime-A 359 513 88.5 64.3 82.6 553Lime-B 525 584 200 179 172 84.8Average
Lime 442 549 144 122 127 319Heat-A 518 714 115 58.8 95.2 1940Heat-B 673 815 255 119 169 4890
AverageHeat 596 765 185 89 132 3415
An Dig-A 605 572 125 68.9 57.2 347An Dig-B 421 391 113 116 61 340An Dig-C 686 648 129 67.7 61.9 40An Dig-D 674 613 176 80.6 74.5 389AverageAn Dig 597 556 136 83 64 279
The data suggest that for the hexabromo and lower brominated congeners, the different treatmentprocesses had relatively little effect on the observed concentrations. The data are less clear withrespect to the decabromo isomer. The sites using anaerobic digestion appeared to havesubstantially lower concentrations than the other treatment processes. The two sites using heatdrying had biosolids with the highest decabromo DPE concentrations observed in the survey.Two of three composted samples exhibited relatively low concentrations of the isomer, as did the

CCME Final ReportESOCs in Biosolids: Concentrations and Effects of Treatment Processes Literature Review
Hydromantis, Inc., University of Waterloo and Trent University 38
two limed samples. More sites and tests would be required to provide an adequate basis forstatistical analysis.
A study be Gerecke et al. (2006) at a full-scale Swiss treatment plant was of interest because itcompared samples of PBDEs before and after anaerobic digestion, and also investigated twoother type of brominated flame retardant. Data are provided in Table 29.
All three classes of flame retardants were reduced by full-scale anaerobic digestion. Thedecabromo isomer was present at much higher concentrations than the other two flame retardants.The tetrabromobisphenol A (TBBPA) class was reduced by the largest extent while thedecabromo DPE was reduced by the least extent. In laboratory studies, Gerecke et al. (2006)determined compound half-lives of less than a day for the hexabromocyclododecane (HBCD) andTBBPA, compared to 700 days for the decabromo DPE. Shin et al. (2006) also found inlaboratory studies with batch reactors that concentrations of decabromo DPE were reduced byanaerobic treatment, with a faster reduction occurring at thermophilic than at mesophilictemperatures. Such observations may well explain why anaerobic treatment resulted in lowerconcentration in biosolids than did composting, heat treatment or liming in the study byLaGuardia et al. (2004).
Table 29. Concentrations of Brominated Flame Retardants in Sludge Before and AfterAnaerobic Digestion (Gerecke et al., 2006)
Concentrationnmol/L
Concentration ng/gFlame retardant
raw digested raw digested2,2',3,3',4,4',5,5',6,6'-DecabromodephenylEther (BDE209)
76 49 2,490 1,605
Hexabromocyclododecane (HBCD)(6 stereoisomers)
2.1 1.2 66.32 37.89
Tetrabromobisphenol A +Tetrabromobisphenol (dimethyl) (TBBPA)
1.9 0.3 34.20 5.40
No reduction efficiency data for the PBDEs in biosolids treatment processes were observed in theliterature.
3.3.4 Section Summary
The main points of interest for this section follow.1. There are apparent differences in concentrations of PBDE isomers in North America and
other countries (e.g., Europe, Kuwait, and Australia).2. The isomer decabromo DPE (BDE 209) was observed in all the samples at the highest
concentration of any of the isomers, followed by the penta BDE99 and tetra BDE47.3. Available data indicate that the concentrations of the PBDE isomers are substantially
lower in the solids streams prior to secondary treatment (e.g. primary sludge), and moreconcentrated in the solids streams following secondary treatment (i.e., return activatedsludge, and dewater secondary or mixed sludge).

CCME Final ReportESOCs in Biosolids: Concentrations and Effects of Treatment Processes Literature Review
Hydromantis, Inc., University of Waterloo and Trent University 39
4. Anaerobic digestion may result in a reduction of decabromo DPE, but concentrations oflower brominated congeners may increase.
5. There is insufficient information to determine if other biosolids treatment processes canresult in reduction of PBDEs.
6. Few occurrence data were identified for other BFRs such as HBCD and TBBPA.7. No reduction efficiency data for the PBDEs or other brominated flame retardants in
biosolids treatment processes were observed in the literature.
3.4 PHARMACEUTICAL COMPOUNDS
3.4.1 Introduction
This class of ESOCs in sludges and biosolids includes many different sub-classes with differenttherapeutic uses. This report will follow to a great extent the classification used by Gielen (2007)for investigating interactions of pharmaceuticals in New Zealand sludge with soils. The classesof pharmaceuticals investigated and reported herein are provided in Table 30. By far, the mostcompounds identified belonged to the categories of antibiotics.
3.4.2 Antibiotics
Antibiotic pharmaceuticals consist of many classes of compounds applied to inhibit or killpathogenic bacteria. The main classes of antibiotics observed in this literature review are foundin Table 31.
Tetracycline AntibioticsData on the occurrence of tetracycline compounds in sludge and biosolids are sparse. The recentU.S. EPA Targeted National Sewage Sludge Survey (TNSSS) (EPA, 2009) provides one of themost complete pictures of the compounds there, as indicated in Table 32. Tetracycline and itsmetabolite 4-epitetracycline, doxycycline and minocycline were found in the highestconcentrations. Other than the EPA data, few other studies have reported concentrations.
Earlier studies by Lindberg et al. (2005) and the review by Harrison et al. (2006) indicate a highLimit of Quantitation (LOQ) for doxycycline (approx. 1200 – 1500 ng/g TS). The more recentEPA (2009) study cites a median concentration of 424 ng/g TS, suggesting a significantimprovement in analytical procedures in the interim.

CCME Final ReportESOCs in Biosolids: Concentrations and Effects of Treatment Processes Literature Review
Hydromantis, Inc., University of Waterloo and Trent University 40
Table 30. Categories and Pharmaceuticals Identified in this Review
Antibiotics Nervous system Analgesic Blood
sulfonamides macrolides anti-epileptic Acetaminophen anti-lipid
Sulfadimethoxine Clarithromycin Primidone NSAID Bezafibrate
Sulfamethazine Erythromycin Carbamazepine Diclofenac Clofibric Acid
Sulfamerazine Azithromycin anti-depressant Naproxen Gemfibrozil
Sulfametazine Ormetoprim fluoxetine Ibuprofen Anti-coagulant
Sulfadiazine Virginiamycin anti-psychotic Indometacin Warfarin
Sulfisoxazole Tylosin Chlorpromazine Mefenamic acid
Sulfachloro-pyridazine Roxithromycin Thioridazine Ketoprofen Other
Sulfanilamide tetracyclines anti-anxiety anti-parasitic
Sulfadimidine Doxycycline Diazepam Alimentary Thiabendazole
Sulfonamide Chlortetracycline Amitriptyline gastric Carbadox
Sulfamethizole Minocycline Paroxetine Cimetidine Anti-fungal
fluoroquinolones Oxytetracycline stimulantsRanitidine(hydrochloride) Miconazole
Norfloxacin Demeclocycline Methamphetamine Famotidine Other
Enrofloxacin beta-lactams Amphetamine Omeprazole Digoxigenin
Lomefloxacin Cloxacillin Caffeine Diabetic Cotinine
Sarafloxacin Oxacillin1,7-Dimethylxanthine Glibenclamide Norgestimate
Flumequine Penicillin GMetformin(hydrochloride) Salicylic Acid
Ciprofloxacin Penicillin V Respiratory/allergy
Ofloxacin Dicloxacillin anti-histamine Cardiac
Clinafloxacin bacteriostats Diphenylhydramine Digoxin Atenolol
lincosamides Triclosan Diphenhydramine Hydrochlorothiazide Propranolol
Clindamycin, Triclocarban Loratidine Chlorpromazine Diltiazem
Lincomycin Trimethoprim anti-bronchospasm Thioridazine
Chloramphenicol Albuterol

CCME Final ReportESOCs in Biosolids: Concentrations and Effects of Treatment Processes Literature Review
Hydromantis, Inc., University of Waterloo and Trent University 41
Table 31. Classes of Antibiotics and Compounds Noted in Literature Review of Biosolids
Tetracyclines Sulfonamides Fluoroquinolones Macrolides Beta-lactams
Tetracycline Sulfadimethoxine Norfloxacin Clarithromycin Cloxacillin
4-Epitetracyclinea Sulfamerazine Enrofloxacin Erythromycin Oxacillin
4-Epianhydrotetracyclinea Lomefloxacin Azithromycin Penicillin G
AnhydrotetracyclineaSulfamethazine/Sulfametazine Sarafloxacin Ormetoprim Penicillin V
Chlortetracycline Sulfadiazine Flumequine Virginiamycin Dicloxacillin
4-Epichlortetracyclineb Sulfisoxazole Ciprofloxacin Tylosin4-Epianhydrochlor-tetracyclineb
Sulfachloro-pyridazine Ofloxacin Roxithromycin
Anhydrochlortetracyclineb Sulfanilamide Clinafloxacin
Isochlortetracyclineb Sulfadimidine Bacteriostats
Oxytetracycline Sulfonamide Quinolones Trimethoprim
4-Epioxytetracyclinec Sulfamethizole Oxolinic acid Lincosamides Chloramphenicol
Demeclocycline Clindamycin, Hexachlorophene
Doxycycline Cephalosprins Lincomycin Triclosan
Minocycline Cefotaxime Triclocarbana
metabolite of Tetracyclineb
metabolite of Chlortetracyclinec
metabolite of Oxytetracycline
Table 32. Concentrations of Tetracycline Antibiotics in Sludges and Biosolids
Tetracycline Compound
Notspecified(sludgesurvey)
Notspecified(literaturesurvey)
Unknownsludge (AnurbanWWTP)
Unknownsludge (AruralWWTP)
Anaerobic& aerobicdigested
Tetracycline 1278 (630) a <LOQ - 15.8 19.8
4-ETC 1135 (620)
4-Epianhydro-tetracycline 251 (140)
Anhydrotetracycline 263 (153)
Chlortetracycline 55.1 (39.7) <LOQ - 14.7
4-Epichlortetracycline 119 (100)
4-Epianhydrochlortetracycline 421 (397)
Anhydrochlortetracycline 126 (105)
Isochlortetracycline 83.4 (39.6)
Oxytetracycline 57.9 (43.2)
4-Epioxytetracycline 45.3 (41.5)
Demeclocycline 106 (99.2)
Doxycycline 877 (424)<1200–
1500<LOQ -1500
Minocycline 660 (432)
Reference U.S. EPA(2009)
Harrisonet al.(2006)
Spongberg and Witter(2008)
Lindberget al.(2005)
a mean (median) LOQ = limit of quantitation

CCME Final ReportESOCs in Biosolids: Concentrations and Effects of Treatment Processes Literature Review
Hydromantis, Inc., University of Waterloo and Trent University 42
Wu et al. (2008) observed the reduction of concentrations of tetracycline and doxycycline overtime in aerobically digested biosolids held under different storage conditions (Table 33).Concentrations of tetracycline declined so readily that the tests were terminated after 8 days.Conditions of aerobic or anaerobic storage had no effect on the reduction in tetracycline, nor didthe presence or absence of daylight. The data indicated that doxycycline required a substantiallylonger time for reduction in concentration than did tetracycline, with aerobic conditions providinga more favourable environment for reduction of doxycycline than anaerobic conditions. Presenceor absence of daylight made no appreciable difference in the reduction of doxycycline.
Table 33. Effect of Storage Treatment on Tetracyclines in Aerobically Digested Biosolids(Wu et al., 2008)
Concentration (ng/g TS)Storage Treatment
Storage Time(days) Tetracycline Doxycycline
0 1500 15007 900 1400
35 no data a 1000Dark, Anaerobic
77 no data 11000 1600 15007 800 1500
35 no data a 750Dark, Aerobic
77 no data 6000 1600 15007 700 1600
35 no data a 800Daylight, Aerobic
77 no data 700a study terminated after 8 days
Sulfonamide AntibioticsOccurrence data for the sulphonamide class of drugs is scattered through the technical literature,with most attention devoted to one or two compounds (sulfamethoxazole). The most completedata set is derived for the U.S. EPA’s TNSSS, in which sulfanilamide was detected at the highestconcentration, approximately one to two orders of magnitude higher than the remaining drugs inthis class (Table 34). In the literature survey by Jones-Lepp and Stevens (2007), maximumconcentrations of sulfametazine and sulfapyridineb were 160 and 197 ng/g TS, respectively.Many of the sulphonamide class tested by Spongberg and Witter (2008) were beneath the limit ofquantitation.
Several researchers included analysis of sulfamethoxazole in anaerobically digested sludgesamples, but reported it at non-detectable levels (Göbel et al., 2005; Heidler and Halden 2008).
TreatmentSulfamethoxazole was found to be highly amenable to anaerobic digestion in several laboratory-scale studies by Carballa and colleagues. This sulfa drug was so readily degradable in anaerobicdigestion (99% removal) that no difference in removal efficiency due to operating temperature or
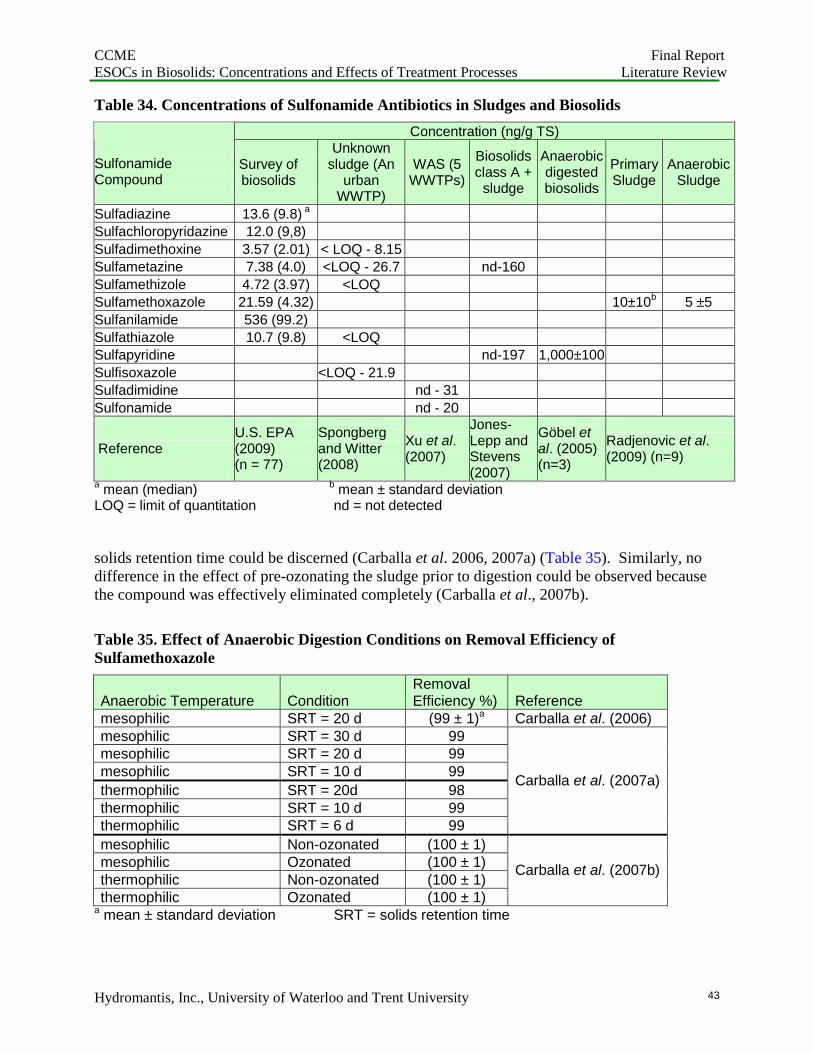
CCME Final ReportESOCs in Biosolids: Concentrations and Effects of Treatment Processes Literature Review
Hydromantis, Inc., University of Waterloo and Trent University 43
Table 34. Concentrations of Sulfonamide Antibiotics in Sludges and Biosolids
Concentration (ng/g TS)
SulfonamideCompound
Survey ofbiosolids
Unknownsludge (An
urbanWWTP)
WAS (5WWTPs)
Biosolidsclass A +
sludge
Anaerobicdigestedbiosolids
PrimarySludge
AnaerobicSludge
Sulfadiazine 13.6 (9.8) a
Sulfachloropyridazine 12.0 (9,8)
Sulfadimethoxine 3.57 (2.01) < LOQ - 8.15
Sulfametazine 7.38 (4.0) <LOQ - 26.7 nd-160
Sulfamethizole 4.72 (3.97) <LOQ
Sulfamethoxazole 21.59 (4.32) 10±10b 5 ±5
Sulfanilamide 536 (99.2)
Sulfathiazole 10.7 (9.8) <LOQ
Sulfapyridine nd-197 1,000±100
Sulfisoxazole <LOQ - 21.9
Sulfadimidine nd - 31
Sulfonamide nd - 20
ReferenceU.S. EPA(2009)(n = 77)
Spongbergand Witter(2008)
Xu et al.(2007)
Jones-Lepp andStevens(2007)
Göbel etal. (2005)(n=3)
Radjenovic et al.(2009) (n=9)
a mean (median) b mean ± standard deviationLOQ = limit of quantitation nd = not detected
solids retention time could be discerned (Carballa et al. 2006, 2007a) (Table 35). Similarly, nodifference in the effect of pre-ozonating the sludge prior to digestion could be observed becausethe compound was effectively eliminated completely (Carballa et al., 2007b).
Table 35. Effect of Anaerobic Digestion Conditions on Removal Efficiency ofSulfamethoxazole
Anaerobic Temperature ConditionRemovalEfficiency %) Reference
mesophilic SRT = 20 d (99 ± 1)a Carballa et al. (2006)mesophilic SRT = 30 d 99mesophilic SRT = 20 d 99mesophilic SRT = 10 d 99
thermophilic SRT = 20d 98thermophilic SRT = 10 d 99thermophilic SRT = 6 d 99
Carballa et al. (2007a)
mesophilic Non-ozonated (100 ± 1)mesophilic Ozonated (100 ± 1)thermophilic Non-ozonated (100 ± 1)thermophilic Ozonated (100 ± 1)
Carballa et al. (2007b)
a mean ± standard deviation SRT = solids retention time

CCME Final ReportESOCs in Biosolids: Concentrations and Effects of Treatment Processes Literature Review
Hydromantis, Inc., University of Waterloo and Trent University 44
Fluoroquinoline and Quinoline AntibioticsThe most complete identification of fluoroquinolone compounds in biosolids comes from theU.S. EPA TNSSS (Table 36). The drugs found at the highest levels were ciprofloxacin andofloxacin, at median concentrations of 5,370 and 3,110 ng/g TS, respectively. These twopharmaceuticals have been identified most frequently in the literature, along with norfloxacin.The remaining fluoroquinolines and quinolines in the EPA survey had median concentrationsunder 50 ng/g TS.
Table 36. Concentrations of Fluoroquinolone and Quinolone Antibiotics in Sludges andBiosolids
Concentration (ng/g TS)
Fluoroquinoline/Quinoline Sludge Survey
Anaerobicdigestion
(n=5WWTPs)
Aerobicdigestion
(n=1WWTP)
LiteratureReview
Unknownsludge (An
urbanWWTP)
Unknownsludge (A
ruralWWTP)
Ciprofloxacin 10,500 (5,370) a 1,400 – 4,800500 - 900 50 – 4,800 <LOQ - 46.3 8.3Clinafloxacin 75.6 (40.4)Enrofloxacin 27.9 (19.8)Flumequine 10.6 (9.87)Lomefloxacin 22.9 (19.8)Norfloxacin 275 (109) 900 – 4,200 100 - 400 10 – 4,200Ofloxacin 8,570 (3,110) <LOQ–2,000 100 - 700 <10 – 2,000Oxolinic acid 4.7 (4.0)Sarafloxacin 294 (91.9)
ReferenceU.S. EPA (2009)
(n = 78)Lindberg et al. (2005)
Harrison etal. (2006)
Spongberg and Witter(2008)
a mean (median)
Concentrations of the three main identified fluoroquinolones in raw and digested sludge samplesare summarized in Table 37. Many of the publications reviewed indicate that the concentrationsof ciprofloxacin and norfloxacin in the sludge samples are similar in magnitude on the order of2,000 to 6,000 ng/g TS. Lindberg et al. (2005) tracked the concentrations of ciprofloxacin andnorfloxacin through the residual solids stream of a wastewater treatment plant in Umea, Sweden.The concentrations increased as the sludge was combined, digested and dewatered, but thendropped significantly after drying by pelletization. It appears that these fluoroquinolonecompounds are relatively unaffected by the anaerobic digestion process, as concentrations are inmany cases higher in the digested sludge than in the raw sludge.
TreatmentWhen aerobically digested sludge containing ciprofloxacin was stored under different light andredox environments, there was no reduction in concentration from the initial starting level after77 days of storage (Wu et al., 2008).

CCME Final ReportESOCs in Biosolids: Concentrations and Effects of Treatment Processes Literature Review
Hydromantis, Inc., University of Waterloo and Trent University 45
Table 37. Concentrations of Three Fluoroquinolones in Sludge and Biosolids
Concentration (ng/g TS)Sludge Type
SourceCiprofloxacin Norfloxacin Ofloxacin Reference
Primary sludge 2,900 2,900Secondary sludge 2,500 1,500Raw sludge to digester 6,600 5,100Digested biosolids 6,000 7,000Dewatered digestedbiosolids 10,600 9,800
Dried biosolids (Pellets) 2,600 3,400
Lindberg etal. (2006)
WWTP1 1,400 ± 120 a 1,540 ± 30Raw sludge, Zurich WWTP2 2,030 ± 200 1,960 ± 150
WWTP3 2,420 ± 60 2,370 ± 70Digested biosolids, Zurich WWTP4 2,720 ± 200 2,130 ± 190
Golet et al.(2002) (n=2)
Waste activated sludge,Zurich 2,500 ± 100 2,600 ± 100
Raw sludge, Zurich 2,200± 400 2,100 ± 200Anaerobic digestedbiosolids, Zurich 3,100 ± 400 2,900 ± 400
Golet et al.(2003) (n=2)
Raw sludge 1,000-2,0001,500–2,000
Digested biosolids 2,300–2,4002,100–2,400
Jones-Leppand Stevens(2007)
Digested sludge 3,100-5970 2,900-6970Heidler andHalden (2008)
Plant A 301± 89 227 ± 46
Plant B 40 ± 165 886 ± 222
Plant C 187 ± 38 165 ± 71Waste activated sludge,China
Plant D 372 ± 97 835 ± 186
Xu et al.(2007) (n=4)
Primary Sludge, Spain 190±280Anaerobic Digestedbiosolids, Spain 80 ±30
Radjenović etal., 2009)(n=9)
a mean ± standard deviation
Macrolide AntibioticsIn Table 38, the data generated by the U.S. EPA’s TNSSS suggest that azithromycin, tylosin andvirginiamycin are present at the highest concentrations of the macrolide antibiotics, with meanvalues of 831 and 138 ng/g TS, respectively. Concentration data from an anaerobically digestedsludge by Göbel et al. (2005) exhibited some of the highest concentrations of this class ofantibiotics. Otherwise, concentration data for this class of antibiotics were sparse.
TreatmentOnly limited data were found on the removal of a macrolide antibiotic by biosolids treatment.Studies by Carballa et al. (2006, 2007a) indicated that roxithromycin was highly degradable inlaboratory-scale anaerobic digesters. The combination of thermophilic operation and longerretention times appeared to contribute to higher removal efficiency (Table 39).
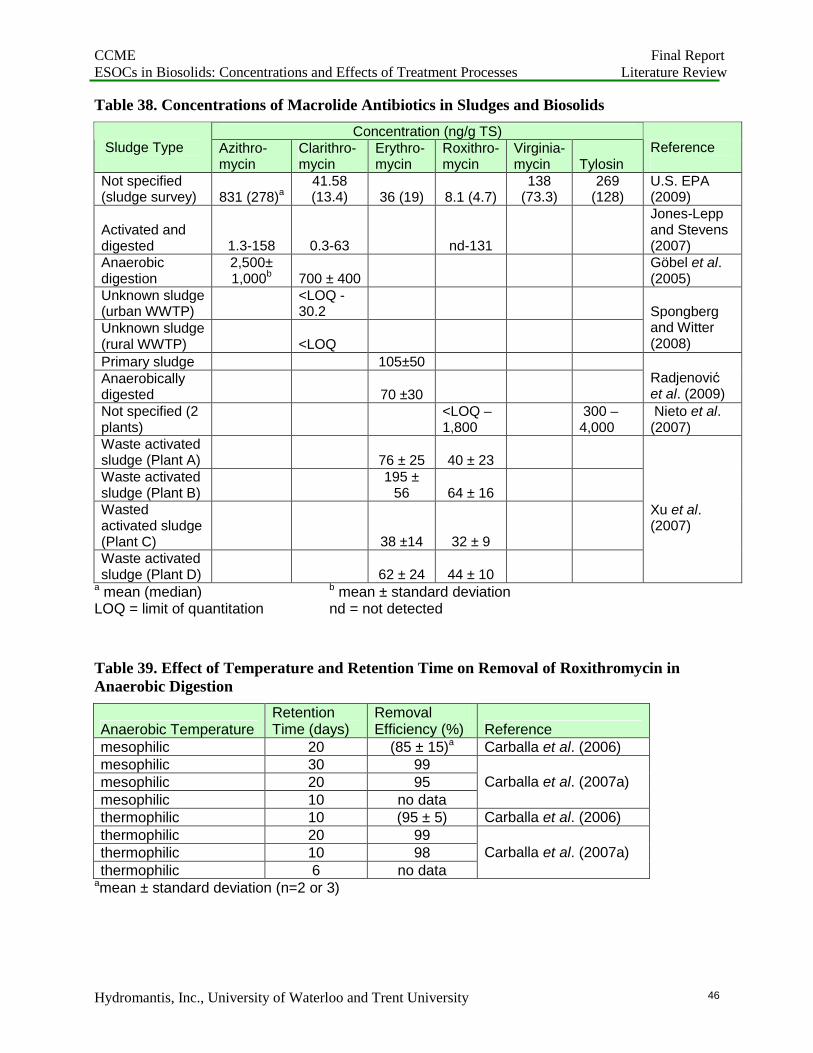
CCME Final ReportESOCs in Biosolids: Concentrations and Effects of Treatment Processes Literature Review
Hydromantis, Inc., University of Waterloo and Trent University 46
Table 38. Concentrations of Macrolide Antibiotics in Sludges and Biosolids
Concentration (ng/g TS)Sludge Type Azithro-
mycinClarithro-mycin
Erythro-mycin
Roxithro-mycin
Virginia-mycin Tylosin
Reference
Not specified(sludge survey) 831 (278)a
41.58(13.4) 36 (19) 8.1 (4.7)
138(73.3)
269(128)
U.S. EPA(2009)
Activated anddigested 1.3-158 0.3-63 nd-131
Jones-Leppand Stevens(2007)
Anaerobicdigestion
2,500±1,000b 700 ± 400
Göbel et al.(2005)
Unknown sludge(urban WWTP)
<LOQ -30.2
Unknown sludge(rural WWTP) <LOQ
Spongbergand Witter(2008)
Primary sludge 105±50Anaerobicallydigested 70 ±30
Radjenovićet al. (2009)
Not specified (2plants)
<LOQ –1,800
300 –4,000
Nieto et al.(2007)
Waste activatedsludge (Plant A) 76 ± 25 40 ± 23Waste activatedsludge (Plant B)
195 ±56 64 ± 16
Wastedactivated sludge(Plant C) 38 ±14 32 ± 9Waste activatedsludge (Plant D) 62 ± 24 44 ± 10
Xu et al.(2007)
a mean (median) b mean ± standard deviationLOQ = limit of quantitation nd = not detected
Table 39. Effect of Temperature and Retention Time on Removal of Roxithromycin inAnaerobic Digestion
Anaerobic TemperatureRetentionTime (days)
RemovalEfficiency (%) Reference
mesophilic 20 (85 ± 15)a Carballa et al. (2006)mesophilic 30 99mesophilic 20 95mesophilic 10 no data
Carballa et al. (2007a)
thermophilic 10 (95 ± 5) Carballa et al. (2006)thermophilic 20 99thermophilic 10 98thermophilic 6 no data
Carballa et al. (2007a)
amean ± standard deviation (n=2 or 3)

CCME Final ReportESOCs in Biosolids: Concentrations and Effects of Treatment Processes Literature Review
Hydromantis, Inc., University of Waterloo and Trent University 47
When aerobically digested sludge containing the macrolides clarithromycin and erythromycinwas stored under different light and redox environments, both antibiotics declined from between2,000 and 2,500 ng/g TS to non-detectable concentrations from between 7 and 35 days (Wu etal., 2008) (Table 40). Neither storage under anaerobic or aerobic conditions, nor the presence orabsence of daylight appeared to affect the removal rates.
Table 40. Effect of Storage Treatment on Macrolides in Aerobically Digested Biosolids (Wuet al., 2008)
Concentration (ng/g TS)Storage Treatment Storage
Time (days) Clarithromycin Erythromycin0 2,500 2,0007 300 1,20035 0 800
Dark, Anaerobic
77 0 2500 2,500 2,2007 200 80035 0 400
Dark, Aerobic
77 0 2000 2,500 2,2007 200 80035 0 300
Daylight, Aerobic
77 0 200
Beta-Lactam AntibioticsThis class of antibiotics contains the well-recognized penicillin and similar drugs. Few data wereidentified for these compounds, with only the U.S. EPA’s TNSSS providing any information onoccurrence in sludges and biosolids (Table 41). Penicillin V at 41 ng/g TS was detected atapproximately twice the concentration of the other types of beta-lactams.
Table 41. Concentrations of Beta-Lactam Antibiotics in Sludges and Biosolids (U.S. EPA,2009)
Beta-lactam Concentration (ng/g TS)Cloxacillin 26.4 (19.9)a
Oxacillin 20.8 (19.8)Penicillin G 20.8 (19.8)Penicillin V 41.4 (39.6)a mean (median)
No data on removal efficiencies in biosolids treatment processes were found in this review.
Lincosamide AntibioticsOnly limited occurrence data in biosolids or sludges were found for this class of compounds(Table 42). In the EPA’s TNSSS (U.S. EPA, 2009), lincomycin and clindamycin were found atmedian concentrations of 19.9 and 13.4 ng/g TS, respectively. In Ohio, clindamycin in sludges

CCME Final ReportESOCs in Biosolids: Concentrations and Effects of Treatment Processes Literature Review
Hydromantis, Inc., University of Waterloo and Trent University 48
of three urban treatment plants ranged from 3.7 to 154 ng/g TS, while in sludge from a ruraltreatment facility, the concentration was18.2 ng/g TS (Spongberg and Witter, 2008).
Table 42. Concentrations of Lincosamide Antibiotics in Sludges and Biosolids
Sludge Type Lincomycin Clindamycin ReferenceNot Specified (sludge survey) 30.2 (19.9) a 41.58 (13.4) U.S. EPA (2009)Unknown sludge (An urban WWTP) 3.7 - 154Unknown sludge (A rural WWTP) 18.2
Spongberg and Witter(2008)
a mean (median) (n=78)
The effect of different storage conditions on the removal of clindamycin in aerobically digestedsolids was examined by Wu et al. (2008). The antibiotic declined rapidly in the first seven daysof storage in both aerobic and anaerobic conditions and with daylight either present or absent inthe aerobic samples (Table 43). Removal of the clindamycin was much slower in the remaining70 days of the study. All test conditions produced approximately the same test results.
Table 43. Effect of Storage Treatment on Clindamycin in Aerobically Digested Biosolids(Wu et al., 2008)
Storage Treatment Storage Time(days)
Clindamycin Concentration(ng/g TS)
0 2,5007 1,00035 800
Dark, Anaerobic
77 8000 2,5007 80035 700
Dark, Aerobic
77 5000 2,5007 90035 700
Daylight, Aerobic
77 600
3.4.3 Nervous SystemAnti-Epileptics (Anti-Convulsants)
Occurrence DataAnti-epileptic drugs are used in the control of epilepsy. Occurrence data were primarily foundfor carbamazepine. The only reference to a second anti-epileptic drug, Primidone, stated theconcentrations in sludge samples from three Ohio treatment plants were lower than the level ofquantitation (Spongberg and Witter, 2008). Concentrations of carbamazepine in biosolids andsludge samples fell into a relatively narrow range (Table 44), from non-detectable to a maximumof 850 ng/g TS as reported by Jones-Lepp and Stevens (2007).

CCME Final ReportESOCs in Biosolids: Concentrations and Effects of Treatment Processes Literature Review
Hydromantis, Inc., University of Waterloo and Trent University 49
Table 44. Occurrence Data for Carbamazepine in Sludges and Biosolids
Sludge or Biosolids SourceConcentration
(ng/g TS) ReferenceRaw sludge 69.6 ±2.2a
Anaerobically digested biosolids 258 ±4.7a Miao et al. (2005) (n=3)
Waste Activated Sludge 150 ng/g OCDewatered sludge 64 ng/g OC
Kinney et al. (2006)
Not specified (Sewage treatment plant 1) nd - 78Not specified (Sewage treatment plant 2) 50 - 165
Nieto et al. (2007)
Not specified (An urban WWTP) 4.8 - 12.9Not specified (A rural WWTP) 21.1
Spongberg and Witter(2008)
Not specified (sludge survey) 135 (55)b U.S. EPA (2009) (n=78)
Primary sludge 70 ±60aRadjenović et al. (2009)(n=2)
Biosolids class A + sludge nd-850Jones-Lepp and Stevens(2007)
nd = not detected a mean ± standard deviation b mean (median)
Concentrations of carbamazepine following biosolids treatment processes are presented in Table45. Kinney et al. (2006) compared several treatment processes. Other than anaerobic digestion,which exhibited a very high carbamazepine concentration of 1200 ng/g OC, concentrations wereless than 180 ng/g TS. Other samples of anaerobically digested sludge ranged up to 281 ng/g TS.Carbamazepine concentrations observed in the treated biosolids were similar in magnitude tothose of the other biosolids samples presented in Table 45.
Table 45. Concentrations of Carbamazepine in Treated Biosolids
Treatment ProcessConcentrationng/g TS Reference
compost 15-180 ng/g OCheat dried 140 ng/g OCair dried 51 ng/g OCAnaerobic digested sludge 1,200 ng/g OC
Kinney et al. (2006)
Digested sludge 281 Heidler and Halden (2008)Anaerobic digested sludge 80 ±10 a Radjenović et al. (2009) (n=2)
a mean ± standard deviation OC = organic carbon
Metabolites of carbamazepine were monitored in the raw and digested solids of the Peterborough(ON) wastewater treatment plant (Miao et al., 2005) (Table 46). Concentrations of themetabolites included for analysis were either non-detected or present at very low concentrations(e.g., 2 -4 ng/g TS), compared to the concentrations of the parent compound in raw sludge (70ng/g TS, or digested biosolids (258 ng/g TS, Table 44).

CCME Final ReportESOCs in Biosolids: Concentrations and Effects of Treatment Processes Literature Review
Hydromantis, Inc., University of Waterloo and Trent University 50
Table 46. Metabolites of Carbamazepine in Sludge (Miao et al., 2005)
Concentration (ng/g TS)Carbamazepine Metabolite Raw sludge Anaerobic digested
sludge10,11-dihydro-10,11-epoxycarbamazepine nd nd10,11-dihydro-10-hydroxycarbamazepine nd nd
2-hydroxycarbamazepine 1.9 ±1.1 a 3.4 ±0.93-hydroxycarbamazepine 1.6 ±0.8 4.3 ±0.9
a mean ± standard deviation (n=3) nd = not detected
Removal of Carbamazepine in Biosolids Treatment ProcessesOnly a limited set of tests have examined the removal of carbamazepine by biosolids treatmentprocesses. Trials with anaerobic digestion documented by Carballa et al. (2007a) at laboratoryscale indicated that carbamazepine was not reduced by the treatment at time up to 30 days atmesophilic conditions, and up to 20 days at thermophilic conditions (Table 47). Ternes et al.(2005) also reported that batch anaerobic digestion tests resulted in no removal of carbamazepine.
Table 47. Effect of Anaerobic Digestion Treatments on Removal of Carbamazepine(Carballa et al., 2007a)
Anaerobic Sludge TypeSolids Retention
Time (d)Removal
Efficiency (%)
30 0
20 0mesophilic
10 12
20 0
10 0thermophilic
6 22
Average 0
Carballa et al. (2007b) also investigated the effect of pre-ozonation prior to anaerobic digestionunder mesophilic and thermophilic conditions at laboratory scale (Table 48). The pre-ozonationtreatment had a beneficial effect on the removal of carbamazepine, with up to a 60% reductionafter 10 days at thermophilic temperatures. The authors considered the beneficial effect of theozone was due to the carbamazepine existing primarily in the liquid phase, making it moresusceptible to attack by the ozone (Carballa et al., 2007b).
Wu et al. (2008) examined the effects of storage methods on the reduction of carbamazepine andother pharmaceuticals in aerobically digested sludge. Treatment methods consisted of aerobicand anaerobic treatment in dark containers, and aerobic treatment subjected to solar radiation.There was no reduction from the initial carbamazepine concentration of approximately 2,500ng/g TS in any of the three treatments after 77 days of storage.

CCME Final ReportESOCs in Biosolids: Concentrations and Effects of Treatment Processes Literature Review
Hydromantis, Inc., University of Waterloo and Trent University 51
Table 48. Effect of Pre-Ozonation on Anaerobic Digestion of Carbamazepine (Carballa etal., 2007b)
Sludge TypeOperating condition
and SRTRemoval
Efficiency, %
anaerobic digestion - mesophilic Non-ozonated 20 d 0anaerobic digestion - mesophilic Ozonated 20 d 18± 5a
anaerobic digestion - thermophilic Non-ozonated 10 d 0anaerobic digestion - thermophilic Ozonated 10 d 60 ± 3
a mean ± standard deviation
Mood-altering PharmaceuticalsThis section includes four different categories of pharmaceuticals including anti-anxiety(Amitriptyline, Diazepam and Paroxetine), anti-depressants (Fluoxetine), anti-psychotics(Chlorpromazine and Thioridazine), and psycho-stimulants (amphetamine, methamphetamineand caffeine). Data concerning these drugs in biosolids are generally scarce. The concentrationdata for fluoxetine in sludges indicate it is found typically in a range between 100 and 1,000 ng/gTS (Table 49). Concentrations of fluoxetine and paroxetine in a sample of primary sludge wereof approximately the same magnitude (Radjenović et al., 2009).
Table 49. Concentrations of Representative Anti-Anxiety and Anti-Depressants in Sludgesand Biosolids
Concentration (ng/g TS)Sludge Source
Fluoxetine ParoxetineReference
Waste Activated Sludge 370 ng/g OCDewatered Sludge 830 ng/g OC
Kinney et al. (2006)
Primary Sludge 100±50a 70±50Radjenović et al. (2009)(n=2)
Biosolids class A + sludge(literature review) nd-59
Jones-Lepp and Stevens(2007)
Not specified (sludge survey) 245 (147)b U.S. EPA (2009) (n=76)
Heat drying 480 ng/g OC
Composting255-705 ng/g
OCAir drying 2,800 ng/g OCAnaerobic digestion 4,700 ng/g OC
Kinney et al. (2006)
Anaerobic digestion 150 ±60 a 50 ± 20Radjenović et al. (2009)(n=2)
a mean ± standard deviation b mean (median) OC = organic carbon
Concentrations of two anti-depressants in the product of biosolids treatment processes are alsoprovided in Table 49. Although some of the treated samples exhibit concentrations similar to
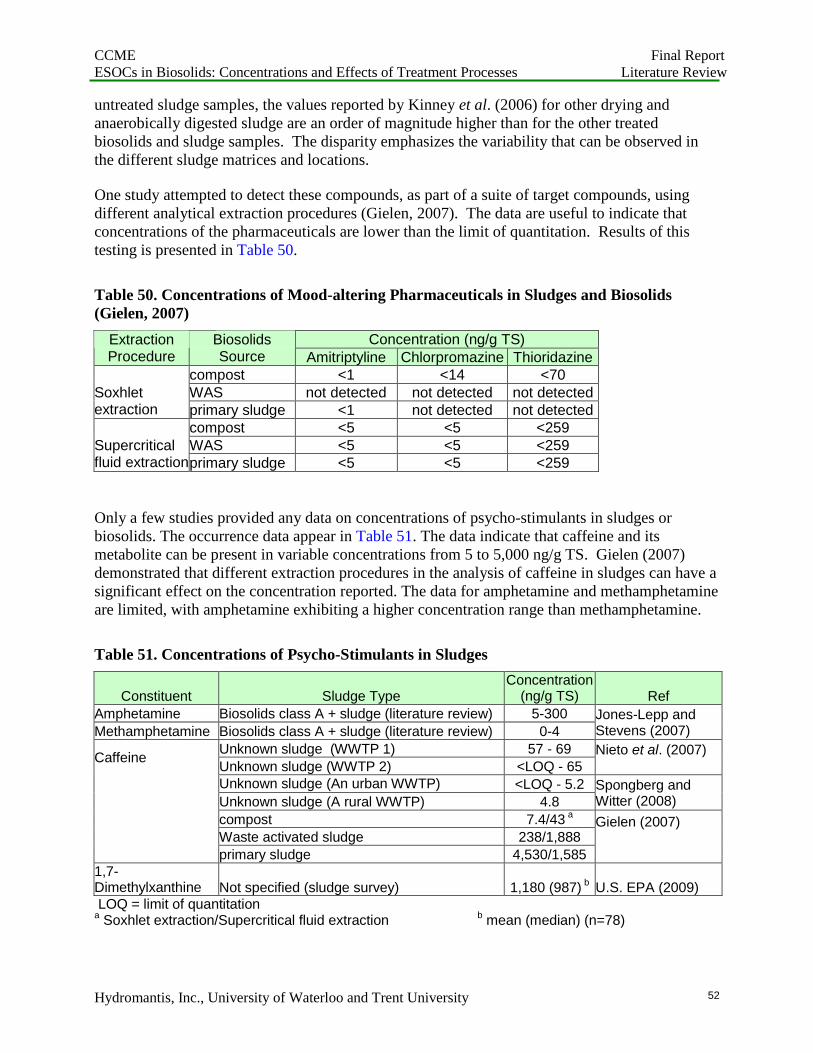
CCME Final ReportESOCs in Biosolids: Concentrations and Effects of Treatment Processes Literature Review
Hydromantis, Inc., University of Waterloo and Trent University 52
untreated sludge samples, the values reported by Kinney et al. (2006) for other drying andanaerobically digested sludge are an order of magnitude higher than for the other treatedbiosolids and sludge samples. The disparity emphasizes the variability that can be observed inthe different sludge matrices and locations.
One study attempted to detect these compounds, as part of a suite of target compounds, usingdifferent analytical extraction procedures (Gielen, 2007). The data are useful to indicate thatconcentrations of the pharmaceuticals are lower than the limit of quantitation. Results of thistesting is presented in Table 50.
Table 50. Concentrations of Mood-altering Pharmaceuticals in Sludges and Biosolids(Gielen, 2007)
Concentration (ng/g TS)ExtractionProcedure
BiosolidsSource Amitriptyline Chlorpromazine Thioridazine
compost <1 <14 <70WAS not detected not detected not detectedSoxhlet
extraction primary sludge <1 not detected not detectedcompost <5 <5 <259WAS <5 <5 <259Supercritical
fluid extractionprimary sludge <5 <5 <259
Only a few studies provided any data on concentrations of psycho-stimulants in sludges orbiosolids. The occurrence data appear in Table 51. The data indicate that caffeine and itsmetabolite can be present in variable concentrations from 5 to 5,000 ng/g TS. Gielen (2007)demonstrated that different extraction procedures in the analysis of caffeine in sludges can have asignificant effect on the concentration reported. The data for amphetamine and methamphetamineare limited, with amphetamine exhibiting a higher concentration range than methamphetamine.
Table 51. Concentrations of Psycho-Stimulants in Sludges
Constituent Sludge TypeConcentration
(ng/g TS) Ref
Amphetamine Biosolids class A + sludge (literature review) 5-300
Methamphetamine Biosolids class A + sludge (literature review) 0-4Jones-Lepp andStevens (2007)
Unknown sludge (WWTP 1) 57 - 69
Unknown sludge (WWTP 2) <LOQ - 65Nieto et al. (2007)
Unknown sludge (An urban WWTP) <LOQ - 5.2
Unknown sludge (A rural WWTP) 4.8Spongberg andWitter (2008)
compost 7.4/43 a
Waste activated sludge 238/1,888
Caffeine
primary sludge 4,530/1,585
Gielen (2007)
1,7-Dimethylxanthine Not specified (sludge survey) 1,180 (987) b U.S. EPA (2009)LOQ = limit of quantitation
a Soxhlet extraction/Supercritical fluid extraction b mean (median) (n=78)

CCME Final ReportESOCs in Biosolids: Concentrations and Effects of Treatment Processes Literature Review
Hydromantis, Inc., University of Waterloo and Trent University 53
3.4.4 Analgesics and Anti-Inflammatory DrugsOccurrenceAnalgesics are drugs that relieve pain (i.e., “pain-killers”). Non-steroidal-anti-inflammatory drugs(NSAIDs) may be used both as analgesics and for their anti-inflammatory purposes, in whichthey inhibit an enzyme (cyclooxygenase) contributing to the inflammation process.
The only analgesic compound identified in this review is acetaminophen (also called paracetamolin other countries). Several NSAIDs were identified in sludge and biosolids samples, includingdiclofenac, ibuprofen, naproxen, ketoprofen, indometacin and mefenamic acid. Occurrence datafor these pharmaceuticals is found in Table 52. Compilation of data in this table reveals that thedifferent analytical surveys have different suites of pharmaceuticals of interest. Only the NSAIDDiclofenac appears on the target list of most publications examined, but was not an analyte of therecent EPA (2009) survey. Compounds that appear in the target lists of different research teamsappear to be a function of pharmaceutical consumption (which in itself may be country-specific)and the analytical procedures used.
Removal of Analgesics and NSAIDsThere are few data reported in the literature on removal efficiencies of the analgesic and NSAIDcompounds. With laboratory-scale anaerobic digesters, Carballa et al. (2007a) observed thatnaproxen was readily removed under both mesophilic and thermophilic conditions, even at theshortest retention times tested (Table 53). Ibuprofen was more resistant to removal duringanaerobic digestion, with slightly improved reductions at thermophilic over mesophilic operation(Carballa et al., 2006, 2007a). Diclofenac was relatively more resistant to removal in anaerobicdigestion than either naproxen or ibuprofen. The relative removal efficiencies of the threeNSAIDs were confirmed in laboratory batch anaerobic digestion tests completed by Ternes et al.(2005).
The effect of pre-ozonation prior to anaerobic digestion under mesophilic and thermophilicconditions at laboratory scale was examined by Carballa et al. (2007b) (Table 54). The pre-ozonation treatment had no beneficial effect on the removal of the NSAIDs tested, with perhapseven a slightly negative impact on reduction by anaerobic digestion when preceded by ozonation.

CCME Final ReportESOCs in Biosolids: Concentrations and Effects of Treatment Processes Literature Review
Hydromantis, Inc., University of Waterloo and Trent University 54
Table 52. Occurrence of Analgesics and Non-Steroidal Anti-Inflammatory Drugs (NSAIDs) in Sludges and Biosolids
Concentration (ng/g TS)
Biosolids Source Acetamin-ophen
Codeine
Diclofenac IbuprofenIndomet-acin Ketoprofen Naproxen
Mefen-amicacid
Reference
Not specified(Sewage treatmentplant 1) (n=5) nd - 34 nd - 65 70 - 99 nd - 242Not specified(Sewage treatmentplant 2) (n=5) nd - 42 nd - 183 nd - 75 nd - 87
Nieto et al.(2007)
Not specified(literature survey)
0.0006–4535
Harrison et al.(2006)
Not specified (Anurban WWTP) (n=3)
<LOQ -23.1
Not specified (Arural WWTP) (n=1) 28.5
Spongberg andWitter (2008)
Not specified(sludge survey)
462 (396)a 30.6(19.9)
653 (143)86.2
(31.6) EPA (2009)
Primary sludge 215±130b 535±193 220±110 10±5Anaerobic digestedsludge 190±130 300 ±70 40±40 50±15
Radjenović etal. (2009)
Biosolids class A +sludge nd-1400
Jones-Leppand Stevens(2007)
Compost <5Waste ActivatedSludge <1 - 41
Primary sludge 153 - 299
Gielen (2007)
LOQ = Limit of Quantitation nd = not detecteda mean (median) (n=78) b mean ± standard deviation (n=2)
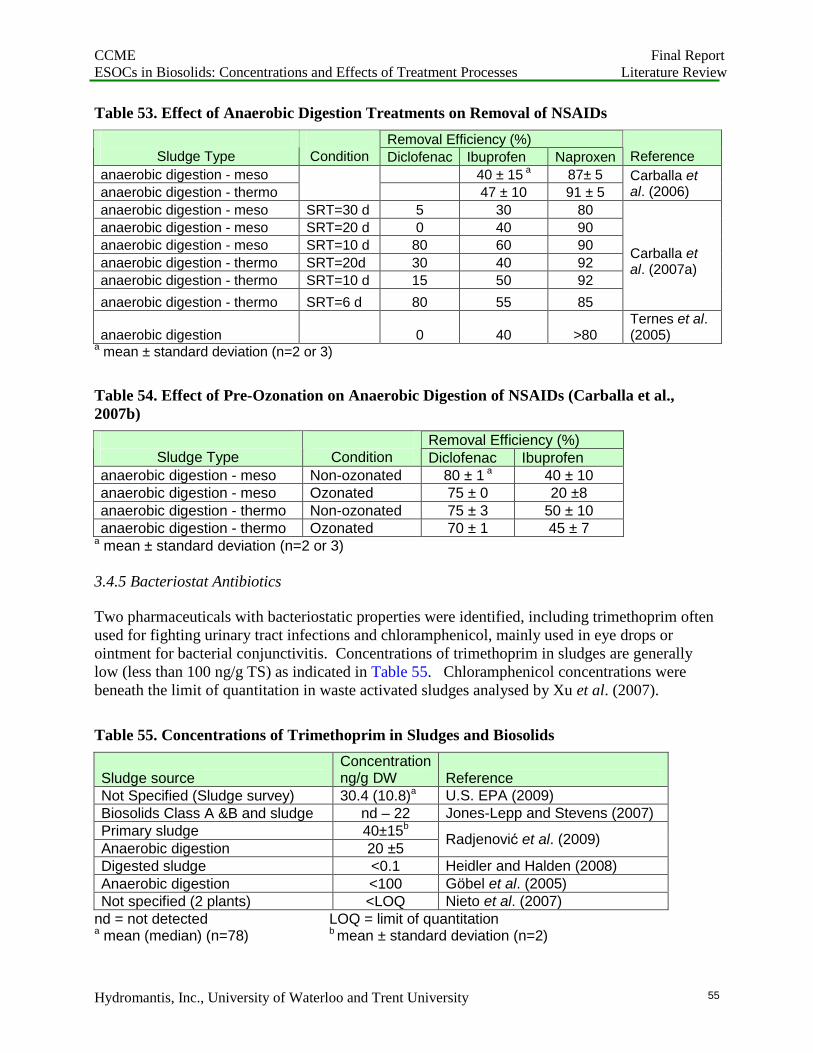
CCME Final ReportESOCs in Biosolids: Concentrations and Effects of Treatment Processes Literature Review
Hydromantis, Inc., University of Waterloo and Trent University 55
Table 53. Effect of Anaerobic Digestion Treatments on Removal of NSAIDs
Removal Efficiency (%)Sludge Type Condition Diclofenac Ibuprofen Naproxen Reference
anaerobic digestion - meso 40 ± 15 a 87± 5
anaerobic digestion - thermo 47 ± 10 91 ± 5Carballa etal. (2006)
anaerobic digestion - meso SRT=30 d 5 30 80
anaerobic digestion - meso SRT=20 d 0 40 90
anaerobic digestion - meso SRT=10 d 80 60 90
anaerobic digestion - thermo SRT=20d 30 40 92
anaerobic digestion - thermo SRT=10 d 15 50 92
anaerobic digestion - thermo SRT=6 d 80 55 85
Carballa etal. (2007a)
anaerobic digestion 0 40 >80Ternes et al.(2005)
a mean ± standard deviation (n=2 or 3)
Table 54. Effect of Pre-Ozonation on Anaerobic Digestion of NSAIDs (Carballa et al.,2007b)
Removal Efficiency (%)Sludge Type Condition Diclofenac Ibuprofen
anaerobic digestion - meso Non-ozonated 80 ± 1 a 40 ± 10anaerobic digestion - meso Ozonated 75 ± 0 20 ±8anaerobic digestion - thermo Non-ozonated 75 ± 3 50 ± 10anaerobic digestion - thermo Ozonated 70 ± 1 45 ± 7
a mean ± standard deviation (n=2 or 3)
3.4.5 Bacteriostat Antibiotics
Two pharmaceuticals with bacteriostatic properties were identified, including trimethoprim oftenused for fighting urinary tract infections and chloramphenicol, mainly used in eye drops orointment for bacterial conjunctivitis. Concentrations of trimethoprim in sludges are generallylow (less than 100 ng/g TS) as indicated in Table 55. Chloramphenicol concentrations werebeneath the limit of quantitation in waste activated sludges analysed by Xu et al. (2007).
Table 55. Concentrations of Trimethoprim in Sludges and Biosolids
Sludge sourceConcentrationng/g DW Reference
Not Specified (Sludge survey) 30.4 (10.8)a U.S. EPA (2009)Biosolids Class A &B and sludge nd – 22 Jones-Lepp and Stevens (2007)Primary sludge 40±15b
Anaerobic digestion 20 ±5Radjenović et al. (2009)
Digested sludge <0.1 Heidler and Halden (2008)Anaerobic digestion <100 Göbel et al. (2005)Not specified (2 plants) <LOQ Nieto et al. (2007)
nd = not detected LOQ = limit of quantitationa mean (median) (n=78) b mean ± standard deviation (n=2)

CCME Final ReportESOCs in Biosolids: Concentrations and Effects of Treatment Processes Literature Review
Hydromantis, Inc., University of Waterloo and Trent University 56
3.4.6 Cardiovascular Pharmaceuticals
This class of pharmaceuticals is that which affect the cardiovascular system. Drugs in this classhave generic actions including beta-blockers (atenolol, propanolol), calcium-channel blockers(diliatazem), thiazides (hydrochlorothiazide) and digoxin, These pharmaceuticals are used tocontrol heart arrhythmia and hypertension (high blood pressure). Hydrochlorothiazide isprescribed as an anti-diuretic, which ultimately helps to reduce hypertension. Dehydronifedipineis a metabolite of the calcium-channel blocker nifedipine.
The compounds in this class that were identified in the literature review are provided in Table 56.The range of concentrations for pharmaceuticals in this class appears to be on the order of 10 to400 ng/g TS. Based on the data provided by Radjenović et al., (2009), treatment of primarysludge by anaerobic digestion appears to result in a reduction of this class of compounds, withatenolol having a mean concentration notably lower in digested sludge compared to the level inprimary non-digested sludge.
Table 56. Concentrations of Cardiovascular Pharmaceuticals in Sludges and Biosolids
Concentration (ng/g TS)
Compound
NotSpecified(SludgeSurvey)
Biosolidsclass A +sludge
PrimarySludge
AnaerobicallyDigestedSludge
Notspecified (2plants)
Atenolol 90±30b 10±2
Digoxin 208 (99.4)a
Diltiazem 40.2 (14.8) nd-26 <LOQ - 12.8
Hydrochlorothiazide 40±20 15±10
Propranolol 40±20 30±15
Dehydronifedipine 5.03 (4.04) 8-390
ReferenceU.S. EPA
(2009)
Jones-Leppand Stevens
(2007)Radjenović et al. (2009)
Spongbergand Witter
(2008)nd = not detected LOQ = limit of quantitationa mean (median) (n=78) b mean ± standard deviation (n=2)
3.4.7 Alimentary Tract Pharmaceuticals
OccurrenceThis class of pharmaceuticals includes anti-diabetic drugs, and anti-dyspeptics or acid refluxinhibitors. The latter group has technical names including hydrogen receptor agonists or protonpump inhibitors. In Table 57, the anti-diabetic drug metformin is higher in concentration than itsalternate glibenclamide. Cimetidine was identified at the highest concentration (1,330 ng/g TS)of gastric reflux inhibitors by a wide margin. Studies involving testing of sludges revealed non-detectable concentrations of cimetidine (Spongberg and Witter, 2008) and the proton pumpinhibitor omeprazole (Nieto et al., 2007).

CCME Final ReportESOCs in Biosolids: Concentrations and Effects of Treatment Processes Literature Review
Hydromantis, Inc., University of Waterloo and Trent University 57
Table 57. Concentrations of Alimentary Tract Pharmaceuticals in Sludges and Biosolids
Compound Application Sludge SourceConcentration(ng/g TS) Reference
Primary sludge 90±100a
Glibenclamide anti-diabeticanaerobicdigestedsludge 160±30
Radjenović et al.(2009)
Metformin(hydrochloride) anti-diabetic
Not Specified(sludge survey) 533 (546)b U.S. EPA (2009)Not Specified(sludge survey) 1,330 (171) U.S. EPA (2009)
CimetidineH2-receptor antagonist(Anti-dyspeptic) Biosolids class
A + sludge nd-71Jones-Lepp andStevens (2007)
Primary sludge 20±20
Famotidine H2-receptor antagonists(Anti-dyspeptic)
anaerobicdigestedsludge 60±30
Radjenović et al.(2009)
Ranitidine(hydrochloride)
H2-receptor antagonists(Anti-dyspeptic)
Not Specified(sludge survey) 57.5 (12.5) U.S. EPA (2009)
nd = not detecteda mean ± standard deviation (n=2) b mean (median) (n=77)
TreatmentData provided in Radjenović et al. (2009) in Table 57 are useful for comparing the effect ofanaerobic digestion on concentrations of glibenclamide and famotidine. The concentrations ofthese two pharmaceuticals were higher following anaerobic digestion than in the raw primarysludge, indicating that the drugs are not amenable to reduction by anaerobic digestion.
3.4.8 Blood-Modifying Pharmaceuticals
This class of drugs includes anti-lipid (cholesterol lowering) (e.g., gemfibrozil, bezafibrate andclofibric acid) and anti-coagulants (e.g. Warfarin). Gemfibrozil was the compound reported mostfrequently in the literature, with concentrations ranging as high as 1,500 ng/g TS (Table 58).Maximum concentrations of the other pharmaceuticals in this class were substantially lower. Thestudy completed by Radjenović et al., (2009) indicated that gemfibrozil was not likely to beremoved by the anaerobic digestion process. No other data on removal efficiencies in biosolidstreatment processes were found.
3.4.9 Respiratory and Anti-Allergenic Pharmaceuticals
Antihistamine drugs are used to prevent the formation of histamine as a result of allergicreactions to triggers such as pollens and insect stings. Occurrence data in sludges and biosolidsare limited (Table 59) and generally focus on the compound diphenylhydramine. The dataprovided by Jones-Lepp and Stevens (2007) suggest the concentrations can be quite variable,although collectively the literature would indicate concentrations in the range of 100 to 1,000ng/g TS might be expected. The mean concentration of loratidine in primary sludge at 50 ng/g TS(Radjenović et al., 2009) was lower than those observed for diphenylhydramine.

CCME Final ReportESOCs in Biosolids: Concentrations and Effects of Treatment Processes Literature Review
Hydromantis, Inc., University of Waterloo and Trent University 58
Table 58. Concentrations of Blood-Modifying Pharmaceuticals in Sludges and Biosolids
Concentration (ng/g TS)Sludge Source
BezafibrateClofibricAcid Gemfibrozil Warfarin
Reference
Not specified (sludgesurvey) 214 (101)a 10.5 (9.9) U.S. EPA (2009)
Literature review nd - 1500 nd - 92Jones-Lepp andStevens (2007)
Literature review nd - 1190Harrison et al.(2006)
Unknown sludge (An urbanWWTP)
<LOQ -8.1 <LOQ - 3.4
Unknown sludge (A ruralWWTP) 18.3
Spongberg andWitter (2008)
Two treatment plant sludges <LOQ - 88<LOQ -64
Nieto et al.(2007)
Primary sludge 50±50b
Anaerobic digested sludge 140 ±80Radjenović et al.(2009)
nd = not detected LOQ = limit of quantitationa mean (median) (n=78) b mean ± standard deviation (n=2)
Table 59. Concentrations of Anti-Allergenic Pharmaceuticals in Sludges and Biosolids
Compound Sludge SourceConcentration(ng/g TS) Reference
Not specified (sludgesurvey) 871 (541)a U.S. EPA (2009)
Biosolids class A + sludge 15-7,000Jones-Lepp and Stevens(2007)
Waste activated sludge 150 ng/g OC
Diphenylhydramine
Dewatered sludge 170 ng/g OCKinney et al. (2006)
Loratidine Primary sludge 50±40b Radjenović et al. (2009)Not specified (sludgesurvey) 5.23 (5.29)a U.S. EPA (2009)
AlbuterolLiterature review
nd – 1,400Jones-Lepp and Stevens(2007)
a mean (median) (n=77) b mean ± standard deviation (n=2)OC = organic carbon
Although the anti-bronchospasm drug albuterol was found at relatively low concentrations of 5ng/g TS in the EPA’s TNSSS (Table 59), the literature review by Jones-Lepp and Stevens (2007)indicated much higher concentrations have been observed in sludges and biosolids.
Concentrations of the anti-allergenic drugs in treated biosolids are provided in Table 60.Concentrations of diphenylhydramine in the data provided by Kinney et al. (2006) are highlyvariable. As noted above, the sludge and biosolids occurrence data, concentrations of this drugare quite variable, and so it is not possible to determine of the different concentrations in the

CCME Final ReportESOCs in Biosolids: Concentrations and Effects of Treatment Processes Literature Review
Hydromantis, Inc., University of Waterloo and Trent University 59
processes result from the variability inherent in the sludge, or due to the process treatments. Thedata of Radjenović et al., (2009) for mean concentrations of loratidine in primary sludge (50 ng/gTS) and anaerobically digested sludge (160 ng/g TS) suggest that there is no reduction of thecompound during anaerobic digestion.
Table 60. Concentrations of Two Anti-Allergenics following Biosolids Treatment Processes
Compound Biosolids ProcessConcentration(ng/g TS) Reference
heat drying 2,900 ng/g OCcompost 32 – 550 ng/g OCair drying 810 ng/g OC
Diphenylhydramine
anaerobic digestion 22,000 ng/g OC
Kinney et al. (2006)
Loratidine anaerobic digestion 160 ± 40aRadjenović et al.(2009)
a mean ± standard deviation (n=2) OC = organic carbon
3.4.10 Anti-Parasitic and Anti-Fungal Pharmaceuticals
Anti-parasitic pharmaceuticals are used to control parasitic protozoa, helminths and other similarpathogens. The anti-fungal agent identified in the survey, miconazole, is used for treatingathlete’s foot, jock itch and vaginal yeast infections.
Occurrence data for these compounds were identified in two sources as indicated in Table 61. Ofthe three anti-parasitics identified in sludges in this review, carbadox was present at the highestconcentration with a median value on 103 ng/g TS. The median concentration of miconazole was207 ng/g TS. Considerable variability was associated with this substance in the survey as themean value is approximately six times the median value.
Table 61. Concentrations of Anti-Parasitics and Anti-Fungals in Sludges and Biosolids
Pharmaceutical Use Sludge SourceConcentration(ng/g TS)
Reference
CarbadoxAnti-parasitic
Not Specified (SludgeSurvey) 232 (103)a
OrmetoprimAnti-parasitic
Not Specified (SludgeSurvey) 4.16 (3.96)Not Specified (SludgeSurvey) 36.6 (16.5)
U.S. EPA (2009)
ThiabendazoleAnti-parasitic
Biosolids class A + sludge nd - 420Jones-Lepp andStevens (2007)
Not Specified (SludgeSurvey) 1,240 (207)
U.S. EPA (2009)
MiconazoleAnti-fungal
Biosolids class A + sludge nd - 460Jones-Lepp andStevens (2007)
a mean (median) (n=78) nd = not detected

CCME Final ReportESOCs in Biosolids: Concentrations and Effects of Treatment Processes Literature Review
Hydromantis, Inc., University of Waterloo and Trent University 60
3.4.11 Miscellaneous Pharmaceuticals
The drugs included here depart from the classification provided by Gielen (2007) due to thelimited number of compounds for each use or presence in sludges. Concentrations of thecompound salicylic acid were present at a wide range in the literature on sludges reviewed byHarrison et al. (2006) (Table 62). Cotinine is a metabolite of nicotine and is a marker of humanpresence in wastewaters and sludges. Digoxigenin is used to induce an immune system responsein humans. The median concentration of this marker compound, at 39.8 ng/g TS, was relativelylow in the EPA TNSSS, as was the median concentration of 19.9 ng/g TS for the ovulationinhibitor norgestimate.
No biosolids treatment data were found for these pharmaceuticals
Table 62. Concentrations of Miscellaneous Pharmaceuticals in Sludges and Biosolids
Compound Use/Presence Sludge sourceConcentration (ng/g TS) Reference
Digoxigeninsteroid immunohisto-chemical marker
Not specified (sludgesurvey)
57.2 (39.8) a
Norgestimate ovulation inhibitorNot specified (sludgesurvey) 27.5 (19.9)
U.S. EPA (2009)
Literature review0.002–13,740
Harrison et al.,(2006)
Unknown sludge (An urbanWWTP) <LOQ - 253Salicylic Acid skin-careUnknown sludge (A ruralWWTP) 253
Spongberg andWitter (2008)
Cotinine nicotine metaboliteNot specified (sludgesurvey) 58.0 (13.2) U.S. EPA (2009)
nd = not detected LOQ = limit of quantitationa mean (median) (n=78)
3.4.12 Section Summary
The pertinent points from the review of these pharmaceuticals in sludges and biosolids follow.1. There is a wide range of data available for the different pharmaceuticals that may be
present in sludges and biosolids. Some compounds like carbamazepine have been widelycharacterized, while others have only one or two references in the literature.
2. As a result of there being limited occurrence data for many pharmaceuticals, there areeven fewer data available investigating the reduction of these drugs in biosolids treatmentprocesses.
3. Anaerobic digestion is the treatment process for which most data on pharmaceuticalconcentrations prior to and after treatment have been recorded. Reduction of thecompounds appears to be highly specific to each class of pharmaceutical.

CCME Final ReportESOCs in Biosolids: Concentrations and Effects of Treatment Processes Literature Review
Hydromantis, Inc., University of Waterloo and Trent University 61
3.5 HORMONES AND STEROLS
3.5.1 Hormones
Compounds in this category include both natural and synthetic estrogens, and androgens whichclearly have an effect on the human endocrine system. The synthetic estrogens, used for birthcontrol and hormone replacement therapies, and the natural estrogens and androgens are excretedon a daily basis to sewage. Phytosterols are naturally occurring alcohols of steroids, and arepresent in vegetable oils used in cooking and salads. These can be ingested and excreted, or endup in household grey water during dish washing. The presence of the animal sterols in receivingwaters is typically viewed as a marker for sewage contamination. Environmental concerns arisingfrom this group of compounds is mostly focused on the synthetic estrogens, which have potencyorders of magnitude higher than the natural estrogens.
Natural and synthetic estrogens found most regularly in wastewater sludges are summarized inTable 63. Concentrations of these compounds in sludges are typically less than 50 ng/g TS,although in the U.S. EPA’s Targeted National Sewage Sludge Survey (TNSSS, U.S. EPA 2009)the concentration of the natural hormone estrone (E1) had a mean concentration of 106 ng/g TS.The data suggest that estrone (E1) is higher than most of the other common estrogeniccompounds. In an analysis of New Zealand Sludge, Gielen reported a mean value of 185 ng/g TSfor the synthetic hormone 17α-ethinylestradiol (EE2), however the standard deviation of themean was also very high indicating a wide spread of experimental values.
Table 63. Concentrations of Common Estrogenic Compounds in Sludges and Biosolids
Concentration (ng/g TS)Sludge Source 17α-ethinylestradiol
(EE2)17β-estradiol(E2)
Estriol(E3)
Estrone(E1)
Reference
Sludge Survey 24.9 (25)a 34.3 (21.5)38.7
(24.8)106 (51.2)
U.S. EPA(2009)
Return activatedsludge (2 plants)
nd nd nd - 17.5Tan et al.(2007)
Literature review <1.5 – 17 4.9 – 49 16 – 27.8Harrison etal. (2006)
Compost <5Waste activatedsludge (lit. review)
<5
Primary sludge (lit.review)
185 ± 185b
Gielen(2007)
Waste activatedsludge
3 1.7 7
Primary sludge <1.5 30 30Return activatedsludge <1.5 2.2 5.6
Andersen etal. (2003)
nd = not detecteda mean (median) (n=73-78) b mean ± standard deviation (number not specified)
There are other natural and synthetic estrogenic compounds present in biosolids as well as thoselisted in Table 63. Additional estrogens detected in sludges and biosolids in the EPA’s TNSSS

CCME Final ReportESOCs in Biosolids: Concentrations and Effects of Treatment Processes Literature Review
Hydromantis, Inc., University of Waterloo and Trent University 62
(EPA, 2009) are provided in Table 64. The concentration of the natural hormone progesteronewas the highest of the others observed, with a median concentration of 139 ng/g TS. The medianconcentrations of the other estrogens were less than 50 ng/g TS.
Table 64. Concentrations of Other Estrogenic Compounds in Sludges and Biosolids (U.S.EPA, 2009)
Natural and Synthetic estrogens Concentration (ng/g TS)17α-Dihydroequilin 20.6 (19.4) a
β-Estradiol 3-Benzoate 146.9 (23.2)Equilenin 16 (10.9)Equilin 34.8 (23)Mestranol (MEE2) 22.5 (21.4)Norethindrone 101 (22.3)Norgestrel 66.5 (42)Progesterone 323 (139)
a mean (median) (n= 73 to 78)
Removal of EstrogensThe effect of anaerobic digestion on the removal of the common estrogens in sludge has beeninvestigated by Carballa et al. (2006, 2007a). Data are summarised in Table 65.
Table 65. Effect of Anaerobic Digestion Conditions on Removal Efficiency of EstrogenicCompounds
Removal Efficiency (%)
AnaerobicTemperature
Condition Estrone (E1) +17β-estradiol(E2)
17α-ethinylestradiol(EE2)
Reference
Mesophilic SRT=20 d (85 ± 10)%a (85 ± 5)%Carballa et al.(2006)
Mesophilic SRT=30 d 70% 40%
Mesophilic SRT=20 d no data no data
Mesophilic SRT=10 d 95% 90%
Carballa et al.(2007a)
Thermophilic SRT=10 d (85 ± 5)% (75 ± 15)%Carballa et al.(2006)
Thermophilic SRT=20d 80% 35%
Thermophilic SRT=10 d no data no data
Thermophilic SRT=6 d 90% 90%
Carballa et al.(2007a)
Mesophilic Non-ozonated (90 ± 10)% (90 ±1)%
Mesophilic Ozonated (80±1)% (85 ±1)%
Thermophilic Non-ozonated (90 ± 1)% (90 ±1)%
Thermophilic Ozonated (88±1)% (85 ±1)%
Carballa et al.(2007b)
a mean ± standard deviation (n=2 or 3)
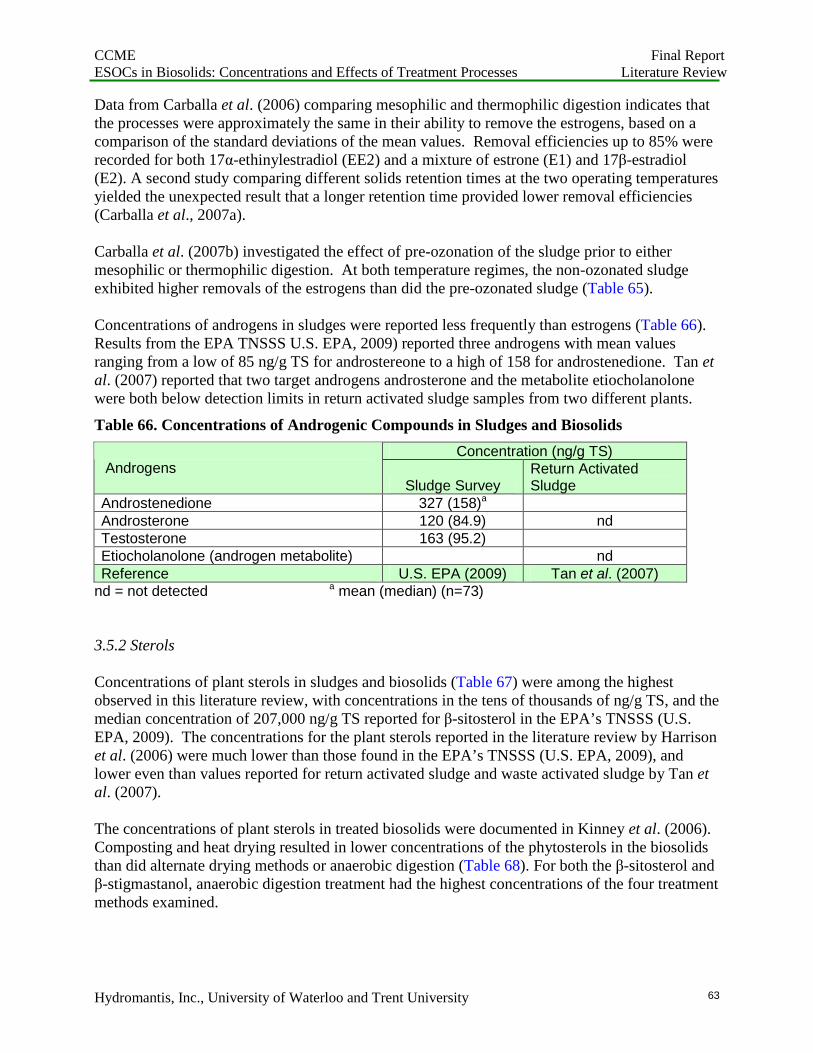
CCME Final ReportESOCs in Biosolids: Concentrations and Effects of Treatment Processes Literature Review
Hydromantis, Inc., University of Waterloo and Trent University 63
Data from Carballa et al. (2006) comparing mesophilic and thermophilic digestion indicates thatthe processes were approximately the same in their ability to remove the estrogens, based on acomparison of the standard deviations of the mean values. Removal efficiencies up to 85% wererecorded for both 17α-ethinylestradiol (EE2) and a mixture of estrone (E1) and 17β-estradiol(E2). A second study comparing different solids retention times at the two operating temperaturesyielded the unexpected result that a longer retention time provided lower removal efficiencies(Carballa et al., 2007a).
Carballa et al. (2007b) investigated the effect of pre-ozonation of the sludge prior to eithermesophilic or thermophilic digestion. At both temperature regimes, the non-ozonated sludgeexhibited higher removals of the estrogens than did the pre-ozonated sludge (Table 65).
Concentrations of androgens in sludges were reported less frequently than estrogens (Table 66).Results from the EPA TNSSS U.S. EPA, 2009) reported three androgens with mean valuesranging from a low of 85 ng/g TS for androstereone to a high of 158 for androstenedione. Tan etal. (2007) reported that two target androgens androsterone and the metabolite etiocholanolonewere both below detection limits in return activated sludge samples from two different plants.
Table 66. Concentrations of Androgenic Compounds in Sludges and Biosolids
Concentration (ng/g TS)Androgens
Sludge SurveyReturn ActivatedSludge
Androstenedione 327 (158)a
Androsterone 120 (84.9) ndTestosterone 163 (95.2)Etiocholanolone (androgen metabolite) ndReference U.S. EPA (2009) Tan et al. (2007)
nd = not detected a mean (median) (n=73)
3.5.2 Sterols
Concentrations of plant sterols in sludges and biosolids (Table 67) were among the highestobserved in this literature review, with concentrations in the tens of thousands of ng/g TS, and themedian concentration of 207,000 ng/g TS reported for β-sitosterol in the EPA’s TNSSS (U.S.EPA, 2009). The concentrations for the plant sterols reported in the literature review by Harrisonet al. (2006) were much lower than those found in the EPA’s TNSSS (U.S. EPA, 2009), andlower even than values reported for return activated sludge and waste activated sludge by Tan etal. (2007).
The concentrations of plant sterols in treated biosolids were documented in Kinney et al. (2006).Composting and heat drying resulted in lower concentrations of the phytosterols in the biosolidsthan did alternate drying methods or anaerobic digestion (Table 68). For both the β-sitosterol andβ-stigmastanol, anaerobic digestion treatment had the highest concentrations of the four treatmentmethods examined.

CCME Final ReportESOCs in Biosolids: Concentrations and Effects of Treatment Processes Literature Review
Hydromantis, Inc., University of Waterloo and Trent University 64
Table 67. Concentrations of Plant Sterols in Sludges and Biosolids
Concentration (ng/g TS) Concentration (ng/g OC)Compound
Literature reviewnot specified
Sludge Survey WAS DewateredCampestanol (5α+5β) 3,000 – 14,000Campesterol 6,300 100,900 (46,500)a
Desmosterol 15,650 (10,800)Ergosterol 19,830 (12,600)Sitostanol (5α-β+5β-β) 14,100 – 93,900Sitosterol (β-) 29,600 – 31,100 291,400 (207,000) 138,000 112,000Stigmastanol;β-Stigmastanol;Stigmastanol (5α+5β) 1,900 – 12,900 168,100 (62,500) 44,600 40,500Stigmasterol 6,700 321,200 (41,500)
ReferenceHarrison et al.(2006)
EPA (2009) Kinney et al. (2006)
a mean (median) (n=78) OC = organic carbon
Table 68. Concentrations of Plant Sterols following Biosolids Treatment Processes (Kinneyet al., 2006)
Concentration (ng/g OC)Biosolids treatment
Sitosterol (β-) Stigmastanol;Stigmastanol (5α+5β)
Heat drying 110,000 9,310Compost 50,800-200,000 2,760-17,400Air drying 257,000 113,000Anaerobic digestion 554,000 243,000
OC = organic carbon
Concentrations of the animal sterols reported in sludges varied substantially from one referenceor source to the next, but were in any case among the highest concentrations observed in thisreview, as shown in Table 69. The literature review of Harrison et al. (2006) reported the lowestconcentrations of the compounds, while the highest values were documented in the EPA’sTNSSS (U.S. EPA, 2009), with the fecal indicator 3β-coprostanol having a median concentrationof 827,000 ng/g TS. Concentrations of two animal sterols by Kinney et al. (2006) in wasteactivated sludge and dewatered sludge were intermediate between the EPA data and the reviewdata of Harrison et al. (2006).
Concentrations of animal sterols in biosolids treated by different processes are limited to twocompounds in the work by Kinney et al. (2006) (Table 70). The results are not consistent for thetwo compounds. The highest concentration of cholesterol was found in biosolids treated by heatdrying, whereas the highest concentration of 3β-coprostanol was observed following anaerobicdigestion. For both compounds, however, composting resulted in the lowest concentrations.

CCME Final ReportESOCs in Biosolids: Concentrations and Effects of Treatment Processes Literature Review
Hydromantis, Inc., University of Waterloo and Trent University 65
There are too few data to determine whether composting would produce the lowestconcentrations of these compounds.
Table 69. Concentrations of Animal Sterols in Sludges and Biosolids
Concentration (ng/g TS) Concentration (ng/g OC)Compound
Literature reviewNot specified(Sludge Survey)
Waste ActivatedSludge Dewatered
Cholestanol (5α-);Cholestanol 22,700
680,000 (187,200)a
Cholesterol 57,400 386,000 333,000Coprostanol;3β-Coprostanol 216,900
4,367,000(827,100) 355,000 325,000
Epicoprostanol1,703,000(108,000)
ReferenceHarrison et al.(2006) U.S. EPA (2009) Kinney et al. (2006)
a mean (median) (n=78) OC = organic carbon
Table 70. Concentrations of Animal Sterols following Biosolids Treatment Processes(Kinney et al., 2006)
Concentration (ng/g OC)
Biosolids treatmentCholesterol
Coprostanol;3β-Coprostanol
Heat Drying 402,000 221,000Compost 19,100-157,000 8,100-72,800Air Drying 236,000 126,000Anaerobic Digestion 209,000 1,460,000
3.5.3 Section Summary
The main points of interest in this section follow.1. The hormones 17α-ethinylestradiol (EE2), estrone (E1) and 17β-estradiol (E2) are among
the most frequently characterized compounds of this category in sludges and biosolids.Estrone (E1) is higher in concentration than the other common estrogenic compounds.
2. The concentration of the natural hormone progesterone was the highest of the otherhormones observed, with a median concentration of 139 ng/g TS.
3. Concentrations of androgens in sludges were reported less frequently than estrogens, withmedian concentration of three identified androgens from the EPA sludge survey rangingfrom 85 to 158 ng/g TS.
4. Concentrations of plant sterols in sludges and biosolids were among the highest observedin this literature review, with concentrations in the tens of thousands of ng/g TS.Composting and heat drying resulted in lower concentrations of the phytosterols in thebiosolids; anaerobic digestion treatment had the highest concentrations of the fourtreatment methods.

CCME Final ReportESOCs in Biosolids: Concentrations and Effects of Treatment Processes Literature Review
Hydromantis, Inc., University of Waterloo and Trent University 66
5. Concentrations of the animal sterols reported in sludges varied substantially from onereference or source to the next, but were in any case among the highest concentrationsobserved in this review.
6. Composting resulted in the lowest observed concentrations of both cholesterol and 3β-coprostanol in different biosolids treatment processes.
7. Removal efficiencies up to 85% were recorded for both 17α-ethinylestradiol (EE2) and amixture of estrone (E1) and 17β-estradiol (E2) in both thermophilic and mesophilicanaerobic digestion.
8. Removal efficiency data for hormones and sterols in other biosolids treatment processesare scarce.
3.6 PERSONAL CARE PRODUCTS
3.6.1 Introduction
In the Review of the State of Knowledge of Municipal Effluent Science and Research: Review ofEffluent Substances (Hydromantis et al., 2005), a number of different types of personal careproducts (PCP) were identified including synthetic musk fragrances, parabens (anti-microbialpreservatives), sunscreen agents and insect repellents. In the current literature review focusing onoccurrence and removal in biosolids, data were decidedly more limited. The informationretrieved has centred primarily on the presence of the anti-microbials and synthetic muskcompounds, with more limited data on fluorescent whitening agents, quaternary ammoniumcompounds and volatile methyl siloxanes.
3.6.2 Antimicrobials
Triclosan and triclocarban are compounds displaying antimicrobial activity against both gram-positive and gram-negative organisms, resulting in their use in an array of consumer productssuch as soaps, detergents and cosmetics (Heidler and Halden, 2007). Hexachlorophene is used asa topical anti-bacterial agent in soaps and some toothpastes.
As of October 2008, the U.S. EPA determined that triclosan did not pose a human health hazardwhen used as intended. Although it is anticipated to be immobile in soils, in the aquaticenvironment, however, EPA expressed concern that triclosan could bioaccumulate in organismsto levels posing a concern (U.S. EPA, 2008). Corresponding information for triclocarban is notavailable. According to IPCS (2009), hexachlorophene is acutely toxic to aquatic organisms, andbioaccumulation in the food chain can be expected. In humans, long term exposure toHexachlorophene may cause dermatitis, skin sensitization, while prolonged inhalation may causeasthma, and affect the nervous system. Tests with animal indicate it may cause deformation inbabies (IPCS, 2009).
Due to their use in personal care products, the antimicrobials are transferred to grey water as aresult of bathing, laundry and other domestic activities. At a wastewater treatment plant, thecompounds are likely to be either sorbed onto solids, biodegraded to some extent or discharged inthe treated effluent. As reported in the CCME Review of State of Knowledge of MunicipalEffluent Science and Research (Hydromantis et al., 2005), removal efficiency of triclosan by

CCME Final ReportESOCs in Biosolids: Concentrations and Effects of Treatment Processes Literature Review
Hydromantis, Inc., University of Waterloo and Trent University 67
treatment plants can be variable.
Lee and Peart (2002) assessed the concentrations of triclosan and hexachlorophene as two of asuite of ESOCs in Canadian sludges, both raw and digested biosolids (Table 71).
Table 71. Occurrence of Triclosan and Hexachlorophene in Canadian Municipal Sludges andBiosolids (Lee and Peart, 2002)
Municipal Treatment Plant and SludgeType
Triclosan(ng/g TS)
Hexachlorophene(ng/g TS)
Edmonton (Goldbar) Raw 14,800 102
Regina Raw 7,160 216
Adelaide Raw 3,430 308
Burlington Raw 8,900 797
Ottawa Raw 17,900 208
Toronto (Ashbridges Bay) Raw 10,600 138
Toronto (Highland Creek) Raw 17,100 502
Toronto (Humber) Raw 16,500 397
Toronto (North) Raw 12,500 181
Montreal (MUC-PSI) Raw 14,200 562
Quebec City Raw 6,100 113
Quebec City Raw 5,500 72.6
median raw 10,600 208
Vancouver Digested 8,410 477
Vancouver Digested 24,700 420
Calgary (Bonnybrook) Digested 12,800 371
Calgary (Fish Creek) Digested 19,500 218
Edmonton (Goldbar) Digested 22,000 285
Regina Digested 18,900 420
Saskatoon Digested 9,900 352
Saskatoon Digested 19,400 597
Burlington Digested 7,480 451
Galt Digested 28,200 421
Guelph Digested 16,200 727
Hamilton Digested 11,500 1,190
Ingersoll Digested 16,100 640
Kitchener Digested 18,600 254
Ottawa Digested 11,700 693
Waterloo Digested 8,840 311
Windsor Digested 20,300 548
Toronto (Ashbridges Bay) Digested 16,600 328
Toronto (Humber) Digested 5,400 572
Toronto (North) Digested 900 22.6
Granby Digested 1,920 68.7
Moncton Digested 7,530 701
Truro Digested 8,410 477
median digested 14,450 421

CCME Final ReportESOCs in Biosolids: Concentrations and Effects of Treatment Processes Literature Review
Hydromantis, Inc., University of Waterloo and Trent University 68
The median values of triclosan in raw sludge and digested biosolids were 10,600 and 14,450 ng/gTS, respectively, suggesting that there is no reduction of triclosan as a result of digestion.Similar results were observed for hexachlorophene, with median values in raw and digestedsludge samples of 208 and 421 ng/g TS, respectively. The highest concentrations of triclosan inraw sludge and digested biosolids were found in samples from Ottawa and Galt (ON) at 17,900and 28,200 ng/g TS, respectively. Digested sludge from the Toronto North facility had thelowest concentration of triclosan and hexachlorophene. The highest concentration ofhexachlorophene in raw sludge in this survey was in a sample from Burlington, ON, while thehighest concentration in digested biosolids was observed in a sample from Hamilton, ON.
Concentrations of triclosan in other sludge samples are provided in Table 72. A recent survey ofCanadian sludges by XCG Consultants (2007) reported concentrations of triclosan in a range of900 – 28,000 ng/g TS, with a median value of 13,000 ng/g TS. In four Ontario treatment plants,concentrations of Triclosan ranged between 680 and 11,550 ng/g TS. Concentrations reported inother publications were of a similar magnitude, between 3,200 and 42,000 ng/g TS.
Table 72. Concentration of Triclosan in Other Sludge and Biosolids Samples
Concentration (ng/g TS)Sludge Source
Range mean (median)Reference
Canadian sludge (1995-1998) 900 - 28,000 13,000 XCG (2007)
Treated Biosolids (4 Ontario plants) 680 – 11,550 Chu and Metcalfe (2007)
Mid-Atlantic U.S. plant 20,000 - 55,000 30,000 ± 11,000aHeidler and Halden(2007) (n=3)
Not specified (literature review) nd – 15,600 Harrison et al. (2006)dewatered anaerobically digested ordewatered secondary sludge (Greece)
190 – 9,850 3,210 (2,710)Stasinakis et al. (2008)(n=27)
Not specified (France) 41,900 ± 37,000
Ruel et al. (2008) (fromliterature database;number not specified)
Not specified (U.S. survey) 16,100 (3,860) U.S. EPA (2009) (n=78)nd = not detected a mean ± standard deviation
Biosolids treatment processes had no real discernible effect on reducing concentrations oftriclosan, as indicated in Table 73.
Table 73. Concentration of Triclosan following Biosolids Treatment Processes
Sludge Source Concentration (ng/g TS) ReferenceCompost-B 7,400Lime-A 4,700Heat treated-A 6,900Anaerobic digestion -A 5,200Anaerobic digestion -B 5,500Anaerobic digestion -E 3,600
LaGuardia et al. (2004)
Anaerobic Digested sludge 1,200 - 30,000 Heidler and Halden (2008 )
Anaerobic Digested Sludge 20,000 ± 18,000 a Halden (2007)a mean ± standard deviation
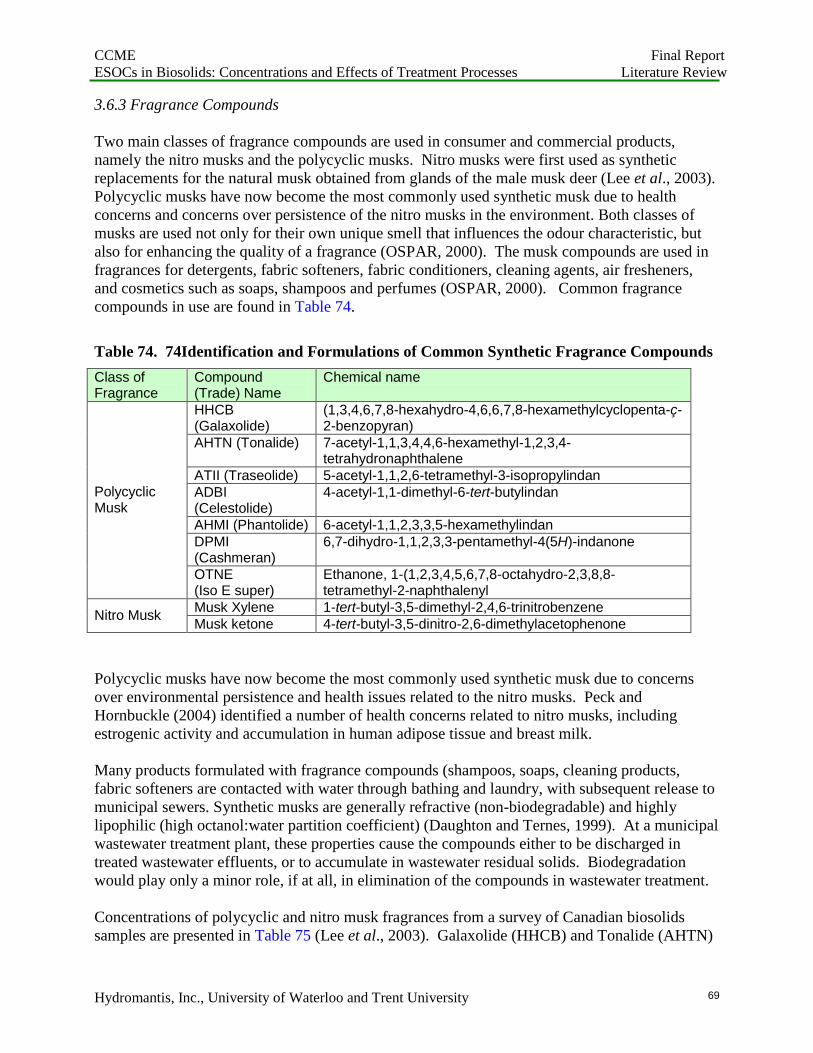
CCME Final ReportESOCs in Biosolids: Concentrations and Effects of Treatment Processes Literature Review
Hydromantis, Inc., University of Waterloo and Trent University 69
3.6.3 Fragrance Compounds
Two main classes of fragrance compounds are used in consumer and commercial products,namely the nitro musks and the polycyclic musks. Nitro musks were first used as syntheticreplacements for the natural musk obtained from glands of the male musk deer (Lee et al., 2003).Polycyclic musks have now become the most commonly used synthetic musk due to healthconcerns and concerns over persistence of the nitro musks in the environment. Both classes ofmusks are used not only for their own unique smell that influences the odour characteristic, butalso for enhancing the quality of a fragrance (OSPAR, 2000). The musk compounds are used infragrances for detergents, fabric softeners, fabric conditioners, cleaning agents, air fresheners,and cosmetics such as soaps, shampoos and perfumes (OSPAR, 2000). Common fragrancecompounds in use are found in Table 74.
Table 74. 74Identification and Formulations of Common Synthetic Fragrance Compounds
Class ofFragrance
Compound(Trade) Name
Chemical name
HHCB(Galaxolide)
(1,3,4,6,7,8-hexahydro-4,6,6,7,8-hexamethylcyclopenta-ç-2-benzopyran)
AHTN (Tonalide) 7-acetyl-1,1,3,4,4,6-hexamethyl-1,2,3,4-tetrahydronaphthalene
ATII (Traseolide) 5-acetyl-1,1,2,6-tetramethyl-3-isopropylindanADBI(Celestolide)
4-acetyl-1,1-dimethyl-6-tert-butylindan
AHMI (Phantolide) 6-acetyl-1,1,2,3,3,5-hexamethylindanDPMI(Cashmeran)
6,7-dihydro-1,1,2,3,3-pentamethyl-4(5H)-indanone
PolycyclicMusk
OTNE(Iso E super)
Ethanone, 1-(1,2,3,4,5,6,7,8-octahydro-2,3,8,8-tetramethyl-2-naphthalenyl
Musk Xylene 1-tert-butyl-3,5-dimethyl-2,4,6-trinitrobenzeneNitro Musk
Musk ketone 4-tert-butyl-3,5-dinitro-2,6-dimethylacetophenone
Polycyclic musks have now become the most commonly used synthetic musk due to concernsover environmental persistence and health issues related to the nitro musks. Peck andHornbuckle (2004) identified a number of health concerns related to nitro musks, includingestrogenic activity and accumulation in human adipose tissue and breast milk.
Many products formulated with fragrance compounds (shampoos, soaps, cleaning products,fabric softeners are contacted with water through bathing and laundry, with subsequent release tomunicipal sewers. Synthetic musks are generally refractive (non-biodegradable) and highlylipophilic (high octanol:water partition coefficient) (Daughton and Ternes, 1999). At a municipalwastewater treatment plant, these properties cause the compounds either to be discharged intreated wastewater effluents, or to accumulate in wastewater residual solids. Biodegradationwould play only a minor role, if at all, in elimination of the compounds in wastewater treatment.
Concentrations of polycyclic and nitro musk fragrances from a survey of Canadian biosolidssamples are presented in Table 75 (Lee et al., 2003). Galaxolide (HHCB) and Tonalide (AHTN)

CCME Final ReportESOCs in Biosolids: Concentrations and Effects of Treatment Processes Literature Review
Hydromantis, Inc., University of Waterloo and Trent University 70
were the two predominant polycyclic musks, with median concentrations in raw sludge samplesof 11,850 and 8,005 ng/g TS, respectively. Traesolide (ATII) was observed with a median valueof 1,345 ng/g TS, approximately an order of magnitude lower than the HHCB or AHTN. Theremaining two polycyclic musks investigated, Celestolide (ADBI) and Phantolide (AHDI orAHMI) were substantially lower at 175 and 110 ng/g TS, respectively. The highest concentrationof HHCB was in a digested biosolids sample from the Toronto Humber Wastewater TreatmentPlant, at 26,700 ng/g TS, while the highest for AHTN was 20,600 from the Calgary Bonnybrookfacility. With respect to the nitro musks analyzed, musk xylene was found at the highestconcentration, 422 ng/g TS, in a sample of raw sludge from Montreal, while musk ketone wasconsistently found at higher concentrations than musk xylene, particularly in the raw sludgesamples (median value of 144.5 ng/g TS).
Concentrations of the polycyclic musks increased from raw sludge to anaerobically digestedbiosolids, suggesting that no reduction was occurring to due anaerobic biodegradation.Anaerobic digestion had an apparent beneficial reduction of the nitro musk compounds withMusk ketone and Musk xylene having median concentrations of 4.5 and 3.3 ng/g TS, respectivelyin the digested biosolids samples (Lee et al., 2003).
Additional concentration data are provided in Table 76 for polycyclic musks and Table 77 fornitro musk compounds. Data provided by Smyth et al. (2007) are from a survey of fivewastewater treatment plants in the Grand River watershed of Ontario, while data provided byYang and Metcalfe (2005) are from the Peterborough, ON facility. Data compiled by Webberand Sidwha (2005) are a summary of the data of Lee et al. (2003) presented above in Table 75.The concentration profiles in Tables 76 and 77 follow those in Table 75. Of the polycyclicmusks, HHCB and AHTN were present at the highest concentrations, followed by ATII.Concentrations of ADBI and AHMI were of similar magnitude but much lower than the otherpolycyclic musks identified. The musk DPMI was not detected in the five Ontario plants testedby Smyth et al. (2007). Concentrations of the polycyclic musks from the Peterborough facility(Yang and Metcalfe, 2005) were substantially lower than those identified by Smyth et al. (2007)and Lee at al. (2003). It is not clear whether the differences in magnitude were due to differencesin site-specific inputs, differences in analytical procedures, or other unidentifiable factors.

CCME Final ReportESOCs in Biosolids: Concentrations and Effects of Treatment Processes Literature Review
Hydromantis, Inc., University of Waterloo and Trent University 71
Table 75. Fragrance Concentrations in Canadian Municipal Sludges (Lee et al., 2003)
Fragrance Concentration (ng/g TS)
Biosolids Source Galaxolide(HHCB)
Tonalide(AHTN)
Celestolide(ADBI)
Phantolide(AHDI orHMI)
Traesolide(ATII)
MuskXylene (MX)
Musk Ketone(MK)
Raw sludge (Adelaide) 4850 6150 170 <30 1270 33.2 142
Raw sludge (Toronto (North)) 21200 8710 220 730 2070 12.8 24.3
Raw sludge (Burlington) 15200 8650 230 120 1650 14.4 17.2
Raw sludge (Edmonton (Goldbar)) 6390 8060 130 110 1260 7.2 158
Raw sludge (Montreal (MUC-PSI)) 1340 5360 90 80 1000 422 191
Raw sludge (Ottawa) 13200 8650 180 90 1130 46.1 245
Raw sludge (Quebec City) 10500 7300 160 <30 1470 341 364
Raw sludge (Regina) 9070 7260 170 80 1190 144 347
Raw sludge (Saskatoon) 7480 7950 140 130 1360 4.2 94.6
Raw sludge (Toronto (Ashbridges Bay)) 21800 11000 230 110 2200 12.6 106
Raw sludge (Toronto (Humber)) 17400 7020 200 70 1330 20.3 147
Raw sludge (Toronto (Highland Creek)) 20900 10000 390 340 2100 17.6 36.7
Anaerobic digested (Burlington) 12000 8010 190 80 1360 3.3 3.7
Anaerobic digested (Calgary (Bonnybrook)) 20800 20600 570 130 4150 5.1 7.3
Anaerobic digested (Calgary (Fish Creek)) 18100 18500 480 180 3250 3.9 4.1
Anaerobic digested (Edmonton (Goldbar)) 17800 18600 350 150 3680 2.9 6.4
Anaerobic digested (Guelph) 14500 14900 350 130 2180 1.8 2.4
Anaerobic digested (Ingersoll) 4460 6270 160 60 1200 2.3 2.8
Anaerobic digested (Ottawa) 18800 16700 370 130 3080 2.7 4.9
Anaerobic digested (Regina) 12600 12000 320 120 1870 2 4.1
Anaerobic digested (Saskatoon) 8890 9440 180 110 1650 3.3 4.8
Anaerobic digested (Toronto (Ashbridges Bay)) 24300 12400 300 120 2290 13 8.3
Anaerobic digested (Toronto (Humber)) 26700 12300 310 110 1610 6.9 4.5
Digested sludge (Toronto (North)) 24500 12100 220 90 2330 3.8 7.2
Anaerobic digested (Vancouver) 9580 9050 260 60 1240 1.4 1.4
Anaerobic digested (Waterloo) 7340 12700 490 90 1810 2.9 2.2
Anaerobic digested (Windsor) 7810 9510 370 150 1380 3.4 36.7
Median concentration raw sludge 11850 8005 175 110 1345 18.95 144.5Median concentration anaerobic digestedbiosolids 14500 12300 320 120 1870 3.3 4.5
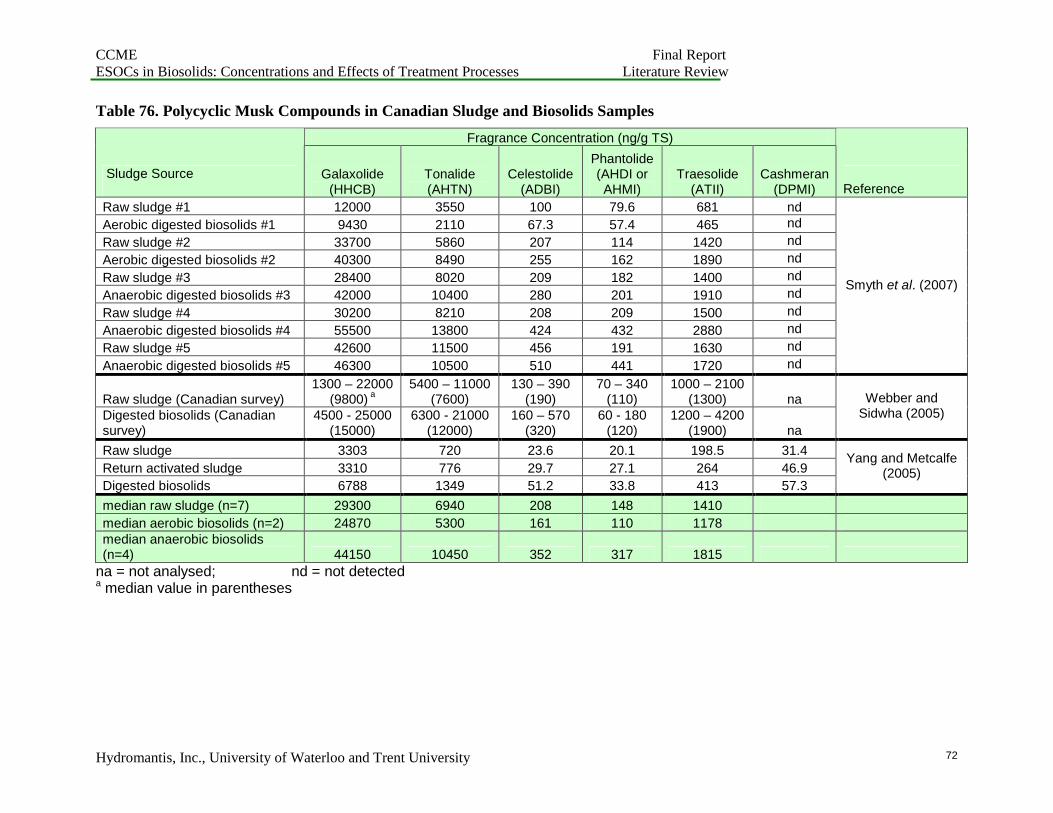
CCME Final ReportESOCs in Biosolids: Concentrations and Effects of Treatment Processes Literature Review
Hydromantis, Inc., University of Waterloo and Trent University 72
Table 76. Polycyclic Musk Compounds in Canadian Sludge and Biosolids Samples
Fragrance Concentration (ng/g TS)
Sludge Source Galaxolide(HHCB)
Tonalide(AHTN)
Celestolide(ADBI)
Phantolide(AHDI orAHMI)
Traesolide(ATII)
Cashmeran(DPMI) Reference
Raw sludge #1 12000 3550 100 79.6 681 nd
Aerobic digested biosolids #1 9430 2110 67.3 57.4 465 nd
Raw sludge #2 33700 5860 207 114 1420 nd
Aerobic digested biosolids #2 40300 8490 255 162 1890 nd
Raw sludge #3 28400 8020 209 182 1400 nd
Anaerobic digested biosolids #3 42000 10400 280 201 1910 nd
Raw sludge #4 30200 8210 208 209 1500 nd
Anaerobic digested biosolids #4 55500 13800 424 432 2880 nd
Raw sludge #5 42600 11500 456 191 1630 nd
Anaerobic digested biosolids #5 46300 10500 510 441 1720 nd
Smyth et al. (2007)
Raw sludge (Canadian survey)1300 – 22000
(9800)a
5400 – 11000(7600)
130 – 390(190)
70 – 340(110)
1000 – 2100(1300) na
Digested biosolids (Canadiansurvey)
4500 - 25000(15000)
6300 - 21000(12000)
160 – 570(320)
60 - 180(120)
1200 – 4200(1900) na
Webber andSidwha (2005)
Raw sludge 3303 720 23.6 20.1 198.5 31.4
Return activated sludge 3310 776 29.7 27.1 264 46.9
Digested biosolids 6788 1349 51.2 33.8 413 57.3
Yang and Metcalfe(2005)
median raw sludge (n=7) 29300 6940 208 148 1410
median aerobic biosolids (n=2) 24870 5300 161 110 1178median anaerobic biosolids(n=4) 44150 10450 352 317 1815
na = not analysed; nd = not detecteda median value in parentheses

CCME Final ReportESOCs in Biosolids: Concentrations and Effects of Treatment Processes Literature Review
Hydromantis, Inc., University of Waterloo and Trent University 73
Table 77. Nitro Musk Compounds in Canadian Sludge and Biosolids Samples
Fragrance Concentration (ng/g TS)
Sludge Source Musk Xylene(MX)
Musk Ketone(MK)
MuskAmbrette
(MA)
MuskMoskene
(MM)
MuskTibetene
(MT)Reference
Raw sludge #1 64.6 115 44 nd nd
Aerobic digested biosolids #1 18.9 45.3 31.3 nd nd
Raw sludge #2 96.9 290 nd 151 19.5
Aerobic digested biosolids #2 25.1 242 nd 6 67.2
Raw sludge #3 78.2 116 nd nd nd
Anaerobic digested biosolids #3 61 8.16 nd nd nd
Raw sludge #4 59.8 148 11.5 nd nd
Anaerobic digested biosolids #4 81.5 11.2 7.6 nd nd
Raw sludge #5 25 226 93.2 nd nd
Anaerobic digested biosolids #5 3.4 27.6 nd nd nd
Smyth et al. (2007)
Raw sludge (Canadian survey) 4 – 422 (16)a
17 – 364 (124)Digested biosolids (Canadiansurvey) 1 – 7 (3) 1 – 37 (5)
Webber andSidwha (2005)
Raw sludge 76.6 39.8 nd nd nd
Return activated sludge 115 73.1 nd nd nd
Digested biosolids 95.1 53 nd nd nd
Yang and Metcalfe(2005)
median raw sludge (n=7) 70.6 132
median aerobic biosolids (n=2) 22 143.7
median anaerobic biosolids (n=4) 71.25 19.4
nd = not detecteda median value in parentheses

CCME Final ReportESOCs in Biosolids: Concentrations and Effects of Treatment Processes Literature Review
Hydromantis, Inc., University of Waterloo and Trent University 74
As observed with the data of Lee et al. (2003), aerobic digestion resulted in a decrease in theconcentrations of the polycyclic musks in Table 76, whereas increased concentrations of thepolycyclic musks were observed following anaerobic digestion.
With respect to nitro musks, the data in Table 77 indicate that Musk ketone and Musk xylenewere the dominant compounds, with the Musk ketone present at the highest concentrations.Musk ambrette, Musk moskene and Musk tibetene were detected sporadically in the survey bySmyth et al. (2007), and were not detected in the Peterborough sludge samples by Yang andMetcalf (2005). Data in Table 77 used to estimate median concentrations present a confusingpicture, likely due to the limited sample sizes used for assessment. The evaluation indicated thatMusk xylene concentrations in raw sludge would be reduced by aerobic digestion, but wereessentially unchanged by anaerobic digestion. Conversely, it appeared that Musk ketone wouldbe reduced in concentration by anaerobic digestion of the raw sludge (in agreement with the datafrom Lee et al. (2003)), whereas aerobic treatment would result in a slight increase inconcentration.
Additional polycyclic musk concentration data from other biosolids samples are provided inTable 78. HHCB an AHTN are the most commonly characterized polycyclic musks in thesesamples. When other polycyclic musk data are presented, the concentrations are much lowerthan those reported for HHCB and AHTN.
In addition to the polycyclic and nitro musks identified above, a number of other fragrancecompounds have been identified. These are summarized in Table 79. Most of the additionalcompounds were identified in the literature survey of biosolids completed by Harrison et al.(2006).
Kinney et al. (2006) reported high levels of indole (maximum value of 7,000 ng/g OC) and d-limonene (maximum value of 744 ng/g OC) in samples of return activated sludge and dewateredsludge. Otherwise, with the exception of musk ketone, and its derivative, amino musk ketone,the maximum concentrations of the alternate fragrance compounds were less than 100 ng/g TS.

CCME Final ReportESOCs in Biosolids: Concentrations and Effects of Treatment Processes Literature Review
Hydromantis, Inc., University of Waterloo and Trent University 75
Table 78. Concentrations of Polycyclic Musk Compounds in Biosolids from Other Studies
Concentration (ng/g TS)
Biosolids Source Galaxolide(HHCB)
Tonalide(AHTN)
Celestolide(ADBI)
Phantolide(AHDI orAHMI)
Traesolide(ATII)
Cashmeran(DPMI)
Reference
Digested 26,000 4,000
Biosolids Class A 5,000-18,000 2,000-4,000
Biosolids Class B 10,000 3,000
Biosolids class A 13-177,000 78-427,000Jones-Lepp and Stevens(2007)
Waste activatedsludge 3,210 ng/g OC 15,900 ng/g OC
Dewatered sludge 3,150 ng/g OC 16,700 ng/g OC Kinney et al. (2006)
Digested sludge 3,068 - 6,788 1,525-1,349 Heidler and Halden (2008)
Not specified ND – 8,100 ND – 5,100 10–1,100 32–1,800 44–1,100 ND – 332 Harrison et al. (2006)
Unknown sludge(Germany)
4,300 – 13,000(8,900)
4,000 – 13,000(8300)
120 – 290(200)
Webber and Sidwha (2005)

CCME Final ReportESOCs in Biosolids: Concentrations and Effects of Treatment Processes Literature Review
Hydromantis, Inc., University of Waterloo and Trent University 76
Table 79. Concentrations of Other Fragrance Compounds in Biosolids
Concentration (ng/g TS) Concentration (ng/g OC)Fragrance Compound
Not specifiedUnknown sludge(Germany)
WasteActivated Dewatered
Musk Xylene (MX) ND – 32.5 <5
Musk Ketone (MK) ND – 1300 <10 – 60
Acetyl Cedrene 9.0 – 31.1
Amino Musk Ketone ND – 362Amino Musk Xylene(AMX) ND –31.5
Diphenyl Ether ND – 99.6
Galaxolide lactone 0.6 – 3.5
Hexyl salicylate Trace – 1.5 [52HexylcinnamicAldehyde (Alpha) 4.1Methyl ionone(gamma) 1.1 – 3.8
OTNE 7.3 – 30.7
D-Limonene 744 630
Indole 4,290 7,000
ReferenceHarrisonet al. (2006)
Webber andSidwha (2005)
Kinney et al. (2006)
Concentration data for fragrance compounds in four biosolids treatment processes, includingcomposting, lime treatment, heat drying, and anaerobic digestion are provided in Table 80(LaGuardia et al., 2004; Kinney et al., 2006).
Exceptionally high concentrations of HHCB and AHTN were observed in the anaerobicallydigested sample reported by Kinney et al. (2006). A heat-dried sludge sample reported byLaGuardia et al. (2004) had low concentrations of both HHCB and AHTN. In the study byKinney et al. (2006), the composted and heat dried samples exhibited lower concentrations of d-limonene than did sludges produced by other drying procedures or by anaerobic digestion. Indoleconcentrations suggested that there was no significant effect between processes on compoundreductions. There are insufficient data reported in the literature to determine the effectiveness ofthe different treatment processes for reductions of the compounds.
There are few data available on calculated removal efficiencies of fragrances during biosolidstreatment. Studies by Carballa et al. (2007a, 2007b) focusing on treatment using anaerobicdigestion are summarised in Table 81.

CCME Final ReportESOCs in Biosolids: Concentrations and Effects of Treatment Processes Literature Review
Hydromantis, Inc., University of Waterloo and Trent University 77
Table 80. Comparison of Fragrance Compound Concentrations in Biosolids TreatmentProcesses
Concentration (ng/g TS)TreatedBiosolids Galaxolide
(HHCB)Tonalide(AHTN) D-limonene Indole
Reference
Compost47-12,300(ng/g OC)
281-11,600(ng/g OC)
255-705(ng/g OC)
4,210-38,200(ng/g OC)
Kinney et al.(2006)
Compost-B 7,000 5,600
Lime-A 12,400 7,400
LaGuardia et al.(2004)
Heat dry3,900
(ng/g OC)11,000
(ng/g OC)520
(ng/g OC)20,700
(ng/g OC)Kinney et al.(2006)
Heat-A 1,100 400LaGuardia et al.(2004)
Air dry21,900
(ng/g OC)43,900
(ng/g OC)2,120
(ng/g OC)19,400
(ng/g OC)Anaerobicdigestion
554,000(ng/g OC)
1,340,000(ng/g OC)
3,340(ng/g OC)
21,300(ng/g OC)
Kinney et al.(2006)
Anaerobicdigestion -A 17,900 9,000Anaerobicdigestion –B 11,400 5,400Anaerobicdigestion –E 10,200 6,600
LaGuardia et al.(2004)
Table 81. Removal Efficiencies of Two Polycyclic Musks by Anaerobic Digestion (Carballaet al., 2007a)
Removal EfficiencyAnaerobic Sludge Type
Solids RetentionTime (d) Galaxolide (HHCB) Tonalide (AHTN)
30 60% 50%20 65% 60%mesophilic10 70% 62%
20 70% 75%10 75% 85%thermophilic
6 80% 80%Average (69 ± 9)% (63 ± 14)%
a mean ± standard deviation
The data presented in Table 81 are not intuitive, as they seem to indicate that the removalefficiencies decline as the solids retention time (SRT) in the digester increases. Typically longerSRT values provide greater time for acclimation and biodegradation to occur in a reactor. Ingeneral, the data indicate that removal efficiencies of the two polycyclic fragrances are similar,with HHCB being slightly more degradable than AHTN under mesophilic conditions. Removalefficiencies were nearly identical under thermophilic treatment.
Table 82 summarizes the effect of pre-ozonating sludge prior to anaerobic digestion under

CCME Final ReportESOCs in Biosolids: Concentrations and Effects of Treatment Processes Literature Review
Hydromantis, Inc., University of Waterloo and Trent University 78
mesophilic and thermophilic conditions (Carballa et al., 2007b). Under mesophilic conditions,pre-ozonation of the feed sludge had a positive influence on the removal efficiency of the twomusk compounds, with improvement of approximately 20 percentage points. In thermophilictreatment, the data appear to indicate that pre-ozonation resulted in lower removal efficienciesfor the two musks. The cause of lower removal following pre-ozonation is unclear.
Table 82. Effect of Pre-Ozonation on Anaerobic Digestion of Two Polycyclic Musks(Carballa et al., 2007b)
Removal EfficiencySludge Type
Operatingcondition and SRT
Galaxolide(HHCB)
Tonalide(AHTN)
anaerobic digestion - mesophilic Non-ozonated 20 d (65 ±5) a % (60 ± 5)%
anaerobic digestion - mesophilic Ozonated 20 d (85±0)% (82±2)%
anaerobic digestion - thermophilic Non-ozonated 10 d (78 ± 10)% (82 ± 1)%
anaerobic digestion - thermophilic Ozonated 10 d (69±2)% (30±3)%a mean ± standard deviation (n=2 or 3)
Studies conducted by Carballa et al. (2007a, 2007b) with spiked laboratory anaerobic reactorsindicate digestion results in reduced concentrations of the HHCB and AHTN. The laboratoryresults disagree with the field data compiled by Lee and Peart (2002), Smyth et al, (2007, andWebber and Sidwha (2005) and Yang and Metcalfe (2005).
3.6.4 Fluorescent Whitening Agents
Fluorescent whitening agents (FWAs) are chemicals used with textiles and papers to increase theappearance of whiteness by absorbing invisible ultraviolet light and re-emitting it in the blueregion of the visible spectrum. Concentrations of FWAs in sludge samples were reported in thesurvey of Harrison et al. (2006). The compound DAS 1 was observed to have the highest levelsin this class of compounds, with a maximum value of 112,000 ng/g TS (Table 83). The agentDSBP was present at approximately half the concentration of DAS 1, while the compound BLSwas an approximate order of magnitude lower than the DSBP levels.
Table 83. Concentration of Fluorescent Whitening Agents in Biosolids (Harrison et al.,2006)
FluorescentWhitening Agent Formulation
Concentration(ng/g TS)
BLS (4,4'-bis(4-chloro-3-sulfostyryl)-biphenyl) 5,400 – 5,500
DSBP (4,4'-bis(2-sulfostyryl)biphenyl) 31,000 – 50,000
DAS 1(4,4'-bis[(4-anilino-6-morpholino-1,3,5-triazin-2-yl)-amino]stilbene-2,2'-disulfonate) 86,000 – 112,000
No removal efficiency data for biosolids treatment processes were found for fluorescentwhitening agents

CCME Final ReportESOCs in Biosolids: Concentrations and Effects of Treatment Processes Literature Review
Hydromantis, Inc., University of Waterloo and Trent University 79
3.6.5 Quaternary Ammonium Compounds
Quaternary ammonium compounds represent an important class of cationic surface-active agentswhich are used in a variety of commercial products. They are associated with an anion, whichmay include either a halide salt (chloride, bromide, etc.), sulfate, carbonate, acetate, or nitrate.Quaternary ammonium compounds are generally classified as monoalkyltrimethyl ammoniumsalts, monoalkyldimethylbenzyl ammonium salts, and dialkyldimethyl ammonium salts (Petrilleand Werner, 1996).
Quaternary ammonium compounds have an extremely strong affinity for negatively chargedsubstrates. Their highly adsorptive properties make them suitable for a wide variety ofcommercial applications. They are used as agents in personal care products such as fabricsofteners, laundry detergents, anti-static sprays. In heavy industrial applications, they are used toenhance flotation properties in the mining industry, in asphalt and petroleum additives, and in themanufacturing of drilling muds. Other major uses include corrosion inhibitors,germicides/deodorizers, and biocides. Because of their germicidal and biocidal properties,quaternary ammonium compounds may be acutely toxic to specific aquatic organisms atconcentrations as low as 10 μg/L (Petrille and Werner, 1996). In Europe, the detergent industrybegan a voluntary phase-out of the QAC ditallowdimethylammonium chloride in the 1990s.
Concentrations of the QAC ditallowdimethylammonium cation (DDAC-C18) in theanaerobically digested biosolids of six Swiss wastewater treatment plants were documented byFernández et al (1996). Concentrations were high compared to other ESOCs, in the mg/g dryweight range corresponding to concentrations in the parts per thousand range. The intent of thestudy was to monitor the decline of the QAC following its substitution in laundry products in1991. In the base year of 1991, prior to the phase-out of the compound, the mean concentrationsin digested sludges from the six treatment plants ranged from 2.57 to 5.87 mg/g DS (Table 84).Over the span of three years, the mean concentration of the DDAC-C18 declined byapproximately 90% from 1991 levels. Because no concentration data were reported for thedigester feed sludge, it is not possible to determine the removal of this compound by anaerobicdigestion.
Table 84. Concentrations of the QAC Ditallowdimethylammonium Cation in AnaerobicallyDigested Biosolids from 6 Swiss Wastewater Treatment Plants (Fernández et al., 1996).
Conc’ns of Ditallowdimethylammonium Cation (mg/g TS) in Digested BiosolidsDate
Adliswil Niederglatt WinterthurZürich-Glatt
Zürich-Werdhölzli Mean Range
Feb,1991
5.87 0.39a
3.05 0.05
3.59 0.05
3.29 0.07
2.57 0.03
3.67 1.28
2.57-5.87
Nov,1992
1.51 0.09
0.73 0.07
0.87 0.03
0.94 0.07
0.73 0.06
0.96 0.32
0.73-1.51
Sept,1993
0.57 0.04
0.54
0.48 0.03
0.46 0.04
0.30 0.03
0.47 0.10
0.30-0.57
Sept,1994
0.30 0.02
0.15 0.02
0.15 0.03
0.28 0.01
0.15 0.01
0.21 0.08
0.15-0.30
a Mean + s.d. (n = 3 samples)

CCME Final ReportESOCs in Biosolids: Concentrations and Effects of Treatment Processes Literature Review
Hydromantis, Inc., University of Waterloo and Trent University 80
More recently, Martinez-Carballo et al. (2007) reported concentrations of several QACs insludges (type not revealed) from three Austrian wastewater treatment plants, collected duringtwo sampling campaigns in 2004. Total concentrations of all QACs ranged from 22 to 103mg/kg (ppm), which is similar in magnitude to the concentrations reported by Fernández et al(1996) in 1993 and 1994 (Table 84). The compound C18-chain DDAC(ditallowdimethylammonium cation), which was replaced in fabric softeners by the detergentindustry in the 1990s, continued to be the predominant species present, with a medianconcentration (n=6) of approximately 10 mg/kg DS. Other QACs at elevated concentrationsincluded C12-chain benzalkonium chloride (BAC-C12), C14-chain benzalkonium chloride(BAC-C14), and C10-chain DDAC (didecyldimethylammonium cation). The C16-chaintrialkylammonium chloride was also detected at elevated concentrations, ranging from 0.16-8.4mg/kg DS (Martinez-Carballo et al., 2007).
No other removal efficiency publications for QAC concentrations in biosolids and sludges wereidentified.
3.6.6 Siloxanes
Siloxanes are organic silicon polymers manufactured as additives that improve the properties ofpersonal care products such as cosmetics, shampoos and deodorants. Industrial applicationsinclude paper coatings and textile manufacturing. Their use is widespread due to beneficialproperties of low surface tension and water-repelling activity. Octamethylcyclotetrasiloxane (D4)and decamethylcyclopentasiloxane (D5) are the most common cyclical siloxanes found.
There are no human health-related issues identified with siloxanes. The compounds are describedas non-toxic (Appels et al., 2008). With respect to environmental concerns, siloxanes are notedfor their persistence in the aquatic environment and potential for harm to fish and other aquaticorganisms (Environment Canada, 2009c). To limit the amount of D4 and D5 that is released tothe environment, the Government of Canada proposed on January 30, 2009 to set a concentrationlimit for D4 and D5 in products and in the wastewater produced by the manufacturing process.
Siloxanes enter the wastewater system as a result of personal bathing and domestic householdwork. In wastewater treatment, physical-chemical properties of interest include readyvolatilization and hydrophobicity. The compounds are reportedly not biodegraded aerobically inthe activated sludge process (Appels et al., 2008). Consequently, at a treatment plant they tendto mostly sorb to solids (ending up in residual sludges) and to volatilize.
The main concern with these compounds results from the anaerobic digestion process, when thebiogas produced in the process is used for energy recovery in combined heat and powerapplications. In the digestion process, as the sludge biomass is broken down, the boundsiloxanes are released, with transfer to the biogas. When the digester gas is combusted toproduce useful energy, the organic part of the siloxanes is oxidized, leaving behind silicates andmicro-crystalline quartz, which strongly bond to the heated metal surfaces of the energy recoveryequipment. The deposits are highly abrasive and cause excessive wear to the moving parts of thecombustion chambers. Operating and maintenance costs can become very high for removal ofthe silica deposits.

CCME Final ReportESOCs in Biosolids: Concentrations and Effects of Treatment Processes Literature Review
Hydromantis, Inc., University of Waterloo and Trent University 81
Modeling of octamethylcyclotetrasiloxane (D4) in wastewater treatment plants was employed byMueller et al. (1995) to estimate the potential adverse effect of D4 in treated sewage effluents naquatic organisms. Based on an estimated influent wastewater concentration of 150 μg/L, thepredicted concentration in the treated effluent ranged from 0.39 to 0.44 μg/L, which wassubstantially lower than the reported lowest chronic no effect concentration of 4.4 μg/L foraquatic organisms.
Concentrations of siloxanes in sludges and biosolids are poorly documented, due the primaryconcern over their presence in biogas. A publication by Mueller et al. (1995) provided reportedoctamethylcyclotetrasiloxane (D4) concentrations in dewatered “sludge” cakes ranging from0.21 to 0.48 mg/kg TS, while the concentration of D4 in a sample of secondary sludge was lessthan 0.21 mg/kg TS. Dewil et al. (2007) reported concentrations of siloxanes in waste activatedsludges in the U.K. up to 0.03g/g TS (i.e. 3% by weight), reinforcing the importance of sorptionas a transfer mechanism from the liquid to the solid phase.
Watts et al. (1995) investigated the effect of linear polydimethylsiloxanes on biosolids treatmentprocesses. Aerobic digesters loaded with sludge at concentrations up to 10,000 mg PDMS/kgDS (10,000 ppm) exhibited pH values, oxygen uptake rates and mixed liquor solidsconcentrations identical to control reactors. In anaerobic digesters loaded with sludge atconcentrations up to 10,000 mg PDMS/kg DS, pH, suspended solids concentrations and biogasproduction rates were virtually identical to values in control digesters. The compounds werethus concluded to be inert to wastewater treatment.
Removal of the predominant siloxanes octamethylcyclotetrasiloxane (D4) anddecamethylcyclopentasiloxane (D5) by chemical oxidants in spiked laboratory-scale wasteactivated sludge tests was examined by Appels et al. (2008). The oxidants examined includedFenton’s reagent (hydrogen peroxide in the presence of iron salts), peroxymonosulphate (POMS)and dimethyldioxirane (DMDO). Results are presented in Table 85.
Table 85. Removal of Siloxanes D4 and D5 by Chemical Oxidation (Appels et al., 2008)
Percent Reduction by Dosage (%)
Chemical OxidantDosage
Rateoctamethylcyclotetrasiloxane
(D4)decamethylcyclopentasiloxane
(D5)
15 20% 26%25 29% 37%35 38% 40%
Fenton’s ReagentH2O2
dosage (g/kg DS) 50 48% 43%
5 20% 25%15 36% 29%30 36% 38%
Peroxymonosulphate(POMS)
dosage (g/kg DS) 60 38% 42%
55 17% 43%165 48% 45%330 72% 47%
Dimethyldioxirane(DMDO)
dosage (mL/kg DS) 660 85% 48%

CCME Final ReportESOCs in Biosolids: Concentrations and Effects of Treatment Processes Literature Review
Hydromantis, Inc., University of Waterloo and Trent University 82
Removal efficiencies of D4 and D5 were typically in the 40% to 50% range for the oxidants atthe highest dose rates applied, although the DMDO appeared to result in a substantially betterreduction of D4 at the two highest doses, reaching an 85% reduction efficiency at a dose rate of660 mL of DMDO per kg DS.
No other removal efficiency publications for siloxane concentrations in biosolids and sludgeswere identified.
3.6.7 Section Summary
Important points regarding personal care products in sludges are as follows.1. Triclosan is found in sludge and biosolids samples at a concentration approximately an
order of magnitude higher than is hexachlorophene.2. Concentration data for triclocarban in sludges and biosolids are extremely sparse.3. There is no apparent reduction of triclosan by anaerobic digestion or other biosolids
treatment processes such as composting, lime addition or heat treatment.4. Polycyclic musks are present at higher concentrations than nitro musks.5. HHCB and AHTN are the predominant polycyclic musks, followed by ATII.6. The two main nitro musks identified in sludge samples were Musk ketone and Musk
xylene.7. Full-scale anaerobic digestion does not appear to reduce concentrations of polycyclic
musks in sludges, with concentrations in the digested biosolids higher than in the rawsludge. Laboratory spiked studies indicate reduction in AHTN and HHCB concentrationsare possible.
8. Aerobic treatment conversely, appears to cause a reduction in concentrations ofpolycyclic musks.
9. Documentation of the occurrence of the quaternary ammonium compounds in sludgesand biosolids is limited, but reported concentrations of the compounds are significantlyhigher than for many of the other types of ESOCs.
10. Occurrence and concentrations of siloxanes in sludges and biosolids are poorlydocumented.
11. There are insufficient data reported in the literature to determine the effectiveness of thedifferent biosolids treatment processes for reductions of the personal care products.
3.7 METALS AND METALLOIDS
3.7.1 Introduction
Concentrations of metals in sludges and biosolids have been of concern for decades because ofthe use of biosolids as a soil amendment in agriculture and silviculture, as well as in recreationaluses in parks and golf courses. Concentrations of metals have been reported and have been welldocumented in other surveys dating back to the early 1970s (e.g., Leeper, 1972; Page 1974) andlater in the 1980s and 1990s (e.g., Monteith, 1987, Canviro Consultants Ltd. 1988; Webber andNichols, 1995) and more recently (XCG, 2007). Reported concentrations of the most commonmetals and elements are typically in the mg/kg (ppm) range. The intent of this review is not toduplicate these earlier efforts given the project schedule, but to retrieve and expand the body of

CCME Final ReportESOCs in Biosolids: Concentrations and Effects of Treatment Processes Literature Review
Hydromantis, Inc., University of Waterloo and Trent University 83
literature in a limited review of more recent data.
The substances included in this review include a number of elements that include both metalsand metalloids, such as arsenic and selenium, which will be referred to as “metals” forsimplicity. Metals accumulate in sludges at wastewater treatment when they are discharged bydomestic and industrial sources. Aluminum and selenium are present in personal care products.Copper, lead and zinc can enter wastewater from plumbing. Concerns with the metals inbiosolids are related to their potential uptake by agricultural crops or foraging animals. Becauseof the diversity of the metals in this class of contaminants, concerns with respect to human healthcan be varied. Mercury, cadmium and lead are neurotoxins for example, while cadmium has alsobeen linked to kidney disease.
3.7.2 Occurrence Data
A comprehensive survey of concentrations of metals in the U.S. was recently released by theEPA (2009) in the Targeted National Sewage Sludge Survey (TNSSS) report. Concentrationsfrom this and other recent surveys are presented in Table 86. The EPA survey provides a list ofboth commonly reported metals and those that are less well documented. The data provided inTable 86for the rows of metals below selenium are not as reported in the source table from theEPA (2009) report (Table B-7). In comparison with that report’s Table B-6, the values of TableB-7 have been shifted by one row (Stevens, 2009). The effect is that in Table B-7, the reportedconcentration for thallium is almost two orders of magnitude higher than that for sodium, and theconcentration of zinc is less than those for the uncommon elements vanadium and yttrium. As aresult, the values from Table B-7 following selenium by row have been shifted upwards by onerow for compiling in Table 86 and the value for zinc, which is then missing, was taken as thevalue reported as “Aggregated Data” in Table B-6 of the EPA (2009) report.
Concentrations of metals common to the three surveys provided in Table 86 are relativelyconsistent, on an order of magnitude basis, between the three studies. In the TNSSS, (U.S. EPA,2009), aluminum and iron are present at the highest concentrations because they are metalsfrequently used as flocculants and precipitants for phosphorus in wastewater treatment. Zinc andcopper are among the next highest concentrations, at median concentrations of 764 and 446mg/kg respectively. Data provided by Perron and Hébert (2007) for sludges from 14 mechanicaltreatment facilities in Québec and by Ruel et al. (2008) for a chemically-assisted primary sludgeare in agreement with zinc and copper present at the highest concentrations of the metalsanalysed. Zinc and copper were not among the metals in sludges reported by XCG (2007), inwhich the metals with the highest concentrations were chromium and lead. In the EPA (2009)report, the median concentration of mercury (0.83 mg/kg TS) is higher than for the lessfrequently reported beryllium and thallium 0.27 and 0.13 mg/kg TS, respectively.) Theconcentration data from the 14 Quebec treatment plants (Perron and Hébert, 2007) aresubstantially lower than concentrations for the same metals reported by the EPA (2009).
3.7.3 Organotin Compounds
Concentrations of organotin compounds in sludges have received some attention because of theirtoxic properties to aquatic organisms. Table 87 provides concentration data for organotin

CCME Final ReportESOCs in Biosolids: Concentrations and Effects of Treatment Processes Literature Review
Hydromantis, Inc., University of Waterloo and Trent University 84
Table 86. Concentrations of Metals in Sewage Sludges and Biosolids.
Concentration (mg/kg TS)
Metal/Metalloidsewage sludgesurvey
Mean of 14Quebecmechanical plants(2002-2006)
17 Canadiansludges(1995-1998)
anaerobicdigestion,limed, drying
Aluminum (Al) 13,480 (11,200)a
Antimony (Sb) 2.26 (1.42)Arsenic (As) 6.76 (4.95) 4.3 0.6 - 4 (2)b not reportedBarium (Ba) 572 (452)Beryllium (Be) 0.38 (0.27)Cadmium (Cd) 2.48 (1.72) 1.2 0.2 – 13 (5) 3.5 ± 21c
Chromium (Cr) 78.2 (30.6) 33 15 – 1,800 (82) 43.2 ± 38Cobalt (Co) 11.0 (4.44) 7.9Copper (Cu) 559 (449) 521 335 ± 338Iron (Fe) 24,740 (13,250)Lead (Pb) 74.0 (44.4) 29 4.6 – 186 (75) 71 ± 70Mercury (Hg) 1.27 (0.83) 0.9 0.5 - 5 (2.6) 3 ± 2.3Molybdenum (Mo) 15 (11) 6.9Nickel (Ni) 47.4 (22.8) 34 8 – 68 (36) 28.6 ± 38Selenium (Se) 7.1 (6.2) 2Silver (Ag) 31 (22)Thallium (Th) 0.17 (0.13)Tin (Sn) 43.5 (36.2)Titanium (Ti) 221 (80.9)Vanadium (V) 33.9 (11.6)Yttrium (Y) 4.55 (3.54)Zinc (Zn) 970 (764) 392 875 ± 1005
Reference EPA (2009)Perron and Hébert
(2007)Webber and
Nichols (1995)Ruel et al.
(2008)a mean (median) (n=74) b range (median)c mean ± standard deviation (literature survey, number not specified)for cells in grey shading see text above for explanatory note
Table 87. Concentrations of Organotin Compounds in Sludges
Concentration (mg/kg TS)Organotincompound
Survey 25Swiss plants Literature
Raw sludge(16 results)
Digested sludge(18 results)
Triphenyltin 0.50 0.04 - 3.4 not reported not reported
Tributyltin 1.1 0.1 - 3.4 0.014 – 0.176 (0.095)a 0.072 – 0.502 (0.111)Dibutyltin 1.5 0.04 - 4.8 0.076 – 0.336 (0.146) 0.098 – 0.424 (0.264)Monobutyltin 0.5 0.02 – 6.9 0.113 – 0.205 (0.144) 0.211 – 0.357 (0.254)Total butyltin not reported not
reported0.240 – 0.524 (0.388) 0.424 – 1.080 (0.616)
Reference Fent (1996) Webber and Sidwha (2005)a range (median)

CCME Final ReportESOCs in Biosolids: Concentrations and Effects of Treatment Processes Literature Review
Hydromantis, Inc., University of Waterloo and Trent University 85
compounds from two publications. Concentrations of the organtins in the earlier literatureprovided by Fent (1996) are higher than those reported in Webber and Sidwha (2005) for datafrom the North Toronto plant. In the Toronto data, the monobutyltin and dibutyltin appear to bepresent at a slightly higher concentration than tributyltin. The data of Fent (1996) include thecompound triphenyltin, present at concentrations similar to the butyltin compounds. The surveyof sludges by Ruel et al. (2008) listed a concentration of tribute tin as 0.09 ± 0.05 mg/kg TS,which is similar to the values presented by Webber and Sidwha (2005), but lower than those ofFent (1996).
The data of Webber and Sidwha (2005) comparing the butyltins in raw and digested sludgesform the North Toronto plant indicate that the compounds are not reduced by anaerobicdegradation. Conversely, Fent (1996) identified that some biodegradation of tributyltin waspossible (up to a maximum of 30%) based on laboratory studies of aerobic and anaerobicdigestion under both mesophilic and thermophilic conditions.
3.7.4 Section Summary
The main points of interest from this survey follow.1. The concentration database for metals and metalloids is limited because this review was
focused on data from the year 2000 on, and much of the documented research on metalsoccurred previously.
2. After iron and aluminum, the metals of highest concentration are zinc and copper, twometals commonly used in household plumbing.
3. There are few data characterizing concentrations of elements such as beryllium, thallium,antimony, titanium, and vanadium in biosolids.
4. Organotin compounds are present in sludges at low concentrations of less than 1 mg/kgTS (less than 1,000 ng/g TS).
5. Limited data suggest the organotin compounds are not reduced in concentration byanaerobic digestion.
3.8 OTHER SUBSTANCES
3.8.1 Introduction
This section brings together compounds which were not readily included in the previoussections. The major groupings include polyaromatic hydrocarbons (PAHs) and polychlorinatedpolyaromatic compounds (biphenyls (PCBs); dibenzofurans (PCDFs); and dibenzo-p-dioxins(PCDDs).
PAHs are a product of carbon combustion, and enter the environment from volcanoes, forestfires, residential wood burning, and exhaust from automobiles and trucks (NRCC, 1983).Atmospheric deposition, and road oils and exhaust particulates are thus major routes towastewater treatment via combined sewers. Food cooked at high temperatures (e.g., grilling ofbarbecuing) may also produce PAHs, which may then be discharged with dishwater. PCBs wereonce widely used in a variety of products such as electrical transformer fluids, but their

CCME Final ReportESOCs in Biosolids: Concentrations and Effects of Treatment Processes Literature Review
Hydromantis, Inc., University of Waterloo and Trent University 86
manufacture and use have been phased out. PCDDs and PCDFs result from combustion ofproducts consisting of chlorinated organics (e.g. polyvinyl chloride plastics) and as a by-productof pentachlorophenol production. Atmospheric deposition of these chlorinated substances islikely a major contributor in wastewater treatment. Health concerns related to the PAH andpolychlorinated polyaromatic classes of compounds are as potential human carcinogens.
As with certain other groups of contaminants reviewed herein, the PAHs and polychlorinatedaromatic compounds have received considerable attention in past reviews (e.g. CanviroConsultants, 1988) and thus this section is intended to provide a more recent update on thesecompounds.
3.8.2 Polyaromatic Hydrocarbons
Concentrations of the PAHs in sludges are provided in Table 88. Based on the survey ofCanadian sludges (XCG, 2007), these compounds have median concentrations typically lying inthe range of 100 to 1500 ng/g TS. The simplest PAHs, naphthalene and phenanthrene, consistingof two and three fused benzene rings, respectively, have the highest median concentrations of thePAHs in the Canadian survey (XCG, 2007) at 2,700 (phenanthrene) and 1,500 (naphthalene)ng/g TS. The literature review of Harrison et al. (2006) demonstrated that the maximumconcentrations of the PAHs could be higher than those summarized by XCG (2007), with theupper range of naphthalene, methylnaphthalene isomers and benzo(a)anthracene at or above100,000 ng/g TS. The U.S. EPA’s TNSSS (EPA, 2009) included only two PAHs on its list oftarget analytes. Median concentrations of benzo(a)pyrene and 2-methylnaphthlene were 302 and200 ng/g TS, respectively. Concentrations of four PAHs reported by Kinney et al. (2006) inwaste activated sludge and dewatered sludge were less than 200 ng/g organic carbon.
Concentrations of PAHs following biosolids treatment processes were provided by Kinney et al.(2006) and appear in Table 89. For the lower molecular weight PAHs anthracene andphenanthrene, composted and air dried biosolids have apparent lower concentrations thanbiosolids produced by heat drying or after anaerobic digestion. This trend did not follow throughin the two higher molecular weight PAHs fluoranthene and pyrene, for which there was nodiscernible difference between composting air drying and heat drying. The anaerobic digestedsludge had the highest concentrations of the four PAHs examined. There are too few data todetermine whether anaerobic digestion is the least effective biosolids treatment for reduction ofPAHs.
3.8.3 Polychlorinated Polyaromatics
Concentrations of PCBs, PCDDs and PCDFs in sludges are summarized in Table 90 in twodifferent units of expression. Some reports list the PCDDs and PCDFs in terms of toxicequivalents of the 2,3,7,8-tetrachlorodibenzo-p-dioxin, the most toxic congener of this class ofcompounds. For the literature surveyed, the range and means reported from different countriesappear to be very similar, with mean values in the range of 0.020 ng TEQ/g TS. More recent datafrom Québec and Ontario (unpublished) indicate a median of 0.008 ng TEQ/g TS for land appliedbiosolids. Concentrations of the PCDDs and PCDFs as total congener concentrations weredocumented by XCG (2007), with mean values of the total congeners at least an order ofmagnitude higher than the TEQ-based concentrations.
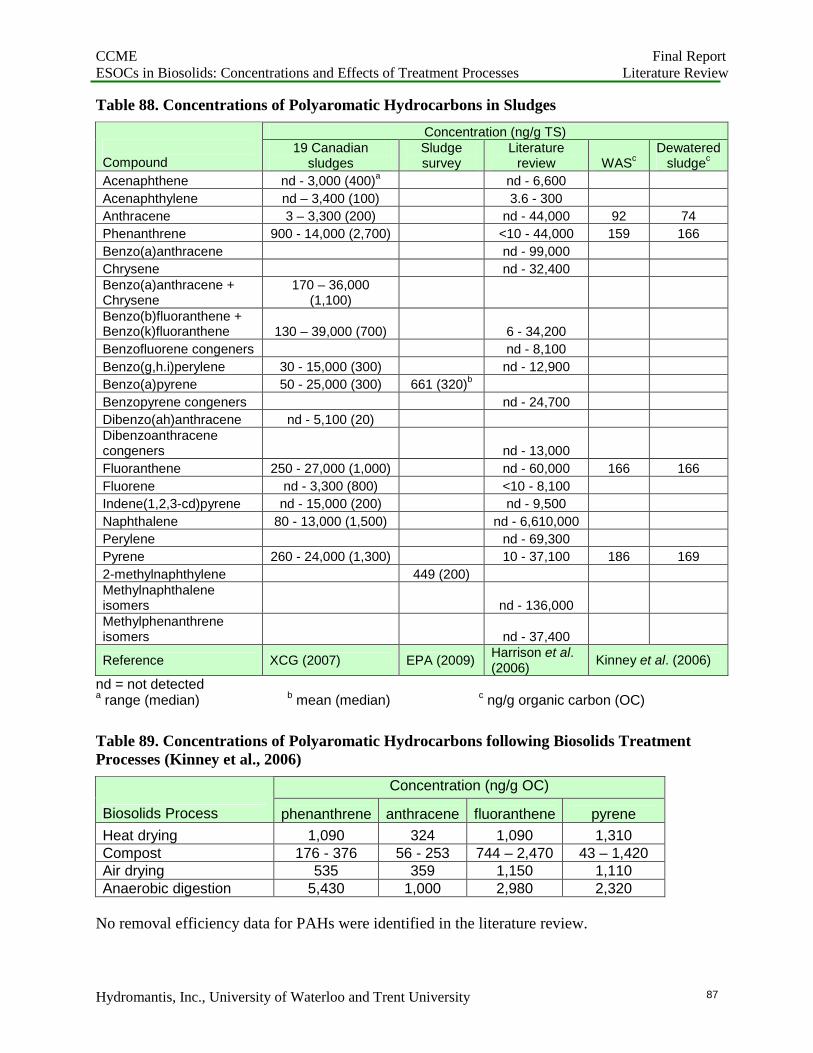
CCME Final ReportESOCs in Biosolids: Concentrations and Effects of Treatment Processes Literature Review
Hydromantis, Inc., University of Waterloo and Trent University 87
Table 88. Concentrations of Polyaromatic Hydrocarbons in Sludges
Concentration (ng/g TS)
Compound19 Canadian
sludgesSludgesurvey
Literaturereview WAS
cDewatered
sludgec
Acenaphthene nd - 3,000 (400)a
nd - 6,600
Acenaphthylene nd – 3,400 (100) 3.6 - 300
Anthracene 3 – 3,300 (200) nd - 44,000 92 74
Phenanthrene 900 - 14,000 (2,700) <10 - 44,000 159 166
Benzo(a)anthracene nd - 99,000
Chrysene nd - 32,400Benzo(a)anthracene +Chrysene
170 – 36,000(1,100)
Benzo(b)fluoranthene +Benzo(k)fluoranthene 130 – 39,000 (700) 6 - 34,200
Benzofluorene congeners nd - 8,100
Benzo(g,h.i)perylene 30 - 15,000 (300) nd - 12,900
Benzo(a)pyrene 50 - 25,000 (300) 661 (320)b
Benzopyrene congeners nd - 24,700
Dibenzo(ah)anthracene nd - 5,100 (20)Dibenzoanthracenecongeners nd - 13,000
Fluoranthene 250 - 27,000 (1,000) nd - 60,000 166 166
Fluorene nd - 3,300 (800) <10 - 8,100
Indene(1,2,3-cd)pyrene nd - 15,000 (200) nd - 9,500
Naphthalene 80 - 13,000 (1,500) nd - 6,610,000
Perylene nd - 69,300
Pyrene 260 - 24,000 (1,300) 10 - 37,100 186 169
2-methylnaphthylene 449 (200)Methylnaphthaleneisomers nd - 136,000Methylphenanthreneisomers nd - 37,400
Reference XCG (2007) EPA (2009)Harrison et al.(2006)
Kinney et al. (2006)
nd = not detecteda range (median) b mean (median) c ng/g organic carbon (OC)
Table 89. Concentrations of Polyaromatic Hydrocarbons following Biosolids TreatmentProcesses (Kinney et al., 2006)
Concentration (ng/g OC)
Biosolids Process phenanthrene anthracene fluoranthene pyrene
Heat drying 1,090 324 1,090 1,310Compost 176 - 376 56 - 253 744 – 2,470 43 – 1,420Air drying 535 359 1,150 1,110Anaerobic digestion 5,430 1,000 2,980 2,320
No removal efficiency data for PAHs were identified in the literature review.

CCME Final ReportESOCs in Biosolids: Concentrations and Effects of Treatment Processes Literature Review
Hydromantis, Inc., University of Waterloo and Trent University 88
Table 90. Concentrations of Polychlorinated Polyaromatics in Sludges
Concentration (ng TEQ/g TS) Concentration (ng/g TS)
Sludge Source
PolychlorinatedDibenzo-p-Dioxins and Furans
(PCDD/Fs)
TotalPolychlorinated
Dibenzo-p-Dioxins (PCDD)
TotalPolychlorinatedDibenzofurans
(PCDFs)
Total PolychlorinatedBiphenyls(PCBs)
Denmark sludge(not specified)
0.0007 - 0.055(0.021)a
0.010 - 0.034(no mean) a
Germanybiosolids(anaerobicdigested)
0.0007 - 1.21(0.020 - 0.040)
no range(0.019)
Germany sludge(not specified)
154 - 340
Spain biosolids(anaerobicdigested)
no range(0.064)
UK sludge(not specified)
0.009 - 0.192(no mean)
Austria(not specified)
0.008 - 0.038(0.015)
Sweden sludge(not specified)
0.00002 - 0.115(0.020)
0.0057 - 0.115(no mean)
0.6 - 232(113)
Norway sludge(not specified)
17 - 100(42) a
Canadian sludge(1995-1998)
0.004 – 0.12(0.022) a
1.1 - 22(4.1) a
0.07 – 4.2(0.7) a
nd – 2,027(345) a
ReferenceJaganyi (2007)
Langenkampet al. (2001)
XCG (2007) XCG (2007)Jaganyi(2007)
a range (mean) nd = not detected

CCME Final ReportESOCs in Biosolids: Concentrations and Effects of Treatment Processes Literature Review
Hydromantis, Inc., University of Waterloo and Trent University 89
For the PCB data summarized by XCG (2007), the upper end of the concentration range, at 2,027ng/g TS, is substantially higher than the maximum values reported in sludges from Europeancountries. The mean concentration likewise is higher in the XCG (2007) report than for thesludges from Norway, Sweden and Germany as documented by Jaganyi (2007).
3.8.4 Section Summary
The main points of interest from this section follow.1. The upper range of naphthalene, methylnaphthalene isomers and benzo(a)anthracene
were at or above 100,000 ng/g TS in the literature review of Harrison et al. (2006),although a survey of Canadian sludges resulted in median concentrations typically lyingin the range of 100 to 1,500 ng/g TS.
2. The simplest PAHs, naphthalene and phenanthrene, consisting of two and three fusedbenzene rings, respectively, have the highest median concentrations of the PAHs in theCanadian survey.
3. Data on the effect of biosolids treatment processes on reducing concentrations of PAHsare very limited. For the lower molecular weight PAHs anthracene and phenanthrene,composted and air dried biosolids have apparent lower concentrations than biosolidsproduced by heat drying or after anaerobic digestion. The anaerobic digested sludge hadthe highest concentrations of the four PAHs examined.
4. For the literature surveyed, the range and means of the PCDDs and PCDFs reported fromdifferent countries appear to be very similar, with mean values in the range of 0.020 ngTEQ/g TS.
5. Concentrations of total PCBs listed in Canadian sludge samples appeared to be higherthan corresponding sludge samples from Europe.

CCME Final ReportESOCs in Biosolids: Concentrations and Effects of Treatment Processes Literature Review
Hydromantis, Inc., University of Waterloo and Trent University 90
4. CONTAMINANTS IN SEPTAGE
The electronic databases were also searched for publications reporting on the occurrence and fateof emerging substances of concern (ESOCs) in septage or septage applied to land. The searchrevealed an almost complete lack of information on these topics. A considerably larger body ofliterature can be found with respect to transport and fate of contaminants in septic tank effluent,however this was deemed outside of the scope of the report, concerning biosolids or septage, asthe residual solids, which might be used in beneficial applications.
The two studies of occurrence of ESOCs in septage that were identified in the literature searchrelated to investigation near Cape Cod, MA. The data on occurrence and concentrations in thetwo studies are provided in Table 91. Within the data are recognizable classes of ESOCsincluding alkylphenol and their ethoxylates, the plasticizer Bisphenol A, estrogenic hormones(E2 and E1), fluorescent whitening agents (DAS and DBSP), the anti-oxidant BHA used in foodpackaging and several chlorophenols. Caffeine and its metabolite paraxanthine were alsoidentified in one of the studies.
The data provided in Table 91 provide only a limited overview of the occurrence andconcentrations of certain target analytes. There is no identification or potential removal of thecontaminants through the septic tank (i.e. anaerobic treatment).
Because there are many types of ESOCs, few surveys can afford to test for all the differentpotential classes. For example, no data were found regarding occurrence, concentrations orremoval efficiencies of pharmaceuticals, flame retardants, perfluorinated substances, and otherpersonal care products such as anti-microbials.

CCME Final ReportESOCs in Biosolids: Concentrations and Effects of Treatment Processes Literature Review
Hydromantis, Inc., University of Waterloo and Trent University 91
Table 91. Occurrence and Concentrations of ESOCs in Septage
Conc'n (μg/L) Conc'n (μg/L)
ContaminantNo. Detects/No. Analyzed Range
Mean ofDetects
2 samplesreported
Nonylphenol 2/2 1000-1500 1200 16, 10Octylphenol 2/2 35-42 39Octylphenol monoethoxylate 2/2 8.0-9.8 8.9Octylphenol diethoxylate 0/2 n.d. n.d.Nonylphenol monoethoxylate 2/2 440-580 510Nonylphenol diethoxylate 2/2 79-100 90Sum nonylphenol mono-, di- andtriethoxylates 3.9, 4.8Nonylphenol monoethoxycarboxylate 2/2 37-57 47 7.8, 8.2Nonylphenol diethoxycarboxylate 1.6, 2.3Bisphenol A 4/5 0.11-1.7 0.824,4'-dihydroxybiphenyl (4,4'-biphenyldiol) 5/5 0.04-1.4 0.774-tert-butylphenol 5/5 0.16-3.2 0.85Phenylphenol (total) 5/5 0.16-3.9 1.74-tert-pentylphenol 2/5 0.03-0.03 0.03Butylated hydroxyanisole (BHA) 5/5 0.13-0.53 0.32-sec-butylphenol 2/5 0.03-0.08 0.0554-nitrophenol 1/5 1 detect 0.166-bromo-2-naphthol 1/5 1 detect 0.052,4-dichlorophenol 2/5 0.07-0.10 0.0853,4-dichlorophenol 1/5 1 detect 0.023,5,6-trichloro-2-pyridinol 2/5 0.16-0.19 0.18Pentachlorophenol 2/5 0.04-0.05 0.045DAS [4,4-bis[(4-anilino-6-morpholino-1,3,5- triazin-2-yl)amino]stilbene-2,2-disulfonate] 2.04, 1.67
DSBP [4,4-bis(2-sulfostyryl)biphenyl]0.0065,0.0028
Caffeine 22.9, 17.3Paraxanthine (caffeine metabolite) 65.1, 54.9E2 (17-β-estradiol) 0.019, 0.016E1 (Estrone) 0.074, 0.049Boron 216+8
Reference Rudel et al. (1998)Swartz et al.(2006)

CCME Final ReportESOCs in Biosolids: Concentrations and Effects of Treatment Processes Literature Review
Hydromantis, Inc., University of Waterloo and Trent University 92
5. ANALYSIS OF LITERATURE REVIEW FINDINGS
The interpretation of the published results on occurrence, concentrations and removalefficiencies of contaminants in sludges and biosolids is complex. Terminology of residualwastewater solids, as used by the different authors in the publications, is not consistent. Basedon definitions provided in Section 1, the references to “sludge” in the publications reviewed areconstrued to mean “sewage sludge”. Often, however, the word sludge may be used when in factthe more appropriate term may be “biosolids”, as the residual solids have been subjected to astabilization process. In much of the data reviewed, including other literature reviews, thesludges or biosolids are not specified by type (raw or treated, primary or secondary, etc) whichmakes the effort of determining if some processes are more beneficial than others in minimizingthe concentrations of these substances. Some reviews, which summarize concentration data,group different types of sludges together without regard to the nature of the sludges.
There is a great disparity in published literature in the attention devoted to the occurrence ofdifferent ESOCs in sludges and biosolids. Some compounds have been examinedcomprehensively, and there is a substantial database on occurrence of these substances.Examples of the well-documented substances include the plasticizer bis(2-ethylhexyl)phthalate,the surfactant nonylphenol and some of its ethoxylates, the synthetic musk fragrances HHCB andAHTN, the flame retardants polybrominated diphenyl ethers, and the bacteriostat triclosan. Inother cases however, there is a significant lack of information on concentrations of other ESOCsin sludges and biosolids, including many antibiotics and other pharmaceuticals. CCME’s reporton the State of Knowledge of Municipal Effluent Science and Research identified many classesof personal care products in treated effluents, including parabens (anti-microbial preservatives),sunscreen agents and insect repellents, for which no occurrence data in sludges or biosolids wereidentified. Lack of adequate analytical protocols may hinder this effort.
There appeared in the review to be evidence that sludges from some countries have lowerconcentrations than others, which may be reflective of manufacturing, consumption or userestrictions. Such products include brominated flame retardants and pharmaceuticals.
The concentrations of different ESOCs reviewed in this report can vary widely in sludges andbiosolids, from the low part per billion (ng/g TS) (e.g. estrogens and androgens to the part perthousand level, for plant and animal sterols, and from literature in the 1990s, linear alkylbenzenesurfactants. LAS concentrations may now be lower, but there is a scarcity of recent data forthese compounds. Table 92 provides a depiction of the concentration ranges observed in sludgesand biosolids in this review.
High concentrations (e.g., mg/g TS range) of substances identified in the sludges and biosolidsare not necessarily a cause for concern. The plant and animal sterols for example are naturalproducts that may serve as an anthropogenic indicator or marker. Conversely, very lowconcentrations (e.g., ng/g TS range) of substances such as hormones, polybrominated diphenylethers and perfluorinated organic compounds that may be found in biosolids destined for landapplication are likely to be of greater concern due to their potential for endocrine disruption orpersistence, bioaccumulation or toxicity.

CCME Final ReportESOCs in Biosolids: Concentrations and Effects of Treatment Processes Literature Review
Hydromantis, Inc., University of Waterloo and Trent University 93
Table 92. Approximate Range of Concentrations of ESOCs in Sludges and Biosolids
Concentration Range
Contaminant or Class ofContaminants
parts perbillion(ng/g TS)
parts permillion(μg/g TS )
parts perthousand(mg/g TS)
Bisphenol APhthalatesPFOCsLASChlorophenolicsPesticidesSolventsAlkylphenolsPBDEsPharmaceuticalsEstrogens and androgensPlant SterolsAnimal SterolsTriclosanMusk FragrancesQuaternary Ammonium CompoundsSiloxanesPolycyclic Aromatic HydrocarbonsPolychlorinated polyaromatics
With respect to different biosolids treatment processes, in most publications only the final treatedbiosolids concentrations are typically documented. Without the accompanying raw sludgeconcentrations, an evaluation of the effectiveness of the processes becomes more tenuous. In thedata provided by Kinney et al. (2006), there appears to be evidence of some reduction in ESOCconcentrations resulting from certain biosolids treatment processes such as composting or drying,based only on differences in concentrations between the treated biosolids. Without raw sludgedata, however, no firm conclusions can be drawn.
The potential of different biosolids treatment processes to reduce concentrations of contaminantsin the feed sewage sludge, based on the literature data, is summarized in Table 93. Where a tableentry is indicated as having some removal efficiency, the magnitudes of removal efficiency havenot been differentiated.
The treatment process most characterized for ability to reduce contaminant concentrations is theanaerobic digestion process. For example in the studies by Carballa et al. (2006, 2007a, 2007b),concentrations of a variety of contaminants are provided for both raw sludge and sludgesdigested under different temperature regimes and retention times. From this review it appearsthat certain ESOCs can be reduced by anaerobic digestion, while others are recalcitrant (e.g.,Bisphenol A, musk fragrances, triclosan), or perhaps even increased in concentration (e.g., 4-nonylphenol) by anaerobic biotransformation processes.

CCME Final ReportESOCs in Biosolids: Concentrations and Effects of Treatment Processes Literature Review
Hydromantis, Inc., University of Waterloo and Trent University 94
Table 93. Potential of Biosolids Treatment Processes for Reduction of ESOCs in SewageSludge
Compound orClass ofCompounds
Aerobicdigestion
Anaerobicdigestion
Composting Alkalinestabilis’n
Heatdrying
Other drying(e.g. air orsolar drying)
Industrial chemicals
Bis(2-ethylhexyl)phthalate
NA R R NA R NA
Alkylphenolsand theirethoxylates
R X R R? R? NA
Bisphenol A NA X NA NA NA NA
Linearalkylbenzenesurfactants
R N NA NA NA NA
Perfluorinatedorganiccompounds
NA NA NA NA NA NA
Brominatedflame retardants
NA R NA NA NA NA
Personal Care Products
Anti-microbials NA X NA NA NA NA
Nitro muskfragrances
R R NA NA NA NA
Polycyclic muskfragrances
X X NA NA NA NA
Quaternaryammoniumcompounds
NA NA NA NA NA NA
Siloxanes NA NA NA NA NA NA
Metals
Organotins NA X NA NA NA NA
Other
Polyaromatichydrocarbons
NA NA NA NA NA NA
Polychlorinateddioxins and furans
NA NA NA NA NA NA
R = some reductionindicatedR? = mixed results
X = no reduction indicated NA = no data available
It is evident from Table 93 that published knowledge of the potential for reduction of ESOCs inwastewater sludges by composting, alkaline stabilization or drying processes is incomplete.
CCME Final ReportESOCs in Biosolids: Concentrations and Effects of Treatment Processes Literature Review
Hydromantis, Inc., University of Waterloo and Trent University 95
There is a major lack of published data regarding ESOC occurrence, concentration and removalin septage. Only one study published after the year 2000 was identified, making difficult acomparison of concentrations in septage relative to other wastewater sludges or biosolids. Nostudies on the effectiveness of treatment of septage for reduction of ESOC concentrations wereidentified.
Because many of the ESOCs examined in this review are hydrophobic, they concentrate in theresidual wastewater solids (sludges). The understanding of the fate of these compounds bydifferent biosolids processes is largely unknown. Because land application of biosolids is animportant management technique in Canada, it is desirable to minimize any potential adverseeffects to the terrestrial environment due to amendment of soils with biosolids. Consequently,there is a need to understand whether certain biosolids treatment processes are better than othersat reducing concentrations of ESOCs in wastewater sludges. With respect to non-persistentESOCs in biosolids applied to land, a mitigating approach may be to prescribe an interim periodbetween the time of land application and the beginning of seeding or grazing to allow soilmicrobes time to degrade the compounds.Should it be determined from literature studies oractual testing that certain types of ESOCs remain unaffected by biosolids treatment processes,then other means of limiting the concentrations of these recalcitrant compounds in biosolidsshould be explored, such as by source control, pretreatment and sewer use limits, or moreextreme measures such as product re-formulations or outright bans on manufacture or use.
Reductions of metal concentrations such as nickel, chromium and cadmium were effectivelyaccomplished in the 1980s and 1990s by source control, pretreatment and sewer use limits. InSwitzerland, there was a clear reduction in LAS concentrations in biosolids after restrictions onthe use of the compounds was implemented in the early 1990s. More recently, bans on use ofcertain PBDEs in European countries and North America are resulting in reduced concentrationsof these compounds in biosolids.

CCME Final ReportESOCs in Biosolids: Concentrations and Effects of Treatment Processes Literature Review
Hydromantis, Inc., University of Waterloo and Trent University 96
6. RECOMMENDATIONS
Based on the literature review and above assessment, the following recommendations areoffered:
1. There is a need to define criteria for what is an adequate database for characterization ofcontaminants in sludges and biosolids, then to apply the criteria to the compiled data. Anexample of the review criteria might consist of a minimum number of qualified references(e.g., n=6), and specified relative standard deviation about a mean concentration (e.g.RSD = 25%).
2. Where there are insufficient data, the availability of adequate analytical protocols for theESOCs of interest needs to be determined by qualified analytical personnel. If adequateanalytical procedures are not available, then method development should be set as apriority.
3. If acceptable analytical protocols are available, the sampling survey proposed as part ofthis study to investigate the ability of biosolids treatment processes to reduceconcentrations of ESOCs in sewage sludge and biosolids should be .initiated. Assessmentof biosolids treatment effectiveness requires both raw and treated biosolids samples, aswell as any potential process sidestreams to aid in mass balance closures.
4. As part of the biosolids treatment survey, sites with septage treatment should be includedso that a database of ESOCs in septage can be expanded.
5. In the proposed survey of biosolids treatment processes, within budgetary limits, differenttypes of pharmaceuticals, synthetic musk fragrances and alkylphenols (includingBisphenol A) should be included as primary target analytes. Secondarily, as budgetarylimitations permit, classes of ESOCs such as human hormones, brominated flameretardants, perfluorinated organic compounds, quaternary ammonium compounds, andsiloxanes should be analysed.
6. Should it be determined from literature studies or actual testing that certain types ofESOCs remain unaffected by biosolids treatment processes, then other means of limitingthe concentrations of these recalcitrant compounds in biosolids should be explored, suchas by source control, pretreatment and sewer use limits, or more extreme measures suchas product re-formulations or outright bans on manufacture or use. Such actions shouldbe consistent across Canada.
7. Lastly, data produced by this and similar reviews, and by the forth-coming fieldinvestigation, need to be transferred out to appropriate agencies and researchers.

CCME Final ReportESOCs in Biosolids: Concentrations and Effects of Treatment Processes Literature Review
Hydromantis, Inc., University of Waterloo and Trent University 97
REFERENCES
Ahel, M., Molnar, E., Ibric, S. and Giger, W. 2000. Estrogenic metabolites of alkylphenol polyethoxylates insecondary sewage effluents and rivers. Wat. Sci. Technol. 42(7-8), 15-22.
Andersen, H., Siegrist, H., Halling-Sorensen, B., and Ternes, T.A., 2003. Fate of Estrogens in a Municipal SewageTreatment Plant. Environ. Sci. Technol. 37(18), 4021-4026.
Angelidaki, I., Toräng, L., Waul, C.M., and Schmidt, J.E. 2004. Anaerobic bioprocessing of sewage sludge,focusing on degradation of linear alkylbenzene sulfonates (LAS). Wat. Sci. and Technol. 49(10), 115–122.
Appels, L., Baeyens, J. and Dewil, R., 2008. Siloxane removal from biosolids by peroxidation. Energy Conversionand Management, 49, 2859–2864.
Barnabé, S., Beauchesne, I., Cooper, D.G., Nicell, J.A. 2008. Plasticizers and their degradation products in theprocess streams of a large urban physicochemical sewage treatment plant. Wat. Res., 42, 153 – 162.
Bossi, R., Strand, J., Sortkjær, O., and Larsen, M.M., 2008. Perfluoroalkyl compounds in Danish wastewatertreatment plants and aquatic environments. Environment International 34, 443–450.
Brown, S., Clarke, D., Doubrava, M., O’Connor, G., 2008. Fate of 4-nonylphenol in a biosolids amended soil.Chemosphere (2008), in press.
CCREM (Canadian Council of Resource and Environment Ministers). 1987. Canadian Water Quality Guidelines.
Canada Gazette, 2008. Polybrominated Diphenyl Ethers Regulations under the Canadian Environmental ProtectionAct, 1999. Accessed February 24, 2009 at http://canadagazette.gc.ca/partII/2008/20080709/html/sor218-e.html.
Canviro Consultants Ltd. 1988. Thirty-seven municipal water pollution control plants: Pilot monitoring studyVolume 1. Interim report. Report submitted to Ontario Ministry of the Environment. Toronto. December.
Carballa, M., Omil, F., Alder, A.C., Lema, J.M. 2006. Comparison between the conventional anaerobic digestion ofsewage sludge and its combination with a chemical or thermal pre-treatment concerning the removal ofpharmaceuticals and personal care products. Wat. Sci. & Technol., 53(8), 109–117.
Carballa, M., Omil, F., Ternes, T., Lema, J.M. 2007a. Fate of pharmaceutical and personal care products (PPCPs)during anaerobic digestion of sewage sludge. Water Research, 41, 2139-2150.
Carballa, M., Manterola, G., Larrea, L., Ternes. T., Omil, F., Lema, J.M. 2007b. Influence of ozone pre-treatment onsludge anaerobic digestion: Removal of pharmaceutical and personal care products. Chemosphere, 67, 1444-1452.
Carex Canada. 2009. Pentachlorophenol.http://www.carexcanada.ca/research/carcinogens/en/pentachlorophenol.pdf. Accessed June 24, 2009.
Cavalli, L. 2004. Surfactants in the Environment: fate and effect of linear alkylbenzene sulfonates (LAS) andalcohol-based surfactants. In: Handbook of Detergents. Part B. Environmental Impacts. Edited by U. Zoller.,pp.373-348.
Chu, S. and Metcalfe, C.D. 2007. Simultaneous determination of triclocarban and triclosan in municipal biosolids byliquid chromatography tandem mass spectrometry. Journal of Chromatography A, 1164, 212–218.
Clarke, B., Porter, N., Symons, R., Marriott, P., Ades, P., Stevenson, G. and Blackbeard, J. 2008.Polybrominated diphenyl ethers (PBDEs) and polybrominated biphenyls (PBBs) in Australian

CCME Final ReportESOCs in Biosolids: Concentrations and Effects of Treatment Processes Literature Review
Hydromantis, Inc., University of Waterloo and Trent University 98
sewage sludge. Chemosphere, doi:10.1016/j.chemosphere.2008.06.034.
Das, K., and Xia, K., 2008. Transformation of 4-nonylphenol isomers during biosolids composting. Chemosphere,70, 761–768.
Daughton, C.G. and Ternes, T.A. 1999. Pharmaceuticals and Personal Care Products in the Environment: Agents ofSubtle Change? Environ. Health Perspectives, 107(Supp. 6) 907-938.
Dewil, R., Appels, L., Baeyens, J., Buczynska, A., and Vaeck, L. V., 2007. The analysis of volatile siloxanes inwaste activated sludge. Talanta, 74, 14–19.
Eljarrat, E., Marsh G., Labandeira, A., and Barcelo, D. 2006. Effect of Sewage Sludges Contaminated withPolybrominated Diphenylethers on Agricultural Soils. Chemosphere, 71, 1079-1086.
Environment Canada, 2006. Ecological Screening Assessment Report on Polybrominated Diphenyl Ethers(PBDEs). Canadian Environmental Protection Act Environmental Registry. Accessed February 24, 2009 athttp://www.ec.gc.ca/CEPARegistry/documents/subs_list/PBDE_SAR/PBDEs_SAR_EC_June_2006_(en).pdf.
Environment Canada 2009a. Contaminants in herring gull eggs from Great Lakes: 25 years of monitoring levels andeffects. http://www.on.ec.gc.ca/wildlife/factsheets/fs_herring_gulls-e.html. Accessed June 24, 2009.
Environment Canada 2009b. Backgrounder: nonylphenol ethoxylates (NPEs).http://www.ec.gc.ca/CEPARegistry/subs_list/NPE_BG.cfm. Accessed June 24, 2009.
Environment Canada 2009c. Backgrounder – Siloxanes D4, D5 and D6.http://www.ec.gc.ca/default.asp?lang=En&n=714D9AAE-1&news=546F7166-9C61-4CA5-BB67-804EC3F2A0ED. Accessed June 26, 2009.
Fent, K., 1996., Organotin compounds in municipal wastewater and sewage sludge: contamination, fate in treatmentprocess and ecotoxicological consequences. Sci. Tot. Environ. 185(1-3), 151-159.
Fernández, P., Alder, A.C., Suter, M., and Giger, W. 1996. Determination of the quaternary ammonium surfactantditallowdimethylammonium in digested sludges and marine sediments by supercritical fluid extraction andliquid chromatography with post-column ion-pair formation. Anal. Chem., 68, 921-929.
Gerecke, A., Giger, W., Hartmann, P., Heeb, N.V., Kohler, H.E., Schmid, P., Zennegg, M. and Kohler, M. 2006.Anaerobic degradation of brominated flame retardants in sewage sludge. Chemosphere, 64, 311-317.
Gevao, B., Muzaini, S., Helaleh, M. 2008. Occurrence and concentrations of polybrominated diphenyl ethers insewage sludge from three wastewater treatment plants in Kuwait. Chemosphere, 71, 242–247.
Ghanem, A., Bados, P., and Estaun, A.R., Alencastro, L.F., Taibi, S., Einhorn, J., and Mougin, C., 2007.Concentrations and specific loads of glyphosate, diuron, atrazine, nonylphenol and metabolites thereof in Frenchurban sewage sludge. Chemosphere 69, 1368–1373.
Gibson, R.W., Wang, M., Padgett, E., Lopez-Real, J.M., and Beck, A.J., 2007. Impact of drying and compostingprocedures on the concentrations of 4-nonylphenols, di-(2-ethylhexyl) phthalate and polychlorinated biphenylsin anaerobically digested sewage sludge. Chemosphere, 68, 1352–1358.
Gielen GHJP 2007. The fate and effects of sewage-derived pharmaceuticals in soil. Doctoral thesis, University ofCanterbury (NZ).
Giger, W., Brunner, P.H. and Schaffner, C. 1984. 4-nonylphenol in sewage sludge: accumulation of toxicmetabolites form non-ionic surfactants. Science, 225, 623-625.

CCME Final ReportESOCs in Biosolids: Concentrations and Effects of Treatment Processes Literature Review
Hydromantis, Inc., University of Waterloo and Trent University 99
Göbel, A., Thomsen, A., McArdell, C. Joss, A. and Giger, W. 2005. Occurrence and Sorption Behavior ofSulfonamides, Macrolides, and Trimethoprim in Activated Sludge Treatment. Environ. Sci. Technol., 39, 3243-3249.
Golet, E.M., Strehler, A., Alder, A.C. and Giger, W. 2002. Determination of Fluoroquinolone Antibacterial Agentsin Sewage Sludge and Sludge-Treated Soil Using Accelerated Solvent Extraction Followed by Solid-PhaseExtraction. Anal. Chem., 74, 5455-5462.
Golet E.M., Xifra, I., Siegrist, H., Alder, A. and Giger, W. 2003). Environmental Exposure Assessment ofFluoroquinolone Antibacterial Agents from Sewage to Soil. Environ. Sci. Technol., 37(15), 3981-3989.
Green Ontario, 2009. Ontario’s pollution strategy. http://www.greenontario.org/strategy/toxics_Ontario.html.Accessed June 24, 2009.
Halden, R.U. 2007. PPCP Perspectives: Emerging Knowledge on Emerging Contaminants.Presentation at Northeast Water Science Forum, Pharmaceuticals and Personal Care Products: State of theScience. Portland, ME. August 8.
Hale, R.C., and La Guardia, M.J., 2002. Have Risks Associated With The Presence Of Synthetic OrganicContaminants In Land-Applied Sewage Sludges Been Adequately Assessed? New Solutions, 12(4), 371-386.
Harrison, E.Z., Oakes, S.R., Hysell, M., and Hay, A., 2006. Review - organic chemicals in sewage sludges. Sci. ofthe Total Environ. 367, 481–497.
Health Canada 2009a. Perfluorooctane sulfonate (PFOS) and Health.http://www.hc-sc.gc.ca/ewh-semt/pubs/contaminants/perflurooctane_sulfonate-eng.php. Accessed June 23,2009.
Health Canada 2009b. Perfluorinated Carboxylic Acids and Their Precursors (including Fluorotelomers).http://www.chemicalsubstanceschimiques.gc.ca/interest-interet/pfca-acp_e.html. Accessed June 23, 2009.
Health Canada, 2009c. Chlorophenols http://www.hc-sc.gc.ca/ewh-semt/pubs/water-eau/chlorophenols/index-eng.php. Accessed June 24, 2009.
Heidler, J. and Halden, R.U. 2007. Mass balance assessment of triclosan removal during conventional sewagetreatment. Chemosphere, 66, 362–369.
Heidler, J., and Halden, R.U. 2008. Meta-Analysis of Mass Balances Examining Chemical Fate during WastewaterTreatment. Environ. Sci. Technol. 42(17), 6324-6332.
Hydromantis, Inc., Minnow Environmental and University of Waterloo. 2005. Review of the State of Knowledge ofMunicipal Effluent Science and Research: Review of Effluent Substances. Report to the Canadian Council ofMinisters of the Environment, Winnipeg, MB. Available at:http://www.ccme.ca/assets/pdf/csr_rev_effluent_substances.pdf.
IPCS, 2009. Hexachlorophene, International Programme for Chemical Safety.http://www.inchem.org/documents/icsc/icsc/eics0161.htm. Accessed June 25, 2009.
Jacobsen, A.M., Mortensen, G.K., and Bruun Hansen, H.C. 2004. Organic compounds in the environment. J.Environ. Qual. 33, 232–240.
Jaganyi, D., 2007. Methodology and survey of organic pollutants in South African sewage sludges, volume 1.Report to the Water Research Commission on the project “Survey and Methodology for Analysing OrganicPollutants in South African Sewage Sludges”.
CCME Final ReportESOCs in Biosolids: Concentrations and Effects of Treatment Processes Literature Review
Hydromantis, Inc., University of Waterloo and Trent University 100
Jones-Lepp, T. L., and Stevens, R., 2007. Pharmaceuticals and personal care products in biosolids/sewage sludge:the interface between analytical chemistry and regulation. Anal Bioanal Chem. 387, 1173–1183.
Kinney, C., Furlong, E., Zaugg, S., Burkhardt, M.R., Werner, S., Cahill, J.D., and Jorgensen, G.R., 2006. Survey oforganic wastewater contaminants in biosolids destined for land application. Environ. Sci. & Technol. 40 (23),7207–7215.
LaGuardia, M., Hale, R.C., Harvey, E., Bush, E., Mainor, T.M., and Gaylor, M.O., 2004. Organic contaminants ofemerging concern in land-applied sewage sludge (biosolids). J. of Residual Sci. Technol. 1, 111-122.
Langenkamp, H., Part, P., Erhardt, W. and Pruess, A. 2001. Organic Contaminants in Sewage Sludge forAgricultural Use. European Commission, Joint Research Centre, Institute for Environment and Sustainability,Soil and Waste Unit.
Lee, H., and Peart, T. 2002. Organic Contaminants in Canadian Municipal Sewage Sludge. Part I. Toxic orEndocrine-Disrupting Phenolic Compound. Water Qual. Res. J. Canada, 37(4), 81–696.
Lee H., Peart, T. E., and Sarafin, K., 2003. Occurrence of polycyclic and nitro musk compounds in Canadian sludgeand wastewater samples. Water Qual. Res. J. Canada, 38(4), 683-702.
Leeper, G.W. 1972. Reactions of heavy metals with soils with special regard to their application in sewage wastes.Report prepared for U.S. Army Corps of Engineers under contract No. DACW73 – 73-C- 0026.
Lindberg, R.H., Senneberg, P., Johansson, M.I., Tysklind, M. and Andersson, B.A.V. 2005. Screening of HumanAntibiotic Substances and Determination of Weekly Mass Flows in Five Sewage Treatment Plants in Sweden.Environ. Sci. Technol., 39(10), 3421-3429.
Lindberg, R.H., Olofsson, U., Rendahl, P., Johansson, M.I., Tysklind, M. and Andersson, B.A.V. 2006. Behavior ofFluoroquinolones and Trimethoprim during Mechanical, Chemical, and Active Sludge Treatment of SewageWater and Digestion of Sludge. Environ. Sci. Technol., 40(3), 1042-1048.
Loganathan, B.G., Sajwan, K.S., Sinclair, E., Kumar, K., S., and Kannan, K., 2007. Perfluoroalkyl sulfonates andperfluorocarboxylates in two wastewater treatment facilities in Kentucky and Georgia. Wat. Res. 41, 4611–4620.
Martínez-Carballo, E., González-Barreiro, C., Sitka, A., Kreuzinger, N., Scharf S. and Gans, O. 2007. Determinationof selected quaternary ammonium compounds by liquid chromatography with mass spectrometry. Part II.Application to sediment and sludge samples in Austria. Environ. Poll. 146(2) 543-547.
Melcer, H., Klecka, G., Monteith, H. and Staples, C. 2007. Wastewater Treatment of Alkylphenols and TheirEthoxylates. Water Environment Federation, Alexandria, VA. January.
Metcalf & Eddy. 1991.Wastewater Engineering: Treatment, Disposal, Reuse (3rd ed.). edited by G. Tchobanoglousand F.L. Burton. McGraw-Hill. Toronto.
Miao, X., Yang, J. and Metcalfe, C.D. 2005. Carbamazepine and its metabolites in wastewater and in biosolids in amunicipal wastewater treatment plant. Environ. Sci. Technol., 39, 7469-7475.
Mittelstaedt, M. 2009. Canada to pull plug on “rubber-duck” chemicals. Toronto Globe and Mail online version.June 20, 2009.
Monteith, H.D. 1987. Fluctuations of Trace Contaminants in Sewage Treatment Plants. Monograph No. 1.,Canadian Association on Water Pollution Research and Control, Burlington, ON.
Mueller, J. A. Di Toro, D.M. and Maiello, J.A. 1995. Fate of octamethylcyclotetrasiloxane (OMCTS) in theatmosphere and in sewage treatment plants as an estimate of aquatic exposure. Environ. Toxicol. Chem. 14(10),1657-1666.

CCME Final ReportESOCs in Biosolids: Concentrations and Effects of Treatment Processes Literature Review
Hydromantis, Inc., University of Waterloo and Trent University 101
NRCC (National Research Council of Canada) 1983. Polycyclic Aromatic Hydrocarbons in the AquaticEnvironment: Formation, Sources, Fate and Effects on aquatic Biota. Associate Committee on Scientific Criteriafor Environmental Quality. NRCC No. 18981, Ottawa. 209 pp.
Nieto, A., Borrull, F., Pocurull, E. and Marcé, R.M. 2007. Pressurized liquid extraction of pharmaceuticals fromsewage-sludge. J. Sep. Sci. 30, 979 – 984.
OSPAR, 2000. OSPAR Commission Background Document on Musk Xylene and Other Musks.
Our Stolen Future. 2009. About phthalates.http://www.ourstolenfuture.org/NEWSCIENCE/oncompounds/phthalates/phthalates.htm. Accessed June 22.
Page, A.L. 1974. Fate and effects of trace elements in sewage sludge when applied to agricultural lands. A literaturereview study. U.S. EPA Report No. EPA-670/8-74-005. Office of Research and Development, Cincinnati, OH.
Peck, A.M. and Hornbuckle, K.C. 2004. Synthetic Musk Fragrances in Lake Michigan. Environ. Sci. Technol., 38,367-372.
Perron , V. and Hébert, M. 2007. Caractérization des Boues d’Épuration Municipales. Partie II: Élément TracesMétalliques. Vecteur Environnement (Québec). November, pp.42-46.
Petrille, J.C. and Werner, M.W. 1996. Methods of detoxifying quaternary ammonium compounds toward aquaticorganisms. http://www.freepatentsonline.com/5518636.html. Accessed June 29, 2009.
Pryor, S.W., Hay, A.G., and Walker, L.P., 2002. Nonylphenol in anaerobically digested sewage sludge from NewYork State. Environ. Sci. Technol. 36, 3678-3682.
Radjenović, J., Petrović, M. and Barceló, D. 2009. Fate and distribution of pharmaceuticals in wastewater andsewage sludge of the conventional activated sludge (CAS) and advanced membrane bioreactor (MBR) treatment.Wat. Res., 43, 831 – 841.
Rayne, S. and Ikonomou, M. 2005. Polybrominated diphenyl ethers in an advanced wastewater treatment plant. Part1: Concentrations, patterns and influence of treatment processes. J. Environ. Eng. Sci. 4, 353-367(supplementary data tables).
Rogers, H.R., 1996. Sources, behaviour and fate of organic contaminants during sewage treatment and in sewagesludges. The Science of the Total Environment 185, 3-26.
Rudel, R.A., Mely, S.J., Geno, P.W., Sun, G., and Brody, J.G. 1998. Identification of Alkylphenols andOther Estrogenic Phenolic Compounds in Wastewater, Septage, and Groundwater on Cape Cod, Massachusetts.Environ. Sci. Technol. 32, 861-869.
Ruel, S.M., Choubert, J.M., Ginestet, P., and Coquery, M., 2008. Semi-quantitative analysis of a specific databaseon priority and emerging substances in wastewater and sludge. Wat. Sci. & Technol 57(12), 1935-1944.
Schultz, M.M., Higgins, C.P., Huset, C.A., Luthy, R.G., Barofsky, D.F. and Field, J.A. 2006. Fluorochemical MassFlows in a Municipal Wastewater Treatment Facility. Environ. Sci. & Technol. 40(23), 7350-7357.
Shin, M., Lee, D-Y., Falletta, P. and Seto, P. 2006. Anaerobic Microbial Dehalogenation of PolybrominatedDiphenylethers (PBDEs) in Batch Culture system. Presentation at 27th Annual SETAC North America Meeting,Montreal, QC. November 5-9.
Sinclair, E. and Kannan, K. 2006. Mass Loading and Fate of Perfluoroalkyl Surfactants in Wastewater TreatmentPlants. Environ. Sci. & Technol. 40(5), 1408-1414.

CCME Final ReportESOCs in Biosolids: Concentrations and Effects of Treatment Processes Literature Review
Hydromantis, Inc., University of Waterloo and Trent University 102
Smyth, S.A., Lishman, L.A., McBean, E.A., Kleywegt, S., Yang, J., Svoboda, M.L., Lee, H-B., and Seto, P., 2007.Fate of Polycyclic and Nitro Musks during Aerobic and Anaerobic Sludge Digestion. Proceedings, InternationalWater Association Specialist Conference on Moving Forward Biosolids Sustainability, Moncton NB, June 2007.
Soares, A., Guieysse, B., Jefferson, B., Cartmell, E., and Lester, J.N., 2008. Nonylphenol in environment: A criticalreview on occurrence, fate, toxicity and treatment in wastewaters. Environment International 34, 1033–1049.
Song, M., Chu, S., Letcher, R.J. and Seth, R. 2006. Fate, partitioning and mass loading of polybrominated diphenylethers (PBDEs) during the treatment processing of municipal sewage. Environ. Sci. Technol. 40, 6241-6246.
Spongberg A.L. and Witter, J.D. 2008. Pharmaceutical compounds in the wastewater process stream in NorthwestOhio. Sci. of the Tot. Environ. 397, 148 – 157.
Stasinakis, A.S., Gatidou, and G., Mamais, D., 2008. Occurrence and fate of endocrine disrupters in Greek sewagetreatment plants. Water Res. 42, 1796 – 1804.
Stevens, R. 2009. U.S. Environmental Protection Agency, Washington, D.C. Personal Communication to H.Monteith, Hydromantis Inc., March 17, 2009.
Swackhamer, D.L., Paerl, H.W., Eisenreich, S.J. Hurley, J. Hornbuckle, K.C., McLachlan, M., Mount, D. Muir, D.and Schindler, D. 2004. Impacts of Atmospheric Pollutants on Aquatic Ecosystems. Issues in Ecology, 12,Summer. Accessed at http://www.epa.gov/owow/airdeposition/ESA_Air_Dep_Ecosystems.pdf. March13,2009.
Swartz, C.H., Reddy, S., Benotti, M.J., Yin, H., Barber, L.B., Brownawell, B.J., and Rudel, R.A. 2006. SteroidEstrogens, Nonylphenol Ethoxylate Metabolites, and Other Wastewater Contaminants in Groundwater Affectedby a Residential Septic System on Cape Cod, MA. Environ. Sci. Technol. 40, 4894-4902.
Tan, Gevao, B., Muzaini, S., Helaleh, M. 2007. Comprehensive study of endocrine disrupting compounds using graband passive sampling at selected wastewater treatment plants in South East Queensland, Australia. EnvironmentInternational, 33, 654–669.
Ternes T., Joss, A., Kreuzinger, N., Miksch, K., Lema, J.M., von Gunten, U., McArdell, C.S., and Siegrist, H., 2005.Removal of pharmaceuticals and personal care products: results of the Poseidon project. Proceedings ofWEFTEC05 on CD-ROM, Water Environment Federation Annual Conference and Technical Exposition,Washington, D.C.
UNEP 2009. O-Cresol. United Nations Environment Program Screening Information Data Sheets (SIDS).http://www.chem.unep.ch/irptc/sids/oecdsids/95487.pdf. Accessed June 24, 2009.
U.S. DHHS 2004. Toxicological profile for polybrominated biphenyls and polybrominated diphenyl ethers. U.S.Dept. of Health and Human Services, Public Health Service, Agency for Toxic Substances and Disease Registry.September.
U.S. EPA. 2008. Registration eligibility decision and risk assessment for the pesticidal uses of triclosan.http://www.epa.gov/oppsrrd1/REDs/factsheets/triclosan_fs.htm. Accessed June 25, 2009.
U.S. EPA. 2009. Target National Sewage Sludge Survey. Report No. EPA-822-R-08-014.
USGS 2004. Brominated Flame Retardants in the Environment. Columbia Environmental Research Center.November.
U.S. National Institutes of Health. 2009. Since You Asked - Bisphenol A: Questions and Answers about theNational Toxicology Program's Evaluation of Bisphenol A. Accessed athttp://www.niehs.nih.gov/news/media/questions/sya-bpa.cfm. March 13.

CCME Final ReportESOCs in Biosolids: Concentrations and Effects of Treatment Processes Literature Review
Hydromantis, Inc., University of Waterloo and Trent University 103
Watts, R.J., Kong, S., Haling, C.S., Gearhart, L., Frye, C.L., and Vigon B.W., 1995. Fate and effects ofpolydimethylsiloxanes on pilot and bench-top activated sludge reactors and anaerobic/aerobic digesters. Wat.Res. 29(10), 2405-2411.
Webber, M. D. and Nichols, J.A. 1995. Organic and Metal Contaminants in Canadian Municipal Sludges and aSludge Compost. Wastewater Technology Centre Report, Burlington, ON, February.
Webber, M.D. and Sidhwa, P., 2005. Pharmaceuticals and Personal Care Products (PPCPs) in CanadianWastewaters and Municipal Sludges – A Review. Proceedings of the 3rd Canadian organic residuals recyclingconference, Calgary, AB, June 1-4, 2005.
WHO, 2003. Concise International Chemical Assessment Document #48. 4-Chloroaniline. World HealthOrganization. http://www.inchem.org/documents/cicads/cicads/cicad48.htm. Accessed June 24, 2009.
Williams, T.O. 2007. Occurrence of Microconstituents in Biosolids. Proceedings of WEFTEC07 on CD-ROM,Water Environment Federation Annual Conference and Technical Exposition, San Diego, CA.
Wu, C., Spongberg, A.L. and Witter, J.D. 2008. Determination of the persistence of pharmaceuticals in biosolidsusing liquid-chromatography tandem mass spectrometry. Chemosphere,doi:10.1016/j.chemosphere.2008.06.026.
XCG Consultants Ltd. 2007. Fate and Significance of Contaminants in Wastewater Sludge Generated At Municipaland Other Publicly-Owned Wastewater Treatment Facilities. Report to Environmental Canada, Ottawa, ON
Xia, K., Bhandari, A., Das, K., and Pillar, G. 2005. Occurrence and fate of pharmaceuticals and personalcare products (ppcps) in biosolids. J. Environ. Qual. 34, 91–104.
Xu, W., Zhang, G., Li, X., Zou, S., Li, P., Hu, Z. and Li, J. 2007. Occurrence and elimination of antibiotics at foursewage treatment plants in the Pearl River Delta (PRD), South China. Wat. Res., 41, 4526 – 4534.
Yang, J.-J., Metcalfe, C.D. 2005. Fate of synthetic musks in a domestic wastewater treatment plant and in anagricultural field amended with biosolids. Sci. of the Total Environ. 363(1-3), 149-165.