Embed Size (px)
Citation preview

InvestorPresentation
May 30, 2017
SECOND QUARTER 2017
Caution Regarding Forward-Looking Statements
2
Our public communications often include oral or written forward-looking statements. Statements of this type are included in this document, and may be included in other filings with Canadian securities regulators or the U.S. Securities and Exchange Commission, or in other communications. All such statements are made pursuant to the “safe harbor” provisions of the U.S. Private Securities Litigation Reform Act of 1995 and any applicable Canadian securities legislation. Forward-looking statements may include, but are not limited to, statements made in this document, the Management’s Discussion and Analysis in the Bank’s 2016 Annual Report under the headings “Overview-Outlook,” for Group Financial Performance “Outlook,” for each business segment “Outlook” and in other statements regarding the Bank’s objectives, strategies to achieve those objectives, the regulatory environment in which the Bank operates, anticipated financial results (including those in the area of risk management), and the outlook for the Bank’s businesses and for the Canadian, U.S. and global economies. Such statements are typically identified by words or phrases such as “believe,” “expect,” “anticipate,” “intent,” “estimate,” “plan,” “may increase,” “may fluctuate,” and similar expressions of future or conditional verbs, such as “will,” “may,” “should,” “would” and “could.” By their very nature, forward-looking statements involve numerous assumptions, inherent risks and uncertainties, both general and specific, and the risk that predictions and other forward-looking statements will not prove to be accurate. Do not unduly rely on forward-looking statements, as a number of important factors, many of which are beyond the Bank’s control and the effects of which can be difficult to predict, could cause actual results to differ materially from the estimates and intentions expressed in such forward-looking statements. These factors include, but are not limited to: the economic and financial conditions in Canada and globally; fluctuations in interest rates and currency values; liquidity and funding; significant market volatility and interruptions; the failure of third parties to comply with their obligations to the Bank and its affiliates; changes in monetary policy; legislative and regulatory developments in Canada and elsewhere, including changes to, and interpretations of tax laws and risk-based capital guidelines and reporting instructions and liquidity regulatory guidance; changes to the Bank’s credit ratings; operational (including technology) and infrastructure risks; reputational risks; the risk that the Bank’s risk management models may not take into account all relevant factors; the accuracy and completeness of information the Bank receives on customers and counterparties; the timely development and introduction of new products and services in receptive markets; the Bank’s ability to expand existing distribution channels and to develop and realize revenues from new distribution channels; the Bank’s ability to complete and integrate acquisitions and its other growth strategies; critical accounting estimates and the effects of changes in accounting policies and methods used by the Bank as described in the Bank’s annual financial statements (See “Controls and Accounting Policies—Critical accounting estimates” in the Bank’s 2016 Annual Report) and updated by this document; global capital markets activity; the Bank’s ability to attract and retain key executives; reliance on third parties to provide components of the Bank’s business infrastructure; unexpected changes in consumer spending and saving habits; technological developments; fraud by internal or external parties, including the use of new technologies in unprecedented ways to defraud the Bank or its customers; increasing cyber security risks which may include theft of assets, unauthorized access to sensitive information or operational disruption; consolidation in the financial services sector in Canada and globally; competition, both from new entrants and established competitors; judicial and regulatory proceedings; natural disasters, including, but not limited to, earthquakes and hurricanes, and disruptions to public infrastructure, such as transportation, communication, power or water supply; the possible impact of international conflicts and other developments, including terrorist activities and war; the effects of disease or illness on local, national or international economies; and the Bank’s anticipation of and success in managing the risks implied by the foregoing. A substantial amount of the Bank’s business involves making loans or otherwise committing resources to specific companies, industries or countries. Unforeseen events affecting such borrowers, industries or countries could have a material adverse effect on the Bank’s financial results, businesses, financial condition or liquidity. These and other factors may cause the Bank’s actual performance to differ materially from that contemplated by forward-looking statements. For more information, see the “Risk Management” section of the Bank’s 2016 Annual Report. Material economic assumptions underlying the forward-looking statements contained in this document are set out in the 2016 Annual Report under the heading “Overview-Outlook,” as updated by this document; and for each business segment “Outlook”. The “Outlook” sections are based on the Bank’s views and the actual outcome is uncertain. Readers should consider the above-noted factors when reviewing these sections. The preceding list of factors is not exhaustive of all possible risk factors and other factors could also adversely affect the Bank’s results. When relying on forward-looking statements to make decisions with respect to the Bank and its securities, investors and others should carefully consider the preceding factors, other uncertainties and potential events. The Bank does not undertake to update any forward-looking statements, whether written or oral, that may be made from time to time by or on its behalf.Additional information relating to the Bank, including the Bank’s Annual Information Form, can be located on the SEDAR website at www.sedar.com and on the EDGAR section of the SEC’s website at www.sec.gov.

Overview
President & Chief Executive Officer
Brian Porter
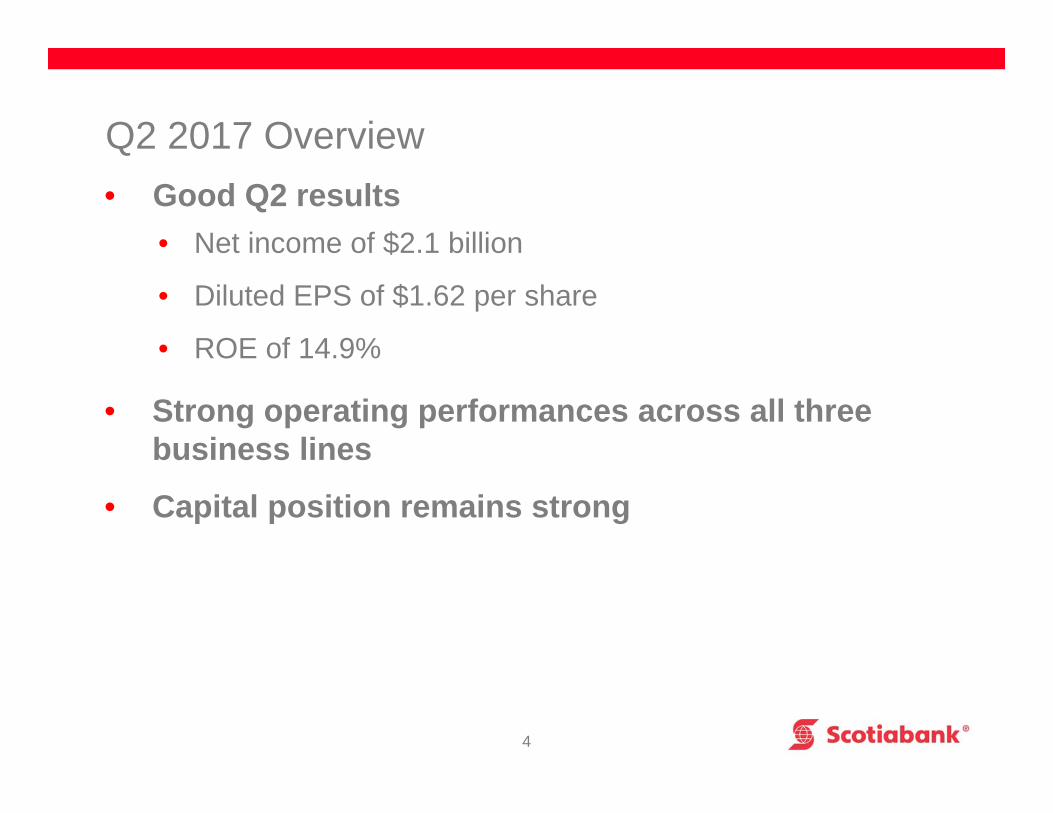
• Good Q2 results• Net income of $2.1 billion
• Diluted EPS of $1.62 per share
• ROE of 14.9%
• Strong operating performances across all three business lines
• Capital position remains strong
4
Q2 2017 Overview

Financial Review
Chief Financial Officer
Sean McGuckin
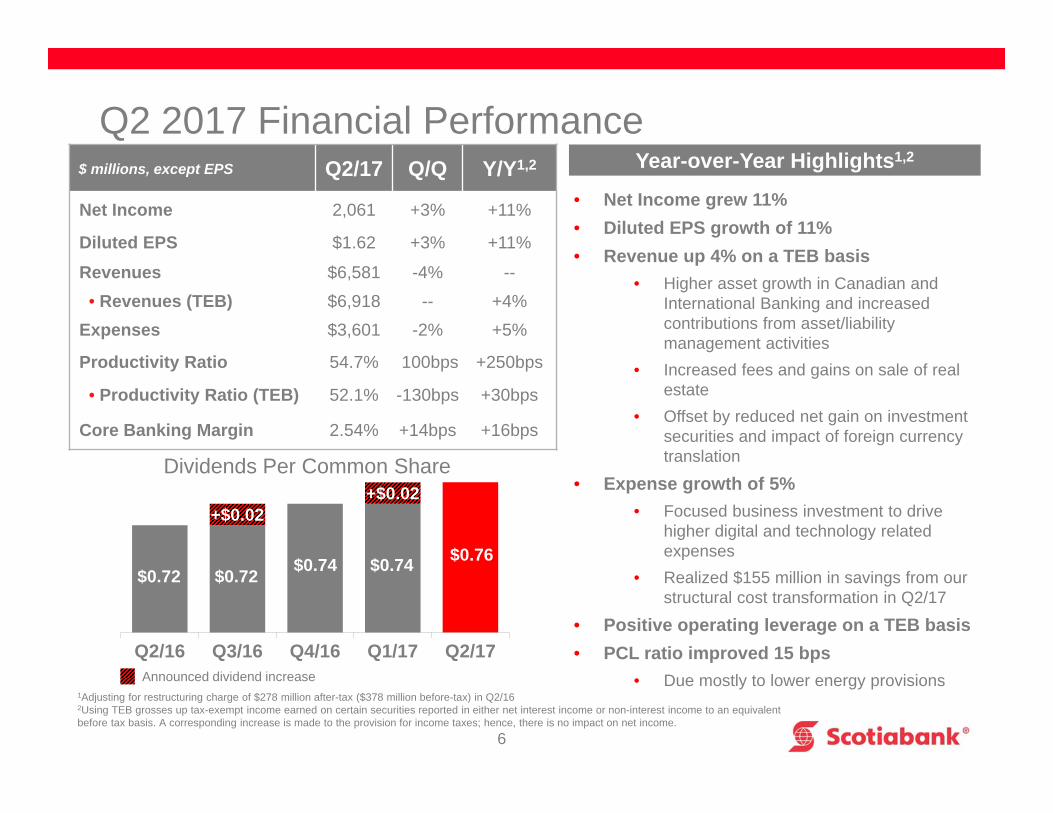
$0.72 $0.72 $0.74 $0.74 $0.76
+$0.02+$0.02
Q2/16 Q3/16 Q4/16 Q1/17 Q2/17
Q2 2017 Financial Performance $ millions, except EPS Q2/17 Q/Q Y/Y1,2
Net Income 2,061 +3% +11%
Diluted EPS $1.62 +3% +11%
Revenues $6,581 -4% --• Revenues (TEB) $6,918 -- +4%
Expenses $3,601 -2% +5%
Productivity Ratio 54.7% 100bps +250bps
• Productivity Ratio (TEB) 52.1% -130bps +30bps
Core Banking Margin 2.54% +14bps +16bps
Year-over-Year Highlights1,2
• Net Income grew 11%• Diluted EPS growth of 11%• Revenue up 4% on a TEB basis
• Higher asset growth in Canadian and International Banking and increased contributions from asset/liability management activities
• Increased fees and gains on sale of real estate
• Offset by reduced net gain on investment securities and impact of foreign currency translation
• Expense growth of 5%• Focused business investment to drive
higher digital and technology related expenses
• Realized $155 million in savings from our structural cost transformation in Q2/17
• Positive operating leverage on a TEB basis• PCL ratio improved 15 bps
• Due mostly to lower energy provisions
Dividends Per Common Share
6
Announced dividend increase1Adjusting for restructuring charge of $278 million after-tax ($378 million before-tax) in Q2/162Using TEB grosses up tax-exempt income earned on certain securities reported in either net interest income or non-interest income to an equivalent before tax basis. A corresponding increase is made to the provision for income taxes; hence, there is no impact on net income.
Capital – Strong Position
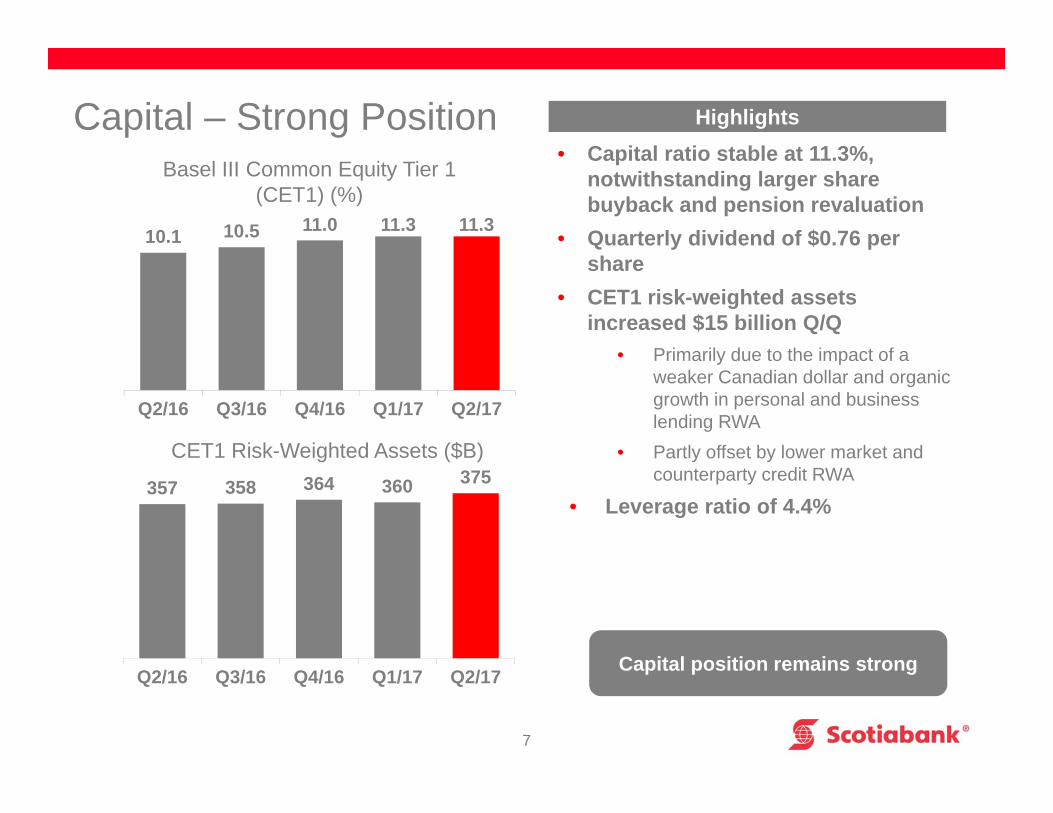
10.1 10.5 11.0 11.3 11.3
Q2/16 Q3/16 Q4/16 Q1/17 Q2/17
Basel III Common Equity Tier 1(CET1) (%)
CET1 Risk-Weighted Assets ($B)
Highlights
7
357 358 364 360 375
Q2/16 Q3/16 Q4/16 Q1/17 Q2/17
• Capital ratio stable at 11.3%, notwithstanding larger share buyback and pension revaluation
• Quarterly dividend of $0.76 per share
• CET1 risk-weighted assets increased $15 billion Q/Q
• Primarily due to the impact of a weaker Canadian dollar and organic growth in personal and business lending RWA
• Partly offset by lower market and counterparty credit RWA
• Leverage ratio of 4.4%
Capital position remains strong
Canadian Banking
8d
(1) Attributable to equity holders of the Bank
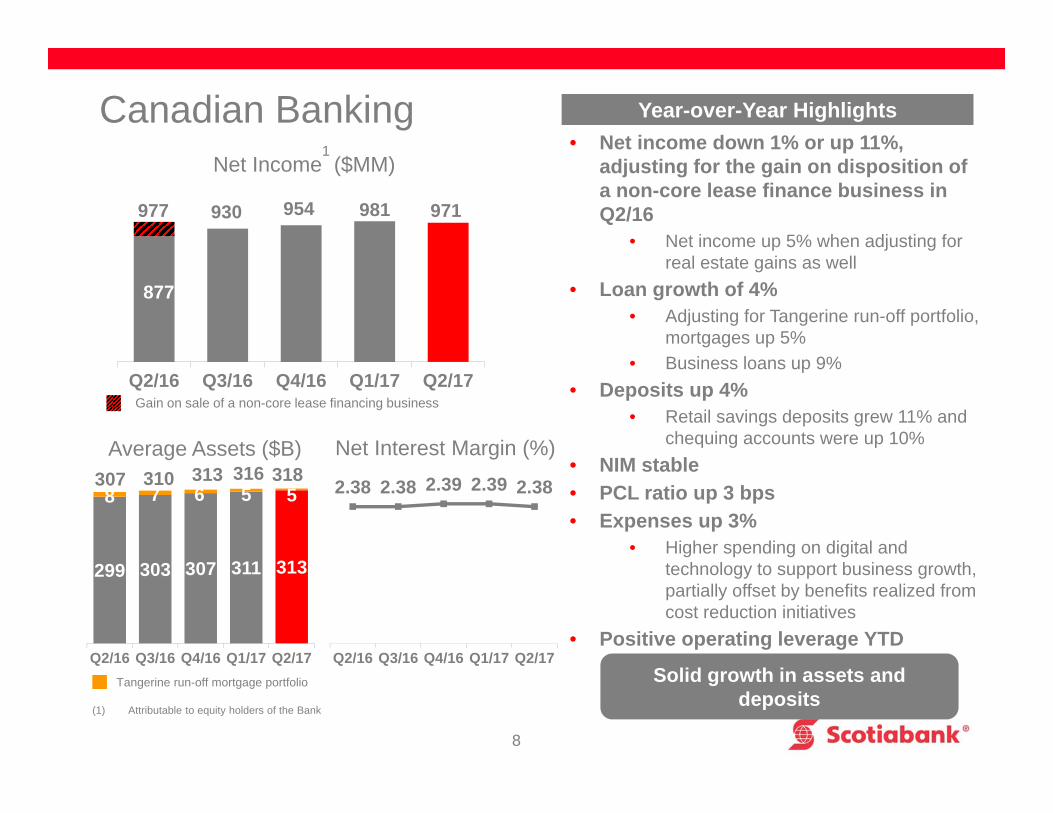
• Net income down 1% or up 11%, adjusting for the gain on disposition of a non-core lease finance business in Q2/16
• Net income up 5% when adjusting for real estate gains as well
• Loan growth of 4%• Adjusting for Tangerine run-off portfolio,
mortgages up 5%• Business loans up 9%
• Deposits up 4%• Retail savings deposits grew 11% and
chequing accounts were up 10%• NIM stable • PCL ratio up 3 bps • Expenses up 3%
• Higher spending on digital and technology to support business growth, partially offset by benefits realized from cost reduction initiatives
• Positive operating leverage YTD
Average Assets ($B)
299 303 307 311 313
8 7 6 5 5
Q2/16 Q3/16 Q4/16 Q1/17 Q2/17
318
Year-over-Year Highlights
2.38 2.38 2.39 2.39 2.38
Q2/16 Q3/16 Q4/16 Q1/17 Q2/17
Net Interest Margin (%)
Net Income1
($MM)
Tangerine run-off mortgage portfolio
316313310307
930 954 981
Q2/16 Q3/16 Q4/16 Q1/17 Q2/17
977
Gain on sale of a non-core lease financing business
877
971
Solid growth in assets and deposits
International Banking
9
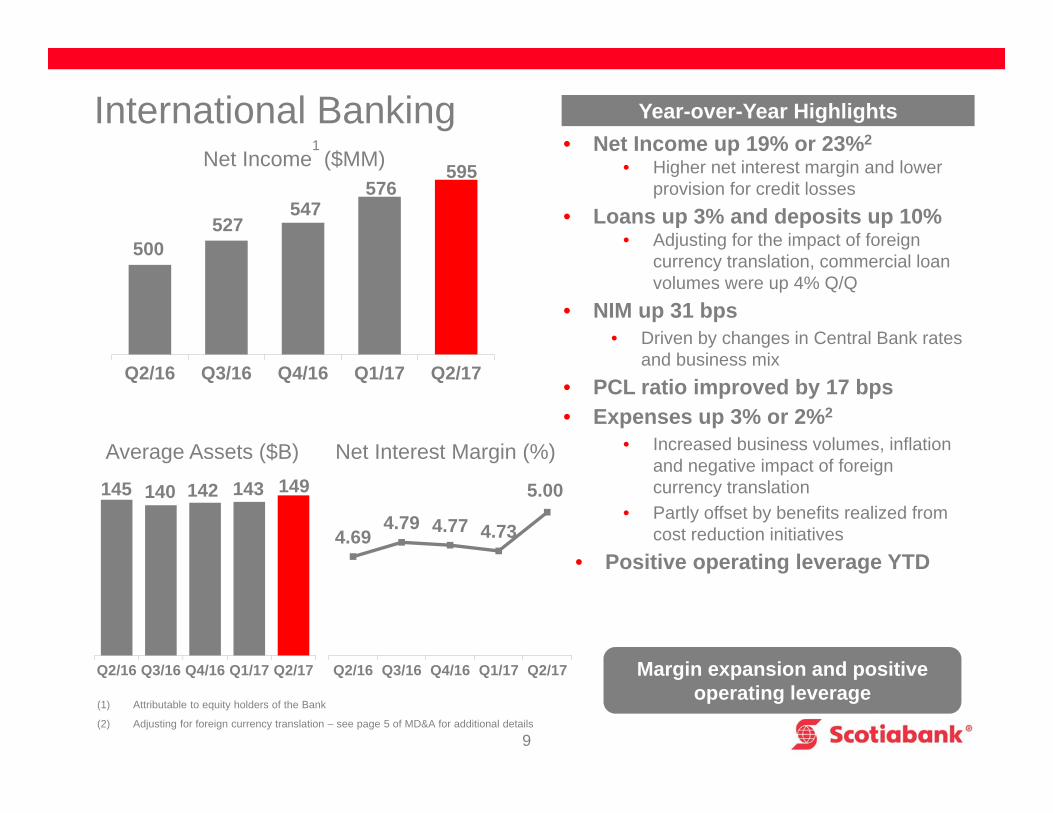
500527
547576
595
Q2/16 Q3/16 Q4/16 Q1/17 Q2/17
Net Income1
($MM)
(1) Attributable to equity holders of the Bank
(2) Adjusting for foreign currency translation – see page 5 of MD&A for additional details
• Net Income up 19% or 23%2
• Higher net interest margin and lower provision for credit losses
• Loans up 3% and deposits up 10%• Adjusting for the impact of foreign
currency translation, commercial loan volumes were up 4% Q/Q
• NIM up 31 bps• Driven by changes in Central Bank rates
and business mix• PCL ratio improved by 17 bps • Expenses up 3% or 2%2
• Increased business volumes, inflation and negative impact of foreign currency translation
• Partly offset by benefits realized from cost reduction initiatives
• Positive operating leverage YTD
Average Assets ($B)
145 140 142 143 149
Q2/16 Q3/16 Q4/16 Q1/17 Q2/17
Year-over-Year Highlights
4.694.79 4.77 4.73
5.00
Q2/16 Q3/16 Q4/16 Q1/17 Q2/17
Net Interest Margin (%)
Margin expansion and positive operating leverage
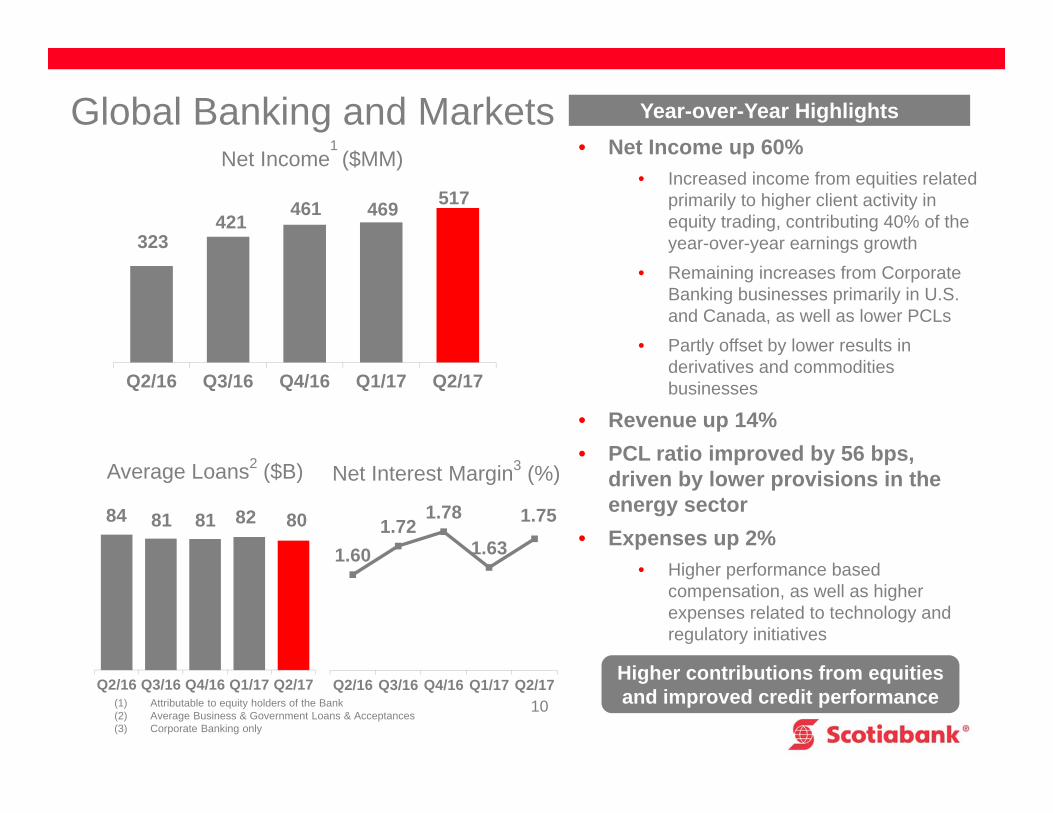
84 81 81 82 80
Q2/16 Q3/16 Q4/16 Q1/17 Q2/17
Global Banking and Markets
10
323421
461 469 517
Q2/16 Q3/16 Q4/16 Q1/17 Q2/17
Net Income1
($MM)
(1) Attributable to equity holders of the Bank(2) Average Business & Government Loans & Acceptances(3) Corporate Banking only
• Net Income up 60%• Increased income from equities related
primarily to higher client activity in equity trading, contributing 40% of the year-over-year earnings growth
• Remaining increases from Corporate Banking businesses primarily in U.S. and Canada, as well as lower PCLs
• Partly offset by lower results in derivatives and commodities businesses
• Revenue up 14%• PCL ratio improved by 56 bps,
driven by lower provisions in the energy sector
• Expenses up 2% • Higher performance based
compensation, as well as higher expenses related to technology and regulatory initiatives
Average Loans2 ($B)
Year-over-Year Highlights
1.601.72
1.78
1.63
1.75
Q2/16 Q3/16 Q4/16 Q1/17 Q2/17
Net Interest Margin3 (%)
Higher contributions from equities and improved credit performance
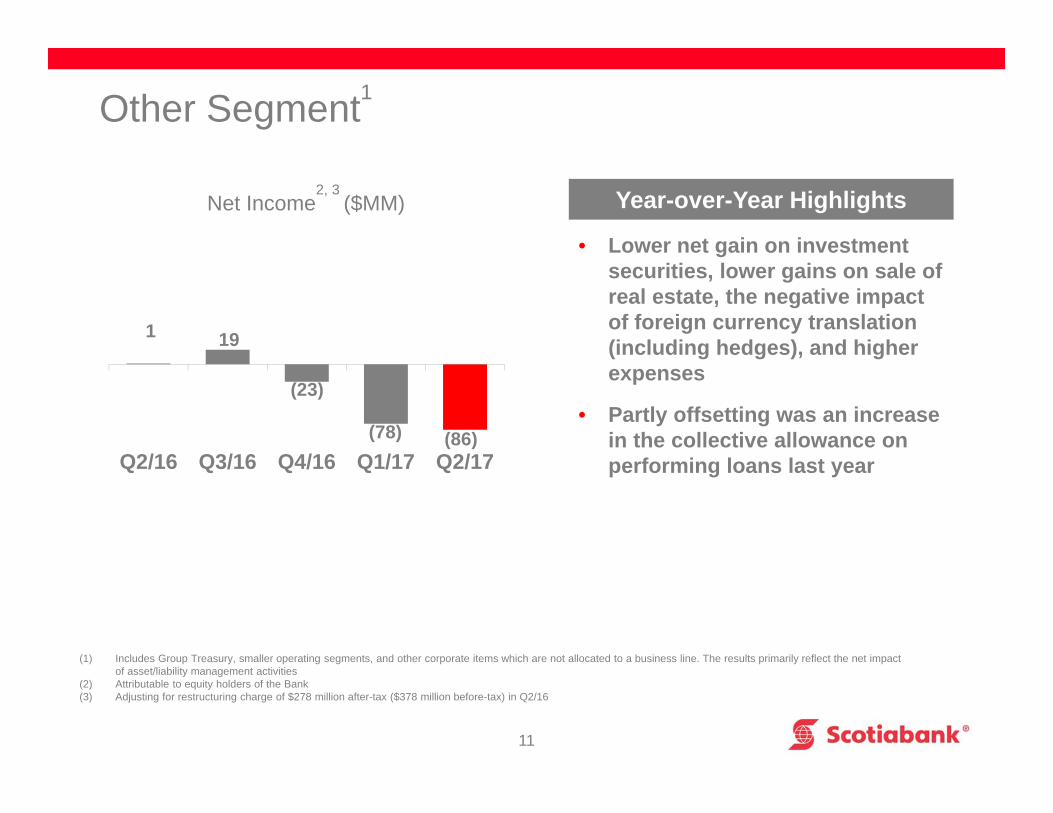
1 19
(23)
(78) (86)Q2/16 Q3/16 Q4/16 Q1/17 Q2/17
Other Segment1
11
Net Income2, 3
($MM)
(1) Includes Group Treasury, smaller operating segments, and other corporate items which are not allocated to a business line. The results primarily reflect the net impact of asset/liability management activities
(2) Attributable to equity holders of the Bank(3) Adjusting for restructuring charge of $278 million after-tax ($378 million before-tax) in Q2/16
Year-over-Year Highlights
• Lower net gain on investment securities, lower gains on sale of real estate, the negative impact of foreign currency translation (including hedges), and higher expenses
• Partly offsetting was an increase in the collective allowance on performing loans last year

Risk Review
Chief Risk Officer
Daniel Moore
Risk Review
13
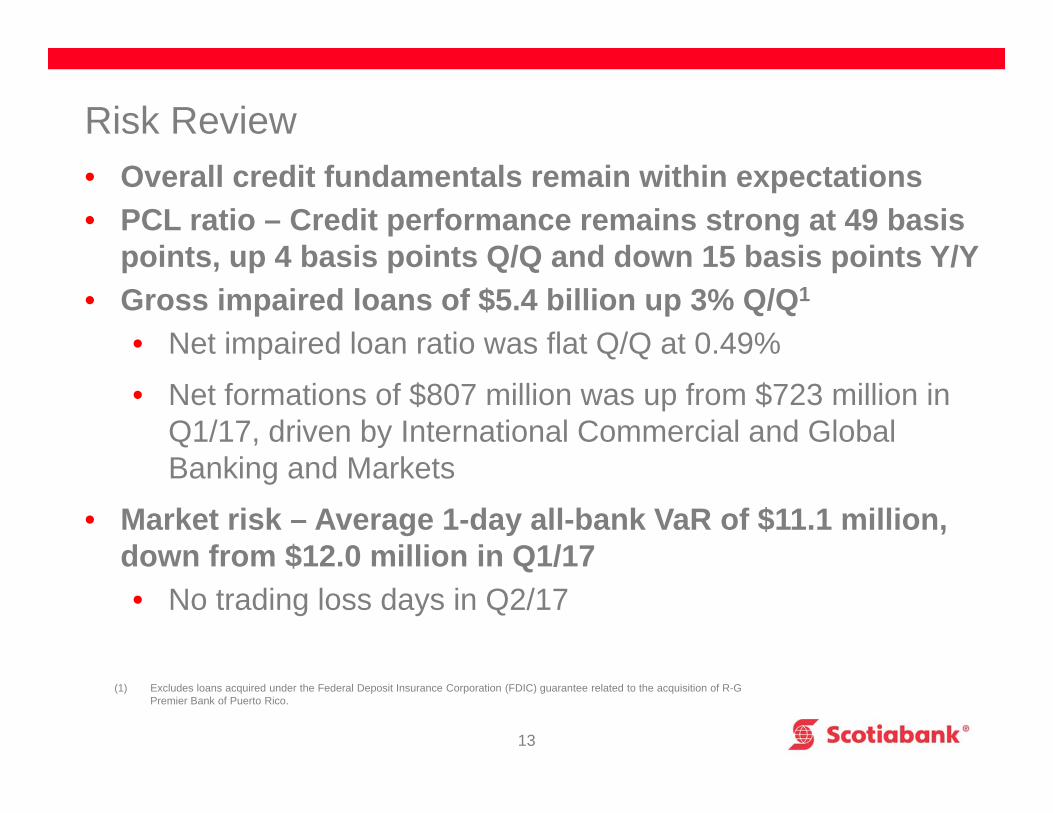
• Overall credit fundamentals remain within expectations • PCL ratio – Credit performance remains strong at 49 basis
points, up 4 basis points Q/Q and down 15 basis points Y/Y• Gross impaired loans of $5.4 billion up 3% Q/Q1
• Net impaired loan ratio was flat Q/Q at 0.49%
• Net formations of $807 million was up from $723 million in Q1/17, driven by International Commercial and Global Banking and Markets
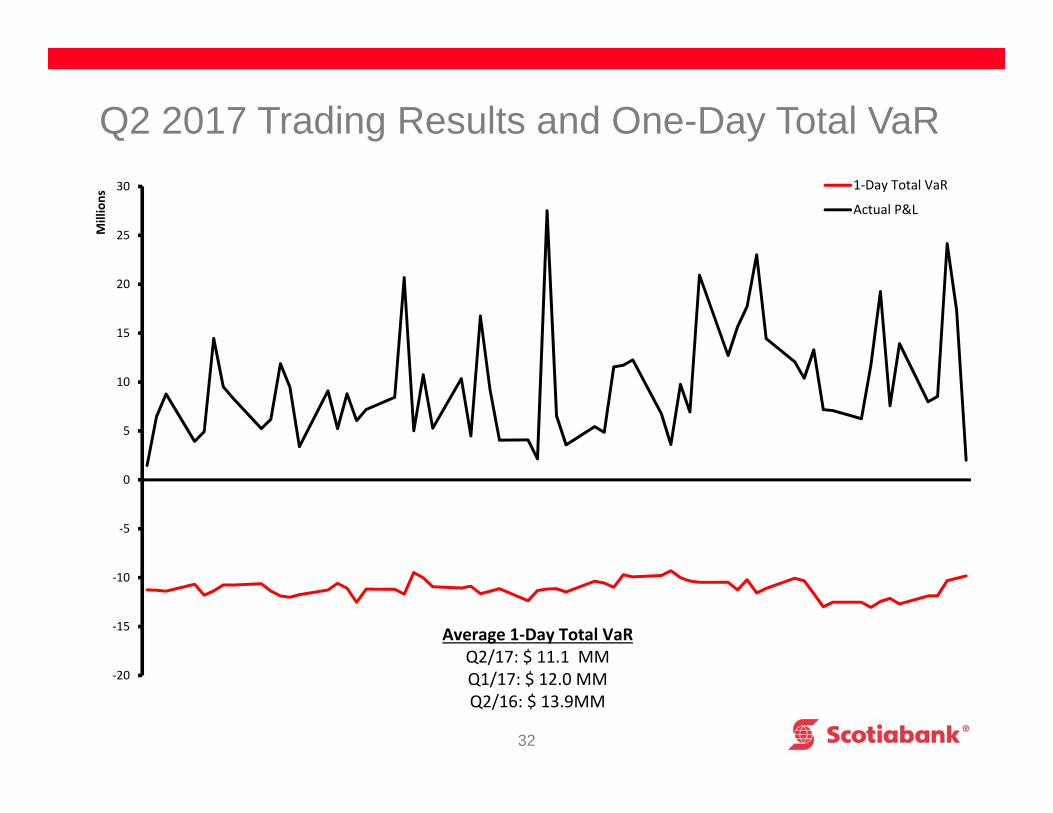
• Market risk – Average 1-day all-bank VaR of $11.1 million, down from $12.0 million in Q1/17• No trading loss days in Q2/17
(1) Excludes loans acquired under the Federal Deposit Insurance Corporation (FDIC) guarantee related to the acquisition of R-G Premier Bank of Puerto Rico.
PCL Ratios
14
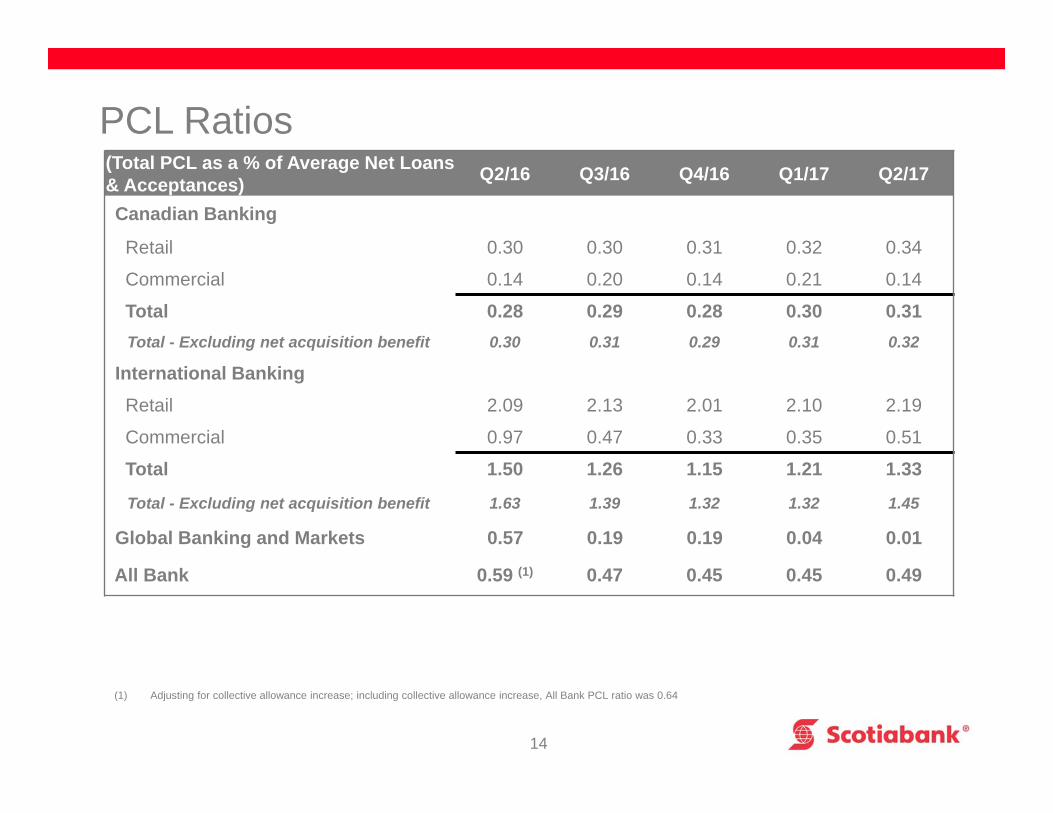
(Total PCL as a % of Average Net Loans & Acceptances) Q2/16 Q3/16 Q4/16 Q1/17 Q2/17
Canadian Banking
Retail 0.30 0.30 0.31 0.32 0.34
Commercial 0.14 0.20 0.14 0.21 0.14
Total 0.28 0.29 0.28 0.30 0.31Total - Excluding net acquisition benefit 0.30 0.31 0.29 0.31 0.32
International BankingRetail 2.09 2.13 2.01 2.10 2.19
Commercial 0.97 0.47 0.33 0.35 0.51
Total 1.50 1.26 1.15 1.21 1.33
Total - Excluding net acquisition benefit 1.63 1.39 1.32 1.32 1.45
Global Banking and Markets 0.57 0.19 0.19 0.04 0.01
All Bank 0.59 (1) 0.47 0.45 0.45 0.49
(1) Adjusting for collective allowance increase; including collective allowance increase, All Bank PCL ratio was 0.64

Appendix
Diluted EPS Reconciliation
16
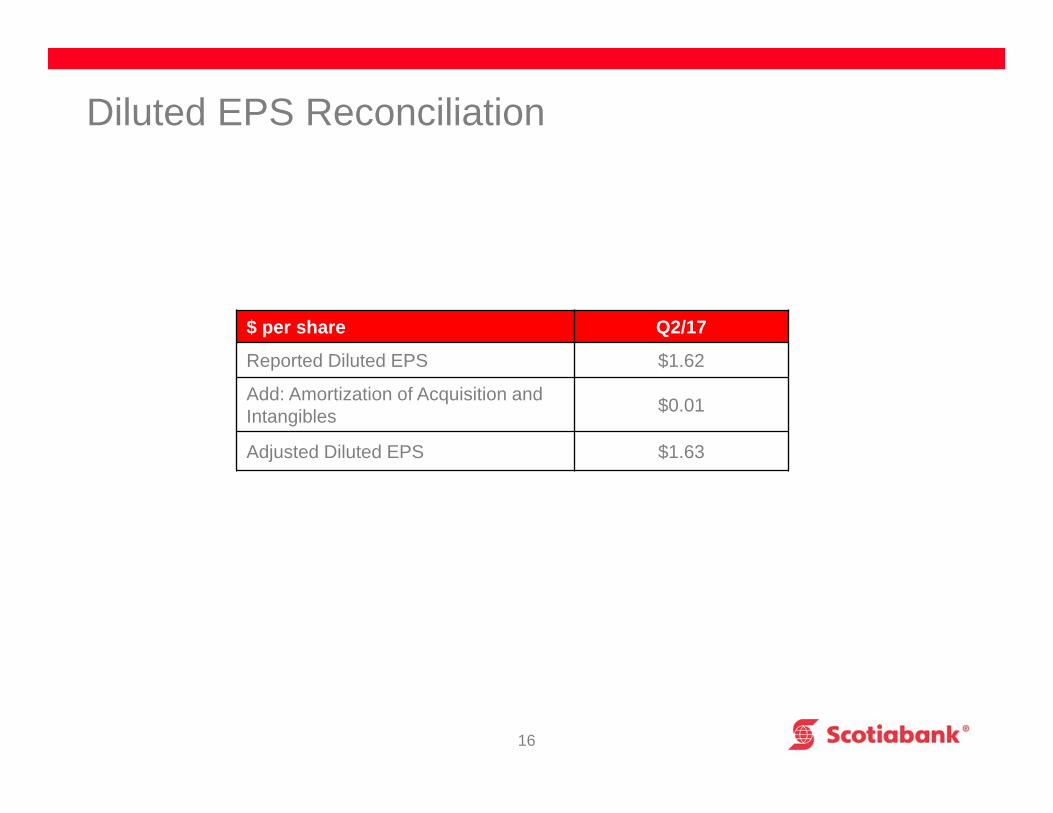
$ per share Q2/17
Reported Diluted EPS $1.62
Add: Amortization of Acquisition and Intangibles $0.01
Adjusted Diluted EPS $1.63
Core Banking Margin
17
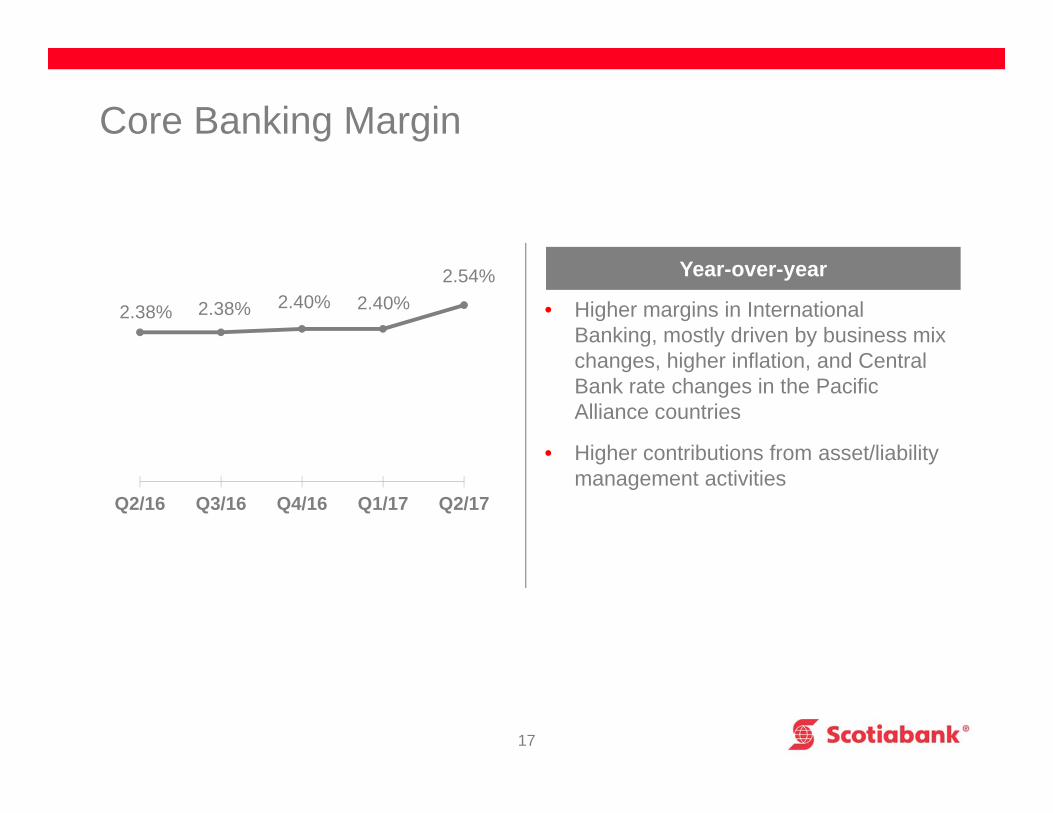
2.38% 2.38% 2.40% 2.40%2.54%
Q2/16 Q3/16 Q4/16 Q1/17 Q2/17
• Higher margins in International Banking, mostly driven by business mix changes, higher inflation, and Central Bank rate changes in the Pacific Alliance countries
• Higher contributions from asset/liability management activities
Year-over-year
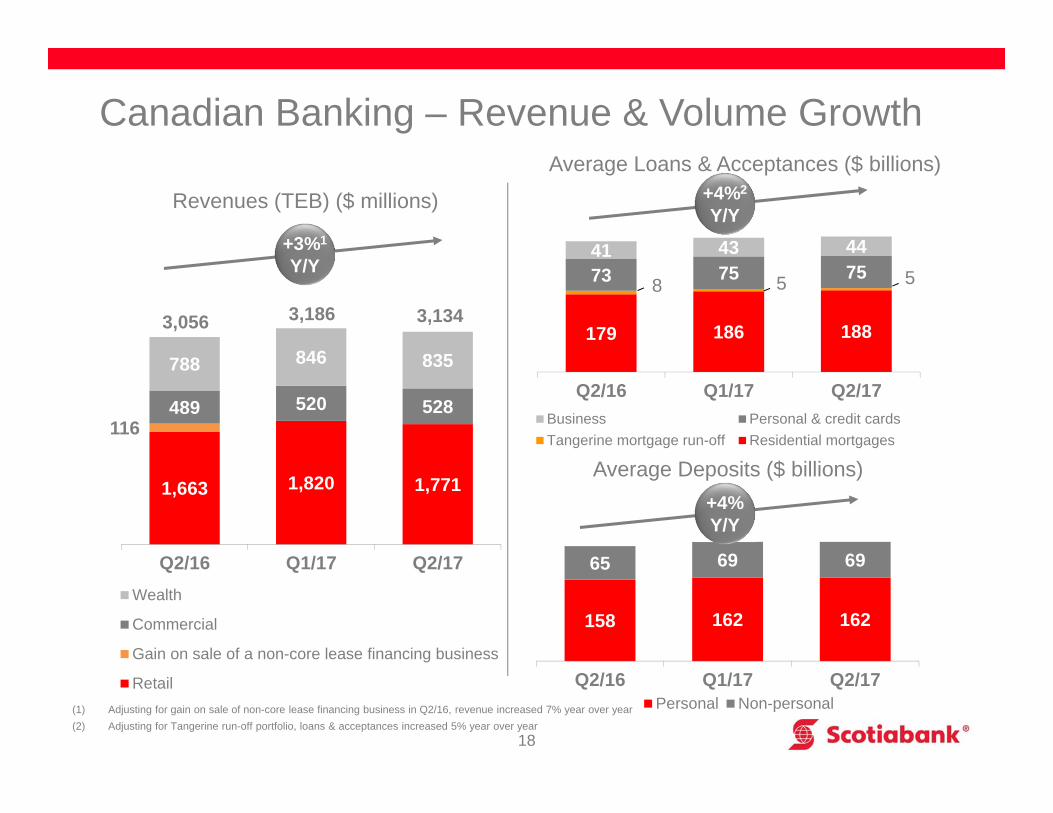
1,663 1,820 1,771
116 489 520 528
788 846 835
Q2/16 Q1/17 Q2/17Wealth
Commercial
Gain on sale of a non-core lease financing business
Retail
Canadian Banking – Revenue & Volume Growth
18
158 162 162
65 69 69
Q2/16 Q1/17 Q2/17Personal Non-personal
3,186179 186 188
8 5 573 75 75 41 43 44
Q2/16 Q1/17 Q2/17Business Personal & credit cardsTangerine mortgage run-off Residential mortgages
Average Loans & Acceptances ($ billions)
Average Deposits ($ billions)
+3%1
Y/Y
+4%2
Y/Y
+4%Y/Y
Revenues (TEB) ($ millions)
(1) Adjusting for gain on sale of non-core lease financing business in Q2/16, revenue increased 7% year over year (2) Adjusting for Tangerine run-off portfolio, loans & acceptances increased 5% year over year
3,056 3,134
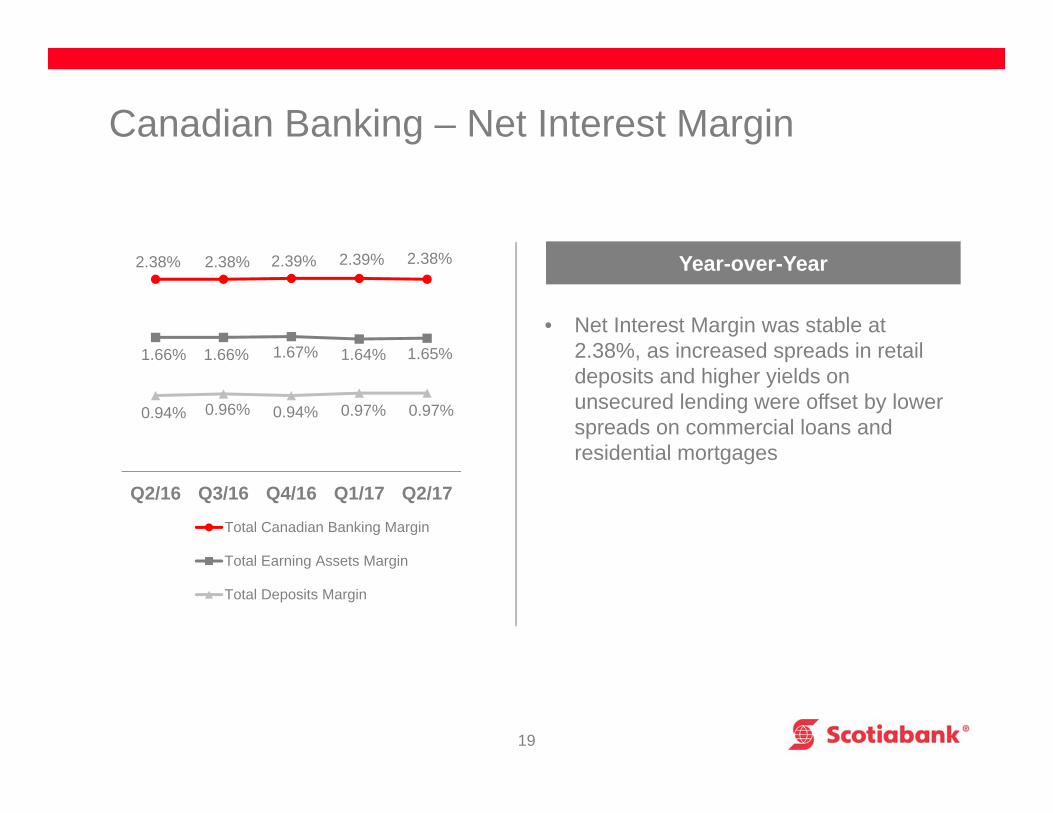
19
Canadian Banking – Net Interest Margin
Year-over-Year
• Net Interest Margin was stable at 2.38%, as increased spreads in retail deposits and higher yields on unsecured lending were offset by lower spreads on commercial loans and residential mortgages
2.38% 2.38% 2.39% 2.39% 2.38%
1.66% 1.66% 1.67% 1.64% 1.65%
0.94% 0.96% 0.94% 0.97% 0.97%
Q2/16 Q3/16 Q4/16 Q1/17 Q2/17
Total Canadian Banking Margin
Total Earning Assets Margin
Total Deposits Margin
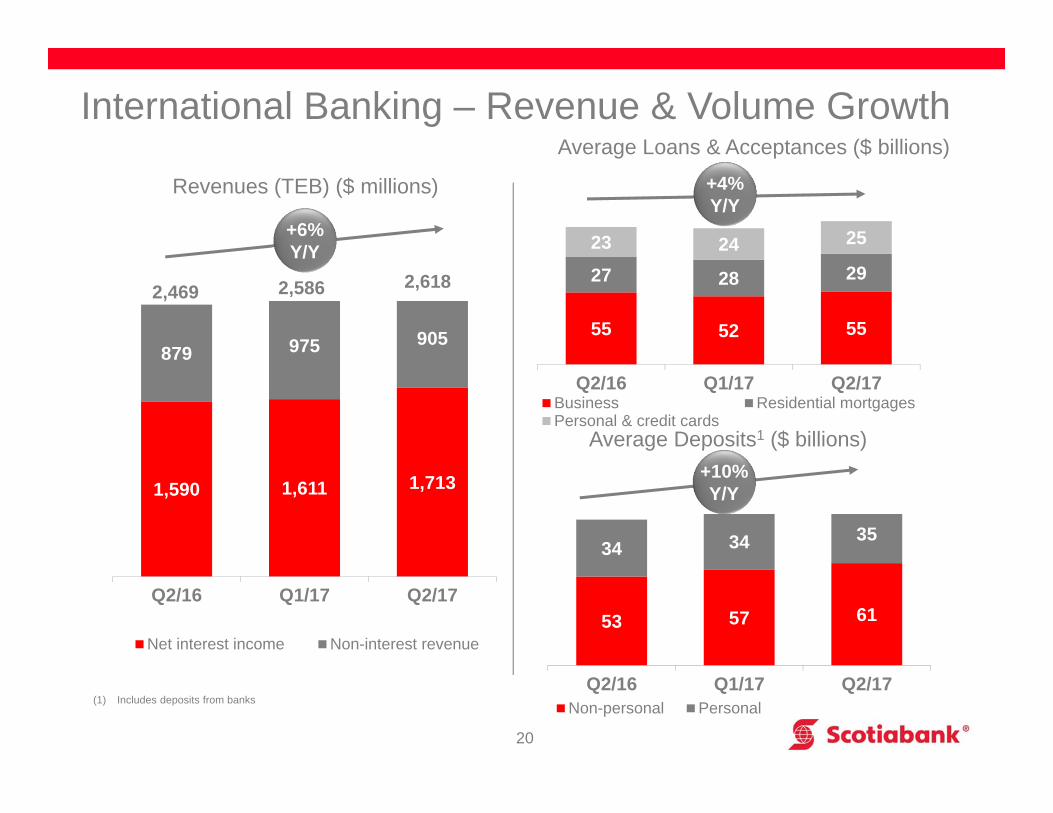
International Banking – Revenue & Volume Growth
20
1,590 1,611 1,713
879 975 905
Q2/16 Q1/17 Q2/17
Net interest income Non-interest revenue
55 52 55
27 28 29 23 24 25
Q2/16 Q1/17 Q2/17Business Residential mortgagesPersonal & credit cards
Average Loans & Acceptances ($ billions)
Average Deposits1 ($ billions)
+6%Y/Y
+4%Y/Y
+10%Y/Y
Revenues (TEB) ($ millions)
2,469 2,586
(1) Includes deposits from banks
53 57 61
34 34 35
Q2/16 Q1/17 Q2/17Non-personal Personal
2,618
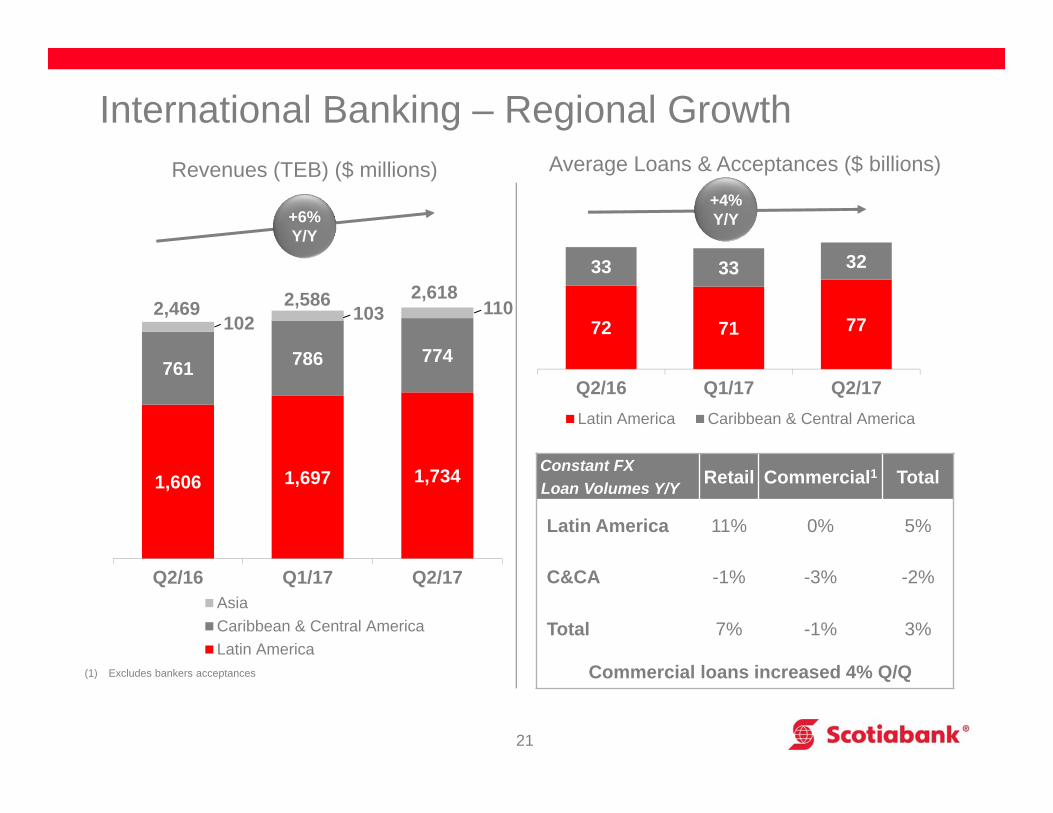
21
72 71 77
33 33 32
Q2/16 Q1/17 Q2/17Latin America Caribbean & Central America
Average Loans & Acceptances ($ billions)
+6%Y/Y
+4%Y/Y
Revenues (TEB) ($ millions)
International Banking – Regional Growth
1,606 1,697 1,734
761 786 774
102 103 110
Q2/16 Q1/17 Q2/17AsiaCaribbean & Central AmericaLatin America
2,586 2,618
Constant FX Loan Volumes Y/Y Retail Commercial1 Total
Latin America 11% 0% 5%
C&CA -1% -3% -2%
Total 7% -1% 3%
Commercial loans increased 4% Q/Q(1) Excludes bankers acceptances
2,469
22
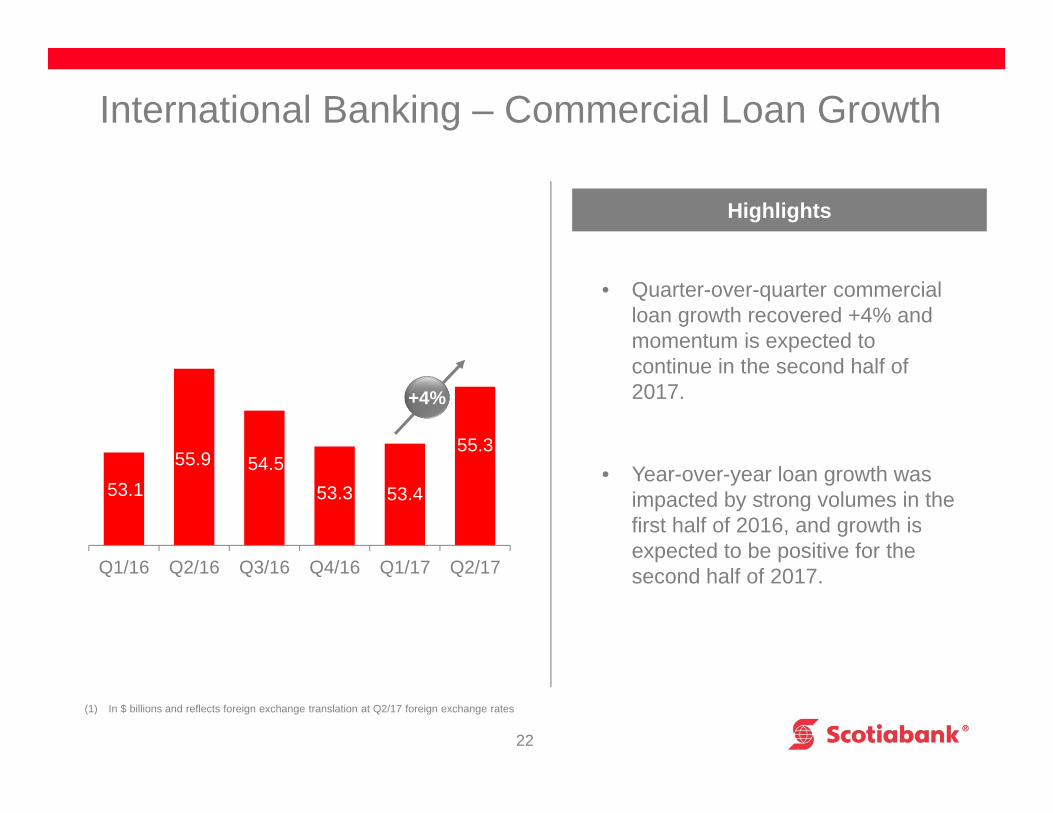
International Banking – Commercial Loan Growth
• Quarter-over-quarter commercial loan growth recovered +4% and momentum is expected to continue in the second half of 2017.
• Year-over-year loan growth was impacted by strong volumes in the first half of 2016, and growth is expected to be positive for the second half of 2017.
Highlights
53.155.9 54.5
53.3 53.4
55.3
Q1/16 Q2/16 Q3/16 Q4/16 Q1/17 Q2/17
+4%
(1) In $ billions and reflects foreign exchange translation at Q2/17 foreign exchange rates
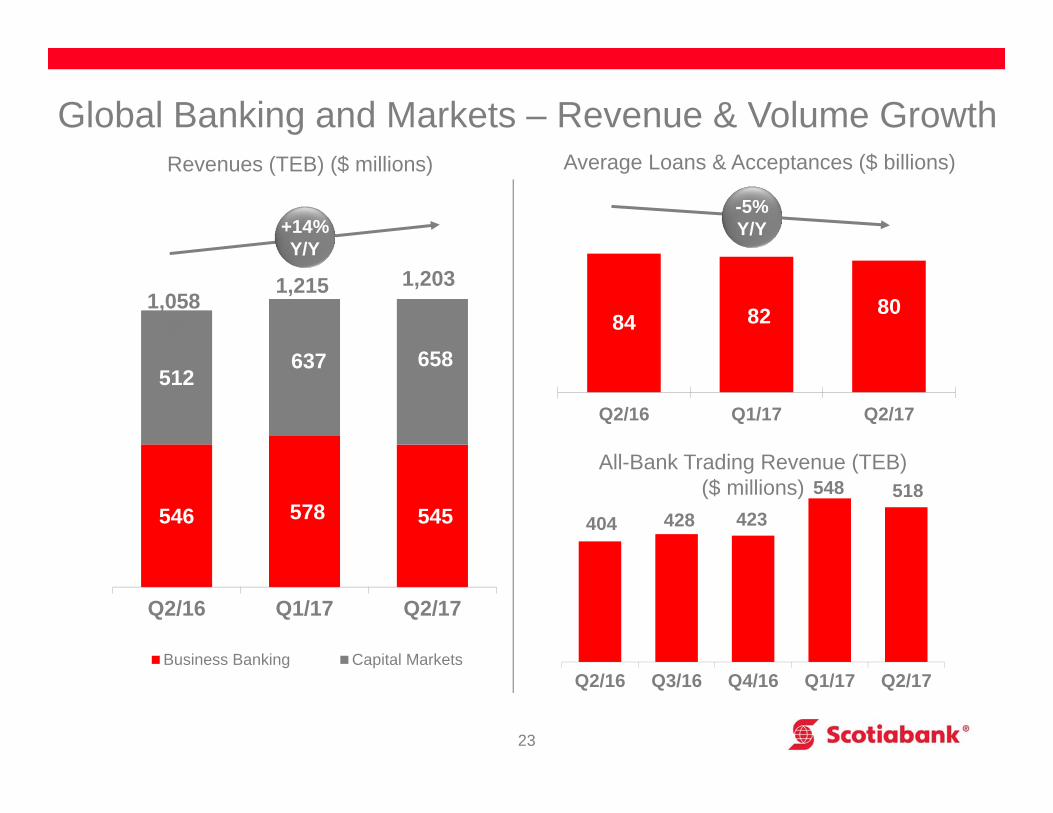
Global Banking and Markets – Revenue & Volume Growth
23
546 578 545
512637 658
Q2/16 Q1/17 Q2/17
Business Banking Capital Markets
1,203
929
1,215
+14%Y/Y
Revenues (TEB) ($ millions)
84 82 80
Q2/16 Q1/17 Q2/17
All-Bank Trading Revenue (TEB)($ millions)
-5%Y/Y
Average Loans & Acceptances ($ billions)
404 428 423548 518
Q2/16 Q3/16 Q4/16 Q1/17 Q2/17
1,058

Economic Outlook in Key Markets
24
Real GDP (Annual % Change)
Country 2000-15 Avg. 2016A 2017F 2018F
Mexico 2.4 2.3 2.0 2.5Peru 5.3 3.9 2.5 3.7Chile 4.3 1.6 1.8 2.4Colombia 4.3 2.0 2.0 2.8
2000-15 Avg. 2016A 2017F 2018F
Canada 2.2 1.4 2.5 2.0U.S. 1.9 1.6 2.2 2.4
Source: Scotia Economics, as of May 3, 2017
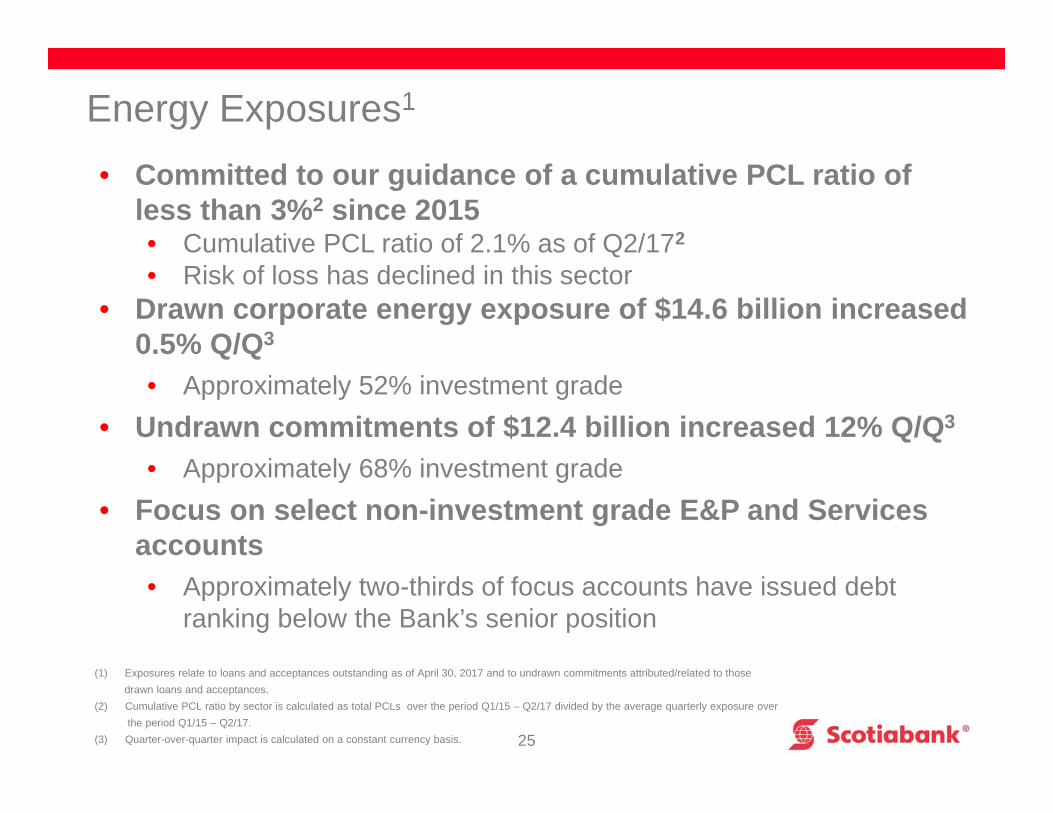
• Committed to our guidance of a cumulative PCL ratio of less than 3%2 since 2015• Cumulative PCL ratio of 2.1% as of Q2/172
• Risk of loss has declined in this sector • Drawn corporate energy exposure of $14.6 billion increased
0.5% Q/Q3
• Approximately 52% investment grade• Undrawn commitments of $12.4 billion increased 12% Q/Q3
• Approximately 68% investment grade• Focus on select non-investment grade E&P and Services
accounts • Approximately two-thirds of focus accounts have issued debt
ranking below the Bank’s senior position
Energy Exposures1
25
(1) Exposures relate to loans and acceptances outstanding as of April 30, 2017 and to undrawn commitments attributed/related to those drawn loans and acceptances.
(2) Cumulative PCL ratio by sector is calculated as total PCLs over the period Q1/15 – Q2/17 divided by the average quarterly exposure over the period Q1/15 – Q2/17.
(3) Quarter-over-quarter impact is calculated on a constant currency basis.
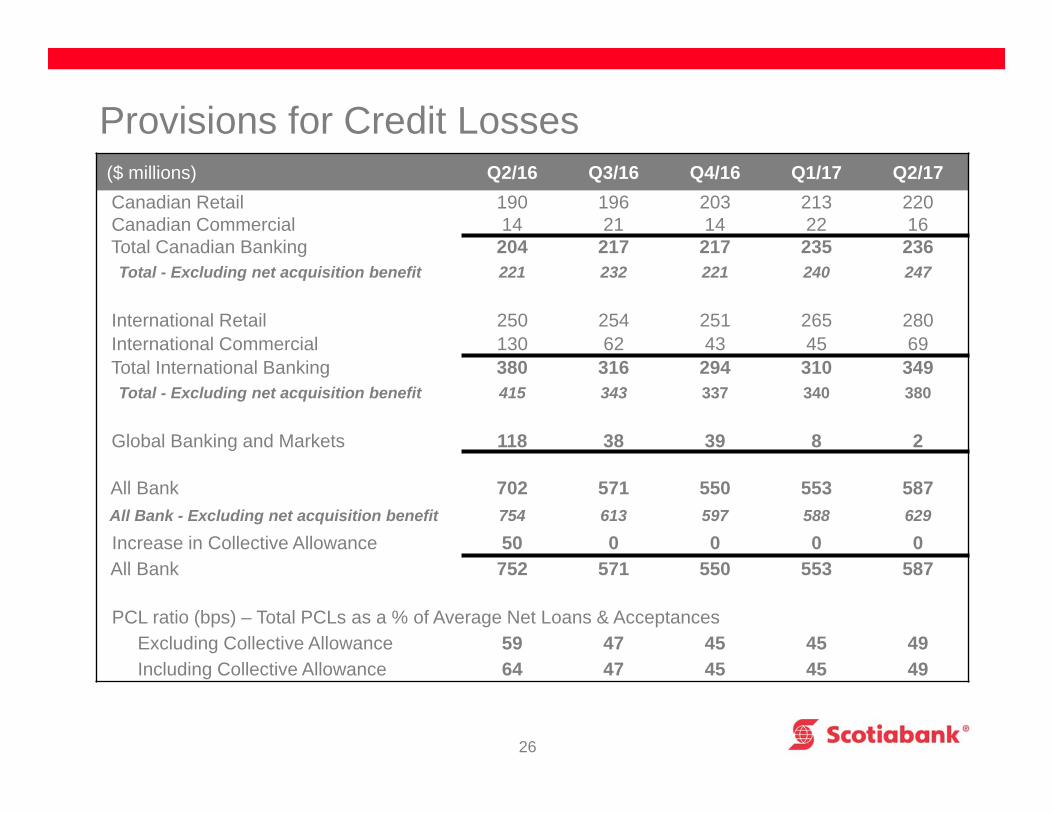
Provisions for Credit Losses
26
($ millions) Q2/16 Q3/16 Q4/16 Q1/17 Q2/17Canadian Retail 190 196 203 213 220Canadian Commercial 14 21 14 22 16Total Canadian Banking 204 217 217 235 236Total - Excluding net acquisition benefit 221 232 221 240 247
International Retail 250 254 251 265 280International Commercial 130 62 43 45 69Total International Banking 380 316 294 310 349Total - Excluding net acquisition benefit 415 343 337 340 380
Global Banking and Markets 118 38 39 8 2
All Bank 702 571 550 553 587All Bank - Excluding net acquisition benefit 754 613 597 588 629
Increase in Collective Allowance 50 0 0 0 0All Bank 752 571 550 553 587
PCL ratio (bps) – Total PCLs as a % of Average Net Loans & Acceptances Excluding Collective Allowance 59 47 45 45 49Including Collective Allowance 64 47 45 45 49
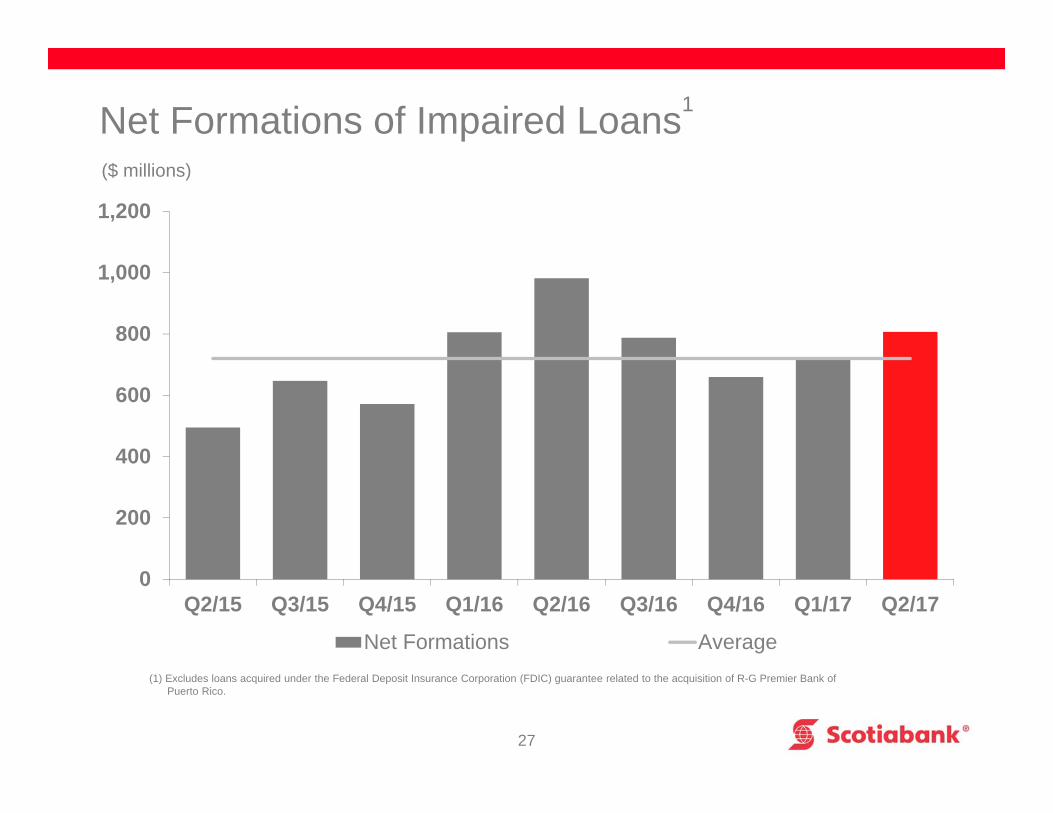
Net Formations of Impaired Loans1
27
(1) Excludes loans acquired under the Federal Deposit Insurance Corporation (FDIC) guarantee related to the acquisition of R-G Premier Bank of Puerto Rico.
($ millions)
0
200
400
600
800
1,000
1,200
Q2/15 Q3/15 Q4/15 Q1/16 Q2/16 Q3/16 Q4/16 Q1/17 Q2/17
Net Formations Average
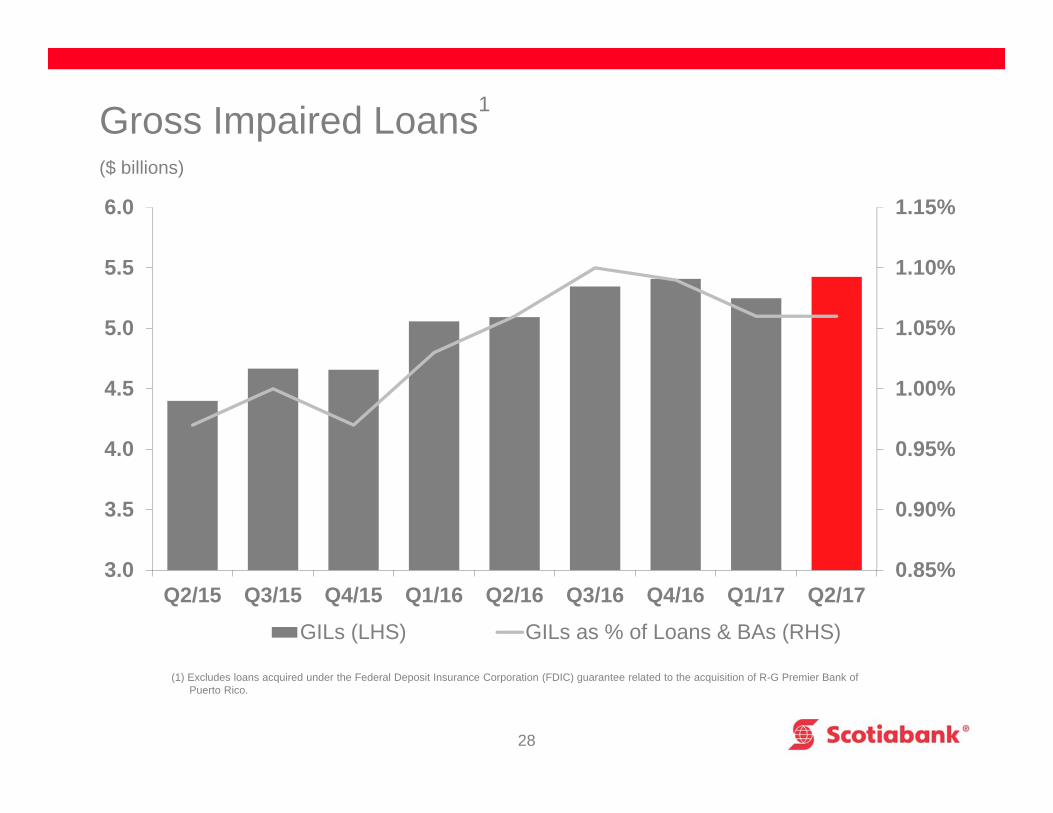
Gross Impaired Loans1
28
($ billions)
(1) Excludes loans acquired under the Federal Deposit Insurance Corporation (FDIC) guarantee related to the acquisition of R-G Premier Bank of Puerto Rico.
0.85%
0.90%
0.95%
1.00%
1.05%
1.10%
1.15%
3.0
3.5
4.0
4.5
5.0
5.5
6.0
Q2/15 Q3/15 Q4/15 Q1/16 Q2/16 Q3/16 Q4/16 Q1/17 Q2/17GILs (LHS) GILs as % of Loans & BAs (RHS)
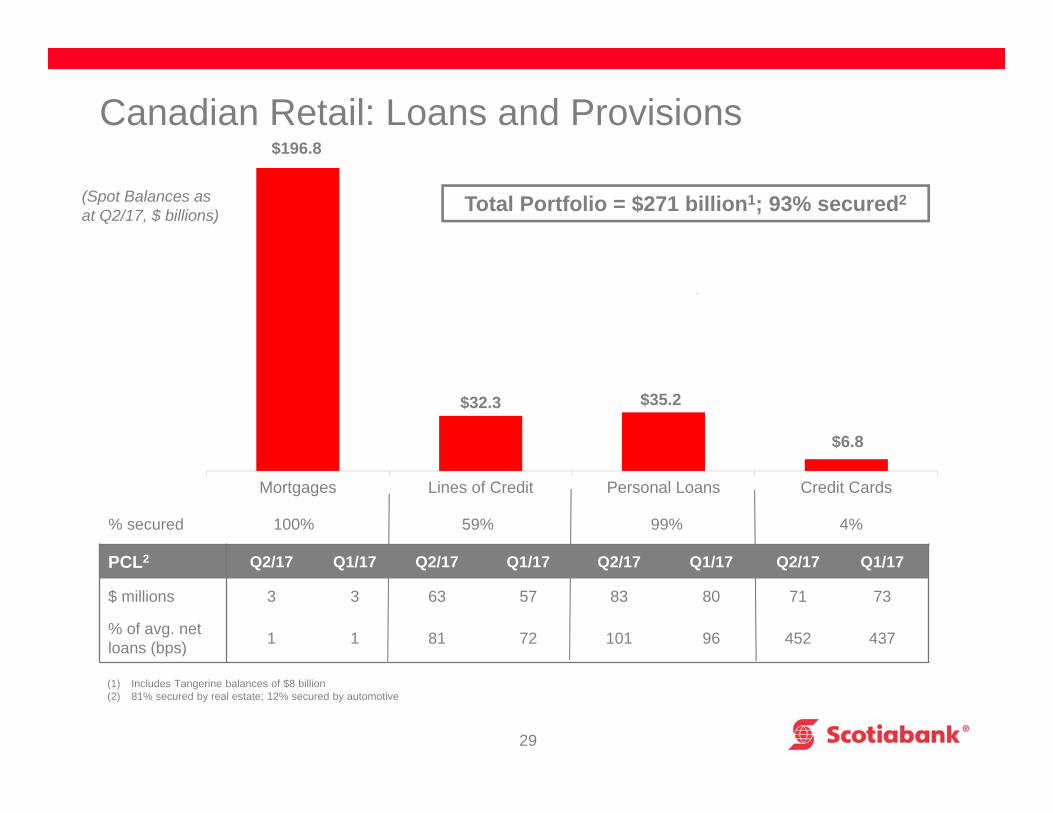
$196.8
$32.3 $35.2
$6.8
Mortgages Lines of Credit Personal Loans Credit Cards
.
Canadian Retail: Loans and Provisions
(Spot Balances as at Q2/17, $ billions) Total Portfolio = $271 billion1; 93% secured2
% secured 100% 59% 99% 4%
29
(1) Includes Tangerine balances of $8 billion(2) 81% secured by real estate; 12% secured by automotive
PCL2 Q2/17 Q1/17 Q2/17 Q1/17 Q2/17 Q1/17 Q2/17 Q1/17
$ millions 3 3 63 57 83 80 71 73
% of avg. netloans (bps) 1 1 81 72 101 96 452 437
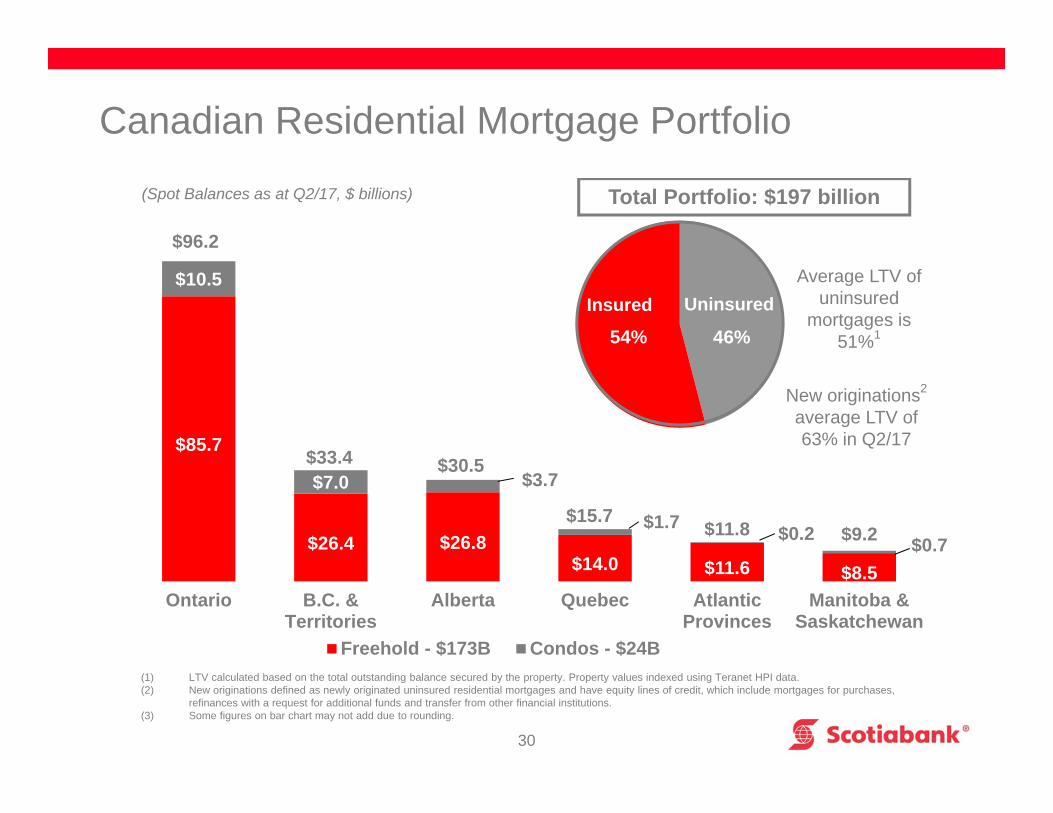
$85.7
$26.4 $26.8$14.0 $11.6 $8.5
$10.5
$7.0 $3.7
$1.7 $0.2
Ontario B.C. &Territories
Alberta Quebec AtlanticProvinces
Manitoba &Saskatchewan
Freehold - $173B Condos - $24B
(Spot Balances as at Q2/17, $ billions) Total Portfolio: $197 billion
New originations2
average LTV of 63% in Q2/17
30
(1) LTV calculated based on the total outstanding balance secured by the property. Property values indexed using Teranet HPI data.(2) New originations defined as newly originated uninsured residential mortgages and have equity lines of credit, which include mortgages for purchases,
refinances with a request for additional funds and transfer from other financial institutions. (3) Some figures on bar chart may not add due to rounding.
46%54%
Average LTV of uninsured
mortgages is 51%1
Uninsured
$96.2
$33.4 $30.5
$15.7$11.8 $9.2
Canadian Residential Mortgage Portfolio
$0.7
Insured
31
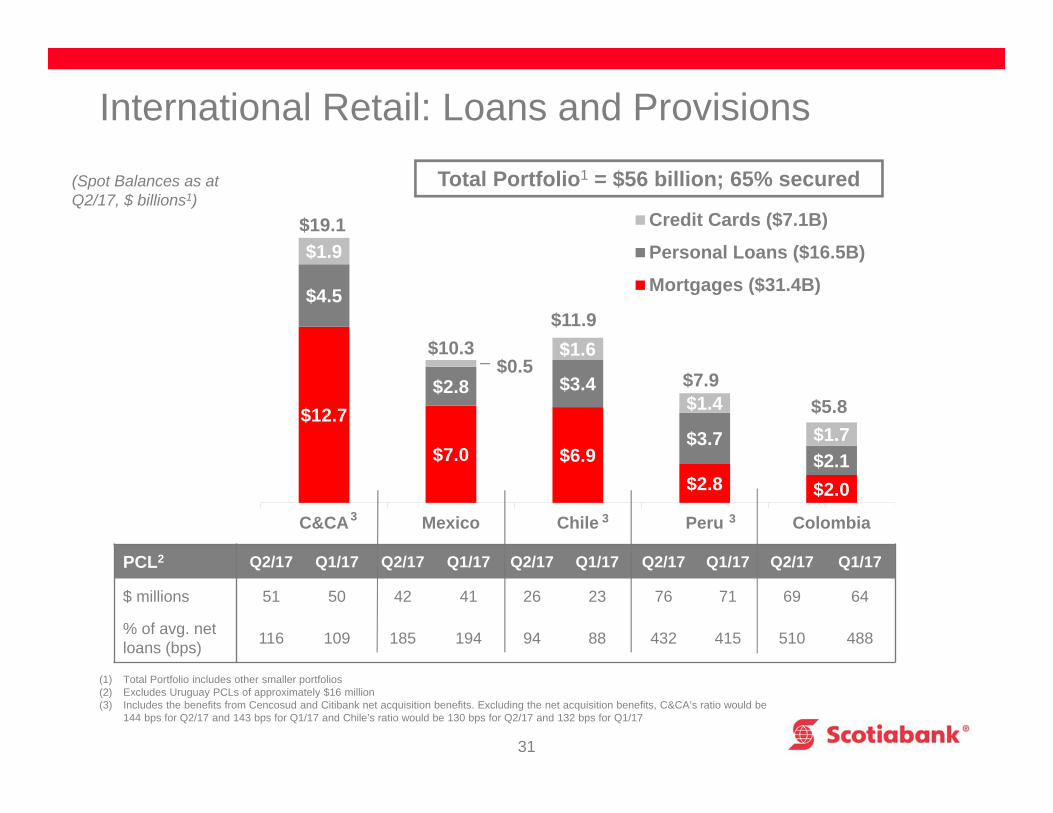
International Retail: Loans and Provisions
$12.7
$7.0 $6.9$2.8 $2.0
$4.5
$2.8 $3.4
$3.7$2.1
$1.9
$1.6
$1.4$1.7
C&CA Mexico Chile Peru Colombia
Credit Cards ($7.1B)
Personal Loans ($16.5B)
Mortgages ($31.4B)
$19.1
$10.3$11.9
$7.9$5.8
PCL2 Q2/17 Q1/17 Q2/17 Q1/17 Q2/17 Q1/17 Q2/17 Q1/17 Q2/17 Q1/17
$ millions 51 50 42 41 26 23 76 71 69 64
% of avg. netloans (bps) 116 109 185 194 94 88 432 415 510 488
(1) Total Portfolio includes other smaller portfolios(2) Excludes Uruguay PCLs of approximately $16 million(3) Includes the benefits from Cencosud and Citibank net acquisition benefits. Excluding the net acquisition benefits, C&CA’s ratio would be
144 bps for Q2/17 and 143 bps for Q1/17 and Chile’s ratio would be 130 bps for Q2/17 and 132 bps for Q1/17
$0.5
Total Portfolio1 = $56 billion; 65% secured(Spot Balances as at Q2/17, $ billions1)
33 3
32
Q2 2017 Trading Results and One-Day Total VaR
‐20
‐15
‐10
‐5
0
5
10
15
20
25
30
Millions
1‐Day Total VaR
Actual P&L
Average 1‐Day Total VaRQ2/17: $ 11.1 MMQ1/17: $ 12.0 MMQ2/16: $ 13.9MM
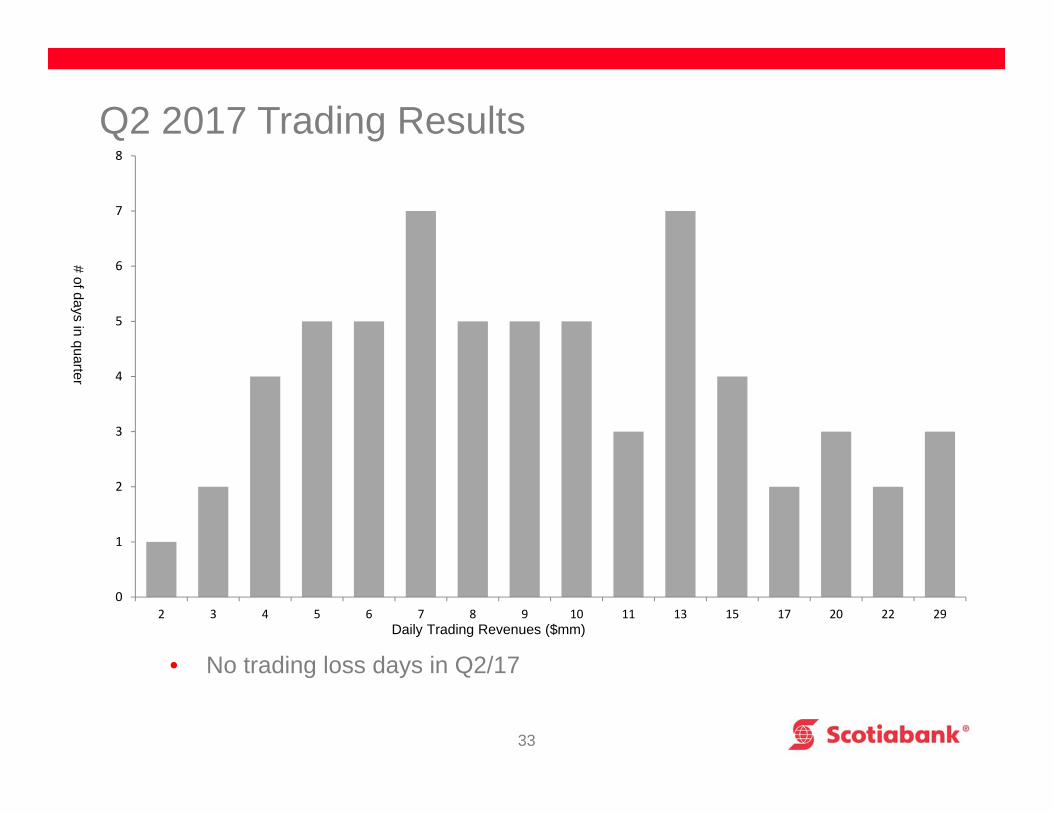
• No trading loss days in Q2/17Daily Trading Revenues ($mm)
Q2 2017 Trading Results
33
# of days in quarter
0
1
2
3
4
5
6
7
8
2 3 4 5 6 7 8 9 10 11 13 15 17 20 22 29
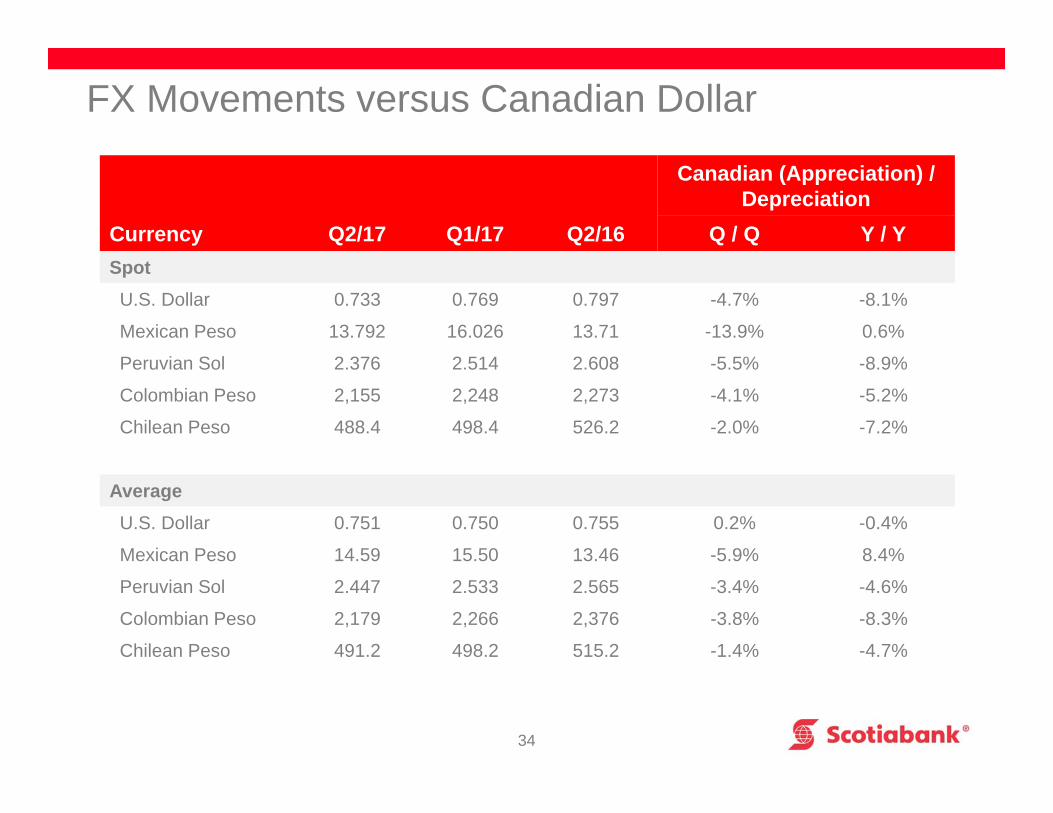
FX Movements versus Canadian Dollar
34
Currency Q2/17 Q1/17 Q2/16
Canadian (Appreciation) / Depreciation
Q / Q Y / YSpotU.S. Dollar 0.733 0.769 0.797 -4.7% -8.1%
Mexican Peso 13.792 16.026 13.71 -13.9% 0.6%
Peruvian Sol 2.376 2.514 2.608 -5.5% -8.9%
Colombian Peso 2,155 2,248 2,273 -4.1% -5.2%
Chilean Peso 488.4 498.4 526.2 -2.0% -7.2%
AverageU.S. Dollar 0.751 0.750 0.755 0.2% -0.4%
Mexican Peso 14.59 15.50 13.46 -5.9% 8.4%
Peruvian Sol 2.447 2.533 2.565 -3.4% -4.6%
Colombian Peso 2,179 2,266 2,376 -3.8% -8.3%
Chilean Peso 491.2 498.2 515.2 -1.4% -4.7%


