Embed Size (px)
Citation preview
NanoDefine project Final report
Final publishable summary report
Contents Executive summary ............................................................................................... 2
Summary description of project context and objectives .............................................. 4
Description of the main S&T results/foregrounds ....................................................... 7
Summary of main work implemented during the 4 years project duration .................. 8
Description of main S&T results/foreground achieved with the different WPs .............10
WP1: Test and reference materials ....................................................................10
WP2: Sample preparation, dispersion & sampling methods ...................................12
WP3: Evaluation and selection of techniques and methodologies ...........................14
WP4: Screening methods (tier 1 methods) .........................................................18
WP5: Confirmatory methods (tier 2 methods) .....................................................20
WP6: Validation and standardization .................................................................23
WP7: Implementation: NanoDefiner e-Tool, Manual & case studies .......................27
Potential impact, main dissemination activities and exploitation of results....................30
Summary on impact and dissemination/exploitation activities for each technical WP ..30
Impact on employment and education ..................................................................36
Address of project public website and relevant contact details. ...................................37
NanoDefine project Final report
2
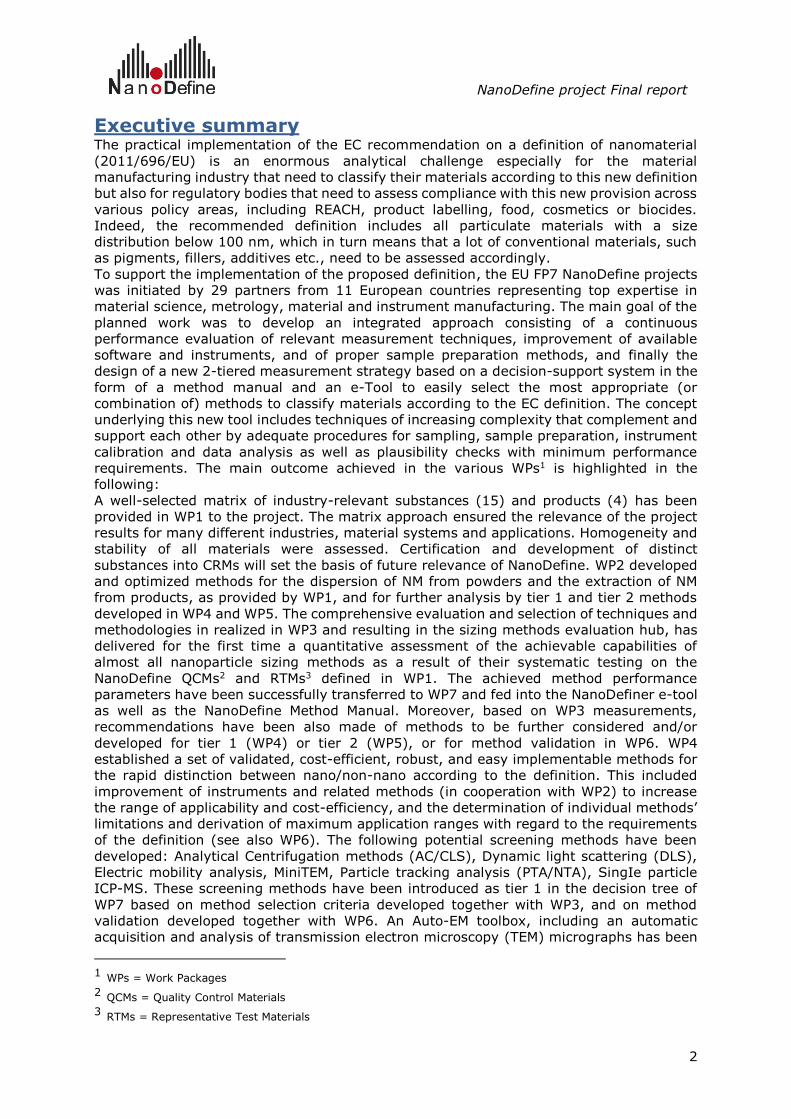
Executive summary The practical implementation of the EC recommendation on a definition of nanomaterial
(2011/696/EU) is an enormous analytical challenge especially for the material
manufacturing industry that need to classify their materials according to this new definition
but also for regulatory bodies that need to assess compliance with this new provision across
various policy areas, including REACH, product labelling, food, cosmetics or biocides.
Indeed, the recommended definition includes all particulate materials with a size
distribution below 100 nm, which in turn means that a lot of conventional materials, such
as pigments, fillers, additives etc., need to be assessed accordingly.
To support the implementation of the proposed definition, the EU FP7 NanoDefine projects
was initiated by 29 partners from 11 European countries representing top expertise in
material science, metrology, material and instrument manufacturing. The main goal of the
planned work was to develop an integrated approach consisting of a continuous
performance evaluation of relevant measurement techniques, improvement of available
software and instruments, and of proper sample preparation methods, and finally the
design of a new 2-tiered measurement strategy based on a decision-support system in the
form of a method manual and an e-Tool to easily select the most appropriate (or
combination of) methods to classify materials according to the EC definition. The concept
underlying this new tool includes techniques of increasing complexity that complement and
support each other by adequate procedures for sampling, sample preparation, instrument
calibration and data analysis as well as plausibility checks with minimum performance
requirements. The main outcome achieved in the various WPs1 is highlighted in the
following:
A well-selected matrix of industry-relevant substances (15) and products (4) has been
provided in WP1 to the project. The matrix approach ensured the relevance of the project
results for many different industries, material systems and applications. Homogeneity and
stability of all materials were assessed. Certification and development of distinct
substances into CRMs will set the basis of future relevance of NanoDefine. WP2 developed
and optimized methods for the dispersion of NM from powders and the extraction of NM
from products, as provided by WP1, and for further analysis by tier 1 and tier 2 methods
developed in WP4 and WP5. The comprehensive evaluation and selection of techniques and
methodologies in realized in WP3 and resulting in the sizing methods evaluation hub, has
delivered for the first time a quantitative assessment of the achievable capabilities of
almost all nanoparticle sizing methods as a result of their systematic testing on the
NanoDefine QCMs2 and RTMs3 defined in WP1. The achieved method performance
parameters have been successfully transferred to WP7 and fed into the NanoDefiner e-tool
as well as the NanoDefine Method Manual. Moreover, based on WP3 measurements,
recommendations have been also made of methods to be further considered and/or
developed for tier 1 (WP4) or tier 2 (WP5), or for method validation in WP6. WP4
established a set of validated, cost-efficient, robust, and easy implementable methods for
the rapid distinction between nano/non-nano according to the definition. This included
improvement of instruments and related methods (in cooperation with WP2) to increase
the range of applicability and cost-efficiency, and the determination of individual methods’
limitations and derivation of maximum application ranges with regard to the requirements
of the definition (see also WP6). The following potential screening methods have been
developed: Analytical Centrifugation methods (AC/CLS), Dynamic light scattering (DLS),
Electric mobility analysis, MiniTEM, Particle tracking analysis (PTA/NTA), SingIe particle
ICP-MS. These screening methods have been introduced as tier 1 in the decision tree of
WP7 based on method selection criteria developed together with WP3, and on method
validation developed together with WP6. An Auto-EM toolbox, including an automatic
acquisition and analysis of transmission electron microscopy (TEM) micrographs has been
1 WPs = Work Packages 2 QCMs = Quality Control Materials 3 RTMs = Representative Test Materials
NanoDefine project Final report
3
the major outcome in WP5. This novel EM technique allows classifying a material as a
nanomaterial according to the EC definition with reduced user-bias. Another major
outcome of WP5 consists in new standard operating procedures (SOPs) for determining the
median diameter (D50 / x50) of the number-based particle size distribution of titanium
dioxide (TiO2) particles in sunscreen and aluminium oxide (Al2O3) particles in toothpaste,
respectively, by asymmetric flow field-flow fractionation (AF4) coupled to multi angle light
scattering (MALS) and inductively coupled plasma-mass spectrometry (ICP-MS).
In WP6, a common guideline for in-house validations was developed and agreed by all
partners assuring a harmonized in-house validation over the various methods and work
packages. Apart from this guidance, harmonized in-house validation was assured through
common templates and continuous support from the JRC. A special project was started
under VAMAS and an international call for inter-laboratory validation exercises launched.
These validation studies were conducted and evaluated for 8 methods, some of them
showing fitness for purpose, while others still need further optimisation. Liaison with the
standardisation committee CEN/TC352 was realized and contribution to many
standardisation committees provided. The NanoDefine Methods Manual was proposed to
CEN/TC352 as a New Work Item Proposal.
WP7 pooled all findings from all other work packages to implement the project results for
the primary interest groups: regulators and enterprises. Its main products are a decision
support flow scheme, which is implemented also in an e-tool, a material classification
system and the NanoDefine Methods Manual. WP7 also prepared recommendations on a
revision of the EC Definition of nanomaterial, based on analytical possibilities.

NanoDefine project Final report
4
Summary description of project context and objectives One of the main purpose of NanoDefine is to develop a new and reliable measurement
strategy and approach that can support potential end-users, such as the manufacturing
industry and regulatory bodies to implement the EU Definition (2011/696/EU). To cover
the vast spectrum of diversity and complexity of existing and newly emerging materials,
the concept of NanoDefine has been built upon a new 2-tiered approach consisting of (1)
rapid and cost-effective screening methods that rather easily identify nanomaterials (NM)
in substances or product formulations, and of (2) confirmatory techniques that complement
these screening methods and match more difficult materials with complex matrices, such
as industrial or consumer products.
Although the EU definition of nanomaterial is solely based on determining the number
based size distribution of the constituent particles of a material, including agglomerates
and aggregates, without relating to any specific functional or hazard properties, it can be
also used as reference across different policy areas and legislations such as chemicals
(REACH) or product labelling, food, cosmetics or biocides. Accordingly, the 2-tiered
approach developed by NanoDefine does not only help to classify materials as nano or non-
nano according to the EU Nano-Definition, but also produces accurate and reliable size-
related data needed for assessing hazard and risk associated with nanomaterials.
As a major outcome, a decision support flow scheme and method manual have been
developed and designed as “NanoDefiner” e-Tool to guide manufacturers or enforcement
laboratories to select the most appropriate measurement method(s) to determine if a
material or product is or contains nanomaterial, or not. In addition, the vast knowledge
base produced by NanoDefine on methods and their performance and applicability to
correctly measure the size of materials will shed new light on still critical aspects of the EU
definition, such as the question of the plausibility of the number size distribution threshold
of 50 % and its replacement by a threshold between 1 and 50 % for complex and
environmentally relevant materials, or the fact that implementing the EU definition will
include all conventional particulate materials < 100 nm to be classified accordingly.
In the following, main objectives and results achieved within the various work packages
are described within this overall project context:
WP1 assessed the availability of calibration standards and reference materials and
provided the project with suitable calibration standards and test materials. As CRMs for
size measurement are still lacking (see also WP6 below), a panel of in-house synthesized
or externally procured stable and homogeneous, industry-relevant test substances and
products covering a matrix of different chemical and physical properties, material systems,
sizes, shapes and size-distributions were supplied to implement the planned project tasks.
As one consequence, project outcome like dispersion protocols and analysis strategies can
therefore be applied to a vast range of similar industrial substances with only minor
adoptions of protocols. Also, the robustness of the developed tools, such as the decision-
making framework (NanoDefiner e-tool) ot the ParticleSizer software could be successfully
tested by a broad range of different sample properties.
Main objective of WP2 was the development and optimization of methods for the
dispersion of NM from powders and the extraction of NM from products, as provided by
WP1, for further analysis by the tier 1 and tier 2 methods developed in WP4 and WP5,
respectively.
One main objective of WP3 was the evaluation of a broad range of available techniques
against quantitative quality criteria as defined in WP7 (see below) to establish
unambiguous ranges of applicability. Based on this thorough quantitative evaluation of all
available sizing techniques applied on the well-defined sets of Quality Control Materials
NanoDefine project Final report
5
(QCMs) and real-world Representative Test Materials (RTMs) generated in WP1, a set of
methodologies had to be developed that have the potential to be further developed into
standard methods for the measurement of particle size distributions of nanomaterials
according to the EC recommendation for a definition as nanomaterial (within WP4, 5 and
6). Further, the continuous benchmarking of the methods under development against the
set of quality criteria established in WP7 had to be carried out, considering purpose, sample
complexity and acceptable limitations – in agreement with WP7.
Another main objective in Wp3 addressing a particular aspect of the EC recommendation
on a definition of nanomaterial was the evaluation of the relationship between the volume
specific surface area (VSSA) and the number based particle size distribution for standards
and representative powder materials from WP1. Hereby, a collaboration with the parallel
EU/FP7 project NANoREG was realized. As a continuous dynamic activity involving also
experts from outside of NanoDefine, the monitoring of analytical device developments and
assessment of new or improved techniques using QCMs from WP1 against quality criteria
as defined in WP7 was the final achieved objective in WP3.
Main objective in WP4 was the establishment of a set of validated, cost-efficient, robust,
and easy implementable methods for rapid distinction between nano/non-nano according
to the definition. This included improvement of instruments and related methods (in
cooperation with WP2) to increase the range of applicability and cost-efficiency, and the
determination of individual methods’ limitations and derivation of maximum application
ranges with regard to the requirements of the definition (see also WP6). The following
potential screening methods have been developed in WP4: Analytical Centrifugation
methods (AC/CLS), Dynamic light scattering (DLS), Electric mobility analysis, MiniTEM,
Particle tracking analysis (PTA/NTA), SingIe particle ICP-MS. WP4 delivered the screening
methods for tier 1 in the decision tree of WP7 based on method selection criteria developed
together with WP3, and on method validation developed together with WP6.
WP5 utilized established principles of analytical separation and high resolution imaging
and analysis to overcome typical problem of sample polydispersity and heterogeneity.
Established techniques are electron microscopy (SEM, TEM) with EDX and field flow
fractionation hyphenated to multiple detection systems in conventional and single particle
mode. Therefore, the objectives of WP5 were:
- Establishment of methods for the implementation of the EC definition in difficult
samples, non-dispersible powders, complex matrices, products and the
environment.
- Development and validation of an ‘auto EM’ toolbox for automated particle
recognition, measurement, counting and analysis according to the EC definition.
- Validated reference methods for the classifications of materials with characteristics
outside the applicability of the rapid screening methods (WP4).
- Evaluating and establishing reliable procedures to generate the number based
distributions from raw data based on detection principles other than particle
counting.
- Development of FFF coupled to particle counting detectors (liquid and aerosol
based) to obtain true number based distributions after high-resolution separation.
To ensure harmonisation of the in-house validation in WP4 and WP5, a common guideline
for in-house validations was developed in WP6 and agreed by all partners. Continuous
support from the JRC to the validation laboratories was given. This assured a harmonized
in-house validation over the various methods and work packages.To conduct and evaluate
interlaboratory validation studies of key methods according to international method
evaluation standards, an international call for interlaboratory validation exercises was
launched and conducted with VAMAS and results evaluated for eight methods. Some
methods showed their fitness for purpose; other methods still need some optimisation.
Another goal in WP6 was to establish links and be the contact point for standardisation
organisations (CEN, ISO) and regulatory stakeholders (European Commission) and submit
NanoDefine project Final report
6
validated methods as proposed New Work Items. For this, project liaison with the
standardisation committee CEN/TC352 was achieved. The NanoDefine Methods Manual was
proposed to CEN/TC352 as a New Work Item Proposal.
WP7 pooled results from other work packages and prepared output supporting parties
which need to identify nanomaterials for regulatory purposes in practice. As a main
objective the WP developed a comprehensive decision support framework, taking into
account and integrating all relevant project results. A user who applies the framework is
guided logically and uniquely through the decision steps for all reasonably expected cases
in regulatory practice to come to a recommendation whether a specific material is a nano
or a non-nanomaterial. A decision flow scheme derived from the framework is implemented
in an e-tool for end-users. The decision support flow scheme was successfully tested in a
number of case studies representing a wide variety of materials. Based on analytical
capabilities, the WP also developed recommendations on a revision of the EC definition of
nanomaterial.
NanoDefine project Final report
7
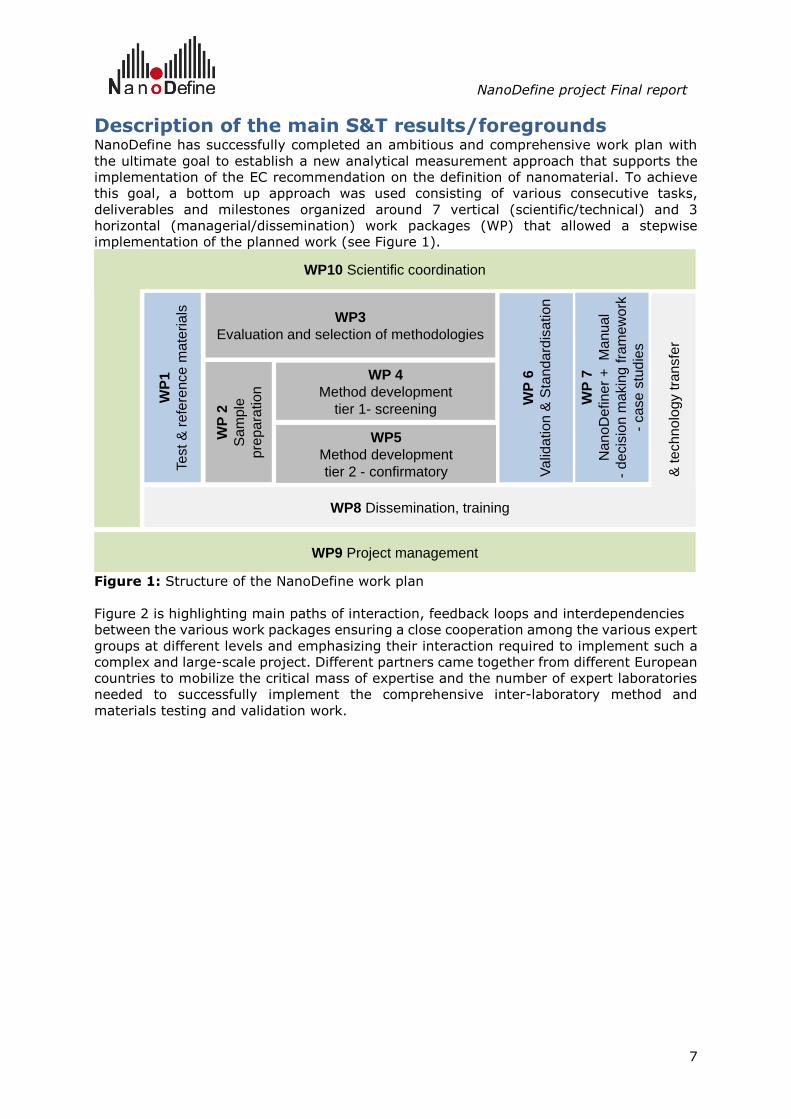
Description of the main S&T results/foregrounds NanoDefine has successfully completed an ambitious and comprehensive work plan with
the ultimate goal to establish a new analytical measurement approach that supports the
implementation of the EC recommendation on the definition of nanomaterial. To achieve
this goal, a bottom up approach was used consisting of various consecutive tasks,
deliverables and milestones organized around 7 vertical (scientific/technical) and 3
horizontal (managerial/dissemination) work packages (WP) that allowed a stepwise
implementation of the planned work (see Figure 1).
Figure 1: Structure of the NanoDefine work plan
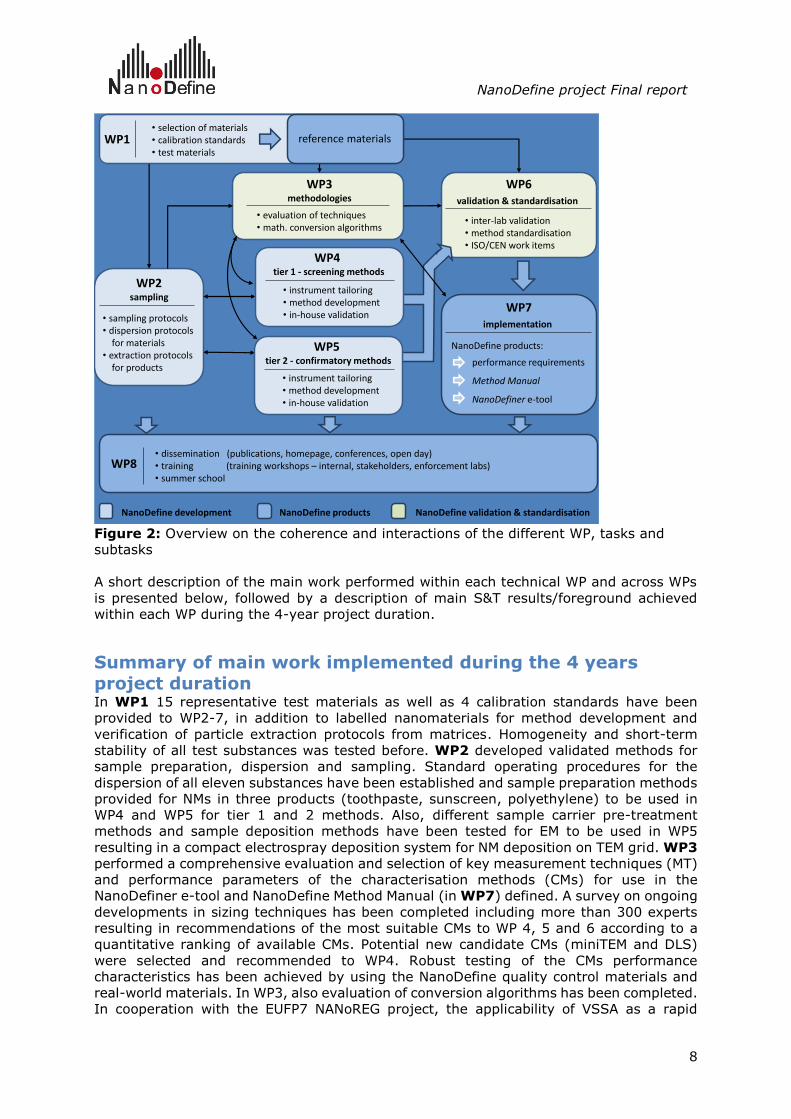
Figure 2 is highlighting main paths of interaction, feedback loops and interdependencies
between the various work packages ensuring a close cooperation among the various expert
groups at different levels and emphasizing their interaction required to implement such a
complex and large-scale project. Different partners came together from different European
countries to mobilize the critical mass of expertise and the number of expert laboratories
needed to successfully implement the comprehensive inter-laboratory method and
materials testing and validation work.
WP3
Evaluation and selection of methodologies
WP 4
Method development
tier 1- screening
WP5
Method development
tier 2 - confirmatory
WP
1
Test
& r
efe
rence m
ate
rials
WP
6
Valid
ation &
Sta
ndard
isation
WP
2
Sam
ple
pre
para
tion
& technolo
gy t
ransfe
r
WP8 Dissemination, training
WP9 Project management
WP10 Scientific coordination
WP
7
NanoD
efiner
+
Manual
-decis
ion m
akin
g f
ram
ew
ork
-case s
tudie
s
NanoDefine project Final report
8
Figure 2: Overview on the coherence and interactions of the different WP, tasks and
subtasks
A short description of the main work performed within each technical WP and across WPs
is presented below, followed by a description of main S&T results/foreground achieved
within each WP during the 4-year project duration.
Summary of main work implemented during the 4 years
project duration In WP1 15 representative test materials as well as 4 calibration standards have been
provided to WP2-7, in addition to labelled nanomaterials for method development and
verification of particle extraction protocols from matrices. Homogeneity and short-term
stability of all test substances was tested before. WP2 developed validated methods for
sample preparation, dispersion and sampling. Standard operating procedures for the
dispersion of all eleven substances have been established and sample preparation methods
provided for NMs in three products (toothpaste, sunscreen, polyethylene) to be used in
WP4 and WP5 for tier 1 and 2 methods. Also, different sample carrier pre-treatment
methods and sample deposition methods have been tested for EM to be used in WP5
resulting in a compact electrospray deposition system for NM deposition on TEM grid. WP3
performed a comprehensive evaluation and selection of key measurement techniques (MT)
and performance parameters of the characterisation methods (CMs) for use in the
NanoDefiner e-tool and NanoDefine Method Manual (in WP7) defined. A survey on ongoing
developments in sizing techniques has been completed including more than 300 experts
resulting in recommendations of the most suitable CMs to WP 4, 5 and 6 according to a
quantitative ranking of available CMs. Potential new candidate CMs (miniTEM and DLS)
were selected and recommended to WP4. Robust testing of the CMs performance
characteristics has been achieved by using the NanoDefine quality control materials and
real-world materials. In WP3, also evaluation of conversion algorithms has been completed.
In cooperation with the EUFP7 NANoREG project, the applicability of VSSA as a rapid
• selection of materials• calibration standards• test materials
WP1
• sampling protocols• dispersion protocols
for materials• extraction protocols
for products
WP2sampling
• evaluation of techniques• math. conversion algorithms
WP3methodologies
WP8• dissemination (publications, homepage, conferences, open day)• training (training workshops – internal, stakeholders, enforcement labs)• summer school
NanoDefine products:
performance requirements
Method Manual
NanoDefiner e-tool
WP7implementation
• inter-lab validation• method standardisation• ISO/CEN work items
WP6validation & standardisation
• instrument tailoring• method development• in-house validation
WP4 tier 1 - screening methods
• instrument tailoring• method development• in-house validation
WP5 tier 2 - confirmatory methods
reference materials
NanoDefine development NanoDefine products NanoDefine validation & standardisation
NanoDefine project Final report
9
screening tool for the determination of the number based particle size average has been
assessed and a corresponding screening strategy developed.
WP4 has developed screening methods, including AC/CLS, DLS, miniTEM, spICPMS and
PTA. A generic SOP has been established for analytical centrifugation (AC) techniques that
can be used for material classification. Three AC techniques (cuvette-type and disc-type
AC with turbidity detectors, cuvette-type AC with interferometric detectors) successfully
passed intra-lab validation with representative test materials. Also, the applicability of DLS
as screening technique was improved by testing poly-disperse materials with significant
amounts of coarse micrometre-sized particles. Size analysis by miniTEM was shown to be
fit for purposes when used as screening method (tier 1) as well as confirmatory method
(tier 2 in WP5). For spICPMS, a new platform independent ICP-MS software was developed
that facilitates size analysis of single particles and the new method successfully tested by
intra-lab validation for nanomaterials in complex matrices. New instrument and software
modifications resulted in a significant reduction of lower size limits and hence in more
reliable measurement of particle number concentration by PTA. Also in WP4 a new
prototype for size analysis of extremely fine (1-5 nm) aerosol particles by HRMS has been
realized. Confirmatory methods have been developed in WP5, including (1) an auto-EM
toolbox for automatic serial acquisition and analysis of TEM micrographs that is working
for different EM instruments and is using a new automated image analysis software, incl.
algorithms for agglomerate/aggregate deconvolution and size based classification, and (2)
SOPs for the determination of the median diameter of the number-based particle size
distribution of TiO2 particles in sunscreen and Al2O3 particles in toothpaste by asymmetric
flow field-flow fractionation (AF4) coupled to multi angle light scattering and inductively
coupled plasma-mass spectrometry. In addition, interfaces for coupling FFF with particle
counting detectors, a new software and needle valve to improve AF4 performance and
reduce costs and an intra-lab validation of the measurement of the minimal external
dimension of the primary particles of particulate materials from TEM images by the
NanoDefine ParticleSizer software have been also realized in W5. A common guideline for
in-house validations was developed in WP6 to ensure harmonized in-house validation
across all methods and work packages. Liaison of NanoDefine with CEN/TC352 was
achieved and continuous contributions to many other standardisation committees
provided. The NanoDefine Methods Manual was proposed to CEN/TC352 as a New Work
Item Proposal. Inter-laboratory validation of eight selected key methods was realized in
cooperation with VAMAS, whereby some methods showed their fitness for purpose, while
other methods still need some optimisation. In WP7, the NanoDefiner e-tool and method
manual was developed and case studies performed to assess the feasibility of the
developed approach to real-world materials. For this, a catalogue of performance criteria
to assess the capabilities of characterisation methods was developed (see WP3). These
criteria were used to develop templates for characterisation of tier 1 and tier 2 methods
and the templates filled in in WP3. Both the methods-focused material classification and
the criteria used to steer the decision process became the pillars of the decision support
flow scheme that was established based on the experience with materials used in the
project and the assessment of the performance and capabilities of CMs. The NanoDefine
Manual was developed to provide all information necessary for the user to perform an
assessment of any material against the EC nanomaterial definition. Finally, the decision
flow scheme and manual were implemented in the NanoDefiner e-tool, an easy to use
software that guides the user in a straightforward and semiautomatic way through all steps
of assessment to a final traceable decision (nano, non-nanomaterial, or inconclusive based
on the provided information) with extensive reporting. Both decision flow scheme and e-
tool were tested and refined in case studies on real world materials involving industrial
chemicals and also products. The experiences and findings resulted in recommendations
on the revision of the EC definition of nanomaterials based on experimental capabilities.
NanoDefine project Final report
10
Description of main S&T results/foreground achieved with the
different WPs
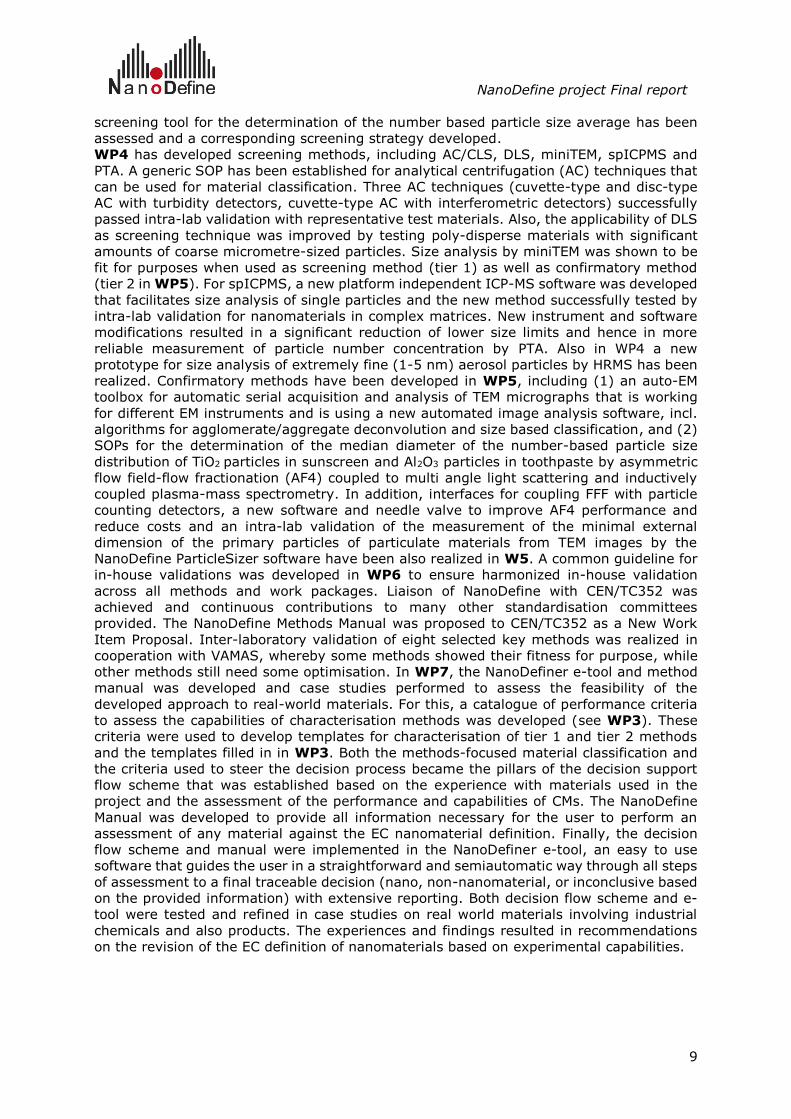
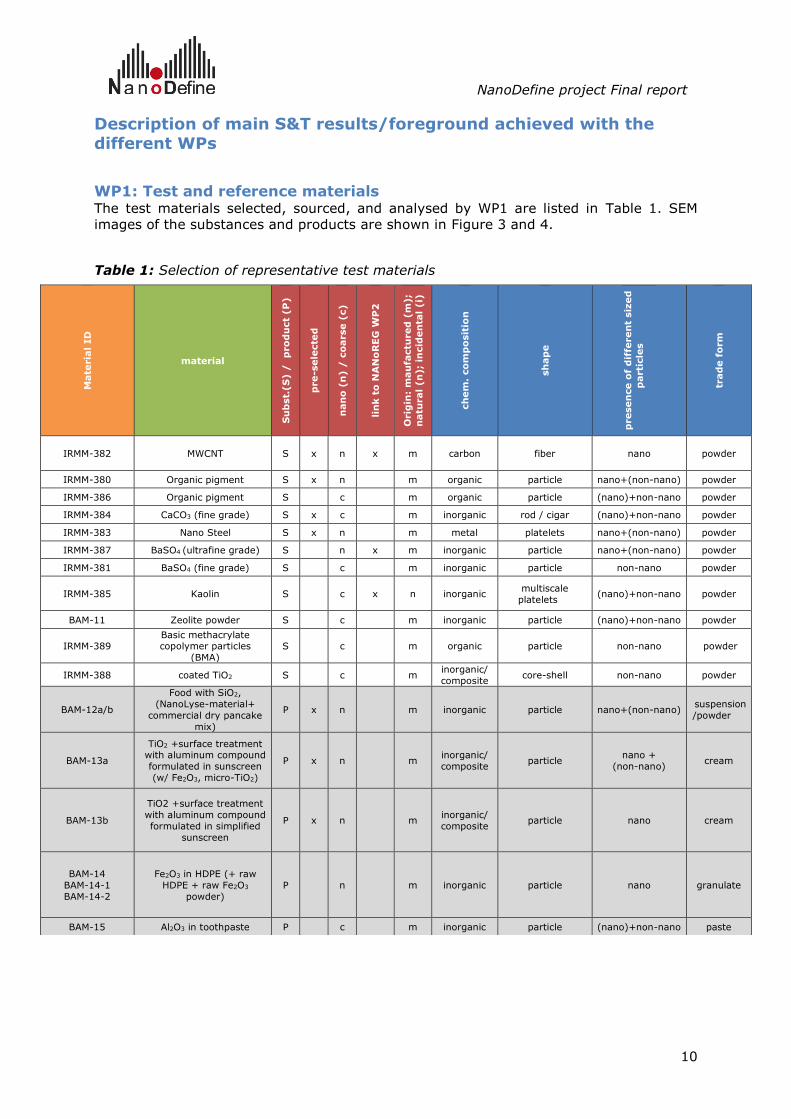
WP1: Test and reference materials The test materials selected, sourced, and analysed by WP1 are listed in Table 1. SEM
images of the substances and products are shown in Figure 3 and 4.
Table 1: Selection of representative test materials
Mate
ria
l ID
material
Su
bst.
(S
) /
p
ro
du
ct
(P
)
pre-s
ele
cte
d
nan
o (
n) /
co
arse (
c)
lin
k t
o N
AN
oR
EG
WP
2
Orig
in:
mau
factu
red
(m
);
natu
ral
(n
);
incid
en
tal
(i)
ch
em
. co
mp
osit
ion
sh
ap
e
presen
ce o
f d
iffe
ren
t siz
ed
parti
cle
s
trad
e f
orm
IRMM-382 MWCNT S x n x m carbon fiber nano powder
IRMM-380 Organic pigment S x n m organic particle nano+(non-nano) powder
IRMM-386 Organic pigment S c m organic particle (nano)+non-nano powder
IRMM-384 CaCO3 (fine grade) S x c m inorganic rod / cigar (nano)+non-nano powder
IRMM-383 Nano Steel S x n m metal platelets nano+(non-nano) powder
IRMM-387 BaSO4 (ultrafine grade) S n x m inorganic particle nano+(non-nano) powder
IRMM-381 BaSO4 (fine grade) S c m inorganic particle non-nano powder
IRMM-385 Kaolin S
c x n inorganic multiscale
platelets (nano)+non-nano powder
BAM-11 Zeolite powder S c m inorganic particle (nano)+non-nano powder
IRMM-389 Basic methacrylate copolymer particles
(BMA)
S
c m organic particle non-nano powder
IRMM-388 coated TiO2 S
c m inorganic/
composite core-shell non-nano powder
BAM-12a/b
Food with SiO2,
(NanoLyse-material+
commercial dry pancake
mix)
P x n m inorganic particle nano+(non-nano) suspension
/powder
BAM-13a
TiO2 +surface treatment with aluminum compound
formulated in sunscreen
(w/ Fe2O3, micro-TiO2)
P x n m inorganic/
composite particle
nano +
(non-nano) cream
BAM-13b
TiO2 +surface treatment
with aluminum compound
formulated in simplified
sunscreen
P x n m inorganic/
composite particle nano cream
BAM-14
BAM-14-1
BAM-14-2
Fe2O3 in HDPE (+ raw
HDPE + raw Fe2O3
powder)
P
n m inorganic particle nano granulate
BAM-15 Al2O3 in toothpaste P c m inorganic particle (nano)+non-nano paste
NanoDefine project Final report
11
Figure 3: SEM images of the selected substances
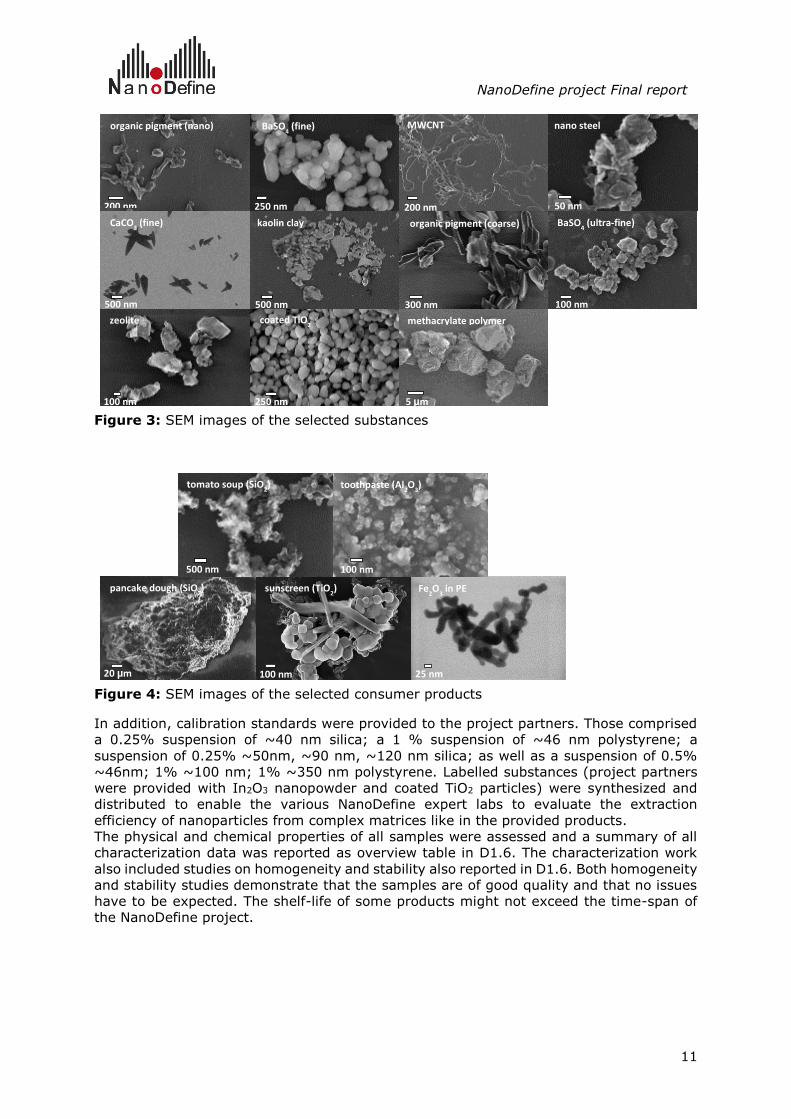
Figure 4: SEM images of the selected consumer products
In addition, calibration standards were provided to the project partners. Those comprised
a 0.25% suspension of ~40 nm silica; a 1 % suspension of ~46 nm polystyrene; a
suspension of 0.25% ~50nm, ~90 nm, ~120 nm silica; as well as a suspension of 0.5%
~46nm; 1% ~100 nm; 1% ~350 nm polystyrene. Labelled substances (project partners
were provided with In2O3 nanopowder and coated TiO2 particles) were synthesized and
distributed to enable the various NanoDefine expert labs to evaluate the extraction
efficiency of nanoparticles from complex matrices like in the provided products.
The physical and chemical properties of all samples were assessed and a summary of all
characterization data was reported as overview table in D1.6. The characterization work
also included studies on homogeneity and stability also reported in D1.6. Both homogeneity
and stability studies demonstrate that the samples are of good quality and that no issues
have to be expected. The shelf-life of some products might not exceed the time-span of
the NanoDefine project.
200 nm 250 nm 200 nm 50 nm
500 nm 500 nm 300 nm 100 nm
100 nm 250 nm 5 µm
organic pigment (nano) BaSO4 (fine) MWCNT nano steel
CaCO3 (fine) kaolin clay organic pigment (coarse) BaSO
4 (ultra-fine)
coated TiO2 zeolite methacrylate polymer
500 nm
20 µm 100 nm 25 nm
100 nm
tomato soup (SiO2)
pancake dough (SiO2) sunscreen (TiO
2) Fe
2O
3 in PE
toothpaste (Al2O
3)
NanoDefine project Final report
12
WP2: Sample preparation, dispersion & sampling methods
A literature review was performed to evaluate suitable guidelines for sub-sampling. The
number of publications dealing with the sampling or sub-sampling of nanomaterials was
found to be limited. In general, the known procedures for coarser materials were applied.
The norm ISO 14488:2007 was selected as guideline for the practical evaluation of
sampling. A limited number of experimental studies was performed. The tested sub-
sampling procedures were slurry, paste and heap sampling as well as dividing by spinning
riffler. For the investigations three materials were selected: coated TiO2 and fine and
ultrafine BaSO4. Dynamic light scattering (DLS) as a tier 1 method was applied (see WP4).
A comparison of the expanded measurement uncertainties for all materials and sub-
sampling procedures was made. It was observed that independent of the material the heap
sampling led to the highest variance. The sub-sampling methods paste and slurry showed
comparable influence on the measurement uncertainties. The spinning riffler seemed to
have the smallest effect. A comparison of the two barium sulfate materials indicated a
tendency: the expanded measurement uncertainties increased more for the ultrafine grade
for all sub-sampling procedures than for the fine grade material. For further investigations
on NM sampling scenarios, a combination of more sophisticated analytical techniques
should be used. Additionally the use of a material with a known particle size distribution
(PSD) or with labeled particles of defined sizes should be considered in order to be able to
better understand changes in the PSD due to sampling/sample preparation.
To find and define suitable methods for the dispersion of powders, a literature survey of
publically available dispersion protocols was made. The results of this survey showed that
in the scientific literature, many methods can be found for dispersing specific types of
particles in specific liquids but there is little information on more generically applicable
protocols. In fact, the development of true generic dispersion protocols in the recent
literature has been driven almost exclusively by the needs of the nanotoxicology testing
community and their need to produce short-term stability dispersions which, apart from
the nanoparticles, can contain only compounds which are compatible with biological
system. It was concluded that the quality of dispersion achieved with these generic
protocols would likely be sub-optimal for many of the priority materials in the NanoDefine
project and consequently it was necessary to adapt or design individual protocols tailored
for each material based on the outcome of the literature study. The dispersion protocols
for the 11 priority materials were optimized for each material in terms of sonication energy,
sonication time, dispersant liquid, stabilizers and stabilizer concentration. To allow the
maximum transferability across the measurement techniques and laboratories, emphasis
was placed on producing aqueous based dispersions containing only the minimum quantity
necessary of commonly available stabilizing agents. The dispersion efficiency was
evaluated qualitatively and where possible quantitatively by transmission electron
microscopy (TEM) for two independently prepared suspensions to confirm repeatability. All
priority materials have an individual dispersion protocol describing their use with probe
sonication while selected materials were, in addition, also provided with data for use with
a vial sonicator. A stability of the NM suspension of at least 30 min was assured, which
was identified as the maximum relevant time for instrumental measurements. For the
majority of substances, the dispersion protocols allowed the dispersion of the material up
to the level of single primary particles and some small aggregates/agglomerates (2-10
primary particles). To improve the inter-laboratory transferability of the dispersion
protocols, a calorimetric method of measuring the relative power of the sonication probes
was used in the method development to allow an instrument independent value of
absorbed ultrasonic power to be reported as part of each protocol. This procedure allows
each laboratory to independently determine the performance characteristics of their own
sonicator and adjust its power settings to match the values recommended in the dispersion
protocols. The dispersion protocols were adapted by the tier 1 and tier 2 method developers
in WP4 and WP5. Modifications were especially necessary in the case of TEM analysis where
problems with some chemicals/dispersion agents were observed.
NanoDefine project Final report
13
In total, sample preparation protocols for three consumer products were developed:
sunscreen containing titanium dioxide (TiO2) particles, toothpaste containing aluminium
oxide (Al2O3) particles and solid polyethylene (PE) matrix containing Fe2O3 particles. The
studied sunscreen formulae were specifically designed for the project and were not
commercially available products. The attempt of developing a sample preparation
procedure for pancake dry mix containing silicon dioxide (SiO2) was not successful. The
sample preparation methods were specifically tailored towards tier 1 (sp-ICPMS) and tier
2 (FFF or TEM) methods, which have different requirements in terms of sample preparation.
As a starting point, the most relevant sample preparation methods for the specific
material/matrix combinations were identified on the basis of previous experience from the
involved partners, including the EU FP7 project NanoLyse. Two sample preparation
approaches for analysis of SiO2 in food by field flow fractionation (FFF) were tested: a) acid
digestion (based on NanoLyse method for liquid tomato soup) and b) enzymatic digestion.
For approach a) the “NanoLyse method” was successfully improved towards lower limit of
detection for powdered tomato soup based on additional pre-digestion and acid
evaporation steps. The improved acid digestion method was then applied to pancake mix.
Several problems where observed when transferring the method to this distinct food
matrix. For approach b) several enzyme combinations, buffers, and digestion durations
were tested, but no complete digestion of pancake mix was possible and the obtained
sample was too complex to be injected in FFF. For TiO2 in sunscreen, a rapid approach of
sample preparation for sp-ICPMS analysis based on matrix dilution was developed. Mixing
with a detergent plus sonication gave the best results for FFF analysis after testing several
approaches. For Al2O3 in toothpaste, dilution of the toothpaste in water was selected as
the final sample preparation method for analysis by sp-ICPMS. For analysis of Al2O3 present
in in toothpaste by FFF, a more complex sample preparation strategy based on chemical
oxidation and later dispersion in surfactant was required for FFF-ICPMS. Focused ion beam
(FIB) and ultramicrotomy techniques were evaluated for the preparation of Fe2O3 particles
embedded in a solid polyethylene matrix for EM analyses. Best results were obtained by
UM followed by a gentle thermal treatment of the thin sections. Sample preparation for NM
in products remains a challenging and time-consuming task and needs to be developed for
each NM / matrix combination. Whereas sp-ICPMS is less sensitive to matrix residues,
these residues can cause problems in FFF and EM analyses.
Sample preparation for TEM requires special attention. Various functionalization methods
of TEM grids prior to NM deposition were studied. The methods included glow discharging,
high vacuum baking, coating with Poly-L-Lysine (PLL) and coating with Alcian blue. Glow
discharge renders carbon coated TEM grids hydrophilic with a low negative surface charge.
Hence, NPs with positive zeta-potential can be deposited immediately onto the grid. For
NPs with negative zeta-potential, additional chemical treatment is recommended. High
vacuum baking of the TEM grids has a similar effect as glow discharging, giving a
hydrophilic and low negatively charged carbon film with the addition of cleaning the surface
from contaminants. This is especially useful if elemental specific information has to be
recorded, e.g. by energy dispersive X-ray spectroscopy, where the beam induced
contamination can be severe. A low cost high vacuum baking station was built and the
beam induced contamination quantitatively tested using several TEM grids from different
vendors. It was shown that the contamination varied greatly between the grids from the
same vendor, but was overall reduced after high vacuum baking. There exist many
different chemicals for the pre-treatment of the TEM grids to provide a monolayer of
molecules with an opposite charge than the NPs zeta-potential. Alcian Blue and PLL were
chosen here because of their wide usage, and ease of preparation. The different
functionalization methods (including untreated TEM grids) were studied for three different
NMs: 60 nm gold NPs dispersed in ultrapure water, ultrafine grade BaSO4 NPs dispersed in
bovine albumin serum and tri-modal SiO2 NP dispersed in bovine albumin serum. For
deposition, centrifugation was used. TEM grid functionalizations with PLL or glow
discharging prior to PLL were found to be the best methods in terms of contamination,
NanoDefine project Final report
14
deposition quality and coverage. The results from Alcian blue were also satisfactory
showing little or no contamination with sufficiently good deposition quality and coverage.
Three different deposition methods, drop deposition, electrospray ionization and
centrifugation, were evaluated for their suitability to deposit NM evenly on TEM grids. A
SOP based on drop deposition, which was originally developed in the context of the
NANoREG project, was applied and evaluated for the NanoDefine materials. Sample dilution
and charge of the grid were optimized for each NanoDefine material. The SOP was shown
to be efficient for the preparation of EM specimens. The prototype of an Electrospray
Deposition System for EM sample preparation was designed, manufactured and tested. For
performance evaluation of the prototype, several NMs were tested. It was demonstrated
that electrospray deposition of particle suspensions on a TEM grid is a very promising
option for achieving even particle distributions. To achieve good and reproducible results,
the suspension needs to be appropriate for electrospray deposition: it should not be
stabilized with a surfactant that generates precipitates upon drying and the suspension
concentration should not be too high. Experiments with a tri-modal polystyrene latex
suspension demonstrated high deposition efficiencies for all three modes, which enabled
allowed short sampling times. The spatial distribution of the deposited particles, however,
strongly depended on the particle size. Hence, the entire deposition area needed to be
evaluated to gain representative information, which unfortunately more than
counterbalanced the short sampling times. Finally, the advantages and disadvantages of
the three TEM grid deposition methods were identified and summarized, and protocols for
all grid functionalization and deposition methods provided. A generalization of the most
suitable grid functionalization and deposition method was not possible, as these strongly
depend on the studied NM and the planned EM analysis.
A feasibility study showed that different direct aerosolisation techniques tested in various
experimental conditions did not allow obtaining primary particles from NM powders in the
aerosol form. Mainly agglomerate/aggregate airborne particles were measured. Further
work beyond the NanoDefine project is required, including optimization of the aerosol
generator operating parameters, the generation protocol as well as the scanning mobility
particle sizer (SMPS) characterization protocol in order to improve the results. Moreover,
systems improvements must be carried out in order to increase the stability over time.
The reproducibility of selected dispersion protocols (for fine and ultrafine BaSO4 as well as
coated TiO2) was evaluated. These materials were selected for use in either intra-laboratory
(instrument/method) validations or subsequently for inter-laboratory ring-trials and, thus,
there was a clear added valued to assessing the reproducibility of the associated dispersion
protocols. For the materials subjected to the evaluation of repeatability the method chosen
to measure particle weight-size distribution was analytical centrifugation (Line-start Disc-
AC) (see WP4). It was found that the combination of the standardized sample preparation
methods with systematic analysis by Disc-AC was able to produce median particle sizes of
the cumulative number or mass size distribution with relative measurement uncertainty
values below 11% and 5%, respectively, for all three materials. Considering that these
uncertainty values are a combination of the variability of both the analytical method and
dispersion step, it was concluded that strict adherence to the detailed dispersion protocols
permits the preparation of samples which have reproducible PSDs.
WP3: Evaluation and selection of techniques and methodologies
The first task was a comprehensive study on current MTs which may be relevant for the
reliable analysis of the number based size distribution of NM according to the EC
recommendation. Based on the performance criteria already established in WP7 (D7.1),
the potential MTs available in the literature were evaluated also by following the expertise
available within the NanoDefine consortium. The specific advantages and disadvantages of
each MT with respect to its applicability to the scope of NanoDefine were highlighted.
NanoDefine project Final report
15
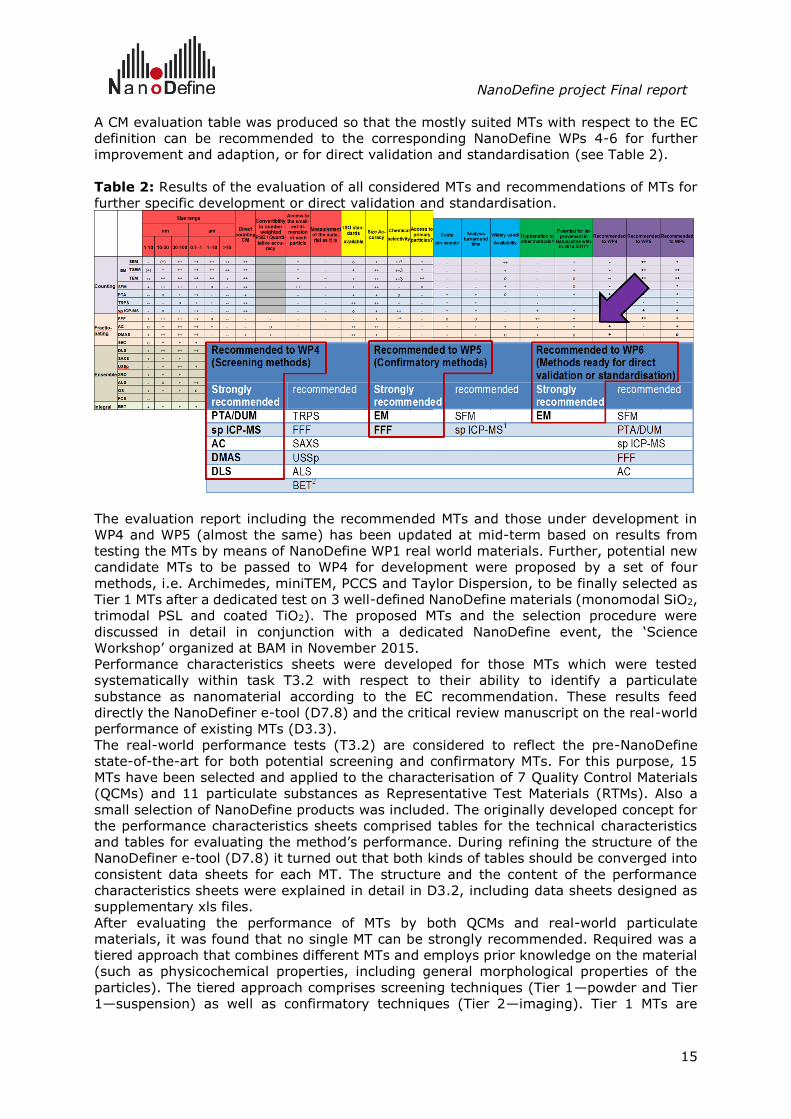
A CM evaluation table was produced so that the mostly suited MTs with respect to the EC
definition can be recommended to the corresponding NanoDefine WPs 4-6 for further
improvement and adaption, or for direct validation and standardisation (see Table 2).
Table 2: Results of the evaluation of all considered MTs and recommendations of MTs for
further specific development or direct validation and standardisation.
The evaluation report including the recommended MTs and those under development in
WP4 and WP5 (almost the same) has been updated at mid-term based on results from
testing the MTs by means of NanoDefine WP1 real world materials. Further, potential new
candidate MTs to be passed to WP4 for development were proposed by a set of four
methods, i.e. Archimedes, miniTEM, PCCS and Taylor Dispersion, to be finally selected as
Tier 1 MTs after a dedicated test on 3 well-defined NanoDefine materials (monomodal SiO2,
trimodal PSL and coated TiO2). The proposed MTs and the selection procedure were
discussed in detail in conjunction with a dedicated NanoDefine event, the ‘Science
Workshop’ organized at BAM in November 2015.
Performance characteristics sheets were developed for those MTs which were tested
systematically within task T3.2 with respect to their ability to identify a particulate
substance as nanomaterial according to the EC recommendation. These results feed
directly the NanoDefiner e-tool (D7.8) and the critical review manuscript on the real-world
performance of existing MTs (D3.3).
The real-world performance tests (T3.2) are considered to reflect the pre-NanoDefine
state-of-the-art for both potential screening and confirmatory MTs. For this purpose, 15
MTs have been selected and applied to the characterisation of 7 Quality Control Materials
(QCMs) and 11 particulate substances as Representative Test Materials (RTMs). Also a
small selection of NanoDefine products was included. The originally developed concept for
the performance characteristics sheets comprised tables for the technical characteristics
and tables for evaluating the method’s performance. During refining the structure of the
NanoDefiner e-tool (D7.8) it turned out that both kinds of tables should be converged into
consistent data sheets for each MT. The structure and the content of the performance
characteristics sheets were explained in detail in D3.2, including data sheets designed as
supplementary xls files.
After evaluating the performance of MTs by both QCMs and real-world particulate
materials, it was found that no single MT can be strongly recommended. Required was a
tiered approach that combines different MTs and employs prior knowledge on the material
(such as physicochemical properties, including general morphological properties of the
particles). The tiered approach comprises screening techniques (Tier 1—powder and Tier
1—suspension) as well as confirmatory techniques (Tier 2—imaging). Tier 1 MTs are
NanoDefine project Final report
16
intended to provide clear statements whether a material is a NM, or whether more profound
analyses by Tier 2 techniques are required, because the number-weighted median x50,0 is
close to the borderline of 100 nm. They either test integral properties of the particle system
(e. g. VSSA) or determine the distribution of equivalent diameters rather than the
geometric lengths of the external dimension. In addition, the intrinsically measured size
distributions are typically non-number-weighted. For this reason, the Tier 1 MTs are
expected to perform well for low and moderate polydispersity. Moreover, most MTs that
are relevant for Tier 1—suspension cannot resolve the internal structure of particles
aggregates, instead they probe aggregate properties. Their ability to reliably assess
particulate materials according to the EC definition is, therefore, restricted to materials
that consist of particles as individual entities or of well dispersible aggregates. Based on
our data, matching nano/non-nano classification by both Tier 1—suspension and Tier 1—
powder indicates that this validity criterion is fulfilled. Otherwise, Tier 2—imaging can help,
but even then, ambiguity remains. This approach yields recommendations for the MTs that
can be attributed to the different tiers based on their proven performance for real-world
materials.
Tier 1—powders can rely on BET, but only outside the borderline region, whose limits we
explored in detail elsewhere (Wohlleben et al., J. Nanopart. Res., 2017).
Tier 1—suspension can be realised with spray-DEMA, all AC techniques or DLS, yet similar
as for BET, they are inconclusive for a borderline region and certain particle morphologies.
Further candidates for Tier 1, which we tested, provided no reliable classification (ALS,
PTA, and SAXS), or were not ready for a final assessment (AF4 and spICP-MS).
Tier 2—imaging measurements can be conducted with TEM or SEM, which give access to
the constituent particles of aggregates and to the smallest external dimension of particles
for most materials. However, the preparation of representative samples constitutes a major
source of uncertainty and ambiguity for Tier 2, and the determination of the smallest
external dimension remains challenging (if possible at all) for several classes of
morphology, e. g., for three-dimensional aggregates and two-dimensional platelets.
Inconsistent results occur with both Tier 1 and Tier 2 techniques for highly polydisperse
samples: for most screening techniques because of their relative insensitivity towards the
fine size fractions and for imaging techniques, because any particle deposition process on
substrates is affected by particle size. We also observed ambiguity in Tier 1 and Tier 2
results when the materials were composed of indispersible aggregates comprising a large
number of constituent particles. In these cases, the Tier 1 – powder might be preferable
for a pragmatic implementation. Despite these challenges, our results suggest that reliable
NM identification is possible for a broad range of real-world substances, provided they are
not borderline cases (i. e. if their x50,0 is outside the 50 to 150 nm range). In this size
range, conflicting results are to be expected also from EM labs, and weight of evidence
approaches might be required to combine evidence from all tiers.
Finally, it could be extrapolated that the classification of mixtures of different substances
is probably rather difficult and prone to artefacts. The interpretation of particle sizing
results for such materials can be critically misleading if, for instance, the turbidity of a
mixture is solely determined by one light-absorbing component (e. g. in AC-turb), or when
the scattering signal of a mixture is dominated by the component with highest optical or
electron density contrast (e. g. DLS and SAXS).
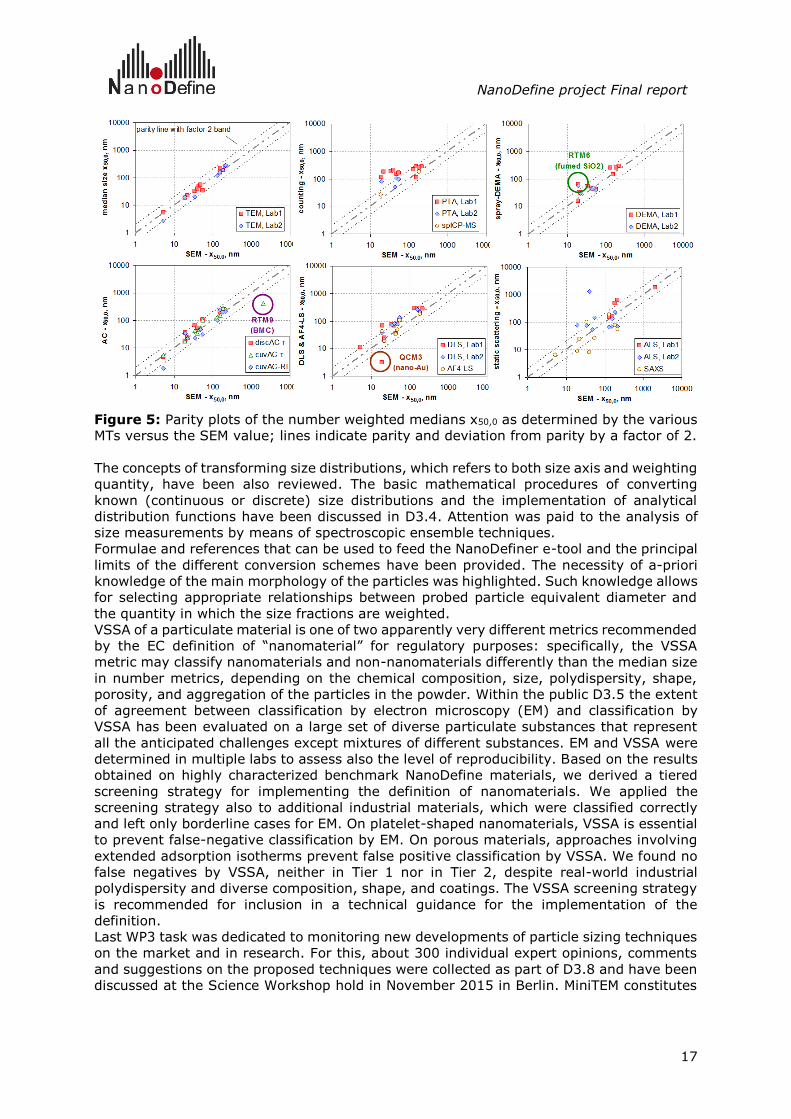
All the results obtained from the systematic evaluation study carried out within T3.2 (an
overview of the results is illustrated in Fig. 5) have been published by Babick et al. as an
Open Access Review in J. Nanopart. Res., 2016. The measurement guidance, the uniform
reporting templates (in agreement with ISO 9276 1-6) and the dispersion protocols are
also included as open access information.
NanoDefine project Final report
17
Figure 5: Parity plots of the number weighted medians x50,0 as determined by the various
MTs versus the SEM value; lines indicate parity and deviation from parity by a factor of 2.
The concepts of transforming size distributions, which refers to both size axis and weighting
quantity, have been also reviewed. The basic mathematical procedures of converting
known (continuous or discrete) size distributions and the implementation of analytical
distribution functions have been discussed in D3.4. Attention was paid to the analysis of
size measurements by means of spectroscopic ensemble techniques.
Formulae and references that can be used to feed the NanoDefiner e-tool and the principal
limits of the different conversion schemes have been provided. The necessity of a-priori
knowledge of the main morphology of the particles was highlighted. Such knowledge allows
for selecting appropriate relationships between probed particle equivalent diameter and
the quantity in which the size fractions are weighted.
VSSA of a particulate material is one of two apparently very different metrics recommended
by the EC definition of “nanomaterial” for regulatory purposes: specifically, the VSSA
metric may classify nanomaterials and non-nanomaterials differently than the median size
in number metrics, depending on the chemical composition, size, polydispersity, shape,
porosity, and aggregation of the particles in the powder. Within the public D3.5 the extent
of agreement between classification by electron microscopy (EM) and classification by
VSSA has been evaluated on a large set of diverse particulate substances that represent
all the anticipated challenges except mixtures of different substances. EM and VSSA were
determined in multiple labs to assess also the level of reproducibility. Based on the results
obtained on highly characterized benchmark NanoDefine materials, we derived a tiered
screening strategy for implementing the definition of nanomaterials. We applied the
screening strategy also to additional industrial materials, which were classified correctly
and left only borderline cases for EM. On platelet-shaped nanomaterials, VSSA is essential
to prevent false-negative classification by EM. On porous materials, approaches involving
extended adsorption isotherms prevent false positive classification by VSSA. We found no
false negatives by VSSA, neither in Tier 1 nor in Tier 2, despite real-world industrial
polydispersity and diverse composition, shape, and coatings. The VSSA screening strategy
is recommended for inclusion in a technical guidance for the implementation of the
definition.
Last WP3 task was dedicated to monitoring new developments of particle sizing techniques
on the market and in research. For this, about 300 individual expert opinions, comments
and suggestions on the proposed techniques were collected as part of D3.8 and have been
discussed at the Science Workshop hold in November 2015 in Berlin. MiniTEM constitutes
NanoDefine project Final report
18
an example of newly developed MT whose high potential was recognized by NanoDefine so
that it was selected as a joker technique to be further evaluated under WP4.
WP4: Screening methods (tier 1 methods)
Main achievements addressed method developments and instrument tailoring and included
the following outcome: 1) completion of the electrospray system prototype, 2)
determination of the average LODsize on ICAP-Q by spICPMS for particles with 13 nm for
Au, 15 nm for Ag, 44 nm for TiO2, 3) design and manufacture of a HRMS prototype by
RAMEM for the particle size analysis in the range of 1...5 nm showing good results for 2
nm Au reference suspension, 4) improvement of the accuracy for particle size analysis in
particle tracking analysis also by means of a concentration measurement upgrade
implemented in the software, 5) generic SOPs developed according to WP6 guidelines for
all screening methods (CLS, HRMS, SMPS, particle tracking analysis and spICP-MS), 6)
testing of additional screening methods “refined dynamic light scattering (DLS)” and
MiniTEM showing clear advancements in comparison to the prior state of the art, 6)
successful validation of key screening methods are according to international guidelines
and in line with the default approach provided by WP6, 7) inter-laboratory validations of
AUC and CLS methods and ParticleSizer software organised by WP6 in collaboration with
VAMAS.
A set of validated, cost-efficient, robust, and easy implementable methods was established
for the rapid distinction between nano/non-nano according to the definition. In cooperation
with WP3 testing of substances and materials has been performed to determine the
robustness, trueness and precision especially of the rapid screening methods. Using the
reference materials (internal calibration standards) method specific limitations have been
investigated, e.g. for SMPS the concentration of the particles, the composition and purity
of the electrolyte for Electrospray. For Disk-CLS noise and baseline drift have been
determined as limiting parameters and a strategy for specific validation, e.g. by cuvette
centrifuge has been considered. All AC techniques and spICPMS were validated with respect
to size analysis in the relevant size range, including the number-weighted median size.
Moreover, DLS and MiniTEM successfully demonstrated their applicability as cost-efficient
and robust screening methods at real-world materials.
Another goal in WP4 was the improvement of instruments and related methods (together
with WP2) to increase the range of applicability and cost-efficiency. This included the
improvement of existing instruments (NTA, CLS) and construction of prototypes (SMPS),
and the development of software for the evaluation of spICPMS data. Dispersions
procedures were exchanged with WP2 for the application of all methods and have been
adapted for the application of spray-DEMA and of SMPS. Improvement in hardware and
software of commercial PTA instrumentation allowed the determination of particle number
concentration and reduced the lower size limit of the technique.
Concerning particle counting methods, both Dynamic Ultramicroscopy (NTA) and Single
particle ICP-MS have been upgraded. The concentration upgrade is fully released and
available to all NTA instruments matching required specifications. The upgrade has been
incorporated into a final software version (NTA 3.1) and will be implemented by all future
software developments. Besides, a protocol has been produced facilitating the upgrade
process. This is intended to be completed by instrument users for field based instrument
upgrades and Malvern production staff for build instruments ordered with the upgrade
included. In addition, marketing and user support material has been produced with the aim
to explain and promote the upgrade. The final product successfully reduces the influence
of user selected settings (camera level, detection threshold) and sample properties on
concentration measurements allowing greater reproducibility between measurements and
a confidence in measurement accuracy across a range of settings. Also, improvements to
NanoDefine project Final report
19
repeatability have been introduced through adopting a best practice protocol which
optimises the amount of data captured along with incorporating sample flow and an
automatic focus detection.
For spICPMS, a software has been developed that allows the determination of the size- and
number distribution of nanoparticles in a sample. A complete package for the definition of
suitable parameters for data acquisition and measurement control was established
together with the required calculation algorithms to evaluate data sets according to the
spICPMS calculations. Corresponding user interfaces were created. Preliminary evaluation
of results obtained with this software have been compared to a widely accepted alternative
calculation tool to provide a preliminary validation of the correct calculation of the particle
size as well as the particle number concentration. The software development has been
continued to be introduced as a commercially available part of the Qtegra ISDS software
platform, so that users of different ICP-MS instrumentation are able to use it for the
determination of size distribution and number concentration of nanoparticles in routine
laboratories.
A High-Resolution Mobility Spectrometer (HRMS) was developed to characterise
nanomaterials in the size range 1-5 nm, and performance validated to be adequate to the
NanoDefine requirements regarding the smallest nanometric range 1-5nm. Instrument
design was aimed at minimizing particle losses by diffusion. The particle path was
minimized by using planar DMA geometry. The particle generator and detector were
coupled to the classification zone. The pneumatic circuit was dimensioned to high sheath
flow rates in order to minimize particle dwelling time in the system. The DMA manufacture
was very difficult because of its extraordinary complexity and strict geometrical and
precision requirements, but was completed successfully and in extraordinary agreement
with the theoretical simulations. Despite the difficulties, all components were successfully
manufactured. Engineering tests were realized in order to validate the instrument
functionality. RAMEM carried out validation measurements with mobility standards, but
could not accomplish an entire intra-laboratory validation over 5 days. This technical
challenge is in accordance with the expert opinion in the new informative Annex G draft of
the actually revised ISO 15900.
The performance of the two more commonly available centrifugation methods, disk-
centrifugal liquid sedimentation and cuvette-centrifugal liquid sedimentation, have been
considered in comparison with the more expensive, less common but more technically
sophisticated and capable method of analytical ultracentrifugation (AUC).
The results of this evaluation done by using ideal particles (narrow size distribution,
unaggregated and spherical) confirm that all three AC methods are very capable of reliably
determining particle size. When applied to the problem of measuring a mass-based size
distribution of bimodal and trimodal mixtures of approximately known composition, the
results showed the AUC and cuvette-systems are more accurate than the disk-CLS.
The additional (“Joker”) methods selected in WP3, “refined dynamic light scattering (DLS)”
and MiniTEM, were tested and the advancements shown in comparison to the prior state
of the art. In case of DLS, experimental studies showed that the quality of DLS data
(autocorrelation function) can be improved by refining sample preparation and
measurement protocol without changing the hardware configuration. The improvement
aimed at an increased sensitivity towards the smallest size fractions. For this purpose,
different approaches were examined: removing coarse particles from sample by filtering
and depleting the measurement zone of coarse particles by expanding the equilibration
time. This was successfully tested on four NanoDefine materials (kaolin, barium sulfate
coarse grade, calcium carbonate and coated titania) in triplicates.
The state of the MiniTEM development before the beginning of the development process
did not allow a validation but rather an evaluation of the MiniTEM analysis technique. The
software was found to be in a “beta-state”, and human interaction was frequently required.
NanoDefine project Final report
20
Automated focusing and searching of suitable grid positions were optimised and tested for
different sample systems at different magnification scales causing occasionally problems
during the evaluation. The number-weighted medians determined by MiniTEM are close to
the results generated by standard TEM. Moreover, the MiniTEM software evaluates TEM
similarly well as the ParticleSizer software developed in NanoDefine. Image quality and
resolution of MiniTEM is lower than in standard TEM due to lower acceleration voltage. Yet
this appeared irrelevant for material classification according to the EC definition of
nanomaterials. The parameters for the image evaluation module of the MiniTEM system
can be optimised for each material as e.g. proposed in the ParticleSizer SOP.
Another objective in WP4 was the determination of individual methods’ limitations and
derivation of maximum application ranges with regard to the requirements of the definition.
For this, the actual working range, detection and quantification limits have been
established by means of an intra-laboratory validation process that started after finalisation
of method development according to the guidelines generated in WP 6. Generic SOPs meet
the defined requirements and have been approved by WP6. The determination of the actual
working range, detection and quantification limits has been finished for all AC techniques
and spICP-MS. Using at least two real world materials or substances, these key screening
methods are successfully validated according to international guidelines and in line with
the default approach provided by WP6. After finishing the evaluation, validation reports
have been prepared by the laboratories in charge and sent to WP6 for review. Main results
can be summarized: (i) spICPMS validation was carried out for analysis of titania
nanoparticles in suspension, titania in sunscreen and alumina in toothpaste. The method
produced repeatable results, especially for particle size. (ii) validation of the cuvette-type
AC technique with interferometric optic showed its ability to properly distinguish between
nano and non-nano materials. For the test material already in suspension (trimodal SiO2),
there is an excellent match between x50,3 and x50,0 values generated at the two
participating labs with less than 6 % and 2 % difference, respectively. Differences are
much higher in case of BaSO4 powders: for the coarse grade, they amount to 56 % for
x50,0, although the material is still correctly identified as non-nano-material. (iii) For the
cuvette-type AC with turbidity detector, the working range regarding sample content is
from 0.6 g/kg – 2.6 g/kg for (BaSO4, coarse grade) and 0.6 g/kg – 10 g/kg for (BaSO4,
fine grade). The lower limit can be expanded until 0.1 g/kg by choosing 10 mm cuvettes.
The intermediate precision was below 10 % for both BaSO4 powders. (iv) The repeatability
of the Disc-type AC with turbidity detector including ultrasonic dispersion and AC
measurement is fairly high for both BaSO4 powders – provided that appropriate instrument
parameters are used. The method was found to be robust with respect to the sedimentation
gradient composition, choice of calibrant and moderate changes in rotation speed.
WP5: Confirmatory methods (tier 2 methods)
Software for automated particle size analysis of recorded EM images.
The development of a new software for automated particle size analysis of recorded EM
images (off-line batch processing) was one of the confirmatory methods developed. The
splitting of touching / overlapping nanoparticles is a very challenging task with a trade-off
between automatization, detection quality and user-input. Software based on ImageJ
which is capable to handle different image qualities, backgrounds and polydisperse particle
mixtures was developed. For that purpose, a pipeline was designed, which removes
different noise-levels automatically by using a non-local-means filter, subtracting the
image back-ground and binarizing the image using local adaptive thresholding technique.
Finally, the software detects and removes false positive segmentations by defining a
minimal feret diameter and a minimal object-to-background intensity difference. The
ParticleSizer software successfully handled overlapping particles, various image qualities
(intensities) and inhomogeneous backgrounds.
NanoDefine project Final report
21
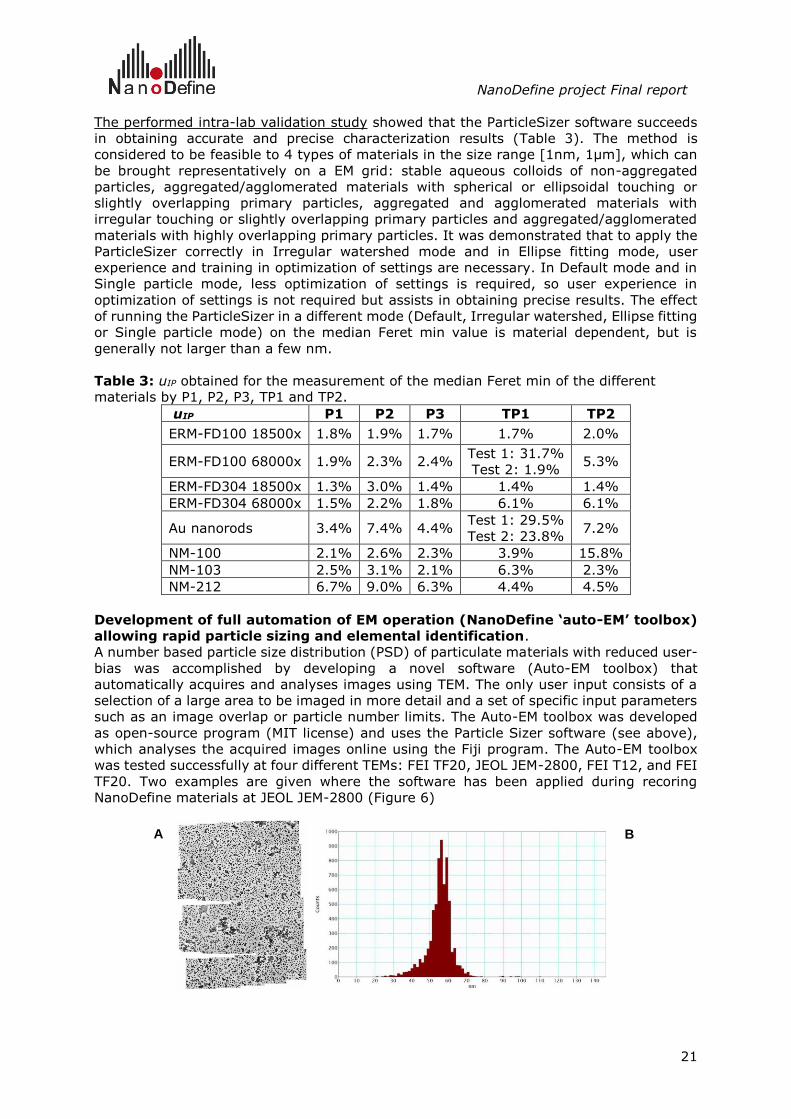
The performed intra-lab validation study showed that the ParticleSizer software succeeds
in obtaining accurate and precise characterization results (Table 3). The method is
considered to be feasible to 4 types of materials in the size range [1nm, 1µm], which can
be brought representatively on a EM grid: stable aqueous colloids of non-aggregated
particles, aggregated/agglomerated materials with spherical or ellipsoidal touching or
slightly overlapping primary particles, aggregated and agglomerated materials with
irregular touching or slightly overlapping primary particles and aggregated/agglomerated
materials with highly overlapping primary particles. It was demonstrated that to apply the
ParticleSizer correctly in Irregular watershed mode and in Ellipse fitting mode, user
experience and training in optimization of settings are necessary. In Default mode and in
Single particle mode, less optimization of settings is required, so user experience in
optimization of settings is not required but assists in obtaining precise results. The effect
of running the ParticleSizer in a different mode (Default, Irregular watershed, Ellipse fitting
or Single particle mode) on the median Feret min value is material dependent, but is
generally not larger than a few nm.
Table 3: uIP obtained for the measurement of the median Feret min of the different
materials by P1, P2, P3, TP1 and TP2.
uIP P1 P2 P3 TP1 TP2
ERM-FD100 18500x 1.8% 1.9% 1.7% 1.7% 2.0%
ERM-FD100 68000x 1.9% 2.3% 2.4% Test 1: 31.7%
Test 2: 1.9% 5.3%
ERM-FD304 18500x 1.3% 3.0% 1.4% 1.4% 1.4%
ERM-FD304 68000x 1.5% 2.2% 1.8% 6.1% 6.1%
Au nanorods 3.4% 7.4% 4.4% Test 1: 29.5%
Test 2: 23.8% 7.2%
NM-100 2.1% 2.6% 2.3% 3.9% 15.8%
NM-103 2.5% 3.1% 2.1% 6.3% 2.3%
NM-212 6.7% 9.0% 6.3% 4.4% 4.5%
Development of full automation of EM operation (NanoDefine ‘auto-EM’ toolbox)
allowing rapid particle sizing and elemental identification.
A number based particle size distribution (PSD) of particulate materials with reduced user-
bias was accomplished by developing a novel software (Auto-EM toolbox) that
automatically acquires and analyses images using TEM. The only user input consists of a
selection of a large area to be imaged in more detail and a set of specific input parameters
such as an image overlap or particle number limits. The Auto-EM toolbox was developed
as open-source program (MIT license) and uses the Particle Sizer software (see above),
which analyses the acquired images online using the Fiji program. The Auto-EM toolbox
was tested successfully at four different TEMs: FEI TF20, JEOL JEM-2800, FEI T12, and FEI
TF20. Two examples are given where the software has been applied during recoring
NanoDefine materials at JEOL JEM-2800 (Figure 6)
A B
NanoDefine project Final report
22
Figure 6: (A) A mosaic image (5x6) of Au NIST NPs (JEOL JEM-2800); (B) PSD of NIST
Au NPs (𝑿𝟓𝟎 value is 56 nm and 6636 particles were analysed).
Measurement methods for complex materials based on particle separation (FFF)
and conventional multi-detection techniques
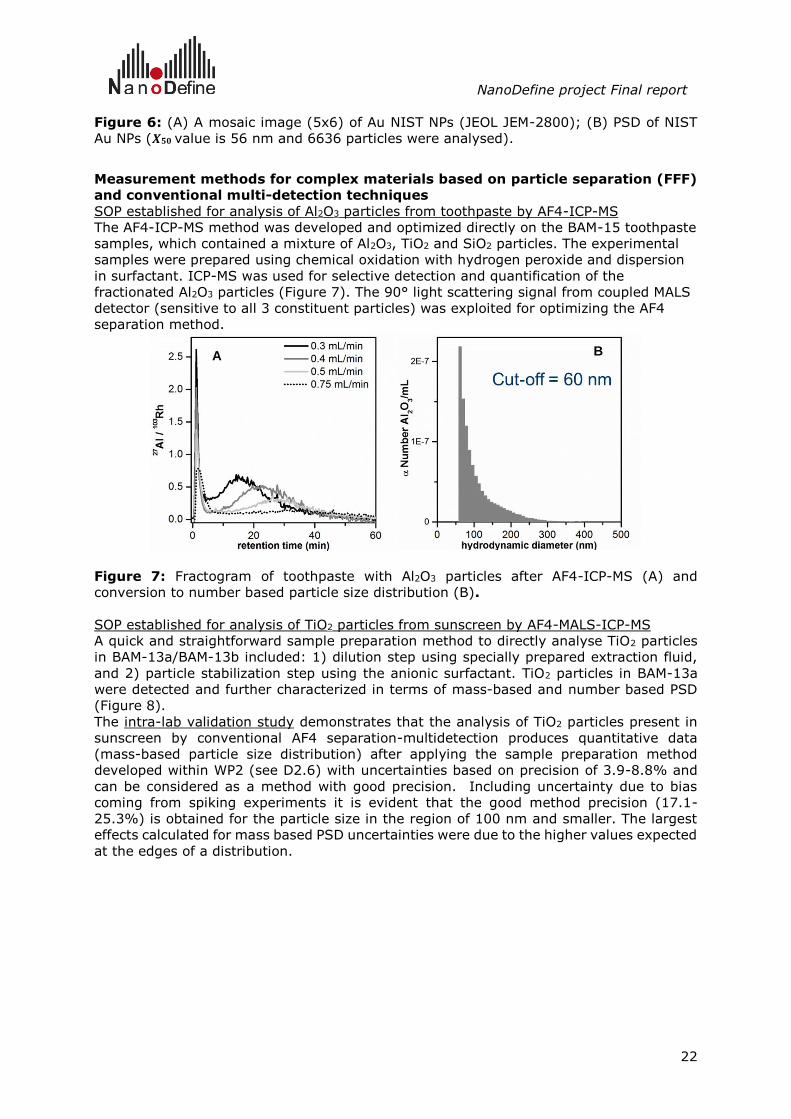
SOP established for analysis of Al2O3 particles from toothpaste by AF4-ICP-MS
The AF4-ICP-MS method was developed and optimized directly on the BAM-15 toothpaste
samples, which contained a mixture of Al2O3, TiO2 and SiO2 particles. The experimental
samples were prepared using chemical oxidation with hydrogen peroxide and dispersion
in surfactant. ICP-MS was used for selective detection and quantification of the
fractionated Al2O3 particles (Figure 7). The 90° light scattering signal from coupled MALS
detector (sensitive to all 3 constituent particles) was exploited for optimizing the AF4
separation method.
Figure 7: Fractogram of toothpaste with Al2O3 particles after AF4-ICP-MS (A) and
conversion to number based particle size distribution (B).
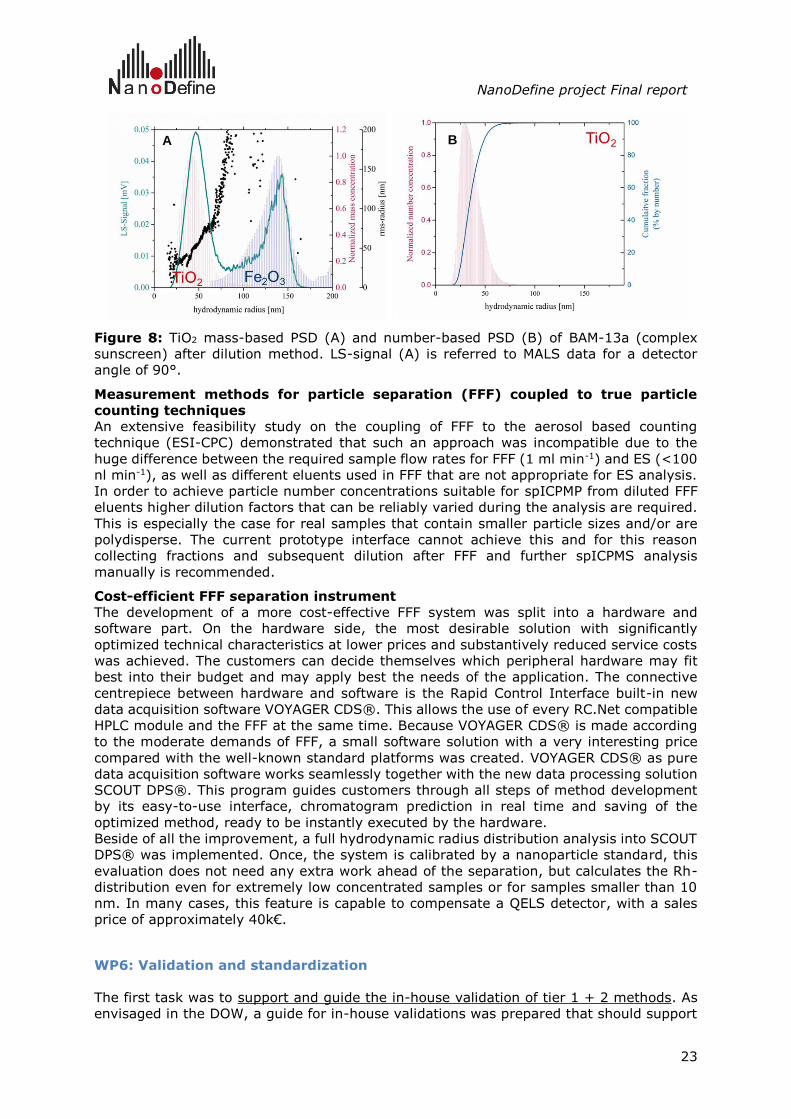
SOP established for analysis of TiO2 particles from sunscreen by AF4-MALS-ICP-MS
A quick and straightforward sample preparation method to directly analyse TiO2 particles
in BAM-13a/BAM-13b included: 1) dilution step using specially prepared extraction fluid,
and 2) particle stabilization step using the anionic surfactant. TiO2 particles in BAM-13a
were detected and further characterized in terms of mass-based and number based PSD
(Figure 8).
The intra-lab validation study demonstrates that the analysis of TiO2 particles present in
sunscreen by conventional AF4 separation-multidetection produces quantitative data
(mass-based particle size distribution) after applying the sample preparation method
developed within WP2 (see D2.6) with uncertainties based on precision of 3.9-8.8% and
can be considered as a method with good precision. Including uncertainty due to bias
coming from spiking experiments it is evident that the good method precision (17.1-
25.3%) is obtained for the particle size in the region of 100 nm and smaller. The largest
effects calculated for mass based PSD uncertainties were due to the higher values expected
at the edges of a distribution.
A B
NanoDefine project Final report
23
Figure 8: TiO2 mass-based PSD (A) and number-based PSD (B) of BAM-13a (complex
sunscreen) after dilution method. LS-signal (A) is referred to MALS data for a detector
angle of 90°.
Measurement methods for particle separation (FFF) coupled to true particle
counting techniques
An extensive feasibility study on the coupling of FFF to the aerosol based counting
technique (ESI-CPC) demonstrated that such an approach was incompatible due to the
huge difference between the required sample flow rates for FFF (1 ml min-1) and ES (<100
nl min-1), as well as different eluents used in FFF that are not appropriate for ES analysis.
In order to achieve particle number concentrations suitable for spICPMP from diluted FFF
eluents higher dilution factors that can be reliably varied during the analysis are required.
This is especially the case for real samples that contain smaller particle sizes and/or are
polydisperse. The current prototype interface cannot achieve this and for this reason
collecting fractions and subsequent dilution after FFF and further spICPMS analysis
manually is recommended.
Cost-efficient FFF separation instrument
The development of a more cost-effective FFF system was split into a hardware and
software part. On the hardware side, the most desirable solution with significantly
optimized technical characteristics at lower prices and substantively reduced service costs
was achieved. The customers can decide themselves which peripheral hardware may fit
best into their budget and may apply best the needs of the application. The connective
centrepiece between hardware and software is the Rapid Control Interface built-in new
data acquisition software VOYAGER CDS®. This allows the use of every RC.Net compatible
HPLC module and the FFF at the same time. Because VOYAGER CDS® is made according
to the moderate demands of FFF, a small software solution with a very interesting price
compared with the well-known standard platforms was created. VOYAGER CDS® as pure
data acquisition software works seamlessly together with the new data processing solution
SCOUT DPS®. This program guides customers through all steps of method development
by its easy-to-use interface, chromatogram prediction in real time and saving of the
optimized method, ready to be instantly executed by the hardware.
Beside of all the improvement, a full hydrodynamic radius distribution analysis into SCOUT
DPS® was implemented. Once, the system is calibrated by a nanoparticle standard, this
evaluation does not need any extra work ahead of the separation, but calculates the Rh-
distribution even for extremely low concentrated samples or for samples smaller than 10
nm. In many cases, this feature is capable to compensate a QELS detector, with a sales
price of approximately 40k€.
WP6: Validation and standardization
The first task was to support and guide the in-house validation of tier 1 + 2 methods. As
envisaged in the DOW, a guide for in-house validations was prepared that should support
A B
NanoDefine project Final report
24
the laboratories in charge of the in-house validation exercises. The aim of the in-house
validation guideline was to ensure the compliance with international standards based on
the IUPAC "Harmonised Guidelines for Single-Laboratory Validation of Analytical Methods",
the Eurachem Guide "Fitness for Purpose of Analytical Methods" and Commission Decision
2002/657/EC on the reliability of methods for residues and contaminants in food of animal
origin. As an outcome, the most promising methods should be subjected to inter-laboratory
validation.
The guideline is divided in several parts that address general aspects; the workflows of
preparing documents and their review; the listing of possible validation parameters and
templates, and examples for the preparation of respective documents.
In the generic part, the aspect of pre-defined criteria and the importance of routine
conditions for the validations are stressed. An important clarification is the definition of a
method: it is understood that for substances and products, the scope of the individual
method validation is a combination of a sample preparation protocol, the measurement
technique (e.g. TEM) and a specific type of nanomaterial(s).
It is emphasized that a good method validation is not an ad hoc exercise, but a planned
process based on three steps: the description of the underlying work instruction (standard
operating procedure, SOP) describing all the details and operations that are needed to
successfully perform a measurement; the validation plan describing all the validation
parameters and experiments together with acceptance criteria; and a validation report that
evaluates and summarizes the obtained results and assesses if the method is fit for
purpose.
The proposed workflow included a reviewing step of each document by the JRC. Together
with the provided document templates, this assured the harmonised approach over
different validations and actors. In order to assure the harmonized approach in different
laboratories, templates for SOPs, validation plans and validation reports are annexed to
this document, together with an example of a typical SOP for nanoparticles. The in-house
validation guideline was discussed and reviewed by project partners und finally accepted
by all partners in the project.
As proposed in the guideline, a validation list was prepared summarizing all important
information about the planned validations. Apart from more technical aspects (description
of method, measurement technique, samples), also organisational aspects (laboratories in
charge of the validation, contact persons, time frames) and the current status of activities
are documented which gives an up-to-date overview on the whole exercise and allows a
proper management and coordination of the studies. This document served as a backbone
for regular WP6 discussions on the progress of the validations, typically carried out in
frequent telephone conferences. JRC assisted in the preparation of the SOP, the validation
plans and the in-house validation reports. Critical reviews were given on the respective
documents involved. This ensured that the agreed, harmonised approach was followed. In
the end, 8 methods/SOPs based on 6 measurement principles covering 22 parameters
were assessed in the in-house validations. All of them were selected for the subsequent
inter-laboratory validation studies (see below).
The second task was the inter-laboratory validation of key measurement methods by JRC-
IRMM and all trained laboratories. The DOW specified that the most promising methods
based on the outcome of the in-house validation studies should be selected. As a target,
four methods should be selected to be studied in the inter-laboratory validations. In
practice, more methods were chosen. First of all, at least four measurement principles are
involved (the ParticleSizer software, spICPMS, AF4-MALS-ICPMS, CLS). In the case of the
centrifugal methods, three subtechniques had been validated (Disc-CLS, Cuvette-CLS,
Analytical Ultracentrifugation). Instead of selecting only one of them, it was decided that
all three of them should be studied in the inter-laboratory validation exercises. Although
NanoDefine project Final report
25
the measurement techniques are very similar, the principles do vary which leads to
different measurands that per se cannot be compared directly. All CLS methods were
developed for BaSO4 and had shown a similar performance in the in-house validation.
However, it was unclear whether all CLS techniques would be able to obtain the needed 8
valid data sets (see MS38). As a consequence, all CLS methods were subjected to inter-
laboratory validation studies, taking into account that not all of them would collect
sufficient data. For the spICPMS, three different methods were available (TiO2 in
suspension, TiO2 in sunscreen, Al2O3 in toothpaste) and all of them were selected as well.
The AF4 method was developed for TiO2 in toothpaste. Finally, all 8 methods were selected.
For every of these methods, more than one parameter (measurand) has to be determined,
such as particle size expressed as number-or mass-based median diameters, median Feret
diameters, hydrodynamic radiuses, or particle number/mass concentrations. In total, 22
parameters for the 8 selected methods had to be measured in the inter-laboratory
validation studies.
Given the low number of potential laboratories, it was evident that successful
interlaboratory exercises could only be organised with external participants from all over
the world. For this reason, a project under the auspices of VAMAS was started (see below)
that should give the inter-laboratory exercises also the necessary standing and visibility.
The proposed project was approved as new project 9 (Assessment of a quantitative
nanomaterial definition) of TWA34. Shortly after, an international call was launched that
should not only include metrological institutes, but also all kinds of public or private
laboratories. In addition, available networks of consortium partners were activated and in
the end, the international call was sent to over 200 laboratories world-wide inviting to join
one or more of the inter-laboratory method comparisons. As stated above, the selected
methods included measurement principles such as spICPMS, the ParticleSizer (automatic
analysis of EM images), Disc-CLS, Cuvette-CLS, Analytical Ultracentrifugation (AUC), and
AF4-MALS-ICPMS. Given the extremely short time of a few weeks to respond to this call,
the feedback was very positive: in total, 104 laboratories showed their interest in
participation and 88 of them actually registered.
Interested parties received the respective SOPs and the necessary test materials, together
with clear instructions from JRC.
Despite the large global call and the high number of participants, the number of acceptable
data sets per method was sometimes below the minimum number of eight. This could be
due to time constraints or problems to implement the methods in a laboratory in the
relatively short period available, as was the case for Disc CLS, AUC, and AF4. Strictly
speaking, no quantitative conclusions on reproducibility can be drawn from these results,
even if some results are promising, e.g. in the case of FFF. However, due to the lack of
sufficient data, the inter-laboratory study cannot be considered successful for these
methods.
The remaining five methods (three spICPMS methods, Cuvette CLS and the ParticleSizer
Software) obtained however a satisfactory to high number of acceptable data sets. In the
case of the spICPMS methods, the within-laboratory relative standard deviations were
comparable or better than the standard uncertainties obtained in the in-house validations.
As a rule of thumb, relative reproducibility standard deviations larger than 20 – 25 % are
very often not deemed as fit for purpose which means that the observed RSDR of these
methods of around 40 % indicates a problem in different laboratories. Data from particle
number concentrations (data not shown) suggest that it could be an issue of sample
preparation in the different laboratories.
The results of the Cuvette CLS method for BaSO4 are quite positive. The ParticleSizer
Software was tested on images of four different materials with increasing difficulty in terms
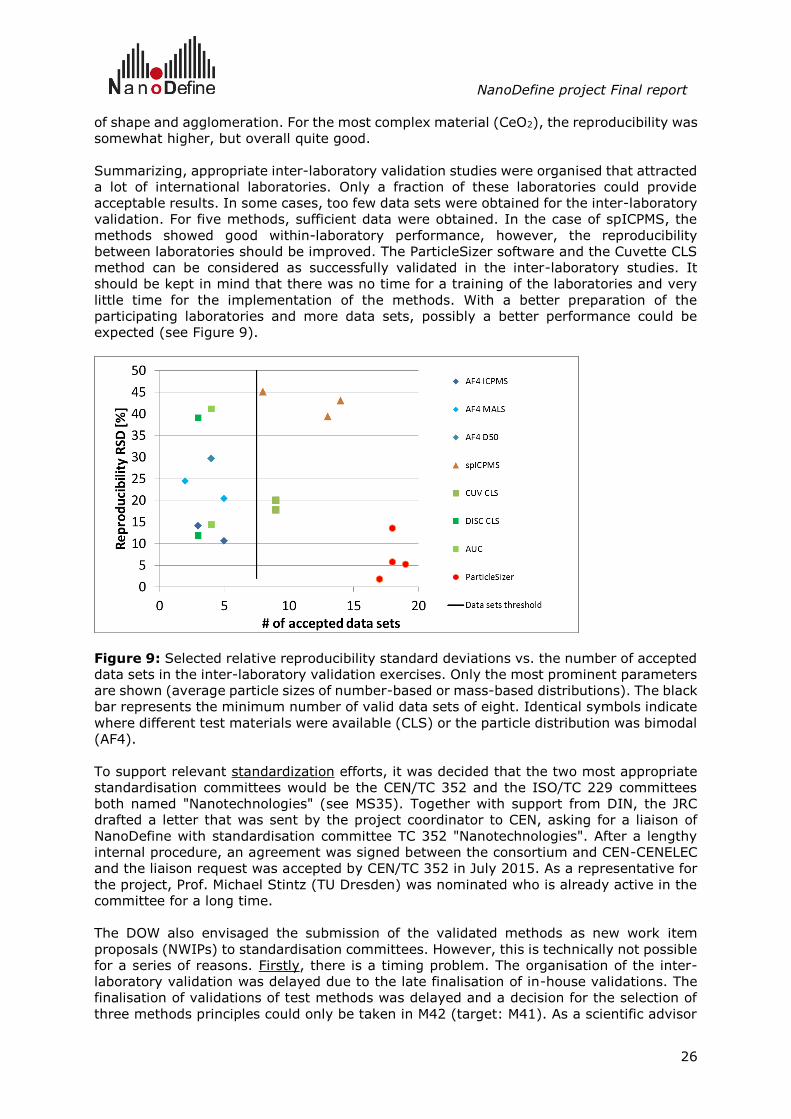
NanoDefine project Final report
26
of shape and agglomeration. For the most complex material (CeO2), the reproducibility was
somewhat higher, but overall quite good.
Summarizing, appropriate inter-laboratory validation studies were organised that attracted
a lot of international laboratories. Only a fraction of these laboratories could provide
acceptable results. In some cases, too few data sets were obtained for the inter-laboratory
validation. For five methods, sufficient data were obtained. In the case of spICPMS, the
methods showed good within-laboratory performance, however, the reproducibility
between laboratories should be improved. The ParticleSizer software and the Cuvette CLS
method can be considered as successfully validated in the inter-laboratory studies. It
should be kept in mind that there was no time for a training of the laboratories and very
little time for the implementation of the methods. With a better preparation of the
participating laboratories and more data sets, possibly a better performance could be
expected (see Figure 9).
Figure 9: Selected relative reproducibility standard deviations vs. the number of accepted
data sets in the inter-laboratory validation exercises. Only the most prominent parameters
are shown (average particle sizes of number-based or mass-based distributions). The black
bar represents the minimum number of valid data sets of eight. Identical symbols indicate
where different test materials were available (CLS) or the particle distribution was bimodal
(AF4).
To support relevant standardization efforts, it was decided that the two most appropriate
standardisation committees would be the CEN/TC 352 and the ISO/TC 229 committees
both named "Nanotechnologies" (see MS35). Together with support from DIN, the JRC
drafted a letter that was sent by the project coordinator to CEN, asking for a liaison of
NanoDefine with standardisation committee TC 352 "Nanotechnologies". After a lengthy
internal procedure, an agreement was signed between the consortium and CEN-CENELEC
and the liaison request was accepted by CEN/TC 352 in July 2015. As a representative for
the project, Prof. Michael Stintz (TU Dresden) was nominated who is already active in the
committee for a long time.
The DOW also envisaged the submission of the validated methods as new work item
proposals (NWIPs) to standardisation committees. However, this is technically not possible
for a series of reasons. Firstly, there is a timing problem. The organisation of the inter-
laboratory validation was delayed due to the late finalisation of in-house validations. The
finalisation of validations of test methods was delayed and a decision for the selection of
three methods principles could only be taken in M42 (target: M41). As a scientific advisor
NanoDefine project Final report
27
from the project SAB suggested to try everything to get also the FFF method selected, the
deadline for the selection of the fourth measurement principle was postponed to M43, when
the AF4 method was accepted. On top of this delay, the organisation of the VAMAS project
also required some extra time that was not foreseen in the DOW. As explained above, the
VAMAS project approval could only be obtained after the selection of methods for inter-
laboratory validations. Secondly, there is a technical problem why the mentioned methods
could not form the basis of a NWIP. The developed methods in NanoDefine are specific test
methods that provide a protocol (SOP) for the quantitative analysis of a specific material
which implies that the whole measurement procedure (as defined by the international
vocabulary of metrology, VIM) is specified. This includes the definition of the measurand,
the type of sample, its sample preparation, the actual measurement specifying the
measurement technique with the detailed conditions, and the data evaluation that leads to
the final result. From the point of view of standardisation committees, these methods are
highly specific and developed and validated for a particular type of analysis. However, work
items and published standards typically deal with more generic guidelines that result in a
broad applicability of these standards. In other words, the methods developed in
NanoDefine are rather over-specific in their scope when considering them as potential
NWIPs.
There is also another (third) technical issue that should be considered. In the course of the
NanoDefine project, there was limited time for the development and subsequent validation
of the different methods. There was little or no time for optimisation, especially for the
validation experiments. It is in the interest of the standardisation committees that only
fully optimised methods are considered for their work programme. It is questionable if the
methods provided by NanoDefine at the end of the project are already mature enough to
pass a rigorous scrutinizing by the standardisation bodies before accepting them as new
work items.
However, a proposal finally surfaced to consider the NanoDefine Methods Manual (D7.6
and D7.7) as a NWIP. This idea was taken up by M. Stintz, the project's representative in
CEN/TC352. It basically proposes the content of the Methods Manual as a NWIP in the form
of a technical report (TR). This is based on the work described in deliverable reports D7.6
and D7.7, but also in D3.1 and D7.12. The title of the proposed NWIP is Eligibility of particle
characterization methods for classification of a material as nanomaterial. The proposal was
put forward by DIN as it had to come from a CEN member body. One main feature of the
Methods Manual is the decision support flow scheme, which is developed to logically guide
the user through a sequence of tasks, decision nodes and options in order to decide
whether a material is a nanomaterial or not according to the EC Recommendation for a
definition of the term "nanomaterial". The Strategy Group of CEN/TC 352 has invited M.
Stintz to its meeting on 18 October 2017 in Prague to comment the delivered outline and
to answer questions from the other experts. If successful, at the next plenary meeting on
19 October 2017, CEN/TC 352 will ask DIN to launch the NWIP for the TR. A first discussion
with experts could follow at the first CEN/TC 352 meeting in 2018 on 15 March in Brussels.
WP7: Implementation: NanoDefiner e-Tool, Manual & case studies
To enable authorities and enterprises to make the best use of the project findings, a
decision support framework was developed, the pillars on which the framework is based
and the tools for practical application (decision support flow scheme and e-tool). The pillars
for the decision support framework are: (i) Knowledge base – methods evaluation, (ii)
Materials Classification System, (iii) Data input – Methods Manual, and (iv) logical flow
scheme – decision tree. The flow scheme is implemented in an e-tool (v). After completion,
the decision support framework was tested in (vi) Case Studies, and in addition the WP
developed (vii) recommendations on a revision of the EC definition of nanomaterial.
NanoDefine project Final report
28
(i) Performance Criteria, Methods Evaluation and Knowledge Base. A catalogue of technical
performance criteria was developed targeted at measurement requirements resulting from
the EC NM definition of the term “nanomaterial”. The capacities of each characterisation
method (CM) was elaborated in detail at the beginning and at the end of the project,
including
• Applicability to different groups of substances (chemical scope of the method)
• Applicability to polydisperse samples
• Measurement in terms of size, shape and test medium for different groups of substances
• Capacity to measure aggregates, agglomerates, primary particles and/or non-spherical
particles.
• Accuracy of the results determined with the CM
• Standardization status (traceability of the measured values / availability of CRMs)
The results of these evaluations were collected in a Knowledge Base available as tabular
database and in machine-readable form for the e-tool.
(ii) Materials Classification System. A method-driven materials classification system was
developed which classifies a material according to criteria that are most influential for
selecting appropriate characterisation methods. This enables the optimal match between
a specific material and the most appropriate characterisation method to be used when
going through the decision tree.
(iii) Method Manual – data input. The hands-on manual on the recommended use of
methods specified by purpose and quality requirements, including performance
characteristics was compiled based on filled methods templates and more in-depth
information on specific methods added as annexes. The manual was updated and expanded
based on findings from work packages 1-6, and according to the “state of the art” at the
end of the project. It can be consulted by the user to give clear guidance on the CMs to be
used and their application range as well as their limits throughout the entire nanomaterial
characterization process. The manual also contains the complete material classification
system and the decision support flow scheme with detailed instructions on all steps,
including explanation of the decision process at each decision node, SOPs developed in the
project and available standards. It is a stand-alone document to be consulted by the user
throughout the entire decision process on how best to obtain and use experimental data
necessary in the entire decision process. The manual is also integrated as online version
into the NanoDefiner e-tool.
(iv) Decision tree – conceptual decision support flow scheme. The NanoDefine decision
support flow scheme was developed to logically guide the user through a sequence of tasks,
decision nodes and options in order to decide whether a material is a nanomaterial or not
according to the EC Recommendation for a definition of the term "nanomaterial". The flow
scheme implements and integrates the results obtained in the individual WPs into a
comprehensive decision support framework and guides the user through the entire decision
process. Step by step, based on the knowledge acquired within NanoDefine and depending
on the nature of the material to analyse, the user is given a choice how to characterise
the material in question with certain screening (tier 1) or confirmatory methods (tier 2).
The flow scheme starts with a basic classification and then continues in two branches: one
for powders and one for dispersions. The two branches go to a first tier (screening
methods) and continue to tier 2 (confirmatory methods). For each step a dedicated node
is proposed that indicates to the user a set of information required for proper classification
of the material as nano or non-nano. The scheme is designed to allow economic and reliable
decisions on whether a material can be identified as nano or non-nanomaterial.
(v) NanoDefiner e-Tool. The decision support flow scheme was implemented in the
NanoDefiner e-tool. The NanoDefiner e-tool software (beta-version) was developed and
successfully tested within the consortium. It was further developed into its final version
which is available as standalone as well as downloadable version. The e-tool is an easy to
NanoDefine project Final report
29
use software which guides the user through the entire decision process. The material
classification system, the knowledge base with its quantitative and qualitative evaluation
of tier1 and tier 2 characterisation methods and the logical decision support flow scheme,
together with input of data at appropriate stages are the main elements ("pillars") of the
e-tool. The work flow within the e-tool follows the decision support flow scheme. The e-
tool is configurable via configuration files and therefore has the flexibility necessary to be
adapted for technical progress in the CMs, modification of the decision criteria and revisions
of the EC's nanomaterial definition.
(vi) Case studies. The decision work flow was tested in case studies with nine different
materials. Three categories of case studies were conducted, which each take a distinct
perspective:
• NanoDefine Materials already extensively tested in NanoDefine
• OECD sponsorship program materials from the JRC repository
• Materials with challenges not yet represented in the project
The case studies run also by external collaborators explored both tier 1 routes (powder
and dispersion) and benchmarked against a tier 2 method (TEM/EM). They were carried
out manually as well as using the NanoDefiner e-tool. There were no cases of inconsistent
classification, two cases remained inconclusive regarding the decision nano or non-nano.
The decision tree was optimized as a result of these studies to further reduce ambiguities.
In all cases studied the two runs came to consistent results for a specific element regardless
of whether the assessment was made by applying the flow scheme manually or whether
the e-tool was used.
(vii) Recommendations on a revision of the EC nanomaterial definition. The project
developed recommendations on a revision of the EC Definition of Nanomaterial based on
analytical possibilities after project half-time and at the end of the project.
NanoDefine project Final report
30
Potential impact, main dissemination activities and exploitation of results NanoDefine was entirely devoted to develop a measurement strategy that can support the
implementation of the EC recommendation on the definition of nanomaterial
(2011/696/EU) by potential end-users, such as material industries, regulatory authorities
of enforcement labs. This was mainly achieved by providing a set of representative test
samples and reference materials (WP1), by testing and evaluating the most relevant
particle size measurement methods (WP3), by establishing a variety of new and validated
SOPs for sample preparation and dispersion (WP2), for particle counting, imaging and
detection, including design of new measurement software (WP1-5), by developing a 2-
tiered measurement approach based on the developed and validated measurement
techniques, including rapid and cost-effective screening (WP4) and complementary and
confirmatory methods(WP5), by using a stringent method validation and standardization
process (WP6), and last not least by integrating all these methods into a decision support
flow scheme and method manual that is applicable as the NanoDefiner e-Tool to guide
potential end-users, such as material manufacturers or monitoring authorities, in the
identification of nanomaterials as substances or in products, or in finding out if a material
or product is or contains nano, or not (WP7).
NanoDefine has developed several exploitable results (i.e. foreground), as identified during
a special Exploitation Strategy Seminar in March 2016 (see Annex II in D8.5). These
include, among others, reference materials (some may be further developed to CRM),
method protocols, new and/or improved measurement instruments and software for
commercial use, e.g. by industry, testing laboratories or regulatory monitoring agencies.
Beside the development of a panel of well characterized reference tools, including reference
materials and validated methods (SOPs) that will assist industry and regulatory bodies to
classify particulate materials, NanoDefine also created an enormous wealth of new
scientific knowledge and technical know-how on the physicochemical behavior of
nanomaterials and associated products.
NanoDefine also produced a variety of commercially relevant foregrounds, such as new
measurement instruments and software, or new material prototypes specifically designed
to identify nanomaterials in complex real-world samples. In particular the development of
a new electrospray deposition prototype for EM analysis, a novel ParticleSizer based on
DMA with high resolution for particles < 5 nm, the improvement and further development
of analytical centrifugation and of a new hard and software for commercial PTA/NTA, the
creation of new interfaces between different particle counting and detection modules, such
as the coupling of FFF and ESI for aerosol detectors, or a new software to determine the
size- and number distribution of nanoparticles in a sample by spICP-MS, but in particular
the NanoDefiner e-Tool offering proper analytical routes to classify a particular material or
product, has to be emphasized.
In the following, a short summary is given on the potential impact, dissemination and
exploitation of achieved results for each work package.
Summary on impact and dissemination/exploitation activities for
each technical WP WP1 was mainly an enabling work package to guaranty and enable a broad impact of the
other WPs products. The main product (CRMs developed from 2 of the projects substances)
is due after the end of the project. JRC-IRMM is committed to develop and provide this
product after the project was finished.
NanoDefine project Final report
31
WP2 provided the necessary sample preparation protocols for WP4, 5 and 6 and in this
way contributed to the dissemination / exploitation activities in these WPs.
WP3: All results on the comprehensive method evaluation together with the raw analytical
data obtained have been published in the following two review open access papers:
1 F. Babick, J. Mielke, W. Wohlleben, S. Weigel, V.-D. Hodoroaba, How reliably can a
material be classified as a nanomaterial? Available particle-sizing techniques at work, J
Nanopart Res (2016) 18: 158, and
2 W. Wohlleben, J. Mielke, A. Bianchin, A. Ghanem, H. Freiberger, H. Rauscher, M.
Gemeinert, V.-D. Hodoroaba, Reliable nanomaterial classification of powders using the
volume-specific surface area method, J Nanopart Res (2017) 19: 61.
While (1) includes for the first time results on the quantitative evaluation of all available
sizing MTs as applied on the reference materials selected in WP1 but especially on the
representative and challenging real-world particulate NanoDefine materials, (2) is also
unique by demonstrating for the first time the reliability (together with applicability ranges)
of the VSSA approach as extracted from BET measurements for various shapes of
particulate materials. The latter was possible in the frame of inter-laboratory comparisons
by both BET and electron microscopy applied on the same materials. Despite the recent
publication (June 2016 and January 2017), both papers are very well cited, i.e. 19 times
the first paper and 4 times the 2nd one (acc. to Google Scholar).
In addition to the first overview paper (1), another detailed report dedicated to the errors
generated by conversion of measured quantity (i.e. intensity, volume or mass) into
number-based particle size distribution has been published by WP3:
3 F. Babick, C. Ullmann, Error propagation at the conversion of particle size distributions,
Powder Technology (2016) 301: 503.
A large number (23 x) of active participations in European and international workshops
and conferences dedicated to the analysis of particle size distribution in support of the EC
definition of nanomaterial has been organized by WP3 experts (see also Project
Dissemination Activities and Publications at the EC Participant Portal). The presentation of
the WP3 results as invited lecture at the Joint Workshop of ISO/TC 229 ‘Nanotechnologies’/
JWG 2 'Measurement and Characterization' & ISO/TC 24 / SC4 ‘Particle characterization’:
‘Frontiers of nanomaterial characterization’ on 28th of May 2017 in Tokyo, Japan can be
given as an example, in addition to the invited presentation of the WP3 evaluation study
within the Metrology Study Group of ISO/TC 229 ‘Nanotechnologies’/ JWG 2 'Measurement
and Characterization', on 29 May – 2 June 2017 in Tokyo, Japan. The necessity of transfer
of knowledge gained in NanoDefine related to the complex as well as limited application of
the sizing MTs for the specific implementation of the EU definition of nanomaterial was
recognized by the WP3 experts early during the project. The valuable knowledge was
disseminated diligently, but also debated intensively at the (NanoDefine) dedicated public
workshops (in 2014 and 2017) and technology transfer events (in 2016 and 2017), where
the relevant stakeholders were present, as well as at corresponding ‘nano’ conferences and
standardization meetings.
WP4 generated substantial improvements of existing measurement procedures and data
interpretation, which contributed to several standardization projects (see WP6) and
commercially available devices and software tools.
WP4 selected the methods and materials for the inter-laboratory validation studies (in
WP6) and developed the measurement specific SOPs. This resulted in the knowledge
database required for the e-Tool and in various input to European standardisation efforts
on Nanotechnology (e.g., TR project in CEN 352 and CEN open workshop, Malta 2017).
NanoDefine project Final report
32
Another impact created in WP4 was the science based order of comparison and validation
of number based distributions required before the intensity-based and mass-based
distributions validation, which will contribute, e.g., to risk assessment and risk modelling
(particle release, transport, exposure).
So far, there have been 2 peer-reviewed publications (1 submitted), 5 other publications
(conferences, workshops), 1 contribution to proceedings and more than 8 talks and
posters.
WP5: A key aspect of WP5 was the strong focus on industrial exploitation of the project
developments/results. As one outcome, the ParticleSizer manual was developed to
automatically measure the distributions of the characteristic size and shape properties of
a nanomaterial and shared online: https://imagej.net/ParticleSizer.
Also the Auto-EM toolbox was developed as an open-source program (MIT license) and has
been promoted at different events such as, the first and second NanoDefine industry-
focused Workshop in 2016 and 2017, Frankfurt, Germany and the Final NanoDefine
Outreach Event in Brussels, on 19-20 September 2017.
In terms of scientific training and education, 1 PhD thesis has resulted from WP5 and a
variety of oral and poster presentations at relevant conferences, of which some are
highlighted in the following:
PhD thesis, title: Methods in support of environmental risk assessment of ENMs by Fazel
Abdolahpur Monikh
Selected conferences:
253rd American Chemical Society NATIONAL MEETING & EXPOSITION: Advanced
Materials, Technologies, Systems & Processes, 2-6 April 2017, San Francisco, CA, United
States (oral presentation)
- TiO2 nanoparticles in sunscreen lotion: asymmetric flow field-flow fractionation
hyphenated to ICPMS for their characterization, Milica Velimirovic (Speaker)
18th International Symposium on Flow- and Field Based Separations (FFF2016), 22-26
May 2016, Dresden, Germany (oral presentation)
- Simultaneous on-line detection of SiO2, TiO2 and Al2O3 particles in toothpaste by
asymmetric flow field-flow fractionation hyphenated to triple-quadrupole inductively
coupled plasma mass spectrometry, Manuel Correia (Speaker)
RAFA 2015, 3-6 November 2015, Prague, Czech Republic (2 oral presentations)
- Application and future perspective of automated electron microscopy to quantify
engineered nanoparticles in complex matrices. Ralf Kaegi (Speaker)
- Simultaneous on-line detection of Si, Ti and Al-containing particles in toothpaste
by asymmetric flow field-flow fractionation coupled with ICP-QQQ-MS, Katrin
Loeschner (Speaker)
2nd International Fresenius Conference, 9-10 September 2015, Cologne, Germany (oral
presentation)
- An update on method development to analyse nanoparticles in complex samples,
Stephan Wagner (Speaker).
WP6: Dissemination activities included:
• Two public outreach events for a general audience and for industry
• Publication of the material classification system, decision support flow scheme and
the e-tool in peer reviewed journals
• Free access to the Manual and the e-tool
• Dissemination activities will continue after project end, e.g., by organizing training
events for authorities and industry as requested
NanoDefine project Final report
33
The CEN/TC352 committee accepted at its plenary meeting on 18 October 2017 in Prague,
the NanoDefiner Method Manual as a NWIP. For this, CEN/TC 352 asks DIN to accordingly
launch the NWIP for the TR. A first discussion with experts could follow at the first meeting
of CEN/TC 352 in 2018 on the 15th of March meeting in Brussels. With this, an important
deliverable of NanoDefine can have its impact in the standardisation work for
nanotechnology in Europe.
As the validated test methods developed by NanoDefine are public, they can be used by
laboratories from industries or regulatory bodies to analyse the nanomaterials in question,
which will generate another relevant impact of Nanodefine on the need to meet the
analytical challenges linked with the regulatory implementation of the EU definition.
Apart from this, these methods can also serve as a starting point for further method
development for similar or even very different materials. Some of the method development
work in NanoDefine dealt with very challenging, polydisperse material resulting in validated
methods. This can encourage other laboratories to address this challenging task as well.
The chosen approaches to standardise sample preparation or the approach how to validate
methods in this field can be seen as role models.
Also, the harmonised in-house validation approach used by NanoDefine and the
professional organisation of the inter-laboratory validation studies can encourage
laboratories or organisations to follow this approach, as it could be demonstrated that the
ambitious challenge to tackle complex, real-world nanomaterials can be successfully
mastered. Indeed, previous inter-comparisons have often lacked this harmonised approach
using common test samples of demonstrated homogeneity and stability and common,
detailed method protocols.
As the external validation activities were completed during the final phase of the project,
little dissemination apart from the public workshops could be achieved so far. However,
the strong response from a vast number of analytical laboratories to the international call
for the inter-laboratory validation exercises showed that there is considerable interest in
this kind of activities. During their preparation, the respective method protocols have been
distributed to more than 100 laboratories already. The results from the inter-laboratory
validation study will be also distributed to many laboratories. The approach and the results
of these studies will give sufficient material for future peer-reviewed publications.
As the project 9 of the VAMAS TWA34 launched by NanoDefine does not end with the
project, it is possible to continue the optimisation of methods. Depending on the in-depth
analysis of the inter-laboratory study results, laboratories could further optimise their
methods which could be tested in a second inter-laboratory exercise, which would be very
welcomed by VAMAS. However, such a follow-up would depend on the confirmation of the
willingness and commitment from involved parties to continue this work, even without
funding from NanoDefine.
WP7
Summarized, it can be stated:
That the implementation of the EC's Recommendation on a definition of nanomaterial
in a regulatory context will be considerably facilitated through the results described
above, in particular the decision flow scheme, the NanoDefine Manual and the
NanoDefiner e-tool.
That the EC's Guidance on the implementation of the NM Definition will substantially
benefit from the NanoDefine project results. It is expected that the uptake of these
results by regulators and relevant industries will facilitate and harmonize the regulatory
classification of nanomaterials.
NanoDefine project Final report
34
As the project provides the analytical tools to support implementation of the EC
definition it can be expected that the amendments of Regulations covering
nanomaterials will make progress, either by introducing the EC definition of
nanomaterials across existing policy areas (such as REACH) or by replacing historical
definitions of nanomaterial with the EC recommendation (e.g. within the Foods,
Cosmetics, Biocides regulation).
In total, all obtained project results (foreground) have been disseminated to all relevant
stakeholders (industry, regulatory, academia, EC, public) mainly by means of peer-
reviewed publications, conference or workshop presentations/proceedings, exhibition
stands, email shots, flyers, brochures, project-specific and NSC bulletins and newsletters
and in particular via the project-specific website. Internally, a specific partner intranet has
been installed at the website to allow the password protected uploading/downloading,
sharing and exchange of all produced documents including publications among partners,
such as deliverable or milestones reports, presentations and minutes from meetings or
legal documents, such as amendments of the grant agreement etc.
All partners contributed to the dissemination of the results they produced both by preparing
technical deliverable and milestone reports and by publishing in peer-reviewed scientific
journals or presenting their results at conferences or workshops. A list of main
dissemination activities and of peer-reviewed publications is preswentated at the EC
Participant Portal and attached to the Final Report. So far, NanoDefine partners have been
engaged in almost 140 different dissemination activities and produced 6 peer-reviewed
publications (more publications are still in progress after the end of the project).
In the final project year, NanoDefine has engaged the wider community through a range
of different dissemination activities and events, including those within the ENF2017
international conference and CEN Open Workshop in Malta June 2017, a special Summer
School organized at RIKILT in June 2017, a 2nd Public Workshop in combination with the
Final Outreach Event in Brussels, September 2017, and a 2nd Industry Focused Workshop
in Frankfurt October 2017, but also by initiating and participating in minor meetings or
workshops, such as the Nanosafety Workshop in Saarbrücken/Germany in October 2017.
In addition, a continuously updated project specific website with an integrated database of
new results and new knowledge produced, and with relevant news and events sections and
information streams made the wider community aware of the resources being developed
within the project. Relevant initiatives, organizations and individuals could register and
receive regular output, regular reports (targeted to different user and stakeholder groups,
including citizens, scientists, policy makers and industry).
Part of the results (new knowledge, methods and materials) generated during the project
have been also used to contribute to ongoing relevant standardization efforts, mainly
through DIN, BAM, JRC and TUD, e.g., under CEN/TC 352 “Nanotechnologies”, ISO/TC 229
“Nanotechnologies”, or ISO/TC 24/SC 4 “Particle characterization, but in particular to
provide input to the currently ongoing revision of the EC recommendation on the definition
of nanomaterial. A project liaison was agreed in the beginning between CEN/TC 352 and
NanoDefine.
Concerning exploitation of results, many instrument, test material and software prototypes
have been produced by instrument and material manufacturers, such as Malvern, RAMEM,
Superon, or BASF for further future commercialisation. Various types of reference and
calibration materials can be used in future projects as benchmark for material
characterization and classification as well as for biological testing, e.g. for risk and safety
assessments (see Table 4).
NanoDefine project Final report
35
Table 4: Overview of new results (foreground) with high potential for commercial
exploitation
Exploitable product Main
producer
Innovation and commercialization potential
NTA Validation Protocol Malvern Describes a set protocol for in-house and inter-
laboratory validation of NanoDefine samples.
Offers a method for generating values for
instrument validation. A technique for evaluating
PTA technology.
NTA Validation SOP for
sample preparation and
measurement
Malvern Describes a set protocol for sample preparation
(including powder dispersion) and measurement
setup for NanoDefine supplied samples. To be
used in conjunction with NTA Validation protocol.
A technique for evaluating PTA technology
HRMS for nanoparticle
characterization
RAMEM There is no commercial High-resolution DMA for
particles in the range of 1-5 nm. High Resolution,
detection of the smallest nanoparticles.
Electrospray deposition
for EM
RAMEM Sampling system to avoid aggregation and
agglomeration of NP for EM. No other sampling
system exists to avoid aggregation and
homogeneous distribution of NP
Coupling FFF and ESI for
aerosol detec-tors
RAMEM Increase in the number and type of detectors for
FFF. First development apart from FFF-ESI-ICP-MS
Concentration Calibration
of NTA in-struments
Malvern Current NTA instruments use fixed values across
all instruments and capture settings in
determining concentration measurements. This
innovation aims to calibrate individual system at a
range of capture and analysis settings thereby
removing concerns of low reproducibility and user
dependence. Additionally, accuracy of
measurements will be improved. Increases
accuracy and robustness of concentration
measurement producing a unique, high
throughput, number based concentration tool
spICP-MS data evaluation
software
RIKILT The Single Particle Calculation tool version 2
(SPCTv2) allows to generate spreadsheet-based
analysis data of spICP-MS measurements. Data
can be imported into the NanoDefiner e-Tool for
an automatic nano/non-nano/borderline decision
for a specific material.
http://www.wur.nl/nl/show/Single-Particle-
Calculation-tool.htm
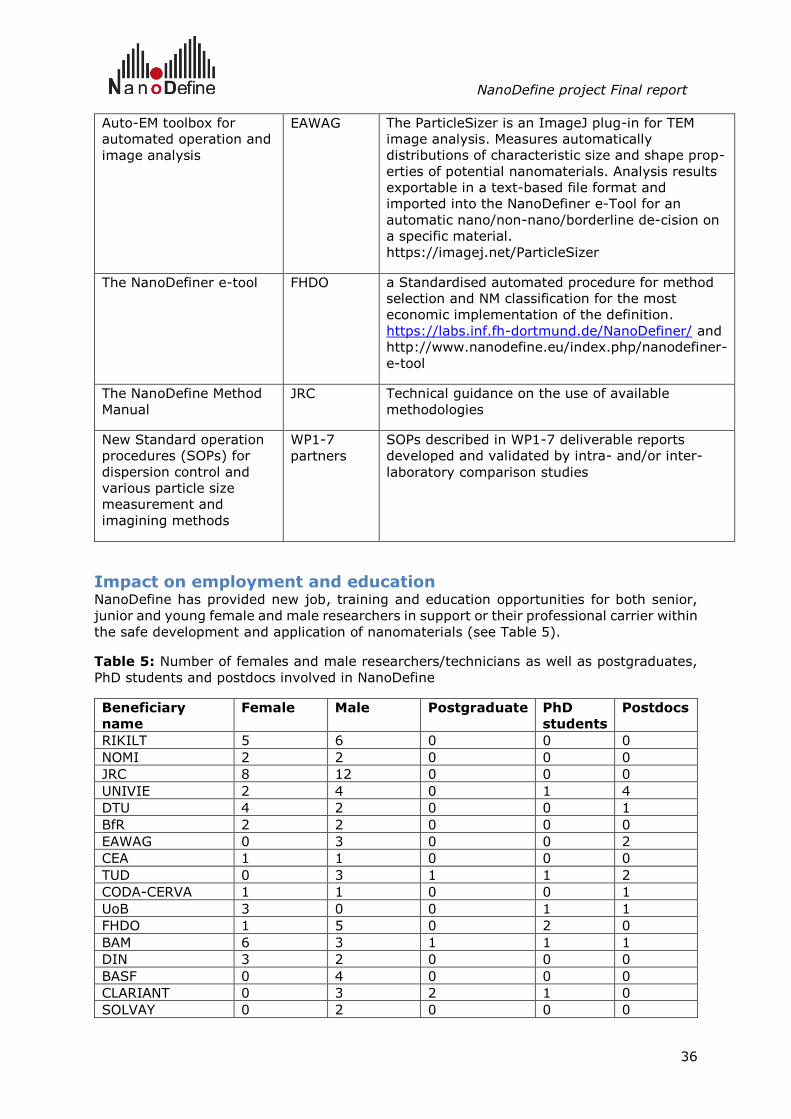
NanoDefine project Final report
36
Auto-EM toolbox for
automated operation and
image analysis
EAWAG The ParticleSizer is an ImageJ plug-in for TEM
image analysis. Measures automatically
distributions of characteristic size and shape prop-
erties of potential nanomaterials. Analysis results
exportable in a text-based file format and
imported into the NanoDefiner e-Tool for an
automatic nano/non-nano/borderline de-cision on
a specific material.
https://imagej.net/ParticleSizer
The NanoDefiner e-tool FHDO a Standardised automated procedure for method
selection and NM classification for the most
economic implementation of the definition.
https://labs.inf.fh-dortmund.de/NanoDefiner/ and
http://www.nanodefine.eu/index.php/nanodefiner-
e-tool
The NanoDefine Method
Manual
JRC Technical guidance on the use of available
methodologies
New Standard operation
procedures (SOPs) for
dispersion control and
various particle size
measurement and
imagining methods
WP1-7
partners
SOPs described in WP1-7 deliverable reports
developed and validated by intra- and/or inter-
laboratory comparison studies
Impact on employment and education NanoDefine has provided new job, training and education opportunities for both senior,
junior and young female and male researchers in support or their professional carrier within
the safe development and application of nanomaterials (see Table 5).
Table 5: Number of females and male researchers/technicians as well as postgraduates,
PhD students and postdocs involved in NanoDefine
Beneficiary
name
Female Male Postgraduate PhD
students
Postdocs
RIKILT 5 6 0 0 0
NOMI 2 2 0 0 0
JRC 8 12 0 0 0
UNIVIE 2 4 0 1 4
DTU 4 2 0 0 1
BfR 2 2 0 0 0
EAWAG 0 3 0 0 2
CEA 1 1 0 0 0
TUD 0 3 1 1 2
CODA-CERVA 1 1 0 0 1
UoB 3 0 0 1 1
FHDO 1 5 0 2 0
BAM 6 3 1 1 1
DIN 3 2 0 0 0
BASF 0 4 0 0 0
CLARIANT 0 3 2 1 0
SOLVAY 0 2 0 0 0
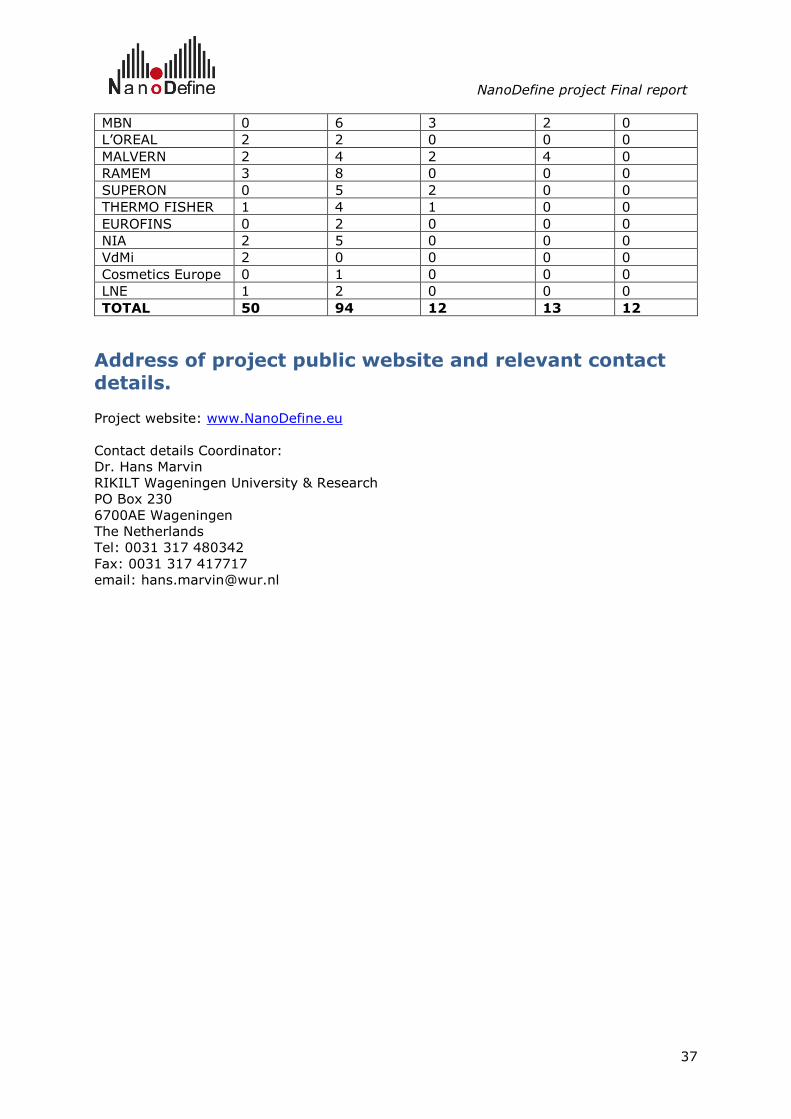
NanoDefine project Final report
37
MBN 0 6 3 2 0
L’OREAL 2 2 0 0 0
MALVERN 2 4 2 4 0
RAMEM 3 8 0 0 0
SUPERON 0 5 2 0 0
THERMO FISHER 1 4 1 0 0
EUROFINS 0 2 0 0 0
NIA 2 5 0 0 0
VdMi 2 0 0 0 0
Cosmetics Europe 0 1 0 0 0
LNE 1 2 0 0 0
TOTAL 50 94 12 13 12
Address of project public website and relevant contact details.
Project website: www.NanoDefine.eu
Contact details Coordinator:
Dr. Hans Marvin
RIKILT Wageningen University & Research
PO Box 230
6700AE Wageningen
The Netherlands
Tel: 0031 317 480342
Fax: 0031 317 417717
email: [email protected]