Embed Size (px)
Citation preview
Sediment grain size variation along a cross-shore profile –representative d50
Pedro Narra1 & Carlos Coelho2 & Jorge Fonseca1
Received: 28 November 2014 /Revised: 12 May 2015 /Accepted: 13 May 2015 /Published online: 24 May 2015# Springer Science+Business Media Dordrecht 2015
Abstract The coastal zones management not only relies on aprofound knowledge of the shoreline but also on a good as-sessment of morphodynamics, sediments transport and coastalinterventions required. Many coastal studies, such as beachslope estimates, equilibrium beach profile definition or sedi-ment transport analysis, depend on the sediment grain size atthe site. This paper aims to gain a better understanding of grainsize distribution along the cross-shore profile and variation ofd50, allowing to define a representative d50 to characterize thebeaches. On the study site chosen, Barra beach, Aveiro, anextensive field campaign was performed, from October 2010toMay 2011. In a weekly basis, samples from 5 points along across-shore profile were collected. During this period, datarelated to wave climate was collected from the PortugueseHydrographic Institute in temporal series of 10 min. Tidalprojections from Hydrographic Institute were also identifiedfor the period of the field campaigns. The sediment grain sizedistributions showed that, although the mass-median-diameterdoes not usually pass the 1 mm, d50 presented a great variationduring winter, in the intertidal zone. On the other side, the firstand last points of the cross-shore profile, located far from theintertidal zone, presented the smaller d50 and variation through
time. The significant wave height presented a mean value of2.16 m. The most energetic wave climates happened in No-vember, January and February. During those months, an in-crease of d50 in the wave breaking zone was noticed. Gener-ally, the expected behavior of the cross-shore sediment grainsize distribution is in line with the data collected in this paperand it was verified that the grain size is coarser on the intertidalzone and after storm periods. Also, despite the complexity ofdefining a characteristic d50 due to its great temporal and spa-tial variation, sensitivity analysis on the data obtained helpedthe identification of the upper foreshore limit, at high tide, asthe better location for a sediment sample collection represen-tative of a cross-shore profile.
Keywords Wave height . Sediment grain size . Emerged andimmerse samples . Cross-shore profile . Barra beach
Introduction
In human history, land areas located close to shorelines alwayshas been primarily chosen for occupation. As an example,according to the EUROSTAT, in 2011, around 40 % of thepopulation in the European Union lived in coastal zones (Col-let and Engelbert 2013). Due to the high economic and socialvalue of the littoral environment, urban areas grew around itand, consequently, the interest in these areas generated a con-siderable number of researchers dedicated to coastal dynamicstudies.
In Portugal, the high energetic wave climate of thewest coast and erosion problems on the majority of thecoastal areas lead to an increasing number of developedstudies that aimed to better understand the behavior ofthe Portuguese shoreline, namely on subjects as coastaldynamics, sediment transport and coastal erosion, which
* Pedro [email protected]
Carlos [email protected]
Jorge [email protected]
1 Department of Civil Engineering, University of Aveiro, Campus deSantiago, 3810-193 Aveiro, Portugal
2 Department of Civil Engineering and RISCO, University of Aveiro,Campus de Santiago, 3810-193 Aveiro, Portugal
J Coast Conserv (2015) 19:307–320DOI 10.1007/s11852-015-0392-x
are directly or indirectly dependent on the sediment grainsize (Andrade and Freitas 2001; Bettencourt 1997;Coelho 2005; Dias 2005; Lopes et al. 2001; Silva et al.2009; Trigo-Teixeira et al. 2000; Veloso-Gomes et al.2004).
However, the management of coastal zones not only de-pends on the knowledge about the shoreline and its behaviorsand trends, but also on a good assessment of coastal processesand interventions required, such as beach nourishments andcoastal structures. Thus, many coastal studies depend, amongother attributes, on the sediment grain size characteristics atthe site. For instance, some important aspects of coastalstudies are related with beach slope, equilibrium beachprofile proposed by Dean (1977) or numeric evaluation ofsediment transport volumes, all of them depending on thed50. Therefore, it is also important to understand the grain sizedistribution along a cross-shore profile, its variation in spaceand time, and the relationwith other coastal agents, such as thewave climate and tide regime.
Several researchers in the past aimed to understand grainsize variation in coastal zones (Celikoğlu et al. 2006; Guillénand Hoekstra 1997; Masselink 1992; McCave 1978; Terwindt1962; Visher 1969).
However, only a few number of studies considered thesimultaneous collection of samples at emerged and sub-merged locations of the same beach profile (Guillén andHoekstra 1997). Thus, this paper aims to contribute for abetter understanding of grain size distribution along across-shore beach profile, in order to improve the effi-ciency of future field campaigns in the collection of im-portant grain size parameters, such as a representatived50, essential for a correct approach in coastal studies.For that, a fieldwork was performed in Barra beach,Aveiro, Portugal. This is a sandy beach located southof Aveiro inlet and slightly protected from the intensewave climate, typical from the North Atlantic coast. Across-shore profile was monitored during 8 months (fromOctober 2010 to May 2011), taking samples every weekon 5 locations along the profile, 3 of them emerged and2 immersed, in a total of 33 field campaigns and 165samples. Also, during the same period, data of tidesand wave climate from the Portuguese Hydrographic In-stitute was gathered, in order to establish a relationshipwith the grain size on the studied profile. This paperstarts with a characterization of the study site where thefield campaigns were performed, followed by the de-scription of the methodologies used for sample collec-tion. Next, the results are presented and analyzed, firstas separate categories – sediment grain size and waveand tidal climate – and then combined, seeking for arelation between the two attributes. Finally, a discussionis presented including the impacts of different consider-ation on attributes as beach slope, Dean’s equilibrium
profile or sediment transport volume rate, also consider-ing the results of previous researchers in the field.
Methods
Study area
The study site, Barra beach, is located at the Northwest Por-tuguese coast, in Gafanha da Nazaré, Aveiro district (Fig. 1).The shoreline orientation at the beach is approximately N21°Eand it is essentially a sandy open coast with highly energeticwave climate, typically oriented from northwest. Regardingthe energetic exposure of the beach, Coelho et al. (2009b),using the Short (1999) morphodynamics classification, classi-fied Barra beach as mainly intermediate to reflective. Duringstorms, especially common during winter, the significantwave heights may reach 8 m and although its duration isusually inferior to 2 days, sometimes storms persist for up to5 days (Costa et al. 2001). The tide is semi-diurnal, with am-plitudes that can range between 2 m during neap tides, toalmost 4 m during spring tides.
In recent years, the coast at the study site is facingshoreline retreat problems, mainly due to sea level rise,land occupation and most significantly, river sedimentsupplies reduction (Coelho et al. 2009a). This reductionis a consequence from the diminished sediment loadsfrom Douro River, located about 50 km North of thestudy area, and is considered the main cause of coastalerosion problems along the Central Portuguese coast (Sil-va et al. 2007). In the past, sediments supplies fromDouro ranged between 1.5 and 2 million m3/year. Cur-rently, the value decreased to below 0.25 million m3/year(Bettencourt 1997). The difference is explained by in-river works and actions, such as dam construction, nav-igation dredging, sand extraction and shore protection, aswell as catchment land use and practice changes (Coelhoet al. 2009a). The decrease of sediments available in thecoastal system is intensified at Barra beach, located southof Aveiro inlet and harbor. The small amount of sedi-ments in the longitudinal drift is trapped by the northernbreakwater and is dredged to ensure the harbor operabil-ity. The sediments that can be found at the study siteshould have origin in the littoral drift, mainly feed bythe beach erosion occurring updrift and in a small por-tion, from the Aveiro lagoon.
Fieldwork
The data that contributed to this paper was collected be-tween October 2010 and May 2011, as part of Fonseca(2011) work. In Barra beach, 3 representative cross-shoreprofiles were chosen (Fig. 1). The protective effect of the
308 P. Narra et al.
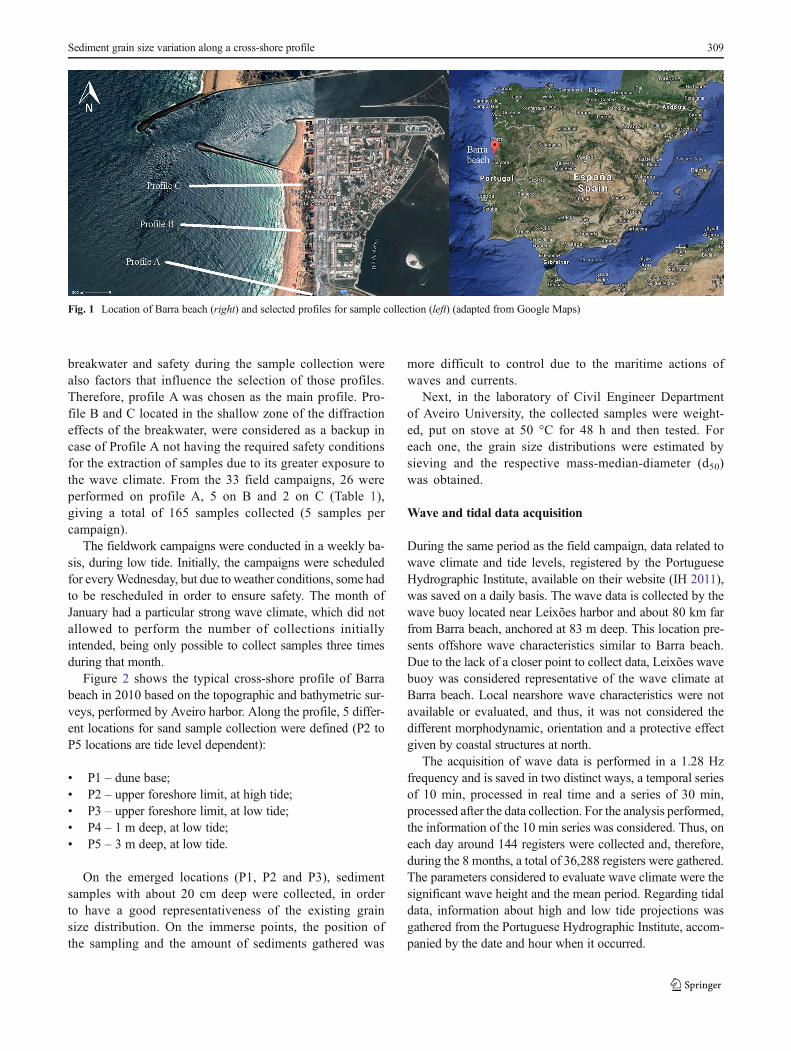
breakwater and safety during the sample collection werealso factors that influence the selection of those profiles.Therefore, profile A was chosen as the main profile. Pro-file B and C located in the shallow zone of the diffractioneffects of the breakwater, were considered as a backup incase of Profile A not having the required safety conditionsfor the extraction of samples due to its greater exposure tothe wave climate. From the 33 field campaigns, 26 wereperformed on profile A, 5 on B and 2 on C (Table 1),giving a total of 165 samples collected (5 samples percampaign).
The fieldwork campaigns were conducted in a weekly ba-sis, during low tide. Initially, the campaigns were scheduledfor everyWednesday, but due to weather conditions, some hadto be rescheduled in order to ensure safety. The month ofJanuary had a particular strong wave climate, which did notallowed to perform the number of collections initiallyintended, being only possible to collect samples three timesduring that month.
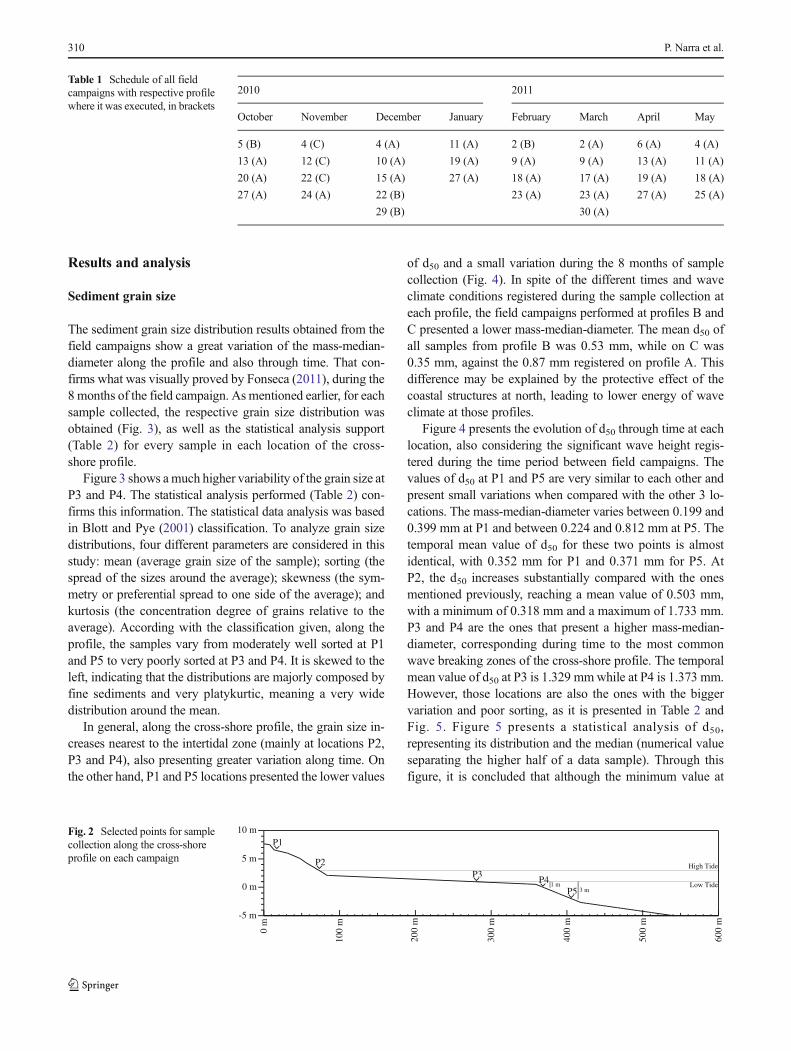
Figure 2 shows the typical cross-shore profile of Barrabeach in 2010 based on the topographic and bathymetric sur-veys, performed by Aveiro harbor. Along the profile, 5 differ-ent locations for sand sample collection were defined (P2 toP5 locations are tide level dependent):
& P1 – dune base;& P2 – upper foreshore limit, at high tide;& P3 – upper foreshore limit, at low tide;& P4 – 1 m deep, at low tide;& P5 – 3 m deep, at low tide.
On the emerged locations (P1, P2 and P3), sedimentsamples with about 20 cm deep were collected, in orderto have a good representativeness of the existing grainsize distribution. On the immerse points, the position ofthe sampling and the amount of sediments gathered was
more difficult to control due to the maritime actions ofwaves and currents.
Next, in the laboratory of Civil Engineer Departmentof Aveiro University, the collected samples were weight-ed, put on stove at 50 °C for 48 h and then tested. Foreach one, the grain size distributions were estimated bysieving and the respective mass-median-diameter (d50)was obtained.
Wave and tidal data acquisition
During the same period as the field campaign, data related towave climate and tide levels, registered by the PortugueseHydrographic Institute, available on their website (IH 2011),was saved on a daily basis. The wave data is collected by thewave buoy located near Leixões harbor and about 80 km farfrom Barra beach, anchored at 83 m deep. This location pre-sents offshore wave characteristics similar to Barra beach.Due to the lack of a closer point to collect data, Leixões wavebuoy was considered representative of the wave climate atBarra beach. Local nearshore wave characteristics were notavailable or evaluated, and thus, it was not considered thedifferent morphodynamic, orientation and a protective effectgiven by coastal structures at north.
The acquisition of wave data is performed in a 1.28 Hzfrequency and is saved in two distinct ways, a temporal seriesof 10 min, processed in real time and a series of 30 min,processed after the data collection. For the analysis performed,the information of the 10 min series was considered. Thus, oneach day around 144 registers were collected and, therefore,during the 8 months, a total of 36,288 registers were gathered.The parameters considered to evaluate wave climate were thesignificant wave height and the mean period. Regarding tidaldata, information about high and low tide projections wasgathered from the Portuguese Hydrographic Institute, accom-panied by the date and hour when it occurred.
Fig. 1 Location of Barra beach (right) and selected profiles for sample collection (left) (adapted from Google Maps)
Sediment grain size variation along a cross-shore profile 309
Results and analysis
Sediment grain size
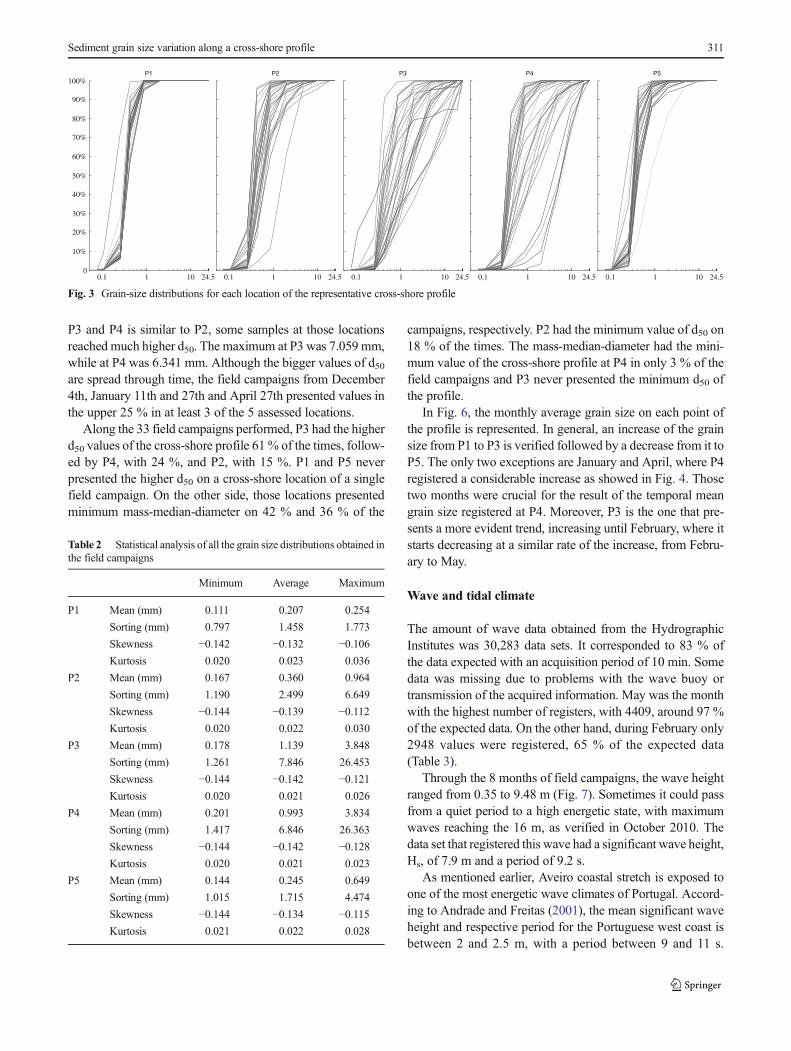
The sediment grain size distribution results obtained from thefield campaigns show a great variation of the mass-median-diameter along the profile and also through time. That con-firms what was visually proved by Fonseca (2011), during the8 months of the field campaign. Asmentioned earlier, for eachsample collected, the respective grain size distribution wasobtained (Fig. 3), as well as the statistical analysis support(Table 2) for every sample in each location of the cross-shore profile.
Figure 3 shows amuch higher variability of the grain size atP3 and P4. The statistical analysis performed (Table 2) con-firms this information. The statistical data analysis was basedin Blott and Pye (2001) classification. To analyze grain sizedistributions, four different parameters are considered in thisstudy: mean (average grain size of the sample); sorting (thespread of the sizes around the average); skewness (the sym-metry or preferential spread to one side of the average); andkurtosis (the concentration degree of grains relative to theaverage). According with the classification given, along theprofile, the samples vary from moderately well sorted at P1and P5 to very poorly sorted at P3 and P4. It is skewed to theleft, indicating that the distributions are majorly composed byfine sediments and very platykurtic, meaning a very widedistribution around the mean.
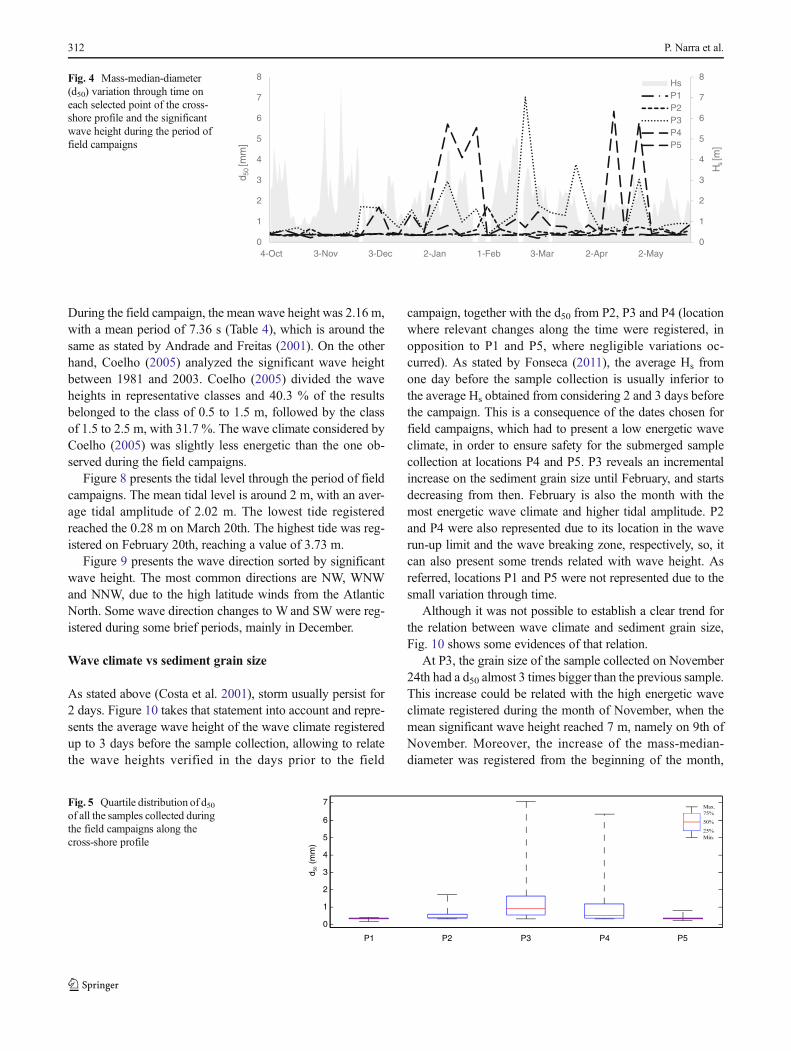
In general, along the cross-shore profile, the grain size in-creases nearest to the intertidal zone (mainly at locations P2,P3 and P4), also presenting greater variation along time. Onthe other hand, P1 and P5 locations presented the lower values
of d50 and a small variation during the 8 months of samplecollection (Fig. 4). In spite of the different times and waveclimate conditions registered during the sample collection ateach profile, the field campaigns performed at profiles B andC presented a lower mass-median-diameter. The mean d50 ofall samples from profile B was 0.53 mm, while on C was0.35 mm, against the 0.87 mm registered on profile A. Thisdifference may be explained by the protective effect of thecoastal structures at north, leading to lower energy of waveclimate at those profiles.
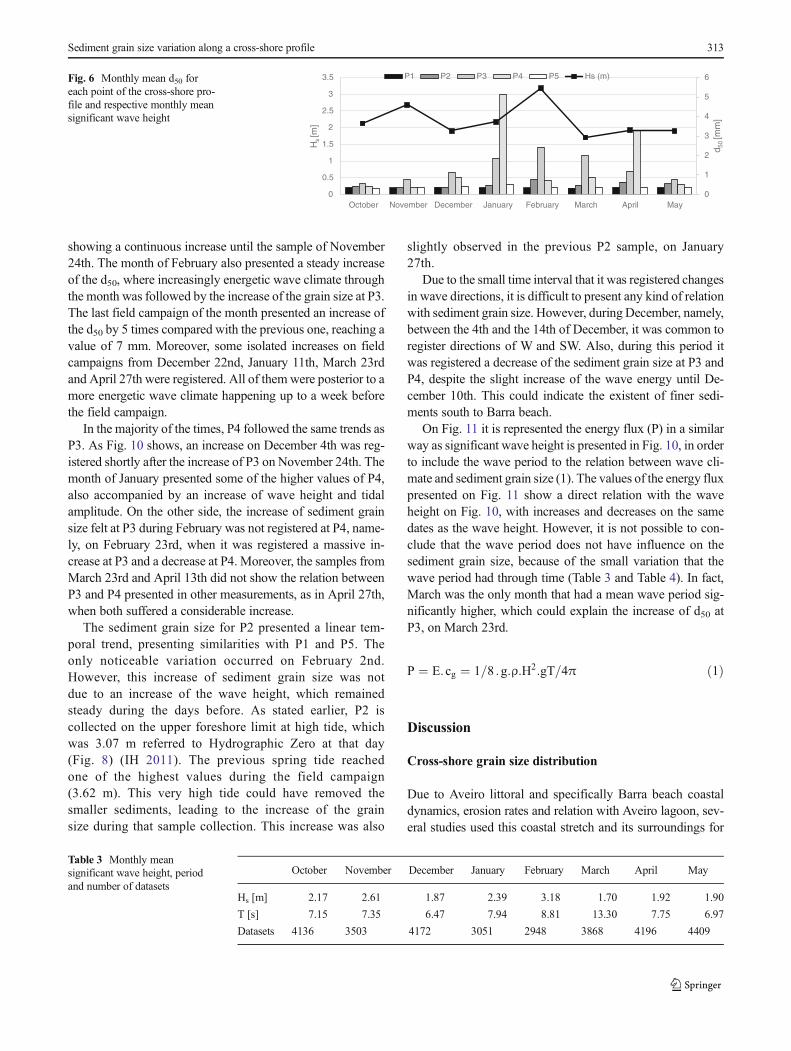
Figure 4 presents the evolution of d50 through time at eachlocation, also considering the significant wave height regis-tered during the time period between field campaigns. Thevalues of d50 at P1 and P5 are very similar to each other andpresent small variations when compared with the other 3 lo-cations. The mass-median-diameter varies between 0.199 and0.399 mm at P1 and between 0.224 and 0.812 mm at P5. Thetemporal mean value of d50 for these two points is almostidentical, with 0.352 mm for P1 and 0.371 mm for P5. AtP2, the d50 increases substantially compared with the onesmentioned previously, reaching a mean value of 0.503 mm,with a minimum of 0.318 mm and a maximum of 1.733 mm.P3 and P4 are the ones that present a higher mass-median-diameter, corresponding during time to the most commonwave breaking zones of the cross-shore profile. The temporalmean value of d50 at P3 is 1.329 mmwhile at P4 is 1.373 mm.However, those locations are also the ones with the biggervariation and poor sorting, as it is presented in Table 2 andFig. 5. Figure 5 presents a statistical analysis of d50,representing its distribution and the median (numerical valueseparating the higher half of a data sample). Through thisfigure, it is concluded that although the minimum value at
Table 1 Schedule of all fieldcampaigns with respective profilewhere it was executed, in brackets
2010 2011
October November December January February March April May
5 (B) 4 (C) 4 (A) 11 (A) 2 (B) 2 (A) 6 (A) 4 (A)
13 (A) 12 (C) 10 (A) 19 (A) 9 (A) 9 (A) 13 (A) 11 (A)
20 (A) 22 (C) 15 (A) 27 (A) 18 (A) 17 (A) 19 (A) 18 (A)
27 (A) 24 (A) 22 (B) 23 (A) 23 (A) 27 (A) 25 (A)
29 (B) 30 (A)
0 m
100
m
200
m
300
m
400
m
500
m
600
m
0 m
-5 m
5 m
10 mP1
P2P3
P5
High Tide
Low Tide1 m3 m
P4
Fig. 2 Selected points for samplecollection along the cross-shoreprofile on each campaign
310 P. Narra et al.
P3 and P4 is similar to P2, some samples at those locationsreached much higher d50. The maximum at P3 was 7.059 mm,while at P4 was 6.341 mm. Although the bigger values of d50are spread through time, the field campaigns from December4th, January 11th and 27th and April 27th presented values inthe upper 25 % in at least 3 of the 5 assessed locations.
Along the 33 field campaigns performed, P3 had the higherd50 values of the cross-shore profile 61% of the times, follow-ed by P4, with 24 %, and P2, with 15 %. P1 and P5 neverpresented the higher d50 on a cross-shore location of a singlefield campaign. On the other side, those locations presentedminimum mass-median-diameter on 42 % and 36 % of the
campaigns, respectively. P2 had the minimum value of d50 on18 % of the times. The mass-median-diameter had the mini-mum value of the cross-shore profile at P4 in only 3 % of thefield campaigns and P3 never presented the minimum d50 ofthe profile.
In Fig. 6, the monthly average grain size on each point ofthe profile is represented. In general, an increase of the grainsize from P1 to P3 is verified followed by a decrease from it toP5. The only two exceptions are January and April, where P4registered a considerable increase as showed in Fig. 4. Thosetwo months were crucial for the result of the temporal meangrain size registered at P4. Moreover, P3 is the one that pre-sents a more evident trend, increasing until February, where itstarts decreasing at a similar rate of the increase, from Febru-ary to May.
Wave and tidal climate
The amount of wave data obtained from the HydrographicInstitutes was 30,283 data sets. It corresponded to 83 % ofthe data expected with an acquisition period of 10 min. Somedata was missing due to problems with the wave buoy ortransmission of the acquired information. May was the monthwith the highest number of registers, with 4409, around 97 %of the expected data. On the other hand, during February only2948 values were registered, 65 % of the expected data(Table 3).
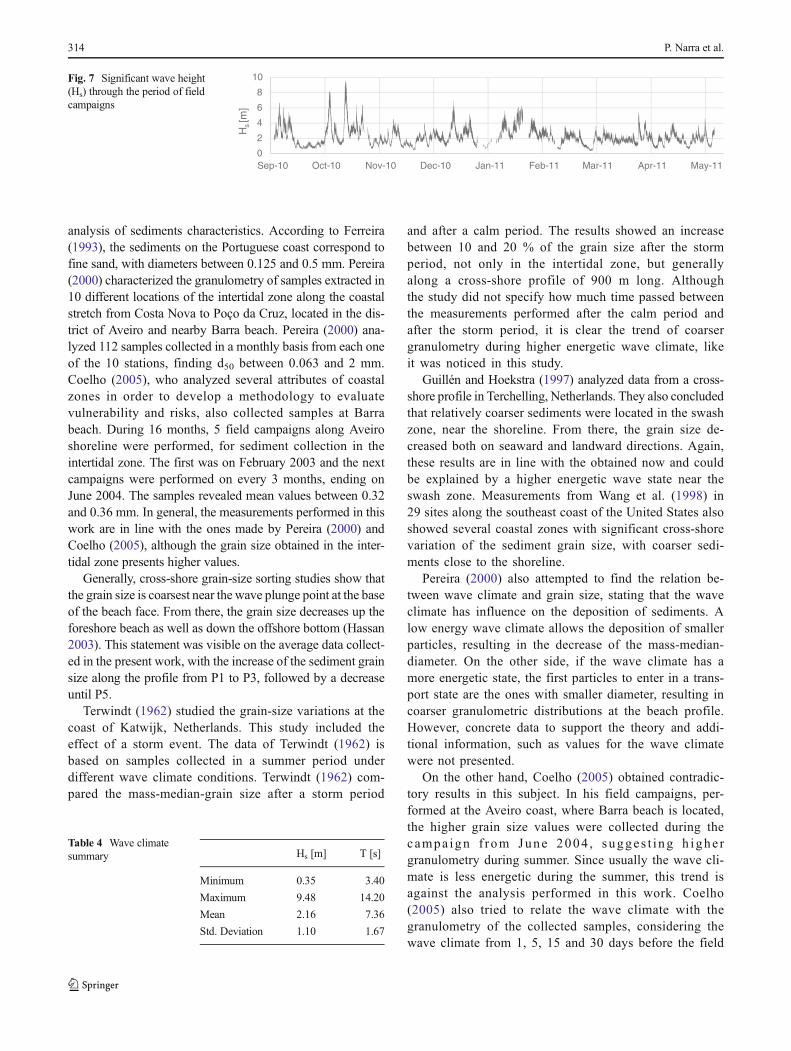
Through the 8 months of field campaigns, the wave heightranged from 0.35 to 9.48 m (Fig. 7). Sometimes it could passfrom a quiet period to a high energetic state, with maximumwaves reaching the 16 m, as verified in October 2010. Thedata set that registered this wave had a significant wave height,Hs, of 7.9 m and a period of 9.2 s.
As mentioned earlier, Aveiro coastal stretch is exposed toone of the most energetic wave climates of Portugal. Accord-ing to Andrade and Freitas (2001), the mean significant waveheight and respective period for the Portuguese west coast isbetween 2 and 2.5 m, with a period between 9 and 11 s.
0.1 1 10 24.50
10%
20%
30%
40%
50%
60%
70%
80%
90%
100%P1
0.1 1 10 24.5
P2
0.1 1 10 24.5
P3
0,1 1 10 24.5
P4
0.1 1 10 24.5
P5
Fig. 3 Grain-size distributions for each location of the representative cross-shore profile
Table 2 Statistical analysis of all the grain size distributions obtained inthe field campaigns
Minimum Average Maximum
P1 Mean (mm) 0.111 0.207 0.254
Sorting (mm) 0.797 1.458 1.773
Skewness −0.142 −0.132 −0.106Kurtosis 0.020 0.023 0.036
P2 Mean (mm) 0.167 0.360 0.964
Sorting (mm) 1.190 2.499 6.649
Skewness −0.144 −0.139 −0.112Kurtosis 0.020 0.022 0.030
P3 Mean (mm) 0.178 1.139 3.848
Sorting (mm) 1.261 7.846 26.453
Skewness −0.144 −0.142 −0.121Kurtosis 0.020 0.021 0.026
P4 Mean (mm) 0.201 0.993 3.834
Sorting (mm) 1.417 6.846 26.363
Skewness −0.144 −0.142 −0.128Kurtosis 0.020 0.021 0.023
P5 Mean (mm) 0.144 0.245 0.649
Sorting (mm) 1.015 1.715 4.474
Skewness −0.144 −0.134 −0.115Kurtosis 0.021 0.022 0.028
Sediment grain size variation along a cross-shore profile 311
During the field campaign, the mean wave height was 2.16 m,with a mean period of 7.36 s (Table 4), which is around thesame as stated by Andrade and Freitas (2001). On the otherhand, Coelho (2005) analyzed the significant wave heightbetween 1981 and 2003. Coelho (2005) divided the waveheights in representative classes and 40.3 % of the resultsbelonged to the class of 0.5 to 1.5 m, followed by the classof 1.5 to 2.5 m, with 31.7 %. The wave climate considered byCoelho (2005) was slightly less energetic than the one ob-served during the field campaigns.
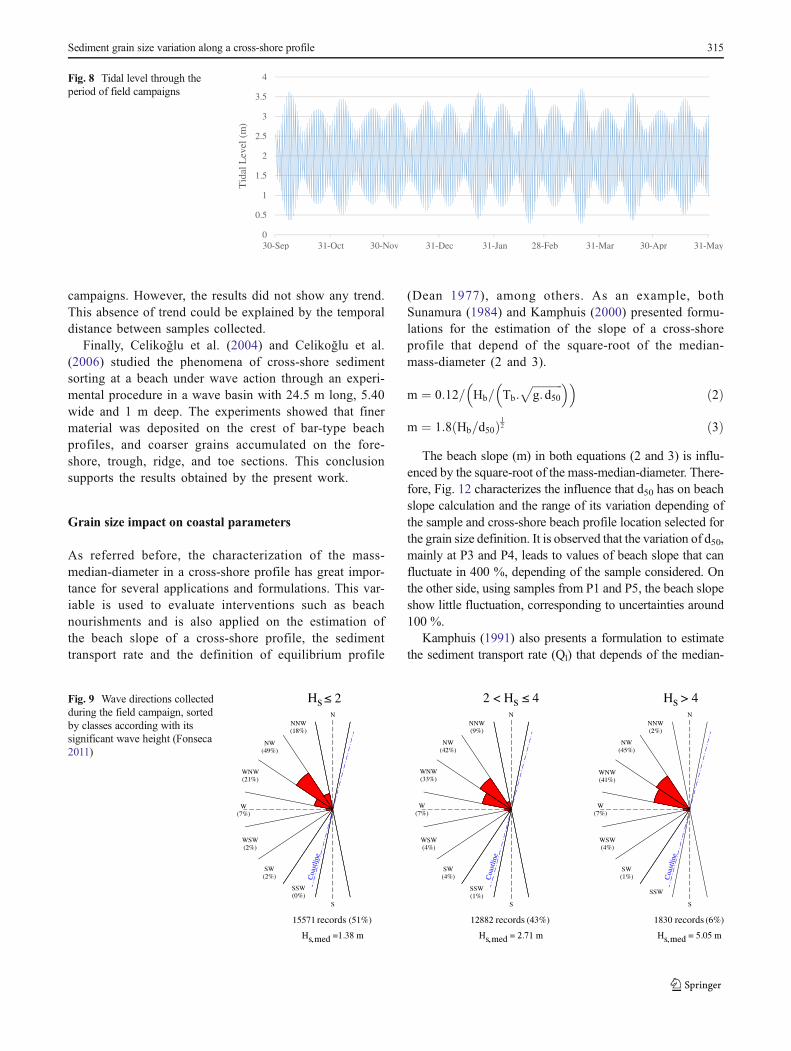
Figure 8 presents the tidal level through the period of fieldcampaigns. The mean tidal level is around 2 m, with an aver-age tidal amplitude of 2.02 m. The lowest tide registeredreached the 0.28 m on March 20th. The highest tide was reg-istered on February 20th, reaching a value of 3.73 m.
Figure 9 presents the wave direction sorted by significantwave height. The most common directions are NW, WNWand NNW, due to the high latitude winds from the AtlanticNorth. Some wave direction changes to W and SW were reg-istered during some brief periods, mainly in December.
Wave climate vs sediment grain size
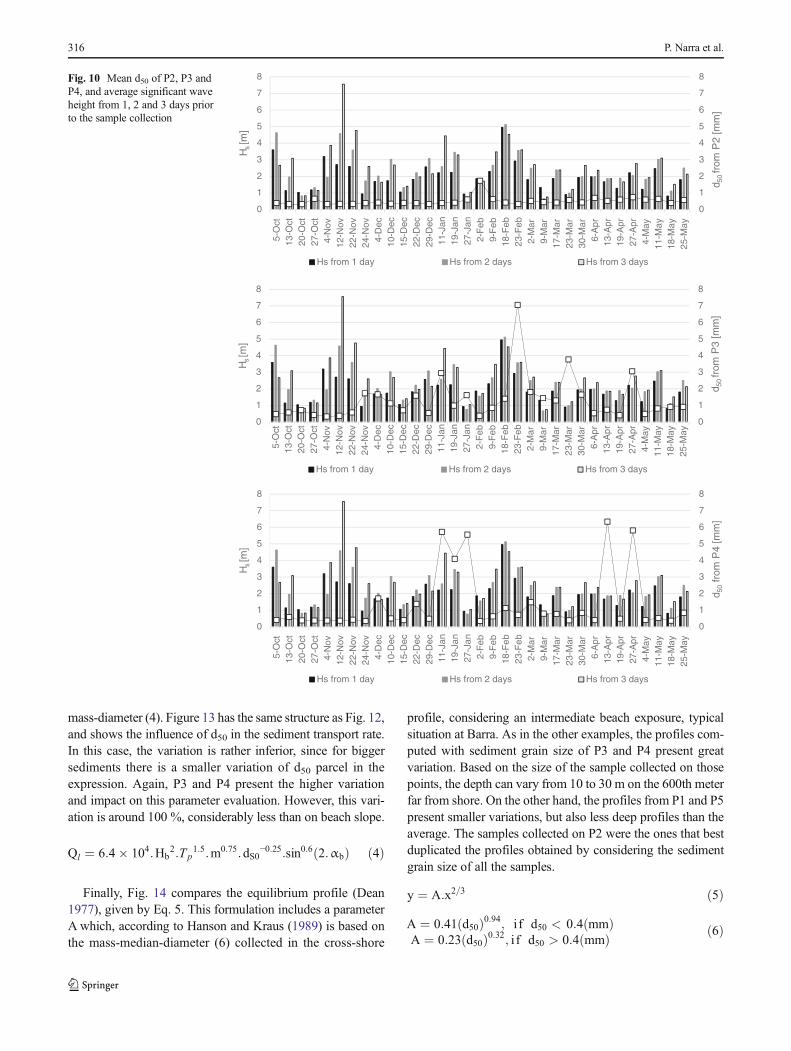
As stated above (Costa et al. 2001), storm usually persist for2 days. Figure 10 takes that statement into account and repre-sents the average wave height of the wave climate registeredup to 3 days before the sample collection, allowing to relatethe wave heights verified in the days prior to the field
campaign, together with the d50 from P2, P3 and P4 (locationwhere relevant changes along the time were registered, inopposition to P1 and P5, where negligible variations oc-curred). As stated by Fonseca (2011), the average Hs fromone day before the sample collection is usually inferior tothe average Hs obtained from considering 2 and 3 days beforethe campaign. This is a consequence of the dates chosen forfield campaigns, which had to present a low energetic waveclimate, in order to ensure safety for the submerged samplecollection at locations P4 and P5. P3 reveals an incrementalincrease on the sediment grain size until February, and startsdecreasing from then. February is also the month with themost energetic wave climate and higher tidal amplitude. P2and P4 were also represented due to its location in the waverun-up limit and the wave breaking zone, respectively, so, itcan also present some trends related with wave height. Asreferred, locations P1 and P5 were not represented due to thesmall variation through time.
Although it was not possible to establish a clear trend forthe relation between wave climate and sediment grain size,Fig. 10 shows some evidences of that relation.
At P3, the grain size of the sample collected on November24th had a d50 almost 3 times bigger than the previous sample.This increase could be related with the high energetic waveclimate registered during the month of November, when themean significant wave height reached 7 m, namely on 9th ofNovember. Moreover, the increase of the mass-median-diameter was registered from the beginning of the month,
0
1
2
3
4
5
6
7
8
0
1
2
3
4
5
6
7
8
4-Oct 3-Nov 3-Dec 2-Jan 1-Feb 3-Mar 2-Apr 2-May
Hs[m
]
d 50[m
m]
HsP1P2P3P4P5
Fig. 4 Mass-median-diameter(d50) variation through time oneach selected point of the cross-shore profile and the significantwave height during the period offield campaigns
0
1
2
3
4
5
6
7
P1 P2 P3 P4 P5
d 50 (
mm
)
Fig. 5 Quartile distribution of d50of all the samples collected duringthe field campaigns along thecross-shore profile
312 P. Narra et al.
showing a continuous increase until the sample of November24th. The month of February also presented a steady increaseof the d50, where increasingly energetic wave climate throughthe month was followed by the increase of the grain size at P3.The last field campaign of the month presented an increase ofthe d50 by 5 times compared with the previous one, reaching avalue of 7 mm. Moreover, some isolated increases on fieldcampaigns from December 22nd, January 11th, March 23rdand April 27th were registered. All of them were posterior to amore energetic wave climate happening up to a week beforethe field campaign.
In the majority of the times, P4 followed the same trends asP3. As Fig. 10 shows, an increase on December 4th was reg-istered shortly after the increase of P3 on November 24th. Themonth of January presented some of the higher values of P4,also accompanied by an increase of wave height and tidalamplitude. On the other side, the increase of sediment grainsize felt at P3 during February was not registered at P4, name-ly, on February 23rd, when it was registered a massive in-crease at P3 and a decrease at P4. Moreover, the samples fromMarch 23rd and April 13th did not show the relation betweenP3 and P4 presented in other measurements, as in April 27th,when both suffered a considerable increase.
The sediment grain size for P2 presented a linear tem-poral trend, presenting similarities with P1 and P5. Theonly noticeable variation occurred on February 2nd.However, this increase of sediment grain size was notdue to an increase of the wave height, which remainedsteady during the days before. As stated earlier, P2 iscollected on the upper foreshore limit at high tide, whichwas 3.07 m referred to Hydrographic Zero at that day(Fig. 8) (IH 2011). The previous spring tide reachedone of the highest values during the field campaign(3.62 m). This very high tide could have removed thesmaller sediments, leading to the increase of the grainsize during that sample collection. This increase was also
slightly observed in the previous P2 sample, on January27th.
Due to the small time interval that it was registered changesin wave directions, it is difficult to present any kind of relationwith sediment grain size. However, during December, namely,between the 4th and the 14th of December, it was common toregister directions of W and SW. Also, during this period itwas registered a decrease of the sediment grain size at P3 andP4, despite the slight increase of the wave energy until De-cember 10th. This could indicate the existent of finer sedi-ments south to Barra beach.
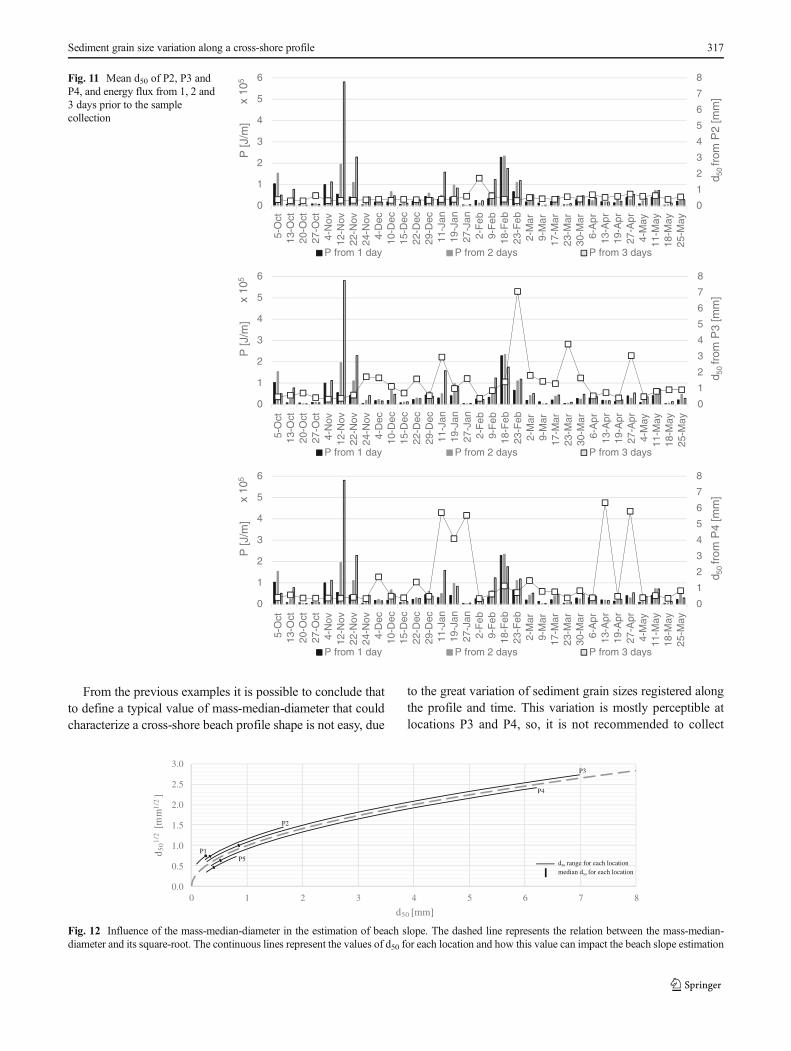
On Fig. 11 it is represented the energy flux (P) in a similarway as significant wave height is presented in Fig. 10, in orderto include the wave period to the relation between wave cli-mate and sediment grain size (1). The values of the energy fluxpresented on Fig. 11 show a direct relation with the waveheight on Fig. 10, with increases and decreases on the samedates as the wave height. However, it is not possible to con-clude that the wave period does not have influence on thesediment grain size, because of the small variation that thewave period had through time (Table 3 and Table 4). In fact,March was the only month that had a mean wave period sig-nificantly higher, which could explain the increase of d50 atP3, on March 23rd.
P ¼ E:cg ¼ 1=8 :g:ρ:H2:gT=4π ð1Þ
Discussion
Cross-shore grain size distribution
Due to Aveiro littoral and specifically Barra beach coastaldynamics, erosion rates and relation with Aveiro lagoon, sev-eral studies used this coastal stretch and its surroundings for
0
1
2
3
4
5
6
0
0.5
1
1.5
2
2.5
3
3.5
October November December January February March April May
d 50[m
m]
Hs[m
]
P1 P2 P3 P4 P5 Hs (m)Fig. 6 Monthly mean d50 foreach point of the cross-shore pro-file and respective monthly meansignificant wave height
Table 3 Monthly meansignificant wave height, periodand number of datasets
October November December January February March April May
Hs [m] 2.17 2.61 1.87 2.39 3.18 1.70 1.92 1.90
T [s] 7.15 7.35 6.47 7.94 8.81 13.30 7.75 6.97
Datasets 4136 3503 4172 3051 2948 3868 4196 4409
Sediment grain size variation along a cross-shore profile 313
analysis of sediments characteristics. According to Ferreira(1993), the sediments on the Portuguese coast correspond tofine sand, with diameters between 0.125 and 0.5 mm. Pereira(2000) characterized the granulometry of samples extracted in10 different locations of the intertidal zone along the coastalstretch from Costa Nova to Poço da Cruz, located in the dis-trict of Aveiro and nearby Barra beach. Pereira (2000) ana-lyzed 112 samples collected in a monthly basis from each oneof the 10 stations, finding d50 between 0.063 and 2 mm.Coelho (2005), who analyzed several attributes of coastalzones in order to develop a methodology to evaluatevulnerability and risks, also collected samples at Barrabeach. During 16 months, 5 field campaigns along Aveiroshoreline were performed, for sediment collection in theintertidal zone. The first was on February 2003 and the nextcampaigns were performed on every 3 months, ending onJune 2004. The samples revealed mean values between 0.32and 0.36 mm. In general, the measurements performed in thiswork are in line with the ones made by Pereira (2000) andCoelho (2005), although the grain size obtained in the inter-tidal zone presents higher values.
Generally, cross-shore grain-size sorting studies show thatthe grain size is coarsest near the wave plunge point at the baseof the beach face. From there, the grain size decreases up theforeshore beach as well as down the offshore bottom (Hassan2003). This statement was visible on the average data collect-ed in the present work, with the increase of the sediment grainsize along the profile from P1 to P3, followed by a decreaseuntil P5.
Terwindt (1962) studied the grain-size variations at thecoast of Katwijk, Netherlands. This study included theeffect of a storm event. The data of Terwindt (1962) isbased on samples collected in a summer period underdifferent wave climate conditions. Terwindt (1962) com-pared the mass-median-grain size after a storm period
and after a calm period. The results showed an increasebetween 10 and 20 % of the grain size after the stormperiod, not only in the intertidal zone, but generallyalong a cross-shore profile of 900 m long. Althoughthe study did not specify how much time passed betweenthe measurements performed after the calm period andafter the storm period, it is clear the trend of coarsergranulometry during higher energetic wave climate, likeit was noticed in this study.
Guillén and Hoekstra (1997) analyzed data from a cross-shore profile in Terchelling, Netherlands. They also concludedthat relatively coarser sediments were located in the swashzone, near the shoreline. From there, the grain size de-creased both on seaward and landward directions. Again,these results are in line with the obtained now and couldbe explained by a higher energetic wave state near theswash zone. Measurements from Wang et al. (1998) in29 sites along the southeast coast of the United States alsoshowed several coastal zones with significant cross-shorevariation of the sediment grain size, with coarser sedi-ments close to the shoreline.
Pereira (2000) also attempted to find the relation be-tween wave climate and grain size, stating that the waveclimate has influence on the deposition of sediments. Alow energy wave climate allows the deposition of smallerparticles, resulting in the decrease of the mass-median-diameter. On the other side, if the wave climate has amore energetic state, the first particles to enter in a trans-port state are the ones with smaller diameter, resulting incoarser granulometric distributions at the beach profile.However, concrete data to support the theory and addi-tional information, such as values for the wave climatewere not presented.
On the other hand, Coelho (2005) obtained contradic-tory results in this subject. In his field campaigns, per-formed at the Aveiro coast, where Barra beach is located,the higher grain size values were collected during thecampa ign f rom June 2004 , sugges t i ng h ighe rgranulometry during summer. Since usually the wave cli-mate is less energetic during the summer, this trend isagainst the analysis performed in this work. Coelho(2005) also tried to relate the wave climate with thegranulometry of the collected samples, considering thewave climate from 1, 5, 15 and 30 days before the field
0
2
4
6
8
10
Sep-10 Oct-10 Nov-10 Dec-10 Jan-11 Feb-11 Mar-11 Apr-11 May-11
Hs[m
]
Fig. 7 Significant wave height(Hs) through the period of fieldcampaigns
Table 4 Wave climatesummary Hs [m] T [s]
Minimum 0.35 3.40
Maximum 9.48 14.20
Mean 2.16 7.36
Std. Deviation 1.10 1.67
314 P. Narra et al.
campaigns. However, the results did not show any trend.This absence of trend could be explained by the temporaldistance between samples collected.
Finally, Celikoğlu et al. (2004) and Celikoğlu et al.(2006) studied the phenomena of cross-shore sedimentsorting at a beach under wave action through an experi-mental procedure in a wave basin with 24.5 m long, 5.40wide and 1 m deep. The experiments showed that finermaterial was deposited on the crest of bar-type beachprofiles, and coarser grains accumulated on the fore-shore, trough, ridge, and toe sections. This conclusionsupports the results obtained by the present work.
Grain size impact on coastal parameters
As referred before, the characterization of the mass-median-diameter in a cross-shore profile has great impor-tance for several applications and formulations. This var-iable is used to evaluate interventions such as beachnourishments and is also applied on the estimation ofthe beach slope of a cross-shore profile, the sedimenttransport rate and the definition of equilibrium profile
(Dean 1977), among others. As an example, bothSunamura (1984) and Kamphuis (2000) presented formu-lations for the estimation of the slope of a cross-shoreprofile that depend of the square-root of the median-mass-diameter (2 and 3).
m ¼ 0:12= Hb= Tb:ffiffiffiffiffiffiffiffiffiffiffi
g:d50p
� �� �
ð2Þ
m ¼ 1:8 Hb=d50ð Þ12 ð3Þ
The beach slope (m) in both equations (2 and 3) is influ-enced by the square-root of the mass-median-diameter. There-fore, Fig. 12 characterizes the influence that d50 has on beachslope calculation and the range of its variation depending ofthe sample and cross-shore beach profile location selected forthe grain size definition. It is observed that the variation of d50,mainly at P3 and P4, leads to values of beach slope that canfluctuate in 400 %, depending of the sample considered. Onthe other side, using samples from P1 and P5, the beach slopeshow little fluctuation, corresponding to uncertainties around100 %.
Kamphuis (1991) also presents a formulation to estimatethe sediment transport rate (Ql) that depends of the median-
0
0.5
1
1.5
2
2.5
3
3.5
4
30-Sep 31-Oct 30-Nov 31-Dec 31-Jan 28-Feb 31-Mar 30-Apr 31-MayT
idal
Lev
el (
m)
Fig. 8 Tidal level through theperiod of field campaigns
Coa
stlin
e
Coa
stlin
e
Coa
stlin
e
records records records
Fig. 9 Wave directions collectedduring the field campaign, sortedby classes according with itssignificant wave height (Fonseca2011)
Sediment grain size variation along a cross-shore profile 315
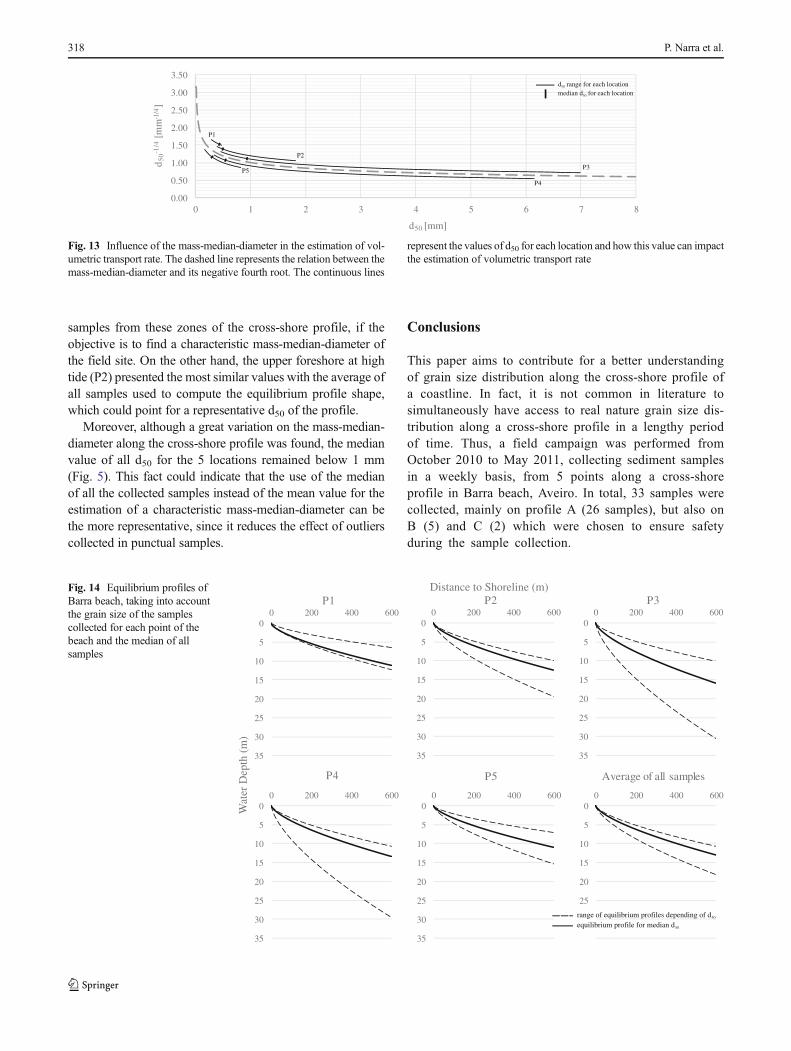
mass-diameter (4). Figure 13 has the same structure as Fig. 12,and shows the influence of d50 in the sediment transport rate.In this case, the variation is rather inferior, since for biggersediments there is a smaller variation of d50 parcel in theexpression. Again, P3 and P4 present the higher variationand impact on this parameter evaluation. However, this vari-ation is around 100 %, considerably less than on beach slope.
Ql ¼ 6:4� 104:Hb2:Tp
1:5:m0:75:dS0−0:25:sin0:6 2:αbÞð ð4Þ
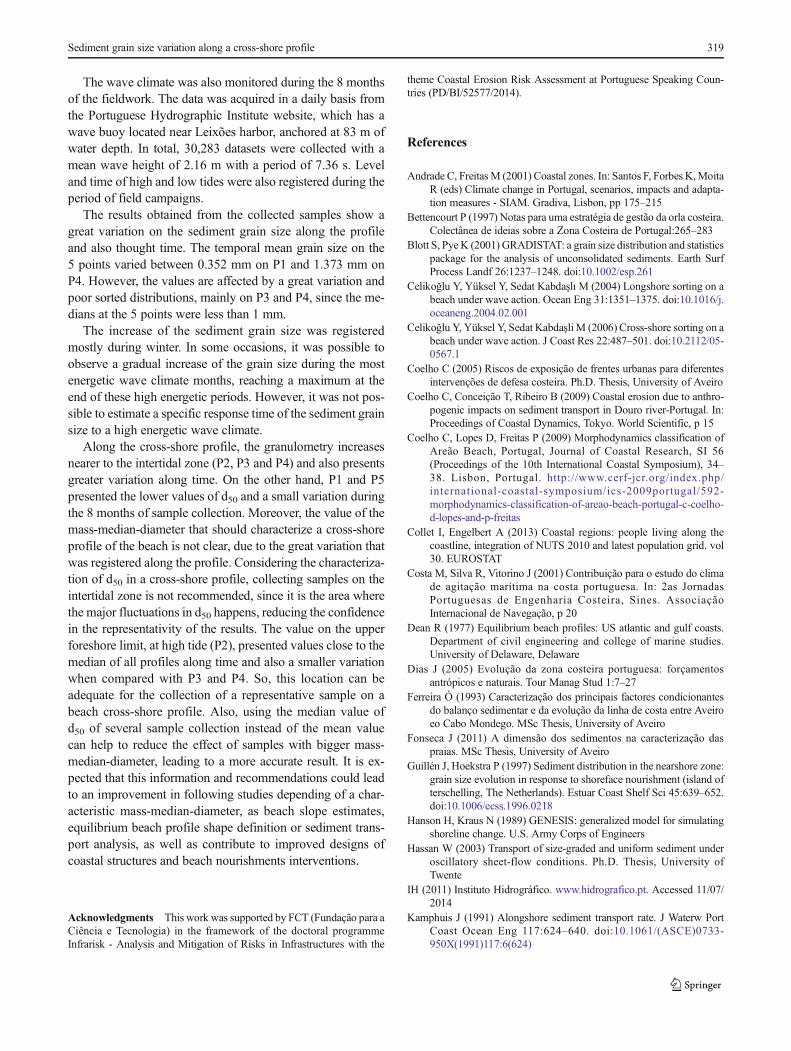
Finally, Fig. 14 compares the equilibrium profile (Dean1977), given by Eq. 5. This formulation includes a parameterA which, according to Hanson and Kraus (1989) is based onthe mass-median-diameter (6) collected in the cross-shore
profile, considering an intermediate beach exposure, typicalsituation at Barra. As in the other examples, the profiles com-puted with sediment grain size of P3 and P4 present greatvariation. Based on the size of the sample collected on thosepoints, the depth can vary from 10 to 30 m on the 600th meterfar from shore. On the other hand, the profiles from P1 and P5present smaller variations, but also less deep profiles than theaverage. The samples collected on P2 were the ones that bestduplicated the profiles obtained by considering the sedimentgrain size of all the samples.
y ¼ A:x2=3 ð5Þ
A ¼ 0:41 d50ð Þ0:94; i f d50 < 0:4 mmð ÞA ¼ 0:23 d50ð Þ0:32; i f d50 > 0:4 mmð Þ ð6Þ
0
1
2
3
4
5
6
7
8
0
1
2
3
4
5
6
7
8
5-O
ct13
-Oct
20-O
ct27
-Oct
4-N
ov12
-Nov
22-N
ov24
-Nov
4-D
ec10
-Dec
15-D
ec22
-Dec
29-D
ec11
-Jan
19-J
an27
-Jan
2-F
eb9-
Feb
18-F
eb23
-Feb
2-M
ar9-
Mar
17-M
ar23
-Mar
30-M
ar6-
Apr
13-A
pr19
-Apr
27-A
pr4-
May
11-M
ay18
-May
25-M
ay
d 50fr
om P
2 [m
m]
Hs[m
]
Hs from 1 day Hs from 2 days Hs from 3 days
0
1
2
3
4
5
6
7
8
0
1
2
3
4
5
6
7
8
5-O
ct13
-Oct
20-O
ct27
-Oct
4-N
ov12
-Nov
22-N
ov24
-Nov
4-D
ec10
-Dec
15-D
ec22
-Dec
29-D
ec11
-Jan
19-J
an27
-Jan
2-F
eb9-
Feb
18-F
eb23
-Feb
2-M
ar9-
Mar
17-M
ar23
-Mar
30-M
ar6-
Apr
13-A
pr19
-Apr
27-A
pr4-
May
11-M
ay18
-May
25-M
ay
d 50fr
om P
3 [m
m]
Hs[m
]
Hs from 1 day Hs from 2 days Hs from 3 days
0
1
2
3
4
5
6
7
8
0
1
2
3
4
5
6
7
8
5-O
ct13
-Oct
20-O
ct27
-Oct
4-N
ov12
-Nov
22-N
ov24
-Nov
4-D
ec10
-Dec
15-D
ec22
-Dec
29-D
ec11
-Jan
19-J
an27
-Jan
2-F
eb9-
Feb
18-F
eb23
-Feb
2-M
ar9-
Mar
17-M
ar23
-Mar
30-M
ar6-
Apr
13-A
pr19
-Apr
27-A
pr4-
May
11-M
ay18
-May
25-M
ay
d 50
from
P4
[mm
]
Hs[m
]
Hs from 1 day Hs from 2 days Hs from 3 days
Fig. 10 Mean d50 of P2, P3 andP4, and average significant waveheight from 1, 2 and 3 days priorto the sample collection
316 P. Narra et al.
From the previous examples it is possible to conclude thatto define a typical value of mass-median-diameter that couldcharacterize a cross-shore beach profile shape is not easy, due
to the great variation of sediment grain sizes registered alongthe profile and time. This variation is mostly perceptible atlocations P3 and P4, so, it is not recommended to collect
0
1
2
3
4
5
6
7
8
0
1
2
3
4
5
6
5-O
ct13
-Oct
20-O
ct27
-Oct
4-N
ov12
-Nov
22-N
ov24
-Nov
4-D
ec10
-Dec
15-D
ec22
-Dec
29-D
ec11
-Jan
19-J
an27
-Jan
2-F
eb9-
Feb
18-F
eb23
-Feb
2-M
ar9-
Mar
17-M
ar23
-Mar
30-M
ar6-
Apr
13-A
pr19
-Apr
27-A
pr4-
May
11-M
ay18
-May
25-M
ay
d 50fr
om P
2 [m
m]
P [J
/m]
x 10
5
P from 1 day P from 2 days P from 3 days
0
1
2
3
4
5
6
7
8
0
1
2
3
4
5
65-
Oct
13-O
ct20
-Oct
27-O
ct4-
Nov
12-N
ov22
-Nov
24-N
ov4-
Dec
10-D
ec15
-Dec
22-D
ec29
-Dec
11-J
an19
-Jan
27-J
an2-
Feb
9-F
eb18
-Feb
23-F
eb2-
Mar
9-M
ar17
-Mar
23-M
ar30
-Mar
6-A
pr13
-Apr
19-A
pr27
-Apr
4-M
ay11
-May
18-M
ay25
-May
d 50fr
om P
3 [m
m]
P [J
/m]
x 10
5
P from 1 day P from 2 days P from 3 days
0
1
2
3
4
5
6
7
8
0
1
2
3
4
5
6
5-O
ct13
-Oct
20-O
ct27
-Oct
4-N
ov12
-Nov
22-N
ov24
-Nov
4-D
ec10
-Dec
15-D
ec22
-Dec
29-D
ec11
-Jan
19-J
an27
-Jan
2-F
eb9-
Feb
18-F
eb23
-Feb
2-M
ar9-
Mar
17-M
ar23
-Mar
30-M
ar6-
Apr
13-A
pr19
-Apr
27-A
pr4-
May
11-M
ay18
-May
25-M
ay
d 50fr
om P
4 [m
m]
P [J
/m]
x 10
5
P from 1 day P from 2 days P from 3 days
Fig. 11 Mean d50 of P2, P3 andP4, and energy flux from 1, 2 and3 days prior to the samplecollection
0.0
0.5
1.0
1.5
2.0
2.5
3.0
0 1 2 3 4 5 6 7 8
d 50
1/2
d50 [mm]
d50 range for each locationmedian d50 for each location
mm[
1/2
]
P1
P2
P3
P4
P5
Fig. 12 Influence of the mass-median-diameter in the estimation of beach slope. The dashed line represents the relation between the mass-median-diameter and its square-root. The continuous lines represent the values of d50 for each location and how this value can impact the beach slope estimation
Sediment grain size variation along a cross-shore profile 317
samples from these zones of the cross-shore profile, if theobjective is to find a characteristic mass-median-diameter ofthe field site. On the other hand, the upper foreshore at hightide (P2) presented the most similar values with the average ofall samples used to compute the equilibrium profile shape,which could point for a representative d50 of the profile.
Moreover, although a great variation on the mass-median-diameter along the cross-shore profile was found, the medianvalue of all d50 for the 5 locations remained below 1 mm(Fig. 5). This fact could indicate that the use of the medianof all the collected samples instead of the mean value for theestimation of a characteristic mass-median-diameter can bethe more representative, since it reduces the effect of outlierscollected in punctual samples.
Conclusions
This paper aims to contribute for a better understandingof grain size distribution along the cross-shore profile ofa coastline. In fact, it is not common in literature tosimultaneously have access to real nature grain size dis-tribution along a cross-shore profile in a lengthy periodof time. Thus, a field campaign was performed fromOctober 2010 to May 2011, collecting sediment samplesin a weekly basis, from 5 points along a cross-shoreprofile in Barra beach, Aveiro. In total, 33 samples werecollected, mainly on profile A (26 samples), but also onB (5) and C (2) which were chosen to ensure safetyduring the sample collection.
0.00
0.50
1.00
1.50
2.00
2.50
3.00
3.50
0 1 2 3 4 5 6 7 8
d 50-1
/4
d50 [mm]
P1
P2
P5 P3
P4
mm[
4/1 -]
d50 range for each locationmedian d50 for each location
Fig. 13 Influence of the mass-median-diameter in the estimation of vol-umetric transport rate. The dashed line represents the relation between themass-median-diameter and its negative fourth root. The continuous lines
represent the values of d50 for each location and how this value can impactthe estimation of volumetric transport rate
0
5
10
15
20
25
30
35
0 200 400 600P1
0
5
10
15
20
25
30
35
0 200 400 600P2
0
5
10
15
20
25
30
35
0 200 400 600P3
0
5
10
15
20
25
30
35
0 200 400 600
P4
0
5
10
15
20
25
30
35
0 200 400 600
P5
0
5
10
15
20
25
0 200 400 600
Average of all samples
Distance to Shoreline (m)
Wat
er D
epth
(m
)
range of equilibrium profiles depending of d50
equilibrium profile for median d50
Fig. 14 Equilibrium profiles ofBarra beach, taking into accountthe grain size of the samplescollected for each point of thebeach and the median of allsamples
318 P. Narra et al.
The wave climate was also monitored during the 8 monthsof the fieldwork. The data was acquired in a daily basis fromthe Portuguese Hydrographic Institute website, which has awave buoy located near Leixões harbor, anchored at 83 m ofwater depth. In total, 30,283 datasets were collected with amean wave height of 2.16 m with a period of 7.36 s. Leveland time of high and low tides were also registered during theperiod of field campaigns.
The results obtained from the collected samples show agreat variation on the sediment grain size along the profileand also thought time. The temporal mean grain size on the5 points varied between 0.352 mm on P1 and 1.373 mm onP4. However, the values are affected by a great variation andpoor sorted distributions, mainly on P3 and P4, since the me-dians at the 5 points were less than 1 mm.
The increase of the sediment grain size was registeredmostly during winter. In some occasions, it was possible toobserve a gradual increase of the grain size during the mostenergetic wave climate months, reaching a maximum at theend of these high energetic periods. However, it was not pos-sible to estimate a specific response time of the sediment grainsize to a high energetic wave climate.
Along the cross-shore profile, the granulometry increasesnearer to the intertidal zone (P2, P3 and P4) and also presentsgreater variation along time. On the other hand, P1 and P5presented the lower values of d50 and a small variation duringthe 8 months of sample collection. Moreover, the value of themass-median-diameter that should characterize a cross-shoreprofile of the beach is not clear, due to the great variation thatwas registered along the profile. Considering the characteriza-tion of d50 in a cross-shore profile, collecting samples on theintertidal zone is not recommended, since it is the area wherethe major fluctuations in d50 happens, reducing the confidencein the representativity of the results. The value on the upperforeshore limit, at high tide (P2), presented values close to themedian of all profiles along time and also a smaller variationwhen compared with P3 and P4. So, this location can beadequate for the collection of a representative sample on abeach cross-shore profile. Also, using the median value ofd50 of several sample collection instead of the mean valuecan help to reduce the effect of samples with bigger mass-median-diameter, leading to a more accurate result. It is ex-pected that this information and recommendations could leadto an improvement in following studies depending of a char-acteristic mass-median-diameter, as beach slope estimates,equilibrium beach profile shape definition or sediment trans-port analysis, as well as contribute to improved designs ofcoastal structures and beach nourishments interventions.
Acknowledgments This work was supported by FCT (Fundação para aCiência e Tecnologia) in the framework of the doctoral programmeInfrarisk - Analysis and Mitigation of Risks in Infrastructures with the
theme Coastal Erosion Risk Assessment at Portuguese Speaking Coun-tries (PD/BI/52577/2014).
References
Andrade C, FreitasM (2001) Coastal zones. In: Santos F, Forbes K,MoitaR (eds) Climate change in Portugal, scenarios, impacts and adapta-tion measures - SIAM. Gradiva, Lisbon, pp 175–215
Bettencourt P (1997) Notas para uma estratégia de gestão da orla costeira.Colectânea de ideias sobre a Zona Costeira de Portugal:265–283
Blott S, Pye K (2001) GRADISTAT: a grain size distribution and statisticspackage for the analysis of unconsolidated sediments. Earth SurfProcess Landf 26:1237–1248. doi:10.1002/esp.261
Celikoğlu Y, Yüksel Y, Sedat KabdaşlıM (2004) Longshore sorting on abeach under wave action. Ocean Eng 31:1351–1375. doi:10.1016/j.oceaneng.2004.02.001
Celikoğlu Y, Yüksel Y, Sedat Kabdaşli M (2006) Cross-shore sorting on abeach under wave action. J Coast Res 22:487–501. doi:10.2112/05-0567.1
Coelho C (2005) Riscos de exposição de frentes urbanas para diferentesintervenções de defesa costeira. Ph.D. Thesis, University of Aveiro
Coelho C, Conceição T, Ribeiro B (2009) Coastal erosion due to anthro-pogenic impacts on sediment transport in Douro river-Portugal. In:Proceedings of Coastal Dynamics, Tokyo. World Scientific, p 15
Coelho C, Lopes D, Freitas P (2009) Morphodynamics classification ofAreão Beach, Portugal, Journal of Coastal Research, SI 56(Proceedings of the 10th International Coastal Symposium), 34–38. Lisbon, Portugal. http://www.cerf-jcr.org/index.php/international-coastal-symposium/ics-2009portugal/592-morphodynamics-classification-of-areao-beach-portugal-c-coelho-d-lopes-and-p-freitas
Collet I, Engelbert A (2013) Coastal regions: people living along thecoastline, integration of NUTS 2010 and latest population grid. vol30. EUROSTAT
Costa M, Silva R, Vitorino J (2001) Contribuição para o estudo do climade agitação marítima na costa portuguesa. In: 2as JornadasPortuguesas de Engenharia Costeira, Sines. AssociaçãoInternacional de Navegação, p 20
Dean R (1977) Equilibrium beach profiles: US atlantic and gulf coasts.Department of civil engineering and college of marine studies.University of Delaware, Delaware
Dias J (2005) Evolução da zona costeira portuguesa: forçamentosantrópicos e naturais. Tour Manag Stud 1:7–27
Ferreira Ó (1993) Caracterização dos principais factores condicionantesdo balanço sedimentar e da evolução da linha de costa entre Aveiroeo Cabo Mondego. MSc Thesis, University of Aveiro
Fonseca J (2011) A dimensão dos sedimentos na caracterização daspraias. MSc Thesis, University of Aveiro
Guillén J, Hoekstra P (1997) Sediment distribution in the nearshore zone:grain size evolution in response to shoreface nourishment (island ofterschelling, The Netherlands). Estuar Coast Shelf Sci 45:639–652.doi:10.1006/ecss.1996.0218
Hanson H, Kraus N (1989) GENESIS: generalized model for simulatingshoreline change. U.S. Army Corps of Engineers
Hassan W (2003) Transport of size-graded and uniform sediment underoscillatory sheet-flow conditions. Ph.D. Thesis, University ofTwente
IH (2011) Instituto Hidrográfico. www.hidrografico.pt. Accessed 11/07/2014
Kamphuis J (1991) Alongshore sediment transport rate. J Waterw PortCoast Ocean Eng 117:624–640. doi:10.1061/(ASCE)0733-950X(1991)117:6(624)
Sediment grain size variation along a cross-shore profile 319
Kamphuis J (2000) Introduction to coastal engineering and management,vol 16. World Scientific, Singapore. doi:10.1142/9789812386403_fmatter
Lopes J, Dias J, Dekeyser I (2001) Influence of tides and river inputs onsuspended sediment transport in the Ria de Aveiro lagoon, Portugal.Phys Chem Earth Part B: Hydrol Oceans Atmos 26:729–734. doi:10.1016/S1464-1917(01)00077-0
Masselink G (1992) Longshore variation of grain-size distribution alongthe coast of Rhode Delta, Southern France - A test of the McLarenModel. J Coast Res 8:286–291
McCave I (1978) Grain-size trends and transport along beaches: examplefrom eastern england. Mar Geol 28:43–51. doi:10.1016/0025-3227(78)90092-0
Pereira L (2000) Evolução de curto prazo da linha de costa entre CostaNova e Poço da Cruz. Aveiro. MSc Thesis, University of Aveiro
Short A (1999) Handbook of beach and shoreface morphodynamics.Wiley, Austral ia . doi :10.1002/1099-0755(200009/10)10:5<391::AID-AQC418>3.0.CO;2-F
Silva R, Coelho C, Veloso-Gomes F, Taveira-Pinto F (2007) Dynamicnumerical simulation of medium-term coastal evolution of the westcoast of portugal. J Coast Res 50:263–267
Silva R, Baptista P, Veloso-Gomes F, Coelho C, Taveira-Pinto F (2009)Sediment grain size variation on a coastal stretch facing the northatlantic (NW Portugal). J Coast Res 56:762–766
Sunamura T (1984) Quantitative predictions of beach-face slopes. GeolSoc Am Bull 95:242–245. doi:10.1130/0016-7606(1984)95<242:QPOBS>2.0.CO;2
Terwindt J (1962) Study of grain size variations at the coast of Katwijk.Note K-324. Rijkswaterstaat , Deltadienst, Den Haag,The Netherlands
Trigo-Teixeira A,Matos J, Pimentel C, Pinheiro J (2000) Amap of land atrisk on the Portuguese Coast. Period Biol 102:605–612
Veloso-Gomes F, Taveira-Pinto F, das Neves L, Pais Barbosa J, Coelho C(2004) Erosion risk levels at the NW Portuguese coast: the Douromouth—Cape Mondego stretch. J Coast Conserv 10:43–52. doi:10.1652/1400-0350(2004)010[0043:ERLATN]2.0.CO;2
Visher G (1969) Grain size distributions and depositional processes. JSediment Petrol 39:1074–1106. doi:10.1306/74D71D9D-2B21-11D7-8648000102C1865D
Wang P, Davis R, Kraus N (1998) Cross-shore distribution of sedimenttexture under breaking waves along low-wave-energy coasts. JSediment Res 68:497–506
320 P. Narra et al.