Embed Size (px)
Citation preview
FINAL PROJECT REPORT
WWF REDD+ PILOT PROJECT
WWF TANZANIA COUNTRY OFFICE
2015
Final Project Report of WWF REDD+ Pilot Project entitled “Enhancing Tanzanian Capacity to Deliver Short and Long Term Data on Forest Carbon Stock across the Country, Prepared and Produced by WWF Tanzania in partnership with SUA and University of York, UK
i
ACKNOWLEDGEMENT
We would like to acknowledge the Ministry of Foreign Affairs (Norway) through the Royal
Norwegian Embassy in Tanzania for financing WWF Tanzania to implement a REDD+ Pilot
Project titled “Enhancing Tanzanian Capacity to Deliver Short and Long Term Data of
Forest Carbon Stock across the Country”. We further extend our appreciation to the
Norwegian Ambassador in Tanzania, the Counsellor for Environment and Climate Change,
and the Programme Officer for Environment and Climate Change for their close cooperation
and supervision that helped to ensure the project’s contribution to developing REDD+
capacity and policy in Tanzania.
We would like to acknowledge and extend our appreciation for the support and close
collaboration we received from the Government of Tanzania through the Vice President’s
Office – Department of Environment, Tanzania Forestry Services (TFS), Tanzania REDD
Task force. We express our gratitude to all local authorities and communities who cooperated
with our field teams. Our work is on behalf of the country and we will continue to work
closely with the GoT to reach its goals on REDD+.
We would like also to extend our gratitude to Project implementing partners including
Sokoine University of Agriculture, University of York, FORCONSULT, WCMC and IUCN.
They devoted their time to implement project activities and deliver timely project outputs.
We would also like to extend our appreciation to our conservation partners who also
implemented REDD+ Pilot Projects including TFCG, MCDI, MJUMITA, TATEDO, WCS
for their active interaction and participation on various occations that contributed important
information to the project processes.
Last but not least, we would like also to express our sincere obligation to Project Advisory
Committee for advice and guidance that facilitated smooth project implementation.
ii
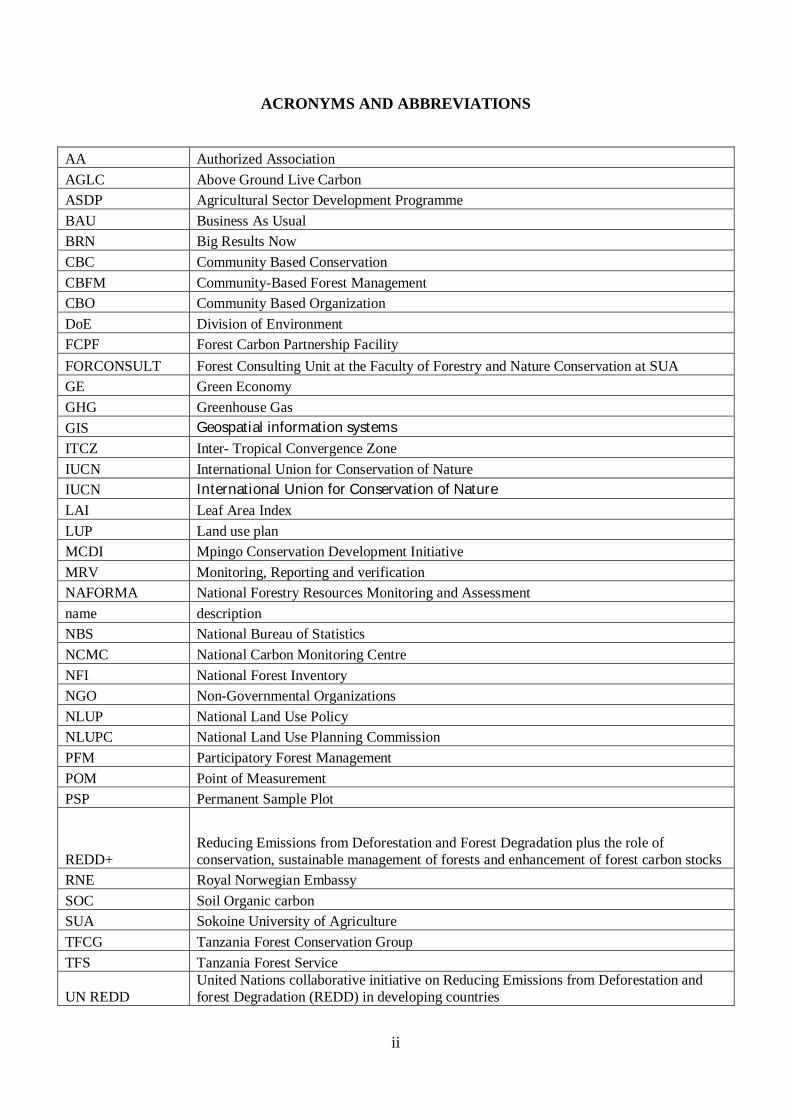
ACRONYMS AND ABBREVIATIONS
AA Authorized Association AGLC Above Ground Live Carbon ASDP Agricultural Sector Development Programme BAU Business As Usual BRN Big Results Now CBC Community Based Conservation CBFM Community-Based Forest Management CBO Community Based Organization DoE Division of Environment FCPF Forest Carbon Partnership Facility FORCONSULT Forest Consulting Unit at the Faculty of Forestry and Nature Conservation at SUA GE Green Economy GHG Greenhouse Gas GIS Geospatial information systems ITCZ Inter- Tropical Convergence Zone IUCN International Union for Conservation of Nature IUCN International Union for Conservation of Nature LAI Leaf Area Index LUP Land use plan MCDI Mpingo Conservation Development Initiative MRV Monitoring, Reporting and verification NAFORMA National Forestry Resources Monitoring and Assessment name description NBS National Bureau of Statistics NCMC National Carbon Monitoring Centre NFI National Forest Inventory NGO Non-Governmental Organizations NLUP National Land Use Policy NLUPC National Land Use Planning Commission PFM Participatory Forest Management POM Point of Measurement PSP Permanent Sample Plot
REDD+ Reducing Emissions from Deforestation and Forest Degradation plus the role of conservation, sustainable management of forests and enhancement of forest carbon stocks
RNE Royal Norwegian Embassy SOC Soil Organic carbon SUA Sokoine University of Agriculture TFCG Tanzania Forest Conservation Group TFS Tanzania Forest Service
UN REDD United Nations collaborative initiative on Reducing Emissions from Deforestation and forest Degradation (REDD) in developing countries

iii
UNEP- WCMC United Nations Environment Programme World Conservation Monitoring Centre UNFCCC United Nations Framework Convention on Climate Change URT United Republic of Tanzania VPO Vice President Office WMA Wildlife Management Area WWF World Wide Fund for Nature

iv
EXECUTIVE SUMMARY
WWF Tanzania and project Partners implemented REDD+ Pilot Project financed by
Norwegian Government for three years started 2011 to 2014. The main project objective was
to contribute core data to the Tanzanian national Monitoring, Reporting and Verification
(MRV) system through building Tanzanian capacity to deliver short and long term data on
forest carbon stocks across the country. The project covered 10 vegetation types which had
had inadequate carbon data to determine accurately carbon emission.
The project was implemented through three points: data collection and analysis, stakeholder
insight and capacity building. One hectare plot method was used to collect information
including woody biomass, soil, litters, grasses and deadwood. Similarly data on
hemispherical photography, Suscan and degradation were collected from these established
plots. Lidar data was acquired through flight in Udzungwa Mountains and verified through
ground truthing in 11 plots. A total of 128 Permanent sample plots were established in 10
vegetation types across the country. Data collection was supplemented with engagement with
Stakeholders. Stakeholders’ workshops across regional zones and consultations captured
information to determine possible land use/cover changes for 2025 and addressed existed
gaps on environmental and social spatial data to support REDD+ Safeguards development.
Capacity building for technical experts was achieved through organised training workshop
and learning by doing in the field.
Results from this project revealed that average Above Ground Live Carbon (AGLC) in 10
vegetation types ranged from 18 tC/ha to 98.99 tC/ha except for upland grassland, floodplain
grassland and Acacia commiphora which have less than 10 tC/ha. Montane forest has higher
average AGLC (98.99) than other vegetation types due to favourable climate conditions and
most of them are protected. However, results from carbon monitoring in Udzungwa indicated
that there is slightly change of carbon enhancement annually since most trees have reached
maturity. This means that REDD+ incentives in montane forest could be realised through
management and conservation of existing carbon stock and other co-benefits related to
biodiversity rather than carbon enhancement.
Average AGLC in Miombo woodland is low (25.55 tC/ha) compared to Lowland forest
(66.06) because most are found in dry areas with some of them lacking proper management.

v
Deforestation and forest degradation is high with the forest being used to meet growing
demand of biomass energy (charcoal and firewood) and unplanned expansion of agricultural
and settlement area due to increasing population and weak governance. Therefore REDD+
incentives could be achieved through addressing drivers of land use change into sectoral
policies and establish effective governance mechanism for its implementation at local level.
Developed land use/cover changes map for 2025 show that under Business as Usual (BAU),
most unreserved forest are vulnerable to deforestation due to easily accessible, high demand
of agricultural and forest product. On the other hand protected forests are vulnerable to forest
degradation due to weak forest governance and inadequate resources to enforce the laws.
Findings from this project suggest that land use/cover changes observed across the country
could be addressed through adopting Green Economy (GE) where conservation issues will be
integrated into development policies to achieve sustainable development as well as reduce
carbon emission, which could be credited under performance based payment.
Results from Lidar data acquisition shows that the capacity of Tanzanian to capture and
analyse laser data is limited as collected data are still analysed in University of York and will
be completed in May 2015. Lidar technology is aimed at reducing workload for ground forest
inventory however its application is still challenging for developing countries due to high
cost involved in mobilising equipment from abroad and weather conditions (dense cloud
cover) which obstruct laser data collection. Therefore it is recommended a multisource
inventory including ground and remote sensing should be properly designed to provide
relevant information at low cost for developing MRV.
Results from REDD+ safeguards shows that Montane forest not only has high carbon stock
but are also rich in biodiversity including threatened species like reptiles. Therefore
monitoring of REDD+ safeguards have the added importance of protecting threatened,
endemic and rare species to ensure multiple benefits are gained from ecosystem.
Findings from capacity building exercises revealed that working in partnership with different
institution/organisation found within and out the country is critical for effective
technological/knowledge transfer. The total 60 villagers and 25 district staff trained are now
competent in taking forest measurement in project area and could reduce monitoring cost in
project area. Furthermore, 77 technical staff in Tanzania has gained knowledge and skill on
vi
data analysis and mapping using R statistical package, developing land use scenarios and
mapping using open source GIS software. The acquired competence and skill resulted to
effective REDD+ project implementation and could reduce dependence on international
expert to lead most REDD+ activities particularly on data analysis, results interpretation and
modelling in the country.
The project findings concluded that Tanzania has made strong steps to the completion of
REDD+ readiness phase as enough data has been collected through NAFORMA and Pilot
Projects to develop National Monitoring, Reporting and Verification system in the country.
Moreover, the recently established National Carbon Monitoring Centre (NCMC) at Sokoine
University of Agriculture is the point institution to collate data from different stakeholders to
design MRV. However, it should be noted that accessing incentives under REDD+
performance based payment will not be possible unless main drivers of land use/cover
changes (expansion of agriculture, demand of biomass energy and increased unplanned
settlement) addressed in National polices for economic development.
WWF Tanzania with its partners is interested to address those challenges at both a national
and subnational scale including MRV development. These combined approaches could
enable communities/institutions to learn and understand through doing at large scale, and
inform the government using evidence based to adopt Green Economy policies to attain
emission reduction that could be credited through performance based payment.
vii
Table of ContentsACKNOWLEDGEMENT ...................................................................................................... i EXECUTIVE SUMMARY .................................................................................................. iv
List of Tables ........................................................................................................................ x
List of Figures ...................................................................................................................... xi List of Appendices .............................................................................................................. xii CHAPTER ONE ................................................................................................................... 1
1.0: INTRODUCTION.......................................................................................................... 1
1.1: Background information ............................................................................................. 1
1.2: Project context and Objective ..................................................................................... 2
1.3: Project Implementation............................................................................................... 3
CHAPTER TWO .................................................................................................................. 4
2.0: PROJECT AREA AND METHODOLOGY ................................................................... 4
2.1: Project area................................................................................................................. 4
2.1.1: Selection of Project area .......................................................................................... 4
2.2: Number of permanent sample plots (PSP) ................................................................... 7
2.3: Plot shape and size ..................................................................................................... 7
2.4: Plot layout .................................................................................................................. 8
2.5: Measurements taken from Permanent Sample Plot (PSP) ............................................ 8
2.5.1 Tree variables ........................................................................................................... 8
2.5.2. Herbaceous layer ..................................................................................................... 9
2.5.3: Litter ....................................................................................................................... 9
2.5.4: Deadwood ............................................................................................................... 9
2.5.5: Soil ......................................................................................................................... 9
2.5.6: Canopy cover ........................................................................................................ 10
2.5.7: Degradation .......................................................................................................... 10
2.6. Remote sensing ........................................................................................................ 10
2.7: Re-measurement of established plots in Udzungwa Mountain ................................... 12
2.8: Steps and procedure for developing Land use and land use change scenario ............. 12
2.8.1: Regional scenario workshop .................................................................................. 12
2.8.2 Approach used for building scenarios. .................................................................... 14
2.8.3 National stakeholders’ workshop ............................................................................ 16
CHAPTER THREE ............................................................................................................. 18
3: DATA ANALYSIS ......................................................................................................... 18
3.1: Data entry and cleansing ........................................................................................... 18
3.2. Above Ground Tree Carbon (AGTC) ........................................................................ 18
3.3. Soil carbon ............................................................................................................... 18
viii
3.4. Herbaceous layer, Liter carbon and Course wood debris (Dead woods) .................... 19
3.5: Degradation .............................................................................................................. 19
3.6: Hemispherical photographs ...................................................................................... 19
3.6.1: Plot sampling and data analyses ............................................................................ 20
3.7: Developing Land use land use change ...................................................................... 22
3.8: Analyzing biodiversity and climate change vulnerability data ................................... 23
3.9: Lidar data processing ................................................................................................ 23
CHAPTER FOUR ............................................................................................................... 24
4.0: RESULTS AND DISCUSSION ................................................................................... 24
Output 1: 120 permanent sample plots established in 10 vegetation types across the country ........................................................................................................................................ 24
4.1.1: Number of plots established in different vegetation types ...................................... 24
4.1.2: Carbon stock in different vegetation types ............................................................. 25
4.1.3: Environmental and Anthropogenic factors influencing carbon storage in miombo woodland ........................................................................................................................ 27
4.1.4: Degradation and Emissions ................................................................................... 32
Output 2: Hemispherical photographic survey of carbon plots established ....................... 33
4.2.1 Number of plots surveyed ...................................................................................... 33
4.2.2: Preliminary results on LAI. ................................................................................... 33
Output 3: Utility of LiDar Technology further tested in Tanzanian forest habitats ........... 34
4.3.1: Coverage of Lidar flight in Udzungwa Mountain .................................................. 34
4.3.2 Changes of carbon stock in Udzungwa Mountains .................................................. 35
Output 4: Soil carbon surveyed across Tanzanian vegetation types .................................. 37
Output 5: A range of future scenarios for changes in carbon stock produced .................... 37
4.5.1: Scenario results ..................................................................................................... 37
4.5.2: Drivers of deforestation and degradation: focus on miombo ecosystem ................. 38
4.5.3: Potential change of miombo woodland to forest plantation .................................... 40
4.5.4: Land use/cover changes maps developed based on Business as usual and Green economy ......................................................................................................................... 42
4.5.5: Environmental and social spatial data to support REDD+ planning and safeguards development ................................................................................................................... 49
4.5.6: Threatened species and its dependence on forest ................................................... 50
4.5.7. Distribution of forest-dependent amphibian, bird, mammal and reptile species ...... 53
4.5.8. Spatial information relevant to social safeguards to support REDD+ planning ....... 55
Output 6: Capacity building, dissemination and communication of project outputs undertaken....................................................................................................................... 69
4.6.1: Local Community (villagers) and district staff empowered on carbon monitoring . 69
4.6.2 Technical staff empowered on data analysis ........................................................... 69

ix
4.6.3: Building capacity of technical staff on mapping and developing scenarios ............ 70
4.6.4: Capacity on species vulnerability assessment ........................................................ 71
4.6.5: Installation of CHN machine and Training of technician ....................................... 71
4.6.6: Data sharing with National Carbon Monitoring Centre .......................................... 72
4.6.7: Stakeholders’ workshop on MRV .......................................................................... 72
4.6.8: Dissemination of project information .................................................................... 72
CHAPTER FIVE ................................................................................................................ 74
5.0: Project Impacts ............................................................................................................. 74
6.0 Sustainability ............................................................................................................ 74
7.0: CONCLUSIONS AND RECOMMENDATIONS ........................................................ 76
x
List of TablesTABLE 1: SELECTED VEGETATION TYPES FOR CARBON ASSESSMENT ..................................................................................... 6
TABLE 2 NUMBER OF PSP IN EACH VEGETATION TYPES ................................................................................................... 7 TABLE 3: PARTICIPANTS ATTENDED IN REGIONAL STAKEHOLDERS WORKSHOP ..................................................................... 13 TABLE 4: STORYLINES FOR TWO SCENARIOS ............................................................................................................... 14 TABLE 5: PLOTS DISTRIBUTION IN DIFFERENT VEGETATION TYPES ..................................................................................... 24 TABLE 6: MEAN CARBON STOCK FOUND IN DIFFERENT VEGETATION TYPES. ........................................................................ 25 TABLE 7: MULTI-MODEL AVERAGES FOR ENVIRONMENTAL AND ANTHROPOGENIC VARIABLES INFLUENCING CARBON STORAGE ........ 27 TABLE 8: TRANSECT/STRIP COVERED BY LIDAR FLIGHT ................................................................................................. 34 TABLE 9: VARIATION IN CARBON STOCK ACROSS ELEVATION GRADIENT IN UDZUNGWA MOUNTAINS FOR 2007 AND 2014 ........... 36 TABLE 10: TREND OF ECONOMY AND ENVIRONMENT UNDER ALTERNATIVE SCENARIOS .......................................................... 38 TABLE 11: DRIVERS OF MIOMBO WOODLAND “DEFORESTATION” ................................................................................... 39 TABLE 12: DRIVERS OF “DEGRADATION .................................................................................................................... 40 TABLE 13: CHANGES TO FOREST PLANTATIONS ........................................................................................................... 41 TABLE 14 – PERCENTAGE CHANGES IN LAND COVER SURFACES BY 2025 UNDER BAU AND GE SCENARIOS. ................................ 48 TABLE 15. RED LIST ASSESSMENTS OF REPTILE SPECIES IN TANZANIA ................................................................................ 50 TABLE 16: NUMBERS (AND PERCENTAGES) OF TANZANIAN REPTILE SPECIES CONSIDERED GLOBALLY THREATENED AND CLIMATE
CHANGE VULNERABLE. ................................................................................................................................. 52 TABLE 17: MAPS TO FACILITATE NATIONAL LEVEL REDD+ SOCIAL SAFEGUARDS PLANNING IN TANZANIA ................................... 55
xi
List of FiguresFIGURE 1: LOCATION OF THE ONE HECTARE STUDY PLOTS WITHIN DIFFERENT VEGETATION TYPES IN TANZANIA .............................. 5 FIGURE 2: ONE HECTARE PLOT.................................................................................................................................. 7 FIGURE 3: AN OVERVIEW MAP OF TANZANIA SHOWING THE LOCATION OF THE LIDAR FLIGHTS ............................................... 11 FIGURE 4: TANZANIA MAP SHOWING DIFFERENT TFS MANAGEMENT ZONES ....................................................................... 13 FIGURE 5: STEPS FOR DEVELOPING LAND USE COVER CHANGES SCENARIO .......................................................................... 14 FIGURE 6: GROUP WORK DISCUSSION DURING REGIONAL SCENARIO WORKSHOP ................................................................. 15 FIGURE 7A & B: EXISTING AND ANTICIPATED SITUATION FOR TWO ALTERNATIVE SCENARIOS ................................................... 16 FIGURE 8: LOCATION OF PLOTS SAMPLED IN AUGUST 2011 AND OVERVIEW ON WWF TANZANIA REDD+ FOCAL ....................... 20 FIGURE 9: VALERI SAMPLING DESIGN IN THE PLOTS. ................................................................................................... 21 FIGURE 10: EXAMPLES OF HEMISPHERICAL IMAGES TAKEN AT 6 OF THE PLOTS .................................................................... 22 FIGURE 11: VARIATION OF CARBON POOL ACROSS DIFFERENT VEGETATION TYPES ................................................................ 26 FIGURE 12: VARIATION OF AGLC ACROSS DIFFERENT VEGETATION TYPES .......................................................................... 26 FIGURE 13: INFLUENTIAL PREDICTORS OF CARBON STORED IN DRY MIOMBO HABITAT (T HA
-1) ................................................. 28 FIGURE 14: INFLUENTIAL PREDICTORS OF CARBON STORED IN WET MIOMBO HABITAT (T HA
-1) ................................................ 29 FIGURE 15: MEAN ESTIMATES OF LAI DERIVED USING HEMISPHERICAL IMAGES (TRUE PAI; RED) AND LAI DERIVED USING SUNSCAN
............................................................................................................................................................. 33 FIGURE 16: CORRELATION BETWEEN LAI MEASUREMENTS DERIVED USING SUNSCAN INSTRUMENT AND DERIVED USING
HEMISPHERICAL IMAGES............................................................................................................................... 34 FIGURE 17: VARIATION IN CARBON STOCK BETWEEN 2007 AND 2014............................................................................. 36 FIGURE 18: SPECIFIC AREAS IDENTIFIED BY STAKEHOLDERS FOR POTENTIAL REPLACEMENT OF MIOMBO WOODLAND WITH FOREST
PLANTATIONS. ........................................................................................................................................... 42 FIGURE 19: LIKELIHOOD OF DEGRADATION AND DEFORESTATION OF DIFFERENT LAND COVER TYPES UNDER BAU SCENARIO ........... 43 FIGURE 20: LIKELIHOOD OF DEGRADATION AND DEFORESTATION OF DIFFERENT LAND COVER TYPES UNDER GE SCENARIO. ............. 44 FIGURE 21: LAND USE/COVER MAP UNDER BAU SCENARIO. .......................................................................................... 47 FIGURE 22: LAND USE/COVER UNDER GE SCENARIO. ................................................................................................... 48 FIGURE 23: ENDEMIC SPECIES RICHNESS AND ABOVE GROUND BIOMASS CARBON ................................................................ 54 FIGURE 24: LOCATIONS OF WMAS AND PFMS .......................................................................................................... 57 FIGURE 25: PERCENTAGE OF VILLAGES WITH LUPS IN EACH DISTRICT. SOURCE: NLUPC AND NBS.......................................... 58 FIGURE 26: VULNERABILITY TO FOOD INSECURITY. SOURCE: MAFSC (2012) .................................................................... 60 FIGURE 27: DISTRIBUTION OF ASDP AND BRN PROJECTS: SOURCE: MAFS C .................................................................... 61 FIGURE 28: MANGROVE FOREST COVER CHANGE, 1990-2010, ..................................................................................... 62 FIGURE 29: MANGROVE FOREST COVER CHANGE, 1990-2010, WITH INSETS SHOWING THE NORTHERN COAST .......................... 63 FIGURE 30: TREE COVER CHANGE IN TANZANIA, 2000-2012 ........................................................................................ 65 FIGURE 31: HIGH-ALTITUDE GRASSLAND DEPENDENT THREATENED SPECIES RICHNESS AND TREE COVER GAIN, 2000-2012 ........... 67 FIGURE 32: MONTANE GRASSLAND ENDEMIC SPECIES RICHNESS AND FOREST GAIN, 2000-2012 ............................................ 68
xii
List of Appendices APPENDIX 1: LIST OF PARTICIPANTS FOR REGIONAL STAKEHOLDERS WORKSHOP ON LAND
USE/COVER CHANGES SCENARIOS .................................................................................. 78 APPENDIX 2: LIST OF PARTICIPANTS IN NATIONAL STAKEHOLDERS WORKSHOP ON LAND
USE/COVER CHANGES SCENARIOS AND REDD+ SAFEGUARDS .......................................... 85 APPENDIX 3: EXISTED GAP ON TANZANIA REDD+ SAFEGUARDS STANDARDS. ........................... 88 APPENDIX 4: DISTRIBUTION OF GLOBALLY THREATENED REPTILE SPECIES IN TANZANIA .......... 91 APPENDIX 5: DISTRIBUTION OF CLIMATE CHANGE VULNERABLE REPTILE SPECIES IN TANZANIA 92 APPENDIX 6: DISTRIBUTION OF FOREST DEPENDENT REPTILE SPECIES IN TANZANIA ................. 93 APPENDIX 7: LIST OF PARTICIPANTS ON R PROGRAMME TRAINING COURSE .............................. 94 APPENDIX 8: LIST OF PARTICIPANTS FOR TRAINING WORKSHOP ON DEVELOPING LAND
USE/COVER SCENARIOS ................................................................................................. 95 APPENDIX 9: LIST OF PARTICIPANTS ATTENDED MAPPING WORKSHOP ..................................... 96
1
CHAPTER ONE
1.0: INTRODUCTION
1.1: Background information
It is estimated that 42% of Tanzania mainland area (48.1 million hectares) is forested1,
comprising of different vegetation types. Sound management of these forests can generate a
number of environmental services such as water catchment, scenic beauty, biodiversity, and
carbon sequestration, which in principle could be valued and paid for by various consumers.
There is also a growing market for forest carbon due to the increasing recognition of the
importance of forest management in Reducing Emissions from Deforestation and Forest
Degradation (REDD+).
A key aspect of determining the carbon benefit of any forest carbon project is to accurately
quantify the levels of carbon changes to known levels of precision. Determination of carbon
changes requires baselines i.e. historical trends against which additional carbon benefits as a
result of carbon project can be determined. Under REDD, the reference scenario is the
baseline against which achievements made by a country can be measured and credited.
Possible options for crediting forest carbon management include reduction in emissions from
deforestation; reduction in emissions from degradation; enhancement; forest conservation;
and conservation of the existing carbon stock. The last two options relate to forests with long
protection status which would be credited based on the maintenance of carbon stock which
would be compensated.
According to COP 15 decision 4/CP 15, non-Annex 1 countries interested in the REDD+
mechanism should establish a robust and transparent national forest monitoring system. A
Monitoring Reporting and Verification (MRV) system is a combination of components that
are interrelated and coordinated to obtain an inventory of Greenhouse Gas (GHG) emission
associated with human practices that affect forest sector. A National MRV system is a key
guarantee that parties will effectively meet their respective mitigation commitments under the
United National Framework Convention for Climate Change (UNFCCC) while building trust
among parties. Therefore forest monitoring system should provide forest emissions that are
transparent and consistent as well as accurate.
1 “Forestland” means an area of land covered with trees, grass and other vegetation but dominated by trees.
2
Tanzania is interested in accessing incentives through potential REDD+ mechanisms that
could support forest management in the country. Therefore National Forest Inventory (NFI)
was conducted countrywide through the NAFORMA2 project housed in Tanzania Forest
Services (TFS). The main purpose of NFI was to generate carbon data for developing
Monitoring, Reporting and Verification (MRV).
1.2: Project context and Objective
The main objective of the project was:
to contribute core data to Tanzanian national Monitoring, Reporting and Verification
(MRV) system that forms a part of the comprehensive forest carbon monitoring
system for the country.
It further aimed at enhancing the capacity of Tanzanians to deliver short and long term data
on forest carbon stocks across the country. According to the project agreement, the project
had six outputs:
i. 120 Baseline carbon plots established in 10 different vegetation types structured
across environmental and degradation gradients.
ii. Hemispherical Photographic survey of carbon plots established
iii. Utility of Lidar technology further tested in Tanzanian forest habitats
iv. Soil carbon surveyed across Tanzanian vegetation types
v. A range of future scenarios for changes in carbon stock produced
vi. Capacity building, dissemination and communication of project outputs undertaken.
All of these outputs focused on increasing carbon data available in Tanzania and contributing
to getting Tanzania ready for the implementation of forest carbon projects under REDD+ or
related mechanisms
In addition to these 6 outputs, savings from the project were used to address both biodiversity
and social safeguards for REDD+ at the national scale in Tanzania. Although not part of the
project document, this work also addresses a core need of the MRV system in Tanzania, and
was agreed to be undertaken through discussion with the Norwegian Embassy. 2 NARFOMA ked by Tanzania |Forest Service under Ministry of Natural Resources and Tourism undertook nationwide forest resource inventory in 2008.
3
The overall rationale of the project was to build capacity and fill gaps that were not being
addressed by other funding sources for MRV aspects of REDD+ readiness. Capitalizing on
stakeholder knowledge, three work streams were identified at the project inception meeting
with other REDD+_ projects. These were:
a) Assessing the accuracy of carbon assessments within the country and the relationship
between data collected through smaller and larger plots, by linking photographic
methods to field plot measurements, and through linking LiDar technology to field
plots.
b) Land cover change scenarios where the REDD+ mechanism has been implemented
and where it has not been. This work would also aim to show how future land use
changes would impact on carbon, biodiversity and social issues across the country.
c) Spatial safeguards information on biodiversity and ecosystem services and social
values. This aimed to build upon the work funded by UN-REDD and provide further
information to a potential Safeguards Information System (SIS) for the country.
Capacity building was to be provided at all levels of the project work. This included
enhancing capacity at the village, local government, NGO, central government and academic
levels.
1.3: Project Implementation
The WWF REDD+ Pilot Project was implemented for three years - 2011 to 2014 – and was
financed by the Norwegian Government. There was a gap in operation in 2012 however the
project resumed in April 2013 when Royal Norwegian Embassy (RNE) approved project
work plan and budget for 2013 and 2014. The project team spent three months to mobilize
assessment teams and resources from April to June 2013 followed with actual field work in
June, 2013.
WWF Tanzania was the lead partner and implemented the project with SUA and University
of York. have been executing project activities that ended December, 2014. Concerted efforts
among the project partners and WWF Tanzania have contributed to the delivery of good
progress towards attaining all project outputs.
4
CHAPTER TWO
2.0: PROJECT AREA AND METHODOLOGY
2.1: Project area
WWF REDD+ Pilot Project covered different land cover types of Tanzania mainland. The
country is constituted by Tanzania Mainland and Zanzibar with a total area of 945,087 km2 of
which 886,037 km2 is surface land (URT, 2009). Tanzania lies just south of the equator, at
10 - 12 S and 30 E - 40 E and has a tropical climate with regional variations due to
topographical difference (McSweeney et al., 2010; URT, 2009). In large part, it is in a central
plateau of around 900-1800m with the intersection of mountain ranges (McSweeney et al.,
2010). The weather is varies in different zones with the coastal areas being warm and humid,
with temperatures 25 to 17 C through most of the year while the highland regions are more
temperate, with temperatures around 20-23 C throughout the year (McSweeney et al., 2010).
Rainfall occurs seasonally driven mainly by the migration of the Inter-Tropical Convergence
Zone (ITCZ) (McSweeney et al., 2010). The country consists of variety of soils with
Cambisols covering 35.6% of the country. Other types of soils include: Histosols which is
formed from organic matter, Andosols developing from volcanic materials and Fluvisols
which is associated with important river plains such as Kilombero and Rufiji plains (MARI,
2006).
It is estimated that 42% of Tanzania mainland area (48.1 million hectares) is forested3,
varying from open savanna grassland mosaics to closed dense evergreen forest. Most
evergreen forests are found within regions of global importance for biodiversity (Marshall et
al., 2012; Platts et al., 2011; Platts et al, 2013). The country hosts six out of the 34 globally
known biodiversity hotspots and is among 15 countries globally with the highest number of
endemic as well as threatened species (URT, 2014).
2.1.1: Selection of Project area
The NAFORMA Project conducted a National Forest Inventory across the Country until
2013. Building on this work, this WWF REDD+ project focused its efforts on less well-
covered vegetation types, also covered miombo woodland and coastal forest to integrate
social factors, on the degradation gradient, and other aspects of the work required for REDD+
3 “Forestland” means an area of land covered with trees, grass and other vegetation but dominated by trees.
5
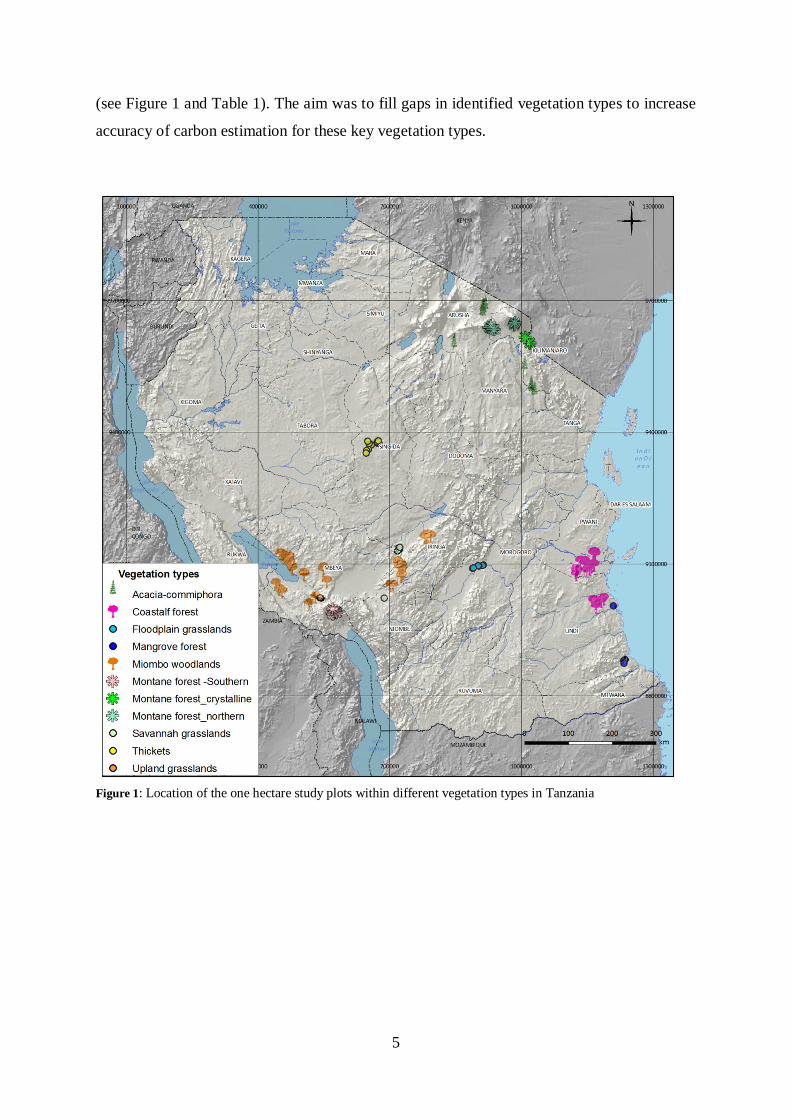
(see Figure 1 and Table 1). The aim was to fill gaps in identified vegetation types to increase
accuracy of carbon estimation for these key vegetation types.
Figure 1: Location of the one hectare study plots within different vegetation types in Tanzania
6
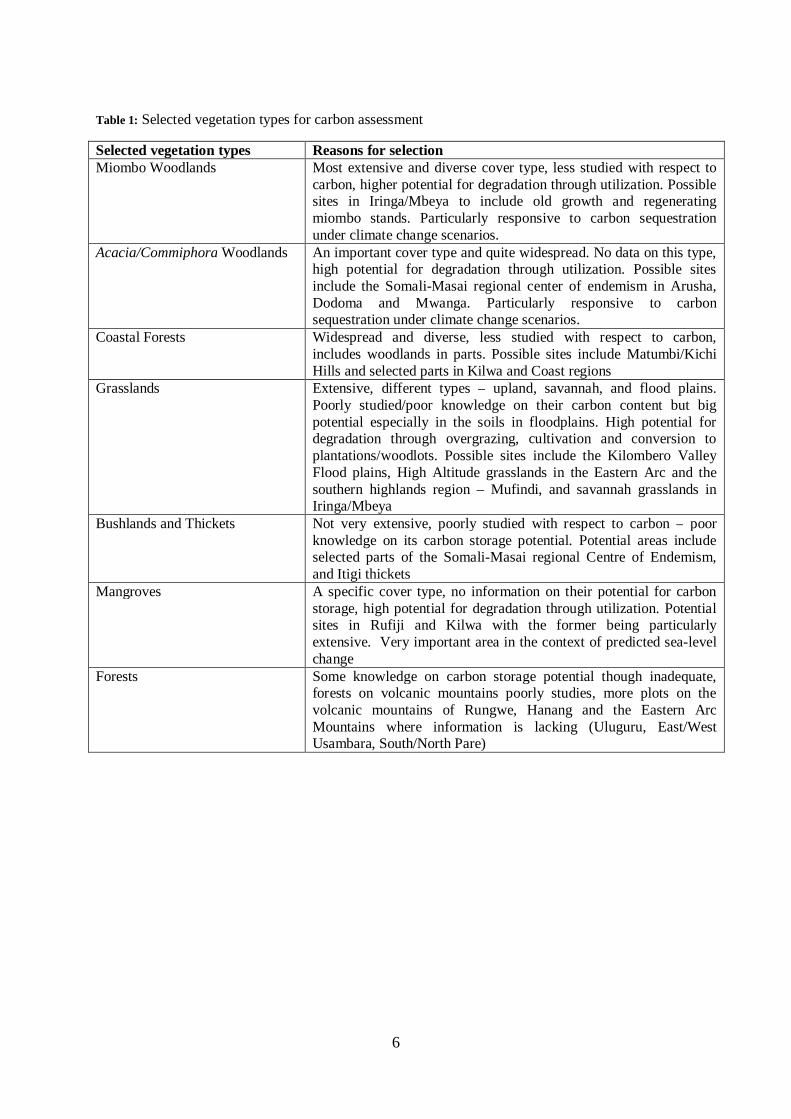
Table 1: Selected vegetation types for carbon assessment
Selected vegetation types Reasons for selection Miombo Woodlands Most extensive and diverse cover type, less studied with respect to
carbon, higher potential for degradation through utilization. Possible sites in Iringa/Mbeya to include old growth and regenerating miombo stands. Particularly responsive to carbon sequestration under climate change scenarios.
Acacia/Commiphora Woodlands An important cover type and quite widespread. No data on this type, high potential for degradation through utilization. Possible sites include the Somali-Masai regional center of endemism in Arusha, Dodoma and Mwanga. Particularly responsive to carbon sequestration under climate change scenarios.
Coastal Forests Widespread and diverse, less studied with respect to carbon, includes woodlands in parts. Possible sites include Matumbi/Kichi Hills and selected parts in Kilwa and Coast regions
Grasslands Extensive, different types – upland, savannah, and flood plains. Poorly studied/poor knowledge on their carbon content but big potential especially in the soils in floodplains. High potential for degradation through overgrazing, cultivation and conversion to plantations/woodlots. Possible sites include the Kilombero Valley Flood plains, High Altitude grasslands in the Eastern Arc and the southern highlands region – Mufindi, and savannah grasslands in Iringa/Mbeya
Bushlands and Thickets Not very extensive, poorly studied with respect to carbon – poor knowledge on its carbon storage potential. Potential areas include selected parts of the Somali-Masai regional Centre of Endemism, and Itigi thickets
Mangroves A specific cover type, no information on their potential for carbon storage, high potential for degradation through utilization. Potential sites in Rufiji and Kilwa with the former being particularly extensive. Very important area in the context of predicted sea-level change
Forests Some knowledge on carbon storage potential though inadequate, forests on volcanic mountains poorly studies, more plots on the volcanic mountains of Rungwe, Hanang and the Eastern Arc Mountains where information is lacking (Uluguru, East/West Usambara, South/North Pare)
7
2.2: Number of permanent sample plots (PSP)
Determination of permanent sample plots was based on variation and similarity within the
selected vegetation types as illustrated in Table 2.
Table 2 Number of PSP in each vegetation types
No Vegetation type Localities Number of PSP 1 Miombo woodland Iringa and Mbeya 40 2 Coastal Forest Kilwa -Matumbi/Kichi Hill 25 3 Mangroves Rufiji/ Kilwa 5 4 Acacia/Commiphora woodlands Arusha/Mwanga 10 5 Bushland/Thickets Singida (Itigi)and Dodoma 10 6 Floodplain Grassland Kilombero 3
7 Upland Grassland Mbeya/Iringa 2 8 Savannah Grasslands Mbeya/Iringa 5 9 Forest on volcanic mountains Mbeya and Kilimanjaro 14
10 Forest on crystalline Mountains E/W Usambara / South 6
Total 120
2.3: Plot shape and size
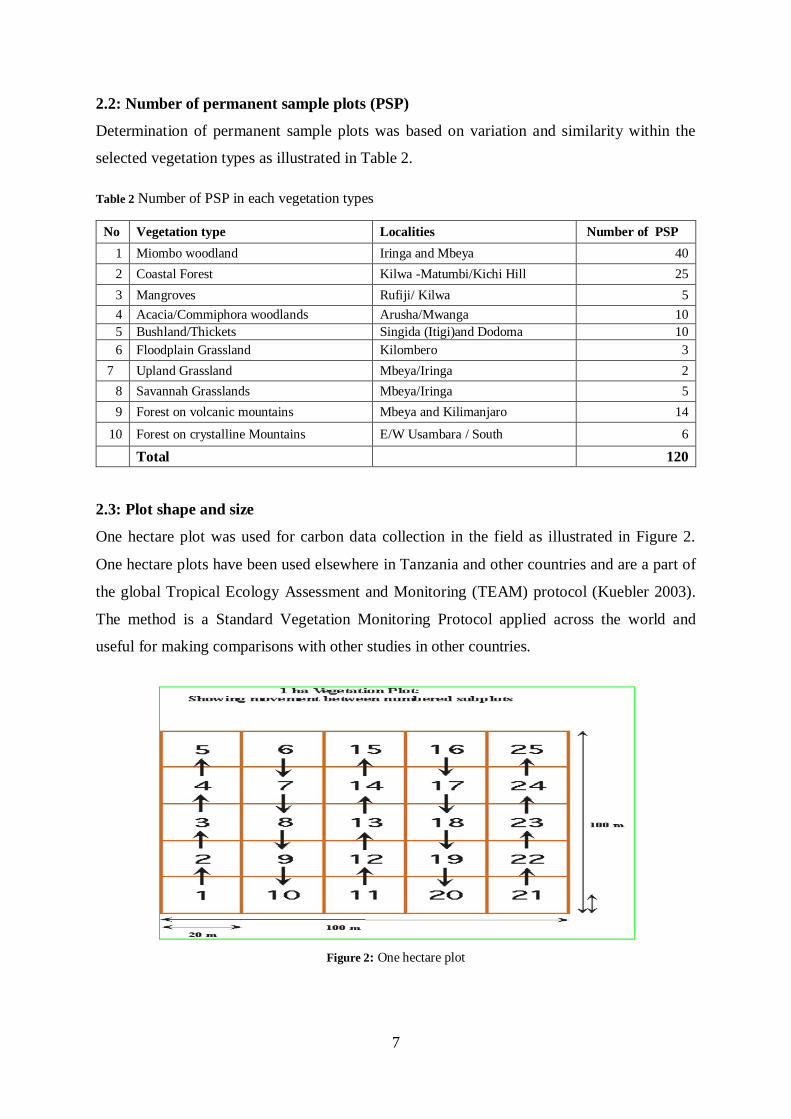
One hectare plot was used for carbon data collection in the field as illustrated in Figure 2.
One hectare plots have been used elsewhere in Tanzania and other countries and are a part of
the global Tropical Ecology Assessment and Monitoring (TEAM) protocol (Kuebler 2003).
The method is a Standard Vegetation Monitoring Protocol applied across the world and
useful for making comparisons with other studies in other countries.
Figure 2: One hectare plot
8
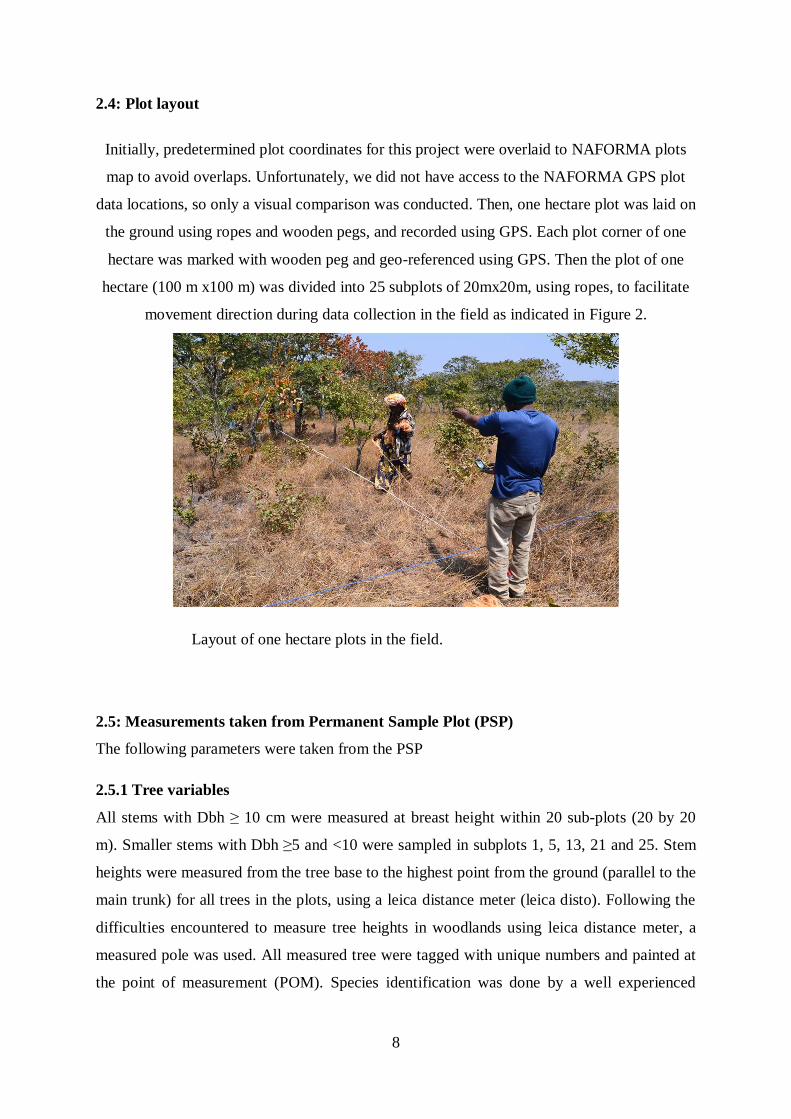
2.4: Plot layout
Initially, predetermined plot coordinates for this project were overlaid to NAFORMA plots
map to avoid overlaps. Unfortunately, we did not have access to the NAFORMA GPS plot
data locations, so only a visual comparison was conducted. Then, one hectare plot was laid on
the ground using ropes and wooden pegs, and recorded using GPS. Each plot corner of one
hectare was marked with wooden peg and geo-referenced using GPS. Then the plot of one
hectare (100 m x100 m) was divided into 25 subplots of 20mx20m, using ropes, to facilitate
movement direction during data collection in the field as indicated in Figure 2.
Layout of one hectare plots in the field.
2.5: Measurements taken from Permanent Sample Plot (PSP)
The following parameters were taken from the PSP
2.5.1 Tree variables
All stems with Dbh 10 cm were measured at breast height within 20 sub-plots (20 by 20
m). Smaller stems with Dbh 5 and <10 were sampled in subplots 1, 5, 13, 21 and 25. Stem
heights were measured from the tree base to the highest point from the ground (parallel to the
main trunk) for all trees in the plots, using a leica distance meter (leica disto). Following the
difficulties encountered to measure tree heights in woodlands using leica distance meter, a
measured pole was used. All measured tree were tagged with unique numbers and painted at
the point of measurement (POM). Species identification was done by a well experienced
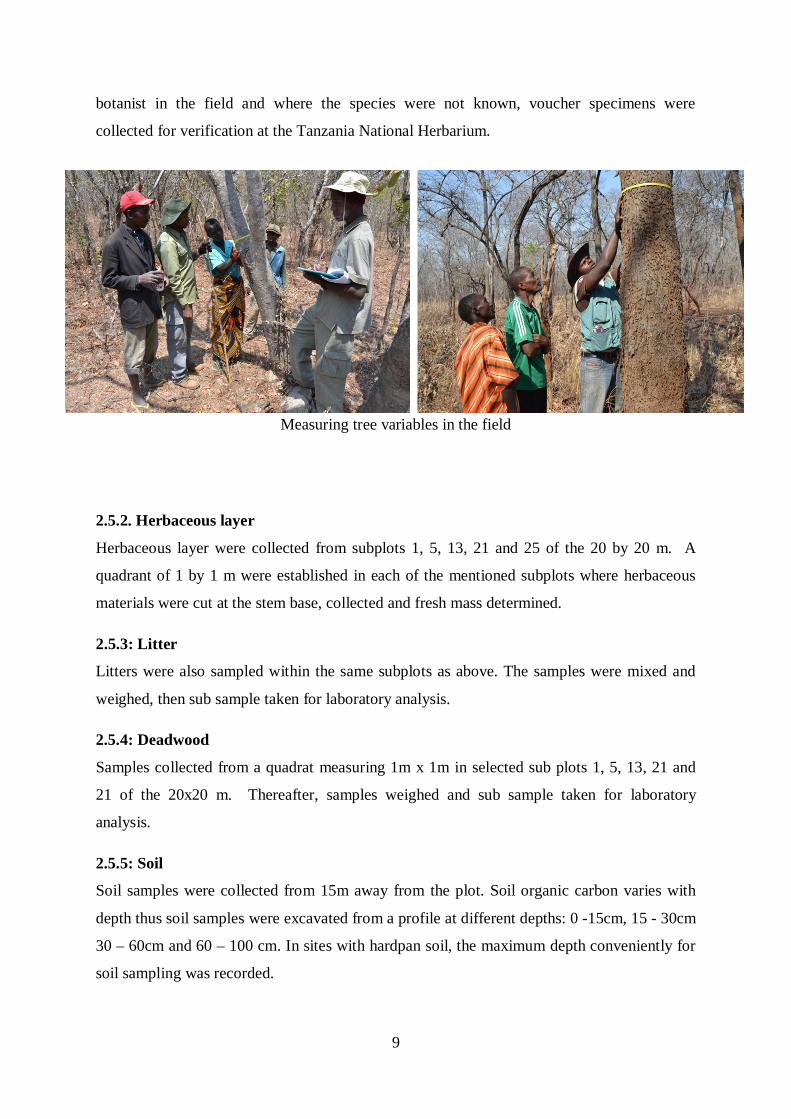
9
botanist in the field and where the species were not known, voucher specimens were
collected for verification at the Tanzania National Herbarium.
Measuring tree variables in the field
2.5.2. Herbaceous layer
Herbaceous layer were collected from subplots 1, 5, 13, 21 and 25 of the 20 by 20 m. A
quadrant of 1 by 1 m were established in each of the mentioned subplots where herbaceous
materials were cut at the stem base, collected and fresh mass determined.
2.5.3: Litter
Litters were also sampled within the same subplots as above. The samples were mixed and
weighed, then sub sample taken for laboratory analysis.
2.5.4: Deadwood
Samples collected from a quadrat measuring 1m x 1m in selected sub plots 1, 5, 13, 21 and
21 of the 20x20 m. Thereafter, samples weighed and sub sample taken for laboratory
analysis.
2.5.5: Soil
Soil samples were collected from 15m away from the plot. Soil organic carbon varies with
depth thus soil samples were excavated from a profile at different depths: 0 -15cm, 15 - 30cm
30 – 60cm and 60 – 100 cm. In sites with hardpan soil, the maximum depth conveniently for
soil sampling was recorded.
10
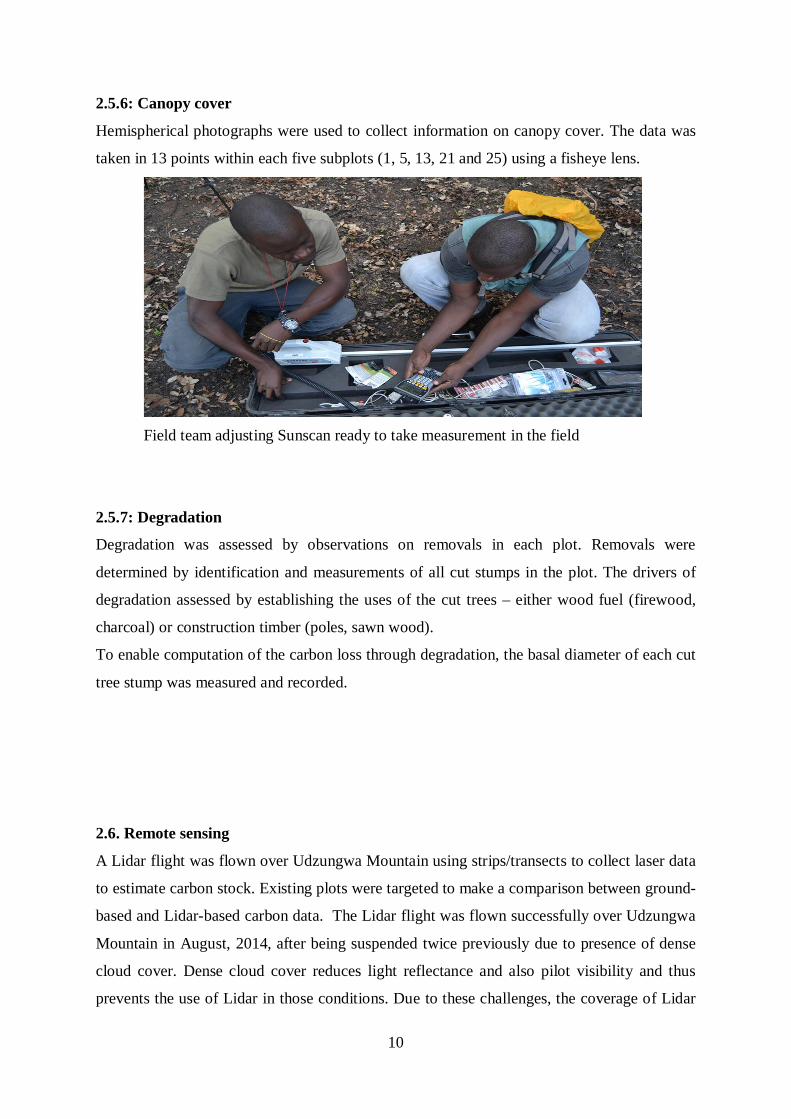
2.5.6: Canopy cover
Hemispherical photographs were used to collect information on canopy cover. The data was
taken in 13 points within each five subplots (1, 5, 13, 21 and 25) using a fisheye lens.
Field team adjusting Sunscan ready to take measurement in the field
2.5.7: Degradation
Degradation was assessed by observations on removals in each plot. Removals were
determined by identification and measurements of all cut stumps in the plot. The drivers of
degradation assessed by establishing the uses of the cut trees – either wood fuel (firewood,
charcoal) or construction timber (poles, sawn wood).
To enable computation of the carbon loss through degradation, the basal diameter of each cut
tree stump was measured and recorded.
2.6. Remote sensing
A Lidar flight was flown over Udzungwa Mountain using strips/transects to collect laser data
to estimate carbon stock. Existing plots were targeted to make a comparison between ground-
based and Lidar-based carbon data. The Lidar flight was flown successfully over Udzungwa
Mountain in August, 2014, after being suspended twice previously due to presence of dense
cloud cover. Dense cloud cover reduces light reflectance and also pilot visibility and thus
prevents the use of Lidar in those conditions. Due to these challenges, the coverage of Lidar
11
flight was only 60% of the targeted area since it was difficult to fly beneath the cloud to
achieve high point density due to extreme topography variation (mountain) that could affect
flight safety.
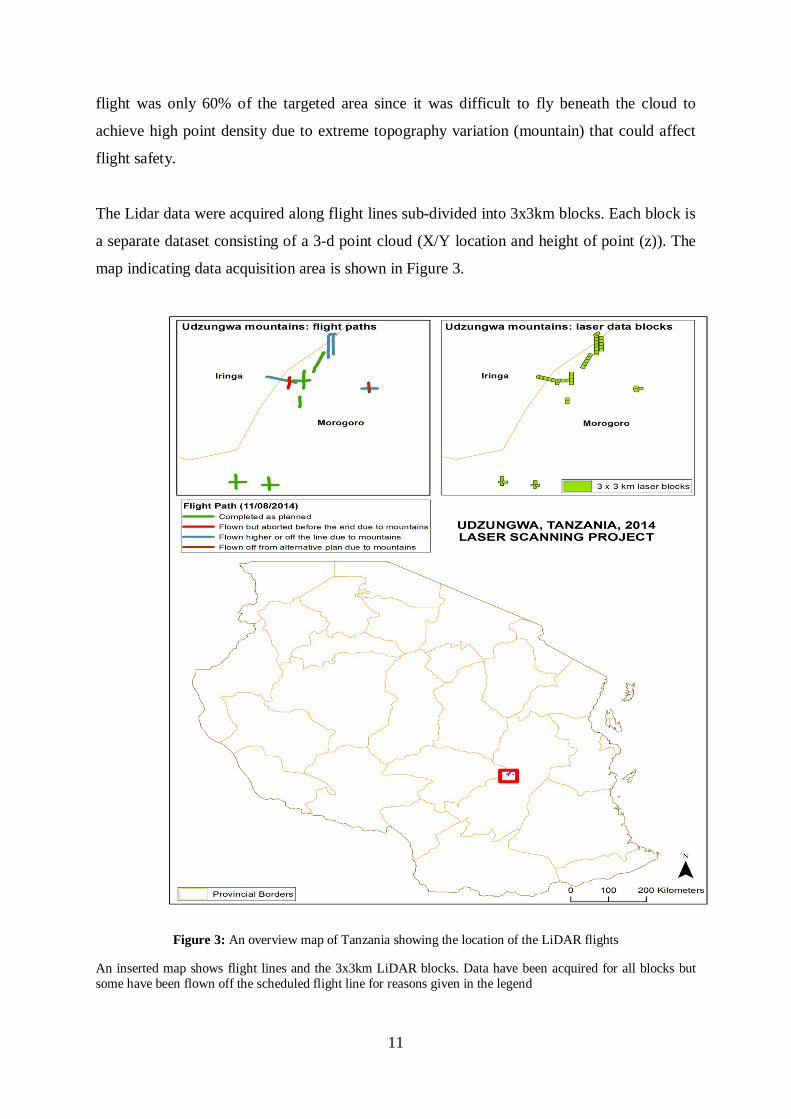
The Lidar data were acquired along flight lines sub-divided into 3x3km blocks. Each block is
a separate dataset consisting of a 3-d point cloud (X/Y location and height of point (z)). The
map indicating data acquisition area is shown in Figure 3.
Figure 3: An overview map of Tanzania showing the location of the LiDAR flights
An inserted map shows flight lines and the 3x3km LiDAR blocks. Data have been acquired for all blocks but some have been flown off the scheduled flight line for reasons given in the legend
12
2.7: Re-measurement of established plots in Udzungwa Mountain
Lidar data acquisition was followed with re assessment of existing 11 PSP in Udzungwa
Mountain. The plots were established in 2007 under Valuing the Arc Project. It was
necessary to re-assess the established plots using the same methodology as Lidar flight flown
over Udzungwa Mountain so as to establish relationship between plot and Lidar data for
estimating carbon stock for the entire area.
Trees were re-measured at exactly the same point measured in 2007 to insure that biomass
increment/loss estimates are reliable. However, there were adjustments on POM to few trees
due to increasing deformity, buttress and bosses as they were affected with either Elephant or
bending following fire and wind. Additional assessments such as hemispherical photographs
were taken with the aim of comparing carbon content and LAI.
2.8: Steps and procedure for developing Land use and land use change scenario
2.8.1: Regional scenario workshop
Regional scenario workshops were conducted in the seven (7) zones established under
Tanzania Forest Services (TFS) to ensure consistency and comparisons of information on
land use/cover change. The areas covered were Southern, Southern Highland, Eastern,
Western, Northern, Central and Lake Zone as indicated in Figure 4. Stakeholders represented
different sectors (agriculture, forestry, water management, social development) from different
institutions (regional and district departments and agencies, private sector, civil society). The
main goal of the workshops was to capture information from stakeholders that could be used
to determine possible future land use and cover changes to year 2025, based on business as
usual (BAU) and green economy (GE) scenarios. The National Land use/cover change map
developed by NAFORMA in 2010 was used as baseline.
13
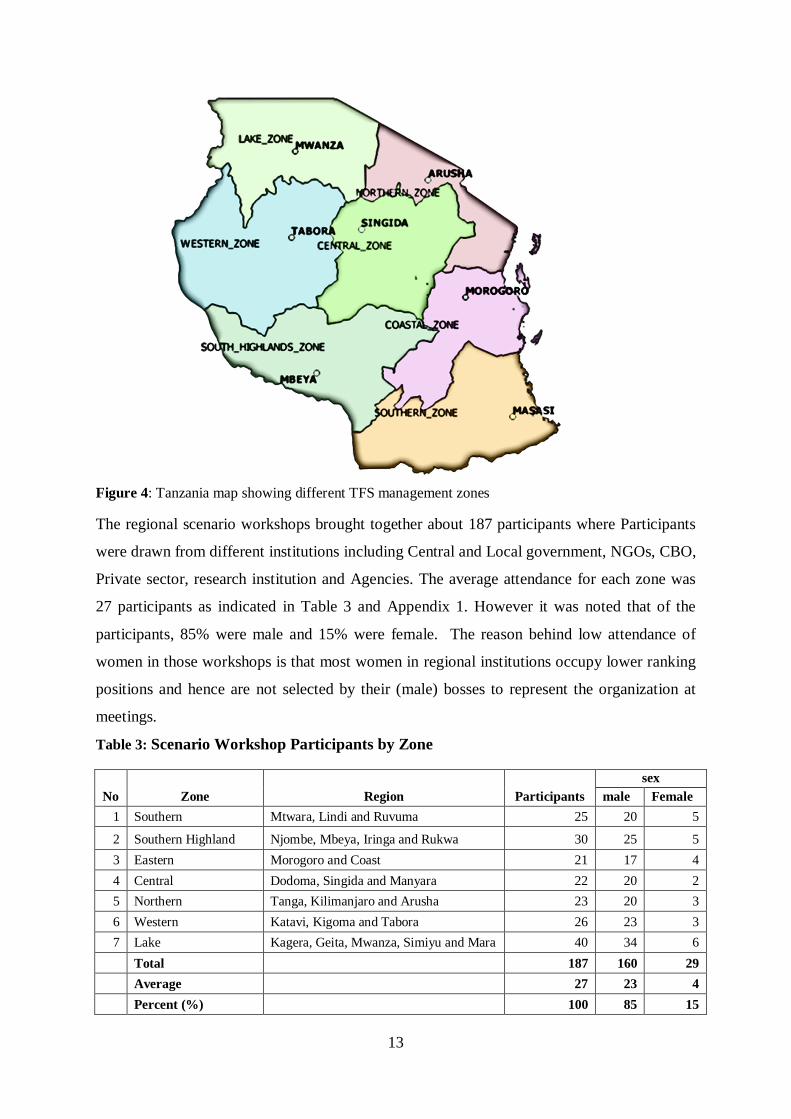
Figure 4: Tanzania map showing different TFS management zones
The regional scenario workshops brought together about 187 participants where Participants
were drawn from different institutions including Central and Local government, NGOs, CBO,
Private sector, research institution and Agencies. The average attendance for each zone was
27 participants as indicated in Table 3 and Appendix 1. However it was noted that of the
participants, 85% were male and 15% were female. The reason behind low attendance of
women in those workshops is that most women in regional institutions occupy lower ranking
positions and hence are not selected by their (male) bosses to represent the organization at
meetings.
Table 3: Scenario Workshop Participants by Zone
No Zone Region Participants sex
male Female 1 Southern Mtwara, Lindi and Ruvuma 25 20 5
2 Southern Highland Njombe, Mbeya, Iringa and Rukwa 30 25 5 3 Eastern Morogoro and Coast 21 17 4 4 Central Dodoma, Singida and Manyara 22 20 2 5 Northern Tanga, Kilimanjaro and Arusha 23 20 3 6 Western Katavi, Kigoma and Tabora 26 23 3 7 Lake Kagera, Geita, Mwanza, Simiyu and Mara 40 34 6
Total 187 160 29 Average 27 23 4 Percent (%) 100 85 15
14
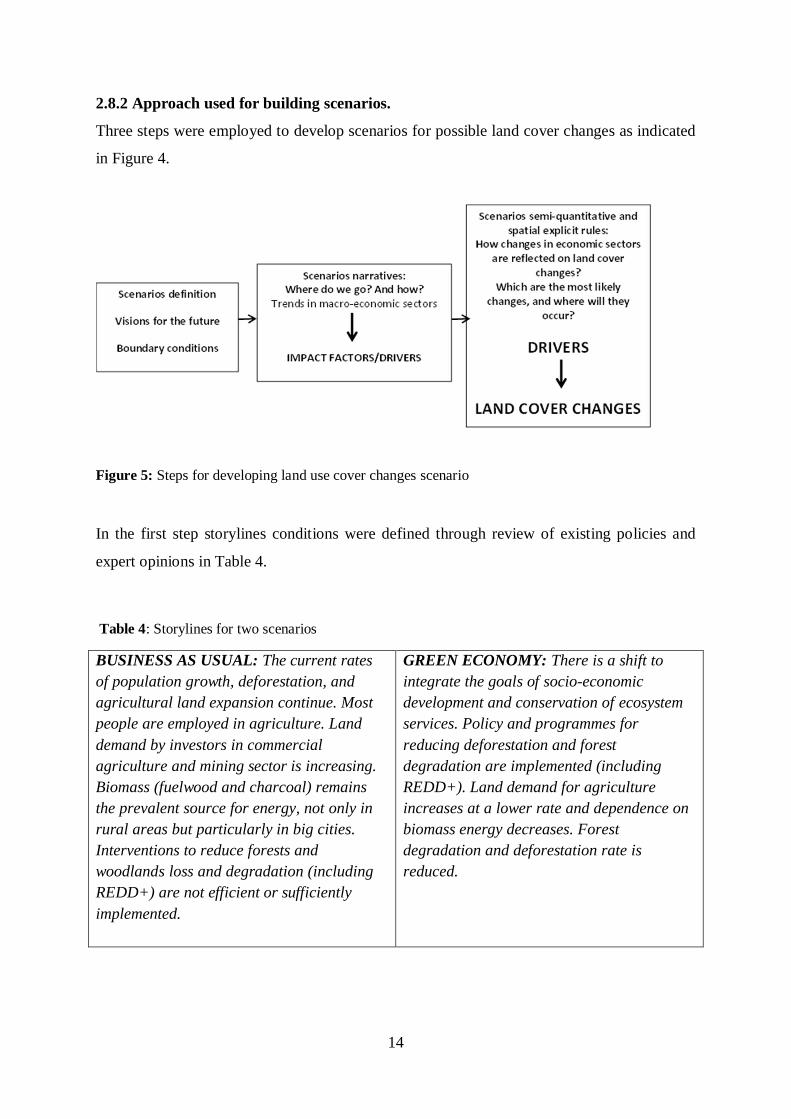
2.8.2 Approach used for building scenarios.
Three steps were employed to develop scenarios for possible land cover changes as indicated
in Figure 4.
Figure 5: Steps for developing land use cover changes scenario
In the first step storylines conditions were defined through review of existing policies and
expert opinions in Table 4.
Table 4: Storylines for two scenarios
BUSINESS AS USUAL: The current rates of population growth, deforestation, and agricultural land expansion continue. Most people are employed in agriculture. Land demand by investors in commercial agriculture and mining sector is increasing. Biomass (fuelwood and charcoal) remains the prevalent source for energy, not only in rural areas but particularly in big cities. Interventions to reduce forests and woodlands loss and degradation (including REDD+) are not efficient or sufficiently implemented.
GREEN ECONOMY: There is a shift to integrate the goals of socio-economic development and conservation of ecosystem services. Policy and programmes for reducing deforestation and forest degradation are implemented (including REDD+). Land demand for agriculture increases at a lower rate and dependence on biomass energy decreases. Forest degradation and deforestation rate is reduced.
15
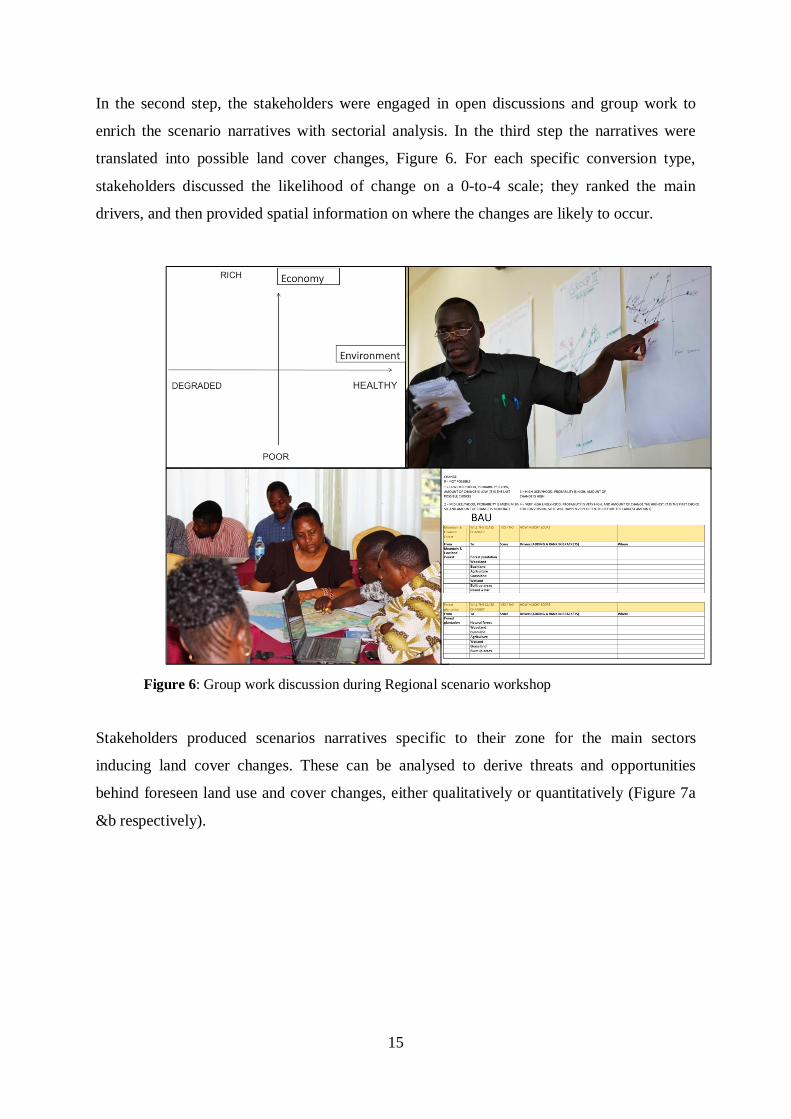
In the second step, the stakeholders were engaged in open discussions and group work to
enrich the scenario narratives with sectorial analysis. In the third step the narratives were
translated into possible land cover changes, Figure 6. For each specific conversion type,
stakeholders discussed the likelihood of change on a 0-to-4 scale; they ranked the main
drivers, and then provided spatial information on where the changes are likely to occur.
Figure 6: Group work discussion during Regional scenario workshop
Stakeholders produced scenarios narratives specific to their zone for the main sectors
inducing land cover changes. These can be analysed to derive threats and opportunities
behind foreseen land use and cover changes, either qualitatively or quantitatively (Figure 7a
&b respectively).
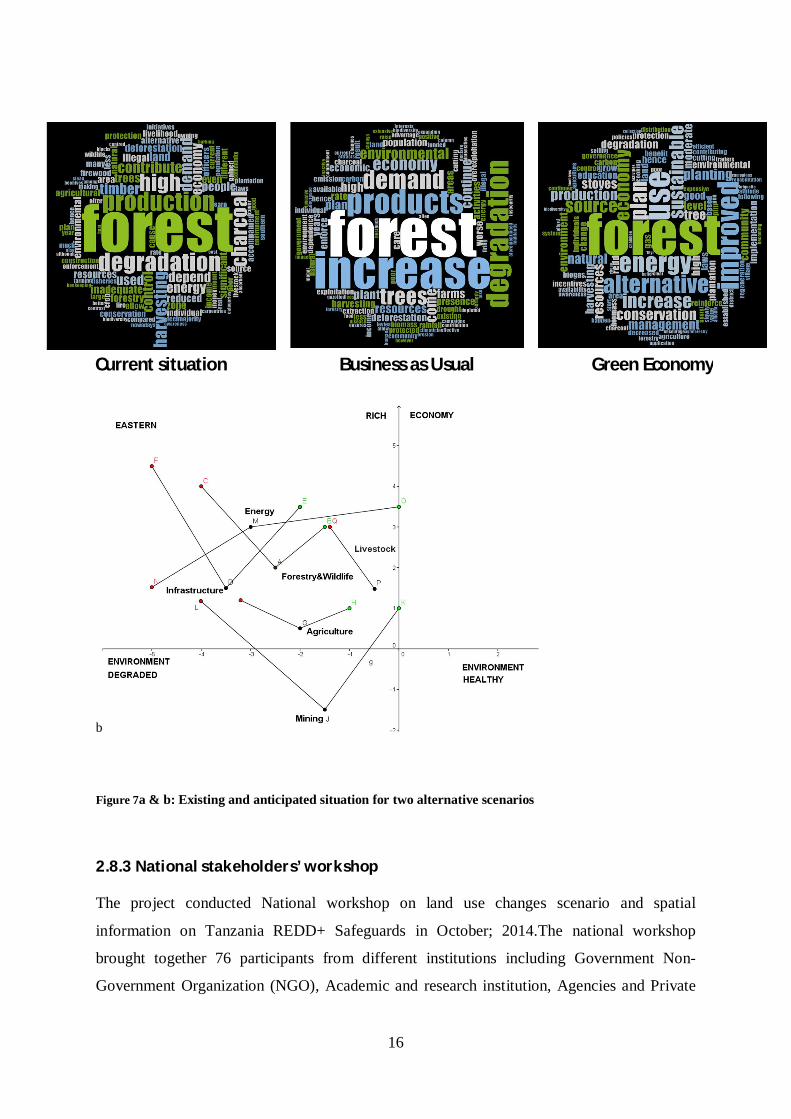
16
Current situation
Business as Usual Green Economy
b
Figure 7a & b: Existing and anticipated situation for two alternative scenarios
2.8.3 National stakeholders’ workshop The project conducted National workshop on land use changes scenario and spatial
information on Tanzania REDD+ Safeguards in October; 2014.The national workshop
brought together 76 participants from different institutions including Government Non-
Government Organization (NGO), Academic and research institution, Agencies and Private
17
sector as shown in participants list appendix 2 . The main objective of the workshop was to
share and validate results and the techniques used to forecast land use/cover changes and
spatial information on REDD+ safeguards. Land use/cover changes are the main criteria to be
used to monitor report and verify carbon emissions. During the workshop, stakeholders
discussed and provided important inputs for potential future land use changes for 2025 across
Tanzania and assessed proposed drivers of changes under Business As Usual (BAU) and
Green Economy (GE). Stakeholders also established consensus on main drivers of land use
/cover changes across the country.
Information from the national workshop was then used to refine or integrated into the land
use change model to generate national map of potential land use/cover change for BAU and
GE scenarios.
2.9: Spatial information on biodiversity and social data for REDD+ Safeguards.
Spatial Information to fill the existing gaps on biodiversity and social data for REDD+
safeguards were collected through stakeholder’s workshops and desk work where different
material gathered and reviewed.
2.10: Capacity building, dissemination and communication of project results.
Several methods were employed to improve the knowledge and skills of Tanzania to
implement REDD+ effectively and achieve project goal. Therefore training workshop and
learning by doing in the field were used to impart knowledge and skill on forest inventory
technique, data analysis and GIS mapping to Tanzanian experts and villagers to ensure that
project are properly implemented. Stakeholder’s workshop and publications were also a
means to communicate and disseminate project results to other stakeholders in and outside
the country. Media was further used to broadcast project events/activities to the entire
country.
18
CHAPTER THREE
3: DATA ANALYSIS
3.1: Data entry and cleansing
Initial data analysis started at SUA where collected data from the field was compiled, cleaned
and entered into the established database. Thereafter, a Tanzanian master’s student from SUA
and one of the field assessment team members joined the project partner University of York
in the UK to analyse data under close supervision of project partners in that institution. Data
was analysed using R statistical package by a the same student who was a beneficiary of R-
statistics training course organised in Morogoro by University of York.
3.2. Above Ground Tree Carbon (AGTC)
AGTC was estimated for each stem with a new improved biomass allometric equation, and
assuming 50% of biomass is carbon (Chave et al., 2014). Biomass was calculated in metric
tons including heights of trees to avoid an overestimation when using DBH only (Marshall et
al., 2012). Wood specific gravity (WSG) was estimated as the mean value for each species
from a database of 2961 records from 844 species (Zanne et al., 2009). Where WSG data
were not available for a species, the mean value for all records of the nearest taxonomic unit
(genus, family) were taken, or where these were not available, the mean of all remaining taxa
in the same plot. The use of WSG is found to be more efficient in calculating above ground
tree biomass especially when including much broader range of vegetation types (Chave et al.,
2014). The following equation was used in calculating above ground tree biomass.
AGB (kg) = 0.112 × [WSG (g.cm-3) × DBH2 (cm2) × Height (m)] 0.916
3.3. Soil carbon
Soil samples were air dried then ground and passed through a 2mm sieve to remove stones
and gravel. Fine and coarse roots were also removed. Soil organic carbon was determined
based on the Walkley - Black chromic acid wet oxidation method, whereby the oxidizable
matter in the soil is oxidized by 1N K2Cr2O7 solution (Walkley and Black, 1934). The soil
carbon was expressed as the % organic carbon with the following formula:
SOC (%) = (meq. K2Cr2O7 – meq.FeSO4) × 0.003 × 100 × f × MCF
Mass (g) air dry soil sample
Where;
19
MCF = Moisture correction factor
f = Correction factor of the organic carbon not oxidized by the treatment (normally approx.
1.3) Computation of soil carbon density was based on soil mass per unit area obtained as the
product of soil volume and soil bulk density determined from the bulk density samples in
(g/cm3) Soil samples are expected to be re-analyzed by the use of CHN analyzer for doing
comparative analysis.
3.4. Herbaceous layer, Liter carbon and Course wood debris (Dead woods)
The wet combustion method was used to estimate percentage organic carbon from the dry
mass of the herbaceous vegetation, litters and course wood debris (Nelson & Sommers,
1982). A portion (50%) of the herbaceous materials, litters and course wood debris was oven-
dried to constant weight at 70_C to determine the dry mass (Andason & Ingram, 1993) and
grounded to fine powder for total organic carbon determination. The total organic carbon was
determined using the wet combustion procedure as described in Nelson & Sommers (1982).
The amount of carbon in each sample was calculated as the product of percentage organic
carbon and dry mass (Andason & Ingram, 1993).
3.5: Degradation
To enable computation of the carbon loss through degradation, the basal diameter of each cut
tree stump was used to establish the diameter at breast height using a developed model for the
miombo woodlands (Sawe et al 20144).
3.6: Hemispherical photographs
The field team was trained by Dr. Simon Willcock andDr Marion Pfeifer in measuring Leaf
Area Index (LAI) and further vegetation structure traits according to a standardized protocol
(Pfeifer and Gonsamo, 2011) using two indirect approaches: hemispherical photography and
Sunscan instrument (Delta-T devices, Cambridge). Twenty plots have been sampled between
09/08/2011 and 30/08/2011. Data files (*.csv) containing SunScan readings have been
converted to excel and pre-processed to specify sampling points and subplots for each of the
20 plots, to check data and to eliminate erroneous data. R statistical software package was 4 Sawe T, Munishi PKT Maliondo SM (2014).Woodland Degradation in the Southern Highlands Miombo of Tanzania: Implications on Conservation and carbon Stock. International Journal of Biodiversity and Conservation Volume 6(3) 230-237.
20
used to derive mean ( ± se) values of LAI for each subplot and plot. Hemispherical images
(*.JPG) collected in each of the plots have been pre-processed by extracting blue band
information from each image and applying a thresholding algorithm to each image. The
resulting images were processed with CanEye Analysis software to obtain estimates of
biophysical vegetation structure, including LAI and fraction of vegetation cover (Fcover)
estimates. Following from the initial analysis a further 65 plots have been sampled for LAI
using Hemispherical imagery – these will be processed over the coming year in conjunction
with a focused analysis of the LiDAR.
LAI estimates from the existing plots have been low, partly caused by measurements having
taken place in deciduous woody biomes in the dry season (i.e. many trees had shed their
leaves). Problems occurred with the SunScan instrument, which were discussed with the field
team to improve reliability and accuracy of measurements in the field. Uncertainties remain
regarding the coordinate reference system used for GPS readings, details on plots (i.e. tree
height, tree density, disturbance history, plot pictures) and whether additional GPS readings
of large buildings/trees/road markers have been taken (required for adjusting geo location of
the satellite images using ground control points method).
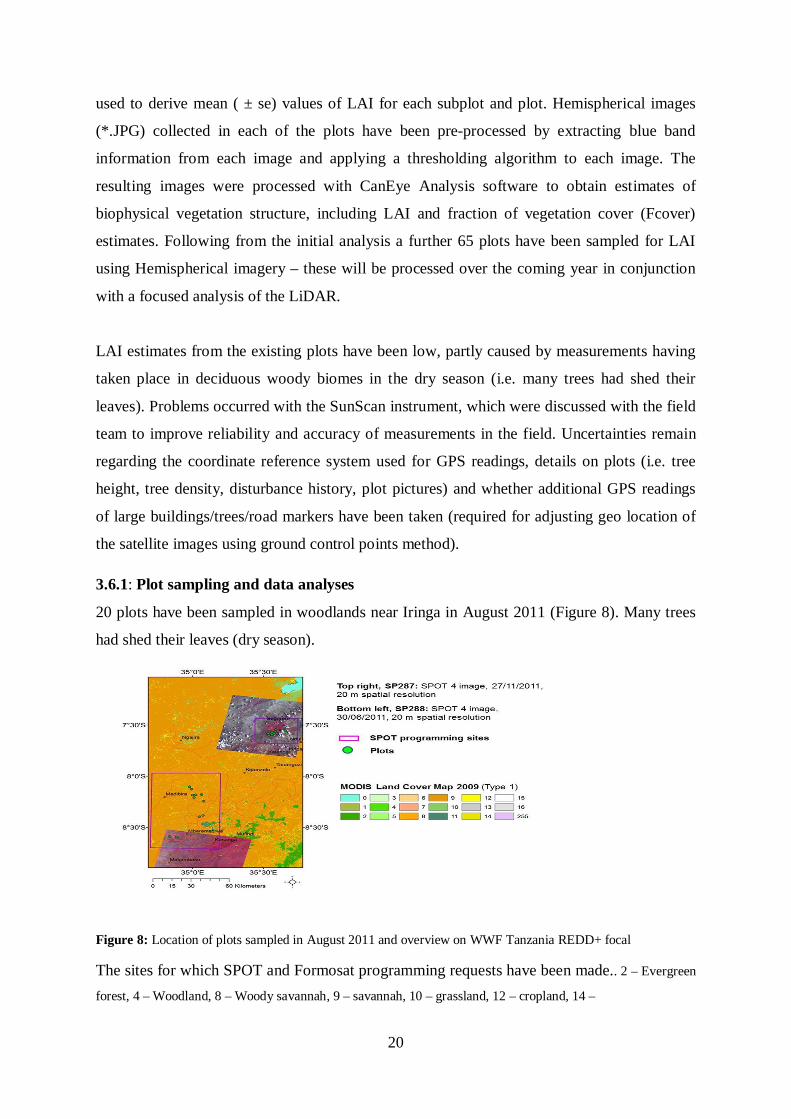
3.6.1: Plot sampling and data analyses
20 plots have been sampled in woodlands near Iringa in August 2011 (Figure 8). Many trees
had shed their leaves (dry season).
Figure 8: Location of plots sampled in August 2011 and overview on WWF Tanzania REDD+ focal
The sites for which SPOT and Formosat programming requests have been made.. 2 – Evergreen
forest, 4 – Woodland, 8 – Woody savannah, 9 – savannah, 10 – grassland, 12 – cropland, 14 –

21
Sampling in the field followed the VALERI sampling design with one additional
measurement in the Centre of each subplot, resulting in 13 sampling points per subplot and 5
subplots per plot (Figure.9)
Figure 9: VALERI sampling design in the plots.
Datafiles (*.csv) containing SunScan readings have been converted to Excel files (*.xls) and
pre-processed to specify sampling points and subplots for each of the 20 plots, to check data
and to eliminate erroneous measurements. A major issue was the BFRAC measurement,
which when done incorrectly resulted in zero readings for LAI in that plot. Following plots
need re-measuring completely: PSP20, PSP 16, PSP7, PSP17, and PSP5. For some of the
other plot, only part of the subplots could be used. Following plots have complete SunScan
readings for subsequent analyses: PSP1, PSP2, PSP 3, PSP4, PSP6, PSP 9, PSP 10, PSP 13
and PSP 15.
Hemispherical images were collected at the same sampling points in the same subplots as
used for SunScan readings. Images were acquired with a NIKON D3100 digital camera
equipped with a SIGMA 4.5 mm f2.8 fisheye lens adaptor (Fig. 10).
Fig 9: VALERI sampling design in
the plots. See also field protocol by
Pfeifer & Gonsamo, 2011.
22
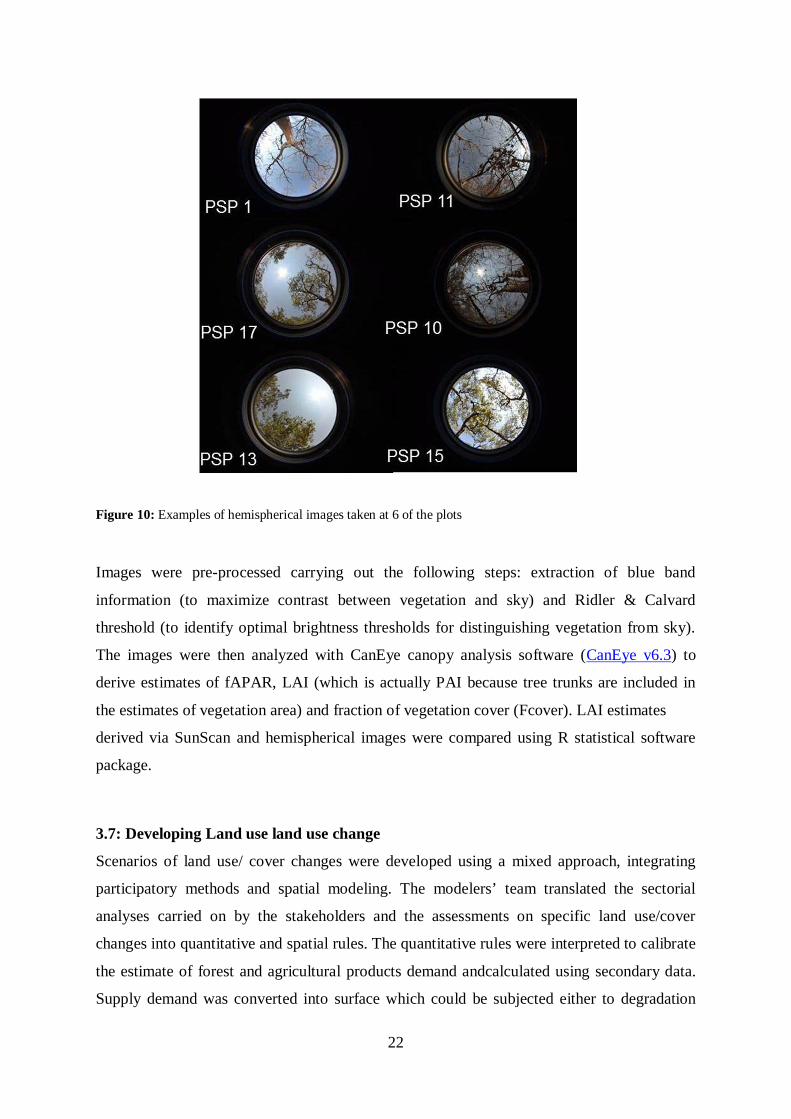
Figure 10: Examples of hemispherical images taken at 6 of the plots
Images were pre-processed carrying out the following steps: extraction of blue band
information (to maximize contrast between vegetation and sky) and Ridler & Calvard
threshold (to identify optimal brightness thresholds for distinguishing vegetation from sky).
The images were then analyzed with CanEye canopy analysis software (CanEye v6.3) to
derive estimates of fAPAR, LAI (which is actually PAI because tree trunks are included in
the estimates of vegetation area) and fraction of vegetation cover (Fcover). LAI estimates
derived via SunScan and hemispherical images were compared using R statistical software
package.
3.7: Developing Land use land use change
Scenarios of land use/ cover changes were developed using a mixed approach, integrating
participatory methods and spatial modeling. The modelers’ team translated the sectorial
analyses carried on by the stakeholders and the assessments on specific land use/cover
changes into quantitative and spatial rules. The quantitative rules were interpreted to calibrate
the estimate of forest and agricultural products demand andcalculated using secondary data.
Supply demand was converted into surface which could be subjected either to degradation
23
(decrease in tree cover and biomass) or deforested (replacement of tree cover by farmland), or
both in sequence. The spatial rules were combined into spatial indicators of likelihood of
change, which guided the allocation of land demand.
Spatial analysis was performed to produce land use /cover change map for two alternatives
(BAU and GE) for 2025 using a baseline of 2010 NAFORMA land use/cover change map.
Scenario maps were scaled up from zonal to national level by harmonizing the spatial
indicators across the zone borders and adopting national scale demand estimates.
3.8: Analyzing biodiversity and climate change vulnerability data
Assessment of vulnerability species was done through stakeholders’ workshop in Bagamoyo
Tanzania. The 383 species assessed, represent all species of terrestrial snakes and lizards
found in Tanzania and the adjacent countries Kenya, Uganda, Burundi and Rwanda (with the
exception of chameleons, which were assessed by a separate process)Tanzania, 280 reptile
species were assessed for Tanzania.
The workshop was attended by 12 experts in the reptile fauna of East Africa, five of whom
are based in Tanzania and represents the leading specialists on reptiles. The workshop
process was led by three facilitators from IUCN, who introduced participants to the Red
Listing process. Subsequently the participants organized themselves into three groups, and
each group focused on species found mainly in one set of geographical regions within East
Africa (roughly delineated as: northern and eastern Tanzania and Kenya; the Albertine Rift,
southern Tanzania and Uganda; and Tanzanian endemics and widespread species).
3.9: Lidar data processing
Terratec analysed the collected raw data in the form of laser scanning and orthophotos and
the outputs were delivered to WWF Tanzania. However, the deliverables were transferred to
University of York for further analysis since Tanzanian expert are lacking capacity on Lidar
data analysis. The required outputs will be ready by May, 2015 to inform the Embassy in
June, 2015. It should be noted that the knowledge and skill for Lidar data analysis will be
transferred to Tanzania institutions particularly SUA and NCMC and the results will be
included in database established in NCMC
24
CHAPTER FOUR
4.0: RESULTS AND DISCUSSION
Output 1: 120 permanent sample plots established in 10 vegetation types across the
country
4.1.1: Number of plots established in different vegetation types
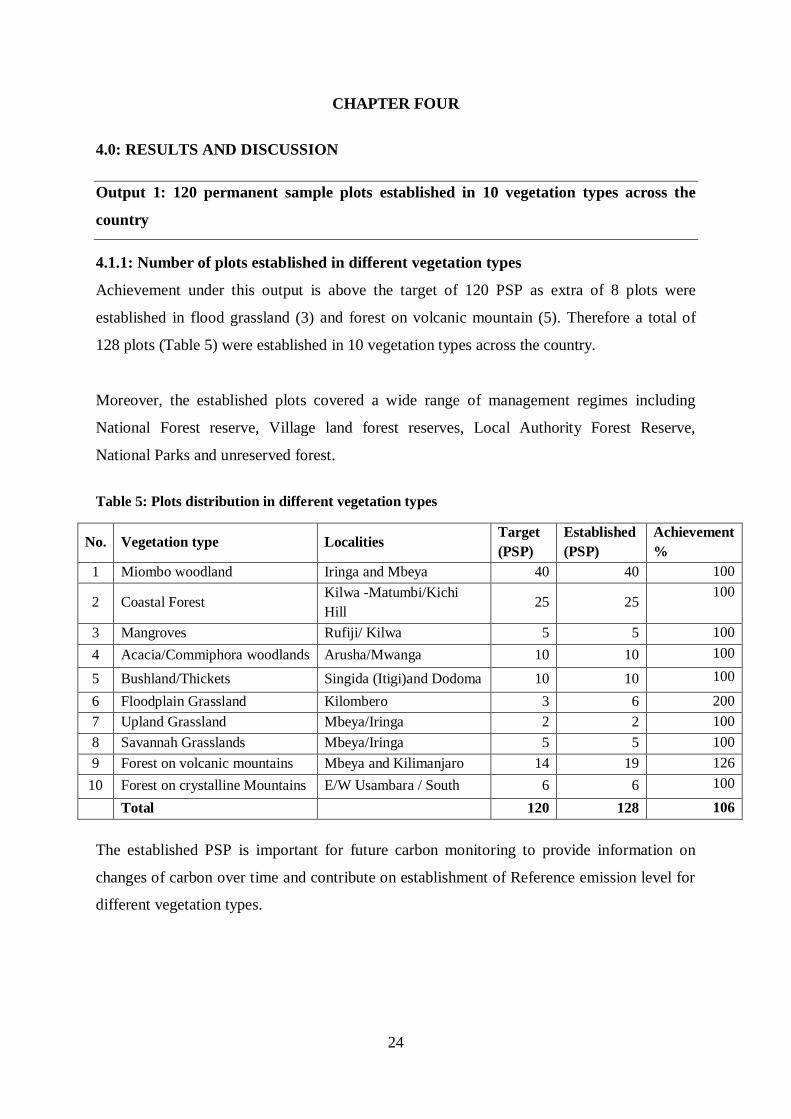
Achievement under this output is above the target of 120 PSP as extra of 8 plots were
established in flood grassland (3) and forest on volcanic mountain (5). Therefore a total of
128 plots (Table 5) were established in 10 vegetation types across the country.
Moreover, the established plots covered a wide range of management regimes including
National Forest reserve, Village land forest reserves, Local Authority Forest Reserve,
National Parks and unreserved forest. Table 5: Plots distribution in different vegetation types
No. Vegetation type Localities Target (PSP)
Established (PSP)
Achievement %
1 Miombo woodland Iringa and Mbeya 40 40 100
2 Coastal Forest Kilwa -Matumbi/Kichi Hill
25 25 100
3 Mangroves Rufiji/ Kilwa 5 5 100 4 Acacia/Commiphora woodlands Arusha/Mwanga 10 10 100
5 Bushland/Thickets Singida (Itigi)and Dodoma 10 10 100
6 Floodplain Grassland Kilombero 3 6 200 7 Upland Grassland Mbeya/Iringa 2 2 100 8 Savannah Grasslands Mbeya/Iringa 5 5 100 9 Forest on volcanic mountains Mbeya and Kilimanjaro 14 19 126
10 Forest on crystalline Mountains E/W Usambara / South 6 6 100
Total 120 128 106 The established PSP is important for future carbon monitoring to provide information on
changes of carbon over time and contribute on establishment of Reference emission level for
different vegetation types.
25
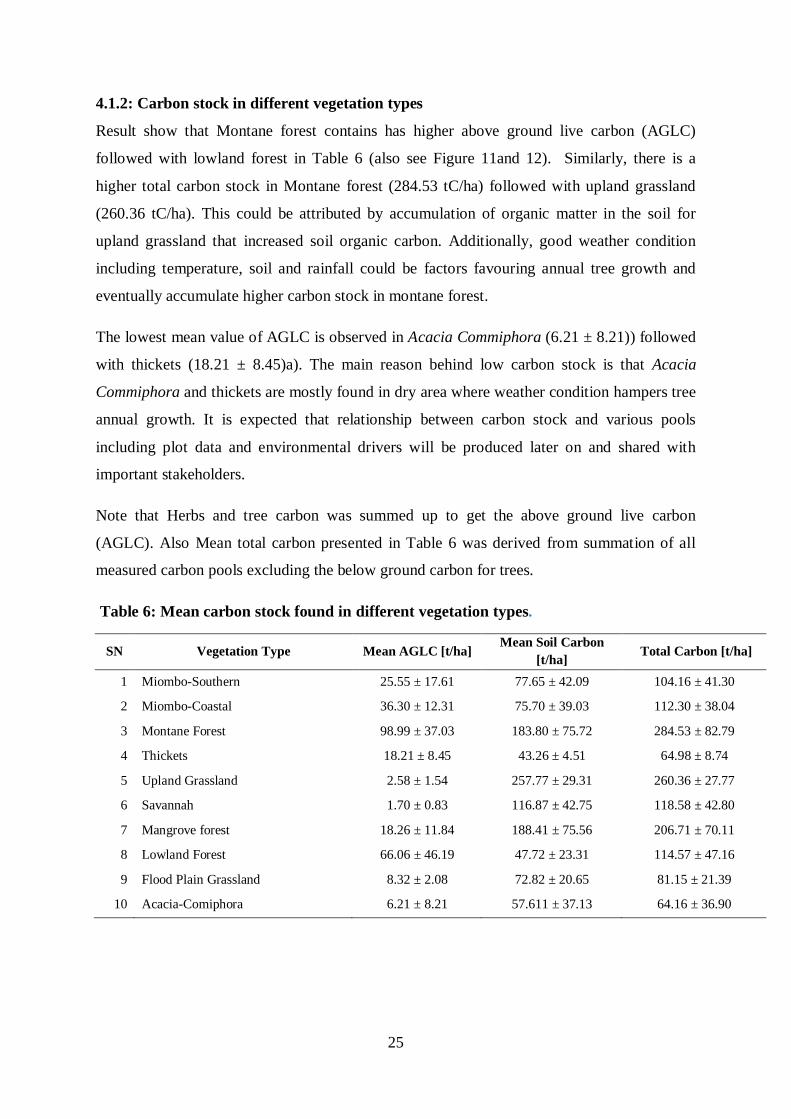
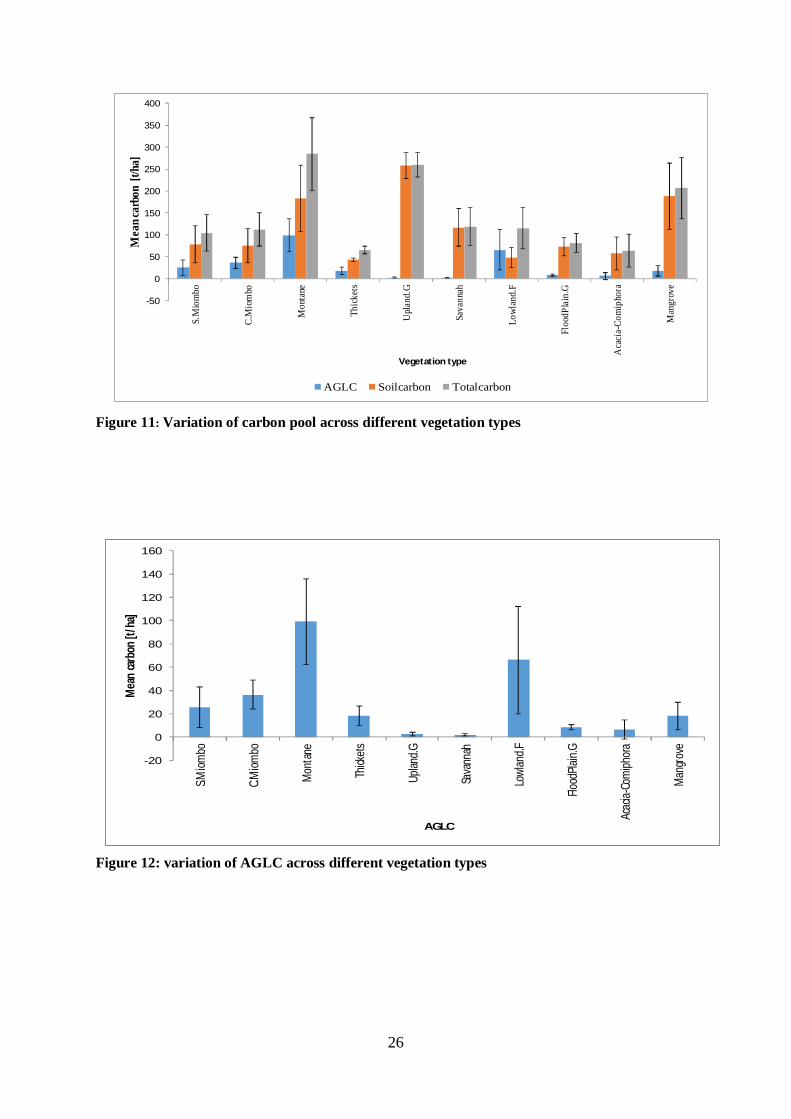
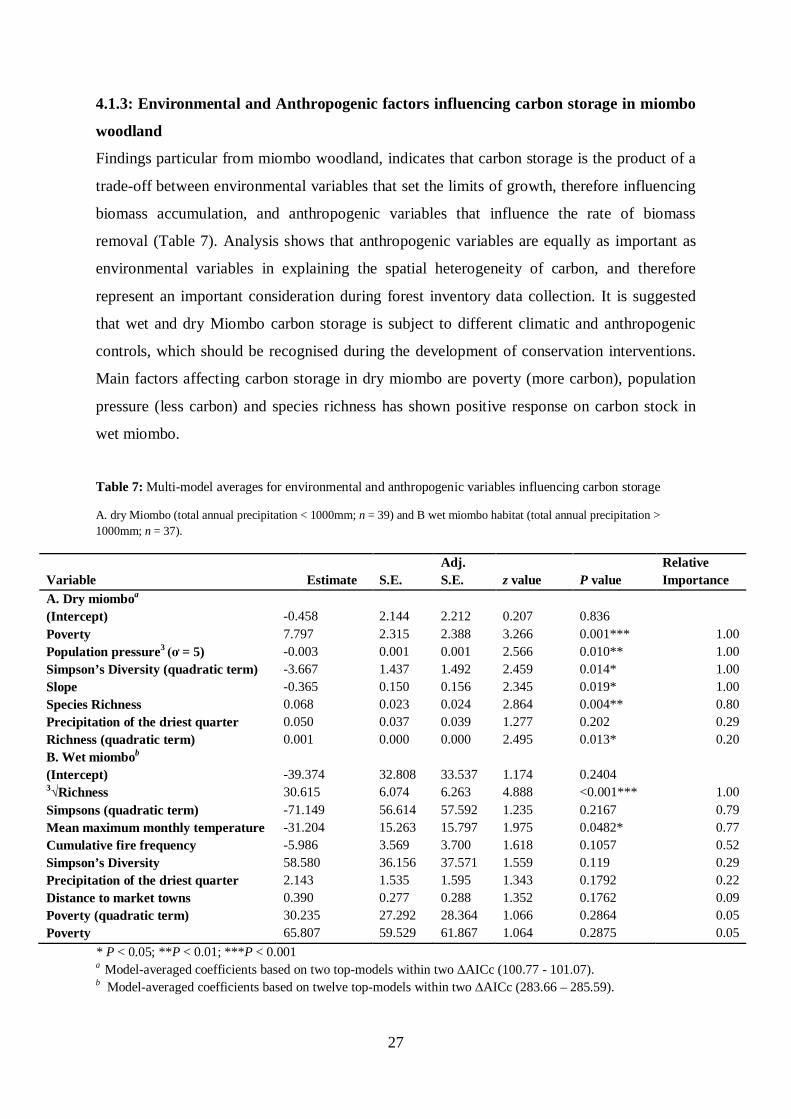
4.1.2: Carbon stock in different vegetation types
Result show that Montane forest contains has higher above ground live carbon (AGLC)
followed with lowland forest in Table 6 (also see Figure 11and 12). Similarly, there is a
higher total carbon stock in Montane forest (284.53 tC/ha) followed with upland grassland
(260.36 tC/ha). This could be attributed by accumulation of organic matter in the soil for
upland grassland that increased soil organic carbon. Additionally, good weather condition
including temperature, soil and rainfall could be factors favouring annual tree growth and
eventually accumulate higher carbon stock in montane forest.
The lowest mean value of AGLC is observed in Acacia Commiphora (6.21 ± 8.21)) followed
with thickets (18.21 ± 8.45)a). The main reason behind low carbon stock is that Acacia
Commiphora and thickets are mostly found in dry area where weather condition hampers tree
annual growth. It is expected that relationship between carbon stock and various pools
including plot data and environmental drivers will be produced later on and shared with
important stakeholders.
Note that Herbs and tree carbon was summed up to get the above ground live carbon
(AGLC). Also Mean total carbon presented in Table 6 was derived from summation of all
measured carbon pools excluding the below ground carbon for trees.
Table 6: Mean carbon stock found in different vegetation types.
SN Vegetation Type Mean AGLC [t/ha] Mean Soil Carbon
[t/ha] Total Carbon [t/ha]
1 Miombo-Southern 25.55 ± 17.61 77.65 ± 42.09 104.16 ± 41.30
2 Miombo-Coastal 36.30 ± 12.31 75.70 ± 39.03 112.30 ± 38.04
3 Montane Forest 98.99 ± 37.03 183.80 ± 75.72 284.53 ± 82.79
4 Thickets 18.21 ± 8.45 43.26 ± 4.51 64.98 ± 8.74
5 Upland Grassland 2.58 ± 1.54 257.77 ± 29.31 260.36 ± 27.77
6 Savannah 1.70 ± 0.83 116.87 ± 42.75 118.58 ± 42.80
7 Mangrove forest 18.26 ± 11.84 188.41 ± 75.56 206.71 ± 70.11
8 Lowland Forest 66.06 ± 46.19 47.72 ± 23.31 114.57 ± 47.16
9 Flood Plain Grassland 8.32 ± 2.08 72.82 ± 20.65 81.15 ± 21.39
10 Acacia-Comiphora 6.21 ± 8.21 57.611 ± 37.13 64.16 ± 36.90
26
-20
0
20
40
60
80
100
120
140
160
S.Miom
bo
C.Miom
bo
Mon
tane
Thick
ets
Uplan
d.G
Sava
nnah
Lowl
and.F
Flood
Plain.
G
Acac
ia-Co
miph
ora
Man
grov
e
Mea
n ca
rbon
[t/h
a]
AGLC
-50
0
50
100
150
200
250
300
350
400
S.M
iom
bo
C.M
iom
bo
Mon
tane
Thick
ets
Upl
and.
G
Sava
nnah
Lowl
and.
F
Floo
dPlai
n.G
Aca
cia-
Com
ipho
ra
Man
grov
e
Mea
n car
bon
[t/ha
]
Vegetation type
AGLC Soilcarbon Totalcarbon
Figure 11: Variation of carbon pool across different vegetation types
Figure 12: variation of AGLC across different vegetation types
27
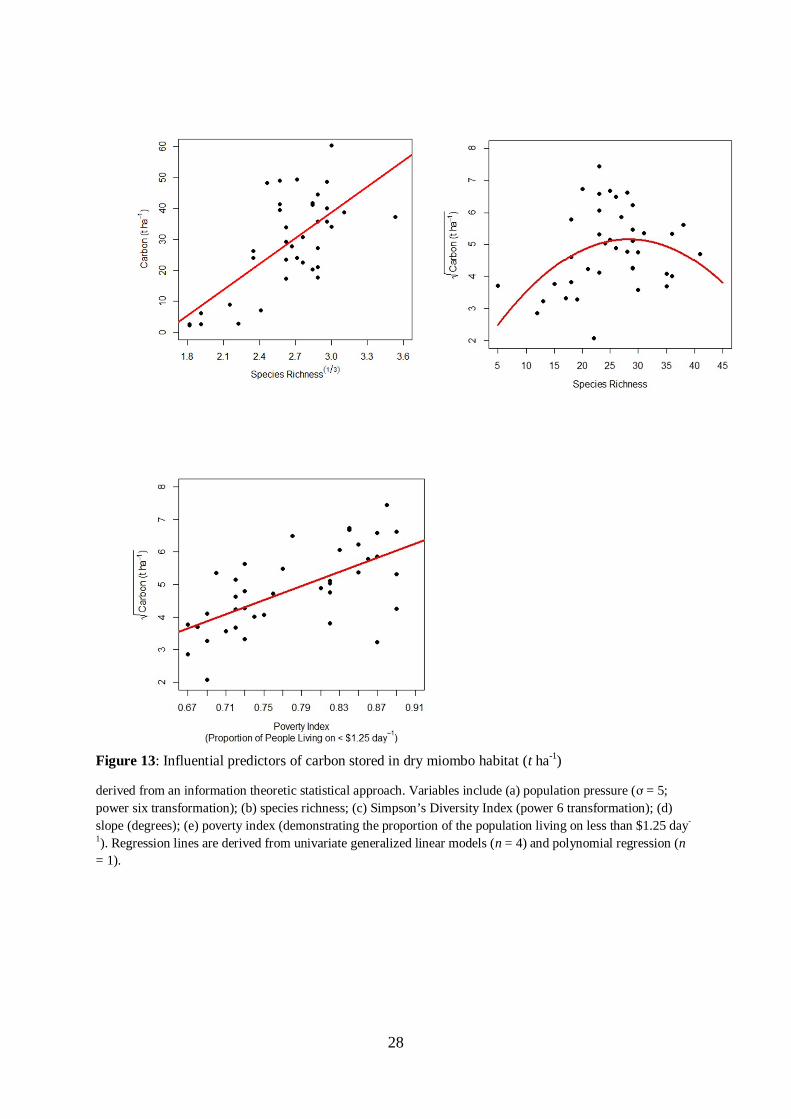
4.1.3: Environmental and Anthropogenic factors influencing carbon storage in miombo
woodland
Findings particular from miombo woodland, indicates that carbon storage is the product of a
trade-off between environmental variables that set the limits of growth, therefore influencing
biomass accumulation, and anthropogenic variables that influence the rate of biomass
removal (Table 7). Analysis shows that anthropogenic variables are equally as important as
environmental variables in explaining the spatial heterogeneity of carbon, and therefore
represent an important consideration during forest inventory data collection. It is suggested
that wet and dry Miombo carbon storage is subject to different climatic and anthropogenic
controls, which should be recognised during the development of conservation interventions.
Main factors affecting carbon storage in dry miombo are poverty (more carbon), population
pressure (less carbon) and species richness has shown positive response on carbon stock in
wet miombo.
Table 7: Multi-model averages for environmental and anthropogenic variables influencing carbon storage
A. dry Miombo (total annual precipitation < 1000mm; n = 39) and B wet miombo habitat (total annual precipitation > 1000mm; n = 37).
Variable
Estimate
S.E.
Adj. S.E.
z value
P value
Relative Importance
A. Dry miomboa (Intercept) -0.458 2.144 2.212 0.207 0.836 Poverty 7.797 2.315 2.388 3.266 0.001*** 1.00 Population pressure3 = 5) -0.003 0.001 0.001 2.566 0.010** 1.00 Simpson’s Diversity (quadratic term) -3.667 1.437 1.492 2.459 0.014* 1.00 Slope -0.365 0.150 0.156 2.345 0.019* 1.00 Species Richness 0.068 0.023 0.024 2.864 0.004** 0.80 Precipitation of the driest quarter 0.050 0.037 0.039 1.277 0.202 0.29 Richness (quadratic term) 0.001 0.000 0.000 2.495 0.013* 0.20 B. Wet miombob (Intercept) -39.374 32.808 33.537 1.174 0.2404 3 Richness 30.615 6.074 6.263 4.888 <0.001*** 1.00 Simpsons (quadratic term) -71.149 56.614 57.592 1.235 0.2167 0.79 Mean maximum monthly temperature -31.204 15.263 15.797 1.975 0.0482* 0.77 Cumulative fire frequency -5.986 3.569 3.700 1.618 0.1057 0.52 Simpson’s Diversity 58.580 36.156 37.571 1.559 0.119 0.29 Precipitation of the driest quarter 2.143 1.535 1.595 1.343 0.1792 0.22 Distance to market towns 0.390 0.277 0.288 1.352 0.1762 0.09 Poverty (quadratic term) 30.235 27.292 28.364 1.066 0.2864 0.05 Poverty 65.807 59.529 61.867 1.064 0.2875 0.05
* P < 0.05; **P < 0.01; ***P < 0.001 a Model-averaged coefficients based on two top-models within two AICc (100.77 - 101.07). b Model-averaged coefficients based on twelve top-models within two AICc (283.66 – 285.59).
28
Figure 13: Influential predictors of carbon stored in dry miombo habitat (t ha-1)
derived from an information theoretic statistical approach. Variables include (a) population pressure ( = 5; power six transformation); (b) species richness; (c) Simpson’s Diversity Index (power 6 transformation); (d) slope (degrees); (e) poverty index (demonstrating the proportion of the population living on less than $1.25 day-
1). Regression lines are derived from univariate generalized linear models (n = 4) and polynomial regression (n = 1).
29
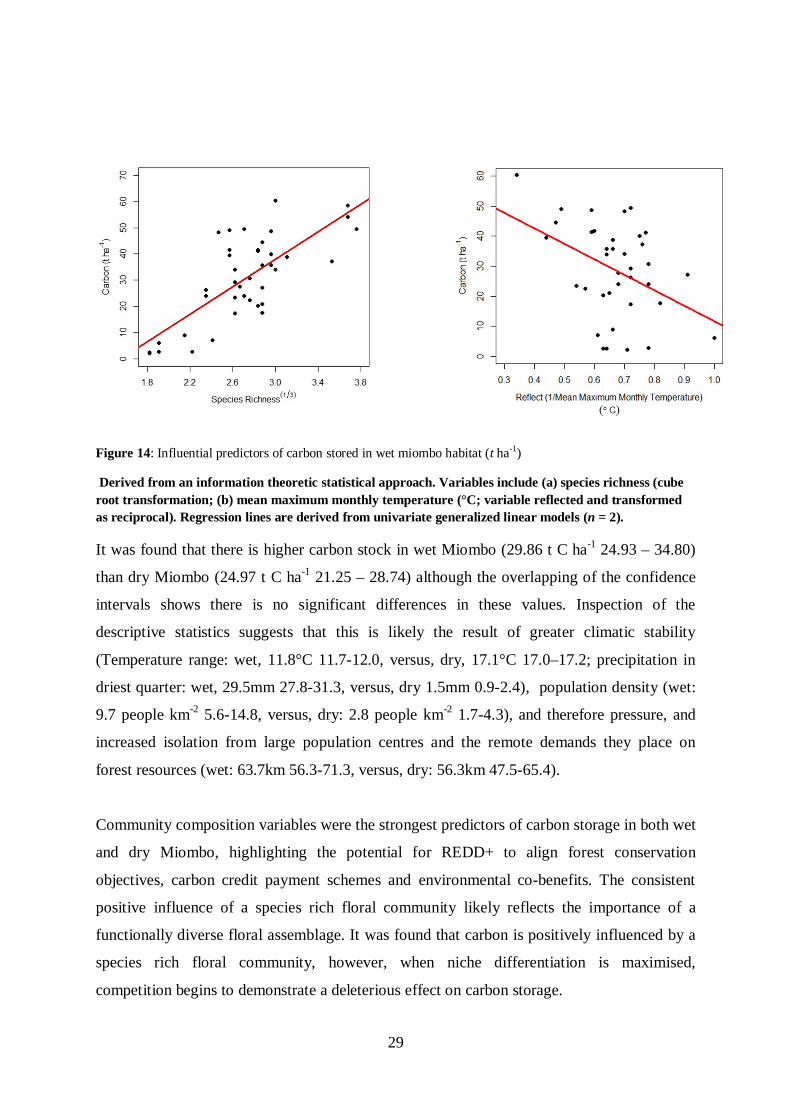
Figure 14: Influential predictors of carbon stored in wet miombo habitat (t ha-1)
Derived from an information theoretic statistical approach. Variables include (a) species richness (cube root transformation; (b) mean maximum monthly temperature (°C; variable reflected and transformed as reciprocal). Regression lines are derived from univariate generalized linear models (n = 2).
It was found that there is higher carbon stock in wet Miombo (29.86 t C ha-1 24.93 – 34.80)
than dry Miombo (24.97 t C ha-1 21.25 – 28.74) although the overlapping of the confidence
intervals shows there is no significant differences in these values. Inspection of the
descriptive statistics suggests that this is likely the result of greater climatic stability
(Temperature range: wet, 11.8°C 11.7-12.0, versus, dry, 17.1°C 17.0–17.2; precipitation in
driest quarter: wet, 29.5mm 27.8-31.3, versus, dry 1.5mm 0.9-2.4), population density (wet:
9.7 people km-2 5.6-14.8, versus, dry: 2.8 people km-2 1.7-4.3), and therefore pressure, and
increased isolation from large population centres and the remote demands they place on
forest resources (wet: 63.7km 56.3-71.3, versus, dry: 56.3km 47.5-65.4).
Community composition variables were the strongest predictors of carbon storage in both wet
and dry Miombo, highlighting the potential for REDD+ to align forest conservation
objectives, carbon credit payment schemes and environmental co-benefits. The consistent
positive influence of a species rich floral community likely reflects the importance of a
functionally diverse floral assemblage. It was found that carbon is positively influenced by a
species rich floral community, however, when niche differentiation is maximised,
competition begins to demonstrate a deleterious effect on carbon storage.
30
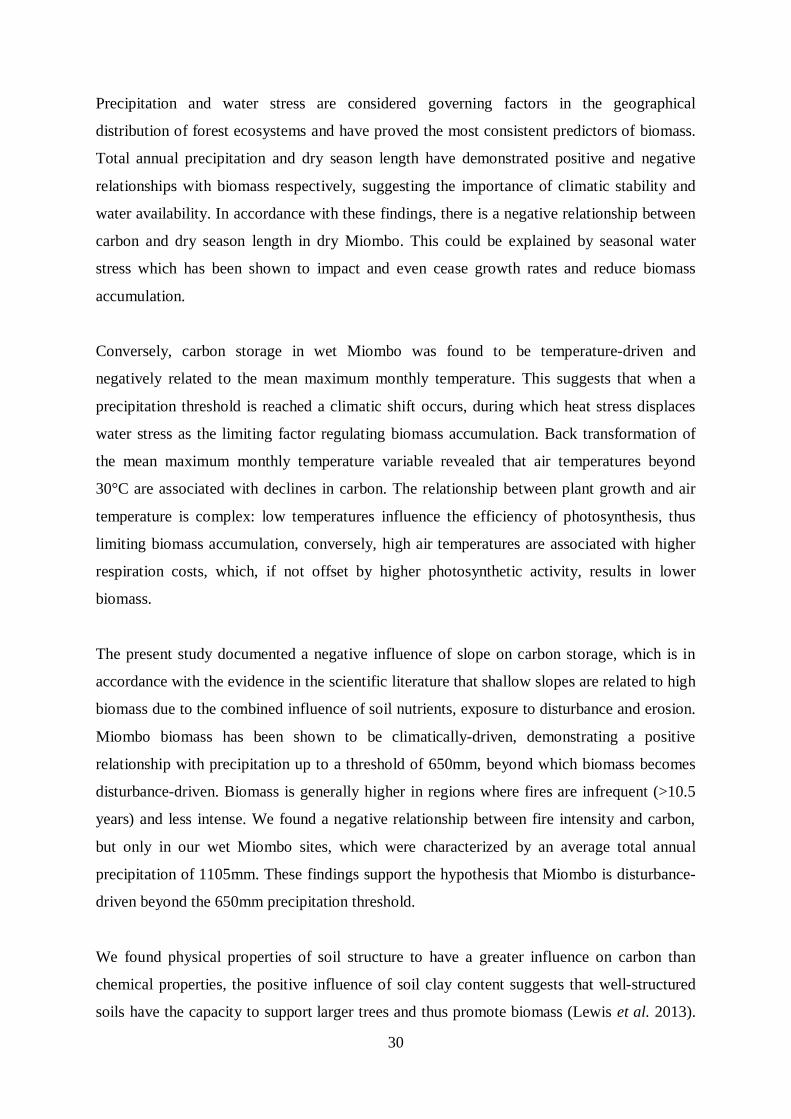
Precipitation and water stress are considered governing factors in the geographical
distribution of forest ecosystems and have proved the most consistent predictors of biomass.
Total annual precipitation and dry season length have demonstrated positive and negative
relationships with biomass respectively, suggesting the importance of climatic stability and
water availability. In accordance with these findings, there is a negative relationship between
carbon and dry season length in dry Miombo. This could be explained by seasonal water
stress which has been shown to impact and even cease growth rates and reduce biomass
accumulation.
Conversely, carbon storage in wet Miombo was found to be temperature-driven and
negatively related to the mean maximum monthly temperature. This suggests that when a
precipitation threshold is reached a climatic shift occurs, during which heat stress displaces
water stress as the limiting factor regulating biomass accumulation. Back transformation of
the mean maximum monthly temperature variable revealed that air temperatures beyond
30°C are associated with declines in carbon. The relationship between plant growth and air
temperature is complex: low temperatures influence the efficiency of photosynthesis, thus
limiting biomass accumulation, conversely, high air temperatures are associated with higher
respiration costs, which, if not offset by higher photosynthetic activity, results in lower
biomass.
The present study documented a negative influence of slope on carbon storage, which is in
accordance with the evidence in the scientific literature that shallow slopes are related to high
biomass due to the combined influence of soil nutrients, exposure to disturbance and erosion.
Miombo biomass has been shown to be climatically-driven, demonstrating a positive
relationship with precipitation up to a threshold of 650mm, beyond which biomass becomes
disturbance-driven. Biomass is generally higher in regions where fires are infrequent (>10.5
years) and less intense. We found a negative relationship between fire intensity and carbon,
but only in our wet Miombo sites, which were characterized by an average total annual
precipitation of 1105mm. These findings support the hypothesis that Miombo is disturbance-
driven beyond the 650mm precipitation threshold.
We found physical properties of soil structure to have a greater influence on carbon than
chemical properties, the positive influence of soil clay content suggests that well-structured
soils have the capacity to support larger trees and thus promote biomass (Lewis et al. 2013).
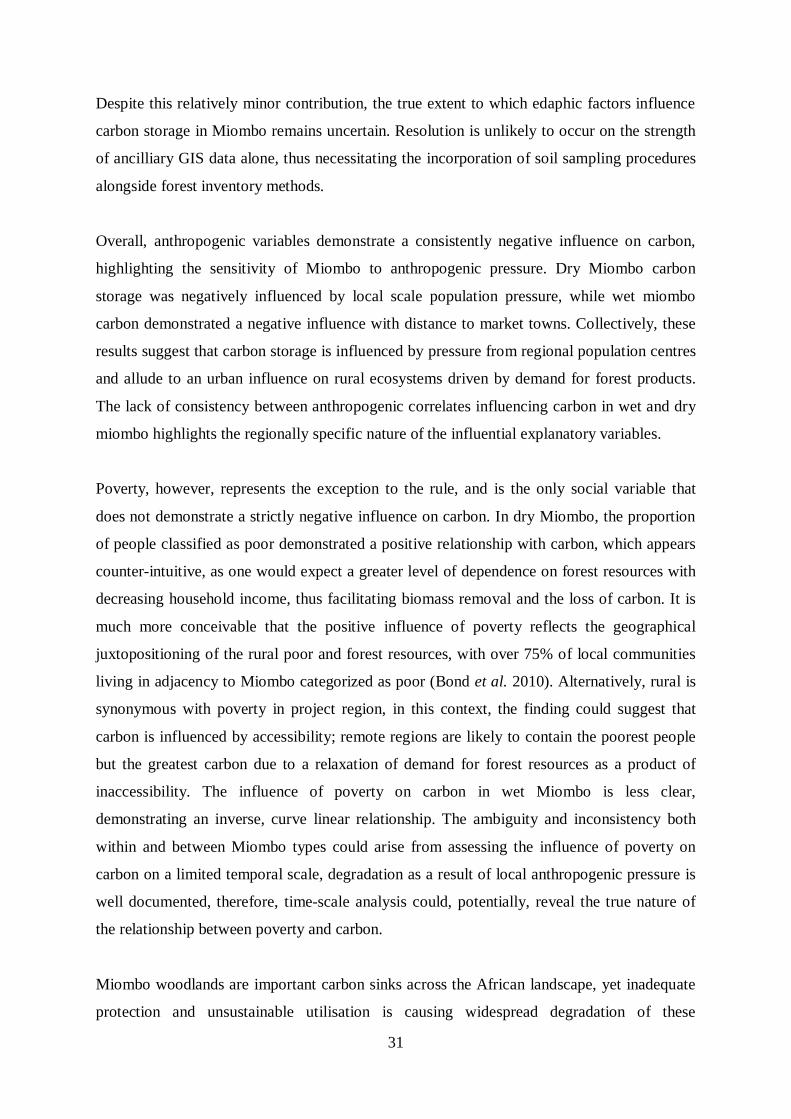
31
Despite this relatively minor contribution, the true extent to which edaphic factors influence
carbon storage in Miombo remains uncertain. Resolution is unlikely to occur on the strength
of ancilliary GIS data alone, thus necessitating the incorporation of soil sampling procedures
alongside forest inventory methods.
Overall, anthropogenic variables demonstrate a consistently negative influence on carbon,
highlighting the sensitivity of Miombo to anthropogenic pressure. Dry Miombo carbon
storage was negatively influenced by local scale population pressure, while wet miombo
carbon demonstrated a negative influence with distance to market towns. Collectively, these
results suggest that carbon storage is influenced by pressure from regional population centres
and allude to an urban influence on rural ecosystems driven by demand for forest products.
The lack of consistency between anthropogenic correlates influencing carbon in wet and dry
miombo highlights the regionally specific nature of the influential explanatory variables.
Poverty, however, represents the exception to the rule, and is the only social variable that
does not demonstrate a strictly negative influence on carbon. In dry Miombo, the proportion
of people classified as poor demonstrated a positive relationship with carbon, which appears
counter-intuitive, as one would expect a greater level of dependence on forest resources with
decreasing household income, thus facilitating biomass removal and the loss of carbon. It is
much more conceivable that the positive influence of poverty reflects the geographical
juxtopositioning of the rural poor and forest resources, with over 75% of local communities
living in adjacency to Miombo categorized as poor (Bond et al. 2010). Alternatively, rural is
synonymous with poverty in project region, in this context, the finding could suggest that
carbon is influenced by accessibility; remote regions are likely to contain the poorest people
but the greatest carbon due to a relaxation of demand for forest resources as a product of
inaccessibility. The influence of poverty on carbon in wet Miombo is less clear,
demonstrating an inverse, curve linear relationship. The ambiguity and inconsistency both
within and between Miombo types could arise from assessing the influence of poverty on
carbon on a limited temporal scale, degradation as a result of local anthropogenic pressure is
well documented, therefore, time-scale analysis could, potentially, reveal the true nature of
the relationship between poverty and carbon.
Miombo woodlands are important carbon sinks across the African landscape, yet inadequate
protection and unsustainable utilisation is causing widespread degradation of these
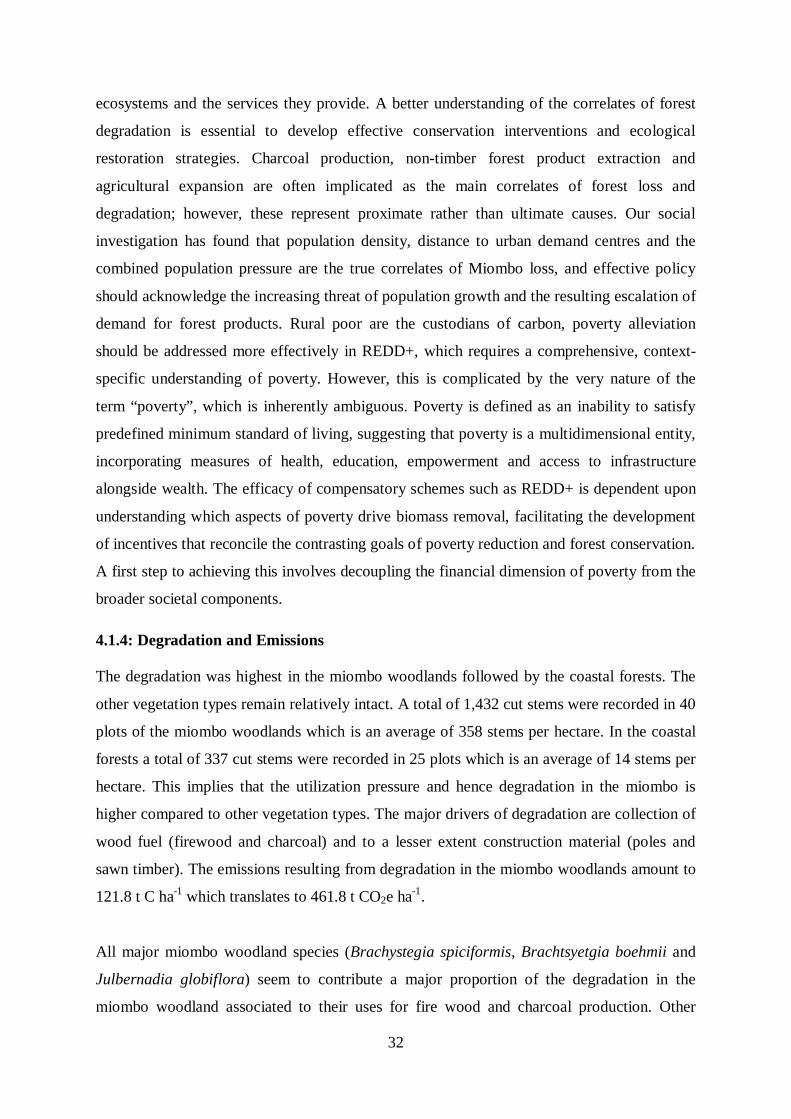
32
ecosystems and the services they provide. A better understanding of the correlates of forest
degradation is essential to develop effective conservation interventions and ecological
restoration strategies. Charcoal production, non-timber forest product extraction and
agricultural expansion are often implicated as the main correlates of forest loss and
degradation; however, these represent proximate rather than ultimate causes. Our social
investigation has found that population density, distance to urban demand centres and the
combined population pressure are the true correlates of Miombo loss, and effective policy
should acknowledge the increasing threat of population growth and the resulting escalation of
demand for forest products. Rural poor are the custodians of carbon, poverty alleviation
should be addressed more effectively in REDD+, which requires a comprehensive, context-
specific understanding of poverty. However, this is complicated by the very nature of the
term “poverty”, which is inherently ambiguous. Poverty is defined as an inability to satisfy
predefined minimum standard of living, suggesting that poverty is a multidimensional entity,
incorporating measures of health, education, empowerment and access to infrastructure
alongside wealth. The efficacy of compensatory schemes such as REDD+ is dependent upon
understanding which aspects of poverty drive biomass removal, facilitating the development
of incentives that reconcile the contrasting goals of poverty reduction and forest conservation.
A first step to achieving this involves decoupling the financial dimension of poverty from the
broader societal components.
4.1.4: Degradation and Emissions
The degradation was highest in the miombo woodlands followed by the coastal forests. The
other vegetation types remain relatively intact. A total of 1,432 cut stems were recorded in 40
plots of the miombo woodlands which is an average of 358 stems per hectare. In the coastal
forests a total of 337 cut stems were recorded in 25 plots which is an average of 14 stems per
hectare. This implies that the utilization pressure and hence degradation in the miombo is
higher compared to other vegetation types. The major drivers of degradation are collection of
wood fuel (firewood and charcoal) and to a lesser extent construction material (poles and
sawn timber). The emissions resulting from degradation in the miombo woodlands amount to
121.8 t C ha-1 which translates to 461.8 t CO2e ha-1.
All major miombo woodland species (Brachystegia spiciformis, Brachtsyetgia boehmii and
Julbernadia globiflora) seem to contribute a major proportion of the degradation in the
miombo woodland associated to their uses for fire wood and charcoal production. Other
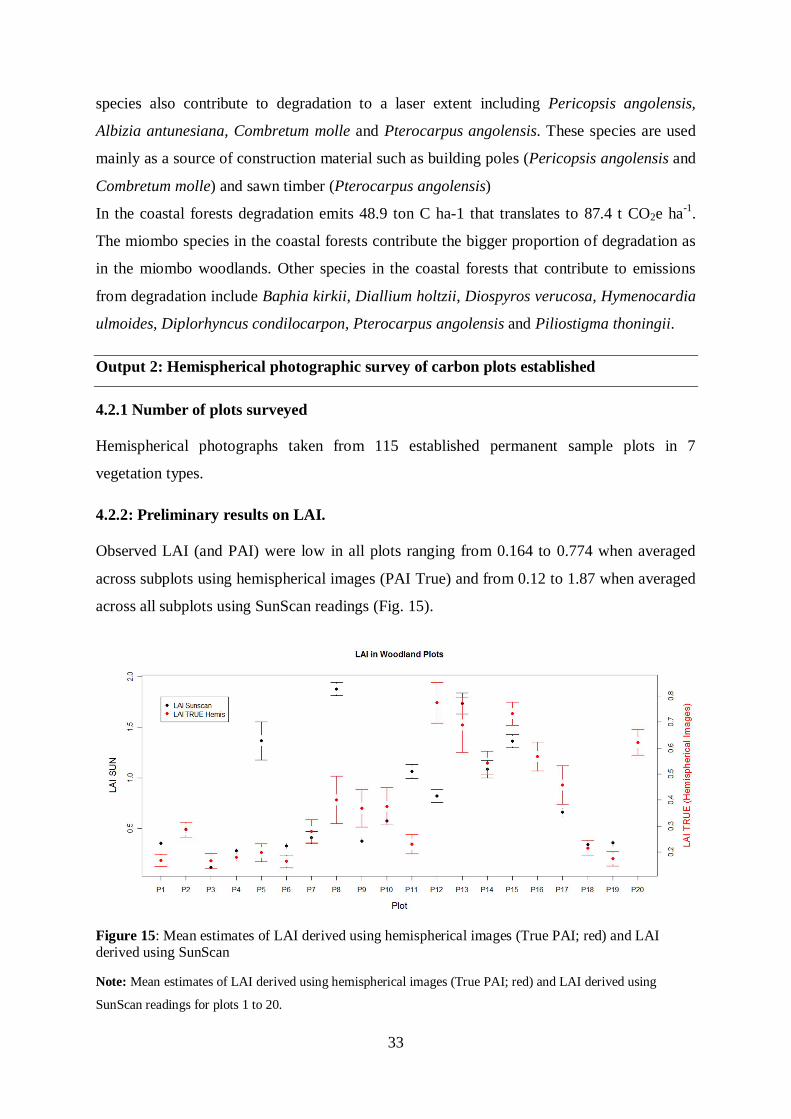
33
species also contribute to degradation to a laser extent including Pericopsis angolensis,
Albizia antunesiana, Combretum molle and Pterocarpus angolensis. These species are used
mainly as a source of construction material such as building poles (Pericopsis angolensis and
Combretum molle) and sawn timber (Pterocarpus angolensis)
In the coastal forests degradation emits 48.9 ton C ha-1 that translates to 87.4 t CO2e ha-1.
The miombo species in the coastal forests contribute the bigger proportion of degradation as
in the miombo woodlands. Other species in the coastal forests that contribute to emissions
from degradation include Baphia kirkii, Diallium holtzii, Diospyros verucosa, Hymenocardia
ulmoides, Diplorhyncus condilocarpon, Pterocarpus angolensis and Piliostigma thoningii.
Output 2: Hemispherical photographic survey of carbon plots established
4.2.1 Number of plots surveyed
Hemispherical photographs taken from 115 established permanent sample plots in 7
vegetation types.
4.2.2: Preliminary results on LAI.
Observed LAI (and PAI) were low in all plots ranging from 0.164 to 0.774 when averaged
across subplots using hemispherical images (PAI True) and from 0.12 to 1.87 when averaged
across all subplots using SunScan readings (Fig. 15).
Figure 15: Mean estimates of LAI derived using hemispherical images (True PAI; red) and LAI derived using SunScan
Note: Mean estimates of LAI derived using hemispherical images (True PAI; red) and LAI derived using
SunScan readings for plots 1 to 20.
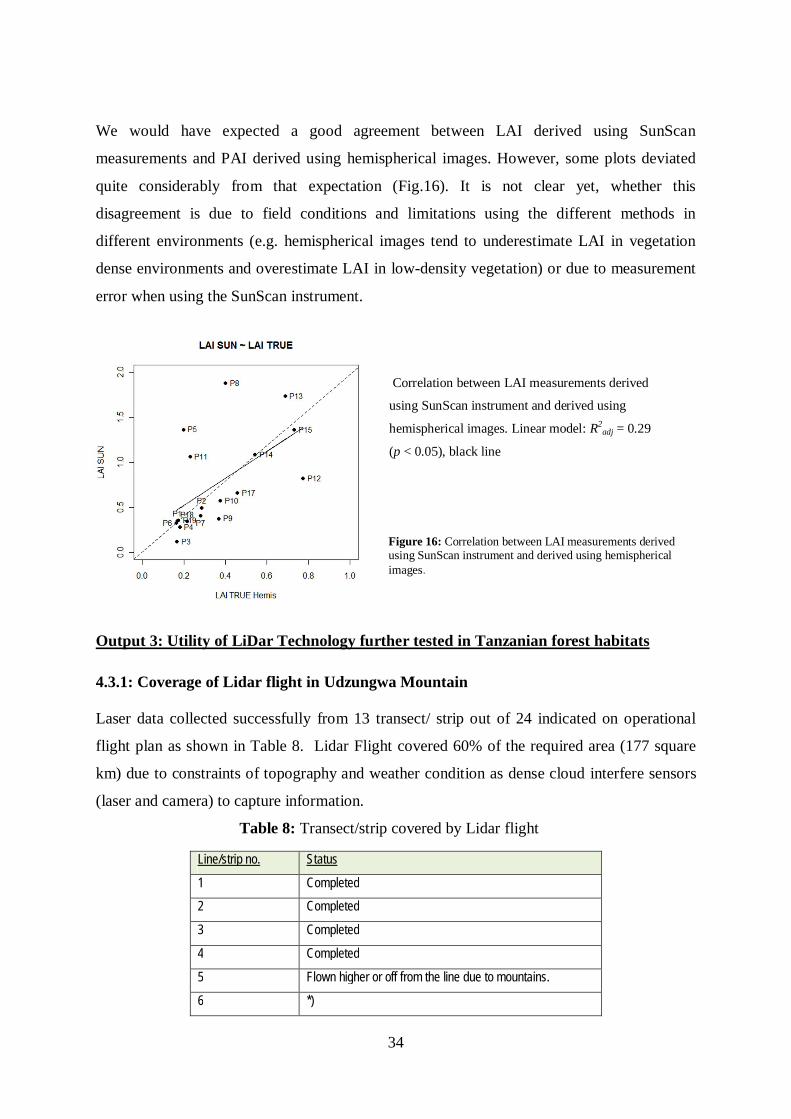
34
We would have expected a good agreement between LAI derived using SunScan
measurements and PAI derived using hemispherical images. However, some plots deviated
quite considerably from that expectation (Fig.16). It is not clear yet, whether this
disagreement is due to field conditions and limitations using the different methods in
different environments (e.g. hemispherical images tend to underestimate LAI in vegetation
dense environments and overestimate LAI in low-density vegetation) or due to measurement
error when using the SunScan instrument.
Figure 16: Correlation between LAI measurements derived using SunScan instrument and derived using hemispherical images.
Output 3: Utility of LiDar Technology further tested in Tanzanian forest habitats
4.3.1: Coverage of Lidar flight in Udzungwa Mountain Laser data collected successfully from 13 transect/ strip out of 24 indicated on operational
flight plan as shown in Table 8. Lidar Flight covered 60% of the required area (177 square
km) due to constraints of topography and weather condition as dense cloud interfere sensors
(laser and camera) to capture information.
Table 8: Transect/strip covered by Lidar flight
Line/strip no. Status
1 Completed 2 Completed
3 Completed
4 Completed
5 Flown higher or off from the line due to mountains.
6 *)
Correlation between LAI measurements derived
using SunScan instrument and derived using
hemispherical images. Linear model: R2adj = 0.29
(p < 0.05), black line
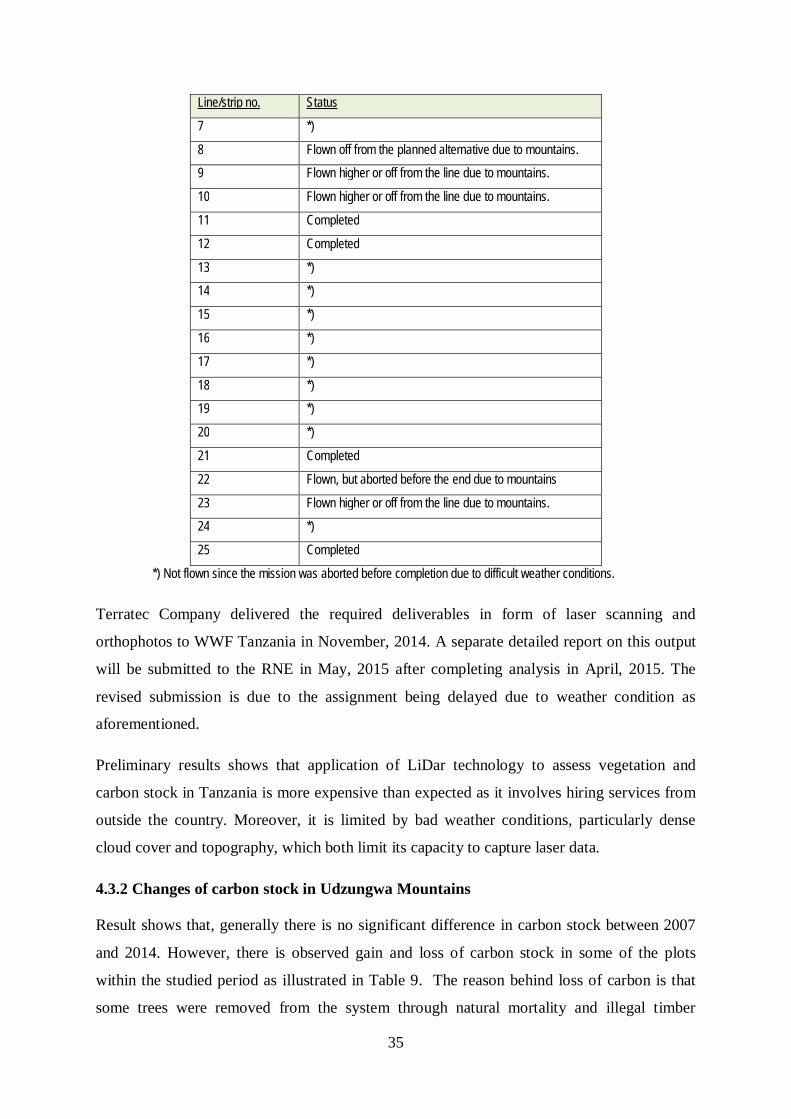
35
Line/strip no. Status
7 *)
8 Flown off from the planned alternative due to mountains. 9 Flown higher or off from the line due to mountains.
10 Flown higher or off from the line due to mountains.
11 Completed
12 Completed
13 *) 14 *)
15 *)
16 *)
17 *)
18 *) 19 *)
20 *)
21 Completed
22 Flown, but aborted before the end due to mountains
23 Flown higher or off from the line due to mountains. 24 *)
25 Completed
*) Not flown since the mission was aborted before completion due to difficult weather conditions.
Terratec Company delivered the required deliverables in form of laser scanning and
orthophotos to WWF Tanzania in November, 2014. A separate detailed report on this output
will be submitted to the RNE in May, 2015 after completing analysis in April, 2015. The
revised submission is due to the assignment being delayed due to weather condition as
aforementioned.
Preliminary results shows that application of LiDar technology to assess vegetation and
carbon stock in Tanzania is more expensive than expected as it involves hiring services from
outside the country. Moreover, it is limited by bad weather conditions, particularly dense
cloud cover and topography, which both limit its capacity to capture laser data.
4.3.2 Changes of carbon stock in Udzungwa Mountains
Result shows that, generally there is no significant difference in carbon stock between 2007
and 2014. However, there is observed gain and loss of carbon stock in some of the plots
within the studied period as illustrated in Table 9. The reason behind loss of carbon is that
some trees were removed from the system through natural mortality and illegal timber
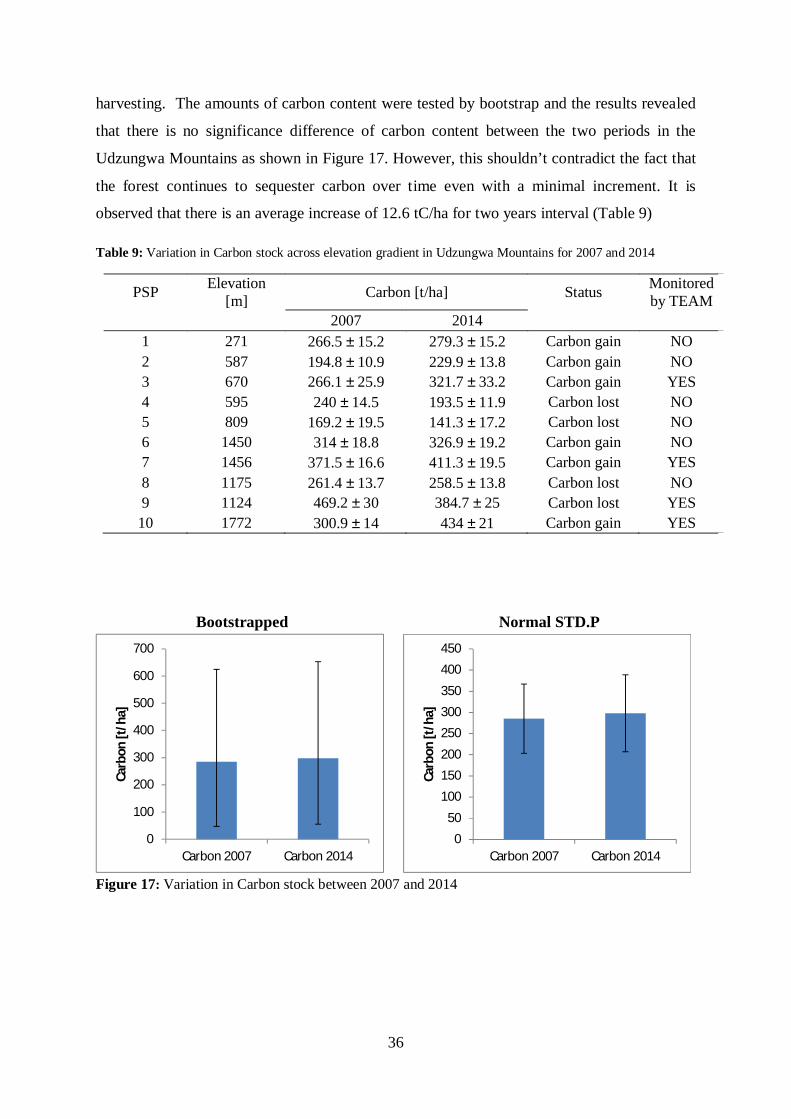
36
harvesting. The amounts of carbon content were tested by bootstrap and the results revealed
that there is no significance difference of carbon content between the two periods in the
Udzungwa Mountains as shown in Figure 17. However, this shouldn’t contradict the fact that
the forest continues to sequester carbon over time even with a minimal increment. It is
observed that there is an average increase of 12.6 tC/ha for two years interval (Table 9)
Table 9: Variation in Carbon stock across elevation gradient in Udzungwa Mountains for 2007 and 2014
Bootstrapped Normal STD.P
Figure 17: Variation in Carbon stock between 2007 and 2014
PSP Elevation [m] Carbon [t/ha] Status Monitored
by TEAM
2007 2014 1 271 266.5 ± 15.2 279.3 ± 15.2 Carbon gain NO 2 587 194.8 ± 10.9 229.9 ± 13.8 Carbon gain NO 3 670 266.1 ± 25.9 321.7 ± 33.2 Carbon gain YES 4 595 240 ± 14.5 193.5 ± 11.9 Carbon lost NO 5 809 169.2 ± 19.5 141.3 ± 17.2 Carbon lost NO 6 1450 314 ± 18.8 326.9 ± 19.2 Carbon gain NO 7 1456 371.5 ± 16.6 411.3 ± 19.5 Carbon gain YES 8 1175 261.4 ± 13.7 258.5 ± 13.8 Carbon lost NO 9 1124 469.2 ± 30 384.7 ± 25 Carbon lost YES 10 1772 300.9 ± 14 434 ± 21 Carbon gain YES
0
100
200
300
400
500
600
700
Carbon 2007 Carbon 2014
Carb
on [t
/ha]
0
50
100
150
200
250
300
350
400
450
Carbon 2007 Carbon 2014
Carb
on [t
/ha]

37
Output 4: Soil carbon surveyed across Tanzanian vegetation types
Results from soil analysis are crucial inputs for mapping Soil Organic Carbon (SOC) and
finally producing the National Soil Carbon Map. It was found that upland grassland,
mangroves, montane forest and savannah contain higher amount of soil organic carbon than
other vegetation types as illustrated in Table 6. Moreover it was observed that least soil
organic carbon is found in thickets followed with lowland forest and Acacia commiphora.
This variation could be attributed to variability in local environment factors such as soil
nutrient dynamics and rainfall pattern as well as severity of disturbances. Also temperatures
in upland ecosystems on mountains are low, resulting in low decomposition rate of organic
matter, hence accumulation of soil organic carbon in high mountain ecosystem provide more
soil carbon compared to adjacent ecosystems on lower altitudes.
Output 5: A range of future scenarios for changes in carbon stock produced
4.5.1: Scenario results
Agriculture, livestock, forestry, energy, mining and infrastructure sectors were identified as
the main sectors affecting land use and cover in every zone. Wildlife and fisheries were also
important in some zones (e.g.: Northern for wildlife and Lake Zone for fisheries).
Agriculture, livestock and biomass energy (reported either under Energy or Forestry sector)
were generally the sectors with strongest effects although it is noted that the sectors’ impacts
varied across regions.
It was found that most sectoral policies under Business As Usual (BAU) are favouring
economic growth at the expense of environmental degradation and consequently increase
carbon emission. However, in Central and Lake Zones, even economic performance of
agriculture and livestock was reported to be undermined by current practices. In fact,
stakeholders envisaged decrease of soil fertility and productivity in these areas which
currently provide a large part of agriculture production. This could trigger an even larger
expansion of farmland.
Under Green economy (GE), stakeholders perceive that there will be improvement of
environment management with less emission from land use conversion because the
environmental agenda will be integrated into development policies to ensure sustainable
development. However, stakeholders envisaged that it would generally not be possible to
have a total reversion of the emission trends and the subsequent increase in carbon storage,.
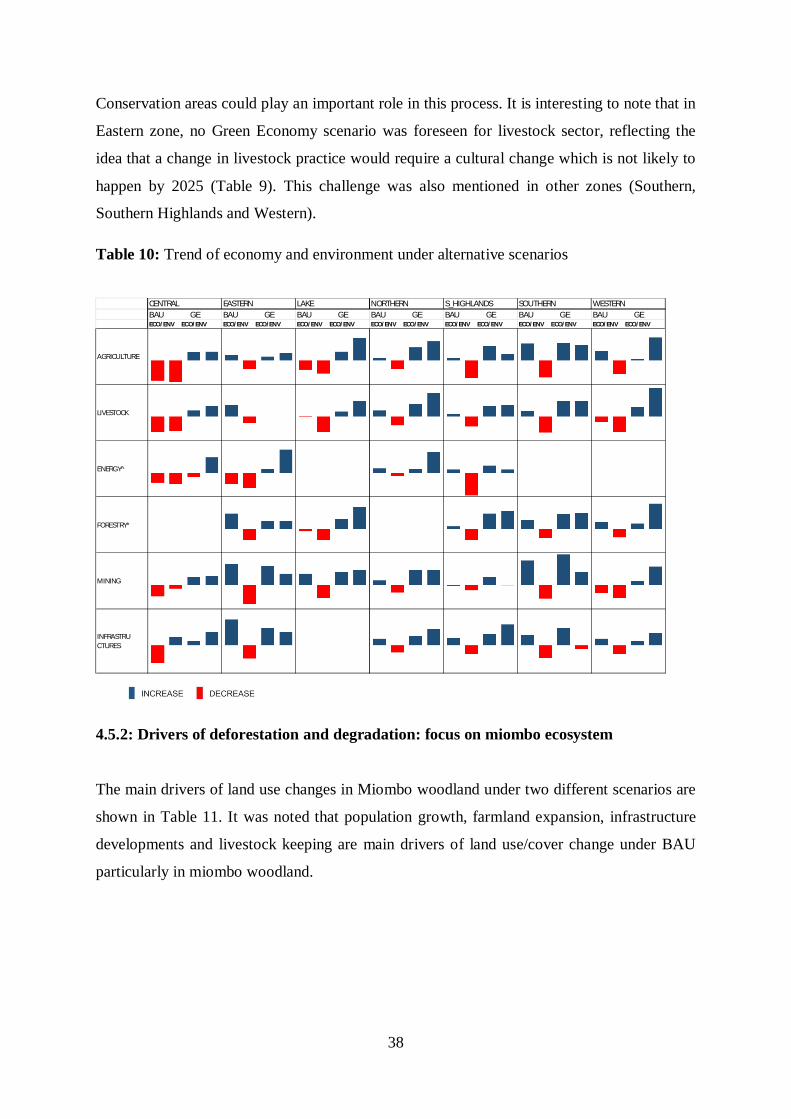
38
Conservation areas could play an important role in this process. It is interesting to note that in
Eastern zone, no Green Economy scenario was foreseen for livestock sector, reflecting the
idea that a change in livestock practice would require a cultural change which is not likely to
happen by 2025 (Table 9). This challenge was also mentioned in other zones (Southern,
Southern Highlands and Western).
Table 10: Trend of economy and environment under alternative scenarios
4.5.2: Drivers of deforestation and degradation: focus on miombo ecosystem
The main drivers of land use changes in Miombo woodland under two different scenarios are
shown in Table 11. It was noted that population growth, farmland expansion, infrastructure
developments and livestock keeping are main drivers of land use/cover change under BAU
particularly in miombo woodland.
CENTRAL EASTERN LAKE NORTHERN S_HIGHLANDS SOUTHERN WESTERNBAU GE BAU GE BAU GE BAU GE BAU GE BAU GE BAU GEECO/ENV ECO/ENV ECO/ENV ECO/ENV ECO/ENV ECO/ENV ECO/ENV ECO/ENV ECO/ENV ECO/ENV ECO/ENV ECO/ENV ECO/ENV ECO/ENV
AGRICULTURE
LIVESTOCK
ENERGY^
FORESTRY*
MINING
INFRASTRU CTURES
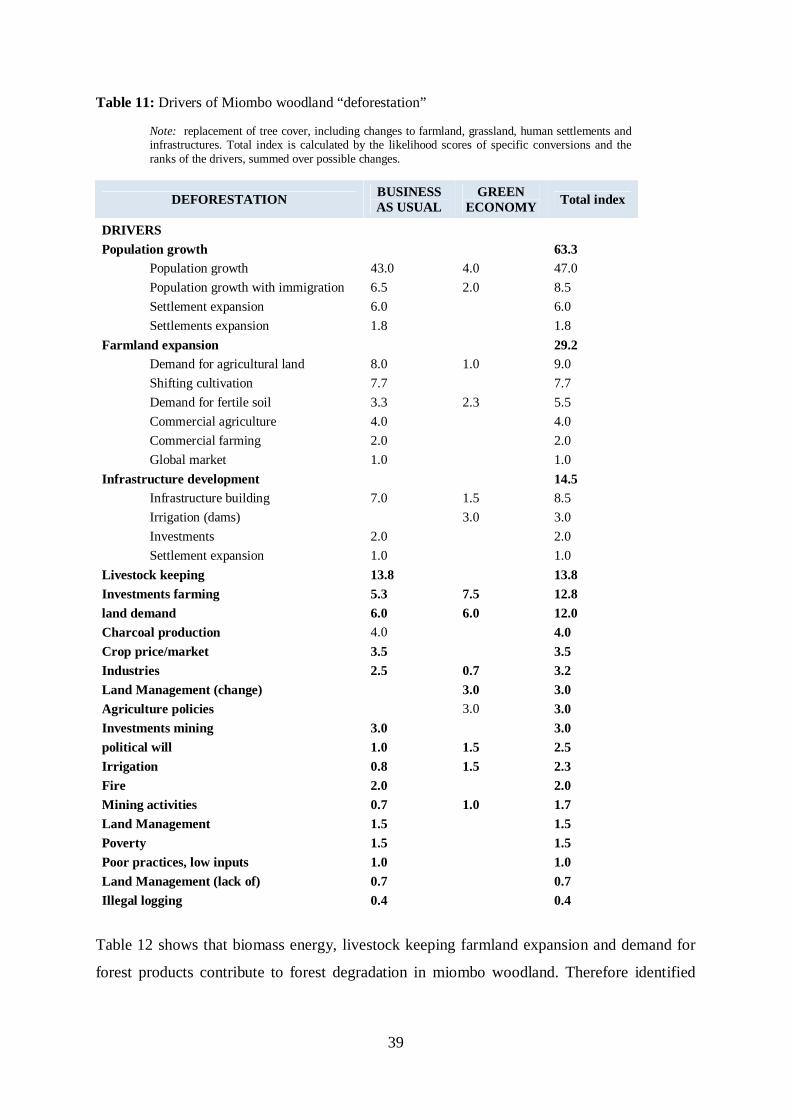
39
Table 11: Drivers of Miombo woodland “deforestation”
Note: replacement of tree cover, including changes to farmland, grassland, human settlements and infrastructures. Total index is calculated by the likelihood scores of specific conversions and the ranks of the drivers, summed over possible changes.
DEFORESTATION BUSINESS AS USUAL
GREEN ECONOMY Total index
DRIVERS Population growth
63.3
Population growth 43.0 4.0 47.0 Population growth with immigration 6.5 2.0 8.5 Settlement expansion 6.0
6.0
Settlements expansion 1.8
1.8 Farmland expansion
29.2
Demand for agricultural land 8.0 1.0 9.0 Shifting cultivation 7.7
7.7
Demand for fertile soil 3.3 2.3 5.5 Commercial agriculture 4.0
4.0
Commercial farming 2.0
2.0 Global market 1.0
1.0
Infrastructure development
14.5 Infrastructure building 7.0 1.5 8.5 Irrigation (dams)
3.0 3.0
Investments 2.0
2.0 Settlement expansion 1.0
1.0
Livestock keeping 13.8
13.8 Investments farming 5.3 7.5 12.8 land demand 6.0 6.0 12.0 Charcoal production 4.0
4.0
Crop price/market 3.5
3.5 Industries 2.5 0.7 3.2 Land Management (change)
3.0 3.0
Agriculture policies
3.0 3.0 Investments mining 3.0
3.0
political will 1.0 1.5 2.5 Irrigation 0.8 1.5 2.3 Fire 2.0
2.0
Mining activities 0.7 1.0 1.7 Land Management 1.5
1.5
Poverty 1.5
1.5 Poor practices, low inputs 1.0
1.0
Land Management (lack of) 0.7
0.7 Illegal logging 0.4
0.4
Table 12 shows that biomass energy, livestock keeping farmland expansion and demand for
forest products contribute to forest degradation in miombo woodland. Therefore identified
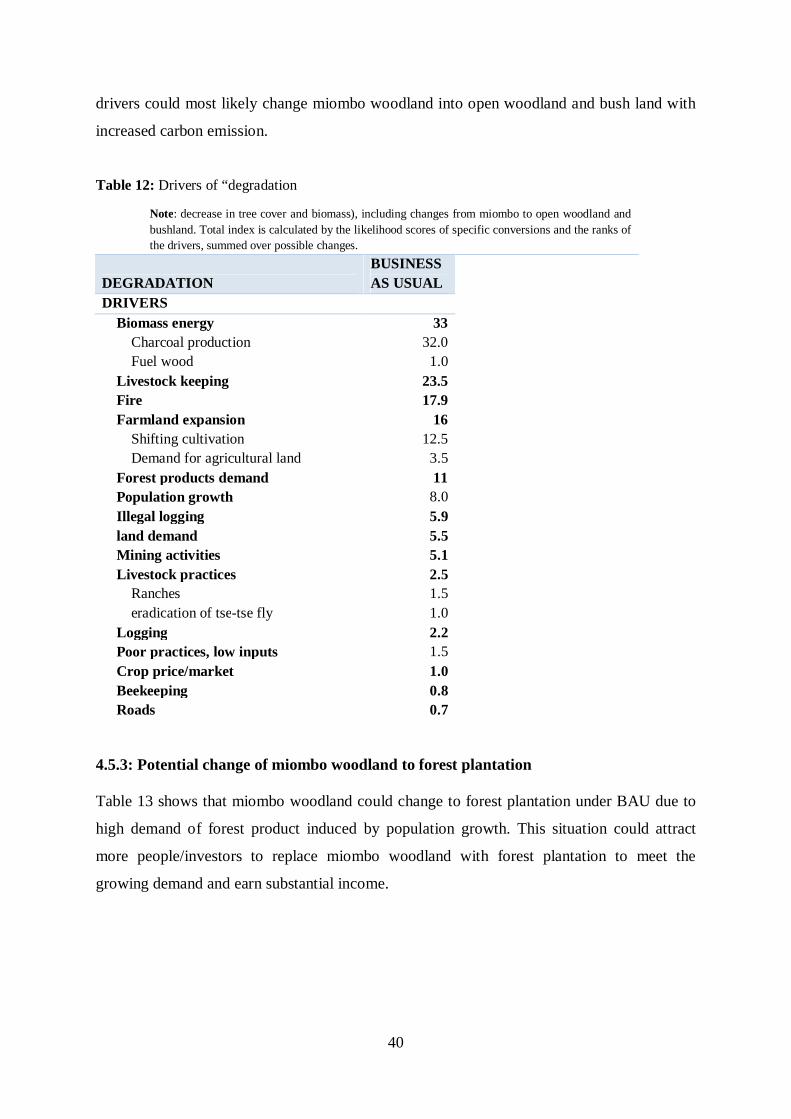
40
drivers could most likely change miombo woodland into open woodland and bush land with
increased carbon emission.
Table 12: Drivers of “degradation
Note: decrease in tree cover and biomass), including changes from miombo to open woodland and bushland. Total index is calculated by the likelihood scores of specific conversions and the ranks of the drivers, summed over possible changes.
DEGRADATION BUSINESS AS USUAL
DRIVERS Biomass energy 33
Charcoal production 32.0 Fuel wood 1.0
Livestock keeping 23.5 Fire 17.9 Farmland expansion 16
Shifting cultivation 12.5 Demand for agricultural land 3.5
Forest products demand 11 Population growth 8.0 Illegal logging 5.9 land demand 5.5 Mining activities 5.1 Livestock practices 2.5
Ranches 1.5 eradication of tse-tse fly 1.0
Logging 2.2 Poor practices, low inputs 1.5 Crop price/market 1.0 Beekeeping 0.8 Roads 0.7
4.5.3: Potential change of miombo woodland to forest plantation
Table 13 shows that miombo woodland could change to forest plantation under BAU due to
high demand of forest product induced by population growth. This situation could attract
more people/investors to replace miombo woodland with forest plantation to meet the
growing demand and earn substantial income.
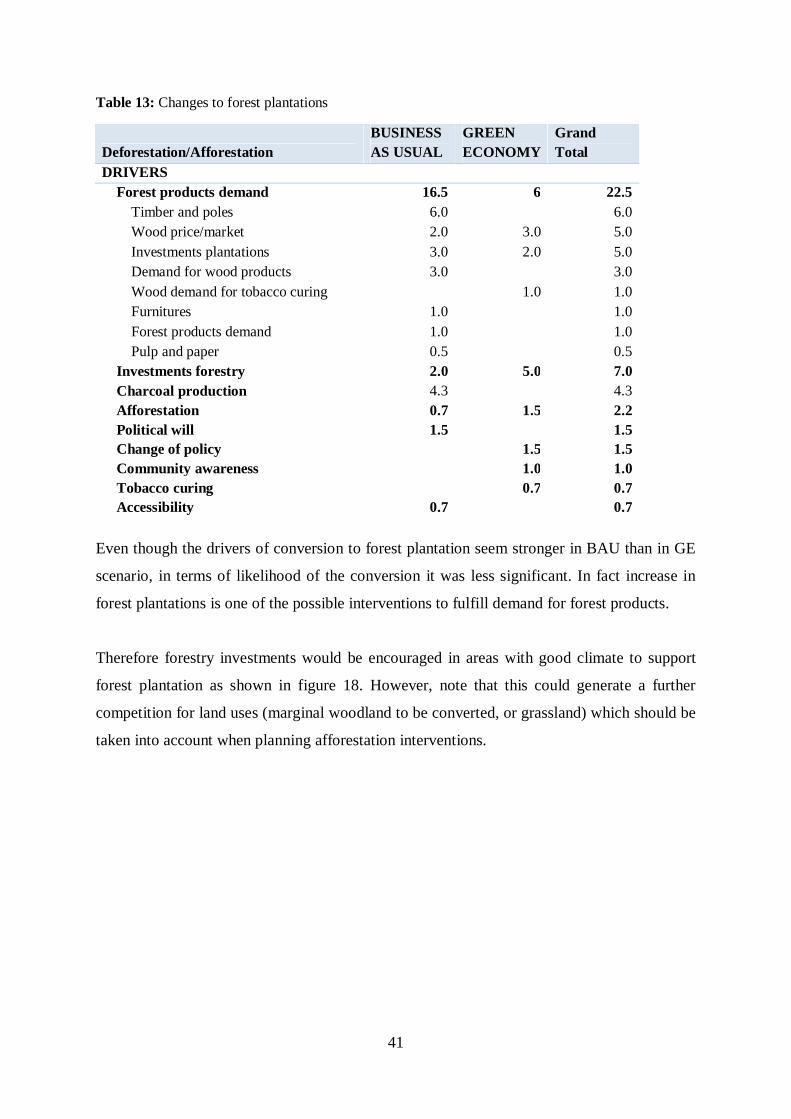
41
Table 13: Changes to forest plantations
Deforestation/Afforestation BUSINESS AS USUAL
GREEN ECONOMY
Grand Total
DRIVERS Forest products demand 16.5 6 22.5
Timber and poles 6.0
6.0 Wood price/market 2.0 3.0 5.0 Investments plantations 3.0 2.0 5.0 Demand for wood products 3.0
3.0
Wood demand for tobacco curing
1.0 1.0 Furnitures 1.0
1.0
Forest products demand 1.0
1.0 Pulp and paper 0.5
0.5
Investments forestry 2.0 5.0 7.0 Charcoal production 4.3
4.3
Afforestation 0.7 1.5 2.2 Political will 1.5
1.5
Change of policy
1.5 1.5 Community awareness
1.0 1.0
Tobacco curing
0.7 0.7 Accessibility 0.7
0.7
Even though the drivers of conversion to forest plantation seem stronger in BAU than in GE
scenario, in terms of likelihood of the conversion it was less significant. In fact increase in
forest plantations is one of the possible interventions to fulfill demand for forest products.
Therefore forestry investments would be encouraged in areas with good climate to support
forest plantation as shown in figure 18. However, note that this could generate a further
competition for land uses (marginal woodland to be converted, or grassland) which should be
taken into account when planning afforestation interventions.
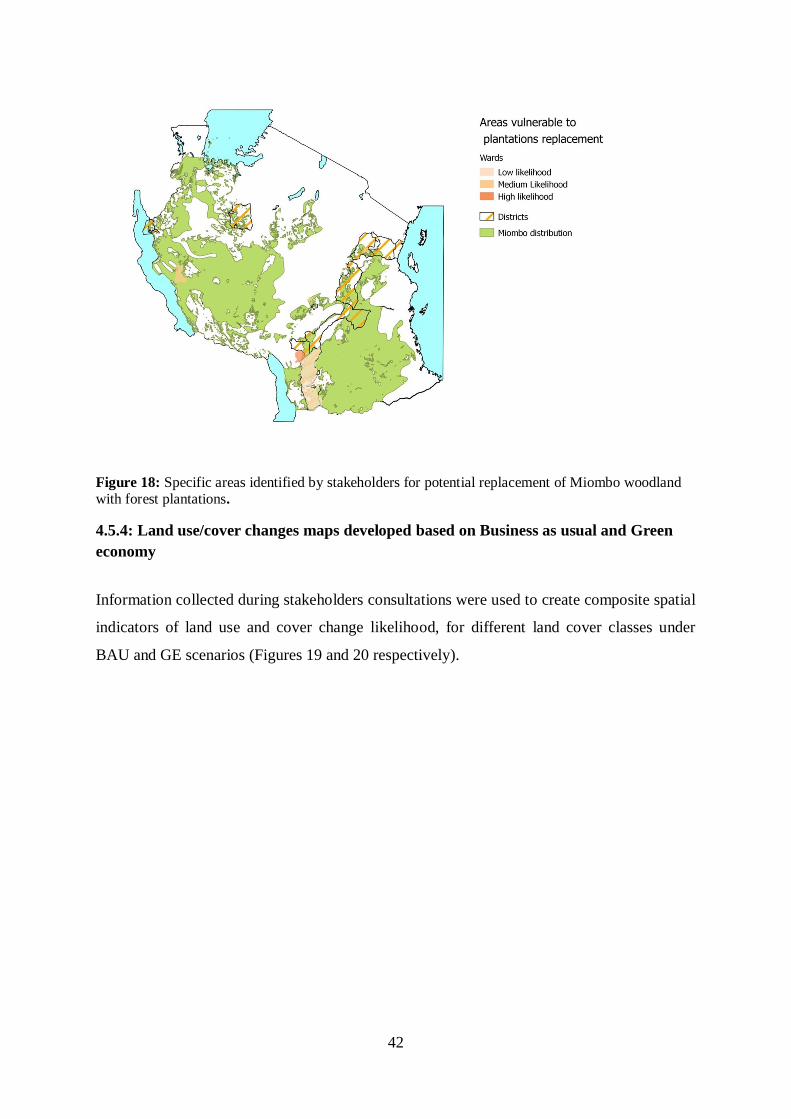
42
Figure 18: Specific areas identified by stakeholders for potential replacement of Miombo woodland with forest plantations.
4.5.4: Land use/cover changes maps developed based on Business as usual and Green economy
Information collected during stakeholders consultations were used to create composite spatial
indicators of land use and cover change likelihood, for different land cover classes under
BAU and GE scenarios (Figures 19 and 20 respectively).
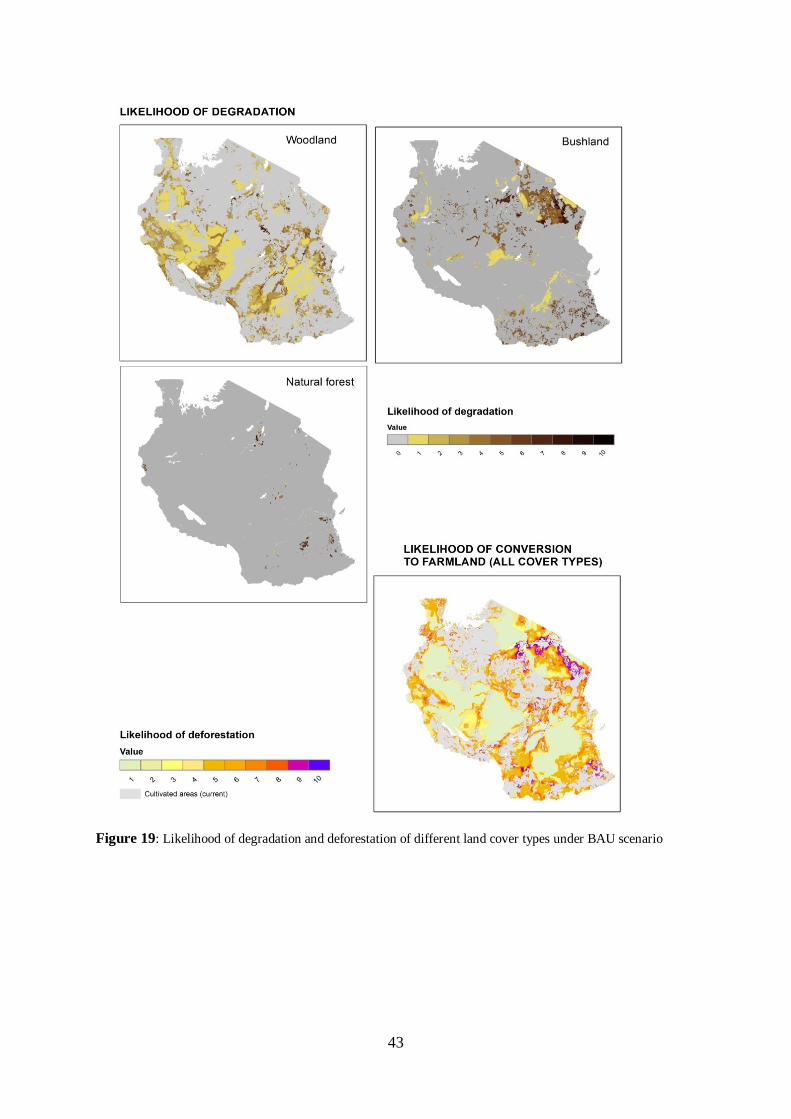
43
Figure 19: Likelihood of degradation and deforestation of different land cover types under BAU scenario
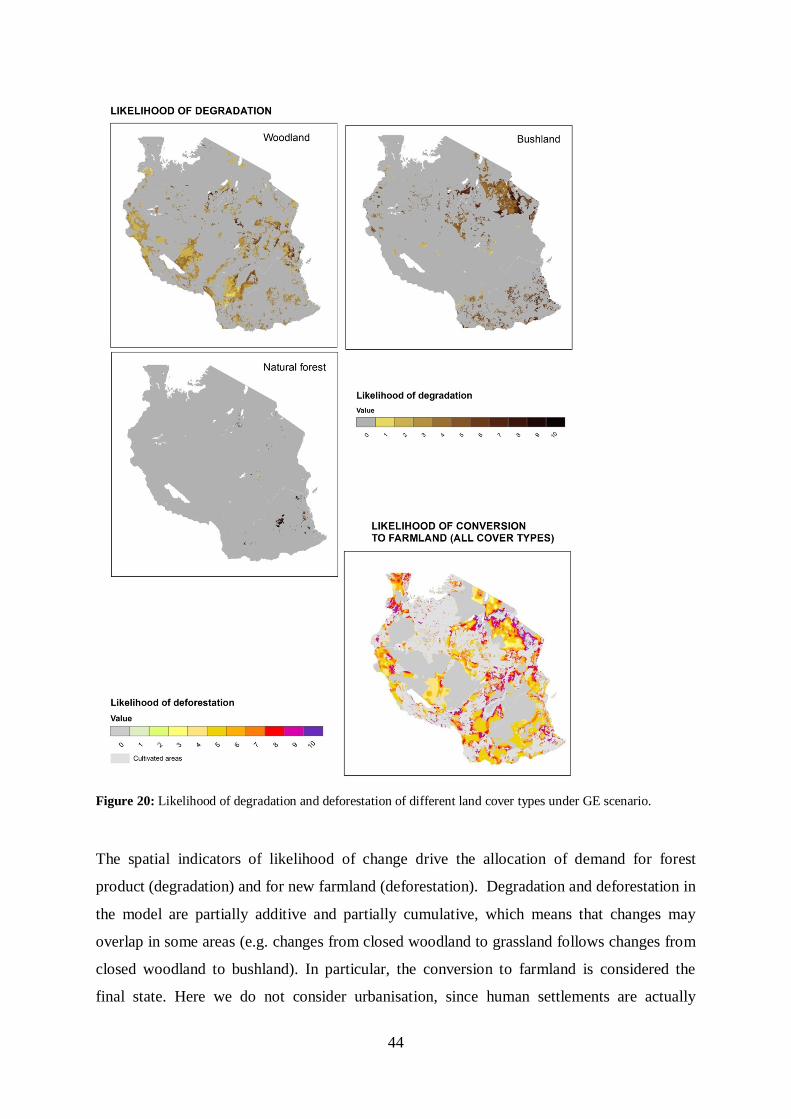
44
Figure 20: Likelihood of degradation and deforestation of different land cover types under GE scenario.
The spatial indicators of likelihood of change drive the allocation of demand for forest
product (degradation) and for new farmland (deforestation). Degradation and deforestation in
the model are partially additive and partially cumulative, which means that changes may
overlap in some areas (e.g. changes from closed woodland to grassland follows changes from
closed woodland to bushland). In particular, the conversion to farmland is considered the
final state. Here we do not consider urbanisation, since human settlements are actually
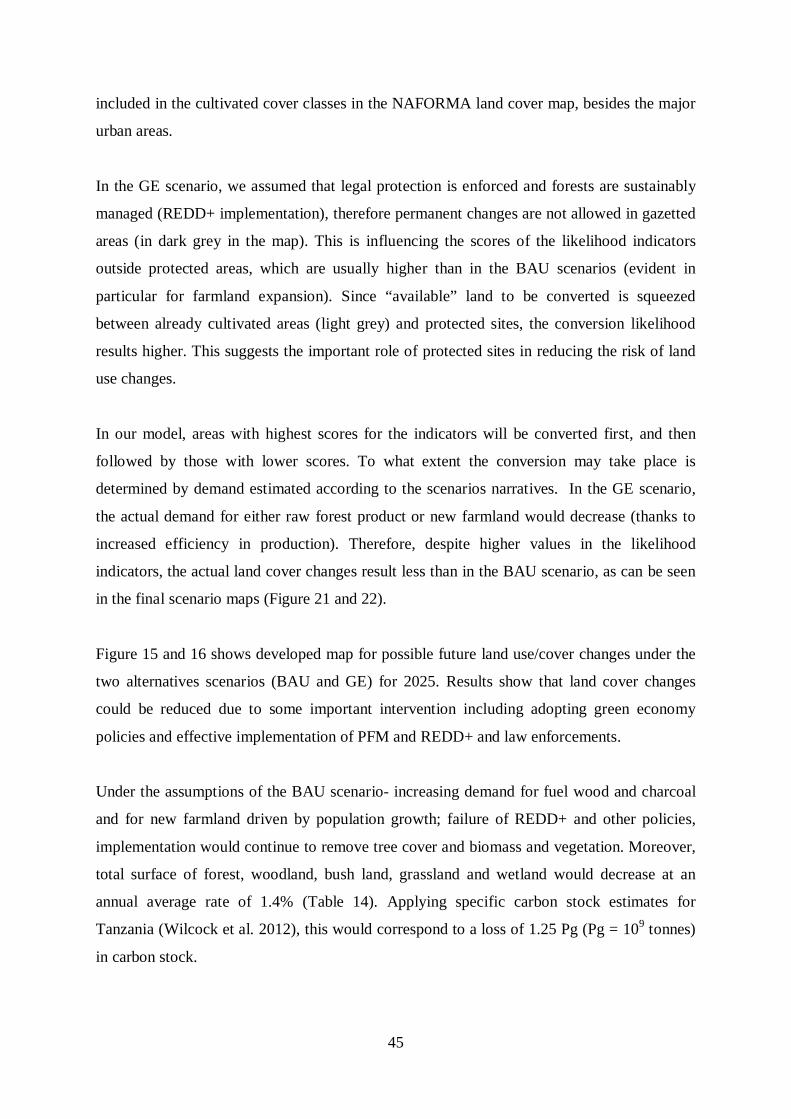
45
included in the cultivated cover classes in the NAFORMA land cover map, besides the major
urban areas.
In the GE scenario, we assumed that legal protection is enforced and forests are sustainably
managed (REDD+ implementation), therefore permanent changes are not allowed in gazetted
areas (in dark grey in the map). This is influencing the scores of the likelihood indicators
outside protected areas, which are usually higher than in the BAU scenarios (evident in
particular for farmland expansion). Since “available” land to be converted is squeezed
between already cultivated areas (light grey) and protected sites, the conversion likelihood
results higher. This suggests the important role of protected sites in reducing the risk of land
use changes.
In our model, areas with highest scores for the indicators will be converted first, and then
followed by those with lower scores. To what extent the conversion may take place is
determined by demand estimated according to the scenarios narratives. In the GE scenario,
the actual demand for either raw forest product or new farmland would decrease (thanks to
increased efficiency in production). Therefore, despite higher values in the likelihood
indicators, the actual land cover changes result less than in the BAU scenario, as can be seen
in the final scenario maps (Figure 21 and 22).
Figure 15 and 16 shows developed map for possible future land use/cover changes under the
two alternatives scenarios (BAU and GE) for 2025. Results show that land cover changes
could be reduced due to some important intervention including adopting green economy
policies and effective implementation of PFM and REDD+ and law enforcements.
Under the assumptions of the BAU scenario- increasing demand for fuel wood and charcoal
and for new farmland driven by population growth; failure of REDD+ and other policies,
implementation would continue to remove tree cover and biomass and vegetation. Moreover,
total surface of forest, woodland, bush land, grassland and wetland would decrease at an
annual average rate of 1.4% (Table 14). Applying specific carbon stock estimates for
Tanzania (Wilcock et al. 2012), this would correspond to a loss of 1.25 Pg (Pg = 109 tonnes)
in carbon stock.
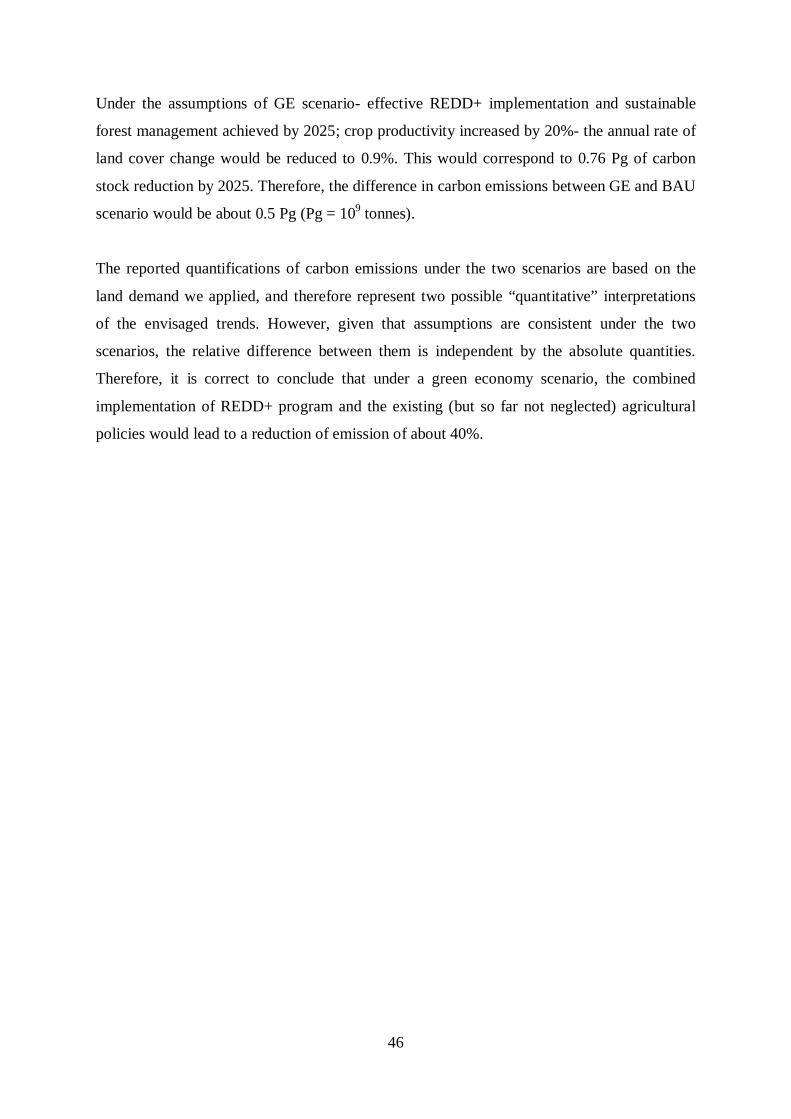
46
Under the assumptions of GE scenario- effective REDD+ implementation and sustainable
forest management achieved by 2025; crop productivity increased by 20%- the annual rate of
land cover change would be reduced to 0.9%. This would correspond to 0.76 Pg of carbon
stock reduction by 2025. Therefore, the difference in carbon emissions between GE and BAU
scenario would be about 0.5 Pg (Pg = 109 tonnes).
The reported quantifications of carbon emissions under the two scenarios are based on the
land demand we applied, and therefore represent two possible “quantitative” interpretations
of the envisaged trends. However, given that assumptions are consistent under the two
scenarios, the relative difference between them is independent by the absolute quantities.
Therefore, it is correct to conclude that under a green economy scenario, the combined
implementation of REDD+ program and the existing (but so far not neglected) agricultural
policies would lead to a reduction of emission of about 40%.
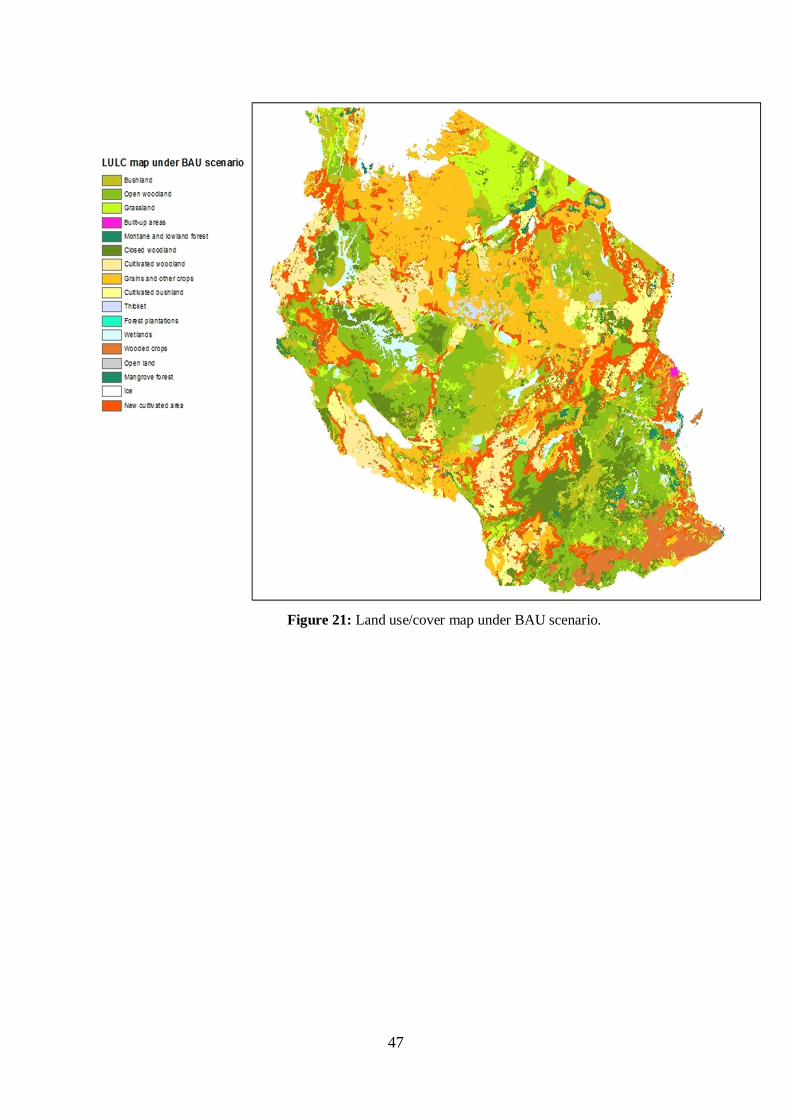
47
Figure 21: Land use/cover map under BAU scenario.
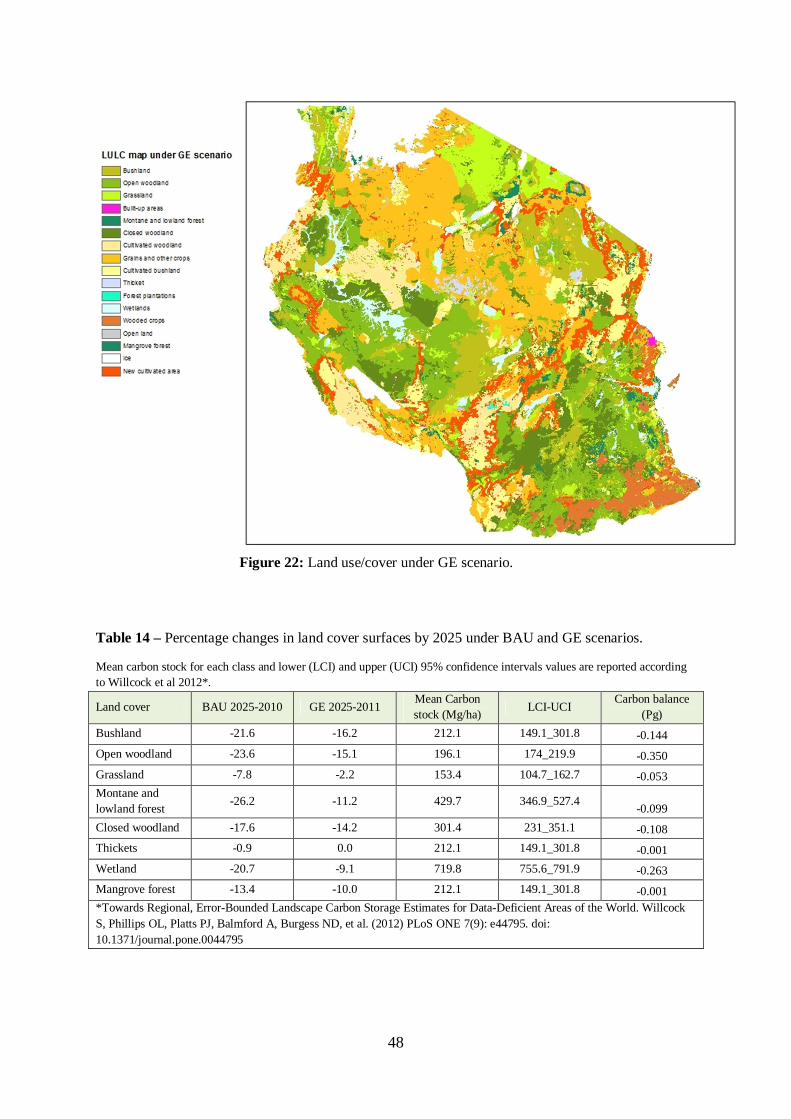
48
Figure 22: Land use/cover under GE scenario.
Table 14 – Percentage changes in land cover surfaces by 2025 under BAU and GE scenarios.
Mean carbon stock for each class and lower (LCI) and upper (UCI) 95% confidence intervals values are reported according to Willcock et al 2012*.
Land cover BAU 2025-2010 GE 2025-2011 Mean Carbon stock (Mg/ha) LCI-UCI
Carbon balance (Pg)
Bushland -21.6 -16.2 212.1 149.1_301.8 -0.144 Open woodland -23.6 -15.1 196.1 174_219.9 -0.350 Grassland -7.8 -2.2 153.4 104.7_162.7 -0.053 Montane and lowland forest -26.2 -11.2 429.7 346.9_527.4 -0.099 Closed woodland -17.6 -14.2 301.4 231_351.1 -0.108 Thickets -0.9 0.0 212.1 149.1_301.8 -0.001 Wetland -20.7 -9.1 719.8 755.6_791.9 -0.263 Mangrove forest -13.4 -10.0 212.1 149.1_301.8 -0.001 *Towards Regional, Error-Bounded Landscape Carbon Storage Estimates for Data-Deficient Areas of the World. Willcock S, Phillips OL, Platts PJ, Balmford A, Burgess ND, et al. (2012) PLoS ONE 7(9): e44795. doi: 10.1371/journal.pone.0044795
49
4.5.5: Environmental and social spatial data to support REDD+ planning and safeguards development
WWF Tanzania through its partner organizations, Sokoine University of Agriculture, IUCN
and UNEP-WCMC, completed a compilation of spatial information on biodiversity,
ecosystem service and social data to fill information gaps on spatial environmental and social
parameters for National REDD+ safeguards, building on work by UN-REDD/NAFORMA in
2013 (Appendix 3). The objective was to identify and meet environmental and social spatial
data needs to support REDD+ planning and safeguards development in Tanzania. Various
maps and statistics were developed to address the existing gap. The final results are presented
in the report Augustino et al. (2014)5.
The report introduces REDD+ in Tanzania and summarizes progress in developing a national
approach to safeguards (section 2), and explains how spatial data is useful for integrating
safeguards and multiple benefits considerations into REDD+ planning and for developing a
Safeguards Information System (SIS) (section 3). It then provides a gap analysis of the spatial
information useful for addressing elements of Tanzania’s REDD+ Safeguards Standards,
outlining how this project can fill some gaps in the spatial data (section 4). In sections 5 and
6, the report presents a set of new maps made available through this project. These cover
social aspects of ‘The Tanzania REDD+ Social and Environmental Safeguard Standards’, as
well as a range of biodiversity, climate change vulnerability and ecosystem services
information. The report then discusses how these maps can inform climate policy and land-
use planning, particularly for REDD+, and for forest restoration. It concludes with policy
recommendations for the development of Tanzania’s future Safeguards Information System.
The maps developed by the project address national priorities for biodiversity and ecosystem
aspects; socio-economic and livelihoods data; forest cover change and how it relates to
priority aspects of biodiversity and ecosystem services; and potential areas for REDD+
activities that would enhance biodiversity and ecosystem services while generating
alternative livelihoods.
5 Augustino, S., Bowles, P., Carr, J., Cox, N., Hicks, C., Mant, R., Mbilinyi, B., Meng, H., Ravilious, C., Runsten, L., Salvaterra, T., Silayo, D., Tognelli, M., Zahabu, E.2014. Environmental and social spatial data to support REDD+ safeguards and planning in Tanzania. SUA, Morogoro, United Republic of Tanzania; UNEP-WCMC, Cambridge, UK; IUCN Global Species Programme, Cambridge UK and Washington DC, USA.
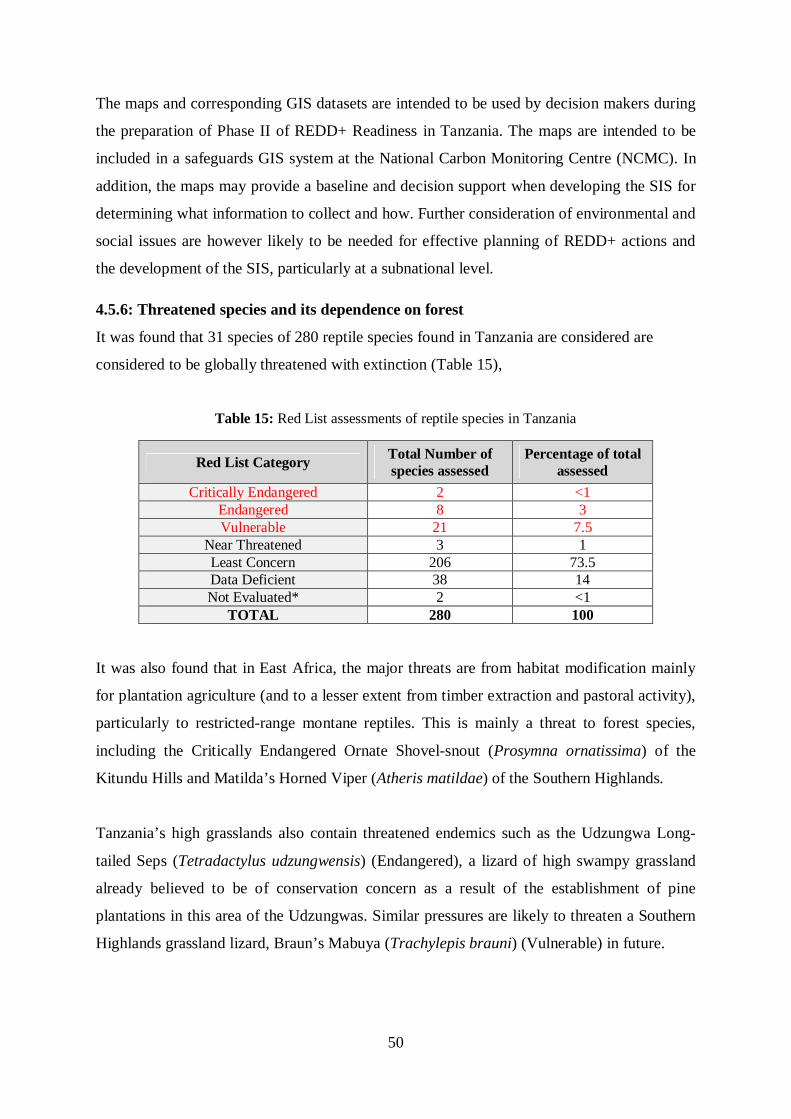
50
The maps and corresponding GIS datasets are intended to be used by decision makers during
the preparation of Phase II of REDD+ Readiness in Tanzania. The maps are intended to be
included in a safeguards GIS system at the National Carbon Monitoring Centre (NCMC). In
addition, the maps may provide a baseline and decision support when developing the SIS for
determining what information to collect and how. Further consideration of environmental and
social issues are however likely to be needed for effective planning of REDD+ actions and
the development of the SIS, particularly at a subnational level.
4.5.6: Threatened species and its dependence on forest
It was found that 31 species of 280 reptile species found in Tanzania are considered are
considered to be globally threatened with extinction (Table 15),
Table 15: Red List assessments of reptile species in Tanzania
Red List Category Total Number of species assessed
Percentage of total assessed
Critically Endangered 2 <1 Endangered 8 3 Vulnerable 21 7.5
Near Threatened 3 1 Least Concern 206 73.5 Data Deficient 38 14 Not Evaluated* 2 <1
TOTAL 280 100 It was also found that in East Africa, the major threats are from habitat modification mainly
for plantation agriculture (and to a lesser extent from timber extraction and pastoral activity),
particularly to restricted-range montane reptiles. This is mainly a threat to forest species,
including the Critically Endangered Ornate Shovel-snout (Prosymna ornatissima) of the
Kitundu Hills and Matilda’s Horned Viper (Atheris matildae) of the Southern Highlands.
Tanzania’s high grasslands also contain threatened endemics such as the Udzungwa Long-
tailed Seps (Tetradactylus udzungwensis) (Endangered), a lizard of high swampy grassland
already believed to be of conservation concern as a result of the establishment of pine
plantations in this area of the Udzungwas. Similar pressures are likely to threaten a Southern
Highlands grassland lizard, Braun’s Mabuya (Trachylepis brauni) (Vulnerable) in future.
51
One species, a skink with no common name (Typhlacontias kataviensis) (Endangered), is
known only from Katavi National Park where it is restricted to sandy ridges along flood
plains, and may be at risk from dam construction in the surrounding landscape.
The international pet trade is a particular threat to some restricted-range species, including
two Tanzanian endemics. The precise distribution of Matilda’s Horned Viper has been
withheld as this species is likely to be attractive to collectors, and as a restricted-range species
already under pressure from deforestation is unlikely to be able to sustain harvest for the pet
trade. The Turquoise Dwarf Gecko (Lygodactylus williamsi) (Critically Endangered), which
was assessed prior to the workshop, is currently collected at unsustainable levels, and like
other threatened Uluguru endemics is also at risk from deforestation.
Appendix 4 shows the concentrations and proportions of threatened reptile species
throughout Tanzania. When considering total numbers of threatened species, one finds the
greatest concentrations (up to 16 species per grid cell) in the regions of Tanga and Morogoro.
Elsewhere, in regions such as Kilimanjaro, Iringa and northern Morogoro, numbers of
threatened reptile species can reach up to eight per grid cell (though more typically three to
five). At other scattered locations throughout the country, one or two threatened species are
present.
In terms of proportions of threatened reptile species, Appendix 4 suggests that the highest
percentages are also found in Tanga and Morogoro, where up to 25% of species are
considered threatened. Locations where 10-20% of reptile species are considered threatened
can be found in Kilimanjaro and Iringa regions, as well as northern Morogoro, while at other
scattered locations throughout the country low proportions (1-5%) of the reptile species
present are considered globally threatened.
Appendix 5 shows the concentrations and proportions of climate change vulnerable reptile
species throughout Tanzania by 2055. When considering total numbers of vulnerable species,
one finds the greatest concentrations (up to 18 species per grid cell) in northern Tanga. In
areas surrounding this, including in much of Kilimanjaro, other parts of Tanga and locations
within Pwani and Dar es Salaam between 10 and 13 climate change vulnerable reptiles per
grid cell can be found. Between four and nine species of climate change vulnerable reptiles
per grid cell can be found along much of northeastern (bordering Kenya) and eastern (coastal
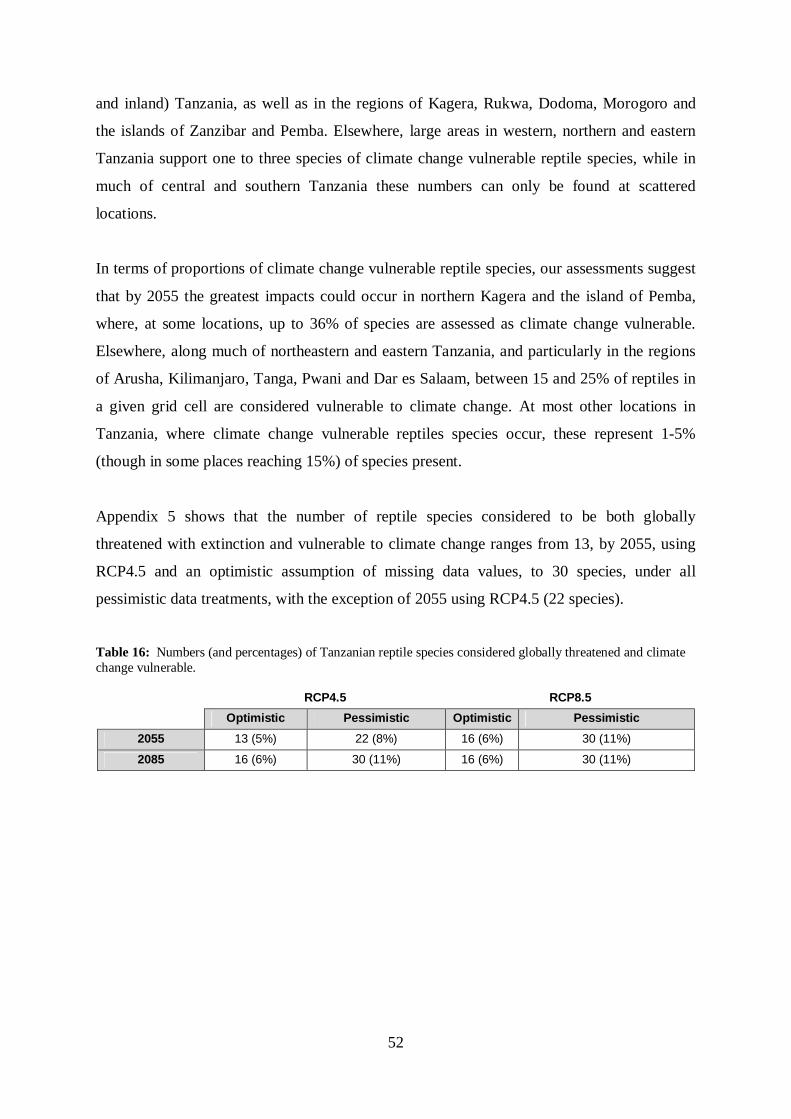
52
and inland) Tanzania, as well as in the regions of Kagera, Rukwa, Dodoma, Morogoro and
the islands of Zanzibar and Pemba. Elsewhere, large areas in western, northern and eastern
Tanzania support one to three species of climate change vulnerable reptile species, while in
much of central and southern Tanzania these numbers can only be found at scattered
locations.
In terms of proportions of climate change vulnerable reptile species, our assessments suggest
that by 2055 the greatest impacts could occur in northern Kagera and the island of Pemba,
where, at some locations, up to 36% of species are assessed as climate change vulnerable.
Elsewhere, along much of northeastern and eastern Tanzania, and particularly in the regions
of Arusha, Kilimanjaro, Tanga, Pwani and Dar es Salaam, between 15 and 25% of reptiles in
a given grid cell are considered vulnerable to climate change. At most other locations in
Tanzania, where climate change vulnerable reptiles species occur, these represent 1-5%
(though in some places reaching 15%) of species present.
Appendix 5 shows that the number of reptile species considered to be both globally
threatened with extinction and vulnerable to climate change ranges from 13, by 2055, using
RCP4.5 and an optimistic assumption of missing data values, to 30 species, under all
pessimistic data treatments, with the exception of 2055 using RCP4.5 (22 species).
Table 16: Numbers (and percentages) of Tanzanian reptile species considered globally threatened and climate change vulnerable.
RCP4.5 RCP8.5
Optimistic Pessimistic Optimistic Pessimistic
2055 13 (5%) 22 (8%) 16 (6%) 30 (11%)
2085 16 (6%) 30 (11%) 16 (6%) 30 (11%)
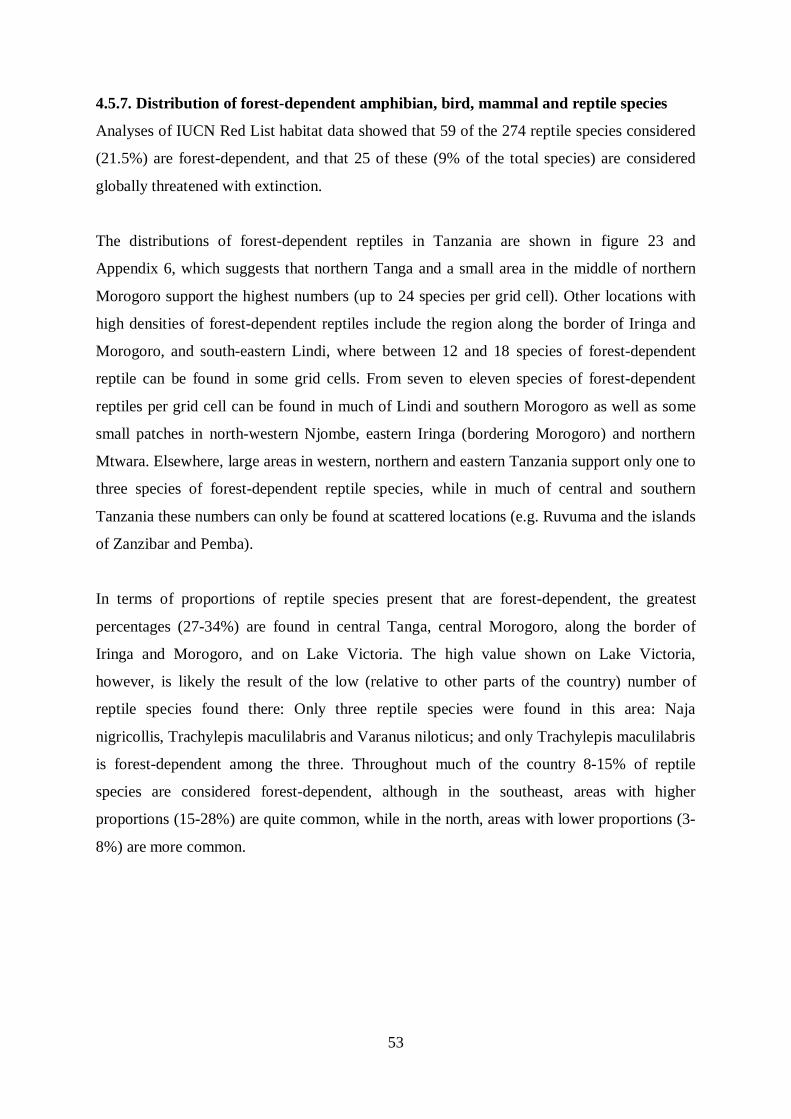
53
4.5.7. Distribution of forest-dependent amphibian, bird, mammal and reptile species
Analyses of IUCN Red List habitat data showed that 59 of the 274 reptile species considered
(21.5%) are forest-dependent, and that 25 of these (9% of the total species) are considered
globally threatened with extinction.
The distributions of forest-dependent reptiles in Tanzania are shown in figure 23 and
Appendix 6, which suggests that northern Tanga and a small area in the middle of northern
Morogoro support the highest numbers (up to 24 species per grid cell). Other locations with
high densities of forest-dependent reptiles include the region along the border of Iringa and
Morogoro, and south-eastern Lindi, where between 12 and 18 species of forest-dependent
reptile can be found in some grid cells. From seven to eleven species of forest-dependent
reptiles per grid cell can be found in much of Lindi and southern Morogoro as well as some
small patches in north-western Njombe, eastern Iringa (bordering Morogoro) and northern
Mtwara. Elsewhere, large areas in western, northern and eastern Tanzania support only one to
three species of forest-dependent reptile species, while in much of central and southern
Tanzania these numbers can only be found at scattered locations (e.g. Ruvuma and the islands
of Zanzibar and Pemba).
In terms of proportions of reptile species present that are forest-dependent, the greatest
percentages (27-34%) are found in central Tanga, central Morogoro, along the border of
Iringa and Morogoro, and on Lake Victoria. The high value shown on Lake Victoria,
however, is likely the result of the low (relative to other parts of the country) number of
reptile species found there: Only three reptile species were found in this area: Naja
nigricollis, Trachylepis maculilabris and Varanus niloticus; and only Trachylepis maculilabris
is forest-dependent among the three. Throughout much of the country 8-15% of reptile
species are considered forest-dependent, although in the southeast, areas with higher
proportions (15-28%) are quite common, while in the north, areas with lower proportions (3-
8%) are more common.
54
Figure 23: Endemic species richness and above ground biomass carbon
55
Figure 23 above show relationship between endemic species and woody biomass carbon
stock. It is clear that different REDD+ actions may have different benefits and risks in
different areas. REDD+ aims to decrease GHG emissions from the forest sector through
the reduction of deforestation and forest degradation and the protection and
enhancement of carbon stocks. The biomass carbon within a particular area affects the
potential emissions from converting that area from forests to another land use. It is observed
that the highest emissions occur where there are highest carbon stock and high level of
conversion. By considering locations where there is congruence between forest carbon
stocks and biodiversity, such analysis can assist in the identification of locations where the
emission reduction objectives of REDD+, as well as multiple benefits for biodiversity
conservation, can be achieved. Areas where both carbon stocks and biodiversity are under
threat are potentially areas where REDD+ implementation can bring the greatest benefits for
both these priorities.
4.5.8. Spatial information relevant to social safeguards to support REDD+ planning
Despite the fact that significant information and spatial data is already available in different
formats such as reports and GIS layers, analysis to establish what spatial information is
relevant to social safeguards to support REDD+ planning in Tanzania is still missing.
Therefore, it was important to do a gap analysis to establish the needful spatial dataset. From
the analysis a number of possible maps to support REDD+ planning in Tanzania were
identified. However, in consideration of time and data availability, only maps listed in Tables
17 were selected for further mapping.
Table 17: Maps to facilitate national level REDD+ social safeguards planning in Tanzania
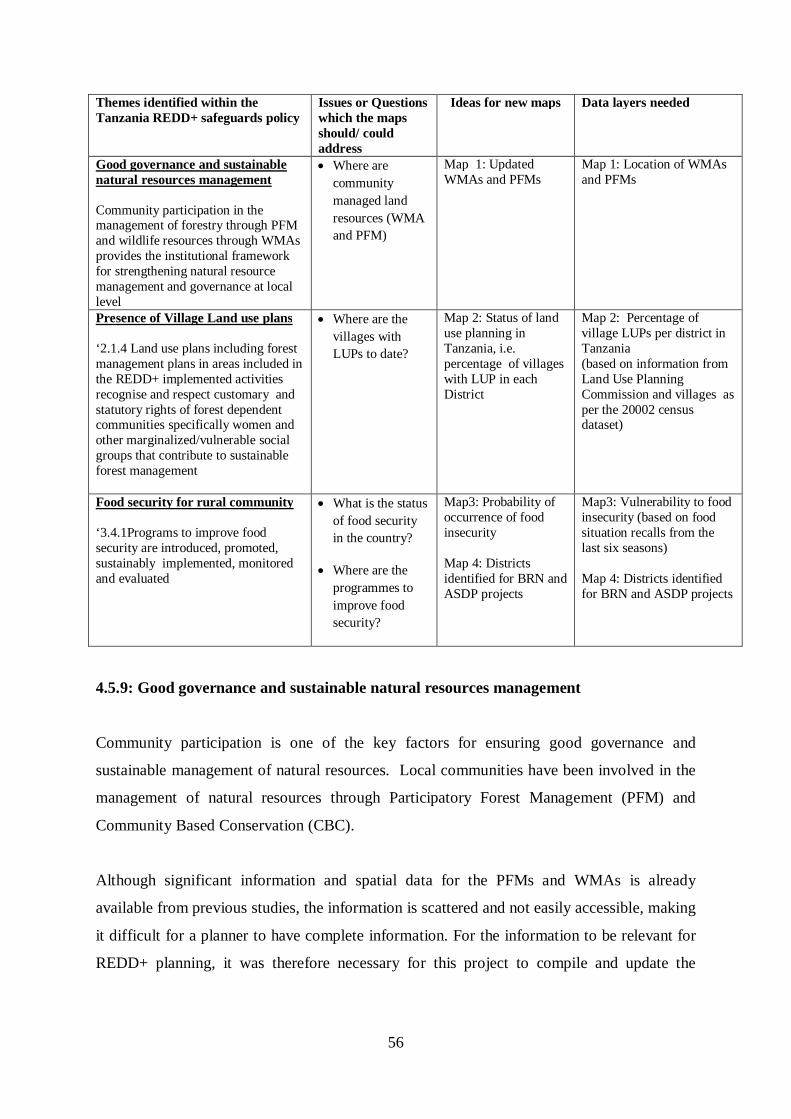
56
Themes identified within the Tanzania REDD+ safeguards policy
Issues or Questions which the maps should/ could address
Ideas for new maps
Data layers needed
Good governance and sustainable natural resources management Community participation in the management of forestry through PFM and wildlife resources through WMAs provides the institutional framework for strengthening natural resource management and governance at local level
Where are community managed land resources (WMA and PFM)
Map 1: Updated WMAs and PFMs
Map 1: Location of WMAs and PFMs
Presence of Village Land use plans ‘2.1.4 Land use plans including forest management plans in areas included in the REDD+ implemented activities recognise and respect customary and statutory rights of forest dependent communities specifically women and other marginalized/vulnerable social groups that contribute to sustainable forest management
Where are the villages with LUPs to date?
Map 2: Status of land use planning in Tanzania, i.e. percentage of villages with LUP in each District
Map 2: Percentage of village LUPs per district in Tanzania (based on information from Land Use Planning Commission and villages as per the 20002 census dataset)
Food security for rural community ‘3.4.1Programs to improve food security are introduced, promoted, sustainably implemented, monitored and evaluated
What is the status of food security in the country?
Where are the programmes to improve food security?
Map3: Probability of occurrence of food insecurity Map 4: Districts identified for BRN and ASDP projects
Map3: Vulnerability to food insecurity (based on food situation recalls from the last six seasons) Map 4: Districts identified for BRN and ASDP projects
4.5.9: Good governance and sustainable natural resources management
Community participation is one of the key factors for ensuring good governance and
sustainable management of natural resources. Local communities have been involved in the
management of natural resources through Participatory Forest Management (PFM) and
Community Based Conservation (CBC).
Although significant information and spatial data for the PFMs and WMAs is already
available from previous studies, the information is scattered and not easily accessible, making
it difficult for a planner to have complete information. For the information to be relevant for
REDD+ planning, it was therefore necessary for this project to compile and update the

57
information from different sources. The map (Figure 24) shows the locations of WMAs
(both with AA and other status) and locations of PFMs (both CBFM and JFM).
Figure 24: Locations of WMAs and PFMs
4.5.10: Presence of Village Land use plans
Land use planning is key to effective natural resource management. It helps to balance
ecological, economic and social objectives, thereby facilitating implementation of REDD+ as
well as preventing land use conflicts.
Tanzania suffers from high rates of deforestation and forest degradation due to heavy
pressure for conversion of forests, particularly on general land, to other competing land uses.
Among other factors, the situation is aggravated by the lack of/inadequate land tenure clarity
and land use plans. The existing National Land Use Policy (NLUP) and National Land Use
Planning Commission (NLUPC) provide safeguards to support REDD+ implementation in
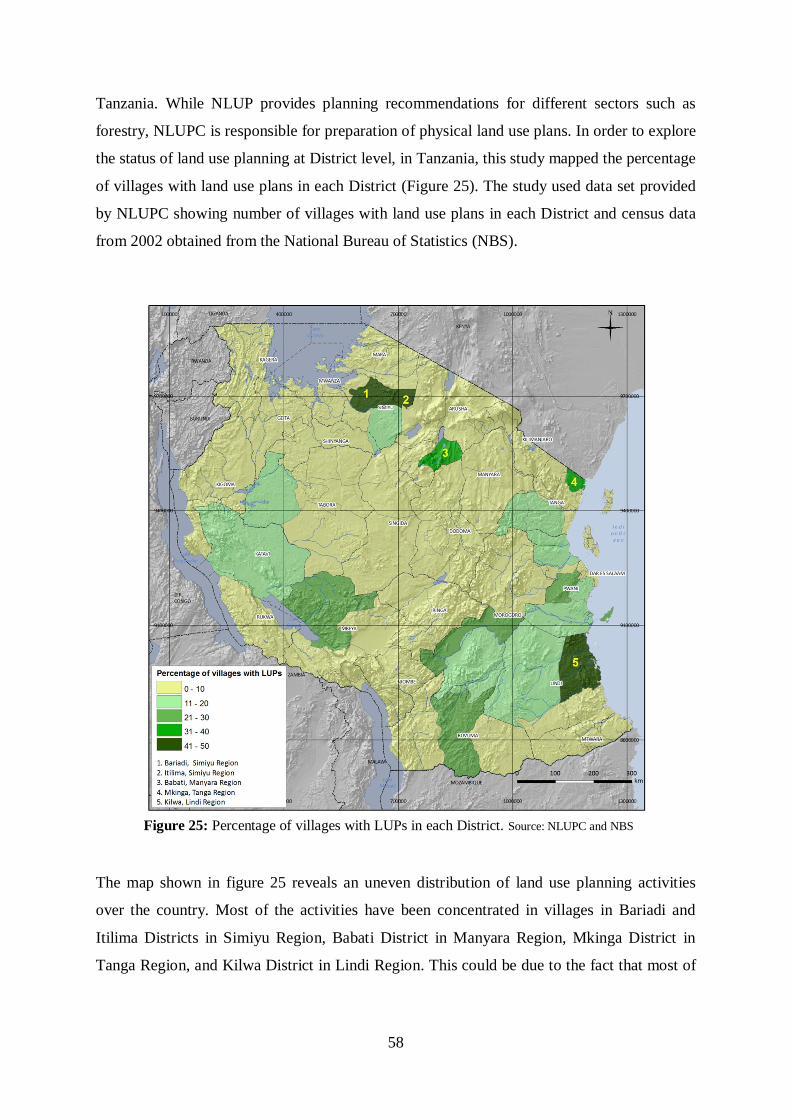
58
Tanzania. While NLUP provides planning recommendations for different sectors such as
forestry, NLUPC is responsible for preparation of physical land use plans. In order to explore
the status of land use planning at District level, in Tanzania, this study mapped the percentage
of villages with land use plans in each District (Figure 25). The study used data set provided
by NLUPC showing number of villages with land use plans in each District and census data
from 2002 obtained from the National Bureau of Statistics (NBS).
Figure 25: Percentage of villages with LUPs in each District. Source: NLUPC and NBS
The map shown in figure 25 reveals an uneven distribution of land use planning activities
over the country. Most of the activities have been concentrated in villages in Bariadi and
Itilima Districts in Simiyu Region, Babati District in Manyara Region, Mkinga District in
Tanga Region, and Kilwa District in Lindi Region. This could be due to the fact that most of
59
these activities rely on funding from donors such as WWF, MKUKUTA and other
international agency.
4.5.11: Food security for rural community
Agriculture (including livestock) is the dominant sector in Tanzanian economy, providing
livelihood, income, and employment to over 80% of the population and it accounts for 27%
of GDP, 30% of export earnings, and 65% of raw material for domestic industries.
Agriculture sector is however one of the key drivers of deforestation in Tanzania. Forests are
annexed for agriculture use because either the current area under agriculture is not enough to
support population pressure, or area under agriculture use becomes unproductive due to poor
agricultural practices as a result people has to find virgin land, which is temporally fertile, or
the practice of shifting cultivation.
In order to ensure that proposed REDD+ initiatives contribute to the adaptation and
mitigation to climate change while contributing to food security for improved livelihoods, the
national REDD+ safeguard proposes that programs to improve food security are introduced
and implemented. This study maps the Districts with some of the financed or planned
national agricultural programmes contributing to the improvement of agricultural
productivity in Tanzania. The programmes are Agricultural Sector Development Programme
(ASDP6) and Big Results Now (BRN7) (Figure 26). In addition, the study has mapped the
vulnerability to food security in different districts of Tanzania based on food situation recalls
from the last six seasons, i.e. 2007/08, 2008/09, 2009/2010, 2010/11, 2011/12, and 2012/13
(Figure 26).
It is envisaged that the upcoming REDD+ initiatives will use this information as an input
during planning for agricultural programmes.
6 ASDP – objective of the programme is to enable farmers to have better access to and use of agricultural knowledge, technologies, marketing systems and infrastructure, all of which contribute to high productivity 7 BRN initiative aims to adapt new methods of working under specified timeframe for delivery of the step-change required. For the agriculture sector, by 2015, 25 commercial farming dealing with paddy and sugarcane, 78 collective rice irrigation and marketing schemes, and 275 collective warehouse-based marketing schemes
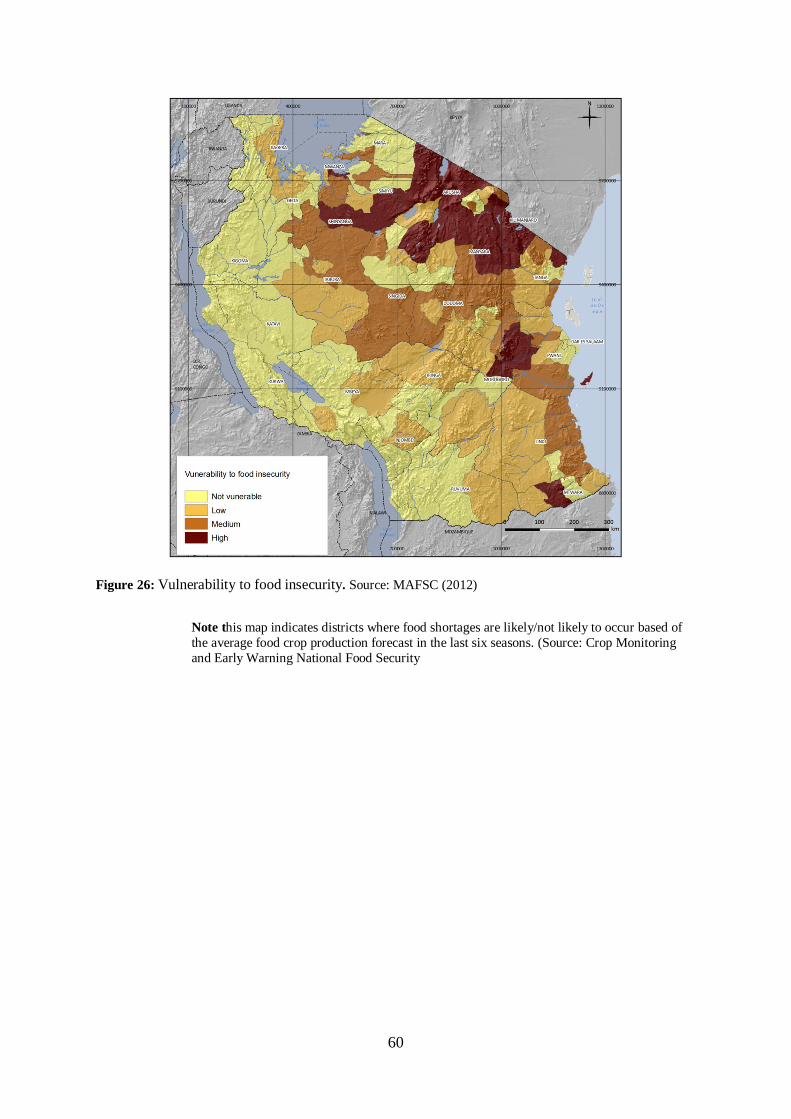
60
Figure 26: Vulnerability to food insecurity. Source: MAFSC (2012)
Note this map indicates districts where food shortages are likely/not likely to occur based of the average food crop production forecast in the last six seasons. (Source: Crop Monitoring and Early Warning National Food Security
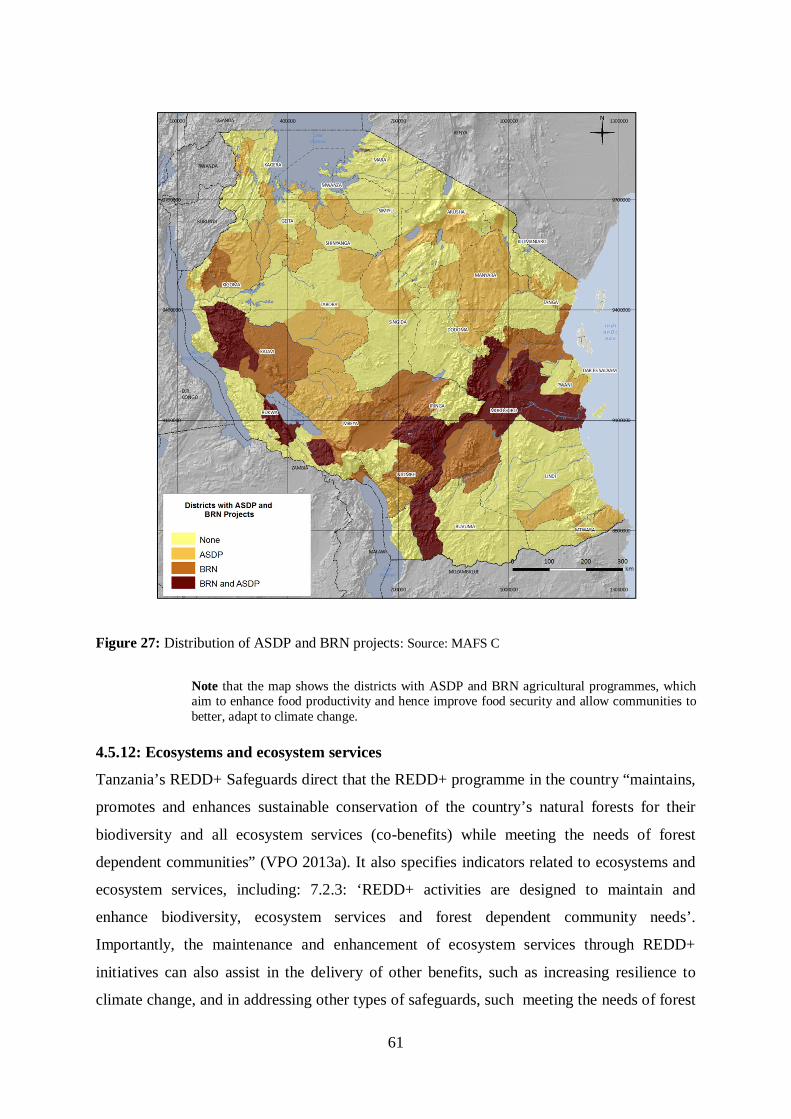
61
Figure 27: Distribution of ASDP and BRN projects: Source: MAFS C
Note that the map shows the districts with ASDP and BRN agricultural programmes, which aim to enhance food productivity and hence improve food security and allow communities to better, adapt to climate change.
4.5.12: Ecosystems and ecosystem services
Tanzania’s REDD+ Safeguards direct that the REDD+ programme in the country “maintains,
promotes and enhances sustainable conservation of the country’s natural forests for their
biodiversity and all ecosystem services (co-benefits) while meeting the needs of forest
dependent communities” (VPO 2013a). It also specifies indicators related to ecosystems and
ecosystem services, including: 7.2.3: ‘REDD+ activities are designed to maintain and
enhance biodiversity, ecosystem services and forest dependent community needs’.
Importantly, the maintenance and enhancement of ecosystem services through REDD+
initiatives can also assist in the delivery of other benefits, such as increasing resilience to
climate change, and in addressing other types of safeguards, such meeting the needs of forest
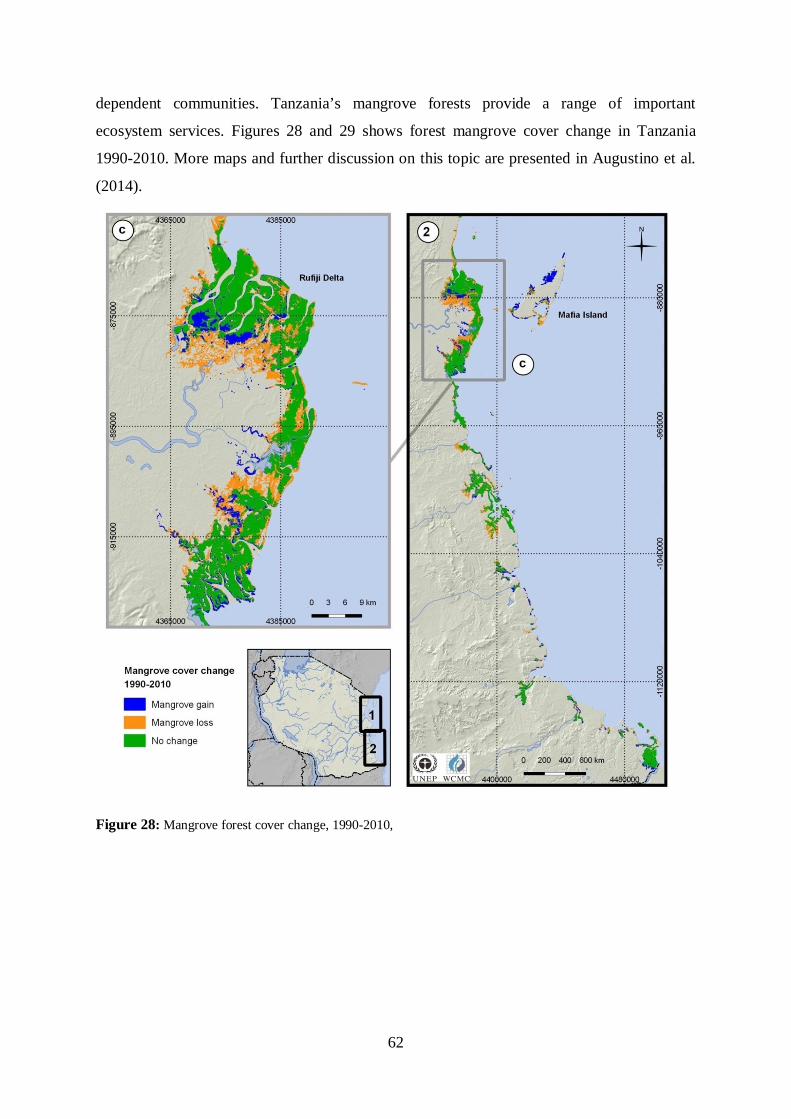
62
dependent communities. Tanzania’s mangrove forests provide a range of important
ecosystem services. Figures 28 and 29 shows forest mangrove cover change in Tanzania
1990-2010. More maps and further discussion on this topic are presented in Augustino et al.
(2014).
Figure 28: Mangrove forest cover change, 1990-2010,
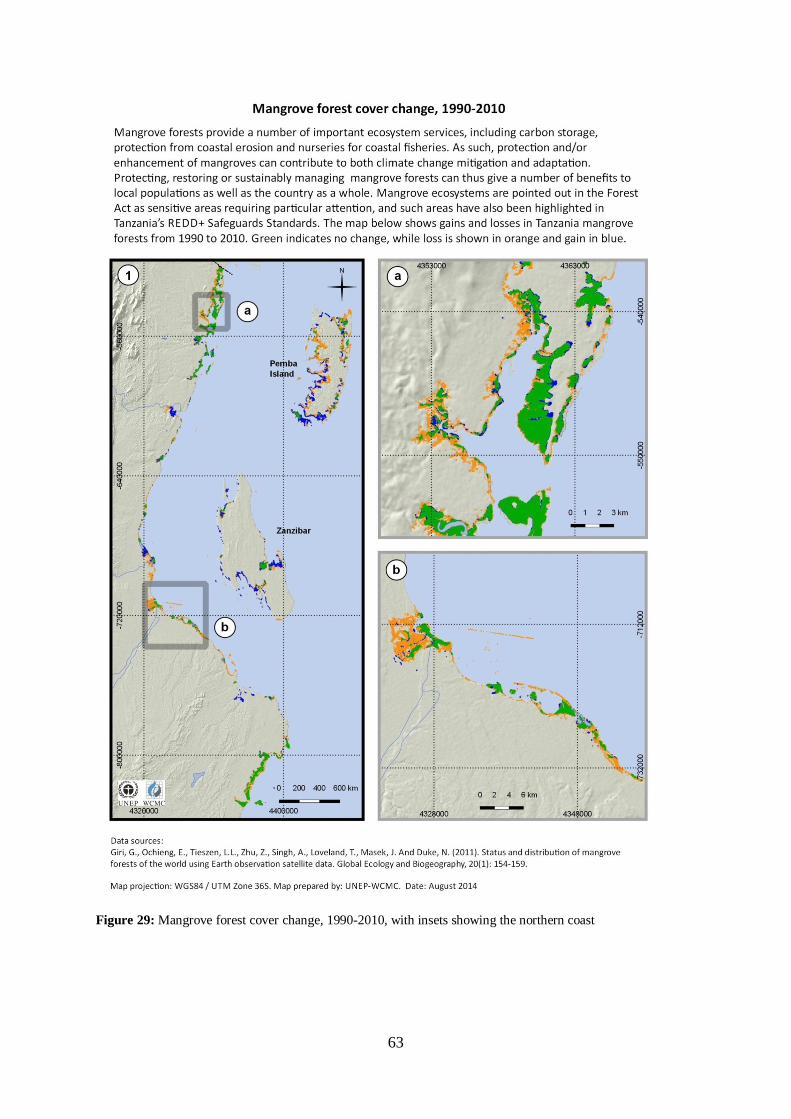
63
Figure 29: Mangrove forest cover change, 1990-2010, with insets showing the northern coast
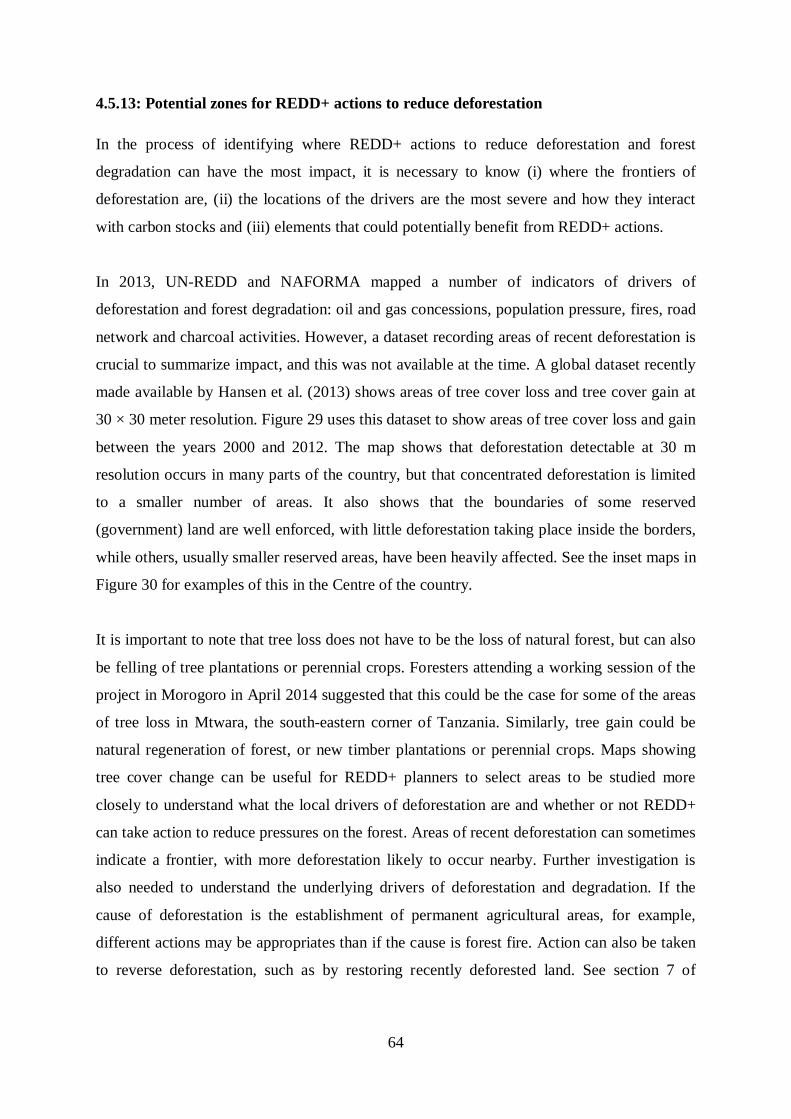
64
4.5.13: Potential zones for REDD+ actions to reduce deforestation
In the process of identifying where REDD+ actions to reduce deforestation and forest
degradation can have the most impact, it is necessary to know (i) where the frontiers of
deforestation are, (ii) the locations of the drivers are the most severe and how they interact
with carbon stocks and (iii) elements that could potentially benefit from REDD+ actions.
In 2013, UN-REDD and NAFORMA mapped a number of indicators of drivers of
deforestation and forest degradation: oil and gas concessions, population pressure, fires, road
network and charcoal activities. However, a dataset recording areas of recent deforestation is
crucial to summarize impact, and this was not available at the time. A global dataset recently
made available by Hansen et al. (2013) shows areas of tree cover loss and tree cover gain at
30 × 30 meter resolution. Figure 29 uses this dataset to show areas of tree cover loss and gain
between the years 2000 and 2012. The map shows that deforestation detectable at 30 m
resolution occurs in many parts of the country, but that concentrated deforestation is limited
to a smaller number of areas. It also shows that the boundaries of some reserved
(government) land are well enforced, with little deforestation taking place inside the borders,
while others, usually smaller reserved areas, have been heavily affected. See the inset maps in
Figure 30 for examples of this in the Centre of the country.
It is important to note that tree loss does not have to be the loss of natural forest, but can also
be felling of tree plantations or perennial crops. Foresters attending a working session of the
project in Morogoro in April 2014 suggested that this could be the case for some of the areas
of tree loss in Mtwara, the south-eastern corner of Tanzania. Similarly, tree gain could be
natural regeneration of forest, or new timber plantations or perennial crops. Maps showing
tree cover change can be useful for REDD+ planners to select areas to be studied more
closely to understand what the local drivers of deforestation are and whether or not REDD+
can take action to reduce pressures on the forest. Areas of recent deforestation can sometimes
indicate a frontier, with more deforestation likely to occur nearby. Further investigation is
also needed to understand the underlying drivers of deforestation and degradation. If the
cause of deforestation is the establishment of permanent agricultural areas, for example,
different actions may be appropriates than if the cause is forest fire. Action can also be taken
to reverse deforestation, such as by restoring recently deforested land. See section 7 of
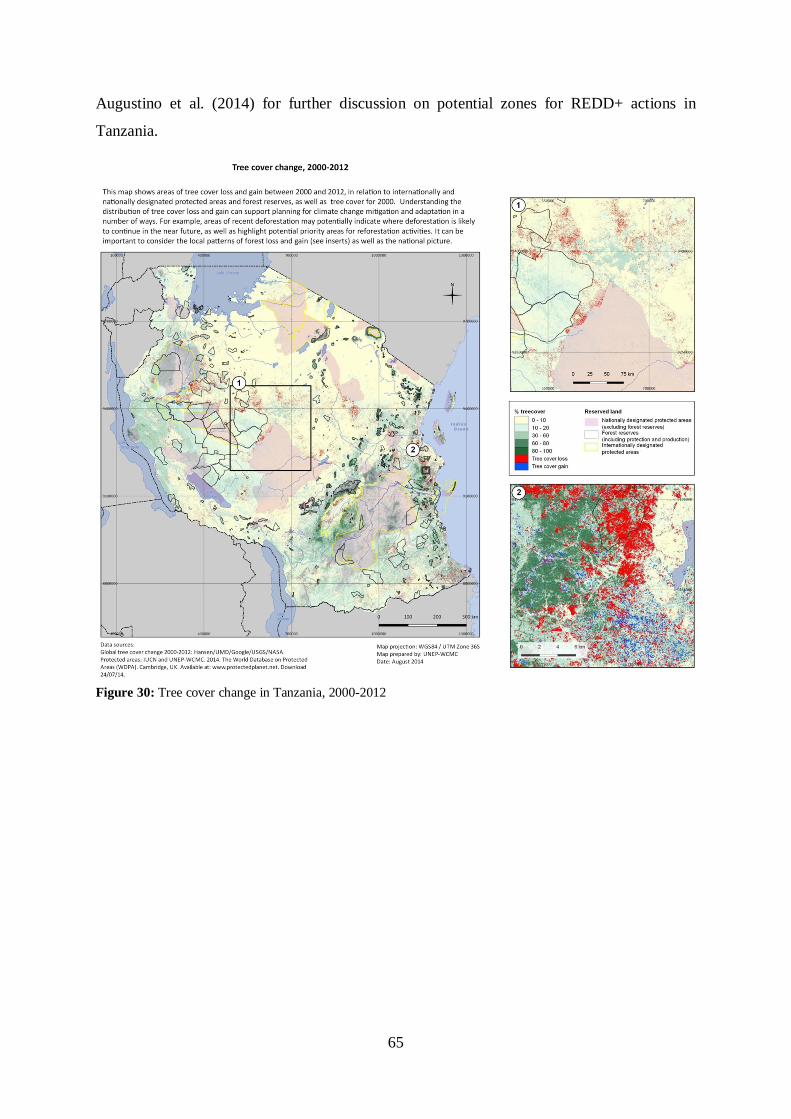
65
Augustino et al. (2014) for further discussion on potential zones for REDD+ actions in
Tanzania.
Figure 30: Tree cover change in Tanzania, 2000-2012
66
4.5.14: Using maps to help avoid risks from REDD+ - Montane grassland dependent
species and tree cover gain
One potential risk from enhancement of forest carbon stocks activities is if new forest areas
are planted on areas of natural important non-forest ecosystems. Figures 31 and 32 show the
distribution of montane grassland dependent threatened and endemic species in Tanzania, in
relation to gains in tree cover. The maps show that areas such as Arusha, Mara and Simiyu in
the north of the country, and scattered patches in Morogoro, Njombe and other parts of the
country host higher densities of threatened species that occur in montane grasslands. In terms
of endemic montane grassland dependent species, these areas are even more restricted,
concentrated in small patches in the Eastern Arc Mountains. Tanzania’s REDD+ Safeguards
prioritize the protection of rare, endemic and threatened species and ecosystems; the
country’s grasslands are home to biodiversity of national and international conservation
importance and face a number of threats to their existence, including the expansion of
industrial tree plantations, such as pine and eucalyptus. For example, the maps highlight the
areas where forest gains overlap and/or border with areas important for montane grassland
species. This is of particular significance to REDD+ implementation, as to align with the
Cancun safeguards and Tanzania’s safeguards policies, REDD+ actions should not include or
encourage the conversion of non-forest ecosystems, such as grasslands, to forest.
67
Figure 31: High-altitude grassland dependent threatened species richness and tree cover gain, 2000-2012
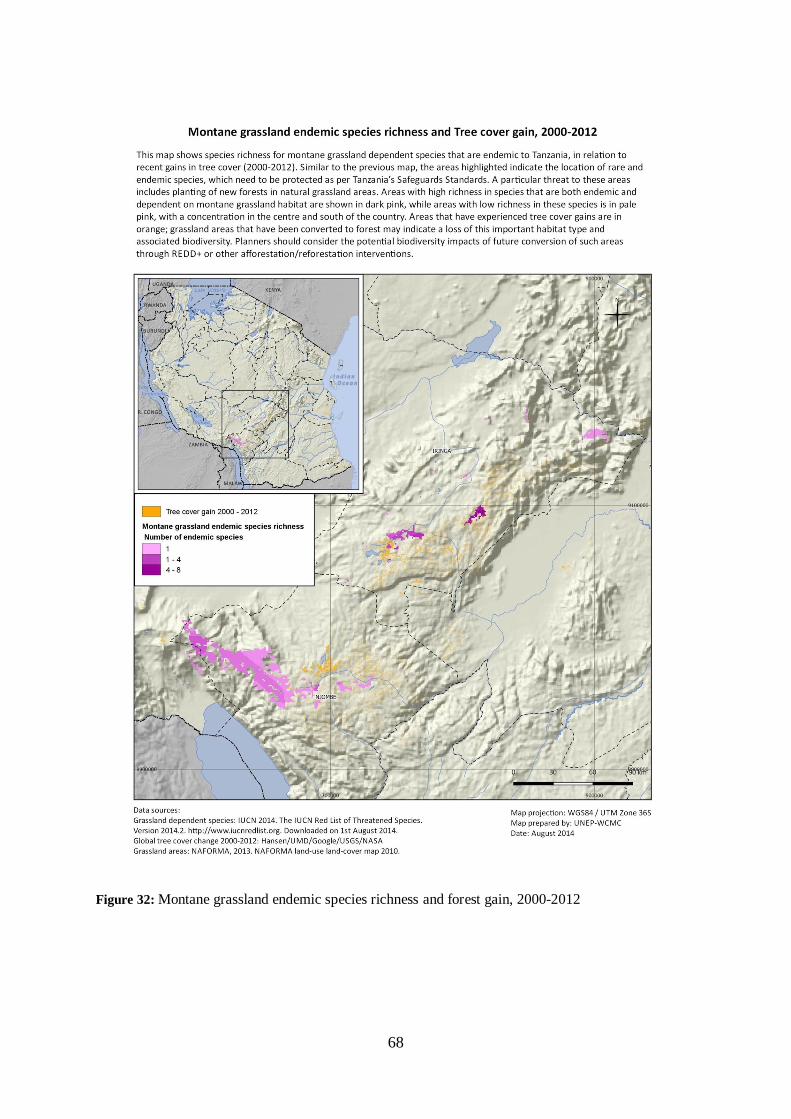
68
Figure 32: Montane grassland endemic species richness and forest gain, 2000-2012

69
Output 6: Capacity building, dissemination and communication of project outputs
undertaken
The project has been enhancing the capacity of Tanzanians from village to national level to
understand methodologies for carbon assessment and data analysis. The project also
collaborated with different government institutions including National Carbon Monitoring
Center (NCMC) and TFS on data sharing. This was done to ensure that collected carbon data
from different REDD+ Pilot project are embedded in the database of the NCMC for
developing National MRV for sustainability and national ownership.
4.6.1: Local Community (villagers) and district staff empowered on carbon monitoring During the project period, a total of 30 villagers and 25 district forest officers were exposed
to various techniques on forest inventory techniques including the use of inventory
equipment. The initial project team including an expert from SUA and University of York
trained 12 members of Field assessment team on one hectare protocol for assessing carbon
stock, taking measurements using hemispherical photograph and Sunscan. Thereafter, project
team trained 25 district staff on forest carbon assessment using one hectare protocol
particularly plot layout, use of inventory equipment and procedures for taking measurements.
During field work, assessment teams were responsible to training local communities on basic
inventory techniques. The villagers had an opportunity to learn by doing when they
participated in field carbon assessment in project area.
Villagers were able to successfully take field measurements. Thus the project concludes they
have gained knowledge and skill for carbon assessment and monitoring in different
vegetation types. It was worth noting that 20% and 30% of trainees in district and village
levels were female respectively.
4.6.2 Technical staff empowered on data analysis Project team in collaboration with University of York conducted two separate session of
training course on R statistical package in 2013 and 2014. Each training session involved
theory and practical methods to increase participants understanding on R applications. The
target group was mainly postgraduate level scholars and/or staff working on monitoring and
modelling forest structure. The course brought together 27 participants including 22 men and
5 women from REDD+ Pilot project, Academic and research institutions particular SUA and
70
other institutions represented were National Environmental Management Council (NEMC)
and Udzungwa Project as illustrated in Appendix 7.
The course focused on the application of the R programme to describe and quantify data from
carbon plots collected under the MRV process to assess carbon storage potential of a number
of key ecosystem types in Tanzania. The course introduced the use of remotely sensed earth
observation products (both freely available via the internet) and how these can be used within
a GIS for carbon assessment at a range of scales (from the plot to global change
research). It was observed that most participants increased their knowledge and skill on
designing, executing and analyzing environmental survey, and have gained competence and
skills to use R- statistical software.
4.6.3: Building capacity of technical staff on mapping and developing scenarios
15 participants from different institutions including Governments (MLHSD, secondary
school), NGO (TFCG, PFP), Academic and research institution (SUA, FTI), and Agencies
(TFS, KFS) were trained on scenario analysis to generate land use/cover change maps using
GIS techniques.
The training lasted 3 days and consisted in learning-by-doing sessions on the process of
scenarios building, starting from this project as case study. The trainee practiced how to
develop new storylines and how to project quantitative and spatial indicators to future states.
They also acquired information on available global or national datasets which can be used for
land cover changes analyses. The training aimed at delivering some specific technical skills
to trainees meanwhile encouraging the attitude for multi-disciplinary approaches in
management of environmental challenges.
Moreover, Project team in collaboration with WCMC staff organized training workshop on
mapping using Q GIS open source in Morogoro for five days. The training brought together
11participants (Appendix 9) from different institutions mostly from SUA and TFS as they
had experience attained from previous training conducted through UN- REDD. The training
mainly focused on creating an endemic species richness map, overlaying with a carbon stock
density map using matrix style legend, calculating statistics, application of QGIS for creating
maps, transformation of maps from one coordinate to another coordinates and image
processing.
71
Most useful results from the training was the knowledge acquired in which the trainees could
be able to produce maps to be used in national forest monitoring system and thereafter to be a
very important input to REDD+.
4.6.4: Capacity on species vulnerability assessment A total of 12 technical staff from different institutions gained knowledge and skill to conduct
species vulnerability assessment. During the training, most participants were able to
understand and to follow processes for conducting Red List and climate change vulnerability
assessments. Therefore they can conduct similar assessments elsewhere, whether at the
national, regional or global level, of species occurring in Tanzania. Similarly individuals
were also able to build their professional networks to include experts associated with the
IUCN Species Survival Commission, which is likely to greatly increase capacity to gather
relevant species data in the future.
4.6.5: Installation of CHN machine and Training of technician
Expert from LECO Company worked together with Laboratory technicians to install CHN
soil analyser at SUA particular in Biology Laboratory. The LECO CN628 Carbon Nitrogen
analyser serial Number 3446 was installed at SUA which involved the following:
I. Fitted Helium, Oxygen and compressed air gas piping and regulators.
II. Fitted a voltage Regulator on the power lines of the instrument and PC package.
III. Repacked all reagent tubes.
Moreover, LECO experts trained both 8 laboratory technicians and 5 master’s students at
SUA on the use of CHN instrument. The training was organized into two session mainly
theory and practical to increase participants understanding. Therefore facilitators explained
operation procedures for running CHN for soil analysis, maintenance, and safety. Facilitators
explained also calibration/operation of carbon IR Cell and Nitrogen Thermo conductivity.
Trainees had enough time to experience hand on operation of the instrument purposely to
increase their competence on application procedure. Finally, the instrument was tested with
certified standard namely EDTA. Results were well within the detection limit of the
standards.
72
4.6.6: Data sharing with National Carbon Monitoring Centre Project team consulted interim Staff at NCMC on sharing project data/results as inputs for
developing MRV. However, since NCMC is not yet operational it was agreed that project
data will be embedded into institutional database when operation starts.
4.6.7: Stakeholders’ workshop on MRV
Project team in collaboration with National Carbon Monitoring Centre organized a two days
stakeholder’s workshop on MRV in Morogoro, June, 2013. The workshop drew 18
representatives from REDD+ Pilot Project (5), TFS (1), NAFORMA project (2), Zanzibar
Wood Biomass Survey (1) and REDD+ Task Force (1), CCIAM (1) SUA (2) NCMC (2),
WWF US (1) and WWF REDD+ Project (2). The main purpose of the workshop was to share
experience and lessons on forest carbon measurements methodology.
It was realized that some pilot project adopted NAFORMA methodology of using concentric
plot while others modified some methodologies to suite its conditions like MCDI. It was also
informed that WWF REDD+ Pilot was the only pilot project using one hectare plot for forest
carbon assessment.
It was also observed that pilot project collected useful data to contribute toward developing
MRV in the Country. However, some data could be lost since most of the project lack storage
facilities to handle the data properly for long period. It was agreed that each pilot project
should find a safe means to store the data for a long period and ensure they are available for
use with other stakeholders. It was also agreed that NCMC should design a contract format
for data sharing that could be used to collect data from different pilot project and other actors
who have important information for MRV design. However, operationalization of the
agreement was not realized during the period of the project because legal establishment of
NCMC delayed.
4.6.8: Dissemination of project information Information regarding this project was disseminated through workshop, publication and
leaflets. Project team also invited some media staff to participate in various workshop
organized across the country to broadcast project information. Therefore some media
particular Tanzania Broadcasting Corporation (TBC), Independent Television (ITV) and Star
TV disseminated project/workshop information through Radio and Televisions and
73
consequently increased communities awareness on Project activities including land use/cover
change matters in the country.
Information on project status and land use /cover changes issues was delivered to 189
stakeholders attending the regional workshops and to other 40 stakeholders at the national
workshop on scenarios, by introductory slide presentations.
Moreover, three scientific papers have been produced as shown below and two of them
published in an international Journal as one way of disseminating information among
stakeholders in and outside the country.
Scientific Papers produced:
Burgess, N.D., S. Mwakalila, P. Munishi, M. Pfeifer, S. Willcock, D. Shirima, S. Hamidu, G.B. Bulenga, J. Rubens, H. Machano and R. Marchant (2013). REDD herrings or REDD menace: Response to Beymer-Farris and Bassett. Global Environmental Change http://dx.doi.org/10.1016/j.gloenvcha.2013.05.013
Burgess, N.D., P. Munishi, S. Mwakalila, M. Pfeifer, S. Willcock, D. Shirima, S. Hamidu, G.B. Bulenga and R. Marchant (2012). Enhancing Tanzanian capacity to deliver short and long term data on forest carbon stocks across the country, The Arc Journal 27: 22-26.
Deere, N, Burgess, N., Finch, F., Seki, H., Mukama K., Sharima, D., Munishi, P., Mbilinyi, B., Platts, P., Pfeifer, M., Willcox, S., Marchant, R. Short and long term perspectives on carbon change from Tanzania. Presentation at the World University Network Workshop on Maximizing community benefits from REDD. Hong Kong, Dec 11-13th
74
CHAPTER FIVE
5.0: Project Impacts
The key impact of the project is the increased availability of national carbon data for MRV.
Hundred and twenty eight (128) permanent sample plots have been established in areas that
are poorly covered in terms of carbon assessment in 10 different vegetation types. The
established permanent plots will be used for future carbon monitoring in different vegetation
types to determine the carbon dynamics and with respect to land use and/or socio-ecological
changes in Tanzania. The data collected under this project has increased data availability that
would be collated by National Carbon Monitoring Centre for developing MRV system in the
country.
The project has complemented spatial information on social and biodiversity which will pool
the knowledge and experiences in establishing national Safeguard Information System (SIS).
The Safeguard Information System is very important tool to inform safeguards during REDD
implementations.
The identified BAU and GE scenarios have provided important baseline information on how
the country can address green economy frameworks. The results will inform decision makers
on policy reviews and provide guidelines and regulations on best practices for the growing
development sectors and the economy.
The overall impact of the project is the technical expertise and analysis that provides a
measurement of carbon stocks and related biodiversity significance for researchers and
decision makers.
6.0 Sustainability The objective of tbe project was to generate short and long term carbon data to contribute to
the National MRV. The data generated and analyzed is now a permanent part of the body of
knowledge both nationally and globally on carbon sinks. The data is part of the long term
strategy for conservation and sustainable use of carbon sinks..
There are three components that have been generated by the project that are sustainable:
i) Data generated: Information/data has been generated for National MRV
system and will be utilized and expanded. The baseline carbon data has
75
provided a measure to the national carbon changes in emissions/ removals
from forest-related activities. Possible “compensation baseline” to provide
financial payments for verified emissions reductions for ‘positive incentives”
ii) Technical capacity developed: Increased the long term capacity of local and
national institutions to integrate natural capital conservation and socio-
economic development as well as the local communities. This capacity can be
harnessed by REDD+ projects and beyond.
iii) Monitoring System developed: The engagement of the local communities for
data collection as well as the direct link with SUA and the new NCMC has
provided sustainable linkages for current monitoring as well as future
monitoring that can be scaled-up as required by the country.
WWF Tanzania and its partners are dedicated to sustaining the efforts of this project to the
extent of their capacity. WWF Tanzania and its partners will continue to monitor the
established permanent plots in different vegetation. Masters and PhD students at SUA and
York will be encouraged to undertake studies/researches regarding carbon monitoring in
project area. This will provide a basis for future REDD+ programs and projects to support
MRV in Tanzania.
76
7.0: CONCLUSIONS AND RECOMMENDATIONS The Project has contributed significantly to issues in the relevant cover/forest types in
Tanzania with regards to:
Information/data for National MRV system and the long term strategy for conservation
and sustainable use of carbon sinks.
Initial data/information that can feed into national Reference Emission Levels (REL)
/Reference Levels
Baseline to measure changes in emissions/ removals from forest-related activities
Possible “compensation baseline” to provide financial payments for verified emissions
reductions for ‘positive incentives”
Emission Factors i.e. carbon changes in the five IPCC pools - The project has provided
data for all Carbon Pools
Data for both Tier 2 and 3 in regards to Emission Factors which did not exist - best
estimates
Biodiversity and Social Safeguards in REDD+ implementation
Increased the long term capacity of local and national institutions to integrate natural
capital conservation and socio-economic development.
These achievements are important as Tanzania strive towards readiness for actual
implementation of REDD+ initiative.
To improve the capacity of Tanzania to participate in performance based payments, the
information generated in these projects would be further enhanced through monitoring the
carbon changes over time in these plots to detect carbon stock changes and improve our
emission factors for different vegetation/forest types.
Tanzania suffers from high rates of deforestation and forest degradation which are among the
main carbon emission sources. REDD+ policy has been initiated through adoption of a
national strategy and legal frameworks supporting participatory forest management (PFM) to
promote emission reduction and poverty alleviation. PFM experiences and REDD+ pilot
projects faces difficulties in accessing carbon markets and inadequate financial mechanisms
for benefit sharing. This situation may decrease community participation and accelerate
carbon emissions. Efforts for establishing Monitoring Reporting and Verification (MRV)
system and Reference Emission Level (REL) exist but are not coordinated between the
77
national and local actions, and REL are still missing due to insufficient data and analysis
capacity.
In light of these national challenges, we provide the following recommendations to maintain
the achievements of the REDD+ projects to date, and to capacitate the country on monitoring
and managing the carbon stocks:
Development of Emission Factors (EF) and Relative Emission Levels/Emission level
(REL/EL) at subnational and National Level
Monitoring of the plots to establish changes in carbon stocks for additionally and
development of Tier 3 emission factors
Further assessment of social and biodiversity safeguards at sub regional level and in
specific biomes is necessary as these differ from one biome to another
Further capacity enhancement in MRV and biodiversity safeguards assessment
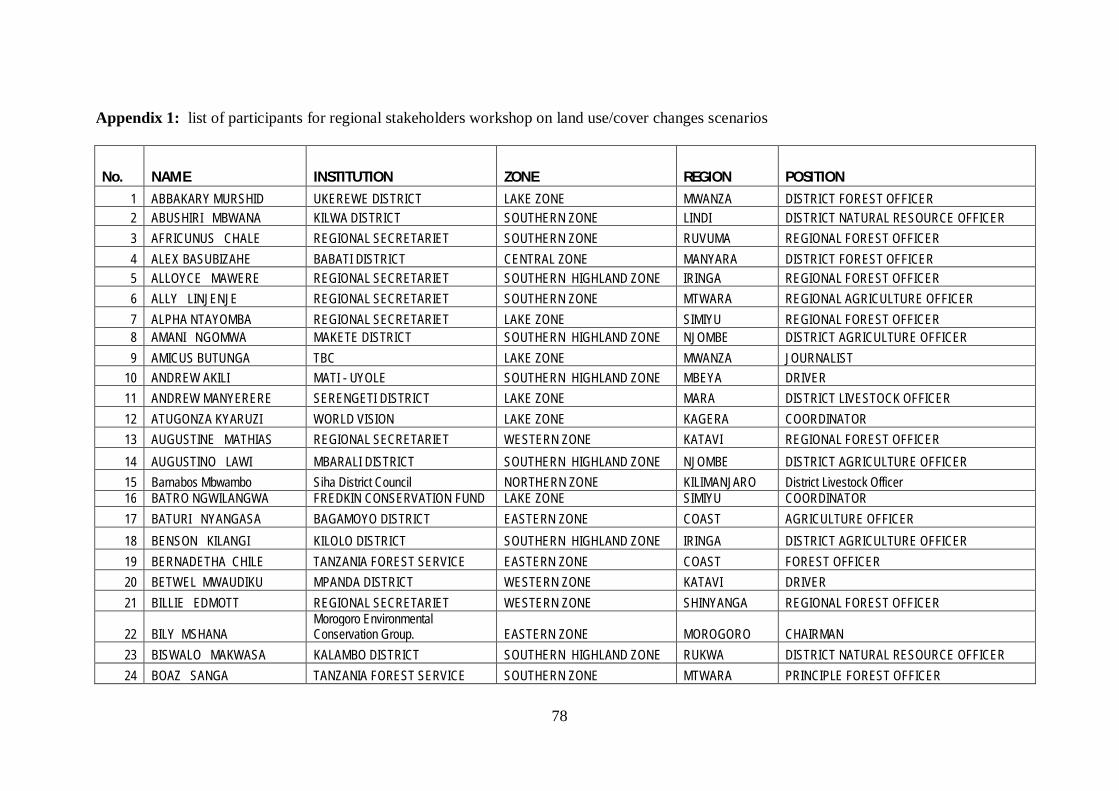
78
Appendix 1: list of participants for regional stakeholders workshop on land use/cover changes scenarios
No. NAME INSTITUTION ZONE REGION POSITION 1 ABBAKARY MURSHID UKEREWE DISTRICT LAKE ZONE MWANZA DISTRICT FOREST OFFICER 2 ABUSHIRI MBWANA KILWA DISTRICT SOUTHERN ZONE LINDI DISTRICT NATURAL RESOURCE OFFICER 3 AFRICUNUS CHALE REGIONAL SECRETARIET SOUTHERN ZONE RUVUMA REGIONAL FOREST OFFICER 4 ALEX BASUBIZAHE BABATI DISTRICT CENTRAL ZONE MANYARA DISTRICT FOREST OFFICER 5 ALLOYCE MAWERE REGIONAL SECRETARIET SOUTHERN HIGHLAND ZONE IRINGA REGIONAL FOREST OFFICER 6 ALLY LINJENJE REGIONAL SECRETARIET SOUTHERN ZONE MTWARA REGIONAL AGRICULTURE OFFICER 7 ALPHA NTAYOMBA REGIONAL SECRETARIET LAKE ZONE SIMIYU REGIONAL FOREST OFFICER 8 AMANI NGOMWA MAKETE DISTRICT SOUTHERN HIGHLAND ZONE NJOMBE DISTRICT AGRICULTURE OFFICER 9 AMICUS BUTUNGA TBC LAKE ZONE MWANZA JOURNALIST
10 ANDREW AKILI MATI - UYOLE SOUTHERN HIGHLAND ZONE MBEYA DRIVER 11 ANDREW MANYERERE SERENGETI DISTRICT LAKE ZONE MARA DISTRICT LIVESTOCK OFFICER 12 ATUGONZA KYARUZI WORLD VISION LAKE ZONE KAGERA COORDINATOR 13 AUGUSTINE MATHIAS REGIONAL SECRETARIET WESTERN ZONE KATAVI REGIONAL FOREST OFFICER 14 AUGUSTINO LAWI MBARALI DISTRICT SOUTHERN HIGHLAND ZONE NJOMBE DISTRICT AGRICULTURE OFFICER 15 Barnabos Mbwambo Siha District Council NORTHERN ZONE KILIMANJARO District Livestock Officer 16 BATRO NGWILANGWA FREDKIN CONSERVATION FUND LAKE ZONE SIMIYU COORDINATOR 17 BATURI NYANGASA BAGAMOYO DISTRICT EASTERN ZONE COAST AGRICULTURE OFFICER 18 BENSON KILANGI KILOLO DISTRICT SOUTHERN HIGHLAND ZONE IRINGA DISTRICT AGRICULTURE OFFICER 19 BERNADETHA CHILE TANZANIA FOREST SERVICE EASTERN ZONE COAST FOREST OFFICER 20 BETWEL MWAUDIKU MPANDA DISTRICT WESTERN ZONE KATAVI DRIVER 21 BILLIE EDMOTT REGIONAL SECRETARIET WESTERN ZONE SHINYANGA REGIONAL FOREST OFFICER
22 BILY MSHANA Morogoro Environmental Conservation Group. EASTERN ZONE MOROGORO CHAIRMAN
23 BISWALO MAKWASA KALAMBO DISTRICT SOUTHERN HIGHLAND ZONE RUKWA DISTRICT NATURAL RESOURCE OFFICER 24 BOAZ SANGA TANZANIA FOREST SERVICE SOUTHERN ZONE MTWARA PRINCIPLE FOREST OFFICER
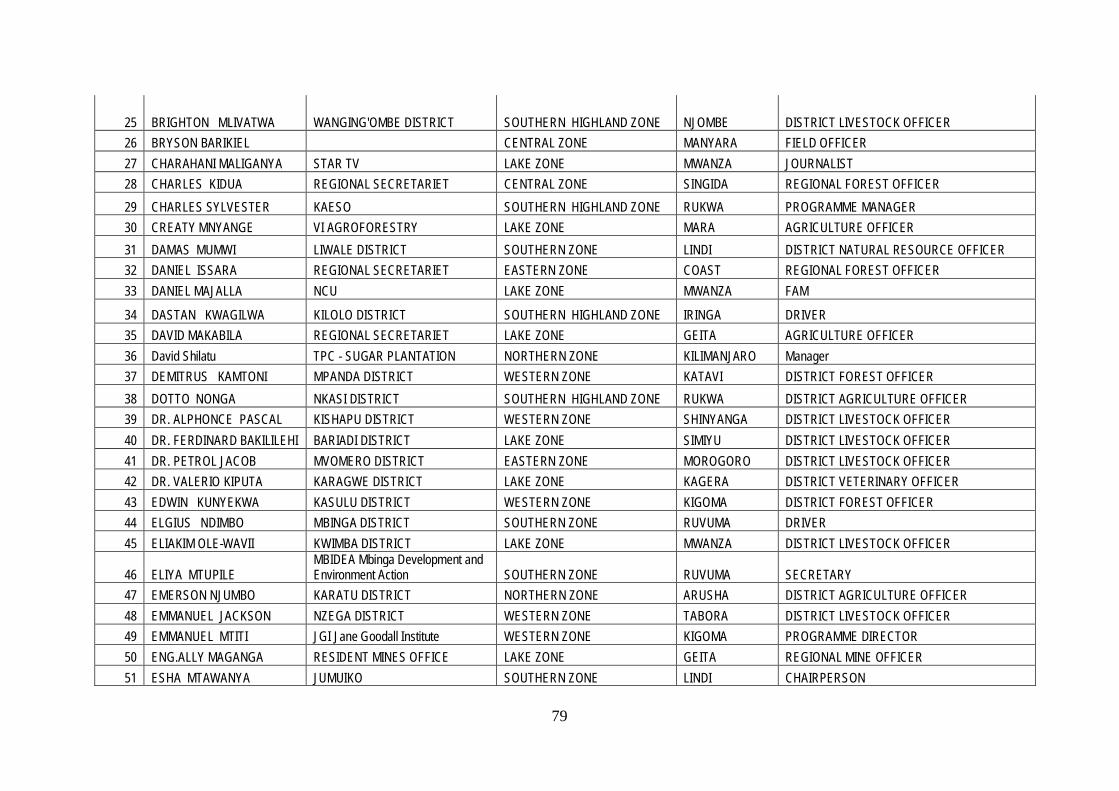
79
25 BRIGHTON MLIVATWA WANGING'OMBE DISTRICT SOUTHERN HIGHLAND ZONE NJOMBE DISTRICT LIVESTOCK OFFICER 26 BRYSON BARIKIEL CENTRAL ZONE MANYARA FIELD OFFICER 27 CHARAHANI MALIGANYA STAR TV LAKE ZONE MWANZA JOURNALIST 28 CHARLES KIDUA REGIONAL SECRETARIET CENTRAL ZONE SINGIDA REGIONAL FOREST OFFICER 29 CHARLES SYLVESTER KAESO SOUTHERN HIGHLAND ZONE RUKWA PROGRAMME MANAGER 30 CREATY MNYANGE VI AGROFORESTRY LAKE ZONE MARA AGRICULTURE OFFICER 31 DAMAS MUMWI LIWALE DISTRICT SOUTHERN ZONE LINDI DISTRICT NATURAL RESOURCE OFFICER 32 DANIEL ISSARA REGIONAL SECRETARIET EASTERN ZONE COAST REGIONAL FOREST OFFICER 33 DANIEL MAJALLA NCU LAKE ZONE MWANZA FAM
34 DASTAN KWAGILWA KILOLO DISTRICT SOUTHERN HIGHLAND ZONE IRINGA DRIVER 35 DAVID MAKABILA REGIONAL SECRETARIET LAKE ZONE GEITA AGRICULTURE OFFICER 36 David Shilatu TPC - SUGAR PLANTATION NORTHERN ZONE KILIMANJARO Manager 37 DEMITRUS KAMTONI MPANDA DISTRICT WESTERN ZONE KATAVI DISTRICT FOREST OFFICER 38 DOTTO NONGA NKASI DISTRICT SOUTHERN HIGHLAND ZONE RUKWA DISTRICT AGRICULTURE OFFICER 39 DR. ALPHONCE PASCAL KISHAPU DISTRICT WESTERN ZONE SHINYANGA DISTRICT LIVESTOCK OFFICER 40 DR. FERDINARD BAKILILEHI BARIADI DISTRICT LAKE ZONE SIMIYU DISTRICT LIVESTOCK OFFICER 41 DR. PETROL JACOB MVOMERO DISTRICT EASTERN ZONE MOROGORO DISTRICT LIVESTOCK OFFICER 42 DR. VALERIO KIPUTA KARAGWE DISTRICT LAKE ZONE KAGERA DISTRICT VETERINARY OFFICER 43 EDWIN KUNYEKWA KASULU DISTRICT WESTERN ZONE KIGOMA DISTRICT FOREST OFFICER 44 ELGIUS NDIMBO MBINGA DISTRICT SOUTHERN ZONE RUVUMA DRIVER 45 ELIAKIM OLE-WAVII KWIMBA DISTRICT LAKE ZONE MWANZA DISTRICT LIVESTOCK OFFICER
46 ELIYA MTUPILE MBIDEA Mbinga Development and Environment Action SOUTHERN ZONE RUVUMA SECRETARY
47 EMERSON NJUMBO KARATU DISTRICT NORTHERN ZONE ARUSHA DISTRICT AGRICULTURE OFFICER 48 EMMANUEL JACKSON NZEGA DISTRICT WESTERN ZONE TABORA DISTRICT LIVESTOCK OFFICER 49 EMMANUEL MTITI JGI Jane Goodall Institute WESTERN ZONE KIGOMA PROGRAMME DIRECTOR 50 ENG.ALLY MAGANGA RESIDENT MINES OFFICE LAKE ZONE GEITA REGIONAL MINE OFFICER 51 ESHA MTAWANYA JUMUIKO SOUTHERN ZONE LINDI CHAIRPERSON
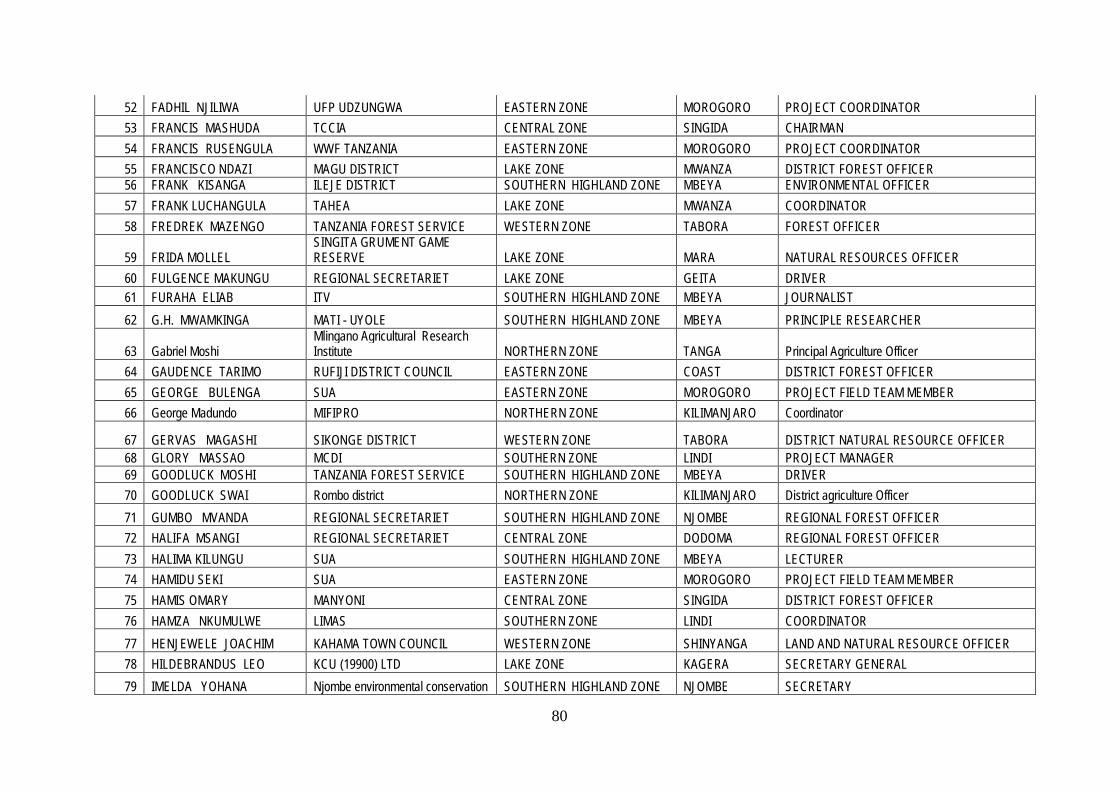
80
52 FADHIL NJILIWA UFP UDZUNGWA EASTERN ZONE MOROGORO PROJECT COORDINATOR 53 FRANCIS MASHUDA TCCIA CENTRAL ZONE SINGIDA CHAIRMAN 54 FRANCIS RUSENGULA WWF TANZANIA EASTERN ZONE MOROGORO PROJECT COORDINATOR 55 FRANCISCO NDAZI MAGU DISTRICT LAKE ZONE MWANZA DISTRICT FOREST OFFICER 56 FRANK KISANGA ILEJE DISTRICT SOUTHERN HIGHLAND ZONE MBEYA ENVIRONMENTAL OFFICER 57 FRANK LUCHANGULA TAHEA LAKE ZONE MWANZA COORDINATOR 58 FREDREK MAZENGO TANZANIA FOREST SERVICE WESTERN ZONE TABORA FOREST OFFICER
59 FRIDA MOLLEL SINGITA GRUMENT GAME RESERVE LAKE ZONE MARA NATURAL RESOURCES OFFICER
60 FULGENCE MAKUNGU REGIONAL SECRETARIET LAKE ZONE GEITA DRIVER 61 FURAHA ELIAB ITV SOUTHERN HIGHLAND ZONE MBEYA JOURNALIST 62 G.H. MWAMKINGA MATI - UYOLE SOUTHERN HIGHLAND ZONE MBEYA PRINCIPLE RESEARCHER
63 Gabriel Moshi Mlingano Agricultural Research Institute NORTHERN ZONE TANGA Principal Agriculture Officer
64 GAUDENCE TARIMO RUFIJI DISTRICT COUNCIL EASTERN ZONE COAST DISTRICT FOREST OFFICER 65 GEORGE BULENGA SUA EASTERN ZONE MOROGORO PROJECT FIELD TEAM MEMBER 66 George Madundo MIFIPRO NORTHERN ZONE KILIMANJARO Coordinator
67 GERVAS MAGASHI SIKONGE DISTRICT WESTERN ZONE TABORA DISTRICT NATURAL RESOURCE OFFICER 68 GLORY MASSAO MCDI SOUTHERN ZONE LINDI PROJECT MANAGER 69 GOODLUCK MOSHI TANZANIA FOREST SERVICE SOUTHERN HIGHLAND ZONE MBEYA DRIVER 70 GOODLUCK SWAI Rombo district NORTHERN ZONE KILIMANJARO District agriculture Officer 71 GUMBO MVANDA REGIONAL SECRETARIET SOUTHERN HIGHLAND ZONE NJOMBE REGIONAL FOREST OFFICER 72 HALIFA MSANGI REGIONAL SECRETARIET CENTRAL ZONE DODOMA REGIONAL FOREST OFFICER 73 HALIMA KILUNGU SUA SOUTHERN HIGHLAND ZONE MBEYA LECTURER 74 HAMIDU SEKI SUA EASTERN ZONE MOROGORO PROJECT FIELD TEAM MEMBER 75 HAMIS OMARY MANYONI CENTRAL ZONE SINGIDA DISTRICT FOREST OFFICER 76 HAMZA NKUMULWE LIMAS SOUTHERN ZONE LINDI COORDINATOR 77 HENJEWELE JOACHIM KAHAMA TOWN COUNCIL WESTERN ZONE SHINYANGA LAND AND NATURAL RESOURCE OFFICER 78 HILDEBRANDUS LEO KCU (19900) LTD LAKE ZONE KAGERA SECRETARY GENERAL 79 IMELDA YOHANA Njombe environmental conservation SOUTHERN HIGHLAND ZONE NJOMBE SECRETARY
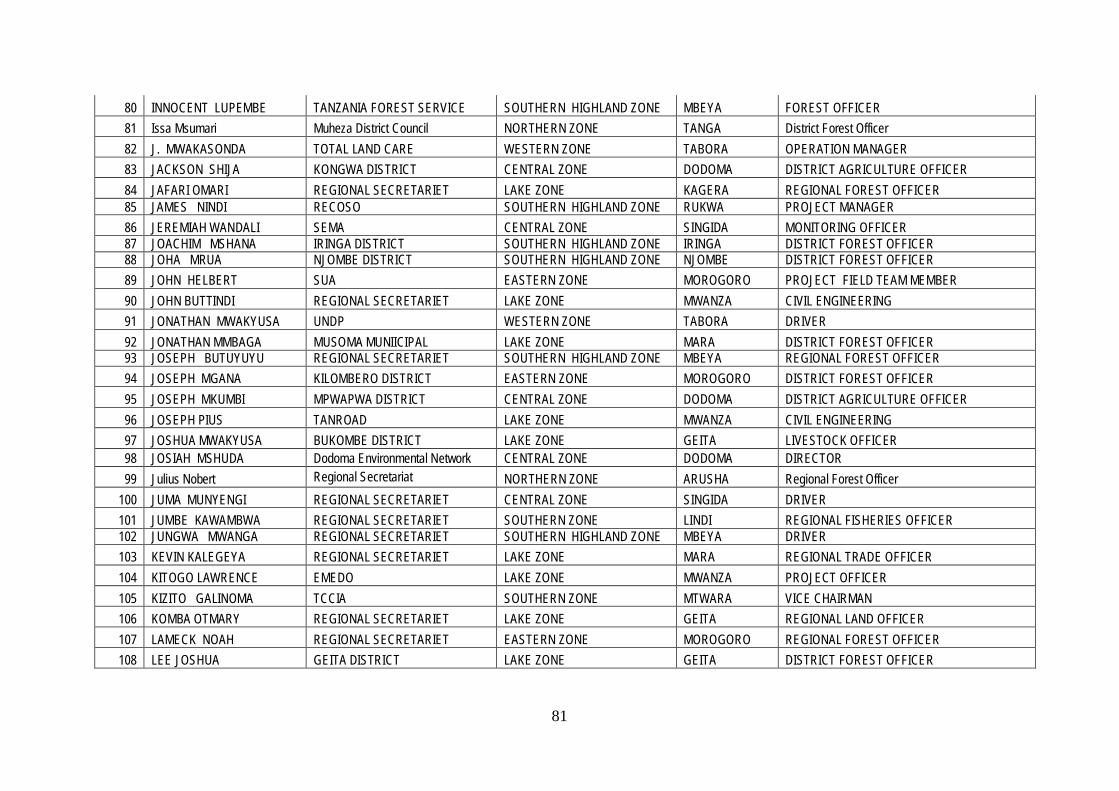
81
80 INNOCENT LUPEMBE TANZANIA FOREST SERVICE SOUTHERN HIGHLAND ZONE MBEYA FOREST OFFICER 81 Issa Msumari Muheza District Council NORTHERN ZONE TANGA District Forest Officer 82 J. MWAKASONDA TOTAL LAND CARE WESTERN ZONE TABORA OPERATION MANAGER 83 JACKSON SHIJA KONGWA DISTRICT CENTRAL ZONE DODOMA DISTRICT AGRICULTURE OFFICER 84 JAFARI OMARI REGIONAL SECRETARIET LAKE ZONE KAGERA REGIONAL FOREST OFFICER 85 JAMES NINDI RECOSO SOUTHERN HIGHLAND ZONE RUKWA PROJECT MANAGER 86 JEREMIAH WANDALI SEMA CENTRAL ZONE SINGIDA MONITORING OFFICER 87 JOACHIM MSHANA IRINGA DISTRICT SOUTHERN HIGHLAND ZONE IRINGA DISTRICT FOREST OFFICER 88 JOHA MRUA NJOMBE DISTRICT SOUTHERN HIGHLAND ZONE NJOMBE DISTRICT FOREST OFFICER 89 JOHN HELBERT SUA EASTERN ZONE MOROGORO PROJECT FIELD TEAM MEMBER 90 JOHN BUTTINDI REGIONAL SECRETARIET LAKE ZONE MWANZA CIVIL ENGINEERING 91 JONATHAN MWAKYUSA UNDP WESTERN ZONE TABORA DRIVER 92 JONATHAN MMBAGA MUSOMA MUNIICIPAL LAKE ZONE MARA DISTRICT FOREST OFFICER 93 JOSEPH BUTUYUYU REGIONAL SECRETARIET SOUTHERN HIGHLAND ZONE MBEYA REGIONAL FOREST OFFICER 94 JOSEPH MGANA KILOMBERO DISTRICT EASTERN ZONE MOROGORO DISTRICT FOREST OFFICER 95 JOSEPH MKUMBI MPWAPWA DISTRICT CENTRAL ZONE DODOMA DISTRICT AGRICULTURE OFFICER 96 JOSEPH PIUS TANROAD LAKE ZONE MWANZA CIVIL ENGINEERING 97 JOSHUA MWAKYUSA BUKOMBE DISTRICT LAKE ZONE GEITA LIVESTOCK OFFICER 98 JOSIAH MSHUDA Dodoma Environmental Network CENTRAL ZONE DODOMA DIRECTOR 99 Julius Nobert Regional Secretariat NORTHERN ZONE ARUSHA Regional Forest Officer
100 JUMA MUNYENGI REGIONAL SECRETARIET CENTRAL ZONE SINGIDA DRIVER 101 JUMBE KAWAMBWA REGIONAL SECRETARIET SOUTHERN ZONE LINDI REGIONAL FISHERIES OFFICER 102 JUNGWA MWANGA REGIONAL SECRETARIET SOUTHERN HIGHLAND ZONE MBEYA DRIVER 103 KEVIN KALEGEYA REGIONAL SECRETARIET LAKE ZONE MARA REGIONAL TRADE OFFICER 104 KITOGO LAWRENCE EMEDO LAKE ZONE MWANZA PROJECT OFFICER 105 KIZITO GALINOMA TCCIA SOUTHERN ZONE MTWARA VICE CHAIRMAN 106 KOMBA OTMARY REGIONAL SECRETARIET LAKE ZONE GEITA REGIONAL LAND OFFICER 107 LAMECK NOAH REGIONAL SECRETARIET EASTERN ZONE MOROGORO REGIONAL FOREST OFFICER 108 LEE JOSHUA GEITA DISTRICT LAKE ZONE GEITA DISTRICT FOREST OFFICER
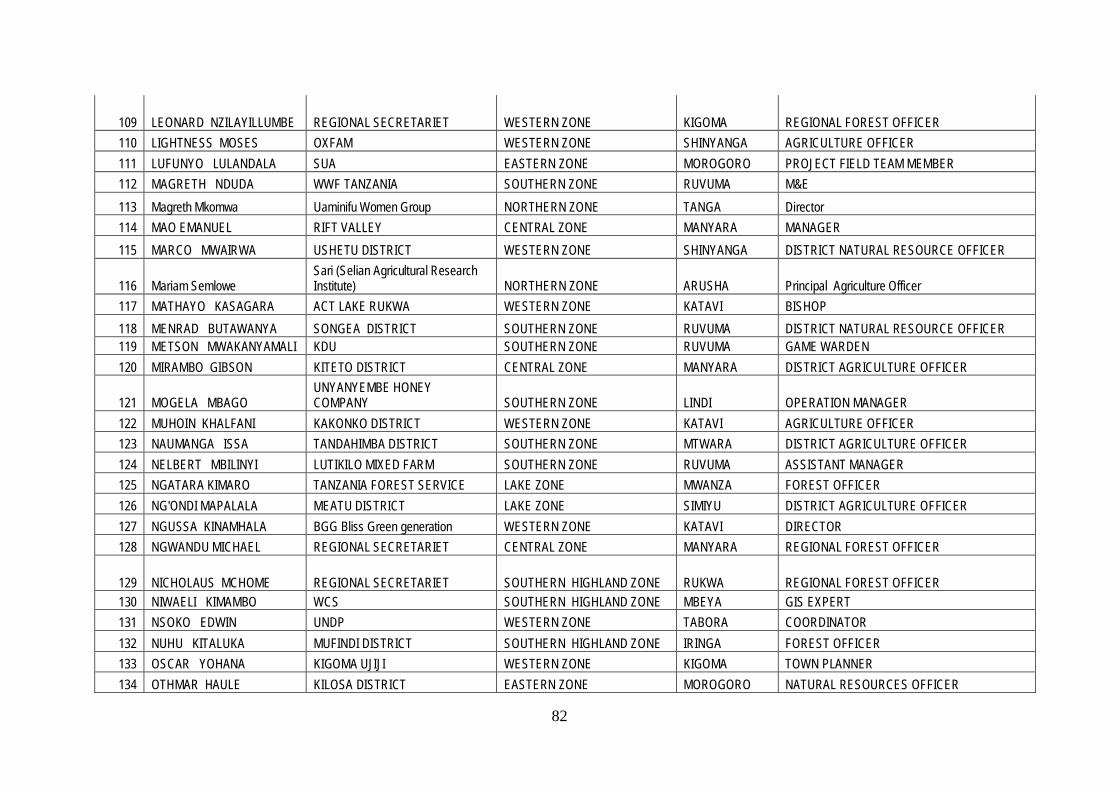
82
109 LEONARD NZILAYILLUMBE REGIONAL SECRETARIET WESTERN ZONE KIGOMA REGIONAL FOREST OFFICER 110 LIGHTNESS MOSES OXFAM WESTERN ZONE SHINYANGA AGRICULTURE OFFICER 111 LUFUNYO LULANDALA SUA EASTERN ZONE MOROGORO PROJECT FIELD TEAM MEMBER 112 MAGRETH NDUDA WWF TANZANIA SOUTHERN ZONE RUVUMA M&E 113 Magreth Mkomwa Uaminifu Women Group NORTHERN ZONE TANGA Director 114 MAO EMANUEL RIFT VALLEY CENTRAL ZONE MANYARA MANAGER 115 MARCO MWAIRWA USHETU DISTRICT WESTERN ZONE SHINYANGA DISTRICT NATURAL RESOURCE OFFICER
116 Mariam Semlowe Sari (Selian Agricultural Research Institute) NORTHERN ZONE ARUSHA Principal Agriculture Officer
117 MATHAYO KASAGARA ACT LAKE RUKWA WESTERN ZONE KATAVI BISHOP 118 MENRAD BUTAWANYA SONGEA DISTRICT SOUTHERN ZONE RUVUMA DISTRICT NATURAL RESOURCE OFFICER 119 METSON MWAKANYAMALI KDU SOUTHERN ZONE RUVUMA GAME WARDEN 120 MIRAMBO GIBSON KITETO DISTRICT CENTRAL ZONE MANYARA DISTRICT AGRICULTURE OFFICER
121 MOGELA MBAGO UNYANYEMBE HONEY COMPANY SOUTHERN ZONE LINDI OPERATION MANAGER
122 MUHOIN KHALFANI KAKONKO DISTRICT WESTERN ZONE KATAVI AGRICULTURE OFFICER 123 NAUMANGA ISSA TANDAHIMBA DISTRICT SOUTHERN ZONE MTWARA DISTRICT AGRICULTURE OFFICER 124 NELBERT MBILINYI LUTIKILO MIXED FARM SOUTHERN ZONE RUVUMA ASSISTANT MANAGER 125 NGATARA KIMARO TANZANIA FOREST SERVICE LAKE ZONE MWANZA FOREST OFFICER 126 NG'ONDI MAPALALA MEATU DISTRICT LAKE ZONE SIMIYU DISTRICT AGRICULTURE OFFICER 127 NGUSSA KINAMHALA BGG Bliss Green generation WESTERN ZONE KATAVI DIRECTOR 128 NGWANDU MICHAEL REGIONAL SECRETARIET CENTRAL ZONE MANYARA REGIONAL FOREST OFFICER
129 NICHOLAUS MCHOME REGIONAL SECRETARIET SOUTHERN HIGHLAND ZONE RUKWA REGIONAL FOREST OFFICER 130 NIWAELI KIMAMBO WCS SOUTHERN HIGHLAND ZONE MBEYA GIS EXPERT 131 NSOKO EDWIN UNDP WESTERN ZONE TABORA COORDINATOR 132 NUHU KITALUKA MUFINDI DISTRICT SOUTHERN HIGHLAND ZONE IRINGA FOREST OFFICER 133 OSCAR YOHANA KIGOMA UJIJI WESTERN ZONE KIGOMA TOWN PLANNER 134 OTHMAR HAULE KILOSA DISTRICT EASTERN ZONE MOROGORO NATURAL RESOURCES OFFICER
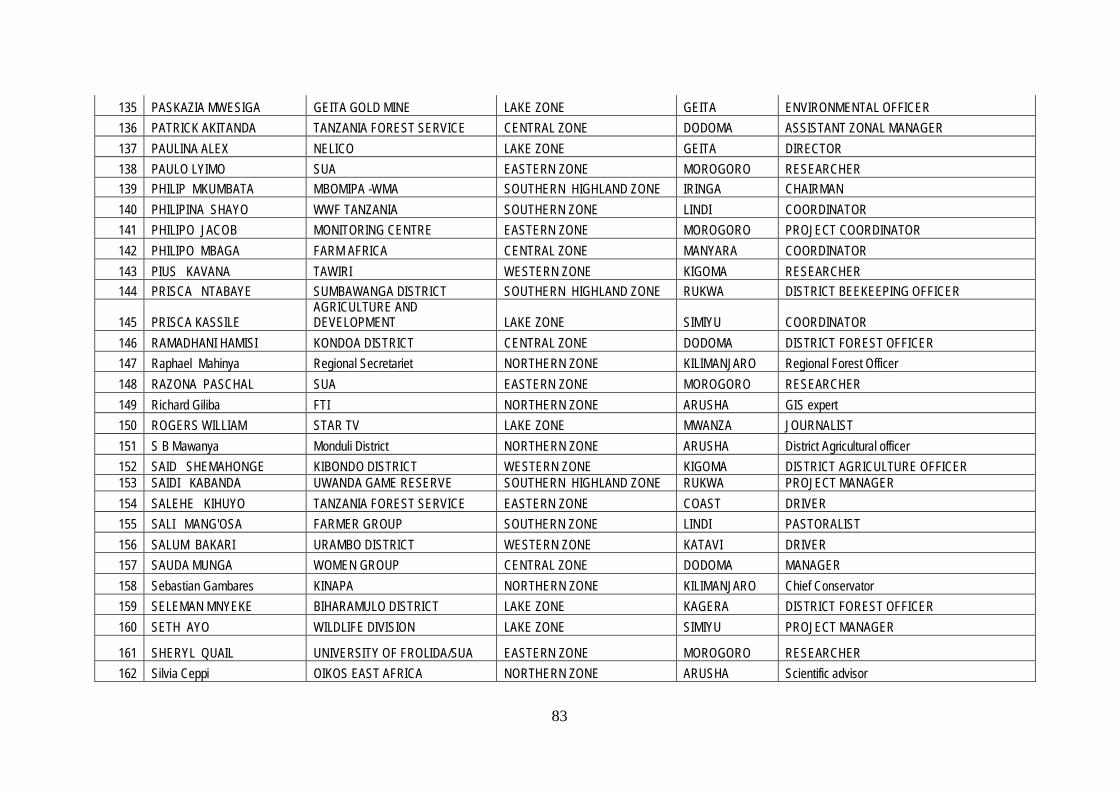
83
135 PASKAZIA MWESIGA GEITA GOLD MINE LAKE ZONE GEITA ENVIRONMENTAL OFFICER 136 PATRICK AKITANDA TANZANIA FOREST SERVICE CENTRAL ZONE DODOMA ASSISTANT ZONAL MANAGER 137 PAULINA ALEX NELICO LAKE ZONE GEITA DIRECTOR 138 PAULO LYIMO SUA EASTERN ZONE MOROGORO RESEARCHER 139 PHILIP MKUMBATA MBOMIPA -WMA SOUTHERN HIGHLAND ZONE IRINGA CHAIRMAN 140 PHILIPINA SHAYO WWF TANZANIA SOUTHERN ZONE LINDI COORDINATOR 141 PHILIPO JACOB MONITORING CENTRE EASTERN ZONE MOROGORO PROJECT COORDINATOR 142 PHILIPO MBAGA FARM AFRICA CENTRAL ZONE MANYARA COORDINATOR 143 PIUS KAVANA TAWIRI WESTERN ZONE KIGOMA RESEARCHER 144 PRISCA NTABAYE SUMBAWANGA DISTRICT SOUTHERN HIGHLAND ZONE RUKWA DISTRICT BEEKEEPING OFFICER
145 PRISCA KASSILE AGRICULTURE AND DEVELOPMENT LAKE ZONE SIMIYU COORDINATOR
146 RAMADHANI HAMISI KONDOA DISTRICT CENTRAL ZONE DODOMA DISTRICT FOREST OFFICER 147 Raphael Mahinya Regional Secretariet NORTHERN ZONE KILIMANJARO Regional Forest Officer 148 RAZONA PASCHAL SUA EASTERN ZONE MOROGORO RESEARCHER 149 Richard Giliba FTI NORTHERN ZONE ARUSHA GIS expert 150 ROGERS WILLIAM STAR TV LAKE ZONE MWANZA JOURNALIST 151 S B Mawanya Monduli District NORTHERN ZONE ARUSHA District Agricultural officer 152 SAID SHEMAHONGE KIBONDO DISTRICT WESTERN ZONE KIGOMA DISTRICT AGRICULTURE OFFICER 153 SAIDI KABANDA UWANDA GAME RESERVE SOUTHERN HIGHLAND ZONE RUKWA PROJECT MANAGER 154 SALEHE KIHUYO TANZANIA FOREST SERVICE EASTERN ZONE COAST DRIVER 155 SALI MANG'OSA FARMER GROUP SOUTHERN ZONE LINDI PASTORALIST 156 SALUM BAKARI URAMBO DISTRICT WESTERN ZONE KATAVI DRIVER 157 SAUDA MUNGA WOMEN GROUP CENTRAL ZONE DODOMA MANAGER 158 Sebastian Gambares KINAPA NORTHERN ZONE KILIMANJARO Chief Conservator 159 SELEMAN MNYEKE BIHARAMULO DISTRICT LAKE ZONE KAGERA DISTRICT FOREST OFFICER 160 SETH AYO WILDLIFE DIVISION LAKE ZONE SIMIYU PROJECT MANAGER
161 SHERYL QUAIL UNIVERSITY OF FROLIDA/SUA EASTERN ZONE MOROGORO RESEARCHER 162 Silvia Ceppi OIKOS EAST AFRICA NORTHERN ZONE ARUSHA Scientific advisor
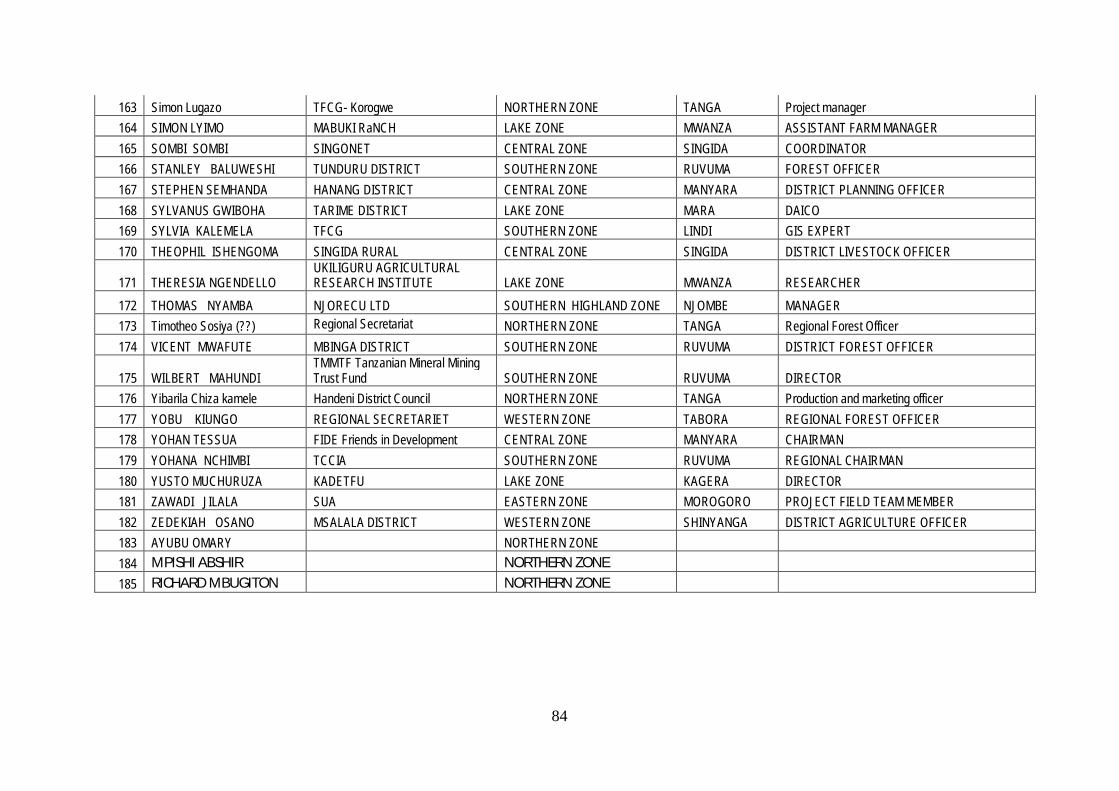
84
163 Simon Lugazo TFCG- Korogwe NORTHERN ZONE TANGA Project manager 164 SIMON LYIMO MABUKI RaNCH LAKE ZONE MWANZA ASSISTANT FARM MANAGER 165 SOMBI SOMBI SINGONET CENTRAL ZONE SINGIDA COORDINATOR 166 STANLEY BALUWESHI TUNDURU DISTRICT SOUTHERN ZONE RUVUMA FOREST OFFICER 167 STEPHEN SEMHANDA HANANG DISTRICT CENTRAL ZONE MANYARA DISTRICT PLANNING OFFICER 168 SYLVANUS GWIBOHA TARIME DISTRICT LAKE ZONE MARA DAICO 169 SYLVIA KALEMELA TFCG SOUTHERN ZONE LINDI GIS EXPERT 170 THEOPHIL ISHENGOMA SINGIDA RURAL CENTRAL ZONE SINGIDA DISTRICT LIVESTOCK OFFICER
171 THERESIA NGENDELLO UKILIGURU AGRICULTURAL RESEARCH INSTITUTE LAKE ZONE MWANZA RESEARCHER
172 THOMAS NYAMBA NJORECU LTD SOUTHERN HIGHLAND ZONE NJOMBE MANAGER 173 Timotheo Sosiya (??) Regional Secretariat NORTHERN ZONE TANGA Regional Forest Officer 174 VICENT MWAFUTE MBINGA DISTRICT SOUTHERN ZONE RUVUMA DISTRICT FOREST OFFICER
175 WILBERT MAHUNDI TMMTF Tanzanian Mineral Mining Trust Fund SOUTHERN ZONE RUVUMA DIRECTOR
176 Yibarila Chiza kamele Handeni District Council NORTHERN ZONE TANGA Production and marketing officer 177 YOBU KIUNGO REGIONAL SECRETARIET WESTERN ZONE TABORA REGIONAL FOREST OFFICER 178 YOHAN TESSUA FIDE Friends in Development CENTRAL ZONE MANYARA CHAIRMAN 179 YOHANA NCHIMBI TCCIA SOUTHERN ZONE RUVUMA REGIONAL CHAIRMAN 180 YUSTO MUCHURUZA KADETFU LAKE ZONE KAGERA DIRECTOR 181 ZAWADI JILALA SUA EASTERN ZONE MOROGORO PROJECT FIELD TEAM MEMBER 182 ZEDEKIAH OSANO MSALALA DISTRICT WESTERN ZONE SHINYANGA DISTRICT AGRICULTURE OFFICER 183 AYUBU OMARY NORTHERN ZONE 184 MPISHI ABSHIR NORTHERN ZONE 185 RICHARD MBUGITON NORTHERN ZONE
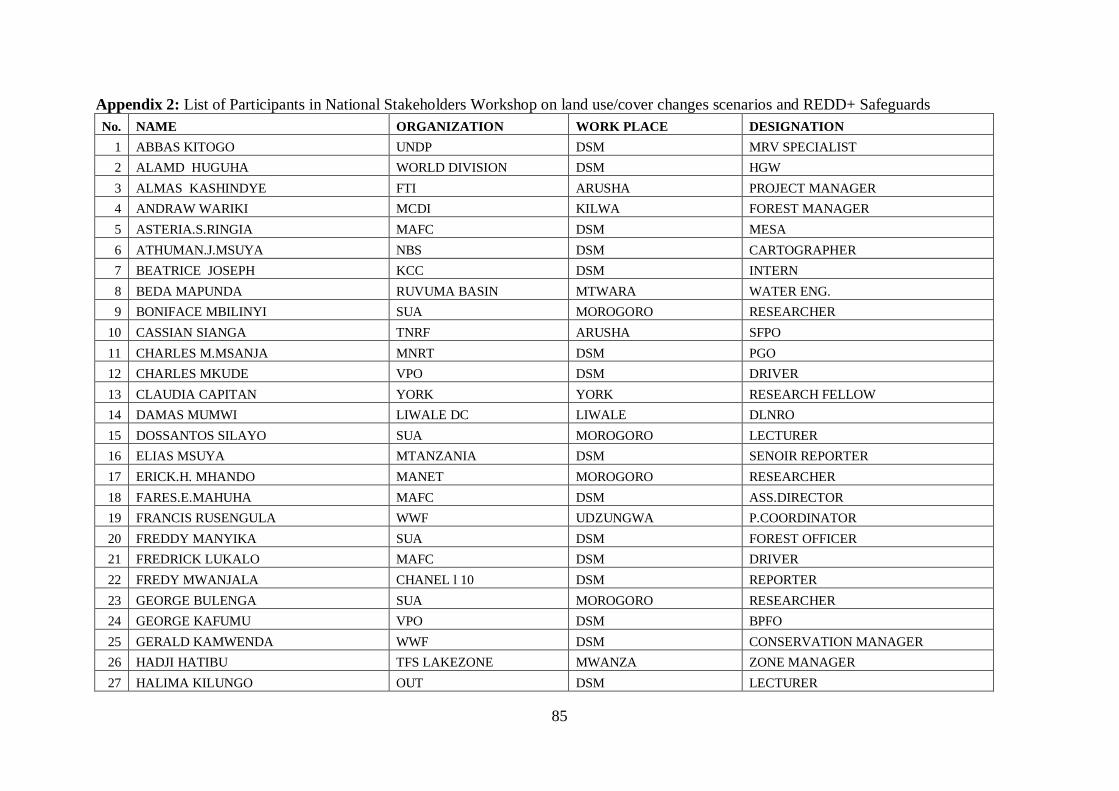
85
Appendix 2: List of Participants in National Stakeholders Workshop on land use/cover changes scenarios and REDD+ Safeguards No. NAME ORGANIZATION WORK PLACE DESIGNATION
1 ABBAS KITOGO UNDP DSM MRV SPECIALIST 2 ALAMD HUGUHA WORLD DIVISION DSM HGW 3 ALMAS KASHINDYE FTI ARUSHA PROJECT MANAGER 4 ANDRAW WARIKI MCDI KILWA FOREST MANAGER 5 ASTERIA.S.RINGIA MAFC DSM MESA 6 ATHUMAN.J.MSUYA NBS DSM CARTOGRAPHER 7 BEATRICE JOSEPH KCC DSM INTERN 8 BEDA MAPUNDA RUVUMA BASIN MTWARA WATER ENG. 9 BONIFACE MBILINYI SUA MOROGORO RESEARCHER
10 CASSIAN SIANGA TNRF ARUSHA SFPO 11 CHARLES M.MSANJA MNRT DSM PGO 12 CHARLES MKUDE VPO DSM DRIVER 13 CLAUDIA CAPITAN YORK YORK RESEARCH FELLOW 14 DAMAS MUMWI LIWALE DC LIWALE DLNRO 15 DOSSANTOS SILAYO SUA MOROGORO LECTURER 16 ELIAS MSUYA MTANZANIA DSM SENOIR REPORTER 17 ERICK.H. MHANDO MANET MOROGORO RESEARCHER 18 FARES.E.MAHUHA MAFC DSM ASS.DIRECTOR 19 FRANCIS RUSENGULA WWF UDZUNGWA P.COORDINATOR 20 FREDDY MANYIKA SUA DSM FOREST OFFICER 21 FREDRICK LUKALO MAFC DSM DRIVER 22 FREDY MWANJALA CHANEL l 10 DSM REPORTER 23 GEORGE BULENGA SUA MOROGORO RESEARCHER 24 GEORGE KAFUMU VPO DSM BPFO 25 GERALD KAMWENDA WWF DSM CONSERVATION MANAGER 26 HADJI HATIBU TFS LAKEZONE MWANZA ZONE MANAGER 27 HALIMA KILUNGO OUT DSM LECTURER
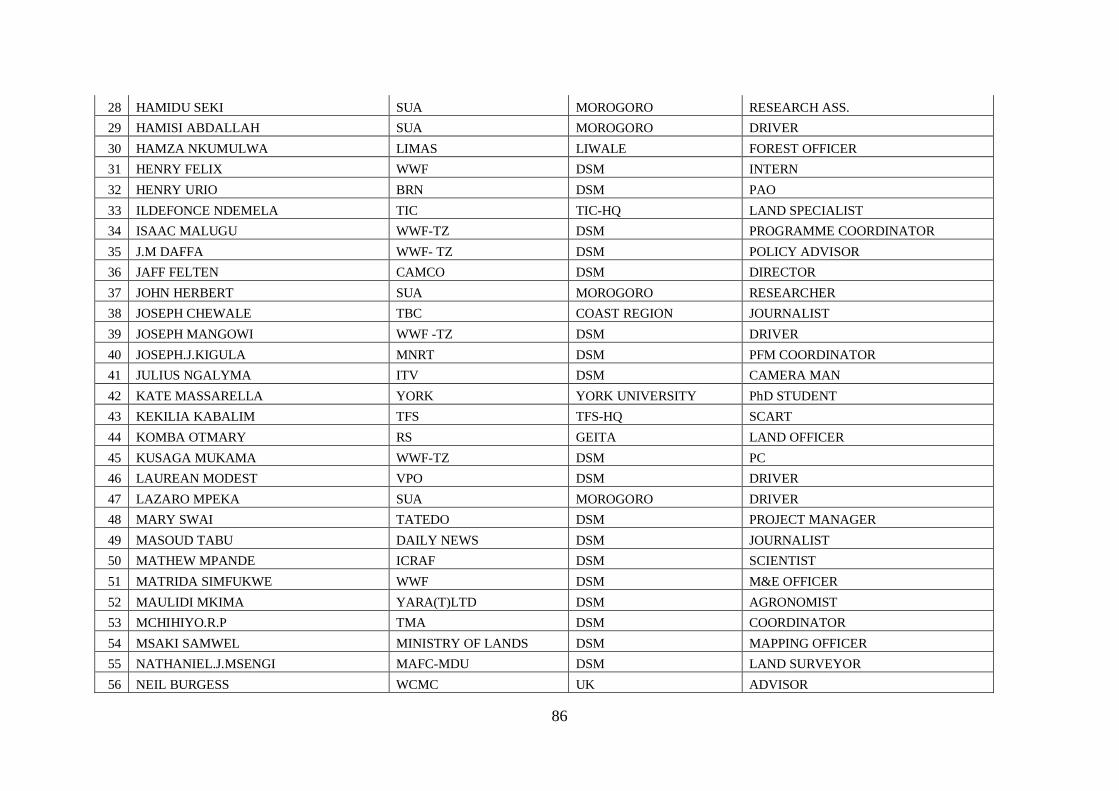
86
28 HAMIDU SEKI SUA MOROGORO RESEARCH ASS. 29 HAMISI ABDALLAH SUA MOROGORO DRIVER 30 HAMZA NKUMULWA LIMAS LIWALE FOREST OFFICER 31 HENRY FELIX WWF DSM INTERN 32 HENRY URIO BRN DSM PAO 33 ILDEFONCE NDEMELA TIC TIC-HQ LAND SPECIALIST 34 ISAAC MALUGU WWF-TZ DSM PROGRAMME COORDINATOR 35 J.M DAFFA WWF- TZ DSM POLICY ADVISOR 36 JAFF FELTEN CAMCO DSM DIRECTOR 37 JOHN HERBERT SUA MOROGORO RESEARCHER 38 JOSEPH CHEWALE TBC COAST REGION JOURNALIST 39 JOSEPH MANGOWI WWF -TZ DSM DRIVER 40 JOSEPH.J.KIGULA MNRT DSM PFM COORDINATOR 41 JULIUS NGALYMA ITV DSM CAMERA MAN 42 KATE MASSARELLA YORK YORK UNIVERSITY PhD STUDENT 43 KEKILIA KABALIM TFS TFS-HQ SCART 44 KOMBA OTMARY RS GEITA LAND OFFICER 45 KUSAGA MUKAMA WWF-TZ DSM PC 46 LAUREAN MODEST VPO DSM DRIVER 47 LAZARO MPEKA SUA MOROGORO DRIVER 48 MARY SWAI TATEDO DSM PROJECT MANAGER 49 MASOUD TABU DAILY NEWS DSM JOURNALIST 50 MATHEW MPANDE ICRAF DSM SCIENTIST 51 MATRIDA SIMFUKWE WWF DSM M&E OFFICER 52 MAULIDI MKIMA YARA(T)LTD DSM AGRONOMIST 53 MCHIHIYO.R.P TMA DSM COORDINATOR 54 MSAKI SAMWEL MINISTRY OF LANDS DSM MAPPING OFFICER 55 NATHANIEL.J.MSENGI MAFC-MDU DSM LAND SURVEYOR 56 NEIL BURGESS WCMC UK ADVISOR
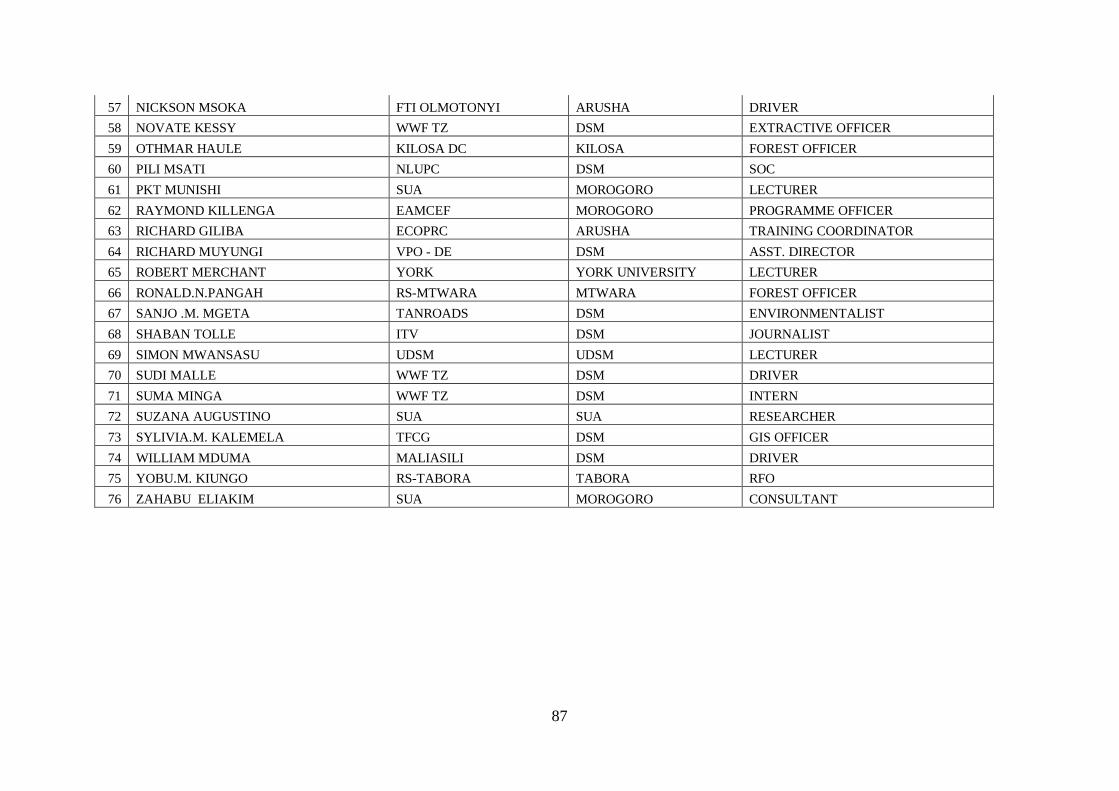
87
57 NICKSON MSOKA FTI OLMOTONYI ARUSHA DRIVER 58 NOVATE KESSY WWF TZ DSM EXTRACTIVE OFFICER 59 OTHMAR HAULE KILOSA DC KILOSA FOREST OFFICER 60 PILI MSATI NLUPC DSM SOC 61 PKT MUNISHI SUA MOROGORO LECTURER 62 RAYMOND KILLENGA EAMCEF MOROGORO PROGRAMME OFFICER 63 RICHARD GILIBA ECOPRC ARUSHA TRAINING COORDINATOR 64 RICHARD MUYUNGI VPO - DE DSM ASST. DIRECTOR 65 ROBERT MERCHANT YORK YORK UNIVERSITY LECTURER 66 RONALD.N.PANGAH RS-MTWARA MTWARA FOREST OFFICER 67 SANJO .M. MGETA TANROADS DSM ENVIRONMENTALIST 68 SHABAN TOLLE ITV DSM JOURNALIST 69 SIMON MWANSASU UDSM UDSM LECTURER 70 SUDI MALLE WWF TZ DSM DRIVER 71 SUMA MINGA WWF TZ DSM INTERN 72 SUZANA AUGUSTINO SUA SUA RESEARCHER 73 SYLIVIA.M. KALEMELA TFCG DSM GIS OFFICER 74 WILLIAM MDUMA MALIASILI DSM DRIVER 75 YOBU.M. KIUNGO RS-TABORA TABORA RFO 76 ZAHABU ELIAKIM SUA MOROGORO CONSULTANT
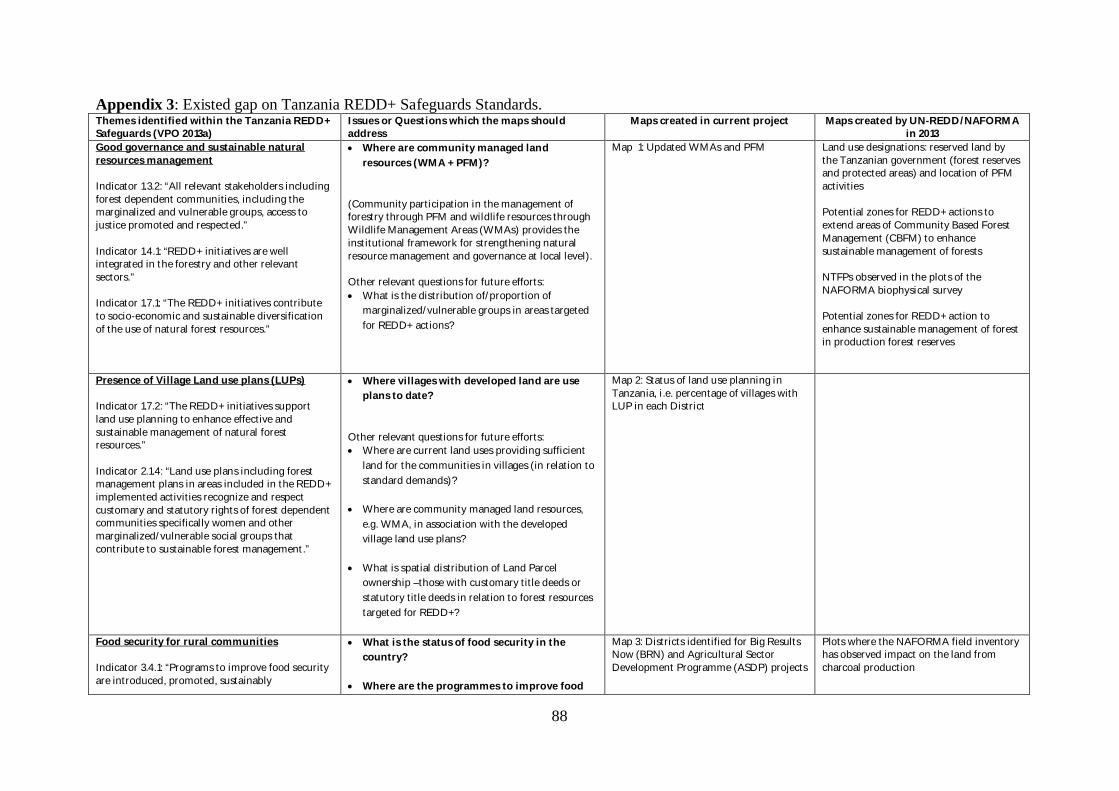
88
Appendix 3: Existed gap on Tanzania REDD+ Safeguards Standards. Themes identified within the Tanzania REDD+ Safeguards (VPO 2013a)
Issues or Questions which the maps should address
Maps created in current project
Maps created by UN-REDD/NAFORMA in 2013
Good governance and sustainable natural resources management Indicator 1.3.2: “All relevant stakeholders including forest dependent communities, including the marginalized and vulnerable groups, access to justice promoted and respected.” Indicator 1.4.1: “REDD+ initiatives are well integrated in the forestry and other relevant sectors.” Indicator 1.7.1: “The REDD+ initiatives contribute to socio-economic and sustainable diversification of the use of natural forest resources.”
Where are community managed land resources (WMA + PFM)?
(Community participation in the management of forestry through PFM and wildlife resources through Wildlife Management Areas (WMAs) provides the institutional framework for strengthening natural resource management and governance at local level). Other relevant questions for future efforts: What is the distribution of/proportion of
marginalized/vulnerable groups in areas targeted for REDD+ actions?
Map 1: Updated WMAs and PFM
Land use designations: reserved land by the Tanzanian government (forest reserves and protected areas) and location of PFM activities Potential zones for REDD+ actions to extend areas of Community Based Forest Management (CBFM) to enhance sustainable management of forests NTFPs observed in the plots of the NAFORMA biophysical survey Potential zones for REDD+ action to enhance sustainable management of forest in production forest reserves
Presence of Village Land use plans (LUPs) Indicator 1.7.2: “The REDD+ initiatives support land use planning to enhance effective and sustainable management of natural forest resources.” Indicator 2.1.4: “Land use plans including forest management plans in areas included in the REDD+ implemented activities recognize and respect customary and statutory rights of forest dependent communities specifically women and other marginalized/vulnerable social groups that contribute to sustainable forest management.”
Where villages with developed land are use plans to date?
Other relevant questions for future efforts: Where are current land uses providing sufficient
land for the communities in villages (in relation to standard demands)?
Where are community managed land resources, e.g. WMA, in association with the developed village land use plans?
What is spatial distribution of Land Parcel ownership –those with customary title deeds or statutory title deeds in relation to forest resources targeted for REDD+?
Map 2: Status of land use planning in Tanzania, i.e. percentage of villages with LUP in each District
Food security for rural communities Indicator 3.4.1: “Programs to improve food security are introduced, promoted, sustainably
What is the status of food security in the country?
Where are the programmes to improve food
Map 3: Districts identified for Big Results Now (BRN) and Agricultural Sector Development Programme (ASDP) projects
Plots where the NAFORMA field inventory has observed impact on the land from charcoal production
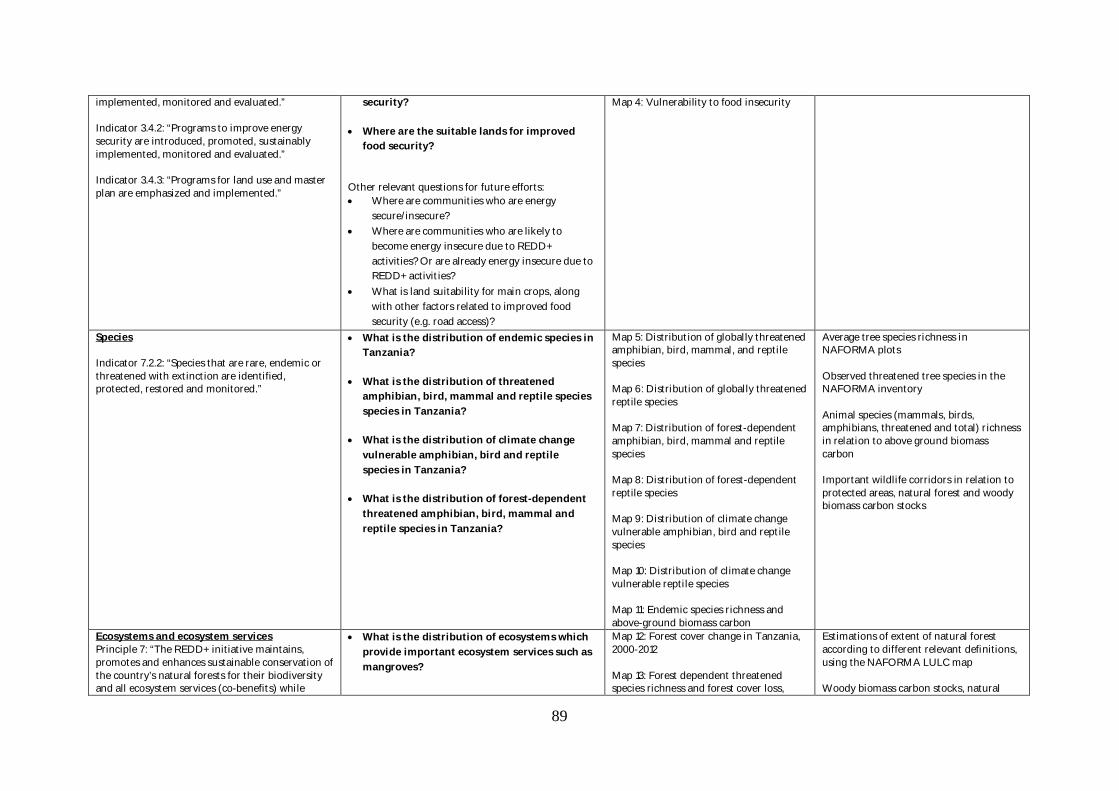
89
implemented, monitored and evaluated.” Indicator 3.4.2: “Programs to improve energy security are introduced, promoted, sustainably implemented, monitored and evaluated.” Indicator 3.4.3: “Programs for land use and master plan are emphasized and implemented.”
security?
Where are the suitable lands for improved food security?
Other relevant questions for future efforts: Where are communities who are energy
secure/insecure? Where are communities who are likely to
become energy insecure due to REDD+ activities? Or are already energy insecure due to REDD+ activities?
What is land suitability for main crops, along with other factors related to improved food security (e.g. road access)?
Map 4: Vulnerability to food insecurity
Species Indicator 7.2.2: “Species that are rare, endemic or threatened with extinction are identified, protected, restored and monitored.”
What is the distribution of endemic species in Tanzania?
What is the distribution of threatened amphibian, bird, mammal and reptile species species in Tanzania?
What is the distribution of climate change vulnerable amphibian, bird and reptile species in Tanzania?
What is the distribution of forest-dependent threatened amphibian, bird, mammal and reptile species in Tanzania?
Map 5: Distribution of globally threatened amphibian, bird, mammal, and reptile species Map 6: Distribution of globally threatened reptile species Map 7: Distribution of forest-dependent amphibian, bird, mammal and reptile species Map 8: Distribution of forest-dependent reptile species Map 9: Distribution of climate change vulnerable amphibian, bird and reptile species Map 10: Distribution of climate change vulnerable reptile species Map 11: Endemic species richness and above-ground biomass carbon
Average tree species richness in NAFORMA plots Observed threatened tree species in the NAFORMA inventory Animal species (mammals, birds, amphibians, threatened and total) richness in relation to above ground biomass carbon Important wildlife corridors in relation to protected areas, natural forest and woody biomass carbon stocks
Ecosystems and ecosystem services Principle 7: “The REDD+ initiative maintains, promotes and enhances sustainable conservation of the country’s natural forests for their biodiversity and all ecosystem services (co-benefits) while
What is the distribution of ecosystems which provide important ecosystem services such as mangroves?
Map 12: Forest cover change in Tanzania, 2000-2012 Map 13: Forest dependent threatened species richness and forest cover loss,
Estimations of extent of natural forest according to different relevant definitions, using the NAFORMA LULC map Woody biomass carbon stocks, natural
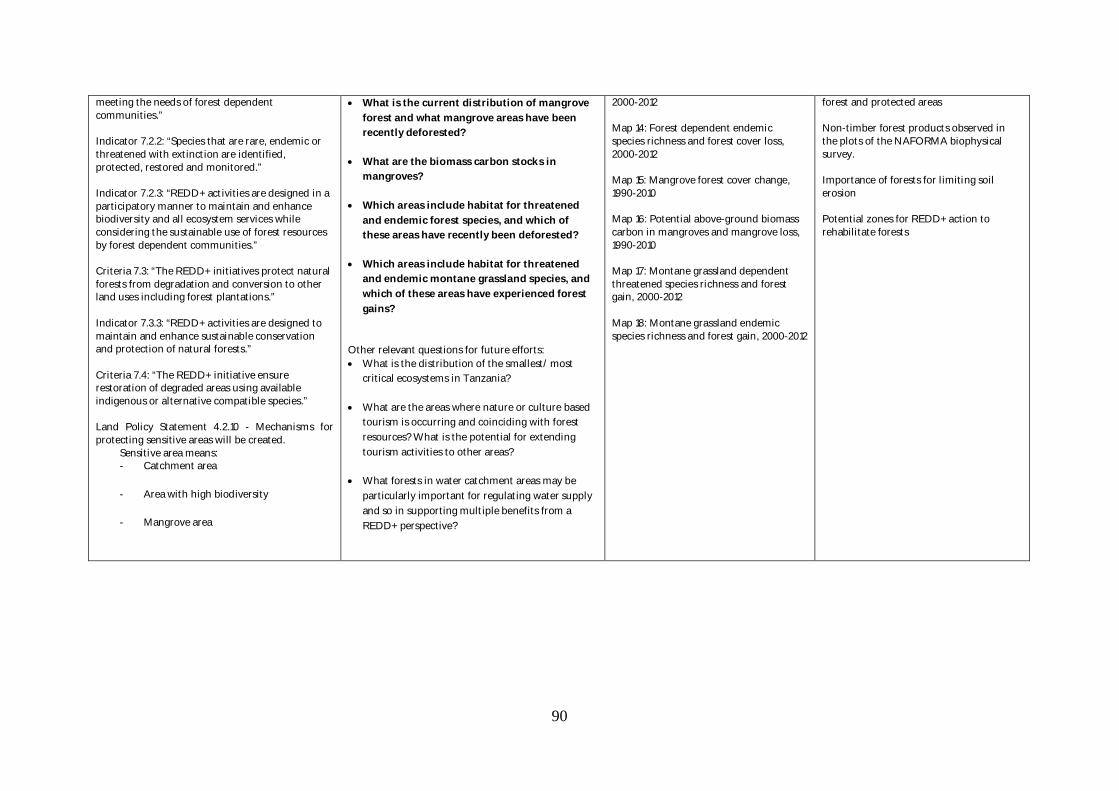
90
meeting the needs of forest dependent communities.” Indicator 7.2.2: “Species that are rare, endemic or threatened with extinction are identified, protected, restored and monitored.” Indicator 7.2.3: “REDD+ activities are designed in a participatory manner to maintain and enhance biodiversity and all ecosystem services while considering the sustainable use of forest resources by forest dependent communities.” Criteria 7.3: “The REDD+ initiatives protect natural forests from degradation and conversion to other land uses including forest plantations.” Indicator 7.3.3: “REDD+ activities are designed to maintain and enhance sustainable conservation and protection of natural forests.” Criteria 7.4: “The REDD+ initiative ensure restoration of degraded areas using available indigenous or alternative compatible species.” Land Policy Statement 4.2.10 - Mechanisms for protecting sensitive areas will be created.
Sensitive area means: - Catchment area
- Area with high biodiversity
- Mangrove area
What is the current distribution of mangrove forest and what mangrove areas have been recently deforested?
What are the biomass carbon stocks in mangroves?
Which areas include habitat for threatened and endemic forest species, and which of these areas have recently been deforested?
Which areas include habitat for threatened and endemic montane grassland species, and which of these areas have experienced forest gains?
Other relevant questions for future efforts: What is the distribution of the smallest/ most
critical ecosystems in Tanzania?
What are the areas where nature or culture based tourism is occurring and coinciding with forest resources? What is the potential for extending tourism activities to other areas?
What forests in water catchment areas may be particularly important for regulating water supply and so in supporting multiple benefits from a REDD+ perspective?
2000-2012 Map 14: Forest dependent endemic species richness and forest cover loss, 2000-2012 Map 15: Mangrove forest cover change, 1990-2010 Map 16: Potential above-ground biomass carbon in mangroves and mangrove loss, 1990-2010 Map 17: Montane grassland dependent threatened species richness and forest gain, 2000-2012 Map 18: Montane grassland endemic species richness and forest gain, 2000-2012
forest and protected areas Non-timber forest products observed in the plots of the NAFORMA biophysical survey. Importance of forests for limiting soil erosion Potential zones for REDD+ action to rehabilitate forests
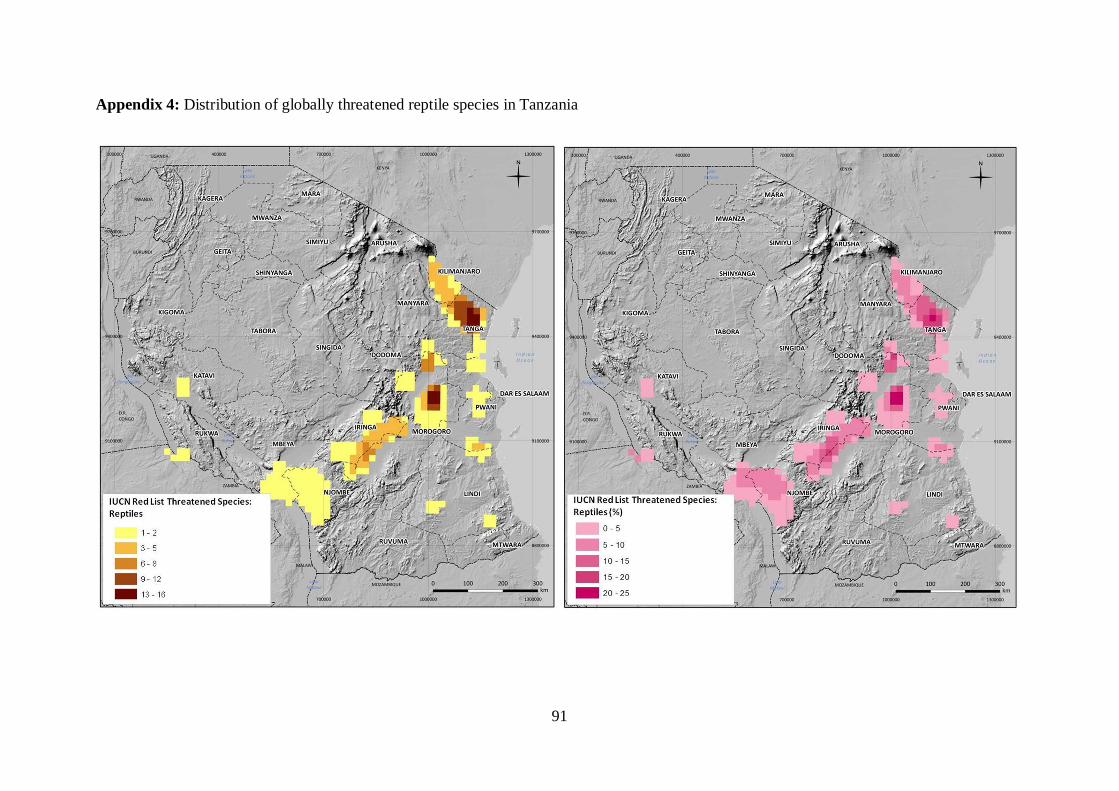
91
Appendix 4: Distribution of globally threatened reptile species in Tanzania
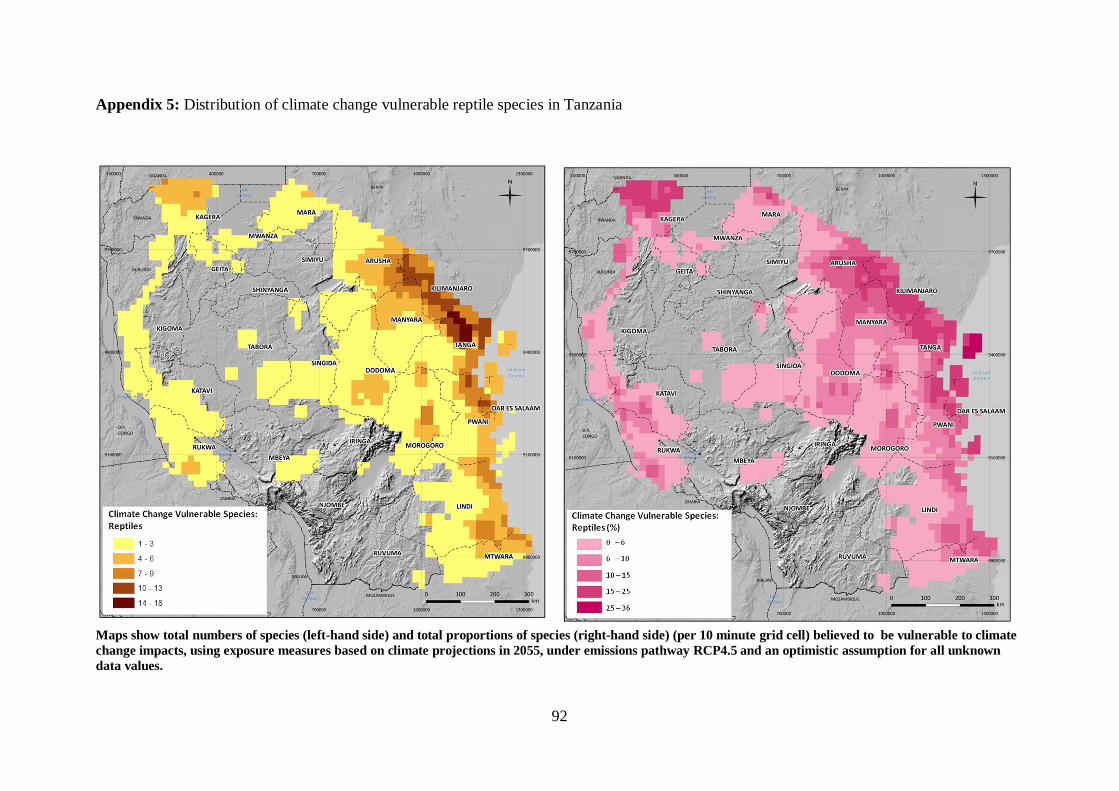
92
Appendix 5: Distribution of climate change vulnerable reptile species in Tanzania Maps show total numbers of species (left-hand side) and total proportions of species (right-hand side) (per 10 minute grid cell) believed to be vulnerable to climate change impacts, using exposure measures based on climate projections in 2055, under emissions pathway RCP4.5 and an optimistic assumption for all unknown data values.
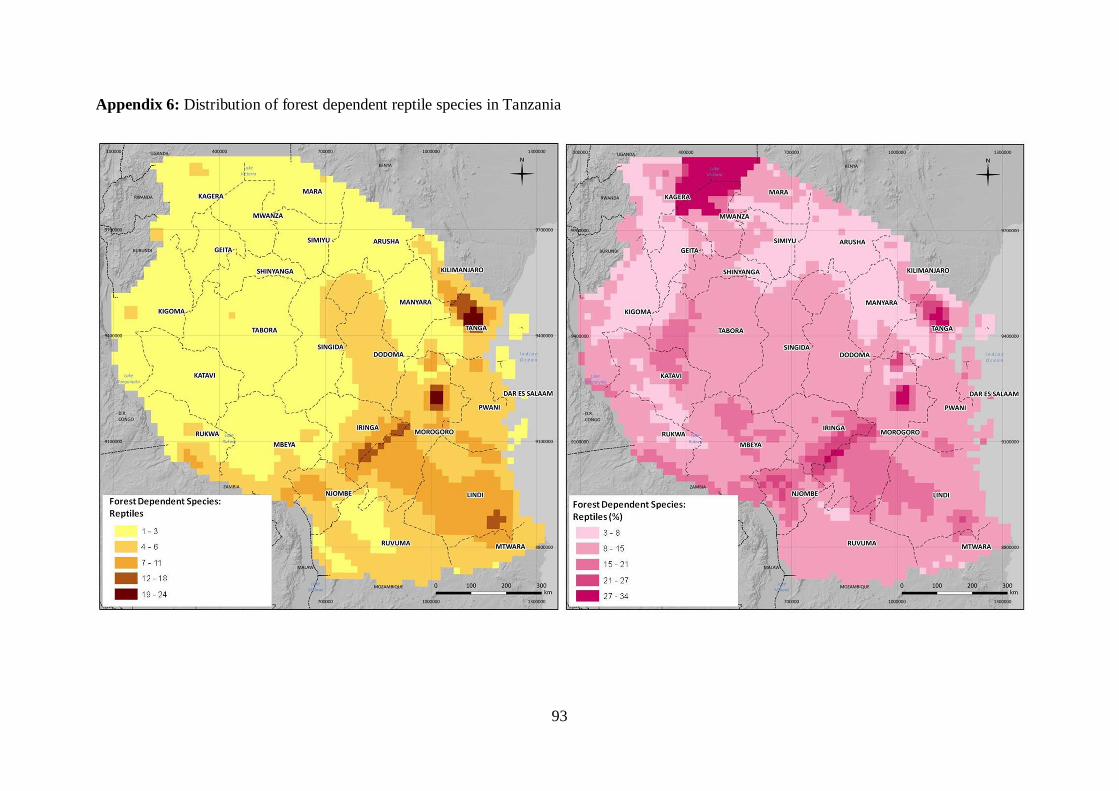
93
Appendix 6: Distribution of forest dependent reptile species in Tanzania
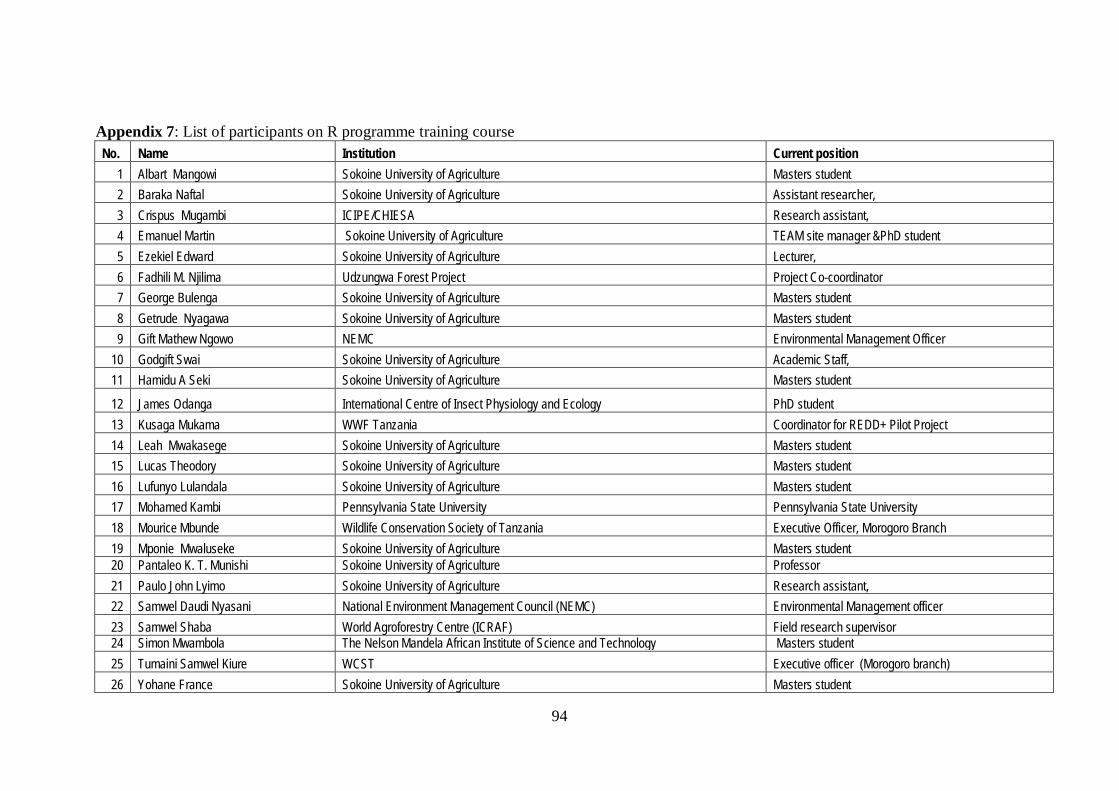
94
Appendix 7: List of participants on R programme training course No. Name Institution Current position
1 Albart Mangowi Sokoine University of Agriculture Masters student 2 Baraka Naftal Sokoine University of Agriculture Assistant researcher, 3 Crispus Mugambi ICIPE/CHIESA Research assistant, 4 Emanuel Martin Sokoine University of Agriculture TEAM site manager &PhD student 5 Ezekiel Edward Sokoine University of Agriculture Lecturer, 6 Fadhili M. Njilima Udzungwa Forest Project Project Co-coordinator 7 George Bulenga Sokoine University of Agriculture Masters student 8 Getrude Nyagawa Sokoine University of Agriculture Masters student 9 Gift Mathew Ngowo NEMC Environmental Management Officer
10 Godgift Swai Sokoine University of Agriculture Academic Staff, 11 Hamidu A Seki Sokoine University of Agriculture Masters student
12 James Odanga International Centre of Insect Physiology and Ecology PhD student 13 Kusaga Mukama WWF Tanzania Coordinator for REDD+ Pilot Project 14 Leah Mwakasege Sokoine University of Agriculture Masters student 15 Lucas Theodory Sokoine University of Agriculture Masters student 16 Lufunyo Lulandala Sokoine University of Agriculture Masters student 17 Mohamed Kambi Pennsylvania State University Pennsylvania State University 18 Mourice Mbunde Wildlife Conservation Society of Tanzania Executive Officer, Morogoro Branch 19 Mponie Mwaluseke Sokoine University of Agriculture Masters student 20 Pantaleo K. T. Munishi Sokoine University of Agriculture Professor 21 Paulo John Lyimo Sokoine University of Agriculture Research assistant, 22 Samwel Daudi Nyasani National Environment Management Council (NEMC) Environmental Management officer 23 Samwel Shaba World Agroforestry Centre (ICRAF) Field research supervisor 24 Simon Mwambola The Nelson Mandela African Institute of Science and Technology Masters student 25 Tumaini Samwel Kiure WCST Executive officer (Morogoro branch) 26 Yohane France Sokoine University of Agriculture Masters student

95
27 Zawadi Jilala Sokoine University of Agriculture Masters student
Appendix 8: List of Participants for training workshop on developing land use/cover scenarios
No Name Designation Organisation
1 Adrew Ferdinands GIS &IT Expert Private Forest Programme 2 Almas Kashindye Project Coordinator ECOPRC 3 Dr. Claudia Capitani Facilitator University of York 4 Dr. Reuben Kadigi Lecturer and Ass.Prof. SUA 5 Elikana John GIS Analyst Tanzania Forest Service 6 Emmanuel Lyimo M&E TFCG 7 Endeshi Melakiti Cartographer Ministry of Land 8 Gloria Nderumaki Teacher Karatu Secondary 9 Halima Kilungu Lecturer Open University of Tanzania
10 Jacob Mlula Driver WWF Tanzania 11 Kekilia Kabalimu SCARTO TFS 12 Mukama Kusaga Project Coordinator WWF Tanzania 13 Nickson Msoka Driver ECOPRC 14 Prof. PKT Munishi Prof. and Lecturer SUA 15 Richard Giliba Training Coordinator Olmotonyi Forest training Institute 16 Rose Akombo Ass. Director Kenya Forest Services
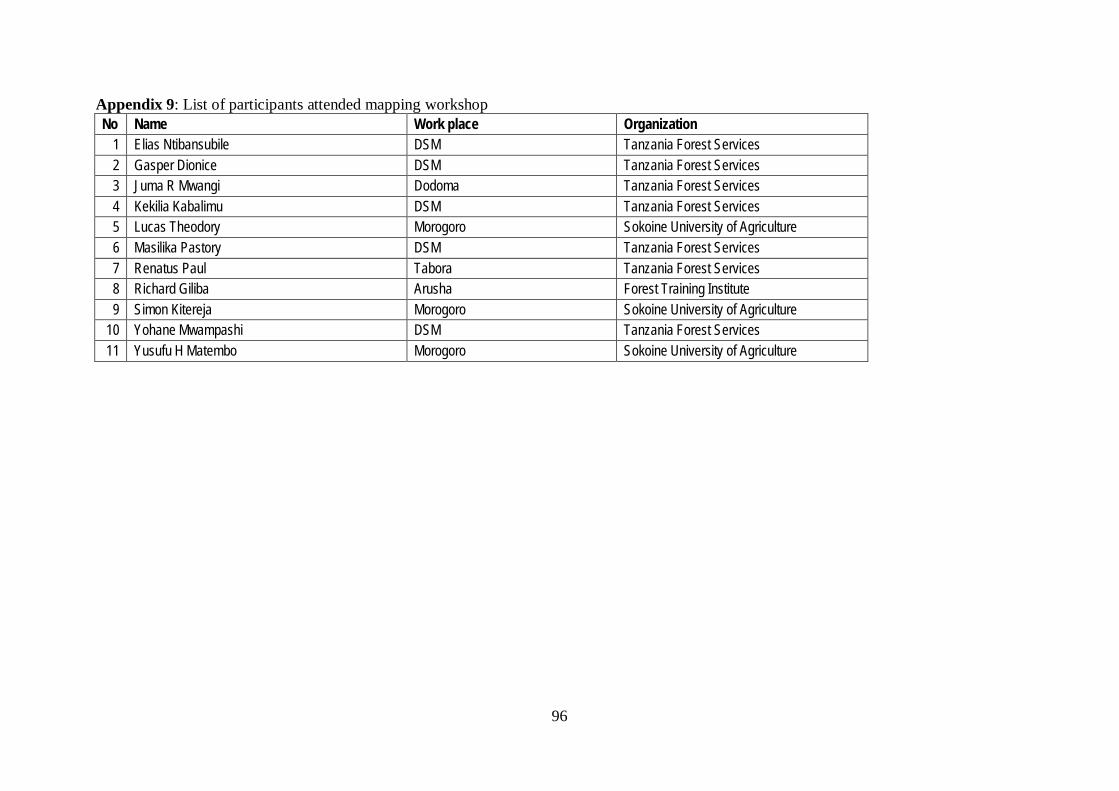
96
Appendix 9: List of participants attended mapping workshop No Name Work place Organization
1 Elias Ntibansubile DSM Tanzania Forest Services 2 Gasper Dionice DSM Tanzania Forest Services 3 Juma R Mwangi Dodoma Tanzania Forest Services 4 Kekilia Kabalimu DSM Tanzania Forest Services 5 Lucas Theodory Morogoro Sokoine University of Agriculture 6 Masilika Pastory DSM Tanzania Forest Services 7 Renatus Paul Tabora Tanzania Forest Services 8 Richard Giliba Arusha Forest Training Institute 9 Simon Kitereja Morogoro Sokoine University of Agriculture
10 Yohane Mwampashi DSM Tanzania Forest Services 11 Yusufu H Matembo Morogoro Sokoine University of Agriculture


![Redd project indonesia steni 11 [compatibility mode]](https://img.pdfslide.us/doc/110x75/54756576b4af9fb40a8b5ba9/redd-project-indonesia-steni-11-compatibility-mode.jpg)