Embed Size (px)
Citation preview
1
FINAL PROJECT DEGREE
“DESIGN AND INTENSIFICATION
OF A CELLULOSE DRYER”
Research worker
Esther Sánchez Palá
Supervisor
Tuomas Koiranen
Chemical Engineering Department
Lappeenranta University of Technology
2017
2
Table of content
Background of the Project ............................................................................................................. 3
Definition of goals and scheduling ................................................................................................ 3
Market survey ................................................................................................................................ 4
Initial idea about the process description ...................................................................................... 5
Initial selection for the main equipment in the drying process ..................................................... 6
Initial selection of flash dryer ........................................................................................................ 8
Process description ...................................................................................................................... 10
Block diagram ............................................................................................................................. 12
Process flow diagram .................................................................................................................. 13
Process and instrumental diagram ............................................................................................... 14
Process flow calculations ............................................................................................................ 15
Utilities .................................................................................................................................... 17
Selection of the equipment .......................................................................................................... 18
Screw press .............................................................................................................................. 19
Feeder ...................................................................................................................................... 19
Drying chamber ....................................................................................................................... 20
Cyclone with dust separation arrangement ............................................................................. 20
Rotary feeder ........................................................................................................................... 21
Lay-out design of the plant (3D MODEL) .................................................................................. 21
Economic analysis of the project ................................................................................................ 24
Conclusions ................................................................................................................................. 30
References ................................................................................................................................... 31
3
Background of the Project
The pulp and paper industry is heavily involved in developing new products from biomass
and cellulosic material. In this context there is a constant search for appropriate
production methods. One unit operation that comes into play is drying. The drying step
in processing biomass and cellulosic material serves several purposes such as reducing
transport and storage costs and extending shelf life. Also, in many cases the material
needs to be dry in order to be processed further. In such cases the properties of the dry
material is of significant importance. Thus it is important to use the drying process that
will give the dry material the right properties. Intensification of the drying process is
another key issue for nowadays research. The experience of using various presses and
chemical additions for the intensification of drying process on preliminary steps is already
existing practice. In order of this project, the flash drying process must be intensified
using the press and unit for the addition of chemicals aiming on moisture reduction in the
pulp feed.
Definition of goals and scheduling
Main parts of the project and description of the work goals are listed in Table 1.
4
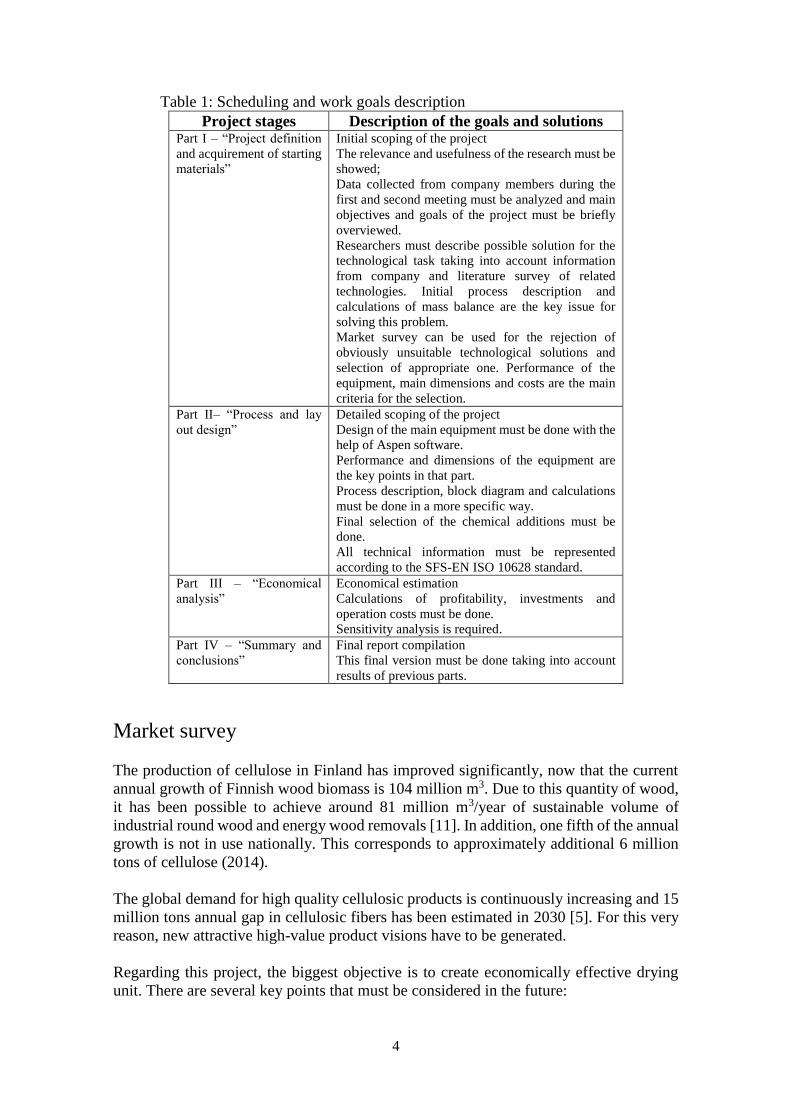
Table 1: Scheduling and work goals description
Project stages Description of the goals and solutions Part I – “Project definition
and acquirement of starting
materials”
Initial scoping of the project
The relevance and usefulness of the research must be
showed;
Data collected from company members during the
first and second meeting must be analyzed and main
objectives and goals of the project must be briefly
overviewed.
Researchers must describe possible solution for the
technological task taking into account information
from company and literature survey of related
technologies. Initial process description and
calculations of mass balance are the key issue for
solving this problem.
Market survey can be used for the rejection of
obviously unsuitable technological solutions and
selection of appropriate one. Performance of the
equipment, main dimensions and costs are the main
criteria for the selection.
Part II– “Process and lay
out design”
Detailed scoping of the project
Design of the main equipment must be done with the
help of Aspen software.
Performance and dimensions of the equipment are
the key points in that part.
Process description, block diagram and calculations
must be done in a more specific way.
Final selection of the chemical additions must be
done.
All technical information must be represented
according to the SFS-EN ISO 10628 standard.
Part III – “Economical
analysis”
Economical estimation
Calculations of profitability, investments and
operation costs must be done.
Sensitivity analysis is required.
Part IV – “Summary and
conclusions”
Final report compilation
This final version must be done taking into account
results of previous parts.
Market survey
The production of cellulose in Finland has improved significantly, now that the current
annual growth of Finnish wood biomass is 104 million m3. Due to this quantity of wood,
it has been possible to achieve around 81 million m3/year of sustainable volume of
industrial round wood and energy wood removals [11]. In addition, one fifth of the annual
growth is not in use nationally. This corresponds to approximately additional 6 million
tons of cellulose (2014).
The global demand for high quality cellulosic products is continuously increasing and 15
million tons annual gap in cellulosic fibers has been estimated in 2030 [5]. For this very
reason, new attractive high-value product visions have to be generated.
Regarding this project, the biggest objective is to create economically effective drying
unit. There are several key points that must be considered in the future:
5
Analysis of the main equipment market (where it is possible to buy the essential
equipment);
Comparison of prices and technological characteristics of different suppliers;
The selection of the appropriate equipment which answer the demands of
characteristics (capacity, price, dimensions and etc.).
Initial idea about the process description
The initial idea that has been developed about the process description is explained below.
With the study of this design probably in the following parts described in Table 1,
probably this initial idea will change.
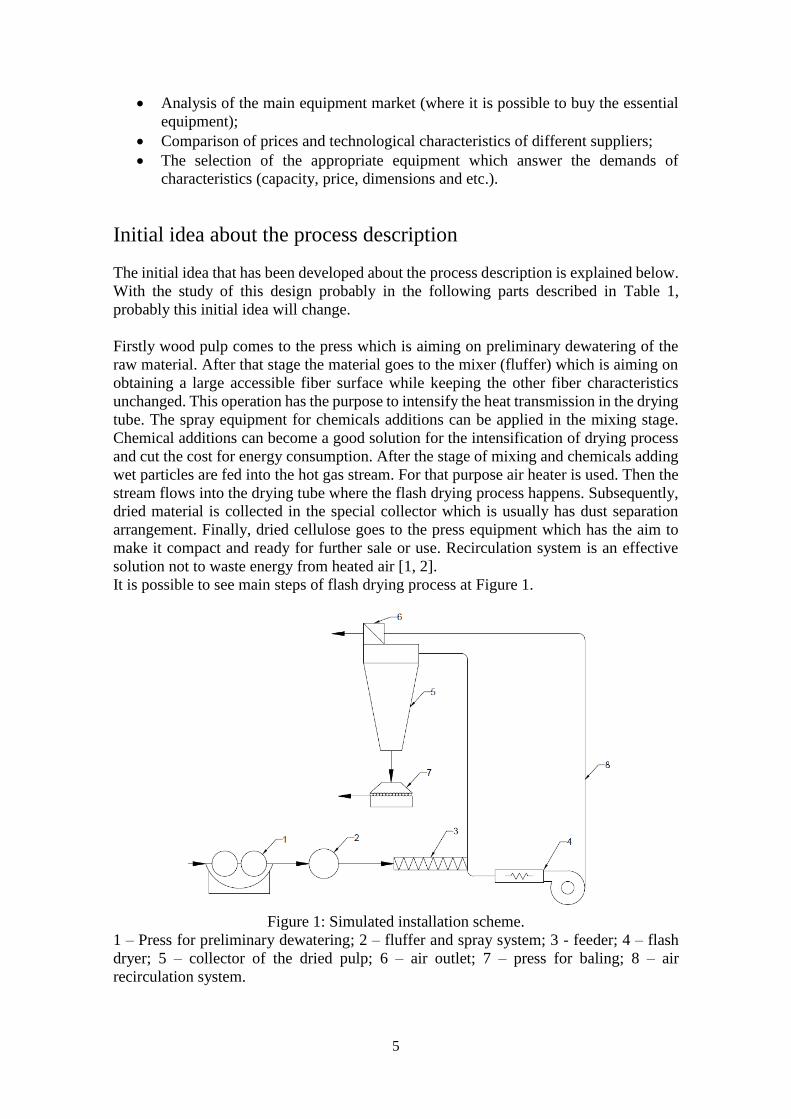
Firstly wood pulp comes to the press which is aiming on preliminary dewatering of the
raw material. After that stage the material goes to the mixer (fluffer) which is aiming on
obtaining a large accessible fiber surface while keeping the other fiber characteristics
unchanged. This operation has the purpose to intensify the heat transmission in the drying
tube. The spray equipment for chemicals additions can be applied in the mixing stage.
Chemical additions can become a good solution for the intensification of drying process
and cut the cost for energy consumption. After the stage of mixing and chemicals adding
wet particles are fed into the hot gas stream. For that purpose air heater is used. Then the
stream flows into the drying tube where the flash drying process happens. Subsequently,
dried material is collected in the special collector which is usually has dust separation
arrangement. Finally, dried cellulose goes to the press equipment which has the aim to
make it compact and ready for further sale or use. Recirculation system is an effective
solution not to waste energy from heated air [1, 2].
It is possible to see main steps of flash drying process at Figure 1.
Figure 1: Simulated installation scheme.
1 – Press for preliminary dewatering; 2 – fluffer and spray system; 3 - feeder; 4 – flash
dryer; 5 – collector of the dried pulp; 6 – air outlet; 7 – press for baling; 8 – air
recirculation system.
6
In order to achieve efficient pneumatic drying process the velocity of the gas flow must
be higher than the free fall velocity of particles otherwise the drying process will not
occur. However, the most effective drying process happens when the velocity of the gas
flow is as low as possible due to the fact that the time for the thermal contact between the
gas stream and particles is increasing that way. It is possible to note, that the flash drying
is a process for the surface moisture removal. [1].
Summary of initial process description is in Table 2.
Table 2: Basic Parameters with some additional information for the future calculations
Capacity (kg/day) 1000
Feed Moisture of material at Inlet (%) 40-45
Feed Moisture of material at Outlet (%) 10-20
Minimum Particle Size (mm) 0.7 (Softwood fibers)
Maximum Particle Size (mm) 2.5 (Softwood fibers)
Optimal Particle Size (mm) 0.7 (Softwood fibers)
Operating time per day (h/day) 8-10
Applications of the dried product
(cellulose)
Non-woven tissue, fluffy materials,
superadsorbents, etc.
Source of energy for drying process electricity
Density of the bales with compressed
dried material cellulose (kg/m3)
300
Initial selection for the main equipment in the drying process
Twin Wire Press
Mechanical extraction of liquid from the pulp is carried out different types of presses.
Advantage of this method is the separation of liquid without diluting. However, the one-
step mode is not achieved the fullness of liquid department, as developed by the pressure
in the press is not enough to remove liquor from the inner capillary cellulose fibers [2].
The operation of the pulp dewatering on the first stage can be obtained by using Twin
Wire Press. Main advantages of this technology are:
• reduced consumption of energy by flash dryer due to the fact that pre dried wood pulp
demand less thermal energy for meeting requirements in moisture content;
• gentle dewatering leading to easier maintenance;
• compact design which is extremely important to make the whole unit transportable;
• high productivity, reliability and filtrate quality.
Fluffer
Fluffer is a high-consistency mixer for pulp particles which has the purpose to obtain a
large accessible fiber surface while keeping the other fiber characteristics unchanged.
Fluffer is used for the intensification of the heat transmission to the wood pulp particles
in the flash drying stage.
Main advantages of this technology are:
• homogeneous particle size after mixing;
7
• reduce the energy consumption on the next stages;
• low investments costs;
• gentle treatment of fibers.
According to the number of phases, it is possible to find a few kinds of reactors, two of
which would be useful for this process:
a)Tubular reactor:
While the reactants flow, they are becoming products. Fluid flows at high speed,so this is
the reason that the products are unable to diffuse back and therefore there is not remixed.
The conditions at any point only changes over time of the reaction are measured in terms
of the position along the tube length.
The reaction rate is faster at the entrance of the pipe because the concentration of the
reactants is at its highest level and the reaction rate is reduced as the reactants flow
through the pipe due to the decrease in reactant concentration.
One example of tubular reactor in the market nowdays is below:
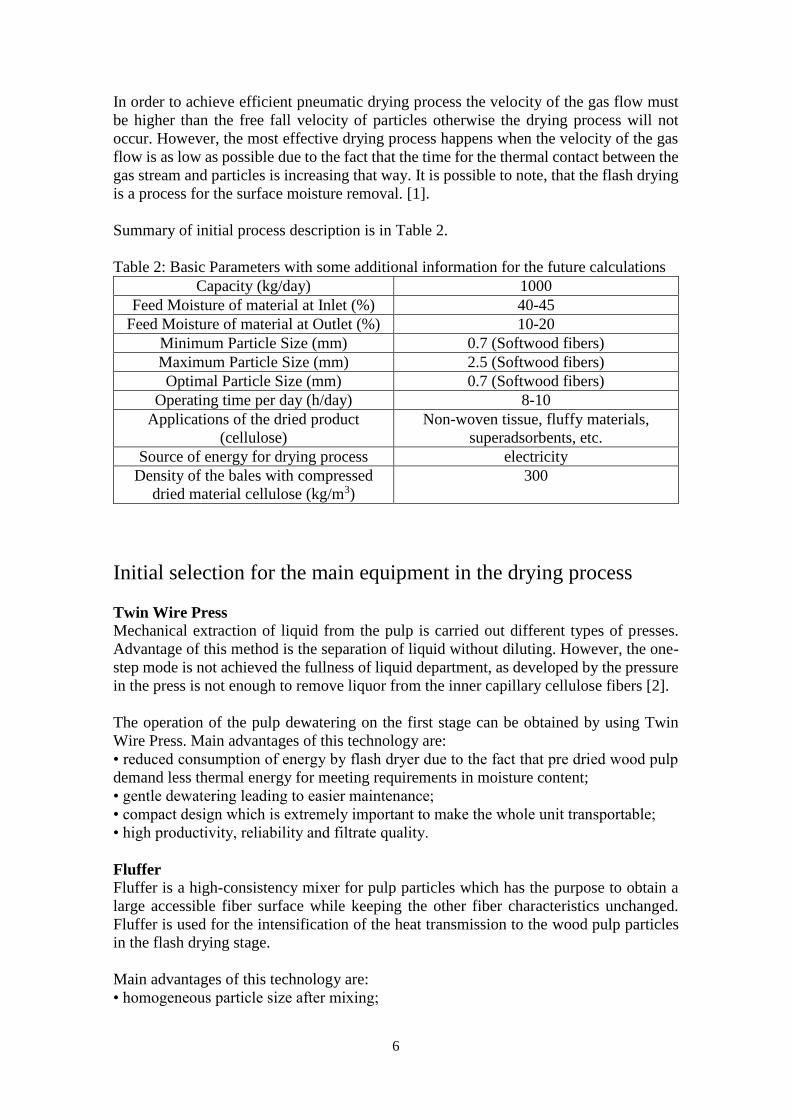
• Turbulizer Paddle mixer (used by Bepex company): is a continuous high mixer with
adjustable paddle angles and tip-to-wall clearance provides flexibility for control of
residence time and mix intensity [3].
Figure 2: turbulizer paddle mixer
b) Stirred tank reactor:
In a stirred tank reactor, one or more reagents are introduced into the reactor equipped
with an impeller (agitator), whose main function is that the products are removed
continuously. The impeller stirring the reactants to ensure a good mix so that there is a
uniform composition throughout the system.
The composition of the output is the same reactor. These are exactly the opposite of those
conditions in a tubular flow reactor.
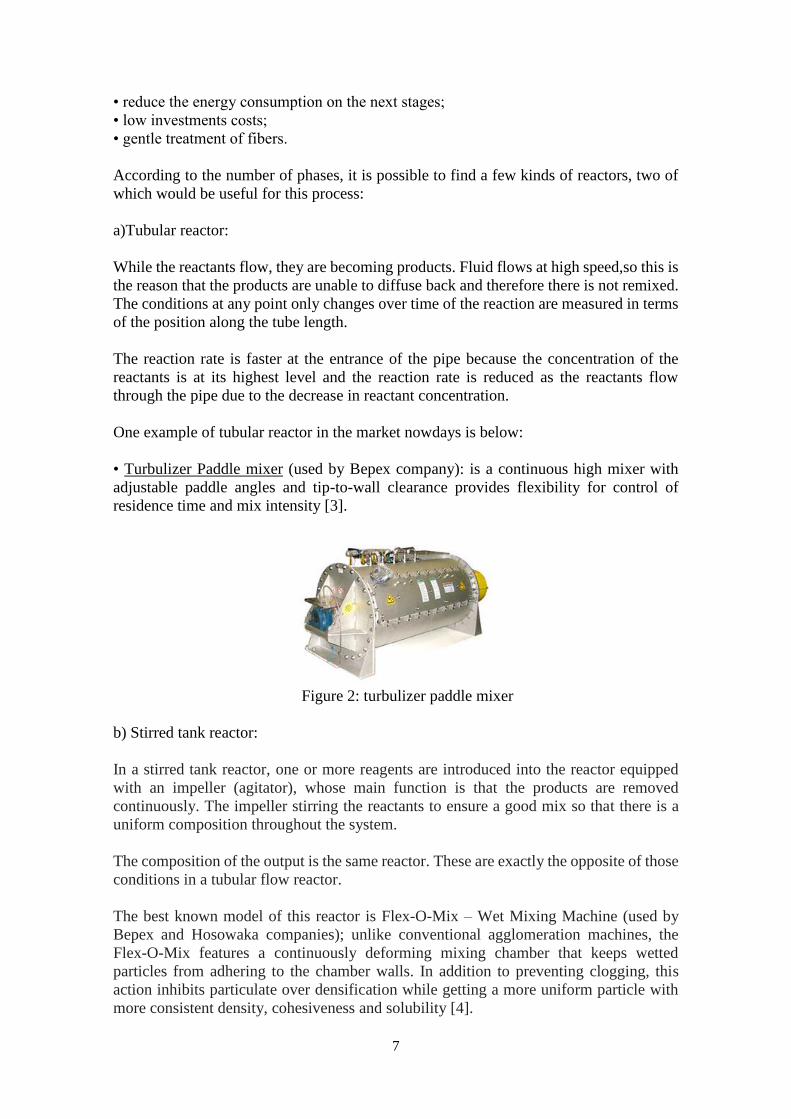
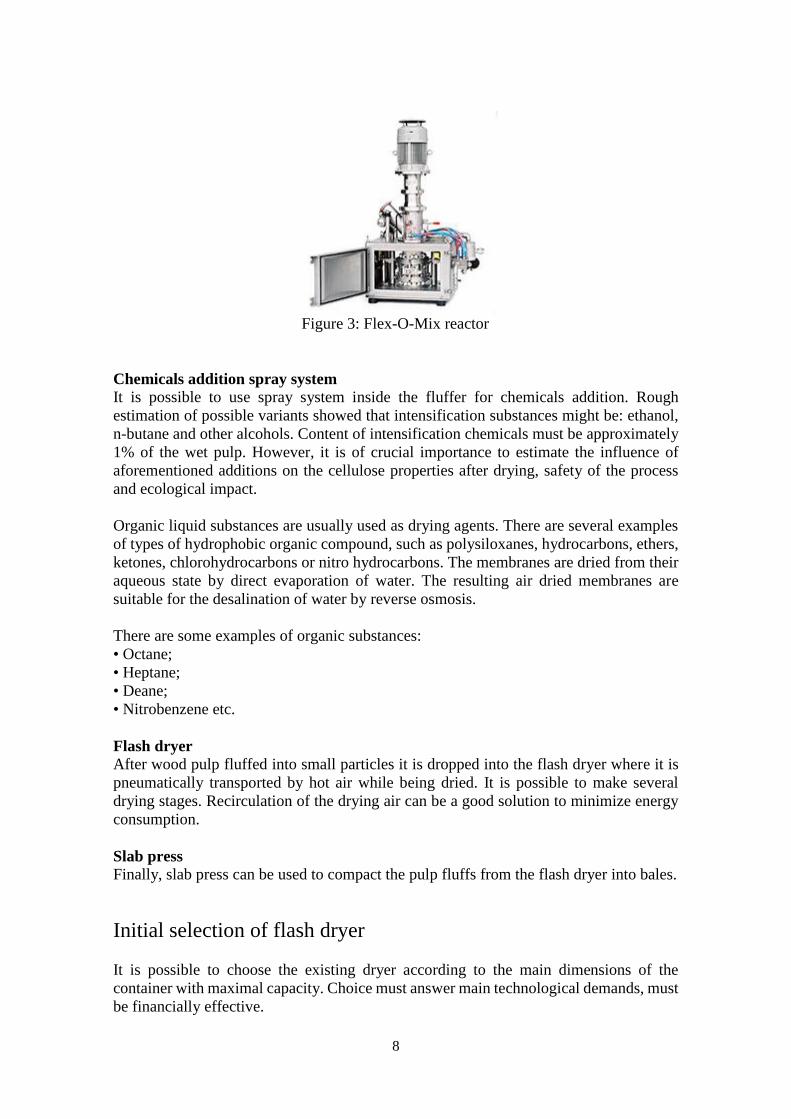
The best known model of this reactor is Flex-O-Mix – Wet Mixing Machine (used by
Bepex and Hosowaka companies); unlike conventional agglomeration machines, the
Flex-O-Mix features a continuously deforming mixing chamber that keeps wetted
particles from adhering to the chamber walls. In addition to preventing clogging, this
action inhibits particulate over densification while getting a more uniform particle with
more consistent density, cohesiveness and solubility [4].
8
Figure 3: Flex-O-Mix reactor
Chemicals addition spray system
It is possible to use spray system inside the fluffer for chemicals addition. Rough
estimation of possible variants showed that intensification substances might be: ethanol,
n-butane and other alcohols. Content of intensification chemicals must be approximately
1% of the wet pulp. However, it is of crucial importance to estimate the influence of
aforementioned additions on the cellulose properties after drying, safety of the process
and ecological impact.
Organic liquid substances are usually used as drying agents. There are several examples
of types of hydrophobic organic compound, such as polysiloxanes, hydrocarbons, ethers,
ketones, chlorohydrocarbons or nitro hydrocarbons. The membranes are dried from their
aqueous state by direct evaporation of water. The resulting air dried membranes are
suitable for the desalination of water by reverse osmosis.
There are some examples of organic substances:
• Octane;
• Heptane;
• Deane;
• Nitrobenzene etc.
Flash dryer
After wood pulp fluffed into small particles it is dropped into the flash dryer where it is
pneumatically transported by hot air while being dried. It is possible to make several
drying stages. Recirculation of the drying air can be a good solution to minimize energy
consumption.
Slab press
Finally, slab press can be used to compact the pulp fluffs from the flash dryer into bales.
Initial selection of flash dryer
It is possible to choose the existing dryer according to the main dimensions of the
container with maximal capacity. Choice must answer main technological demands, must
be financially effective.
9
Main goals:
• To create a transportable dryer using existing models;
• Container must be used as a method for transportation;
• Mobile dryer must be convenient for the exploitation, service and using.
Table 3: The size of the container [5].
Length 13,556 m
Width 2,352 m
Height 2,812 m
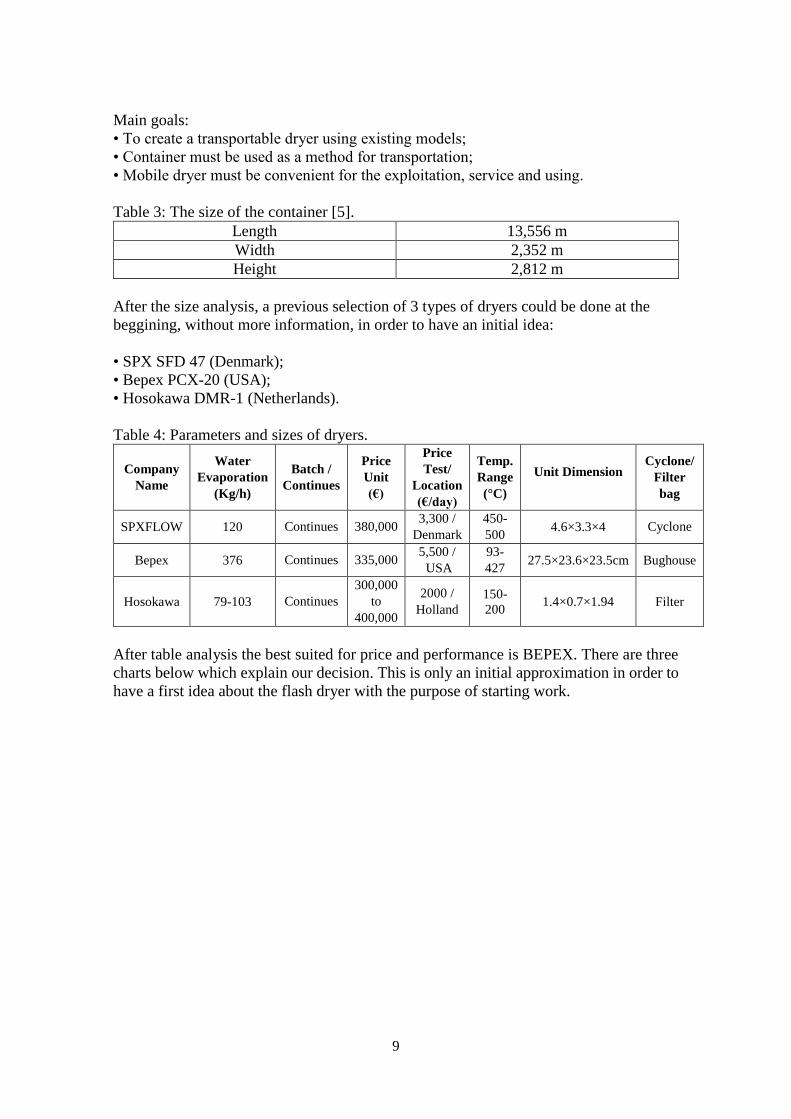
After the size analysis, a previous selection of 3 types of dryers could be done at the
beggining, without more information, in order to have an initial idea:
• SPX SFD 47 (Denmark);
• Bepex PCX-20 (USA);
• Hosokawa DMR-1 (Netherlands).
Table 4: Parameters and sizes of dryers.
Company
Name
Water
Evaporation
(Kg/h)
Batch /
Continues
Price
Unit
(€)
Price
Test/
Location
(€/day)
Temp.
Range
(°C)
Unit Dimension Cyclone/
Filter
bag
SPXFLOW 120 Continues 380,000 3,300 /
Denmark
450-
500 4.6×3.3×4 Cyclone
Bepex 376 Continues 335,000 5,500 /
USA
93-
427 27.5×23.6×23.5cm Bughouse
Hosokawa 79-103 Continues
300,000
to
400,000
2000 /
Holland 150-
200 1.4×0.7×1.94 Filter
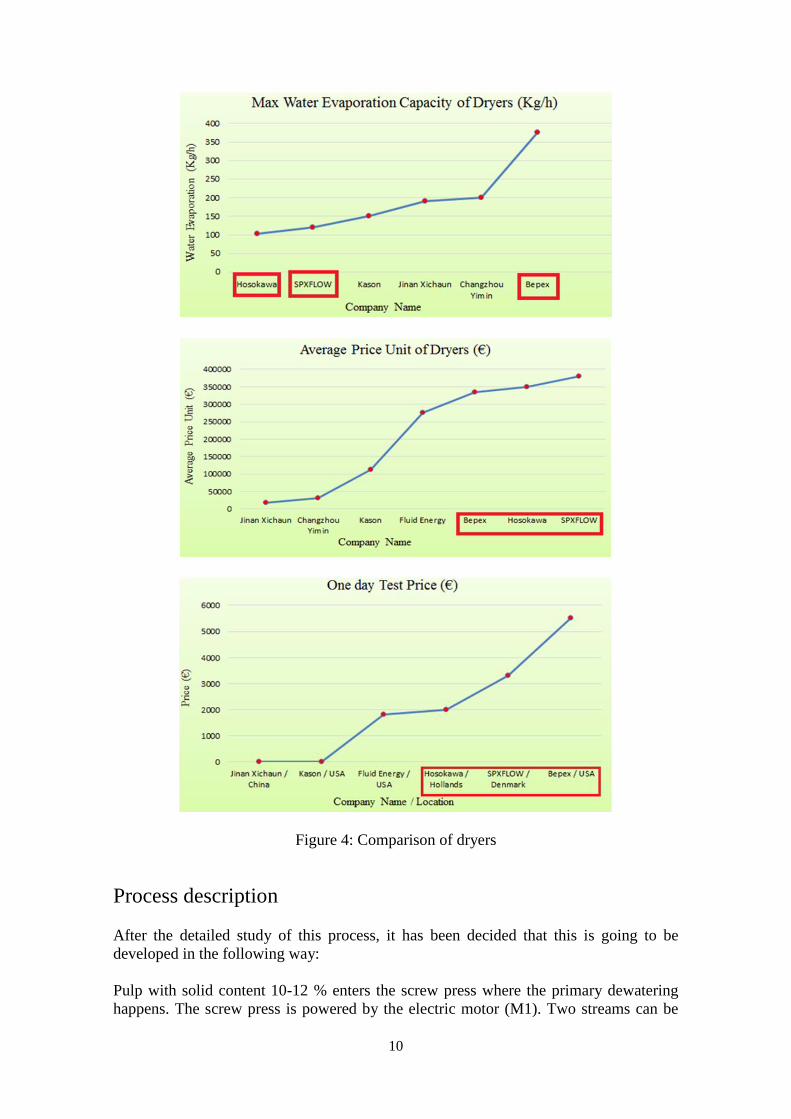
After table analysis the best suited for price and performance is BEPEX. There are three
charts below which explain our decision. This is only an initial approximation in order to
have a first idea about the flash dryer with the purpose of starting work.
10
Figure 4: Comparison of dryers
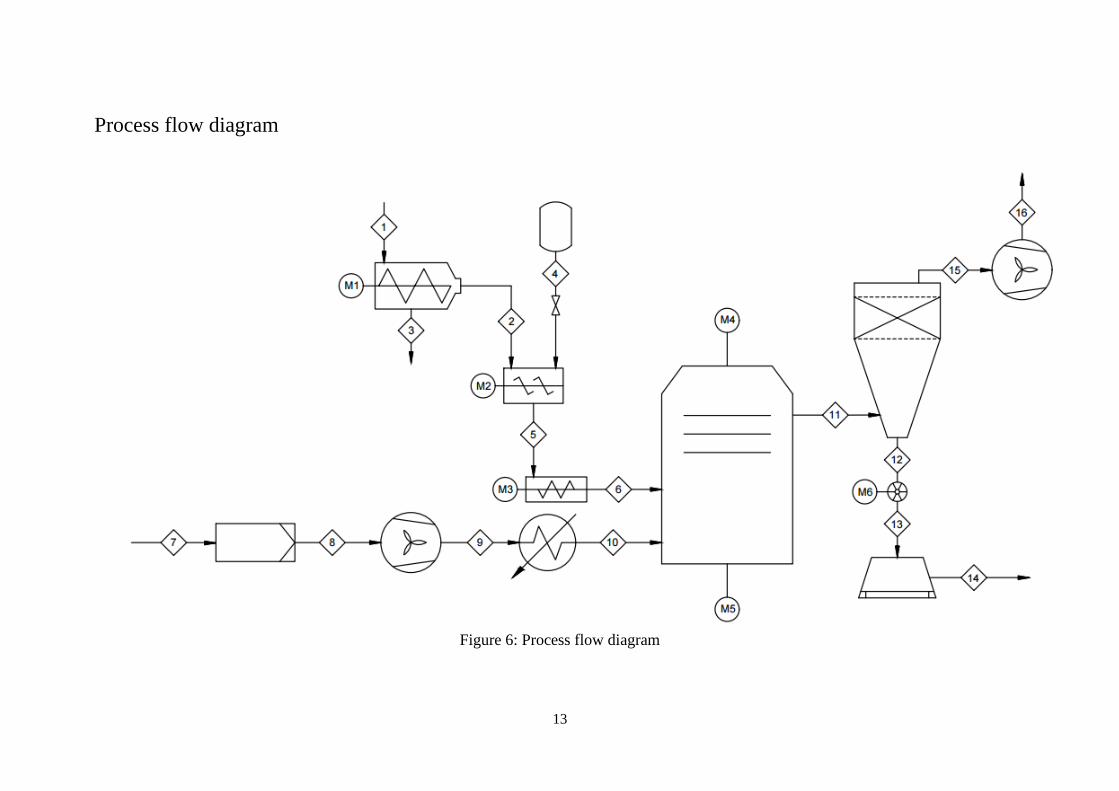
Process description
After the detailed study of this process, it has been decided that this is going to be
developed in the following way:
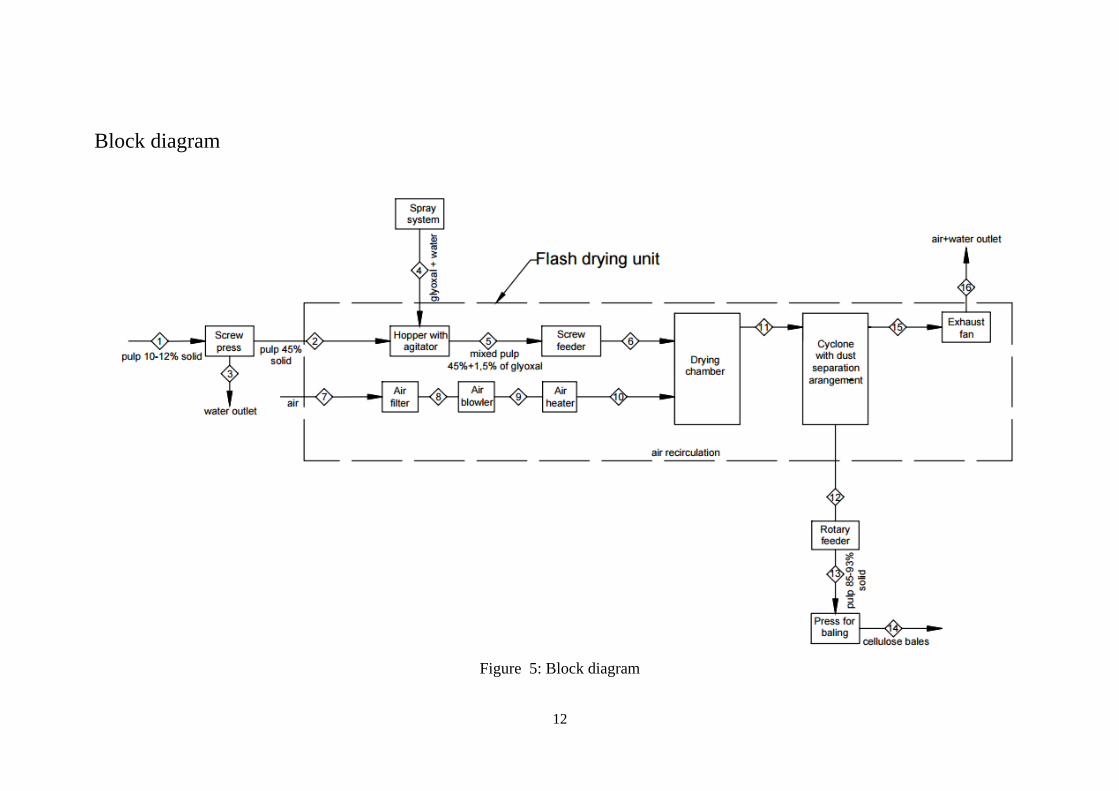
Pulp with solid content 10-12 % enters the screw press where the primary dewatering
happens. The screw press is powered by the electric motor (M1). Two streams can be
11
observed after the screw press. First one is squeezed water from the pulp (m = 826.375
kg/h). This water is removed to the sewerage. The second stream is pulp with the solid
content 45 % (m = 236.125 kg/h). Gravitation forces transport this pulp by the inclined
pipe to the hopper.
The hopper has agitators powered by the electric motor 2 (M2). The mixing with water
solution of glyoxal happens in the hopper. The content of glyoxal in water solution is 36
%. Water solution of glyoxal is distributed to the mixing hopper by the spray system from
the tank for chemicals (V = 100 l.). The hopper and the screw feeder are the parts of the
same feeding unit. The well-mixed pulp with 45 % solid content and 1.5 % of glyoxal can
be distributed to the drying chamber by screw feeder. The screw feeder is powered by the
electric motor 3 (M3). The screw feeder acts not only as the feeding element but also as
the mixing one.
The operation of the pneumatic drying happens in the drying chamber. For that purpose
the ambient air is blown and heated by the air blower and air heater, correspondingly, to
the drying chamber. The air flow rate is 50 m3/min. The inlet temperature of air flow in
the bottom of the drying chamber is 223 °C and inlet pressure is 1.6 bar. The specific
direction for the air flow is provided by the air agitator powered by the electric motor 5
(M5) which is located in the bottom of the drying chamber. At the same time this agitator
impacts as a grinding element which disperses the pulp to the micro particles. The directed
air flow serves for the drying process intensification and efficient distribution of the
grinded cellulose flakes to the top section of the drying chamber where the classification
system is located. The classification system is powered by the electric motor 4 (M4) and
has the main purpose to separate the fine particles and at the same time to reject badly
dried coarse particles for the recurring grinding and drying. The size of the particles can
be controlled by the rotation speed of the classifying unit which can be controlled by the
motor 4 (M4).
Air stream carrying the cellulose particles with solid content 85 % flows out of the drying
chamber and has the outlet temperature 100 °C. It distributes the cellulose to the bottom
section of the cyclone with the fixed bed dust separation arrangement approximately in
the middle of it. The dried product is collected in the bottom section of the cyclone and
transported by the rotary feeder powered by the motor 6 (M6) to the shaping machine
while the air flow with temperature 80 °C goes through the bag filter and comes to the
exhaust fan. The shaping machine creates the bales of cellulose packed in the
polyethylene bags. The block diagram, process flow diagram and PI diagrams of the
process are represented on the Figures 5, 6 and 7.
12
Block diagram
Figure 5: Block diagram
13
Process flow diagram
Figure 6: Process flow diagram
14
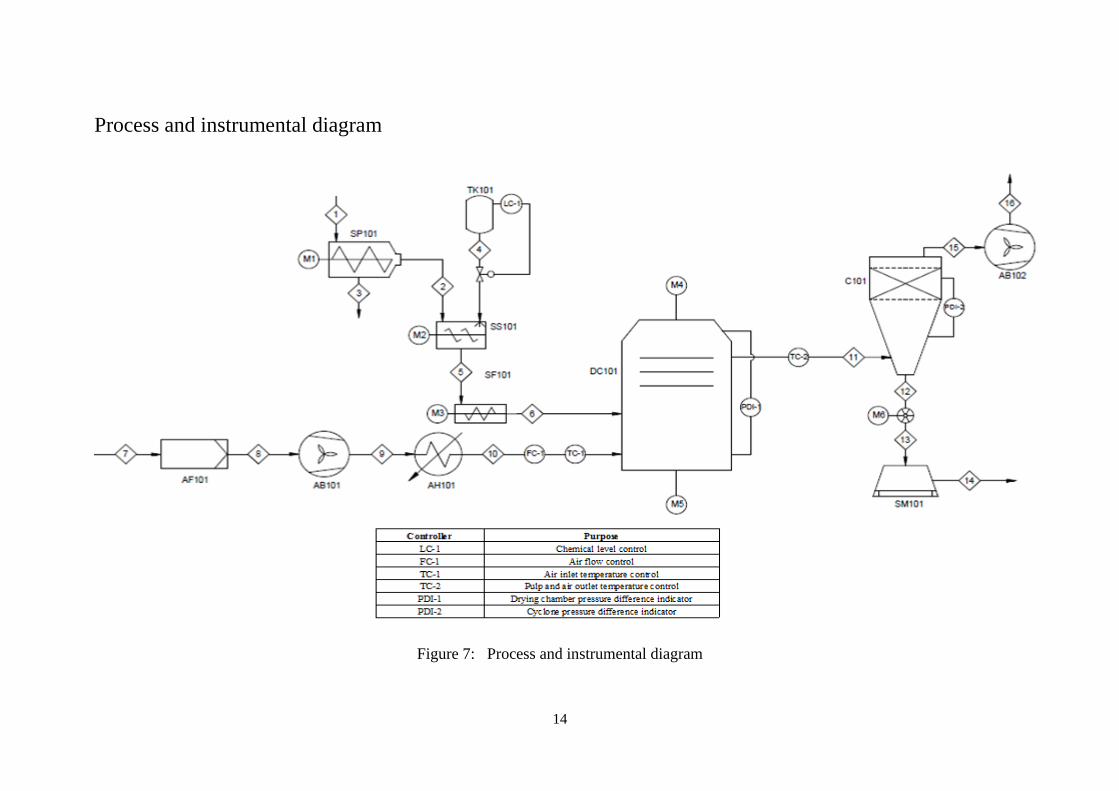
Process and instrumental diagram
Figure 7: Process and instrumental diagram
15
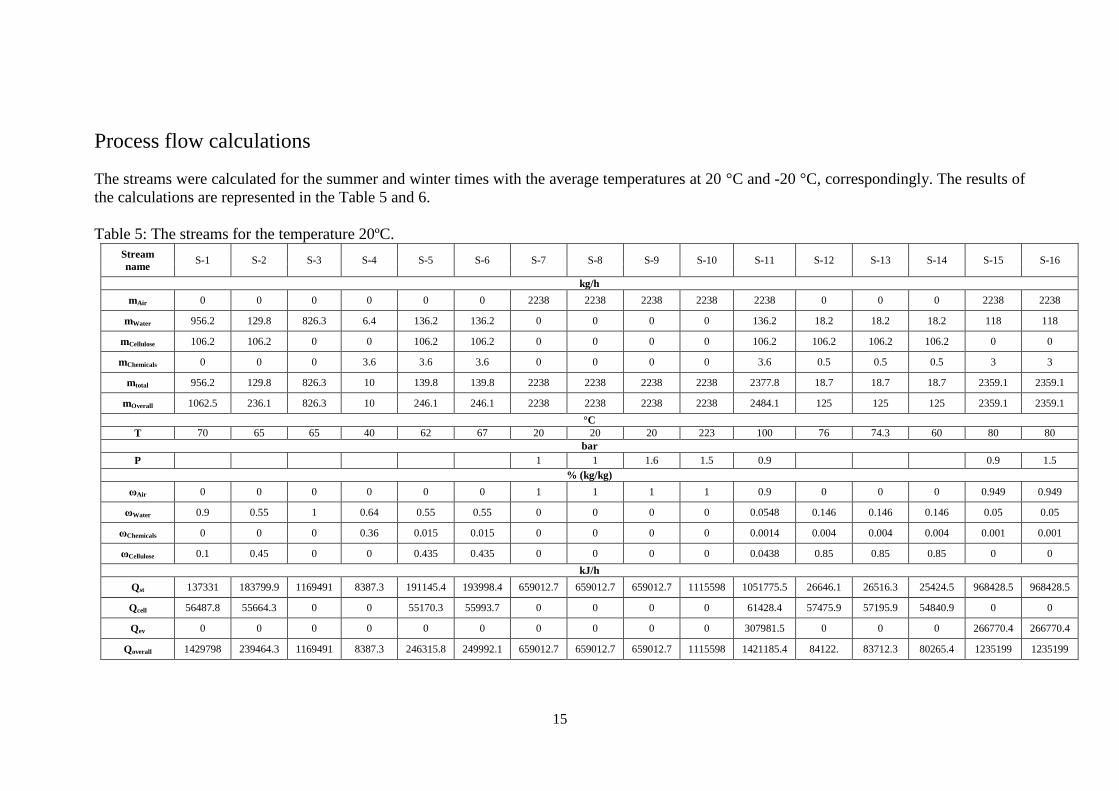
Process flow calculations
The streams were calculated for the summer and winter times with the average temperatures at 20 °C and -20 °C, correspondingly. The results of
the calculations are represented in the Table 5 and 6.
Table 5: The streams for the temperature 20ºC.
Stream
name S-1 S-2 S-3 S-4 S-5 S-6 S-7 S-8 S-9 S-10 S-11 S-12 S-13 S-14 S-15 S-16
kg/h
mAir 0 0 0 0 0 0 2238 2238 2238 2238 2238 0 0 0 2238 2238
mWater 956.2 129.8 826.3 6.4 136.2 136.2 0 0 0 0 136.2 18.2 18.2 18.2 118 118
mCellulose 106.2 106.2 0 0 106.2 106.2 0 0 0 0 106.2 106.2 106.2 106.2 0 0
mChemicals 0 0 0 3.6 3.6 3.6 0 0 0 0 3.6 0.5 0.5 0.5 3 3
mtotal 956.2 129.8 826.3 10 139.8 139.8 2238 2238 2238 2238 2377.8 18.7 18.7 18.7 2359.1 2359.1
mOverall 1062.5 236.1 826.3 10 246.1 246.1 2238 2238 2238 2238 2484.1 125 125 125 2359.1 2359.1
°C
T 70 65 65 40 62 67 20 20 20 223 100 76 74.3 60 80 80
bar
P 1 1 1.6 1.5 0.9 0.9 1.5
% (kg/kg)
ωAir 0 0 0 0 0 0 1 1 1 1 0.9 0 0 0 0.949 0.949
ωWater 0.9 0.55 1 0.64 0.55 0.55 0 0 0 0 0.0548 0.146 0.146 0.146 0.05 0.05
ωChemicals 0 0 0 0.36 0.015 0.015 0 0 0 0 0.0014 0.004 0.004 0.004 0.001 0.001
ωCellulose 0.1 0.45 0 0 0.435 0.435 0 0 0 0 0.0438 0.85 0.85 0.85 0 0
kJ/h
Qst 137331 183799.9 1169491 8387.3 191145.4 193998.4 659012.7 659012.7 659012.7 1115598 1051775.5 26646.1 26516.3 25424.5 968428.5 968428.5
Qcell 56487.8 55664.3 0 0 55170.3 55993.7 0 0 0 0 61428.4 57475.9 57195.9 54840.9 0 0
Qev 0 0 0 0 0 0 0 0 0 0 307981.5 0 0 0 266770.4 266770.4
Qoverall 1429798 239464.3 1169491 8387.3 246315.8 249992.1 659012.7 659012.7 659012.7 1115598 1421185.4 84122. 83712.3 80265.4 1235199 1235199
16
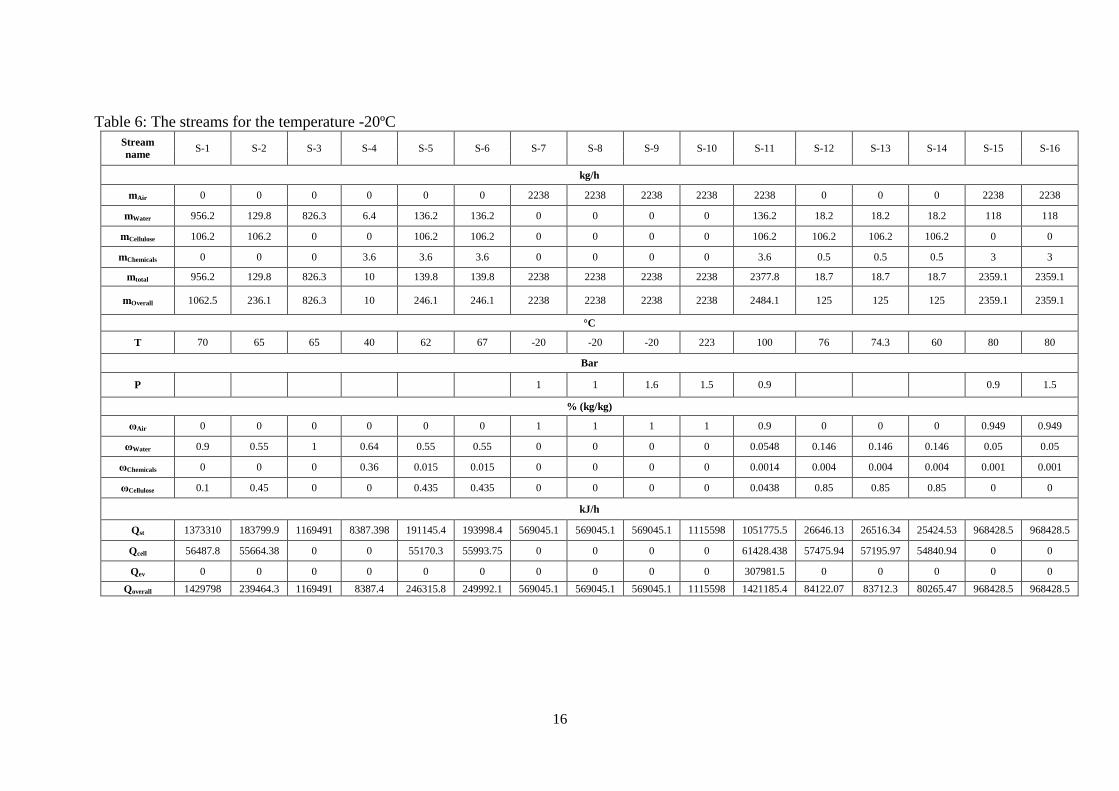
Table 6: The streams for the temperature -20ºC
Stream
name S-1 S-2 S-3 S-4 S-5 S-6 S-7 S-8 S-9 S-10 S-11 S-12 S-13 S-14 S-15 S-16
kg/h
mAir 0 0 0 0 0 0 2238 2238 2238 2238 2238 0 0 0 2238 2238
mWater 956.2 129.8 826.3 6.4 136.2 136.2 0 0 0 0 136.2 18.2 18.2 18.2 118 118
mCellulose 106.2 106.2 0 0 106.2 106.2 0 0 0 0 106.2 106.2 106.2 106.2 0 0
mChemicals 0 0 0 3.6 3.6 3.6 0 0 0 0 3.6 0.5 0.5 0.5 3 3
mtotal 956.2 129.8 826.3 10 139.8 139.8 2238 2238 2238 2238 2377.8 18.7 18.7 18.7 2359.1 2359.1
mOverall 1062.5 236.1 826.3 10 246.1 246.1 2238 2238 2238 2238 2484.1 125 125 125 2359.1 2359.1
°C
T 70 65 65 40 62 67 -20 -20 -20 223 100 76 74.3 60 80 80
Bar
P 1 1 1.6 1.5 0.9 0.9 1.5
% (kg/kg)
ωAir 0 0 0 0 0 0 1 1 1 1 0.9 0 0 0 0.949 0.949
ωWater 0.9 0.55 1 0.64 0.55 0.55 0 0 0 0 0.0548 0.146 0.146 0.146 0.05 0.05
ωChemicals 0 0 0 0.36 0.015 0.015 0 0 0 0 0.0014 0.004 0.004 0.004 0.001 0.001
ωCellulose 0.1 0.45 0 0 0.435 0.435 0 0 0 0 0.0438 0.85 0.85 0.85 0 0
kJ/h
Qst 1373310 183799.9 1169491 8387.398 191145.4 193998.4 569045.1 569045.1 569045.1 1115598 1051775.5 26646.13 26516.34 25424.53 968428.5 968428.5
Qcell 56487.8 55664.38 0 0 55170.3 55993.75 0 0 0 0 61428.438 57475.94 57195.97 54840.94 0 0
Qev 0 0 0 0 0 0 0 0 0 0 307981.5 0 0 0 0 0
Qoverall 1429798 239464.3 1169491 8387.4 246315.8 249992.1 569045.1 569045.1 569045.1 1115598 1421185.4 84122.07 83712.3 80265.47 968428.5 968428.5
17
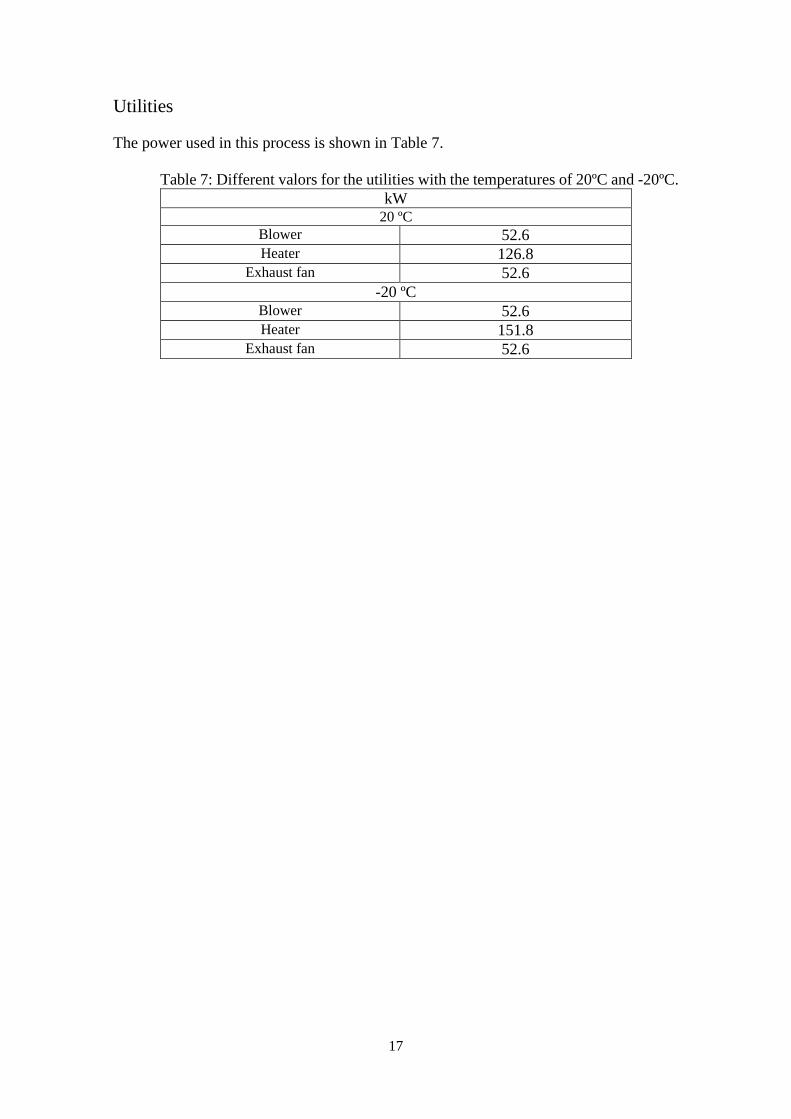
Utilities
The power used in this process is shown in Table 7.
Table 7: Different valors for the utilities with the temperatures of 20ºC and -20ºC.
kW 20 ºC
Blower 52.6 Heater 126.8
Exhaust fan 52.6
-20 ºC Blower 52.6 Heater 151.8
Exhaust fan 52.6
18
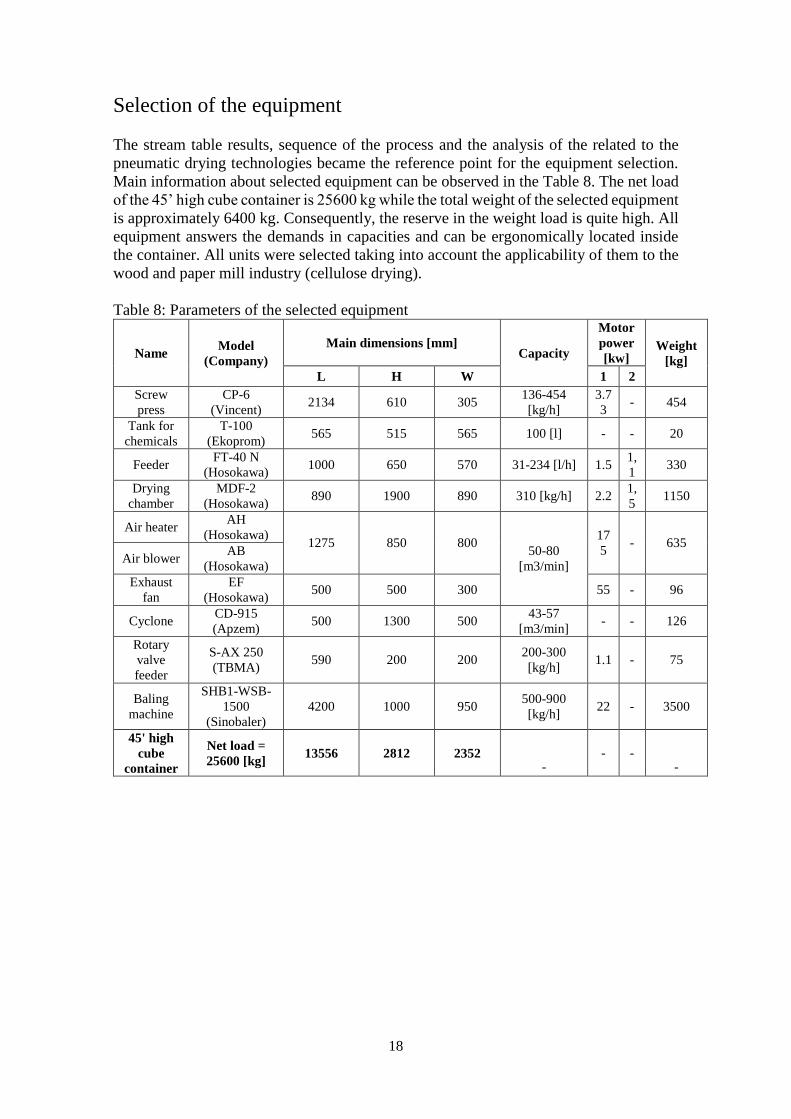
Selection of the equipment
The stream table results, sequence of the process and the analysis of the related to the
pneumatic drying technologies became the reference point for the equipment selection.
Main information about selected equipment can be observed in the Table 8. The net load
of the 45’ high cube container is 25600 kg while the total weight of the selected equipment
is approximately 6400 kg. Consequently, the reserve in the weight load is quite high. All
equipment answers the demands in capacities and can be ergonomically located inside
the container. All units were selected taking into account the applicability of them to the
wood and paper mill industry (cellulose drying).
Table 8: Parameters of the selected equipment
Name Model
(Company)
Main dimensions [mm] Capacity
Motor
power
[kw] Weight
[kg]
L H W 1 2
Screw
press
CP-6
(Vincent) 2134 610 305
136-454
[kg/h]
3.7
3 - 454
Tank for
chemicals
T-100
(Ekoprom) 565 515 565 100 [l] - - 20
Feeder FT-40 N
(Hosokawa) 1000 650 570 31-234 [l/h] 1.5
1,
1 330
Drying
chamber
MDF-2
(Hosokawa) 890 1900 890 310 [kg/h] 2.2
1,
5 1150
Air heater AH
(Hosokawa) 1275 850 800
50-80
[m3/min]
17
5 - 635
Air blower AB
(Hosokawa)
Exhaust
fan
EF
(Hosokawa) 500 500 300 55 - 96
Cyclone CD-915
(Apzem) 500 1300 500
43-57
[m3/min] - - 126
Rotary
valve
feeder
S-AX 250
(TBMA) 590 200 200
200-300
[kg/h] 1.1 - 75
Baling
machine
SHB1-WSB-
1500
(Sinobaler)
4200 1000 950 500-900
[kg/h] 22 - 3500
45' high
cube
container
Net load =
25600 [kg] 13556 2812 2352
- - -
-
19
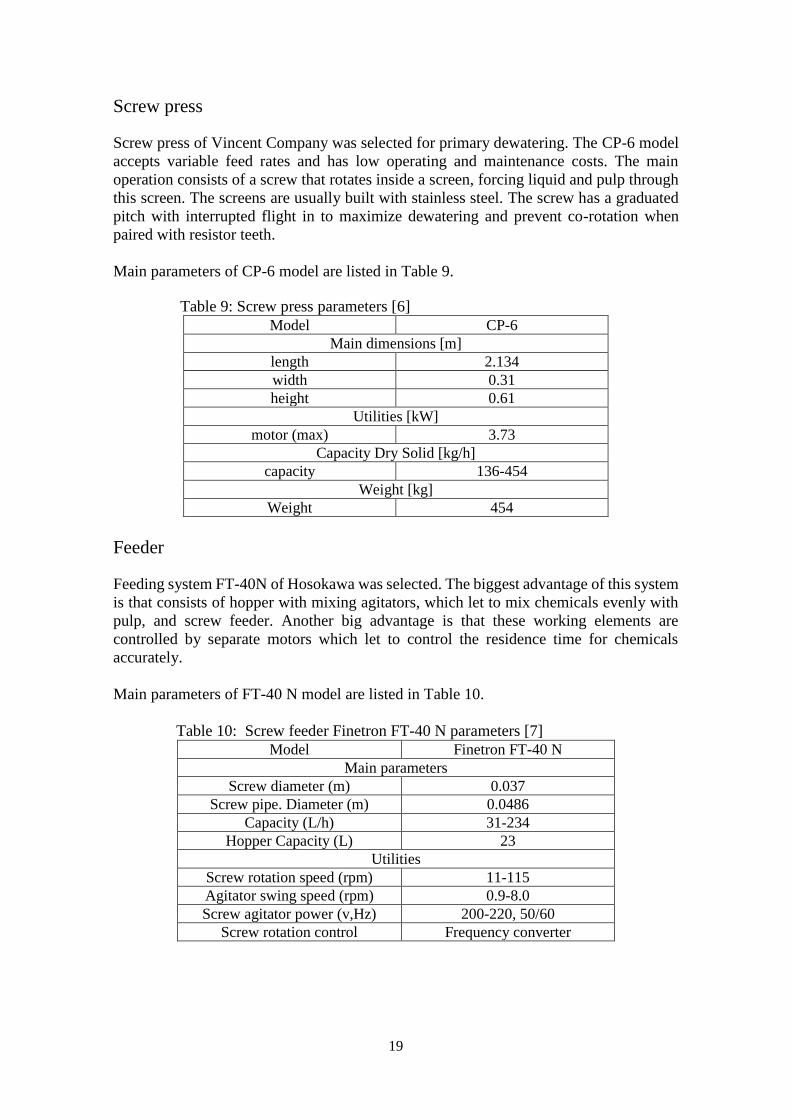
Screw press
Screw press of Vincent Company was selected for primary dewatering. The CP-6 model
accepts variable feed rates and has low operating and maintenance costs. The main
operation consists of a screw that rotates inside a screen, forcing liquid and pulp through
this screen. The screens are usually built with stainless steel. The screw has a graduated
pitch with interrupted flight in to maximize dewatering and prevent co-rotation when
paired with resistor teeth.
Main parameters of CP-6 model are listed in Table 9.
Table 9: Screw press parameters [6]
Model CP-6
Main dimensions [m]
length 2.134
width 0.31
height 0.61
Utilities [kW]
motor (max) 3.73
Capacity Dry Solid [kg/h]
capacity 136-454
Weight [kg]
Weight 454
Feeder
Feeding system FT-40N of Hosokawa was selected. The biggest advantage of this system
is that consists of hopper with mixing agitators, which let to mix chemicals evenly with
pulp, and screw feeder. Another big advantage is that these working elements are
controlled by separate motors which let to control the residence time for chemicals
accurately.
Main parameters of FT-40 N model are listed in Table 10.
Table 10: Screw feeder Finetron FT-40 N parameters [7]
Model Finetron FT-40 N
Main parameters
Screw diameter (m) 0.037
Screw pipe. Diameter (m) 0.0486
Capacity (L/h) 31-234
Hopper Capacity (L) 23
Utilities
Screw rotation speed (rpm) 11-115
Agitator swing speed (rpm) 0.9-8.0
Screw agitator power (v,Hz) 200-220, 50/60
Screw rotation control Frequency converter
20
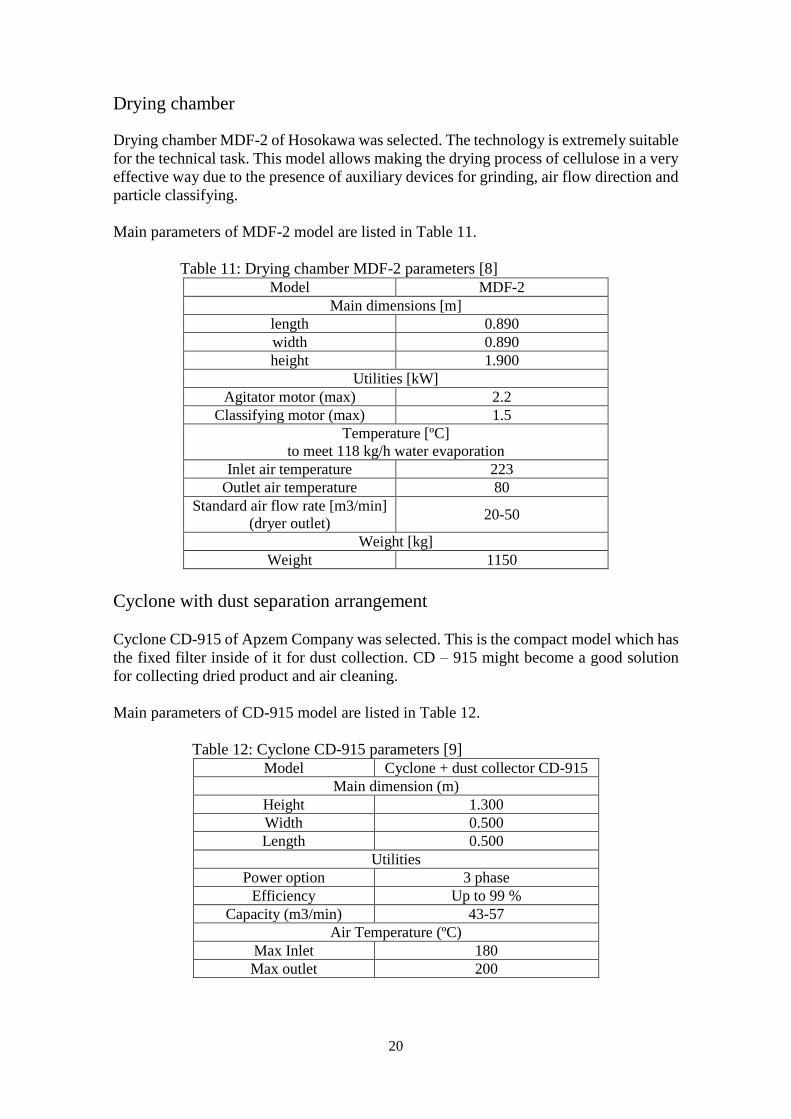
Drying chamber
Drying chamber MDF-2 of Hosokawa was selected. The technology is extremely suitable
for the technical task. This model allows making the drying process of cellulose in a very
effective way due to the presence of auxiliary devices for grinding, air flow direction and
particle classifying.
Main parameters of MDF-2 model are listed in Table 11.
Table 11: Drying chamber MDF-2 parameters [8]
Model MDF-2
Main dimensions [m]
length 0.890
width 0.890
height 1.900
Utilities [kW]
Agitator motor (max) 2.2
Classifying motor (max) 1.5
Temperature [ºC]
to meet 118 kg/h water evaporation
Inlet air temperature 223
Outlet air temperature 80
Standard air flow rate [m3/min]
(dryer outlet) 20-50
Weight [kg]
Weight 1150
Cyclone with dust separation arrangement
Cyclone CD-915 of Apzem Company was selected. This is the compact model which has
the fixed filter inside of it for dust collection. CD – 915 might become a good solution
for collecting dried product and air cleaning.
Main parameters of CD-915 model are listed in Table 12.
Table 12: Cyclone CD-915 parameters [9]
Model Cyclone + dust collector CD-915
Main dimension (m)
Height 1.300
Width 0.500
Length 0.500
Utilities
Power option 3 phase
Efficiency Up to 99 %
Capacity (m3/min) 43-57
Air Temperature (ºC)
Max Inlet 180
Max outlet 200
21
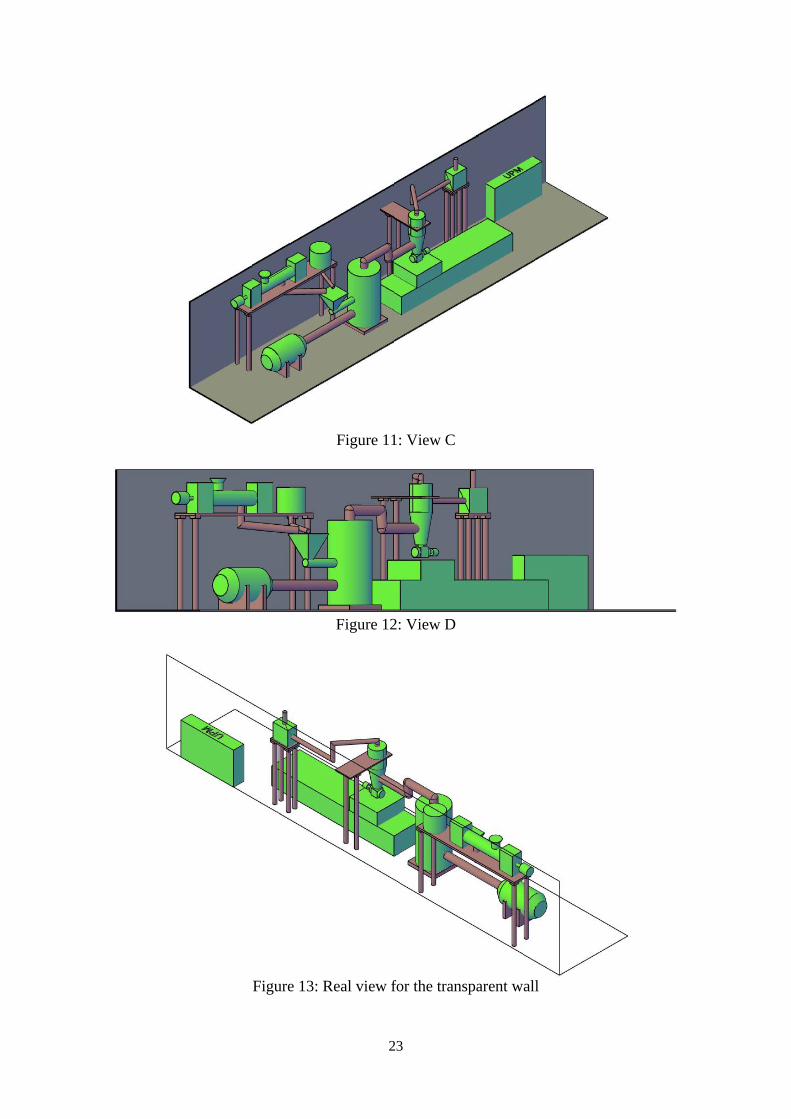
Rotary feeder
For the discharge of the dry cellulose to the shaping machine we need to use a rotary
feeder, order to could get the required quantity. In this case Rotary feeder S-AX 250
belongs to TBMA Company was selected.
Main Parameters of S-AX 250 are listed in Table 13.
Table 13: Rotary feeder S-Ax 250 parameters [10].
Model S-AX 250
Main dimensions (m)
Length 0.590
Width 0.200
Height 0.200
Utilities
Watt (kW) 1.1
Electrical supply (V, Hz) 230/400,50
Air temperature (ºC; K)
Max Allowable product Tª 120; 393
Weight (kg)
Weight 75
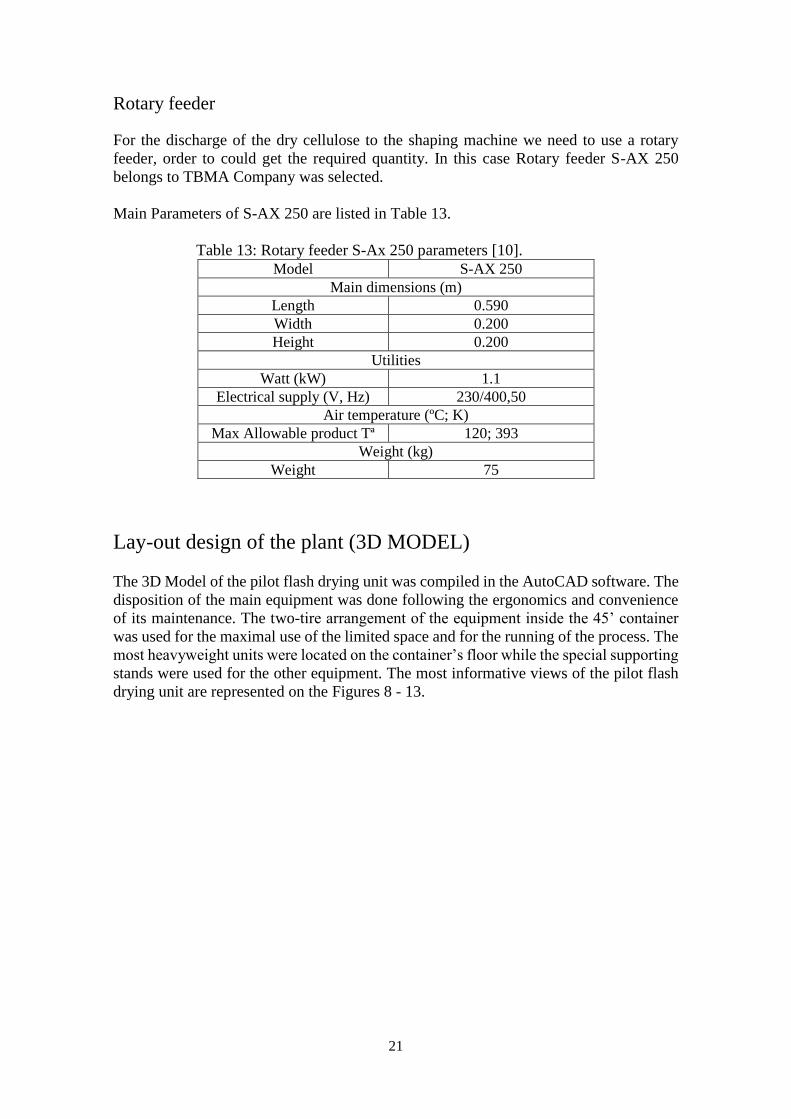
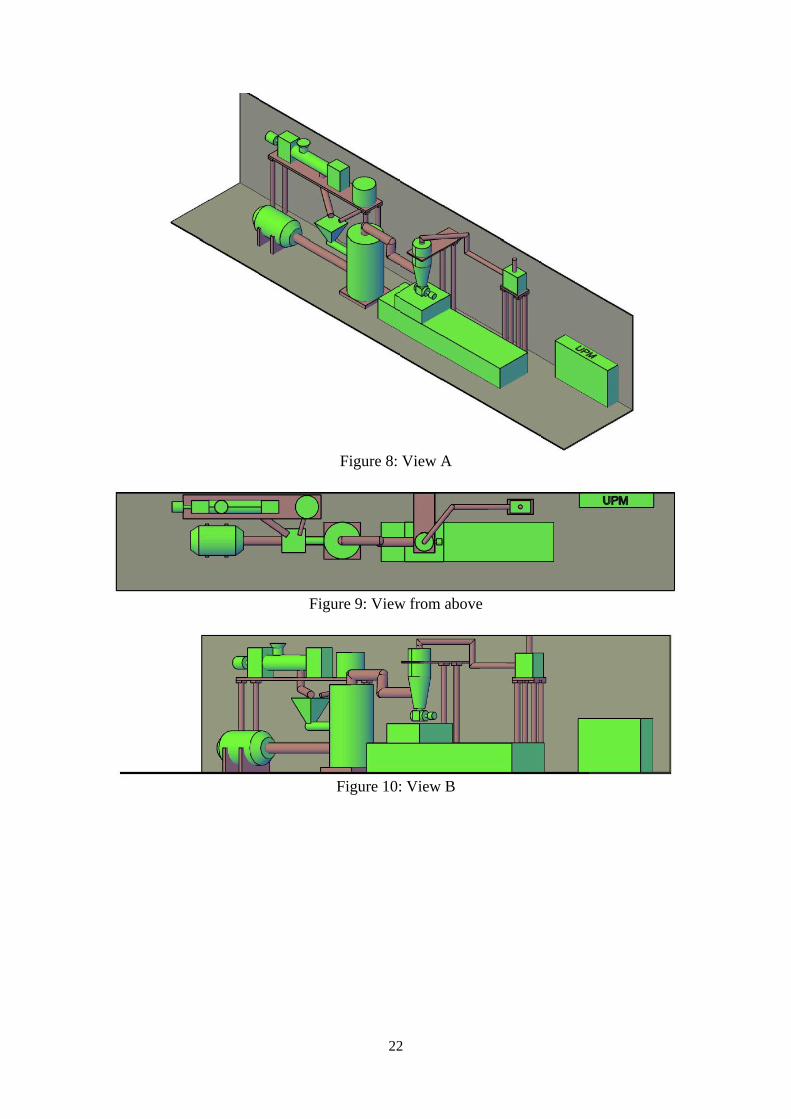
Lay-out design of the plant (3D MODEL)
The 3D Model of the pilot flash drying unit was compiled in the AutoCAD software. The
disposition of the main equipment was done following the ergonomics and convenience
of its maintenance. The two-tire arrangement of the equipment inside the 45’ container
was used for the maximal use of the limited space and for the running of the process. The
most heavyweight units were located on the container’s floor while the special supporting
stands were used for the other equipment. The most informative views of the pilot flash
drying unit are represented on the Figures 8 - 13.
22
Figure 8: View A
Figure 9: View from above
Figure 10: View B
23
Figure 11: View C
Figure 12: View D
Figure 13: Real view for the transparent wall
24
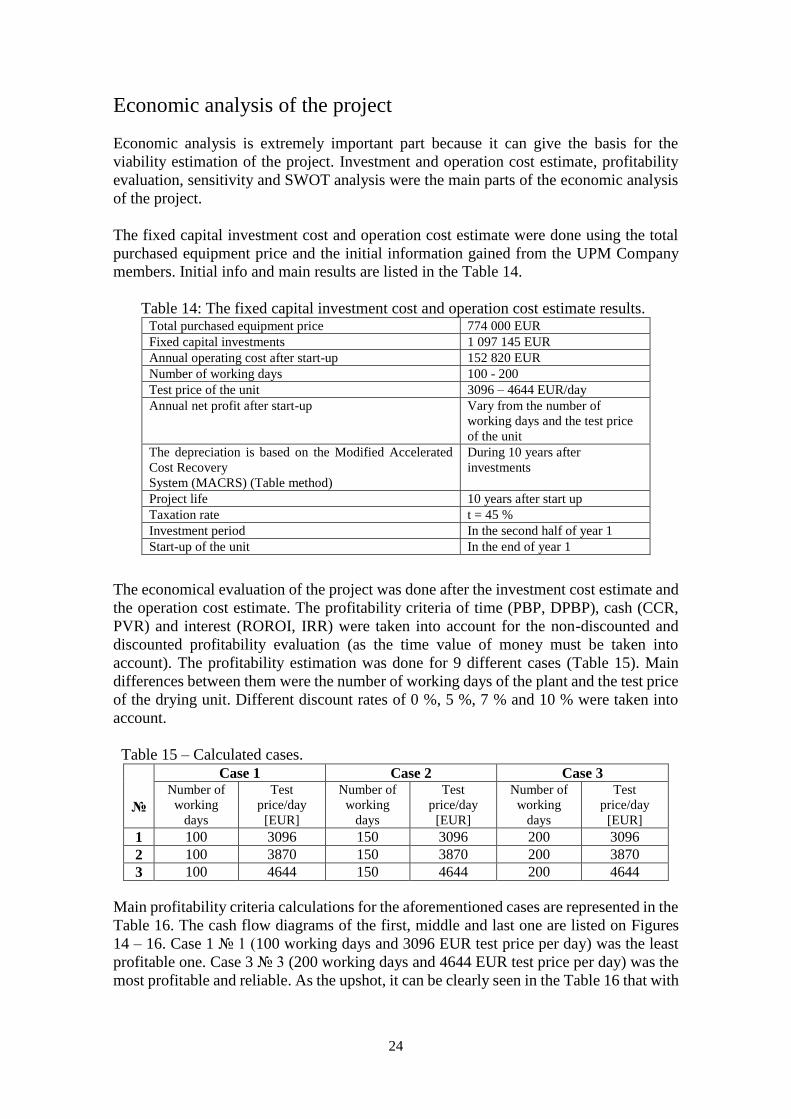
Economic analysis of the project
Economic analysis is extremely important part because it can give the basis for the
viability estimation of the project. Investment and operation cost estimate, profitability
evaluation, sensitivity and SWOT analysis were the main parts of the economic analysis
of the project.
The fixed capital investment cost and operation cost estimate were done using the total
purchased equipment price and the initial information gained from the UPM Company
members. Initial info and main results are listed in the Table 14.
Table 14: The fixed capital investment cost and operation cost estimate results. Total purchased equipment price 774 000 EUR
Fixed capital investments 1 097 145 EUR
Annual operating cost after start-up 152 820 EUR
Number of working days 100 - 200
Test price of the unit 3096 – 4644 EUR/day
Annual net profit after start-up Vary from the number of
working days and the test price
of the unit
The depreciation is based on the Modified Accelerated
Cost Recovery
System (MACRS) (Table method)
During 10 years after
investments
Project life 10 years after start up
Taxation rate t = 45 %
Investment period In the second half of year 1
Start-up of the unit In the end of year 1
The economical evaluation of the project was done after the investment cost estimate and
the operation cost estimate. The profitability criteria of time (PBP, DPBP), cash (CCR,
PVR) and interest (ROROI, IRR) were taken into account for the non-discounted and
discounted profitability evaluation (as the time value of money must be taken into
account). The profitability estimation was done for 9 different cases (Table 15). Main
differences between them were the number of working days of the plant and the test price
of the drying unit. Different discount rates of 0 %, 5 %, 7 % and 10 % were taken into
account.
Table 15 – Calculated cases.
№
Case 1 Case 2 Case 3 Number of
working
days
Test
price/day
[EUR]
Number of
working
days
Test
price/day
[EUR]
Number of
working
days
Test
price/day
[EUR]
1 100 3096 150 3096 200 3096
2 100 3870 150 3870 200 3870
3 100 4644 150 4644 200 4644
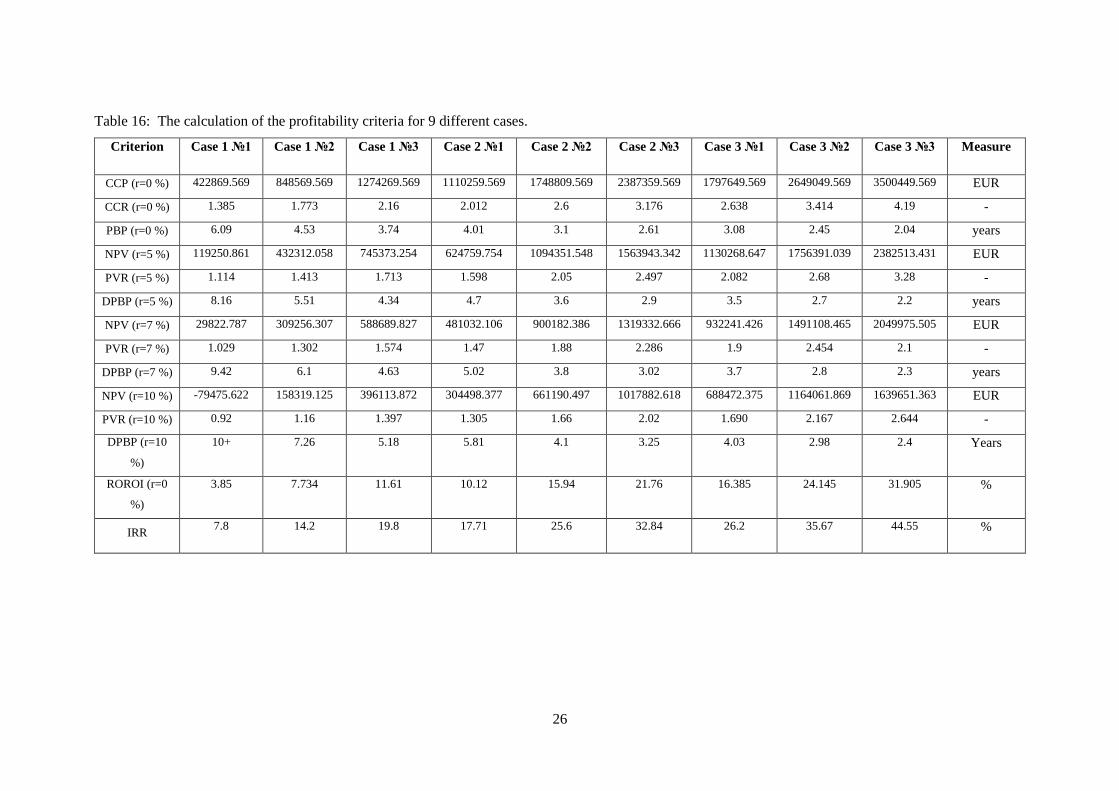
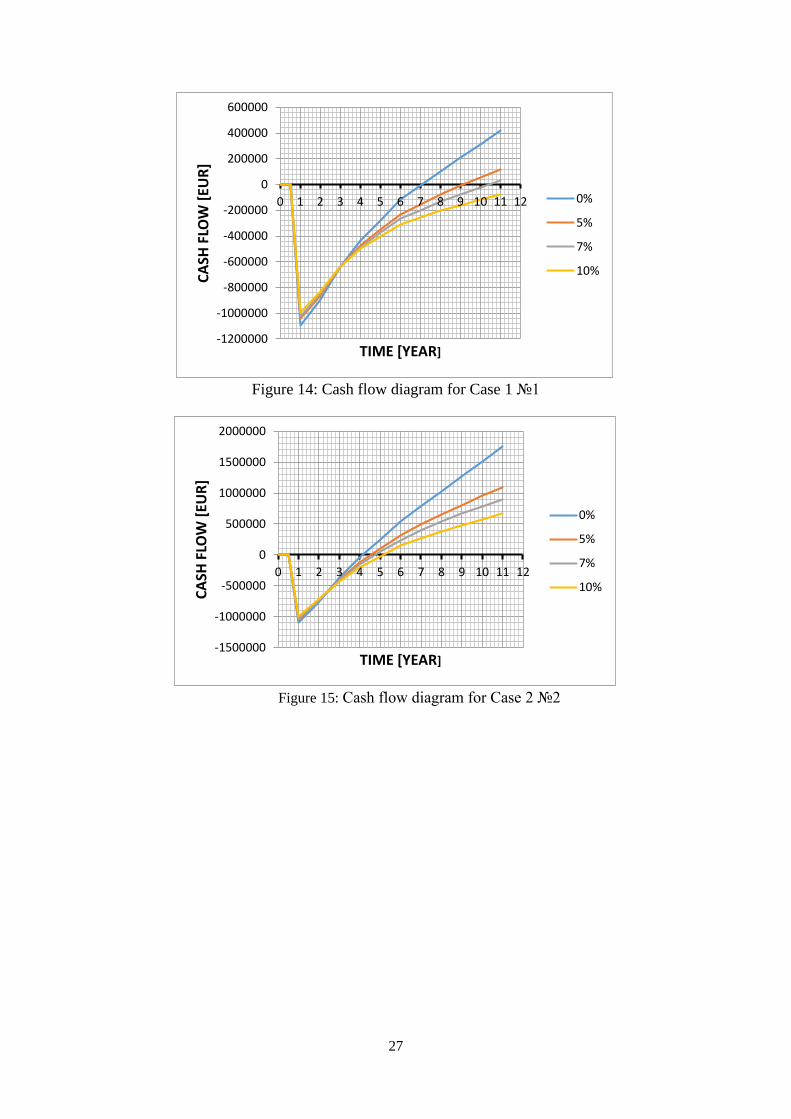
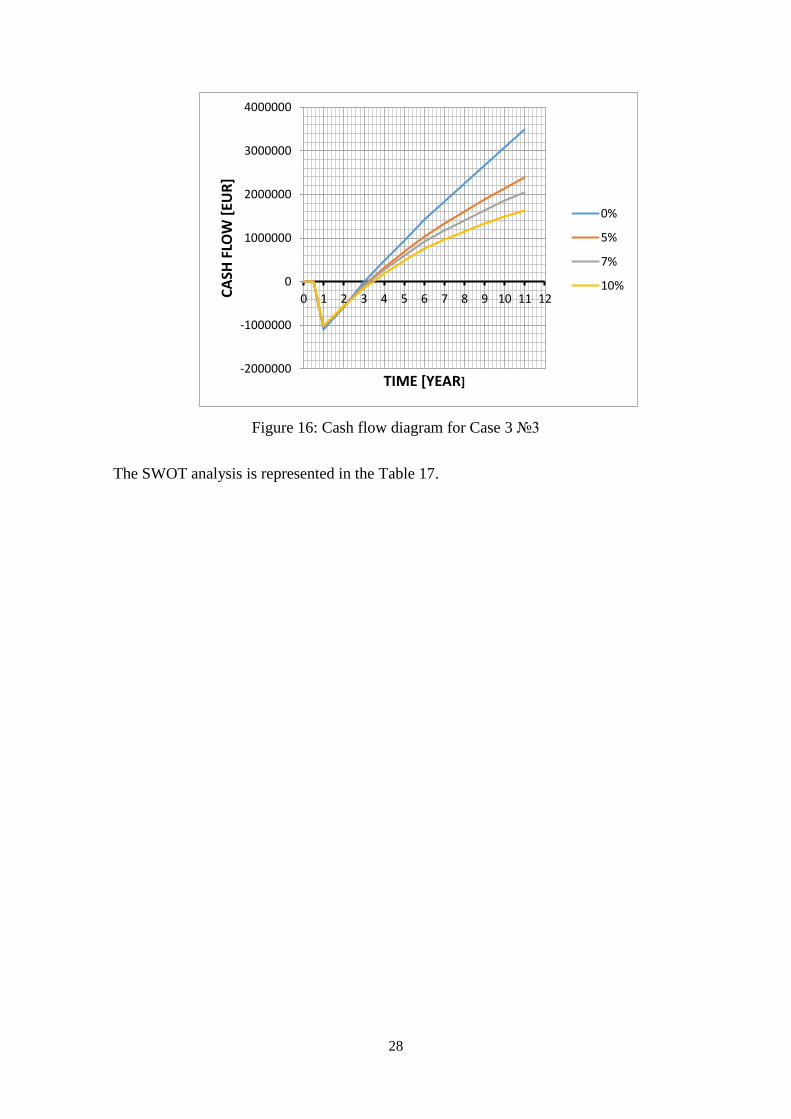
Main profitability criteria calculations for the aforementioned cases are represented in the
Table 16. The cash flow diagrams of the first, middle and last one are listed on Figures
14 – 16. Case 1 № 1 (100 working days and 3096 EUR test price per day) was the least
profitable one. Case 3 № 3 (200 working days and 4644 EUR test price per day) was the
most profitable and reliable. As the upshot, it can be clearly seen in the Table 16 that with

25
the increase of the working days and increase of the test price per day the project become
more potentially profitable.
26
Table 16: The calculation of the profitability criteria for 9 different cases.
Criterion Case 1 №1 Case 1 №2 Case 1 №3 Case 2 №1 Case 2 №2 Case 2 №3 Case 3 №1 Case 3 №2 Case 3 №3 Measure
CCP (r=0 %) 422869.569 848569.569 1274269.569 1110259.569 1748809.569 2387359.569 1797649.569 2649049.569 3500449.569 EUR
CCR (r=0 %) 1.385 1.773 2.16 2.012 2.6 3.176 2.638 3.414 4.19 -
PBP (r=0 %) 6.09 4.53 3.74 4.01 3.1 2.61 3.08 2.45 2.04 years
NPV (r=5 %) 119250.861 432312.058 745373.254 624759.754 1094351.548 1563943.342 1130268.647 1756391.039 2382513.431 EUR
PVR (r=5 %) 1.114 1.413 1.713 1.598 2.05 2.497 2.082 2.68 3.28 -
DPBP (r=5 %) 8.16 5.51 4.34 4.7 3.6 2.9 3.5 2.7 2.2 years
NPV (r=7 %) 29822.787 309256.307 588689.827 481032.106 900182.386 1319332.666 932241.426 1491108.465 2049975.505 EUR
PVR (r=7 %) 1.029 1.302 1.574 1.47 1.88 2.286 1.9 2.454 2.1 -
DPBP (r=7 %) 9.42 6.1 4.63 5.02 3.8 3.02 3.7 2.8 2.3 years
NPV (r=10 %) -79475.622 158319.125 396113.872 304498.377 661190.497 1017882.618 688472.375 1164061.869 1639651.363 EUR
PVR (r=10 %) 0.92 1.16 1.397 1.305 1.66 2.02 1.690 2.167 2.644 -
DPBP (r=10
%)
10+ 7.26 5.18 5.81 4.1 3.25 4.03 2.98 2.4 Years
ROROI (r=0
%)
3.85 7.734 11.61 10.12 15.94 21.76 16.385 24.145 31.905 %
IRR 7.8 14.2 19.8 17.71 25.6 32.84 26.2 35.67 44.55 %
27
Figure 14: Cash flow diagram for Case 1 №1
Figure 15: Cash flow diagram for Case 2 №2
-1200000
-1000000
-800000
-600000
-400000
-200000
0
200000
400000
600000
0 1 2 3 4 5 6 7 8 9 10 11 12C
ASH
FLO
W [
EUR
]
TIME [YEAR]
0%
5%
7%
10%
-1500000
-1000000
-500000
0
500000
1000000
1500000
2000000
0 1 2 3 4 5 6 7 8 9 10 11 12
CA
SH F
LOW
[EU
R]
TIME [YEAR]
0%
5%
7%
10%
28
Figure 16: Cash flow diagram for Case 3 №3
The SWOT analysis is represented in the Table 17.
-2000000
-1000000
0
1000000
2000000
3000000
4000000
0 1 2 3 4 5 6 7 8 9 10 11 12CA
SH F
LOW
[EU
R]
TIME [YEAR]
0%
5%
7%
10%
29
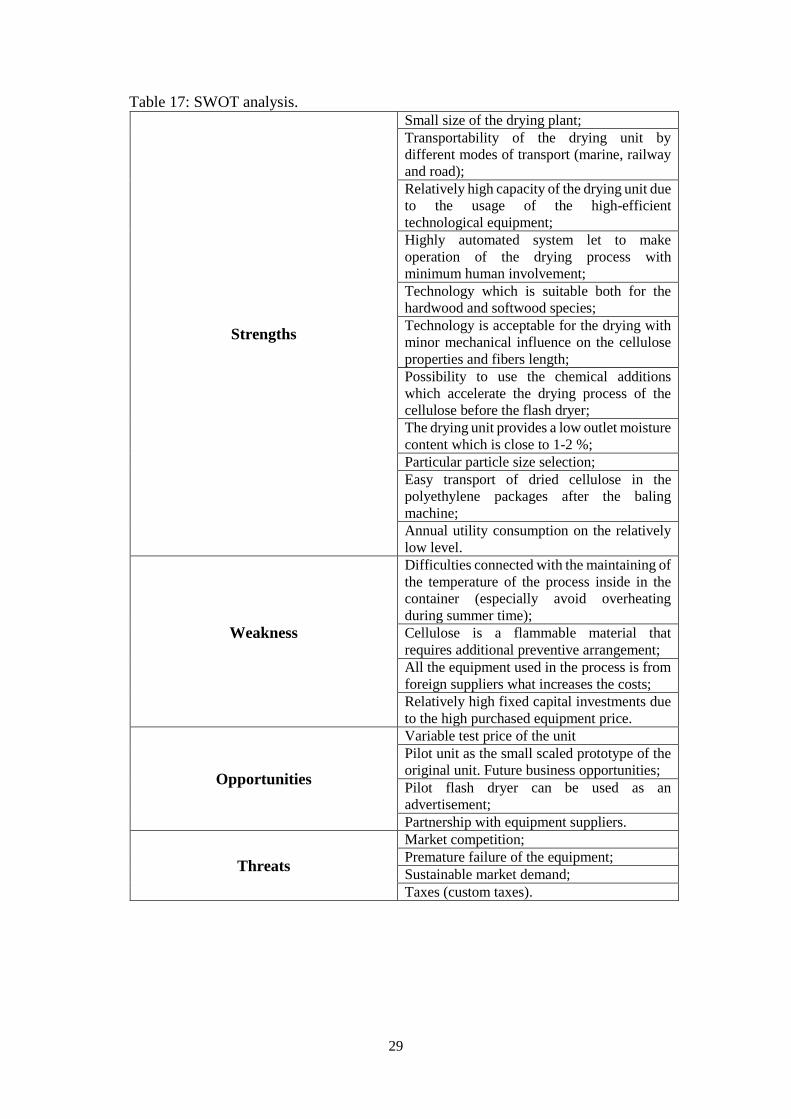
Table 17: SWOT analysis.
Strengths
Small size of the drying plant;
Transportability of the drying unit by
different modes of transport (marine, railway
and road);
Relatively high capacity of the drying unit due
to the usage of the high-efficient
technological equipment;
Highly automated system let to make
operation of the drying process with
minimum human involvement;
Technology which is suitable both for the
hardwood and softwood species;
Technology is acceptable for the drying with
minor mechanical influence on the cellulose
properties and fibers length;
Possibility to use the chemical additions
which accelerate the drying process of the
cellulose before the flash dryer;
The drying unit provides a low outlet moisture
content which is close to 1-2 %;
Particular particle size selection;
Easy transport of dried cellulose in the
polyethylene packages after the baling
machine;
Annual utility consumption on the relatively
low level.
Weakness
Difficulties connected with the maintaining of
the temperature of the process inside in the
container (especially avoid overheating
during summer time);
Cellulose is a flammable material that
requires additional preventive arrangement;
All the equipment used in the process is from
foreign suppliers what increases the costs;
Relatively high fixed capital investments due
to the high purchased equipment price.
Opportunities
Variable test price of the unit
Pilot unit as the small scaled prototype of the
original unit. Future business opportunities;
Pilot flash dryer can be used as an
advertisement;
Partnership with equipment suppliers.
Threats
Market competition;
Premature failure of the equipment;
Sustainable market demand;
Taxes (custom taxes).
30
Conclusions
The project was devoted to the pilot scale flash drying unit design. Main criteria for the
design were the transportability of the unit inside the container and meeting of the
demands in capacities at 1000 kg of dried cellulose per day. The preliminary dewatering,
chemical addition system and baling of the dried product in the end of the flash drying
process were the other important issues for the consideration.
At the end of this investigation, the dryer of Hosokawa Company was selected due to the
smallest dimensions comparing with SPX and Bepex units and the achievement of the
demands in capacity for dried cellulose at 1000 kg per day. The suitability of this
technology to the initial process description is another great advantage of it as Hosokawa
provides the equipment for mixing of the drying material with chemicals which can
intensify the process of pneumatic drying. Another big advantage of this technology is
the classifying unit located in the top section of the drying chamber because it can be
useful for the particular particle size selection.
The equipment selection was of crucial importance to select the equipment answering the
demands of capacities but in the same time which can be located in the container for
future transportation. The disposition of the selected units represented on Figures 8 – 13
can be considered ergonomic and useful for the equipment maintenance. However, to
make the process even more flexible it is possible to use the open-top container for the
pilot flash drying unit transportation as the greatest challenge in lay-out design was
connected with the limited height space. It can be also useful for the system cooling,
especially in the summertime as the open-top container does not demand the additional
ventilation systems.
The project can also be considered reliable and resistant to the external factors when
analyzing the obtained results represented in the Table 16 and Figures 15 – 16. Even the
highest test price at 4644 EUR per day seems to be reasonable as the pilot flash dryer has
big number of advantages represented in the Table 17. Big threat can be connected mainly
with the decrease of the number of working days which is closely connected with the
market demand. The worst calculated situation is represented on the Figure 14, but the
demand can be controlled by the variable test price as the decrease of it can have positive
impact on the market demand.
31
References
[1]:Availableat:
https://www.researchgate.net/publication/264893081_6_Pneumatic_and_Flash_Drying
(Accessed: 5 October 2016).
[2]: ANDRITZ (2012) Products & services - details. Available at:
https://www.andritz.com/products-and-services/pf-detail.htm?productid=13347
(Accessed: 5 October 2016).
[3]: Bepex. Available at: http://www.bepex.com/equipment/turbulizer/ (Accessed: 10
October 2016)
[4]: Bepex. Available at: http://www.bepex.com/equipment/flex-o-mix/ (Accessed: 10
October 2016)
[5]: Hanning Li, Qun Chen, Xiaohui Zhang, Karen N Finney, Vida N Sharifi, Jim
Swithenbank, "4. EVALUATION OF A BIOMASS DRYING PROCESS USING
WASTE HEAT FROM PROCESS INDUSTRIES: A CASE STUDY".Sheffield
University Waste Incineration Centre (SUWIC), Department of Chemical and Biological
Engineering, University of Sheffield, Sheffield, S1 3JD, UK.
[6]: Available at: http://www.vincentcorp.com/sites/all/files/CP_VP_Screw_Press_1M-
08_13_0.pdf (Accessed: 5 November 2016).
[7]: Group, H.M. (no date) HOSOKAWAMICRON CORPORATION.
Available at: http://hosokawamicron.co.jp/en/machines/163 (Accessed: 30 October
2016).
[8]: Group, H.M. (no date) HOSOKAWAMICRON CORPORATION.
Available at: http://hosokawamicron.co.jp/en/machines/150 (Accessed: 29 October
2016).
[9]: Admin, A. (2013) Cyclone dust collector - Apzem Inc.Available at:
http://www.dustcollector.co.in/product/cyclone-dust-collectors.html (Accessed: 14
November 2016).
[10]: Sinobaler horizontal briquetting baler (2015)
Available at: http://www.sinobaler.com/wp-content/uploads/2013/07/Sinobaler-
Horizontal-briquetting-baler.pdf (Accessed: 18 December 2016).
[11]: Dr. Sanju Nanda, M.Pharm, Ph.D. (IIT Delhi), Dept. of Pharmaceutical Sciences,
M.D. University, Rohtak – 124001, Haryana , "Reactors and Fundamentals of Reactors
Design for Chemical Reaction, Pharmaceutical Engineering".

32