Embed Size (px)
Citation preview

8/7/2019 final product line
http://slidepdf.com/reader/full/final-product-line 1/29
Product Line Pricing
MMA A NN A A GGEER R II A A LL EECCOONN OOMMII CCSS
REPORT ON:
PRODUCT LINE PRICING

8/7/2019 final product line
http://slidepdf.com/reader/full/final-product-line 2/29
Product Line Pricing
PREPAIRED BY
Name Course Roll No
MADHUSUDAN B. HANWAT MMM M091056
VIDULA PARADKAR MHRDM H091030
SUMIT KADAM MFM F091019
VAM VARM MMM M091043
SATYAVAN RAUNDHAL MMM M091051
BABURAO BADHE MMM M091050KOMAL S. KATKADE MHRDM H091009
MANGESH J. PATIL MHRDM H091014
MANOJ JADHAV MFM F091015
SUJEET KOTHAWADE MFM F091023
KANAIYA BAROT MMM M091006
Prepared for
MS.Joshi
INSTITUTE MANAGEMENT & COMPUTER STUDIES, THANE

8/7/2019 final product line
http://slidepdf.com/reader/full/final-product-line 3/29
Product Line Pricing
A PROJECT REPORT ON
(PRODUCT LINE PRICING)By
Name Course Roll No
MADHUSUDAN B. HANWAT MMM M091056
VIDULA PARADKAR MHRDM H091030
SUMIT KADAM MFM F091019
VAM VARM MMM M091043
SATYAVAN RAUNDHAL MMM M091051
BABURAO BADHE MMM M091050
KOMAL S. KATKADE MHRDM H091009
MANGESH J. PATIL MHRDM H091014
MANOJ JADHAV MFM F091015
SUJEET KOTHAWADE MFM F091023
KANAIYA BAROT MMM M091006
Approved by
Ms. Joshi, Professor
A Project Report submitted in partial fulfillment Of the requirements of
THE MMS PROGRAM (CLASS 2010)
INSTITUTE OF MANAGEMENT AND COMPUTER STUDIES
8/7/2019 final product line
http://slidepdf.com/reader/full/final-product-line 4/29
Product Line Pricing
ACKNOWLEDGEMENT
We take this opportunity of submitting this dissertation to express our deepgratitude to all those who offered their valuable help and time without which thisproject would not have progressed. The success of starting this project lies solely
on the kind assistance and encouragement of all those people.
We are greatly indebted to our guide Prof. Ms. Joshi for giving us the opportunity
to work on this project in spite our inexperience and providing us with valuableinsights and much needed encouragement from time to time.
8/7/2019 final product line
http://slidepdf.com/reader/full/final-product-line 5/29
Product Line Pricing
CERTIFICATE
This is to certify that the said project is undertaken under my guidance as a part
of curriculum activity and a part of the subject. Further to certify that the saidproject is completed and submitted to me in prescribed time limit and project isproperly handled by the team
_________________ ____________________
Sign. Of Guide IMCOST, Principle(M.S. Joshi)
Date :- 08.03.2010
Place :- Thane
8/7/2019 final product line
http://slidepdf.com/reader/full/final-product-line 6/29
Product Line Pricing
Table of Contents
1. INTRODUCTION ................................................................................7
2. PRODUCT -LINE PRICING..................................................................9
3. PRODUCT L INE P RICING STRATEGY ..............................................10
4. ALTERN ATIVE POLI CIES OF P RICE RELATIONSHIP .......................12
5. WHEN TO USE PRODUCT LIN E PR ICING STRATEGY ......................13
6. DEMAND R ELATIONSHIP IN PRODUCT LINE .................................16 7. RETAIL PRODUCT-LINE PRICING STRATEGY WHEN COSTS AND
PRODUCTS CHANGE ..............................................................................17
8. CASE STUDY....................................................................................20
9. THE MODEL .....................................................................................22
10. DISCR IMIN ATION I N THE EUROPEAN CAR MARKET...................26
11. CONCLUSIONS .............................................................................29
8/7/2019 final product line
http://slidepdf.com/reader/full/final-product-line 7/29
Product Line Pricing
1. INTRODUCTION
Product l in ing is the market ing strategy of offer ing for sa le
several related products.Unlike product bundling, where severalproducts are combined into one, lining involves offering several
related products individually. A line can comprise related productsof various sizes, types, colors, qualities, or prices. Line depth ref ersto the number of product variants in a line. Line consistency refers
to how closely related the products that make up the line are. Linevulnerability refers to the percentage of sales or profits that arederived from only a few products in the line.
The number of different product lines sold by a company is referredto as width of product mix. The total number of products sold in all
l ines is referred to as length of product mix. If a line of products is
sold with the same brand name, this is referred to as familybranding. When you add a new product to a line, it is referred to as
a line extension. When you add a line extension that is of betterquality than the other products in the line, this is referred to astrading up or brand leveraging. When you add a line extension that
is of lower quality than the other products of the line, this isreferred to as trading down. When you trade down, you will l ikelyreduce your brand equity. You are gaining short-term sales at theexpense of long term sales.
Image anchors are highly promoted products within a line that
define the image of the whole line. Image anchors are usually fromthe higher end of the line's range. When you add a new product
within the current range of an incomplete line, this is referred to asline filling.
Price lining is the use of a limited number of prices for all yourproduct offerings. This is a tradition started in the old five and dimestores in which everything cost either 5 or 10 cents. Its underlying
rationale is that these amounts are seen as suitable price points fora whole range of products by prospective customers. It has theadvantage of ease of administering, but the disadvantage of inflexibility, particularly i n times of inflation or unstable prices.
8/7/2019 final product line
http://slidepdf.com/reader/full/final-product-line 8/29
Product Line Pricing
There are many important decisions about product and service
development and marketing. In the process of product developmentand marketing we should focus on strategic decisions about productattributes, product branding, product packaging, product labeling
and product support services. But product strategy also calls forbuilding a product line.
8/7/2019 final product line
http://slidepdf.com/reader/full/final-product-line 9/29
Product Line Pricing
2. PRODUCT-LINE PRICING
Product line pricing is also becoming an increasingly common feature of many
markets, particularly manufactured products where there are many closely con-nected complementary products that consumers may be enticed to buy. It isfrequently observed that a producer may manufacture many related products.
They may choose to charge one low price for the core product (accepting alower mark-up or profit on cost) as a means of attracting customers to the com-ponents / accessories that have a much higher mark-up or profit margin.
Establishing a single price for all products in a product line, such as having aprice of $55 for the high-priced line of dress shirts, $45 for the medium-pricedline, and $35 for the lower priced line. Product line pricing factors in the impact
of a product's price on demand for another product offered by that marketer. For
example, if McDonald's offered a $12 sandwich, it would be far out of theprice/value range established by other sandwiches in McDonald's product line
and demand would be minimal. The price of a complementary product such assoftware can directly impact demand for the hardware. The higher the price of the software, the lower the demand for the hardware. McDonald's could afford to
offer a beverage at cost if the incremental sandwich sales revenue gained as aresult outweighed the lost beverage revenue. The price of a product such as acompact car can impact demand for another compact car model that would serve
as a substitute. The higher the price of one car, the greater the demand for theother. Variations in manufacturing costs across products are also a factor inProduct line pricing.

8/7/2019 final product line
http://slidepdf.com/reader/full/final-product-line 10/29
Product Line Pricing
3. PR ODUCT LINE PR ICING STRATEGY
You can only use a product l ine pr ic ing strategy i f you have awhole product l ine or i f you are in the proce ss of bui ld ing a whole
product l ine (more than one product, and usual ly more than sev-
eral products). This statement seems self-evident but remember
products are not usual ly brought out in a fu l l l ine; they are intro-duced one at a t ime.
So, to use a product l ine pr ic ing strategy you wi l l need to keep
track o f each product's l i fe cycl e stage, how inter -dependent the
products are, when you estimate a product wil l leave the l ine,
when a new product is scheduled to enter the l ine, and how theproducts in the l ine complement each other. Al l of these productl ine e lements wi l l affect your product l ine pr ic ing strategy.
One way of looking at pr ic ing for a product l ine is to consider
pr ic ing and prof i tabi l i ty of the whole l ine, not only individual
products of the l ine. In th is type of pr ice analys is , you might have
some products that lose money but they help pul l in buyers for
those products that make money (preferably that make a lot of
money). Other prod ucts in the l ine might just break-even but they
contr ibute to the fu l lness of the l i ne and help support the money-making products.
The other way to look at pro duct l ine pr ic ing is to analyze the im-
portance of one or more products to the whole l ine. For example,
for a car dealership, the car model is the product, and the acces-
sor ies, extended warrant ies, service package, color, sunroof and
other opt ions are the rest of the l ine i tems. Those l ine i tems
would be rather meaningless, for the most part , without the caras the pr imary product.

8/7/2019 final product line
http://slidepdf.com/reader/full/final-product-line 11/29
Product Line Pricing
Product l ine pr ic ing strategies can be further compl icated by com-
pet it ive act iv ity by product, not exclus ively by l ine. If you have
f ive compet itors for one of your products in the l ine, and then
only two compet itors for the other products in the l ine, you might
use a dif ferent pr ice strateg y for the product with l ots of compet i-
t ion, than the other l ine products.
Some more specif ic product l ine pr ice strategies are opt ional-
feature pricing (such as in the car example above); ancil lary
product pr ic ing (such as a digita l camera that is packaged with a
lens, a case, a battery charger, a memory card, etc.); two-part
pricing uch as a museum that charges for general entrance and
then adds an addit ional charge for entrance to a special exhibit);
product bundl ing pr ic ing ( in the above car example, i f you buy the
car and the accessor ies or one of the other opt ions at the same
time you wi l l receive a better pr ice than i f you buy some of theaccessor ies separately or later).
Make sure to bui ld a strong promotional program for product l ine
pr ic ing; buyers need to c lear ly understand what they are buying,
what the differences are with in the l ine (especia l ly i f there is not
clear dif ferent iat ion), and the benef its of buyi ng bundles, opt ional
features or other l ine accessor ies at the same t ime as the pr imary
product. Your buyers wi l l a lso need to understand the pr ic ing and
value differences between the products and with in the l ine.
8/7/2019 final product line
http://slidepdf.com/reader/full/final-product-line 12/29
Product Line Pricing
4. Alternati ve policies of price relationship
A logical approach to product l ine pr ic i ng is to start with a picture
of the a lteranat ive kinds of pol icy regarding the re lat ionships
among pr ices of members of product l ine. This approach assumes
that i t is des irable to have some kind of underly ing system of re-lat ionship of product pr ices which is debatable. But before adopt-
ing a phi losophy of chaos i t is wel l to examine systematic pat-terns, several of which are sketched below.
1] Pr ices that are proport ional to fu l l cost, i .e. , that produce thesame percentage net prof i t margin for a l l prod uct.
2] Pr ices that are proport ional to incremental cost, i .e. , that pro-
duces the same percentage contr ibut ion- margin over incr emental
cost for a l l products.
3] Pr ices with prof i t margins that are proport ional to convers ioncost, i.e., that take no account of purchase materials cost.
4] Prices that produce contribution margins that depend upon theelast ic i ty of demand of dif ferent market segment.
5] Pr ices that are systematica l ly re lated to the stage of market
and compet it ive development of individual members of the prod-uct l ine.
8/7/2019 final product line
http://slidepdf.com/reader/full/final-product-line 13/29
Product Line Pricing
5. WHEN TO USE PRODUCT LINE PRICING STRATEGY
Let me state the obvious: yo u can only use a product l ine pr ic ing
strategy i f you have a whole product l ine or i f you are in the
process of bui ld ing a whole product l ine (more than one product,
and usual ly more than several products). This statement seemsself-evident but remember p roducts are not usual ly brought out in
a ful l l ine; they are introduced one at a t ime.
So, to use a product l ine pr ic ing strategy you wi l l need to keep
track of each product's l i fe cyc le stage, how i nter -dependent the
products are, when you est imate a product wi l l leave the l ine,
when a new product is scheduled to enter the l ine, and how the
products in the l ine complement each other. Al l of these product
l ine e lements wi l l affect your product l ine pr ic ing strategy.
One way of looking at pr ic ing for a product l ine is to consider
pr ic ing and prof i tabi l i ty of the whole l ine, not only individual
products of the l ine. In th is type of pr ice analys is , you might have
some products that lose money but they help pul l in buyers for
those products that make money (preferably that make a lot of
money). Other prod ucts in the l ine might just break-even but they
contr ibute to the fu l lness of the l i ne and help support the money-
making products.
The other way to look at prod uct l ine pr ic ing is to analyze the im-portance of one or more products to the whole l ine. For example,
for a car dealership, the car model is the product, and the acces-
sor ies, extended warrant ies, service package, color, sunroof and
other opt ions are the rest of the l ine i tems. Those l ine i tems
would be rather meaningless, for the most part , without the car
as the pr imary product.
Product l ine pr ic ing strategies can be further compl icated by com-
pet it ive act iv ity by product, not exclus ively by l ine. If you have
f ive compet itors for one of your products in the l ine, and thenonly two compet itors for the other products in the l ine, you
might use a dif ferent pr ice strategy for the product with lots of
competit ion, than the other l ine products.
8/7/2019 final product line
http://slidepdf.com/reader/full/final-product-line 14/29
Product Line Pricing
Some more specif ic product l ine pr ice strategies are opt ional-
feature pricing (such as in the car example above); ancil lary
product pr ic ing (such as a digita l camera that is packaged with a
lens, a case, a battery charger, a memory card, etc.); two-part
pricing (such as a museum that charges for general entrance and
then adds an addit ional charge for entrance to a special exhibit);product bundl ing pr ic ing ( in the above car example, i f you buy the
car and the accessor ies or one of the other opt ions at the same
time you wi l l receive a better pr ice than i f you buy some of the
accessor ies separately or later).
Make sure to bui ld a strong promotional program for product l ine
pr ic ing; buyers need to c lear ly understand what they are buying,
what the differences are with in the l ine (especia l ly i f there is not
clear dif ferent iat ion), and the benef its of buying bundles, opt ional
features or other l ine accessor ies at the same t ime as the pr imaryproduct. Your buyers wi l l a lso need to understand the pr ic ing and
value differences between the products and with in the l ine.
Let me state the obvious: you can only use a product l ine pr ic ing
strategy i f you have a whole product l ine or i f you are in the
process of bui ld ing a whole product l ine (more than one product,
and usual ly more than several products). This statement seems
self-evident but remember products are not usual ly brought out in
a ful l l ine; they are introduced one at a t ime.
So, to use a product l ine pr ic ing strategy you wi l l need to keep
track of each product's l i fe cyc le stage, how i nter -dependent the
products are, when you estimate a product wil l leave the l ine,
when a new product is scheduled to enter the l ine, and how the
products in the l ine complement each other. Al l of these product
l ine e lements wi l l affect your product l ine pr ic ing strategy.
8/7/2019 final product line
http://slidepdf.com/reader/full/final-product-line 15/29
Product Line Pricing
One way of looking at pr ic ing for a product l ine is to consider
pr ic ing and prof i tabi l i ty of the whole l ine, not only individual
products of the l ine. In th is type of pr ice analys is , you might have
some products that lose money but they help pul l in buyers forth os e products that make money (preferably that make a lot of
money). Other prod ucts in the l ine might just break-even but they
contr ibute to the fu l lness of the l i ne and help support the money-
making products.
The other way to look at product l ine pr i c ing is to analyze the im-
portance of one or more products to the whole l ine. For example,
for a car dealership, the car model is the product, and the acces-
sor ies, extended warrant ies, service package, color, sunroof and
other opt ions are the rest of the l ine i tems. Those l ine i temswould be rather meaningless, for the most part , without the car
as the pr imary product.

8/7/2019 final product line
http://slidepdf.com/reader/full/final-product-line 16/29
Product Line Pricing
6. DEMAND RELATIONSHIP IN PRODUCT LINE
Tw o demand character ist ic pecul iar to mult ip le- product l ines ares ignif icant for pr ic i ng p urpose. The f irst is the interdependent of
the demand for var ious product of member’s l ine. Interdepend-
ence takes many form. Products may be substitutes for each
other, e.g., dif ferent models of radios or grades of t i res. They
may be complementary, e.g., tabulators and punched cards. They
may be complementary in the more remote and subt le sense of
augment ing one another ’s e.g., in enhancing the reputat ion of the
f i rm.
Interdependence also has a t ime dimension. The sales of oneproduct today may affect the sales of another product tomorrow.
Str ik ing examples are introductory models, such tr ia l subscr ipt ions
and chi ldren’s edit ions of magazines, diminut ive sport ing equip-
ments. But this t ime aspect extends into any product group in
which the sales of one product tends to t ie the customer to future
purchase of another product as exemplif ied by the slow-speed
phonographs and their records.
A second demand character ist ic in mult ip le-product l ines is their
importance as instruments for market segmentations and pricediscr iminat ions. They provide opportunit ies for breaking the mar-
ket into smal ler sector that dif fer in pr ice e last ic i ty and hence can
prof itably be charged different pr ices. Product des ign and pr ic ing
and major methods for achieving segmentat ion. Not only can mar-
ket segmentat ion increase prof i ts by sett ing pr ices that take ad-
vantage of the different e last ic i ty of demand in each sector; i t can
also increase tota l sa les by penetrat ing mass markets at pr ices
that cover incremental costs and contribute a l itt le to over -head.

8/7/2019 final product line
http://slidepdf.com/reader/full/final-product-line 17/29
Product Line Pricing
7. Retail Product-Line Pricing Strategy When Costs and ProductsChange
Technological advances and other factors are rapidly changing the
nature of products and cost structures. Such factors can impact
product ingredients and cost components, having a sudden dra-mat ic impact on the wholesale and reta i l pr ices of many var iants
with in product l ines such as computers, pr inters, digi ta l cameras,
cel lu lar phones and kitchen electr ics. Decreases in computer chip
pr ices, for example, affect the pr ices of many products from cel lu-
lar phones to a larm clocks; increases in wages impact most ser-
vices from health care to banking; and, oi l pr ice shocks dramati-
cal ly impact many products from automobi les to home insulat ion.
These rapid changes can also lead to abrupt addit ions or delet ions
from a product l ine.
However, cost changes can have a disproport ionate impact on
only one end of the l ine (e.g., h igher or lower qual i ty var iants)
because quality differences are often caused by differences in
components or ingredients. For example, increases in the pr ice of
diamonds might have a disproport ionate impact on the higher
qual i ty var iants of the jewelry l ines (e.g., watches, earr ings,
necklaces, and bracelets) because, for such variants, a greater
percentage of the cost comes from diamonds. Lower qual i ty jew-
elry var iants may contain few or no diamonds. S imi lar ly, de-
creases in the pr ices of n ickel cadmium batter ies may have moreimpact on lower qual i ty e lectronic devices (e.g., camcorders, CD
players, cordless te lephones, and home laptop computers) be-
cause higher qual i ty devices use other types of batter ies (e.g.,
manganese l i th ium). In yet other instances, cost changes are fe lt
proport ional ly throughout the l ine. For instance, increases in a l-
cohol taxes can have a proport ional impact on the cost of l iquor
products. The cost o f each wine bott le , for example, may increase
by 10 percent.
One strategy f or dealing with a co st change is to implement a co r-respondi ng pric e change; for exa mple, who lesale cost inc r ements
(decrements) result in h igher ( lower) reta i l pr ices. Such strate-
gies, however, may not consider the interact ions among the var i-
ants of a reta i l product l ine. These interact ions imply that in addi-
t ion to consider ing the impact of a var iant 's pr ice on that var iant 's
prof i t , i t is v ita l for the reta i ler to consider the impact of that
pr ice on the prof i ts of other var iants in the l ine.

8/7/2019 final product line
http://slidepdf.com/reader/full/final-product-line 18/29
Product Line Pricing
Recent research suggests that these product l i ne interact ions may
be more complex than previously bel ieved. In many cases, prod-
ucts show a form of asymmetr ic demand relat ionship. Although
lower qual i ty brands are vulnerable to h igher qual i ty brand's pr ice
reduct ions, h igh-qual i ty brands did not show this vulnerabi l i ty.Research shows that many more consumers are incl ined to switch
up to h igher qual i ty brands than switch down to lower qual i ty
brands. Asymmetr ic l ine compet it ion is now documented in both
in-store exper iments and household- level purchasing panel-data.
Whether product var iants in a l ine exhibit asymmetr ic dem and re-
lat ionships or not, reta i lers must know how to adjust their pr ices
in response to var ious types of cost shocks. Those adjustments
must consider a l l product l ine interact ions whether they are sym-
metr ic or not. Our paper answers three key quest ions necessaryfor a rapid response. First , when the costs of specif ic product
components or ingredients change, how should reta i lers re-adjust
the pr ices of the affected product l ines? Second, what wi l l be the
impact on prof i t margins, the range of pr ices in the l ine and the
average pr ice in the l ine? Final ly, i f a product is removed, perhaps
suddenly, from the l ine, how should the reta i ler adjust the other
pr ices in the l ine?
We answer each of these three quest ions. The answers depend on
the nature of the demand relat ionships between the var iants inthe l ine. For example, consider a s imple product l ine with two
var iants. We f ind that when demand funct ions are l inear and
products display a symmetric demand relationship (i.e., changes
in two var iant 's pr ices have the same impact on each other 's de-
mand), then changes in the cost of one var iant has no impact on
the opt imal pr ice of the other var iant. However, when the demand
funct ion for a product l ine is l inear and an asymmetr ic re lat ion-
ship ex ists, there i s an inver se relat io nship betw een the cost o f
the lower qual i ty var iant and the opt imal pr ice of the higher
qual i ty var iant.
In general, when the cost of a var iant ref lects i ts qual i ty, there
are more than two var iants in the l ine and the l ine displays
asymmetr ic demand relat ionships, we f ind the fol lowing impl ica-
t ions to be true.
8/7/2019 final product line
http://slidepdf.com/reader/full/final-product-line 19/29
Product Line Pricing
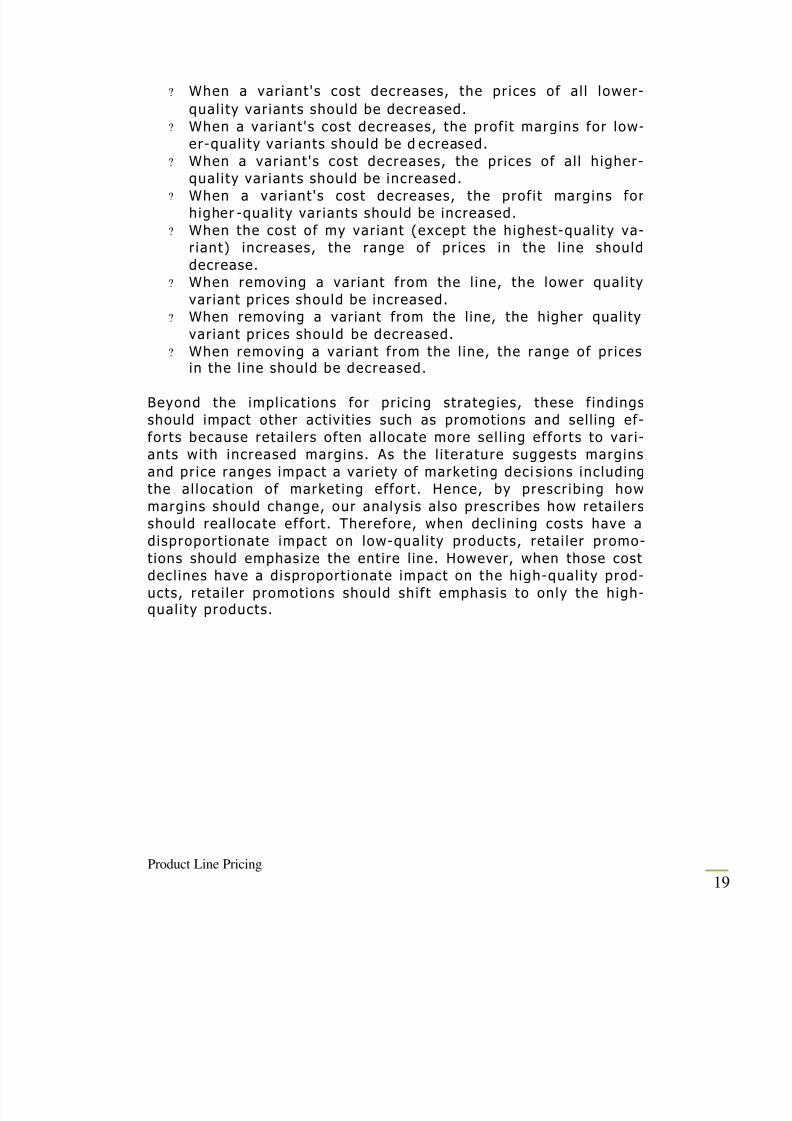
? When a var iant 's cost decreases, the pr ices of a l l lower-
qual i ty var iants should be decreased.
? When a var iant 's cost decreases, the prof i t margins for low-
er-qual i ty var iants should be d ecreased.
? When a var iant 's cost decreases, the pr ices of a l l h igher-
qual i ty var iants should be increased.? When a var iant 's cost decreases, the prof i t margins for
higher -qual i ty var iants should be increased.
? When the cost of my var iant (except the highest-qual i ty va-
r iant) increases, the range of pr ices in the l ine should
decrease.
? When removing a var iant from the l ine, the lower qual i ty
var iant pr ices should be increased.
? When removing a variant from the l ine, the higher quality
var iant pr ices should be decreased.
? When removing a var iant from the l ine, the range of pr icesin the l ine should be decreased.
Beyond the impl icat ions for pr ic ing strategies, these f indings
should impact other activit ies such as promotions and sell ing ef-
forts because reta i lers often a l locate more sel l ing efforts to var i-
ants with increased margins. As the l i terature suggests margins
and pr ice ranges impact a var iety of market ing deci s ions including
the al locat ion of market ing effort . Hence, by prescr ibing how
margins should change, our analys is a lso prescr ibes how reta i lers
should real locate effort . Therefore, when decl in ing costs have adisproport ionate impact on low-qual i ty products, reta i ler promo-
tions should emphasize the entire l ine. However, when those cost
decl ines have a disproport ionate impact on the high-qual i ty prod-
ucts, reta i ler promotions should shift emphasis to only the high-qual i ty products.

8/7/2019 final product line
http://slidepdf.com/reader/full/final-product-line 20/29
Product Line Pricing
8. CASE STUDY
Most consumer product markets are character ized by several f i rms
offer ing product l ines that c losely match those of their compet i-
tors. The var ious companies are dif ferent iated not so much by thetype of product, but by other factors such as styl ing, warrant ies,reputat ions for re l i abi l i ty, brandname. Most car manufacturers, forexample, tend to offer the same range of cars in terms of power,s ize, engine capacity, speed, etc. The way they vary is to have astyl ing that is unique to their whole product l ine (and to their
brandname), thus a l lowing economies of scope in advert is ing, ser-vic ing, etc. Firms seem to work very hard to produce a look thatis unique, but not uniformly desired by a l l consumers (hor izontaldifferenti at ion), while at the same time they offer products whichcan vary considerably in qual i ty (vert ica l dif ferent iat ion).
This suggests that f i rms make an essent ia l ly two-dimensionalproduct l ine decis ion. The f irst is the choice of a styl ing, or com-pany pract ice, that dif ferent iates a l l of their products in somecommon way from those of their compet itors. In the secondstage, each company makes a product line decis ion whic h includes
the range of products they offer, and the corresponding priceschedule. In many markets, f i rms change their style very seldomand we therefore focus our analys is on product l ine r iva lry forexogenously chosen styles. We show that f i rms create market
power for themselves by differ ent iat ing their whole product l ine tobe able to pr ice discr iminate among consumers. Therefore, prod-uct l ine r iva lry can be vi ewed as an example of ol igopol ist ic pr icediscr iminat ion.
In our model we assume that f i rms locate in a point in style
space, and produce a product l ine that var ies in qual i ty. Consum-ers diff er in thei r income an d preferen ce for sty le. In thi s fram e-work we examine two -part pr ice schedules that include a f ixed feeand a markup, and study how pr ice discr iminat ion var ies with
compet it ion and with consumers ’ preferences for style.
We prove that a non-cooperative equil ibrium exists and show that,as compet it ion increases, pr ices approach marginal cost. Eventhough the preferences we use are der ived from those of Gabsze-wicz and Thisse (1979), our model does not lead to their natural
ol igopoly result .

8/7/2019 final product line
http://slidepdf.com/reader/full/final-product-line 21/29
Product Line Pricing
The empir ica l part of the paper deals with the car market in f ivecountr ies of the European Union. For obvious reasons, detai leddata on costs as wel l as( in most cases) on volumes are unavai l-
able. There now exist several papers in which authors are able toinfer cost and demand parameters (See Berry, Levinsohn and
Pakes (1995, 1998) Goldberg (1998) and Verboven (1996) forsuch examples). Since our focus was different, we did not esti-mate the structural parameters of the model, and took a shortcut
based on the theoretical model, where we derive our results byassuming that the equil ibrium price-quality schedules are two-parttar i f fs , whose coeff ic ients are parametr ized with respect to thedegree of compet it ion. Here, we direct ly est imate these pr iceschedules, and f ind evidence that European producers use product
l ines to price discriminate.
Before turning to the detai ls of the model, let us note that, as
Brander and Eaton (1984) have pointed out in their study of prod-uct l ine r iva lry, there is re lat ively l i t t le work on the subject. Their
paper centers around the issue of entry deterrence and the choiceof scope and has l i t t le to say about pr ice discr iminat ion. The ear-l ier l i terature on product dif ferent iat ion, has gener al ly assumedthat each f irm produces a s ingle qual i ty product. More recent ly,Champsaur and Rochet (1985, 1989) addressed the question of
mult iprod-uct ol igopol ists; however the absence of hor izontal dif-ferent iat ion in their model results in each qual i ty being sold by atmost one f irm. Economides (1986) and Neven and Thisse (1990)study a model in which var iety ( i .e. , hor izontal dif ferent iat ion)and qual i ty choice ( i .e. , vert ica l dif ferent iat ion) of a s ingle prod-
uct are endogenous; however, they do not examine the case of product l ine competit ion. Gilbert and Matutes (1993) focus on theissue of commitment in determining the scope of the f irms’ pr icel ine offer ings in a model with a discrete product space. Rochetand Stole (1999) provide an extensive theoret ica l framework to
address the issue of nonl inear pr ic ing in a mult id imensional set-t ing.
They show, in part icu lar, that an eff ic ient qual i ty a l locat ion with
cost-plus-fee pr ic ing, examined in th is paper, emerges as an equi-l ibrium outcome.
The paper is organized as fol lows. In Sect ion 2 we out l ine thetheoret ica l model and state our existence and comparat ive stat icsresults, for which proofs are given in the Appendix. Sect ion 3
deals with our empir ica l results. Sect ion 4 is devoted to conclud-ing comments.
8/7/2019 final product line
http://slidepdf.com/reader/full/final-product-line 22/29
Product Line Pricing
9. The model
There is a market with dif ferent iated products and there are n
f i rms, indexed by In contrast to mo st of themodels of spatial competit ion, that typical ly deal with one dimen-
sional choice spaces, we assume that f irms compete with theirproduct l ines. That is , there is an observable character ist ic whichis common to a l l products of a given f irm. In the case of the carmarket th is might be a f i rm’s dist inct ive styl ing (th ink, for exam-ple, of Mercedes-Benz or BMW who have cars with a dist inctive
“ look”) .
It wil l be assumed that the fi rms loc ate symmetri cal ly o n the ci r-c le at locat ions (see Sa lop (1979), Novshek (1980),
Horstmann and Sl iv insky (1985)). The circumference L of the c ir-cle wil l provide a measure of p otential di versity. While many co n-sumers may wish to buy a pro duct of given styl e, they wi l l in g en-eral also wish to choose among different qualit ies. Firms thereforeoffer a range of qualit ies
F i rm i s p ro duc t l ine is thus def ined b y The marginal costof producing a good of qual i ty q is the same for a l l f i rms andtakes the form c i(q) = cq.
There is a cont inuum of consumers parameter ized by their most
preferred style and income. The space of consumers is givenby where M = [m L , m H] and m L (m H) denotes the lower(upper) bound of consumers ’ income. It is furthermore assumedthat consumers are uniformly distr ibuted over Y and, without lossof general i ty, their tota l mass is equal to one. Each consumer
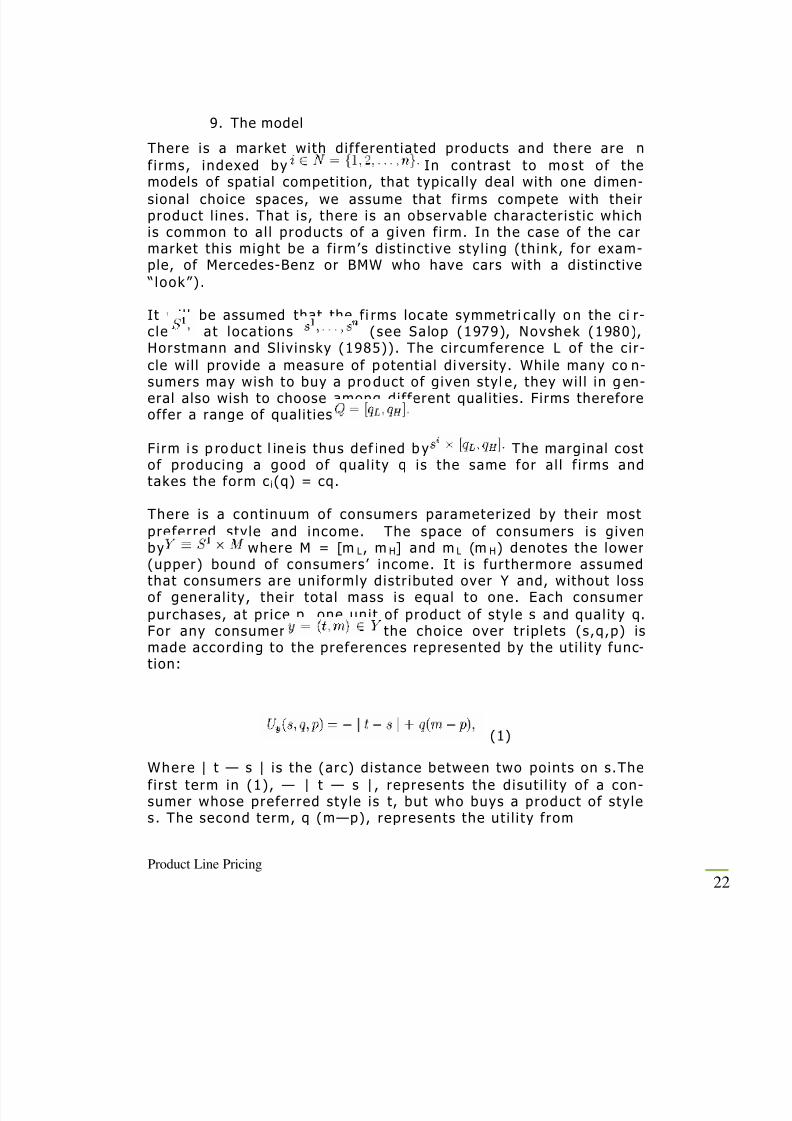
purchases, at pr ice p, one unit of product of style s and qual i ty q.For any consumer the choice over tr ip lets (s,q,p) ismade according to the preferences represented by the ut i l i ty func-t ion:
(1)
Where | t — s | is the (arc) distance between two points on s.The
f irst term in (1), — | t — s | , represents the disut i l i ty of a con-sumer whose preferred style is t, but who buys a product of styles . The second term, q (m—p), represents the ut i l i ty from
8/7/2019 final product line
http://slidepdf.com/reader/full/final-product-line 23/29
Product Line Pricing
consuming one unit of a good of qual i ty q, at pr ice p. This is es-
sent ia l ly the funct ional form used by Gabszewicz and Thisse(1979) and Shaked and Sutton (1982), which guarantees that atgiven pri ce, co nsumers with hi gher in comes put more wei ght on
quality.S ince f irms are not able to observe the character ist ics of indi-vidual consumers and charge a tai lor-made price for each of them,
they choose pr ice as a f unct ion of qua l i ty a lone. For reasons of technical tractabi l i ty and potent ia l empir ica l appl icat ions, we as-sume that pr ice is an aff ine funct ion of qual i ty. The f irms’ pr iceschedules wi l l therefore be restr icted to two-part tar i f fs . Thus, atypical strategy of f i rm i i s which y ie lds
a pr ice P i(q ) = a i + b iq for qual i ty q . When the marginal costfor producing qual i ty q , f i rm i wil l d iscr iminate among indi vidualswith dif ferent tastes for qual i ty. Customers of f i rm i wil l buy the
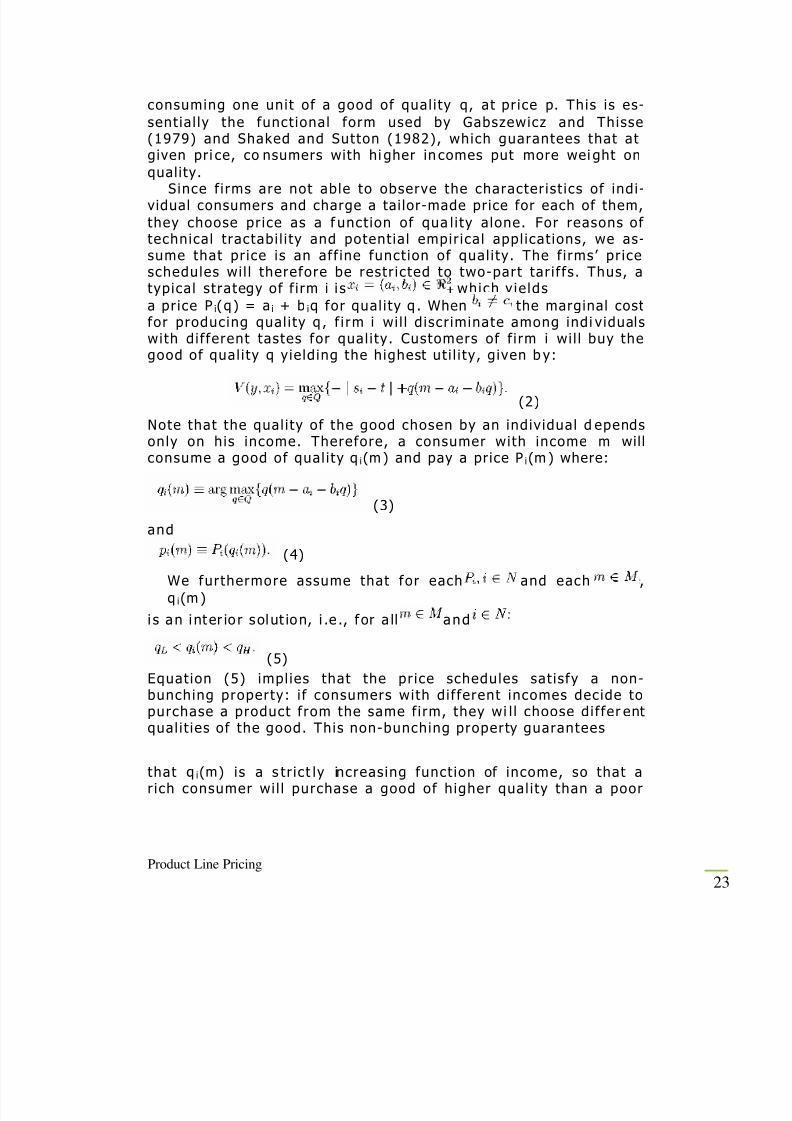
good of qual i ty q yie lding the highest ut i l i ty, given b y:
(2)
Note that the qual i ty of the good chosen by an individual d ependsonly on his income. Therefore, a consumer with income m willconsume a good of qual i ty q i(m ) and pay a price P i(m ) where:
(3)
and
(4)
We furthermore assume that for each and each ,
q i(m )
i s an i nt er io r solut ion, i .e ., f or a ll and
(5)
Equat ion (5) impl ies that the pr ice schedules sat isfy a non-bunching property: i f consumers with dif ferent incomes decide topurchase a product from the same f irm, they wi l l choose differ entqual i t ies of the good. This non-bunching property guarantees
that q i(m) is a s tr ict ly increas ing funct ion of income, so that ar ich consumer wi l l purchase a good of h igher qual i ty than a poor
8/7/2019 final product line
http://slidepdf.com/reader/full/final-product-line 24/29
Product Line Pricing
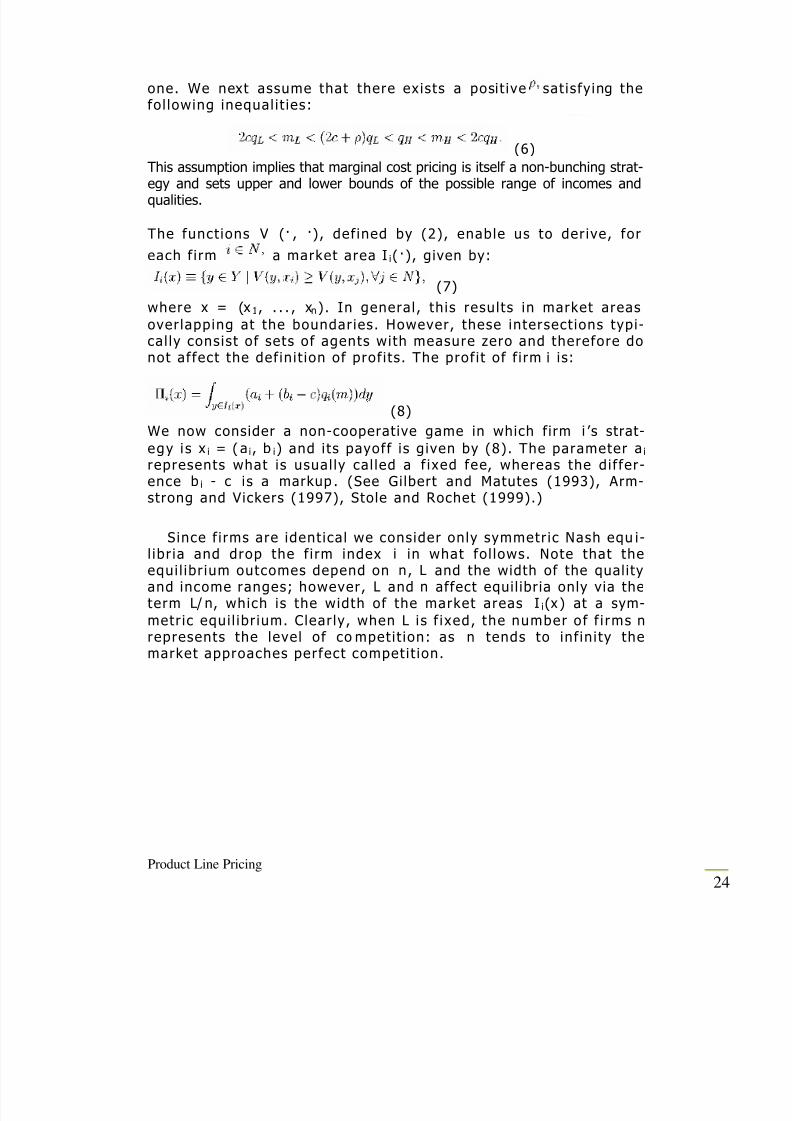
one. We next assume that there exists a posit ive sat isfying thefol lowing inequal i t ies:
(6)
This assumption implies that marginal cost pricing is itself a non-bunching strat-egy and sets upper and lower bounds of the possible range of incomes andqualities.
The funct ions V (· , ·), def ined by (2), enable us to der ive, for
each f irm a market area I i( ·), given by:
(7)
where x = (x 1, . . . , xn ). In general, th is results in market areas
over lapping at the boundaries. However, these intersect ions typi-cal ly consist of sets of agents with measure zero and therefore do
not affect the def in it ion of prof i ts . The prof i t of f i rm i is:
(8)
We now consider a non-cooperative game in which firm i ’s strat-
egy i s x i = ( a i, b i) and its payoff is given by (8). The parameter a i represents what is usual ly cal led a f ixed fee, whereas the differ-ence b i - c is a markup . (See Gilbert and Matutes (1993), Arm-strong and Vickers (1997), Stole and Rochet (1999).)
S ince f irms are ident ica l we consider only symmetr ic Nash equ i-l ibr ia and drop the f irm index i in what fol lows. Note that theequi l ibr ium outcomes depend on n, L and the width of the qualityand income ranges; however, L and n affect equil ibria only via theterm L/ n, which is the width of the market areas I i(x ) at a sym-
metr ic equi l ibr ium. Clear ly, when L i s f ixed, the number of f i rms nrepresents the level of co mpet it ion: as n tends to inf in ity themarket approaches perfect compet it ion.
8/7/2019 final product line
http://slidepdf.com/reader/full/final-product-line 25/29
Product Line Pricing
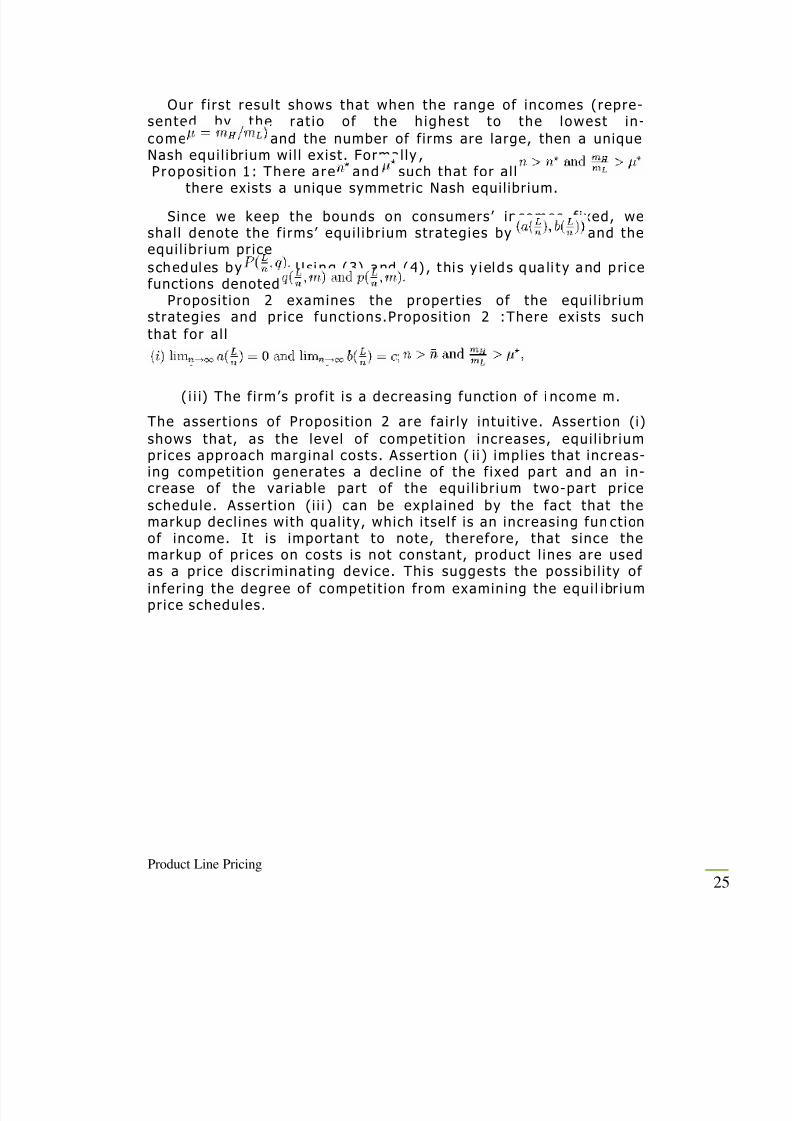
Our f i rst result shows that when the range of incomes (repre-
sented by the rat io of the h ighest to the lowest in-
come and the number of f irms are large, then a uniqueNash equi l ibr ium wi l l exist . Formal ly ,
P roposi t ion 1 : There a re and such that for a l lthere exists a unique symmetric Nash equil ibrium.
Since we keep the bounds on consumers ’ incomes f ixed, weshal l denote the f irms’ equi l ibr ium strategies by and theequi l ibr ium pr ice
s chedules by Using (3) and (4) , t hi s y i elds qua li t y and p ri cefunctions denoted
Proposit ion 2 examines the propert ies of the equi l ibr iumstrategies and pr ice funct ions.Proposit ion 2 :There exists such
that for a l l
( i i i) The f irm’s prof i t is a decreasing funct ion of i ncome m .
The assert ions of Proposit ion 2 are fa ir ly intu it ive. Assert ion (i)
shows that, as the level of compet it ion increases, equi l ibr iumprices approach marginal costs. Assert ion ( i i ) impl ies that increas-ing compet it ion generates a decl ine of the f ixed part and an in-crease of the var iable part of the equi l ibr ium two-part pr ice
schedule. Assert ion (i i i ) can be expla ined by the fact that the
markup decl ines with qual i ty, which i tse lf is an increasing fun ct ionof income. It is important to note, therefore, that s ince themarkup of pr ices on costs is not constant, product l ines are usedas a pr ice discr iminat ing device. This suggests the poss ibi l i ty of
infer ing the degree of compet it ion from examining the equi l ibr iumprice schedules.
8/7/2019 final product line
http://slidepdf.com/reader/full/final-product-line 26/29
Product Line Pricing
10. Discrimination in the European car market
Since we shal l be discuss ing pr ice discr iminat ion in Belgium,
France, Germany, Ita ly and the United Kingdom, some commentson the f ive markets are in order.
Casual observat ion seems to lend support to the assumptionthat Belgium is the most compet it ive market. Indeed, there is noBelgian domest ic prod ucer, whi le the four other countr ies a l l haveone or several producers enjoy ing some degree of protect ion. Bel-gium is a lso widely open to Japanese imports. Final ly, producer
pr ices are s ignif icant ly lower in Belgium than in a l l other countr ies(see BEUC (1984, 1986) as wel l as Mertens and Gins-burgh (1985)and Ginsburgh and Vanhamme (1989)). These observat ions arebacked up by the fact that producers complain about Belgian priceregulat ions leading to insuff ic ient prof i ts , or even losses in some
cases. On the other end of the spectrum, the United Kingdom is
character ized by r ight-hand dr iv ing which isol ates the Br it ish mar-ket and makes it diff icult for consumers to import their car fromCont inental Europe; mo reover, a substant ia l part of “pr ivate” carsis owned by companies. France, Germany and Ita ly are endowed
with characterist ics which l ie between these two extreme cases.It should also be stressed that there exist exclusive agreements
between producers and deale rs. This may turn out to impose non-tar i f f barr iers between the var ious countr ies and, though it doesnot completely prevent arbitrage, i t makes i t rather dif f icu lt . An
individual consumer from say France, can buy his car in Belgium(differences in regulat ions tend however to make th is quite dif f i -
cu lt and t ime consuming), but dealers can hardly organize ar-bitrage on a large scale basis, though th is is s lowly changing overthe years.2As was pointed out in the introduct ion, we did not es-
t imate the structuralcoefficients of the model, but took the shortcut to estimate theequi l ibr ium pr ice-qual i ty schedules Pic (q) = a ic + b ic q ic in the var i-ous countr ies c whereproducer i is act ive and to check whether the coeff ic ients a ic and
b i c satisfyassert ion ( i i ) of Proposit ion 2, i .e. whether a i c and b i c ' < b ic »
in a
country c that is a pr ior i - see above - assumed to be less com-pet it ive than country c". The un ique qua l i ty q considered in thetheoret ica l model wi l l b e replaced by a vector of character ist ics z.The characterist ics used are engine capacity, speed and length -

8/7/2019 final product line
http://slidepdf.com/reader/full/final-product-line 27/29
Product Line Pricing
which are cont inuous var iables - and a dummy var iable whichrepresents the type of fuel used, diesel or gasoline.
For every producer i sel l ing in country c, the fol lowing regres-
sion is computed:
Each regress ion i c is computed by pool ing observ at ions belong-ing to three years (1988, 1989 and 1990). The var iables are as
fol lows: p i cj t i s the pr ice of make j so ld in year t ; y l is a dummyvariable which takes the value one i f observat ion ( ic , j t ) corre-sponds to year l = t and i s t he val ue o f t he kth character ist ic. The a ’ s and ß ’s are regress ion coeff ic ients - the in-tercepts a and the slopes b of the theoretical model. Note that
the dependent var iable in each regress ion is the logar ithm of the
pr ice, and not the pr ice i tse lf ; th is is done to reduce any poss ibleheteroskedast ic i ty. The theoret ica l model of Sect ion 2, is l inear,but nothing there prevents to rescale dif ferent ly the qual i ty var i-able(s).
2 The European Court in Luxemburg had to deal with such cases, and ruledagainst dealers who were not officially selected by producers. In 1999, the Euro-pean Commission imposed a Euro 102 million fine on Volkswagen who was for-
bidding Italian dealers to sell cars to Austrian and German customers, sinceprices in Austria and Germany were much higher than in Italy.
8/7/2019 final product line
http://slidepdf.com/reader/full/final-product-line 28/29
Product Line Pricing
We ran 117 such individual regress ions,3 which makes i t impossi-ble to give the detai led results. Table 1 merely reports the distr i-
but ion of the R 2s, showi ng that most adj ustements are ver y sati s-factory.
Next, we ran, for each producer i , var ious hypothesis tests on the( in)equa-l i ty of the regress ion coeff ic ients across countr ies.4 The
result ing F-tests are reported in Table 2 and show that the jointtest on equal i ty of intercepts and slopes is rejected in al l cases,with the except ion of Jaguar-Daimler. This leads us to concludethat the pr ice shedules set by producers for their product l inesare s ignif icant ly dif ferent across countr ies. The joint test on
slopes only also rejects equal i ty in most cases.
This seems to impl y that producer s use character ist ics in order to
pr ice discr iminate, but does not indicate whether assert ion (i i) of Proposit ion 2 holds. To check for th is , we have ranked countr ies
according to the values of the intercepts or of the s lopes on en-gine capacit y and speed; thes e ar e the characteri st ics that are o f-ten used to dist inguish a car in a product l ine – viz. BMW 1600,1800 or Ford GT, GTI, etc.
The results of these rankings are given in Table 3, 5 which givesthe number of t imes a country is ranked lowest, second lowest,etc. for the intercept of the regress ions as wel l as for each of thes lope coeff ic ients corresponding to character ist ics (engine capac-ity, speed). For instance, Belgium has the smal lest intercept in 8
cases (out of 20), the second smal lest in 11 cases, etc. , whi le i thas the smal lest s lope on engine capacity only once, the secondsmal lest in 3 cases, and the largest in 7 cases. We also computethe mean rank for each country. This shows that Belgium corre-sponds to the most competit ive country (lowest mean rank for in-
tercept and highest for s lopes on character ist ics), 6 while theUnited Kingdom corresponds to theleast compet it ive (h ighest mean rank for intercepts and lo west fors lopes), which is consistent with the theoret ica l impl icat ions of
the model and with the above discussion.

8/7/2019 final product line
http://slidepdf.com/reader/full/final-product-line 29/29
11. Conclusions
We have considered a model of oligopolistic competition which incorporates bothhorizontal and vertical product differentiation. Firms choose a location in style
space and select a product line of different qualities. We show that a non-cooperative equilibrium exists. Taking these two views of new product introduc-tions to their logical end suggests a possible rational for why some firms may
support research and development departments and marketing departments thatare prolific but slow. Product lines that grow slowly| but never stop to grow|overtime are most efficient at solving the time inconsistency problem.
We analyze firms’ pricing strategies by specifying a supply-side model with com-peting manufacturers who sell through a common retailer. The first decsion weinvestigate is firms’ pricing strategies across the product lines they cary. While
the price differences between product lines appear to be driven primarly by costdifferences, in several instances the evidence suggests that manufactturers areusing product lines as price discrimination tools. Second, we look at firms’ pricing
decisions across flavors within a product line. We conduct a “what-if”-type ex-periment to determine if firms’ profits would increase if they were to price flavorsindividually and conclude that this is not the case. This finding suggests that
firms’ strategy of setting equal prices for all flavors within a given product line isindeed optimal.
We also study the properties of the equilibrium style and product line seletionsand show that if the degree of competition increases, prices approach marginalcost. The model is applied to the European car market; the results support the
theoretical conclusion that producers use product lines to price discriminateacross countries.