Embed Size (px)
Citation preview
Marine Corps Installations Command
06285038.0000
FINAL
Ran
ge E
nviro
nm
ental V
uln
erability A
ssessmen
t
5-Year R
eviewM
arine C
orp
s Base H
awaii
FINAL
DISTRIBUTION STATEMENT A. Approved for public release, distribution is unlimited.
Photo credit: ARCADIS
December 2014
December 2014

Marine Corps Installations Command MCICOM (GF-5) 3000 Marine Corps Pentagon, Room 2D153 Washington, DC 20350
Final
Range Environmental Vulnerability Assessment 5-Year Review Marine Corps Base Hawaii December 2014
06285037.0000
Report Prepared By:
701 Town Center Drive
Suite 600
Newport News, VA 23606
DISTRIBUTION STATEMENT A: Approved for public release;
distribution is unlimited.

Marine Corps Installations Command Range Environmental Vulnerability Assessment 5-Year Report Marine Corps Base Hawaii
i
Table of Contents
Executive Summary 1
1. Introduction 1-1 1.1. Purpose ......................................................................................................................... 1-1 1.2. Scope and Applicability ................................................................................................. 1-2 1.3. Data Collection Effort .................................................................................................. 1-13 1.4. Report Organization .................................................................................................... 1-14
2. Baseline Results and Installation Changes 2-1 2.1. Baseline Results ........................................................................................................... 2-1 2.2. Installation Changes ..................................................................................................... 2-3
Changes at MCB Hawaii Kaneohe Bay ........................................................ 2-3 2.2.1. Changes at Marine Corps Training Area Bellows ......................................... 2-3 2.2.2. Changes at Puuloa Range Training Facility .................................................. 2-4 2.2.3. Changes in REVA Assessment ..................................................................... 2-4 2.2.4.
2.3. Summary of Areas Address in the Five-Year Review .................................................. 2-4
3. Munitions Constituents Loading Rates and Assumptions 3-1 3.1. Munitions Constituents Loading Process ...................................................................... 3-1 3.2. Expenditure Data .......................................................................................................... 3-3 3.3. REVA Munitions Constituents Loading Rate Calculator ............................................... 3-5 3.4. Munitions Constituents Loading at MCB Hawaii ........................................................... 3-6
Kaneohe Bay Range Training Facility ........................................................... 3-9 3.4.1. Marine Corps Training Area Bellows ........................................................... 3-17 3.4.2. Puuloa Range Training Facility ................................................................... 3-21 3.4.3. Other Training Areas ................................................................................... 3-21 3.4.4. Operational Range Clearance Program ...................................................... 3-22 3.4.5.
3.5. Munitions Constituents Loading Assumptions ............................................................ 3-26 Selection of Munitions Constituents Loading Areas .................................... 3-26 3.5.1. Overarching Assumptions ........................................................................... 3-27 3.5.2.
4. Conceptual Site Model 4-1 4.1. MCBH Kaneohe Bay ..................................................................................................... 4-4
Facility Profile ................................................................................................ 4-4 4.1.1. Operational Range Profile ............................................................................. 4-4 4.1.2. Physical Profile .............................................................................................. 4-9 4.1.3. Surface Water Profile .................................................................................. 4-14 4.1.4. Groundwater Profile .................................................................................... 4-20 4.1.5. Human Land Use and Exposure Profile ...................................................... 4-24 4.1.6. Natural Resources Profile ........................................................................... 4-26 4.1.7. Potential Pathways and Receptors ............................................................. 4-27 4.1.8.
4.2. Puuloa Range Training Facility ................................................................................... 4-33 Facility Profile .............................................................................................. 4-33 4.2.1.
Table of Contents
ii
Marine Corps Installations Command Range Environmental Vulnerability Assessment 5-Year Report Marine Corps Base Hawaii
Operational Range Profile ........................................................................... 4-33 4.2.2. Physical Profile ............................................................................................ 4-38 4.2.3. Surface Water Profile .................................................................................. 4-41 4.2.4. Groundwater Profile .................................................................................... 4-46 4.2.5. Human Land Use and Exposure Profile ...................................................... 4-48 4.2.6. Natural Resources Profile ........................................................................... 4-49 4.2.7. Potential Pathways and Receptors ............................................................. 4-50 4.2.8.
5. Modeling Assumptions and Parameters 5-1 5.1. Surface Water and Sediment Modeling Assumptions .................................................. 5-1
Surface Water Screening-Level Approach at the Munitions Constituents 5.1.1.Loading Areas ............................................................................................... 5-3
Sediment Screening-Level Approach at Munitions Constituents Loading Areas5-7 5.1.2.5.2. Groundwater Modeling Assumptions ............................................................................ 5-8
Qualitative Assessment ................................................................................. 5-8 5.2.1. REVA Groundwater Assessment Procedure ................................................ 5-9 5.2.2.
6. Screening-Level Assessment Results 6-1 6.1. High Explosives / Inert Impact Drainage Area .............................................................. 6-3
Conceptual Site Model .................................................................................. 6-3 6.1.1. Surface Water and Sediment Screening-Level Assessment Results ......... 6-10 6.1.2. Groundwater Screening-Level Assessment Results ................................... 6-17 6.1.3.
6.2. Range 8/Range 8A Drainage Area ............................................................................. 6-19 Conceptual Site Model ................................................................................ 6-20 6.2.1. Surface Water and Sediment Screening-Level Assessment Results ......... 6-26 6.2.2. Groundwater Screening-Level Assessment Results ................................... 6-31 6.2.3.
7. Small Arms Range Assessments 7-1 7.1. Summary of the Small Arms Range Assessment Protocol .......................................... 7-1 7.2. Range Maintenance Activities ....................................................................................... 7-7 7.3. Small Arms Ranges at MCBH Kaneohe Bay ................................................................ 7-8
Range 1 ......................................................................................................... 7-8 7.3.1. Range 2 ......................................................................................................... 7-9 7.3.2. Range 6 ....................................................................................................... 7-10 7.3.3. Range 8B .................................................................................................... 7-10 7.3.4. Range 9 ....................................................................................................... 7-11 7.3.5. Range 10 ..................................................................................................... 7-11 7.3.6.
7.4. Puuloa Range Training Facility ................................................................................... 7-12 Alpha Range ................................................................................................ 7-12 7.4.1. Bravo Range ............................................................................................... 7-13 7.4.2. Charlie Range ............................................................................................. 7-13 7.4.3. Delta Range ................................................................................................ 7-14 7.4.4. Echo Range ................................................................................................. 7-14 7.4.5. Foxtrot Range .............................................................................................. 7-15 7.4.6.
8. References 8-1 List of Tables Table ES-1: Results and Conclusions of the MCB Hawaii REVA Five-Year Review ..................... 5
Table of Contents
Marine Corps Installations Command Range Environmental Vulnerability Assessment 5-Year Report Marine Corps Base Hawaii
iii
Table 2-1: Summary of Baseline Assessment at MCB Hawaii ................................................... 2-1 Table 2-2: Summary of SARAP Analysis from Baseline Assessment for MCB Hawaii .............. 2-2 Table 3-1: MCB Hawaii Training Complex .................................................................................. 3-6 Table 3-2: MCB Hawaii Operational Range Areas .................................................................... 3-10 Table 5-1: REVA Median MDLs for MC ....................................................................................... 5-2 Table 6-1: MC Loading Areas ....................................................................................................... 6-1 Table 6-2: Estimated MC Loading Rates for the HE/Inert Impact Drainage Area ....................... 6-7 Table 6-3: Estimated Annual Lead Deposition for the HE/Inert Impact Drainage Area .............. 6-7 Table 6-4: Screening-Level Estimates of Percent MC Mass Contributed by Individual MC Loading Areas into the HE/Inert Impact Drainage Area ............................................................. 6-11 Table 6-5: Screening-Level Estimates of Annual Average Edge-of-Loading-Area MC Concentrations in Surface Water Runoff within the HE/Inert Impact Drainage Area ................. 6-11 Table 6-6: Screening-Level Estimates of Annual Average MC Concentrations in Surface Water (including surface water and groundwater contributions) Entering the Kailua Bay from the HE/Inert Impact Drainage Area .................................................................................................. 6-12 Table 6-7: Estimated MC Concentrations Off Shore within the Kailua Bay after Entering the Intertidal/Littoral Zone of Kailua Bay from the HE/Inert Impact Drainage Area .......................... 6-13 Table 6-8: Screening-Level Estimates of Annual Average Edge-of-Loading-Area MC Concentrations in Sediment within the HE/Inert Impact Drainage Area ..................................... 6-14 Table 6-9: Screening-Level Estimates of Annual Average MC Concentrations in Sediment Entering the Kailua Bay from the HE/Inert Impact Drainage Area ............................................. 6-17 Table 6-10: Estimated Maximum MC Concentrations in Infiltrating Water at the MC Loading Areas within the HE/Inert Impact Drainage Area ........................................................................ 6-17 Table 6-11: Modeled MC Concentrations Reaching the Water Table at MC Loading Areas within the HE/Inert Impact Drainage Area ............................................................................................ 6-18 Table 6-12: Model-Estimated MC Concentrations Reaching the Shoreline of Kailua Bay within the HE/Inert Impact Drainage Area ............................................................................................ 6-19 Table 6-13: Estimated MC Loading Rates for the Range 8/Range 8A Drainage Area ............. 6-23 Table 6-14: Estimated Annual Lead Deposition for the Range 8/Range 8A Drainage Area .... 6-23 Table 6-15: Screening-Level Estimates of Annual Average Edge-of-Loading-Area MC Concentrations in Surface Water Runoff within the Range 8/Range 8A Drainage Area ........... 6-27 Table 6-16: Screening-Level Estimates of Annual Average MC Concentrations in Surface Water (including surface water and groundwater contributions) Entering the Kailua Bay from the Range 8/Range 8A Drainage Area ........................................................................................................ 6-27 Table 6-17: Estimated MC Concentrations Offshore within the Kailua Bay after Entering the Intertidal/Littoral Zone of Kailua Bay from the Range 8/Range 8A Drainage Area .................... 6-28 Table 6-18: Screening-Level Estimates of Annual Average Edge-of-Loading-Area MC Concentrations in Sediment within the Range 8/Range 8A Drainage Area ............................... 6-31 Table 6-19: Screening-Level Estimates of Annual Average MC Concentrations in Sediment Entering the Kailua Bay from the Range 8/Range 8A Drainage Area ........................................ 6-31 Table 6-20: Estimated Maximum MC Concentrations in Infiltrating Water at the MC Loading Areas within the Range 8/Range 8A Drainage Area .................................................................. 6-32 Table 6-21: Modeled MC Concentrations Reaching the Water Table at MC Loading Areas within the Range 8/Range 8A Drainage Area ....................................................................................... 6-33 Table 6-22: Model-Estimated MC Concentrations Reaching the Shoreline of Kailua Bay within the Range 8/Range 8A Drainage Area ....................................................................................... 6-34 Table 7-1: Summary of SARs Ranking ....................................................................................... 7-2 List of Figures Figure 1-1: MCB Hawaii Site Location ........................................................................................ 1-4 Figure 1-2: MCBH Kaneohe Bay Layout Map ............................................................................. 1-6 Figure 1-3: MCTAB Layout Map .................................................................................................. 1-8 Figure 1-4: Puuloa Range Training Facility Layout Map ........................................................... 1-10
Table of Contents
iv
Marine Corps Installations Command Range Environmental Vulnerability Assessment 5-Year Report Marine Corps Base Hawaii
Figure 3-1: Operational Ranges – MCB Hawaii .......................................................................... 3-7 Figure 3-2: Operational Ranges – Kaneohe Bay Range Training Facility ................................ 3-12 Figure 3-3: Operational Ranges – MCTAB ............................................................................... 3-18 Figure 3-4: Operational Ranges – Puuloa Range Training Facility ........................................... 3-23 Figure 3-5: MC Loading Areas at KBRTF ................................................................................. 3-28 Figure 3-6: MC Loading Areas at MCTAB ................................................................................. 3-30 Figure 4-1: Graphical Conceptual Site Model of MCBH Kaneohe Bay ....................................... 4-2 Figure 4-2: Watersheds and Streams MCBH Kaneohe Bay ..................................................... 4-16 Figure 4-3: Oahu Aquifer Sectors and Systems ........................................................................ 4-20 Figure 4-4: Graphical Conceptual Site Model at Puuloa Range Training Facility ..................... 4-31 Figure 4-5: Watersheds and Streams, Puuloa Range Training Facility .................................... 4-43 Figure 6-1: MC Loading Areas, Surface Water and Groundwater Features within HE/Inert Impact Drainage Area MCBH Kaneohe Bay ............................................................................................ 6-5 Figure 6-2: CORMIX Simulated Result Showing MC Concentration Reduction in Kailua Bay from an Assumed Discharge Point at the Shore of Kailua Bay MCBH Kaneohe Bay ........................ 6-15 Figure 6-3: MC Loading Areas, Surface Water and Groundwater Features within Range 8/Range 8A Impact Drainage Area MCBH Kaneohe Bay ......................................................................... 6-21 Figure 6-4: CORMIX Simulated Result Showing MC Concentration Reduction in Kailua Bay from an Assumed Discharge Point at the Shore of Kailua Bay MCBH Kaneohe Bay ....................... 6-29 Figure 7-1: Small Arms Ranges Kaneohe Bay Range Training Facility ...................................... 7-3 Figure 7-2: Small Arms Ranges Puuloa Range Training Facility ................................................ 7-5
Appendices
A. DoD Screening Values B. Screening-Level Analysis Parameters C. Small Arms Range Assessment Protocol Tables
Table of Contents
Marine Corps Installations Command Range Environmental Vulnerability Assessment 5-Year Report Marine Corps Base Hawaii
v
Acronym List Acronym Definition
°C Degrees Celsius
°F Degrees Fahrenheit
III MEF 3rd Marine Expeditionary Force
AATA Amphibious Assault Training Area
AAV Amphibious Assault Vehicle
amsl Above Mean Sea Level
bgs Below Ground Surface
BMP Best Management Practice
BTA Boondocker Training Area
BWS Board of Water Supply
cal Caliber
CEC Cation Exchange Capacity
CLZ Craft Landing Zone
CPRW-2 Commander, Patrol Reconnaissance Wing Two
CRRC Combat Rubber Raiding Craft
CSM Conceptual Site Model
DEA Drug Enforcement Agency
DoD Department of Defense
DoDI Department of Defense Instruction
DoDIC Department of Defense Identification Code
EOD Explosive Ordnance Disposal
ESQD Explosive Safety Quantity-Distance
FAA Federal Aviation Administration
FBI Federal Bureau of Investigation
FOB Forward Operating Base
GIS Geographic Information System
HE High Explosive
HMX Cyclotetramethylene Tetranitramine
IED Improvised Explosive Device
in/yr Inches per Year
IR Installation Restoration
Table of Contents
vi
Marine Corps Installations Command Range Environmental Vulnerability Assessment 5-Year Report Marine Corps Base Hawaii
Acronym Definition
KBRTF Kaneohe Bay Range Training Facility
KD Known Distance
kg/m2 Kilograms per Square Meter
kg/m2/d Kilograms per Square Meter per Day
lb Pounds
lb/yd2 Pounds per Square Yard
LAW Light Anti-Tank Weapon
LCAC Landing Craft, Air-Cushioned
LZ Landing Zone
m2 Square Meters
m3/m2/yr Cubic Meters per Square Meter per Year
m/sec Meters per Second
Marine Corps United States Marine Corps
MATCH Modular Armored Tactical Combat House
MC Munitions Constituents
MCB Marine Corps Base
MCBH Marine Corps Base Hawaii
MCICOM Marine Corps Installations Command
MCTAB Marine Corps Training Area Bellows
MdB Makalapa Clay
MDL Method Detection Limit
mg/kg Milligrams per Kilogram
mg/L Milligrams per Liter
MIDAS Munitions Items Disposition Action System
MMRP Military Munitions Response Program
MOUT Military Operations in Urban Terrain
NAVFAC Naval Facilities Engineering Command
NEW Net Explosive Weight
NRHP National Register of Historic Places
ORC Operational Range Clearance
ppt Parts per Thousand
PRTF Puuloa Range Training Facility
Table of Contents
Marine Corps Installations Command Range Environmental Vulnerability Assessment 5-Year Report Marine Corps Base Hawaii
vii
Acronym Definition
RDX Cyclotrimethylene Trinitramine
REVA Range Environmental Vulnerability Assessment
RFMSS Range Facility Management Scheduling System
rRk Rockland
RSOP Reconnaissance, Selection, Occupation of Position
RUSLE Revised Universal Soil Loss Equation
SACON Shock Absorbing Concrete
SAR Small Arms Range
SARAP Small Arms Range Assessment Protocol
SDZ Surface Danger Zone
SESAMS Special Effects Small Arms Marking System
SMAW Shoulder-Launched Multipurpose Assault Weapon
SOP Standard Operating Procedure
TA Training Area
TCLP Toxic Characteristic Leaching Procedures
TDS Total Dissolved Solids
TECOM Training and Education Command
TMDL Total Maximum Daily Load
TNT Trinitrotoluene
TOC Total Organic Carbon
TP Target Practice
g/kg Micrograms per Kilogram
g/L Micrograms per Liter
UIC Underground Injection Control
U.S. United States
UXO Unexploded Ordnance
WMA Wildlife Management Area
WWII World War II
yr Year

Marine Corps Installations Command Range Environmental Vulnerability Assessment 5-Year ReportMarine Corps Base Hawaii
ES-1
Executive Summary
The United States Marine Corps (Marine Corps) Range Environmental Vulnerability Assessment (REVA) program meets the requirements of the Department of Defense (DoD) Directive 4715.11 Environmental and Explosives Safety Management on Operational Ranges within the United States and DoD Instruction 4715.14 Operational Range Assessments.
The purpose of the REVA program is to identify whether there is a release or substantial threat of a release of munitions constituents (MC) from the operational range or range complex areas to off-range areas. This is accomplished through a baseline assessment of operational range areas and periodic five-year review assessments, and, where applicable, the use of fate and transport modeling. Fate and transport modeling provides a conservative examination of MC and how they may migrate through the environment to potential receptors. Results of the model-predicted MC concentrations are compared to an established set of REVA median method detection limits (MDLs). These median MDLs limits serve as a benchmark to compare the model results and determine whether additional actions are warranted. Modeling results that exceed a median MDL may warrant further investigation to determine if a release or threat of a release may be present. The MC evaluated in the REVA program include trinitrotoluene (TNT), cyclotetramethylene tetranitramine (HMX), cyclotrimethylene trinitramine (RDX), perchlorate, and lead.
This report presents the first periodic five-year review assessment results for the operational ranges at the Marine Corps Base (MCB) Hawaii located on the island of Oahu, Hawaii. This report documents the period of munitions loading from 2008 through 2013, whereas the baseline assessment examined and documented munitions use through 2007.
MCB Hawaii consists of several discrete noncontiguous properties spread across a total of 4,670 acres on the islands of Oahu and Molokai. Its mission is to support the readiness and global projection of ground combat forces and aviation units of the Marine Corps (MCBH, 2006). The operational ranges at MCB Hawaii are located at three facilities: MCB Hawaii (MCBH) Kaneohe Bay, Marine Corps Training Area Bellows (MCTAB), and Puuloa Range Training Facility (PRTF).
MC loading rates were estimated for MC loading areas and small arms ranges (SARs) to estimate the amount of MC deposited annually in these areas. Two drainage areas containing the MC loading areas were identified for screening-level analysis (surface
Executive Summary
ES-2
Marine Corps Installations Command Range Environmental Vulnerability Assessment 5-Year Report Marine Corps Base Hawaii
water, sediment, and groundwater); these drainage areas contain the High Explosive (HE)/Inert Impact and the Range 8/Range 8A MC loading areas. A conceptual site model was developed to qualitatively assess the potential for MC transport from the MC loading areas to assess potential impact to off-range human and ecological receptors. A separate conceptual site model for lead transport at SARs on the PRTF also was updated with more recent data.
Conceptual Site Model for MCB Hawaii Kaneohe Bay - Kaneohe Bay Range Training Facility
Ulupau Crater is located in the northeast corner of MCB Kaneohe Bay on the Mokapu peninsula. The KBRTF is located within the crater itself with the eastern wall of the crater having eroded into the Pacific Ocean exposing the Pacific Ocean to direct line-of-sight (LOS) of any of the ranges therein. KBRTF is screened by the crater walls on the north, west, and south sides of the range complex. Additional description of the unique topography is located in the Conceptual Site Model in Section 4. Marine deposits and emerged reefs also are found in and around the crater and are remnants of when the ocean level was higher than it is today (Luecker et al., 1984; NAVFACHI, 2006; USACE, 2006; SRGII, 2004; ESI, 2006).
The screening-level assessments of MC fate and transport in surface water and sediment were conducted for three MC loading areas located within two drainage areas on KBRTF (HE/Inert Impact and Range 8/Range 8A). Annual average MC concentrations in surface water runoff and sediment at the edge of each MC loading area were estimated. MC concentrations in surface water and sediment entering the identified downstream receptor location (Kailua Bay) also were estimated. A mixing zone model then was applied to estimate MC concentrations distributed within Kailua Bay. Results of the screening-level assessments are presented in Table ES-1.
Based on the screening-level assessment results, MC are estimated to migrate off the MC loading areas and enter Kailua Bay at concentrations above median MDLs. However, these predicted concentrations are below the DoD screening values when they enter the bay. Additionally, upon entering the bay, the concentrations will reduce to below detectable levels within 98 feet of the shoreline. Based on these findings, it was determined that MC are not migrating off the operational range area at concentrations that would impact human health and the environment. Therefore, no further assessment is required at this time.
SAR Assessments
The primary REVA MC of concern at SARs is lead because it is the most prevalent (by weight) potentially hazardous constituent associated with small arms ammunition. SARs are qualitatively assessed under the REVA program to identify factors that influence the
Executive Summary
Marine Corps Installations Command Range Environmental Vulnerability Assessment 5-Year Report Marine Corps Base Hawaii
ES-3
potential for lead migration. Lead loading associated with the bermed, live-fire SARs at MCB Hawaii—Range 1, Range 2, Range 6, Range 8B, Range 9 and Range 10 at KBRTF and Alpha Range through Foxtrot Range at PRTF—were qualitatively assessed through the Small Arms Range Assessment Protocol.
The analysis of these 12 SARs at the installation provided the following results:
Ranges 8B and 10 were not evaluated due to minimal usage during the five-year review period.
Ranges 1 and 9 have a Moderate surface water evaluation ranking and a Minimal groundwater evaluation ranking.
Ranges 2 and 6 have Minimal surface water and groundwater evaluation rankings.
Alpha through Echo Ranges have Moderate surface water evaluation rankings and Minimal groundwater evaluation rankings.
Foxtrot Range has a High surface water evaluation ranking and Minimal groundwater evaluation ranking.
Results and Conclusions of the REVA Five-Year Review
A summary of the results and conclusions for the watersheds and MC loading areas assessed at MCB Hawaii in the REVA five-year review is presented in Table ES-1.
Executive Summary
ES-4
Marine Corps Installations Command Range Environmental Vulnerability Assessment 5-Year Report Marine Corps Base Hawaii
This page intentionally blank
Executive Summary
Marine Corps Installations Command Range Environmental Vulnerability Assessment 5-Year Report Marine Corps Base Quantico
ES-5
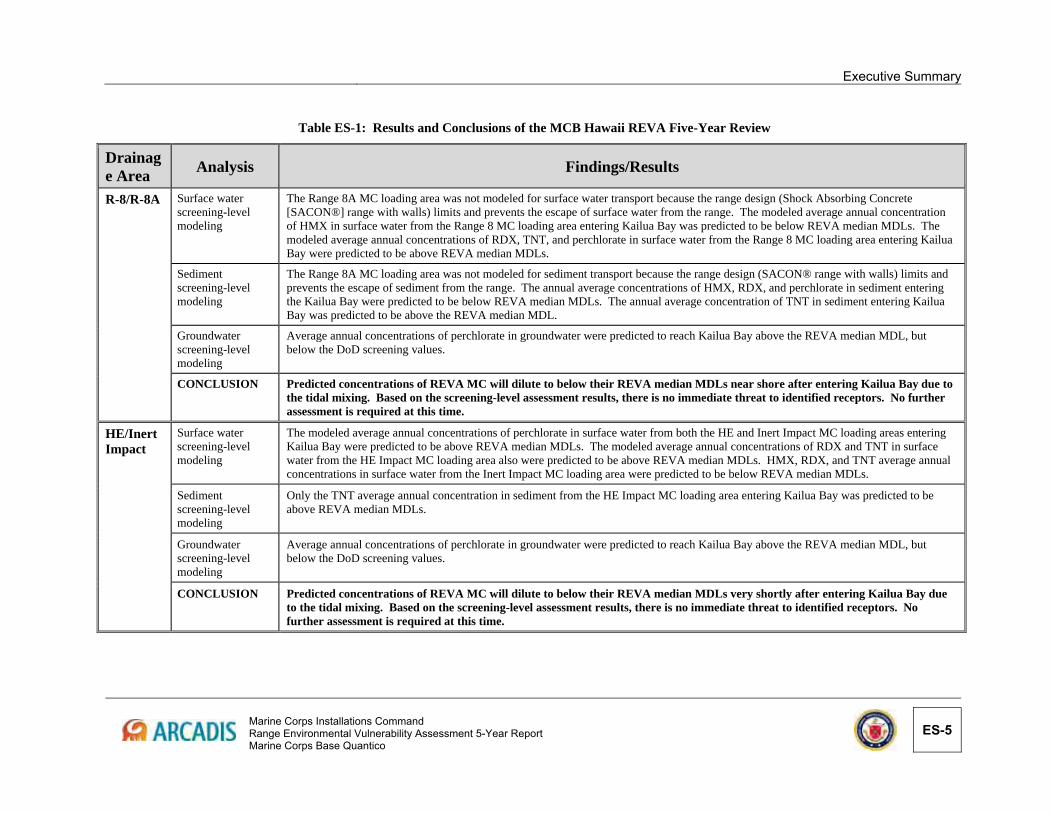
Table ES-1: Results and Conclusions of the MCB Hawaii REVA Five-Year Review
Drainage Area
Analysis Findings/Results
R-8/R-8A Surface water screening-level modeling
The Range 8A MC loading area was not modeled for surface water transport because the range design (Shock Absorbing Concrete [SACON®] range with walls) limits and prevents the escape of surface water from the range. The modeled average annual concentration of HMX in surface water from the Range 8 MC loading area entering Kailua Bay was predicted to be below REVA median MDLs. The modeled average annual concentrations of RDX, TNT, and perchlorate in surface water from the Range 8 MC loading area entering Kailua Bay were predicted to be above REVA median MDLs.
Sediment screening-level modeling
The Range 8A MC loading area was not modeled for sediment transport because the range design (SACON® range with walls) limits and prevents the escape of sediment from the range. The annual average concentrations of HMX, RDX, and perchlorate in sediment entering the Kailua Bay were predicted to be below REVA median MDLs. The annual average concentration of TNT in sediment entering Kailua Bay was predicted to be above the REVA median MDL.
Groundwater screening-level modeling
Average annual concentrations of perchlorate in groundwater were predicted to reach Kailua Bay above the REVA median MDL, but below the DoD screening values.
CONCLUSION Predicted concentrations of REVA MC will dilute to below their REVA median MDLs near shore after entering Kailua Bay due to the tidal mixing. Based on the screening-level assessment results, there is no immediate threat to identified receptors. No further assessment is required at this time.
HE/Inert Impact
Surface water screening-level modeling
The modeled average annual concentrations of perchlorate in surface water from both the HE and Inert Impact MC loading areas entering Kailua Bay were predicted to be above REVA median MDLs. The modeled average annual concentrations of RDX and TNT in surface water from the HE Impact MC loading area also were predicted to be above REVA median MDLs. HMX, RDX, and TNT average annual concentrations in surface water from the Inert Impact MC loading area were predicted to be below REVA median MDLs.
Sediment screening-level modeling
Only the TNT average annual concentration in sediment from the HE Impact MC loading area entering Kailua Bay was predicted to be above REVA median MDLs.
Groundwater screening-level modeling
Average annual concentrations of perchlorate in groundwater were predicted to reach Kailua Bay above the REVA median MDL, but below the DoD screening values.
CONCLUSION Predicted concentrations of REVA MC will dilute to below their REVA median MDLs very shortly after entering Kailua Bay due to the tidal mixing. Based on the screening-level assessment results, there is no immediate threat to identified receptors. No further assessment is required at this time.

Marine Corps Installations Command Range Environmental Vulnerability Assessment 5-Year Report Marine Corps Base Hawaii
1-1
1. Introduction
1.1. Purpose
The United States (U.S.) Marine Corps (Marine Corps) Range Environmental Vulnerability Assessment (REVA) program meets the requirements of the Department of Defense (DoD) Directive 4715.11 Environmental and Explosives Safety Management on Operational Ranges within the United States and DoD Instruction (DoDI) 4715.14 Operational Range Assessments. The REVA program is a proactive and comprehensive program designed to support the Marine Corps’ Range Sustainment Program. Operational ranges across the Marine Corps are being assessed to identify areas and activities that are subject to possible impacts from external influences, as well as to determine whether a release or substantial threat of a release of munitions constituents (MC) from operational ranges to off-range areas creates an unacceptable risk to human health and/or the environment. This is accomplished through assessments of operational range areas and periodic five-year review assessments and, where applicable, the use of fate and transport modeling and analysis of the REVA indicator MC based upon site-specific environmental conditions at the operational ranges and training areas.
This report presents the first periodic five-year review assessment results for the operational ranges at the Marine Corps Base (MCB) Hawaii, located on the island of Oahu, Hawaii. This report documents the period of munitions loading from 2008 through 2013, whereas the baseline assessment, completed in October 2009, documented munitions use at MCB Hawaii through 2007.
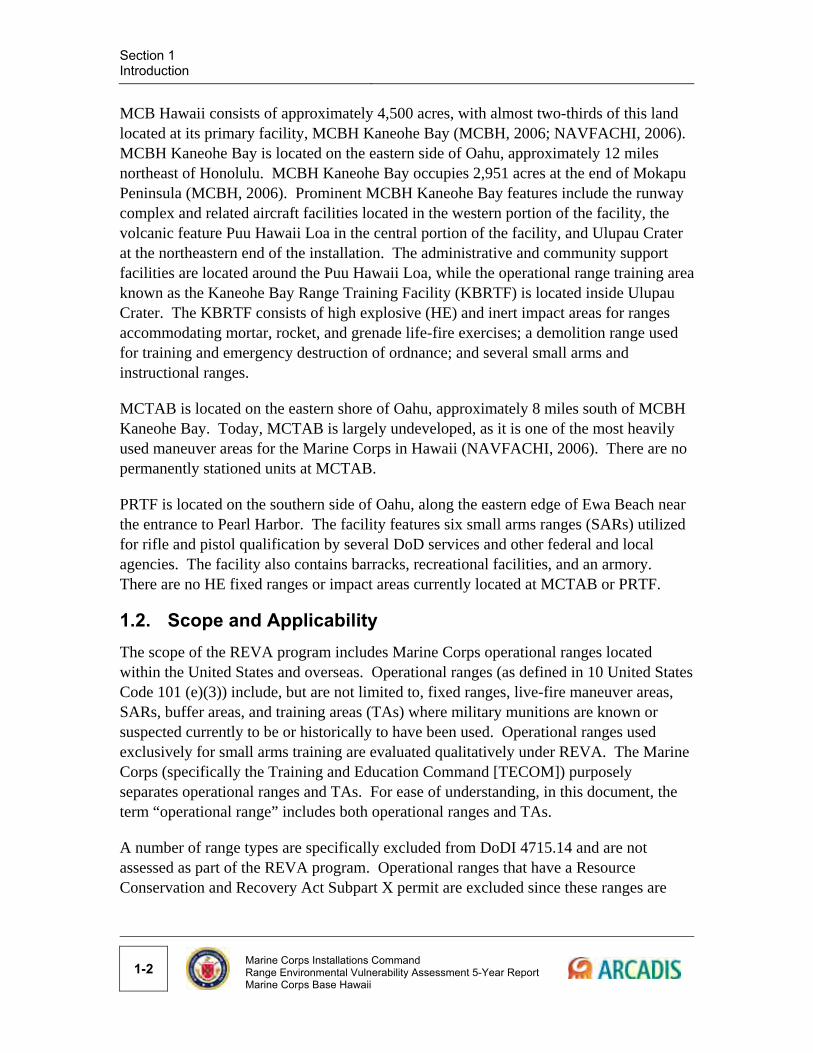
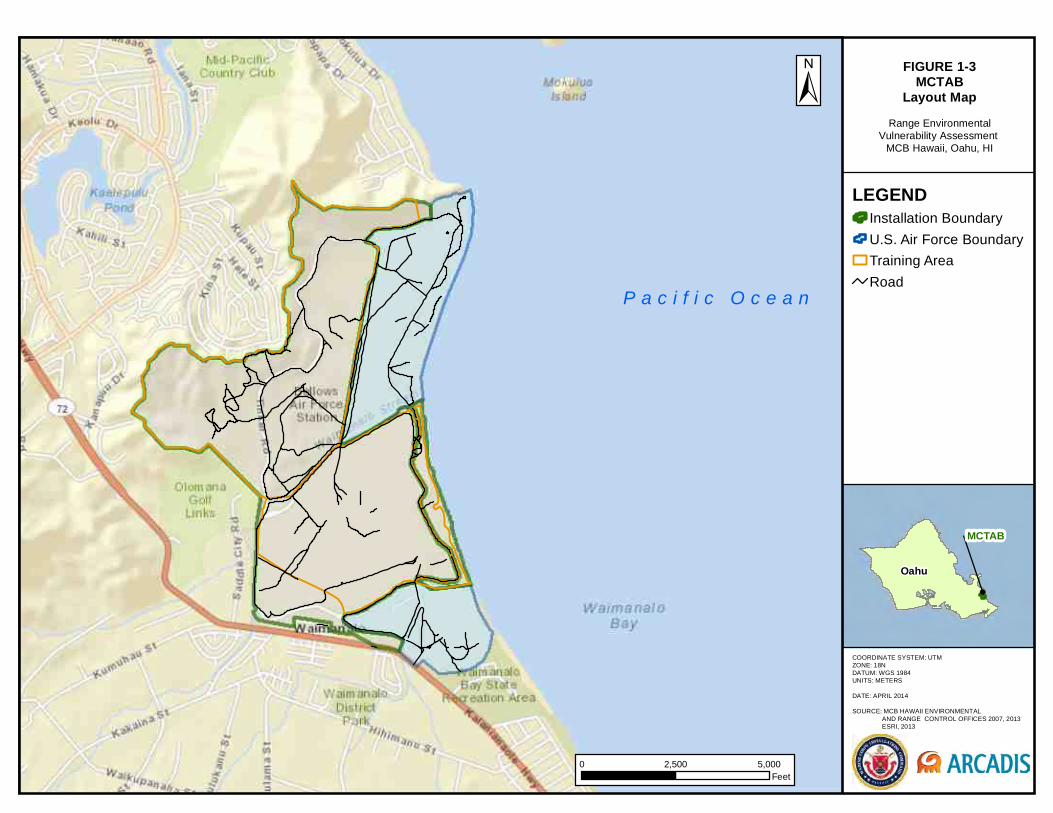
MCB Hawaii consists of several discrete noncontiguous properties located on the islands of Oahu and Molokai. Operational ranges are located at three of these facilities: MCB Hawaii (MCBH) Kaneohe Bay, Marine Corps Training Area Bellows (MCTAB), and Puuloa Range Training Facility (PRTF), all located on Oahu. Its mission is to support the readiness and global projection of ground combat forces and aviation units of the Marine Corps (MCBH, 2006). The primary range users are the current tenants of the installation, which include the 3rd Marine Expeditionary Force (Hawaii) (III MEF); the Navy’s Commander, Patrol Reconnaissance Wing Two (CPRW-2); and the 3rd Radio Battalion (Drigot and SRGII, 2006; NAVFACHI, 2006). The location of MCB Hawaii is shown in Figure 1-1, and the layouts of the three facilities with operational ranges are shown in Figure 1-2 through Figure 1-4.
Section 1 Introduction
1-2
Marine Corps Installations Command Range Environmental Vulnerability Assessment 5-Year Report Marine Corps Base Hawaii
MCB Hawaii consists of approximately 4,500 acres, with almost two-thirds of this land located at its primary facility, MCBH Kaneohe Bay (MCBH, 2006; NAVFACHI, 2006). MCBH Kaneohe Bay is located on the eastern side of Oahu, approximately 12 miles northeast of Honolulu. MCBH Kaneohe Bay occupies 2,951 acres at the end of Mokapu Peninsula (MCBH, 2006). Prominent MCBH Kaneohe Bay features include the runway complex and related aircraft facilities located in the western portion of the facility, the volcanic feature Puu Hawaii Loa in the central portion of the facility, and Ulupau Crater at the northeastern end of the installation. The administrative and community support facilities are located around the Puu Hawaii Loa, while the operational range training area known as the Kaneohe Bay Range Training Facility (KBRTF) is located inside Ulupau Crater. The KBRTF consists of high explosive (HE) and inert impact areas for ranges accommodating mortar, rocket, and grenade life-fire exercises; a demolition range used for training and emergency destruction of ordnance; and several small arms and instructional ranges.
MCTAB is located on the eastern shore of Oahu, approximately 8 miles south of MCBH Kaneohe Bay. Today, MCTAB is largely undeveloped, as it is one of the most heavily used maneuver areas for the Marine Corps in Hawaii (NAVFACHI, 2006). There are no permanently stationed units at MCTAB.
PRTF is located on the southern side of Oahu, along the eastern edge of Ewa Beach near the entrance to Pearl Harbor. The facility features six small arms ranges (SARs) utilized for rifle and pistol qualification by several DoD services and other federal and local agencies. The facility also contains barracks, recreational facilities, and an armory. There are no HE fixed ranges or impact areas currently located at MCTAB or PRTF.
1.2. Scope and Applicability The scope of the REVA program includes Marine Corps operational ranges located within the United States and overseas. Operational ranges (as defined in 10 United States Code 101 (e)(3)) include, but are not limited to, fixed ranges, live-fire maneuver areas, SARs, buffer areas, and training areas (TAs) where military munitions are known or suspected currently to be or historically to have been used. Operational ranges used exclusively for small arms training are evaluated qualitatively under REVA. The Marine Corps (specifically the Training and Education Command [TECOM]) purposely separates operational ranges and TAs. For ease of understanding, in this document, the term “operational range” includes both operational ranges and TAs.
A number of range types are specifically excluded from DoDI 4715.14 and are not assessed as part of the REVA program. Operational ranges that have a Resource Conservation and Recovery Act Subpart X permit are excluded since these ranges are
Section 1
Introduction
Marine Corps Installations Command Range Environmental Vulnerability Assessment 5-Year Report Marine Corps Base Hawaii
1-3
monitored under a specific regulatory program. Military Munitions Response Program (MMRP) sites are excluded, as they are

P a c i f i c O c e a n
Puuloa RangeTraining Facility
MCBH Kaneohe Bay
MCTAB
COORDINATE SYSTEM: UTM ZONE: 18NDATUM: WGS 1984UNITS: METERS
DATE: APRIL 2014
SOURCE: MCB HAWAII ENVIRONMENTAL AND RANGE CONTROL OFFICES 2013 ESRI, 2013
FIGURE 1-1MCB Hawaii Site Location
Range EnvironmentalVulnerability Assessment
MCB Hawaii, Oahu, HI
LEGENDInstallation Boundary
0 4 8 122Miles
Oahu
Hawaii
Oahu
Section 1
Introduction
Marine Corps Installations Command Range Environmental Vulnerability Assessment 5-Year Report Marine Corps Base Hawaii
1-5
This page intentionally blank

Kaneohe Bay
Kailua Bay
Former Runway
Ulupau Crater
Puu Hawaii Loa
COORDINATE SYSTEM: UTM ZONE: 18NDATUM: WGS 1984UNITS: METERS
DATE: APRIL 2014
SOURCE: MCB HAWAII ENVIRONMENTAL AND RANGE CONTROL OFFICES 2013 ESRI, 2013
FIGURE 1-2MCBH Kaneohe Bay
Layout MapRange Environmental
Vulnerability Assessment MCB Hawaii, Oahu, HI
LEGENDInstallation Boundary
KBRTF Boundary
Main Runway
MCBH Kaneohe Bay
±
0 5,0002,500Feet
Notes:1. KBRTF - Kaneohe Bay Range Training Facility.
Oahu
P a c i f i c O c e a n

Section 1
Introduction
Marine Corps Installations Command Range Environmental Vulnerability Assessment 5-Year Report Marine Corps Base Hawaii
1-7
This page intentionally blank
COORDINATE SYSTEM: UTM ZONE: 18NDATUM: WGS 1984UNITS: METERS
DATE: APRIL 2014
SOURCE: MCB HAWAII ENVIRONMENTAL AND RANGE CONTROL OFFICES 2007, 2013 ESRI, 2013
FIGURE 1-3MCTAB
Layout MapRange Environmental
Vulnerability Assessment MCB Hawaii, Oahu, HI
LEGENDInstallation Boundary
U.S. Air Force Boundary
Training Area
Road
MCTAB
±
0 5,0002,500Feet
Oahu
P a c i f i c O c e a n

Section 1
Introduction
Marine Corps Installations Command Range Environmental Vulnerability Assessment 5-Year Report Marine Corps Base Hawaii
1-9
This page intentionally blank
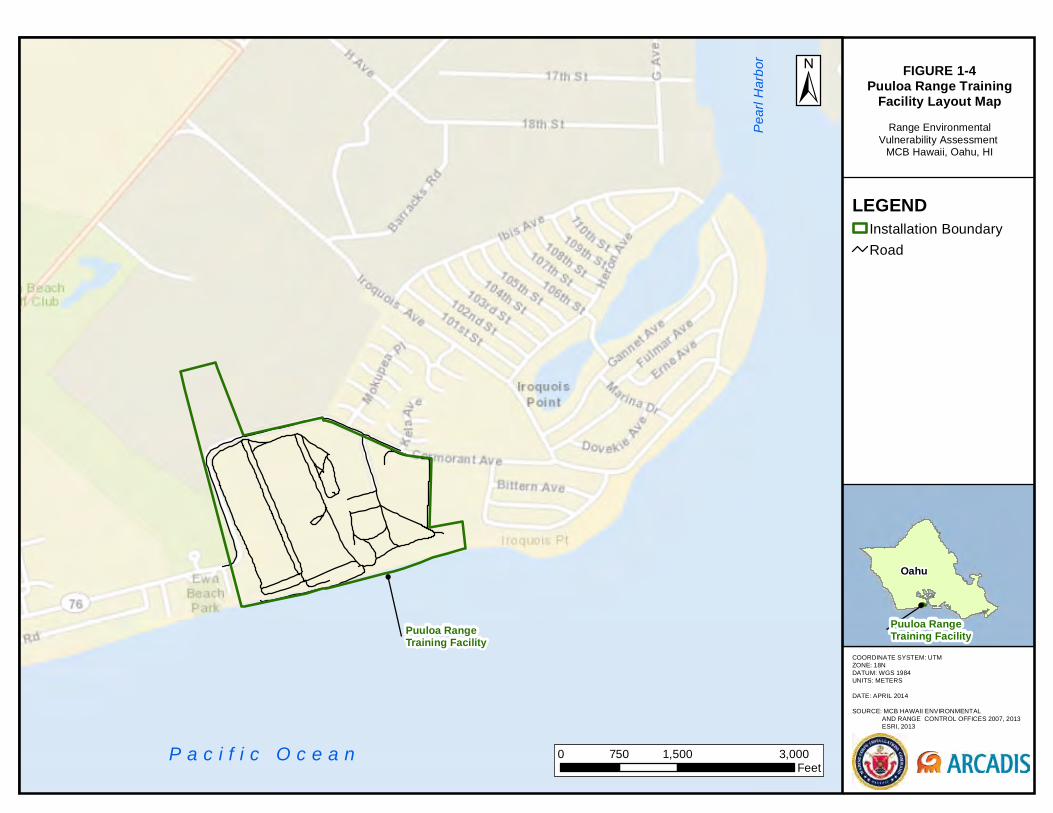
COORDINATE SYSTEM: UTM ZONE: 18NDATUM: WGS 1984UNITS: METERS
DATE: APRIL 2014
SOURCE: MCB HAWAII ENVIRONMENTAL AND RANGE CONTROL OFFICES 2007, 2013 ESRI, 2013
FIGURE 1-4Puuloa Range Training
Facility Layout MapRange Environmental
Vulnerability Assessment MCB Hawaii, Oahu, HI
LEGENDInstallation Boundary
Road
Puuloa RangeTraining Facility
Oahu
P a c i f i c O c e a nPe
arl H
arbor
Puuloa RangeTraining Facility
0 1,500 3,000750Feet

Section 1
Introduction
Marine Corps Installations Command Range Environmental Vulnerability Assessment 5-Year Report Marine Corps Base Hawaii
1-11
This page intentionally blank
Section 1 Introduction
1-12
Marine Corps Installations Command Range Environmental Vulnerability Assessment 5-Year Report Marine Corps Base Hawaii
non-operational ranges; therefore, they no longer are used for their intended purpose. Additionally, the management and funding of MMRP sites are conducted under a separate DoD program. Any ranges located wholly indoors also are not included, as any MC associated with these ranges are assumed to be contained and not available to the environment.
Site-specific environmental conditions and MC loading rates are used in fate and transport models to assess whether the potential exists for a release or substantial threat of a release of MC from an operational range or range complex area to an off-range area. Modeling is conducted for MC loading areas, which are delineated based on the area in which the majority of MC is deposited within an operational range. Fate and transport modeling in REVA uses screening-level transport analyses that conservatively estimate the concentrations of MC potentially migrating to off-range exposure points. Receptor groups considered in the REVA process include human as well as ecological receptors (defined in the REVA analysis as any threatened or endangered species or species of concern). Human exposure pathways considered include consumption of surface water and groundwater for off-range human receptors, as described in the REVA Five-year Review Manual (HQMC, 2010). Exposure pathways for off-range ecological receptors include direct consumption of surface water and direct exposure to surface water and sediment. Other off-range exposure scenarios (e.g., soil ingestion, incidental dermal contact, bioaccumulation, food chain exposure) currently are not considered in the REVA process unless site-specific considerations warrant an evaluation. Environmental sampling and analysis (i.e., field data collection) are conducted if the results of the screening-level fate and transport modeling suggest an off-range release of MC where receptors may be present. Field data collection activities are conducted to determine whether an off-range release has occurred and whether such a release constitutes an unacceptable risk to human health or the environment.
The MC evaluated in the REVA program include trinitrotoluene (TNT), cyclotetramethylene tetranitramine (HMX), cyclotrimethylene trinitramine (RDX), perchlorate, and lead. TNT, HMX, and RDX are considered indicator MC. Studies have shown that they are detected in a high percentage of samples containing MC because they are common in HEs used in a wide variety of military munitions and because of their chemical stability within the environment. Perchlorate is a component of the solid propellants used in some military munitions. Perchlorate also is considered an indicator MC because its high solubility, low sorption potential, and low natural degradation rate make the compound highly mobile in the environment. Additional information pertaining to the physical and chemical characteristics of the REVA indicator compounds is provided in the REVA Reference Manual (HQMC, 2009).
The primary MC at SARs is lead because it is the most prevalent (by weight) potentially hazardous constituent associated with small arms ammunition. Lead is geochemically
Section 1
Introduction
Marine Corps Installations Command Range Environmental Vulnerability Assessment 5-Year Report Marine Corps Base Hawaii
1-13
specific regarding its mobility in the environment; thus, fate and transport modeling of lead requires site-specific geochemical data that usually are unavailable during a REVA assessment. Therefore, instead of modeling lead transport, operational SARs at the installation are qualitatively reviewed and assessed to identify factors that influence the potential for lead migration. These factors include a range’s design and layout, the physical and environmental conditions of the area, current and past operation and maintenance practices, and the amount of lead that has been loaded to the operational range.
Lead loading associated with small arms and munitions components at HE ranges was estimated as part of the five-year review process. Lead is present primarily in expenditures at the point of impact as an inert compound and, consequently, does not undergo low order or high order detonations. As such, lead loading was estimated based on the total amount of lead content in the munition DoD Identification Code (DoDIC) multiplied by the total number of items of each DoDIC fired into the range or MC loading area. The total lead loaded at the site aids in determining if additional actions, such as sampling, are necessary.
The process and assumptions used in estimating the amount of MC deposited onto operational ranges, defined in REVA as MC loading, are discussed in Section 3. The screening-level fate and transport modeling and analysis methods and assumptions for surface water and groundwater are discussed in Section 5.
This report presents the analysis of the data collected during site visits and the results of screening-level fate and transport modeling for MC loading areas. Additional details of the REVA assessment methods are outlined in the REVA Reference Manual, which includes a detailed description of the fate and transport models selected for the REVA assessments, the data needed to run those models, and recommended sources for data. In addition, the REVA Reference Manual provides a detailed description of the REVA MC Loading Rate Calculator tool used to estimate MC deposition on operational ranges (HQMC, 2009).
This five-year review REVA report presents the conditions of the operational ranges at the time the assessment was conducted. The assessment was performed using available data and personnel interviews and is supplemented with information from external sources, including reports and documentation.
1.3. Data Collection Effort A thorough review of data collected during the baseline assessment was conducted prior to collecting data from the installation. Data required for the operational range assessments were obtained from the installation during a site visit by the REVA assessment team, from Marine Corps Installations Command (MCICOM), and from
Section 1 Introduction
1-14
Marine Corps Installations Command Range Environmental Vulnerability Assessment 5-Year Report Marine Corps Base Hawaii
external data sources. Data collected include various documents and reports prepared for the installation (e.g., expenditure data, range operating procedures, natural and cultural resource surveys), weather records, and geographic information systems (GIS) files.
The REVA assessment team conducted a site visit to MCB Hawaii from 25 to 29 February 2013. MCICOM personnel accompanied the team during the site visit. The installation site visit involved a review of various data repositories and interviews with installation personnel from the following offices:
Range Management / Range Control
Environmental Compliance and Protection Department
Explosive Ordnance Disposal (EOD)
Facilities Management Division
Engineering
GIS
Public Affairs Office and the Community Planning Liaison Office
Subject matter experts within each of these offices were interviewed to identify areas of interest and specific concerns pertaining to each office. Specific issues relating to operational range use and potential impacts to training were the focus of these discussions.
During the five-year review installation visit, site visits were performed at all of the operational ranges. The REVA assessment team surveyed the physical condition of each range, noting firing points, impact areas, engineered controls, and other environmental factors (e.g., areas of erosion, potential migration routes, drainage features).
1.4. Report Organization This REVA five-year review environmental range assessment report for MCB Hawaii is organized into the following sections:
Section 1 – Introduction
Section 2 – Baseline Results and Installation Changes
Section 3 – Munitions Constituents Loading Rate and Assumptions
Section 4 – Conceptual Site Model (CSM)
Section 5 – Modeling Assumptions and Parameters
Section 6 – Screening-Level Assessment Results
Section 7 – Small Arms Range Assessments
Section 8 – References
Marine Corps Installations Command Range Environmental Vulnerability Assessment 5-Year Report Marine Corps Base Hawaii
2-1
2. Baseline Results and Installation Changes
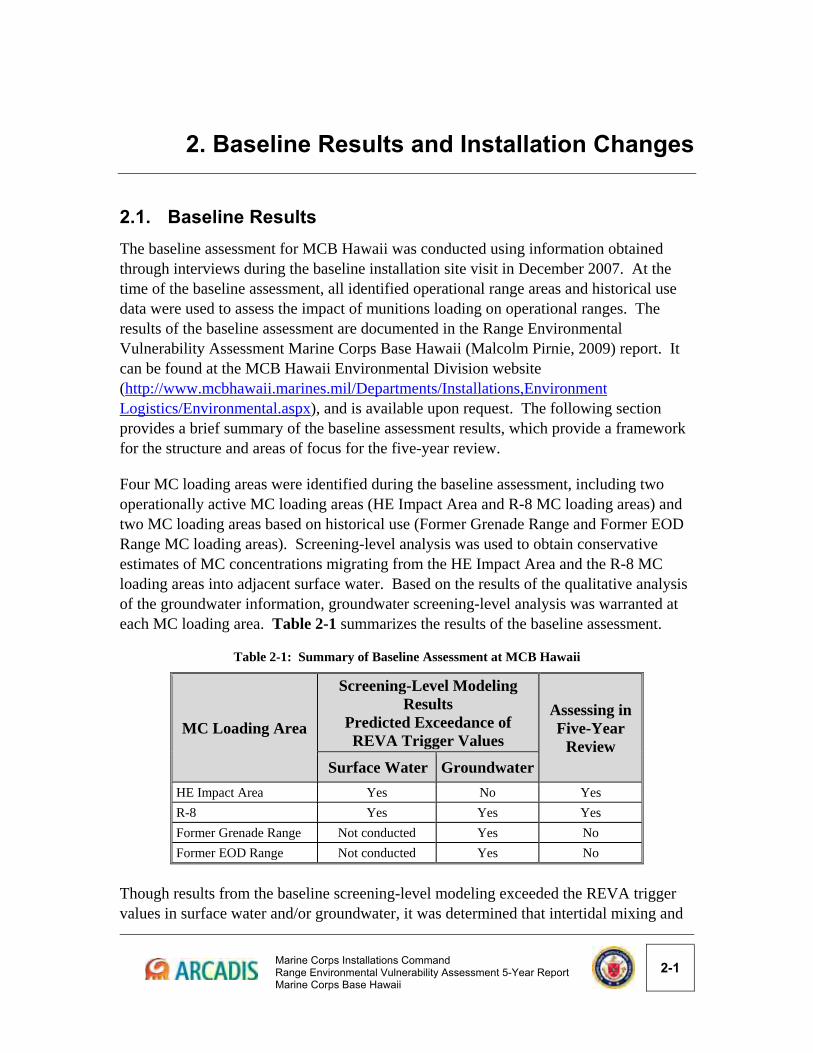
2.1. Baseline Results The baseline assessment for MCB Hawaii was conducted using information obtained through interviews during the baseline installation site visit in December 2007. At the time of the baseline assessment, all identified operational range areas and historical use data were used to assess the impact of munitions loading on operational ranges. The results of the baseline assessment are documented in the Range Environmental Vulnerability Assessment Marine Corps Base Hawaii (Malcolm Pirnie, 2009) report. It can be found at the MCB Hawaii Environmental Division website (http://www.mcbhawaii.marines.mil/Departments/Installations,Environment Logistics/Environmental.aspx), and is available upon request. The following section provides a brief summary of the baseline assessment results, which provide a framework for the structure and areas of focus for the five-year review.
Four MC loading areas were identified during the baseline assessment, including two operationally active MC loading areas (HE Impact Area and R-8 MC loading areas) and two MC loading areas based on historical use (Former Grenade Range and Former EOD Range MC loading areas). Screening-level analysis was used to obtain conservative estimates of MC concentrations migrating from the HE Impact Area and the R-8 MC loading areas into adjacent surface water. Based on the results of the qualitative analysis of the groundwater information, groundwater screening-level analysis was warranted at each MC loading area. Table 2-1 summarizes the results of the baseline assessment.
Table 2-1: Summary of Baseline Assessment at MCB Hawaii
MC Loading Area
Screening-Level Modeling Results
Predicted Exceedance of REVA Trigger Values
Assessing in Five-Year
Review Surface Water Groundwater
HE Impact Area Yes No Yes
R-8 Yes Yes Yes
Former Grenade Range Not conducted Yes No
Former EOD Range Not conducted Yes No
Though results from the baseline screening-level modeling exceeded the REVA trigger values in surface water and/or groundwater, it was determined that intertidal mixing and
Section 2 Baseline Results and Installation Changes
2-2
Marine Corps Installations Command Range Environmental Vulnerability Assessment 5-Year Report Marine Corps Base Hawaii
dispersion would reduce the MC levels below REVA trigger values rapidly offshore. Although ecological receptors might be present within the nearshore environment, the estimated concentrations of MC would be well below the draft DoD Range and Munitions Use Subcommittee screening values developed for ecological receptors in marine waters. Therefore, no further assessment or sampling activities was required.
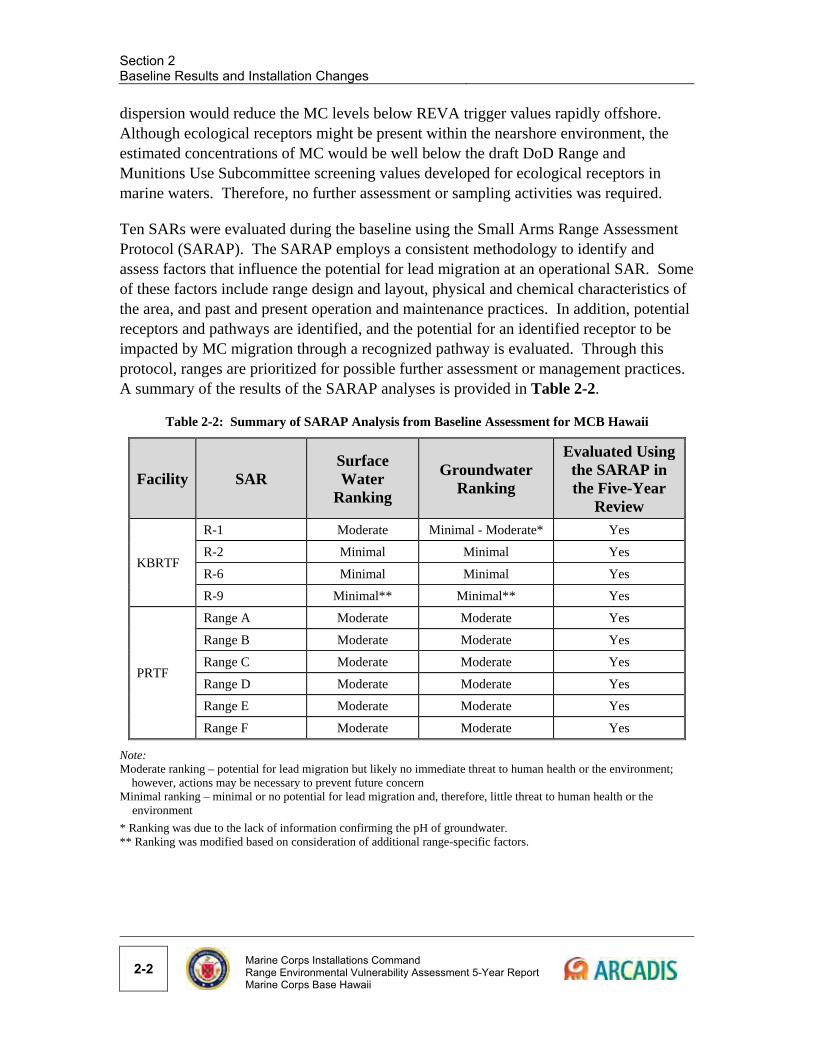
Ten SARs were evaluated during the baseline using the Small Arms Range Assessment Protocol (SARAP). The SARAP employs a consistent methodology to identify and assess factors that influence the potential for lead migration at an operational SAR. Some of these factors include range design and layout, physical and chemical characteristics of the area, and past and present operation and maintenance practices. In addition, potential receptors and pathways are identified, and the potential for an identified receptor to be impacted by MC migration through a recognized pathway is evaluated. Through this protocol, ranges are prioritized for possible further assessment or management practices. A summary of the results of the SARAP analyses is provided in Table 2-2.
Table 2-2: Summary of SARAP Analysis from Baseline Assessment for MCB Hawaii
Facility SAR Surface Water
Ranking
Groundwater Ranking
Evaluated Using the SARAP in the Five-Year
Review
KBRTF
R-1 Moderate Minimal - Moderate* Yes
R-2 Minimal Minimal Yes
R-6 Minimal Minimal Yes
R-9 Minimal** Minimal** Yes
PRTF
Range A Moderate Moderate Yes
Range B Moderate Moderate Yes
Range C Moderate Moderate Yes
Range D Moderate Moderate Yes
Range E Moderate Moderate Yes
Range F Moderate Moderate Yes
Note: Moderate ranking – potential for lead migration but likely no immediate threat to human health or the environment;
however, actions may be necessary to prevent future concern Minimal ranking – minimal or no potential for lead migration and, therefore, little threat to human health or the
environment
* Ranking was due to the lack of information confirming the pH of groundwater. ** Ranking was modified based on consideration of additional range-specific factors.
Section 2
Baseline Results and Installation Changes
Marine Corps Installations Command Range Environmental Vulnerability Assessment 5-Year Report Marine Corps Base Hawaii
2-3
2.2. Installation Changes Changes at MCB Hawaii Kaneohe Bay 2.2.1.
Since the baseline assessment, two new ranges, R-3 and R-8B, were constructed at the KBRTF and a military operations in urban terrain (MOUT) facility was constructed in the Boondocker Training Area (BTA) in the eastern portion of the facility.
During the REVA baseline assessment, R-9 was used as a multipurpose range, to include both small arms training (firing into the on-range containment berm) and mortar firing (into the impact area). Since that time, these activities have been separated into different range designations: R-9 for small arms training and R-9A for mortar firing.
R-1 previously operated as a known distance (KD) rifle range for annual qualification training of Marines. The qualification activities were transferred to PRTF in 2010. The range continues to be used for rifle training, but firing is directed into multiple locations rather than the original backstop area. These changes are detailed further in Section 7.
Additionally, operational range clearances (ORCs) were conducted at several ranges within the KBRTF, which are discussed in Section 3.4.5.
Previous environmental studies had identified areas around R-6 and the main range access road as erosional “hot spots” (SRGII, 2004). Erosion controls were installed adjacent to these features to alleviate the risk of erosion and subsequent sedimentation of the adjacent bay. A concrete storm water diversion channel was constructed to the south of R-6 on the other side of the earthen side berm. Rock and riprap also were placed north of the other lateral earthen berm for control of runoff. These best management practices (BMPs) direct storm water to the east and into Kailua Bay.
Retrofit improvements were completed along eroding sections of the range access road; these included using a geotextile liner on the road subbase, covering the road deck with coarse basaltic gravels, and installing controls to convey storm water runoff in a controlled manner. As an added benefit, the geotextile lining discourages invasive vegetation regrowth, helping to reduce fire risk and use of herbicides.
At the time of the site visit, improvements were being made to the access road to R-9. The improvements will serve to control erosion along the crater’s steeply eroded southeast slopes. The roadbed will be regraded and packed with fill that will resist erosion; it will be lined with a leak-free channel lining system.
Changes at Marine Corps Training Area Bellows 2.2.2.Improvements have been made since the baseline to the MOUT facilities at MCTAB to enhance their training capabilities, such as advanced atmospherics and camera systems
Section 2 Baseline Results and Installation Changes
2-4
Marine Corps Installations Command Range Environmental Vulnerability Assessment 5-Year Report Marine Corps Base Hawaii
for after-action analysis. Additionally, MOUT 4 in Training Area 3 is no longer used as a training facility.
Changes at Puuloa Range Training Facility 2.2.3.The backstop berms of several ranges were reconstructed due to wear by heavy use and a high rate of erosion. A new 1,000-yard firing line was installed at Alpha Range. Lead mining also has been conducted at most of the ranges at PRTF in 2011.
Changes in REVA Assessment 2.2.4.During the baseline assessment, two historical use MC loading areas were identified (Former Grenade Range MC loading area and Former EOD Range MC loading area). Since no new loading has occurred on the historical ranges, the historical ranges evaluated in the baseline assessment did not require further evaluation during the five-year review.
Sediment transport analysis was conducted during the five-year review as part of the screening-level transport assessment, which was not conducted during the baseline assessment.
Lead loading on operational ranges was considered only for SARs in the baseline assessment. However, to provide an initial understanding of the amount of lead deposition on HE ranges and TAs, lead loading was estimated for all ranges, including non-SARs, in the five-year review. Similar to SAR evaluations, the potential for lead migration is evaluated qualitatively.
ORCs have been conducted at several locations at the KBRTF since the baseline assessment. Completion reports were obtained and factored into MC loading estimates, as ORCs effectively removed MC available for transport from the MC loading area. ORCs were not considered in the baseline assessment, and their use in the five-year review is discussed in Section 3.4.5.
2.3. Summary of Areas Address in the Five-Year Review During the five-year review for MCB Hawaii, the following nine MC loading areas (four located at the KBRTF and five located at MCTAB) were evaluated:
Section 2
Baseline Results and Installation Changes
Marine Corps Installations Command Range Environmental Vulnerability Assessment 5-Year Report Marine Corps Base Hawaii
2-5
KBRTF
HE Impact Area
Inert Impact Area
R-8
R-8A
MCTAB
MOUT 1
MOUT 2
MOUT 3
TA-2
TA-3
During the five-year review, 12 SARs were identified. Two of these SARs, R-8B and R-10, were not evaluated through the SARAP due to their limited use and no available expenditure data. The 10 remaining SARs also were evaluated in the baseline assessment. The following SARs were evaluated through the SARAP in the five-year review:
R-1
R-2
R-6
R-9
Alpha Range
Bravo Range
Charlie Range
Delta Range
Echo Range
Foxtrot Range
Marine Corps Installations Command Range Environmental Vulnerability Assessment 5-Year Report Marine Corps Base Hawaii
3-1
3. Munitions Constituents Loading Rates and Assumptions
The qualitative and screening-level analyses conducted under REVA require estimation of the amount of indicator MC deposited on operational ranges over time in order to determine if there is a release or substantial threat of a release of MC. The deposition of indicator MC that is estimated under the REVA program is referred to as MC loading.
Operational range usage, boundaries, and other characteristics typically change over time. The objective of the five-year review is to determine the impact of MC loading since the baseline assessment. For this review of training at MCB Hawaii, MC loading estimates include the period from January 2008 to February 2013; no further review of historical loading prior to 2008 is required since it was addressed in the baseline assessment, and no new historical use areas were identified. MC loading areas were adjusted for the five-year review to reflect updated information about locations of range facilities, known targets, surface danger zones, and munitions data. MC loading was estimated using the REVA MC Loading Calculator and modified to account for standard management practices at demolition and EOD ranges as well as ORC activities that occurred during the five-year review period.
The MC loading process for a baseline assessment is outlined in the REVA Reference Manual (HQMC, 2009), while specifics pertaining to MCB Hawaii are discussed in its baseline REVA Report (Malcolm Pirnie, 2009). This five-year review utilizes and builds upon this process, developing MC loading estimates expressed as the average areal loading rate (kilograms per square meter [kg/m2]) deposited annually in the defined area(s) of interest for the most recent time period (from baseline assessment to present). Assumptions were made throughout this MC loading analysis process pertaining to the spatial distribution of the MC on the MC loading areas, as summarized in Section 3.1 through Section 3.5. Section 3.4 provides a description of the TAs and ranges at MCB Hawaii and defines the specific MC loading areas identified for the installation and the overall assumptions for MC loading on the operational ranges. The range-specific assumptions used in the process and the results of the MC loading screening-level assessment are provided in Section 6.
3.1. Munitions Constituents Loading Process The MC loading was estimated based on mass-loading principles. One key consideration for MC loading estimates is the MC content of each type or specific item(s) used at a given MC loading area. Information on the types and amounts of energetic fillers associated with military munitions was developed primarily through the use of Internet-
Section 3 Munitions Constituents Loading Rates and Assumptions
3-2
Marine Corps Installations Command Range Environmental Vulnerability Assessment 5-Year Report Marine Corps Base Hawaii
based sources, such as the Defense Ammunition Center’s Munitions Items Disposition Action System (MIDAS) Web site and the ORDATA database (2012).
Additional key considerations for MC loading estimates are dud, low order, and high order detonation rates. Studies have shown that MC are deposited on operational ranges through low and high order detonations, as well as the leaching of corroded unexploded ordnance (UXO). MC loading estimates are based upon the sum of the MC deposition associated with each outcome (i.e., high order, low order, and UXO) for a given MC loading area. Details on this process are included in the MCB Hawaii baseline report and the REVA Reference Manual (Malcolm Pirnie, 2009; HQMC, 2009).
When calculating MC loading for a range or TA that is determined to be regularly and intensely managed for explosive hazards (e.g., demolition or engineering range), dud and low order rates were set to zero.
Deposition of metals, specifically lead, was considered during this five-year review. Small arms are presumed to be the most significant contributor to lead deposition at operational ranges and TAs, although the metal also may be part of other HE munitions components to varying degrees. Using a similar MC loading methodology, the annual areal deposition of lead for each MC loading area was estimated; the results are included in Section 6. Deposition rates may provide an initial measure of potential impact from lead on training ranges; however, it is important to note such rates differ from other MC loading rates. Given the nature of metals, lead deposition estimates assume no consumption from impact (e.g., no loss due to detonation of the munition) and that all of the lead contained within the munition is deposited in the MC loading area. However, the amount of lead that is deposited in a form that is exposed to the environment and available for transport (e.g., small particles and dust separated from the munition body upon impact) cannot be estimated without site-specific measurements. This is further complicated at demolition ranges or other ranges where management practices may involve collection of scrap metal or munitions debris, which would reduce the overall lead presence at that location. At ranges where these practices are known to occur, it is conservatively assumed that lead deposition is 5% of the munitions’ lead content. Fate and transport parameters for lead are dependent on site-specific geochemical properties, which may vary across small areas in a designated MC loading area and cannot be determined solely by physical observation. For these reasons, the lead loading estimates developed for this assessment are intended to serve as a general indicator of the total lead deposited rather than an estimate of the fraction of lead that is environmentally available for transport and exposure to receptors. In the case of a SAR, range design typically concentrates the impact point to a small, restricted area, and the SARAP may be used to qualitatively assess the potential for off-site impacts, as covered in Section 7.
Section 3
Munitions Constituents Loading Rates and Assumptions
Marine Corps Installations Command Range Environmental Vulnerability Assessment 5-Year Report Marine Corps Base Hawaii
3-3
Additional specifics regarding how these data were incorporated are explored in the aforementioned REVA Reference Manual and baseline REVA Report for MCB Hawaii.
3.2. Expenditure Data Range Control is responsible for the administration and oversight of the training operations conducted at MCB Hawaii. Range Control coordinates primary recordkeeping for munitions expenditures at the operational ranges of the installation through use of the Range Facility Management Support System (RFMSS). This data was provided in electronic format.
The use of documented expenditure data is preferred in the REVA program. A quality review of the expenditure data provided by the installation resulted in a series of assumptions applicable across operational ranges at MCB Hawaii:
Expenditure data provided by the installation were RFMSS data. The RFMSS data provided for the period listed above represented expenditures over a period of 1,880 days. For MC loading calculations, annual average expenditure totals were calculated for each munition type based on a period of 365 days.
The expenditure summaries contain some DoDICs for which data regarding MC content were not available in MIDAS or other munitions inventories.
o In some of these instances, a general description of the munition associated with the DoDIC was identified, either as part of the installation data or as found in other readily available sources. This was reviewed, along with available information regarding the associated range, its design, and its regulations, and technical judgment was used to select surrogate MC loading factors from available data associated with similar munitions for use in MC loading calculations.
o In other instances, no description of the munition was provided. The associated expenditure counts for the unknown DoDICs were proportionally distributed among other known DoDICs within the given location, based on totals for the other DoDICs listed for the same range.
In a few instances, expenditure data with known DoDICs were associated with facilities where some of the listed munitions would not be permitted. In such cases, the munitions expenditures were attributed to an expected facility based on the Range Standard Operating Procedure (SOP) and information from Range Control personnel.
For ranges at the KBRTF that fire into the HE Impact MC loading area and the Inert Impact MC loading area (R-5, R-7, and R-9A), it was assumed that 75% of all small arms and inert munitions were deposited into the Inert Impact MC loading area and 25% of all small arms and inert munitions were deposited into the HE Impact MC loading area. This assumption was discussed with and agreed upon by Range Control personnel. It also was assumed that all HE-containing munitions fired from any of
Section 3 Munitions Constituents Loading Rates and Assumptions
3-4
Marine Corps Installations Command Range Environmental Vulnerability Assessment 5-Year Report Marine Corps Base Hawaii
these ranges were deposited only in the HE Impact MC loading area according to the Range SOP and information from Range Control personnel.
Range use at R-1 changed during the five-year review period, resulting in deposition of small arms in multiple locations. Based on information provided by Range Control personnel, for the period of 2008 to 2010, approximately 75% of all projectiles fired at R-1 were assumed to be deposited in the impact berm at R-1 and 25% were deposited in the Inert Impact MC loading area. From 2010 to present, this distribution was reversed, with 75% of projectiles impacting within the Inert Impact MC loading area and 25% impacting in the R-1 impact berm. The MC loading calculations were adjusted to reflect this distribution.
Munitions use within the MCTAB training areas (TA-2 and TA-3) does not occur in a specific or reoccurring location; rather, it is distributed across a wide area. As a conservative measure, only 10% of the total surface area for TA-2 and TA-3 was incorporated into the MC loading calculations.
Key assumptions also were developed with regard to EOD activities at MCB Hawaii. R-8 is currently the primary emergency demolition / training range at MCB Hawaii for EOD training activities. EOD units may be called upon to address actual or suspected UXO or other munitions-related hazards encountered on and occasionally off the installation. When emergency demolition of unstable munitions or UXO is deemed necessary, munitions may be either blown in place or transported to an EOD range. Additionally, there are instances where discarded munitions may be recovered and turned back into the ammunition supply point, as opposed to being destroyed. Based on information provided by EOD personnel, information regarding these occurrences may not be captured accurately in the RFMSS data.
EOD personnel provided a record of call sheets used to account for EOD-related expenditures that may not be captured in the RFMSS data. The sheets cover the period from January 2010 to February 2013 and contain information about what UXO was found, where it was found, and what remedy was applied. These data were used to develop a single year of averages, which supplemented information extracted from the RFMSS data, using the following assumptions:
DoDICs where MC content data were not available in MIDAS or other inventories were managed using similar assumptions described previously in this section.
Only EOD calls involving destruction of munitions (as opposed to recovery, for example) were reviewed for this assessment. Counts of disposed items found at a demolition location were not included because it was assumed that those munitions were part of regular training activities and already captured in the expenditure data.
Donor charges used to initiate the disposal of UXO were not recorded on the call sheets provided by the EOD personnel. If the demolition occurred at R-8, it was assumed that the donor charges used were accounted for in the RFMSS data. For incidents occurring within ranges or TAs other than R-8, a standard demolition shot
Section 3
Munitions Constituents Loading Rates and Assumptions
Marine Corps Installations Command Range Environmental Vulnerability Assessment 5-Year Report Marine Corps Base Hawaii
3-5
based on the most commonly used donor charges at MCB Hawaii and the amount of UXO being disposed of was assumed.
When information regarding the location of demolition was not provided, it was assumed to have occurred at R-8.
The EOD call sheet data covered 3 years and 2 months of operations. These data were assumed to represent typical operations during the assessment period (2008–2013) and were used to calculate annual expenditure totals to add to corresponding annual averages developed from the expenditure data.
Dud/UXO rates associated with DoDICs reported in the RFMSS data were not used in place of the standard dud assumptions used in the REVA MC Loading Rate Calculator because these data may not have been reported consistently. As such, the REVA standard dud rate assumptions were used in order to maintain a higher level of conservatism in the estimate. Calculations incorporating expenditures from EOD operations and demolition ranges were adjusted to reflect an assumed 100% high order detonation rate.
Additionally, an assumption was developed with regard to ORC operations at MCB Hawaii. As will be discussed in Section 3.4.5, a number of areas at MCB Hawaii have undergone ORC since the baseline assessment. The only ORC that affects MC loading during the five-year review period occurred at the HE Impact MC loading area. A list of the items recovered and their associated DoDICs was provided in the NAVFAC (Naval Facilities Engineering Command) After Action Report dated January 2013 (NAVFAC Pacific, 2013), which was used to make the following assumption:
The munitions identified during the ORC within the HE Impact MC loading area have been accounted for in RFMSS. To reflect the removal/destruction of these munitions, the expenditure totals for each applicable DoDIC within the RFMSS data were reduced according to the number of these munitions identified and removed from the range. These munitions were then re-applied to the HE Impact MC loading area with assumed 100% high order detonation rates.
3.3. REVA Munitions Constituents Loading Rate Calculator The REVA MC Loading Rate Calculator is used to provide an automated method for calculating the overall loading of the operational range area in the units needed for the fate and transport analysis (kg/m2). It uses the size of MC loading areas, the military munitions expenditure data obtained from the installation, and information and assumptions related to duds and low order and high order detonations to complete the calculations. Additionally, training factors can be applied to account for fluctuations in training during periods of use where no expenditure data are available.
Section 3 Munitions Constituents Loading Rates and Assumptions
3-6
Marine Corps Installations Command Range Environmental Vulnerability Assessment 5-Year Report Marine Corps Base Hawaii
Further explanation regarding the REVA MC Loading Rate Calculator is provided in the REVA Reference Manual (HQMC, 2009). All known data and assumptions input into the MC Loading Rate Calculator for each operational range area assessed are documented elsewhere in Section 3 and in Section 6.
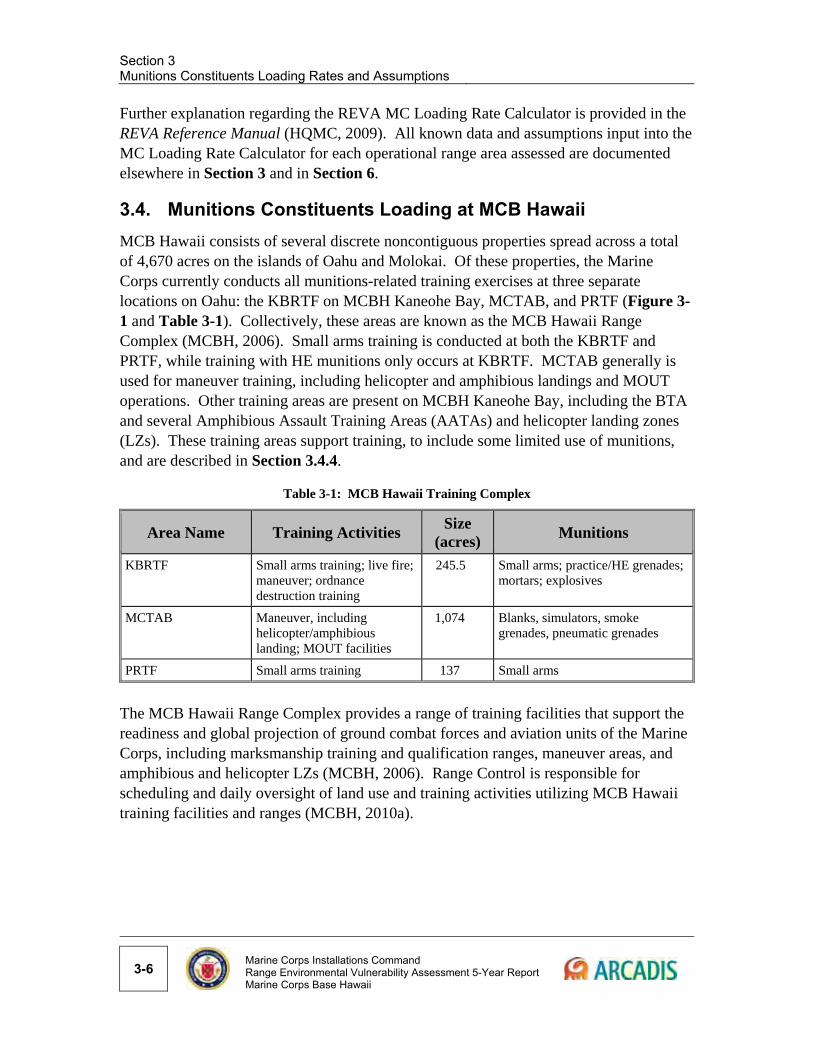
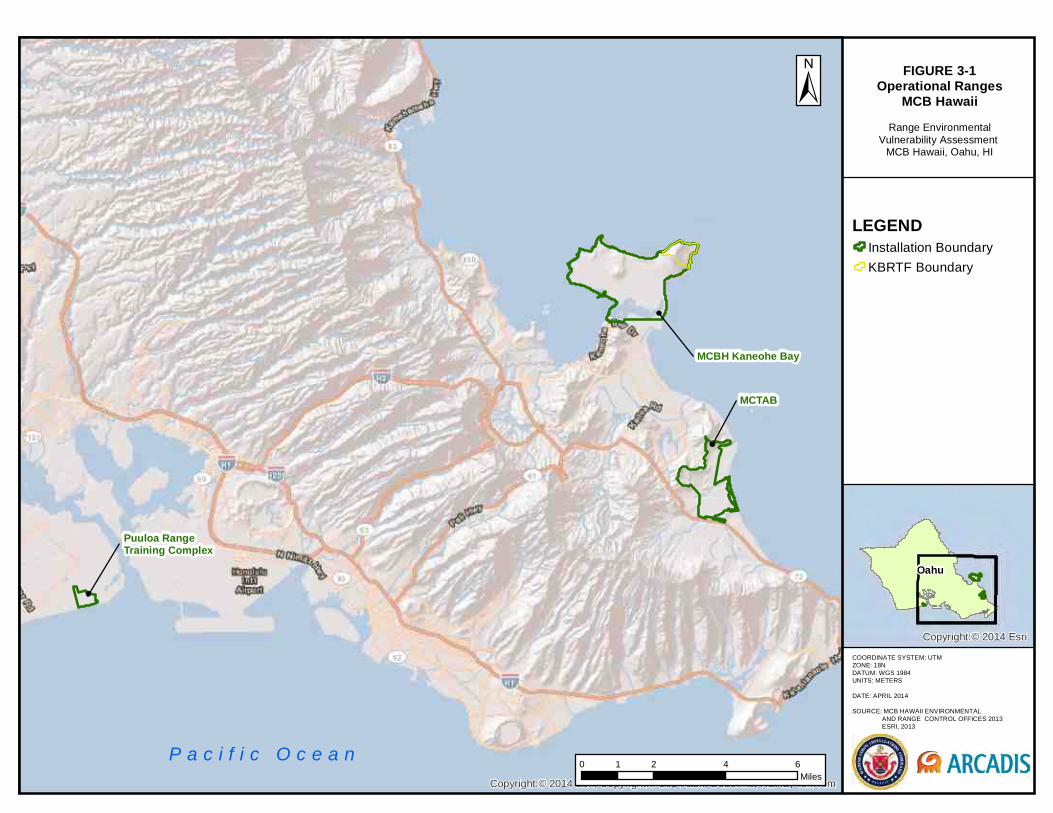
3.4. Munitions Constituents Loading at MCB Hawaii MCB Hawaii consists of several discrete noncontiguous properties spread across a total of 4,670 acres on the islands of Oahu and Molokai. Of these properties, the Marine Corps currently conducts all munitions-related training exercises at three separate locations on Oahu: the KBRTF on MCBH Kaneohe Bay, MCTAB, and PRTF (Figure 3-1 and Table 3-1). Collectively, these areas are known as the MCB Hawaii Range Complex (MCBH, 2006). Small arms training is conducted at both the KBRTF and PRTF, while training with HE munitions only occurs at KBRTF. MCTAB generally is used for maneuver training, including helicopter and amphibious landings and MOUT operations. Other training areas are present on MCBH Kaneohe Bay, including the BTA and several Amphibious Assault Training Areas (AATAs) and helicopter landing zones (LZs). These training areas support training, to include some limited use of munitions, and are described in Section 3.4.4.
Table 3-1: MCB Hawaii Training Complex
Area Name Training Activities Size
(acres) Munitions
KBRTF Small arms training; live fire; maneuver; ordnance destruction training
245.5 Small arms; practice/HE grenades; mortars; explosives
MCTAB Maneuver, including helicopter/amphibious landing; MOUT facilities
1,074 Blanks, simulators, smoke grenades, pneumatic grenades
PRTF Small arms training 137 Small arms
The MCB Hawaii Range Complex provides a range of training facilities that support the readiness and global projection of ground combat forces and aviation units of the Marine Corps, including marksmanship training and qualification ranges, maneuver areas, and amphibious and helicopter LZs (MCBH, 2006). Range Control is responsible for scheduling and daily oversight of land use and training activities utilizing MCB Hawaii training facilities and ranges (MCBH, 2010a).
Copyright:© 2014 Esri
Copyright:© 2014 Esri, Copyright:© 2014 Esri, DeLorme, HERE, TomTom
COORDINATE SYSTEM: UTM ZONE: 18NDATUM: WGS 1984UNITS: METERS
DATE: APRIL 2014
SOURCE: MCB HAWAII ENVIRONMENTAL AND RANGE CONTROL OFFICES 2013 ESRI, 2013
FIGURE 3-1Operational Ranges
MCB HawaiiRange Environmental
Vulnerability Assessment MCB Hawaii, Oahu, HI
LEGENDInstallation Boundary
KBRTF Boundary
±
0 2 4 61Miles
Oahu
P a c i f i c O c e a n
Puuloa RangeTraining Complex
MCBH Kaneohe Bay
MCTAB
Section 3 Munitions Constituents Loading Rates and Assumptions
3-8
Marine Corps Installations Command Range Environmental Vulnerability Assessment 5-Year Report Marine Corps Base Hawaii
This page intentionally blank
Section 3
Munitions Constituents Loading Rates and Assumptions
Marine Corps Installations Command Range Environmental Vulnerability Assessment 5-Year Report Marine Corps Base Hawaii
3-9
The primary range users are the current tenants of the installation:
III MEF
U.S. Pacific Command
Marine Forces Pacific
Special Operations Center, Pacific Command
1st Battalion, 12th Marine Regiment
Combat Logistics Battalion-3
Marine Air Group 24
3d Radio Battalion
CPRW-2
Fleet Logistics Support Wing VR-51
4th Force Reconnaissance Company
Anti-Submarine Warfare Helicopter Squadron Light-37 (MCBH, 2011)
There is also significant use of the ranges at MCB Hawaii by other U.S. military services and federal and local government agencies (MCBH, 2006).
Kaneohe Bay Range Training Facility 3.4.1.The KBRTF is located at the northeastern end of MCBH Kaneohe Bay on Mokapu Peninsula. The KBRTF is a multipurpose range complex capable of supporting a variety of live-fire training exercises (MCBH, 2010a). The total acreage of all ranges and their associated surface danger zones (SDZs), many of which extend into the Pacific Ocean outside of the KBRTF footprint, is approximately 7,300 acres. The operational training area of the KBRTF covers approximately 245.5 acres that encompass Ulupau Crater, excluding its southern exterior slopes.
Ranges at the KBRTF provide known and unknown distance marksmanship ranges, pistol and shotgun ranges, a sniper range, and a static live-fire maneuver range that can accommodate wheeled vehicles and amphibious assault vehicles (AAVs) (Table 3-2 and Figure 3-2). Larger munitions, including HE and target practice (TP) variants, are authorized on several ranges within the KBRTF; these include grenades, rockets, and mortars. A designated impact area, subdivided into inert and HE areas, receives these expenditures. There is also a Demolition Range used for EOD training exercises. Marine Corps units conduct the majority of all training operations at the KBRTF; Navy units, Federal Bureau of Investigation (FBI), Drug Enforcement Agency (DEA), and local Sheriffs' agencies represent the other primary users (MCBH, 2006).

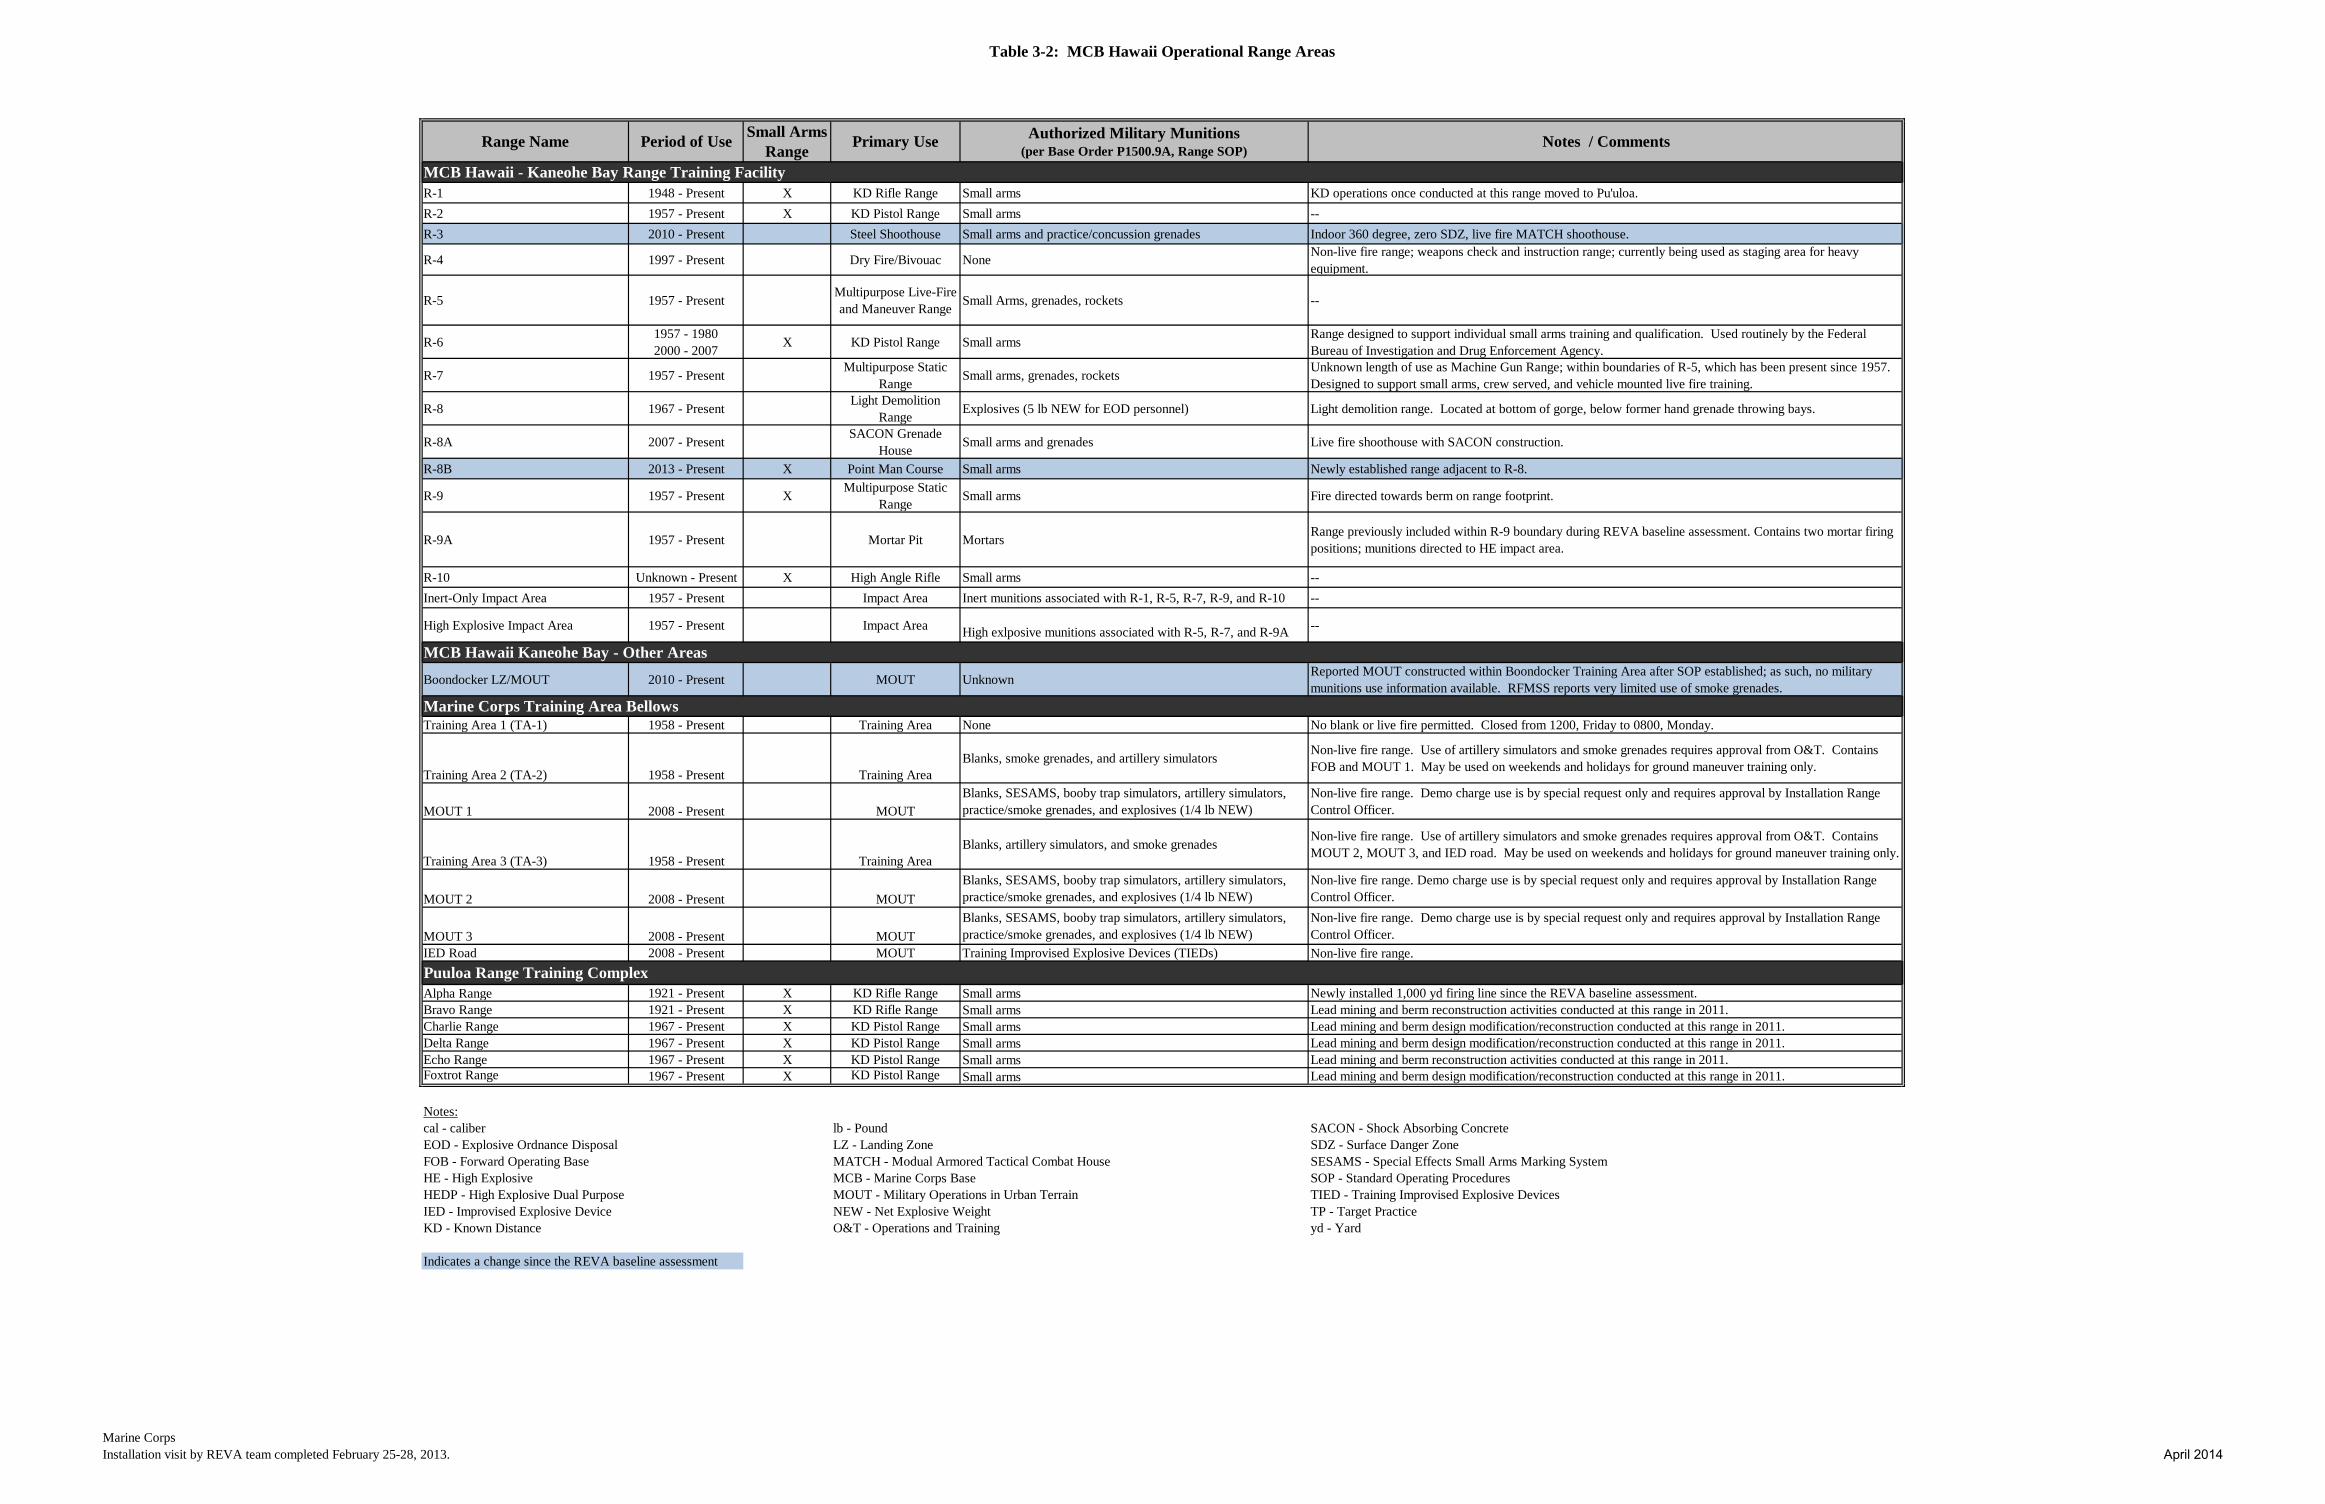
Table 3-2: MCB Hawaii Operational Range Areas
Marine CorpsInstallation visit by REVA team completed February 25-28, 2013. April 2014
Range Name Period of UseSmall Arms
RangePrimary Use Authorized Military Munitions
(per Base Order P1500.9A, Range SOP)Notes / Comments
R-1 1948 - Present X KD Rifle Range Small arms KD operations once conducted at this range moved to Pu'uloa.
R-2 1957 - Present X KD Pistol Range Small arms --
R-3 2010 - Present Steel Shoothouse Small arms and practice/concussion grenades Indoor 360 degree, zero SDZ, live fire MATCH shoothouse.
R-4 1997 - Present Dry Fire/Bivouac NoneNon-live fire range; weapons check and instruction range; currently being used as staging area for heavy equipment.
R-5 1957 - PresentMultipurpose Live-Fire and Maneuver Range
Small Arms, grenades, rockets --
R-61957 - 19802000 - 2007
X KD Pistol Range Small armsRange designed to support individual small arms training and qualification. Used routinely by the Federal Bureau of Investigation and Drug Enforcement Agency.
R-7 1957 - PresentMultipurpose Static
RangeSmall arms, grenades, rockets
Unknown length of use as Machine Gun Range; within boundaries of R-5, which has been present since 1957. Designed to support small arms, crew served, and vehicle mounted live fire training.
R-8 1967 - PresentLight Demolition
RangeExplosives (5 lb NEW for EOD personnel) Light demolition range. Located at bottom of gorge, below former hand grenade throwing bays.
R-8A 2007 - PresentSACON Grenade
HouseSmall arms and grenades Live fire shoothouse with SACON construction.
R-8B 2013 - Present X Point Man Course Small arms Newly established range adjacent to R-8.
R-9 1957 - Present XMultipurpose Static
RangeSmall arms Fire directed towards berm on range footprint.
R-9A 1957 - Present Mortar Pit MortarsRange previously included within R-9 boundary during REVA baseline assessment. Contains two mortar firing positions; munitions directed to HE impact area.
R-10 Unknown - Present X High Angle Rifle Small arms --
Inert-Only Impact Area 1957 - Present Impact Area Inert munitions associated with R-1, R-5, R-7, R-9, and R-10 --
High Explosive Impact Area 1957 - Present Impact Area High exlposive munitions associated with R-5, R-7, and R-9A --
Boondocker LZ/MOUT 2010 - Present MOUT UnknownReported MOUT constructed within Boondocker Training Area after SOP established; as such, no military munitions use information available. RFMSS reports very limited use of smoke grenades.
Training Area 1 (TA-1) 1958 - Present Training Area None No blank or live fire permitted. Closed from 1200, Friday to 0800, Monday.
Training Area 2 (TA-2) 1958 - Present Training AreaBlanks, smoke grenades, and artillery simulators
Non-live fire range. Use of artillery simulators and smoke grenades requires approval from O&T. Contains FOB and MOUT 1. May be used on weekends and holidays for ground maneuver training only.
MOUT 1 2008 - Present MOUTBlanks, SESAMS, booby trap simulators, artillery simulators, practice/smoke grenades, and explosives (1/4 lb NEW)
Non-live fire range. Demo charge use is by special request only and requires approval by Installation Range Control Officer.
Training Area 3 (TA-3) 1958 - Present Training AreaBlanks, artillery simulators, and smoke grenades
Non-live fire range. Use of artillery simulators and smoke grenades requires approval from O&T. Contains MOUT 2, MOUT 3, and IED road. May be used on weekends and holidays for ground maneuver training only.
MOUT 2 2008 - Present MOUT
Blanks, SESAMS, booby trap simulators, artillery simulators, practice/smoke grenades, and explosives (1/4 lb NEW)
Non-live fire range. Demo charge use is by special request only and requires approval by Installation Range Control Officer.
MOUT 3 2008 - Present MOUT
Blanks, SESAMS, booby trap simulators, artillery simulators, practice/smoke grenades, and explosives (1/4 lb NEW)
Non-live fire range. Demo charge use is by special request only and requires approval by Installation Range Control Officer.
IED Road 2008 - Present MOUT Training Improvised Explosive Devices (TIEDs) Non-live fire range.
Alpha Range 1921 - Present X KD Rifle Range Small arms Newly installed 1,000 yd firing line since the REVA baseline assessment.Bravo Range 1921 - Present X KD Rifle Range Small arms Lead mining and berm reconstruction activities conducted at this range in 2011.Charlie Range 1967 - Present X KD Pistol Range Small arms Lead mining and berm design modification/reconstruction conducted at this range in 2011.Delta Range 1967 - Present X KD Pistol Range Small arms Lead mining and berm design modification/reconstruction conducted at this range in 2011.Echo Range 1967 - Present X KD Pistol Range Small arms Lead mining and berm reconstruction activities conducted at this range in 2011.Foxtrot Range 1967 - Present X KD Pistol Range Small arms Lead mining and berm design modification/reconstruction conducted at this range in 2011.
Notes:cal - caliber lb - Pound SACON - Shock Absorbing ConcreteEOD - Explosive Ordnance Disposal LZ - Landing Zone SDZ - Surface Danger ZoneFOB - Forward Operating Base MATCH - Modual Armored Tactical Combat House SESAMS - Special Effects Small Arms Marking SystemHE - High Explosive MCB - Marine Corps Base SOP - Standard Operating ProceduresHEDP - High Explosive Dual Purpose MOUT - Military Operations in Urban Terrain TIED - Training Improvised Explosive DevicesIED - Improvised Explosive Device NEW - Net Explosive Weight TP - Target PracticeKD - Known Distance O&T - Operations and Training yd - Yard
Indicates a change since the REVA baseline assessment
MCB Hawaii - Kaneohe Bay Range Training Facility
Marine Corps Training Area Bellows
Puuloa Range Training Complex
MCB Hawaii Kaneohe Bay - Other Areas
Section 3
Munitions Constituents Loading Rates and Assumptions
Marine Corps Installations Command Range Environmental Vulnerability Assessment 5-Year Report Marine Corps Base Hawaii
3-11
This page intentionally blank
R-10
R-1
R-2
R-3R-4 R-6
R-9AR-9
R-5
R-7
R-8AR-8
R-8B
Ulupau WildlifeManagement Area
InertImpact Area
HEImpact Area
FormerEOD Range
Former Grenade Range
Former Rocket Range Ulu
pau He
ad
COORDINATE SYSTEM: UTM ZONE: 18NDATUM: WGS 1984UNITS: METERS
DATE: APRIL 2014
SOURCE: MCB HAWAII ENVIRONMENTAL AND RANGE CONTROL OFFICES 2013 ESRI, 2013
FIGURE 3-2Operational Ranges - Kaneohe Bay Range
Training FacilityRange Environmental
Vulnerability Assessment MCB Hawaii, Oahu, HI
LEGENDInstallation Boundary
KBRTF Boundary
Wildlife Management Area
MCBH Kaneohe Bay
0 800400Feet
Notes:1. The KBRTF, Inert, and HE boundaries were obtained from the 2009 REVA baseline assessment.2. The R-8B boundary is estimated based on the 2013 range visit and was verifed by Range Control.
Section 3
Munitions Constituents Loading Rates and Assumptions
Marine Corps Installations Command Range Environmental Vulnerability Assessment 5-Year Report Marine Corps Base Hawaii
3-13
This page intentionally blank

Section 3 Munitions Constituents Loading Rates and Assumptions
3-14
Marine Corps Installations Command Range Environmental Vulnerability Assessment 5-Year Report Marine Corps Base Hawaii
3.4.1.1. High Explosives Ranges Designated field firing ranges are located at the KBRTF and support unit commanders in conducting unknown distance and fire and maneuver training (MCBH, 2010a). R-5, R-7, and R-9A direct fire into the HE impact area or into the inert impact area if using TP rounds. R-8A utilizes fragmentation hand grenades that impact within the shock absorbing concrete (SACON®) structure.
R-5 is a multipurpose, unknown distance fire and maneuver range oriented to fire from southwest to northeast into both the inert and HE impact areas. Its SDZ extends approximately 22,000 feet downrange over the Pacific Ocean. R-5 has a portable infantry target system to support machine guns and other small arms. Pop-up targets, supported by solar-powered motors protected by earthen base berms, are spread throughout the range area. Hard targets located in the impact area can accommodate crew-served weapons, launchers, rockets, and missiles. Infantry and vehicle-mounted weapons (both ground and helicopter) may be used at the range. Small arms , mortars (training and HE), and various rocket weapon systems are authorized for use.
R-7 is a static field firing range adjacent to R-5 to the northeast, and the direction of fire is southwest to northeast. The range is designed to support small arms, crew-served, and vehicle mounted live-fire training requirements (MCBH, 2010a). The range contains several SDZs for small arms fire (extending approximately 16,000 feet downrange) and HE munitions use (varying from 8,000 to 10,000 feet downrange); these SDZs cover most of the KBRTF. Exercises at R-7 primarily use small arms, grenades, and rockets. Established targets in the impact area are utilized for exercises on this range.
R-8A is a live-fire shoothouse constructed of SACON® located on a ledge below R-7 and above R-8. The shoothouse had just opened at the time of the REVA baseline assessment. It consists of a three-room structure lined with SACON® walls for bullet and fragment containment. Two smaller rooms on the eastern side of the structure support small arms firing (pistol, rifle, and shotgun ammunition). The larger room on the western half of the building supports small arms firing and use of M67 fragmentation hand grenades. There is no ceiling, and the shoothouse is not authorized for zero SDZ / 360-degree firing (MCBH, 2010a). A red safety line painted on the interior of the range walls indicates vertical firing restrictions. Tracer, incendiary ammunition, and smoke and illumination grenades are not authorized for use at R-8A. Range Control personnel indicated that the original SACON® walls remain in place since training activities were initiated. Each unit is required to fill holes, rake down and level sandy areas of the range floor, and remove all debris from the shoothouse before departing the range.
R-9A is located southeast of R-5 and consists of two mortar firing points. Static fire of mortars is conducted from this firing area. HE mortars are directed toward the designated fixed targets in the HE impact area; inert or TP rounds are fired into the inert impact area.
Section 3
Munitions Constituents Loading Rates and Assumptions
Marine Corps Installations Command Range Environmental Vulnerability Assessment 5-Year Report Marine Corps Base Hawaii
3-15
During the baseline REVA evaluation, the mortar pits were combined with the small arms battlesight zeroing activity and designated as R-9. The R-9A range was established to better administratively track the separate indirect fire training activities associated with the mortar firing area.
3.4.1.2. Small Arms Ranges There are six SARs located within the KBRTF: R-1, R-2, R-6, R-8B, R-9, and R-10.
R-1 is a KD rifle range located along the western interior of Ulupau Crater oriented to fire from south-southwest to north-northeast. It is equipped with 26 firing points on firing lines at 100, 200, 300, and 500 yards and is authorized for small arms.
R-2 is a KD pistol range located at the southern interior reach of Ulupau Crater, just south of R-1 and is oriented for firing from north-northeast to south-southwest. It is equipped with 23 firing points on firing lines at 7, 15, 25, and 50 yards and is authorized for pistol and shotgun ammunition.
R-6, also known as the FBI Range, is a “square bay” range designed to support individual small arms training and qualification. It is located in the southeastern edge of Ulupau Crater and is authorized for pistol, rifle, and all shotgun ammunition.
R-8B is a recently constructed point-man course located within the ravine north of R-8. It contains 16 target emplacements and generally is utilized by one to two personnel at a time using single-shot engagements of the targets with semi-automatic rifles.
R-9 is a static small arms live-fire training range along the eastern edge of the KBRTF. It is utilized for training on engaging point and multiple targets as well as Marine Corps “table” training (MCB Hawaii, 2010a). Rifle ammunition is authorized on R-9.
R-10 is a static high-angle sniper range designed to meet the training requirements of precision and tactical marksmen. It contains a single firing point located on the top of Ulupau Crater. Authorized ammunition for this range includes various sniper rifle ammunition.
The SARs facilitate a variety of training, including static KD firing for pistols, shotguns, rifles, and machine guns, high angle sniper fire, and live-fire point-man training. These ranges are discussed in greater detail in Section 7 of this report.
3.4.1.3. Impact Areas The inert and HE impact areas within the interior of Ulupau Crater receive a variety of mortars, grenades, rockets, and small arms ammunition from R-1, R-5, R-7, R-9A, and R-10. In addition, R-8, an emergency demolition range / training area, is located in a ravine north of the fixed ranges and south of the two primary impact areas. As emergency destruction of explosives and UXO is conducted at this range, it is listed as an impact area for the purpose of this analysis.
Section 3 Munitions Constituents Loading Rates and Assumptions
3-16
Marine Corps Installations Command Range Environmental Vulnerability Assessment 5-Year Report Marine Corps Base Hawaii
The inert impact area sits in the northern interior of Ulupau Crater, covering 3.78 acres; it partially overlaps the Ulupau Head Wildlife Management Area (WMA). The boundaries of the impact area are marked with front and rear, left and right later limit signs. Hard (“EODT”) targets are placed within the bounds of the impact area; currently, three are present. Other steel targets also are located within the inert impact area. The area is otherwise undeveloped and largely covered with grassy vegetation and sporadic brush and trees. This area is used for deposition of inert (non-HE and blank) munitions.
The HE impact area sits upon a 0.72-acre finger of land along the eastern coastline just north of Kii Point. The boundaries of the impact area are marked with lateral limit signs. Three hard targets currently are present within the bounds of the HE impact area. The area is otherwise undeveloped and largely covered with grassy vegetation. This is the only impact area on the KBRTF in which HE-containing munitions (mortars, rockets, rifle grenades) can be directed at targets from fire and maneuver or static ranges. HE expenditures are not authorized for use on the adjacent inert impact area due to the threat of fires within the Ulupau Head WMA. Tracer and illumination munitions also are restricted from use within KBRTF due to fire risk.
R-8 is an emergency demolition range located in a crevice intersecting the eastern coastline between the fixed ranges and the main impact areas. The range is utilized as a training area by various Marine Corps units and personnel, to include demolition and obstacle breaching. The range cannot be used when the adjacent field firing ranges are active. The range is largely vegetated, with the exception of the crevice walls and a small, bare sandy spot used by training units. There is a 5-pound (lb), non-fragmentation net explosive weight (NEW) limit for this range for normal operations and a 10 lb NEW limit for emergencies if necessary. Range Control personnel emphasize that this restriction does not allow for full EOD capacities; in fact, there are no EOD ranges located on MCB Hawaii. The Marine Corps has memoranda of understanding with other U.S. military installations and operations on Oahu in the event that operations exceed the 5 lb limit. Range Control personnel indicated the range may be used to destroy UXO recovered during ORC or as part of an emergency response, though such use is rare. Consequently, this range is used primarily for basic, small-scale exercises to support emergency destruction training. Use of demolition explosives, and associated blasting material has been documented in Toxics Release Inventory and RFMSS data. The range is not used for open burn or open detonation activities. Range Control personnel indicated that there currently are plans to construct a new explosives training range on the KBRTF.
3.4.1.4. Other Ranges and Training Areas R-3 is located between R-2 and R-4, along the southern interior of Ulupau Crater. It was used as a SAR from the 1950s to around 1985. The range was unused until 2010, when the current Modular Armored Tactical Combat House (MATCH) shoothouse was
Section 3
Munitions Constituents Loading Rates and Assumptions
Marine Corps Installations Command Range Environmental Vulnerability Assessment 5-Year Report Marine Corps Base Hawaii
3-17
constructed. The MATCH shoothouse is a 360-degree, zero SDZ, live-fire shoothouse. It consists of two stories with a roof, nine live-fire rooms, two hallways, and two ladder wells (MCBH, 2010a). R-3 supports training with pistol, shotgun, and rifle ammunition. Tracer and incendiary ammunition are not authorized, nor are smoke or illumination grenades. RFMSS data indicate simmunitions also are used. Range users engage targets within the shoothouse; the walls are constructed with materials capable of absorbing small arms projectiles. As this is an indoor range with all lead deposited inside the containment walls, it will not be evaluated further.
R-4 is a snap-in school range located at the southern interior reach of Ulupau Crater adjacent to the range control office. The range was constructed in 1997 (USACE, 2001b). It is circular in shape and positioned around a single target, where Marines may practice proper marksmanship techniques. Range users may only dry fire their weapons, as no live weapons use of any kind is authorized. R-4 also may be utilized for bivouac and assembly drills. As there is no live fire on this range, it will not be evaluated further.
Marine Corps Training Area Bellows 3.4.2.MCTAB is located approximately 8 miles south of MCBH Kaneohe Bay. It is divided into three designated TAs (TA-1, TA-2, and TA-3) that together occupy 1,074 acres (MCBH, 2010a). These TAs contain two large maneuver areas, three MOUT facilities, an amphibious LZ, three helicopter LZs, and an improvised explosive device (IED) training lane called “IED Road” (Table 3-2 and Figure 3-3). MCTAB is the only training area in Hawaii that offers an amphibious landing area with an adjacent tactical maneuver area and, therefore, represents an important training asset for Marine Corps personnel (MCBH, 2010b).
3.4.2.1. Training Areas For all training areas at MCTAB, no live-fire, HE, or aerial pyrotechnic munitions currently are authorized for use. Blank and special effects small arms marking system (SESAMS) small arms ammunition are the primary types of training items used at MCTAB. Expended canisters from simulator and smoke grenade use are collected following the completion of exercises. Range Control personnel characterize use of MCTAB as frequent, occurring multiple days every week.
TA-1 is a 43-acre parcel of land along the coastline at MCTAB. This tree-lined beach area is used for amphibious landing exercises; asphalt paths at the top of the beach along with prescribed routes into TA-2 and TA-3 allow for transit of tracked vehicles in a manner that reduces beach erosion. TA-1 is a non-firing TA; no munitions use is authorized within this TA (MCBH, 2010a). Additionally, TA-1 is closed every weekend for public use from 1200 hours Friday to 0800 hours the following Monday, as well as on designated state and federal holidays.
Section 3 Munitions Constituents Loading Rates and Assumptions
3-18
Marine Corps Installations Command Range Environmental Vulnerability Assessment 5-Year Report Marine Corps Base Hawaii
TA-2 is a 376-acre parcel of land immediately west of TA-1. There are portions of three partially overgrown runways and a small structure that formerly served as an aviation communications center but is now used as administrative space and classrooms by the Marine Corps. TA-2 offers opportunities for aviation-related exercises, vehicle driving training, and tactical operations. Two designated helicopter LZs are located within the boundaries of TA-2 (MCBH, 2010a). Helicopter/heliborne training conducted within TA-2 includes assault landings, low-level flight training, special purpose insert and extraction, rappelling, and helicopter support team training

TA-1
TA-2
TA-3
COORDINATE SYSTEM: UTM ZONE: 18NDATUM: WGS 1984UNITS: METERS
DATE: APRIL 2014
SOURCE: MCB HAWAII/ENVIRONMENTAL AND RANGE CONTROL OFFICES 2013 ESRI, 2013
FIGURE 3-3Operational Ranges -
MCTABRange Environmental
Vulnerability Assessment MCB Hawaii, Oahu, HI
LEGENDTraining Area
Installation Boundary
Surface Water Body
Stream
MCTAB
0 1,000 2,000 3,000 4,000500Feet
MCBH Kaneohe BayMOUT 2 MOUT 1
MOUT 3
Notes:1. MOUT areas approximated based on aerial imagery.
FOB
IED Road

Section 3
Munitions Constituents Loading Rates and Assumptions
Marine Corps Installations Command Range Environmental Vulnerability Assessment 5-Year Report Marine Corps Base Hawaii
3-19
This page intentionally blank
Section 3 Munitions Constituents Loading Rates and Assumptions
3-20
Marine Corps Installations Command Range Environmental Vulnerability Assessment 5-Year Report Marine Corps Base Hawaii
(MCBH, 2010a). Vehicle driving training is conducted within TA-2 on the combat vehicles operator course, which consists of several obstacles and challenges for the drivers to negotiate. Tactical operations training conducted within TA-2 includes small unit offensive and defensive tactics, land navigation, patrolling, blank firing, and non-live-fire artillery reconnaissance, selection, and occupation of position (RSOP) training (MCBH, 2010a). TA-2 also contains MOUT 1 as well as a forward operating base (FOB) training facility. Limited small arms blanks, simulators, and smoke grenades may be utilized within TA-2.
TA-3 is a 582-acre parcel of land immediately northwest of TA-2. It is mostly a vegetated mix of flat and hilly land, with unpaved roads throughout its extent; portions of old runways also exist in the TA. One designated LZ is present within the boundaries of TA-3 (MCBH, 2010a). Similar to TA-2, TA-3 offers training capabilities for aviation-related exercises, infantry tactics, patrolling, RSOP training, vehicle driving training, and land navigation. There are also two MOUT complexes across TA-3 (MOUT 2 and MOUT 3) connected by IED Road. Limited small arms blanks, simulators, and smoke grenades may be utilized within this TA.
3.4.2.2. Military Operations in Urban Terrain The MOUT facilities at MCTAB were reopened in October 2011 when significant improvements were completed that enhanced their training capabilities. All training at the MOUT facilities within MCTAB is non-live fire only; blanks, SESAMS, booby trap flash simulators, and practice grenades are permitted within the MOUT structures. Munitions permitted outside of the MOUT structures include noise cartridges, smoke grenades (with Range Control approval),blanks, SESAMS, battlefield simulations (provided by contractors and approved by Installation Range Control Officer), and demolitions not exceeding ¼ lb NEW (by special request only and approved by Installation Range Control Officer) (MCBH, 2010a).
MOUT 2 and MOUT 3 are located within TA-3. They are equipped similarly to MOUT 1 with some additional capabilities and features. Among these are smell generators in the various sections of the simulated towns as well as projectors within the structures that can simulate various tactical situations. Training IEDs were observed in place in hidden areas throughout the facility during the site visit. According to Range Control personnel, most of these do not utilize pyrotechnics but instead utilize compressed air and talcum powder for effect. A mobile IED course is set up on the road from MOUT 3 to MOUT 2, referred to as the IED Road, and is equipped similarly with cameras for after-action analysis of training operations. In addition to the features listed above, civilian actors are utilized at the MOUT facilities in MCTAB to create hyper-realistic training environments.
Section 3
Munitions Constituents Loading Rates and Assumptions
Marine Corps Installations Command Range Environmental Vulnerability Assessment 5-Year Report Marine Corps Base Hawaii
3-21
Puuloa Range Training Facility 3.4.3.PRTF provides small arms marksmanship training, qualification, and requalification for Marines stationed at MCB Hawaii, DoD personnel, local law enforcement, and federal organizations. PRTF contains six SARs (two rifle ranges and four pistol ranges) that are equipped with a combined total of 100 firing lanes for KD rifle training and 48 lanes for KD pistol training (MCBH, 2006) (Table 3-2 and Figure 3-4). No HE munitions currently are utilized at the range complex. These ranges are discussed in further detail in Section 7 of this report.
Other Training Areas 3.4.4.The BTA, AATAs, and helicopter LZs are additional training assets at MCBH Kaneohe Bay and MCTAB. Training activities at each are described in the following subsections. Munitions use at each of these locations is either limited or not authorized. Consequently, MC loading was not evaluated further at these locations.
3.4.4.1. Boondocker Training Area The BTA is located south of the KBRTF on the eastern end of MCBH Kaneohe Bay. The training area consists of a MOUT facility, confidence obstacle course, rappel/fast-rope tower, leadership reaction course, tactical helicopter LZ, warrior pit, and a gas chamber (MCBH, 2010a). The LZ can be used for troop inserts/extracts and rappelling / fast roping. A series of modular containers comprise the MOUT training facility at the BTA. Training with munitions is authorized only for the MOUT facility. The installation range SOP does not indicate specifically the munitions types authorized for use at the BTA MOUT facility, as it was constructed after SOP’s publication. Based on expenditures recorded in RFMSS, the authorized munitions include blank small arms ammunition, simmunitions, and smoke grenades. However, the recorded expenditures of the smokes and simulators are very low and the resulting MC loading estimates for this time period do not warrant further evaluation. A review of expenditure data will be conducted in the next periodic review.
3.4.4.2. Amphibious Assault Training Areas Amphibious landings are conducted outside of the KBRTF. AATAs are defined as TAs that allow access to watercraft vehicles from the ocean to land. Several AATAs have been established around the periphery of MCBH Kaneohe Bay (MCBH, 2010a). TA-1 on MCTAB also supports amphibious landing activities. Live-fire training is not permitted on any of these training areas on MCBH Kaneohe Bay; safety pyrotechnics use is authorized for emergency circumstances only on certain AATAs.
Section 3 Munitions Constituents Loading Rates and Assumptions
3-22
Marine Corps Installations Command Range Environmental Vulnerability Assessment 5-Year Report Marine Corps Base Hawaii
3.4.4.3. Helicopter Landing Zones Four helicopter LZs are present at MCBH Kaneohe Bay; three are located at MCTAB. Other LZs are present along the MCBH Kaneohe Bay flight line. Data sources (e.g., Range SOP, RFMSS data) indicate that munitions are not utilized at the helicopter LZs.
Operational Range Clearance Program 3.4.5.At the direction of TECOM, NAVFAC Pacific has conducted several ORC activities within the KBRTF since the REVA baseline assessment. ORC was conducted to remove UXO that

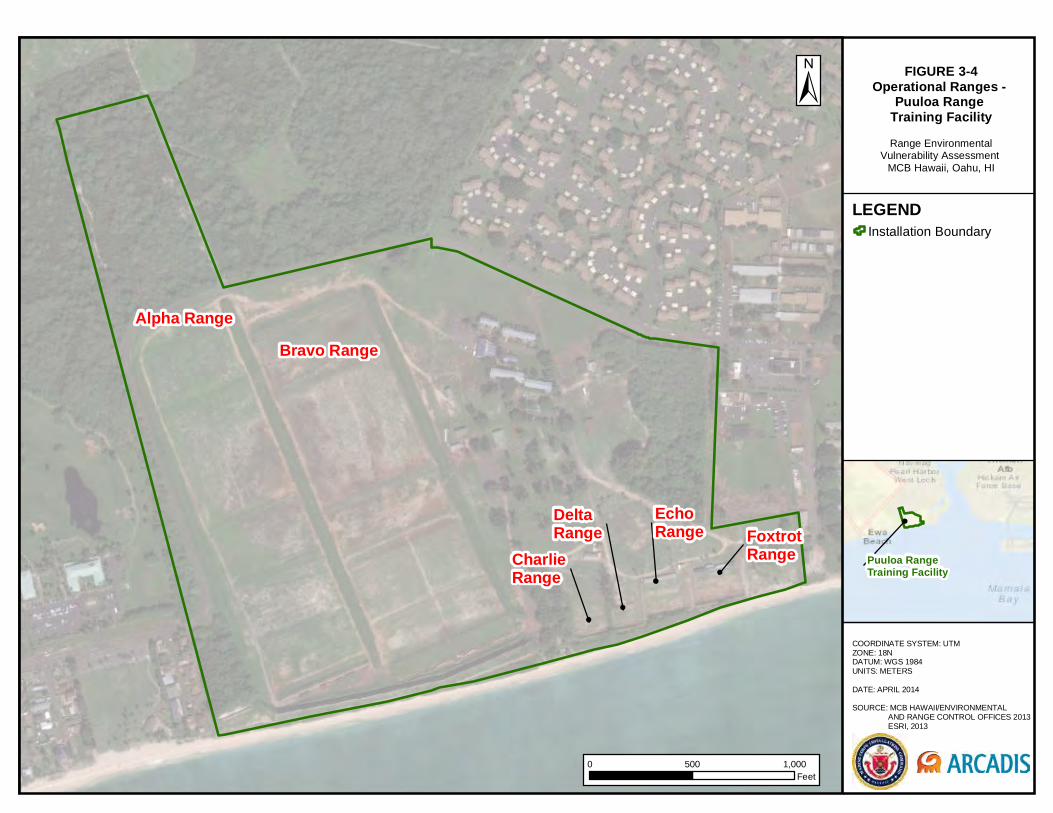
Alpha RangeBravo Range
CharlieRange
DeltaRange
EchoRange Foxtrot
Range
COORDINATE SYSTEM: UTM ZONE: 18NDATUM: WGS 1984UNITS: METERS
DATE: APRIL 2014
SOURCE: MCB HAWAII/ENVIRONMENTAL AND RANGE CONTROL OFFICES 2013 ESRI, 2013
FIGURE 3-4Operational Ranges -
Puuloa Range Training FacilityRange Environmental
Vulnerability Assessment MCB Hawaii, Oahu, HI
LEGENDInstallation Boundary
0 1,000500Feet
Puuloa Range Training Facility
Section 3 Munitions Constituents Loading Rates and Assumptions
3-24
Marine Corps Installations Command Range Environmental Vulnerability Assessment 5-Year Report Marine Corps Base Hawaii
This page intentionally blank
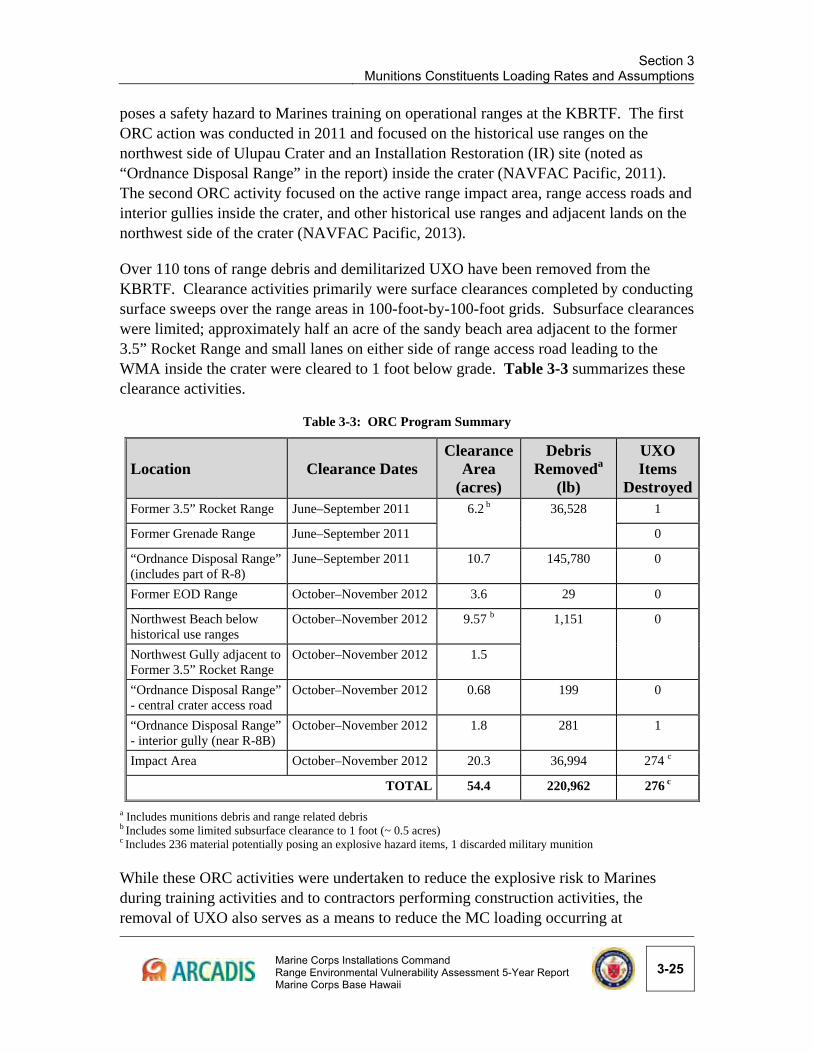
Section 3
Munitions Constituents Loading Rates and Assumptions
Marine Corps Installations Command Range Environmental Vulnerability Assessment 5-Year Report Marine Corps Base Hawaii
3-25
poses a safety hazard to Marines training on operational ranges at the KBRTF. The first ORC action was conducted in 2011 and focused on the historical use ranges on the northwest side of Ulupau Crater and an Installation Restoration (IR) site (noted as “Ordnance Disposal Range” in the report) inside the crater (NAVFAC Pacific, 2011). The second ORC activity focused on the active range impact area, range access roads and interior gullies inside the crater, and other historical use ranges and adjacent lands on the northwest side of the crater (NAVFAC Pacific, 2013).
Over 110 tons of range debris and demilitarized UXO have been removed from the KBRTF. Clearance activities primarily were surface clearances completed by conducting surface sweeps over the range areas in 100-foot-by-100-foot grids. Subsurface clearances were limited; approximately half an acre of the sandy beach area adjacent to the former 3.5” Rocket Range and small lanes on either side of range access road leading to the WMA inside the crater were cleared to 1 foot below grade. Table 3-3 summarizes these clearance activities.
Table 3-3: ORC Program Summary
Location Clearance Dates Clearance
Area (acres)
Debris Removeda
(lb)
UXO Items
DestroyedFormer 3.5” Rocket Range June–September 2011 6.2 b 36,528 1
Former Grenade Range June–September 2011 0
“Ordnance Disposal Range” (includes part of R-8)
June–September 2011 10.7 145,780 0
Former EOD Range October–November 2012 3.6 29 0
Northwest Beach below historical use ranges
October–November 2012 9.57 b 1,151 0
Northwest Gully adjacent to Former 3.5” Rocket Range
October–November 2012 1.5
“Ordnance Disposal Range” - central crater access road
October–November 2012 0.68 199 0
“Ordnance Disposal Range” - interior gully (near R-8B)
October–November 2012 1.8 281 1
Impact Area October–November 2012 20.3 36,994 274 c
TOTAL 54.4 220,962 276 c
a Includes munitions debris and range related debris b Includes some limited subsurface clearance to 1 foot (~ 0.5 acres) c Includes 236 material potentially posing an explosive hazard items, 1 discarded military munition
While these ORC activities were undertaken to reduce the explosive risk to Marines during training activities and to contractors performing construction activities, the removal of UXO also serves as a means to reduce the MC loading occurring at
Section 3 Munitions Constituents Loading Rates and Assumptions
3-26
Marine Corps Installations Command Range Environmental Vulnerability Assessment 5-Year Report Marine Corps Base Hawaii
operational ranges. As such, the ORC activities have been factored into the MC loading process to reduce the MC loads for appropriate ranges during this five-year review. Of the range areas cleared, only the impact area is considered an active range feature; all others are historical use ranges. The adjustment to the MC loading approach is discussed in Section 3.5.
Additional ORC activities are planned for the sandy beach and limestone reef areas located below the HE impact area. Reconnaissance of this area noted clearly visible munitions and explosives of concern in both locations and estimated that 20 acres of lagoon and 7 acres of shoreline could be accessed for ORC (NAVFAC Pacific, 2013). These areas are within a zone recommended by the U.S. Fish and Wildlife Service for occasional munitions survey and removal but only if the activity can be conducted in a manner that does not damage the coral reef community (USFWS, 2008).
3.5. Munitions Constituents Loading Assumptions Selection of Munitions Constituents Loading Areas 3.5.1.
The REVA team reviewed existing operational ranges and TAs to determine the locations of MC loading areas that require analysis in the five-year review. These areas represent the locations at which significant MC loading is occurring or suspected to have occurred as a result of training with munitions containing HE (TNT, RDX, and HMX), illumination rounds and other munitions containing solid propellants (perchlorate), and metals (lead). Lead deposition was evaluated for all operational ranges during this review.
Nine MC loading areas located at the KBRTF and MCTAB were identified at MCB Hawaii for this five-year review:
KBRTF
HE Impact Area (HMX, RDX, TNT, perchlorate, and lead)
Inert Impact Area (primarily lead)
R-8 (HMX, RDX, TNT, perchlorate, and lead)
R-8A (RDX, TNT, perchlorate, and lead)
MCTAB
MOUT 1 (TNT, perchlorate, and lead)
MOUT 2 (TNT, perchlorate, and lead)
MOUT 3 (HMX, RDX, TNT, perchlorate, and lead)
TA-2 (TNT, perchlorate, and lead)
TA-3 (TNT, perchlorate, and lead)
Section 3
Munitions Constituents Loading Rates and Assumptions
Marine Corps Installations Command Range Environmental Vulnerability Assessment 5-Year Report Marine Corps Base Hawaii
3-27
The Inert Impact Area, R-8A, MOUT 1, MOUT 2, MOUT 3, TA-2, and TA-3 MC loading areas are new loading locations for this evaluation. As the REVA five-year evaluation includes lead loading for all operational range areas (not just SARs), the Inert Impact Area MC loading area was identified due to the potential for significant lead loading. R-8A MC loading area was selected for MC loading evaluation due to the use of fragmentation grenades and small arms ammunition.
MOUT 1, MOUT 2, and MOUT 3 as well as TA-2 and TA-3 initially were selected for MC loading evaluation due to the use of pyrotechnic simulators and smoke munitions. Due to the proximity of the MCTAB training areas and MOUT facilities to residential communities, the type and nature of training activities, and thus the MC loading, are limited. Limited expenditure data were recorded at the TAs, and the documented munitions use is assumed to be distributed throughout the TA. Smoke grenade use is limited, as is the use of pyrotechnic simulators (most of these have been replaced with air-compression-loaded talcum powder based simulators with sound report), and established range management practices reduce or eliminate the potential for UXO or low order detonations (e.g., policing of unexpended grenades). Considering this and the SOPs in place for the MOUT facilities, MC loading within the TAs and MOUT facilities at MCTAB was expected to be minimal. However, to ensure conservatism in the evaluation, these areas were identified as MC loading areas and evaluated using the MC loading calculator.
Lead loading estimates were calculated for all SARs at the KBRTF and PRTF. Those estimates are provided in the individual SARAP analysis for each range in Section 7.
The MC loading estimates for the KBRTF are provided in Section 6.1 and Section 6.2. As reported in the Modeling Assumptions Package, MC loading rates for the five MCTAB MC loading areas were estimated at levels several orders of magnitude lower than those for the KBRTF ranges (ARCADIS, 2013). Consequently, MC loading for the TAs and MOUT facilities at MCTAB was found to be very low. As such, they were not carried through the modeling parameter prioritization process and were not further evaluated. The boundaries of each MC loading area were selected based on training-specific information (e.g., operational range boundaries, known target locations). This results in a realistic yet conservative estimate of MC loading rates for all of the MC loading areas. The boundaries of all the MC loading areas identified are displayed in Figure 3-5 and Figure 3-6.
Overarching Assumptions 3.5.2.To estimate MC loading for operational ranges, assumptions were developed to apply to data collected during the five-year review. Complete details and background of these assumptions and

Ulupau WildlifeManagement Area
Ulupa
u Head
COORDINATE SYSTEM: UTM ZONE: 18NDATUM: WGS 1984UNITS: METERS
DATE: APRIL 2014
SOURCE: MCB HAWAII ENVIRONMENTAL AND RANGE CONTROL OFFICES 2013 ESRI, 2013
FIGURE 3-5MC Loading Areas at
KBRTFRange Environmental
Vulnerability Assessment MCB Hawaii, Oahu, HI
LEGENDInstallation Boundary
KBRTF Boundary
MC Loading Area
Wildlife Management Area
MCBH Kaneohe Bay
0 800 1,600400Feet
Section 3
Munitions Constituents Loading Rates and Assumptions
Marine Corps Installations Command Range Environmental Vulnerability Assessment 5-Year Report Marine Corps Base Hawaii
3-29
This page intentionally blank
COORDINATE SYSTEM: UTM ZONE: 18NDATUM: WGS 1984UNITS: METERS
DATE: APRIL 2014
SOURCE: MCB HAWAII/ENVIRONMENTAL AND RANGE CONTROL OFFICES 2013 ESRI, 2013
FIGURE 3-6MC Loading Areas at
MCTABRange Environmental
Vulnerability Assessment MCB Hawaii, Oahu, HI
LEGENDInstallation Boundary
Training Area
MC Loading Area
Surface Water Body
Stream
MCTAB
0 2,000 4,0001,000Feet
MCBH Kaneohe Bay
• c Cl ..
Section 3
Munitions Constituents Loading Rates and Assumptions
Marine Corps Installations Command Range Environmental Vulnerability Assessment 5-Year Report Marine Corps Base Hawaii
3-31
This page intentionally blank
Section 3 Munitions Constituents Loading Rates and Assumptions
3-32
Marine Corps Installations Command Range Environmental Vulnerability Assessment 5-Year Report Marine Corps Base Hawaii
data are available in the REVA Reference Manual for Baseline Assessments (HQMC, 2009). The following bullets represent the primary assumptions used in the MC loading assessment.
Only the main fillers and perchlorate components (REVA indicator MC) are included in the estimates. The amount of MC in fuzes, boosters, and other components is not considered significant enough, by comparison, to impact the MC loading amounts.
All REVA indicator MC are considered 100% pure.
Dud and low order detonation rate estimates are from the Report of Findings for: Study of Ammunition Dud and Low Order Detonation Rates, United States Army Defense Ammunition Center (DAC, 2000). In the event rate estimates are not available, the default values listed in the referenced report of 3.45% (dud rate) and 0.028% (low order detonation rate) are used.
One hundred percent of the MC within a munition remains when a UXO event occurs. Following deposition of UXO, 1% of the total MC mass within the UXO is considered exposed and available for transport.
For low order detonations, it is assumed that 50% of the total MC per item is consumed, resulting in deposition of the other 50% of the MC mass on the MC loading area (DAC, 2000). For high order detonations, it is assumed 99.9% of the total MC per item is consumed, resulting in deposition of 0.1% of the MC mass on the loading area, as detailed in the REVA Reference Manual (HQMC, 2009).
Calculations incorporating expenditures at EOD and demolition ranges are adjusted to reflect an assumed 100% high order detonation.
Marine Corps Installations Command Range Environmental Vulnerability Assessment 5-Year Report Marine Corps Base Hawaii
4-1
4. Conceptual Site Model
Predicting off-range migration of MC requires the evaluation of potential transport pathways, such as surface water and groundwater flow systems, and potential receptors (human and ecological) that could be affected. To this end, the REVA team developed a CSM of MC transport at MCB Hawaii. The primary components of this CSM include:
delineation of the MC loading areas,
identification of which REVA indicator MC have been used at individual MC loading areas,
a synthesis and interpretation of various environmental data to identify potential MC migration pathways and receptors, and
identification of data gaps.
The CSM was developed using information obtained during the site visit, environmental reports obtained from MCB Hawaii, and local geologic field studies. Documents obtained from the Environmental Compliance and Protection Department, Real Estate, Engineering, Facilities, Range Management, Range Operations and Control, and the installation EOD unit included information on the site geology and hydrology, the water supply system, cultural resource studies, natural resource studies, range operating procedures, EOD commitments, and operational range clearances. In addition, the REVA team used various types of spatial data provided by the Environmental Compliance and Protection Department GIS and Range GIS contacts and GEOFidelis to map site characteristics.
A schematic diagram depicting the site conditions addressed in the CSM is presented in Figure 4-1 and Figure 4-4. These figures show the topography of the installation relative to a generalized MC loading area, the range boundary, and potential receptors (e.g., drinking water wells, ecological receptors).
The site-specific CSMs for the MC loading areas are provided in Section 6. A CSM was not created for MCTAB due to lack of MC loading concerns, as described in Section 3.
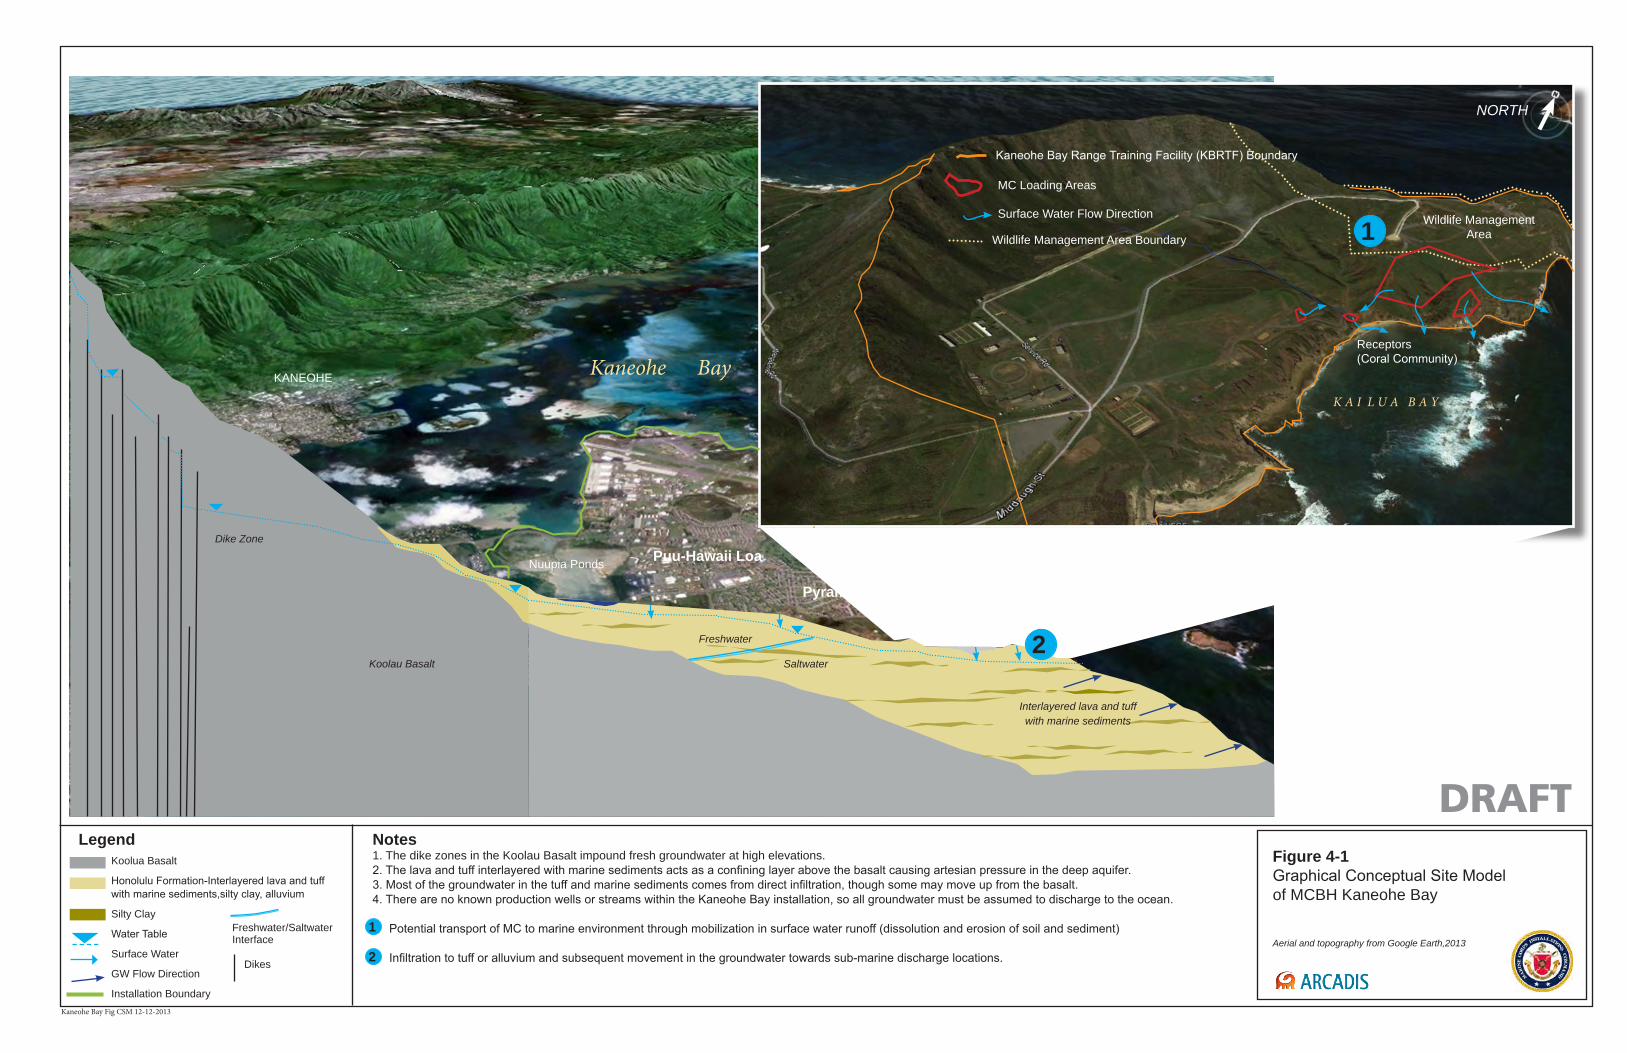
Notes1. The dike zones in the Koolau Basalt impound fresh groundwater at high elevations.2. The lava and tuff interlayered with marine sediments acts as a confining layer above the basalt causing artesian pressure in the deep aquifer.3. Most of the groundwater in the tuff and marine sediments comes from direct infiltration, though some may move up from the basalt.4. There are no known production wells or streams within the Kaneohe Bay installation, so all groundwater must be assumed to discharge to the ocean.
Potential transport of MC to marine environment through mobilization in surface water runoff (dissolution and erosion of soil and sediment)
Infiltration to tuff or alluvium and subsequent movement in the groundwater towards sub-marine discharge locations.
Figure 4-1Graphical Conceptual Site Model of MCBH Kaneohe Bay
Aerial and topography from Google Earth,2013
Koolua Basalt
Honolulu Formation-Interlayered lava and tuff with marine sediments,silty clay, alluvium
Silty Clay
Water Table
Surface Water
GW Flow Direction
Installation Boundary
Legend
Not to Scale
Kaneohe Bay Fig CSM 12-12-2013
K A I L U A B A Y
Receptors(Coral Community)
Wildlife Management Area
MC Loading Areas
1
KANEOHE
Puu-Hawaii LoaNuupia Ponds
Kaneohe Bay
Ulupau Crater
Surface Water Flow Direction
Kaneohe Bay Range Training Facility (KBRTF) Boundary
Interlayered lava and tuff with marine sediments
Koolau Basalt
Dike Zone
2
1
DRAFT
NORTH
2Freshwater
Saltwater
Freshwater/Saltwater Interface
Wildlife Management Area Boundary
Dikes
Pyramid Rock
Section 4
Conceptual Site Model
Marine Corps Installations Command Range Environmental Vulnerability Assessment 5-Year Report Marine Corps Base Hawaii
4-3
This page intentionally blank
Section 4 Conceptual Site Model
4-4
Marine Corps Installations Command Range Environmental Vulnerability Assessment 5-Year Report Marine Corps Base Hawaii
4.1. MCBH Kaneohe Bay
Facility Profile 4.1.1.
CSM Information Profiles – Installation Profile
Information Needs
Information
Facility location MCBH Kaneohe Bay is located adjacent to the bay of the same name, on Mokapu Peninsula off the east side of the island of Oahu, Hawaii.
Date of facility establishment
A Presidential Executive Order established an Army reservation on the northeastern portion of Mokapu Peninsula in 1918 (Drigot and SRGII, 2001; USACE, 2001b). The Marine Corps initially occupied the area shortly following transfer of the property from the Army to the Navy in 1952.
Facility area and layout
MCBH Kaneohe Bay, located approximately 12 miles northeast of Honolulu, encompasses 2,951 acres at the end of Mokapu Peninsula (MCBH, 2011). Notable features include a Class B runway at its western end; the Nuupia Ponds WMA at its southern end; and the KBRTF and Ulupau Head WMA located within Ulupau Crater (NAVFACHI, 2006). Puu Hawaii Loa is the most notable physical feature of the interior of MCBH Kaneohe Bay; various maintenance, administrative, warehousing, personnel housing, and support facilities are located across the interior.
Waters immediately surrounding MCBH Kaneohe Bay are used by Marines for various activities, and access within a 500-yard buffer surrounding the facility is restricted due to its designation as a Naval Defense Sea Area (NAVFACHI, 2006).
Facility mission The mission of MCBH Kaneohe Bay is to maintain and provide facilities and services that support readiness and global projection of III MEF and other activities and units (MCBH, 2011). The III MEF is a major user of operational facilities at MCBH Kaneohe Bay; its mission is to execute amphibious assaults and other required air/ground operations. Major Marine operational commands controlled by the III MEF include the 3rd Marine Regiment (Reinforced) (3rd Marines), Combat Service Support Group-3, and the Marine Air Group 24 (Drigot and SRGII, 2006).
Section 4
Conceptual Site Model
Marine Corps Installations Command Range Environmental Vulnerability Assessment 5-Year Report Marine Corps Base Hawaii
4-5
Operational Range Profile 4.1.2.
CSM Information Profiles – Operational Range Profile
Information Needs
Information
MC loading areas
Nine MC loading areas were delineated for the five-year assessment. Four of these MC loading areas are located within the KBRTF: HE Impact Area, Inert Impact Area, R-8, and R-8A. MOUT 1, MOUT 2, MOUT 3, TA-2, and TA-3 MC loading areas are located at MCTAB.
The MC loading areas were determined based on a review of existing operational ranges and evaluation of munitions expenditures tracked by the installation.
Range names Operational range areas at MCBH Kaneohe Bay include a fire and maneuver area, several fixed ranges that utilize HE munitions, six SARs, an emergency demolition range, an impact area divided into HE and inert zones, and a MOUT facility. This facility contains six SARs: R-1, R-2, R-6 (the FBI Range), R-8B, R-9, and R-10. There are four HE ranges: R-5, R-7, R-8A, and R-9A.
There are two primary impact areas within the interior of Ulupau Crater. The inert impact area sits in the northern interior of Ulupau Crater and is used for deposition of inert (non-HE and blank) munitions. The HE impact area sits on a finger of land along the eastern coastline and is the only impact area on the KBRTF into which HE-containing munitions can be directed.
The BTA is located south of the KBRTF on the eastern end of MCBH Kaneohe Bay. The TA consists of a MOUT facility, confidence obstacle course, rappel/fast-rope tower, leadership reaction course, tactical helicopter LZ, warrior pit, and a gas chamber (MCBH, 2010a).
Date of range establishment
The initial use of Ulupau Crater and the KBRTF for munitions-related training is not clear based upon available documentation. It is known that Naval Air Station Kaneohe Bay and Fort Hase had access to a variety of training ranges during World War II (WWII), though these are largely associated with locations outside of the current operational range boundary (USACE, 2001a). During the 1940s, Ulupau Crater primarily accommodated a number of defensive batteries, though it is known that R-1 was present during this time period based upon a 1948 joint use permit between the Army and Navy. The majority of ranges at Ulupau Crater were created following its development by the Marine Corps in the 1950s. The Marine Corps assumed control of Ulupau Crater in 1952, though documentation (maps) showing the

Section 4 Conceptual Site Model
4-6
Marine Corps Installations Command Range Environmental Vulnerability Assessment 5-Year Report Marine Corps Base Hawaii
CSM Information Profiles – Operational Range Profile
Information Needs
Information
Date of range establishment (cont.)
existence of a developed range complex first appear in 1957. R-4 and R-10 are exceptions to the date of establishment; they were recent additions at the time of the baseline assessment. Since the baseline assessment, R-3, R-8B, and the Boondocker LZ MOUT have been constructed at MCBH Kaneohe Bay.
Range design and use
Designated field firing ranges are located at the KBRTF and support unit commanders in conducting unknown distance and fire and maneuver training (MCBH, 2010a). R-5 (a multipurpose, unknown distance fire and maneuver range), R-7 (a static field firing range), and R-9A (two mortar firing points) direct fire into the HE impact area or, if using TP rounds, the inert impact area. The HE and inert impact areas are delineated by the left and right lateral limit markers visible from the firing line and noted in the Range SOP. R-8A (a live-fire shoothouse) utilizes hand grenades that impact within the SACON®.
SARs
R-1 is a rifle range located along the western interior of Ulupau Crater. The REVA baseline assessment identified R-1 as a KD rifle range used for rifle training and annual qualification. Range Control personnel indicated that the range continued to be used as a KD range until 2010, when KD qualification operations were moved to PRTF (Bravo Range). Since 2010, R-1 has been used as a machinegun and rifle training range. R-2 is a KD pistol and shotgun range located at the southern interior reach of Ulupau Crater. R-6, otherwise known as the FBI Range, is a “square bay” range designed to support individual small arms training and qualification. R-8B is a recently constructed (August 2012) point-man course located within the ravine north of R-8. R-9 is a static small arms live-fire training range for engaging point and multiple targets as well as Marine Corps “table” training (MCBH, 2010a). During the REVA baseline assessment, R-9 was used as a multipurpose range to include both small arms training (firing into the on-range containment berm) and mortar firing (into the impact area). Since that time, these activities have been separated into different range designations: R-9 for small arms training and R-9A for mortar firing. R-10 is a static high-angle sniper range designed to meet the training requirements of precision and tactical marksman, such as scout snipers, law enforcement, and “designated marksman” (MCBH, 2010a).
Section 4
Conceptual Site Model
Marine Corps Installations Command Range Environmental Vulnerability Assessment 5-Year Report Marine Corps Base Hawaii
4-7
CSM Information Profiles – Operational Range Profile
Information Needs
Information
Range design and use (cont.)
Impact Areas
There are two primary impact areas within the interior of Ulupau Crater that receive a variety of mortars, grenades, rockets, and small arms ammunition from R-1, R-5, R-7, R-9A, and R-10. In addition, R-8, an emergency demolition range / training area, is located in a ravine north of the fixed ranges and south of the two primary impact areas. As emergency destruction of explosives and UXO is conducted at this range, it is listed as an impact area for the purpose of this analysis.
Other Ranges
R-3 is located along the southern interior of Ulupau Crater. The range was unused until 2010, when the current MATCH shoothouse was constructed. The MATCH shoothouse is a 360-degree, zero SDZ, live-fire shoothouse. It consists of two stories with a roof, nine live-fire rooms, two hallways, and two ladder wells (MCBH, 2010a). R-4 is a snap-in school range located at the southern interior reach of Ulupau Crater adjacent to the range control office. The range was constructed sometime in 1997 (USACE, 2001b). It is circular in shape and positioned around a single target, where Marines may practice proper marksmanship techniques.
Range security
Access to the operational ranges of the KBRTF is restricted; the entrance is gated and fenced immediately near the Range Control facility. As noted in the Facility Profile, ocean access within a 500-yard buffer surrounding the KBRTF is restricted due to its designation as a Naval Defense Sea Area (NAVFACHI, 2006). Documents and installation personnel indicate accidental trespassing into these waters by nonmilitary vessels occasionally does occur, consequently disrupting training activities.
Military munitions usage
Ranges at the KBRTF provide KD and unknown distance marksmanship ranges, pistol and shotgun ranges, a sniper range, and a static live-fire maneuver range that can accommodate wheeled vehicles and AAVs. Larger munitions, including HE and TP variants, are authorized on several ranges within the KBRTF; these include grenades, rockets, and mortars. A designated impact area, subdivided into inert and HE areas, receives these expenditures. There is also a Demolition Range used for EOD training exercises. Marine Corps units conduct the majority of all training operations at the KBRTF; Navy units, FBI, DEA, and local Sheriffs' agencies represent the other primary users (MCBH, 2006).
Section 4 Conceptual Site Model
4-8
Marine Corps Installations Command Range Environmental Vulnerability Assessment 5-Year Report Marine Corps Base Hawaii
CSM Information Profiles – Operational Range Profile
Information Needs
Information
MC
The potential exists for the four REVA indicator MC associated with HE (TNT, RDX, HMX, and perchlorate) as well as lead to be present at the KBRTF. A comparison of current munitions use logged in the RFMSS records with munitions component data available in the MIDAS database shows these MC (except HMX) to be present in rounds expended at the KBRTF. The potential presence of HMX cannot be discounted or supported due to lack of more detailed historical records. The types of MC estimated to be deposited in each MC loading area at the KBRTF include the following:
HE Impact Area: HMX, RDX, TNT, perchlorate, and lead
Inert Impact Area: lead
R-8: HMX, RDX, TNT, perchlorate, and lead
R-8A: RDX, TNT, perchlorate, and lead
TNT, RDX, and perchlorate may be present at the HE impact area and R-8. These compounds may exist inside the crater in sufficient concentrations to become mobile in the environment.
The potential presence of lead at the KBRTF may stem primarily from the small arms projectiles used at the active ranges. Metallic lead (such as recently fired, unweathered bullets and shot) generally has low chemical reactivity and low solubility in water and is relatively immobile in the environment under most ambient or everyday conditions. However, a portion of lead deposited on a range can become mobile under certain geochemical and hydrologic conditions.
Maintenance
Several ORC activities have been completed within the KBRTF since the REVA baseline assessment. The first ORC action was conducted in 2011 and focused on the historical use ranges on the northwest side of Ulupau Crater and an IR site (noted as “Ordnance Disposal Range” in the report) inside the crater (NAVFAC Pacific, 2011). The second ORC activity focused on the active range impact area, range access roads and interior gullies inside the crater, and other historical use ranges and adjacent lands on the northwest side of the crater (NAVFAC Pacific, 2013).
Erosion controls were installed adjacent to R-6 to alleviate the risk of erosion and subsequent sedimentation of the adjacent bay. A concrete storm water diversion channel was constructed to the south of the range on the other side of the earthen side berm. Rock/riprap also was placed north of the other lateral earthen berm for control of runoff. These BMPs direct storm water to the east and into Kailua Bay.
Section 4
Conceptual Site Model
Marine Corps Installations Command Range Environmental Vulnerability Assessment 5-Year Report Marine Corps Base Hawaii
4-9
CSM Information Profiles – Operational Range Profile
Information Needs
Information
Maintenance (cont.)
A range reconstruction effort was conducted at R-9 in November 2010 due to the severely eroded condition of the berm and elevated risk of projectile ricochet. The berm was mined for lead. The berm soils were replaced with material that is more resistant to erosion from bullet impact and winds (i.e., sand-based soil). In addition, the slope of the berm face was reduced from greater than 45 degrees to less than 40 degrees, which also reduced the impact of erosion. The height of the berm was raised from 8–11 feet to a uniform 14 feet high, and two small side berms were added for additional safety containment. Erosion netting and hydro-mulch were added to further reduce erosion along the berm face. A subsurface irrigation system was installed to support continual vegetative growth on the berm face.
Engineered controls
Two ranges at the KBRTF, R-2 and R-6, utilize bullet traps. The traps have been in place for a short time frame relative to the ranges’ existence. Both traps utilize a shredded rubber matrix that range personnel periodically mine to ensure effective use. Additionally, the rubber material at R-2 is mixed with Gel-Cor™. A reinforced bullet deflector covers much of the trap at R-2, thereby limiting ricochet and precipitation, on the trap.
No other significant engineered controls that may affect MC migration were noted at the other ranges, with the exception of the control and maintenance of vegetative cover discussed earlier.
Other features Other than the previously mentioned Range Control office, there are relatively few notable features of the KBRTF. A 12-inch water supply line runs the length of Ulupau Crater to supply hydrants and water cannons for fire fighting (MCBH, 2002). Twenty-five acres located around Mokapu Point (at the north end of the KBRTF) are designated as part of the Ulupau Head WMA, primarily set aside to support and protect a red-footed booby colony (see Natural Resources Profile) (Drigot and SRGII, 2006).
Section 4 Conceptual Site Model
4-10
Marine Corps Installations Command Range Environmental Vulnerability Assessment 5-Year Report Marine Corps Base Hawaii
Physical Profile 4.1.3.
CSM Information Profiles – Physical Profile
Information Needs
Information
Climate
The climate of the island of Oahu is classified as temperate oceanic and has very little variation in temperature either seasonally or daily (EES, 2005). Daily temperatures vary from near 70 degrees Fahrenheit (°F) to near 80°F (Luecker et al., 1984). Monthly average temperatures at MCBH Kaneohe Bay vary from 69°F in the coolest months to 85°F in the warmest months (NAVFACHI, 2006). Meteorological data were obtained from Marine Corps Air Facility (2013) at MCB Hawaii for the period ranging from 1973 to 2012. The average annual temperature calculated from these data was 76°F, and the average wind speed was 10 miles per hour.
Located on the windward side of Oahu, most of the precipitation at the Kaneohe Bay installation is from the orographic lifting as the northwesterly trade winds rise over the Koolau mountain range (EES, 2005). Reported average annual rainfall on the Mokapu weather station varies from 35 to 38 inches, although annual rainfall rates can vary from 25 to 67 inches (Luecker et al., 1984; EMC, 1991; MCBH, 2002). The northeast portion of Mokapu Peninsula (Ulupau Head) is reported to be drier than the rest of the peninsula, with an annual rainfall of about 10 inches less than at the weather station (Luecker et al., 1984). The aforementioned meteorological data obtained from Marine Corps Air Facility (2013) indicate the average annual precipitation was 24.2 inches per year (in/yr) over its time period.
Pan evaporation is estimated at 80 in/yr, one of the highest values on the island (Oki, 1998; EMC, 1991).
Elevation
Mokapu Peninsula is surrounded by water on all sides (Kaneohe Bay, the Pacific Ocean, Kailua Bay, and the Nuupia Ponds) and generally has a ground surface elevation less than 20 feet above mean sea level (amsl) (Luecker et al., 1984). The main exceptions are three topographic features: Pyramid Rock with an elevation of 40 feet amsl, Puu Hawaii Loa with an elevation of 200 feet amsl, and Ulupau Crater with elevations exceeding 600 feet amsl (NAVFACHI, 2006).
Topography and geologic features
The Mokapu Peninsula is generally flat, with fringing sand dunes and beaches punctuated by the three remnant volcanic features: Pyramid Rock, Puu Hawaii Loa, and Ulupau Crater (MCBH, 2011). The highest point is the Ulupau Crater Head, which is a tuff cone. Pyramid Rock is a low outcrop remnant of a lava flow along the
Section 4
Conceptual Site Model
Marine Corps Installations Command Range Environmental Vulnerability Assessment 5-Year Report Marine Corps Base Hawaii
4-11
CSM Information Profiles – Physical Profile
Information Needs
Information
Topography and geologic features (cont.)
northwestern shore of the peninsula. Puu Hawaii Loa is a cinder cone located near the center of the peninsula. Coral reef remnants and sand dunes interconnect these volcanic features on the peninsula. The identified MC loading areas are located on the Ulupau Crater Head where the topographic slope is relatively steep (grading from 4% to 29% at the MC loading areas). The land generally slopes down the crater head to the southeast.
The island of Oahu was formed by the basaltic lava flows from the eruptions of the Waianae Volcano (west Oahu) and the subsequent eruptions of the Koolau Volcano (east Oahu). During the Neogene, a series of dikes intruded into the Koolau basalts. With a hydraulic conductivity generally lower than the surrounding rock, dikes act as barriers to groundwater flow. The Mokapu Peninsula was shaped from the formation of reefs and deposition of marine sediments on a caldera on the Koolau Range. After millennia of erosion, settling, and sea level variations, these Koolau basalts are now 300 to 1000 feet below present sea level in the area of the peninsula (Luecker et al., 1984). Less than 600,000 years ago, a series of eruptions began in the south of Oahu, laying down the Honolulu Formation (ESI, 2006). Another source dates these eruptions as beginning 1 million years ago (SRGII, 2004). These eruptions continued until about 12,000 years ago and were interspersed with sea level changes and erosional periods. Thus, the Honolulu Formation is interlayered with emerged coral reefs and terrestrial and marine sediments (ESI, 2006).
Pyramid Rock, Puu Hawaii Loa, and Ulupau Crater are remnants of the Honolulu series of eruptions. Pyramid Rock, which probably erupted first, is a deeply eroded vent in which the feeder dike has been exposed. Puu Hawaii Loa is a cinder cone that laid down nephelinite lavas. Ulupau Crater is a tuff cone built on the Puu Hawaii Loa nephelinite from hydromagmatic eruptions. As the lava encountered groundwater and sea water, steam explosions resulted in the scattering of fine ash and fragments of reef debris. These materials later cemented into tuff. In the time since these eruptions, the east side and part of the north side of the crater have eroded away. About 120,000 years ago, the interior of the crater held a shallow lake, which deposited a thin layer of fine silt. Marine deposits and emerged reefs also are found in and around the crater, remnants of previous periods when the ocean level was higher than it is today (Luecker et al., 1984; NAVFACHI, 2006; USACE, 2006; SRGII, 2004; ESI, 2006).
Section 4 Conceptual Site Model
4-12
Marine Corps Installations Command Range Environmental Vulnerability Assessment 5-Year Report Marine Corps Base Hawaii
CSM Information Profiles – Physical Profile
Information Needs
Information
Stratigraphy Stratigraphy (cont.)
Boring logs from six monitoring wells at the landfill site, just south of the crater located on the exterior slopes along the eastern flank of Ulupau crater, provide information on lithology within the installation. Borings for these monitoring wells were completed at depths ranging from 35 to 120 feet below ground surface (bgs) (MCBH, 1994). No boreholes on Mokapu Peninsula have gone deep enough to penetrate the Koolau basalt. The boring log data generally show the presence of weathered and fractured tuff interlayered with alluvium, marine deposits, and calcareous sediments. Two of the monitoring wells (MW-1 and MW-2) are located at an elevation of 206 feet amsl. At these monitoring wells, the top layer of 15 to approximately 28 feet consists of cinder sand with some fine cinder gravel and clay silt. Below this layer is a slightly to highly weathered and fractured tuff that is more than 100 feet thick. Approximately 8 feet of silty cinder sand with basaltic gravel interlayers the tuff material at MW-2. Two monitoring wells (MW-5 and MW-6) are located at elevations ranging from 133 to 142 feet amsl. At these monitoring wells, the top layer of sediment with an approximate thickness of 24 feet consists of silty sand with clayey silt and gravel, clayey silt, and silty sand and gravel. Below this is a layer of moderately to highly fractured and weathered cemented coral with a thickness of approximately 11 to 16 feet. This layer is underlain by a slightly to highly fractured and weathered tuff. Two other monitoring wells (MW-3 and MW-4) are located at an elevation of 120 feet amsl. These monitoring wells are underlain by 33 to 35 feet of sediments consisting of clayey silt, silty sand, and gravel underlain by moderately weathered and highly fractured tuff.
Below the tuff deposits that are interlayered with marine sediments is the basement rock Koolau basalt intruded by numerous dikes, which is found at a depth of 300 to 1,000 feet below mean sea level.
A unit of tuff approximately 30 feet thick is exposed at the surface on the edges of the Ulupau crater and down the outer slopes. The interior of the crater has an additional layer of silty clay deposited by a shallow pond that occupied the area during a period of higher sea level. Some areas of the outside of the crater are covered by unconsolidated marine sediments (beach sand) (Luecker et al., 1984; Takasaki et al., 1969).
Soil and vadose zone characteristics
Soils on the south and central interior of Ulupau Crater are classified as Makalapa clay (MdB), which has a dark grayish brown color, low permeability, high runoff potential (soil hydrologic group D), and
Section 4
Conceptual Site Model
Marine Corps Installations Command Range Environmental Vulnerability Assessment 5-Year Report Marine Corps Base Hawaii
4-13
CSM Information Profiles – Physical Profile
Information Needs
Information
Soil and vadose zone characteristics (cont.)
hazardous shrink/swell properties (USDA NRCS, 2013). The MdB soil has a slightly basic pH of 7.6, an organic content of 1.25%, and a moderate soil erodibility factor of 0.28. The soil is not rated to lead to frequent ponding. Some of the MdB soil extends up the western side of the crater interior. The soil type on the northern end of the crater floor and at the perimeter of the crater has been classified as Rock Land (rRk), characterized by outcrops of volcanic tuff. Rock Land soils are composed primarily of silts (49.8%) and clays (42.5%) (USDA NRCS, 2013). In addition, rock outcrops occur in the gullies inside the crater. Rock outcrops are estimated to cover 25%–90% of the surface. The rRk soil has a high runoff potential (soil hydrologic group D), a neutral pH of 7, an organic content of 4.5%, and a low soil erodibility factor of 0.1. The soil is not rated to lead to frequent ponding. Outside the crater, beach dunes and sands have been deposited by ocean currents. Generally, soils on Mokapu Peninsula are characterized as thin and not well developed and are underlain by consolidated to semiconsolidated volcanic alluvium, weathered volcanics, or calcareous sediments (Luecker et al., 1984; NAVFACHI, 2006; MCBH, 2002; Drigot and SRGII, 2001).
Erosion potential
The majority of the soil types within MCBH Kaneohe Bay have low erodibility, with soil erodibility factors of less than 0.15, particularly in the northwest and central parts of MCBH Kaneohe Bay (USDA NRCS, 2013). These areas are relatively flat with slopes ranging from 0%–2%; however, very little vegetation exists in these areas, so the overall erosion rate can be moderate. Some soil types, including the Makalapa clay found within the KBRTF, have a moderate soil erodibility factor of 0.28. The moderately erodible Makalapa clay is located within and around the slopes of Ulupau Crater and underlies some of the range areas. Severe soil erosion has been known to occur at the Ulupau Crater area (Drigot and SRGII, 2001; SRGII, 2004). According to one study, erosion in this area occurs along storm water runoff pathways and on unvegetated ground surfaces (SRGII, 2004). Accelerated erosion is due, in part, to the inadequately engineered drainage systems for storm water runoff from road surfaces, buildings, and the active landfill work zone (SRGII, 2004). Accelerated erosion also results from poor vegetative cover, steep slopes, and compacted soils (SRGII, 2004).
Based on the erosion problems identified at the Ulupau Crater by SRGII (2004), various erosion control methods have been implemented. The implemented methods include 1) stabilizing
Section 4 Conceptual Site Model
4-14
Marine Corps Installations Command Range Environmental Vulnerability Assessment 5-Year Report Marine Corps Base Hawaii
CSM Information Profiles – Physical Profile
Information Needs
Information
Erosion potential (cont.)
north-facing crater slopes and seaside cliffs above the crater’s southeast shoreline with waddles (biodegradable erosion-stabilizing material) in order to slow runoff and catch sediment, 2) improving storm water drainage at the Weapons Range parking lot, and 3) various retrofit improvements along eroding sections of the range access road (MCBH, 2011). The retrofit improvements include using geotextile liner on the road subbase, covering the road deck with coarse basaltic gravels, and installing controls to convey storm water runoff in a controlled manner.
Potential MC release mechanisms
MC can dissolve in surface runoff generated during precipitation events and be carried into gullies and gorges of Ulupau Crater. Because of the rugged steep topography and proximity to the coastline, it is anticipated that the majority of constituents in surface water runoff may travel a short distance before being discharged into the ocean. Installation personnel noted that munitions debris and potential UXO were observed just off the eastern shore of Ulupau Crater during a marine natural resources inventory study (USFWS, 2008).
Lead from small arms ammunition utilized at the KBRTF is expected to be largely concentrated in individual range impact berms, specifically R-1, R-2, R-6, R-8B, and R-9, as well as spread across the impact area within Ulupau Crater due to exercises conducted at R-5, R-7, and R-10. The primary mechanism for potential release would involve erosion of the earthern berm faces (at R-1 and R-9) and exposed ground surfaces; wind also may play a limited factor in exposing embedded munitions. Transport off individual ranges would be driven primarily by surface runoff generated during precipitation events; water might also infiltrate into the ground, although local geology and the amount of available groundwater may limit this potential release route.
Surface Water Profile 4.1.4.
CSM Information Profiles – Surface Water Profile
Information Needs
Information
Surface water drainage
MCBH Kaneohe Bay directly drains to the Pacific Ocean. The ocean nearly surrounds the installation. Kailua Bay is located on the east, Kaneohe Bay on the southwest, and Nuupia Ponds on the south.
Section 4
Conceptual Site Model
Marine Corps Installations Command Range Environmental Vulnerability Assessment 5-Year Report Marine Corps Base Hawaii
4-15
CSM Information Profiles – Surface Water Profile
Information Needs
Information
Surface water drainage (cont.)
Kailua and Kaneohe Bays merge into the Pacific Ocean, and the Nuupia Ponds ultimately drain in the Pacific Ocean. All waters surrounding MCBH Kaneohe Bay are tidally influenced. There are 24 storm water outlets on MCBH Kaneohe Bay. Four of the storm water outlets discharge to the Nuupia Ponds, eight discharge to Kaneohe Bay, and two discharge to the Ulupau Crater Head (Drigot and SRGII, 2001).
There are two major surface drainage channels on MCBH Kaneohe Bay: (1) the Mokapu Central Drainage Channel, draining the central part of the installation, and (2) an unnamed intermittent stream on the northeastern part of the range at the slopes of Ulupau Crater. The Mokapu Central Drainage Channel is a perennial stream that drains southward on the main base and discharges to Nuupia Ponds and Kaneohe Bay. It is the largest drainage channel on the main base. This drainage channel was designed to allow rapid storm water runoff from the impermeable surfaces of MCBH Kaneohe Bay and is known to have flood risk; therefore, a watershed repair/restoration project is being carried out to address the flooding concerns (Drigot and SRGII, 2001). The unnamed intermittent stream is a short stream that flows through the R-8 MC loading area of the KBRTF and discharges to Kailua Bay.
All four MC loading areas on MCBH Kaneohe Bay are located within the KBRTF on the eastern side of MCBH Kaneohe Bay, down gradient from the crest of Ulupau Crater. A portion of the HE and Inert Impact Area MC loading areas and all of the R-8 and R-8A MC loading areas drain into the unnamed intermittent stream, which continues draining eastward into Kailua Bay. A large portion of the HE and Inert Impact Area MC loading areas drain directly into Kailua Bay.
Hydrological unit & watershed areas
MCBH Kaneohe Bay is located within the Kailua Bay and Kaneohe Bay watersheds. According to a report submitted to the Kailua Bay Advisory Council and a watershed delineation by the State of Hawaii Office of Planning, there are two subwatershed areas located within MCBH Kaneohe Bay: (1) the Kawainui subwatershed and (2) the Puu Hawaiiloa subwatershed (Dashiell, 1998). The Kawainui subwatershed is located within the Kailua Bay watershed, and the Puu Hawaiiloa is located within the Kaneohe Bay watershed (Dashiell, 1998). Both of these subwatersheds extend beyond the MCBH Kaneohe Bay installation boundary. In these subwatersheds, perennial streams and surface water runoff discharge into the surrounding near-shore ocean water bodies. These subwatersheds range in size from 2,300 to 9,400
Section 4 Conceptual Site Model
4-16
Marine Corps Installations Command Range Environmental Vulnerability Assessment 5-Year Report Marine Corps Base Hawaii
CSM Information Profiles – Surface Water Profile
Information Needs
Information
Hydrological unit & watershed areas (cont.)
acres (Figure 4-2).
Based on the watershed delineation of the State of Hawaii, the Kawainui subwatershed includes the Ulupau Crater area, where all identified MC loading areas are located (Figure 4-2). However, based on digital elevation data, the portion of the crater area where MC loading areas are located does not drain within the Kawainui watershed. This portion of the installation drains east into Kailua Bay. Drainage from the area discharges either directly into the bay or through the unnamed intermittent stream that drains eastward to Kailua Bay. Based on digital elevation data, two drainage areas were delineated in the portion of the Ulupau Crater where MC loading areas are located. The larger drainage area, which is estimated to have an area of approximately 37 acres, encompasses the R-8 and the R-8A MC loading areas. The unnamed intermittent stream drains within this drainage area. The smaller drainage area is estimated to have a size of approximately 28 acres, and it encompasses the Inert Impact Area and the HE Impact Area MC loading areas (Figure 4-2).
Kawainui sub-watershed area
Based on the watersheds defined by the State of Hawaii, the Kawainui subwatershed is the largest drainage area within MCBH Kaneohe Bay. It has an area of approximately 9,400 acres. A significant portion of this subwatershed lies outside of the MCBH Kaneohe Bay installation boundary. According to the delineation by the State of Hawaii, the Kawainui subwatershed area contains a small portion of the northern part and approximately the eastern half of MCBH Kaneohe Bay. However, as mentioned previously, the part of the installation in the Ulupau Crater area on the east does not drain within the delineated Kawainui subwatershed area. This area drains east to Kailua Bay. Also, the small portion of the northern part of the Kawainui subwatershed drains north and northeast to the Pacific Ocean. Within this subwatershed, there are gullies on the northeastern part of the installation that have cut into steep inner slopes from the crest of Ulupau Head down to the inner terrace, which forms a relatively flat inner basin (SRGII, 2004). The inner crater consists of north and south morphological zones (SRGII, 2004). The south segment is an area with uniform topography and slopes that has no developed natural drainage, while the north segment contains two large gully networks (SRGII, 2004). All four MC loading areas within the KBRTF are located within the Kawainui subwatershed area.
Section 4
Conceptual Site Model
Marine Corps Installations Command Range Environmental Vulnerability Assessment 5-Year Report Marine Corps Base Hawaii
4-17
This page intentionally blank
Nuupia Ponds
Kaneohe Bay
Kailua BayMokapu Central
Drainage Channel
P a c i f i c O c e a n
Kawa
inui C
anal
Manuawili Stream
COORDINATE SYSTEM: UTM ZONE: 18NDATUM: WGS 1984UNITS: METERS
DATE: APRIL 2014
SOURCE: MCB HAWAII ENVIRONMENTAL AND RANGE CONTROL OFFICES 2013 ESRI, 2013
FIGURE 4-2Watersheds and Streams
MCBH Kaneohe BayRange Environmental
Vulnerability Assessment MCB Hawaii, Oahu, HI
LEGENDInstallation Boundary
KBRTF Boundary
MC Loading Area
Surface Water Body
Stream
Roads
HE/Inert Impact Drainage AreaRange 8/8A Drainage Area
SubwatershedsUlupau CraterKawainuiPuu Hawailoa
MCBH Kaneohe Bay
0 5,000 10,000 15,0002,500Feet
Kailua Bay
Unnamed Drainage(Intermittent)
0 1,000 2,000500Feet
Oahu

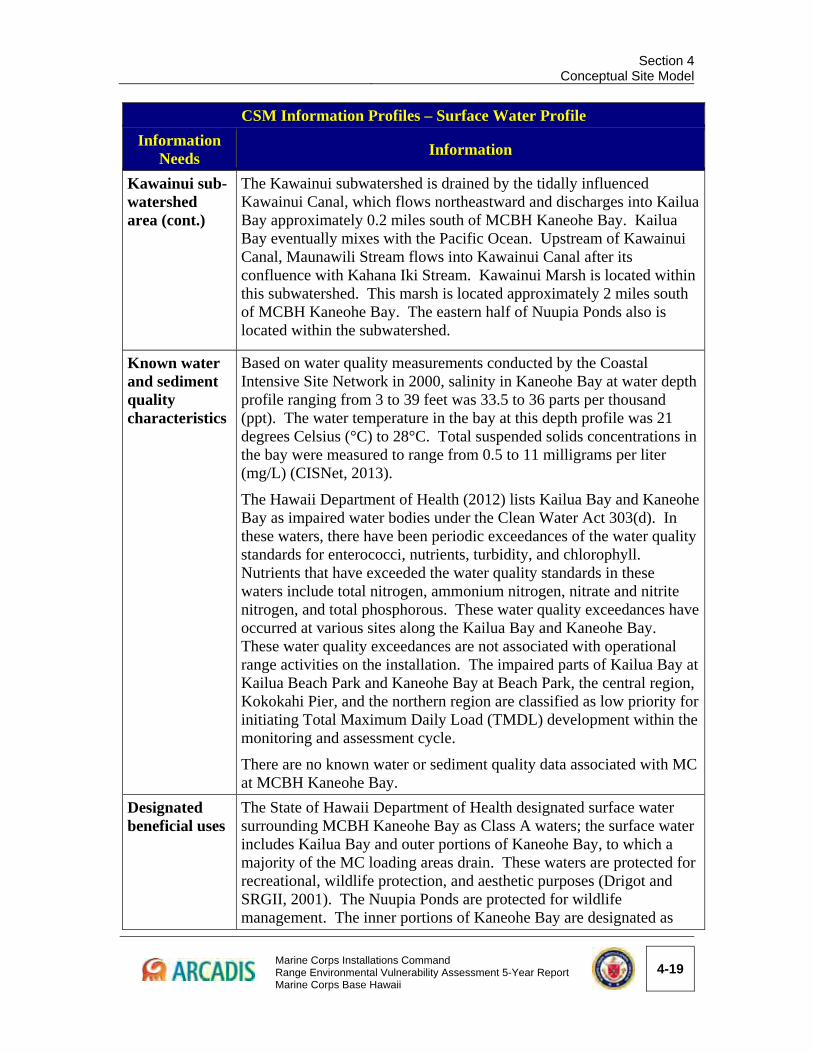
Section 4
Conceptual Site Model
Marine Corps Installations Command Range Environmental Vulnerability Assessment 5-Year Report Marine Corps Base Hawaii
4-19
CSM Information Profiles – Surface Water Profile
Information Needs
Information
Kawainui sub-watershed area (cont.)
The Kawainui subwatershed is drained by the tidally influenced Kawainui Canal, which flows northeastward and discharges into Kailua Bay approximately 0.2 miles south of MCBH Kaneohe Bay. Kailua Bay eventually mixes with the Pacific Ocean. Upstream of Kawainui Canal, Maunawili Stream flows into Kawainui Canal after its confluence with Kahana Iki Stream. Kawainui Marsh is located within this subwatershed. This marsh is located approximately 2 miles south of MCBH Kaneohe Bay. The eastern half of Nuupia Ponds also is located within the subwatershed.
Known water and sediment quality characteristics
Based on water quality measurements conducted by the Coastal Intensive Site Network in 2000, salinity in Kaneohe Bay at water depth profile ranging from 3 to 39 feet was 33.5 to 36 parts per thousand (ppt). The water temperature in the bay at this depth profile was 21 degrees Celsius (°C) to 28°C. Total suspended solids concentrations in the bay were measured to range from 0.5 to 11 milligrams per liter (mg/L) (CISNet, 2013).
The Hawaii Department of Health (2012) lists Kailua Bay and Kaneohe Bay as impaired water bodies under the Clean Water Act 303(d). In these waters, there have been periodic exceedances of the water quality standards for enterococci, nutrients, turbidity, and chlorophyll. Nutrients that have exceeded the water quality standards in these waters include total nitrogen, ammonium nitrogen, nitrate and nitrite nitrogen, and total phosphorous. These water quality exceedances have occurred at various sites along the Kailua Bay and Kaneohe Bay. These water quality exceedances are not associated with operational range activities on the installation. The impaired parts of Kailua Bay at Kailua Beach Park and Kaneohe Bay at Beach Park, the central region, Kokokahi Pier, and the northern region are classified as low priority for initiating Total Maximum Daily Load (TMDL) development within the monitoring and assessment cycle.
There are no known water or sediment quality data associated with MC at MCBH Kaneohe Bay.
Designated beneficial uses
The State of Hawaii Department of Health designated surface water surrounding MCBH Kaneohe Bay as Class A waters; the surface water includes Kailua Bay and outer portions of Kaneohe Bay, to which a majority of the MC loading areas drain. These waters are protected for recreational, wildlife protection, and aesthetic purposes (Drigot and SRGII, 2001). The Nuupia Ponds are protected for wildlife management. The inner portions of Kaneohe Bay are designated as
Section 4 Conceptual Site Model
4-20
Marine Corps Installations Command Range Environmental Vulnerability Assessment 5-Year Report Marine Corps Base Hawaii
CSM Information Profiles – Surface Water Profile
Information Needs
Information
Designated beneficial uses (cont.)
Class AA waters (Drigot and SRGII, 2001). The management objective of these waters is to have them “remain in their natural state as nearly as possible with an absolute minimum of pollution or alteration of water quality from any human caused source or actions” (Hawaii Department of Health, 1992). MC loading areas do not discharge into the Nuupia Ponds nor do they discharge directly into Kaneohe Bay; however, there is a potential for MC discharged north into the Pacific Ocean to mix with Kaneohe Bay, which is connected to the ocean. Marines use surface waters surrounding MCBH Kaneohe Bay (including waters to which MC loading areas drain) for various activities, such as ship-to-shore transit and helicopter search and rescue training (Drigot and SRGII, 2001). Waters surrounding MCBH Kaneohe Bay within a 500-yard buffer zone are not accessible to the public, as the buffer zone is designated as a Naval Defensive Sea Area (Drigot and SRGII, 2001).
Wetlands are present within MCBH Kaneohe Bay. Protected wetlands exist on approximately 402 of the 2,951 acres of the installation area; a significant area of the installation is fill, covering former wetlands, mudflats, and what was once part of Kaneohe Bay (Drigot and SRGII, 2001). Additionally, there are numerous ephemeral pools and marshes that form following a heavy rainfall. These areas are habitats for waterbirds and shorebirds for the short period of time that they contain water (Drigot and SRGII, 2001).
The City of Honolulu supplies drinking water at MCBH Kaneohe Bay. According to the Board of Water Supply for the City and County of Honolulu (2008), almost all of the municipal water supply in Oahu is from groundwater.
Supported habitats/ ecosystems
A variety of vegetation, wildlife, and fish species inhabit MCBH Kaneohe Bay. MCBH Kaneohe Bay contains numerous ephemeral pools and marshes that collect water following a heavy rainfall. These pools support waterbird and shorebird habitats for the short duration that they contain water. Water can remain in these pools from several hours to several days before it evaporates, depending on the volume of rainfall and temperature (Drigot and SRGII, 2001). The Nuupia Ponds are a designated government WMA, and these ponds support endangered species (Hawaiian stilt and Hawaiian water birds). Ephemeral pools and marshes and the Nuupia Ponds are not impacted by MC loading areas within the KBRTF, as MC loading areas do not drain into these surface water features.
Section 4
Conceptual Site Model
Marine Corps Installations Command Range Environmental Vulnerability Assessment 5-Year Report Marine Corps Base Hawaii
4-21
CSM Information Profiles – Surface Water Profile
Information Needs
Information
Supported habitats/ ecosystems (cont.)
The 500-yard buffer zone of water surrounding MCBH Kaneohe Bay supports a large variety of aquatic habitats. Some of these habitats include coral colonies, sponges, bryozoans, sabellid worms and tunicates, burrow-dwelling gobies, abundant populations of 20 or more fish species, and a growing abundance of the threatened green sea turtle (Drigot and SRGII, 2001).
Gaining or losing streams
Surface water runoff and streamflow within the KBRTF at MCBH Kaneohe Bay are likely to infiltrate into the underlying highly permeable lava (tuff material) generally comprising the lithology near Ulupau Crater where MC loading areas are located. Surface flow is less likely to recharge the groundwater in some areas where the subsurface lithology is less permeable, such as around the slopes of Ulupau Crater, which is underlain by Makalapa clay.
Lakes, ponds, and reservoirs
There are no active potable water storage reservoirs on or near MCBH Kaneohe Bay. However, there are natural and man-made surface water features on MCBH Kaneohe Bay. These include the Nuupia Ponds on the southern boundary of the installation, the numerous ephemeral pools and marshes located throughout the installation, and golf course ponds that are located on the north-central part of the installation.
Groundwater Profile 4.1.5.
CSM Information Profiles – Groundwater Profile
Information Needs
Information
Groundwater basins
The Kaneohe Bay is part of the Windward Aquifer Sector and the Waimanalo Aquifer System (Environet, 2007). See Figure 4-3 for the aquifer sectors and systems on Oahu. The State Commission on Water Resources Management divides the island’s groundwater into sectors and systems as management tools only and these divisions do not imply non-communication or hydraulically separate aquifers. In general, aquifer sectors define large geologic barriers, while aquifer systems are defined by hydraulic conductivity zones (Oceanit Townscape, 2007; SRGII, 2002b).
Designated beneficial uses
Groundwater aquifers underlying MCBH Kaneohe Bay are located seaward of

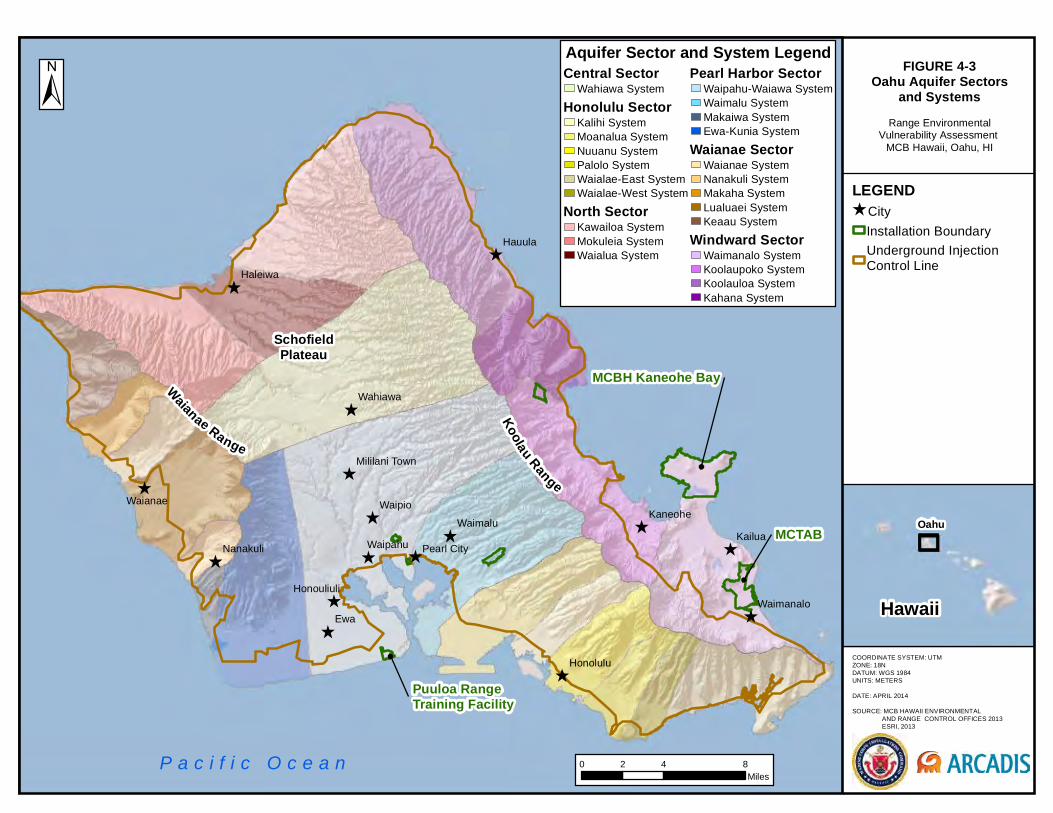
P a c i f i c O c e a n
Puuloa RangeTraining Facility
SchofieldPlateau
Koolau Range
Waianae Range
MCBH Kaneohe Bay
MCTAB
Ewa
Kailua
Hauula
WaipioKaneohe
Waianae
Waipahu
Waimalu
Wahiawa
Haleiwa
Honolulu
Nanakuli
Waimanalo
Pearl City
Honouliuli
Mililani Town
COORDINATE SYSTEM: UTM ZONE: 18NDATUM: WGS 1984UNITS: METERS
DATE: APRIL 2014
SOURCE: MCB HAWAII ENVIRONMENTAL AND RANGE CONTROL OFFICES 2013 ESRI, 2013
FIGURE 4-3Oahu Aquifer Sectors
and SystemsRange Environmental
Vulnerability Assessment MCB Hawaii, Oahu, HI
LEGENDCity
Installation Boundary
Underground InjectionControl Line
0 4 82Miles
Aquifer Sector and System LegendCentral Sector
Wahiawa System
Honolulu SectorKalihi SystemMoanalua SystemNuuanu SystemPalolo SystemWaialae-East SystemWaialae-West System
North SectorKawailoa SystemMokuleia SystemWaialua System
Pearl Harbor SectorWaipahu-Waiawa SystemWaimalu SystemMakaiwa SystemEwa-Kunia System
Waianae SectorWaianae SystemNanakuli SystemMakaha SystemLualuaei SystemKeaau System
Windward SectorWaimanalo SystemKoolaupoko SystemKoolauloa SystemKahana System
Oahu
Hawaii

Section 4 Conceptual Site Model
4-24
Marine Corps Installations Command Range Environmental Vulnerability Assessment 5-Year Report Marine Corps Base Hawaii
CSM Information Profiles – Groundwater Profile
Information Needs
Information
Designated beneficial uses (cont’d)
the Hawaii Underground Injection Control (UIC) Line and are designated as nondrinking water aquifers (Figure 4-3). Aquifers seaward of the UIC Line are designated as nondrinking water, and aquifers landward of the UIC Line are designated as drinking water sources. The Hawaii UIC Line designation helps protect the quality of Hawaii’s groundwater sources of drinking from chemical, physical, radioactive, and biological contamination that could originate from injection well activity (Hawaii Department of Health, 2013). It does so by placing restrictions on injection well activities in areas landward of the UIC Line where aquifers are designated as drinking water sources.
There are no known uses of groundwater in or around MCBH Kaneohe Bay.
Groundwater supply wells
There are no potable water wells on MCBH Kaneohe Bay (NAVFACHI, 2006). The base purchases drinking water from the Honolulu Board of Water Supply (BWS) (Earth Tech, 2006a). The water purchased from BWS comes from the Kaapa Reservoir (NAVFACHI, 2006). NAVFAC Pacific Division reports that the nearest drinking water well to the installation is 7 miles southwest of Ulupau Crater across Kaneohe Bay (MCBH, 2002). One out-of-service groundwater well is reported to be within 1 mile of Building 1667 (less than 1.5 miles southwest of Ulupau Crater) (Wil Chee, 2004).
All potential water sources are located up gradient from Mokapu Peninsula. Groundwater quality on the installation, including the KBRTF, does not affect drinking water sources for the island.
Recharge source(s)
Rain is the source of all fresh groundwater on the island of Oahu. Most of it is recharged through direct infiltration. Some enters the subsurface as stream infiltration. Recharge is the greatest in the Koolaus, where permeable rock is exposed and annual rainfall is very high northwest off the installation. The basal groundwater at Ulupau Head comes primarily from leakage of the dike-impounded groundwater high in the Koolau Mountains (EES, 2005; Souza and Meyer, 1995; Takasaki et al., 1969).
Outside the dike-impounded groundwater areas, fresh groundwater occurs as a lens overlying saline groundwater from the ocean. In these areas, thickness of the freshwater lens generally follows the Ghyben-Herzberg principal based on the density difference between fresh and saline water.
Section 4
Conceptual Site Model
Marine Corps Installations Command Range Environmental Vulnerability Assessment 5-Year Report Marine Corps Base Hawaii
4-25
CSM Information Profiles – Groundwater Profile
Information Needs
Information
Porous or fracture flow
Groundwater flow is generally porous-media flow through the sediments consisting of alluvium and marine deposits of the Honolulu Formation. Groundwater flow is likely to be through zones of secondary porosity (i.e., fracture flow) in tuff and other local bedrock types that are fractured, such ascemented coral. Within the Koolau basalt, groundwater flow is limited in the dike complexes and can be very high in dike-free lava flows.
Depth to groundwater
There are no water level data available near Ulupau Head. On the Mokapu Peninsula, shallow groundwater levels are about 1 to 2 feet amsl (Luecker et al., 1984). At the landfill (just south of the crater), groundwater levels have been measured at 20 to 105 feet bgs, which corresponds to groundwater table elevations of 0.2 to 4.2 feet amsl (Environet, 2007). Groundwater in the deep Koolau basalt may be confined under artesian pressure (ESI, 2006).
Gradient and flow velocity
Generally, groundwater flow is toward the coastline, and the gradient is expected to be very low—perhaps 1 foot/mile (Luecker et al., 1984)—given that the highest measured groundwater level elevation is about 4.2 feet amsl. However, differential recharge, complex geology, and tidal influences make it difficult to define the hydraulic gradient.
Todd (1980) reports hydraulic conductivity for tuff to be approximately 0.7 foot/day. Estimates of horizontal flow velocity are based on assumed conditions and material properties and vary from 1 to 10 feet/day (Environet, 2007; Luecker et al., 1984).
Known water quality characteristics
Groundwater on MCBH Kaneohe Bay is brackish to saline, with salinities between 1 and 32 ppt. Based on measured groundwater quality at six monitoring wells from the landfill site located on the exterior slopes of the Ulupau Crater on December 2012, the median pH in groundwater from marine deposits and tuff was near neutral, 7.23, the median dissolved oxygen was low, 0.3 mg/L, and the median total dissolved solids (TDS) was high, 4,025 mg/L (Environmental Technical Services, 2013). Consistent with the high TDS, the median chloride concentration measured in the groundwater at the landfill site was 1,557 mg/L. Groundwater beneath Ulupau Crater in the upper calcareous aquifer is also brackish, with a salinity between 2 and 32 ppt (SRGII, 2004). The Koolau basalt groundwater at the Mokapu Peninsula is most likely brackish or saline (Luecker et al., 1984).
There are no known groundwater quality data associated with MC at MCBH Kaneohe Bay.
Section 4 Conceptual Site Model
4-26
Marine Corps Installations Command Range Environmental Vulnerability Assessment 5-Year Report Marine Corps Base Hawaii
CSM Information Profiles – Groundwater Profile
Information Needs
Information
Discharge location(s)
In the absence of any streams or wells on Ulupau Head, all groundwater is assumed to discharge to the ocean (EMC, 1991; Takasaki et al., 1969). Range personnel reported that they have not noticed groundwater seepage around the crater. Therefore, the groundwater likely discharges off shore.
Human Land Use and Exposure Profile 4.1.6.
CSM Information Profiles – Human Land Use and Exposure Profile
Information Needs
Information
Land use
The KBRTF primarily is used by the Marine Corps for a mix of small arms and live-fire and maneuver exercises. All active ranges at this facility are located in the interior of Ulupau Crater, though designated SDZs extend beyond the reaches of the crater and over the Pacific Ocean (BCH, 1994; NAVFACHI, 2006). A relatively small portion of southern reaches of the KBRTF is covered by ESQD arcs related to ammunition magazines, outside of the operational range area (BCH, 1994; NAVFACHI, 2006). These arcs prevent some uses of the land, such as construction of residential buildings.
A small network of unpaved roads provides access throughout the KBRTF, and gravel firebreaks have been placed strategically in the main impact area to protect wildlife management efforts and minimize the chance of inadvertent fires leaving Ulupau Crater. A 12-inch water main extends through the KBRTF, feeding into hydrants and fire cannons (BCH, 2002). The City and County of Honolulu Kailua Regional Wastewater Treatment Plant discharges effluent into the deep ocean via the Mokapu outfall, which runs along the eastern side of MCBH Kaneohe Bay and extends southeast into the ocean near the entrance to the KBRTF (NAVFACHI, 2006). The end of the outfall is approximately 0.93 miles off shore (SRGII, 2002a).
Cultural resources have been examined extensively at MCB Hawaii, although sites within the KBRTF are limited, possibly due to military construction and use since WWII (BCH, 2002; USACE, 2006).
Ocean Use
Installation personnel are authorized to utilize designated shoreline areas for fishing and a variety of beach recreation activities. The beach between Pyramid Rock and Ulupau Crater is the most popular
Section 4
Conceptual Site Model
Marine Corps Installations Command Range Environmental Vulnerability Assessment 5-Year Report Marine Corps Base Hawaii
4-27
CSM Information Profiles – Human Land Use and Exposure Profile
Information Needs
Information
Ocean Use (cont.)
for beachcombing, swimming, fishing, scuba diving, and surfing (SRGII, 2002a). The waters immediately around Ulupau Crater are off-limits to recreational use. In the recent past, fishing and other recreational activities were permitted near the entrance to the KBRTF, though that area is now closed to unauthorized personnel (SGRII, 2007). An installation marina provides general boating opportunities to installation personnel (SGRII, 2002a).
Current human receptors
There are no anticipated significant human receptors of MC associated with the KBRTF. Although portions of the shoreline near the facility may be used for recreational purposes, these uses are infrequent near the identified MC loading areas, and restrictions on shoreline use greatly limit the potential for exposure. In addition, the areas at which exposures could occur are difficult to access by Marine Corps personnel attempting to fish, dive, or boat in the area.
Given the proximity of the ocean, any groundwater resources at the KBRTF are brackish to saline and unsuitable for human use; therefore, no receptors are considered to be impacted by this pathway. Additionally, the KBRTF is located on the seaward side of the UIC Line, where groundwater is designated nonpotable. There are no potable water wells on MCBH Kaneohe Bay (NAVFACHI, 2006). The nearest public water supply well is 7 miles across Kaneohe Bay southwest of Ulupau Crater (BCH, 2002).
Land use restrictions
Because of the complex issues surrounding management of the red-footed booby at Ulupau Crater (discussed below), there are several restrictions to munitions use, including tracers, gas, smoke, and pyrotechnics; no use of HE during the fire season; explosive limits on demolition activities; and no operation of helicopters (MCBH, 1997; BCH, 2002; MCBH, 2005). However, range personnel suggested tracer ammunition may be utilized in limited circumstances. Additionally, the Range Complex Management Plan indicates that UXO is cleared after every live-fire exercise (MCBH, 2005).
Any proposed changes to range use, intensity of use, or configuration at the KBRTF are required to undergo an environmental review prior to implementation (MCBH, 1997). Depending on the scope of a given action, potential impact to the limited cultural resources present at the KBRTF may need to be reviewed per the Archaeological Resources Protection Act, National Historic Preservation Act, and Native American Graves Protection and Repatriation Act (USACE, 2006).

Section 4 Conceptual Site Model
4-28
Marine Corps Installations Command Range Environmental Vulnerability Assessment 5-Year Report Marine Corps Base Hawaii
CSM Information Profiles – Human Land Use and Exposure Profile
Information Needs
Information
Land use restrictions (cont.)
The coastal area around MCBH Kaneohe Bay, as well as the presence of coral reefs in these waters, requires consideration of a complex array of federal, state, local, and Marine Corps regulations (reference SGRII, 2002a for a summary).
Natural Resources Profile 4.1.7.
CSM Information Profiles – Natural Resources Profile
Information Needs
Information
Ecosystems Much of MCBH Kaneohe Bay is developed or has been altered by human activities. Secondary successional plant communities dominated by introduced species cover much of the open space at the installation (Drigot and SRGII, 2001).
MCB Hawaii is the only Marine Corps installation in the nation with coral reef ecosystems within its jurisdiction (SRGII, 2002a). Coral reefs support a diverse range of aquatic and benthic organisms, as well as provide shoreline stabilization and recreational and aesthetic opportunities. Relatively high coral cover (up to 80% on ridge crests) occurs off shore of Ulupau Head to the north and east in Kailua Bay and the Pacific Ocean; the greatest reef fish abundance and diversity occur in these same waters.
Vegetation Generally, much of the vegetation at Ulupau Crater consists of invasive, fire-tolerant grasses, such as Guinea grass and buffelgrass, interspersed with koa haole and kiawe trees (Drigot and SRGII, 2001; BCH, 2002; NAVFACHI, 2006; Tetra Tech, 2006). Native plants are dispersed throughout the crater, though these are limited to isolated pockets (SRGII, 2007). During dry summer months, plants generally show symptoms of stress due to reduced soil moisture, including wilting, loss of leaf area, and die back.
As noted, coral reefs like the reef adjacent to Ulupau Crater support a very diverse range of organisms, including a number of algae and sea grasses (SRGII, 2002a).
Fauna
The red-footed booby colony located at the north end of Ulupau Crater represents the most prominent fauna at the KBRTF (BCH, 2002). The colony is one of only two red-footed booby colonies in the main Hawaiian Islands; the population at Ulupau Crater numbers at least 3,000 boobies (Drigot and SRGII, 2001; NAVFACHI, 2006;
Section 4
Conceptual Site Model
Marine Corps Installations Command Range Environmental Vulnerability Assessment 5-Year Report Marine Corps Base Hawaii
4-29
CSM Information Profiles – Natural Resources Profile
Information Needs
Information
Fauna (cont.) Tetra Tech, 2006). Laysan albatrosses also have been noted, though mostly during the “rainy” low fire risk months of November through February (BCH, 2002).
As noted, coral reefs support a very diverse range of organisms. By definition, reef-building corals are a keystone species of the ecosystem. A 2012 survey mapped the benthic communities within a 500-yard security buffer zone around the Mokapu Peninsula in which pristine coral reef resources were identified. During the survey, green sea turtles, herbivorous fishes, and noncoral macroinvertebrates also were observed (MCBH, 2012). Other marine fauna associated with coral reefs include cnidarians, worms, arthropods, mollusks, echinoderms, and reef fishes. Turtles, waterfowl (including migratory birds), and marine mammals are also notable fauna in marine waters off Hawaii (SRGII, 2002a).
Special status species
No federally or state-listed threatened or endangered species have been noted at Ulupau Crater (Drigot and SRGII, 2001; BCH, 2002; NAVFACHI, 2006; Tetra Tech, 2006). The red-footed booby and Laysan albatross are migratory seabirds and are protected under the Migratory Bird Treaty Act (MCBH, 1997). Because of the lack of suitable habitat at the crater, there is an active program to take albatrosses and their eggs to a reserve on the other side of Oahu, though such activity is relatively infrequent (Drigot and SRGII, 2001; Tetra Tech, 2006).
Of the myriad of marine species present in or known to travel through the waters around the KBRTF, there are several of special concern, including the threatened green sea turtle, the endangered hawksbill turtle, the endangered Hawaiian monk seal, and the endangered humpback whale (Drigot and SRGII, 2001; SRGII, 2002a; NAVFAC, 2006; Tetra Tech, 2006). False nesting attempts by the green sea turtle (i.e., the female turtle returns to the sea without digging or laying an egg) have been documented near the operational range area.
Potential Pathways and Receptors 4.1.8.
MC accumulated in the MC loading area could migrate to potential receptors via the following exposure pathways:
Surface water runoff, including sediment transport
Section 4 Conceptual Site Model
4-30
Marine Corps Installations Command Range Environmental Vulnerability Assessment 5-Year Report Marine Corps Base Hawaii
Surface water runoff, including sediment transport
Leaching to groundwater and subsequent groundwater flow
Exposure pathways considered in the REVA process include consumption of surface water and groundwater by off-range human receptors, as described in the REVA Reference Manual (HQMC, 2010). Other off-range exposure scenarios (e.g., soil ingestion, incidental dermal contact, bioaccumulation and food chain exposure) are not considered in the REVA process. In summary, the potential points of exposure for receptors of MC at the MCBH KBRTF include the following:
Marine water bodies (Kailua Bay and the Pacific Ocean) beyond the restricted 500-yard buffer surrounding the KBRTF that may be used by human receptors for recreational activities
The intertidal/littoral zone around the KBRTF, which receives drainage from the operational range area and contains ecological receptors
4.1.8.1. Surface Water and Sediment Pathway MC from MC loading areas at MCBH Kaneohe Bay potentially can be transported to surface water via runoff. Although the MC loading areas are located near the intertidal/littoral zone of marine environments, the MC loading areas are not impacted directly by tidal erosion because they are at higher elevations. The MC loading areas are on relatively steep slopes with vegetation densities that vary seasonally (high vegetation cover during the rainy season and low vegetation cover during the dry season). As a result, during rainstorms, the potential for surface runoff is high at the MC loading areas. The MC loading areas are located within Ulupau Crater. Surface water from the MC loading areas drains east directly into Kailua Bay.
Three of the four MC loading areas at MCBH Kaneohe Bay are located entirely or partially on a soil type that is classified as Rock Land, which generally has low erodibility. Rock Land soil near Ulupau Crater is composed of tuff substrate (SRGII, 2004). A small portion of the R-8 MC loading area and the entire area of the R-8A MC loading area are located on Makalapa clay, which has moderate erodibility. The overall soil erosion potential at two of the MC loading areas (HE Impact Area and Inert Impact Area) is estimated to be moderate, and the soil erosion potential at the R-8 MC loading area is estimated to be high. The erosion potential at these MC loading areas are the result of poor vegetation cover and steep slopes. The soil erosion potential at the R-8A MC loading area was estimated to be low mainly due to the structure of the SACON® range, which includes walls that prevent erosion and the escape of surface water and sediment. MC potentially can be transported to the unnamed intermittent stream located within the range boundary or the surrounding intertidal/littoral zone from soil through dissolution in runoff or erosion of soil and sediments.
Section 4
Conceptual Site Model
Marine Corps Installations Command Range Environmental Vulnerability Assessment 5-Year Report Marine Corps Base Hawaii
4-31
Dissolved MC transported in overland flow can infiltrate into the underlying tuff material, which is relatively permeable (SRGII, 2004). Through surface drainage, dissolved and soil-associated MC potentially can be transported to habitats containing ecological receptors located outside of the range. Outside of the KBRTF boundary, MC can be transported in surface water and sediment to aquatic habitats in the adjacent intertidal/littoral zone, including coral communities.
None of the surface waters within or around MCBH Kaneohe Bay are used as a source of drinking water. All drainages and surface water runoff from the MC loading areas ultimately drain off range to areas that have been documented to be associated with potential protected species. These include diverse marine organisms of concern (such as coral colonies) within the 500-yard buffer zone of the adjacent marine water bodies and species of marine animals that have been declared threatened (green sea turtle) or endangered (hawksbill turtle, Hawaiian monk seal, and humpback whale) in the waters off shore of MCBH Kaneohe Bay. However, these waters are tidally influenced and, thus, are subject to mixing with daily fluxes of a large volume of tidal water. The tidal mixing is expected to provide significant dilution of the water potentially containing MC. Exposures to human receptors are largely not anticipated because recreational uses near the MC loading areas are greatly restricted and the areas in which an exposure might occur are difficult to access. However, the potential for human exposure exists beyond the restricted 500-yard buffer zone, though exposures at this distance from the MC loading areas are unlikely to be significant.
4.1.8.2. Groundwater Pathway The shallow groundwater under the MC loading areas at Ulupau Crater is expected to be found just above mean sea level. The MC loading areas are set on sloped ground with varying elevations. For this reason, depth to groundwater at the MC loading areas is expected to be quite variable and dependent on the ground surface elevation. Rain falling on these areas could dissolve the MC on the ground surface as they infiltrate toward the water table.
Once the infiltrating water reaches the water table, it likely flows toward the ocean. There is no evidence of springs from the rocks or sediments above sea level, so the groundwater likely discharges to the ocean some distance from the shore. The locations of these discharges are unknown.
Discharges to the ocean are expected to be quickly diluted by tidal influences and currents before they can have any effect on human health or the ecology. If the discharging water does have high MC concentrations, it could affect benthic organisms in the sediment as it discharges. Furthermore, all four MC loading areas are located just inland of coral reef systems (USFWS, 2008). These sensitive environments also could be affected by MC if groundwater discharges nearby.
Section 4 Conceptual Site Model
4-32
Marine Corps Installations Command Range Environmental Vulnerability Assessment 5-Year Report Marine Corps Base Hawaii
Because deep groundwater occurs in a dike-confined aquifer setting (i.e., within the basaltic bedrock previously described) at a depth of approximately 300 to 1,000 feet below mean sea level and is expected to be under artesian pressure beneath Ulupau Crater, downward flow from the water table to deeper groundwater zones is believed to be unlikely. As there are no production wells at MCBH Kaneohe Bay, there are no human receptors for any potential groundwater MC impacts.

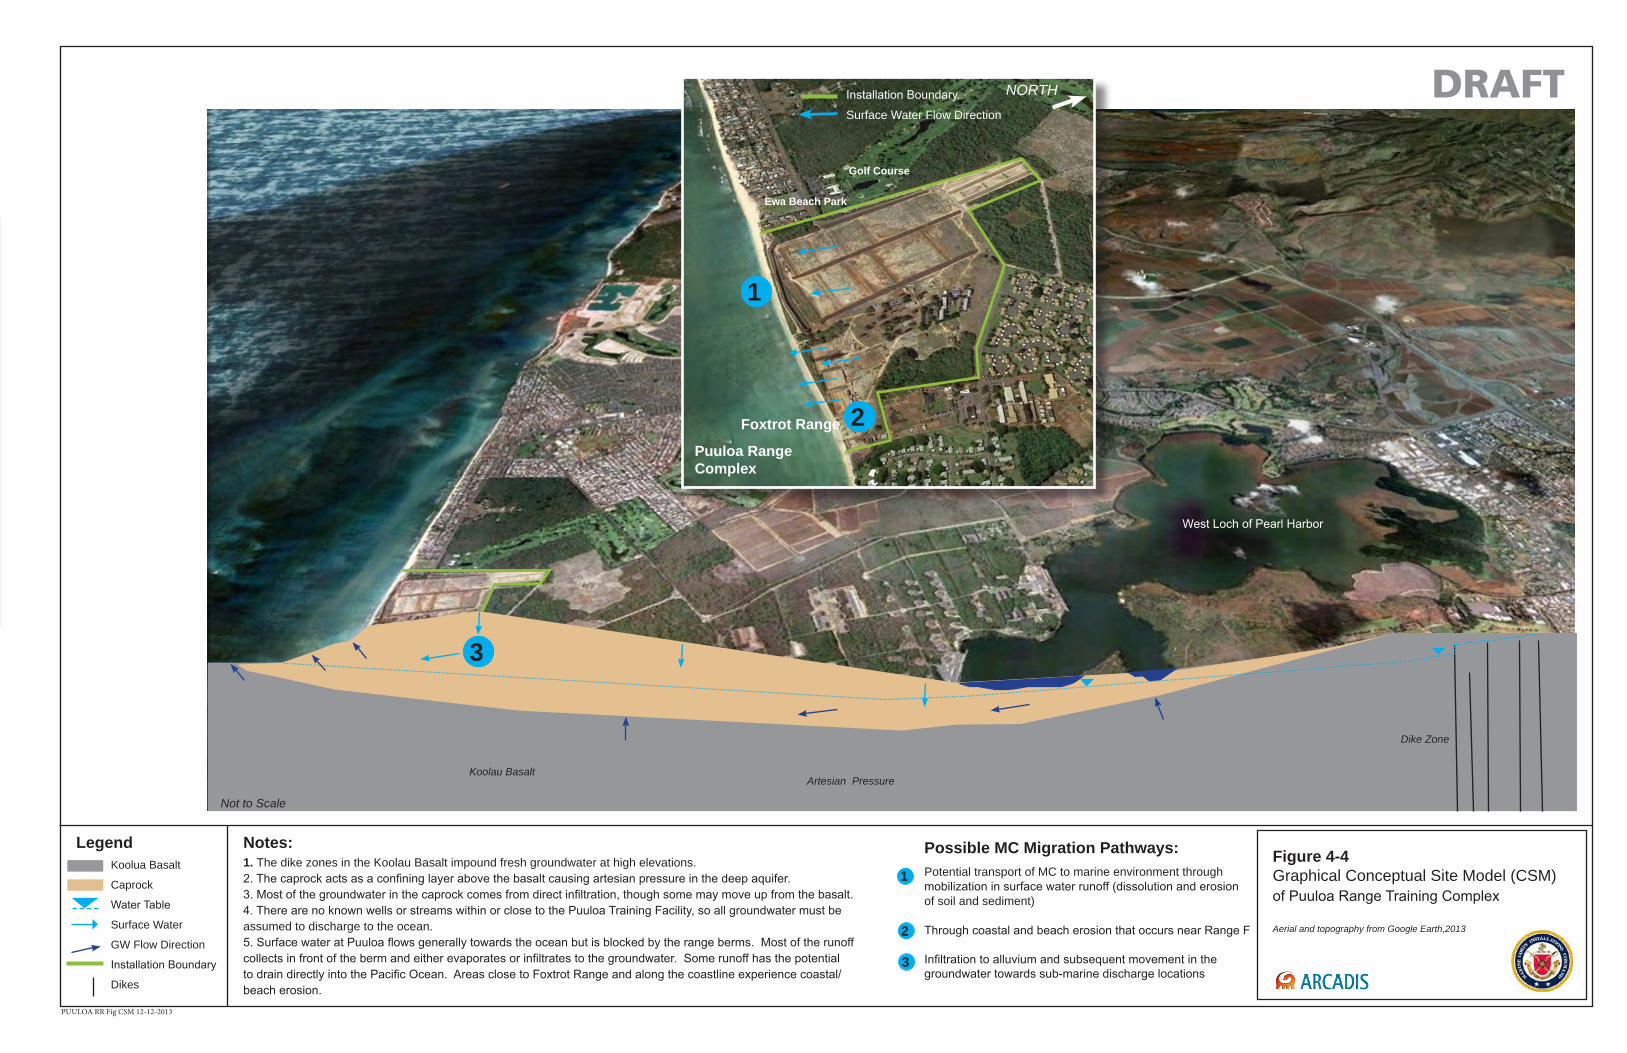
Notes:1. The dike zones in the Koolau Basalt impound fresh groundwater at high elevations.2. The caprock acts as a confining layer above the basalt causing artesian pressure in the deep aquifer.3. Most of the groundwater in the caprock comes from direct infiltration, though some may move up from the basalt.4. There are no known wells or streams within or close to the Puuloa Training Facility, so all groundwater must be assumed to discharge to the ocean.5. Surface water at Puuloa flows generally towards the ocean but is blocked by the range berms. Most of the runoff collects in front of the berm and either evaporates or infiltrates to the groundwater. Some runoff has the potential to drain directly into the Pacific Ocean. Areas close to Foxtrot Range and along the coastline experience coastal/beach erosion.
Figure 4-4Graphical Conceptual Site Model (CSM)of Puuloa Range Training Complex
Aerial and topography from Google Earth,2013
PUULOA RR Fig CSM 12-12-2013
3
NORTH
West Loch of Pearl Harbor
Artesian PressureKoolau Basalt
Dike Zone
Koolua Basalt
Caprock
Water Table
Surface Water
GW Flow Direction
Installation Boundary
Dikes
Legend Possible MC Migration Pathways:
Potential transport of MC to marine environment through mobilization in surface water runoff (dissolution and erosion of soil and sediment)
Through coastal and beach erosion that occurs near Range F
Infiltration to alluvium and subsequent movement in thegroundwater towards sub-marine discharge locations
2
1
3
DRAFT
Not to Scale
1
Surface Water Flow Direction
Installation Boundary
Puuloa Range Complex
2Foxtrot Range
NORTH
Ewa Beach Park
Golf Course

Section 4
Conceptual Site Model
Marine Corps Installations Command Range Environmental Vulnerability Assessment 5-Year Report Marine Corps Base Hawaii
4-35
4.2. Puuloa Range Training Facility
Facility Profile 4.2.1.
CSM Information Profiles – Installation Profile
Information Needs
Information
Facility location PRTF is located on the leeward (southern) Oahu coast near Pearl Harbor, at the eastern edge of the Ewa Plain (MCBH, 2011).
Date of facility establishment
Military use of the area was established in the early 1900s (USACE, 2001a). The Naval Rifle Range at Puuloa Point was commissioned in December 1904. The Marine Corps established the U.S. Military Reservation Puuloa in 1915 (Earth Tech, 2000).
Facility area and layout
PRTF is a 137-acre facility. currently consisting of six SARs, an armory, ammunition storage facilities, indoor and outdoor classrooms, billeting space, and recreational facilities (Earth Tech, 2000). The six ranges are oriented from north to south, with the firing direction to the south toward the Pacific Ocean. The installation is bounded as follows:
North – Federal Aviation Administration (FAA) transmitter facility
West – Private residential properties, golf course
South – Pacific Ocean
East – Military housing (Iroquois Point Housing Area), elementary school, public works center
Facility mission The primary mission of PRTF is to provide marksmanship training support for MCB Hawaii. In addition to the Marines, some Navy and Army units use the ranges for qualification activities (MCBH, 2006; NAVFACHI, 2006). Nonmilitary law enforcement personnel also use the ranges for training purposes.
Operational Range Profile 4.2.2.
CSM Information Profiles – Operational Range Profile
Information Needs
Information
MC loading areas
Because HE munitions are not used, HE MC loading areas were not delineated at PRTF. Earthen berms at each of the SARs represent the greatest concentration of spent small arms ammunition at the complex.
Range names The current ranges at MCB Hawaii PRTF are Alpha Range, Bravo Range, Charlie Range, Delta Range, Echo Range, and Foxtrot Range.
Section 4 Conceptual Site Model
4-36
Marine Corps Installations Command Range Environmental Vulnerability Assessment 5-Year Report Marine Corps Base Hawaii
CSM Information Profiles – Operational Range Profile
Information Needs
Information
Date of range establishment
Although the designations of the SARs have changed over time, the locations of the active ranges have been used in the same manner since military administration of the complex began. Alpha Range and Bravo Range have been present since the 1920s, while the area where Charlie Range, Delta Range, Echo Range, and Foxtrot Range are located has been used since the 1930s (USACE, 2001a).
Range design and use
All six SARs are situated in a line adjacent to one another along the southern coastline of PRTF. Alpha Range is a KD rifle range; various rifle ammunition is authorized at this range. There are six firing lines at 100, 200, 300, 500, 600, and 1,000 yards and 40 target positions at this range. The 1,000-yard firing line was installed at Alpha Range since the baseline assessment to increase long-range rifle training capabilities at PRTF. The impact berm is shared with Bravo Range, which is adjacent to Alpha Range.
Bravo Range is a KD rifle range and is one of the most heavily used SARs at MCB Hawaii, as it is the main range used for qualification. Service rifle ammunition is the most common ammunition expended at this range. Pistol and shotgun ammunition is also permitted at Bravo Range. There are six firing lines at 25, 100, 200, 300, 500, and 600 yards and 60 target positions at this range.
Charlie Range, Delta Range, and Echo Range are KD pistol ranges designed to support individual small arms training and qualification. Pistol, shotgun, and rifle ammunition are supported at these ranges (MCBH, 2010a). There are five firing lines marked at 3, 7, 15, 25, and 50 yards and 25 pneumatic turning target positions at Charlie Range. There are three firing lines marked at 7, 15, and 25 yards and 20 pneumatic turning target positions at Delta Range. Echo Range is equipped with five firing lines marked at 3, 5, 10, 25, and 50 yards and 30 pneumatic turning target positions.
Foxtrot Range is a KD pistol range with similar design and training features as Echo Range. This range is also one of the most heavily used ranges at PRTF. According to Range Control personnel, it facilitates approximately 80% of annual sustainment training for MCB Hawaii personnel. Pistol, shotgun, and rifle ammunition are supported at this range (MCBH, 2010a). Foxtrot Range is equipped with five firing lines marked at 3, 7, 15, 25, and 50 yards and 40 pneumatic turning target positions.
Section 4
Conceptual Site Model
Marine Corps Installations Command Range Environmental Vulnerability Assessment 5-Year Report Marine Corps Base Hawaii
4-37
CSM Information Profiles – Operational Range Profile
Information Needs
Information
Range security
PRTF is fenced on three of the four sides—north, west, and east. The southern property boundary, located along the Pacific Ocean, is not fenced. The fence does not extend all the way to the Pacific Ocean. Security guards are posted during firing sessions to prevent trespassers from entering the downrange areas (NAVFACHI, 2006; HIES, 2007). Two gates control entry to the complex. The first gate is at the Iroquois Point housing facility entrance and is available for access 24 hours a day, 7 days a week. The second gate leads to the ranges and is secured at all times, except when the ranges are in use; it then can be accessed with an escort by MCB Hawaii personnel (HIES, 2007).
The SDZ for PRTF extends over the Pacific Ocean and falls within the Pearl Harbor Naval Defensive Sea Area. The general public is not allowed entry into this area without permission (Earth Tech, 2000; NAVFACHI, 2006).
Military munitions usage
PRTF contains six SARs (two rifle ranges and four pistol ranges) that are equipped with a combined total of 100 firing lanes for KD rifle training and 48 lanes for KD pistol training (MCBH, 2006). No HE munitions currently are used at the range complex.
MC
MC are limited to lead for the SAR projectiles used at PRTF. No tracers or pyrotechnics are allowed on the ranges (NAVFACHI, 2006). Metallic lead (such as recently fired, unweathered bullet and shot) generally has low chemical reactivity, has low solubility in water, and is relatively immobile in the environment under most ambient or everyday conditions. However, a portion of lead deposited on a range can become mobile under certain geochemical and hydrologic conditions.
Two sampling events examining the presence of lead at the complex were conducted in 1999. The first sampling event, conducted between 9 and 12 October 1999, focused on areas outside the active ranges (ERDC, n.d.; ERDC, 2003). The second sampling event, conducted between 18 and 21 October 1999, focused on characterizing lead concentrations at the active ranges (Earth Tech, 2000).
The first event involved collection of samples from various locations and analysis for lead, cadmium, chromium, copper, and zinc. These locations and sample media included:
beach sampling (soil and plant);

Section 4 Conceptual Site Model
4-38
Marine Corps Installations Command Range Environmental Vulnerability Assessment 5-Year Report Marine Corps Base Hawaii
CSM Information Profiles – Operational Range Profile
Information Needs
Information
MC (cont.)
the area east of Foxtrot Range (soil);
the area between Bravo and Charlie Ranges (soil);
the floor, berm, and beach side of a former range in a wooded area, located west of Alpha Range (soil);
the Pacific Ocean (sediment, water); and
background (soil).
Eight soil samples from three locations (up to 16 inches in depth) were collected near a soccer field, east of Bravo Range and north of Charlie Range through Foxtrot Range, to determine the background metals concentrations. The concentrations of lead ranged from 4.4 to 18.0 milligrams per kilogram (mg/kg), with an average of 9.0 mg/kg. Soil samples collected from the beach, the area east of Foxtrot Range, and the beach side and floor of the former range west of Alpha Range were between the background levels and the state direct contact lead concentration soil cleanup value of 400 mg/kg. The average lead concentration in plants sampled along the shoreline was 45.23 mg/kg, with a maximum concentration of 122.0 mg/kg dry weight. The average lead concentration in beach soils was 17.20 mg/kg, with a maximum concentration of 95.8 mg/kg, while the average lead concentration in samples collected from the ocean floor was 3.4 mg/kg, with a maximum concentration of 9.9 mg/kg.
One soil sample collected between Bravo and Charlie Ranges had a detected lead concentration 622 mg/kg at the soil surface (0 to 6 inches). The lead concentration decreased rapidly with depth (187 mg/kg at a depth of 6 inches and 51.3 mg/kg at 12 inches).
In the second study, four surface soil samples were collected, one each from Bravo Range, Charlie Range, Echo Range, and Foxtrot Range. The study describes Bravo Range and Echo Range as the most heavily used ranges, Charlie Range as less frequently used, and Foxtrot Range as recently mined for bullets earlier in the same year (1999). Samples were collected from the impact berms at depths of up to 6 inches. Bullets and large particles were removed from each sample by sieving prior to sample packaging. The samples were analyzed for total antimony, arsenic, copper, lead, toxicity characteristic leachate procedure (TCLP), pH, total organic carbon (TOC), and cation exchange capacity (CEC). Key sampling results are summarized below.
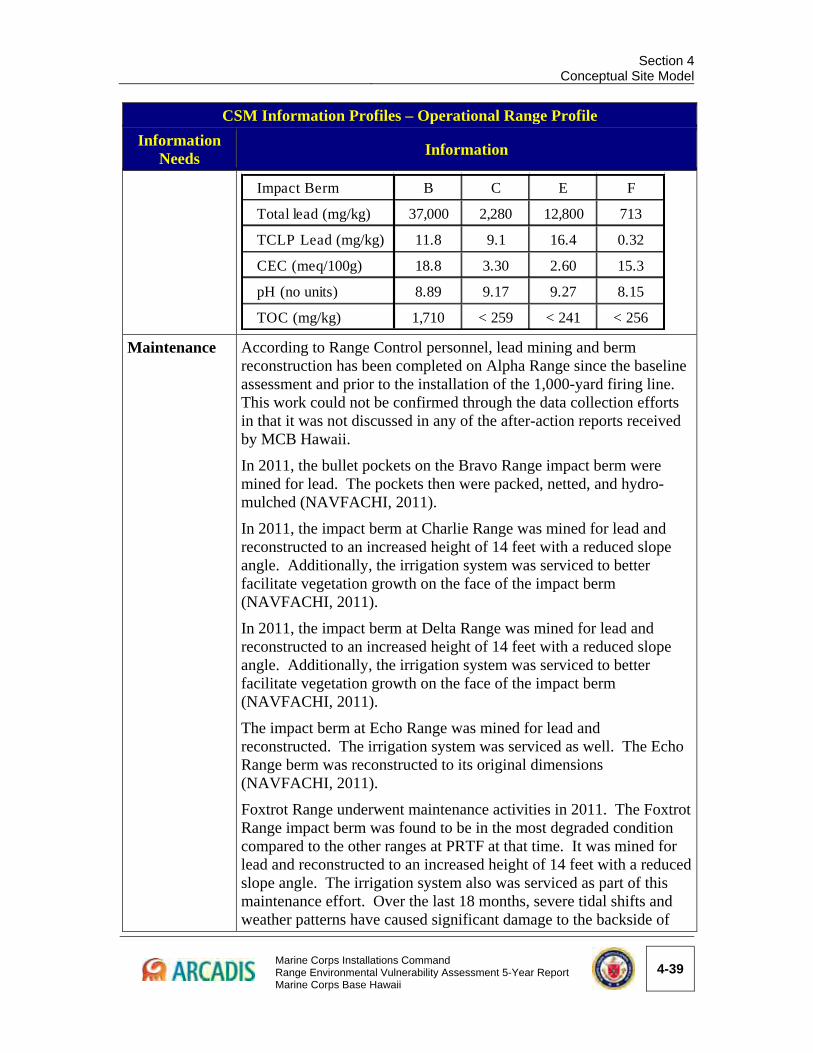
Section 4
Conceptual Site Model
Marine Corps Installations Command Range Environmental Vulnerability Assessment 5-Year Report Marine Corps Base Hawaii
4-39
CSM Information Profiles – Operational Range Profile
Information Needs
Information
Maintenance
According to Range Control personnel, lead mining and berm reconstruction has been completed on Alpha Range since the baseline assessment and prior to the installation of the 1,000-yard firing line. This work could not be confirmed through the data collection efforts in that it was not discussed in any of the after-action reports received by MCB Hawaii.
In 2011, the bullet pockets on the Bravo Range impact berm were mined for lead. The pockets then were packed, netted, and hydro-mulched (NAVFACHI, 2011).
In 2011, the impact berm at Charlie Range was mined for lead and reconstructed to an increased height of 14 feet with a reduced slope angle. Additionally, the irrigation system was serviced to better facilitate vegetation growth on the face of the impact berm (NAVFACHI, 2011).
In 2011, the impact berm at Delta Range was mined for lead and reconstructed to an increased height of 14 feet with a reduced slope angle. Additionally, the irrigation system was serviced to better facilitate vegetation growth on the face of the impact berm (NAVFACHI, 2011).
The impact berm at Echo Range was mined for lead and reconstructed. The irrigation system was serviced as well. The Echo Range berm was reconstructed to its original dimensions (NAVFACHI, 2011).
Foxtrot Range underwent maintenance activities in 2011. The Foxtrot Range impact berm was found to be in the most degraded condition compared to the other ranges at PRTF at that time. It was mined for lead and reconstructed to an increased height of 14 feet with a reduced slope angle. The irrigation system also was serviced as part of this maintenance effort. Over the last 18 months, severe tidal shifts and weather patterns have caused significant damage to the backside of
Impact Berm B C E F
Total lead (mg/kg) 37,000 2,280 12,800 713
TCLP Lead (mg/kg) 11.8 9.1 16.4 0.32
CEC (meq/100g) 18.8 3.30 2.60 15.3
pH (no units) 8.89 9.17 9.27 8.15
TOC (mg/kg) 1,710 < 259 < 241 < 256
Section 4 Conceptual Site Model
4-40
Marine Corps Installations Command Range Environmental Vulnerability Assessment 5-Year Report Marine Corps Base Hawaii
CSM Information Profiles – Operational Range Profile
Information Needs
Information
Maintenance (cont.)
the impact berm in the form of heavy erosion. There is currently discussion among MCB Hawaii and Range Control personnel regarding the possibility of either moving the range northward or installing a bullet trap to prevent the impact berm from eroding into the ocean.
Engineered controls
Each range at PRTF has a backstop berm, most of which have been reconstructed since the baseline assessment. Side berms provide additional projectile containment and safety factors. A 16-foot block wall was installed in the mid-1990s on the top of the impact berms of Alpha and Bravo ranges to reduce the potential deposition of lead projectiles into the Pacific Ocean (Earth Tech, 2000; ERDC, 2003; HIES, 2007).
Other features In addition to the six SARs at PRTF, there are also administrative buildings, a fitness center, recreation center, and bachelor enlisted quarters for up to 160 temporary personnel. Generally, personnel are assigned to the complex for 2-week periods during requalification (Drigot and SRGII, 2001; NAVFACHI, 2006).
Physical Profile 4.2.3.
CSM Information Profiles – Physical Profile
Information Needs
Information
Climate
The climate of the island of Oahu is classified as temperate oceanic and has very little variation in temperature, either seasonally or daily (EES, 2005). The warmest month is generally August, with monthly average high and low temperatures of 89°F and 71°F, respectively. In February, the coolest month, the monthly average high temperature is 81°F and the low is 62°F (NAVFACHI, 2006).
Located on the leeward side of Oahu, PRTF receives less rainfall than either the windward coast or the mountainous areas of the island. Reported average rainfall is about 20 in/yr (Earth Tech, 2000; NAVFACHI, 2006; HIES, 2007; Oki, 1998). Despite the lack of variation in temperature with season, precipitation varies significantly with the season. One report indicates rainfall near Pearl Harbor at 4 inches/month in the winter and 1 inch/month in the summer (EES, 2005).
Winds on Oahu are usually trade winds from the northwest.
Section 4
Conceptual Site Model
Marine Corps Installations Command Range Environmental Vulnerability Assessment 5-Year Report Marine Corps Base Hawaii
4-41
CSM Information Profiles – Physical Profile
Information Needs
Information
Climate (cont.)
However, Kona Winds are common in the winter. These wind patterns are from the south and have high humidity, enabling them to bring large amounts of rainfall to the south side of the island (EES, 2005).
Pan evaporation is over 80 in/yr in the Pearl Harbor area, the largest value on the island (EMC, 1991; Oki, 1998).
Elevation The elevations at the installation range from 0 to 10 feet amsl (NAVFACHI, 2006).
Topography and geologic features
The island of Oahu was formed by the basaltic lava flows from the eruptions of the Waianae Volcano (west Oahu) and the subsequent eruptions of the Koolau Volcano (east Oahu). The Schofield Plateau was formed when the Koolau lava flows banked against the older Waianae Range and both ranges began eroding. As the sea level rose and fell for the next millennia or two, coastal plains were built from emerged reefs, marine deposits, and terrestrial deposits from the eroding volcanoes (Luecker et al., 1984; Earth Tech, 2006b). PRTF is located on the coastal plain at the south end of the Schofield Plateau (Earth Tech, 2006b; Drigot and SRGII, 2001).
During the Neogene, a series of dikes intruded into the Koolau basalts. With a hydraulic conductivity generally lower than the surrounding rock, dikes act as barriers to groundwater flow, resulting in the containment of high-level groundwater in the mountains of Oahu (EMC, 1991; Takasaki et al., 1969).
Stratigraphy
The basement rock at Puuloa is Koolau basalt (Earth Tech, 2006b). Coastal deposits consisting of terrestrial alluvium, marine sediments, and calcareous reef deposits overlie the basement rock forming a caprock. This caprock layer is about 1,000 feet thick near the entrance to Pearl Harbor. Oki (1998) estimates the caprock thickness at Puuloa at greater than 800 feet. The caprock thickness is greatest at the coast and thins inland. It extends more than 8 miles out to sea and 3 to 4 miles inland (Oki, 1998).
The Ewa Plain is a low, flat portion of land at the south end of the Schofield Plateau. It is located west of Pearl Harbor and is composed of limestone reef material, marine deposits, and riverine deposits (EES, 2005). The Ewa Plain is underlain by contiguous limestone unit composed of predominantly Porites coral and Nullipores in upright growth formation (Earth Tech, 2006b).
Section 4 Conceptual Site Model
4-42
Marine Corps Installations Command Range Environmental Vulnerability Assessment 5-Year Report Marine Corps Base Hawaii
CSM Information Profiles – Physical Profile
Information Needs
Information
Soil and vadose zone characteristics
The soil at Puuloa is coral outcrop and calcareous sand with 10%–20% red soil from volcanic erosion found in cracks and depressions (DoN, 1981; NAVFACHI, 2006; Drigot and SRGII, 2001).
This soil does not hold water well, and grass does not grow easily at the site. Chemical erosion from the interaction between rainwater and the carbonate is occurring, indicating limited runoff. Most rainwater is expected to percolate to the subsurface, reaching the shallow groundwater system (DoN, 1981; Earth Tech, 2000).
Erosion potential
The entire PRTF is located on a soil type that has a low soil erodibility factor of 0.02 (USDA NRCS, 2008). The complex is located on flat topography where slope throughout the range is less than 1%. Vegetation cover can vary between the dry and wet seasons, where a denser vegetation cover can grow following a wet season versus a dry one. However, in most cases, the complex has a sparse vegetation cover. This is especially typical at most of the target areas of the SARs.
Over the last 18 months, severe tidal shifts and weather patterns have caused significant damage to the backside of the impact berm at Foxtrot Range in the form of substantial erosion. There is currently discussion among MCB Hawaii and Range Control personnel regarding the possibility of either moving the range northward or installing a bullet trap to prevent the impact berm from eroding into the ocean. Additionally, the impact berm that Alpha Range and Bravo Range share has been revegetated since the baseline assessment.
Potential MC release mechanisms
Lead deposited in the soil at the impact berms and/or range floor can leach from spent bullets. This could lead to possible migration of lead to low-lying areas at the base of the impact berms and eventually to shallow groundwater (Earth Tech, 2000). Soil and lead particles also can be transported by storm water into low lying areas or the Pacific Ocean. This pathway may be enhanced when soil erosion occurs on the impact berms, particularly due to the lack of vegetation present on the impact berms.
It is noted that limited studies of lead at PRTF have been conducted previously. This includes a varied sampling event conducted between 9 and 12 October 1999, focused on areas immediately outside the current ranges (ERDC, n.d.; ERDC, 2003) and a soil sampling event, conducted between 18 and 21 October 1999, focused on characterizing lead concentrations at the impact berms (Earth
Section 4
Conceptual Site Model
Marine Corps Installations Command Range Environmental Vulnerability Assessment 5-Year Report Marine Corps Base Hawaii
4-43
CSM Information Profiles – Physical Profile
Information Needs
Information
Tech, 2000). Key data from these studies may be found in Section 7.4.
Surface Water Profile 4.2.4.
CSM Information Profiles – Surface Water Profile
Information Needs
Information
Surface water drainage
There are no streams located at PRTF. Overland flow that results from storm water runoff within the complex drains south and discharges into the Pacific Ocean, which borders the southern boundary of PRTF. Ewa Beach is located to the west, and Pearl Harbor is located northeast of the facility. The lower tidal creek of Pearl Harbor is approximately 900 feet from the complex. As defined by the current Flood Insurance Rate Map, the southwestern corner of PRTF is within the coastal flood zone (Drigot and SRGII, 2001). The remaining area of the complex is described as having “undetermined, but possible flood hazards” (Drigot and SRGII, 2001).
The ranges generally drain south and discharge directly into the Pacific Ocean. However, because Alpha and Bravo Ranges are located on very flat areas (slope ranging from 0 to 0.05%), a large portion of the surface water runoff collects into pools of water and evaporates or infiltrates into the subsurface before it reaches the ocean (Herman, 2008). Because Echo and Foxtrot Ranges are located on steeper topography (slopes of the ranging from 0.1% to 0.2%), small portion of the surface water runoff from within these ranges is likely to drain into the ocean (with the exception of the areas directly in front of the berms, where runoff would collect). The target areas of all the SARs within PRTF potentially are exposed to tidal flushing from the ocean.
Hydrological units and sub-watershed areas
PRTF is located within the Kaloi subwatershed area (State of Hawaii, 2008). This subwatershed borders the Honouliuli subwatershed area on the east. The Kaloi and Honouliuli subwatersheds are located within the central Oahu watershed area. The Kaloi subwatershed (located within the Ewa District subwatershed area) drains into the Pacific Ocean on the southwestern shoreline (Oceanit Townscape, 2007). There is no physical drainage in the portion of the Kaloi subwatershed area where PRTF is located. This subwatershed area has no relevance to the drainage characteristics of PRTF. The main drainage within the Honouliuli subwatershed, which borders the Kaloi subwatershed area,
Section 4 Conceptual Site Model
4-44
Marine Corps Installations Command Range Environmental Vulnerability Assessment 5-Year Report Marine Corps Base Hawaii
CSM Information Profiles – Surface Water Profile
Information Needs
Information
Hydrological units and sub-watershed areas (cont.)
is the Honouliuli nonperennial stream. This stream drains into Pearl Harbor (Oceanit Townscape, 2007). The Kaloi subwatershed area, which encompasses PRTF, extends beyond the facility boundary. The size of the subwatershed is approximately16,815 acres. The impact areas for all six SARs are located within this subwatershed area. Locations of subwatersheds and streams are shown in Figure 4-5.
Kaloi sub-watershed area
The majority of the subwatershed lies outside of the PRTF. There are no perennial streams within the Kaloi subwatershed. These dry streams are known as gulches where water only flows following a rainfall event. These gulches potentially can produce a flash flood after an intense rainfall event. The Kaloi Gulch is the main drainage within the Kaloi subwatershed area. This gulch flows from north to south. Flow ceases approximately 1,800 feet north of the Pacific Ocean. Other gulches in this subwatershed include the Hunehune, Makalapa, Makakilo, Awanui and Palalai Gulches (Oceanit Townscape, 2007). In addition, ditches are present in the southeastern and southwestern parts of the subwatershed. Two of the ditches drain directly into the ocean. None of these dry streams or ditches drain PRTF.
Known water and sediment quality
The Hawaii Department of Health (2012) lists Ewa Beach, bordering PRTF on the southwest, and Pearl Harbor, which is located northwest of the training area, as impaired water bodies under the Clean Water Act 303(d). Both waters are listed impaired for chlorophyll and nutrients, including total nitrogen, nitrate and nitrite nitrogen, and total phosphorus. In addition, Ewa Beach is listed impaired for ammonium nitrogen, enterococci, and turbidity, and Pearl Harbor is listed impaired for suspended solids and polychlorinated biphenyls. These impaired waters are not associated with range activities.
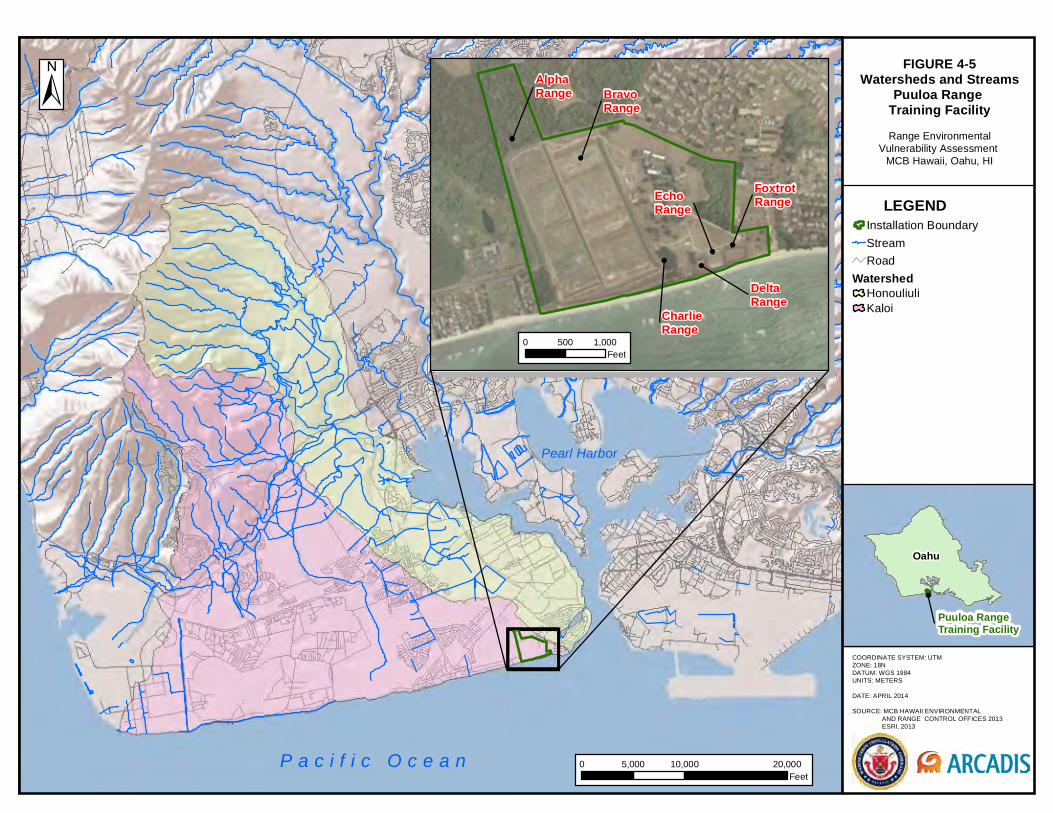
P a c i f i c O c e a n
Pearl Harbor
COORDINATE SYSTEM: UTM ZONE: 18NDATUM: WGS 1984UNITS: METERS
DATE: APRIL 2014
SOURCE: MCB HAWAII ENVIRONMENTAL AND RANGE CONTROL OFFICES 2013 ESRI, 2013
FIGURE 4-5Watersheds and Streams
Puuloa Range Training FacilityRange Environmental
Vulnerability Assessment MCB Hawaii, Oahu, HI
LEGENDInstallation Boundary
Stream
Road
WatershedHonouliuliKaloi
Puuloa RangeTraining Facility
0 10,000 20,0005,000Feet
AlphaRange Bravo
Range
DeltaRange
FoxtrotRangeEcho
Range
CharlieRange
0 1,000500Feet
Oahu

Section 4
Conceptual Site Model
Marine Corps Installations Command Range Environmental Vulnerability Assessment 5-Year Report Marine Corps Base Hawaii
4-45
CSM Information Profiles – Surface Water Profile
Information Needs
Information
Known water and sediment quality (cont.)
The impaired parts of Pearl Harbor are classified as high priority for initiating TMDL development within the monitoring and assessment cycle.
During surface water and sediment sampling conducted in the Pacific Ocean down gradient of PRTF in October 1999 (Earth Tech, 2000), the average lead concentration in sediment in the ocean was measured to be 3.4 mg/kg, with a maximum concentration of 9.9 mg/kg. These concentrations are below the DoD marine sediment screening value for lead of 30.2 mg/kg (Appendix A). The lead concentration in the water was measured to be below detectable levels.
Designated beneficial uses
There are no permanent streams or jurisdictional wetlands within the boundaries of PRTF (Drigot and SRGII, 2001). The offshore marine environment that borders the southern boundary of the complex is an important resource used for recreation and subsistence fishing, as well as limu (edible seaweed) gathering by the local population (Drigot and SRGII, 2001). The Pacific Ocean south of the facility is classified as a Class A marine water by the State of Hawaii. The objective of this designation is to protect the water for recreational purposes and aesthetic enjoyment (NAVFACHI, 2006).
Surface water around the facility is not used for drinking. The City of Honolulu supplies the drinking water at the complex and the whole of MCB Hawaii. According to the BWS for the City and County of Honolulu (2008), almost 100% of the municipal water supply in Oahu is groundwater. The central Oahu watershed area, which contains the Kaloi subwatershed, is Honolulu BWS’s largest source of potable water, providing approximately 98 million gallons of water per day (Oceanit Townscape, 2007). Drainage from PRTF does not impact any of the potable sources within the watershed, as overland flow within the facility is toward the Pacific Ocean.
Supported habitats/ ecosystems
There are limited ecological communities that inhabit PRTF. A few scattered native vegetation species exist on the beach (Drigot and SRGII, 2001). These vegetation species potentially are supported by water from the Pacific Ocean shoreline bordering the southern range boundary. There is a variety of fish that exists in the adjacent offshore marine environment. Fishing is one of the recreational activities that take place in the offshore marine environment. In addition, several indigenous migratory shorebirds, including wandering tattler, ‘ulili, ruddy turnstone, akekeke, sanderling, and hunakai, frequently are seen on the adjacent shoreline (Drigot and SRGII, 2001).

Section 4 Conceptual Site Model
4-46
Marine Corps Installations Command Range Environmental Vulnerability Assessment 5-Year Report Marine Corps Base Hawaii
CSM Information Profiles – Surface Water Profile
Information Needs
Information
Gaining or losing streams
There are no streams located within PRTF. Surface water runoff within PRTF would drain directly into the ocean. However, a large portion of the surface water runoff is likely to infiltrate into the underlying coral outcrop soil, a well to excessively drained soil that consists of coral or cemented calcareous sand, with 10% to 20% red soil of a volcanic base in cracks and depressions (USDA NRCS, 2008; Drigot and SRGII, 2001). All of PRTF is underlain by coral outcrop soils. Due to the presence of this highly permeable soil type, the amount of rainfall recharging the groundwater is greater than the amount of overland flow running over the surface to the ocean (Oceanit Townscape, 2007).
Surface water collection points
There are no active potable water storage reservoirs within or around PRTF. There are also no natural or man-made surface water collection points within the boundaries of the complex. However, there are five golf-course ponds located just outside of the complex. These golf-course ponds are located west and northwest of the complex, up gradient of the MC loading areas. The Pacific Ocean receives drainage from the ranges.
Groundwater Profile 4.2.5.CSM Information Profiles – Groundwater Profile
Information Needs
Information
Groundwater basins
PRTF is part of the Pearl Harbor Aquifer Sector and the Waipahu-Waiawa Aquifer System (Hawaii, 2008). See Figure 4-3 for the aquifer sectors and systems on Oahu. The State Commission on Water Resources Management divides the island’s groundwater into sectors and systems as management tools only, and these divisions do not imply non-communication or hydraulically separate aquifers. In general, aquifer sectors define large geologic barriers, while aquifer systems are defined by hydraulic conductivity zones (Oceanit Townscape, 2007; SRGII, 2002b).
Designated beneficial uses
All of PRTF is located seaward of the Hawaii UIC Line, indicating that it is not a drinking water source. The groundwater landward of the UIC Line is preserved for drinking water use by preventing wastewater injections to the groundwater (SDWB, 2008).
Groundwater There are no groundwater wells on PRTF. There are no known wells
Section 4
Conceptual Site Model
Marine Corps Installations Command Range Environmental Vulnerability Assessment 5-Year Report Marine Corps Base Hawaii
4-47
CSM Information Profiles – Groundwater Profile
Information Needs
Information
supply wells in the area. Due to the closeness of the area to the ocean, the groundwater is believed to be brackish to saline and is unsuitable for human use. Thus, the presence of domestic or small commercial/industrial wells near the facility is highly unlikely. Drinking water is obtained from the city/county distribution system (NAVFACHI, 2006).
Recharge source(s)
Recharge to the basaltic aquifer under PRTF comes from rainfall in the Koolau Mountains, where precipitation is much higher than in the coastal areas. The caprock groundwater at Puuloa is recharged by local rainfall (EES, 2005; Oceanit Townscape, 2007). Annual recharge at Puuloa is estimated at less than 10 inches (Oki, 1998).
Porous or fracture flow
Based on the geology, groundwater movement is expected to flow through porous media in the caprock, although no data were available to confirm this. Regional well data indicate that flow is generally toward the ocean, as expected in an island environment (USGS, 2008; USGS, 1990).
Depth to groundwater
Groundwater in the caprock is usually found at 1–3 feet amsl (Oki, 1998) and will be tidally influenced close to the ocean. Since PRTF is so close to the ocean, the low end of that range is expected. The head is likely to be greatly affected by the tide.
The deeper Koolua basaltic aquifer found below the caprock is confined, under artesian pressure, and heads are expected to be 15–20 feet amsl (Wil Chee, 2004).
Gradient and flow velocity
Groundwater elevation is expected to be slightly above sea level, as shown by a single well located 2000 feet from the coastline with an average head of 2 feet amsl (USGS, 2008; USGS, 1990). At similar locations close to the coast, groundwater is likely to be tidally influenced.
The maximum groundwater velocity in the caprock was estimated to be approximately 0.00013 feet/day. This was estimated based on the assumption that the maximum groundwater hydraulic gradient in the caprock is equivalent to the estimated gradient in the basalt of 0.001. Also a hydraulic conductivity value of approximately 0.5 feet/day for the caprock (EMC, 1991; Oki, 1998) and an effective porosity value for the alluvium of 0.26 were used in estimating the groundwater velocity.
Known water quality
Inland of PRTF, the caprock water is a significant resource for golf courses, developments, and crop irrigation. Chloride concentrations
Section 4 Conceptual Site Model
4-48
Marine Corps Installations Command Range Environmental Vulnerability Assessment 5-Year Report Marine Corps Base Hawaii
CSM Information Profiles – Groundwater Profile
Information Needs
Information
characteristics Known water quality characteristics (cont.)
range from just above the drinking water limit to salt water levels. Near the shore, caprock groundwater is brackish to saline and in direct connection with the ocean (Oceanit Townscape, 2007). The basaltic groundwater quality is potable at high elevations but degrades as it reaches the shore (Oceanit Townscape, 2007).
Discharge location(s)
As there are no known groundwater wells or streams near PRTF, all groundwater is assumed to discharge to the ocean. The caprock is known to extend about 8 miles out to sea, and groundwater is expected to discharge to the ocean over this range (Oki, 1998). Groundwater in the Koolua basalt is expected to discharge to the ocean at the edge of the caprock. A small amount of the basaltic groundwater may flow upward into the caprock prior to discharge to the ocean.
Human Land Use and Exposure Profile 4.2.6.CSM Information Profiles – Human Land Use and Exposure Profile
Information Needs
Information
Land use
The primary land use at PRTF is small arms training. In addition to small arms training, the installation also is used for permanent and temporary housing for enlisted Marines and for recreation. When the SARs are not in use, a small recreation area located east of Foxtrot Range can be used for beach access for military personnel and their guests (Drigot and SRGII, 2001; NAVFACHI, 2006). An FAA transmitter complex is located north of the ranges.
Cultural resources have been examined extensively throughout MCB Hawaii, including PRTF. Much of the complex has been modified and leveled, so identified resources are limited (USACE, 2006).
Current human receptors Current human receptors (cont.)
Current human receptors may include installation personnel, installation residents, guests, and the general public who use the beach for recreational purposes. The Pacific Ocean and Oahu Beach are located south of the SARs. Ewa Beach Park, a public park owned by the County of Honolulu, is located within 500 feet of the installation boundary. The beaches in this area of Hawaii are used heavily for swimming, surfing, and fishing. The beach is one of the few beaches in Hawaii that provides edible seaweed used by the native Hawaiian population. Some of the more common edible algae are Limu Manauea (ogo), Limu Kohu, Limu Wawai ‘iole, Limu
Section 4
Conceptual Site Model
Marine Corps Installations Command Range Environmental Vulnerability Assessment 5-Year Report Marine Corps Base Hawaii
4-49
CSM Information Profiles – Human Land Use and Exposure Profile
Information Needs
Information
Aki’aki, and Limu Huluhulu Waena (Drigot and SRGII, 2001; NAVFACHI, 2006). The State of Hawaii classifies the Pacific Ocean in this portion of Hawaii as a Class A marine water. The objective of this designation is to protect the water for recreational purposes and aesthetic enjoyment (NAVFACHI, 2006).
Land use restrictions
The SDZ for PRTF falls within the Pearl Harbor Naval Defensive Sea Area. By federal law, the general public is not allowed into this area without specific permission.
In order to keep the SDZ within the bounds of the complex, MCB Hawaii restricts the use of Alpha Range to the 300-yard line due to its proximity to a residential community. Therefore, Bravo Range is the primary qualification range at Puuloa. Based on the proximity of residential properties on the western boundary of the complex, training is not permitted at night. Range hours are restricted to between 0700 and 1700 hours (NAVFACHI, 2006).
Natural Resources Profile 4.2.7.CSM Information Profiles – Natural Resources Profile
Information Needs
Information
Ecosystems All areas of the Hawaiian Islands are considered part of the Hawaiian Islands ecological province. Native plants can include a variety of community types, including shrubland, forest, and areas of bog and moss-lichen. The complex is situated on the leeward side of the island in the coastal lowlands, where the majority of shrubland occurs (USDA NRCS, 2008).
Vegetation The entire PRTF is composed of modified landscape with no notable ecological communities on or adjacent to the property. A few native species are located on the beach; the remaining vegetation consists of non-native trees, shrubs, and grasses (Drigot and SRGII, 2001).
Fauna Fauna (cont.)
Migratory shorebirds frequently are seen on the grassy areas and shorelines of the installation (Drigot and SRGII, 2001). These birds include the following:
Wandering tattler (‘ulili [Heteroscelus incanus])
Ruddy turnstone (‘akekeke [Arenaria interpres])
Sanderling (hunakai [Calidris alba])
Section 4 Conceptual Site Model
4-50
Marine Corps Installations Command Range Environmental Vulnerability Assessment 5-Year Report Marine Corps Base Hawaii
CSM Information Profiles – Natural Resources Profile
Information Needs
Information
Special status species
The Hawaiian short-eared owl (Asio flammeus sandwichensis), which is listed as endangered by the State of Hawaii on the island of Oahu, occasionally may use the open areas of the ranges for hunting. No other known federally or state-listed, proposed, or candidate threatened or endangered species are associated with the complex.
The green sea turtle (Chelonia mydas), a federally listed threatened species, has been observed in the waters off the installation (Drigot and SRGII, 2001).
Potential Pathways and Receptors 4.2.8.Lead accumulated in the MC loading area could migrate to potential receptors via the following exposure pathways:
Surface water runoff, including sediment transport
Leaching to groundwater and subsequent groundwater flow
Exposure pathways considered in the REVA process include consumption of surface water and groundwater by off-range human receptors, as described in the REVA Reference Manual (HQMC, 2010). Other off-range exposure scenarios (e.g., soil ingestion, incidental dermal contact, bioaccumulation and food chain exposure) are not considered in the REVA process. In summary, the potential points of exposure for receptors of lead at MCB Hawaii include the following:
Areas of the Pacific Ocean beyond the restricted Pearl Harbor Naval Defensive Sea Area that may be used by human receptors for recreational activities
The southern intertidal/littoral zone, which receives drainage from the operational range area and contains potential ecological receptors, particularly those associated with the coral reef community (green sea turtle)
4.2.8.1. Surface Water and Sediment Pathway Potential surface water and sediment transport of lead is limited at PRTF because of the flat area that generally is not conducive to overland migration and the presence of rear backstop berms and side berms on all six SARs that help retain surface water runoff on the range floor. Overland flow that results from storm water runoff within the non-range areas of the complex drains south and discharges into the Pacific Ocean.
Soils at the complex have low erodibility. The ranges are located on flat topography where slope throughout the range is less than 1%. There are no perennial surface water
Section 4
Conceptual Site Model
Marine Corps Installations Command Range Environmental Vulnerability Assessment 5-Year Report Marine Corps Base Hawaii
4-51
features within the complex. All of the ranges are located in the Kaloi subwatershed area, which contains ditches and ephemeral streams; however, none of these channels occur on PRTF. Following rainstorm events, precipitation that falls directly on the range berms containing the majority of lead at the site pools at the base of the berm. The rear backstop berm and side berms on all six ranges act to retain the runoff on the range floor, where it evaporates or infiltrates. Lead present on or behind the rear backstop berms potentially can be transported via overland flow to the south for discharge to the ocean. In addition, the SARs also potentially are exposed to tidal flushing from the ocean, which could transport lead from the berms into the coastal environment.
The limited overland flow from behind the ranges and the coastal erosion action can transport lead to the Pacific Ocean from soil through dissolution in water or erosion of soil and sediments. Therefore, dissolved, particulate, and soil-associated lead potentially can be transported to the offshore marine environment, which has potential human (through recreational use, subsistence fishing, and limu gathering) and ecological (coral reef and associated species) receptors.
4.2.8.2. Groundwater Pathway There are two aquifers present beneath PRTF. The deeper, Koolau basaltic aquifer is under artesian pressure and is overlain by the shallow caprock aquifer. The higher hydraulic head in the confined deep aquifer results in an upward potential flow between the two aquifers. For this reason, it is unlikely that lead deposited on the ground surface at the complex has, or in the future will, migrate to the deep aquifer.
Because the ground surface elevation at the complex is close to sea level, the groundwater can be expected to be close to the ground surface, making the vadose zone very small. Infiltration of precipitation on the ranges can result in potential lead transport from the ground surface into the saturated zone. In the absence of any known pumping wells or gaining streams, all shallow groundwater is assumed to discharge to the ocean. The location of submarine groundwater discharge is unknown, so the horizontal travel distance in the saturated zone is unknown.
Discharge of groundwater associated with lead to the ocean sediments could affect benthic organisms or coral-associated species but is unlikely to have an impact on human health since the MC would be diluted quickly in the ocean water.

Marine Corps Installations Command Range Environmental Vulnerability Assessment 5-Year Report Marine Corps Base Hawaii
5-1
5. Modeling Assumptions and Parameters
As part of the REVA five-year review effort, fate and transport screening-level modeling assessments were conducted for the following MC loading area at MCB Hawaii:
HE Impact Area Inert Impact Area
Range 8 Range 8A
The MC loading areas were selected for quantitative transport modeling based on their current use of munitions containing HE and their proximity to potential down gradient receptor locations. The purpose of the fate and transport screening-level assessment is to determine the potential for release of MC in surface water, groundwater, and sediment from the identified MC loading areas. If the results of the screening-level assessments indicate a potential release of MC, additional assessments (such as sampling) would be considered. Otherwise, no further assessment is conducted, and the identified MC loading areas will be reassessed in the next five-year review to determine if continued loading at these sites are impacting surface water, sediment, and groundwater. The surface water, sediment, and groundwater screening-level modeling assessment methods and assumptions are presented in the following sections.
5.1. Surface Water and Sediment Modeling Assumptions The analyses of potential surface water and sediment impacts for MCB Hawaii were conducted following the REVA process described in the REVA Reference Manual and the REVA 5-Year Review Manual (HQMC, 2009; HQMC, 2010). The initial step is a qualitative assessment of the surface water and sediment conditions based on the CSM, described in detail in Section 4, including the identification of potential exposure pathways, migration routes, and potential receptors (human and ecological). When these qualitative assessments indicate a potential for MC migration from MC loading areas to surface water receptors, screening-level MC transport assessments are conducted to quantitatively estimate potential concentrations of indicator MC (RDX, HMX, TNT, and perchlorate) that can migrate in surface water and sediment.
Under REVA, screening-level transport assessments are used first to estimate the MC concentrations in surface water runoff and sediment at the edge of the identified MC loading areas. If these assessments predict potential impacts at the edge of the loading areas, then additional calculations are performed to estimate the potential MC concentrations at downstream receptor locations. The receptor location assessed at MCB Hawaii is the Kailua Bay. There are potential ecological receptors within the intertidal zone of the bay and potential human receptors that use the bay for recreational purposes
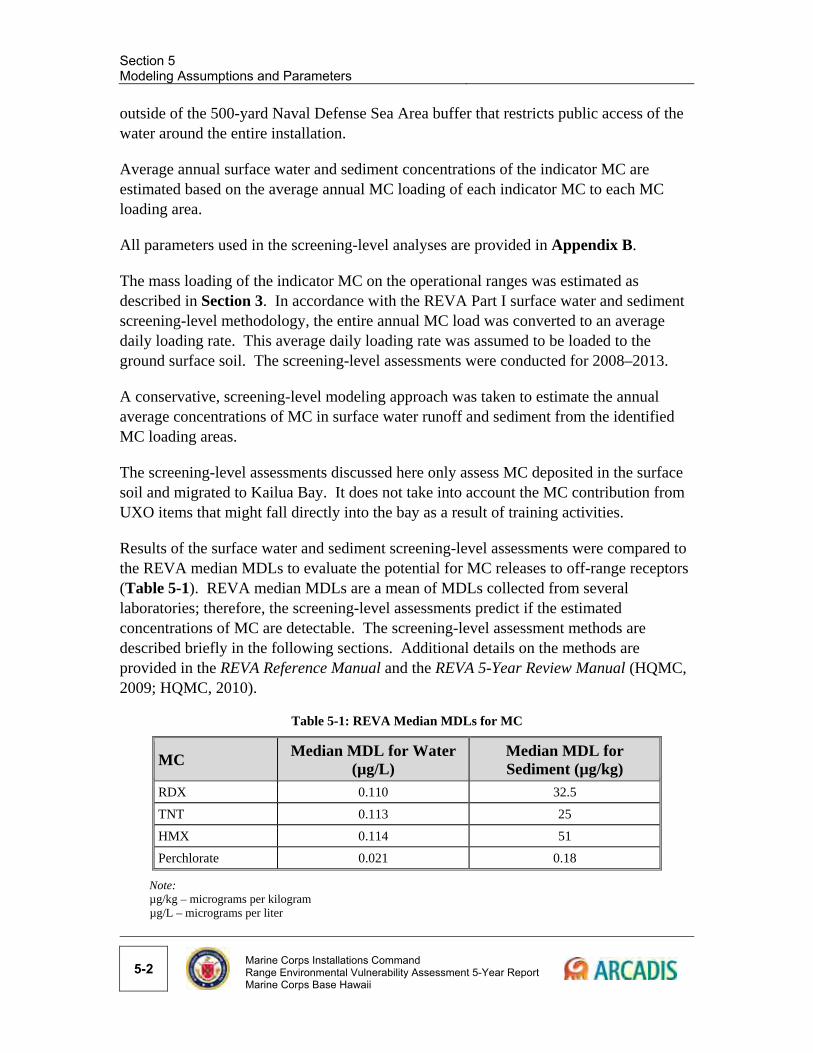
Section 5 Modeling Assumptions and Parameters
5-2
Marine Corps Installations Command Range Environmental Vulnerability Assessment 5-Year Report Marine Corps Base Hawaii
outside of the 500-yard Naval Defense Sea Area buffer that restricts public access of the water around the entire installation.
Average annual surface water and sediment concentrations of the indicator MC are estimated based on the average annual MC loading of each indicator MC to each MC loading area.
All parameters used in the screening-level analyses are provided in Appendix B.
The mass loading of the indicator MC on the operational ranges was estimated as described in Section 3. In accordance with the REVA Part I surface water and sediment screening-level methodology, the entire annual MC load was converted to an average daily loading rate. This average daily loading rate was assumed to be loaded to the ground surface soil. The screening-level assessments were conducted for 2008–2013.
A conservative, screening-level modeling approach was taken to estimate the annual average concentrations of MC in surface water runoff and sediment from the identified MC loading areas.
The screening-level assessments discussed here only assess MC deposited in the surface soil and migrated to Kailua Bay. It does not take into account the MC contribution from UXO items that might fall directly into the bay as a result of training activities.
Results of the surface water and sediment screening-level assessments were compared to the REVA median MDLs to evaluate the potential for MC releases to off-range receptors (Table 5-1). REVA median MDLs are a mean of MDLs collected from several laboratories; therefore, the screening-level assessments predict if the estimated concentrations of MC are detectable. The screening-level assessment methods are described briefly in the following sections. Additional details on the methods are provided in the REVA Reference Manual and the REVA 5-Year Review Manual (HQMC, 2009; HQMC, 2010).
Table 5-1: REVA Median MDLs for MC
MC Median MDL for Water
(µg/L) Median MDL for Sediment (µg/kg)
RDX 0.110 32.5
TNT 0.113 25
HMX 0.114 51
Perchlorate 0.021 0.18
Note: µg/kg – micrograms per kilogram µg/L – micrograms per liter
Section 5
Modeling Assumptions and Parameters
Marine Corps Installations Command Range Environmental Vulnerability Assessment 5-Year Report Marine Corps Base Hawaii
5-3
Surface Water Screening-Level Approach at the Munitions 5.1.1.Constituents Loading Areas
This subsection discusses the methods used in estimating MC entering surface water through (1) erosion of particulate or adsorbed MC in soil and transported in surface water runoff and (2) direct dissolution of MC in surface water runoff. MC at the loading areas were assumed to be loaded to the ground surface soil.
5.1.1.1. Estimation of the Annual Average MC Concentrations Leaving MC Loading Areas
The following three calculations were carried out in order to estimate average annual MC concentrations in surface water runoff leaving the MC loading areas.
Estimation of Soil Erosion
Estimates of total soil erosion were required for subsequent calculation of the mass of MC transported from MC loading areas. Estimation of the soil erosion to calculate transported MC mass is especially important for MC that strongly adsorb to soil (e.g., TNT). An annual soil erosion rate was estimated using the Revised Universal Soil Loss Equation (RUSLE), which incorporates the major factors affecting erosion to predict the rate of soil loss in mass per area per year. The RUSLE is expressed as follows:
A = RKLSCP
Where: A = Predicted soil loss R = Rainfall energy factor K = Soil erodibility factor LS = Topographic factor (factor influenced by length and steepness of slope) C = Cover and management factor P = Erosion control practice factor
These factors were estimated for the MC loading areas at MCB Hawaii using available information, such as soil types, land use / land cover, and digital elevation data (MCBH, 2013a; USDA NRCS, 2013). Appendix B lists parameter values used for estimating soil erosion for the MC loading areas.
Estimation of Surface Water Runoff Rate
The annual surface water runoff rate from each MC loading area was estimated simply as the product of the average annual precipitation, the measured area of the MC loading area, and a runoff coefficient. The average annual precipitation of 29.4 in/yr was evaluated from annual precipitation data obtained from Air Traffic Control at MCB Hawaii (for the period 1949–2008) (MCBH, 2013b). Runoff coefficients were selected
Section 5 Modeling Assumptions and Parameters
5-4
Marine Corps Installations Command Range Environmental Vulnerability Assessment 5-Year Report Marine Corps Base Hawaii
from published tabular data based on soil hydrologic group, slope, and land cover of the MC loading areas being assessed (McCuen, 1998) (Appendix B).
Estimation of MC Mass and Concentration in Surface Water Runoff
A multimedia partitioning model, CalTOX, was used to estimate the mass of MC transported from surface soil to surface water runoff. This model has the capability of simulating the major transport mechanisms that are likely to affect MC from their point of origin in surface soils to their release into surface water runoff. CalTOX can be used to simulate the partitioning of MC loaded into various media (soil, air, and water) over time. The rate at which MC will partition among these media is dependent on both the chemical properties of the MC and the physical/hydrological properties of the site. CalTOX requires the input of landscape properties of the MC loading areas and chemical properties of the MC (Appendix B). Values of landscape and chemical properties were selected based on local reports, soil surveys, mapping information, and the scientific literature. Estimates of soil erosion and surface water runoff were calculated as described above and entered into CalTOX. An estimated groundwater recharge rate was also entered into CalTOX as one of the input parameters.
The chemical parameter values used in the model were selected as the most recent available at the time the modeling was carried out. It was noted that some of the parameter values have variability in the literature, such as MC decay rate and MC organic carbon partition coefficient (Koc). In general, variability of many of the chemical parameters in the literature is not wide enough to cause significant variations in model results.
The CalTOX output of interest for the surface water analysis was the MC mass transferred from surface soil to surface water, which CalTOX expresses as an average daily load in grams per day. This daily mass transfer rate was divided by the daily runoff volume to estimate the MC concentration in surface water runoff at the edge of the MC loading area, prior to down gradient mixing/dilution in streams.
Temporal and spatial resolution of the analysis is limited by the basic input parameters and the loading rate, which is defined on an annual basis and to a fixed area. Therefore, the screening analysis inherently results in annual average concentrations.
5.1.1.2. Estimation of Munitions Constituents Concentrations Entering Downstream Receptor Locations
The MC loading areas within MCB Hawaii drain to the Kailua Bay, which has potential ecological receptors. The water is not used as drinking water, and recreational activities are not permitted on the shore or in the bay adjacent to the operational ranges. While considered unlikely, potential exposure to human receptors (through recreational use) could exist beyond the restricted 500-yard Naval Defense Sea Area buffer zone.
Section 5
Modeling Assumptions and Parameters
Marine Corps Installations Command Range Environmental Vulnerability Assessment 5-Year Report Marine Corps Base Hawaii
5-5
For MC loading areas where MC concentrations in surface water runoff at the edge of the MC loading area were estimated to be above the REVA median MDL, an additional conservative mixing calculation was carried out to estimate MC concentrations in surface water entering the downstream receptor location (Kailua Bay). Total drainage areas upstream of the Kailua Bay were estimated (Figure 4-2). The estimated concentrations at the edge of the MC loading areas then were multiplied by the ratio of the MC loading area to the total drainage area upstream of the receptor location.
The down gradient, mixed MC concentrations entering the receptor location were estimated as area-weighted sums of the concentrations from the individual MC loading areas draining to the receptor location from within the same drainage area:
Cmixed = (Crunoff × ALA) / ADA
Where: Cmixed = Post-mixed concentrations entering downstream receptor locations (μg/L) Crunoff = Concentration in runoff from MC loading areas (μg/L) ALA = Area receiving MC loading (square meters [m2]) ADA = Total drainage area of the downstream receptor location (m2)
All of the HE Impact and the Inert Impact MC loading areas drain through the HE/Inert Impact drainage area prior to discharge to the Kailua Bay. All of the Range 8 and Range 8A MC loading areas drain through the Range 8/Range 8A drainage area prior to discharge to the Kailua Bay. Drainages from the HE/Inert Impact and the Range 8/Range 8A drainage areas discharge at different points within the Kailua Bay and, therefore, enter the bay at different post-mixed concentrations. An inherent assumption of this assessment is that all areas other than the MC loading area contribute runoff that has negligible MC concentrations. This provides an estimate of the potential for concentrations to be reduced by mixing with other runoff prior to entry into the identified downstream receptor locations. This approach conservatively assumes no reduction of MC through MC decay in surface water.
In addition to direct surface water runoff sources, groundwater discharge is a source of potential MC loads to Kailua Bay from the MC loading areas. MC concentrations in groundwater potentially discharging into the bay from MC loading areas were estimated in the groundwater screening-level assessment discussed in Section 5.2. From the groundwater screening-level assessment, MC concentrations that were predicted to discharge into the Kailua Bay above REVA median MDLs were considered for a mixing calculation with runoff sources. The following steps were followed in the mixing calculation:
i) The MC load in groundwater from the MC loading area was estimated by multiplying the predicted concentration (result of the groundwater screening assessment from
Section 5 Modeling Assumptions and Parameters
5-6
Marine Corps Installations Command Range Environmental Vulnerability Assessment 5-Year Report Marine Corps Base Hawaii
Section 5.2.2.3) with a groundwater flux that was estimated to be equivalent to 0.00051 cubic meters per square meter per day (based on a baseflow value typical for an area with a similar climate condition as MCB Hawaii [Malcolm Pirnie, 2010]) and the MC loading area.
ii) The mixed runoff and groundwater concentration leaving the MC loading area was estimated by dividing the total MC load leaving the MC loading area (the sum of the MC load from groundwater calculated in step i and MC load from runoff estimated from CalTOX) by the total volume of runoff and groundwater flux.
The mixed runoff and groundwater concentration from step ii was used as the input concentration (instead of the Crunoff) in the downstream mixing calculation described above to estimate downstream mixed concentrations entering the identified downstream receptor location (Kailua Bay). In order to take a conservative approach, if the mixed runoff and groundwater concentration from step ii was lower than the Crunoff, then Crunoff was used as the input concentration in the downstream mixing calculation.
5.1.1.3. Mixing in Kailua Bay The CORMIX model was used to predict the spatial mixing/dilution pattern of MC, which are assumed to be discharge into the Kailua Bay as a point source. The result of this modeling is used to examine how quickly REVA MC concentrations entering the Kailua Bay might decrease through mixing in the large water body. Based on the results, it was possible to evaluate the likelihood of MC impact to potential human receptors potentially present at the 500-yard restricted zone as well as ecological receptors potentially present within the coral reef communities located immediately offshore. The model was used to simulate how the MC concentrations entering the intertidal/littoral zone of Kailua Bay reduce as they are transported offshore.
For this application, the CORMIX3 subsystem for buoyant surface discharges is used. This subsystem assumes that an effluent enters a large water body laterally through an open channel or pipe. In this manner, the MC is assumed to discharge with runoff originating from each MC loading area, and it is simulated conservatively as a bank discharge to the bay. Input data requirements of CORMIX3 are divided into two categories, one characterizing the receiving water and the other characterizing the effluent discharge (Appendix B).
The discharge flow rate to the bay is assumed conservatively to be equal to the peak runoff rate associated with a 1-year, 24-hour storm event. The magnitude of the discharge flow to the bay is estimated using the Rational Method, where discharge flow rate is estimated by multiplying the peak rainfall intensity with runoff coefficient and discharge area. The peak rainfall intensity is estimated by applying a Type 1 distribution to the 24-hour rainfall of the 1-year return period.
Section 5
Modeling Assumptions and Parameters
Marine Corps Installations Command Range Environmental Vulnerability Assessment 5-Year Report Marine Corps Base Hawaii
5-7
The discharge rate to the Kailua Bay was estimated using the Rational Method as follows:
q = CiA
Where: q = Discharge (cubic meters per second) C = Runoff coefficient of the MC loading areas (Appendix B) I = Peak rainfall intensity (meters per second (m/sec)) A = Area of discharge (the drainage area, m2)
Based on the Type 1 rainfall distribution, the maximum rainfall that occurs within an hour duration was estimated to amount to approximately 17% of the rainfall for the 24-hour l-year return period (giving a rainfall intensity of 1.39E-05 m/sec). Rainfall of the 24-hour l-year return period for MCB Hawaii was estimated to be 11.6 inches/day (0.3 meters/day) (MCBH, 2013b).
A steady-state ambient condition of the receiving water body is assumed. To model mixing in tidal waters, it is assumed that the receiving water is under slack water conditions. It also is assumed that the MC introduced behave conservatively in the water (e.g., no decay, transformation, volatilization, settling) (Appendix B).
Sediment Screening-Level Approach at Munitions Constituents 5.1.2.Loading Areas
The CalTOX partitioning model was used to estimate MC concentrations in sediment leaving the MC loading areas. The input variables used are similar to the input variables used for the surface water assessment, as described in Section 5.1.1.1. CalTOX was used to estimate the MC mass transferred to surface water through partitioning into the soil/sediment eroding from the site and transported in surface water runoff. The MC concentrations in eroded soil/sediment leaving the MC loading areas then were estimated by dividing the MC mass in eroded soil (obtained from CalTOX) by the estimated total soil erosion (obtained from RUSLE).
If the MC concentrations in sediment at the edge of the MC loading areas were estimated to be above REVA median MDLs, additional screening assessment was carried out to estimate MC concentration in sediment at the downstream receptor location. This involved using RUSLE to estimate the total annual mass of sediment transported to the downstream receptor location from areas upstream of the receptor location (the total mass of sediment eroded within the drainage areas of the receptor location). The sediment MC concentrations at the downstream receptor location were estimated to be equivalent to the MC mass in sediment leaving MC loading areas divided by the total sediment mass from the drainage area transported to the downstream receptor location. The cumulative sediment MC concentration from different MC loading areas draining to the same
Section 5 Modeling Assumptions and Parameters
5-8
Marine Corps Installations Command Range Environmental Vulnerability Assessment 5-Year Report Marine Corps Base Hawaii
receptor location will be equivalent to the sum of the MC mass in sediment leaving the individual MC loading areas divided by the sediment mass eroding into the receptor location as follows:
Csed,mixed = ∑ MMC,LA / Msed,DA
Where: Csed,mixed = Post-mixed MC concentration in sediment entering downstream receptor locations (µg/kg)
MMC,LA = MC mass in sediment leaving the MC loading area located within a drainage area of a receptor location (µg/day)
Msed,DA = Sediment mass eroded within the drainage area of a receptor location (kilograms per day)
This method conservatively assumes that 100% of the sediment generated over the loading area is deposited into downstream surface water (downstream receptor locations). This is a conservative approach because typical sediment yields in surface water range from 30% to 50%.
5.2. Groundwater Modeling Assumptions The purpose of the groundwater assessment in the REVA program is to make best use of the available information to infer whether indicator MC (RDX, HMX, TNT, and perchlorate) can be transported in groundwater from MC loading areas to receptors. Both conceptual and quantitative methods are used. The initial step is a qualitative assessment of the groundwater conditions based on the CSM, described in detail in Section 4, including the identification of potential exposure pathways, migration routes, and potential receptors (human and ecological). When this qualitative assessment indicates there is potential for MC migration from MC loading areas to groundwater receptors, a screening-level MC transport assessment is performed to quantitatively estimate potential concentrations of indicator MC in groundwater migrating to a receptor or beyond the installation boundaries. This quantitative screening-level assessment method uses multiple conservative assumptions, is more likely to overestimate than underestimate MC concentrations, and is used to determine whether particular MC loading areas merit additional investigation. The groundwater screening-level analysis methods employed for MCB Hawaii follow the approach described in the REVA Reference Manual and the Assessment of Models for Evaluating Fate and Transport of Munitions on Operational Ranges and are discussed in this section (HQMC, 2009; Malcolm Pirnie, 2005).
Qualitative Assessment 5.2.1.The qualitative groundwater assessment looked at multiple data sources, which are detailed in the CSM. The following key information sources were used in the qualitative assessment:
Section 5
Modeling Assumptions and Parameters
Marine Corps Installations Command Range Environmental Vulnerability Assessment 5-Year Report Marine Corps Base Hawaii
5-9
Military munitions expenditure data
Geospatial data (MCB Hawaii NREA GIS office)
IR Program site data
Integrated Natural Resources Management Plan
Monitoring well boring log data at the landfill site
U.S. Department of Agriculture Natural Resources Conservation Service soil survey
Precipitation data
The groundwater conditions, the potential for MC migration in vadose zone and saturated zones, and the presence of potential groundwater receptors are described in more detail in Section 4.1.3, Section 4.1.5, and Section 4.1.8.2, respectively.
REVA Groundwater Assessment Procedure 5.2.2.A screening-level fate and transport assessment of potential MC migration via groundwater was conducted as part of the vulnerability assessment for MCB Hawaii. The assessment was conducted for the four MC loading areas identified at MCB Hawaii: HE Impact Area, Inert Impact Area, Range 8, and Range 8A. These MC loading areas were selected for groundwater modeling based on their current use of munitions containing HE and their proximity to a potential ecological receptor location (the Kailua Bay) where the groundwater discharges. The screening-level assessment was accomplished in three main steps:
1. Initial groundwater screening assessment: MC concentrations were estimated in the portion of the precipitation water that infiltrates to the groundwater and assumed to arrive at the groundwater at that concentration.
2. Vadose zone modeling: A screening-level vadose zone model was used to evaluate the potential for MC to migrate through the vadose zone to the groundwater at concentrations greater than the REVA median MDL.
3. Saturated zone modeling: A screening-level saturated zone model was used to predict the potential for MC that were identified to reach the groundwater at concentrations above the REVA median MDL in step 2 to migrate farther through the saturated zone and reach potential ecological receptors in the Kailua Bay at concentrations above the REVA median MDL.
The above three steps executed for the screening-level assessment are discussed in the following subsections.
5.2.2.1. Initial Groundwater Screening Assessment The first step in assessing groundwater transport is an initial assessment of the MC loading rate and the annual groundwater recharge rate to determine a maximum MC concentration in infiltrating water. This approach produces a highly conservative
Section 5 Modeling Assumptions and Parameters
5-10
Marine Corps Installations Command Range Environmental Vulnerability Assessment 5-Year Report Marine Corps Base Hawaii
concentration because the majority of the MC (with the exception of perchlorate) are not completely soluble in water and their effective solubilities decrease when in mixtures. Further, most MC have a high rate of decay and some of the MC (TNT and RDX) can have a relatively strong affinity to the soil particles and, thus, can sorb readily to the soil from the aqueous phase. Perchlorate is the only recalcitrant (persistent) indicator MC that does not readily degrade, is miscible (completely soluble) in water, and does not sorb to solid soil particles. This assessment also assumes that there is no removal of MC in the surface water runoff or decay as a result of biotic and abiotic transformations. If this initial, conservative analysis indicates the potential for MC to have a concentration in the infiltrating water above the REVA median MDLs (Table 5-1), a more detailed screening-level modeling analysis is done for that MC using the models outlined in the REVA Reference Manual and the Assessment of Models for Evaluating Fate and Transport of Munitions on Operational Ranges (HQMC, 2009; Malcolm Pirnie, 2005).
The initial groundwater assessment is performed as a spreadsheet-based mass balance calculation. The basic input data are the estimated average annual MC loading rates at the MC loading areas (presented in Section 6) and the estimated infiltration rate (recharge) of 2.9 to 5.9 in/yr at the MC loading areas based on land cover, soil type, slope and the type of aquifer material present. The estimated recharge rate values of 2.9 to 5.9 in/yr include the estimated evapotranspiration rate, which reduces recharge significantly. The estimated recharge rate values at the MC loading areas are presented in Appendix B.
The maximum possible concentrations of MC in the infiltrating water were calculated by dividing the MC loading rates by the volume of the infiltrating water. The MC estimated to have concentrations above the REVA median MDLs at MC loading areas were assessed further for transport through the vadose zone using a screening-level vadose zone model. MC estimated to have concentrations below REVA median MDLs at MC loading areas were eliminated from additional assessment.
5.2.2.2. Vadose Zone Modeling When the results from the initial groundwater assessment from Section 5.2.2.1 indicate a need for further evaluation, the U.S. Environmental Protection Agency VLEACH Model was used to simulate fate and transport of MC through the unsaturated zone to the groundwater table. VLEACH is a one-dimensional finite difference vadose zone leaching model that simulates the movement of organic contaminants within and between three phases: 1) as a solute dissolved in water, 2) as a gas in the vapor phase, and 3) as an adsorbed compound in the solid phase (Ravi and Johnson, 1997). Partitioning between phases occurs according to the contaminant distribution coefficient. Vertical transport in VLEACH is simulated by advection in the liquid phase and by gaseous diffusion in the vapor phase. Since VLEACH does not include decay as a mechanism of environmental fate and transport, a post-processing step that included decay was performed on the
Section 5
Modeling Assumptions and Parameters
Marine Corps Installations Command Range Environmental Vulnerability Assessment 5-Year Report Marine Corps Base Hawaii
5-11
VLEACH results. The MC decay rate was applied to the VLEACH output concentrations based on the elapsed time.
Results obtained from the initial groundwater screening assessment (Section 5.2.2.1) were used to simulate MC transport to the water table. MC were modeled for migration through the vadose zone as follows:
RDX and TNT were modeled at three MC loading areas (HE Impact Area, Range 8, and Range 8A).
Perchlorate was modeled at four MC loading areas (HE Impact Area, Inert Impact Area, Range 8, and Range 8A).
Local soils generally consist of silts and clays. The relevant physical and chemical properties of the vadose zone soils, MC, and climate that were used as input parameters to VLEACH are presented in Appendix B.
5.2.2.3. Saturated Zone Modeling The fate and transport of MC at the various MC loading areas that were estimated to reach the groundwater (from the vadose zone modeling) were simulated using BIOCHLOR 2.2, a one-dimensional analytical solute transport and fate model (Aziz and Newell, 2002). Only perchlorate was estimated to reach the groundwater at a concentration above the REVA median MDL at four MC loading areas (based on results of the vadose zone modeling). As a result, perchlorate at the four MC loading areas was modeled for movement through the saturated zone. The model was used to predict the possible movement of perchlorate through the saturated zone to the potential receptor location (Kailua Bay). It was run on a box grid and assumed a homogeneous aquifer with constant velocity.
The groundwater flowing through the basal unconfined sedimentary aquifer at MCB Hawaii discharges to the Kailua Bay where there are potential ecological receptors in the near-shore environment (marine organisms of concern and threatened and endangered species). The distance from each MC loading area modeled to the nearest potential surface water receptor location was estimated. Using the maximum perchlorate concentration predicted to migrate to the groundwater (based on the result of the vadose zone modeling) as an input to the BIOCHLOR model, perchlorate concentrations potentially reaching the Kailua Bay from each of the four MC loading areas were estimated. The relevant aquifer and chemical properties used as input parameters in the BIOCHLOR model are presented in Appendix B. These values were based on the literature or conservative assumptions. The site-specific model parameters are also presented in Appendix B.

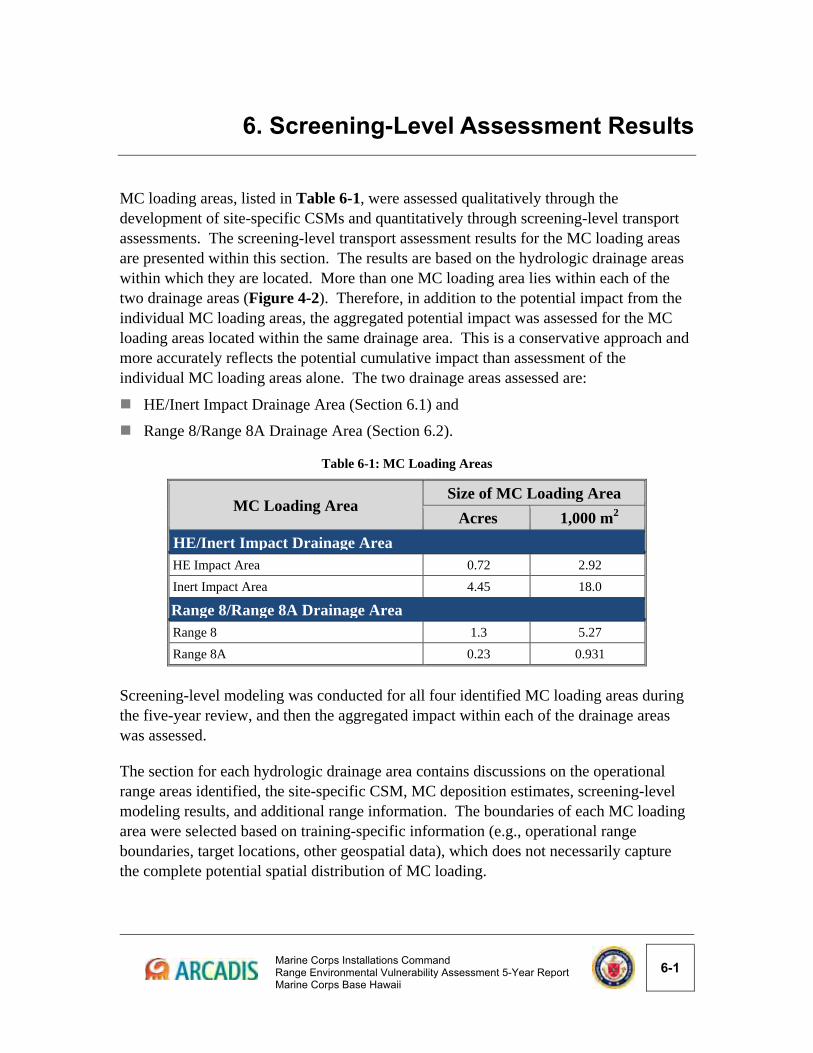
Marine Corps Installations Command Range Environmental Vulnerability Assessment 5-Year Report Marine Corps Base Hawaii
6-1
6. Screening-Level Assessment Results
MC loading areas, listed in Table 6-1, were assessed qualitatively through the development of site-specific CSMs and quantitatively through screening-level transport assessments. The screening-level transport assessment results for the MC loading areas are presented within this section. The results are based on the hydrologic drainage areas within which they are located. More than one MC loading area lies within each of the two drainage areas (Figure 4-2). Therefore, in addition to the potential impact from the individual MC loading areas, the aggregated potential impact was assessed for the MC loading areas located within the same drainage area. This is a conservative approach and more accurately reflects the potential cumulative impact than assessment of the individual MC loading areas alone. The two drainage areas assessed are:
HE/Inert Impact Drainage Area (Section 6.1) and
Range 8/Range 8A Drainage Area (Section 6.2).
Table 6-1: MC Loading Areas
MC Loading Area Size of MC Loading Area
Acres 1,000 m2
HE/Inert Impact Drainage AreaHE Impact Area 0.72 2.92
Inert Impact Area 4.45 18.0
Range 8/Range 8A Drainage AreaRange 8 1.3 5.27
Range 8A 0.23 0.931
Screening-level modeling was conducted for all four identified MC loading areas during the five-year review, and then the aggregated impact within each of the drainage areas was assessed.
The section for each hydrologic drainage area contains discussions on the operational range areas identified, the site-specific CSM, MC deposition estimates, screening-level modeling results, and additional range information. The boundaries of each MC loading area were selected based on training-specific information (e.g., operational range boundaries, target locations, other geospatial data), which does not necessarily capture the complete potential spatial distribution of MC loading.
Section 6 Screening-Level Assessment Results
6-2
Marine Corps Installations Command Range Environmental Vulnerability Assessment 5-Year Report Marine Corps Base Hawaii
Surface Water and Sediment Assessments Summary
The screening-level assessments of MC fate and transport in surface water and sediment were conducted for three MC loading areas located within two drainage areas (HE/Inert Impact and Range 8/Range 8A). These MC loading areas were selected for quantitative transport assessment based on their current use of munitions containing HE and the presence of potential receptor locations along the surface water drainage pathway. The Range 8A MC loading area located within the Range 8/Range 8A drainage area was not assessed for surface water and sediment transport because the range design (SACON® range with walls) limits or prevents the escape of surface water and sediment from the range. Annual average MC concentrations in surface water runoff and sediment at the edge of each MC loading area were estimated. MC concentrations in surface water and sediment entering the identified downstream receptor location (the Kailua Bay) also were estimated based on the potential aggregated impact from the ranges within the respective drainage areas. A mixing zone model was applied to estimate MC concentrations distributed within the Kailua Bay.
The average annual concentrations of RDX and perchlorate in surface water entering the Kailua Bay from the HE/Inert Impact drainage area and the average annual concentrations of RDX and TNT entering the Kailua Bay from the Range 8/Range 8A drainage area were predicted to be above their respective REVA median MDLs. Further mixing zone modeling assessment has predicted that concentrations of these constituents will decrease to below their REVA median MDLs before reaching potential human receptor locations in the bay (the 500-yard restricted zone). The predicted MC concentrations within the intertidal zone of the bay where there are potential ecological receptors are far below DoD screening values for ecological receptors (Appendix A).
The average annual concentration of TNT in sediment was estimated to be above the REVA median MDL at the edge of two of the three MC loading areas assessed. Annual average MC concentrations in sediment entering the identified downstream surface water receptor location were predicted to be below REVA median MDLs. The results of the surface water and sediment screening-level assessments for the three MC loading areas are discussed in detail in Section 6.1.2 and Section 6.2.2.
Groundwater Assessment Summary
Groundwater fate and transport modeling through screening-level assessment was conducted for four MC loading areas. These MC loading areas were selected for quantitative transport assessment based on their current use of munitions containing HE and their proximity to a potential ecological receptor location (Kailua Bay). The shallow groundwater discharges to the Kailua Bay where there are potential ecological receptors.
Section 6
Screening-Level Assessment Results
Marine Corps Installations Command Range Environmental Vulnerability Assessment 5-Year Report Marine Corps Base Hawaii
6-3
Based on the initial groundwater screening-level assessment, at least one indicator MC was predicted to leach into the vadose zone above the REVA median MDL at the four MC loading areas assessed. Therefore, vadose zone modeling was conducted at the four MC loading areas. Based on the vadose zone modeling, perchlorate was predicted to reach the groundwater at a concentration above the REVA median MDL at the four MC loading areas modeled. Saturated zone modeling was conducted to quantify the potential for perchlorate in groundwater to migrate to the identified ecological receptor location, the Kailua Bay. Based on the saturated zone modeling, perchlorate in groundwater was predicted to discharge to Kailua Bay at a concentration above the REVA median MDL from the four MC loading areas modeled. The results of the groundwater screening-level assessment for the four MC loading areas are discussed in detail in Section 6.1.3 and Section 6.2.3.
6.1. High Explosives / Inert Impact Drainage Area This drainage area is located on the northeastern part of KBRTF down gradient of the Ulupau Crater Head; it is approximately 28 acres, with all of the drainage area located inside the KBRTF boundary (Figure 6-1). There are no streams or other surface water features located within the drainage area.
The two MC loading areas located within the HE/Inert Impact drainage area include HE Impact Area and Inert Impact Area, as listed in Table 6-1 and shown on Figure 6-1.
Military Munitions
The military munitions authorized for use within the two MC loading areas include small arms, HE and practice grenades, demolition charges, rockets, tracer trainer munitions, and mortars.
Conceptual Site Model 6.1.1.
6.1.1.1. Estimated Munitions Constituents Loading The MC loading areas within the HE/Inert Impact drainage area are shown in Figure 6-1. The MC Loading Rate Calculator was used to estimate the amount of MC deposited annually within these MC loading areas using assumptions detailed in Section 3 (Table 6-2). The HE/Inert Impact drainage area represents the highest overall MC loading rates observed compared to the Range 8/Range 8A drainage area during the five-year review period. Specifically, the analysis suggests that RDX and TNT represent the highest MC loading to the ranges within the HE/Inert Impact drainage area. The highest MC loading occurred for RDX in the HE Impact MC loading area. Based on the size of the MC loading area and the associated MC loading rates, the most significant loading in the drainage area appears to be RDX and TNT deposition from Ranges 5, 9, and 9A.
Section 6 Screening-Level Assessment Results
6-4
Marine Corps Installations Command Range Environmental Vulnerability Assessment 5-Year Report Marine Corps Base Hawaii
The total aggregate, noncontiguous MC loading area across the drainage area was 2,704 m2 larger for the five-year review period compared to that of the combined MC loading areas from Period E (1989–2007) in the baseline assessment (Table 6-2). This modification was based on target locations and information provided by Range Control personnel and minor adjustments over time to training operations on the ranges present in the drainage area.
The estimated MC loading rates for each MC loading area are summarized in Table 6-2. The total noncontiguous surface areas of the individual MC loading areas and their specific loading rates were aggregated for the baseline and five-year review periods so that a comparison of MC loading rates could be used to identify general MC loading changes within the watershed over time. Compared to estimated baseline MC loading rates, the estimated MC loading rates for the five-year review suggest overall loading within this drainage area has decreased slightly since the baseline assessment. Using limited data available and the approach developed during the baseline assessment, no HMX loading was estimated across the drainage area. However, HMX was estimated at relatively low loading rates in the five-year review (Table 6-2). Estimated TNT and perchlorate loading also increased since the baseline assessment by approximately one order of magnitude. The estimated RDX loading rate decreased by one order of magnitude across the watershed when compared to the baseline estimates. Since RDX represents the most heavily utilized HE MC within this drainage area, the decrease in its estimated loading is responsible for the decrease in overall loading within the drainage area. Note that this is an estimation methodology for comparing the datasets; the MC loading areas are noncontiguous, and adding the rates into a single area does not capture concentrated MC loading at specific range locations. As such, these comparisons are relevant only for a watershed-level comparison.
Kailua BayCOORDINATE SYSTEM: UTM ZONE: 18NDATUM: WGS 1984UNITS: METERS
DATE: APRIL 2014
SOURCE: MCB HAWAII ENVIRONMENTAL AND RANGE CONTROL OFFICES 2013 ESRI, 2013
FIGURE 6-1MC Loading Areas, Surface
Water and GroundwaterFeatures within HE/Inert Impact
Drainage AreaMCBH Kaneohe BayRange Environmental
Vulnerability Assessment MCB Hawaii, Oahu, HI
LEGENDInstallation Boundary
KBRTF Boundary
MC Loading Area
Drainage AreaHE/Inert Impact
MCBH Kaneohe Bay
0 400 800200Feet
Anticipated GroundwaterFlow Direction
Section 6 Screening-Level Assessment Results
6-6
Marine Corps Installations Command Range Environmental Vulnerability Assessment 5-Year Report Marine Corps Base Hawaii
This page intentionally blank
Section 6
Screening-Level Assessment Results
Marine Corps Installations Command Range Environmental Vulnerability Assessment 5-Year Report Marine Corps Base Hawaii
6-7
Table 6-2: Estimated MC Loading Rates for the HE/Inert Impact Drainage Area
Assessment MC Loading
Area
Assumed Loading
Area (m2)
Estimated Annual Loading Rate (kg/m2)
HMX RDX TNT Perchlorate
Baseline (1989–2007)
HE Impact 2,920 0.00E+00 1.83E-04 5.70E-06 5.72E-09
Baseline (1989–2007)
Inert Impact 15,300 0.00E+00 3.93E-09 1.69E-10 1.84E-07
Total MC loading area in HE/Inert Impact drainage area
18,220 0.00E+00 1.83E-04 5.70E-06 1.89E-07
Five-Year Review (2008–2013)
HE Impact Area 2,920 1.64E-09 7.44E-05 1.61E-05 1.43E-06
Five-Year Review (2008–2013)
Inert Impact Area 18,004 0.00E+00 7.50E-09 1.87E-10 4.15E-07
Total MC loading area in HE/Inert Impact drainage area
20,924 1.64E-09 7.44E-05 1.61E-05 1.85E-06
Annual lead deposition for the MC loading areas in the HE/Inert Impact drainage area was estimated during this five-year review (Table 6-3). As noted in Section 3.1, the lead deposition rate is not comparable to an MC loading rate; rather, it is an estimate of the total amount of lead deposited in a given MC loading area without the loss of mass from explosive decomposition. The baseline assessment did not include such lead loading estimates for MC loading areas. SAR lead loading is discussed in Section 7. Calculations indicate the HE Impact MC loading area has the most significant lead deposition in the HE/Inert Impact drainage area, estimated at 4.23E+03 lb of lead annually. Accounting for all MC loading areas identified in the HE/Inert Impact drainage area, it is estimated that a total of 5.33E+03 lb of lead was deposited annually during this review period.
Table 6-3: Estimated Annual Lead Deposition for the HE/Inert Impact Drainage Area
MC Loading Area Size (m2)Lead Deposition
kg/m2 lb/yd2 Total lb
HE Impact Area 2,920 1.70E-01 3.13E-01 1.09E+03
Section 6 Screening-Level Assessment Results
6-8
Marine Corps Installations Command Range Environmental Vulnerability Assessment 5-Year Report Marine Corps Base Hawaii
Inert Impact Area 18,004 1.07E-01 1.97E-01 4.23E+03
Total lead loading in HE/Inert Impact Drainage Area (Period F)
20,924 2.77E-01 5.10E-01 5.33E+03
Note: lb/yd2 – pounds per square yard
6.1.1.2. Geography and Topography The HE/Inert Impact drainage area is located at the Ulupau Crater, down gradient of the Crater Head. The topography is steep and generally slopes to the southeast. Available contour data indicate the elevation of the drainage area ranges from approximately 4 feet amsl near the southernmost boundary of the drainage area to approximately 307 feet amsl near the northeastern boundary of the drainage area (MCBH, 2013a). Based on available spatial data, the slope within the drainage area can range from less than 1% to approximately 65%. The average slope is estimated to be 24%.
6.1.1.3. Surface Water Features There are no surface water features within the HE/Inert Impact drainage area. Surface drainage within the area directly discharges into Kailua Bay. Surface water runoff from the Inert Impact and the HE Impact MC loading areas drains south into Kailua Bay, approximately 240 feet and 90 feet from the MC loading areas, respectively. For purposes of the modeling assessment, overland flow from the Inert Impact Area is assumed to flow through and combine with flow from the HE Impact Area before discharging to the Kailua Bay.
6.1.1.4. Soil Characteristics and Land Cover Soils within the HE/Inert Impact drainage area consist of the rock land (rRk) map unit symbol. This soil consists of silts and is poorly drained with slow permeability. The soil map unit symbols has a neutral pH (7.0 ), organic content of 4.5%, low inherent soil erodibility factor (0.1), and high runoff potential ( hydrologic group D) (USDA NRCS, 2013).
The HE/Inert Impact drainage area is partially vegetated (approximately 30% of the area is vegetated). The vegetated area generally includes grassy vegetation with some isolated bushes. Approximately 70% of the drainage area is unvegetated with exposed soil.
6.1.1.5. Erosion Potential The HE/Inert Impact drainage area was estimated to have moderate soil erosion potential (had a RUSLE predicted soil loss value of 8.19E-03 kilograms per square meters per day [kg/m2/d]). The estimated moderate soil erosion potential is largely a result of the steep topographic slope and poor vegetation cover common to the area. Invasive species
Section 6
Screening-Level Assessment Results
Marine Corps Installations Command Range Environmental Vulnerability Assessment 5-Year Report Marine Corps Base Hawaii
6-9
encroachment also may accelerate erosion, as these types of vegetation have led to higher intervals of fires in the crater (SRGII, 2004).
6.1.1.6. Groundwater Characteristics There are generally limited groundwater data available at the Ulupau Crater where the HE/Inert Impact drainage area is located. Two aquifers underlie the area: an unconfined sedimentary aquifer in the Honolulu Formation and a confined aquifer in the dike complex of the Koolau balalt. The unconfined sedimentary aquifer beneath the Ulupau Crater is reported to have a salinity between 2 and 32 ppt (SRGII, 2004), and the water table is near sea level. The dike-confined water near the operational ranges is below sea level and is too saline for potable use. The reported salinity levels in the unconfined aquifer also preclude the groundwater within this aquifer from being used as a suitable drinking water supply source. Perched groundwater also may be present at localized areas on layers of low-conductivity marine deposits (Environet, 2007; EES, 2005).
Precipitation is the source of all groundwater recharge on Oahu, primarily through direct infiltration. Groundwater at Ulupau Head comes from leakage of dike-impounded groundwater high in the Koolau Mountains (Takasaki et al., 1969; Souza and Meyer, 1995; EES, 2005). There are no groundwater level measurements available at the HE/Inert Impact drainage area; however, based on measurements at the Mokapu Peninsula and at the landfill site just south of the crater, the depth to groundwater is expected to be near ground surface.
6.1.1.7. Potential Surface Water and Groundwater Pathways
Surface Water and Sediment Pathways
The estimated surface water runoff rate at the HE Impact and Inert Impact MC loading areas within the HE/Inert Impact drainage area is 0.34 cubic meters per square meter per year (m3/m2/yr). Based on this estimated surface water runoff rate for both MC loading areas, there is a moderate potential for MC to migrate via surface water runoff from the MC loading areas. This is attributed to the poor vegetation cover, steep topographic slopes, and soil types with high runoff potential (hydrologic group D).
The high soil erosion potential that may occur at the HE Impact and Inert Impact MC loading areas makes soil erosion an important mechanism for potential MC mobilization into surface water runoff. MC transported through surface water and sediment runoff from the MC loading areas could reach the near-ocean environment of Kailua Bay located approximately 240 feet and 90 feet down gradient east of the HE Impact and the Inert Impact MC loading areas. Kailua Bay is tidally influenced, and the tidal mixing combined with the volume of water present is expected to provide significant dilution of the water potentially containing MC. Kailua Bay ultimately mixes with the Pacific Ocean.

Section 6 Screening-Level Assessment Results
6-10
Marine Corps Installations Command Range Environmental Vulnerability Assessment 5-Year Report Marine Corps Base Hawaii
Groundwater Pathways
MC deposited on the MC loading areas within the HE/Inert Impact drainage area have the potential to migrate down to the unconfined aquifer of the Honolulu Formation, which is relatively permeable. It is highly unlikely for MC to migrate farther to the deeper confined Koolua basalt aquifer due to the presence of artesian pressure, which would prevent downward migration. Also, proximity to the ocean would restrict downward migration to some extent.
The shallow groundwater generally flows toward Kailua Bay; however, due to the presence of fractures and the tidal influences from the ocean, it can be difficult to define the exact path groundwater flows. It generally is assumed that MC potentially transported to the shallow unconfined aquifer of the Honolulu Formation have the potential to migrate to the coastline and discharge into the Kailua Bay.
6.1.1.8. Potential Surface Water and Groundwater Receptors
Surface Water and Sediment Receptors
Kailua Bay has potential ecological receptors, including diverse marine organisms of concern (e.g., coral colonies) and species of marine animals that have been identified as threatened (e.g., green sea turtles) or endangered (e.g., hawksbill turtle, monk seal, humpback whale). The bay is not used for drinking water, and recreational activities are not permitted on the shore or in the bay adjacent to the operational rages. A 500-yard Naval Defense Sea Area buffer that restricts public access has been established around the entire installation. While considered only remotely possible because of dilution, exposure to human receptors through recreational use potentially exists beyond the restricted 500-yard buffer zone.
Groundwater Receptors
There are no drinking water wells used within or outside of the installation boundary. As indicated in Section 4.1.5, groundwater aquifers underlying MCBH Kaneohe Bay are designated as nondrinking water aquifers. Potential receptors in the near-shore environment of Kailua Bay where shallow groundwater potentially discharges include ecological species (as discussed in the surface water and sediment receptors section). There is potential impact to human receptors through recreational use of the water beyond the 500-yard restricted zone, but the potential for MC migration at this distance is minimal.
Surface Water and Sediment Screening-Level Assessment Results 6.1.2.A screening-level assessment was used to obtain conservative estimates of MC concentrations in surface water and sediment from the HE Impact and Inert Impact MC
Section 6
Screening-Level Assessment Results
Marine Corps Installations Command Range Environmental Vulnerability Assessment 5-Year Report Marine Corps Base Hawaii
6-11
loading areas located within the HE/Inert Impact drainage area (Figure 6-1). These screening-level assessments were conducted as described in Section 5.1.1 and Section 5.1.2, respectively. Of the two MC loading areas, the Inert Impact MC loading area was estimated to have negligible HMX loading. This MC loading area was not included in the modeling for HMX.
Surface Water
Table 6-4 presents the estimated percentage of total MC mass contributed by the individual MC loading areas draining to the Kailua Bay within the HE/Inert Impact drainage area. The HE Impact MC loading area was predicted to contribute all of the HMX and TNT mass and nearly all of the RDX mass to Kailua Bay within the HE/Inert Impact drainage area. The Inert Impact MC loading area was predicted to contribute a significant proportion of the perchlorate mass to Kailua Bay within the HE/Inert Impact drainage area.
Table 6-4: Screening-Level Estimates of Percent MC Mass Contributed by Individual MC Loading Areas into the HE/Inert Impact Drainage Area
MC Loading Area MC Contributed to HE/Inert Impact
Drainage Area (% Total Mass)
HMX RDX TNT Perchlorate
HE Impact Area 100 99.9 100 37
Inert Impact Area N/A 0.06 ~0 63
Note: N/A – not modeled because the MC loading rate was estimated to be negligible
Table 6-5 presents the annual average edge-of-loading-area concentrations in surface water runoff from the MC loading areas draining within the HE/Inert Impact drainage area. Based on the screening-level calculations, the concentration of HMX was not predicted to exceed the REVA median MDL at both the HE Impact and the Inert Impact MC loading areas within the HE/Inert Impact drainage area. Concentrations of RDX and TNT were predicted to exceed the REVA median MDLs only at the HE Impact MC loading area, and the concentration of perchlorate was predicted to exceed the REVA median MDL at both the HE Impact and Inert Impact MC loading areas.
Table 6-5: Screening-Level Estimates of Annual Average Edge-of-Loading-Area MC Concentrations in Surface Water Runoff within the HE/Inert Impact Drainage Area
MC Loading Area Estimated MC Concentration (µg/L)
HMX RDX TNT Perchlorate
HE Impact Area 0.003 75.2 4.01 3.31
Inert Impact Area N/A 0.007 ~0 0.91
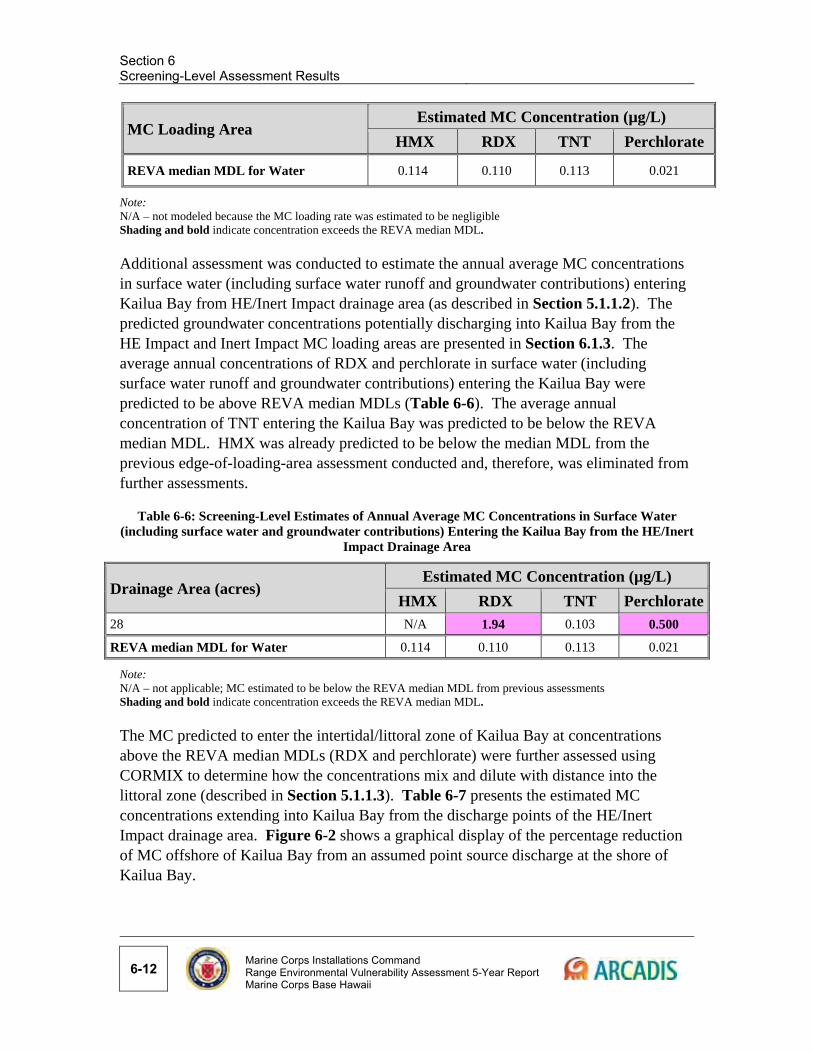
Section 6 Screening-Level Assessment Results
6-12
Marine Corps Installations Command Range Environmental Vulnerability Assessment 5-Year Report Marine Corps Base Hawaii
MC Loading Area Estimated MC Concentration (µg/L)
HMX RDX TNT Perchlorate
REVA median MDL for Water 0.114 0.110 0.113 0.021
Note: N/A – not modeled because the MC loading rate was estimated to be negligible Shading and bold indicate concentration exceeds the REVA median MDL.
Additional assessment was conducted to estimate the annual average MC concentrations in surface water (including surface water runoff and groundwater contributions) entering Kailua Bay from HE/Inert Impact drainage area (as described in Section 5.1.1.2). The predicted groundwater concentrations potentially discharging into Kailua Bay from the HE Impact and Inert Impact MC loading areas are presented in Section 6.1.3. The average annual concentrations of RDX and perchlorate in surface water (including surface water runoff and groundwater contributions) entering the Kailua Bay were predicted to be above REVA median MDLs (Table 6-6). The average annual concentration of TNT entering the Kailua Bay was predicted to be below the REVA median MDL. HMX was already predicted to be below the median MDL from the previous edge-of-loading-area assessment conducted and, therefore, was eliminated from further assessments.
Table 6-6: Screening-Level Estimates of Annual Average MC Concentrations in Surface Water (including surface water and groundwater contributions) Entering the Kailua Bay from the HE/Inert
Impact Drainage Area
Drainage Area (acres) Estimated MC Concentration (µg/L)
HMX RDX TNT Perchlorate
28 N/A 1.94 0.103 0.500
REVA median MDL for Water 0.114 0.110 0.113 0.021
Note: N/A – not applicable; MC estimated to be below the REVA median MDL from previous assessments Shading and bold indicate concentration exceeds the REVA median MDL.
The MC predicted to enter the intertidal/littoral zone of Kailua Bay at concentrations above the REVA median MDLs (RDX and perchlorate) were further assessed using CORMIX to determine how the concentrations mix and dilute with distance into the littoral zone (described in Section 5.1.1.3). Table 6-7 presents the estimated MC concentrations extending into Kailua Bay from the discharge points of the HE/Inert Impact drainage area. Figure 6-2 shows a graphical display of the percentage reduction of MC offshore of Kailua Bay from an assumed point source discharge at the shore of Kailua Bay.
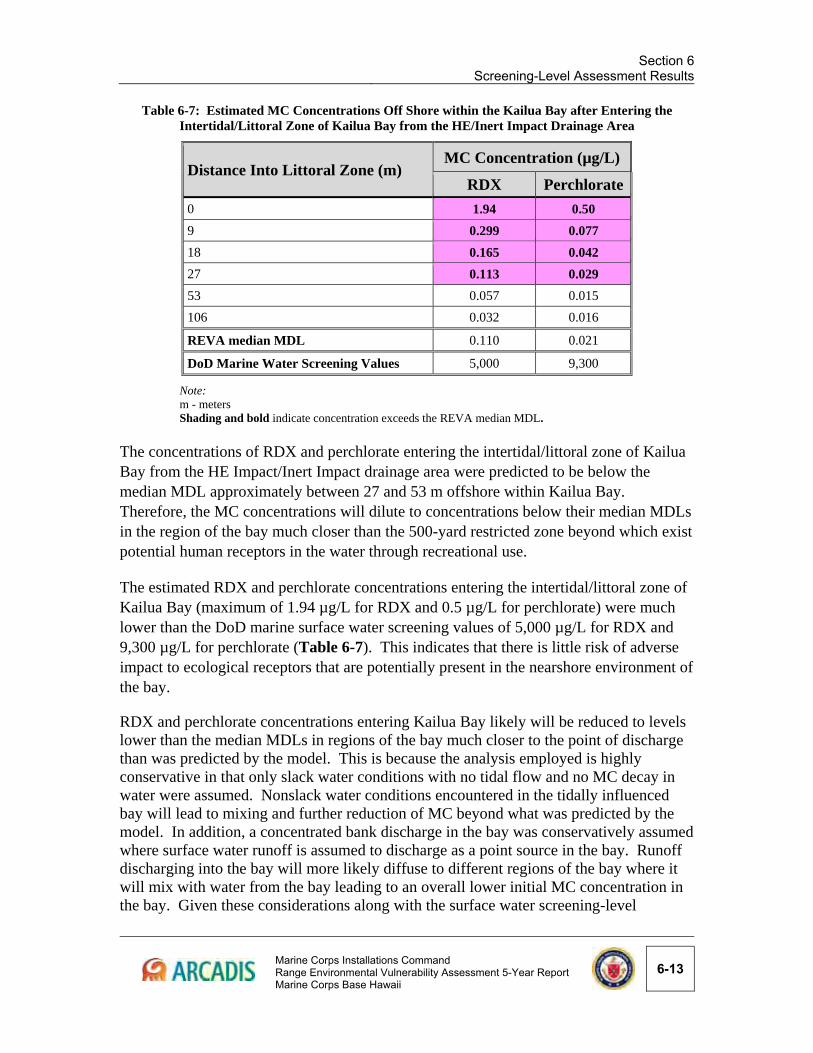
Section 6
Screening-Level Assessment Results
Marine Corps Installations Command Range Environmental Vulnerability Assessment 5-Year Report Marine Corps Base Hawaii
6-13
Table 6-7: Estimated MC Concentrations Off Shore within the Kailua Bay after Entering the Intertidal/Littoral Zone of Kailua Bay from the HE/Inert Impact Drainage Area
Distance Into Littoral Zone (m) MC Concentration (µg/L)
RDX Perchlorate
0 1.94 0.50
9 0.299 0.077
18 0.165 0.042
27 0.113 0.029
53 0.057 0.015
106 0.032 0.016
REVA median MDL 0.110 0.021
DoD Marine Water Screening Values 5,000 9,300
Note: m - meters Shading and bold indicate concentration exceeds the REVA median MDL.
The concentrations of RDX and perchlorate entering the intertidal/littoral zone of Kailua Bay from the HE Impact/Inert Impact drainage area were predicted to be below the median MDL approximately between 27 and 53 m offshore within Kailua Bay. Therefore, the MC concentrations will dilute to concentrations below their median MDLs in the region of the bay much closer than the 500-yard restricted zone beyond which exist potential human receptors in the water through recreational use.
The estimated RDX and perchlorate concentrations entering the intertidal/littoral zone of Kailua Bay (maximum of 1.94 µg/L for RDX and 0.5 µg/L for perchlorate) were much lower than the DoD marine surface water screening values of 5,000 µg/L for RDX and 9,300 µg/L for perchlorate (Table 6-7). This indicates that there is little risk of adverse impact to ecological receptors that are potentially present in the nearshore environment of the bay.
RDX and perchlorate concentrations entering Kailua Bay likely will be reduced to levels lower than the median MDLs in regions of the bay much closer to the point of discharge than was predicted by the model. This is because the analysis employed is highly conservative in that only slack water conditions with no tidal flow and no MC decay in water were assumed. Nonslack water conditions encountered in the tidally influenced bay will lead to mixing and further reduction of MC beyond what was predicted by the model. In addition, a concentrated bank discharge in the bay was conservatively assumed where surface water runoff is assumed to discharge as a point source in the bay. Runoff discharging into the bay will more likely diffuse to different regions of the bay where it will mix with water from the bay leading to an overall lower initial MC concentration in the bay. Given these considerations along with the surface water screening-level
Section 6 Screening-Level Assessment Results
6-14
Marine Corps Installations Command Range Environmental Vulnerability Assessment 5-Year Report Marine Corps Base Hawaii
assessment results, no additional assessment of surface water is recommended at this time.
Sediment
Table 6-8 presents the estimated annual average edge-of-loading-area concentrations in sediment from the HE Impact and Inert Impact MC loading areas draining within the HE/Inert Impact drainage area. Based on the screening-level calculations, the average annual concentration of TNT in sediment at the edge of HE Impact MC loading area was predicted to be above the REVA median MDL, and the concentration was predicted to be below the MDL for the Inert Impact Area. The average annual concentrations of HMX, RDX, and perchlorate in sediment were predicted to be below REVA median MDLs at the edge of both HE Impact and Inert Impact MC loading areas modeled within the HE/Inert Impact drainage area.
Table 6-8: Screening-Level Estimates of Annual Average Edge-of-Loading-Area MC Concentrations in Sediment within the HE/Inert Impact Drainage Area
MC Loading Area
MC Concentration (µg/kg)
HMX RDX TNT Perchlorate
HE Impact Area ~0 15.2 48.7 ~0
Inert Impact Area N/A 0.002 ~0 ~0
REVA median MDL for sediment 51 32.5 25 0.18
Note: N/A – not modeled because the MC loading rate was estimated to be negligible Shading and bold indicate concentration exceeds the REVA median MDL.
Additional assessment was conducted to estimate the annual average MC concentrations in sediment entering the Kailua Bay from the HE/Inert Impact drainage area. Average annual MC concentrations in sediment entering the Kailua Bay were predicted to be below REVA median MDLs (Table 6-9).

Kailua BayCOORDINATE SYSTEM: UTM ZONE: 18NDATUM: WGS 1984UNITS: METERS
DATE: APRIL 2014
SOURCE: MCB HAWAII ENVIRONMENTAL AND RANGE CONTROL OFFICES 2013 ESRI, 2013
FIGURE 6-2CORMIX Simulated Result Showing
MC Concentration Reduction inKailua Bay from an AssumedDischarge Point at the Shore
of Kailua BayMCBH Kaneohe BayRange Environmental
Vulnerability Assessment MCB Hawaii, Oahu, HI
LEGENDInstallation Boundary
KBRTF Boundary
500-Yard Boundary
MC Loading Area
Drainage AreaHE Impact/Inert Impact
Assumed Discharge Point
HE/Inert Drainage - Percent Reduction of MC<84.6 Percent84.6 to 91.5 Percent91.5 to 94.2 Percent94.2 to 99 Percent
MCBH Kaneohe Bay
0 400 800200Feet
Directionto discharge
500-Yard Boundary
Section 6 Screening-Level Assessment Results
6-16
Marine Corps Installations Command Range Environmental Vulnerability Assessment 5-Year Report Marine Corps Base Hawaii
This page intentionally blank
Section 6
Screening-Level Assessment Results
Marine Corps Installations Command Range Environmental Vulnerability Assessment 5-Year Report Marine Corps Base Hawaii
6-17
Table 6-9: Screening-Level Estimates of Annual Average MC Concentrations in Sediment Entering the Kailua Bay from the HE/Inert Impact Drainage Area
Drainage Area (acres) Estimated MC Concentration (µg/kg)
HMX RDX TNT Perchlorate
28 ~0 0.423 1.36 ~0
REVA Median MDL for sediment 51 32.5 25 0.18
Based on the results of the sediment screening-level assessment, no further evaluation of this transport pathway is recommended at this time.
Groundwater Screening-Level Assessment Results 6.1.3.The groundwater screening-level assessment was conducted for the HE Impact and Inert Impact MC loading areas within the HE/Inert Impact drainage area. Similar to the surface water and sediment screening assessments, HMX transport via groundwater mechanisms was only assessed for the HE Impact MC loading area. RDX, TNT, and perchlorate were assessed for both HE Impact and Inert Impact MC loading areas.
The initial step of the Part I groundwater screening-level assessment was used to determine the maximum MC concentrations potentially reaching the groundwater table at the two MC loading areas assessed within the HE/Inert Impact MC loading area. In doing this, the estimated MC loading rates (Table 6-2) were divided by recharge rate values that were estimated for the MC loading areas based on slope and land cover. Table 6-10 shows the estimated MC concentration in infiltrating water at the MC loading areas. Concentrations of RDX, TNT, and perchlorate were estimated to exceed REVA median MDLs at HE Impact MC loading area, and only the concentration of perchlorate was estimated to exceed the REVA median MDL at the Inert Impact MC loading area.
Table 6-10: Estimated Maximum MC Concentrations in Infiltrating Water at the MC Loading Areas within the HE/Inert Impact Drainage Area
MC Loading Area
Recharge Rate
(feet/year)
Estimated Maximum Infiltration Concentration (µg/L)
HMX RDX TNT Perchlorate
HE Impact Area 0.29 0.018 830 180 16
Inert Impact Area 0.37 N/A 0.07 0.002 3.7
REVA median MDL for water 0.114 0.110 0.113 0.021
Note: N/A – not modeled because the MC loading area was estimated to be negligible Shading and bold indicate concentrations exceed the REVA median MDL.
As a result, MC were modeled for migration through the vadose zone as follows:
Section 6 Screening-Level Assessment Results
6-18
Marine Corps Installations Command Range Environmental Vulnerability Assessment 5-Year Report Marine Corps Base Hawaii
RDX and TNT were modeled at the HE Impact MC loading area.
Perchlorate was modeled at the HE Impact and the Inert Impact MC loading areas.
Vadose zone modeling was performed using VLEACH, a vadose zone leaching model with a post-processing step that included decay. The screening-level model was conducted using the methodology described in Section 5.2.2.2. The flow and transport parameters used in the model are presented in Appendix B. The model was run for a simulation time of 150 years.
Modeling results, including conservative (e.g., no decay) and decay scenarios, are presented in Table 6-11 for comparison. Using the estimated infiltration rates ranging from 3.5 to 4.4 in/yr based on soil types, land cover, and slope of the MC loading areas (Appendix B) and a depth to groundwater of approximately 11 to 17 feet bgs, the minimum travel time for MC to reach the water table at concentrations equal to the respective MC median MDL is approximately 3 years, which occurs at the HE Impact MC loading area. Without decay, all MC were predicted ultimately to reach the water table for the modeling simulations. When decay is included, RDX and TNT at the HE Impact MC loading area were predicted to degrade to concentrations below their respective REVA median MDLs before reaching the water table. The perchlorate concentrations at both HE Impact and Inert Impact MC loading areas modeled are estimated to exceed the REVA median MDL.
Table 6-11: Modeled MC Concentrations Reaching the Water Table at MC Loading Areas within the HE/Inert Impact Drainage Area
MC Loading Area
MC
REVA median MDL (µg/L)
VLEACH (No Decay) VLEACH (Decay)
Steady-State Concentration at Water Table
(µg/L)
Time to Exceed Median MDL (yr)
Steady-State Concentration at Water Table
(µg/L)
Time to
Exceed Median MDL (yr)
HE Impact Area
HMX 0.114 NM NM NM NM
RDX 0.110 828 ~3 ~0 --
TNT 0.113 178 ~90 ~0 --
Perchlorate 0.021 16 ~3 16 ~3
Inert Impact Area
HMX 0.114 N/A N/A N/A N/A
RDX 0.110 NM NM NM NM
TNT 0.113 NM NM NM NM
Perchlorate 0.021 3.7 ~7 3.7 ~7
Note: N/A – not modeled because the MC loading area was estimated to be negligible NM – not modeled, as the constituent was eliminated for further assessment from the initial groundwater screening assessment.
Section 6
Screening-Level Assessment Results
Marine Corps Installations Command Range Environmental Vulnerability Assessment 5-Year Report Marine Corps Base Hawaii
6-19
yr – years -- denotes that the MC degrade before reaching the water table. Shading and bold indicate concentration exceeds the REVA median MDL.
Based on the vadose zone results, saturated zone modeling was conducted for perchlorate at the HE Impact and the Inert Impact MC loading areas to estimate the MC concentration potentially reaching the shoreline of Kailua Bay from each MC loading area.
The saturated zone modeling was conducted using BIOCHLOR 2.2 for movement through the unconfined aquifer mainly consisting of interlayered lava and tuff with marine sediments to the shoreline of Kailua Bay. The modeling was conducted as described in Section 5.2.2.3. The model was run for a simulation time of 500 years. The BIOCHLOR simulation results produced the estimated MC concentration profile along the centerline of flow between the source zones at the MC loading areas and nearest receptor locations (shoreline of Kailua Bay).
The assessment predicted that perchlorate concentrations exceeded the REVA median MDLs in shallow groundwater reaching the shoreline of Kailua Bay from the HE Impact and Inert Impact MC loading areas modeled for saturated zone transport through the unconfined aquifer (Table 6-12). These results were used in the surface water screening-level assessment for estimating perchlorate concentrations entering the intertidal/littoral zone of Kailua Bay down gradient of the MC loading areas (presented in Section 6.1.2).
Table 6-12: Model-Estimated MC Concentrations Reaching the Shoreline of Kailua Bay within the HE/Inert Impact Drainage Area
MC Loading Area Concentration Potentially Reaching the
Shoreline of Kailua Bay (µg/L)
HMX RDX TNT Perchlorate
HE Impact Area N/A N/A N/A 16
Inert Impact Area N/A N/A N/A 3.7
REVA median MDL for water 0.114 0.110 0.113 0.021
Note: N/A – not modeled, as MC was eliminated for further assessment based on the first two steps of the groundwater screening assessment Shading and bold indicate concentration exceeds the REVA median MDL.
6.2. Range 8/Range 8A Drainage Area The drainage area is located on the northeastern part of KBRTF down gradient of the Ulupau Crater Head; it is approximately 37 acres, with all of the drainage area located inside the KBRTF boundary (Figure 6-3). With the exception of one unnamed
Section 6 Screening-Level Assessment Results
6-20
Marine Corps Installations Command Range Environmental Vulnerability Assessment 5-Year Report Marine Corps Base Hawaii
ephemeral drainage channel, there are no surface water features located within the drainage area.
The two MC loading areas located within the Range 8/Range 8A drainage area are Range 8 and Range 8A, as listed in Table 6-1.
Military Munitions
Military munitions authorized for use within the two MC loading areas are primarily small arms, hand grenades, claymores, and non-fragmentation producing explosives up to 5 lb NEW.
Conceptual Site Model 6.2.1.
6.2.1.1. Estimated Munitions Constituents Loading The MC loading areas within the Range 8/Range 8A drainage area are shown in Figure 6-3. The MC Loading Rate Calculator was used to estimate the amount of MC deposited annually within these MC loading areas using assumptions detailed in Section 3 (Table 6-13). The total noncontiguous surface areas of the individual MC loading areas and their specific loading rates are provided for the baseline and five-year review periods. Specifically, the analysis suggests that RDX and TNT represent the highest range MC loading within the Range 8/Range 8A drainage area. The highest overall loading is represented by RDX. The highest MC loading rate observed in the watershed was RDX at the R-8A MC loading area.
The combined noncontiguous MC loading areas in the five-year review are 274 m2 larger than the single MC loading area identified in the baseline within this drainage area (Table 6-13). This is due to the addition of Range 8A, which was constructed in 2007, being added to the calculations for this drainage area. Expenditure data from the five-year review period were used to identify two MC loading areas in the Range 8/Range 8A drainage area. The estimated MC loading rates for the five-year review suggest overall loading within this drainage area has decreased marginally since the baseline assessment (Table 6-13). Using limited data available and the approach developed during the baseline assessment, no HMX loading was estimated across the drainage area. However, HMX was estimated at relatively low loading rates in the five-year review. Although perchlorate loading is still relatively low compared to the other drainage area at the installation, it increased by approximately two orders
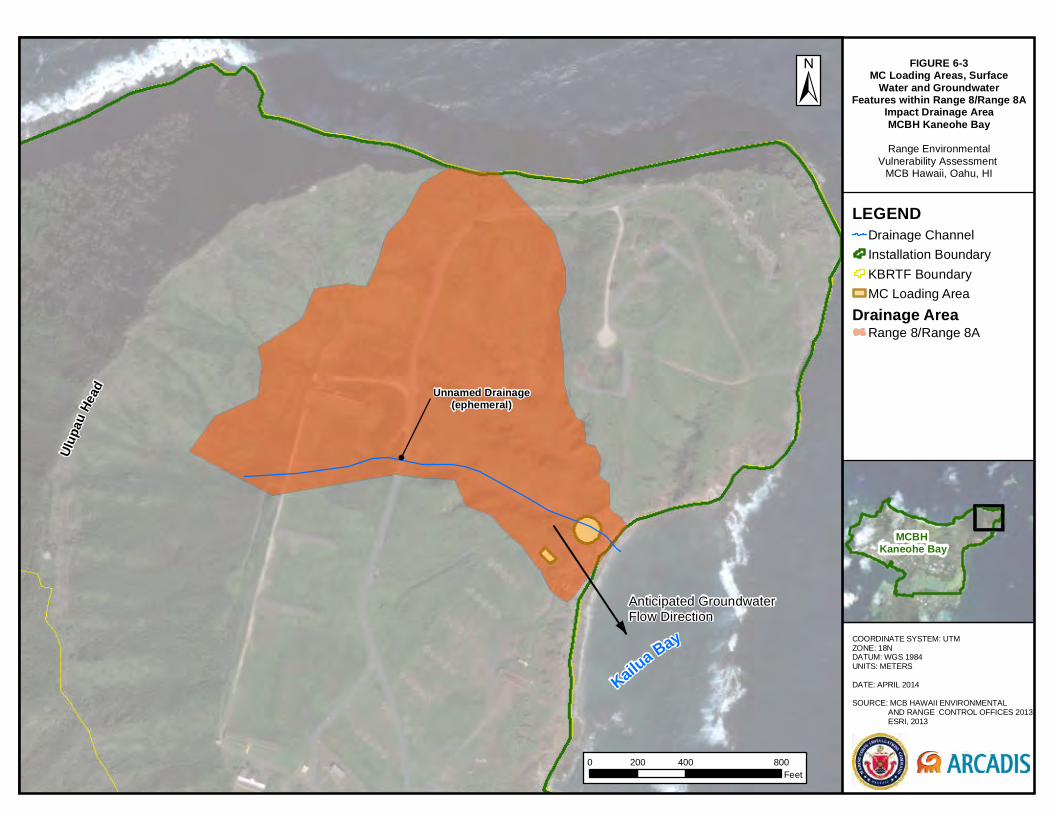
Ulupa
u Hea
d
Kailua Bay COORDINATE SYSTEM: UTM ZONE: 18NDATUM: WGS 1984UNITS: METERS
DATE: APRIL 2014
SOURCE: MCB HAWAII ENVIRONMENTAL AND RANGE CONTROL OFFICES 2013 ESRI, 2013
FIGURE 6-3MC Loading Areas, Surface
Water and GroundwaterFeatures within Range 8/Range 8A
Impact Drainage AreaMCBH Kaneohe BayRange Environmental
Vulnerability Assessment MCB Hawaii, Oahu, HI
LEGENDDrainage Channel
Installation Boundary
KBRTF Boundary
MC Loading Area
Drainage AreaRange 8/Range 8A
MCBH Kaneohe Bay
0 400 800200Feet
Unnamed Drainage(ephemeral)
Anticipated GroundwaterFlow Direction
Section 6 Screening-Level Assessment Results
6-22
Marine Corps Installations Command Range Environmental Vulnerability Assessment 5-Year Report Marine Corps Base Hawaii
This page intentionally blank
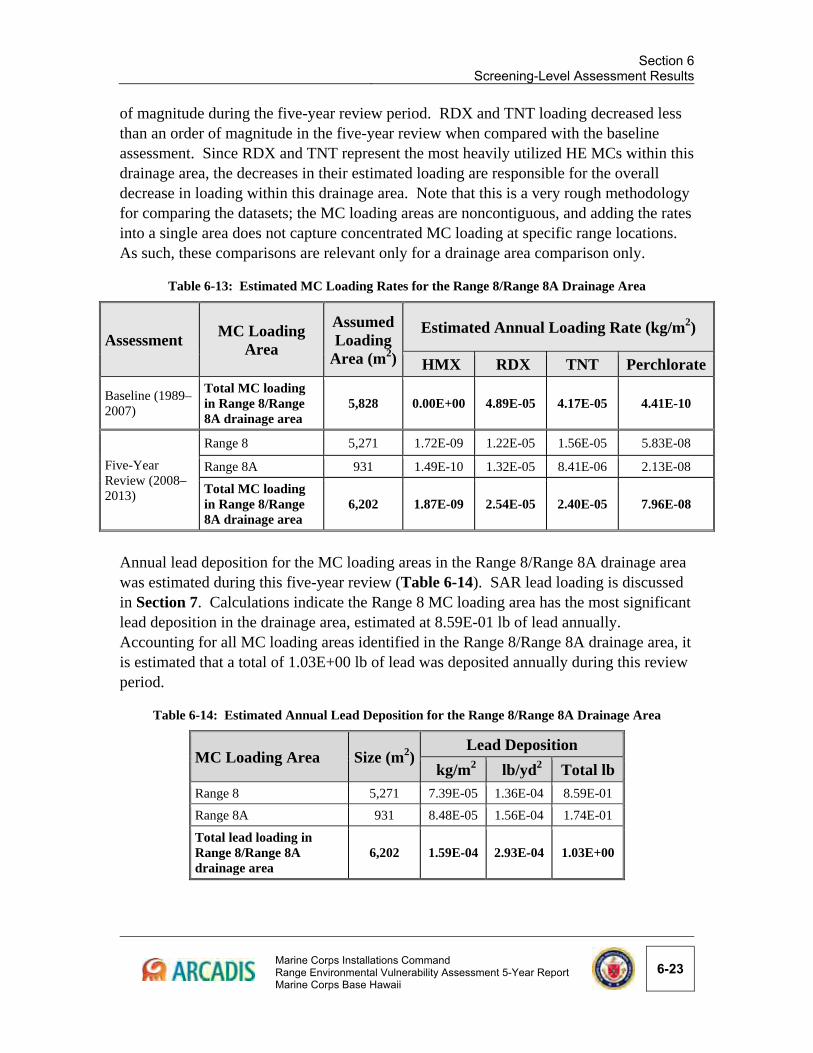
Section 6
Screening-Level Assessment Results
Marine Corps Installations Command Range Environmental Vulnerability Assessment 5-Year Report Marine Corps Base Hawaii
6-23
of magnitude during the five-year review period. RDX and TNT loading decreased less than an order of magnitude in the five-year review when compared with the baseline assessment. Since RDX and TNT represent the most heavily utilized HE MCs within this drainage area, the decreases in their estimated loading are responsible for the overall decrease in loading within this drainage area. Note that this is a very rough methodology for comparing the datasets; the MC loading areas are noncontiguous, and adding the rates into a single area does not capture concentrated MC loading at specific range locations. As such, these comparisons are relevant only for a drainage area comparison only.
Table 6-13: Estimated MC Loading Rates for the Range 8/Range 8A Drainage Area
Assessment MC Loading
Area
Assumed Loading
Area (m2)
Estimated Annual Loading Rate (kg/m2)
HMX RDX TNT Perchlorate
Baseline (1989–2007)
Total MC loading in Range 8/Range 8A drainage area
5,828 0.00E+00 4.89E-05 4.17E-05 4.41E-10
Five-Year Review (2008–2013)
Range 8 5,271 1.72E-09 1.22E-05 1.56E-05 5.83E-08
Range 8A 931 1.49E-10 1.32E-05 8.41E-06 2.13E-08
Total MC loading in Range 8/Range 8A drainage area
6,202 1.87E-09 2.54E-05 2.40E-05 7.96E-08
Annual lead deposition for the MC loading areas in the Range 8/Range 8A drainage area was estimated during this five-year review (Table 6-14). SAR lead loading is discussed in Section 7. Calculations indicate the Range 8 MC loading area has the most significant lead deposition in the drainage area, estimated at 8.59E-01 lb of lead annually. Accounting for all MC loading areas identified in the Range 8/Range 8A drainage area, it is estimated that a total of 1.03E+00 lb of lead was deposited annually during this review period.
Table 6-14: Estimated Annual Lead Deposition for the Range 8/Range 8A Drainage Area
MC Loading Area Size (m2)Lead Deposition
kg/m2 lb/yd2 Total lb
Range 8 5,271 7.39E-05 1.36E-04 8.59E-01
Range 8A 931 8.48E-05 1.56E-04 1.74E-01
Total lead loading in Range 8/Range 8A drainage area
6,202 1.59E-04 2.93E-04 1.03E+00
Section 6 Screening-Level Assessment Results
6-24
Marine Corps Installations Command Range Environmental Vulnerability Assessment 5-Year Report Marine Corps Base Hawaii
6.2.1.2. Geography and Topography The Range 8/Range 8A drainage area is located at the Ulupau Crater, down gradient of the Crater Head. The topography is steep and generally slopes to the southeast. Available contour data indicate the elevation of the drainage area ranges from approximately 7 feet amsl at the most southeastern part of the drainage area to approximately 292 feet amsl near the northern boundary of the drainage area (MCBH, 2013a). Based on available spatial data, the slope within the drainage area can range from less than 1% to approximately 66%. The average is estimated to be 27%.
6.2.1.3. Surface Water Features There are no perennial surface water features within the Range 8/Range 8A drainage area; the major feature is an unnamed ephemeral drainage channel that drains eastward through the entire length of the drainage area and discharges into the Kailua Bay (Figure 6-3).
Surface water runoff from the Range 8 MC loading area largely drains to the unnamed ephemeral drainage channel, which drains southeast within the MC loading area to the Kailua Bay approximately 115 feet down gradient of the MC loading area. Surface water runoff from the Range 8A MC loading area naturally would likely drain south to discharge directly into the Kailua Bay approximately 223 feet down gradient of the MC loading area; however, the structure of the SACON® range, which is enclosed by walls, prevents runoff from the range and instead collects and stores water within the range, which then evaporates or infiltrates to the ground.
6.2.1.4. Soil Characteristics and Land Cover Soils within the Range 8/Range 8A drainage area consist of the rRK and the Makalapa clay (MdB) map unit symbols. These soils consist of silts and clays and are poorly drained with very slow permeability. Both soil map unit symbols have a neutral pH (7.0 and 7.6), organic content of 4.5% and 1.25%, low and moderate inherent soil erodibility factors (0.1 and 0.28), and high runoff potentials (both have hydrologic group D) (USDA NRCS, 2013).
Approximately 60% of the Range 8/Range 8A drainage area is vegetated. The vegetated area generally includes grass and isolated bushes and forest. Approximately 40% of the drainage area is unvegetated with exposed soil.
6.2.1.5. Erosion Potential The Range 8/Range 8A drainage area was estimated to have moderate soil erosion potential (a RUSLE predicted soil loss value of 1.14E-02 kg/m2/d). The estimated moderate soil erosion potential is largely a result of the steep topographic slope common to the area. Invasive species encroachment may also accelerate erosion, as these types of vegetation have led to higher frequency of fires in the crater (SRGII, 2004).
Section 6
Screening-Level Assessment Results
Marine Corps Installations Command Range Environmental Vulnerability Assessment 5-Year Report Marine Corps Base Hawaii
6-25
The Range 8 MC loading area was estimated to have high soil erosion potential. This is a result of the steep topographic slope and poor vegetation cover at the MC loading area. Range 8A is estimated to have low soil erosion potential. This is because the range is enclosed by walls, preventing overland storm water flow from the range restricting soil erosion.
6.2.1.6. Groundwater Characteristics Groundwater characteristics data specific to the Range 8/Range 8A drainage area are not available. The general groundwater characteristics for the Ulupau Crater area where the Range 8/Range 8A drainage area is located are described in Section 6.1.1.6.
6.2.1.7. Potential Surface Water and Groundwater Pathways
Surface Water and Sediment Pathways
The estimated surface water runoff rates at the Range 8 and the Range 8A MC loading areas within the Range 8/Range 8A drainage area are 0.37 and 0.04 m3/m2/yr, respectively. Based on these estimated surface water runoff rates, there is a moderate (Range 8) and low (Range 8A) potential for MC to migrate via surface water runoff from the MC loading areas within the drainage area.
The Range 8 MC loading area was estimated to have a moderate potential for MC to migrate via surface water runoff. This is because of the steep topography, poor vegetation cover, and soil type with high runoff potential (hydrologic group D) at the MC loading area.
The low potential for MC migration via surface water runoff estimated at the Range 8A MC loading area is attributable to the structure of the SACON® range, which includes walls that prevent surface water runoff and the release of surface water and sediment.
The high soil erosion potential that may occur at the Range 8 MC loading area makes soil erosion an important mechanism for MC mobilization into surface water runoff. MC transported through surface water runoff and sediment from the Range 8 MC loading area could reach the unnamed ephemeral drainage channel and, ultimately, the Kailua Bay located approximately 115 feet down gradient southeast of the MC loading area. As described above, the structure of the Range 8A MC loading area prevents the escape of surface water and sediment. Therefore, there is minimal potential for MC migration through surface water and sediment pathways from the Range 8A MC loading area.
Groundwater Pathways
MC deposited on the MC loading areas within the Range 8/Range 8A drainage area have the potential to migrate down to the unconfined aquifer in the Honolulu Formation but
Section 6 Screening-Level Assessment Results
6-26
Marine Corps Installations Command Range Environmental Vulnerability Assessment 5-Year Report Marine Corps Base Hawaii
are highly unlikely to migrate farther to the deeper Koolua basalt confined aquifer. It generally is assumed that MC potentially transported to the shallow unconfined aquifer have the potential to migrate to the coastline and discharge into the Kailua Bay.
6.2.1.8. Potential Surface Water and Groundwater Receptors
Surface Water and Sediment Receptors
The surface water and sediment receptor location of concern associated with the Range 8/Range 8A drainage area is the Kailua Bay, which contains ecological receptors. The identified receptors within the Kailua Bay are discussed in Section 6.1.1.8.
Groundwater Receptors
The identified groundwater receptors of concern associated with the Range8/Range 8A drainage area include ecological receptors found in Kailua Bay, as discussed in Section 6.1.1.8.
Surface Water and Sediment Screening-Level Assessment Results 6.2.2.The surface water and sediment screening-level assessment was conducted for the Range 8 MC loading area located within the Range 8/Range 8A drainage area (Figure 6-3) and was not conducted for the Range 8A MC loading area. The Range 8A MC loading area, which is also located within the Range 8/Range 8A drainage area, was not modeled for surface water and sediment transport because, as discussed in previous sections, the range design (SACON® range with walls) limits and prevents the release of surface water and sediment from the range. As a result, there is minimal potential for MC migration through surface water and sediment pathways at the Range 8A MC loading area. All MC transported with overland flow within the Range 8/Range 8A drainage area are assumed to originate from the Range 8 MC loading area.
All REVA MC were modeled at the Range 8 MC loading area.
Surface Water
Table 6-15 presents the annual average edge-of-loading-area concentrations in surface water runoff from the Range 8 MC loading area draining within the Range 8/Range 8A drainage area. Based on the screening-level calculations, the annual average RDX, TNT, and perchlorate concentrations at the edge of the MC loading area were predicted to be above REVA median MDLs. The annual average HMX concentration at the edge of the MC loading area was predicted to be below the REVA median MDL.
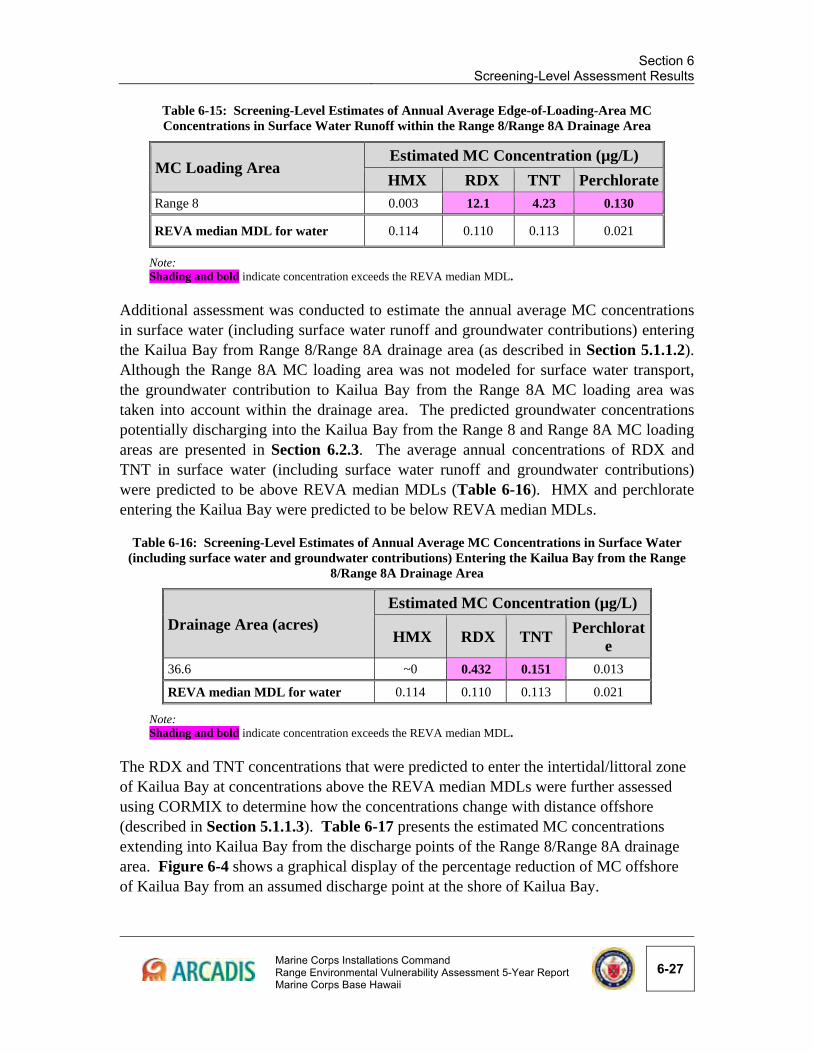
Section 6
Screening-Level Assessment Results
Marine Corps Installations Command Range Environmental Vulnerability Assessment 5-Year Report Marine Corps Base Hawaii
6-27
Table 6-15: Screening-Level Estimates of Annual Average Edge-of-Loading-Area MC Concentrations in Surface Water Runoff within the Range 8/Range 8A Drainage Area
MC Loading Area Estimated MC Concentration (µg/L)
HMX RDX TNT Perchlorate
Range 8 0.003 12.1 4.23 0.130
REVA median MDL for water 0.114 0.110 0.113 0.021
Note: Shading and bold indicate concentration exceeds the REVA median MDL.
Additional assessment was conducted to estimate the annual average MC concentrations in surface water (including surface water runoff and groundwater contributions) entering the Kailua Bay from Range 8/Range 8A drainage area (as described in Section 5.1.1.2). Although the Range 8A MC loading area was not modeled for surface water transport, the groundwater contribution to Kailua Bay from the Range 8A MC loading area was taken into account within the drainage area. The predicted groundwater concentrations potentially discharging into the Kailua Bay from the Range 8 and Range 8A MC loading areas are presented in Section 6.2.3. The average annual concentrations of RDX and TNT in surface water (including surface water runoff and groundwater contributions) were predicted to be above REVA median MDLs (Table 6-16). HMX and perchlorate entering the Kailua Bay were predicted to be below REVA median MDLs.
Table 6-16: Screening-Level Estimates of Annual Average MC Concentrations in Surface Water (including surface water and groundwater contributions) Entering the Kailua Bay from the Range
8/Range 8A Drainage Area
Drainage Area (acres) Estimated MC Concentration (µg/L)
HMX RDX TNT Perchlorat
e
36.6 ~0 0.432 0.151 0.013
REVA median MDL for water 0.114 0.110 0.113 0.021
Note: Shading and bold indicate concentration exceeds the REVA median MDL.
The RDX and TNT concentrations that were predicted to enter the intertidal/littoral zone of Kailua Bay at concentrations above the REVA median MDLs were further assessed using CORMIX to determine how the concentrations change with distance offshore (described in Section 5.1.1.3). Table 6-17 presents the estimated MC concentrations extending into Kailua Bay from the discharge points of the Range 8/Range 8A drainage area. Figure 6-4 shows a graphical display of the percentage reduction of MC offshore of Kailua Bay from an assumed discharge point at the shore of Kailua Bay.
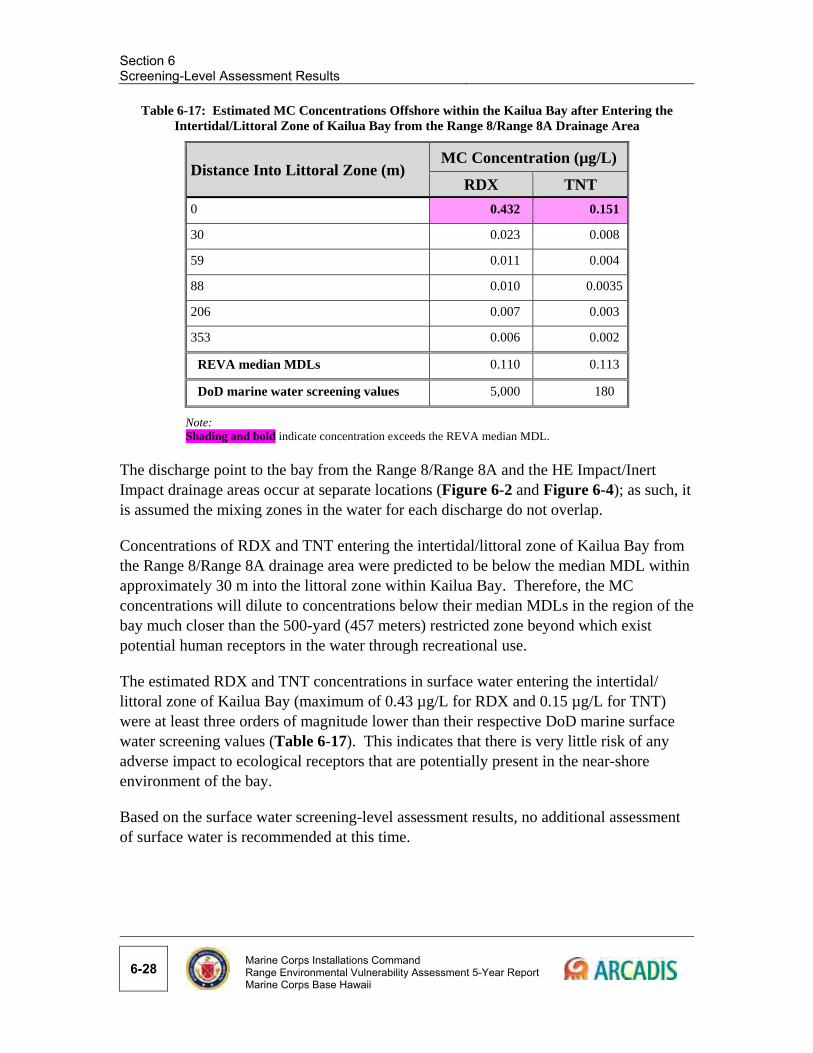
Section 6 Screening-Level Assessment Results
6-28
Marine Corps Installations Command Range Environmental Vulnerability Assessment 5-Year Report Marine Corps Base Hawaii
Table 6-17: Estimated MC Concentrations Offshore within the Kailua Bay after Entering the Intertidal/Littoral Zone of Kailua Bay from the Range 8/Range 8A Drainage Area
Distance Into Littoral Zone (m) MC Concentration (µg/L)
RDX TNT
0 0.432 0.151
30 0.023 0.008
59 0.011 0.004
88 0.010 0.0035
206 0.007 0.003
353 0.006 0.002
REVA median MDLs 0.110 0.113
DoD marine water screening values 5,000 180
Note: Shading and bold indicate concentration exceeds the REVA median MDL.
The discharge point to the bay from the Range 8/Range 8A and the HE Impact/Inert Impact drainage areas occur at separate locations (Figure 6-2 and Figure 6-4); as such, it is assumed the mixing zones in the water for each discharge do not overlap.
Concentrations of RDX and TNT entering the intertidal/littoral zone of Kailua Bay from the Range 8/Range 8A drainage area were predicted to be below the median MDL within approximately 30 m into the littoral zone within Kailua Bay. Therefore, the MC concentrations will dilute to concentrations below their median MDLs in the region of the bay much closer than the 500-yard (457 meters) restricted zone beyond which exist potential human receptors in the water through recreational use.
The estimated RDX and TNT concentrations in surface water entering the intertidal/ littoral zone of Kailua Bay (maximum of 0.43 µg/L for RDX and 0.15 µg/L for TNT) were at least three orders of magnitude lower than their respective DoD marine surface water screening values (Table 6-17). This indicates that there is very little risk of any adverse impact to ecological receptors that are potentially present in the near-shore environment of the bay.
Based on the surface water screening-level assessment results, no additional assessment of surface water is recommended at this time.
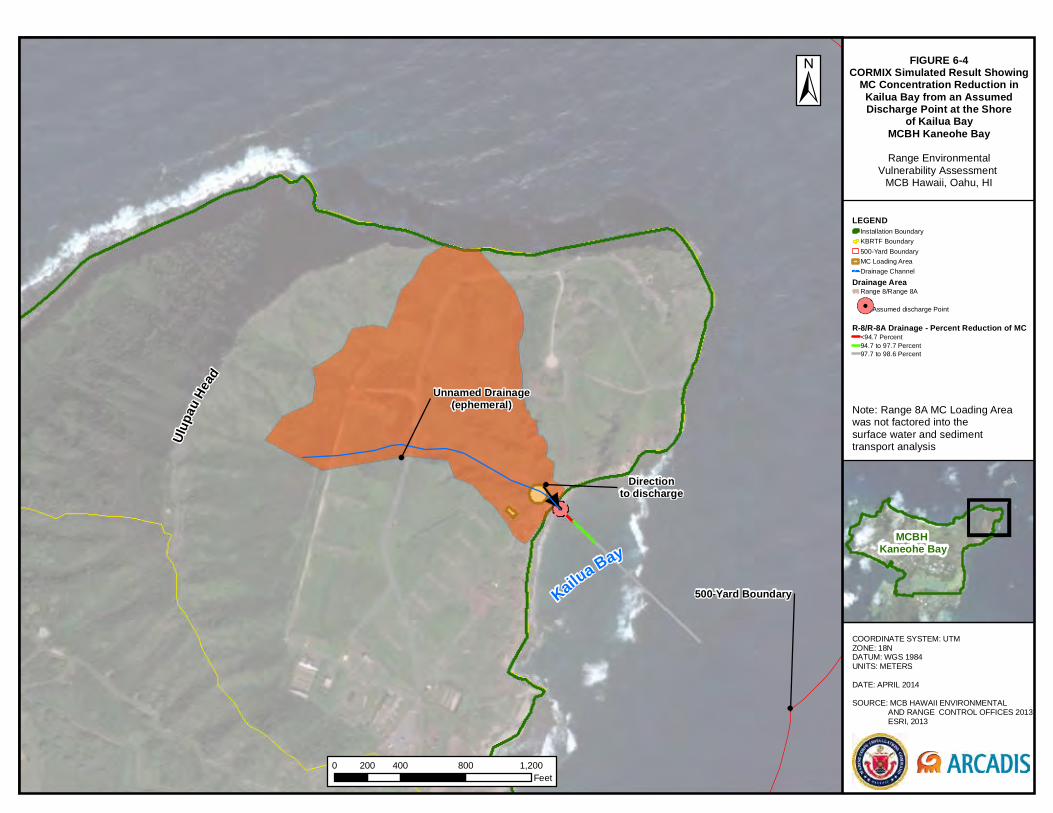
Ulupa
u Head
Kailua Bay
COORDINATE SYSTEM: UTM ZONE: 18NDATUM: WGS 1984UNITS: METERS
DATE: APRIL 2014
SOURCE: MCB HAWAII ENVIRONMENTAL AND RANGE CONTROL OFFICES 2013 ESRI, 2013
FIGURE 6-4CORMIX Simulated Result Showing
MC Concentration Reduction inKailua Bay from an AssumedDischarge Point at the Shore
of Kailua BayMCBH Kaneohe BayRange Environmental
Vulnerability Assessment MCB Hawaii, Oahu, HI
LEGENDInstallation Boundary
KBRTF Boundary
500-Yard Boundary
MC Loading Area
Drainage Channel
Drainage AreaRange 8/Range 8A
Assumed discharge Point
R-8/R-8A Drainage - Percent Reduction of MC<94.7 Percent94.7 to 97.7 Percent97.7 to 98.6 Percent
MCBH Kaneohe Bay
0 400 800 1,200200Feet
Unnamed Drainage(ephemeral) Note: Range 8A MC Loading Area
was not factored into the surface water and sedimenttransport analysis
Directionto discharge
500-Yard Boundary

Section 6 Screening-Level Assessment Results
6-30
Marine Corps Installations Command Range Environmental Vulnerability Assessment 5-Year Report Marine Corps Base Hawaii
This page intentionally blank
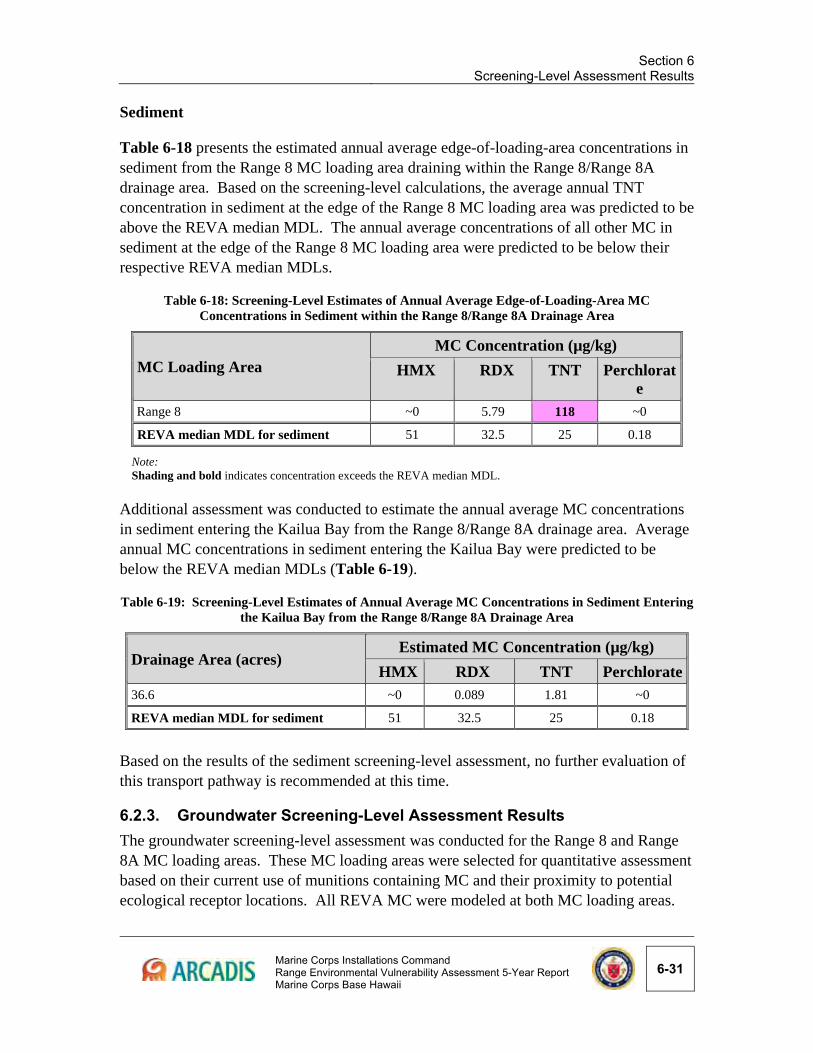
Section 6
Screening-Level Assessment Results
Marine Corps Installations Command Range Environmental Vulnerability Assessment 5-Year Report Marine Corps Base Hawaii
6-31
Sediment
Table 6-18 presents the estimated annual average edge-of-loading-area concentrations in sediment from the Range 8 MC loading area draining within the Range 8/Range 8A drainage area. Based on the screening-level calculations, the average annual TNT concentration in sediment at the edge of the Range 8 MC loading area was predicted to be above the REVA median MDL. The annual average concentrations of all other MC in sediment at the edge of the Range 8 MC loading area were predicted to be below their respective REVA median MDLs.
Table 6-18: Screening-Level Estimates of Annual Average Edge-of-Loading-Area MC Concentrations in Sediment within the Range 8/Range 8A Drainage Area
MC Loading Area MC Concentration (µg/kg)
HMX RDX TNT Perchlorate
Range 8 ~0 5.79 118 ~0
REVA median MDL for sediment 51 32.5 25 0.18
Note: Shading and bold indicates concentration exceeds the REVA median MDL.
Additional assessment was conducted to estimate the annual average MC concentrations in sediment entering the Kailua Bay from the Range 8/Range 8A drainage area. Average annual MC concentrations in sediment entering the Kailua Bay were predicted to be below the REVA median MDLs (Table 6-19).
Table 6-19: Screening-Level Estimates of Annual Average MC Concentrations in Sediment Entering the Kailua Bay from the Range 8/Range 8A Drainage Area
Drainage Area (acres) Estimated MC Concentration (µg/kg)
HMX RDX TNT Perchlorate
36.6 ~0 0.089 1.81 ~0
REVA median MDL for sediment 51 32.5 25 0.18
Based on the results of the sediment screening-level assessment, no further evaluation of this transport pathway is recommended at this time.
Groundwater Screening-Level Assessment Results 6.2.3.The groundwater screening-level assessment was conducted for the Range 8 and Range 8A MC loading areas. These MC loading areas were selected for quantitative assessment based on their current use of munitions containing MC and their proximity to potential ecological receptor locations. All REVA MC were modeled at both MC loading areas.
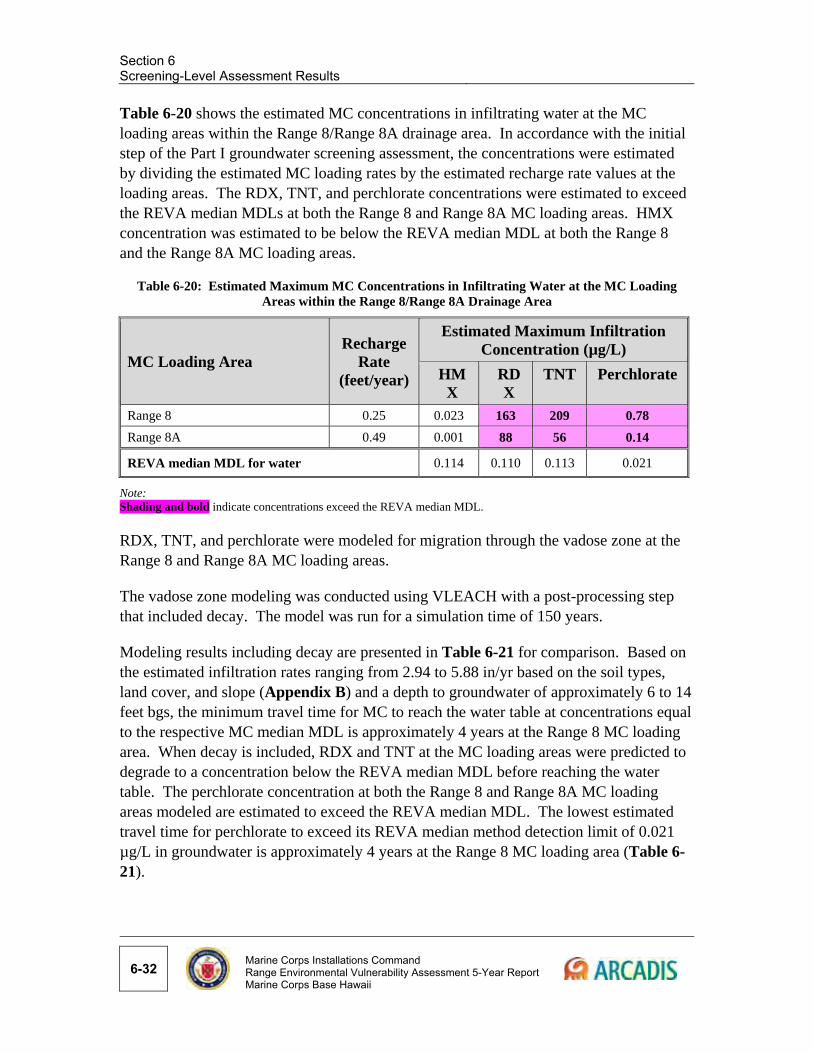
Section 6 Screening-Level Assessment Results
6-32
Marine Corps Installations Command Range Environmental Vulnerability Assessment 5-Year Report Marine Corps Base Hawaii
Table 6-20 shows the estimated MC concentrations in infiltrating water at the MC loading areas within the Range 8/Range 8A drainage area. In accordance with the initial step of the Part I groundwater screening assessment, the concentrations were estimated by dividing the estimated MC loading rates by the estimated recharge rate values at the loading areas. The RDX, TNT, and perchlorate concentrations were estimated to exceed the REVA median MDLs at both the Range 8 and Range 8A MC loading areas. HMX concentration was estimated to be below the REVA median MDL at both the Range 8 and the Range 8A MC loading areas.
Table 6-20: Estimated Maximum MC Concentrations in Infiltrating Water at the MC Loading Areas within the Range 8/Range 8A Drainage Area
MC Loading Area Recharge
Rate (feet/year)
Estimated Maximum Infiltration Concentration (µg/L)
HMX
RDX
TNT Perchlorate
Range 8 0.25 0.023 163 209 0.78
Range 8A 0.49 0.001 88 56 0.14
REVA median MDL for water 0.114 0.110 0.113 0.021
Note: Shading and bold indicate concentrations exceed the REVA median MDL.
RDX, TNT, and perchlorate were modeled for migration through the vadose zone at the Range 8 and Range 8A MC loading areas.
The vadose zone modeling was conducted using VLEACH with a post-processing step that included decay. The model was run for a simulation time of 150 years.
Modeling results including decay are presented in Table 6-21 for comparison. Based on the estimated infiltration rates ranging from 2.94 to 5.88 in/yr based on the soil types, land cover, and slope (Appendix B) and a depth to groundwater of approximately 6 to 14 feet bgs, the minimum travel time for MC to reach the water table at concentrations equal to the respective MC median MDL is approximately 4 years at the Range 8 MC loading area. When decay is included, RDX and TNT at the MC loading areas were predicted to degrade to a concentration below the REVA median MDL before reaching the water table. The perchlorate concentration at both the Range 8 and Range 8A MC loading areas modeled are estimated to exceed the REVA median MDL. The lowest estimated travel time for perchlorate to exceed its REVA median method detection limit of 0.021 µg/L in groundwater is approximately 4 years at the Range 8 MC loading area (Table 6-21).
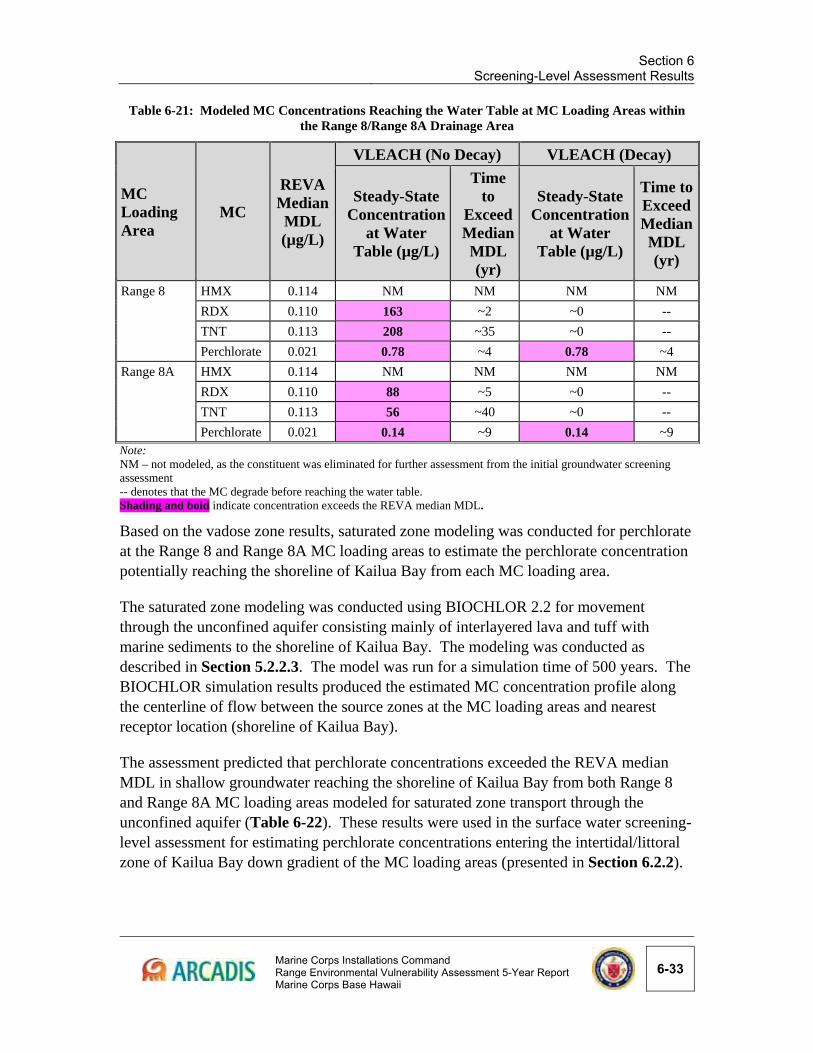
Section 6
Screening-Level Assessment Results
Marine Corps Installations Command Range Environmental Vulnerability Assessment 5-Year Report Marine Corps Base Hawaii
6-33
Table 6-21: Modeled MC Concentrations Reaching the Water Table at MC Loading Areas within the Range 8/Range 8A Drainage Area
MC Loading Area
MC
REVA Median MDL (µg/L)
VLEACH (No Decay) VLEACH (Decay)
Steady-State Concentration
at Water Table (µg/L)
Time to
Exceed Median MDL (yr)
Steady-State Concentration
at Water Table (µg/L)
Time to Exceed Median MDL (yr)
Range 8 HMX 0.114 NM NM NM NM
RDX 0.110 163 ~2 ~0 --
TNT 0.113 208 ~35 ~0 --
Perchlorate 0.021 0.78 ~4 0.78 ~4
Range 8A HMX 0.114 NM NM NM NM
RDX 0.110 88 ~5 ~0 --
TNT 0.113 56 ~40 ~0 --
Perchlorate 0.021 0.14 ~9 0.14 ~9 Note: NM – not modeled, as the constituent was eliminated for further assessment from the initial groundwater screening assessment -- denotes that the MC degrade before reaching the water table. Shading and bold indicate concentration exceeds the REVA median MDL.
Based on the vadose zone results, saturated zone modeling was conducted for perchlorate at the Range 8 and Range 8A MC loading areas to estimate the perchlorate concentration potentially reaching the shoreline of Kailua Bay from each MC loading area.
The saturated zone modeling was conducted using BIOCHLOR 2.2 for movement through the unconfined aquifer consisting mainly of interlayered lava and tuff with marine sediments to the shoreline of Kailua Bay. The modeling was conducted as described in Section 5.2.2.3. The model was run for a simulation time of 500 years. The BIOCHLOR simulation results produced the estimated MC concentration profile along the centerline of flow between the source zones at the MC loading areas and nearest receptor location (shoreline of Kailua Bay).
The assessment predicted that perchlorate concentrations exceeded the REVA median MDL in shallow groundwater reaching the shoreline of Kailua Bay from both Range 8 and Range 8A MC loading areas modeled for saturated zone transport through the unconfined aquifer (Table 6-22). These results were used in the surface water screening-level assessment for estimating perchlorate concentrations entering the intertidal/littoral zone of Kailua Bay down gradient of the MC loading areas (presented in Section 6.2.2).
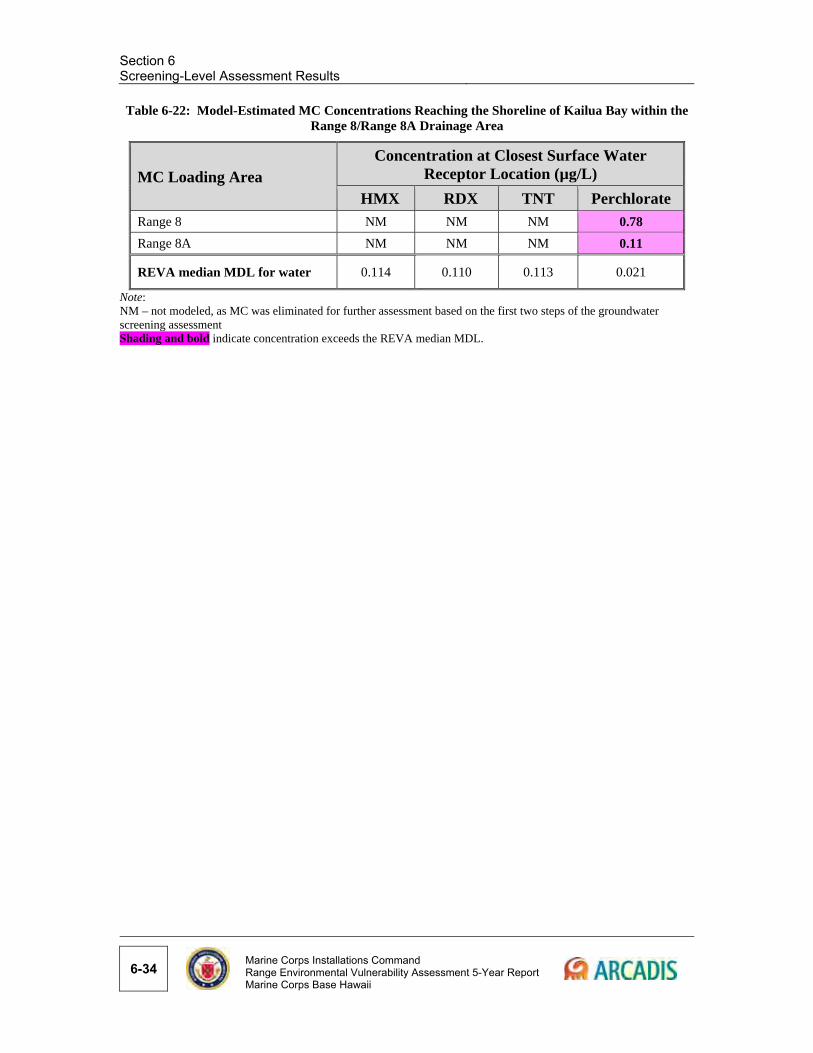
Section 6 Screening-Level Assessment Results
6-34
Marine Corps Installations Command Range Environmental Vulnerability Assessment 5-Year Report Marine Corps Base Hawaii
Table 6-22: Model-Estimated MC Concentrations Reaching the Shoreline of Kailua Bay within the Range 8/Range 8A Drainage Area
MC Loading Area Concentration at Closest Surface Water
Receptor Location (µg/L)
HMX RDX TNT Perchlorate
Range 8 NM NM NM 0.78
Range 8A NM NM NM 0.11
REVA median MDL for water 0.114 0.110 0.113 0.021
Note: NM – not modeled, as MC was eliminated for further assessment based on the first two steps of the groundwater screening assessment Shading and bold indicate concentration exceeds the REVA median MDL.
Marine Corps Installations Command Range Environmental Vulnerability Assessment 5-Year Report Marine Corps Base Hawaii
7-1
7. Small Arms Range Assessments
The REVA indicator MC for SARs is lead because it is the most prevalent (by weight) potentially hazardous constituent associated with small arms ammunition. As described in previous sections, fate and transport parameters for lead at SARs are dependent on site-specific geochemical properties, which cannot be determined solely by physical observation. Training areas and ranges that use only small arms ammunition that are .50 cal or smaller are qualitatively assessed. Ranges that perform joint small arms and live-fire training with HE munitions are not assessed through this process; rather, they are assessed through the MC loading estimation and modeling processes previously described. Only operational SARs are addressed in this protocol; historical use SARs that are no longer used are not assessed due to lack of information to adequately perform an assessment.
The SARAP was developed as a qualitative approach to identify and assess factors that influence the potential for lead to migrate from an operational range. These factors include the following:
Range design and layout, including any best management practices
Physical and chemical characteristics of the area
Past and present operation and maintenance practices
In addition, potential receptors and pathways are identified relative to the SAR being assessed. The potential for an identified receptor to be impacted by MC migration through an identified pathway is evaluated.
7.1. Summary of the Small Arms Range Assessment Protocol The SARAP produces two scores: the sum of surface water elements and the sum of groundwater elements. These determine the overall rankings for surface water and groundwater conditions. The scoring system assigns minimal, moderate, and high values for each category:
Minimal (0 to 29 points) – The SAR has minimal or no potential for lead migration to a receptor, but actions may be necessary to ensure that continuing training activity at the range does not pose a future threat to human health or the environment.
Moderate (30 to 49 points) – The SAR may have the potential for lead migration to a receptor, most likely indicating no immediate threat to human health or the environment, but actions may be necessary to prevent a greater or future concern.
High (50 to 65 points) – The SAR most likely has the potential for lead migration to an identified receptor and requires additional action(s).
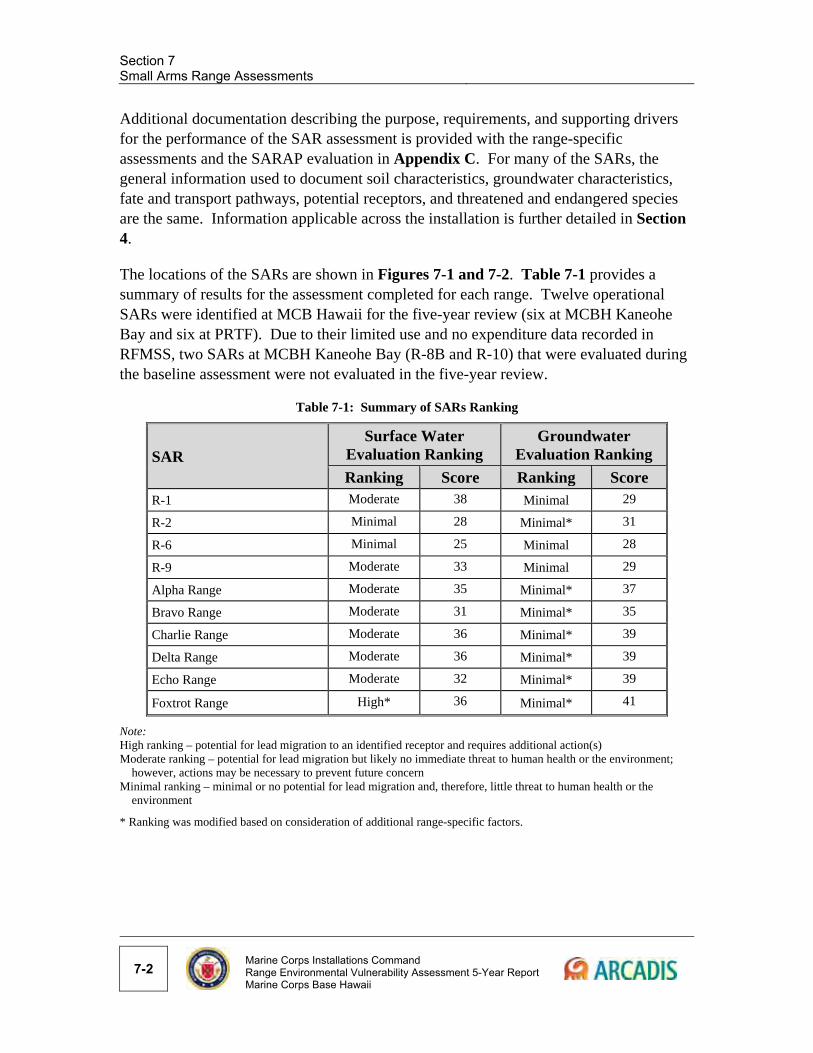
Section 7 Small Arms Range Assessments
7-2
Marine Corps Installations Command Range Environmental Vulnerability Assessment 5-Year Report Marine Corps Base Hawaii
Additional documentation describing the purpose, requirements, and supporting drivers for the performance of the SAR assessment is provided with the range-specific assessments and the SARAP evaluation in Appendix C. For many of the SARs, the general information used to document soil characteristics, groundwater characteristics, fate and transport pathways, potential receptors, and threatened and endangered species are the same. Information applicable across the installation is further detailed in Section 4.
The locations of the SARs are shown in Figures 7-1 and 7-2. Table 7-1 provides a summary of results for the assessment completed for each range. Twelve operational SARs were identified at MCB Hawaii for the five-year review (six at MCBH Kaneohe Bay and six at PRTF). Due to their limited use and no expenditure data recorded in RFMSS, two SARs at MCBH Kaneohe Bay (R-8B and R-10) that were evaluated during the baseline assessment were not evaluated in the five-year review.
Table 7-1: Summary of SARs Ranking
SAR Surface Water
Evaluation Ranking Groundwater
Evaluation Ranking
Ranking Score Ranking Score R-1 Moderate 38 Minimal 29
R-2 Minimal 28 Minimal* 31
R-6 Minimal 25 Minimal 28
R-9 Moderate 33 Minimal 29
Alpha Range Moderate 35 Minimal* 37
Bravo Range Moderate 31 Minimal* 35
Charlie Range Moderate 36 Minimal* 39
Delta Range Moderate 36 Minimal* 39
Echo Range Moderate 32 Minimal* 39
Foxtrot Range High* 36 Minimal* 41
Note: High ranking – potential for lead migration to an identified receptor and requires additional action(s) Moderate ranking – potential for lead migration but likely no immediate threat to human health or the environment;
however, actions may be necessary to prevent future concern Minimal ranking – minimal or no potential for lead migration and, therefore, little threat to human health or the
environment
* Ranking was modified based on consideration of additional range-specific factors.
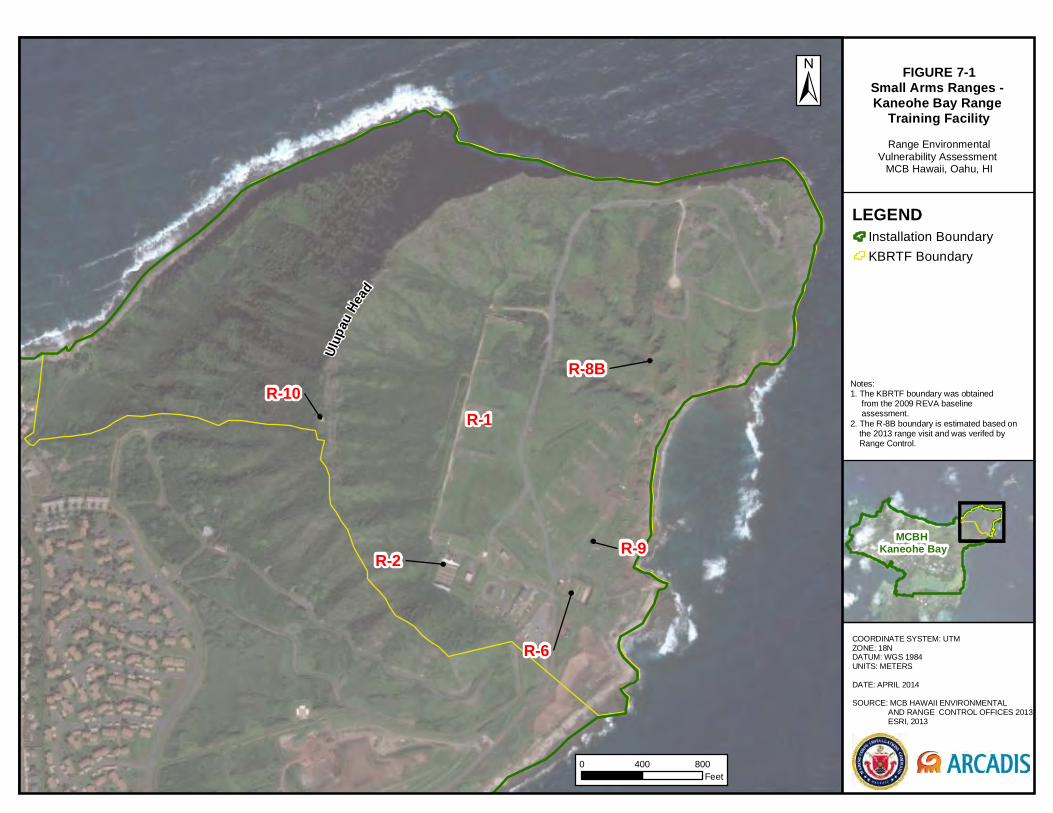
R-10R-1
R-2
R-6
R-9
R-8B
Ulupa
u Head
COORDINATE SYSTEM: UTM ZONE: 18NDATUM: WGS 1984UNITS: METERS
DATE: APRIL 2014
SOURCE: MCB HAWAII ENVIRONMENTAL AND RANGE CONTROL OFFICES 2013 ESRI, 2013
FIGURE 7-1Small Arms Ranges - Kaneohe Bay Range
Training FacilityRange Environmental
Vulnerability Assessment MCB Hawaii, Oahu, HI
LEGENDInstallation Boundary
KBRTF Boundary
MCBH Kaneohe Bay
0 800400Feet
Notes:1. The KBRTF boundary was obtained from the 2009 REVA baseline assessment.2. The R-8B boundary is estimated based on the 2013 range visit and was verifed by Range Control.

Section 7 Small Arms Range Assessments
7-4
Marine Corps Installations Command Range Environmental Vulnerability Assessment 5-Year Report Marine Corps Base Hawaii
This page intentionally blank

Alpha RangeBravo Range
CharlieRange
DeltaRange
EchoRange Foxtrot
Range
COORDINATE SYSTEM: UTM ZONE: 18NDATUM: WGS 1984UNITS: METERS
DATE: APRIL 2014
SOURCE: MCB HAWAII/ENVIRONMENTAL AND RANGE CONTROL OFFICES 2013 ESRI, 2013
FIGURE 7-2Small Arms Ranges -
Puuloa Range Training FacilityRange Environmental
Vulnerability Assessment MCB Hawaii, Oahu, HI
LEGENDInstallation Boundary
0 1,000500Feet
Puuloa Range Training Facility
Section 7 Small Arms Range Assessments
7-6
Marine Corps Installations Command Range Environmental Vulnerability Assessment 5-Year Report Marine Corps Base Hawaii
This page intentionally blank
Section 7
Small Arms Range Assessments
Marine Corps Installations Command Range Environmental Vulnerability Assessment 5-Year Report Marine Corps Base Hawaii
7-7
The following are changes to SARs at MCB Hawaii that have occurred since the baseline assessment:
R-1 at MCBH Kaneohe Bay was used as a KD range for rifle training and annual qualification until 2010, when KD qualification operations were moved to PRTF.
R-8B at MCBH Kaneohe Bay was constructed in August 2012 as a point-man course.
During the baseline assessment period, R-9 was used as a multipurpose range, including small arms training and mortar firing. Since this time, the activities have been separated into different range designations: R-9 for small arms training and R-9A for mortar firing.
Improvements were made to R-9 at MCBH Kaneohe Bay to address erosion issues. These changes are further detailed in Section 7.2.
A new 1,000-yard firing line was installed at Alpha Range at PRTF.
The backstop berms of several ranges at PRTF were reconstructed due to wear by heavy use and a high rate of erosion. Lead mining also has been conducted at most of the ranges at PRTF in 2011. These changes are further detailed in Section 7.2.
7.2. Range Maintenance Activities A range reconstruction effort was conducted at R-9 at MCBH Kaneohe Bay in November 2010 due to the severely eroded condition of the berm and elevated risk of projectile ricochet. The berm was mined for lead, resulting in the removal of 10,000 lb of recyclable lead and 10,000 lb of nonrecyclable metals and trash (HIES, 2010). The berm soils, identified as built with imported and native materials that were nonconformant for use as a range impact berm (rapid runoff, moderate permeability, and low shrink-swell potential resulting in high erosion hazard), were replaced with material that is more resistant to erosion from bullet impact and winds (i.e., sand-based soil). In addition, the slope of the berm face was reduced from greater than 45 degrees to less than 40 degrees, which also reduced the impact of erosion. The height of the berm was raised from 8–11 feet to a uniform 14 feet high, and two small side berms were added for additional safety containment. Erosion netting and hydro-mulch were added to further reduce erosion along the berm face. A subsurface irrigation system was installed to support continual vegetative growth on the berm face.
In 2011, all SARs at PRTF underwent maintenance activities. According to Range Control personnel, lead mining and berm reconstruction was completed on Alpha Range since the baseline assessment and prior to the installation of the 1,000-yard firing line. This work could not be confirmed through the data collection efforts because it was not discussed in any of the after-action reports received by MCB Hawaii.
At Bravo Range, the bullet pockets on the impact berms were mined for lead. The pockets then were packed, netted, and hydro-mulched (NAVFACHI, 2011). Complete
Section 7 Small Arms Range Assessments
7-8
Marine Corps Installations Command Range Environmental Vulnerability Assessment 5-Year Report Marine Corps Base Hawaii
berm mining and reconstruction could not be done due to the danger of de-stabilizing the bullet deflecting wall on top of the berm. The impact berms at Charlie and Delta Ranges were mined for lead and reconstructed to an increased height of 14 feet with a reduced slope angle. Additionally, the irrigation system was serviced to better facilitate vegetation growth on the face of the impact berm (NAVFACHI, 2011). As with the Charlie and Delta Ranges, the impact berm at Echo Range also was mined for lead and reconstructed and the irrigation system was serviced. Unlike the Charlie and Delta Ranges, Echo Range was reconstructed to its original dimensions (NAVFACHI, 2011).
The Foxtrot Range impact berm was found to be in the most degraded condition compared to the other ranges at PRTF at that time. It was mined for lead and reconstructed to an increased height of 14 feet with a reduced slope angle. The irrigation system also was serviced as part of this maintenance effort. Since the berm reconstruction, severe tidal shifts and weather patterns have caused significant damage to the backside of the impact berm in the form of heavy erosion over the last 18 months. There is currently discussion among MCB Hawaii and Range Control personnel regarding the possibility of either moving the range northward or installing a bullet trap to prevent the impact berm from eroding into the ocean.
7.3. Small Arms Ranges at MCBH Kaneohe Bay There are six SARs at MCBH Kaneohe Bay. All six SARs are located within the KBRTF.
Range 1 7.3.1.
7.3.1.1. Site Background R-1 is a rifle range located along the western interior of Ulupau Crater, oriented to fire from south-southwest to north-northeast; its SDZ extends over 22,000 feet downrange in the same direction over the Pacific Ocean. The earliest known use of this range stems from the 1940s, when it was referred to as the “Fort Hase Rifle Range” (USACE, 2001b). The REVA baseline assessment identified R-1 as a KD rifle range used for rifle training and annual qualification. Range Control personnel indicated that the range continued to be used as a KD range until 2010, when KD qualification operations were moved to PRTF (Bravo Range).
In its KD configuration, the range consisted of 26 firing points and four firing lines (100-, 200-, 300-, and 500-yard lines). A manual target carriage system is present downrange of the firing lines. The natural hillside of the western slopes of Ulupau Crater, between 200 and 400 feet behind the target area, serves as the impact area/berm for fired small arms rounds.
Section 7
Small Arms Range Assessments
Marine Corps Installations Command Range Environmental Vulnerability Assessment 5-Year Report Marine Corps Base Hawaii
7-9
From 2010 to the current timeframe, R-1 has been used as a machinegun and rifle training range. In its current configuration, the majority of fire is directed toward the inert impact area, although some fire is directed toward the original natural hillside behind R-1.
7.3.1.2. Assessment Results The evaluation of R-1 resulted in a moderate ranking for surface water and a minimal ranking for groundwater. The moderate ranking for surface water is based on several factors, including a longer duration of range use, moderate lead loading, no storm water controls in place at the range, no regular range maintenance program, and the presence of ecological receptors nearby. The minimal ranking for groundwater is based on moderate lead loading, moderate precipitation, soil with high clay content, a neutral soil pH, and no nearby receptor exposure points.
Range 2 7.3.2.
7.3.2.1. Site Background R-2 is a KD pistol and shotgun range located at the southern interior reach of Ulupau Crater, just south of R-1; it is oriented for firing from north-northeast to south-southwest. Its SDZ extends approximately 6,000 feet downrange; however, the presence of a bullet trap and overhead baffle system limits the extent of the SDZ. This SAR, established in 1957, is used for individual small arms training, pistol requalification, and recreational exercises (USACE, 2001b). The range consists of 23 firing points and four firing lines (7-, 15-, 25-, and 50-yard lines). A SuperTrap bullet trap utilizing ballistic rubber was installed on the range in 2007. The trap effectively captures fired small arms projectiles; Range Control has not observed projectile ricochet and, as such, the trap has not been mined for lead. The majority of small arms ammunition expended at R-2 consists of various pistol cartridges.
7.3.2.2. Assessment Results The evaluation of R-2 resulted in a minimal ranking for surface water and groundwater. While the average lead loading at R-2 is high, the minimal ranking for surface water was determined based on several factors, including effective runoff/erosion control, a well vegetated range and side berms, and a bullet trap in place. The minimal ranking for groundwater is based on the presence of a bullet trap, high clay content in the soil, and soil sampling results indicating that lead is not migrating vertically. There were also no human or ecological groundwater receptors identified nearby R-2.
Section 7 Small Arms Range Assessments
7-10
Marine Corps Installations Command Range Environmental Vulnerability Assessment 5-Year Report Marine Corps Base Hawaii
Range 6 7.3.3.
7.3.3.1. Site Background R-6, otherwise known as the FBI Range, is a “square bay” range designed to support individual small arms training and qualification. R-6 was constructed in 1999 as a pistol and shotgun range; rifles are also authorized. The FBI constructed this range, though it remains under the control of the Marine Corps. Previous ranges have existed at this same location; it was a practice rifle grenade range from the 1950s to the early 1960s and then a practice machine gun range through the 1970s (USACE, 2001b). R-6 is oriented west-northwest to east-southeast; its SDZ extends approximately 16,000 feet in the same direction over the ocean. Firing lines are established at 3-, 5-, 15-, 25-, and 50-yard lines and contain 25 targets. Authorized ammunition includes pistol, shotgun , and rifle ammunition. The range contains a bullet trap (Supertrap) and lateral, vegetated side berms for containment of expended small arms projectiles.
7.3.3.2. Assessment Results The evaluation of R-6 resulted in a minimal ranking for surface water and for groundwater. While the average lead loading at R-6 is high, the minimal ranking for surface water was determined based on several factors, including effective runoff/erosion control, a well vegetated range and side berms and a bullet trap in place. The minimal ranking for groundwater is based on the presence of a bullet trap and high clay content in the soil. There were also no human or ecological groundwater receptors identified nearby R-6.
Range 8B 7.3.4.
7.3.4.1. Site Background R-8B is a recently constructed (August 2012) point-man course located within the ravine north of R-8. The range contains 16 targets placed on either side of the ravine walls. Range users generally are limited to one or two personnel who traverse the long corridor and conduct single-shot engagements of the targets with semi-automatic rifles. Range Control personnel indicate the range also can support pyrotechnics, smoke grenades, and simmunutions, but they must be placed within containment devices (i.e., empty ammunition cans) to prevent fires.
7.3.4.2. Assessment Results R-8B was not evaluated using the SARAP. The range has had only limited use since its construction, and no expenditures are recorded in RFMSS.
Section 7
Small Arms Range Assessments
Marine Corps Installations Command Range Environmental Vulnerability Assessment 5-Year Report Marine Corps Base Hawaii
7-11
Range 9 7.3.5.
7.3.5.1. Site Background R-9 is a static small arms live-fire training range for engaging point and multiple targets as well as Marine Corps “table” training (MCBH, 2010a). There are eight firing lines at 3, 5, 7, 15, 25, 36, 50, and 100 yards with 24 targets. The pneumatic target system is protected by a low SACON® wall. Shooters are authorized to fire at up to three adjacent targets. An earthen backstop berm, originally constructed in 2004, is present for bullet containment. Allowable weaponry includes shotgun, pistol, and rifles.
During the REVA baseline assessment, R-9 was used as a multipurpose range, including small arms training (firing into the on-range containment berm) and mortar firing (into the impact area). Since that time, these activities have been separated into different range designations: R-9 for small arms training and R-9A for mortar firing.
In November 2010, the impact berm at R-9 was mined and reconstructed to reduce the impact of erosion and support vegetative growth. Two small side berms were added for additional safety containment.
7.3.5.2. Assessment Results The evaluation of R-9 resulted in a moderate ranking for surface water and a minimal ranking for groundwater. The moderate ranking for surface water is based on several factors, including a longer duration of range use, high lead loading, no regular range maintenance program, and only partial storm water engineering controls. The minimal ranking for groundwater is based on moderate precipitation and high clay content in the soil. There were also no human or ecological groundwater receptors identified nearby R-9.
Range 10 7.3.6.
7.3.6.1. Site Background R-10 is a static high-angle sniper range designed to meet the training requirements of precision and tactical marksmen, such as scout snipers, law enforcement, and “designated marksman” (MCBH, 2010a). Its original date of use is unknown, although it is believed to have been in existence since at least 2005. This range consists of a single firing point located on the top of Ulupau Crater. According to installation personnel, direction of fire is toward the R-1 range footprint for distances less than 1,000 yards and toward targets in the impact area for distances greater than 1,000 yards. A “precision shot” target is also allowed within the Ulupau WMA, although it is restricted to a single shot per training event. SDZs originating from this firing point extend approximately 16,000 feet downrange. Authorized ammunition includes various rifle cartridges. Data available
Section 7 Small Arms Range Assessments
7-12
Marine Corps Installations Command Range Environmental Vulnerability Assessment 5-Year Report Marine Corps Base Hawaii
from RFMSS and from interviews with Range Control personnel suggest that use of this range is intermittent.
7.3.6.2. Assessment Results R-10 was not evaluated using the SARAP. Range Control personnel suggest that use of this range is intermittent, and no expenditures are recorded in RFMSS.
7.4. Puuloa Range Training Facility All six SARs are situated in a line adjacent to one another along the southern coastline of PRTF. The southern ends of the ranges hold earthen impact berms; these berms vary in distance from the shoreline, from approximately 20 to 130 feet. Use of these berms began at PRTF after WWII to prevent deposition of fired rounds into the ocean (ERDC, 2003). The direction of fire for all ranges is to the south, where the combined SDZ of these ranges extends over the ocean. The maximum distance of the SDZs for the rifle and pistol ranges is 17,000 and 6,000 feet, respectively. No tracers, automatic weapons, or pyrotechnics are authorized for use at any of these ranges (MCBH, 2010a). Hours of use are limited to 0600–1700 on weekdays and 0800–1700 on weekends; no live-fire operations are conducted at night in consideration of neighboring communities (MCBH, 2010a).
Alpha Range 7.4.1.
7.4.1.1. Site Background Alpha Range is a KD rifle range and is the westernmost of the six ranges at PRTF. The earliest known existence of this range is the early 1920s (USACE, 2001b). The impact berm at Alpha Range inclines upward from the ground surface where the target carriages are located and then levels out to a flat area approximately 30 feet wide. The berm then inclines again to form the actual impact berm face. An 8-inch-thick concrete impact wall with a plywood façade sits atop the berm labeled with the firing line numbers to reduce expenditure distribution across its SDZ. The impact berm is shared with Bravo Range, which is adjacent to Alpha Range to the east. There are six firing lines at 100, 200, 300, 500, 600, and 1,000 yards and 40 target positions at this range. The 1,000-yard firing line was installed at Alpha Range since the baseline assessment to increase long-range rifle training capabilities at PRTF. According to Range Control personnel, lead mining and berm reconstruction was completed on Alpha Range since the baseline assessment and prior to the installation of the 1,000-yard firing line.
7.4.1.2. Assessment Results The evaluation of Alpha Range resulted in a moderate ranking for surface water and a minimal ranking for groundwater. The moderate ranking for surface water is based on several factors, including a longer duration of range use, high lead loading, no regular
Section 7
Small Arms Range Assessments
Marine Corps Installations Command Range Environmental Vulnerability Assessment 5-Year Report Marine Corps Base Hawaii
7-13
range maintenance program, a steep impact berm, and only partial storm water engineering controls. While there is a shallow groundwater table and sandy soil present at Alpha Range, the minimal ranking for groundwater is due to groundwater immediately discharging nearby the range and mixing with ocean water. There were also no human or ecological groundwater receptors identified near the Alpha Range.
Bravo Range 7.4.2.
7.4.2.1. Site Background Bravo Range is a KD rifle range adjacent to the east of Alpha Range. It is one of the most heavily used SAR at MCB Hawaii, as it is the main range used for qualification. Various pistol, shotgun, and rifle cartridges are authorized for use on this range. There are six firing lines at 25, 100, 200, 300, 500, and 600 yards and 60 target positions at this range. Bravo Range was constructed in 1920 and has remained active since that time (USACE, 2001b). The range utilizes an impact berm and plywood façade that are continuous with those present on Alpha Range. In 2011, the bullet pockets on the Bravo Range impact berm were mined for lead. The pockets were then packed, netted, and hydro-mulched (NAVFACHI, 2011). Complete berm mining and reconstruction could not be done due to the danger of destabilizing the bullet deflecting wall on top of the berm.
7.4.2.2. Assessment Results The evaluation of Bravo Range resulted in a moderate ranking for surface water and a minimal ranking for groundwater. The moderate ranking for surface water is based on several factors, including a high lead loading and range use, no regular range maintenance program, a steep impact berm, and only partial storm water engineering controls. While there is a shallow groundwater table and sandy soil present at Bravo Range, the minimal ranking for groundwater is due to groundwater immediately discharging nearby the range and mixing with ocean water. There were also no human or ecological groundwater receptors identified nearby Bravo Range.
Charlie Range 7.4.3.
7.4.3.1. Site Background Charlie Range is a KD pistol range designed to support individual small arms training and qualification. Original use of the area as a range dates to the 1930s (USACE, 2001b). The use of pistol , shotgun, and rifle ammunition is supported at this range (MCBH, 2010a). There are five firing lines marked at 3, 7, 15, 25, and 50 yards and 25 pneumatic turning target positions at this range. In 2011, the impact berm at Charlie Range was mined for lead and reconstructed to prevent erosion and promote vegetative growth.
Section 7 Small Arms Range Assessments
7-14
Marine Corps Installations Command Range Environmental Vulnerability Assessment 5-Year Report Marine Corps Base Hawaii
7.4.3.2. Assessment Results The evaluation of Charlie Range resulted in a moderate ranking for surface water and a minimal ranking for groundwater. The moderate ranking for surface water is based on several factors, including a high lead loading, lack of vegetation and erosion controls, and no regular range maintenance program. While there is a shallow groundwater table and sandy soil present at Charlie Range, the minimal ranking for groundwater is due to groundwater immediately discharging nearby the range and mixing with ocean water. There were also no human or ecological groundwater receptors identified nearby Charlie Range.
Delta Range 7.4.4.
7.4.4.1. Site Background Delta Range is a KD pistol range designed to support individual small arms training and qualification. Original use of the area as a range stems back at least to the 1960s and possibly the 1930s (USACE, 2001b). The use of various pistol, shotgun, and rifle ammunition is supported at this range (MCBH, 2010a). There are three firing lines marked at 7, 15, and 25 yards and 20 pneumatic turning target positions at this range. In 2011, the impact berm at Delta Range was mined for lead and reconstructed to prevent erosion and promote vegetative growth.
7.4.4.2. Assessment Results The evaluation of Delta Range resulted in a moderate ranking for surface water and a minimal ranking for groundwater. The moderate ranking for surface water is based on several factors, including a high lead loading, lack of vegetation on range floor and impact berm, and no regular range maintenance program. While there is a shallow groundwater table and sandy soil present at Delta Range, the minimal ranking for groundwater is due to groundwater immediately discharging nearby the range and mixing with ocean water. There were also no human or ecological groundwater receptors identified nearby Delta Range.
Echo Range 7.4.5.
7.4.5.1. Site Background Echo Range is a KD pistol range designed to support individual small arms training and qualification. Original use of the area as a SAR stems to the 1930s (USACE, 2001b). Pistol, shotgun, and rifle ammunition is permitted for use at this range (MCBH, 2010a). Rifle ammunition represents the largest fraction of all small arms used at this range. Echo Range is equipped with five firing lines marked at 3, 5, 10, 25, and 50 yards and 30 pneumatic turning target positions. As with the Charlie and Delta Ranges, the impact berm at Echo Range was mined for lead and reconstructed.
Section 7
Small Arms Range Assessments
Marine Corps Installations Command Range Environmental Vulnerability Assessment 5-Year Report Marine Corps Base Hawaii
7-15
7.4.5.2. Assessment Results The evaluation of Echo Range resulted in a moderate ranking for surface water and a minimal ranking for groundwater. The moderate ranking for surface water is based on several factors, including the longer duration of use, a high lead loading, and no regular range maintenance program. While there is a shallow groundwater table and sandy soil present at Echo Range, the minimal ranking for groundwater is due to groundwater immediately discharging nearby the range and mixing with ocean water. There were also no human or ecological groundwater receptors identified nearby Echo Range.
Foxtrot Range 7.4.6.
7.4.6.1. Site Background Foxtrot Range is a KD pistol range with similar design and training features as Echo Range and is the easternmost of the six current ranges at PRTF. This range is also one of the most heavily used ranges at PRTF. According to Range Control personnel, it facilitates approximately 80% of annual sustainment training for MCB Hawaii personnel. Original use of the area as a SAR stems to the 1930s (USACE, 2001b). The use of pistol, shotgun, and rifle ammunition is supported at this range (MCBH, 2010a). RFMSS data from the last 5 years indicate that rifle rounds represent the largest fraction of all small arms used at this range. Foxtrot Range is equipped with five firing lines marked at 3, 7, 15, 25, and 50 yards and 40 pneumatic turning target positions.
As with Bravo through Echo Ranges, Foxtrot Range underwent maintenance activities in 2011. The Foxtrot Range impact berm was found to be in the most degraded condition compared to the other ranges at PRTF at that time. It was mined for lead and reconstructed to prevent erosion and promote vegetative growth. Since the berm reconstruction, severe tidal shifts and weather patterns have caused significant damage to the backside of the impact berm in the form of heavy erosion over the last 18 months.
7.4.6.2. Assessment Results The evaluation of Foxtrot Range resulted in a high ranking for surface water and a minimal ranking for groundwater. The high ranking for surface water is based on several factors, including the longer duration of use, a high lead loading, and no regular range maintenance program; however, the main concern at the Foxtrot Range is the threat of an imminent release of MC into the ocean from the impact berm, which was partially eroded in 2012. While there is a shallow groundwater table and sandy soil present at Foxtrot Range, the minimal ranking for groundwater is due to groundwater immediately discharging nearby the range and mixing with ocean water. There were also no human or ecological groundwater receptors identified nearby Foxtrot Range.

Marine Corps Installations Command Range Environmental Vulnerability Assessment 5-Year Report Marine Corps Base Hawaii
8-1
8. References
10 U.S.C.§ 101(e)(3)(2006).
ARCADIS. 2013. Range Environmental Vulnerability Assessment Modeling Assumptions Package Marine Corps Base Hawaii. July 2013.
Aziz, C. and C. Newell. 2002. BIOCHLOR. A Natural Attenuation Decision Support System Version 2.2 User’s Manual Addendum. Developed for the Subsurface Protection and Remediation Division, Natural Risk Management Research Laboratory.
Belt Collins Hawaii (BCH). 1994. Environmental Assessment for the Implementation of Fire Management Actions at Ulupa’u Head Wildlife Management Area. Final.
------. 2002. Ulupa’u Crater Fire Management Study 2002.
Coastal Intensive Site Network (CISNet). 2013. NOAA sponsored Kaneohe Bay Monitoring Network Project. http://www.hawaii.edu/cisnet/contents.htm. Accessed April 2013.
Dashiell, E.P. 1998. Water Quality Problem Identification, Kailua Bay Advisory Counsel.
Defense Ammunition Center (DAC). 2000. Munitions Items Disposition Action System (MIDAS). Report of Findings for: Study of Ammunition Dud and Low Order Detonation Rates, United States Army Defense Ammunition Center.
Department of Defense (DoD). 2004. Directive 4715.11, Environmental and Explosives Safety Management on Operational Ranges within the United States.
------. 2005. Instruction 4715.14, Operational Range Assessments.
Department of the Navy (DoN). 1981. Capital Improvements Camp H. M. Smith, USMC Honolulu, Hawaii.
Drigot, Diane C. and Sustainable Resources Group International, Incorporated (SRGII). 2001. Marine Corps Base Hawaii Integrated Natural Resources Management Plan / Environmental Assessment (MCBH INRMP/EA) (2002–2006).
------. 2006. Marine Corps Base Hawaii Integrated Natural Resources Management Plan Update (MCBH INRMP) (2007–2011).
Section 8 References
8-2
Marine Corps Installations Command Range Environmental Vulnerability Assessment 5-Year Report Marine Corps Base Hawaii
Earth Tech, Incorporated. 2000. Management Practices Plan, Firing Ranges and Impact Berms, Puuloa Training Facility, Marine Corps Base Hawaii, Ewa Beach, Oahu, Hawaii.
------. 2006a. Draft Community Involvement Plan Installation Restoration Program, Marine Corps Base Hawaii, Kanoehe Bay, Hawaii.
------. 2006b. Environmental Background Analysis of Metals in Soil at Navy Oahu Facilities, Oahu, Hawaii.
EMC Engineers, Incorporated (EMC). 1991. Groundwater Monitoring Program Solid Waste Sanitary Landfill Marine Corps Air Station Kaneohe Bay, Oahu, Hawaii.
Environet, Incorporated. 2007. Detection Monitoring Water Quality Report First Semi-annual Monitoring Event 2007 MCBH Kaneohe Bay Municipal Solid Waste Landfill, Kaneohe, Oahu, Hawaii.
Environmental Engineering Services (EES). 2005. Environmental Baseline Survey to Support the Utilities Privatization of the Department of the Navy Water Distribution Systems, Volume I, Pearl Harbor Naval Complex, Former NAS Barbers Point, NAVMAG Lualualei, NCTA Camp Stover, Oahu, Hawaii.
Environmental Science International (ESI). 2006. Environmental Baseline Survey for Public Private Venture Action Various Marine Corps Base Hawaii Housing Areas: MCBH Kaneohe Bay, MCBH Camp H.M. Smith and MCBH Manana Family Housing Areas. Draft.
ERDC. See United States Army Engineer Research and Development Center.
Hawaii Department of Health. 1992. Administrative Rules of the Department of Health (HAR Title 11).
------. 2012. 2008/2010 State of Hawaii Water Quality Monitoring and Assessment Report: Integrated Report to the U.S. Environmental Protection Agency and the U.S. Congress Pursuant to Sections 303(d) and 305(b), Clean Water Act (P.L.97-117).
------. 2013. The State of Hawaii Department of Health Web site. http://health.hawaii.gov/. Accessed April 2013
Hawai’i International Environmental Services, Incorporated (HIES). 2007. Project Work Plan (Draft) De-Lead Puuloa Range Training Facility, Oahu, Hawaii – Marine Corps Base Hawaii.
------. 2010. After Action Report, De-Lead and Stabilize Range 9. Prepared for NAVFAC Hawaii.
Section 8
References
Marine Corps Installations Command Range Environmental Vulnerability Assessment 5-Year Report Marine Corps Base Hawaii
8-3
Headquarters Marine Corps (HQMC). 2009. Range Environmental Vulnerability Assessment Reference Manual.
------. 2010. REVA Five-Year Review Manual
Herman, James, Warrant Officer. 2008. Personal communication (in person) on 13 December 2007 by Malcolm Pirnie, Inc. Subject: Operations of Puuloa Range Training Facility.
Luecker, Elizabeth B., John E. Edkins, Jacqueline R. Francis, Nicholas Morgan, Richard J. Watts, and Linda Lay. 1984. Navy Assessment and Control of Installation Pollutants Initial Assessment Study of Marine Corps Air Station Kaneohe Bay, Hawaii.
Malcolm Pirnie. 2005. Assessment of Models for Evaluating Fate and Transport of Munitions on Operational Ranges.
------. 2009. Internal Working Draft Range Environmental Vulnerability Assessment, Marine Corps Base Hawaii.
------. 2010. Internal Working Draft Range Environmental Vulnerability Assessment, Marine Corps Base Quantico.
Marine Corps Base Hawaii (MCHB). 1994. Boring log data for monitoring wells located at the landfill site.
------. 1997. Base Order P3574.6, Standing Operating Procedures (SOP) for the Range Training Facility.
------. 2002. Ulupa’u Crater Fire Management Study 2002, Marine Corps Base Hawaii Kaneohe Bay.
------. 2005. Joint Hawaii Range Complex Management Plan (RCMP), Volume II. 100% Draft.
------. 2006. Joint Hawaii Range Complex Management Plan (RCMP), Final Draft.
------. 2007. Environmental and Range Control Offices GIS files.
------. 2010a. Base Order P1500.9A, Standing Operating Procedures for Marine Corps Base (MCB) Hawaii Training Areas and Facilities.
------. 2010b. Environmental Assessment and Finding of No Significant Impact for Enhancement of Modular Military Operations in Urban Terrain (MOUT) Facilities at Marine Corps Training Area Bellows, Hawaii.
Section 8 References
8-4
Marine Corps Installations Command Range Environmental Vulnerability Assessment 5-Year Report Marine Corps Base Hawaii
------. 2011. Final Marine Corps Base Hawaii Integrated Natural Resources Management Plan Update – 2012 – 2016.
------. 2012. Environmental Assessment and Finding of No Significant Impact – Construction and Use of an Explosives Training Range at Ulupa’u Crater – Marine Corps Base Hawaii, Kaneohe Bay.
------. 2013a. Site inspection from the REVA 5-Year Review Site Visit and Communications with Installation Personnel.
------. 2013b. Environmental and Range Control Offices GIS files.
McCuen, Richard. H. 1998. Hydrologic Analysis and Design, second edition. Prentice Hall.
Naval Facilities Engineering Command, Hawaii (NAVFACHI). 2006. Marine Corps Base Hawaii Master Plan, Volume 1 – Land Use Plan. Final.
-----. 2011. After Action Report, De-lead and Stabilize Range B-F, Pu’uloa Range Training Facility, Oahu, HI – Marine Corps Base Hawai’i.
Naval Facilities Engineering Command, Pacific (NAVFAC Pacific). 2011. Final After Action Report, Range Sustainability Program, Kaneohe Ranges, Marine Corps Base Hawaii, Kaneohe Bay. December 2011.
------. 2013. Draft After Action Report, Operational Range Clearance, Marine Corps Base Hawaii, Kaneohe Bay, Oahu, HI. January 2013.
Oceanit Townscape, Incorporated. 2007. Central O’ahu Watershed Study. Final Report.
Oki, Delwyn S. 1998. Geohydrology of the Central Oahu, Hawaii, Ground-Water Flow System and Numerical Simulation of the Effects of Additional Pumping. U.S. Geological Survey Water-Resources Investigations Report 97-4276.
ORDATA database. 2012. http://www.jmu.edu/cisr/research/ordata.shtml.
Ravi. V. and J. Johnson. 1997. VLEACH. A One-Dimensional Finite Difference Vadose Zone Leaching Model. Developed for the United State Environmental Protection Agency, Office of Research and Development.
Safe Drinking Water Branch (SDWB). 2008. Underground Injection Control (UIC) Program. http://hawaii.gov/health/environmental/water/sdwb/uic/uicprogrm.html. Accessed February 2008.
Souza, W.R. and Meyer, W. 1995. Numerical Simulation of Regional Changes in Ground-Water Levels and in the Freshwater-Saltwater Interface Induced by Increased
Section 8
References
Marine Corps Installations Command Range Environmental Vulnerability Assessment 5-Year Report Marine Corps Base Hawaii
8-5
Pampage at Barbers Point Shaft, Oahu, Hawaii. USGS Water Resources Investigations Report: 95-4206.
State of Hawaii Office of Planning, Department of Business, Economic Development & Tourism (Hawaii). 2008. Hawaii State Wide GIS Program. http://hawaii.gov/dbedt/gis. Accessed January 2008.
Sustainable Resources Group International, Incorporated (SRGII). 2002a. Marine Corps Base Hawaii Coral Reef Ecosystem Management Study. Final.
------. 2002b. Marine Corps Base Hawaii Marine Corps Training Area Bellows Watershed Impairment Study With Recommendations for Stream and Estuarine Repair.
------. 2004. Landfill and Northeast Crater Catchment Erosion Assessment Report with Recommendations. Final.
------. 2005. Erosion Control Design/Instructions for Range Berms Within Ulupa’u Crater.
------. 2007. Erosion Assessment with Recommendations, Outer Slopes and Southeast Shoreline, Ulupa’u Crater.
Takasaki, K.J., G.T. Hirashima, and E.R. Lubke. 1969. Water resources of windward Oahu, Hawaii. Geological Survey water-supply paper, U.S. Govt. Print. Off. Washington.
Todd, D.K. 1980. Groundwater Hydrology, Wiley, New York, pp. 506-507.
United States Army Corps of Engineers (USACE). 2001a. USACE Bathymetric LiDAR: Hawaiian Islands. US Army Engineer Joint Airborne Lidar Bathymetry Technical Center of Expertise (Eds.) NOAA’s Ocean Service, Coastal Services Center (CSC).
------. 2001b. Range Identification and Preliminary Range Assessment for Marine Corps Base, Hawaii and Associated Sites, Oahu, Hawaii.
------. 2006. Integrated Cultural Resources Management Plan (ICRMP), Marine Corps Base Hawaii (MCBH), 2006 – 2010.
United States Army Engineer Research and Development Center (n.d. and 2003)
United States Department of Agriculture (USDA), Natural Resources Conservation Service (NRCS). 2008.
Section 8 References
8-6
Marine Corps Installations Command Range Environmental Vulnerability Assessment 5-Year Report Marine Corps Base Hawaii
------. 2013. Web Soil Survey 2.0 National Cooperative Soil Survey. http://websoilsurvey.nrcs.usda.gov/app. Accessed April 2013.
United States Fish and Wildlife Service (USFWS). 2008. Final Report – Inventory of Coastal and Marine Resources, Marine Corps Base Hawaii-Kaneohe Bay Kaneohe, Oahu Island, Hawaii.
United States Geological Survey (USGS). 1990. Water Resources Data Hawaii and other Pacific Areas Water Year 1989 Volume 1 Hawaii. U.S. Geological Survey Water-Data Report HI-89-1.
------. 2008. National Water Information System: Web Interface. http://waterdata.usgs .gov/nwis. Accessed February 2008.
Wil Chee – Planning, Incorporated (Wil Chee). 2004. MCBH – Building 1667, KB-75 to KB-78 Remedial Investigation of Various Former UST Sites at Marine Corps Base Hawaii (MCBH) and Camp Smith, Oahu, Hawaii.
Marine Corps Installations Command Range Environmental Vulnerability Assessment 5-Year Report Marine Corps Base Hawaii
A
Appendix A
DOD Screening Values

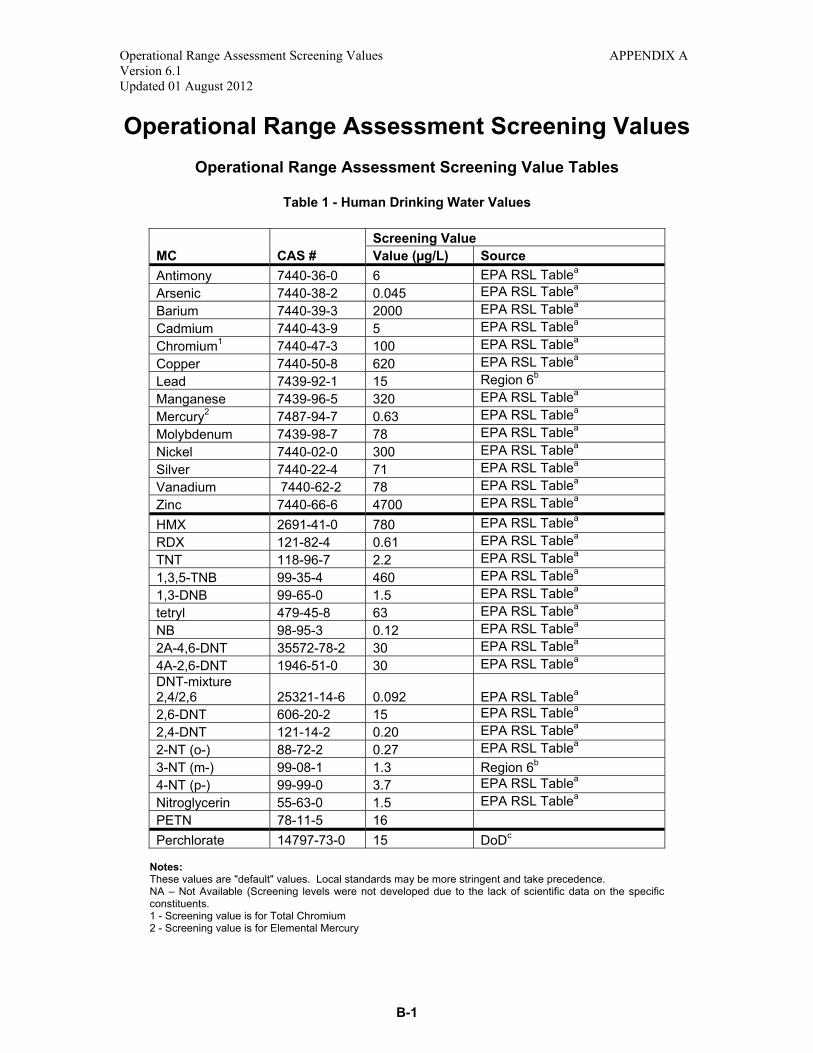
Operational Range Assessment Screening Values APPENDIX A Version 6.1 Updated 01 August 2012
Operational Range Assessment Screening Values Operational Range Assessment Screening Value Tables
Table 1 - Human Drinking Water Values
MC CAS # Screening Value Value (µg/L) Source
Antimony 7440-36-0 6 EPA RSL Tablea Arsenic 7440-38-2 0.045 EPA RSL Tablea Barium 7440-39-3 2000 EPA RSL Tablea Cadmium 7440-43-9 5 EPA RSL Tablea Chromium1 7440-47-3 100 EPA RSL Tablea Copper 7440-50-8 620 EPA RSL Tablea Lead 7439-92-1 15 Region 6b Manganese 7439-96-5 320 EPA RSL Tablea Mercury2 7487-94-7 0.63 EPA RSL Tablea Molybdenum 7439-98-7 78 EPA RSL Tablea Nickel 7440-02-0 300 EPA RSL Tablea Silver 7440-22-4 71 EPA RSL Tablea Vanadium 7440-62-2 78 EPA RSL Tablea Zinc 7440-66-6 4700 EPA RSL Tablea HMX 2691-41-0 780 EPA RSL Tablea RDX 121-82-4 0.61 EPA RSL Tablea TNT 118-96-7 2.2 EPA RSL Tablea 1,3,5-TNB 99-35-4 460 EPA RSL Tablea 1,3-DNB 99-65-0 1.5 EPA RSL Tablea tetryl 479-45-8 63 EPA RSL Tablea NB 98-95-3 0.12 EPA RSL Tablea 2A-4,6-DNT 35572-78-2 30 EPA RSL Tablea 4A-2,6-DNT 1946-51-0 30 EPA RSL Tablea DNT-mixture 2,4/2,6 25321-14-6 0.092 EPA RSL Tablea 2,6-DNT 606-20-2 15 EPA RSL Tablea 2,4-DNT 121-14-2 0.20 EPA RSL Tablea 2-NT (o-) 88-72-2 0.27 EPA RSL Tablea 3-NT (m-) 99-08-1 1.3 Region 6b 4-NT (p-) 99-99-0 3.7 EPA RSL Tablea Nitroglycerin 55-63-0 1.5 EPA RSL Tablea PETN 78-11-5 16Perchlorate 14797-73-0 15 DoDc
Notes: These values are "default" values. Local standards may be more stringent and take precedence. NA – Not Available (Screening levels were not developed due to the lack of scientific data on the specific constituents. 1 - Screening value is for Total Chromium 2 - Screening value is for Elemental Mercury
B-1
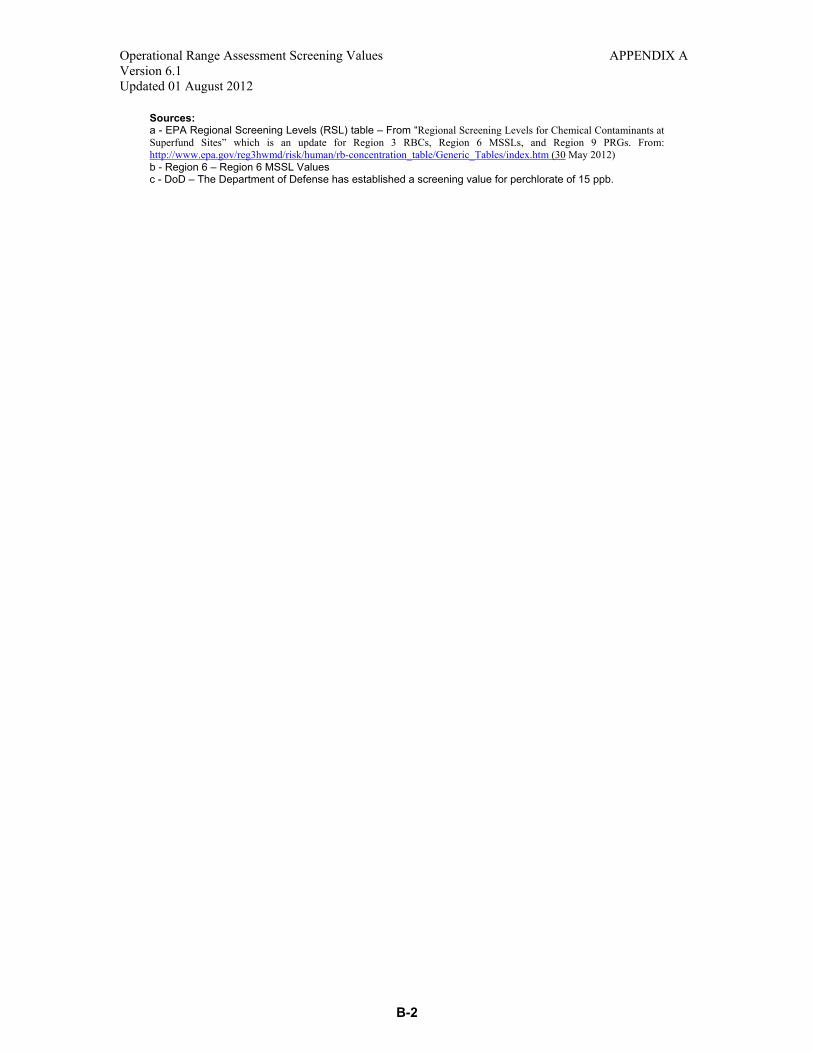
Operational Range Assessment Screening Values APPENDIX A Version 6.1 Updated 01 August 2012
Sources: a - EPA Regional Screening Levels (RSL) table – From “Regional Screening Levels for Chemical Contaminants at Superfund Sites” which is an update for Region 3 RBCs, Region 6 MSSLs, and Region 9 PRGs. From: http://www.epa.gov/reg3hwmd/risk/human/rb-concentration_table/Generic_Tables/index.htm (30 May 2012) b - Region 6 – Region 6 MSSL Values c - DoD – The Department of Defense has established a screening value for perchlorate of 15 ppb.
B-2
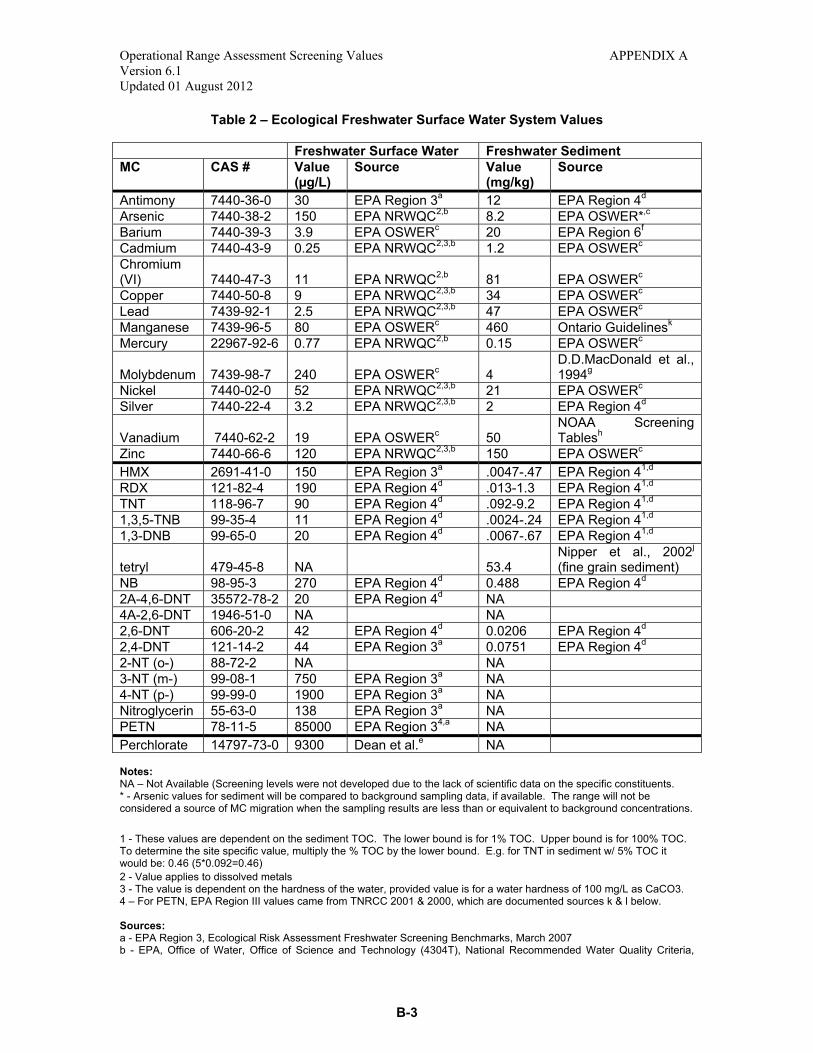
Operational Range Assessment Screening Values APPENDIX A Version 6.1 Updated 01 August 2012
Table 2 – Ecological Freshwater Surface Water System Values
Freshwater Surface Water Freshwater Sediment MC CAS # Value
(µg/L) Source Value
(mg/kg) Source
Antimony 7440-36-0 30 EPA Region 3a 12 EPA Region 4d Arsenic 7440-38-2 150 EPA NRWQC2,b 8.2 EPA OSWER*,c Barium 7440-39-3 3.9 EPA OSWERc 20 EPA Region 6f
Cadmium 7440-43-9 0.25 EPA NRWQC2,3,b 1.2 EPA OSWERc Chromium (VI) 7440-47-3 11 EPA NRWQC2,b 81 EPA OSWERc Copper 7440-50-8 9 EPA NRWQC2,3,b 34 EPA OSWERc Lead 7439-92-1 2.5 EPA NRWQC2,3,b 47 EPA OSWERc Manganese 7439-96-5 80 EPA OSWERc 460 Ontario Guidelinesk
Mercury 22967-92-6 0.77 EPA NRWQC2,b 0.15 EPA OSWERc
Molybdenum 7439-98-7 240 EPA OSWERc 4 D.D.MacDonald et al., 1994g
Nickel 7440-02-0 52 EPA NRWQC2,3,b 21 EPA OSWERc Silver 7440-22-4 3.2 EPA NRWQC2,3,b 2 EPA Region 4d
Vanadium 7440-62-2 19 EPA OSWERc 50 NOAA Screening Tablesh
Zinc 7440-66-6 120 EPA NRWQC2,3,b 150 EPA OSWERc HMX 2691-41-0 150 EPA Region 3a .0047-.47 EPA Region 41,d RDX 121-82-4 190 EPA Region 4d .013-1.3 EPA Region 41,d TNT 118-96-7 90 EPA Region 4d .092-9.2 EPA Region 41,d 1,3,5-TNB 99-35-4 11 EPA Region 4d .0024-.24 EPA Region 41,d 1,3-DNB 99-65-0 20 EPA Region 4d .0067-.67 EPA Region 41,d
tetryl 479-45-8 NA 53.4 Nipper et al., 2002j (fine grain sediment)
NB 98-95-3 270 EPA Region 4d 0.488 EPA Region 4d 2A-4,6-DNT 35572-78-2 20 EPA Region 4d NA 4A-2,6-DNT 1946-51-0 NA NA 2,6-DNT 606-20-2 42 EPA Region 4d 0.0206 EPA Region 4d 2,4-DNT 121-14-2 44 EPA Region 3a 0.0751 EPA Region 4d 2-NT (o-) 88-72-2 NA NA 3-NT (m-) 99-08-1 750 EPA Region 3a NA 4-NT (p-) 99-99-0 1900 EPA Region 3a NA Nitroglycerin 55-63-0 138 EPA Region 3a NAPETN 78-11-5 85000 EPA Region 34,a NA Perchlorate 14797-73-0 9300 Dean et al.e NA
Notes: NA – Not Available (Screening levels were not developed due to the lack of scientific data on the specific constituents. * - Arsenic values for sediment will be compared to background sampling data, if available. The range will not beconsidered a source of MC migration when the sampling results are less than or equivalent to background concentrations.
1 - These values are dependent on the sediment TOC. The lower bound is for 1% TOC. Upper bound is for 100% TOC. To determine the site specific value, multiply the % TOC by the lower bound. E.g. for TNT in sediment w/ 5% TOC it would be: 0.46 (5*0.092=0.46) 2 - Value applies to dissolved metals 3 - The value is dependent on the hardness of the water, provided value is for a water hardness of 100 mg/L as CaCO3. 4 – For PETN, EPA Region III values came from TNRCC 2001 & 2000, which are documented sources k & l below.
Sources: a - EPA Region 3, Ecological Risk Assessment Freshwater Screening Benchmarks, March 2007 b - EPA, Office of Water, Office of Science and Technology (4304T), National Recommended Water Quality Criteria,
B-3
Operational Range Assessment Screening Values APPENDIX AVersion 6.1 Updated 01 August 2012
2006. c - EPA Office of Solid Waste and Emergency Response Ecotox Thresholds, January 1996 d - EPA Region 4, Ecological Risk Assessment Bulletins – Supplement to RAGS (EPA 2001) e - Dean, K.E., R.M. Palachek, J.L. Noel, R. Warbritton, J. Aufderheide, and J. Wireman. 2004. Development of Freshwater Water-Quality Criteria for Perchlorate. Environmental Toxicology and Chemistry 23(6):1441-1451. f - EPA Region 6, Screening Level Ecological Risk Assessment Protocol, Aug 1999. g – A Review of Environmental Quality Criteria and Guidelines for Priority substances in the Fraser River Basin, Prepared by D.D. MacDonald, MacDonald Environmental Sciences Limited, March 1994 h - NOAA Screening Quick Reference Tables, NOAA HAZMAT Report 99-1, Seattle WA, Coastal Protection and Restoration Division, National Oceanic and Atmospheric Administration, 12 pages. Buchman, M.F., 1999. i - Guidelines for the protection and management of aquatic sediment quality in Ontario. Ontario Ministry of the Environment. Queen's Printer of Ontario. Persaud, D., R. Jaagumagi, and A. Hayton. 1993. j - Nipper, M., R.S. Carr, J.M. Biedenbach, R.L. Hooten, and K. Miller. 2002. Toxicological and Chemical Assessment of Ordnance Compounds in Marine Sediments and Porewaters. Marine Pollution Bulletin, 44: 789-806. k - TNRCC 2000 Texas Surface water Quality Standards, Texas Administrative Code, Title 30, Chapter 307, Effective 17, 2000.
B-4
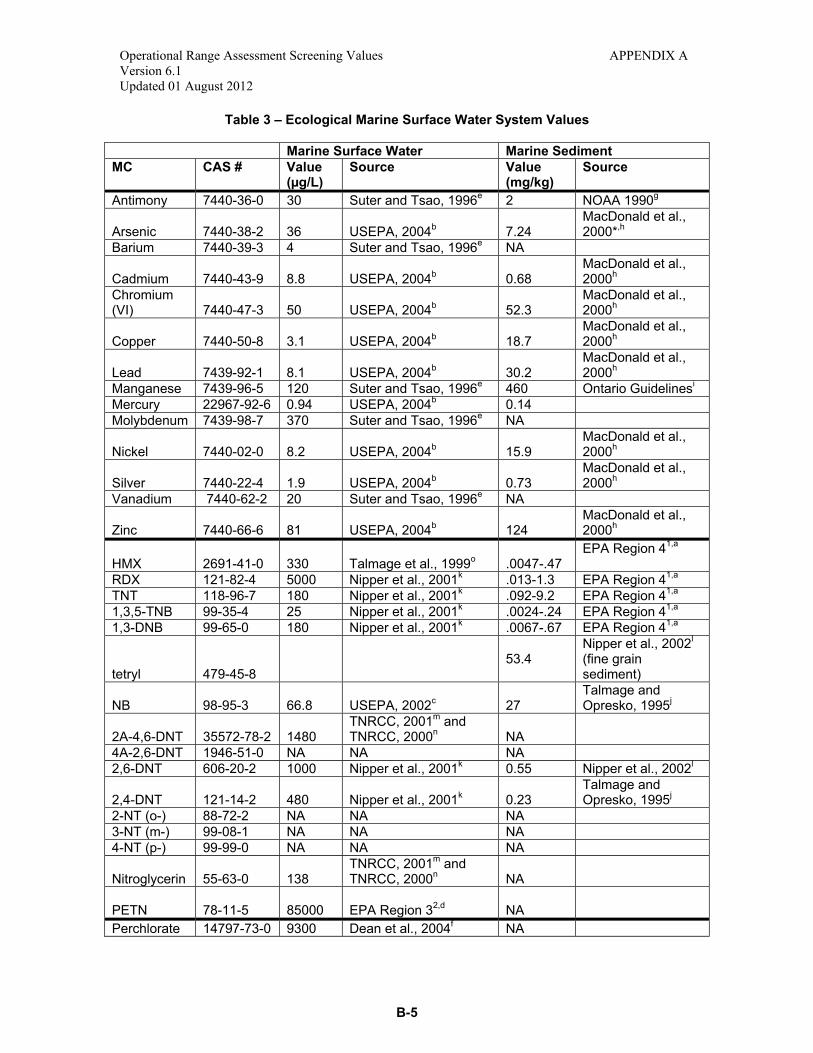
Operational Range Assessment Screening Values APPENDIX AVersion 6.1 Updated 01 August 2012
Table 3 – Ecological Marine Surface Water System Values
Marine Surface Water Marine Sediment MC CAS # Value
(µg/L) Source Value
(mg/kg) Source
Antimony 7440-36-0 30 Suter and Tsao, 1996e 2 NOAA 1990g
Arsenic 7440-38-2 36 USEPA, 2004b 7.24 MacDonald et al., 2000*,h
Barium 7440-39-3 4 Suter and Tsao, 1996e NA
Cadmium 7440-43-9 8.8 USEPA, 2004b 0.68 MacDonald et al., 2000h
Chromium (VI) 7440-47-3 50 USEPA, 2004b 52.3
MacDonald et al., 2000h
Copper 7440-50-8 3.1 USEPA, 2004b 18.7 MacDonald et al., 2000h
Lead 7439-92-1 8.1 USEPA, 2004b 30.2 MacDonald et al., 2000h
Manganese 7439-96-5 120 Suter and Tsao, 1996e 460 Ontario Guidelinesi Mercury 22967-92-6 0.94 USEPA, 2004b 0.14Molybdenum 7439-98-7 370 Suter and Tsao, 1996e NA
Nickel 7440-02-0 8.2 USEPA, 2004b 15.9 MacDonald et al., 2000h
Silver 7440-22-4 1.9 USEPA, 2004b 0.73 MacDonald et al., 2000h
Vanadium 7440-62-2 20 Suter and Tsao, 1996e NA
Zinc 7440-66-6 81 USEPA, 2004b 124 MacDonald et al., 2000h
HMX 2691-41-0 330 Talmage et al., 1999o .0047-.47 EPA Region 41,a
RDX 121-82-4 5000 Nipper et al., 2001k .013-1.3 EPA Region 41,a TNT 118-96-7 180 Nipper et al., 2001k .092-9.2 EPA Region 41,a 1,3,5-TNB 99-35-4 25 Nipper et al., 2001k .0024-.24 EPA Region 41,a 1,3-DNB 99-65-0 180 Nipper et al., 2001k .0067-.67 EPA Region 41,a
tetryl 479-45-853.4
Nipper et al., 2002l (fine grain sediment)
NB 98-95-3 66.8 USEPA, 2002c 27 Talmage and Opresko, 1995j
2A-4,6-DNT 35572-78-2 1480 TNRCC, 2001m and TNRCC, 2000n NA
4A-2,6-DNT 1946-51-0 NA NA NA2,6-DNT 606-20-2 1000 Nipper et al., 2001k 0.55 Nipper et al., 2002l
2,4-DNT 121-14-2 480 Nipper et al., 2001k 0.23 Talmage and Opresko, 1995j
2-NT (o-) 88-72-2 NA NA NA3-NT (m-) 99-08-1 NA NA NA4-NT (p-) 99-99-0 NA NA NA
Nitroglycerin 55-63-0 138 TNRCC, 2001m and TNRCC, 2000n NA
PETN 78-11-5 85000 EPA Region 32,d NA Perchlorate 14797-73-0 9300 Dean et al., 2004f NA
B-5
Operational Range Assessment Screening Values APPENDIX AVersion 6.1 Updated 01 August 2012
Notes: NA – Not Available (Screening levels were not developed due to the lack of scientific data on the specific constituents. * - Arsenic values for sediment will be compared to background sampling data, if available. The range will not be considereda source of MC migration when the sampling results are less than or equivalent to background concentrations.
1 - These values are dependent on the sediment TOC. The lower bound is for 1% TOC. Upper bound is for 100% TOC. To determine the site specific value, multiply the % TOC by the lower bound. (e.g. for TNT in sediment w/ 5% TOC it would be: 0.46)(5*0.092=0.46) 2 - EPA Region III for PETN marine water refers to US EPA Region 3’s Freshwater Screening Benchmark table for a value. These values came from TNRCC 2001 & 2000, which are documented sources m & n below.
Sources: a - EPA Region 4, Ecological Risk Assessment Bulletins - Supplement to RAGS (EPA 2001) b – EPA – USEPA 2009 National Recommended Water Quality Criteria Office of Water and Office of Science and Technology. c – EPA – USEPA 2002 Ecological Risk Assessment Bulletin 2/11/2002. Waste Management Division, Freshwater Surface Screening Values for Hazardous Waste Sites, February. d - EPA Region 3, Ecological Risk Assessment Freshwater Screening Benchmarks, March 2007 e – Suter and Tsao, 1996 Toxicological Benchmarks for Screening Potential Contaminants of Concern for Effects on Aquatic Biota: 196 Revision. ES/ER/Tm-96/R2. f – Dean, K.E., R.M. Palachek, J.L. Noel, R. Warbritton, J. Aufderheide, and J. Wireman. 2004. Development of Freshwater Water-Quality Criteria for Perchlorate. Environmental Toxicology and Chemistry 23(6):1441-1451. g - The potential for biological effects of sediment-sorbed contaminants tested in the national status and trends program. NOAA Technical Memorandum NOS OMA 52. Long, E.R. and L.G. Morgan. 1990. h - MacDonald, D.D., C.G. Ingersoll, and T.A. Berger. 2000. Development and evaluation of consensus-based sediment quality guidelines for freshwater ecosystems. Archives of Environmental Contamination and Toxicology, 39: 20-31. i - Guidelines for the protection and management of aquatic sediment quality in Ontario. Ontario Ministry of the Environment. Queen's Printer of Ontario. Persaud, D., R. Jaagumagi, and A. Hayton. 1993. j - Talmage, S.S., and D.M. Opresko. 1995. Draft Ecological Criteria Documents for Explosives, Oak Ridge National Laboratory, Oak Ridge, Tennessee. k – Nipper, M., R.S. Carr, J.M. Biedenbach, R.L. Hooten, K. Miller, and S. Saepoff, 2001. Development of Marine Toxicity Data for Ordnance Compounds, Archives of Environmental Contamination and Toxicology, 41:308-31. l - Nipper, M., R.S. Carr, J.M. Biedenbach, R.L. Hooten, and K. Miller. 2002. Toxicological and Chemical Assessment of Ordnance Compounds in Marine Sediments and Porewaters. Marine Pollution Bulletin, 44: 789-806. m – TNRCC 2001 Guidance for Conducting Ecological Risk Assessment and Remediation Sites in Texas, Toxicology and Risk Assessment Section, December. n – TNRCC 2000 Texas Surface water Quality Standards, Texas Administrative Code, Title 30, Chapter 307, Effective 17, 2000. o – Talmage, S.S., D.M. Opresko, C.J. Maxwell, J.E. Welsh, M. Cretelia, P.H. Reno, and F.B. Daniel. 1999. Nitroaromatic munition compounds: Environmental effects and screening values. Reviews in Environmental Contamination and Toxicology, 161: 1-156.
B-6
Appendix B
Screening Level Analysis Parameters
Marine Corps Installations Command Range Environmental Vulnerability Assessment 5-Year Report Marine Corps Base Hawaii
B

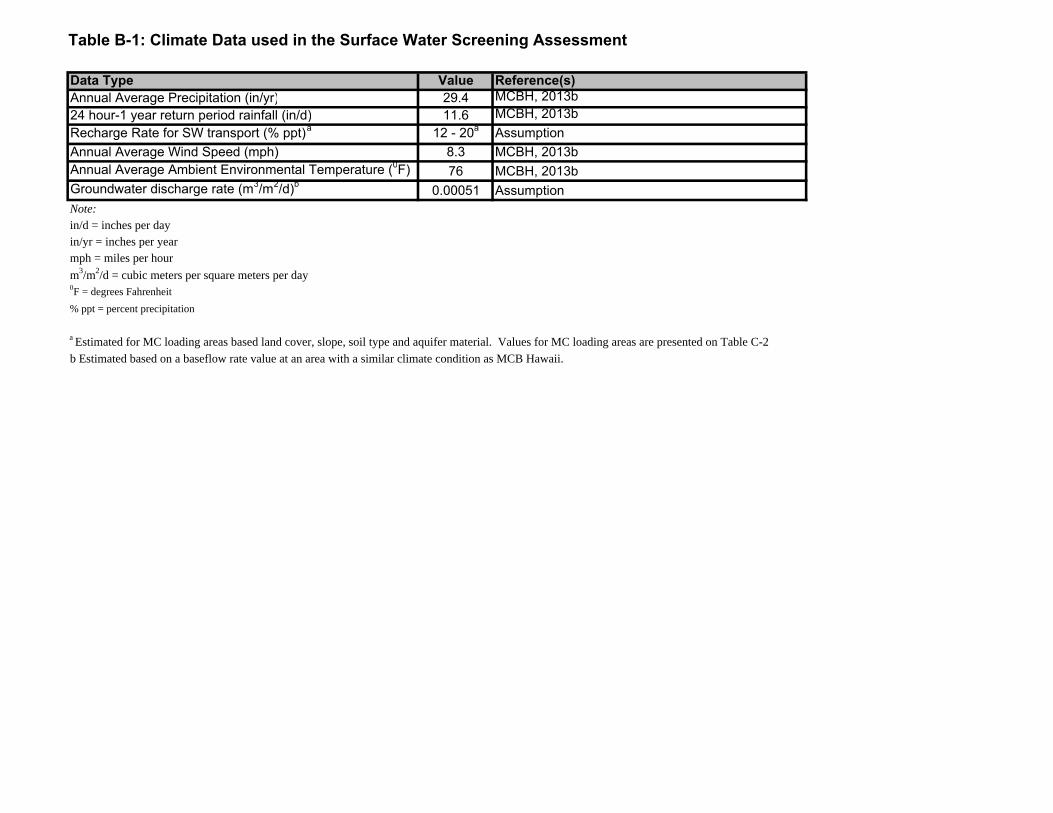
Table B-1: Climate Data used in the Surface Water Screening Assessment
Data Type Value Reference(s)Annual Average Precipitation (in/yr) 29.4 MCBH, 2013b24 hour-1 year return period rainfall (in/d) 11.6 MCBH, 2013bRecharge Rate for SW transport (% ppt)a 12 - 20a AssumptionAnnual Average Wind Speed (mph) 8.3 MCBH, 2013bAnnual Average Ambient Environmental Temperature (0F) 76 MCBH, 2013bGroundwater discharge rate (m3/m2/d)b 0.00051 AssumptionNote:in/d = inches per dayin/yr = inches per yearmph = miles per hour
m3/m2/d = cubic meters per square meters per day0F = degrees Fahrenheit
% ppt = percent precipitation
a Estimated for MC loading areas based land cover, slope, soil type and aquifer material. Values for MC loading areas are presented on Table C-2
b Estimated based on a baseflow rate value at an area with a similar climate condition as MCB Hawaii.
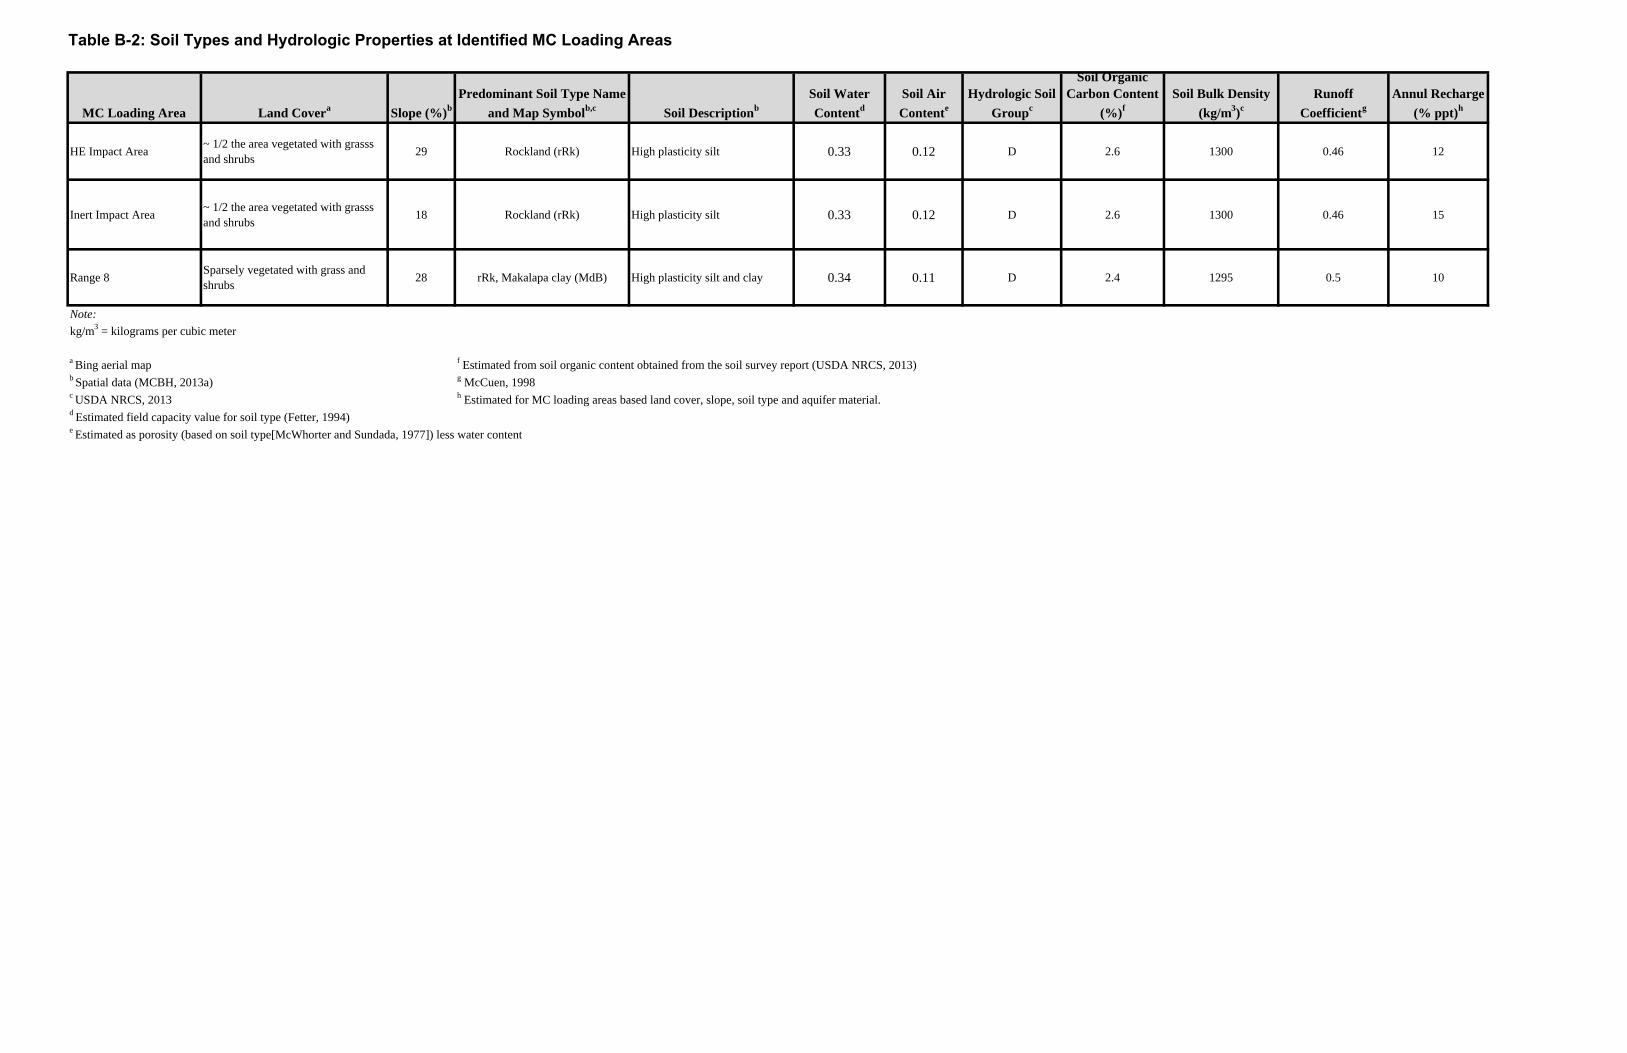
Table B-2: Soil Types and Hydrologic Properties at Identified MC Loading Areas
HE Impact Area~ 1/2 the area vegetated with grasss and shrubs
29 Rockland (rRk) High plasticity silt 0.33 0.12 D 2.6 1300 0.46 12
Inert Impact Area~ 1/2 the area vegetated with grasss and shrubs
18 Rockland (rRk) High plasticity silt 0.33 0.12 D 2.6 1300 0.46 15
Range 8Sparsely vegetated with grass and shrubs
28 rRk, Makalapa clay (MdB) High plasticity silt and clay 0.34 0.11 D 2.4 1295 0.5 10
Note:
kg/m3 = kilograms per cubic meter
a Bing aerial map f Estimated from soil organic content obtained from the soil survey report (USDA NRCS, 2013) b Spatial data (MCBH, 2013a) g McCuen, 1998c USDA NRCS, 2013 h Estimated for MC loading areas based land cover, slope, soil type and aquifer material.d Estimated field capacity value for soil type (Fetter, 1994)e Estimated as porosity (based on soil type[McWhorter and Sundada, 1977]) less water content
Soil Bulk Density
(kg/m3)c
Runoff
Coefficientg
Annul Recharge
(% ppt)h
Predominant Soil Type Name
and Map Symbolb,c Soil Descriptionb
Hydrologic Soil
GroupcMC Loading Area Land Covera Slope (%)b
Soil Water
Contentd
Soil Air
Contente
Soil Organic Carbon Content
(%)f
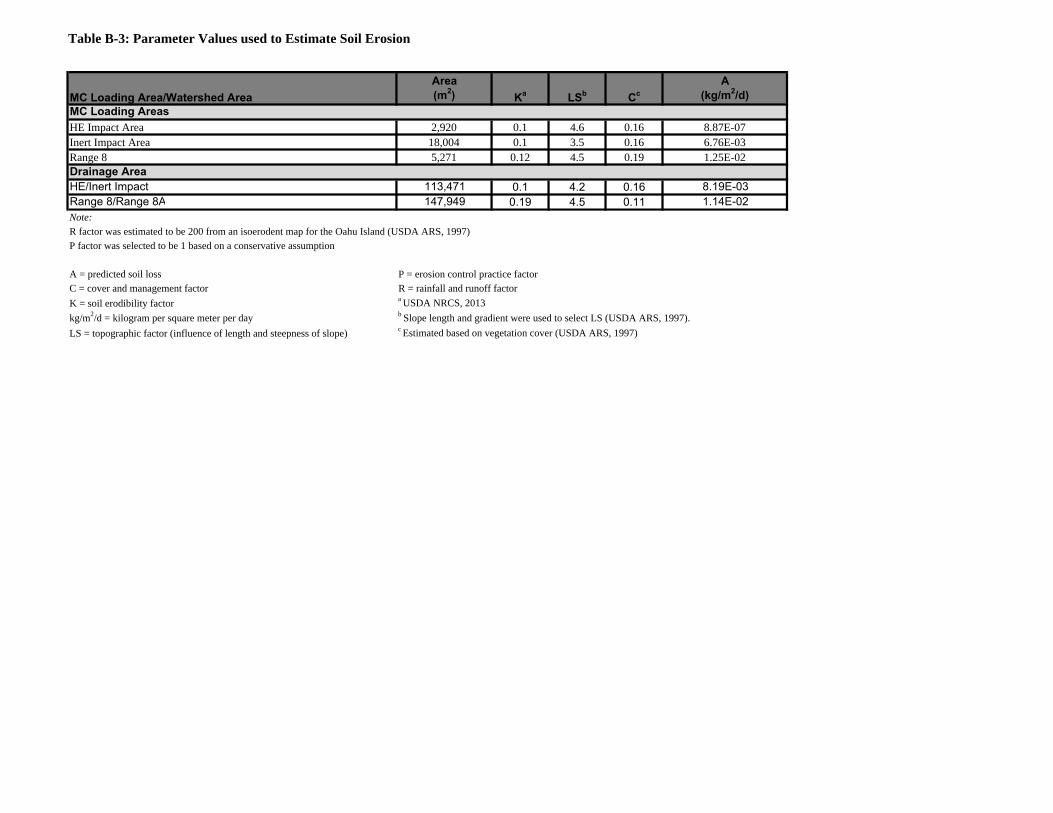
Table B-3: Parameter Values used to Estimate Soil Erosion
Area A(m2) (kg/m2/d)
HE Impact Area 2,920 0.1 4.6 0.16 8.87E-07Inert Impact Area 18,004 0.1 3.5 0.16 6.76E-03Range 8 5,271 0.12 4.5 0.19 1.25E-02
HE/Inert Impact 113,471 0.1 4.2 0.16 8.19E-03Range 8/Range 8A 147,949 0.19 4.5 0.11 1.14E-02Note:
R factor was estimated to be 200 from an isoerodent map for the Oahu Island (USDA ARS, 1997)
P factor was selected to be 1 based on a conservative assumption
A = predicted soil loss P = erosion control practice factor
C = cover and management factor R = rainfall and runoff factor
K = soil erodibility factor a USDA NRCS, 2013
kg/m2/d = kilogram per square meter per day b Slope length and gradient were used to select LS (USDA ARS, 1997).
LS = topographic factor (influence of length and steepness of slope) c Estimated based on vegetation cover (USDA ARS, 1997)
MC Loading Areas
Drainage Area
MC Loading Area/Watershed Area Ka LSb Cc
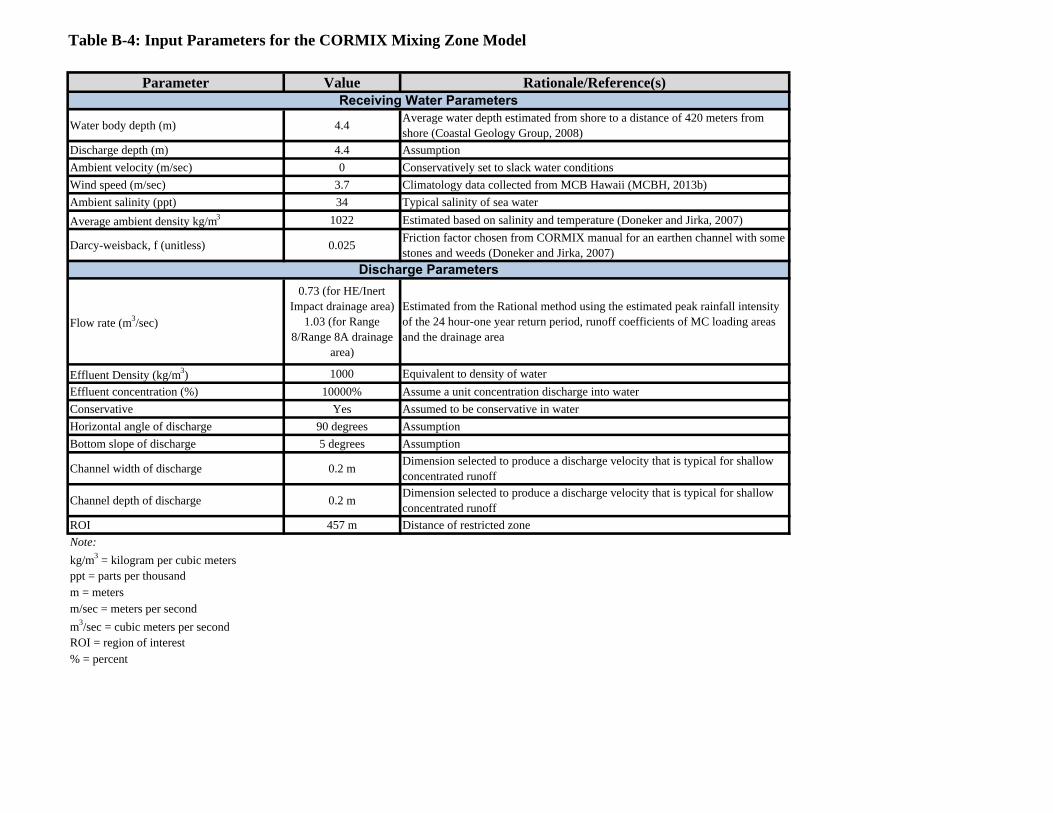
Table B-4: Input Parameters for the CORMIX Mixing Zone Model
Parameter Value Rationale/Reference(s)
Water body depth (m) 4.4Average water depth estimated from shore to a distance of 420 meters from shore (Coastal Geology Group, 2008)
Discharge depth (m) 4.4 Assumption
Ambient velocity (m/sec) 0 Conservatively set to slack water conditions
Wind speed (m/sec) 3.7 Climatology data collected from MCB Hawaii (MCBH, 2013b)
Ambient salinity (ppt) 34 Typical salinity of sea water
Average ambient density kg/m3 1022 Estimated based on salinity and temperature (Doneker and Jirka, 2007)
Darcy-weisback, f (unitless) 0.025Friction factor chosen from CORMIX manual for an earthen channel with some stones and weeds (Doneker and Jirka, 2007)
Flow rate (m3/sec)
0.73 (for HE/Inert Impact drainage area)
1.03 (for Range 8/Range 8A drainage
area)
Estimated from the Rational method using the estimated peak rainfall intensity of the 24 hour-one year return period, runoff coefficients of MC loading areas and the drainage area
Effluent Density (kg/m3) 1000 Equivalent to density of water
Effluent concentration (%) 10000% Assume a unit concentration discharge into water
Conservative Yes Assumed to be conservative in water
Horizontal angle of discharge 90 degrees Assumption
Bottom slope of discharge 5 degrees Assumption
Channel width of discharge 0.2 mDimension selected to produce a discharge velocity that is typical for shallow concentrated runoff
Channel depth of discharge 0.2 mDimension selected to produce a discharge velocity that is typical for shallow concentrated runoff
ROI 457 m Distance of restricted zone
Note:
kg/m3 = kilogram per cubic metersppt = parts per thousandm = metersm/sec = meters per second
m3/sec = cubic meters per secondROI = region of interest% = percent
Receiving Water Parameters
Discharge Parameters
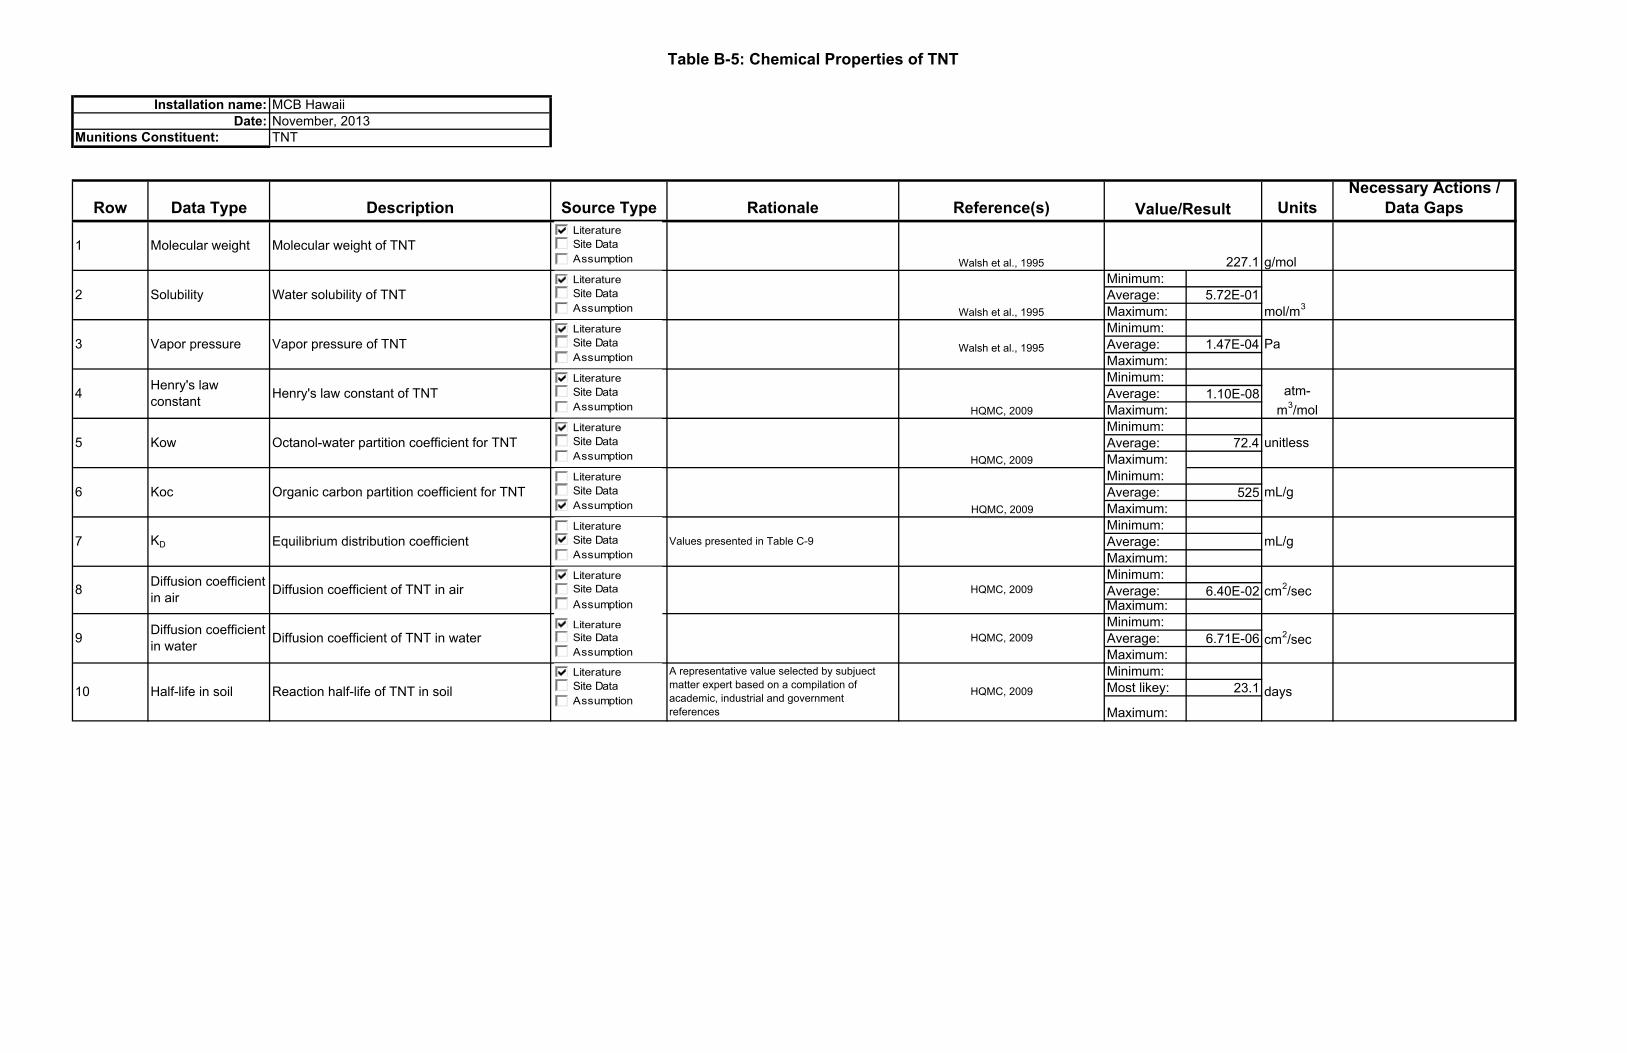
Table B-5: Chemical Properties of TNT
MCB HawaiiNovember, 2013TNT
Row Data Type Description Source Type Rationale Reference(s) UnitsNecessary Actions /
Data Gaps
Minimum:Average: 5.72E-01Maximum:Minimum:Average: 1.47E-04Maximum:Minimum:Average: 1.10E-08Maximum:Minimum:Average: 72.4Maximum:Minimum:Average: 525Maximum:Minimum:Average:Maximum:Minimum:Average: 6.40E-02Maximum:Minimum:Average: 6.71E-06Maximum:Minimum:Most likey: 23.1
Maximum:
HQMC, 2009
HQMC, 2009 days
HQMC, 2009
cm2/sec
unitless
10 Half-life in soil Reaction half-life of TNT in soilA representative value selected by subjuect matter expert based on a compilation of academic, industrial and government references
9 Diffusion coefficient in water Diffusion coefficient of TNT in water
5 Kow Octanol-water partition coefficient for TNT
Walsh et al., 1995
4 Henry's law constant
3 Vapor pressure Vapor pressure of TNT
Henry's law constant of TNT
Walsh et al., 1995
Pa
HQMC, 2009
atm-m3/mol
HQMC, 2009
Walsh et al., 1995 g/mol227.1
mol/m3
mL/g
Diffusion coefficient of TNT in air
Value/Result
1 Molecular weight Molecular weight of TNT
6 Koc
cm2/sec
Values presented in Table C-9 mL/g7 KD Equilibrium distribution coefficient
8 Diffusion coefficient in air
HQMC, 2009
Installation name:Date:
Munitions Constituent:
Organic carbon partition coefficient for TNT
2 Solubility Water solubility of TNT
LiteratureSite DataAssumption
LiteratureSite DataAssumption
LiteratureSite DataAssumption
LiteratureSite DataAssumption
LiteratureSite DataAssumption
LiteratureSite DataAssumption
LiteratureSite DataAssumptionLiteratureSite DataAssumption
LiteratureSite DataAssumption
LiteratureSite DataAssumption
LiteratureSite DataAssumption
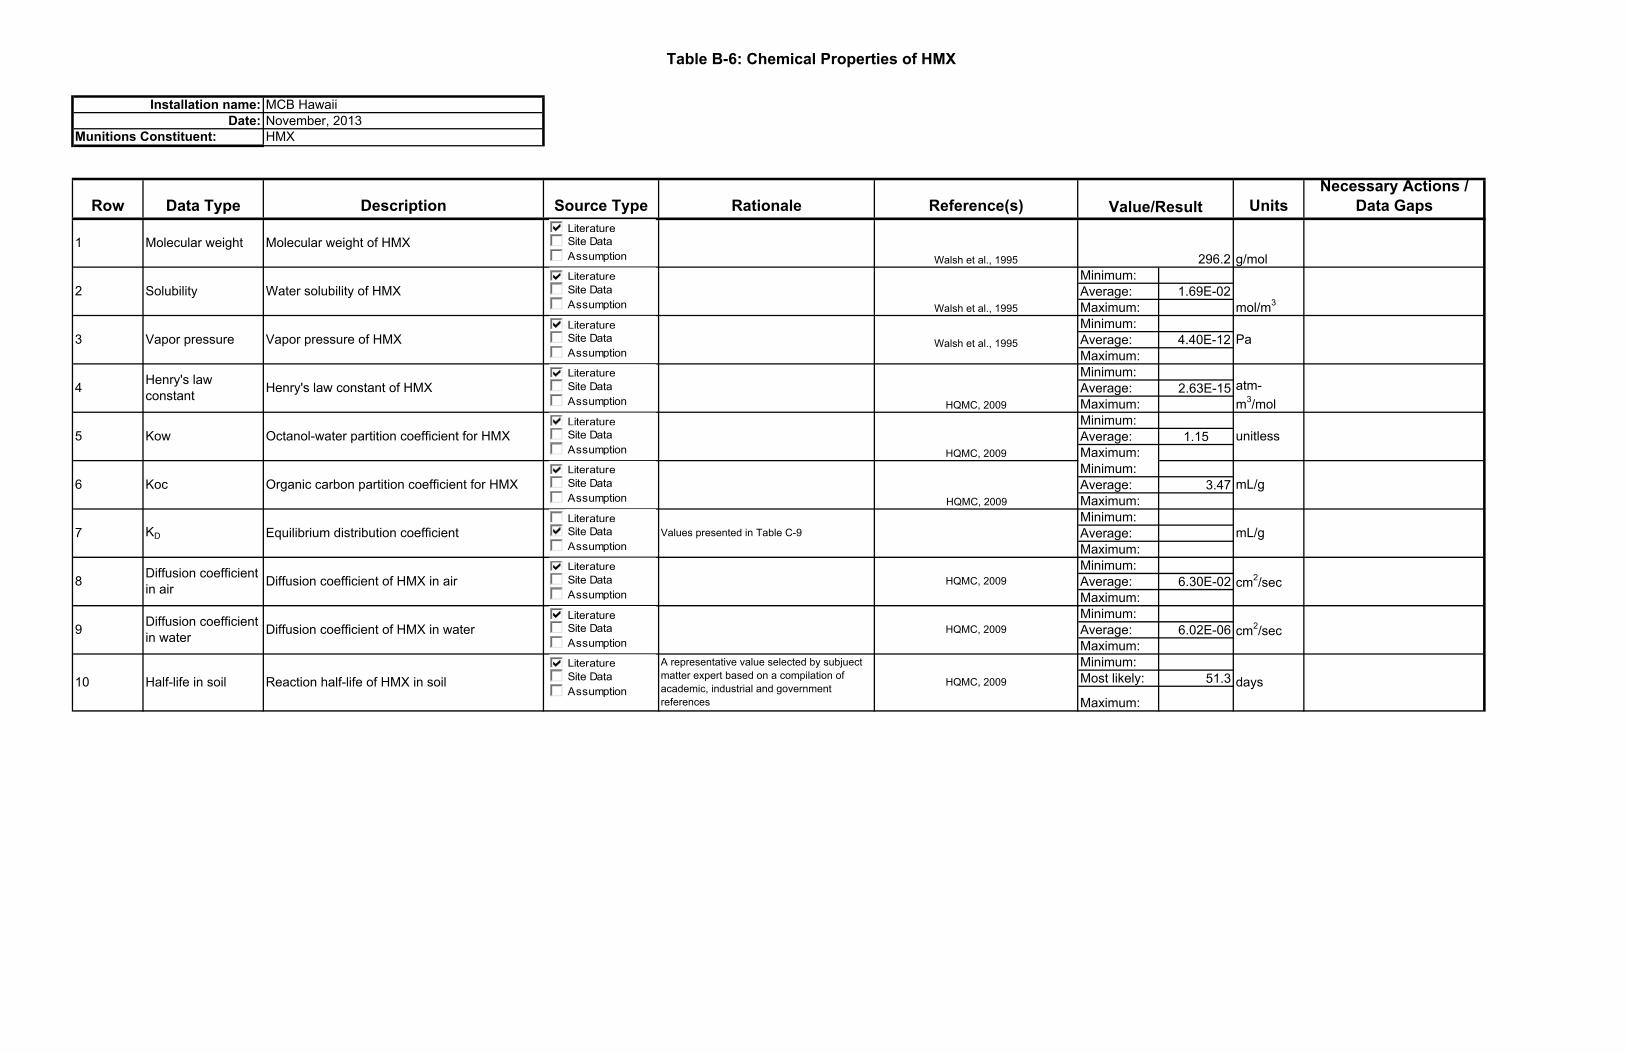
Table B-6: Chemical Properties of HMX
MCB HawaiiNovember, 2013HMX
Row Data Type Description Source Type Rationale Reference(s) UnitsNecessary Actions /
Data Gaps
Minimum:Average: 1.69E-02Maximum:Minimum:Average: 4.40E-12Maximum:Minimum:Average: 2.63E-15Maximum:Minimum:Average: 1.15Maximum:Minimum:Average: 3.47Maximum:Minimum:Average:Maximum:Minimum:Average: 6.30E-02Maximum:Minimum:Average: 6.02E-06Maximum:Minimum:Most likely: 51.3
Maximum:
Values presented in Table C-9 mL/g7 KD Equilibrium distribution coefficient
HQMC, 2009unitless5 Kow Octanol-water partition coefficient for HMX
4 Henry's law constant Henry's law constant of HMX atm-
m3/mol
Walsh et al., 1995
2 Solubility Water solubility of HMXWalsh et al., 1995 mol/m3
A representative value selected by subjuect matter expert based on a compilation of academic, industrial and government references
HQMC, 2009 days
HQMC, 2009 cm2/sec
10 Half-life in soil Reaction half-life of HMX in soil
9 Diffusion coefficient in water Diffusion coefficient of HMX in water
8 Diffusion coefficient in air Diffusion coefficient of HMX in air HQMC, 2009 cm2/sec
Vapor pressure Vapor pressure of HMX
HQMC, 2009
Walsh et al., 1995 296.2
Pa
g/mol
Value/Result
Installation name:Date:
Munitions Constituent:
1 Molecular weight Molecular weight of HMX
3
mL/g6 Koc Organic carbon partition coefficient for HMXHQMC, 2009
LiteratureSite DataAssumption
LiteratureSite DataAssumption
LiteratureSite DataAssumption
LiteratureSite DataAssumption
LiteratureSite DataAssumption
LiteratureSite DataAssumption
LiteratureSite DataAssumption
LiteratureSite DataAssumption
LiteratureSite DataAssumption
LiteratureSite DataAssumption
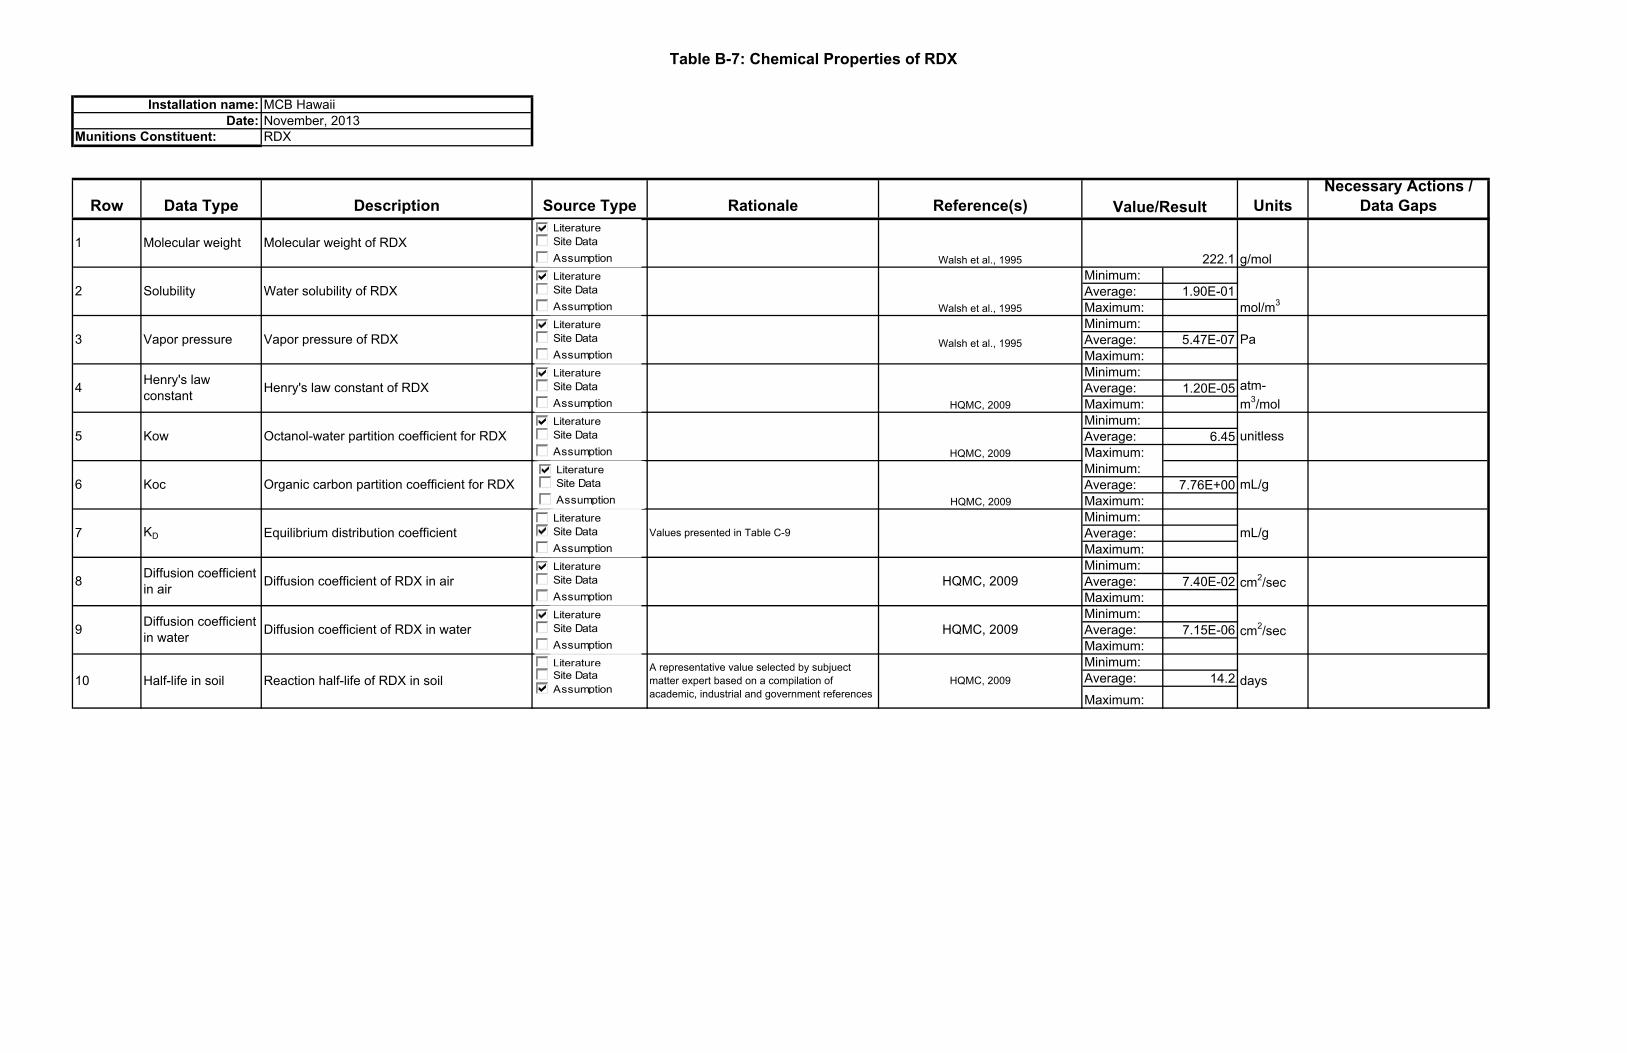
Table B-7: Chemical Properties of RDX
MCB HawaiiNovember, 2013RDX
Row Data Type Description Source Type Rationale Reference(s) UnitsNecessary Actions /
Data Gaps
Minimum:Average: 1.90E-01Maximum:Minimum:Average: 5.47E-07Maximum:Minimum:Average: 1.20E-05Maximum:Minimum:Average: 6.45Maximum:Minimum:Average: 7.76E+00Maximum:Minimum:Average:Maximum:Minimum:Average: 7.40E-02Maximum:Minimum:Average: 7.15E-06Maximum:Minimum:Average: 14.2Maximum:
Values presented in Table C-9 mL/g7 KD Equilibrium distribution coefficient
HQMC, 2009unitless5 Kow Octanol-water partition coefficient for RDX
4 Henry's law constant Henry's law constant of RDX atm-
m3/mol
Walsh et al., 1995
2 Solubility Water solubility of RDXWalsh et al., 1995 mol/m3
A representative value selected by subjuect matter expert based on a compilation of academic, industrial and government references
HQMC, 2009 days
HQMC, 2009 cm2/sec
10 Half-life in soil Reaction half-life of RDX in soil
9 Diffusion coefficient in water Diffusion coefficient of RDX in water
8 Diffusion coefficient in air Diffusion coefficient of RDX in air HQMC, 2009 cm2/sec
Vapor pressure Vapor pressure of RDX
HQMC, 2009
Walsh et al., 1995 222.1
Pa
g/mol
Value/Result
Installation name:Date:
Munitions Constituent:
1 Molecular weight Molecular weight of RDX
3
mL/g6 Koc Organic carbon partition coefficient for RDXHQMC, 2009
LiteratureSite DataAssumptionLiteratureSite DataAssumptionLiteratureSite DataAssumptionLiteratureSite DataAssumptionLiteratureSite DataAssumption
LiteratureSite DataAssumptionLiteratureSite DataAssumptionLiteratureSite DataAssumptionLiteratureSite DataAssumption
LiteratureSite DataAssumption
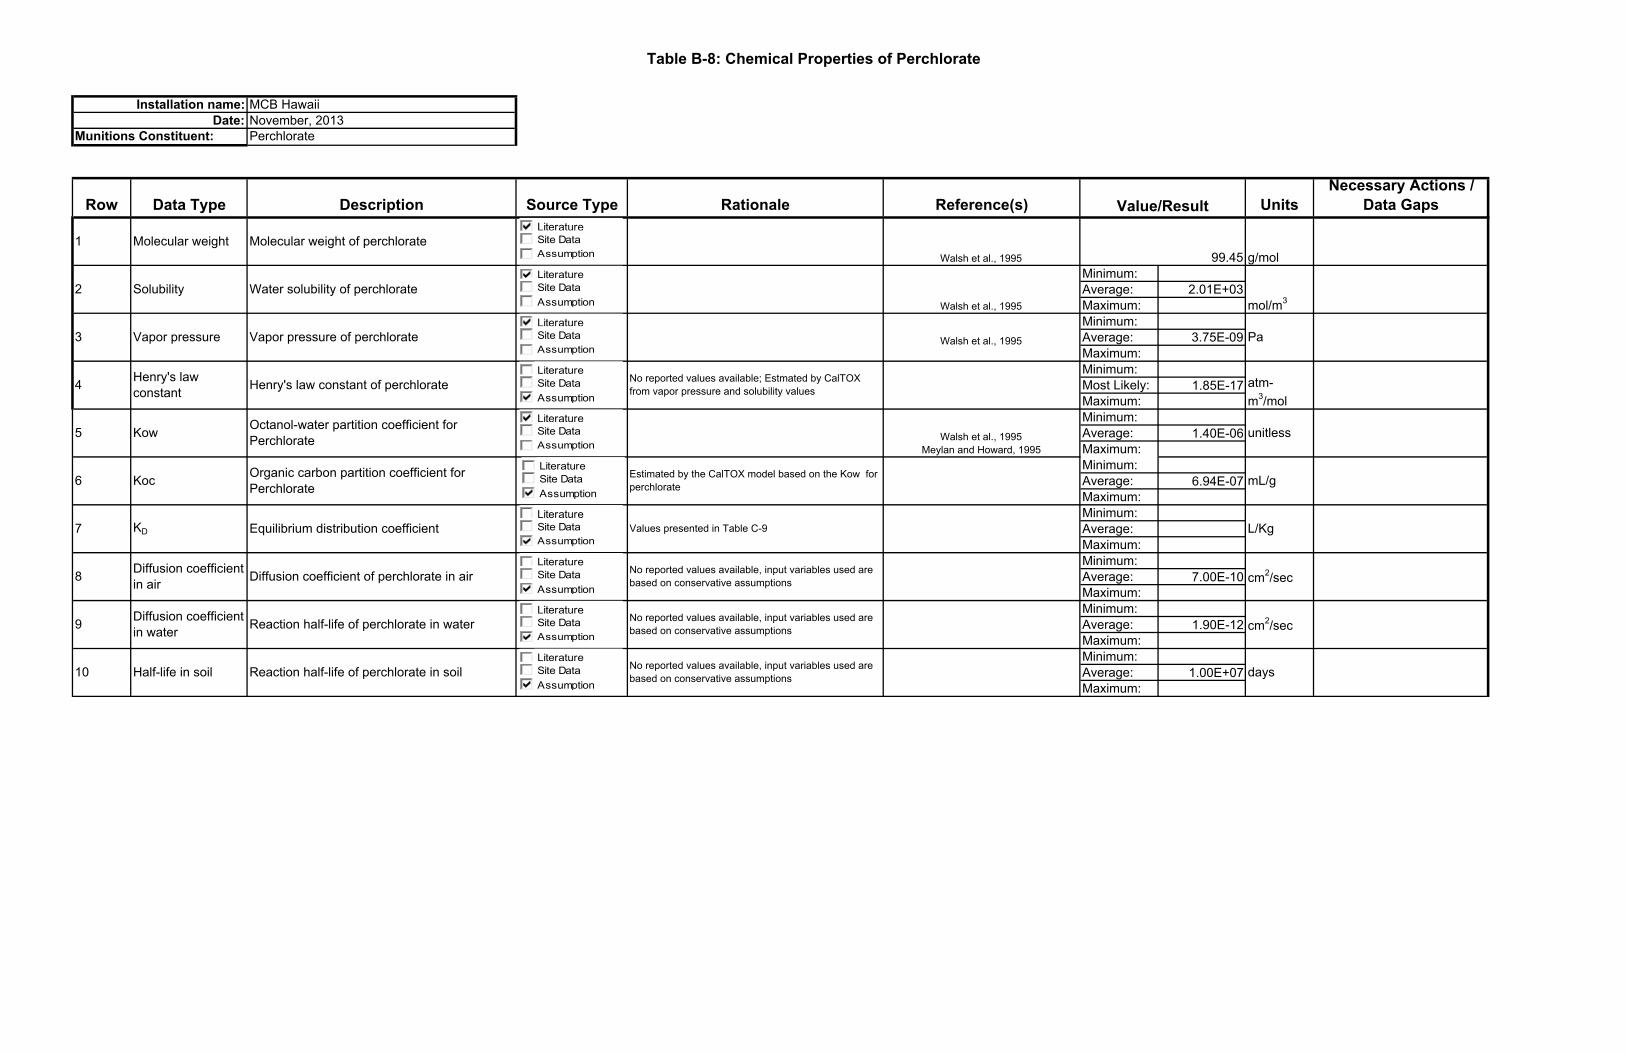
Table B-8: Chemical Properties of Perchlorate
MCB HawaiiNovember, 2013Perchlorate
Row Data Type Description Source Type Rationale Reference(s) UnitsNecessary Actions /
Data Gaps
Minimum:Average: 2.01E+03Maximum:Minimum:Average: 3.75E-09Maximum:Minimum:Most Likely: 1.85E-17Maximum:Minimum:Average: 1.40E-06Maximum:Minimum:Average: 6.94E-07Maximum:Minimum:Average:Maximum:Minimum:Average: 7.00E-10Maximum:Minimum:Average: 1.90E-12Maximum:Minimum:Average: 1.00E+07Maximum:
Values presented in Table C-9 L/Kg7 KD Equilibrium distribution coefficient
Walsh et al., 1995Meylan and Howard, 1995
unitless5 Kow Octanol-water partition coefficient for Perchlorate
4 Henry's law constant Henry's law constant of perchlorate atm-
m3/mol
Walsh et al., 1995
2 Solubility Water solubility of perchlorateWalsh et al., 1995 mol/m3
No reported values available, input variables used are based on conservative assumptions days
No reported values available, input variables used are based on conservative assumptions cm2/sec
10 Half-life in soil Reaction half-life of perchlorate in soil
9 Diffusion coefficient in water Reaction half-life of perchlorate in water
8 Diffusion coefficient in air Diffusion coefficient of perchlorate in air cm2/sec
No reported values available, input variables used are based on conservative assumptions
Vapor pressure Vapor pressure of perchlorate
Walsh et al., 1995 99.45
Pa
g/mol
Value/Result
Installation name:Date:
Munitions Constituent:
No reported values available; Estmated by CalTOX from vapor pressure and solubility values
1 Molecular weight Molecular weight of perchlorate
3
mL/g6 Koc Organic carbon partition coefficient for Perchlorate
Estimated by the CalTOX model based on the Kow for perchlorate
LiteratureSite DataAssumption
LiteratureSite DataAssumption
LiteratureSite DataAssumption
LiteratureSite DataAssumption
LiteratureSite DataAssumption
LiteratureSite DataAssumption
LiteratureSite DataAssumption
LiteratureSite DataAssumption
LiteratureSite DataAssumption
LiteratureSite DataAssumption
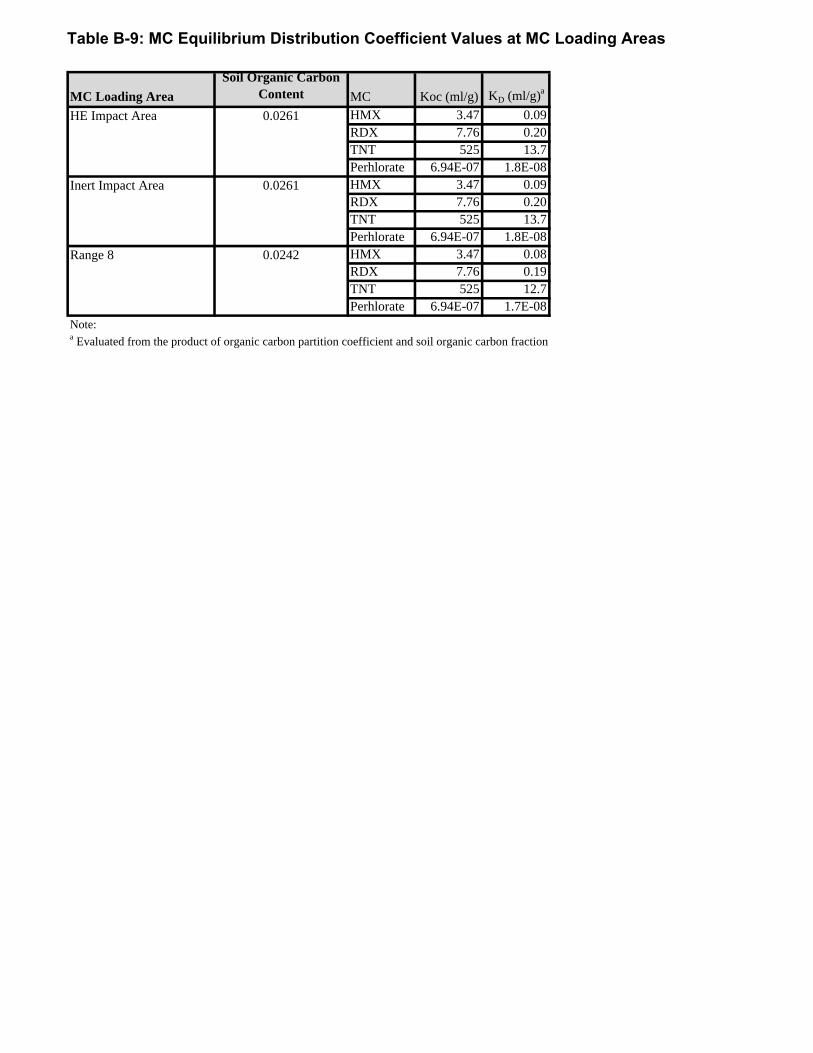
Table B-9: MC Equilibrium Distribution Coefficient Values at MC Loading Areas
MC Loading Area
Soil Organic Carbon Content MC Koc (ml/g) KD (ml/g)a
HMX 3.47 0.09RDX 7.76 0.20TNT 525 13.7Perhlorate 6.94E-07 1.8E-08HMX 3.47 0.09RDX 7.76 0.20TNT 525 13.7Perhlorate 6.94E-07 1.8E-08HMX 3.47 0.08RDX 7.76 0.19TNT 525 12.7Perhlorate 6.94E-07 1.7E-08
Note:a Evaluated from the product of organic carbon partition coefficient and soil organic carbon fraction
HE Impact Area 0.0261
Inert Impact Area 0.0261
Range 8 0.0242
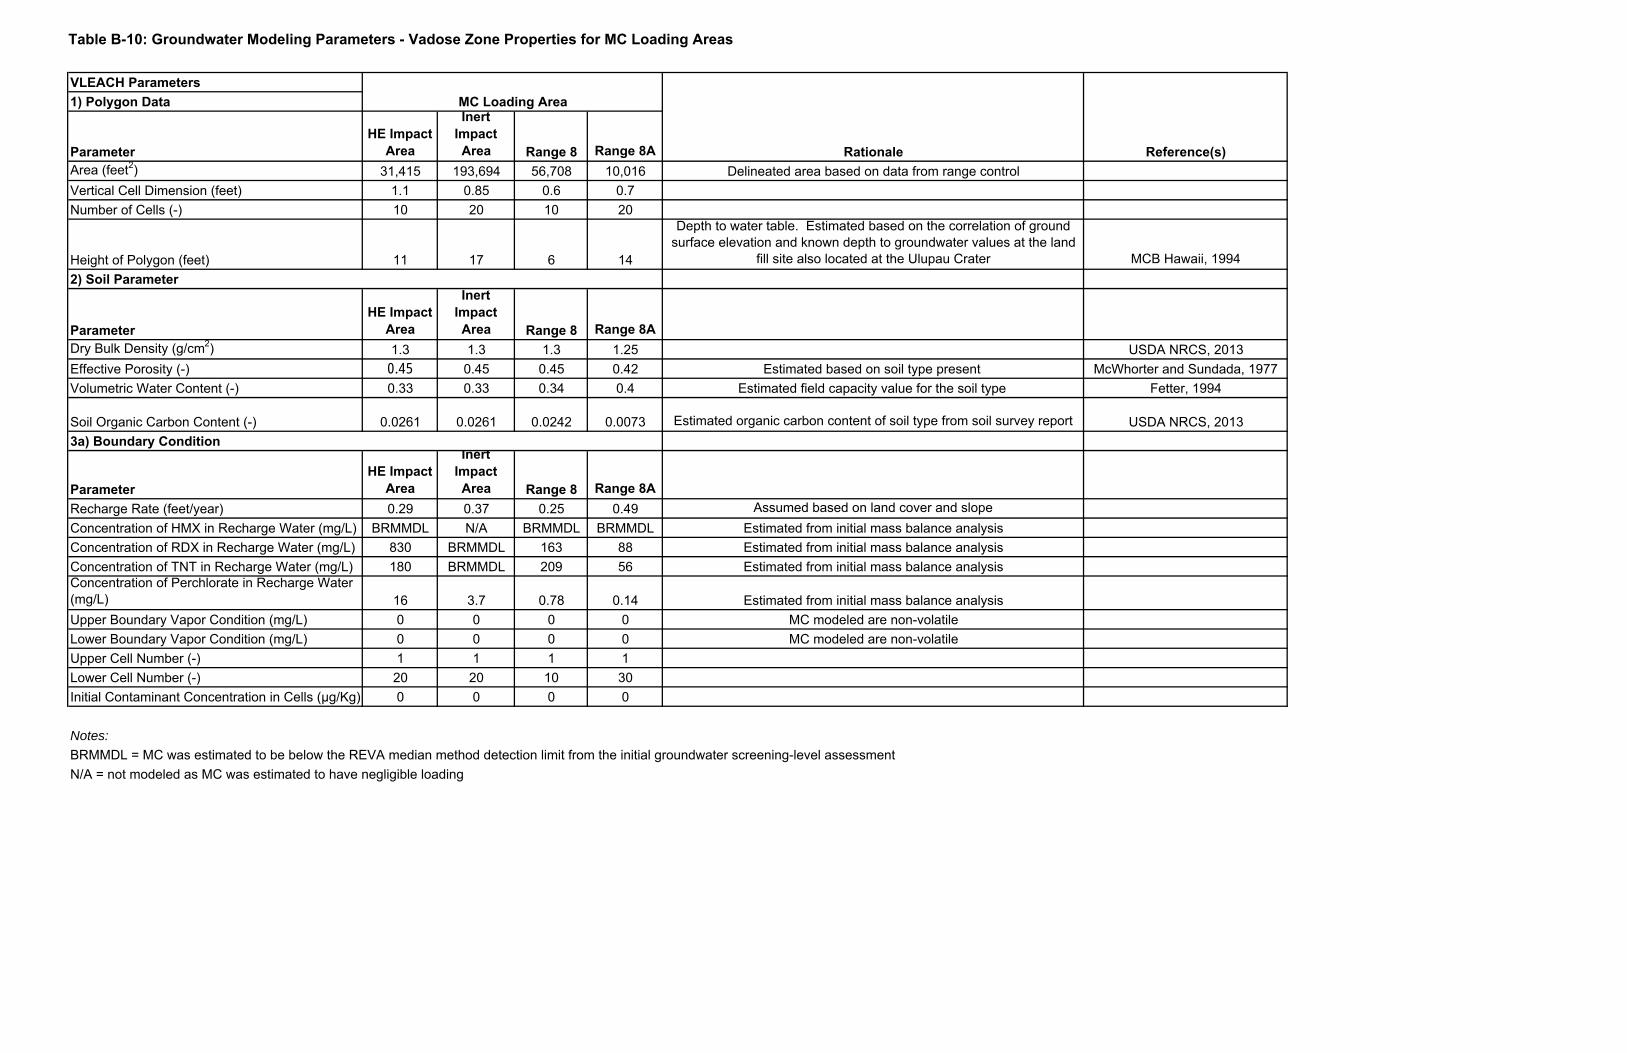
Table B-10: Groundwater Modeling Parameters - Vadose Zone Properties for MC Loading Areas
VLEACH Parameters1) Polygon Data
ParameterHE Impact
Area
Inert Impact Area Range 8 Range 8A
Area (feet2) 31,415 193,694 56,708 10,016 Delineated area based on data from range controlVertical Cell Dimension (feet) 1.1 0.85 0.6 0.7Number of Cells (-) 10 20 10 20
Height of Polygon (feet) 11 17 6 14
Depth to water table. Estimated based on the correlation of ground surface elevation and known depth to groundwater values at the land
fill site also located at the Ulupau Crater MCB Hawaii, 1994
ParameterHE Impact
Area
Inert Impact Area Range 8 Range 8A
Dry Bulk Density (g/cm2) 1.3 1.3 1.3 1.25 USDA NRCS, 2013Effective Porosity (-) 0.45 0.45 0.45 0.42 Estimated based on soil type present McWhorter and Sundada, 1977Volumetric Water Content (-) 0.33 0.33 0.34 0.4 Estimated field capacity value for the soil type Fetter, 1994
Soil Organic Carbon Content (-) 0.0261 0.0261 0.0242 0.0073 Estimated organic carbon content of soil type from soil survey report USDA NRCS, 2013
ParameterHE Impact
Area
Inert Impact Area Range 8 Range 8A
Recharge Rate (feet/year) 0.29 0.37 0.25 0.49 Assumed based on land cover and slopeConcentration of HMX in Recharge Water (mg/L) BRMMDL N/A BRMMDL BRMMDL Estimated from initial mass balance analysisConcentration of RDX in Recharge Water (mg/L) 830 BRMMDL 163 88 Estimated from initial mass balance analysisConcentration of TNT in Recharge Water (mg/L) 180 BRMMDL 209 56 Estimated from initial mass balance analysisConcentration of Perchlorate in Recharge Water (mg/L) 16 3.7 0.78 0.14 Estimated from initial mass balance analysisUpper Boundary Vapor Condition (mg/L) 0 0 0 0 MC modeled are non-volatileLower Boundary Vapor Condition (mg/L) 0 0 0 0 MC modeled are non-volatileUpper Cell Number (-) 1 1 1 1Lower Cell Number (-) 20 20 10 30Initial Contaminant Concentration in Cells (µg/Kg) 0 0 0 0
Notes:
BRMMDL = MC was estimated to be below the REVA median method detection limit from the initial groundwater screening-level assessmentN/A = not modeled as MC was estimated to have negligible loading
Rationale Reference(s)
2) Soil Parameter
3a) Boundary Condition
MC Loading Area
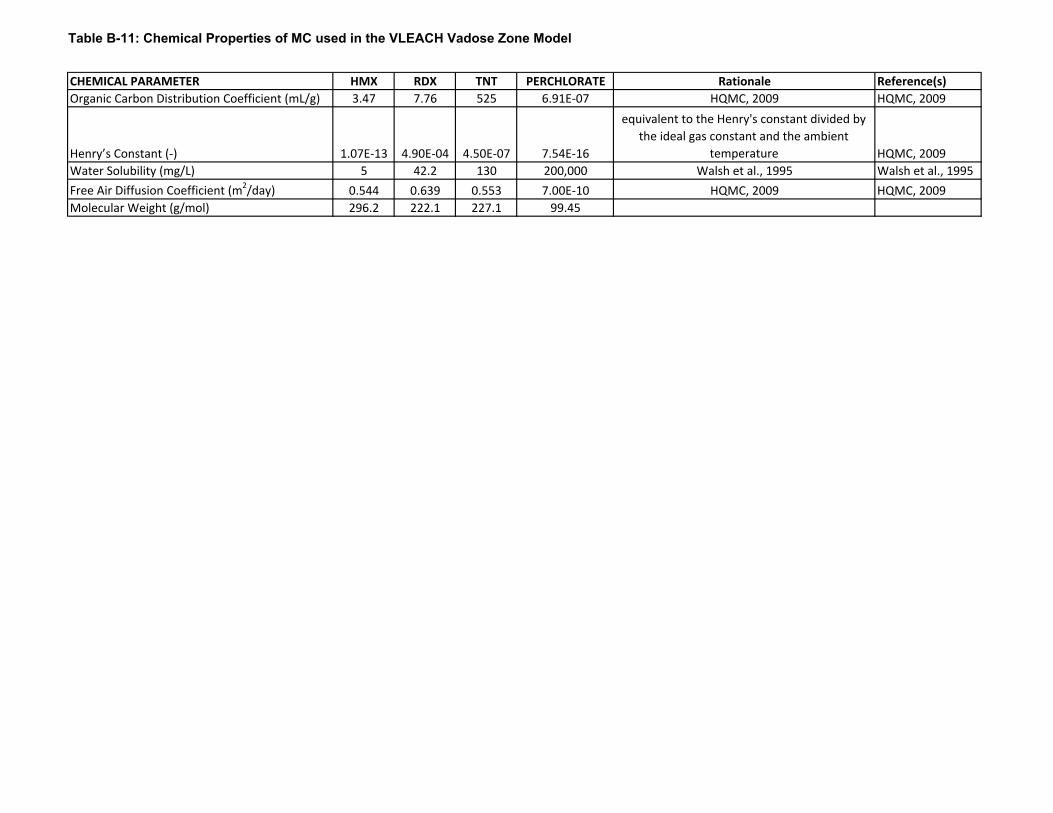
Table B-11: Chemical Properties of MC used in the VLEACH Vadose Zone Model
CHEMICAL PARAMETER HMX RDX TNT PERCHLORATE Rationale Reference(s)Organic Carbon Distribution Coefficient (mL/g) 3.47 7.76 525 6.91E‐07 HQMC, 2009 HQMC, 2009
Henry’s Constant (‐) 1.07E‐13 4.90E‐04 4.50E‐07 7.54E‐16
equivalent to the Henry's constant divided by the ideal gas constant and the ambient
temperature HQMC, 2009Water Solubility (mg/L) 5 42.2 130 200,000 Walsh et al., 1995 Walsh et al., 1995Free Air Diffusion Coefficient (m2/day) 0.544 0.639 0.553 7.00E‐10 HQMC, 2009 HQMC, 2009Molecular Weight (g/mol) 296.2 222.1 227.1 99.45
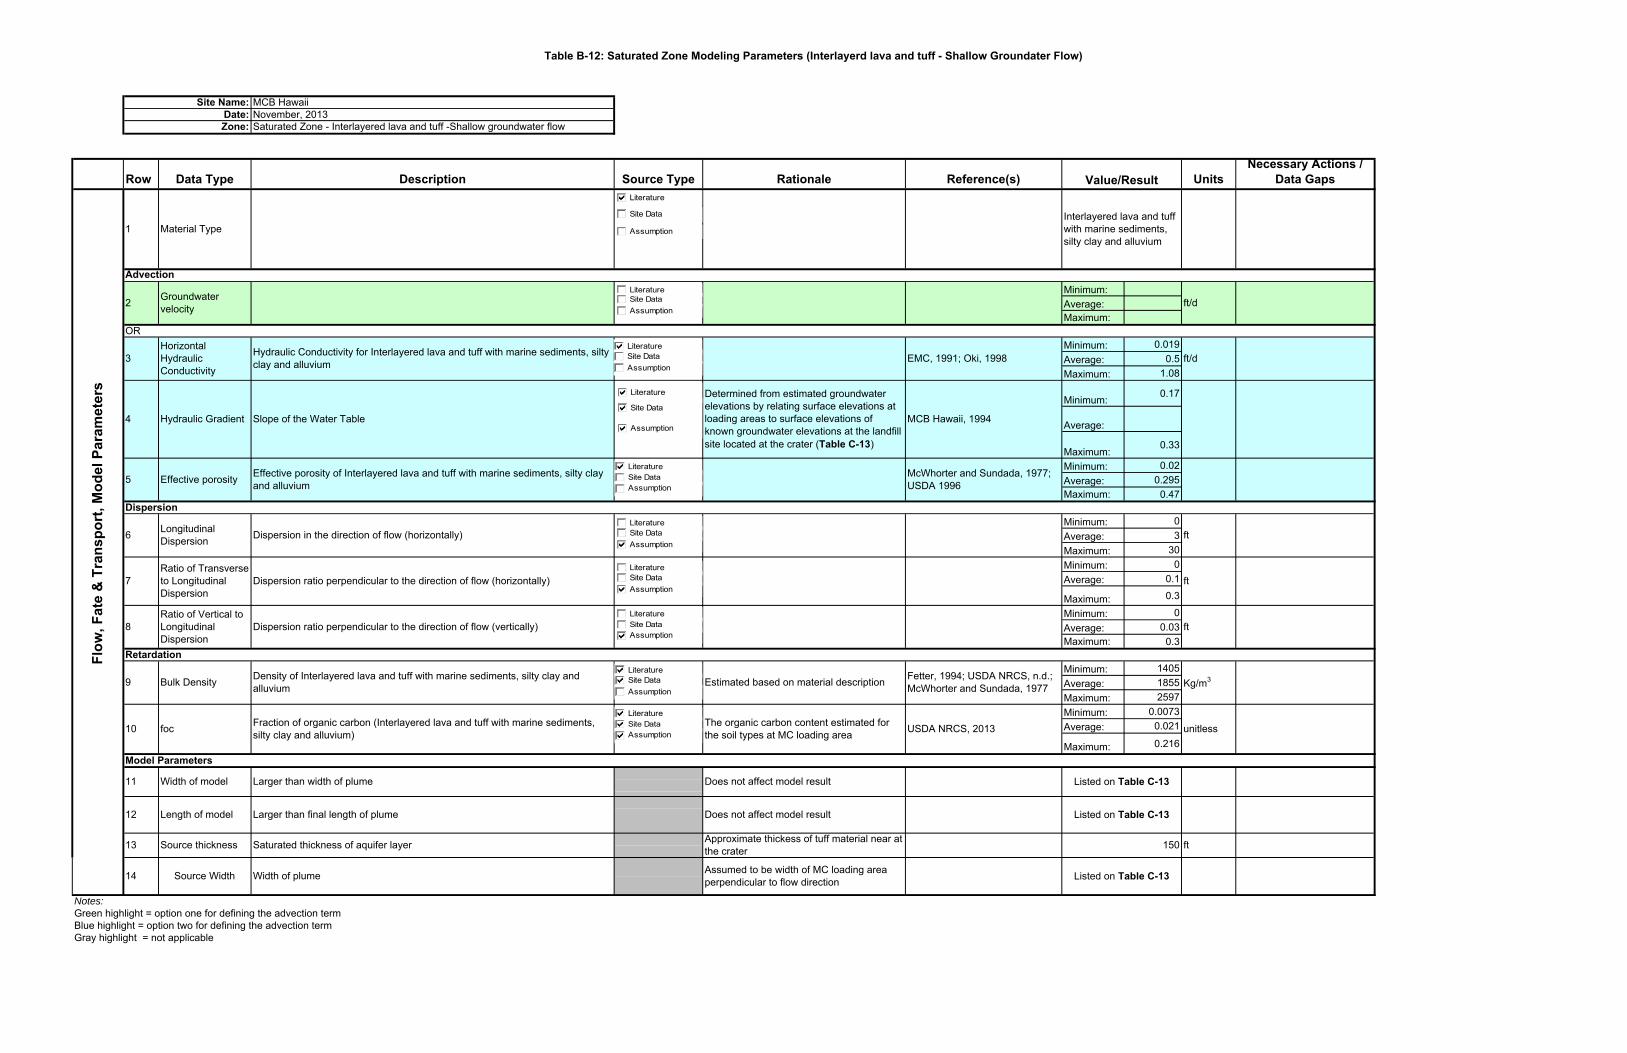
Table B-12: Saturated Zone Modeling Parameters (Interlayerd lava and tuff - Shallow Groundater Flow)
MCB HawaiiNovember, 2013Saturated Zone - Interlayered lava and tuff -Shallow groundwater flow
Row Data Type Description Source Type Rationale Reference(s) UnitsNecessary Actions /
Data Gaps
Minimum:Average:Maximum:
Minimum: 0.019Average: 0.5Maximum: 1.08
Minimum: 0.17
Average:
Maximum:0.33
Minimum: 0.02Average: 0.295Maximum: 0.47
Minimum: 0Average: 3Maximum: 30Minimum: 0Average: 0.1
Maximum: 0.3
Minimum: 0Average: 0.03Maximum: 0.3
Minimum: 1405Average: 1855Maximum: 2597Minimum: 0.0073Average: 0.021
Maximum: 0.216
Notes:Green highlight = option one for defining the advection termBlue highlight = option two for defining the advection termGray highlight = not applicable
ft
14 Source Width Width of plume Assumed to be width of MC loading area perpendicular to flow direction Listed on Table C-13
Listed on Table C-13
13 Source thickness Saturated thickness of aquifer layer Approximate thickess of tuff material near at the crater 150
12 Length of model Larger than final length of plume Does not affect model result
11 Width of model Larger than width of plume Does not affect model result Listed on Table C-13
10 foc Fraction of organic carbon (Interlayered lava and tuff with marine sediments, silty clay and alluvium)
The organic carbon content estimated for the soil types at MC loading area USDA NRCS, 2013 unitless
Model Parameters
Retardation
9 Bulk Density Density of Interlayered lava and tuff with marine sediments, silty clay and alluvium Estimated based on material description Fetter, 1994; USDA NRCS, n.d.;
McWhorter and Sundada, 1977 Kg/m3
8Ratio of Vertical to Longitudinal Dispersion
Dispersion ratio perpendicular to the direction of flow (vertically)
7Ratio of Transverse to Longitudinal Dispersion
Dispersion ratio perpendicular to the direction of flow (horizontally) ft
ft
Determined from estimated groundwater elevations by relating surface elevations at loading areas to surface elevations of known groundwater elevations at the landfill site located at the crater (Table C-13)
MCB Hawaii, 1994
Dispersion
6 Longitudinal Dispersion Dispersion in the direction of flow (horizontally) ft
5 Effective porosity Effective porosity of Interlayered lava and tuff with marine sediments, silty clayand alluvium
McWhorter and Sundada, 1977; USDA 1996
Advection
2 Groundwater velocity ft/d
Site Name:Date:Zone:
Value/Result
Flow
, Fat
e &
Tra
nspo
rt, M
odel
Par
amet
ers
1 Material TypeInterlayered lava and tuff with marine sediments, silty clay and alluvium
OR
3Horizontal Hydraulic Conductivity
Hydraulic Conductivity for Interlayered lava and tuff with marine sediments, silty clay and alluvium EMC, 1991; Oki, 1998 ft/d
4 Hydraulic Gradient Slope of the Water Table
LiteratureSite DataAssumption
LiteratureSite DataAssumption
Literature
Site Data
Assumption
LiteratureSite DataAssumption
LiteratureSite DataAssumption
LiteratureSite DataAssumption
LiteratureSite DataAssumption
LiteratureSite DataAssumption
LiteratureSite DataAssumption
Literature
Site Data
Assumption

Table B-13: Estimated Model Length, Model Width and Hydraulic Gradient Values Used in the BIOCHLOR Model
At Loading Area At CoastlineHE Impact Area 17.35 0 53 0.33 164 174Inert Impact Area 28.9 0 170 0.17 492 558Range 8 9.6 0 50 0.19 98 164Range 8A 22.7 0 77 0.29 30 253
Note:a Spatial data (MCBH, 2013a)b Dimension of MC Loading area that is perpendicular to groundwater flow (MCBH, 2013a)
dh/di - groundwater gradient
GW - groundwater
ft - feet
m - meters
m msl - meters mean sea level
Model Length (ft)
Estimated GW Elevation (m msl)a Distance to
Coastline (m)aMC Loading Area dh/di
Model Width
(ft)b

Appendix C
Small Arms Range Assessment Protocol Tables
Marine Corps Installations Command Range Environmental Vulnerability Assessment 5-Year Report Marine Corps Base Hawaii
C

APPENDIX C Small Arms Range Assessment Protocol
C-1
SMALL ARMS RANGE ASSESSMENT
Appendix Table of Contents
Introduction ......................................................................................................................... 1
Data Collection and Documentation ................................................................................... 3
Qualitative Assessment ....................................................................................................... 4
Small Arms Range Assessment Protocol ............................................................................ 6
Assessment Report .............................................................................................................. 8
Best Management Practices for Small Arms Ranges ......................................................... 8
SARAP Tables .................................................................................................................. 11
Introduction
The purpose of the Range Environmental Vulnerability Assessment (REVA) is to
identify whether there has been a release or there is a substantial threat of a release of
munitions constituents (MC) of concern from the operational range or range complex
areas to off-range areas. This is accomplished through the use of fate and transport
modeling and analysis of the REVA indicator MC based upon site-specific environmental
conditions at the operational ranges and training areas at an installation.
Lead is the primary REVA indicator MC for small arms ranges. The fate and transport
parameters for lead are based entirely on site-specific geochemical properties, which
cannot be determined solely by physical observation. Therefore, small arms ranges
associated with the installation are qualitatively reviewed and assessed to identify factors
that influence the potential for lead migration at the operational range, including:
design and layout,
the physical and chemical characteristics of the area, and
current and past operation and maintenance practices.
APPENDIX C Small Arms Range Assessment Protocol
C-2
In addition, potential receptors and pathways must be identified relative to the small arms
range being assessed. The potential for an identified receptor to be impacted by MC
migration through an identified pathway will be evaluated.
MC associated with small arms ammunition commonly used at operational ranges
include lead, antimony, copper, and zinc. REVA focuses on lead as the MC indicator for
small arms ranges because lead is the most prevalent (by weight) potentially hazardous
constituent associated with small arms ammunition. No specific quantitative conclusions
can be made regarding the fate and transport of lead since it is unlike any other MC.
Lead is geochemically specific regarding its mobility in the environment. Site-specific
conditions must be known (i.e., geochemical properties) in order to quantitatively assess
lead migration. Site-specific geochemical properties are only identified via sampling and
cannot be observed physically. Without site-specific physical and chemical
characterization, lead cannot effectively be modeled using fate and transport modeling
like the other indicator MC in REVA. The scientific community has established that
metallic lead (such as recently fired, unweathered bullets and shot) generally has low
chemical reactivity and low solubility in water and is relatively inactive in the
environment under most ambient or everyday conditions. However, a portion of lead
deposited on a range may become environmentally active if the right combination of
conditions exists.
This Small Arms Range Assessment Protocol was developed in lieu of collecting site-
specific information for every small arms range. The protocol will help to determine
which ranges necessitate data collection of site-specific geochemical properties or further
assessment based the range’s overall prioritization regarding the potential for an
identified receptor to be impacted by potential lead migration through an identified
pathway.
APPENDIX C Small Arms Range Assessment Protocol
C-3
Purpose
This protocol is to be used for:
1) Identifying the small arms ranges within the Marine Corps that have the greatestpotential for lead migration and impact to identified receptors, and
2) Assessing the need for implementing further actions. Recommended furtheractions may include, but are not limited to, the following:
Sampling surface water, groundwater, and/or soil
Conducting additional studies
Implementing best management practices (BMPs)
Data Collection and Documentation
The qualitative assessment process for a small arms range involves first defining and
documenting its physical and environmental conditions, as well as how the range is
utilized and maintained (including dates of use and types and amounts of small arms
ammunition expended). The small arms range data collection form within Section 3 of
the REVA Reference Manual is a guide to collecting and documenting the necessary
information in order to complete the evaluation forms presented later in this protocol
(Tables 1 through 6). It includes a comprehensive list of data elements that are useful in
establishing the historical and current physical and environmental conditions, as well as
capturing the types of information on conditions that influence lead’s potential to migrate
from the range. The data collection form is organized by major topics or information
areas associated with the operational range, including the following:
Basic range information
Current range layout
Current range operations
Historical range operations
Amount of lead potentially deposited
Environmental characteristics
APPENDIX C Small Arms Range Assessment Protocol
C-4
Potential receptors
Surrounding land use
Environmental activities conducted on the range
Summary
The data collection form in the REVA Reference Manual can be modified, where needed,
to fully capture the major factors that can potentially influence lead’s ability to migrate
from each specific small arms range.
Qualitative Assessment
The small arms range can be qualitatively assessed once the conditions of the range have
been fully understood and documented. The assessment process involves a discussion of
possible factors that can influence the potential for lead to migrate off range. Several of
these factors are listed below, followed by a detailed discussion:
Range use and range management (source)
Surface water conditions
Groundwater and soil conditions
Pathways
Receptors
Range Use and Range Management (Source)
The amount of lead and other MC deposited on a range is a combination of the following
factors:
Duration of use
Current and historical frequency of range usage
Amount and types of small arms ammunition expended on the range
Scope and frequency of any range maintenance activities involving the removal oflead from the range
Presence and duration of bullet-capturing technologies
APPENDIX C Small Arms Range Assessment Protocol
C-5
Surface Water Conditions
Under specific pH conditions, lead from shot or bullets can slowly dissolve in water.
Runoff and groundwater recharge could transport this dissolved lead off range. In
addition, lead adsorbed onto sediment can be transported off range in surface runoff. The
primary factors influencing the potential for lead to migrate via surface water include, but
are not limited to, the following:
pH of the water
Duration of water contact with the lead
Intensity and frequency of rainfall
Steepness of the slope containing lead
Amount and type of vegetation on the slope
Infiltration rate of surface soils
Presence of engineering controls or BMPs to modify or control surface waterrunoff
Groundwater and Soil Conditions
The amount of lead that dissolves in water is primarily influenced by the pH of the water
and the duration of water contact with the lead. Once lead is dissolved in water, the
amount of lead that attaches to the soil and/or enters the groundwater is determined by
several factors, including the following:
Organic carbon content of the soil
pH of the soil
Properties of the soil, including porosity, irreducible water content, and hydraulicconductivity
Amount of recharge percolating through the vadose zone
Clay content of the soil (lead attaches to clay minerals more than other soilfractions)
Depth to groundwater
APPENDIX C Small Arms Range Assessment Protocol
C-6
Pathways
The REVA Small Arms Range Assessment Protocol involves developing a conceptual
site model (CSM) for the range to identify the range’s physical and environmental
conditions. The CSM’s purpose is to identify if a potential for source-receptor-pathway
interaction may exist. Factors that influence the potential for a source-receptor-pathway
interaction (e.g., heavy range use, potable water supply wells in proximity to the range),
as well as factors that decrease the potential for such interactions, should be discussed in
the assessment.
Potential pathways include:
groundwater used as a source of potable or agricultural water,
the use of surface water downstream of a range as a source of potable oragricultural water, and
the use of the soil, surface water, or groundwater by sensitive species.
Receptors
Receptors in REVA can include on-range and off-range personnel and sensitive species
and ecosystem areas. Factors considered when assessing the potentially complete
exposure pathways for receptors include, but are not limited to, the following:
The number and proximity of water supply wells relative to the range
The characteristics of nearby water supply wells (e.g., depth to groundwater, wellconstruction details)
The uses of the surface water or groundwater (e.g., agriculture, drinking water)
The locations of nearby sensitive species areas, such as endangered specieshabitats (i.e., within proximity to the range)
Small Arms Range Assessment Protocol
This Small Arms Range Assessment Protocol is based on evaluating the potential for
exposure to receptors by MC. Evaluation rankings for surface water and groundwater
conditions are established for each small arms range. The rankings range between high
(indicating the highest potentialfor lead to migrate toward identified receptors) and
APPENDIX C Small Arms Range Assessment Protocol
C-7
minimal (indicating the lowest potential for lead to migrate toward identified receptors).
Possible recommended actions are based on the relative evaluation rankings assigned by
the protocol. High rankings necessitate further actions. Further actions may included
sampling, additional site-specific studies, and/or BMPs. These actions will be evaluated
based on site conditions for each range.
Protocol Instructions
1. For Tables 1 through 5:
a. Enter the appropriate score for each criteria in the site score column. Usethe highest (i.e., most conservative) value if no information is known tocomplete the score. A designated score may be overridden if it isdetermined that the value does not adequately represent the site based onsite characteristics and constituent loading estimates, , mark the scorecolumn appropriately (*) and fill in the notes section at the bottom of thetable with text detailing why the score was adjusted. Sum the site scores inthe last row.
2. Transfer the scores from Tables 1 through 5 onto Table 6 in the appropriate rows.
3. Use the scores in Table 6 to determine the surface water and groundwaterevaluation rankings.
Evaluation Ranking Designation
Once Table 6 is complete, the protocol finishes with two scores: the sum of surface water
elements and the sum of groundwater elements. These scores are used to identify the
appropriate evaluation ranking (High, Moderate, Minimal) for surface water and
groundwater (as mentioned in step 3 of the protocol instructions).
The surface water evaluation ranking and the groundwater evaluation ranking identify the
potential impact for lead migration for each of those pathways at the small arms range.
The ranking designations and their descriptions follow:
High = Small arms range most likely has the potential for lead migration to anidentified receptor and requires additional action(s).
Moderate = Small arms range may have the potential for lead migration to areceptor, most likely indicating that there is no immediate threat to human healthand the environment, but actions may be necessary to mitigate future concerns.
APPENDIX C Small Arms Range Assessment Protocol
C-8
Minimal = Small arms range has minimal or no potential for lead migration, butactions may be necessary to ensure that continuing training activity at the rangedoes not pose a future threat to human health and the environment.
These rankings are used to determine whether additional actions are appropriate. The
evaluation ranking (surface water or groundwater), as determined in Table 6, is used to
evaluate if further actions are suggested, based on the guidelines for recommended
actions (Table 7, provided on Page A-9).
The overall range evaluation rankings should be compared to each range within the
installation and to the overall rankings of all ranges across the Marine Corps. These
rankings will assist in determining how funding should best be allocated across the
Marine Corps to prevent environmental concerns due to small arms ranges.
Assessment Report
Once the Small Arms Range Assessment Protocol has been completed and appropriate
actions have been designated and implemented, the assessment should be written into a
report that describes the process taken, details the information used to score Tables 1
through 5, outlines the scores and evaluation rankings, and identifies the additional
actions taken. The report should detail whether an identified receptor is or is not
impacted by lead migration through the identified pathway(s). The completed protocol
tables should be included as an appendix to the report.
Best Management Practices for Small Arms Ranges
BMPs are important for all ranges and should be used appropriately to maintain the
sustainability of operational ranges. However, this protocol prioritizes which small arms
ranges may need BMPs to address specific possibilities of lead migration.
Following the Small Arms Range Assessment Protocol, BMPs may be recommended
based on the evaluation ranking. Prior to selecting and implementing BMPs, the
management objectives must be established. Depending on the range-specific site
conditions and the management objectives, the following BMPs should be considered:
APPENDIX C Small Arms Range Assessment Protocol
C-9
Bullet and shot containment techniques (e.g., berms, backstops, traps)
Prevention of soil erosion from berms, aprons, and other range areas
Soil amendments
Recovery and/or recycling of lead
Negative impacts of implementation should also be considered when selecting a BMP.
For example, using soil amendments may affect water quality of nearby water bodies or
modifying surface water runoff may impact nearby habitats.
The prevention of soil erosion can be achieved by implementing one or several of the
following practices:
Maintaining vegetation on berms and drainageways
Reducing runoff rates by adjusting site drainage patterns
Providing sediment traps such as a vegetated detention basin or infiltration area
Preventing the creation of a “point source”
Soil amendments may be an effective BMP by implementing one or both of the following
practices:
Increasing the retentive capacity of soil by adding organic matter, fertilizer,and/or lime
Maintaining a pH range between 6 and 8 by adding triple superphosphate, bonemeal, or other applicable additives
The recovery and recycling of lead from operational ranges should be considered as a
way to control the migration of lead. The following should be considered when
implementing recovery and recycling practices:
Focus on safety as the primary concern of the proposed activities
Avoid practices that appear as treatment activities (e.g. acid leaching, fixation,etc.)
Dispose lead by using a lead recycler or smelter
Use residual soil for the original purpose (e.g. berm/target area soil) followinglead recovery practices.
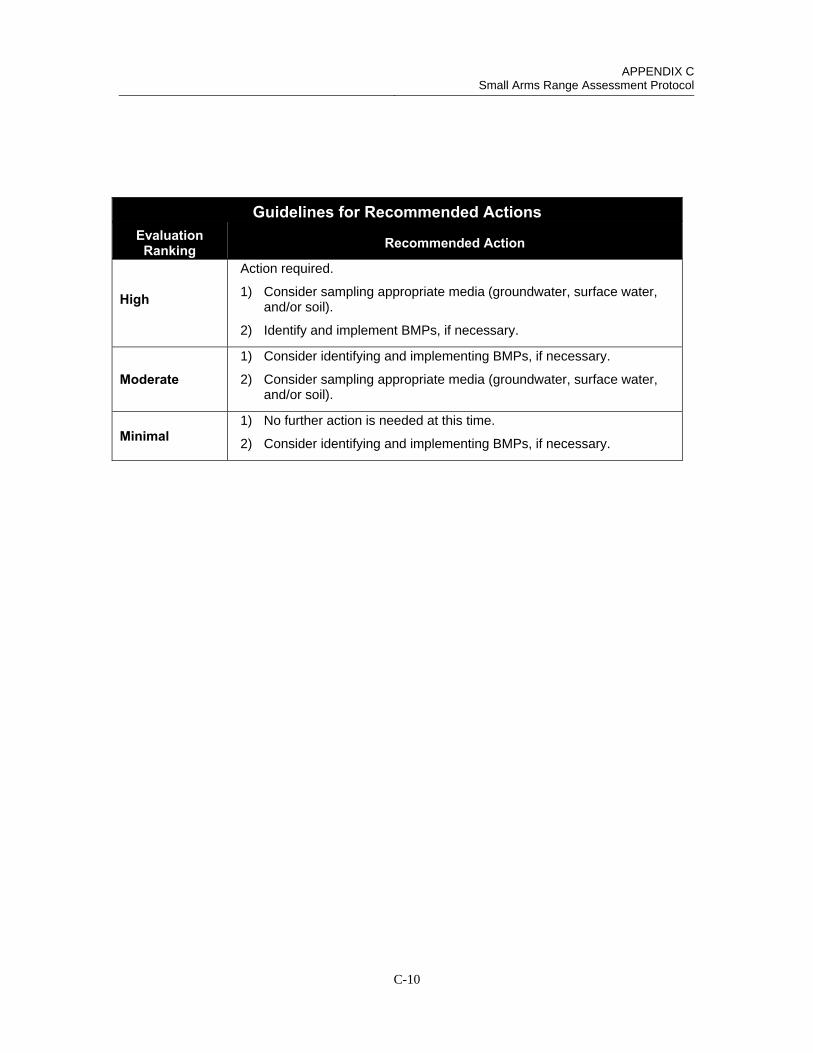
APPENDIX C Small Arms Range Assessment Protocol
C-10
Guidelines for Recommended Actions Evaluation
Ranking Recommended Action
High
Action required.
1) Consider sampling appropriate media (groundwater, surface water,and/or soil).
2) Identify and implement BMPs, if necessary.
Moderate
1) Consider identifying and implementing BMPs, if necessary.
2) Consider sampling appropriate media (groundwater, surface water,and/or soil).
Minimal 1) No further action is needed at this time.
2) Consider identifying and implementing BMPs, if necessary.
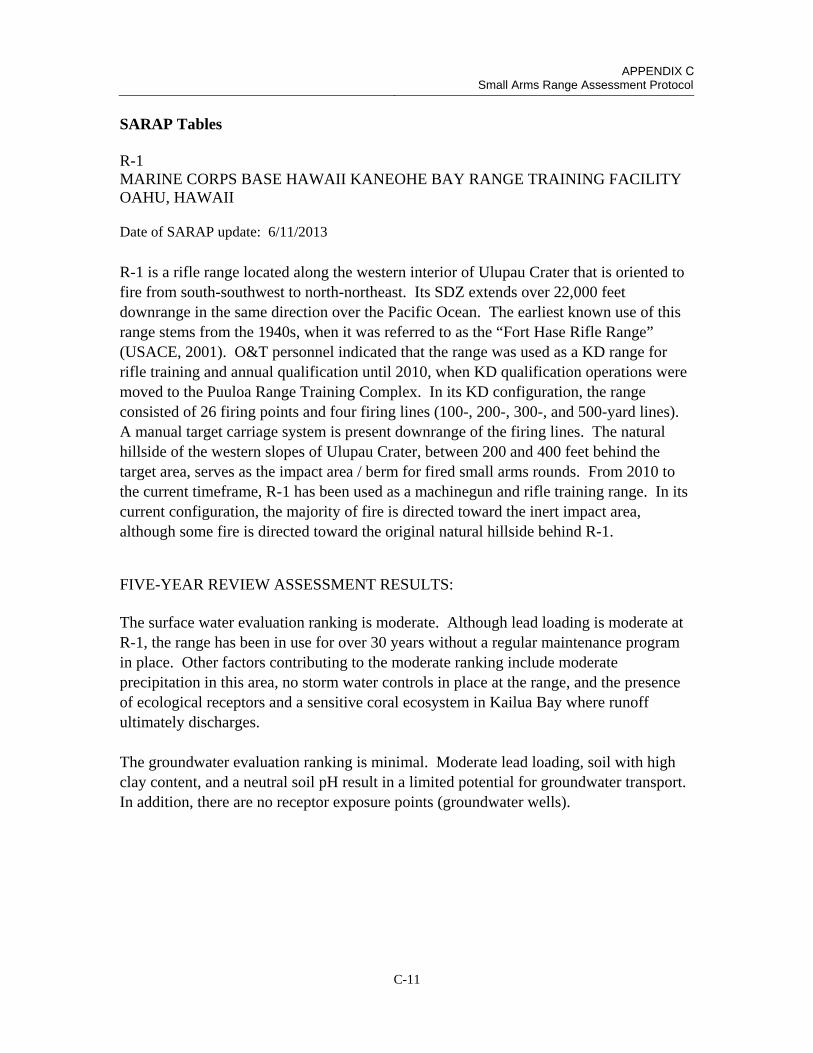
APPENDIX C Small Arms Range Assessment Protocol
C-11
SARAP Tables
R-1 MARINE CORPS BASE HAWAII KANEOHE BAY RANGE TRAINING FACILITY OAHU, HAWAII
Date of SARAP update: 6/11/2013
R-1 is a rifle range located along the western interior of Ulupau Crater that is oriented to fire from south-southwest to north-northeast. Its SDZ extends over 22,000 feet downrange in the same direction over the Pacific Ocean. The earliest known use of this range stems from the 1940s, when it was referred to as the “Fort Hase Rifle Range” (USACE, 2001). O&T personnel indicated that the range was used as a KD range for rifle training and annual qualification until 2010, when KD qualification operations were moved to the Puuloa Range Training Complex. In its KD configuration, the range consisted of 26 firing points and four firing lines (100-, 200-, 300-, and 500-yard lines). A manual target carriage system is present downrange of the firing lines. The natural hillside of the western slopes of Ulupau Crater, between 200 and 400 feet behind the target area, serves as the impact area / berm for fired small arms rounds. From 2010 to the current timeframe, R-1 has been used as a machinegun and rifle training range. In its current configuration, the majority of fire is directed toward the inert impact area, although some fire is directed toward the original natural hillside behind R-1.
FIVE-YEAR REVIEW ASSESSMENT RESULTS:
The surface water evaluation ranking is moderate. Although lead loading is moderate at R-1, the range has been in use for over 30 years without a regular maintenance program in place. Other factors contributing to the moderate ranking include moderate precipitation in this area, no storm water controls in place at the range, and the presence of ecological receptors and a sensitive coral ecosystem in Kailua Bay where runoff ultimately discharges.
The groundwater evaluation ranking is minimal. Moderate lead loading, soil with high clay content, and a neutral soil pH result in a limited potential for groundwater transport. In addition, there are no receptor exposure points (groundwater wells).
APPENDIX C Small Arms Range Assessment Protocol
C-12
R-1 MCB Hawaii – Kaneohe Bay Range Training Facility
Table 1: Range Use and Range Management (Source) Element (These definitions only apply for the purposes of the Small Arms Range Assessment Protocol.)
Criteria Evaluation Characteristics Score Criteria Site Score
Duration of Range Use
Existence of R-1 is documented to the 1940s; it has been used to the present time.
5 if usage > 30 years
3 if usage is 10 to 30 years
1 if usage < 10 years
5
Bullet-Capturing Technology
No current or historical bullet-capturing technology is documented.
-3 if range usage duration = bullet capture duration
-1 if range usage duration – bullet capture duration = 10 to 30 years
0 if range usage duration – bullet capture duration > 30 years
0
MC Loading Rates
Current average annual lead loading rate is approximately 722 lb/year.
5 if MC loading > 1000 pounds/year
3 if MC loading = 100 to 1000 pounds/year
1 if MC loading < 100 pounds/year 3
Range Maintenance
No regular maintenance program was noted.
5 if lead is removed less than every three years
3 if lead is removed more than every three years but less than annually
1 if lead is removed at least annually
5
Source Element Score 13 Notes: According to O&T personnel, 75% of munitions fired at R-1 from 2008 through 2010 were deposited in the R-1 impact berm and 25% were deposited in the inert impact area at KBRTF. 75% of munitions fired at R-1 from 2010 until the present were deposited in the inert impact area, and 25% were deposited in the R-1 impact berm. A small amount of expenditures from R-10, a small sniper range, are fired into the impact berm at R-1 as well as into the inert impact area. The MC loading rates decreased for this range since the baseline assessment because KD training once conducted on this range moved to the Puuloa Range Training Complex in 2010.
O&T personnel indicated that an environmental assessment was submitted to backfill the low-lying vegetated area on the eastern side of R-1 adjacent to the 100-yard firing line to increase training capabilities.
APPENDIX C Small Arms Range Assessment Protocol
C-13
R-1 MCB Hawaii – Kaneohe Bay Range Training Facility
Table 2: Surface Water Pathways Characteristics Element (These definitions only apply for the purposes of the Small Arms Range Assessment Protocol.)
Criteria Evaluation Characteristics Score Criteria Site Score
pH of Water
The pH of surface water located approximately 7 miles from R-1 historically has been between 6.0 and 8.5. The pH of seawater is slightly above 8.0.
5 if pH < 6.5
3 if pH > 8.5
1 if pH 6.5 ≤ pH ≤ 8.5
1
Precipitation The average annual precipitation rate at Mokapu Peninsula is approximately 38 inches per year.
5 if precipitation > 40 inches/year
3 if precipitation = 20-40 inches/year
1 if precipitation < 20 inches/year
3
Slope of Range
The overall range has a slope of between 2% and 6%; the impact area along the crater wall and the impact berm are steeper.
5 if slope > 10%
3 if slope = 5% to 10%
1 if slope < 5%
5
Vegetation The impact berm is generally vegetated with grass, though eroded bullet pockets are evident.
5 if vegetation cover < 20%
3 if vegetation cover = 20% to 50%
1 if vegetation cover > 50%
3
Soil Type/Runoff Conditions
The soil at R-1 is composed of either Makalapa Clay or Rock Land soils.
5 if soil type is clay / silty clay
3 if soil type is clayey sand / silt
1 if soil type is sand/gravel
5
Runoff/ Erosion Engineering Controls
No engineering controls are present. Grass growing around the impact berm may not control erosion effectively.
0 if no engineering controls -5 if partial engineering controls
-10 if effective engineering controls 0
Surface Water Pathway Score 17
Notes: There are no surface water bodies located within the KBRTF and no known record of pH measurements of surface water runoff within Ulupau Crater. The closest water body is Kailua Bay with a pH of slightly greater than 8.0. The USGS measured pH of Haiku Stream near Heeia, HI between 1970 and 1998. Thiese data were collected almost 7 miles south-southwest of the KBRTF. The pH of surface water was between 6.0 and 8.5 with the majority of pH measurements between 7.3 and 8.0.
Based on elevation contours, the impact area of the range slopes between 12% and 13 % (MCBH, 2007). According to USDA data, there are two soil types located at R-1. The northern half of the range, including the target and impact areas, consists of Rock Land soils. The southern half of the range, containing the firing points, consists of Makalapa Clay. Makalapa clay is a fine, dark magnesium clay derived primarily from volcanic tuff. The Rock Land soils are primarily comprised of silts (49.8%) and clays (42.5%).

APPENDIX C Small Arms Range Assessment Protocol
C-14
R-1
MCB Hawaii – Kaneohe Bay Range Training Facility
Table 3: Groundwater Pathways Characteristics Element (These definitions only apply for the purposes of the Small Arms Range Assessment Protocol.)
Criteria Evaluation Characteristics Score
Criteria Site
Score
Depth to Groundwater
Shallow groundwater levels are about 1 to 2 feet amsl in the caprock. Based on the elevation of the impact area at R-1, the depth to groundwater is 55 to 60 feet amsl.
5 if depth to groundwater < 20 feet
3 if depth to groundwater = 20-99 feet
1 if depth to groundwater = 100-300 feet
0 if depth to groundwater >300 feet
3
Precipitation The average annual precipitation rate at Mokapu Peninsula is approximately 38 inches per year.
5 if precipitation > 40 inches/year
3 if precipitation = 20-40 inches/year
1 if precipitation < 20 inches/year
3
pH of Water The pH of groundwater is unknown.
5 if pH < 6.5
3 if pH > 8.5
1 if pH 6.5 ≤ pH ≤ 8.5
3
pH of Soil Based on USDA soil series descriptions, the pH of soil at R-1 is between 6.6 and 8.4.
5 if pH < 6.5 3 if pH > 8.5
1 if pH 6.5 ≤ pH ≤ 8.5 1
Soil Type/Infiltration Conditions
The soil at R-1 is composed of either Makalapa Clay or Rock Land soils.
5 if soil type is sand/gravel
3 if soil type is clayey sand / silt
1 if soil type is clay / silty clay
1
Clay Content in Soil
The soil at R-1 is composed of either Makalapa Clay or Rock Land soils.
5 if soil type is sand/gravel
3 if soil type is clayey sand / silt
1 if soil type is clay / silty clay
1
Groundwater Pathway Score 12
Notes:
There are no known groundwater wells in the immediate vicinity of the range; consequently, groundwater pH values are not known. Based on proximity to the ocean, all groundwater is assumed to discharge to the Pacific Ocean.
According to USDA data, there are two soil types located at R-1. The northern half of the range, including the target and impact areas, consists of Rock Land soils. The southern half of the range, containing the firing points, consists of Makalapa Clay. Makalapa clay is a fine, dark magnesium clay derived primarily from volcanic tuff. The Rock Land soils are primarily comprised of silts (49.8%) and clays (42.5%).
APPENDIX C Small Arms Range Assessment Protocol
C-15
R-1 MCB Hawaii – Kaneohe Bay Range Training Facility
Table 4: Surface Water Receptors Element (These definitions only apply for the purposes of the Small Arms Range Assessment Protocol.)
Criteria Evaluation Characteristics
Score Criteria
Site Score
Drinking Water Usage
The Kailua Bay is downstream of R-1 and is not used as a drinking water source. No other surface water bodies used for drinking water supply are located downstream of R-1.
10 if analytical data or observable evidence indicates that contamination in the media is
present at, is moving toward, or has a reasonable potential to move toward a surface water body
used as a potable water supply or if a designation as a potable water source is unknown
5 if contamination in the media has moved or is expected to move only slightly beyond the source
(tens of feet) or could move, but is not moving appreciably, toward surface water body used as a
potable water supply or if a designation as a potable water source is unknown
2 if low possibility for contamination in the media to be present at or migrate to a point of exposure
2
Agricultural or Other Beneficial Usage
Kailua Bay is located downstream of R-1. The shore downstream of R-1 is off-limits to recreational use. Fishing and other recreational activities are no longer permitted in the waters off KBRTF.
5 if analytical data or observable evidence indicates that contamination in the media is
present at, is moving toward, or has moved to a point of exposure or if a designation as
agricultural or other beneficial usage is unknown
3 if contamination in the media has moved only slightly beyond the source (tens of feet) or could
move but is not moving appreciably.
1 if low possibility for contamination in the media to be present at or migrate to a point of exposure
1
Sensitive Species Habitat and Threatened or Endangered Species
No threatened or endangered species are located within R-1; however, several threatened or endangered species have been observed in Kailua Bay and the Pacific Ocean. Coral communities are located in the waters of Kailua Bay bordering immediately east of the KBRTF.
10 if identified receptors have access to possibly contaminated media and/or are located adjacent
to the range boundary
5 if potential for receptors to have access to possibly contaminated media
1 if little or no potential for receptors to have access to possible contaminated media
5
Surface Water Receptor Score 8
Notes:
APPENDIX C Small Arms Range Assessment Protocol
C-16
Coral reefs have been identified downstream of R-1, located in the littoral zone between Flyer’s Monument Point and Ulupau Head. Several species of concern have been observed in the waters around the KBRTF. These species include the threatened green sea turtle, the endangered hawksbill turtle, the endangered Hawaiian monk seal, and the endangered humpback whale. Lead is most likely to be transported to ocean waters during heavy precipitation events. The dilution of the incoming runoff is expected to result in low concentrations of MC in Kailua Bay. However, MC adhered to sediment may settle on the floor of Kailua Bay, potentially creating an MC exposure to benthic organisms and other species that come into contact with the sediment.
The Ulupau Head WMA is located north of R-1 and was established to help maintain the largest breeding population of red-footed boobies in the Hawaiian Islands (SRGII, 2004). The potential exposure of the red-footed boobies is expected to be limited because there is not a perennial surface water source at the Ulupau Crater. Therefore, the only exposure pathway would be direct contact with lead in the surface soils at R-1, which is unlikely.
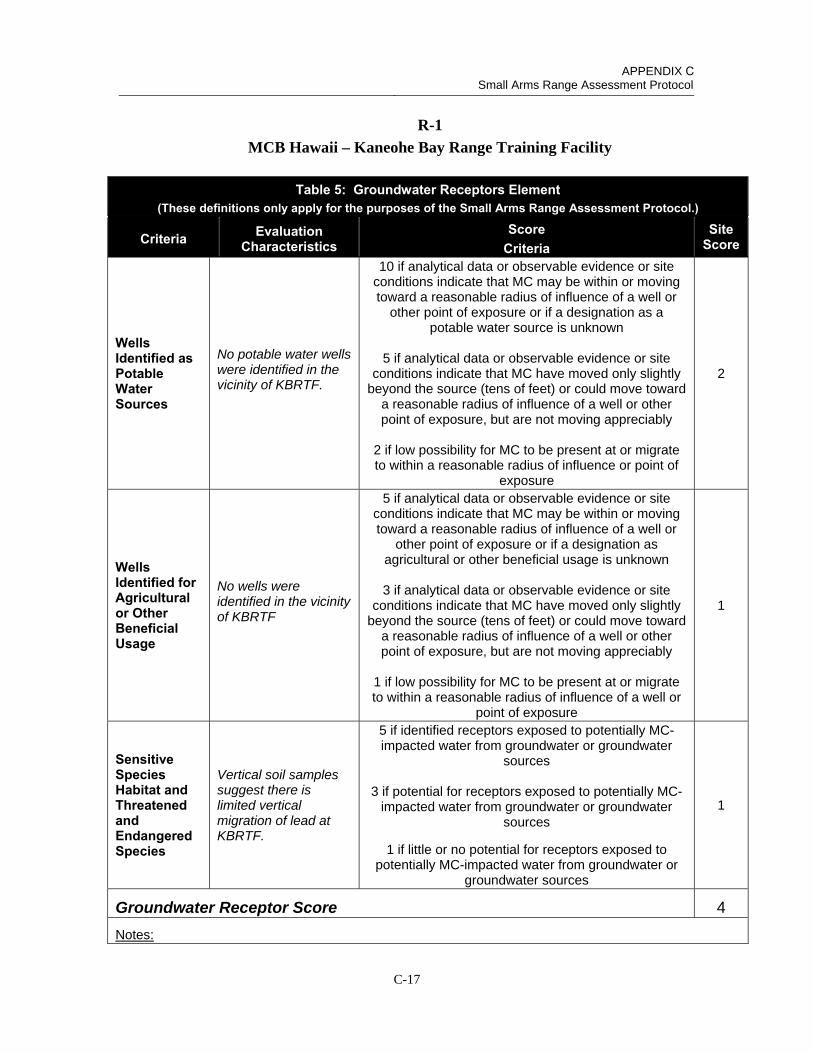
APPENDIX C Small Arms Range Assessment Protocol
C-17
R-1
MCB Hawaii – Kaneohe Bay Range Training Facility
Table 5: Groundwater Receptors Element (These definitions only apply for the purposes of the Small Arms Range Assessment Protocol.)
Criteria Evaluation Characteristics
Score Criteria
Site Score
Wells Identified as Potable Water Sources
No potable water wells were identified in the vicinity of KBRTF.
10 if analytical data or observable evidence or site conditions indicate that MC may be within or moving toward a reasonable radius of influence of a well or
other point of exposure or if a designation as a potable water source is unknown
5 if analytical data or observable evidence or site conditions indicate that MC have moved only slightly
beyond the source (tens of feet) or could move toward a reasonable radius of influence of a well or other point of exposure, but are not moving appreciably
2 if low possibility for MC to be present at or migrate to within a reasonable radius of influence or point of
exposure
2
Wells Identified for Agricultural or Other Beneficial Usage
No wells were identified in the vicinity of KBRTF
5 if analytical data or observable evidence or site conditions indicate that MC may be within or moving toward a reasonable radius of influence of a well or
other point of exposure or if a designation as agricultural or other beneficial usage is unknown
3 if analytical data or observable evidence or site conditions indicate that MC have moved only slightly
beyond the source (tens of feet) or could move toward a reasonable radius of influence of a well or other point of exposure, but are not moving appreciably
1 if low possibility for MC to be present at or migrate to within a reasonable radius of influence of a well or
point of exposure
1
Sensitive Species Habitat and Threatened and Endangered Species
Vertical soil samples suggest there is limited vertical migration of lead at KBRTF.
5 if identified receptors exposed to potentially MC-impacted water from groundwater or groundwater
sources
3 if potential for receptors exposed to potentially MC-impacted water from groundwater or groundwater
sources
1 if little or no potential for receptors exposed to potentially MC-impacted water from groundwater or
groundwater sources
1
Groundwater Receptor Score 4
Notes:
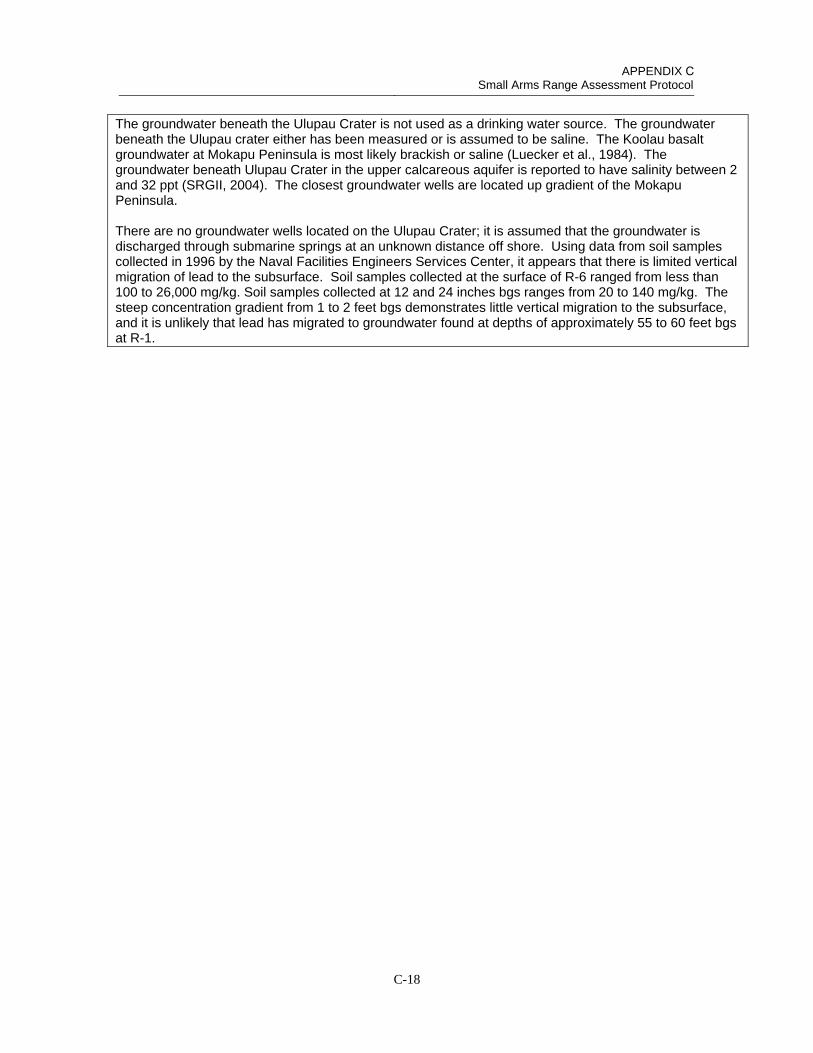
APPENDIX C Small Arms Range Assessment Protocol
C-18
The groundwater beneath the Ulupau Crater is not used as a drinking water source. The groundwater beneath the Ulupau crater either has been measured or is assumed to be saline. The Koolau basalt groundwater at Mokapu Peninsula is most likely brackish or saline (Luecker et al., 1984). The groundwater beneath Ulupau Crater in the upper calcareous aquifer is reported to have salinity between 2 and 32 ppt (SRGII, 2004). The closest groundwater wells are located up gradient of the Mokapu Peninsula.
There are no groundwater wells located on the Ulupau Crater; it is assumed that the groundwater is discharged through submarine springs at an unknown distance off shore. Using data from soil samples collected in 1996 by the Naval Facilities Engineers Services Center, it appears that there is limited vertical migration of lead to the subsurface. Soil samples collected at the surface of R-6 ranged from less than 100 to 26,000 mg/kg. Soil samples collected at 12 and 24 inches bgs ranges from 20 to 140 mg/kg. The steep concentration gradient from 1 to 2 feet bgs demonstrates little vertical migration to the subsurface, and it is unlikely that lead has migrated to groundwater found at depths of approximately 55 to 60 feet bgs at R-1.

APPENDIX C Small Arms Range Assessment Protocol
C-19
R-1 MCB Hawaii – Kaneohe Bay Range Training Facility
Table 6: Evaluation Score (These definitions only apply for the purposes of the Small Arms Range Assessment Protocol.)
Surface Water Element Table Score
Range Use and Range Management (Source) 1 13
Surface Water Pathways 2 17
Surface Water Receptors 4 8
Sum of Surface Water Element Scores 38
Groundwater
Element Table Score
Range Use and Range Management (Source) 1 13
Groundwater Pathways 3 12
Groundwater Receptors 5 4
Sum of Groundwater Element Scores 29
The relative evaluation ranking for each media is determined by selecting the appropriate score based on the data elements for that media:
Evaluation Ranking* Score Range High 50-65 Moderate 30-49 Minimal 0-29
*Use the Evaluation Ranking to determine if further actions are warrantedbased on the guidelines for recommended actions, as defined in Table 7.
Surface Water Evaluation Ranking Moderate
Groundwater Evaluation Ranking Minimal
Notes:
APPENDIX C Small Arms Range Assessment Protocol
C-20
R-2 MARINE CORPS BASE HAWAII KANEOHE BAY RANGE TRAINING FACILITY OAHU, HAWAII
Date of SARAP update: 6/11/2013
R-2 is a KD pistol and shotgun range located at the southern interior reach of Ulupau Crater, just south of R-1; it is oriented for firing from north-northeast to south-southwest. Its SDZ extends approximately 6,000 feet downrange; however, the presence of a bullet trap and overhead baffle system limit the extent of the SDZ. This SAR, established in 1957, is used for individual small arms training, pistol requalification, and recreational exercises (USACE, 2001). The range consists of 23 firing points and four firing lines (7-, 15-, 25- and 50-yard lines). A bullet trap (SuperTrap utilizing ballistic rubber) was installed on the range in 2007, and the trap effectively captures fired small arms projectiles. O&T has not observed projectile ricochet and, as such, the trap has not been mined for lead. The majority of small arms ammunition expended at R-2 consists of various pistol cartridges.
FIVE-YEAR REVIEW ASSESSMENT RESULTS:
The surface water evaluation ranking is minimal. Although loading on the range is high, the evaluation indicates a low potential for the off-range migration of lead through surface water due to several factors: R-2 is well vegetated, has effective runoff/erosion controls in place, and is equipped with a bullet trap. There are no identified human receptors and limited potential exposure to ecological receptors.
The groundwater evaluation ranking is minimal. Although loading on the range is high and there is no regular range maintenance, a bullet trap is in place to contain fired projectiles. The clay soil impedes infiltration, and soil sampling results indicated that lead in soil is not migrating vertically. Finally, no human or ecological groundwater receptors were identified.

APPENDIX C Small Arms Range Assessment Protocol
C-21
R-2 MCB Hawaii – Kaneohe Bay Range Training Facility
Table 1: Range Use and Range Management (Source) Element (These definitions only apply for the purposes of the Small Arms Range Assessment Protocol.)
Criteria Evaluation Characteristics Score Criteria Site Score
Duration of Range Use R-2 was established in 1957.
5 if usage > 30 years 3 if usage is 10 to 30 years
1 if usage < 10 years 5
Bullet-Capturing Technology
A bullet trap was installed at R-2 in 2007.
-3 if range usage duration = bullet capture duration
-1 if range usage duration – bullet capture duration = 10 to 30 years
0 if range usage duration – bullet capture duration > 30 years
0
MC Loading Rates
Current average annual lead loading rate is approximately 2,532 lb/year.
5 if MC loading > 1000 pounds/year
3 if MC loading = 100 to 1000 pounds/year
1 if MC loading < 100 pounds/year
5
Range Maintenance
The bullet trap has never been mined for lead. There is no record of maintenance prior to the installation of the bullet trap.
5 if lead is removed less than every three years
3 if lead is removed more than every three years but less than annually
1 if lead is removed at least annually
5
Source Element Score 15
Notes:
The bullet trap consists of shredded rubber and Gel-CorTM materials.
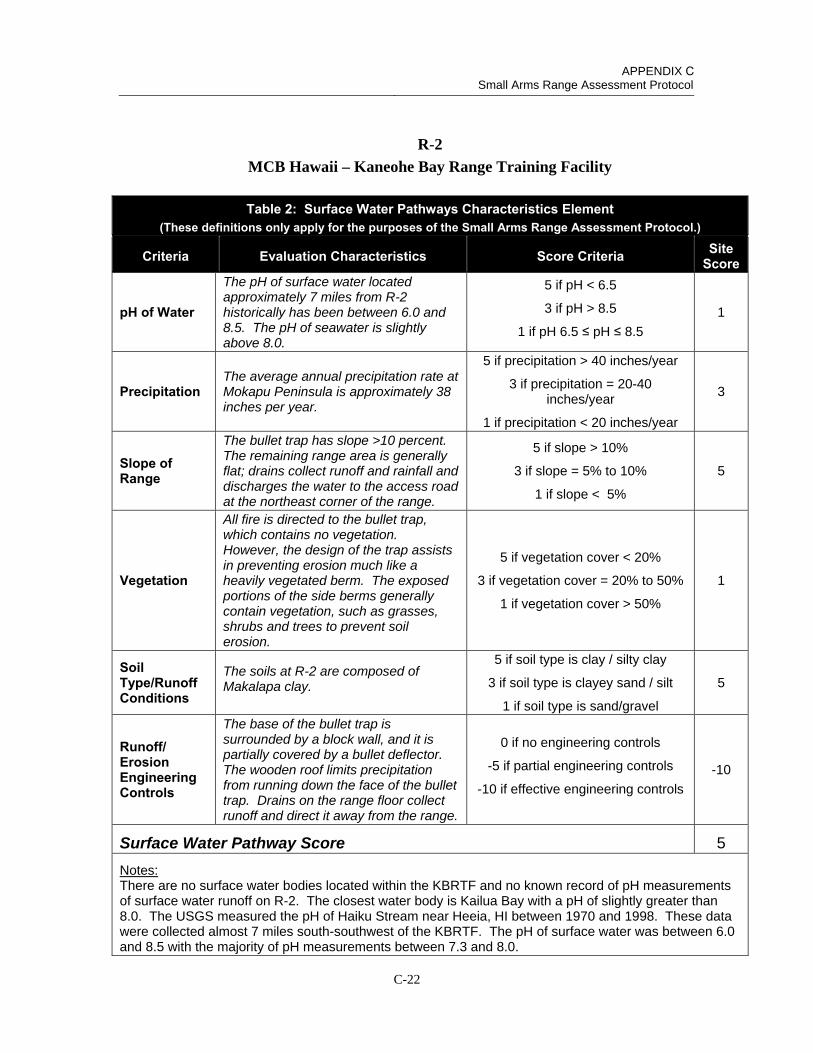
APPENDIX C Small Arms Range Assessment Protocol
C-22
R-2
MCB Hawaii – Kaneohe Bay Range Training Facility
Table 2: Surface Water Pathways Characteristics Element (These definitions only apply for the purposes of the Small Arms Range Assessment Protocol.)
Criteria Evaluation Characteristics Score Criteria Site Score
pH of Water
The pH of surface water located approximately 7 miles from R-2 historically has been between 6.0 and 8.5. The pH of seawater is slightly above 8.0.
5 if pH < 6.5
3 if pH > 8.5
1 if pH 6.5 ≤ pH ≤ 8.5
1
Precipitation The average annual precipitation rate at Mokapu Peninsula is approximately 38 inches per year.
5 if precipitation > 40 inches/year
3 if precipitation = 20-40 inches/year
1 if precipitation < 20 inches/year
3
Slope of Range
The bullet trap has slope >10 percent. The remaining range area is generally flat; drains collect runoff and rainfall and discharges the water to the access road at the northeast corner of the range.
5 if slope > 10%
3 if slope = 5% to 10%
1 if slope < 5%
5
Vegetation
All fire is directed to the bullet trap, which contains no vegetation. However, the design of the trap assists in preventing erosion much like a heavily vegetated berm. The exposed portions of the side berms generally contain vegetation, such as grasses, shrubs and trees to prevent soil erosion.
5 if vegetation cover < 20%
3 if vegetation cover = 20% to 50%
1 if vegetation cover > 50%
1
Soil Type/Runoff Conditions
The soils at R-2 are composed of Makalapa clay.
5 if soil type is clay / silty clay
3 if soil type is clayey sand / silt
1 if soil type is sand/gravel
5
Runoff/ Erosion Engineering Controls
The base of the bullet trap is surrounded by a block wall, and it is partially covered by a bullet deflector. The wooden roof limits precipitation from running down the face of the bullet trap. Drains on the range floor collect runoff and direct it away from the range.
0 if no engineering controls
-5 if partial engineering controls
-10 if effective engineering controls
-10
Surface Water Pathway Score 5
Notes: There are no surface water bodies located within the KBRTF and no known record of pH measurements of surface water runoff on R-2. The closest water body is Kailua Bay with a pH of slightly greater than 8.0. The USGS measured the pH of Haiku Stream near Heeia, HI between 1970 and 1998. These data were collected almost 7 miles south-southwest of the KBRTF. The pH of surface water was between 6.0 and 8.5 with the majority of pH measurements between 7.3 and 8.0.
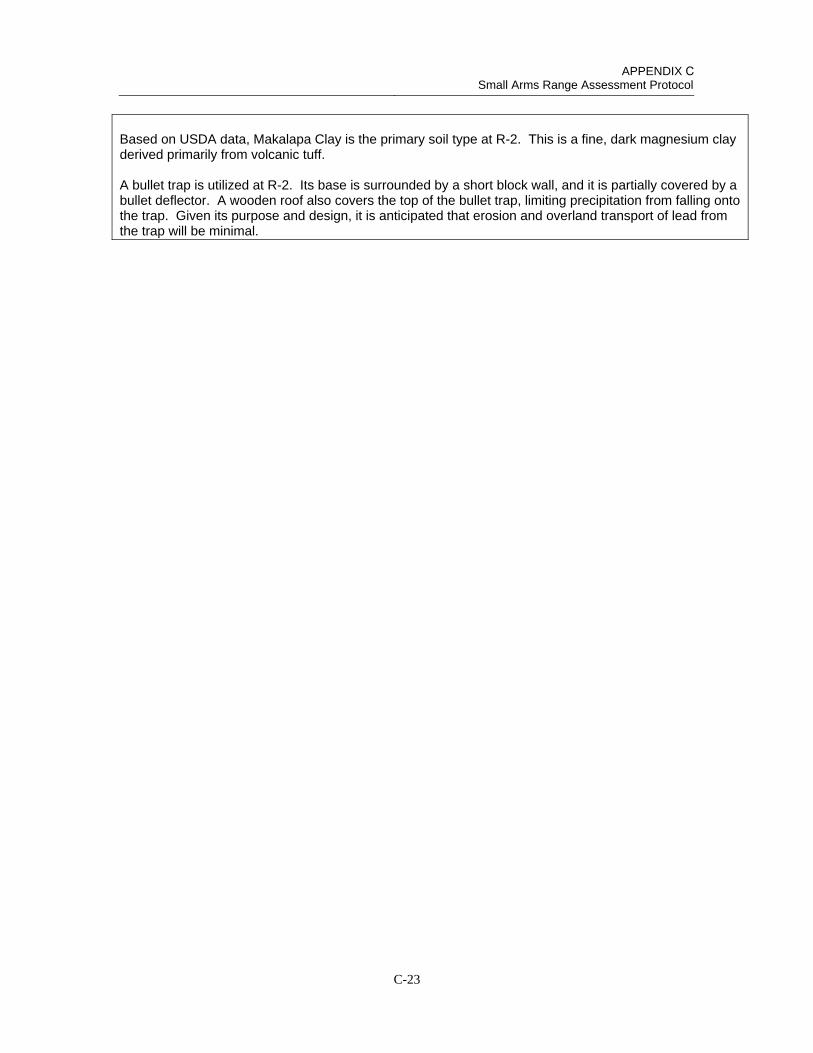
APPENDIX C Small Arms Range Assessment Protocol
C-23
Based on USDA data, Makalapa Clay is the primary soil type at R-2. This is a fine, dark magnesium clay derived primarily from volcanic tuff.
A bullet trap is utilized at R-2. Its base is surrounded by a short block wall, and it is partially covered by a bullet deflector. A wooden roof also covers the top of the bullet trap, limiting precipitation from falling onto the trap. Given its purpose and design, it is anticipated that erosion and overland transport of lead from the trap will be minimal.
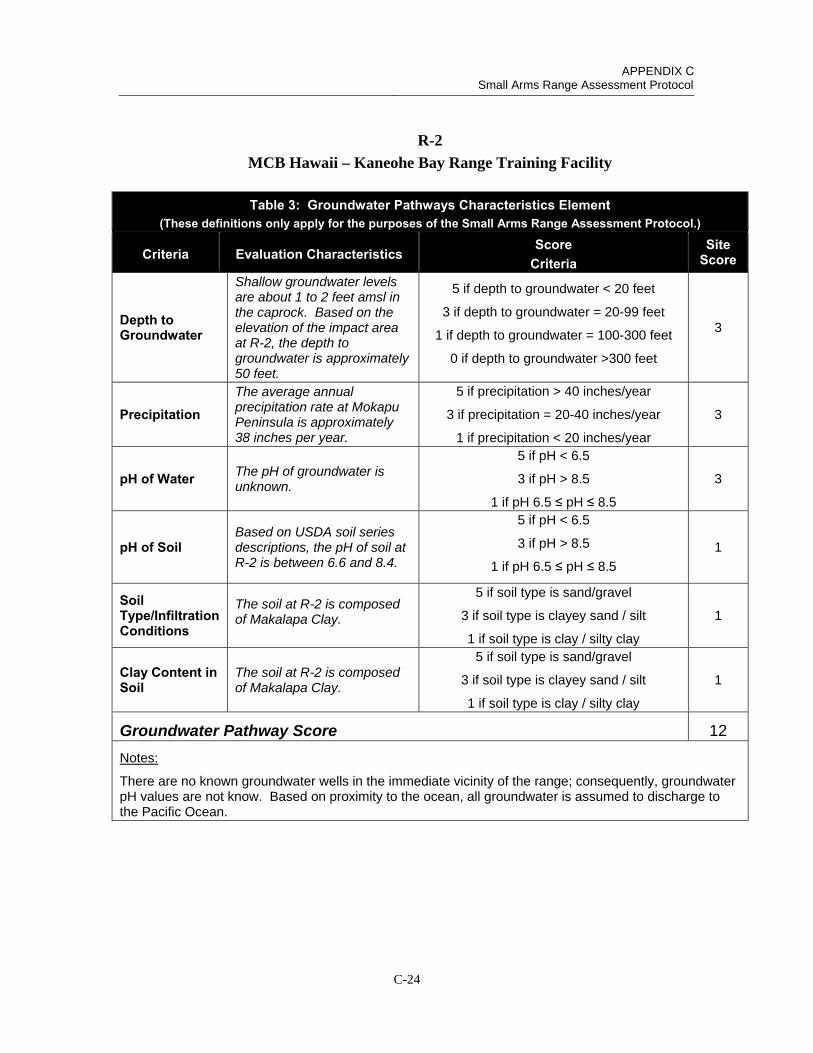
APPENDIX C Small Arms Range Assessment Protocol
C-24
R-2
MCB Hawaii – Kaneohe Bay Range Training Facility
Table 3: Groundwater Pathways Characteristics Element (These definitions only apply for the purposes of the Small Arms Range Assessment Protocol.)
Criteria Evaluation Characteristics Score
Criteria Site
Score
Depth to Groundwater
Shallow groundwater levels are about 1 to 2 feet amsl in the caprock. Based on the elevation of the impact area at R-2, the depth to groundwater is approximately 50 feet.
5 if depth to groundwater < 20 feet
3 if depth to groundwater = 20-99 feet
1 if depth to groundwater = 100-300 feet
0 if depth to groundwater >300 feet
3
Precipitation The average annual precipitation rate at Mokapu Peninsula is approximately 38 inches per year.
5 if precipitation > 40 inches/year
3 if precipitation = 20-40 inches/year
1 if precipitation < 20 inches/year
3
pH of Water The pH of groundwater is unknown.
5 if pH < 6.5
3 if pH > 8.5
1 if pH 6.5 ≤ pH ≤ 8.5
3
pH of Soil Based on USDA soil series descriptions, the pH of soil at R-2 is between 6.6 and 8.4.
5 if pH < 6.5
3 if pH > 8.5
1 if pH 6.5 ≤ pH ≤ 8.5
1
Soil Type/Infiltration Conditions
The soil at R-2 is composed of Makalapa Clay.
5 if soil type is sand/gravel
3 if soil type is clayey sand / silt
1 if soil type is clay / silty clay
1
Clay Content in Soil
The soil at R-2 is composed of Makalapa Clay.
5 if soil type is sand/gravel
3 if soil type is clayey sand / silt
1 if soil type is clay / silty clay
1
Groundwater Pathway Score 12
Notes:
There are no known groundwater wells in the immediate vicinity of the range; consequently, groundwater pH values are not know. Based on proximity to the ocean, all groundwater is assumed to discharge to the Pacific Ocean.
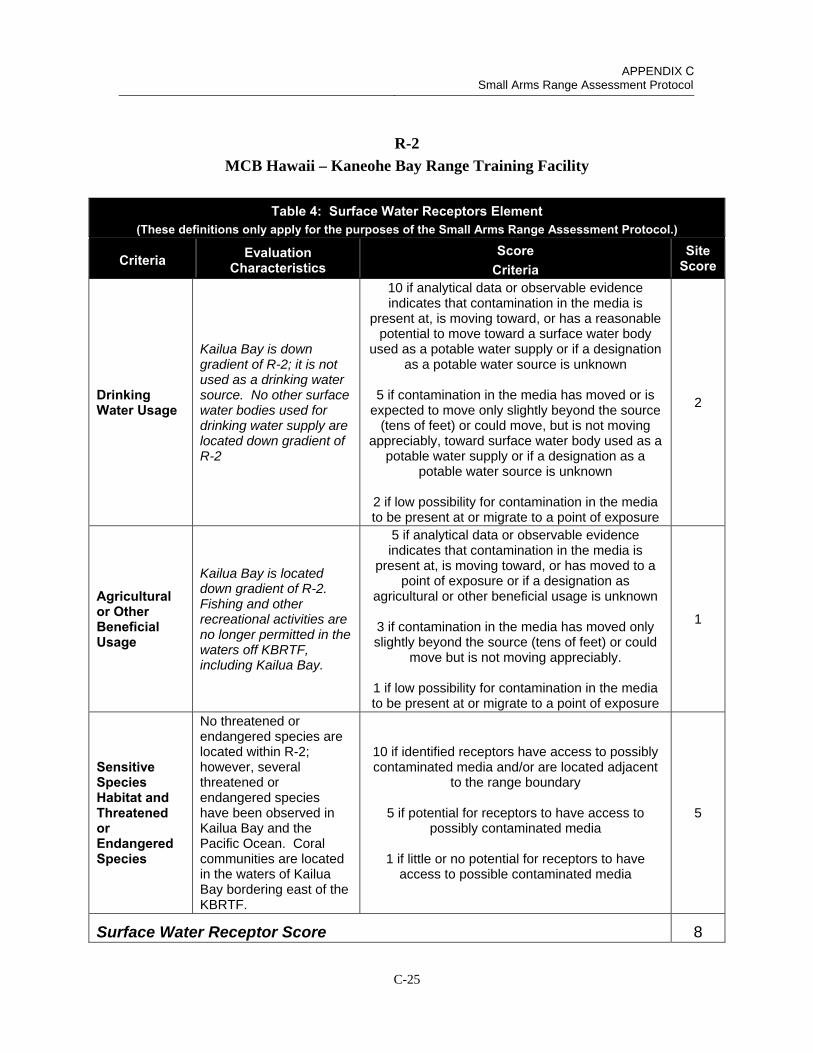
APPENDIX C Small Arms Range Assessment Protocol
C-25
R-2
MCB Hawaii – Kaneohe Bay Range Training Facility
Table 4: Surface Water Receptors Element (These definitions only apply for the purposes of the Small Arms Range Assessment Protocol.)
Criteria Evaluation Characteristics
Score Criteria
Site Score
Drinking Water Usage
Kailua Bay is down gradient of R-2; it is not used as a drinking water source. No other surface water bodies used for drinking water supply are located down gradient of R-2
10 if analytical data or observable evidence indicates that contamination in the media is
present at, is moving toward, or has a reasonable potential to move toward a surface water body
used as a potable water supply or if a designation as a potable water source is unknown
5 if contamination in the media has moved or is expected to move only slightly beyond the source
(tens of feet) or could move, but is not moving appreciably, toward surface water body used as a
potable water supply or if a designation as a potable water source is unknown
2 if low possibility for contamination in the media to be present at or migrate to a point of exposure
2
Agricultural or Other Beneficial Usage
Kailua Bay is located down gradient of R-2. Fishing and other recreational activities are no longer permitted in the waters off KBRTF, including Kailua Bay.
5 if analytical data or observable evidence indicates that contamination in the media is
present at, is moving toward, or has moved to a point of exposure or if a designation as
agricultural or other beneficial usage is unknown
3 if contamination in the media has moved only slightly beyond the source (tens of feet) or could
move but is not moving appreciably.
1 if low possibility for contamination in the media to be present at or migrate to a point of exposure
1
Sensitive Species Habitat and Threatened or Endangered Species
No threatened or endangered species are located within R-2; however, several threatened or endangered species have been observed in Kailua Bay and the Pacific Ocean. Coral communities are located in the waters of Kailua Bay bordering east of the KBRTF.
10 if identified receptors have access to possibly contaminated media and/or are located adjacent
to the range boundary
5 if potential for receptors to have access to possibly contaminated media
1 if little or no potential for receptors to have access to possible contaminated media
5
Surface Water Receptor Score 8
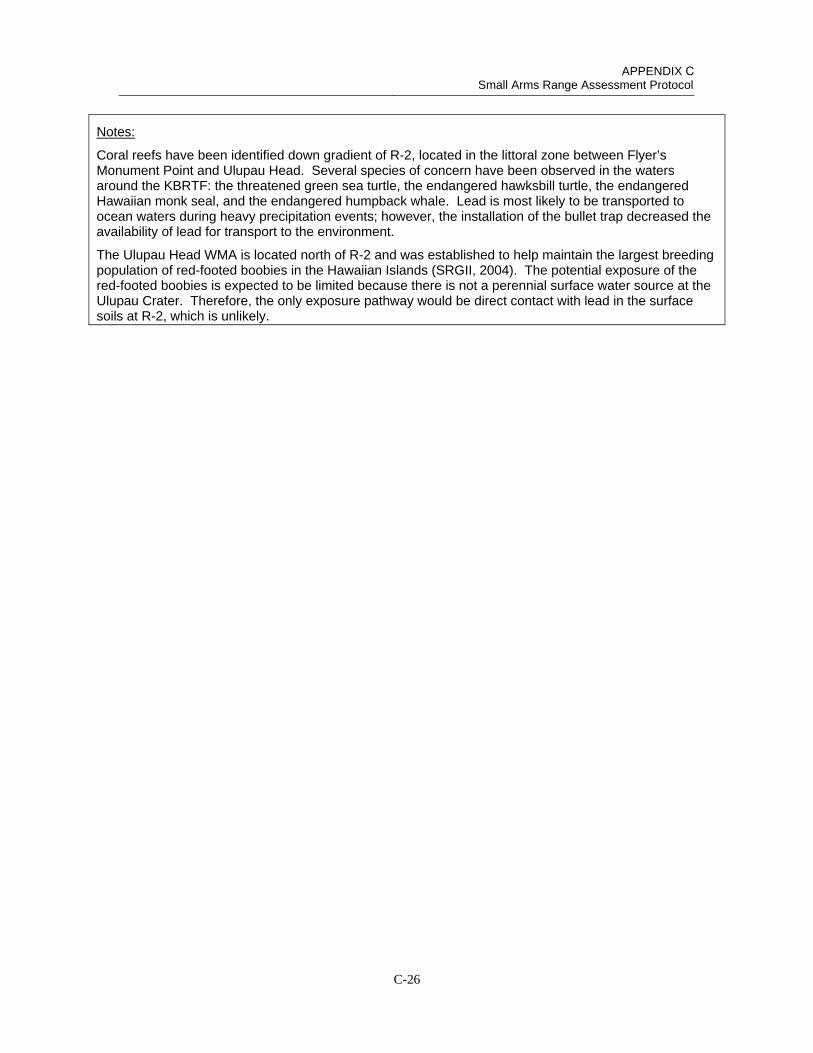
APPENDIX C Small Arms Range Assessment Protocol
C-26
Notes:
Coral reefs have been identified down gradient of R-2, located in the littoral zone between Flyer’s Monument Point and Ulupau Head. Several species of concern have been observed in the waters around the KBRTF: the threatened green sea turtle, the endangered hawksbill turtle, the endangered Hawaiian monk seal, and the endangered humpback whale. Lead is most likely to be transported to ocean waters during heavy precipitation events; however, the installation of the bullet trap decreased the availability of lead for transport to the environment.
The Ulupau Head WMA is located north of R-2 and was established to help maintain the largest breeding population of red-footed boobies in the Hawaiian Islands (SRGII, 2004). The potential exposure of the red-footed boobies is expected to be limited because there is not a perennial surface water source at the Ulupau Crater. Therefore, the only exposure pathway would be direct contact with lead in the surface soils at R-2, which is unlikely.

APPENDIX C Small Arms Range Assessment Protocol
C-27
R-2
MCB Hawaii – Kaneohe Bay Range Training Facility
Table 5: Groundwater Receptors Element (These definitions only apply for the purposes of the Small Arms Range Assessment Protocol.)
Criteria Evaluation Characteristics
Score Criteria
Site Score
Wells Identified as Potable Water Sources
No water supply wells were identified in the vicinity of KBRTF.
10 if analytical data or observable evidence or site conditions indicate that MC may be within or moving toward a reasonable radius of influence of a well or
other point of exposure or if a designation as a potable water source is unknown
5 if analytical data or observable evidence or site conditions indicate that MC have moved only slightly
beyond the source (tens of feet) or could move toward a reasonable radius of influence of a well or other point of exposure, but are not moving appreciably
2 if low possibility for MC to be present at or migrate to within a reasonable radius of influence or point of
exposure
2
Wells Identified for Agricultural or Other Beneficial Usage
No wells were identified in the vicinity of KBRTF.
5 if analytical data or observable evidence or site conditions indicate that MC may be within or moving toward a reasonable radius of influence of a well or
other point of exposure or if a designation as agricultural or other beneficial usage is unknown
3 if analytical data or observable evidence or site conditions indicate that MC have moved only slightly
beyond the source (tens of feet) or could move toward a reasonable radius of influence of a well or other point of exposure, but are not moving appreciably
1 if low possibility for MC to be present at or migrate to within a reasonable radius of influence of a well or
point of exposure
1
Sensitive Species Habitat and Threatened and Endangered Species
Vertical soil samples suggest there is limited vertical migration of lead at KBRTF.
5 if identified receptors exposed to potentially MC-impacted water from groundwater or groundwater
sources
3 if potential for receptors exposed to potentially MC-impacted water from groundwater or groundwater
sources
1 if little or no potential for receptors exposed to potentially MC-impacted water from groundwater or
groundwater sources
1
Groundwater Receptor Score 4

APPENDIX C Small Arms Range Assessment Protocol
C-28
Notes: The groundwater beneath the Ulupau Crater is not used as a drinking water source. The groundwater beneath the Ulupau Crater either has been measured or is assumed to be saline. The Koolau basalt groundwater at Mokapu Peninsula is most likely brackish or saline (Luecker et al., 1984). The groundwater beneath Ulupau Crater in the upper calcareous aquifer is reported to have salinity between 2 and 32 ppt (SRGII, 2004). The closest groundwater wells are located up gradient of the Mokapu Peninsula.
There are no groundwater wells located on the Ulupau Crater; it is assumed that the groundwater is discharged through submarine springs at an unknown distance off shore. Using data from soil samples collected in 1996 by the Naval Facilities Engineers Services Center, it appears that there is limited vertical migration of lead to the subsurface. Soil samples collected at the surface of R-6 ranged from less than 100 to 26,000 mg/kg. Soil samples collected at 12 and 24 inches bgs ranges from 20 to 140 mg/kg. The steep concentration gradient from 1 to 2 feet bgs demonstrates little vertical migration to the subsurface, and it is unlikely that lead has migrated to groundwater found at a depth of approximately 50 feet bgs at R-2.
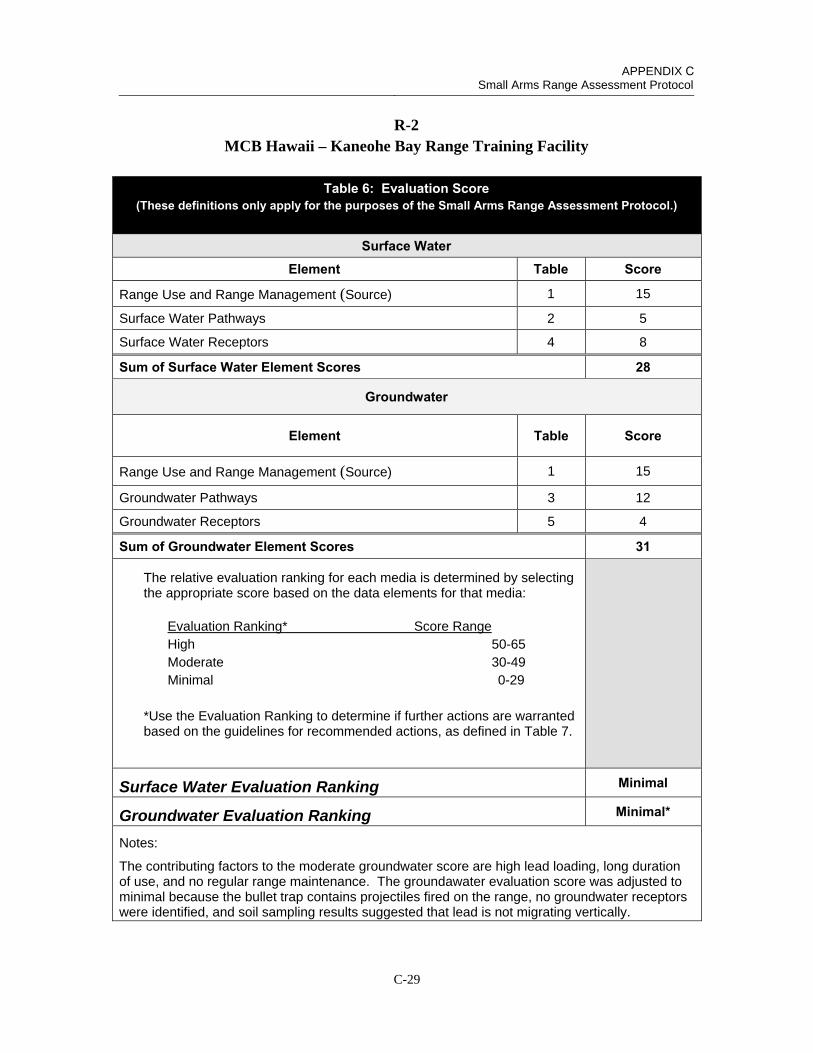
APPENDIX C Small Arms Range Assessment Protocol
C-29
R-2 MCB Hawaii – Kaneohe Bay Range Training Facility
Table 6: Evaluation Score (These definitions only apply for the purposes of the Small Arms Range Assessment Protocol.)
Surface Water Element Table Score
Range Use and Range Management (Source) 1 15
Surface Water Pathways 2 5
Surface Water Receptors 4 8
Sum of Surface Water Element Scores 28
Groundwater
Element Table Score
Range Use and Range Management (Source) 1 15
Groundwater Pathways 3 12
Groundwater Receptors 5 4
Sum of Groundwater Element Scores 31
The relative evaluation ranking for each media is determined by selecting the appropriate score based on the data elements for that media:
Evaluation Ranking* Score Range High 50-65 Moderate 30-49 Minimal 0-29
*Use the Evaluation Ranking to determine if further actions are warrantedbased on the guidelines for recommended actions, as defined in Table 7.
Surface Water Evaluation Ranking Minimal
Groundwater Evaluation Ranking Minimal*
Notes:
The contributing factors to the moderate groundwater score are high lead loading, long duration of use, and no regular range maintenance. The groundawater evaluation score was adjusted to minimal because the bullet trap contains projectiles fired on the range, no groundwater receptors were identified, and soil sampling results suggested that lead is not migrating vertically.
APPENDIX C Small Arms Range Assessment Protocol
C-30
R-6 (FBI Range) MARINE CORPS BASE HAWAII KANEOHE BAY RANGE TRAINING FACILITY OAHU, HAWAII
Date of SARAP update: 6/11/2013
R-6, otherwise known as the FBI Range, is a “square bay” range designed to support individual small arms training and qualification. R-6 was constructed in 1999 as a pistol and shotgun range, but rifles are also authorized. This range was constructed by the FBI though remains under the control of the Marine Corps. Previous ranges have existed at this same location, including a a practice rifle grenade range from the 1950s to the early 1960s and then a practice machine gun range through the 1970s (USACE, 2001). R-6 is oriented west-northwest to east-southeast; its SDZ extends approximately 16,000 feet in the same direction over the ocean. Firing lines are established at 3-, 5-, 15-, 25-, and 50-yard lines and contain 25 targets. Authorized ammunition includes pistol, shotgun , and rifle ammunition. The range contains a bullet trap (Supertrap) and lateral, vegetated side berms for containment of expended small arms projectiles.
FIVE-YEAR REVIEW ASSESSMENT RESULTS:
The surface water evaluation ranking is minimal. Despite the high levels of use at R-6, the evaluation indicates a low potential for the off-range migration of lead through surface water due to several factors: R-6 is well vegetated on the range floor and side berms, has effective runoff/erosion controls in place, and is equipped with a bullet trap. There are no human receptors, and only a limited potential exposure pathway for ecological receptors was identified.
The groundwater evaluation ranking is minimal. Although lead loading at the range is high, the presence of a bullet trap since the range has been operational significantly reduces availability of lead for off-range migration. No human or ecological receptors were identified for groundwater.
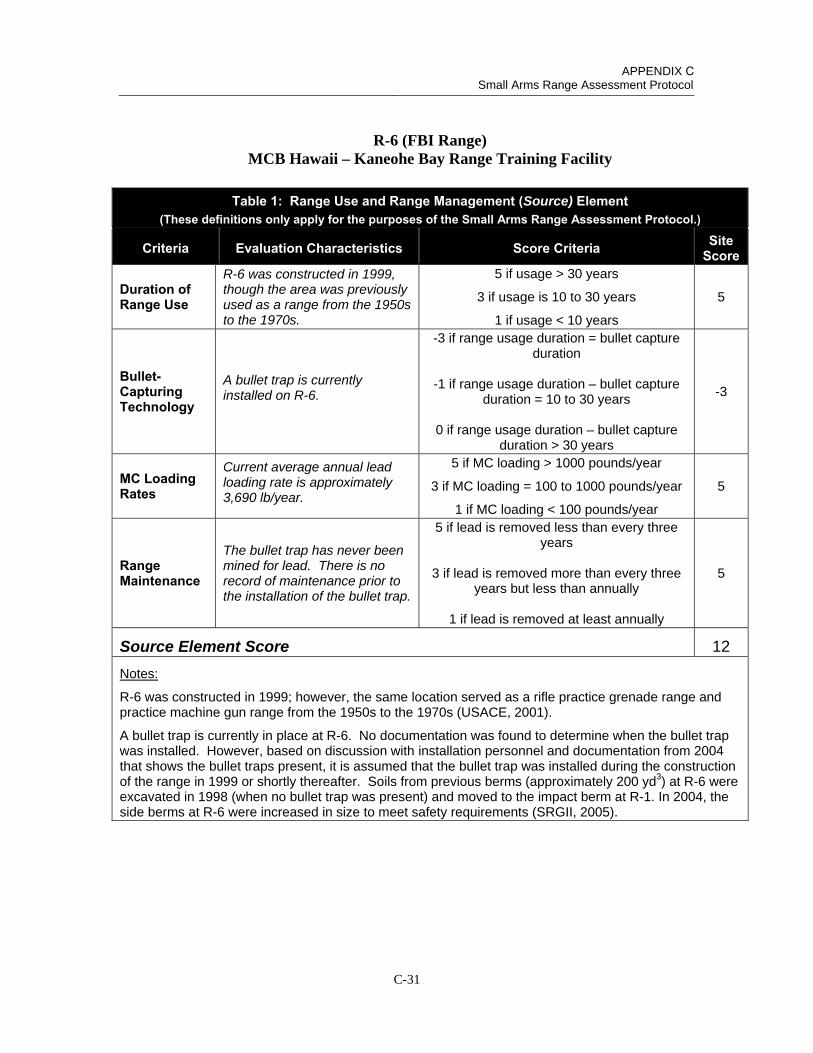
APPENDIX C Small Arms Range Assessment Protocol
C-31
R-6 (FBI Range) MCB Hawaii – Kaneohe Bay Range Training Facility
Table 1: Range Use and Range Management (Source) Element (These definitions only apply for the purposes of the Small Arms Range Assessment Protocol.)
Criteria Evaluation Characteristics Score Criteria Site Score
Duration of Range Use
R-6 was constructed in 1999, though the area was previously used as a range from the 1950s to the 1970s.
5 if usage > 30 years
3 if usage is 10 to 30 years
1 if usage < 10 years
5
Bullet-Capturing Technology
A bullet trap is currently installed on R-6.
-3 if range usage duration = bullet capture duration
-1 if range usage duration – bullet capture duration = 10 to 30 years
0 if range usage duration – bullet capture duration > 30 years
-3
MC Loading Rates
Current average annual lead loading rate is approximately 3,690 lb/year.
5 if MC loading > 1000 pounds/year
3 if MC loading = 100 to 1000 pounds/year
1 if MC loading < 100 pounds/year
5
Range Maintenance
The bullet trap has never been mined for lead. There is no record of maintenance prior to the installation of the bullet trap.
5 if lead is removed less than every three years
3 if lead is removed more than every three years but less than annually
1 if lead is removed at least annually
5
Source Element Score 12
Notes:
R-6 was constructed in 1999; however, the same location served as a rifle practice grenade range and practice machine gun range from the 1950s to the 1970s (USACE, 2001).
A bullet trap is currently in place at R-6. No documentation was found to determine when the bullet trap was installed. However, based on discussion with installation personnel and documentation from 2004 that shows the bullet traps present, it is assumed that the bullet trap was installed during the construction of the range in 1999 or shortly thereafter. Soils from previous berms (approximately 200 yd3) at R-6 were excavated in 1998 (when no bullet trap was present) and moved to the impact berm at R-1. In 2004, the side berms at R-6 were increased in size to meet safety requirements (SRGII, 2005).
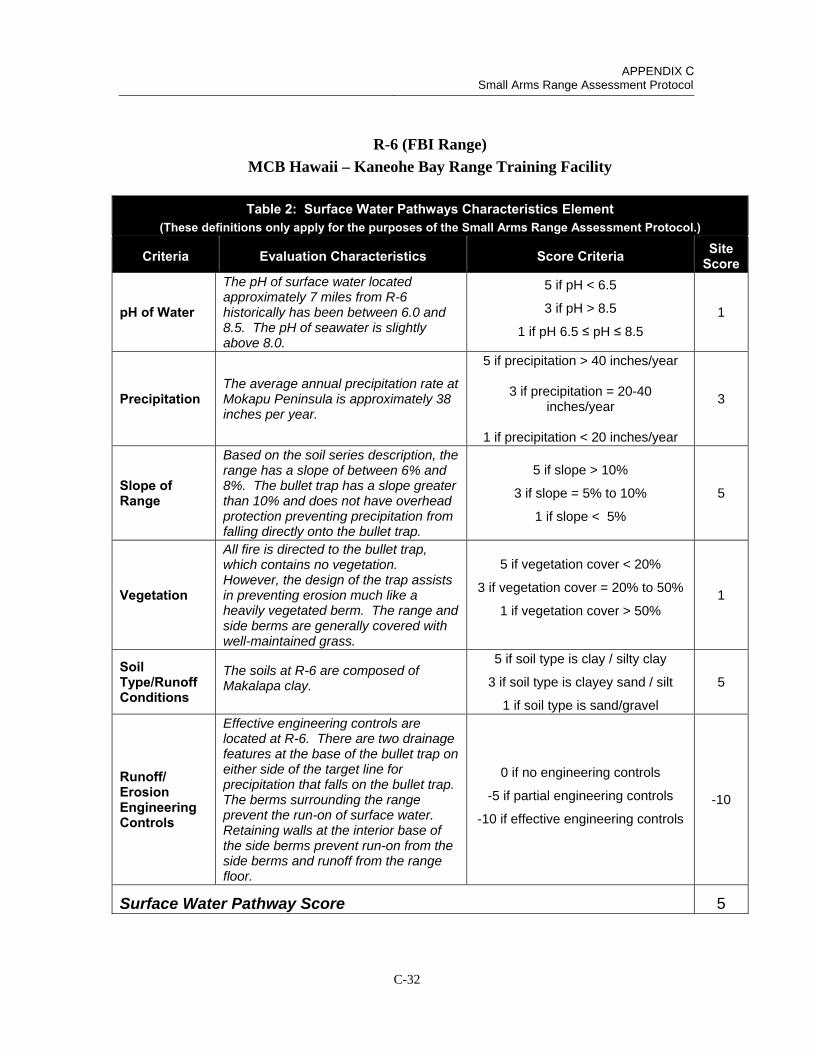
APPENDIX C Small Arms Range Assessment Protocol
C-32
R-6 (FBI Range)
MCB Hawaii – Kaneohe Bay Range Training Facility
Table 2: Surface Water Pathways Characteristics Element (These definitions only apply for the purposes of the Small Arms Range Assessment Protocol.)
Criteria Evaluation Characteristics Score Criteria Site Score
pH of Water
The pH of surface water located approximately 7 miles from R-6 historically has been between 6.0 and 8.5. The pH of seawater is slightly above 8.0.
5 if pH < 6.5
3 if pH > 8.5
1 if pH 6.5 ≤ pH ≤ 8.5
1
Precipitation The average annual precipitation rate at Mokapu Peninsula is approximately 38 inches per year.
5 if precipitation > 40 inches/year
3 if precipitation = 20-40 inches/year
1 if precipitation < 20 inches/year
3
Slope of Range
Based on the soil series description, the range has a slope of between 6% and 8%. The bullet trap has a slope greater than 10% and does not have overhead protection preventing precipitation from falling directly onto the bullet trap.
5 if slope > 10%
3 if slope = 5% to 10%
1 if slope < 5%
5
Vegetation
All fire is directed to the bullet trap, which contains no vegetation. However, the design of the trap assists in preventing erosion much like a heavily vegetated berm. The range and side berms are generally covered with well-maintained grass.
5 if vegetation cover < 20%
3 if vegetation cover = 20% to 50%
1 if vegetation cover > 50% 1
Soil Type/Runoff Conditions
The soils at R-6 are composed of Makalapa clay.
5 if soil type is clay / silty clay
3 if soil type is clayey sand / silt
1 if soil type is sand/gravel
5
Runoff/ Erosion Engineering Controls
Effective engineering controls are located at R-6. There are two drainage features at the base of the bullet trap on either side of the target line for precipitation that falls on the bullet trap. The berms surrounding the range prevent the run-on of surface water. Retaining walls at the interior base of the side berms prevent run-on from the side berms and runoff from the range floor.
0 if no engineering controls
-5 if partial engineering controls
-10 if effective engineering controls
-10
Surface Water Pathway Score 5
APPENDIX C Small Arms Range Assessment Protocol
C-33
Notes:
There are no surface water bodies located within the KBRTF, and no known record of pH measurements of surface water runoff on R-6. The closest water body is Kailua Bay with a pH of slightly greater than 8.0. The USGS measured pH of Haiku Stream near Heeia, HI between 1970 and 1998. These data were collected almost 7 miles south-southwest of the KBRTF. The pH of surface water was between 6.0 and 8.5 with the majority of pH measurements between 7.3 and 8.0.
R-6 sits on soils classified as Makalapa Clays. Makalapa clays are fine, dark magnesium clays derived from volcanic tuff. A small area east and downrange of R-6 consists of Rock Land soils, before reaching the ocean. The Rock Land soils are primarily composed of silts (49.8%) and clays (42.5%).
There are currently engineering controls to prevent the run-on or runoff of surface water from the range and bullet trap. Grass and other vegetation are present on the range floor and side berms to prevent run-on from entering the range. As of 2004, the vegetation within R-6 was watered using a conventional irrigation system to promote vegetation growth (SGRII, 2005). Additionally, there are concrete retaining walls along the interior base of the side berms that run from the firing line to the base of the bullet trap that prevent surface water run-on from the side berms and runoff from the range floor. The bullet trap prevents lead from entering the environment; however, there is no overhead protection to prevent precipitation from falling on the bullet trap. There are two drainage features present at the base of the bullet trap on both sides of the target line that receive any precipitation that falls on the bullet trap or the range floor.
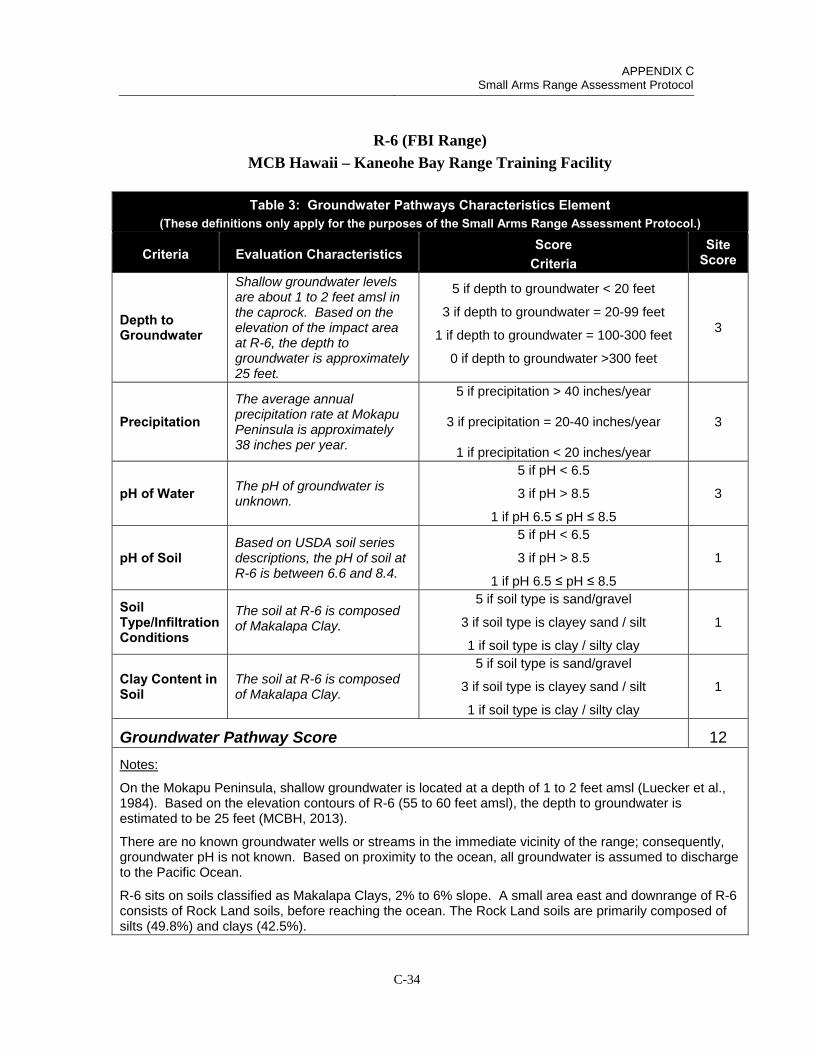
APPENDIX C Small Arms Range Assessment Protocol
C-34
R-6 (FBI Range)
MCB Hawaii – Kaneohe Bay Range Training Facility
Table 3: Groundwater Pathways Characteristics Element (These definitions only apply for the purposes of the Small Arms Range Assessment Protocol.)
Criteria Evaluation Characteristics Score
Criteria Site
Score
Depth to Groundwater
Shallow groundwater levels are about 1 to 2 feet amsl in the caprock. Based on the elevation of the impact area at R-6, the depth to groundwater is approximately 25 feet.
5 if depth to groundwater < 20 feet
3 if depth to groundwater = 20-99 feet
1 if depth to groundwater = 100-300 feet
0 if depth to groundwater >300 feet
3
Precipitation The average annual precipitation rate at Mokapu Peninsula is approximately 38 inches per year.
5 if precipitation > 40 inches/year
3 if precipitation = 20-40 inches/year
1 if precipitation < 20 inches/year
3
pH of Water The pH of groundwater is unknown.
5 if pH < 6.5
3 if pH > 8.5
1 if pH 6.5 ≤ pH ≤ 8.5
3
pH of Soil Based on USDA soil series descriptions, the pH of soil at R-6 is between 6.6 and 8.4.
5 if pH < 6.5
3 if pH > 8.5
1 if pH 6.5 ≤ pH ≤ 8.5
1
Soil Type/Infiltration Conditions
The soil at R-6 is composed of Makalapa Clay.
5 if soil type is sand/gravel
3 if soil type is clayey sand / silt
1 if soil type is clay / silty clay
1
Clay Content in Soil
The soil at R-6 is composed of Makalapa Clay.
5 if soil type is sand/gravel
3 if soil type is clayey sand / silt
1 if soil type is clay / silty clay
1
Groundwater Pathway Score 12
Notes:
On the Mokapu Peninsula, shallow groundwater is located at a depth of 1 to 2 feet amsl (Luecker et al., 1984). Based on the elevation contours of R-6 (55 to 60 feet amsl), the depth to groundwater is estimated to be 25 feet (MCBH, 2013).
There are no known groundwater wells or streams in the immediate vicinity of the range; consequently, groundwater pH is not known. Based on proximity to the ocean, all groundwater is assumed to discharge to the Pacific Ocean.
R-6 sits on soils classified as Makalapa Clays, 2% to 6% slope. A small area east and downrange of R-6 consists of Rock Land soils, before reaching the ocean. The Rock Land soils are primarily composed of silts (49.8%) and clays (42.5%).
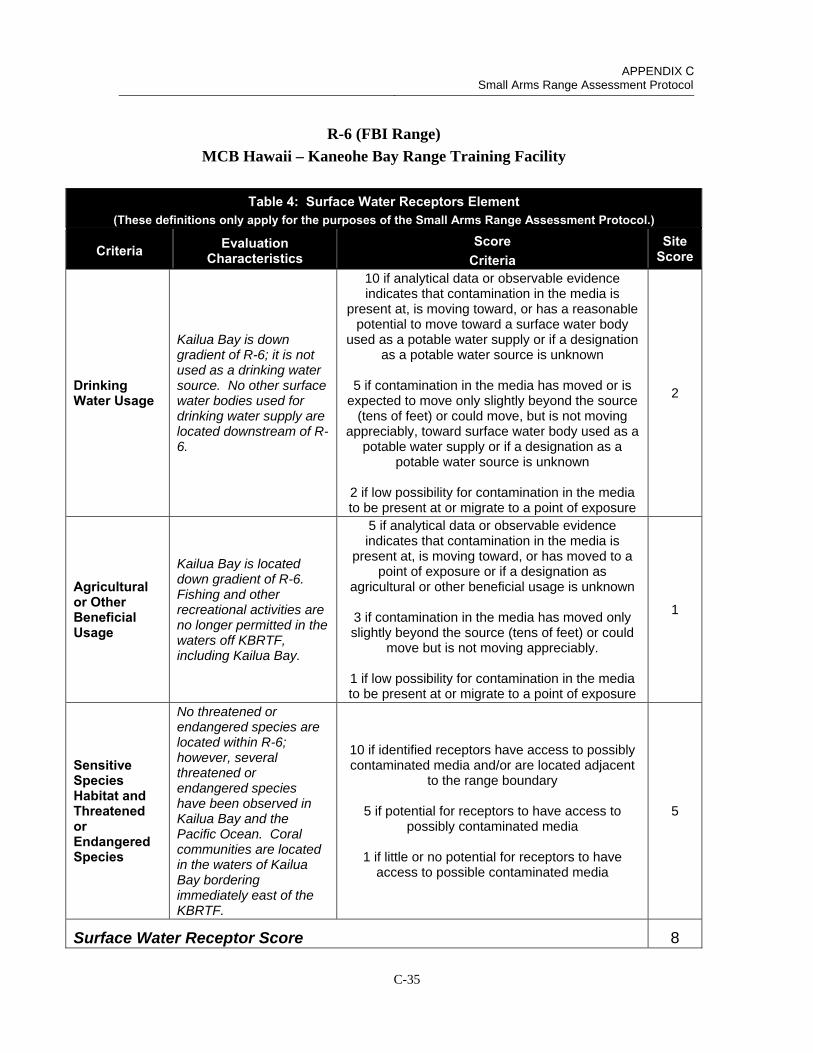
APPENDIX C Small Arms Range Assessment Protocol
C-35
R-6 (FBI Range)
MCB Hawaii – Kaneohe Bay Range Training Facility
Table 4: Surface Water Receptors Element (These definitions only apply for the purposes of the Small Arms Range Assessment Protocol.)
Criteria Evaluation Characteristics
Score Criteria
Site Score
Drinking Water Usage
Kailua Bay is down gradient of R-6; it is not used as a drinking water source. No other surface water bodies used for drinking water supply are located downstream of R-6.
10 if analytical data or observable evidence indicates that contamination in the media is
present at, is moving toward, or has a reasonable potential to move toward a surface water body
used as a potable water supply or if a designation as a potable water source is unknown
5 if contamination in the media has moved or is expected to move only slightly beyond the source
(tens of feet) or could move, but is not moving appreciably, toward surface water body used as a
potable water supply or if a designation as a potable water source is unknown
2 if low possibility for contamination in the media to be present at or migrate to a point of exposure
2
Agricultural or Other Beneficial Usage
Kailua Bay is located down gradient of R-6. Fishing and other recreational activities are no longer permitted in the waters off KBRTF, including Kailua Bay.
5 if analytical data or observable evidence indicates that contamination in the media is
present at, is moving toward, or has moved to a point of exposure or if a designation as
agricultural or other beneficial usage is unknown
3 if contamination in the media has moved only slightly beyond the source (tens of feet) or could
move but is not moving appreciably.
1 if low possibility for contamination in the media to be present at or migrate to a point of exposure
1
Sensitive Species Habitat and Threatened or Endangered Species
No threatened or endangered species are located within R-6; however, several threatened or endangered species have been observed in Kailua Bay and the Pacific Ocean. Coral communities are located in the waters of Kailua Bay bordering immediately east of the KBRTF.
10 if identified receptors have access to possibly contaminated media and/or are located adjacent
to the range boundary
5 if potential for receptors to have access to possibly contaminated media
1 if little or no potential for receptors to have access to possible contaminated media
5
Surface Water Receptor Score 8
APPENDIX C Small Arms Range Assessment Protocol
C-36
Notes:
Coral reefs have been identified downstream of R-6, located in the littoral zone between Flyer’s Monument Point and Ulupau Head. Several species of concern have been observed in the waters around the KBRTF. These species include the threatened green sea turtle, the endangered hawksbill turtle, the endangered Hawaiian monk seal, and the endangered humpback whale. Lead is most likely to be transported to ocean waters during heavy precipitation events; however, the presence of partial engineering controls limits the potential of lead to enter the environment. The dilution of the incoming runoff is expected to result in low concentrations of MC in Kailua Bay. However, MC adhered to sediment may settle on the floor of Kailua Bay, potentially creating an MC exposure to benthic organisms and other species that come into contact with the sediment.
The Ulupau Head WMA is located north of R-6 and was established to help maintain the largest breeding population of red-footed boobies in the Hawaiian Islands (SRGII, 2004). The potential exposure of the red-footed boobies is expected to be limited because there is not a perennial surface water source at the Ulupau Crater. Therefore, the only exposure pathway would be direct contact with lead in the surface soils at R-6, which is unlikely.

APPENDIX C Small Arms Range Assessment Protocol
C-37
R-6 (FBI Range)
MCB Hawaii – Kaneohe Bay Range Training Facility
Table 5: Groundwater Receptors Element (These definitions only apply for the purposes of the Small Arms Range Assessment Protocol.)
Criteria Evaluation Characteristics
Score Criteria
Site Score
Wells Identified as Potable Water Sources
No potable water supply wells were identified in the vicinity of KBRTF.
10 if analytical data or observable evidence or site conditions indicate that MC may be within or moving toward a reasonable radius of influence of a well or
other point of exposure or if a designation as a potable water source is unknown
5 if analytical data or observable evidence or site conditions indicate that MC have moved only slightly
beyond the source (tens of feet) or could move toward a reasonable radius of influence of a well or other point of exposure, but are not moving appreciably
2 if low possibility for MC to be present at or migrate to within a reasonable radius of influence or point of
exposure
2
Wells Identified for Agricultural or Other Beneficial Usage
No wells were identified in the vicinity of KBRTF.
5 if analytical data or observable evidence or site conditions indicate that MC may be within or moving toward a reasonable radius of influence of a well or
other point of exposure or if a designation as agricultural or other beneficial usage is unknown
3 if analytical data or observable evidence or site conditions indicate that MC have moved only slightly
beyond the source (tens of feet) or could move toward a reasonable radius of influence of a well or other point of exposure, but are not moving appreciably
1 if low possibility for MC to be present at or migrate to within a reasonable radius of influence of a well or
point of exposure
1
Sensitive Species Habitat and Threatened and Endangered Species
Vertical soil samples suggest there is limited vertical migration of lead at KBRTF.
5 if identified receptors exposed to potentially MC-impacted water from groundwater or groundwater
sources
3 if potential for receptors exposed to potentially MC-impacted water from groundwater or groundwater
sources
1 if little or no potential for receptors exposed to potentially MC-impacted water from groundwater or
groundwater sources
1
Groundwater Receptor Score 4
APPENDIX C Small Arms Range Assessment Protocol
C-38
Notes:
The groundwater beneath the Ulupau Crater is not used as a drinking water source. The groundwater beneath the Ulupau Crater either has been measured or is assumed to be saline. The Koolau basalt groundwater at Mokapu Peninsula is most likely brackish or saline (Luecker et al., 1984). The groundwater beneath Ulupau Crater in the upper calcareous aquifer is reported to have salinity between 2 and 32 ppt (SRGII, 2004). The closest groundwater wells are located up gradient of the Mokapu Peninsula.
There are no groundwater wells located on the Ulupau Crater; it is assumed that the groundwater is discharged through submarine springs at an unknown distance off shore. Using data from soil samples collected in 1996 by the Naval Facilities Engineers Services Center, it appears that there is limited vertical migration of lead to the subsurface. Soil samples collected at the surface of R-6 ranged from less than 100 to 26,000 mg/kg. Soil samples collected at 12 and 24 inches bgs ranges from 20 to 140 mg/kg. The steep concentration gradient from 1 to 2 feet bgs demonstrates little vertical migration to the subsurface, and it is unlikely that lead has migrated to the groundwater found at depths of approximately 25 feet bgs at R-6.
APPENDIX C Small Arms Range Assessment Protocol
C-39
R-6 (FBI Range) MCB Hawaii – Kaneohe Bay Range Training Facility
Table 6: Evaluation Score (These definitions only apply for the purposes of the Small Arms Range Assessment Protocol.)
Surface Water Element Table Score
Range Use and Range Management (Source) 1 12
Surface Water Pathways 2 5
Surface Water Receptors 4 8
Sum of Surface Water Element Scores 25
Groundwater
Element Table Score
Range Use and Range Management (Source) 1 12
Groundwater Pathways 3 12
Groundwater Receptors 5 4
Sum of Groundwater Element Scores 28
The relative evaluation ranking for each media is determined by selecting the appropriate score based on the data elements for that media:
Evaluation Ranking* Score Range High 50-65 Moderate 30-49 Minimal 0-29
*Use the Evaluation Ranking to determine if further actions are warrantedbased on the guidelines for recommended actions, as defined in Table 7.
Surface Water Evaluation Ranking Minimal
Groundwater Evaluation Ranking Minimal
Notes:
APPENDIX C Small Arms Range Assessment Protocol
C-40
R-9 MARINE CORPS BASE HAWAII KANEOHE BAY RANGE TRAINING FACILITY HONOLULU, HAWAII
Date of SARAP update: 6/11/2013
R-9 is a static small arms live-fire training range for engaging point and multiple targets as well as Marine Corps “table” training (MCB Hawaii, 2010a). There are eight firing lines at 3, 5, 7, 15, 25, 36, 50, and 100 yards with 24 targets. The pneumatic target system is protected by a low SACON® wall. Shooters are authorized to fire at up to three adjacent targets. An earthen backstop berm, originally constructed in 2004 and reconstructed in 2010, is present for bullet containment. Permitted ammunition on R-9 includes shotgun, pistol, and rifle cartridges.
FIVE-YEAR REVIEW ASSESSMENT RESULTS:
The surface water evaluation ranking is moderate. Heavy use of R-9 coupled with no bullet capture technology, no regular maintenance program, and only partial engineering controls in place contributed to the moderate surface water evaluation ranking. Although there are no human receptors, a limited potential pathway to ecological receptors was identified.
The groundwater evaluation ranking is minimal. Similarly to R-6, R-9 site conditions do not contribute significantly to the moderate groundwater evaluation ranking. However, the conditions at this range should be monitored over time, as heavy use of R-9 coupled with the lack of bullet capture technology over the operational lifespan of the range may increase the potential for lead migration to shallow groundwater and discharge to the nearby bay.
APPENDIX C Small Arms Range Assessment Protocol
C-41
R-9 MCB Hawaii – Kaneohe Bay Range Training Facility
Table 1: Range Use and Range Management (Source) Element (These definitions only apply for the purposes of the Small Arms Range Assessment Protocol.)
Criteria Evaluation Characteristics Score Criteria Site Score
Duration of Range Use
R-9 was constructed in the 1950s.
5 if usage > 30 years
3 if usage is 10 to 30 years
1 if usage < 10 years
5
Bullet-Capturing Technology
No current or historical bullet-capturing technology is known or documented.
-3 if range usage duration = bullet capture duration
-1 if range usage duration – bullet capture duration = 10 to 30 years
0 if range usage duration – bullet capture duration > 30 years
0
MC Loading Rates
Current average annual lead loading rate is approximately 2,090 lb/year.
5 if MC loading > 1000 pounds/year
3 if MC loading = 100 to 1000 pounds/year
1 if MC loading < 100 pounds/year
5
Range Maintenance
The impact berm was originally installed in 2004. The impact berm was mined for lead and reconstructed in 2010. An irrigation system was also added for vegetation maintenance.
5 if lead is removed less than every three years
3 if lead is removed more than every three years but less than annually
1 if lead is removed at least annually
3
Source Element Score 13
Notes:
During the REVA baseline assessment, R-9 was used as a multipurpose range to include both small arms training (firing into the on-range containment berm) and mortar firing (into the impact area). Since that time, these activities have been separated into different range designations: R-9 for small arms training and R-9A for mortar firing.
While this range does not have an established maintenance program, the R-9 impact berm was mined for lead in 2010, resulting in the removal of 10,000 pounds of recyclable lead and 10,000 pounds of non-recyclable metals and trash (HIES, 2010). In addition, the berm height was increased, and the soil material added to the berm face is more resistant to erosion compared to the previous soil type. As such, the Range Maintenance score was reduced to 3 to account for these extensive changes to the range.
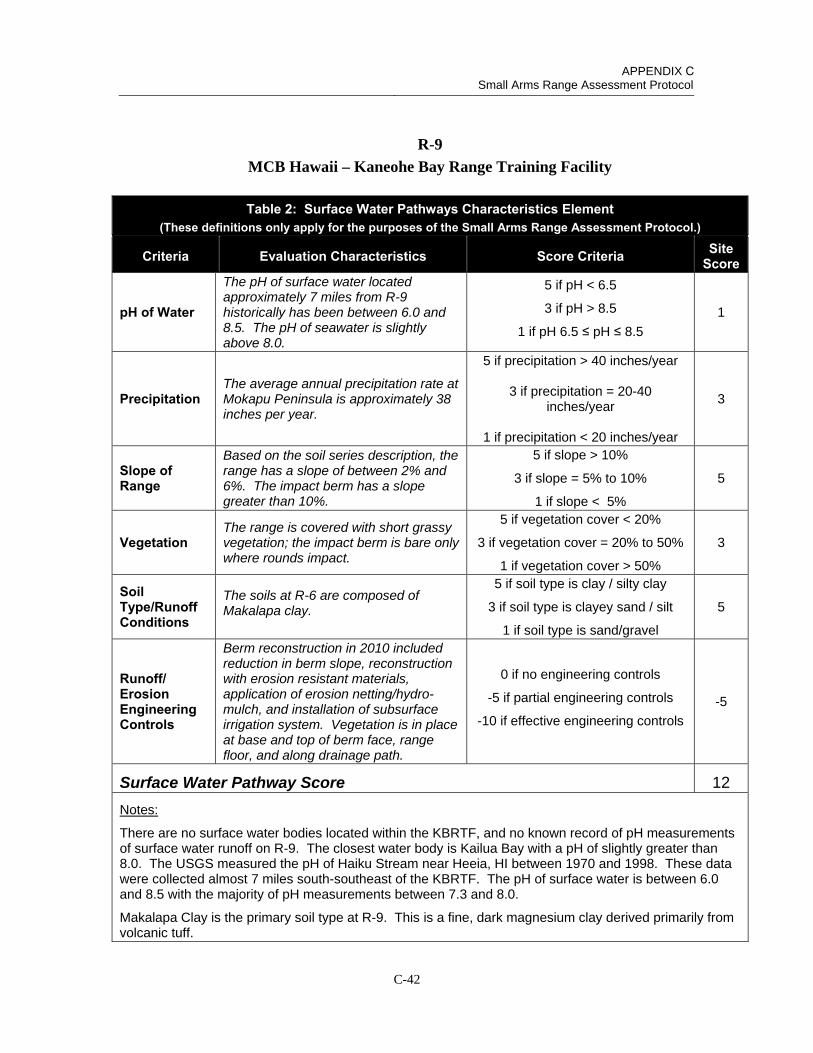
APPENDIX C Small Arms Range Assessment Protocol
C-42
R-9
MCB Hawaii – Kaneohe Bay Range Training Facility
Table 2: Surface Water Pathways Characteristics Element (These definitions only apply for the purposes of the Small Arms Range Assessment Protocol.)
Criteria Evaluation Characteristics Score Criteria Site Score
pH of Water
The pH of surface water located approximately 7 miles from R-9 historically has been between 6.0 and 8.5. The pH of seawater is slightly above 8.0.
5 if pH < 6.5
3 if pH > 8.5
1 if pH 6.5 ≤ pH ≤ 8.5
1
Precipitation The average annual precipitation rate at Mokapu Peninsula is approximately 38 inches per year.
5 if precipitation > 40 inches/year
3 if precipitation = 20-40 inches/year
1 if precipitation < 20 inches/year
3
Slope of Range
Based on the soil series description, the range has a slope of between 2% and 6%. The impact berm has a slope greater than 10%.
5 if slope > 10%
3 if slope = 5% to 10%
1 if slope < 5%
5
Vegetation The range is covered with short grassy vegetation; the impact berm is bare only where rounds impact.
5 if vegetation cover < 20%
3 if vegetation cover = 20% to 50%
1 if vegetation cover > 50%
3
Soil Type/Runoff Conditions
The soils at R-6 are composed of Makalapa clay.
5 if soil type is clay / silty clay
3 if soil type is clayey sand / silt
1 if soil type is sand/gravel
5
Runoff/ Erosion Engineering Controls
Berm reconstruction in 2010 included reduction in berm slope, reconstruction with erosion resistant materials, application of erosion netting/hydro- mulch, and installation of subsurface irrigation system. Vegetation is in place at base and top of berm face, range floor, and along drainage path.
0 if no engineering controls
-5 if partial engineering controls
-10 if effective engineering controls
-5
Surface Water Pathway Score 12
Notes:
There are no surface water bodies located within the KBRTF, and no known record of pH measurements of surface water runoff on R-9. The closest water body is Kailua Bay with a pH of slightly greater than 8.0. The USGS measured the pH of Haiku Stream near Heeia, HI between 1970 and 1998. These data were collected almost 7 miles south-southeast of the KBRTF. The pH of surface water is between 6.0 and 8.5 with the majority of pH measurements between 7.3 and 8.0.
Makalapa Clay is the primary soil type at R-9. This is a fine, dark magnesium clay derived primarily from volcanic tuff.
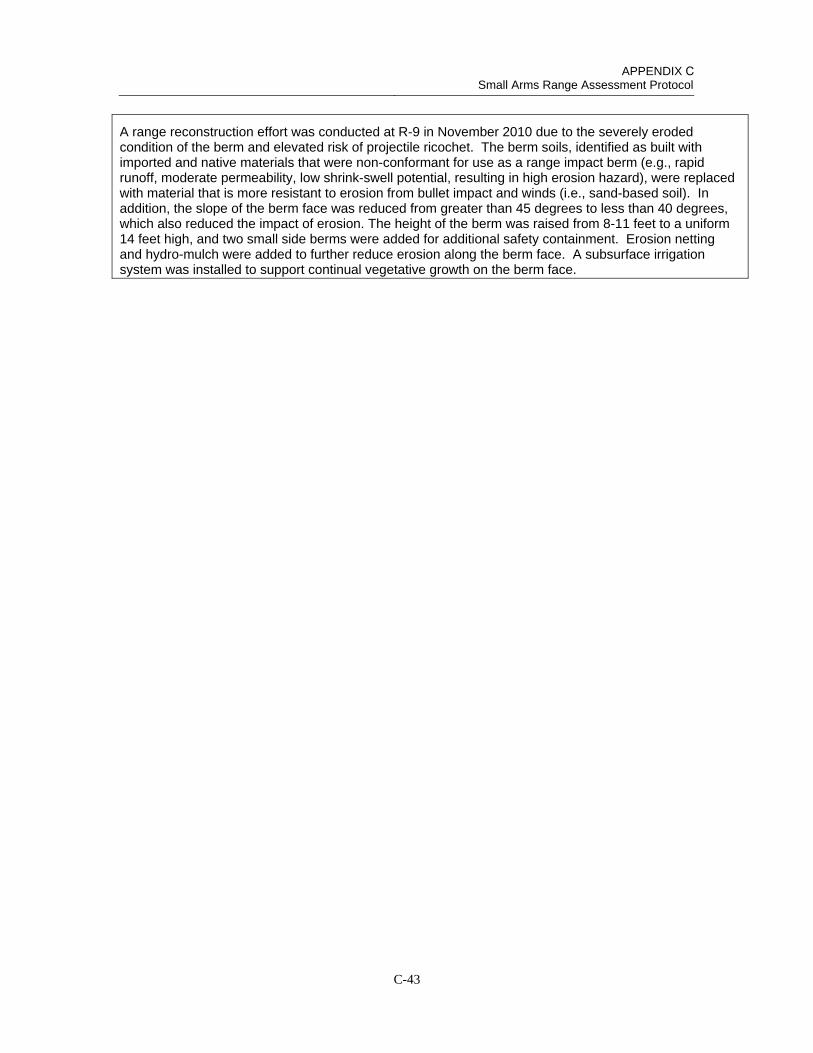
APPENDIX C Small Arms Range Assessment Protocol
C-43
A range reconstruction effort was conducted at R-9 in November 2010 due to the severely eroded condition of the berm and elevated risk of projectile ricochet. The berm soils, identified as built with imported and native materials that were non-conformant for use as a range impact berm (e.g., rapid runoff, moderate permeability, low shrink-swell potential, resulting in high erosion hazard), were replaced with material that is more resistant to erosion from bullet impact and winds (i.e., sand-based soil). In addition, the slope of the berm face was reduced from greater than 45 degrees to less than 40 degrees, which also reduced the impact of erosion. The height of the berm was raised from 8-11 feet to a uniform 14 feet high, and two small side berms were added for additional safety containment. Erosion netting and hydro-mulch were added to further reduce erosion along the berm face. A subsurface irrigation system was installed to support continual vegetative growth on the berm face.

APPENDIX C Small Arms Range Assessment Protocol
C-44
R-9
MCB Hawaii – Kaneohe Bay Range Training Facility
Table 3: Groundwater Pathways Characteristics Element (These definitions only apply for the purposes of the Small Arms Range Assessment Protocol.)
Criteria Evaluation Characteristics Score
Criteria Site
Score
Depth to Groundwater
Shallow groundwater levels are about 1 to 2 feet amsl in the caprock. Based on the elevation at R-9, the depth to groundwater is approximately 25 to 30 feet.
5 if depth to groundwater < 20 feet
3 if depth to groundwater = 20-99 feet
1 if depth to groundwater = 100-300 feet
0 if depth to groundwater >300 feet
3
Precipitation The average annual precipitation rate at Mokapu Peninsula is approximately 38 inches per year.
5 if precipitation > 40 inches/year
3 if precipitation = 20-40 inches/year
1 if precipitation < 20 inches/year
3
pH of Water The pH of groundwater is unknown.
5 if pH < 6.5
3 if pH > 8.5
1 if pH 6.5 ≤ pH ≤ 8.5
3
pH of Soil Based on USDA soil series descriptions, the pH of soil at R-6 is between 6.6 and 8.4.
5 if pH < 6.5
3 if pH > 8.5
1 if pH 6.5 ≤ pH ≤ 8.5
1
Soil Type/Infiltration Conditions
The soil at R-9 is composed of Makalapa Clay.
5 if soil type is sand/gravel
3 if soil type is clayey sand / silt
1 if soil type is clay / silty clay
1
Clay Content in Soil
The soil at R-9 is composed of Makalapa Clay.
5 if soil type is sand/gravel
3 if soil type is clayey sand / silt
1 if soil type is clay / silty clay
1
Groundwater Pathway Score 12
Notes:
There are no known groundwater wells or streams in the immediate vicinity of the range; consequently, groundwater pH values are not know. Based on proximity to the ocean, all groundwater is assumed to discharge to the Pacific Ocean.
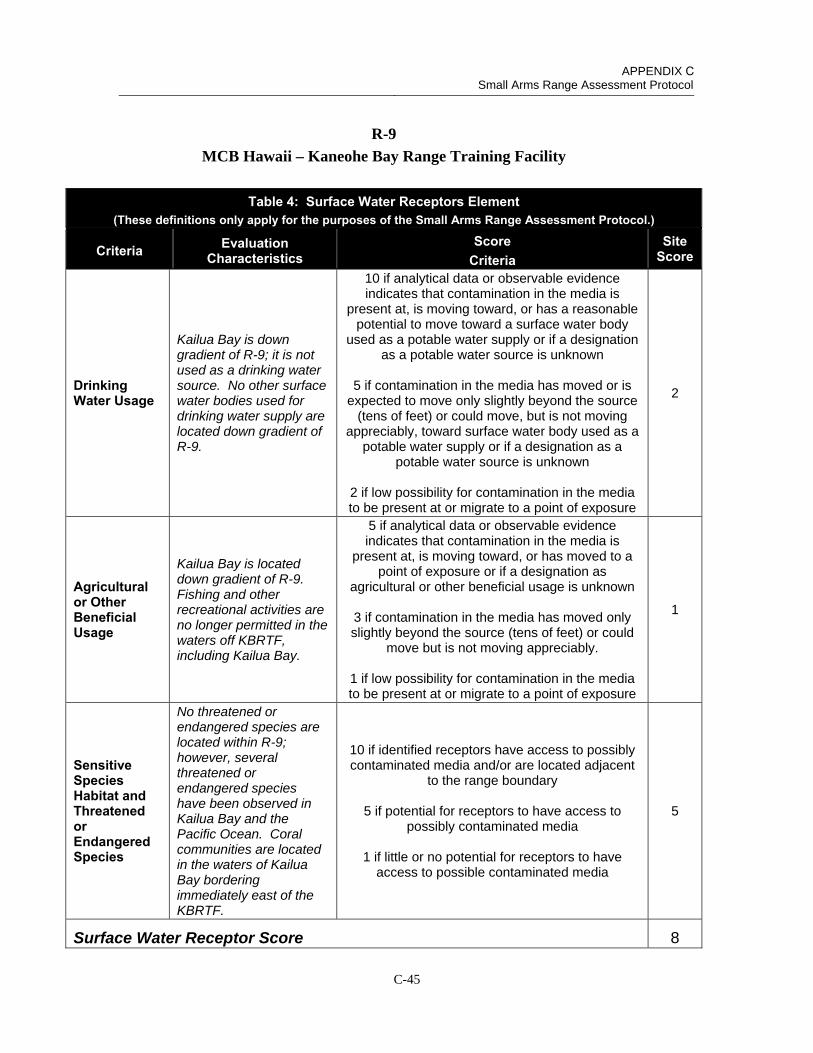
APPENDIX C Small Arms Range Assessment Protocol
C-45
R-9
MCB Hawaii – Kaneohe Bay Range Training Facility
Table 4: Surface Water Receptors Element (These definitions only apply for the purposes of the Small Arms Range Assessment Protocol.)
Criteria Evaluation Characteristics
Score Criteria
Site Score
Drinking Water Usage
Kailua Bay is down gradient of R-9; it is not used as a drinking water source. No other surface water bodies used for drinking water supply are located down gradient of R-9.
10 if analytical data or observable evidence indicates that contamination in the media is
present at, is moving toward, or has a reasonable potential to move toward a surface water body
used as a potable water supply or if a designation as a potable water source is unknown
5 if contamination in the media has moved or is expected to move only slightly beyond the source
(tens of feet) or could move, but is not moving appreciably, toward surface water body used as a
potable water supply or if a designation as a potable water source is unknown
2 if low possibility for contamination in the media to be present at or migrate to a point of exposure
2
Agricultural or Other Beneficial Usage
Kailua Bay is located down gradient of R-9. Fishing and other recreational activities are no longer permitted in the waters off KBRTF, including Kailua Bay.
5 if analytical data or observable evidence indicates that contamination in the media is
present at, is moving toward, or has moved to a point of exposure or if a designation as
agricultural or other beneficial usage is unknown
3 if contamination in the media has moved only slightly beyond the source (tens of feet) or could
move but is not moving appreciably.
1 if low possibility for contamination in the media to be present at or migrate to a point of exposure
1
Sensitive Species Habitat and Threatened or Endangered Species
No threatened or endangered species are located within R-9; however, several threatened or endangered species have been observed in Kailua Bay and the Pacific Ocean. Coral communities are located in the waters of Kailua Bay bordering immediately east of the KBRTF.
10 if identified receptors have access to possibly contaminated media and/or are located adjacent
to the range boundary
5 if potential for receptors to have access to possibly contaminated media
1 if little or no potential for receptors to have access to possible contaminated media
5
Surface Water Receptor Score 8
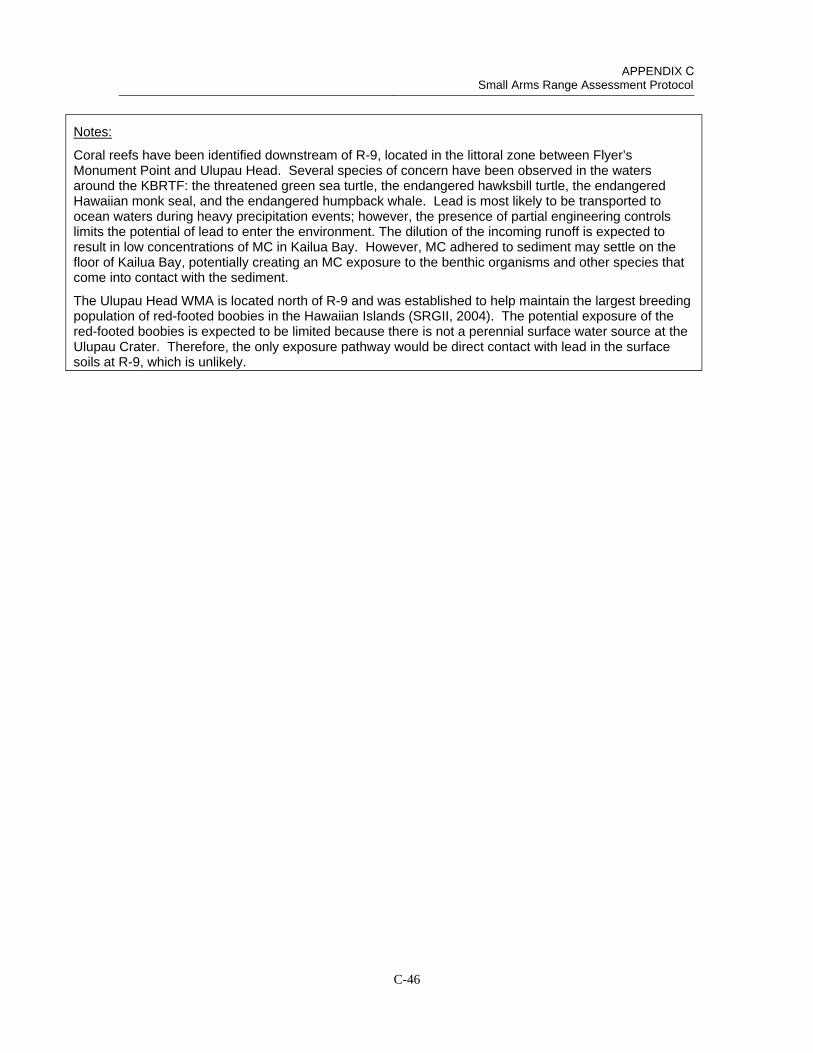
APPENDIX C Small Arms Range Assessment Protocol
C-46
Notes:
Coral reefs have been identified downstream of R-9, located in the littoral zone between Flyer’s Monument Point and Ulupau Head. Several species of concern have been observed in the waters around the KBRTF: the threatened green sea turtle, the endangered hawksbill turtle, the endangered Hawaiian monk seal, and the endangered humpback whale. Lead is most likely to be transported to ocean waters during heavy precipitation events; however, the presence of partial engineering controls limits the potential of lead to enter the environment. The dilution of the incoming runoff is expected to result in low concentrations of MC in Kailua Bay. However, MC adhered to sediment may settle on the floor of Kailua Bay, potentially creating an MC exposure to the benthic organisms and other species that come into contact with the sediment.
The Ulupau Head WMA is located north of R-9 and was established to help maintain the largest breeding population of red-footed boobies in the Hawaiian Islands (SRGII, 2004). The potential exposure of the red-footed boobies is expected to be limited because there is not a perennial surface water source at the Ulupau Crater. Therefore, the only exposure pathway would be direct contact with lead in the surface soils at R-9, which is unlikely.
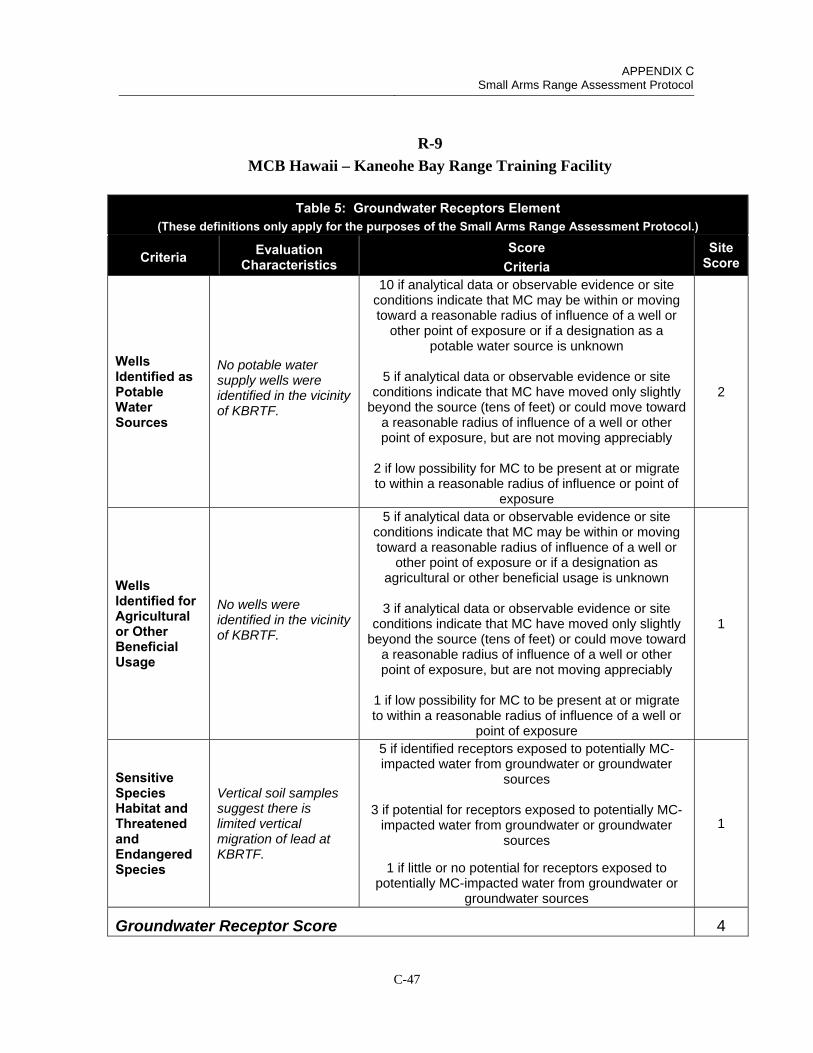
APPENDIX C Small Arms Range Assessment Protocol
C-47
R-9
MCB Hawaii – Kaneohe Bay Range Training Facility
Table 5: Groundwater Receptors Element (These definitions only apply for the purposes of the Small Arms Range Assessment Protocol.)
Criteria Evaluation Characteristics
Score Criteria
Site Score
Wells Identified as Potable Water Sources
No potable water supply wells were identified in the vicinity of KBRTF.
10 if analytical data or observable evidence or site conditions indicate that MC may be within or moving toward a reasonable radius of influence of a well or
other point of exposure or if a designation as a potable water source is unknown
5 if analytical data or observable evidence or site conditions indicate that MC have moved only slightly
beyond the source (tens of feet) or could move toward a reasonable radius of influence of a well or other point of exposure, but are not moving appreciably
2 if low possibility for MC to be present at or migrate to within a reasonable radius of influence or point of
exposure
2
Wells Identified for Agricultural or Other Beneficial Usage
No wells were identified in the vicinity of KBRTF.
5 if analytical data or observable evidence or site conditions indicate that MC may be within or moving toward a reasonable radius of influence of a well or
other point of exposure or if a designation as agricultural or other beneficial usage is unknown
3 if analytical data or observable evidence or site conditions indicate that MC have moved only slightly
beyond the source (tens of feet) or could move toward a reasonable radius of influence of a well or other point of exposure, but are not moving appreciably
1 if low possibility for MC to be present at or migrate to within a reasonable radius of influence of a well or
point of exposure
1
Sensitive Species Habitat and Threatened and Endangered Species
Vertical soil samples suggest there is limited vertical migration of lead at KBRTF.
5 if identified receptors exposed to potentially MC-impacted water from groundwater or groundwater
sources
3 if potential for receptors exposed to potentially MC-impacted water from groundwater or groundwater
sources
1 if little or no potential for receptors exposed to potentially MC-impacted water from groundwater or
groundwater sources
1
Groundwater Receptor Score 4

APPENDIX C Small Arms Range Assessment Protocol
C-48
Notes:
The groundwater beneath the Ulupau Crater is not used as a drinking water source. The groundwater beneath the Ulupau Crater either has been measured or is assumed to be saline. The Koolau basalt groundwater at Mokapu Peninsula is most likely brackish or saline (Luecker et al., 1984). The groundwater beneath Ulupau Crater in the upper calcareous aquifer is reported to have salinity between 2 and 32 ppt (SRGII, 2004). The closest groundwater wells are located up gradient of the Mokapu Peninsula.
There are no groundwater wells located on the Ulupau Crater; it is assumed that the groundwater is discharged through submarine springs at an unknown distance off shore. Using data from soil samples collected in 1996 by the Naval Facilities Engineers Services Center, it appears that there is limited vertical migration of lead to the subsurface. Soil samples collected at the surface of R-6 ranged from less than 100 to 26,000 mg/kg. Soil samples collected at 12 and 24 inches bgs ranges from 20 to 140 mg/kg. The steep concentration gradient from 1 to 2 feet bgs demonstrates little vertical migration to the subsurface, and it is unlikely that lead has migrated to groundwater found at depths of approximately 25 to 30 feet bgs at R-9.

APPENDIX C Small Arms Range Assessment Protocol
C-49
R-9 MCB Hawaii – Kaneohe Bay Range Training Facility
Table 6: Evaluation Score (These definitions only apply for the purposes of the Small Arms Range Assessment Protocol.)
Surface Water Element Table Score
Range Use and Range Management (Source) 1 13
Surface Water Pathways 2 12
Surface Water Receptors 4 8
Sum of Surface Water Element Scores 33
Groundwater
Element Table Score
Range Use and Range Management (Source) 1 13
Groundwater Pathways 3 12
Groundwater Receptors 5 4
Sum of Groundwater Element Scores 29
The relative evaluation ranking for each media is determined by selecting the appropriate score based on the data elements for that media:
Evaluation Ranking* Score Range High 50-65 Moderate 30-49 Minimal 0-29
*Use the Evaluation Ranking to determine if further actions are warrantedbased on the guidelines for recommended actions, as defined in Table 7.
Surface Water Evaluation Ranking Moderate
Groundwater Evaluation Ranking Minimal
Notes:
APPENDIX C Small Arms Range Assessment Protocol
C-50
ALPHA RANGE MARINE CORPS BASE HAWAII PUULOA RANGE TRAINING FACILITY OAHU, HAWAII
Date of SARAP update: 6/11/2013
Alpha Range is a known distance rifle range and is the westernmost of the six ranges at the Puuloa Range Training Facility. The earliest known existence of this range is the early 1920s and it has been operational since 1921 (USACE, 2001). The impact berm at Alpha Range inclines upward from the ground surface where the target carriages are located and then levels out to a flat area approximately 30 feet wide. The berm then inclines again to form the actual impact berm face. An 8-inch thick concrete impact wall with a plywood facade sits atop the berm labeled with the firing line numbers to reduce expenditure distribution across its surface danger zone. The impact berm is shared with Bravo Range which is immediately adjacent to Alpha Range to the east. There are 6 firing lines at 100-, 200-, 300-, 500-, 600-, and 1,000-yards and 40 target positions at this range. The 1,000-yard firing line was installed at Alpha Range since the baseline assessment to increase long range rifle training capabilities at the PRTC. According to O&T personnel, lead mining and berm reconstruction was completed on Alpha Range since the baseline assessment and prior to the installation of the 1,000-yard firing line. This work could not be confirmed through the data collection efforts in that it was not discussed in any of the after action reports received by MCB Hawaii.
FIVE-YEAR REVIEW ASSESSMENT RESULTS:
The surface water evaluation ranking is moderate with a score of 35. Alpha Range is one of the least used SARs at MCB Hawaii, and vegetation is well-established on different parts of the range and berm. The range itself is very flat, though the berm is sloped at approximately a 45-degree angle. Surface water runoff is expected to pool and evaporate, or infiltrate to groundwater and discharge to the ocean.
Surface water is not used as a drinking water source, and though sensitive species may occasionally pass through the ocean water or haul out on the beach, their presence is infrequent and only in passing. Culturally important seagrasses are grown on the neighboring Ewa Beach and Ewa Beach is also used for recreation. Alpha Range is the closest of the Puuloa Ranges to Ewa beach; however, potential MC in surface water is not expected to be at detectable concentrations in this area.
The groundwater evaluation ranking is minimal. The loading on range is high and the shallow water table and sandy soils promote infiltration to groundwater. However, the groundwater is presumed to dilute when discharges to the ocean water. Also, no groundwater receptors were identified.
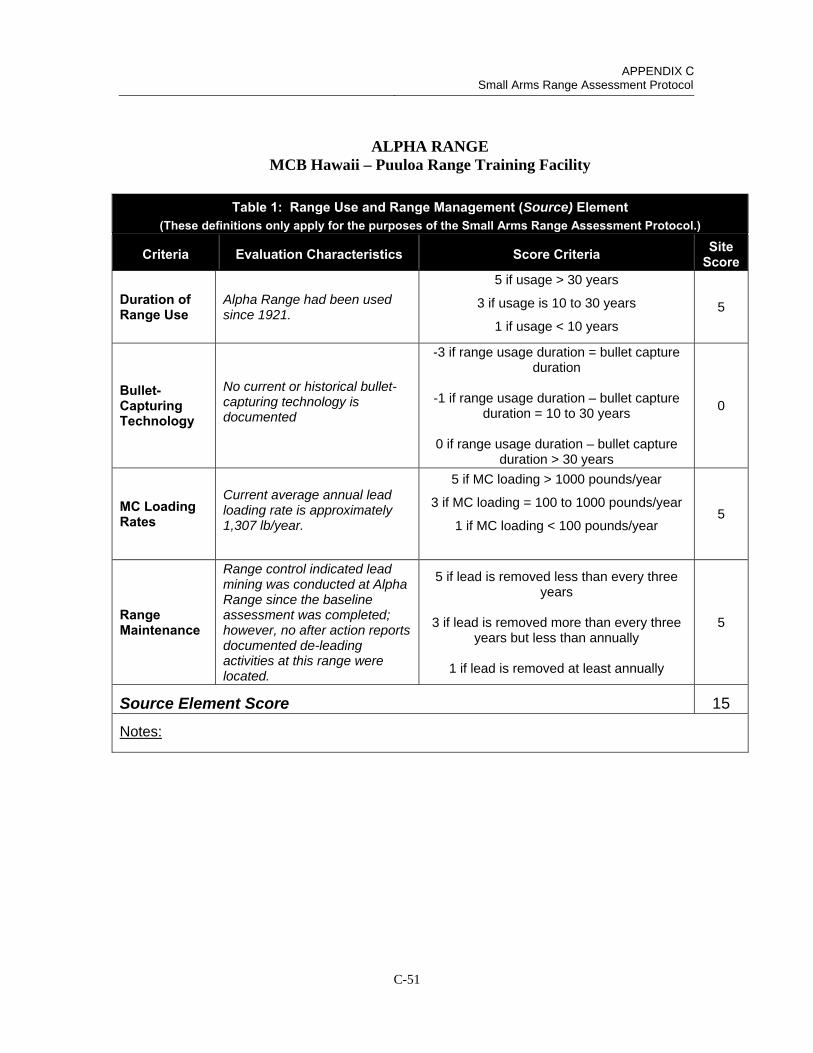
APPENDIX C Small Arms Range Assessment Protocol
C-51
ALPHA RANGE MCB Hawaii – Puuloa Range Training Facility
Table 1: Range Use and Range Management (Source) Element (These definitions only apply for the purposes of the Small Arms Range Assessment Protocol.)
Criteria Evaluation Characteristics Score Criteria Site Score
Duration of Range Use
Alpha Range had been used since 1921.
5 if usage > 30 years
3 if usage is 10 to 30 years
1 if usage < 10 years
5
Bullet-Capturing Technology
No current or historical bullet-capturing technology is documented
-3 if range usage duration = bullet capture duration
-1 if range usage duration – bullet capture duration = 10 to 30 years
0 if range usage duration – bullet capture duration > 30 years
0
MC Loading Rates
Current average annual lead loading rate is approximately 1,307 lb/year.
5 if MC loading > 1000 pounds/year
3 if MC loading = 100 to 1000 pounds/year
1 if MC loading < 100 pounds/year 5
Range Maintenance
Range control indicated lead mining was conducted at Alpha Range since the baseline assessment was completed; however, no after action reports documented de-leading activities at this range were located.
5 if lead is removed less than every three years
3 if lead is removed more than every three years but less than annually
1 if lead is removed at least annually
5
Source Element Score 15
Notes:
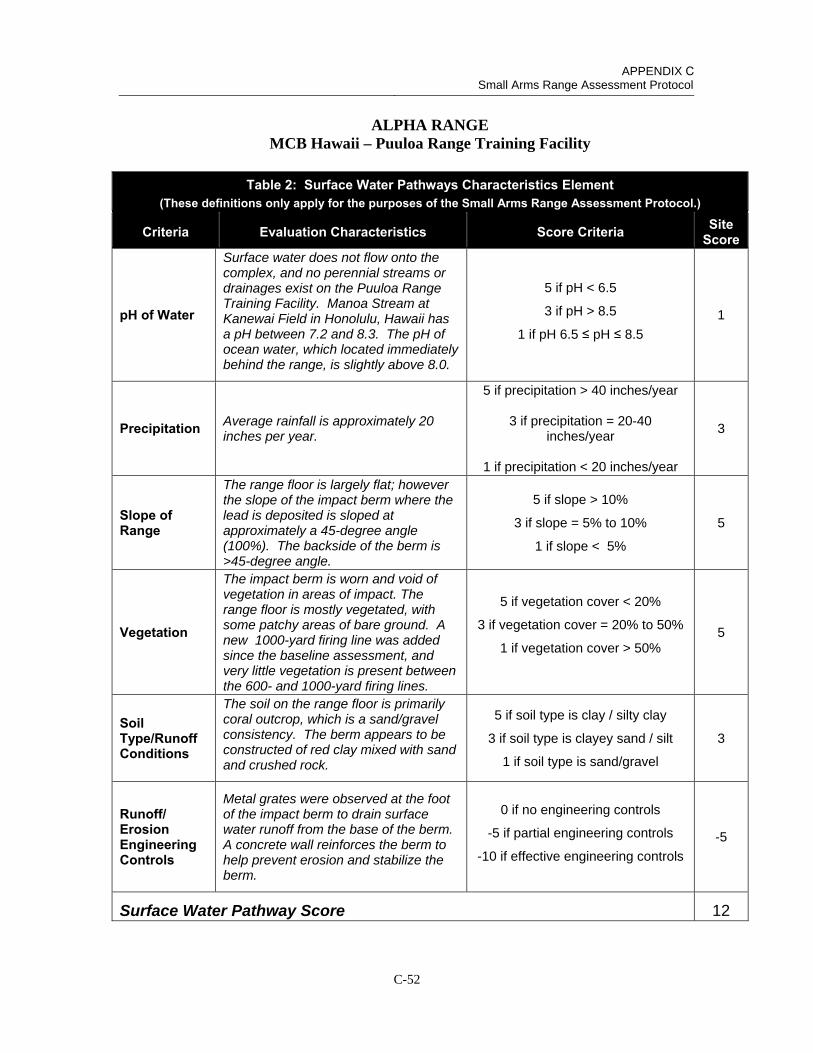
APPENDIX C Small Arms Range Assessment Protocol
C-52
ALPHA RANGE MCB Hawaii – Puuloa Range Training Facility
Table 2: Surface Water Pathways Characteristics Element (These definitions only apply for the purposes of the Small Arms Range Assessment Protocol.)
Criteria Evaluation Characteristics Score Criteria Site Score
pH of Water
Surface water does not flow onto the complex, and no perennial streams or drainages exist on the Puuloa Range Training Facility. Manoa Stream at Kanewai Field in Honolulu, Hawaii has a pH between 7.2 and 8.3. The pH of ocean water, which located immediately behind the range, is slightly above 8.0.
5 if pH < 6.5
3 if pH > 8.5
1 if pH 6.5 ≤ pH ≤ 8.5
1
Precipitation Average rainfall is approximately 20 inches per year.
5 if precipitation > 40 inches/year
3 if precipitation = 20-40 inches/year
1 if precipitation < 20 inches/year
3
Slope of Range
The range floor is largely flat; however the slope of the impact berm where the lead is deposited is sloped at approximately a 45-degree angle (100%). The backside of the berm is >45-degree angle.
5 if slope > 10%
3 if slope = 5% to 10%
1 if slope < 5%
5
Vegetation
The impact berm is worn and void of vegetation in areas of impact. The range floor is mostly vegetated, with some patchy areas of bare ground. A new 1000-yard firing line was added since the baseline assessment, and very little vegetation is present between the 600- and 1000-yard firing lines.
5 if vegetation cover < 20%
3 if vegetation cover = 20% to 50%
1 if vegetation cover > 50% 5
Soil Type/Runoff Conditions
The soil on the range floor is primarily coral outcrop, which is a sand/gravel consistency. The berm appears to be constructed of red clay mixed with sand and crushed rock.
5 if soil type is clay / silty clay
3 if soil type is clayey sand / silt
1 if soil type is sand/gravel
3
Runoff/ Erosion Engineering Controls
Metal grates were observed at the foot of the impact berm to drain surface water runoff from the base of the berm. A concrete wall reinforces the berm to help prevent erosion and stabilize the berm.
0 if no engineering controls
-5 if partial engineering controls
-10 if effective engineering controls
-5
Surface Water Pathway Score 12
APPENDIX C Small Arms Range Assessment Protocol
C-53
ALPHA RANGE MCB Hawaii – Puuloa Range Training Facility
Table 2: Surface Water Pathways Characteristics Element (These definitions only apply for the purposes of the Small Arms Range Assessment Protocol.)
Criteria Evaluation Characteristics Score Criteria Site Score
Notes:
It is appears that one side of the range is used more than the other, as the berm was completely vegetated on the western side and bullet pockets were worn and partially eroded on the eastern side. Vegetation on the backside of the berm and the concrete wall reinforcing the berm helps prevent erosion toward the ocean. The berm was de-leaded in 2011, and maintenance was performed on a sprinkler system, which was installed to help maintain vegetation on the berm. The backside of the berm is well-vegetated. Based on observations during the site visit, it is expected that waves would not reach the backside of the berm except during extreme storm events.
Due to the flat topography, surface water runoff is expected to pool and evaporate, or infiltrate to groundwater and discharge to the ocean.
APPENDIX C Small Arms Range Assessment Protocol
C-54
ALPHA RANGE MCB Hawaii – Puuloa Range Training Facility
Table 3: Groundwater Pathways Characteristics Element (These definitions only apply for the purposes of the Small Arms Range Assessment Protocol.)
Criteria Evaluation Characteristics Score
Criteria Site
Score
Depth to Groundwater
Depth to groundwater is not precisely known but based on topography of the area, it is assumed that groundwater is within 10-15 below ground surface across the range floor.
5 if depth to groundwater < 20 feet
3 if depth to groundwater = 20-99 feet
1 if depth to groundwater = 100-300 feet
0 if depth to groundwater >300 feet
5
Precipitation Average rainfall is approximately 20 inches per year.
5 if precipitation > 40 inches/year
3 if precipitation = 20-40 inches/year
1 if precipitation < 20 inches/year
3
pH of Water
The pH of groundwater is unknown. The range is adjacent to the ocean, and since groundwater is assumed to discharge to ocean water, the pH of the ocean water is the best available data at this time. The pH of ocean water is slightly above 8.0.
5 if pH < 6.5
3 if pH > 8.5
1 if pH 6.5 ≤ pH ≤ 8.5
1
pH of Soil Precise data is not available. pH may range from 6.7 to >9.0.
5 if pH < 6.5
3 if pH > 8.5
1 if pH 6.5 ≤ pH ≤ 8.5
3
Soil Type/Infiltration Conditions
The soil on the range floor is primarily coral outcrop, which is a sand/gravel consistency. The berm material is reddish clay and sand.
5 if soil type is sand/gravel
3 if soil type is clayey sand / silt
1 if soil type is clay / silty clay
3
Clay Content in Soil
The berm where much of the lead is contained is composed primarily of clay and sand.
5 if soil type is sand/gravel
3 if soil type is clayey sand / silt
1 if soil type is clay / silty clay
3
Groundwater Pathway Score 18

APPENDIX C Small Arms Range Assessment Protocol
C-55
ALPHA RANGE MCB Hawaii – Puuloa Range Training Facility
Table 3: Groundwater Pathways Characteristics Element (These definitions only apply for the purposes of the Small Arms Range Assessment Protocol.)
Criteria Evaluation Characteristics Score
Criteria Site
Score
Notes:
The soil map unit for the Puuloa Range Training Facility is CR (coral outcrop), and there is not an available measure pH for this soil type. The area where the Facility is located was identified as being composed of Aridisol soils. These are desert soils typically found in coaster areas on the leeward side of island in areas of low rainfall. These soils are commonly associated with an alkaline pH of >9 (Deenik and McClellan, 2007). Soil at neighboring beaching was identified using a soils map as having a pH range of 6.7 to 7.0. Therefore, the pH at the Puuloa Range Training Facility may range from 6.7 to >9.0 (USDA NRCS, 2013).

APPENDIX C Small Arms Range Assessment Protocol
C-56
ALPHA RANGE MCB Hawaii – Puuloa Range Training Facility
Table 4: Surface Water Receptors Element (These definitions only apply for the purposes of the Small Arms Range Assessment Protocol.)
Criteria Evaluation Characteristics
Score Criteria
Site Score
Drinking Water Usage
Surface water in vicinity of Puuloa Rifle Range Training Facility is not used as a drinking water source.
10 if analytical data or observable evidence indicates that contamination in the media is present at, is
moving toward, or has a reasonable potential to move toward a surface water body used as a potable water supply or if a designation as a potable water source is
unknown
5 if contamination in the media has moved or is expected to move only slightly beyond the source
(tens of feet) or could move, but is not moving appreciably, toward surface water body used as a
potable water supply or if a designation as a potable water source is unknown
2 if low possibility for contamination in the media to be present at or migrate to a point of exposure
2
Agricultural or Other Beneficial Usage
Culturally important seaweeds are grown at the neighboring Ewa Beach just north of the Puuloa Range Training Facility; however, it is not expected that contamination would be present at detectable concentrations where seagrasses are grown and harvested.
5 if analytical data or observable evidence indicates that contamination in the media is present at, is
moving toward, or has moved to a point of exposure or if a designation as agricultural or other beneficial
usage is unknown
3 if contamination in the media has moved only slightly beyond the source (tens of feet) or could move
but is not moving appreciably.
1 if low possibility for contamination in the media to be present at or migrate to a point of exposure
1
Sensitive Species Habitat and Threatened or Endangered Species
Endandgered Hawaiian monk seals and protected turtles inhabit the ocean and infrequently haul out along the shoreline of Puuloa Training Facility.
10 if identified receptors have access to possibly contaminated media and/or are located adjacent to
the range boundary
5 if potential for receptors to have access to possibly contaminated media
1 if little or no potential for receptors to have access to possible contaminated media
5
Surface Water Receptor Score 8
Notes:

APPENDIX C Small Arms Range Assessment Protocol
C-57
ALPHA RANGE MCB Hawaii – Puuloa Range Training Facility
Table 5: Groundwater Receptors Element (These definitions only apply for the purposes of the Small Arms Range Assessment Protocol.)
Criteria Evaluation Characteristics
Score Criteria
Site Score
Wells Identified as Potable Water Sources
No drinking water wells were identified in vicinity of Puuloa Range Trianing Facility. The Puuloa Range Training Facility is located seaward of the Hawaii Underground Injection Control Line, indicating that groundwater in this area is not a drinking water source.
10 if analytical data or observable evidence or site conditions indicate that MC may be within or moving toward a reasonable radius of influence of a well or
other point of exposure or if a designation as a potable water source is unknown
5 if analytical data or observable evidence or site conditions indicate that MC have moved only slightly
beyond the source (tens of feet) or could move toward a reasonable radius of influence of a well or other point
of exposure, but are not moving appreciably
2 if low possibility for MC to be present at or migrate to within a reasonable radius of influence or point of
exposure
2
Wells Identified for Agricultural or Other Beneficial Usage
Inland of the Puuloa Range Training Facility, groundwater is a resource for golf courses, developments, and crop irrigation; however,groundwater beneath the ranges is assumed to discharge to the ocean.
5 if analytical data or observable evidence or site conditions indicate that MC may be within or moving toward a reasonable radius of influence of a well or
other point of exposure or if a designation as agricultural or other beneficial usage is unknown
3 if analytical data or observable evidence or site conditions indicate that MC have moved only slightly
beyond the source (tens of feet) or could move toward a reasonable radius of influence of a well or other point
of exposure, but are not moving appreciably
1 if low possibility for MC to be present at or migrate to within a reasonable radius of influence of a well or
point of exposure
1
Sensitive Species Habitat and Threatened and Endangered Species
No sensitive species were identified in groundwater. Groundwater is assumed to discharge to the ocean.
5 if identified receptors exposed to potentially MC-impacted water from groundwater or groundwater
sources
3 if potential for receptors exposed to potentially MC-impacted water from groundwater or groundwater
sources
1 if little or no potential for receptors exposed to potentially MC-impacted water from groundwater or
groundwater sources
1
Groundwater Receptor Score 4
Notes:
APPENDIX C Small Arms Range Assessment Protocol
C-58
ALPHA RANGE MCB Hawaii – Puuloa Range Training Facility
Table 6: Evaluation Score (These definitions only apply for the purposes of the Small Arms Range Assessment Protocol.)
Surface Water Element Table Score
Range Use and Range Management (Source) 1 15
Surface Water Pathways 2 12
Surface Water Receptors 4 8
Sum of Surface Water Element Scores 35
Groundwater
Element Table Score
Range Use and Range Management (Source) 1 15
Groundwater Pathways 3 18
Groundwater Receptors 5 4
Sum of Groundwater Element Scores 37
The relative evaluation ranking for each media is determined by selecting the appropriate score based on the data elements for that media:
Evaluation Ranking* Score Range High 50-65 Moderate 30-49 Minimal 0-29
*Use the Evaluation Ranking to determine if further actions are warrantedbased on the guidelines for recommended actions, as defined in Table 7.
Surface Water Evaluation Ranking Moderate
Groundwater Evaluation Ranking Minimal*
Notes: The contributing factors to the moderate groundwater score are high lead loading, shallow groundwater table, sandy soil promoting infiltration, and prolonged use of the range with no regular maintenance activities. The score is adjusted to minimal as groundwater discharges and mixes with ocean water. Also, no receptors are identified.
APPENDIX C Small Arms Range Assessment Protocol
C-59
BRAVO RANGE MARINE CORPS BASE HAWAII PUULOA RANGE TRAINING FACILITY OAHU, HAWAII
Date of SARAP update: 6/11/2013
Bravo Range is a known distance rifle range east of Alpha Range. According to munitions loading estimates, it is the second-most used SAR at MCB Hawaii, as it is the main range used for qualifications. Various pistol, shotgun, and rifle cartridges are authorized for use on this range. There are 6 firing lines at 25-, 100-, 200-, 300-, 500-, and 600-yards and 60 target positions. Bravo range was constructed in 1920 and has remained active since 1921 (USACE, 2001). The range uses an impact berm and plywood facade that are continuous with those present on Alpha Range (Section 2.4.1.1). In 2011, the bullet pockets on the Bravo Range impact berm were mined for lead. The pockets were then packed, netted, and hydro-mulched (NAVFACHI, 2011). Complete berm mining and reconstruction could not be done due to the danger of de-stabilizing the bullet deflecting wall on top of the berm.
FIVE-YEAR REVIEW ASSESSMENT RESULTS:
The surface water evaluation ranking is moderate with a score of 31 points. Bravo Range is the second-most used SAR at MCB Hawaii; however, vegetation is well-established and a concrete-reinforced berm helps prevent erosion toward the ocean. The berm was de-leaded in 2011, and maintenance was performed on a sprinkler system, which was installed to help maintain vegetation on the berm.
Surface water is not used as a drinking water source, and though sensitive species may occasionally pass through the ocean water or haul out on the beach, their presence is infrequent and only in passing. Culturally important seagrasses are grown on the neighboring Ewa Beach, but potential MC in surface water is not expected to be at detectable concentrations at the areas where seagrasses are grown and harvested.
The groundwater evaluation ranking is minimal. The shallow water table and sandy soils promote infiltration to groundwater. However, the groundwater is presumed to dilute when discharges to the ocean water. Also, no groundwater receptors were identified.
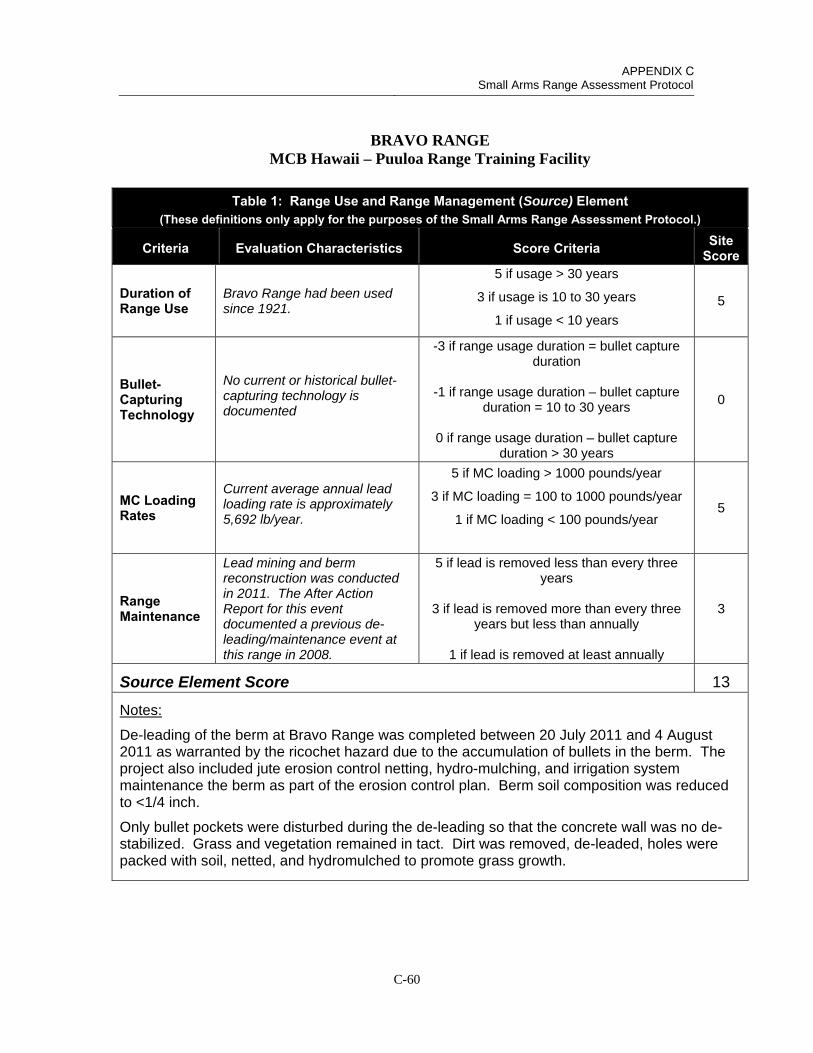
APPENDIX C Small Arms Range Assessment Protocol
C-60
BRAVO RANGE MCB Hawaii – Puuloa Range Training Facility
Table 1: Range Use and Range Management (Source) Element (These definitions only apply for the purposes of the Small Arms Range Assessment Protocol.)
Criteria Evaluation Characteristics Score Criteria Site Score
Duration of Range Use
Bravo Range had been used since 1921.
5 if usage > 30 years
3 if usage is 10 to 30 years
1 if usage < 10 years
5
Bullet-Capturing Technology
No current or historical bullet-capturing technology is documented
-3 if range usage duration = bullet capture duration
-1 if range usage duration – bullet capture duration = 10 to 30 years
0 if range usage duration – bullet capture duration > 30 years
0
MC Loading Rates
Current average annual lead loading rate is approximately 5,692 lb/year.
5 if MC loading > 1000 pounds/year
3 if MC loading = 100 to 1000 pounds/year
1 if MC loading < 100 pounds/year 5
Range Maintenance
Lead mining and berm reconstruction was conducted in 2011. The After Action Report for this event documented a previous de-leading/maintenance event at this range in 2008.
5 if lead is removed less than every three years
3 if lead is removed more than every three years but less than annually
1 if lead is removed at least annually
3
Source Element Score 13
Notes:
De-leading of the berm at Bravo Range was completed between 20 July 2011 and 4 August 2011 as warranted by the ricochet hazard due to the accumulation of bullets in the berm. The project also included jute erosion control netting, hydro-mulching, and irrigation system maintenance the berm as part of the erosion control plan. Berm soil composition was reduced to <1/4 inch.
Only bullet pockets were disturbed during the de-leading so that the concrete wall was no de-stabilized. Grass and vegetation remained in tact. Dirt was removed, de-leaded, holes were packed with soil, netted, and hydromulched to promote grass growth.
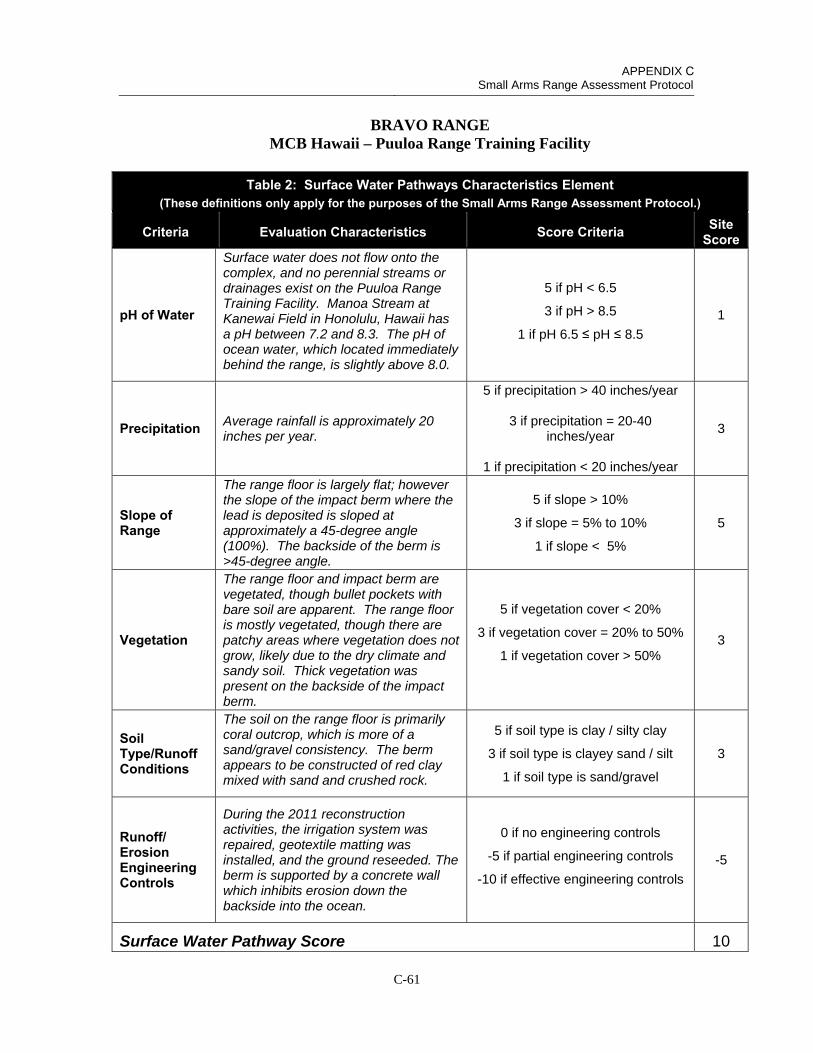
APPENDIX C Small Arms Range Assessment Protocol
C-61
BRAVO RANGE MCB Hawaii – Puuloa Range Training Facility
Table 2: Surface Water Pathways Characteristics Element (These definitions only apply for the purposes of the Small Arms Range Assessment Protocol.)
Criteria Evaluation Characteristics Score Criteria Site Score
pH of Water
Surface water does not flow onto the complex, and no perennial streams or drainages exist on the Puuloa Range Training Facility. Manoa Stream at Kanewai Field in Honolulu, Hawaii has a pH between 7.2 and 8.3. The pH of ocean water, which located immediately behind the range, is slightly above 8.0.
5 if pH < 6.5
3 if pH > 8.5
1 if pH 6.5 ≤ pH ≤ 8.5
1
Precipitation Average rainfall is approximately 20 inches per year.
5 if precipitation > 40 inches/year
3 if precipitation = 20-40 inches/year
1 if precipitation < 20 inches/year
3
Slope of Range
The range floor is largely flat; however the slope of the impact berm where the lead is deposited is sloped at approximately a 45-degree angle (100%). The backside of the berm is >45-degree angle.
5 if slope > 10%
3 if slope = 5% to 10%
1 if slope < 5%
5
Vegetation
The range floor and impact berm are vegetated, though bullet pockets with bare soil are apparent. The range floor is mostly vegetated, though there are patchy areas where vegetation does not grow, likely due to the dry climate and sandy soil. Thick vegetation was present on the backside of the impact berm.
5 if vegetation cover < 20%
3 if vegetation cover = 20% to 50%
1 if vegetation cover > 50% 3
Soil Type/Runoff Conditions
The soil on the range floor is primarily coral outcrop, which is more of a sand/gravel consistency. The berm appears to be constructed of red clay mixed with sand and crushed rock.
5 if soil type is clay / silty clay
3 if soil type is clayey sand / silt
1 if soil type is sand/gravel
3
Runoff/ Erosion Engineering Controls
During the 2011 reconstruction activities, the irrigation system was repaired, geotextile matting was installed, and the ground reseeded. The berm is supported by a concrete wall which inhibits erosion down the backside into the ocean.
0 if no engineering controls
-5 if partial engineering controls
-10 if effective engineering controls
-5
Surface Water Pathway Score 10
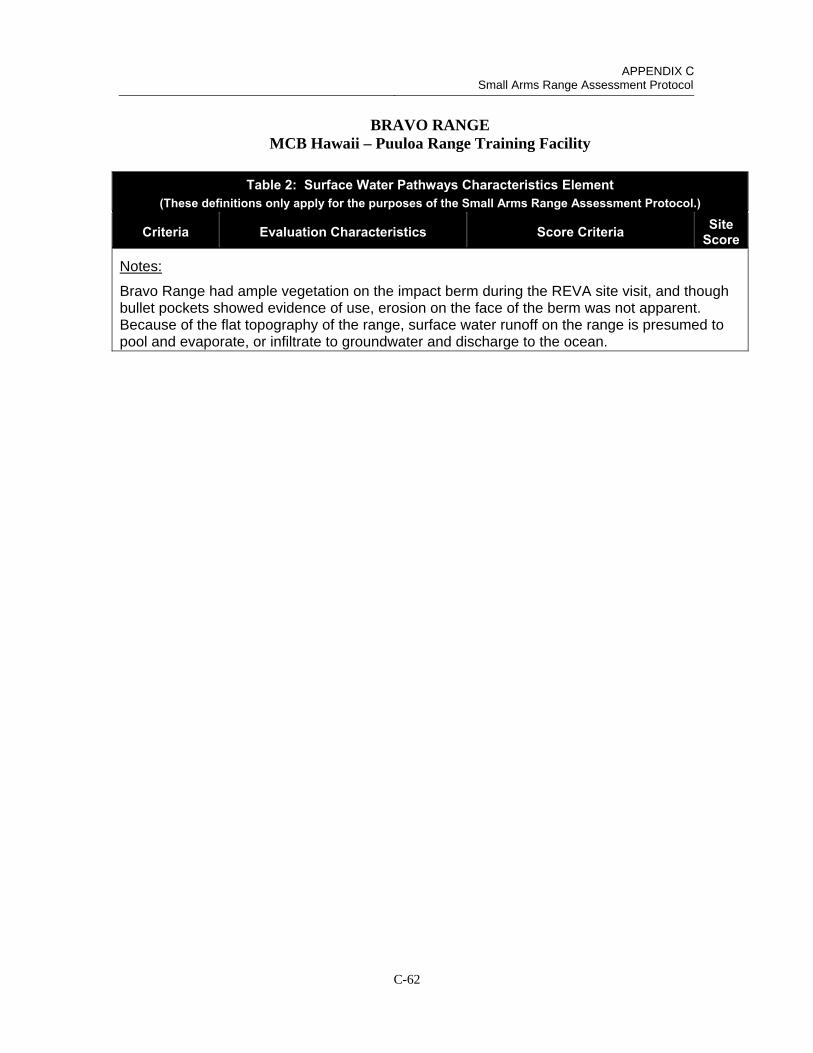
APPENDIX C Small Arms Range Assessment Protocol
C-62
BRAVO RANGE MCB Hawaii – Puuloa Range Training Facility
Table 2: Surface Water Pathways Characteristics Element (These definitions only apply for the purposes of the Small Arms Range Assessment Protocol.)
Criteria Evaluation Characteristics Score Criteria Site Score
Notes:
Bravo Range had ample vegetation on the impact berm during the REVA site visit, and though bullet pockets showed evidence of use, erosion on the face of the berm was not apparent. Because of the flat topography of the range, surface water runoff on the range is presumed to pool and evaporate, or infiltrate to groundwater and discharge to the ocean.
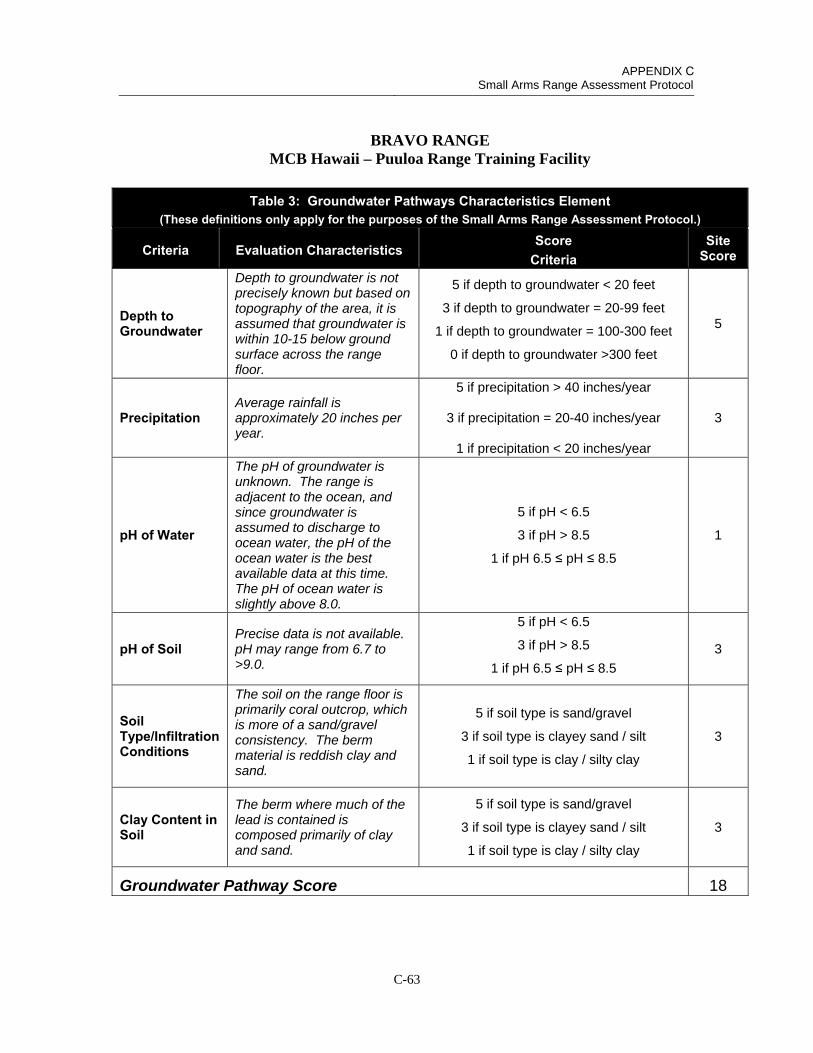
APPENDIX C Small Arms Range Assessment Protocol
C-63
BRAVO RANGE MCB Hawaii – Puuloa Range Training Facility
Table 3: Groundwater Pathways Characteristics Element (These definitions only apply for the purposes of the Small Arms Range Assessment Protocol.)
Criteria Evaluation Characteristics Score
Criteria Site
Score
Depth to Groundwater
Depth to groundwater is not precisely known but based on topography of the area, it is assumed that groundwater is within 10-15 below ground surface across the range floor.
5 if depth to groundwater < 20 feet
3 if depth to groundwater = 20-99 feet
1 if depth to groundwater = 100-300 feet
0 if depth to groundwater >300 feet
5
Precipitation Average rainfall is approximately 20 inches per year.
5 if precipitation > 40 inches/year
3 if precipitation = 20-40 inches/year
1 if precipitation < 20 inches/year
3
pH of Water
The pH of groundwater is unknown. The range is adjacent to the ocean, and since groundwater is assumed to discharge to ocean water, the pH of the ocean water is the best available data at this time. The pH of ocean water is slightly above 8.0.
5 if pH < 6.5
3 if pH > 8.5
1 if pH 6.5 ≤ pH ≤ 8.5
1
pH of Soil Precise data is not available. pH may range from 6.7 to >9.0.
5 if pH < 6.5
3 if pH > 8.5
1 if pH 6.5 ≤ pH ≤ 8.5
3
Soil Type/Infiltration Conditions
The soil on the range floor is primarily coral outcrop, which is more of a sand/gravel consistency. The berm material is reddish clay and sand.
5 if soil type is sand/gravel
3 if soil type is clayey sand / silt
1 if soil type is clay / silty clay
3
Clay Content in Soil
The berm where much of the lead is contained is composed primarily of clay and sand.
5 if soil type is sand/gravel
3 if soil type is clayey sand / silt
1 if soil type is clay / silty clay
3
Groundwater Pathway Score 18

APPENDIX C Small Arms Range Assessment Protocol
C-64
BRAVO RANGE MCB Hawaii – Puuloa Range Training Facility
Table 3: Groundwater Pathways Characteristics Element (These definitions only apply for the purposes of the Small Arms Range Assessment Protocol.)
Criteria Evaluation Characteristics Score
Criteria Site
Score
Notes:
The soil map unit for the Puuloa Range Training Facility is CR (coral outcrop) and there is not an available measure pH for this soil type. The area where the Facility is located was identified as being composed of Aridisol soils. These are desert soils typically found in coaster areas on the leeward side of island in areas of low rainfall. These soils are commonly associated with an alkaline pH of >9 (Deenik and McClellan, 2007). Soil at neighboring beaching was identified using a soils map as having a pH range of 6.7 to 7.0. Therefore, the pH at the Puuloa Range Training Facility may range from 6.7 to >9.0 (USDA NRCS, 2013).

APPENDIX C Small Arms Range Assessment Protocol
C-65
BRAVO RANGE MCB Hawaii – Puuloa Range Training Facility
Table 4: Surface Water Receptors Element (These definitions only apply for the purposes of the Small Arms Range Assessment Protocol.)
Criteria Evaluation Characteristics
Score Criteria
Site Score
Drinking Water Usage
Surface water in vicinity of Puuloa Range Training Facility is not used as a drinking water source.
10 if analytical data or observable evidence indicates that contamination in the media is present at, is
moving toward, or has a reasonable potential to move toward a surface water body used as a potable water supply or if a designation as a potable water source is
unknown
5 if contamination in the media has moved or is expected to move only slightly beyond the source
(tens of feet) or could move, but is not moving appreciably, toward surface water body used as a
potable water supply or if a designation as a potable water source is unknown
2 if low possibility for contamination in the media to be present at or migrate to a point of exposure
2
Agricultural or Other Beneficial Usage
Culturally important seaweeds are grown at the neighboring Ewa Beach just north of the Puuloa Range Training Facility. This beach is also used for recreation; however, it is not expected that contamination would be present at detectable concentrations in this area.
5 if analytical data or observable evidence indicates that contamination in the media is present at, is
moving toward, or has moved to a point of exposure or if a designation as agricultural or other beneficial
usage is unknown
3 if contamination in the media has moved only slightly beyond the source (tens of feet) or could move
but is not moving appreciably.
1 if low possibility for contamination in the media to be present at or migrate to a point of exposure
1
Sensitive Species Habitat and Threatened or Endangered Species
Endandgered Hawaiian monk seals and protected turtles inhabit the ocean and infrequently haul out along the shoreline of Puuloa Training Facility.
10 if identified receptors have access to possibly contaminated media and/or are located adjacent to
the range boundary
5 if potential for receptors to have access to possibly contaminated media
1 if little or no potential for receptors to have access to possible contaminated media
5
Surface Water Receptor Score 8
Notes:

APPENDIX C Small Arms Range Assessment Protocol
C-66
BRAVO RANGE MCB Hawaii – Puuloa Range Training Facility
Table 5: Groundwater Receptors Element (These definitions only apply for the purposes of the Small Arms Range Assessment Protocol.)
Criteria Evaluation Characteristics
Score Criteria
Site Score
Wells Identified as Potable Water Sources
No drinking water wells were identified in vicinity of Puuloa Range Trianing Facility. The Puuloa Range Training Facility is located seaward of the Hawaii Underground Injection Control Line, indicating that groundwater in this area is not a drinking water source.
10 if analytical data or observable evidence or site conditions indicate that MC may be within or moving toward a reasonable radius of influence of a well or
other point of exposure or if a designation as a potable water source is unknown
5 if analytical data or observable evidence or site conditions indicate that MC have moved only slightly
beyond the source (tens of feet) or could move toward a reasonable radius of influence of a well or other point of exposure, but are not moving appreciably
2 if low possibility for MC to be present at or migrate to within a reasonable radius of influence or point of
exposure
2
Wells Identified for Agricultural or Other Beneficial Usage
Inland of the Puuloa Range Training Facility, groundwater is a resource for golf courses, developments, and crop irrigation; however,groundwater beneath the ranges is assumed to discharge to the ocean.
5 if analytical data or observable evidence or site conditions indicate that MC may be within or moving toward a reasonable radius of influence of a well or
other point of exposure or if a designation as agricultural or other beneficial usage is unknown
3 if analytical data or observable evidence or site conditions indicate that MC have moved only slightly
beyond the source (tens of feet) or could move toward a reasonable radius of influence of a well or other point of exposure, but are not moving appreciably
1 if low possibility for MC to be present at or migrate to within a reasonable radius of influence of a well or
point of exposure
1
Sensitive Species Habitat and Threatened and Endangered Species
No sensitive species were identified in groundwater. Groundwater is assumed to discharge to the ocean.
5 if identified receptors exposed to potentially MC-impacted water from groundwater or groundwater
sources
3 if potential for receptors exposed to potentially MC-impacted water from groundwater or groundwater
sources
1 if little or no potential for receptors exposed to potentially MC-impacted water from groundwater or
groundwater sources
1
Groundwater Receptor Score 4
Notes:

APPENDIX C Small Arms Range Assessment Protocol
C-67
BRAVO RANGE MCB Hawaii – Puuloa Range Training Facility
Table 6: Evaluation Score (These definitions only apply for the purposes of the Small Arms Range Assessment Protocol.)
Surface Water Element Table Score
Range Use and Range Management (Source) 1 15
Surface Water Pathways 2 12
Surface Water Receptors 4 8
Sum of Surface Water Element Scores 31
Groundwater
Element Table Score
Range Use and Range Management (Source) 1 15
Groundwater Pathways 3 18
Groundwater Receptors 5 4
Sum of Groundwater Element Scores 35
The relative evaluation ranking for each media is determined by selecting the appropriate score based on the data elements for that media:
Evaluation Ranking* Score Range High 50-65 Moderate 30-49 Minimal 0-29
*Use the Evaluation Ranking to determine if further actions are warrantedbased on the guidelines for recommended actions, as defined in Table 7.
Surface Water Evaluation Ranking Moderate
Groundwater Evaluation Ranking Minimal*
Notes: The combining factors to the moderate groundwater score are shallow groundwater table, sandy soil promoting infiltration and prolonged use of the range with no regular maintenance activities. The score is adjusted to minimal as groundwater discharges and mixes with ocean water. Also, no receptors are identified.
APPENDIX C Small Arms Range Assessment Protocol
C-68
CHARLIE RANGE MARINE CORPS BASE HAWAII PUULOA RANGE TRAINING FACILITY OAHU, HAWAII
Date of SARAP update: 6/11/2013
Charlie Range is a known distance pistol range designed to support individual small arms training and qualification. Original use of the area as a range stems back to the 1930s (USACE, 2001), but Charlie Range was established in 1967. The use of pistol , shotgun, and rifle ammunition is supported at this range (MCBH, 2010a). Five firing lines are marked at 3-, 7-, 15-, 25-, and 50-yards, and there are 25 pneumatic turning target positions.
PRELIMIARY FIVE-YEAR REVIEW ASSESSMENT RESULTS:
The surface water evaluation ranking is moderate with a total score of 36. Factors contributing to a higher score include lead loading and lack of vegetation and erosion controls. Surface water on the range drains toward the ocean, evaporates, or infiltrates through the sandy soil to groundwater where it will discharge to the ocean. Despite past reconstruction of the berm and efforts to slow erosion, loss of soil on the berm is evident.
Surface water is not used as a drinking water source, and although sensitive species are in the area, their presence is rare. Ewa Beach is located to the north and is used for recreation and harvesting of seagrasses, but potential MC in water is not expected to be at detectable concentrations in that area.
The groundwater evaluation ranking is minimal. The shallow water table and sandy soils promote infiltration to groundwater. However, the groundwater is presumed to dilute when discharges to the ocean water. Also, no groundwater receptors were identified.
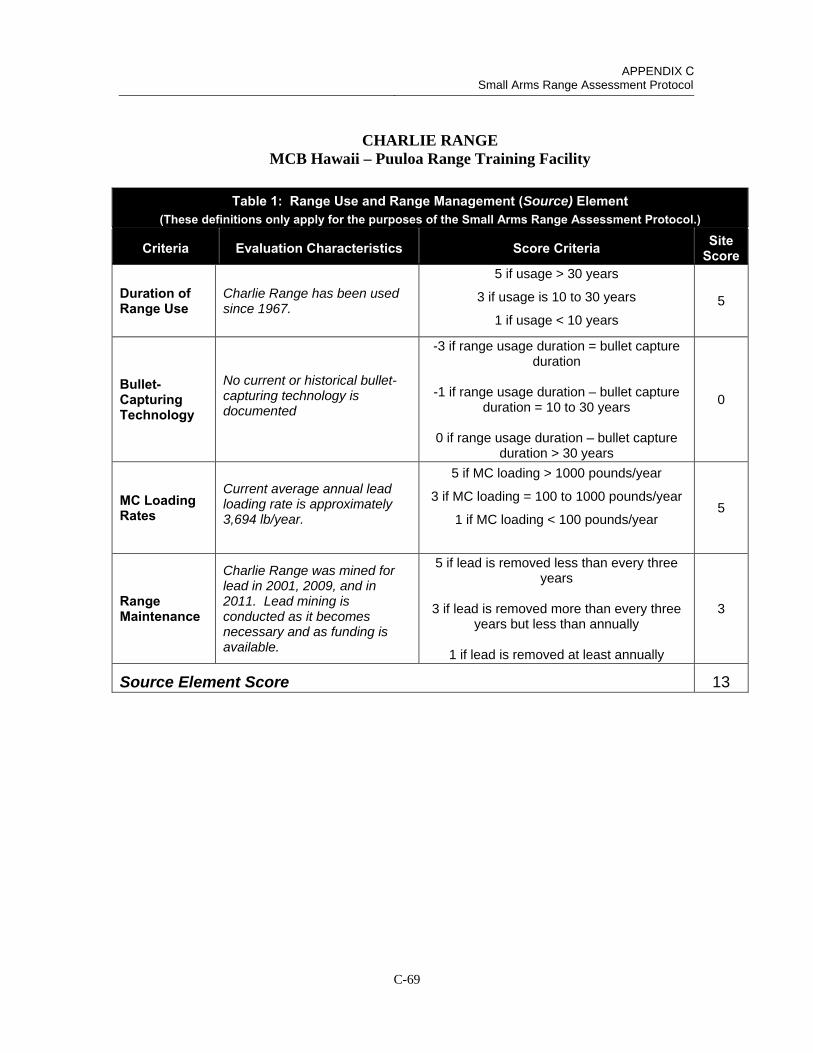
APPENDIX C Small Arms Range Assessment Protocol
C-69
CHARLIE RANGE MCB Hawaii – Puuloa Range Training Facility
Table 1: Range Use and Range Management (Source) Element (These definitions only apply for the purposes of the Small Arms Range Assessment Protocol.)
Criteria Evaluation Characteristics Score Criteria Site Score
Duration of Range Use
Charlie Range has been used since 1967.
5 if usage > 30 years
3 if usage is 10 to 30 years
1 if usage < 10 years
5
Bullet-Capturing Technology
No current or historical bullet-capturing technology is documented
-3 if range usage duration = bullet capture duration
-1 if range usage duration – bullet capture duration = 10 to 30 years
0 if range usage duration – bullet capture duration > 30 years
0
MC Loading Rates
Current average annual lead loading rate is approximately 3,694 lb/year.
5 if MC loading > 1000 pounds/year
3 if MC loading = 100 to 1000 pounds/year
1 if MC loading < 100 pounds/year 5
Range Maintenance
Charlie Range was mined for lead in 2001, 2009, and in 2011. Lead mining is conducted as it becomes necessary and as funding is available.
5 if lead is removed less than every three years
3 if lead is removed more than every three years but less than annually
1 if lead is removed at least annually
3
Source Element Score 13
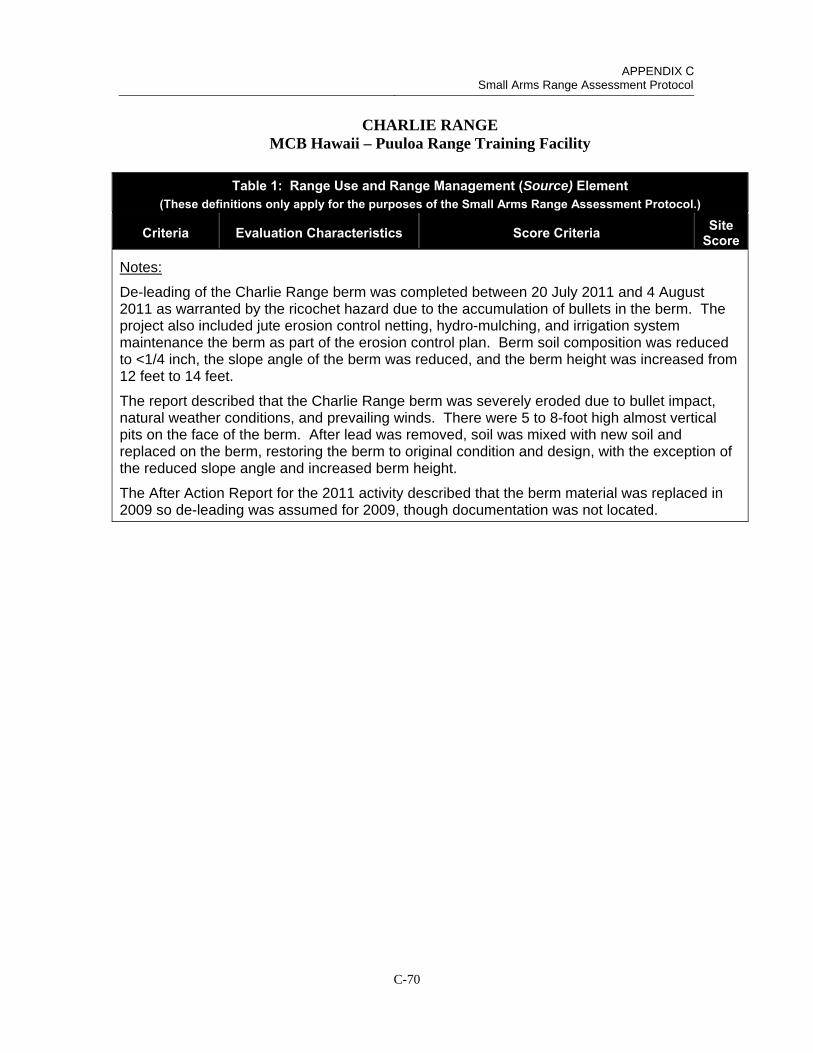
APPENDIX C Small Arms Range Assessment Protocol
C-70
CHARLIE RANGE MCB Hawaii – Puuloa Range Training Facility
Table 1: Range Use and Range Management (Source) Element (These definitions only apply for the purposes of the Small Arms Range Assessment Protocol.)
Criteria Evaluation Characteristics Score Criteria Site Score
Notes:
De-leading of the Charlie Range berm was completed between 20 July 2011 and 4 August 2011 as warranted by the ricochet hazard due to the accumulation of bullets in the berm. The project also included jute erosion control netting, hydro-mulching, and irrigation system maintenance the berm as part of the erosion control plan. Berm soil composition was reduced to <1/4 inch, the slope angle of the berm was reduced, and the berm height was increased from 12 feet to 14 feet.
The report described that the Charlie Range berm was severely eroded due to bullet impact, natural weather conditions, and prevailing winds. There were 5 to 8-foot high almost vertical pits on the face of the berm. After lead was removed, soil was mixed with new soil and replaced on the berm, restoring the berm to original condition and design, with the exception of the reduced slope angle and increased berm height.
The After Action Report for the 2011 activity described that the berm material was replaced in 2009 so de-leading was assumed for 2009, though documentation was not located.
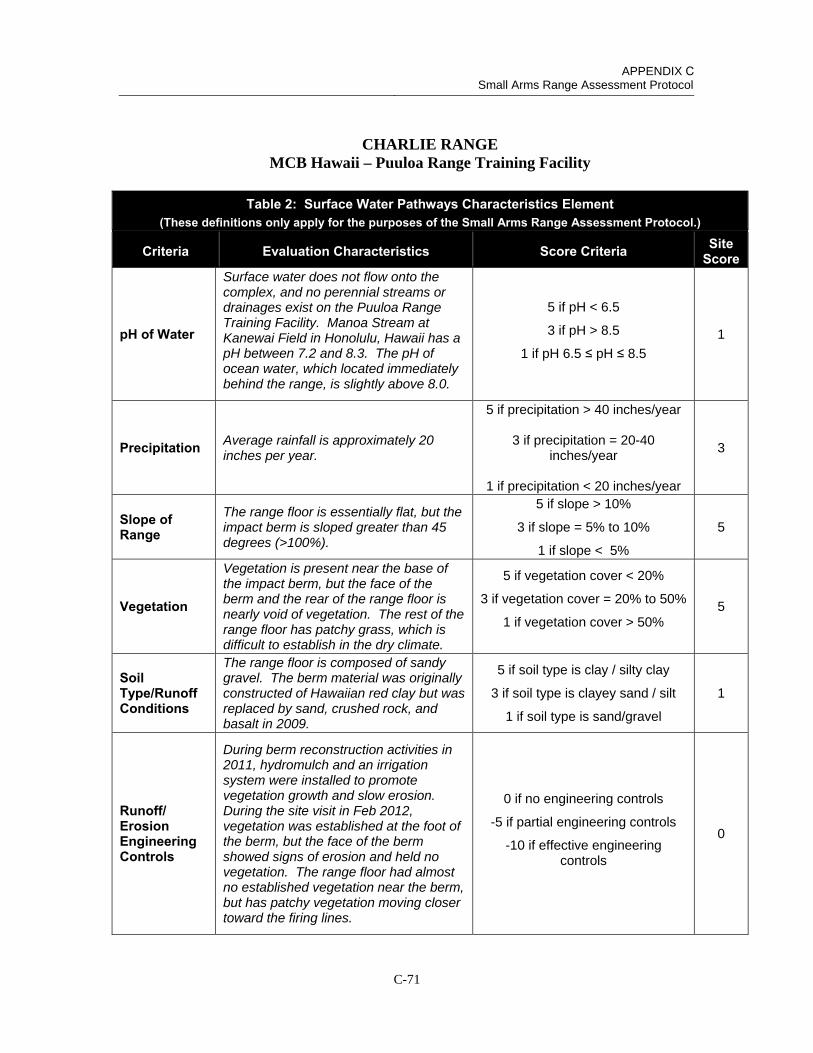
APPENDIX C Small Arms Range Assessment Protocol
C-71
CHARLIE RANGE MCB Hawaii – Puuloa Range Training Facility
Table 2: Surface Water Pathways Characteristics Element (These definitions only apply for the purposes of the Small Arms Range Assessment Protocol.)
Criteria Evaluation Characteristics Score Criteria Site Score
pH of Water
Surface water does not flow onto the complex, and no perennial streams or drainages exist on the Puuloa Range Training Facility. Manoa Stream at Kanewai Field in Honolulu, Hawaii has a pH between 7.2 and 8.3. The pH of ocean water, which located immediately behind the range, is slightly above 8.0.
5 if pH < 6.5
3 if pH > 8.5
1 if pH 6.5 ≤ pH ≤ 8.5
1
Precipitation Average rainfall is approximately 20 inches per year.
5 if precipitation > 40 inches/year
3 if precipitation = 20-40 inches/year
1 if precipitation < 20 inches/year
3
Slope of Range
The range floor is essentially flat, but the impact berm is sloped greater than 45 degrees (>100%).
5 if slope > 10%
3 if slope = 5% to 10%
1 if slope < 5%
5
Vegetation
Vegetation is present near the base of the impact berm, but the face of the berm and the rear of the range floor is nearly void of vegetation. The rest of the range floor has patchy grass, which is difficult to establish in the dry climate.
5 if vegetation cover < 20%
3 if vegetation cover = 20% to 50%
1 if vegetation cover > 50% 5
Soil Type/Runoff Conditions
The range floor is composed of sandy gravel. The berm material was originally constructed of Hawaiian red clay but was replaced by sand, crushed rock, and basalt in 2009.
5 if soil type is clay / silty clay
3 if soil type is clayey sand / silt
1 if soil type is sand/gravel
1
Runoff/ Erosion Engineering Controls
During berm reconstruction activities in 2011, hydromulch and an irrigation system were installed to promote vegetation growth and slow erosion. During the site visit in Feb 2012, vegetation was established at the foot of the berm, but the face of the berm showed signs of erosion and held no vegetation. The range floor had almost no established vegetation near the berm, but has patchy vegetation moving closer toward the firing lines.
0 if no engineering controls
-5 if partial engineering controls
-10 if effective engineering controls
0
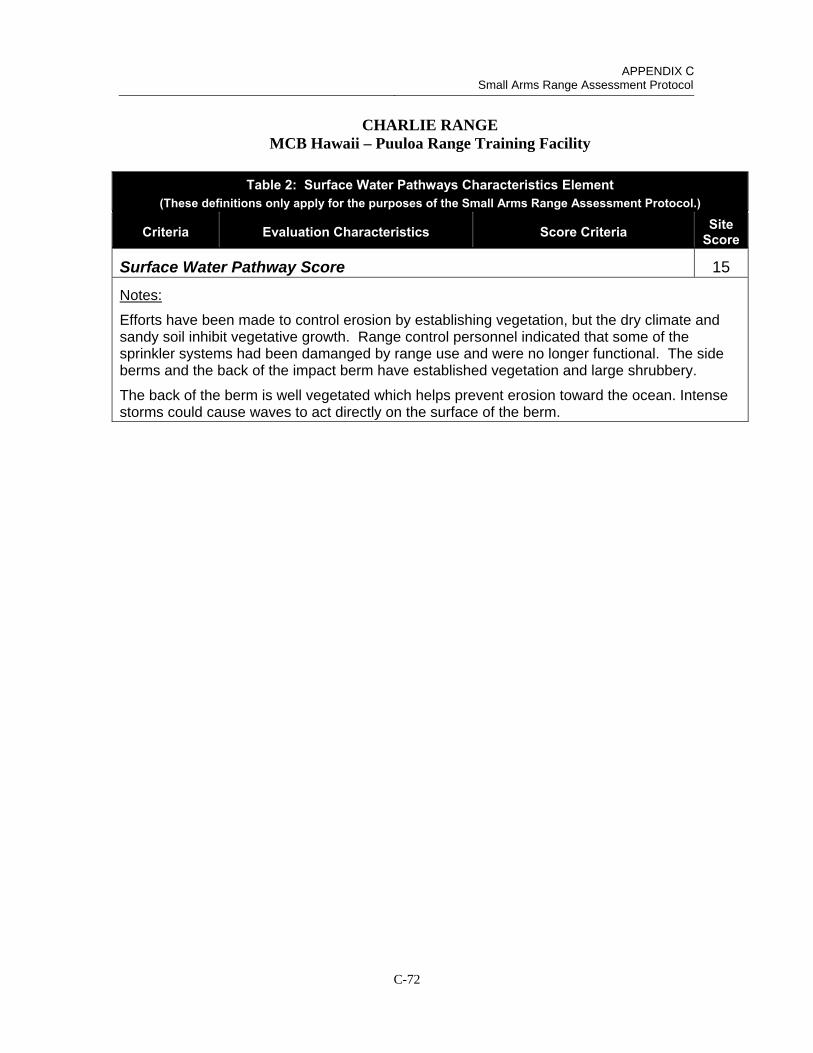
APPENDIX C Small Arms Range Assessment Protocol
C-72
CHARLIE RANGE MCB Hawaii – Puuloa Range Training Facility
Table 2: Surface Water Pathways Characteristics Element (These definitions only apply for the purposes of the Small Arms Range Assessment Protocol.)
Criteria Evaluation Characteristics Score Criteria Site Score
Surface Water Pathway Score 15
Notes:
Efforts have been made to control erosion by establishing vegetation, but the dry climate and sandy soil inhibit vegetative growth. Range control personnel indicated that some of the sprinkler systems had been damanged by range use and were no longer functional. The side berms and the back of the impact berm have established vegetation and large shrubbery.
The back of the berm is well vegetated which helps prevent erosion toward the ocean. Intense storms could cause waves to act directly on the surface of the berm.
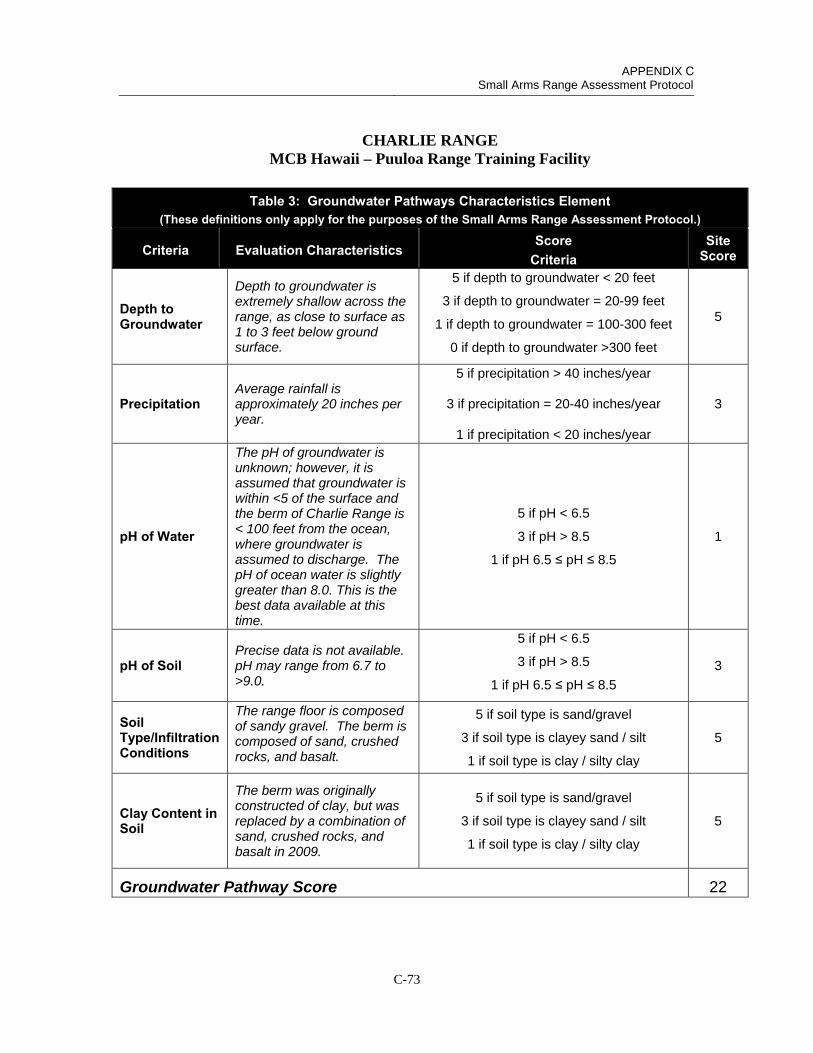
APPENDIX C Small Arms Range Assessment Protocol
C-73
CHARLIE RANGE MCB Hawaii – Puuloa Range Training Facility
Table 3: Groundwater Pathways Characteristics Element (These definitions only apply for the purposes of the Small Arms Range Assessment Protocol.)
Criteria Evaluation Characteristics Score
Criteria Site
Score
Depth to Groundwater
Depth to groundwater is extremely shallow across the range, as close to surface as 1 to 3 feet below ground surface.
5 if depth to groundwater < 20 feet
3 if depth to groundwater = 20-99 feet
1 if depth to groundwater = 100-300 feet
0 if depth to groundwater >300 feet
5
Precipitation Average rainfall is approximately 20 inches per year.
5 if precipitation > 40 inches/year
3 if precipitation = 20-40 inches/year
1 if precipitation < 20 inches/year
3
pH of Water
The pH of groundwater is unknown; however, it is assumed that groundwater is within <5 of the surface and the berm of Charlie Range is < 100 feet from the ocean, where groundwater is assumed to discharge. The pH of ocean water is slightly greater than 8.0. This is the best data available at this time.
5 if pH < 6.5
3 if pH > 8.5
1 if pH 6.5 ≤ pH ≤ 8.5
1
pH of Soil Precise data is not available. pH may range from 6.7 to >9.0.
5 if pH < 6.5
3 if pH > 8.5
1 if pH 6.5 ≤ pH ≤ 8.5
3
Soil Type/Infiltration Conditions
The range floor is composed of sandy gravel. The berm is composed of sand, crushed rocks, and basalt.
5 if soil type is sand/gravel
3 if soil type is clayey sand / silt
1 if soil type is clay / silty clay
5
Clay Content in Soil
The berm was originally constructed of clay, but was replaced by a combination of sand, crushed rocks, and basalt in 2009.
5 if soil type is sand/gravel
3 if soil type is clayey sand / silt
1 if soil type is clay / silty clay
5
Groundwater Pathway Score 22

APPENDIX C Small Arms Range Assessment Protocol
C-74
CHARLIE RANGE MCB Hawaii – Puuloa Range Training Facility
Table 3: Groundwater Pathways Characteristics Element (These definitions only apply for the purposes of the Small Arms Range Assessment Protocol.)
Criteria Evaluation Characteristics Score
Criteria Site
Score
Notes:
The soil map unit for the Puuloa Range Training Facility is CR (coral outcrop) and there is not an available measure pH for this soil type. The area where the Facility is located was identified as being composed of Aridisol soils. These are desert soils typically found in coaster areas on the leeward side of island in areas of low rainfall. These soils are commonly associated with an alkaline pH of >9 (Deenik and McClellan, 2007). Soil at neighboring beaching was identified using a soils map as having a pH range of 6.7 to 7.0. Therefore, the pH at the Puuloa Range Training Facility may range from 6.7 to >9.0 (USDA NRCS, 2013).
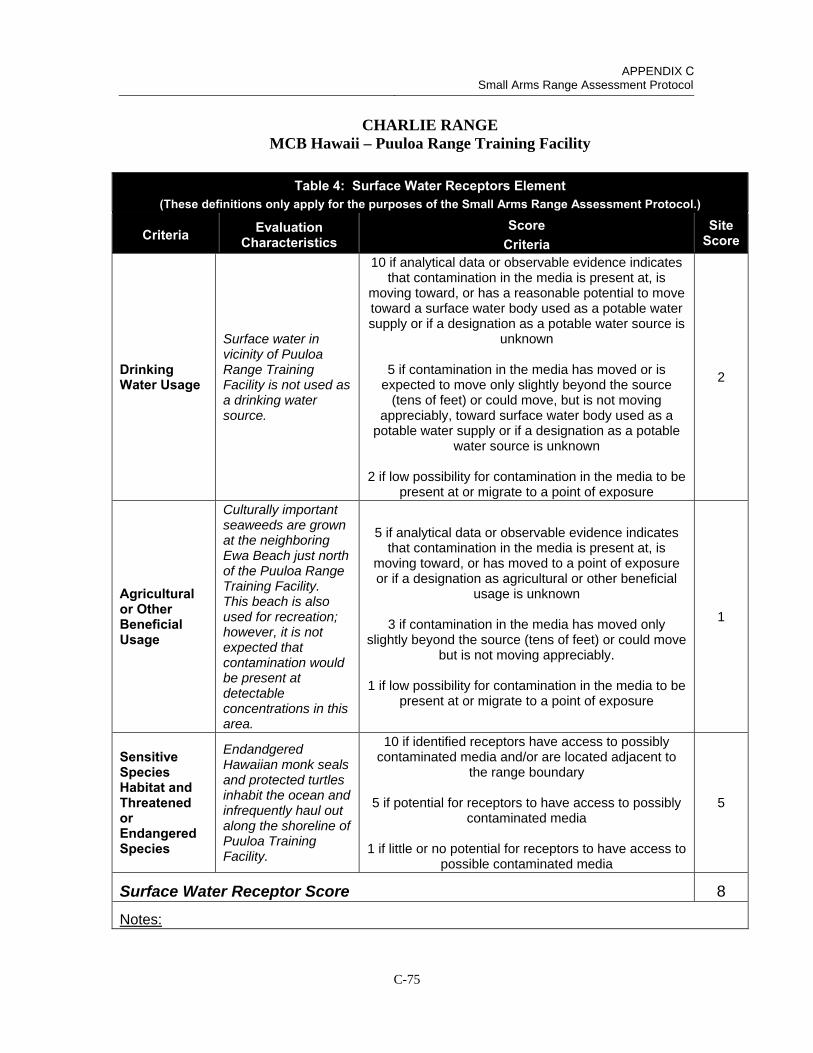
APPENDIX C Small Arms Range Assessment Protocol
C-75
CHARLIE RANGE MCB Hawaii – Puuloa Range Training Facility
Table 4: Surface Water Receptors Element (These definitions only apply for the purposes of the Small Arms Range Assessment Protocol.)
Criteria Evaluation Characteristics
Score Criteria
Site Score
Drinking Water Usage
Surface water in vicinity of Puuloa Range Training Facility is not used as a drinking water source.
10 if analytical data or observable evidence indicates that contamination in the media is present at, is
moving toward, or has a reasonable potential to move toward a surface water body used as a potable water supply or if a designation as a potable water source is
unknown
5 if contamination in the media has moved or is expected to move only slightly beyond the source
(tens of feet) or could move, but is not moving appreciably, toward surface water body used as a
potable water supply or if a designation as a potable water source is unknown
2 if low possibility for contamination in the media to be present at or migrate to a point of exposure
2
Agricultural or Other Beneficial Usage
Culturally important seaweeds are grown at the neighboring Ewa Beach just north of the Puuloa Range Training Facility. This beach is also used for recreation; however, it is not expected that contamination would be present at detectable concentrations in this area.
5 if analytical data or observable evidence indicates that contamination in the media is present at, is
moving toward, or has moved to a point of exposure or if a designation as agricultural or other beneficial
usage is unknown
3 if contamination in the media has moved only slightly beyond the source (tens of feet) or could move
but is not moving appreciably.
1 if low possibility for contamination in the media to be present at or migrate to a point of exposure
1
Sensitive Species Habitat and Threatened or Endangered Species
Endandgered Hawaiian monk seals and protected turtles inhabit the ocean and infrequently haul out along the shoreline of Puuloa Training Facility.
10 if identified receptors have access to possibly contaminated media and/or are located adjacent to
the range boundary
5 if potential for receptors to have access to possibly contaminated media
1 if little or no potential for receptors to have access to possible contaminated media
5
Surface Water Receptor Score 8
Notes:
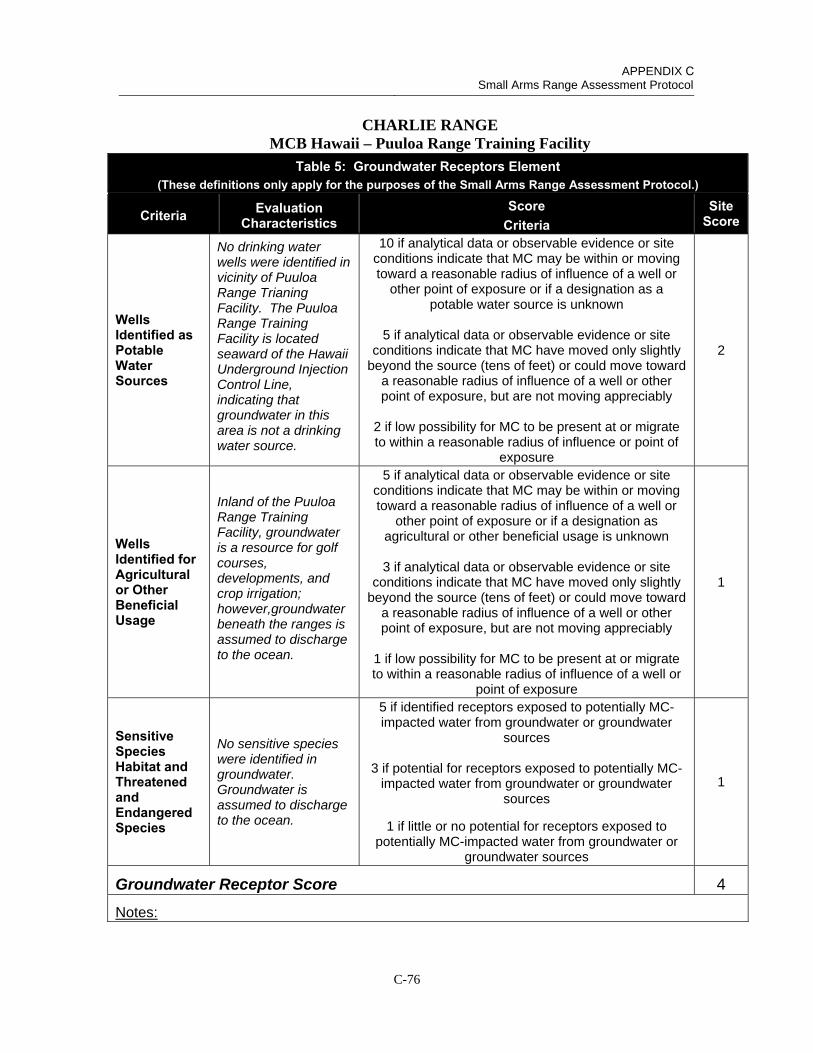
APPENDIX C Small Arms Range Assessment Protocol
C-76
CHARLIE RANGE MCB Hawaii – Puuloa Range Training Facility
Table 5: Groundwater Receptors Element (These definitions only apply for the purposes of the Small Arms Range Assessment Protocol.)
Criteria Evaluation Characteristics
Score Criteria
Site Score
Wells Identified as Potable Water Sources
No drinking water wells were identified in vicinity of Puuloa Range Trianing Facility. The Puuloa Range Training Facility is located seaward of the Hawaii Underground Injection Control Line, indicating that groundwater in this area is not a drinking water source.
10 if analytical data or observable evidence or site conditions indicate that MC may be within or moving toward a reasonable radius of influence of a well or
other point of exposure or if a designation as a potable water source is unknown
5 if analytical data or observable evidence or site conditions indicate that MC have moved only slightly
beyond the source (tens of feet) or could move toward a reasonable radius of influence of a well or other point of exposure, but are not moving appreciably
2 if low possibility for MC to be present at or migrate to within a reasonable radius of influence or point of
exposure
2
Wells Identified for Agricultural or Other Beneficial Usage
Inland of the Puuloa Range Training Facility, groundwater is a resource for golf courses, developments, and crop irrigation; however,groundwater beneath the ranges is assumed to discharge to the ocean.
5 if analytical data or observable evidence or site conditions indicate that MC may be within or moving toward a reasonable radius of influence of a well or
other point of exposure or if a designation as agricultural or other beneficial usage is unknown
3 if analytical data or observable evidence or site conditions indicate that MC have moved only slightly
beyond the source (tens of feet) or could move toward a reasonable radius of influence of a well or other point of exposure, but are not moving appreciably
1 if low possibility for MC to be present at or migrate to within a reasonable radius of influence of a well or
point of exposure
1
Sensitive Species Habitat and Threatened and Endangered Species
No sensitive species were identified in groundwater. Groundwater is assumed to discharge to the ocean.
5 if identified receptors exposed to potentially MC-impacted water from groundwater or groundwater
sources
3 if potential for receptors exposed to potentially MC-impacted water from groundwater or groundwater
sources
1 if little or no potential for receptors exposed to potentially MC-impacted water from groundwater or
groundwater sources
1
Groundwater Receptor Score 4
Notes:
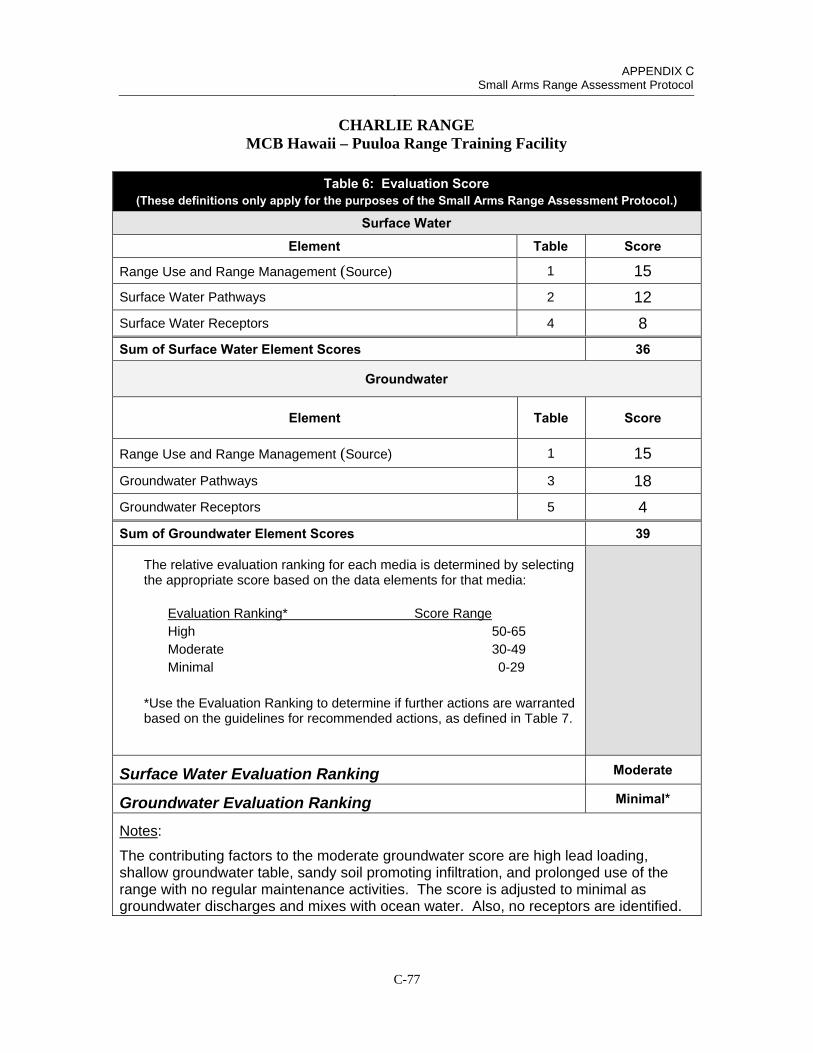
APPENDIX C Small Arms Range Assessment Protocol
C-77
CHARLIE RANGE MCB Hawaii – Puuloa Range Training Facility
Table 6: Evaluation Score (These definitions only apply for the purposes of the Small Arms Range Assessment Protocol.)
Surface Water Element Table Score
Range Use and Range Management (Source) 1 15
Surface Water Pathways 2 12
Surface Water Receptors 4 8
Sum of Surface Water Element Scores 36
Groundwater
Element Table Score
Range Use and Range Management (Source) 1 15
Groundwater Pathways 3 18
Groundwater Receptors 5 4
Sum of Groundwater Element Scores 39
The relative evaluation ranking for each media is determined by selecting the appropriate score based on the data elements for that media:
Evaluation Ranking* Score Range High 50-65 Moderate 30-49 Minimal 0-29
*Use the Evaluation Ranking to determine if further actions are warrantedbased on the guidelines for recommended actions, as defined in Table 7.
Surface Water Evaluation Ranking Moderate
Groundwater Evaluation Ranking Minimal*
Notes:
The contributing factors to the moderate groundwater score are high lead loading, shallow groundwater table, sandy soil promoting infiltration, and prolonged use of the range with no regular maintenance activities. The score is adjusted to minimal as groundwater discharges and mixes with ocean water. Also, no receptors are identified.
APPENDIX C Small Arms Range Assessment Protocol
C-78
DELTA RANGE MARINE CORPS BASE HAWAII PUULOA RANGE TRAINING FACILITY OAHU, HAWAII
Date of SARAP update: 6/11/2013
Delta Range is a known distance pistol range designed to support individual small arms training and qualification. Original use of the area as a range stems back at least to the 1960s and possibly the 1930s (USACE, 2001). It has continually been used since at least 1967. The use of various pistol, shotgun, and rifle ammunition is supported at this range (MCBH, 2010a). There are 3 firing lines marked at 7-, 15-, and 25-yards and 20 pneumatic turning target positions at this range. In 2011, the impact berm at Delta Range was mined for lead and reconstructed from 12 feet to an increased height of 14 feet with a reduced slope angle. Additionally, the irrigation system was serviced to better facilitate vegetation growth on the face of the impact berm (NAVFACHI, 2011).
FIVE-YEAR REVIEW ASSESSMENT RESULTS:
The surface water evaluation ranking is moderate with a score of 36. Delta Range is one of the most heavily used SARs at MCB Hawaii and is susceptible to erosion due to the lack of established vegetation on the berm and the range floor; however, vegetation is well-established between the berm and the ocean, though the berm is located only about 100 feet north of the ocean. Sandy soil promotes infiltration through the soil, rather than large surface flows, and precipitation is low in the area. It appears that the irrigation system has been minimally effective at promoting growth of vegetation on the range and/or berm.
The groundwater evaluation ranking is minimal. The shallow water table and sandy soils promote infiltration to groundwater. However, the groundwater is presumed to dilute when discharges to the ocean water. Also, no groundwater receptors were identified.
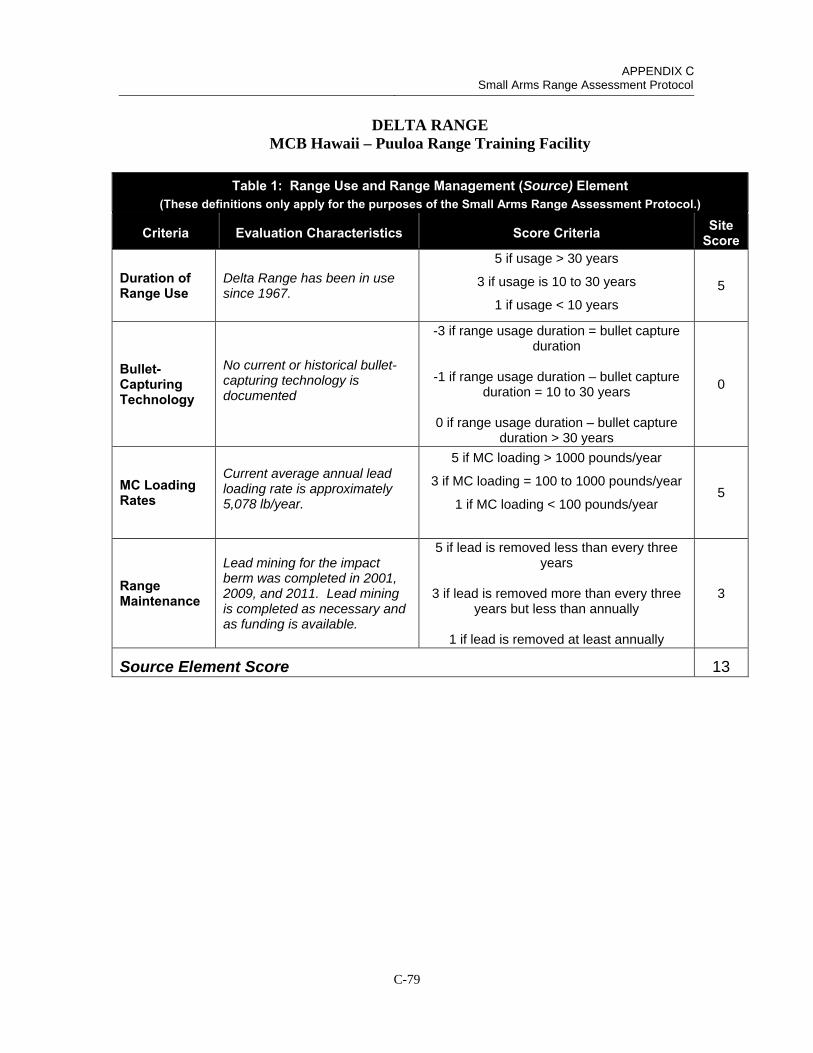
APPENDIX C Small Arms Range Assessment Protocol
C-79
DELTA RANGE MCB Hawaii – Puuloa Range Training Facility
Table 1: Range Use and Range Management (Source) Element (These definitions only apply for the purposes of the Small Arms Range Assessment Protocol.)
Criteria Evaluation Characteristics Score Criteria Site Score
Duration of Range Use
Delta Range has been in use since 1967.
5 if usage > 30 years
3 if usage is 10 to 30 years
1 if usage < 10 years
5
Bullet-Capturing Technology
No current or historical bullet-capturing technology is documented
-3 if range usage duration = bullet capture duration
-1 if range usage duration – bullet capture duration = 10 to 30 years
0 if range usage duration – bullet capture duration > 30 years
0
MC Loading Rates
Current average annual lead loading rate is approximately 5,078 lb/year.
5 if MC loading > 1000 pounds/year
3 if MC loading = 100 to 1000 pounds/year
1 if MC loading < 100 pounds/year 5
Range Maintenance
Lead mining for the impact berm was completed in 2001, 2009, and 2011. Lead mining is completed as necessary and as funding is available.
5 if lead is removed less than every three years
3 if lead is removed more than every three years but less than annually
1 if lead is removed at least annually
3
Source Element Score 13
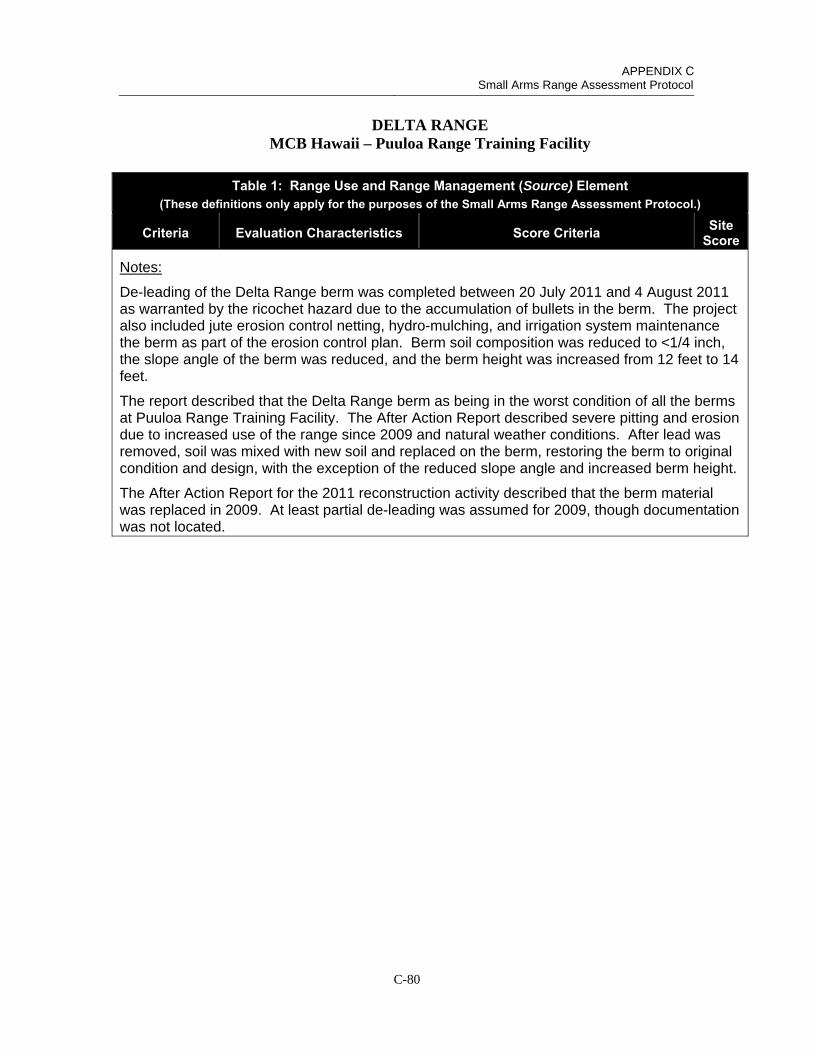
APPENDIX C Small Arms Range Assessment Protocol
C-80
DELTA RANGE MCB Hawaii – Puuloa Range Training Facility
Table 1: Range Use and Range Management (Source) Element (These definitions only apply for the purposes of the Small Arms Range Assessment Protocol.)
Criteria Evaluation Characteristics Score Criteria Site Score
Notes:
De-leading of the Delta Range berm was completed between 20 July 2011 and 4 August 2011 as warranted by the ricochet hazard due to the accumulation of bullets in the berm. The project also included jute erosion control netting, hydro-mulching, and irrigation system maintenance the berm as part of the erosion control plan. Berm soil composition was reduced to <1/4 inch, the slope angle of the berm was reduced, and the berm height was increased from 12 feet to 14 feet.
The report described that the Delta Range berm as being in the worst condition of all the berms at Puuloa Range Training Facility. The After Action Report described severe pitting and erosion due to increased use of the range since 2009 and natural weather conditions. After lead was removed, soil was mixed with new soil and replaced on the berm, restoring the berm to original condition and design, with the exception of the reduced slope angle and increased berm height.
The After Action Report for the 2011 reconstruction activity described that the berm material was replaced in 2009. At least partial de-leading was assumed for 2009, though documentation was not located.
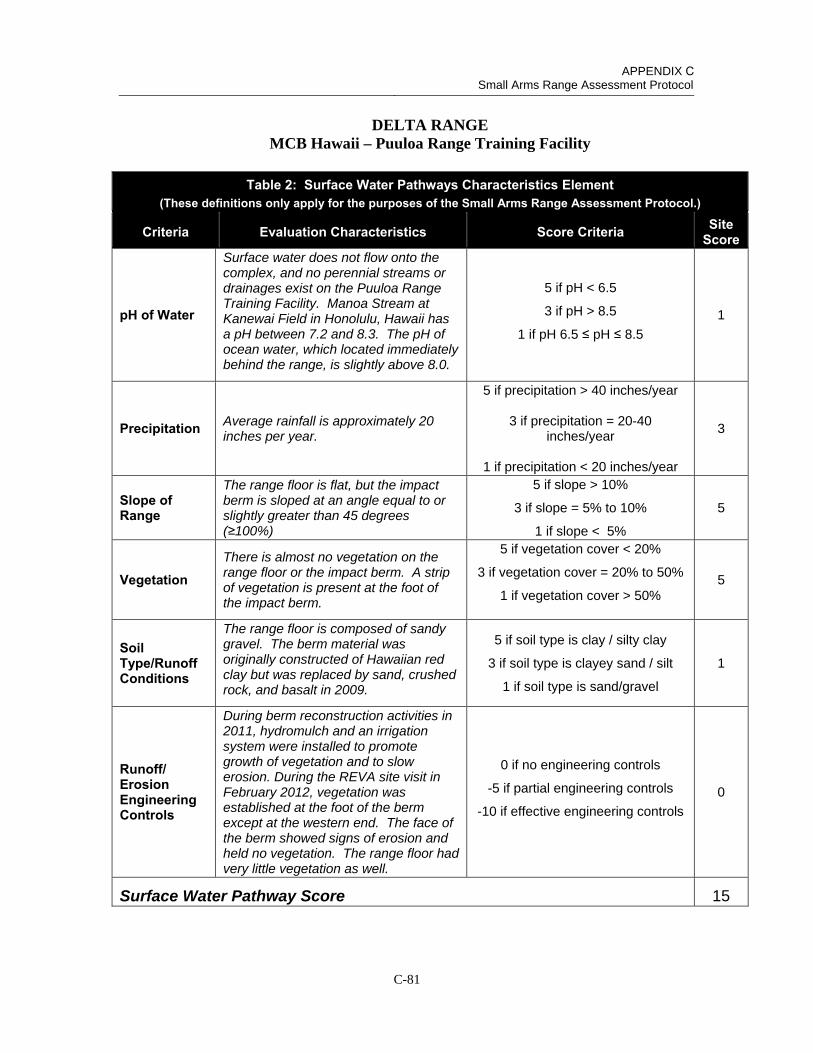
APPENDIX C Small Arms Range Assessment Protocol
C-81
DELTA RANGE MCB Hawaii – Puuloa Range Training Facility
Table 2: Surface Water Pathways Characteristics Element (These definitions only apply for the purposes of the Small Arms Range Assessment Protocol.)
Criteria Evaluation Characteristics Score Criteria Site Score
pH of Water
Surface water does not flow onto the complex, and no perennial streams or drainages exist on the Puuloa Range Training Facility. Manoa Stream at Kanewai Field in Honolulu, Hawaii has a pH between 7.2 and 8.3. The pH of ocean water, which located immediately behind the range, is slightly above 8.0.
5 if pH < 6.5
3 if pH > 8.5
1 if pH 6.5 ≤ pH ≤ 8.5
1
Precipitation Average rainfall is approximately 20 inches per year.
5 if precipitation > 40 inches/year
3 if precipitation = 20-40 inches/year
1 if precipitation < 20 inches/year
3
Slope of Range
The range floor is flat, but the impact berm is sloped at an angle equal to or slightly greater than 45 degrees (≥100%)
5 if slope > 10%
3 if slope = 5% to 10%
1 if slope < 5%
5
Vegetation There is almost no vegetation on the range floor or the impact berm. A strip of vegetation is present at the foot of the impact berm.
5 if vegetation cover < 20%
3 if vegetation cover = 20% to 50%
1 if vegetation cover > 50% 5
Soil Type/Runoff Conditions
The range floor is composed of sandy gravel. The berm material was originally constructed of Hawaiian red clay but was replaced by sand, crushed rock, and basalt in 2009.
5 if soil type is clay / silty clay
3 if soil type is clayey sand / silt
1 if soil type is sand/gravel
1
Runoff/ Erosion Engineering Controls
During berm reconstruction activities in 2011, hydromulch and an irrigation system were installed to promote growth of vegetation and to slow erosion. During the REVA site visit in February 2012, vegetation was established at the foot of the berm except at the western end. The face of the berm showed signs of erosion and held no vegetation. The range floor had very little vegetation as well.
0 if no engineering controls
-5 if partial engineering controls
-10 if effective engineering controls
0
Surface Water Pathway Score 15
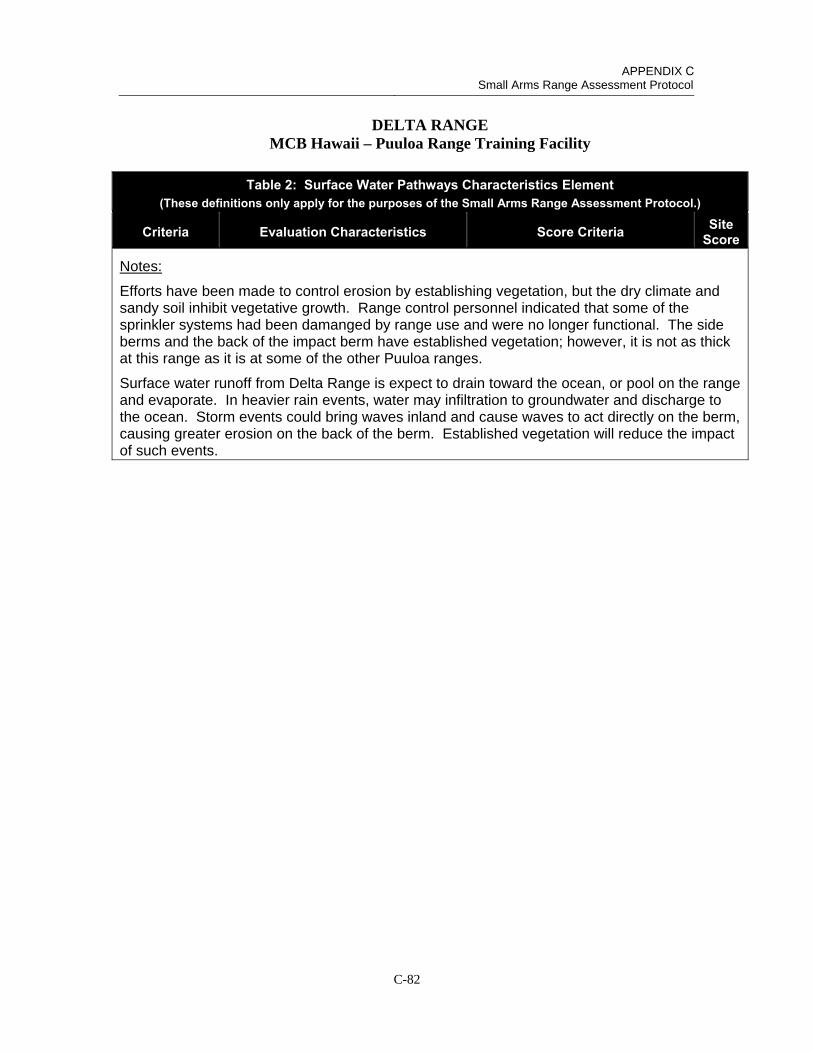
APPENDIX C Small Arms Range Assessment Protocol
C-82
DELTA RANGE MCB Hawaii – Puuloa Range Training Facility
Table 2: Surface Water Pathways Characteristics Element (These definitions only apply for the purposes of the Small Arms Range Assessment Protocol.)
Criteria Evaluation Characteristics Score Criteria Site Score
Notes:
Efforts have been made to control erosion by establishing vegetation, but the dry climate and sandy soil inhibit vegetative growth. Range control personnel indicated that some of the sprinkler systems had been damanged by range use and were no longer functional. The side berms and the back of the impact berm have established vegetation; however, it is not as thick at this range as it is at some of the other Puuloa ranges.
Surface water runoff from Delta Range is expect to drain toward the ocean, or pool on the range and evaporate. In heavier rain events, water may infiltration to groundwater and discharge to the ocean. Storm events could bring waves inland and cause waves to act directly on the berm, causing greater erosion on the back of the berm. Established vegetation will reduce the impact of such events.
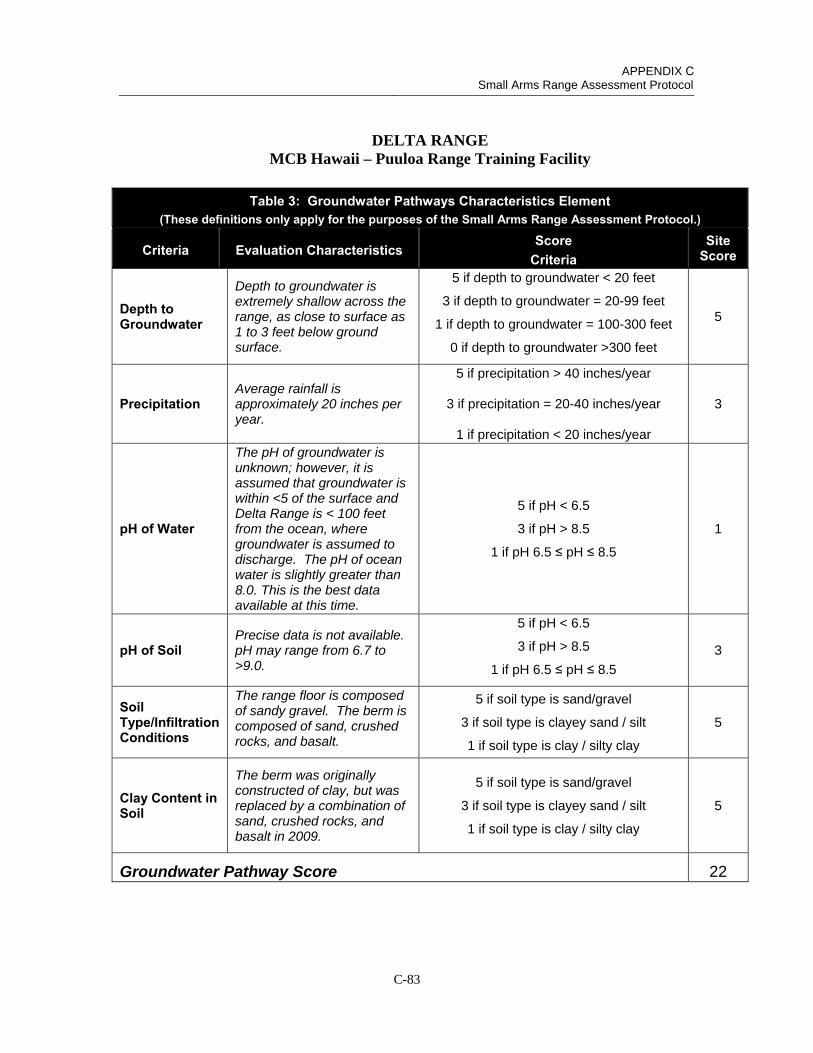
APPENDIX C Small Arms Range Assessment Protocol
C-83
DELTA RANGE MCB Hawaii – Puuloa Range Training Facility
Table 3: Groundwater Pathways Characteristics Element (These definitions only apply for the purposes of the Small Arms Range Assessment Protocol.)
Criteria Evaluation Characteristics Score
Criteria Site
Score
Depth to Groundwater
Depth to groundwater is extremely shallow across the range, as close to surface as 1 to 3 feet below ground surface.
5 if depth to groundwater < 20 feet
3 if depth to groundwater = 20-99 feet
1 if depth to groundwater = 100-300 feet
0 if depth to groundwater >300 feet
5
Precipitation Average rainfall is approximately 20 inches per year.
5 if precipitation > 40 inches/year
3 if precipitation = 20-40 inches/year
1 if precipitation < 20 inches/year
3
pH of Water
The pH of groundwater is unknown; however, it is assumed that groundwater is within <5 of the surface and Delta Range is < 100 feet from the ocean, where groundwater is assumed to discharge. The pH of ocean water is slightly greater than 8.0. This is the best data available at this time.
5 if pH < 6.5
3 if pH > 8.5
1 if pH 6.5 ≤ pH ≤ 8.5
1
pH of Soil Precise data is not available. pH may range from 6.7 to >9.0.
5 if pH < 6.5
3 if pH > 8.5
1 if pH 6.5 ≤ pH ≤ 8.5
3
Soil Type/Infiltration Conditions
The range floor is composed of sandy gravel. The berm is composed of sand, crushed rocks, and basalt.
5 if soil type is sand/gravel
3 if soil type is clayey sand / silt
1 if soil type is clay / silty clay
5
Clay Content in Soil
The berm was originally constructed of clay, but was replaced by a combination of sand, crushed rocks, and basalt in 2009.
5 if soil type is sand/gravel
3 if soil type is clayey sand / silt
1 if soil type is clay / silty clay
5
Groundwater Pathway Score 22

APPENDIX C Small Arms Range Assessment Protocol
C-84
DELTA RANGE MCB Hawaii – Puuloa Range Training Facility
Table 3: Groundwater Pathways Characteristics Element (These definitions only apply for the purposes of the Small Arms Range Assessment Protocol.)
Criteria Evaluation Characteristics Score
Criteria Site
Score
Notes:
The soil map unit for the Puuloa Range Training Facility is CR (coral outcrop) and there is not an available measure pH for this soil type. The area where the Facility is located was identified as being composed of Aridisol soils. These are desert soils typically found in coaster areas on the leeward side of island in areas of low rainfall. These soils are commonly associated with an alkaline pH of >9 (Deenik and McClellan, 2007). Soil at neighboring beaching was identified using a soils map as having a pH range of 6.7 to 7.0. Therefore, the pH at the Puuloa Range Training Facility may range from 6.7 to >9.0 (USDA NRCS, 2013).

APPENDIX C Small Arms Range Assessment Protocol
C-85
DELTA RANGE MCB Hawaii – Puuloa Range Training Facility
Table 4: Surface Water Receptors Element (These definitions only apply for the purposes of the Small Arms Range Assessment Protocol.)
Criteria Evaluation Characteristics
Score Criteria
Site Score
Drinking Water Usage
Surface water in vicinity of Puuloa Range Training Facility is not used as a drinking water source.
10 if analytical data or observable evidence indicates that contamination in the media is present at, is
moving toward, or has a reasonable potential to move toward a surface water body used as a potable water supply or if a designation as a potable water source is
unknown
5 if contamination in the media has moved or is expected to move only slightly beyond the source
(tens of feet) or could move, but is not moving appreciably, toward surface water body used as a
potable water supply or if a designation as a potable water source is unknown
2 if low possibility for contamination in the media to be present at or migrate to a point of exposure
2
Agricultural or Other Beneficial Usage
Culturally important seaweeds are grown at the neighboring Ewa Beach just north of the Puuloa Range Training Facility. This beach is also used for recreation; however, it is not expected that contamination would be present at detectable concentrations in this area.
5 if analytical data or observable evidence indicates that contamination in the media is present at, is
moving toward, or has moved to a point of exposure or if a designation as agricultural or other beneficial
usage is unknown
3 if contamination in the media has moved only slightly beyond the source (tens of feet) or could move
but is not moving appreciably.
1 if low possibility for contamination in the media to be present at or migrate to a point of exposure
1
Sensitive Species Habitat and Threatened or Endangered Species
Endandgered Hawaiian monk seals and protected turtles inhabit the ocean and infrequently haul out along the shoreline of Puuloa Training Facility.
10 if identified receptors have access to possibly contaminated media and/or are located adjacent to
the range boundary
5 if potential for receptors to have access to possibly contaminated media
1 if little or no potential for receptors to have access to possible contaminated media
5
Surface Water Receptor Score 8
Notes:

APPENDIX C Small Arms Range Assessment Protocol
C-86
DELTA RANGE MCB Hawaii – Puuloa Range Training Facility
Table 5: Groundwater Receptors Element (These definitions only apply for the purposes of the Small Arms Range Assessment Protocol.)
Criteria Evaluation Characteristics
Score Criteria
Site Score
Wells Identified as Potable Water Sources
No drinking water wells were identified in vicinity of Puuloa Range Trianing Facility.
10 if analytical data or observable evidence or site conditions indicate that MC may be within or moving toward a reasonable radius of influence of a well or
other point of exposure or if a designation as a potable water source is unknown
5 if analytical data or observable evidence or site conditions indicate that MC have moved only slightly
beyond the source (tens of feet) or could move toward a reasonable radius of influence of a well or other point of exposure, but are not moving appreciably
2 if low possibility for MC to be present at or migrate to within a reasonable radius of influence or point of
exposure
2
Wells Identified for Agricultural or Other Beneficial Usage
Inland of the Puuloa Range Training Facility, groundwater is a resource for golf courses, developments, and crop irrigation; however,groundwater beneath the ranges is assumed to discharge to the ocean.
5 if analytical data or observable evidence or site conditions indicate that MC may be within or moving toward a reasonable radius of influence of a well or
other point of exposure or if a designation as agricultural or other beneficial usage is unknown
3 if analytical data or observable evidence or site conditions indicate that MC have moved only slightly
beyond the source (tens of feet) or could move toward a reasonable radius of influence of a well or other point of exposure, but are not moving appreciably
1 if low possibility for MC to be present at or migrate to within a reasonable radius of influence of a well or
point of exposure
1
Sensitive Species Habitat and Threatened and Endangered Species
No sensitive species were identified in groundwater. Groundwater is assumed to discharge to the ocean.
5 if identified receptors exposed to potentially MC-impacted water from groundwater or groundwater
sources
3 if potential for receptors exposed to potentially MC-impacted water from groundwater or groundwater
sources
1 if little or no potential for receptors exposed to potentially MC-impacted water from groundwater or
groundwater sources
1
Groundwater Receptor Score 4
Notes:

APPENDIX C Small Arms Range Assessment Protocol
C-87
DELTA RANGE MCB Hawaii – Puuloa Range Training Facility
Table 6: Evaluation Score (These definitions only apply for the purposes of the Small Arms Range Assessment Protocol.)
Surface Water Element Table Score
Range Use and Range Management (Source) 1 15
Surface Water Pathways 2 12
Surface Water Receptors 4 8
Sum of Surface Water Element Scores 36
Groundwater
Element Table Score
Range Use and Range Management (Source) 1 15
Groundwater Pathways 3 18
Groundwater Receptors 5 4
Sum of Groundwater Element Scores 39
The relative evaluation ranking for each media is determined by selecting the appropriate score based on the data elements for that media:
Evaluation Ranking* Score Range High 50-65 Moderate 30-49 Minimal 0-29
*Use the Evaluation Ranking to determine if further actions are warrantedbased on the guidelines for recommended actions, as defined in Table 7.
Surface Water Evaluation Ranking Moderate
Groundwater Evaluation Ranking Minimal*
Notes:
The contributing factors to the moderate groundwater score are high lead loading, shallow groundwater table, sandy soil promoting infiltration, and prolonged use of the range with no regular maintenance activities. The score is adjusted to minimal as groundwater discharges and mixes with ocean water. Also, no receptors are identified.
APPENDIX C Small Arms Range Assessment Protocol
C-88
ECHO RANGE MARINE CORPS BASE HAWAII PUULOA RANGE TRAINING FACILITY OAHU, HAWAII
Date of SARAP update: 6/11/2013
Echo Range is a known distance pistol range designed to support individual small arms training and qualification. Original use of the area as a SAR stems to the 1930s, but it has been used continually since at least 1967 (USACE, 2001). Pistol, shotgun, and rifle ammunition is permitted for use at this range (MCBH, 2010a). Rifle ammunition represents the largest fraction of all small arms used at this range. Echo Range is equipped with 5 firing lines marked at 3-, 5-, 10-, 25-, and 50-yards and 30 pneumatic turning target positions.
FIVE-YEAR REVIEW ASSESSMENT RESULTS:
The surface water evaluation ranking is moderate with a score of 32 points. The lower surface water score is due to the sandy soil promoting infiltration, low precipitation, presence of vegetation, and no designated uses for surface water. Surface water runoff from the range is expected to drain toward the ocean, pool and evaporate, or infiltrate through the sandy soil to groundwater and discharge to the ocean. The primary threat to Charlie Range is increasing beach erosion and potential wave action, particularly during intense storms, which could threaten the impact berm in the future.
The groundwater evaluation ranking is minimal. The shallow water table and sandy soils promote infiltration to groundwater. However, the groundwater is presumed to dilute when discharges to the ocean water. Also, no groundwater receptors were identified.
APPENDIX C Small Arms Range Assessment Protocol
C-89
ECHO RANGE MCB Hawaii – Puuloa Range Training Facility
Table 1: Range Use and Range Management (Source) Element (These definitions only apply for the purposes of the Small Arms Range Assessment Protocol.)
Criteria Evaluation Characteristics Score Criteria Site Score
Duration of Range Use
Echo Range has been in use since 1967.
5 if usage > 30 years
3 if usage is 10 to 30 years
1 if usage < 10 years
5
Bullet-Capturing Technology
No current or historical bullet-capturing technology is documented
-3 if range usage duration = bullet capture duration
-1 if range usage duration – bullet capture duration = 10 to 30 years
0 if range usage duration – bullet capture duration > 30 years
0
MC Loading Rates
Current average annual lead loading rate is approximately 3,051 lb/year.
5 if MC loading > 1000 pounds/year
3 if MC loading = 100 to 1000 pounds/year
1 if MC loading < 100 pounds/year 5
Range Maintenance
Echo Range was mined for lead in 1998, 2009, and 2011. The berm also underwent reconstruction activities in 2011. Lead is removed as necessary and as funding is available.
5 if lead is removed less than every three years
3 if lead is removed more than every three years but less than annually
1 if lead is removed at least annually
3
Source Element Score 13
Notes:
De-leading of the berm at Echo Range was completed between 20 July 2011 and 4 August 2011 as warranted by the ricochet hazard due to the accumulation of bullets in the berm. The project also included jute erosion control netting, hydro-mulching, and irrigation system maintenance the berm as part of the erosion control plan.
The report described that the Echo Range berm was in better condition than the other pistol range berms at Puuloa Range Training Facility in 2011 when the range reconstruction activities were completed. After lead was removed, soil was mixed with new soil and replaced on the berm, restoring the berm to original condition and design..
The After Action Report for the 2011 reconstruction activity described that the berm material was replaced in 2009. At least partial de-leading was assumed for 2009, though documentation was not located.
APPENDIX C Small Arms Range Assessment Protocol
C-90
ECHO RANGE MCB Hawaii – Puuloa Range Training Facility
Table 2: Surface Water Pathways Characteristics Element (These definitions only apply for the purposes of the Small Arms Range Assessment Protocol.)
Criteria Evaluation Characteristics Score Criteria Site Score
pH of Water
Surface water does not flow onto the complex, and no perennial streams or drainages exist on the Puuloa Range Training Facility. Manoa Stream at Kanewai Field in Honolulu, Hawaii has a pH between 7.2 and 8.3. The pH of ocean water, which located immediately behind the range, is slightly above 8.0.
5 if pH < 6.5
3 if pH > 8.5
1 if pH 6.5 ≤ pH ≤ 8.5
1
Precipitation Average rainfall is approximately 20 inches per year.
5 if precipitation > 40 inches/year
3 if precipitation = 20-40 inches/year
1 if precipitation < 20 inches/year
3
Slope of Range
The range floor is flat, but the slope of the berm is approximately 45 degrees (100%).
5 if slope > 10%
3 if slope = 5% to 10%
1 if slope < 5%
5
Vegetation
The range has thin vegetation scattered throughout the range floor, and vegetation is well-established at the base and top of the impact berm. The berm is void of vegetation where bullets impact.
5 if vegetation cover < 20%
3 if vegetation cover = 20% to 50%
1 if vegetation cover > 50% 1
Soil Type/Runoff Conditions
The range floor is composed of sand and gravel. The berm material was made from beach sand located throughout the facility, but was replaced with a combination of sand, crushed rock, and basalt in 2009.
5 if soil type is clay / silty clay
3 if soil type is clayey sand / silt
1 if soil type is sand/gravel
1
Runoff/ Erosion Engineering Controls
During berm reconstruction activities in 2011, hydromulch and an irrigation system were installed to promote growth of vegetation and to slow erosion. During the REVA site visit in February 2012, vegetation was established at the foot and top of the berm. Concrete blocks were in place to protect the sprinklers. No engineering controls were identified to direct stormwater runoff.
0 if no engineering controls
-5 if partial engineering controls
-10 if effective engineering controls
0
Surface Water Pathway Score 11

APPENDIX C Small Arms Range Assessment Protocol
C-91
ECHO RANGE MCB Hawaii – Puuloa Range Training Facility
Table 2: Surface Water Pathways Characteristics Element (These definitions only apply for the purposes of the Small Arms Range Assessment Protocol.)
Criteria Evaluation Characteristics Score Criteria Site Score
Notes:
Efforts have been made to establish vegetation to help stabilize the berm and prevent erosion by promoting vegetative growth. These efforts appear to be moderately successful by the presence of vegation at the foot of the berm. The dry climate, winds, and sandy soil continue to inhibit growth of lush vegetation, though vegetation is scattered throughout the range.
Surface water runoff is expected to drain toward the ocean, evaporate, or infiltrate to groundwater and discharge to the ocean. Storms can cause waves to reach the back of the berm and erode the surface of the backside of the berm.
APPENDIX C Small Arms Range Assessment Protocol
C-92
ECHO RANGE MCB Hawaii – Puuloa Range Training Facility
Table 3: Groundwater Pathways Characteristics Element (These definitions only apply for the purposes of the Small Arms Range Assessment Protocol.)
Criteria Evaluation Characteristics Score
Criteria Site
Score
Depth to Groundwater
Depth to groundwater is extremely shallow across the range, as close to surface as 1 to 3 feet below ground surface.
5 if depth to groundwater < 20 feet
3 if depth to groundwater = 20-99 feet
1 if depth to groundwater = 100-300 feet
0 if depth to groundwater >300 feet
5
Precipitation Average rainfall is approximately 20 inches per year.
5 if precipitation > 40 inches/year
3 if precipitation = 20-40 inches/year
1 if precipitation < 20 inches/year
3
pH of Water
The pH of groundwater is unknown; however, it is assumed that groundwater is within <5 of the surface and Delta Range is < 100 feet from the ocean, where groundwater is assumed to discharge. The pH of ocean water is slightly greater than 8.0. This is the best data available at this time.
5 if pH < 6.5
3 if pH > 8.5
1 if pH 6.5 ≤ pH ≤ 8.5
1
pH of Soil Precise data is not available. pH may range from 6.7 to >9.0.
5 if pH < 6.5
3 if pH > 8.5
1 if pH 6.5 ≤ pH ≤ 8.5
3
Soil Type/Infiltration Conditions
The range floor is composed of sandy gravel. The berm is composed of sand, crushed rocks, and basalt.
5 if soil type is sand/gravel
3 if soil type is clayey sand / silt
1 if soil type is clay / silty clay
5
Clay Content in Soil
The berm is composed of a combination of sand, crushed rocks, and basalt in 2009.
5 if soil type is sand/gravel
3 if soil type is clayey sand / silt
1 if soil type is clay / silty clay
5
Groundwater Pathway Score 22

APPENDIX C Small Arms Range Assessment Protocol
C-93
ECHO RANGE MCB Hawaii – Puuloa Range Training Facility
Table 3: Groundwater Pathways Characteristics Element (These definitions only apply for the purposes of the Small Arms Range Assessment Protocol.)
Criteria Evaluation Characteristics Score
Criteria Site
Score
Notes:
The soil map unit for the Puuloa Range Training Facility is CR (coral outcrop) and there is not an available measure pH for this soil type. The area where the Facility is located was identified as being composed of Aridisol soils. These are desert soils typically found in coaster areas on the leeward side of island in areas of low rainfall. These soils are commonly associated with an alkaline pH of >9 (Deenik and McClellan, 2007). Soil at neighboring beaching was identified using a soils map as having a pH range of 6.7 to 7.0. Therefore, the pH at the Puuloa Range Training Facility may range from 6.7 to >9.0 (USDA NRCS, 2013).

APPENDIX C Small Arms Range Assessment Protocol
C-94
ECHO RANGE MCB Hawaii – Puuloa Range Training Facility
Table 4: Surface Water Receptors Element (These definitions only apply for the purposes of the Small Arms Range Assessment Protocol.)
Criteria Evaluation Characteristics
Score Criteria
Site Score
Drinking Water Usage
Surface water in vicinity of Puuloa Range Training Facility is not used as a drinking water source.
10 if analytical data or observable evidence indicates that contamination in the media is present at, is moving toward, or has a reasonable potential to move toward a surface water body used as a potable water supply or if
a designation as a potable water source is unknown
5 if contamination in the media has moved or is expected to move only slightly beyond the source (tens of feet) or could move, but is not moving appreciably, toward surface water body used as a potable water
supply or if a designation as a potable water source is unknown
2 if low possibility for contamination in the media to be present at or migrate to a point of exposure
2
Agricultural or Other Beneficial Usage
Culturally important seaweeds are grown at the neighboring Ewa Beach just north of the Puuloa Range Training Facility. This beach is also used for recreation; however, it is not expected that contamination would be present at detectable concentrations in this area.
5 if analytical data or observable evidence indicates that contamination in the media is present at, is moving toward, or has moved to a point of exposure or if a
designation as agricultural or other beneficial usage is unknown
3 if contamination in the media has moved only slightly beyond the source (tens of feet) or could move but is
not moving appreciably.
1 if low possibility for contamination in the media to be present at or migrate to a point of exposure
1
Sensitive Species Habitat and Threatened or Endangered Species
Endandgered Hawaiian monk seals and protected turtles inhabit the ocean and infrequently haul out along the shoreline of Puuloa Training Facility.
10 if identified receptors have access to possibly contaminated media and/or are located adjacent to the
range boundary
5 if potential for receptors to have access to possibly contaminated media
1 if little or no potential for receptors to have access to possible contaminated media
5
Surface Water Receptor Score 8
Notes:

APPENDIX C Small Arms Range Assessment Protocol
C-95
ECHO RANGE MCB Hawaii – Puuloa Range Training Facility
Table 5: Groundwater Receptors Element (These definitions only apply for the purposes of the Small Arms Range Assessment Protocol.)
Criteria Evaluation Characteristics
Score Criteria
Site Score
Wells Identified as Potable Water Sources
No drinking water wells were identified in vicinity of Puuloa Range Trianing Facility.
10 if analytical data or observable evidence or site conditions indicate that MC may be within or moving toward a reasonable radius of influence of a well or
other point of exposure or if a designation as a potable water source is unknown
5 if analytical data or observable evidence or site conditions indicate that MC have moved only slightly
beyond the source (tens of feet) or could move toward a reasonable radius of influence of a well or other point of exposure, but are not moving appreciably
2 if low possibility for MC to be present at or migrate to within a reasonable radius of influence or point of
exposure
2
Wells Identified for Agricultural or Other Beneficial Usage
Inland of the Puuloa Range Training Facility, groundwater is a resource for golf courses, developments, and crop irrigation; however,groundwater beneath the ranges is assumed to discharge to the ocean.
5 if analytical data or observable evidence or site conditions indicate that MC may be within or moving toward a reasonable radius of influence of a well or
other point of exposure or if a designation as agricultural or other beneficial usage is unknown
3 if analytical data or observable evidence or site conditions indicate that MC have moved only slightly
beyond the source (tens of feet) or could move toward a reasonable radius of influence of a well or other point of exposure, but are not moving appreciably
1 if low possibility for MC to be present at or migrate to within a reasonable radius of influence of a well or
point of exposure
1
Sensitive Species Habitat and Threatened and Endangered Species
No sensitive species were identified in groundwater. Groundwater is assumed to discharge to the ocean.
5 if identified receptors exposed to potentially MC-impacted water from groundwater or groundwater
sources
3 if potential for receptors exposed to potentially MC-impacted water from groundwater or groundwater
sources
1 if little or no potential for receptors exposed to potentially MC-impacted water from groundwater or
groundwater sources
1
Groundwater Receptor Score 4
Notes:
APPENDIX C Small Arms Range Assessment Protocol
C-96
ECHO RANGE MCB Hawaii – Puuloa Range Training Facility
Table 6: Evaluation Score (These definitions only apply for the purposes of the Small Arms Range Assessment Protocol.)
Surface Water Element Table Score
Range Use and Range Management (Source) 1 15
Surface Water Pathways 2 12
Surface Water Receptors 4 8
Sum of Surface Water Element Scores 32
Groundwater
Element Table Score
Range Use and Range Management (Source) 1 15
Groundwater Pathways 3 18
Groundwater Receptors 5 4
Sum of Groundwater Element Scores 39
The relative evaluation ranking for each media is determined by selecting the appropriate score based on the data elements for that media:
Evaluation Ranking* Score Range High 50-65 Moderate 30-49 Minimal 0-29
*Use the Evaluation Ranking to determine if further actions are warrantedbased on the guidelines for recommended actions, as defined in Table 7.
Surface Water Evaluation Ranking Moderate
Groundwater Evaluation Ranking Minimal*
Notes:
The contributing factors to the moderate groundwater score are high lead loading, shallow groundwater table, sandy soil promoting infiltration, and prolonged use of the range with no regular maintenance activities. The score is adjusted to minimal as groundwater discharges and mixes with ocean water. Also, no receptors are identified.
APPENDIX C Small Arms Range Assessment Protocol
C-97
FOXTROT RANGE MARINE CORPS BASE HAWAII PUULOA RANGE TRAINING FACILITY OAHU, HAWAII
Date of SARAP update: 6/11/2013
Foxtrot Range is a known distance pistol range with similar design and training features as Echo Range and is the easternmost of the six current ranges at the Puuloa Range Training Facility. It is the most heavily used SAR at MCB Hawaii. According to O&T personnel, it facilitates approximately 80% of annual sustainment training for MCB Hawaii personnel. Original use of the area as a SAR stems to the 1930s with continual use of the range since at least 1967 (USACE, 2001). The use of pistol, shotgun, and rifle ammunition is supported at this range (MCBH, 2010a). RFMSS data from the last 5 years indicate that rifle rounds represent the largest fraction of all small arms used at this range. Foxtrot Range is equipped with 5 firing lines marked at 3-, 7-, 15-, 25-, and 50-yards and 40 pneumatic turning target positions.
FIVE-YEAR REVIEW ASSESSMENT RESULTS:
The surface water evaluation ranking is high. At the Foxtrot Range, the sandy soil promotes infiltration, there is low precipitation, and there are no designated uses for surface water. Surface water runoff from the range is expected to drain toward the ocean, pool and evaporate, or infiltrate through the sandy soil to groundwater and discharge to the ocean. However, a 2012 summer storm eroded much of the beach into the ocean, and waves are currently acting on the backside of the impact berm, eroding in into the ocean. This is threatening an imminent release of MC into the ocean from the impact berm if action is not taken to protect or move the berm.
The groundwater evaluation ranking is minimal. The shallow water table and sandy soils promote infiltration to groundwater. However, the groundwater is presumed to dilute when discharges to the ocean water. Also, no groundwater receptors were identified.

APPENDIX C Small Arms Range Assessment Protocol
C-98
FOXTROT RANGE MCB Hawaii – Puuloa Range Training Facility
Table 1: Range Use and Range Management (Source) Element (These definitions only apply for the purposes of the Small Arms Range Assessment Protocol.)
Criteria Evaluation Characteristics Score Criteria Site Score
Duration of Range Use
Foxtrot Range has been active since 1967.
5 if usage > 30 years
3 if usage is 10 to 30 years
1 if usage < 10 years
5
Bullet-Capturing Technology
No current or historical bullet-capturing technology is documented
-3 if range usage duration = bullet capture duration
-1 if range usage duration – bullet capture duration = 10 to 30 years
0 if range usage duration – bullet capture duration > 30 years
0
MC Loading Rates
Current average annual lead loading rate is approximately 7,582 lb/year.
5 if MC loading > 1000 pounds/year
3 if MC loading = 100 to 1000 pounds/year
1 if MC loading < 100 pounds/year 5
Range Maintenance
The surface of the berm was mined in 1999, 2009, and the berm was mined and modified/reconstructed in 2011.
5 if lead is removed less than every three years
3 if lead is removed more than every three years but less than annually
1 if lead is removed at least annually
5
Source Element Score 15
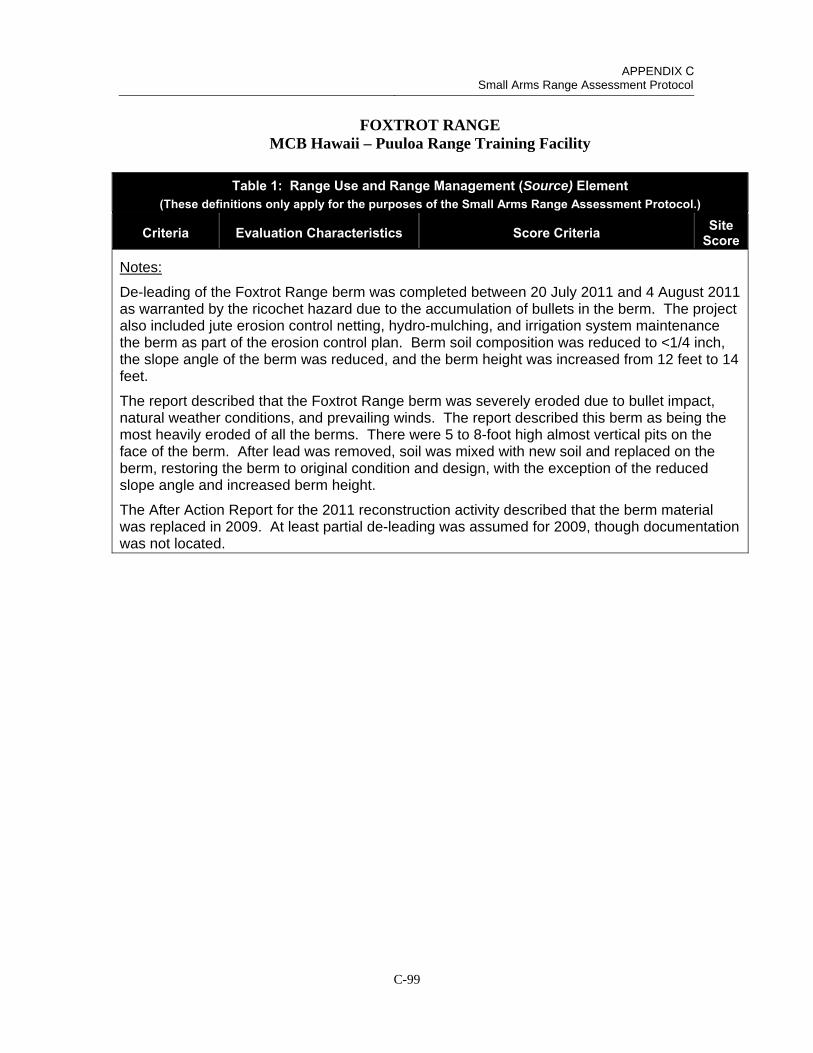
APPENDIX C Small Arms Range Assessment Protocol
C-99
FOXTROT RANGE MCB Hawaii – Puuloa Range Training Facility
Table 1: Range Use and Range Management (Source) Element (These definitions only apply for the purposes of the Small Arms Range Assessment Protocol.)
Criteria Evaluation Characteristics Score Criteria Site Score
Notes:
De-leading of the Foxtrot Range berm was completed between 20 July 2011 and 4 August 2011 as warranted by the ricochet hazard due to the accumulation of bullets in the berm. The project also included jute erosion control netting, hydro-mulching, and irrigation system maintenance the berm as part of the erosion control plan. Berm soil composition was reduced to <1/4 inch, the slope angle of the berm was reduced, and the berm height was increased from 12 feet to 14 feet.
The report described that the Foxtrot Range berm was severely eroded due to bullet impact, natural weather conditions, and prevailing winds. The report described this berm as being the most heavily eroded of all the berms. There were 5 to 8-foot high almost vertical pits on the face of the berm. After lead was removed, soil was mixed with new soil and replaced on the berm, restoring the berm to original condition and design, with the exception of the reduced slope angle and increased berm height.
The After Action Report for the 2011 reconstruction activity described that the berm material was replaced in 2009. At least partial de-leading was assumed for 2009, though documentation was not located.
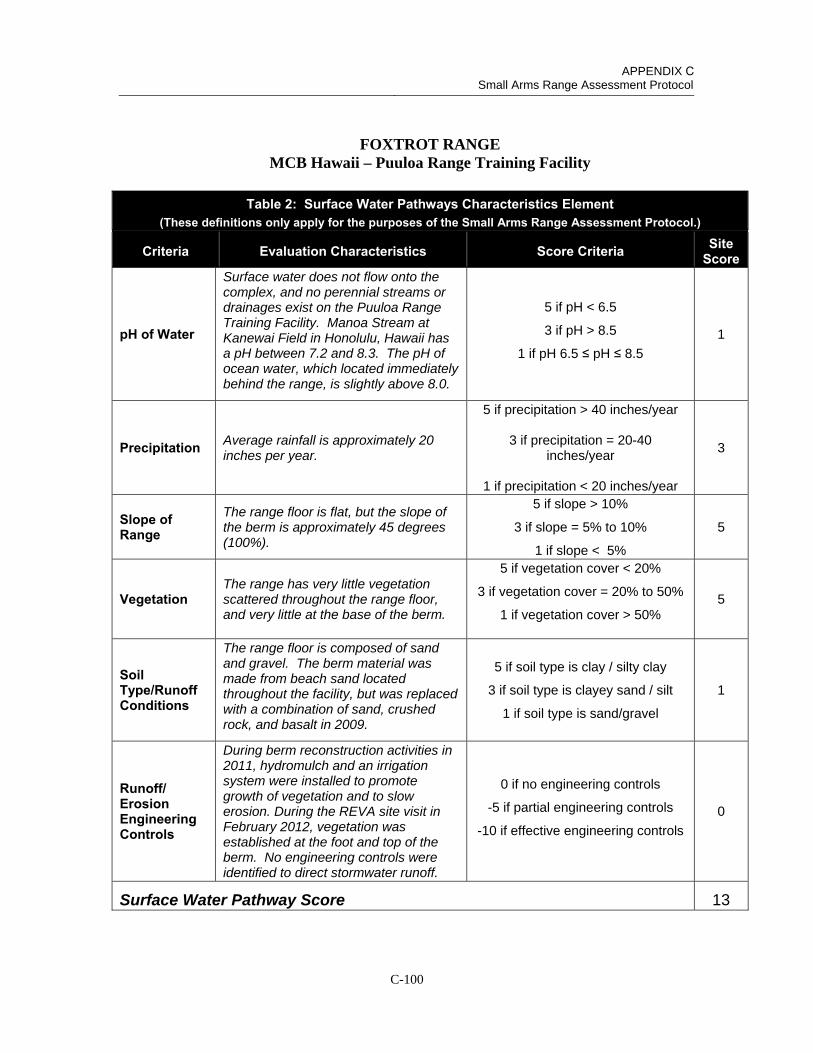
APPENDIX C Small Arms Range Assessment Protocol
C-100
FOXTROT RANGE MCB Hawaii – Puuloa Range Training Facility
Table 2: Surface Water Pathways Characteristics Element (These definitions only apply for the purposes of the Small Arms Range Assessment Protocol.)
Criteria Evaluation Characteristics Score Criteria Site Score
pH of Water
Surface water does not flow onto the complex, and no perennial streams or drainages exist on the Puuloa Range Training Facility. Manoa Stream at Kanewai Field in Honolulu, Hawaii has a pH between 7.2 and 8.3. The pH of ocean water, which located immediately behind the range, is slightly above 8.0.
5 if pH < 6.5
3 if pH > 8.5
1 if pH 6.5 ≤ pH ≤ 8.5
1
Precipitation Average rainfall is approximately 20 inches per year.
5 if precipitation > 40 inches/year
3 if precipitation = 20-40 inches/year
1 if precipitation < 20 inches/year
3
Slope of Range
The range floor is flat, but the slope of the berm is approximately 45 degrees (100%).
5 if slope > 10%
3 if slope = 5% to 10%
1 if slope < 5%
5
Vegetation The range has very little vegetation scattered throughout the range floor, and very little at the base of the berm.
5 if vegetation cover < 20%
3 if vegetation cover = 20% to 50%
1 if vegetation cover > 50% 5
Soil Type/Runoff Conditions
The range floor is composed of sand and gravel. The berm material was made from beach sand located throughout the facility, but was replaced with a combination of sand, crushed rock, and basalt in 2009.
5 if soil type is clay / silty clay
3 if soil type is clayey sand / silt
1 if soil type is sand/gravel
1
Runoff/ Erosion Engineering Controls
During berm reconstruction activities in 2011, hydromulch and an irrigation system were installed to promote growth of vegetation and to slow erosion. During the REVA site visit in February 2012, vegetation was established at the foot and top of the berm. No engineering controls were identified to direct stormwater runoff.
0 if no engineering controls
-5 if partial engineering controls
-10 if effective engineering controls
0
Surface Water Pathway Score 13

APPENDIX C Small Arms Range Assessment Protocol
C-101
FOXTROT RANGE MCB Hawaii – Puuloa Range Training Facility
Table 2: Surface Water Pathways Characteristics Element (These definitions only apply for the purposes of the Small Arms Range Assessment Protocol.)
Criteria Evaluation Characteristics Score Criteria Site Score
Notes:
Range control indicated that training had destroyed the irrigation system and it was no longer functional.
A 2012 summer storm eroded much of the beach behind the impact berm, and waves are now reaching close to the backside of the impact berm. There is essentially no buffer between the range and the ocean. Approximately 50-60% of the backside of the berm is vegetated, but there are some large shrubs that would aid in protecting the berm; however, in a large storm, the berm and the range would be very vulnerable.

APPENDIX C Small Arms Range Assessment Protocol
C-102
FOXTROT RANGE MCB Hawaii – Puuloa Range Training Facility
Table 3: Groundwater Pathways Characteristics Element (These definitions only apply for the purposes of the Small Arms Range Assessment Protocol.)
Criteria Evaluation Characteristics Score
Criteria Site
Score
Depth to Groundwater
Depth to groundwater is extremely shallow across the range, as close to surface as 1 to 3 feet below ground surface.
5 if depth to groundwater < 20 feet
3 if depth to groundwater = 20-99 feet
1 if depth to groundwater = 100-300 feet
0 if depth to groundwater >300 feet
5
Precipitation Average rainfall is approximately 20 inches per year.
5 if precipitation > 40 inches/year
3 if precipitation = 20-40 inches/year
1 if precipitation < 20 inches/year
3
pH of Water
The pH of groundwater is unknown; however, it is assumed that groundwater is within <5 of the surface and Delta Range is <25 from the ocean, where groundwater is assumed to discharge. The pH of ocean water is slightly greater than 8.0. This is the best data available at this time.
5 if pH < 6.5
3 if pH > 8.5
1 if pH 6.5 ≤ pH ≤ 8.5
1
pH of Soil Precise data is not available. pH may range from 6.7 to >9.0.
5 if pH < 6.5
3 if pH > 8.5
1 if pH 6.5 ≤ pH ≤ 8.5
3
Soil Type/Infiltration Conditions
The range floor is composed of sandy gravel. The berm is composed of sand, crushed rocks, and basalt.
5 if soil type is sand/gravel
3 if soil type is clayey sand / silt
1 if soil type is clay / silty clay
5
Clay Content in Soil
The berm is composed of a combination of sand, crushed rocks, and basalt in 2009.
5 if soil type is sand/gravel
3 if soil type is clayey sand / silt
1 if soil type is clay / silty clay
5
Groundwater Pathway Score 22
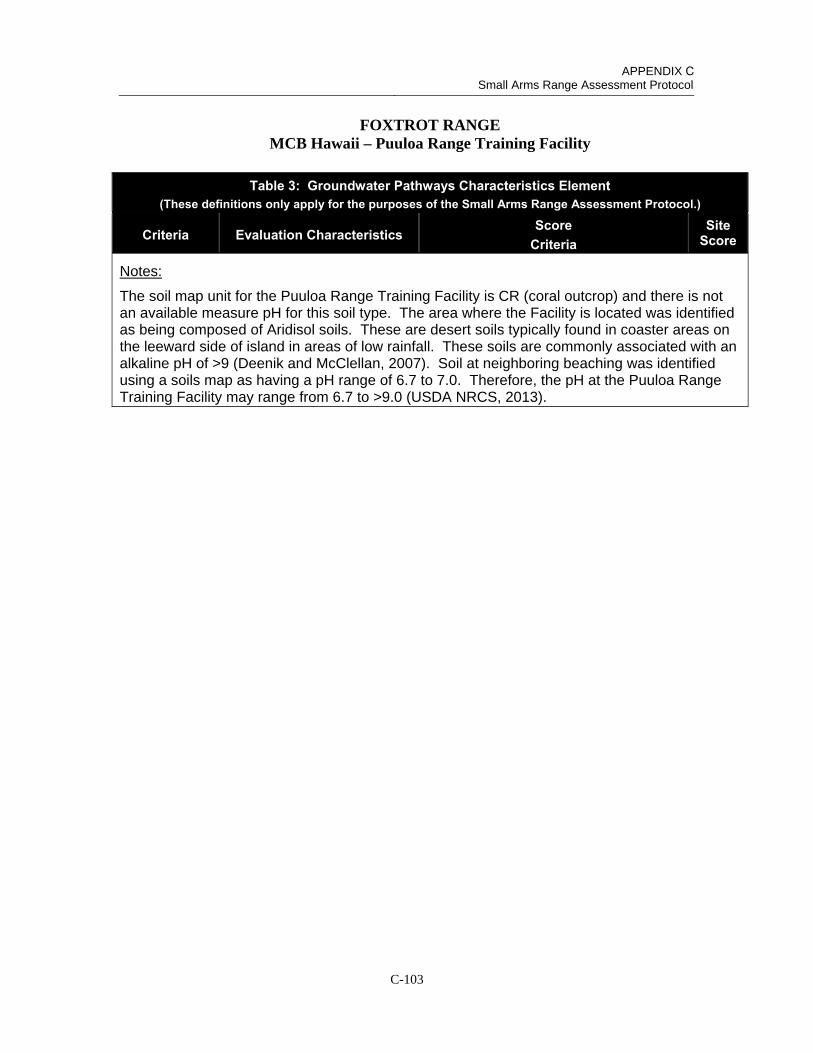
APPENDIX C Small Arms Range Assessment Protocol
C-103
FOXTROT RANGE MCB Hawaii – Puuloa Range Training Facility
Table 3: Groundwater Pathways Characteristics Element (These definitions only apply for the purposes of the Small Arms Range Assessment Protocol.)
Criteria Evaluation Characteristics Score
Criteria Site
Score
Notes:
The soil map unit for the Puuloa Range Training Facility is CR (coral outcrop) and there is not an available measure pH for this soil type. The area where the Facility is located was identified as being composed of Aridisol soils. These are desert soils typically found in coaster areas on the leeward side of island in areas of low rainfall. These soils are commonly associated with an alkaline pH of >9 (Deenik and McClellan, 2007). Soil at neighboring beaching was identified using a soils map as having a pH range of 6.7 to 7.0. Therefore, the pH at the Puuloa Range Training Facility may range from 6.7 to >9.0 (USDA NRCS, 2013).
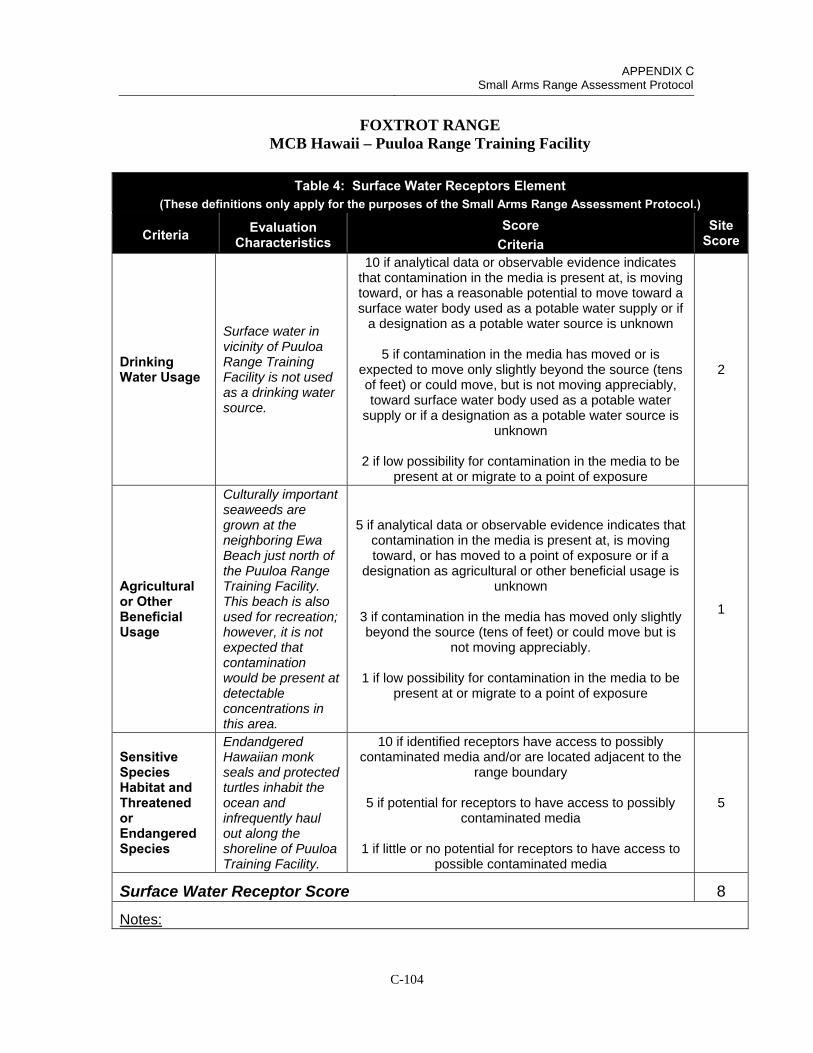
APPENDIX C Small Arms Range Assessment Protocol
C-104
FOXTROT RANGE MCB Hawaii – Puuloa Range Training Facility
Table 4: Surface Water Receptors Element (These definitions only apply for the purposes of the Small Arms Range Assessment Protocol.)
Criteria Evaluation Characteristics
Score Criteria
Site Score
Drinking Water Usage
Surface water in vicinity of Puuloa Range Training Facility is not used as a drinking water source.
10 if analytical data or observable evidence indicates that contamination in the media is present at, is moving toward, or has a reasonable potential to move toward a surface water body used as a potable water supply or if
a designation as a potable water source is unknown
5 if contamination in the media has moved or is expected to move only slightly beyond the source (tens of feet) or could move, but is not moving appreciably, toward surface water body used as a potable water
supply or if a designation as a potable water source is unknown
2 if low possibility for contamination in the media to be present at or migrate to a point of exposure
2
Agricultural or Other Beneficial Usage
Culturally important seaweeds are grown at the neighboring Ewa Beach just north of the Puuloa Range Training Facility. This beach is also used for recreation; however, it is not expected that contamination would be present at detectable concentrations in this area.
5 if analytical data or observable evidence indicates that contamination in the media is present at, is moving toward, or has moved to a point of exposure or if a
designation as agricultural or other beneficial usage is unknown
3 if contamination in the media has moved only slightly beyond the source (tens of feet) or could move but is
not moving appreciably.
1 if low possibility for contamination in the media to be present at or migrate to a point of exposure
1
Sensitive Species Habitat and Threatened or Endangered Species
Endandgered Hawaiian monk seals and protected turtles inhabit the ocean and infrequently haul out along the shoreline of Puuloa Training Facility.
10 if identified receptors have access to possibly contaminated media and/or are located adjacent to the
range boundary
5 if potential for receptors to have access to possibly contaminated media
1 if little or no potential for receptors to have access to possible contaminated media
5
Surface Water Receptor Score 8
Notes:
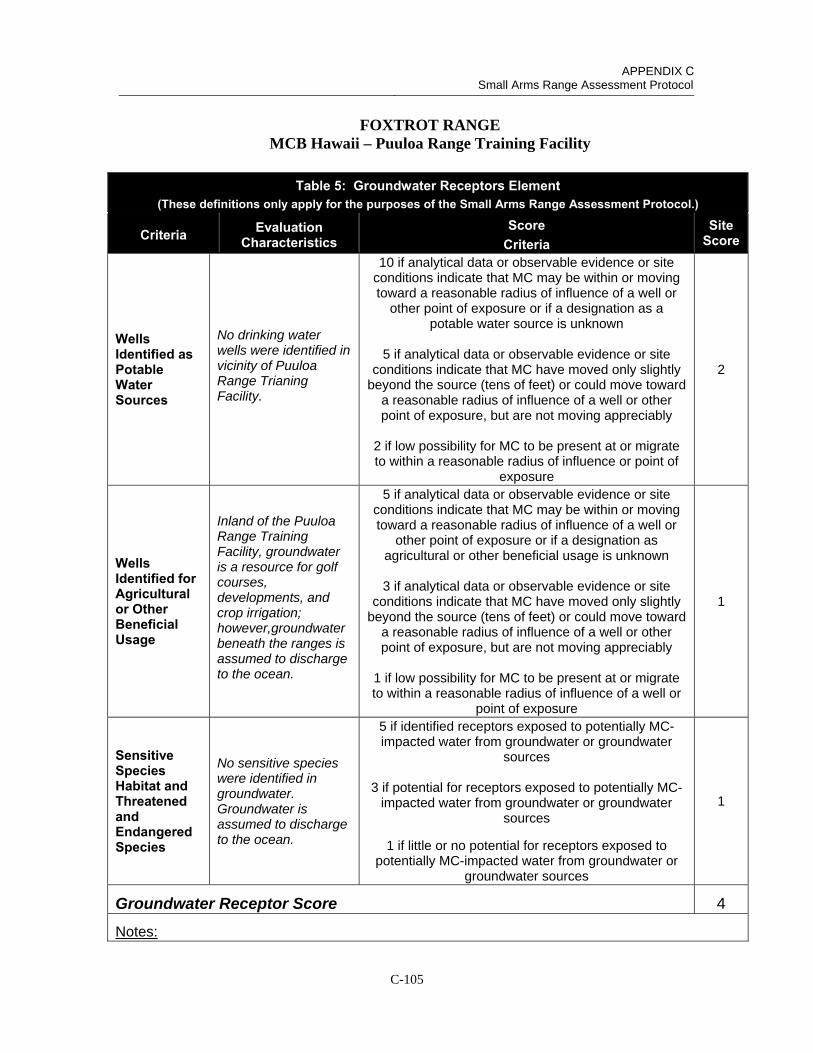
APPENDIX C Small Arms Range Assessment Protocol
C-105
FOXTROT RANGE MCB Hawaii – Puuloa Range Training Facility
Table 5: Groundwater Receptors Element (These definitions only apply for the purposes of the Small Arms Range Assessment Protocol.)
Criteria Evaluation Characteristics
Score Criteria
Site Score
Wells Identified as Potable Water Sources
No drinking water wells were identified in vicinity of Puuloa Range Trianing Facility.
10 if analytical data or observable evidence or site conditions indicate that MC may be within or moving toward a reasonable radius of influence of a well or
other point of exposure or if a designation as a potable water source is unknown
5 if analytical data or observable evidence or site conditions indicate that MC have moved only slightly
beyond the source (tens of feet) or could move toward a reasonable radius of influence of a well or other point of exposure, but are not moving appreciably
2 if low possibility for MC to be present at or migrate to within a reasonable radius of influence or point of
exposure
2
Wells Identified for Agricultural or Other Beneficial Usage
Inland of the Puuloa Range Training Facility, groundwater is a resource for golf courses, developments, and crop irrigation; however,groundwater beneath the ranges is assumed to discharge to the ocean.
5 if analytical data or observable evidence or site conditions indicate that MC may be within or moving toward a reasonable radius of influence of a well or
other point of exposure or if a designation as agricultural or other beneficial usage is unknown
3 if analytical data or observable evidence or site conditions indicate that MC have moved only slightly
beyond the source (tens of feet) or could move toward a reasonable radius of influence of a well or other point of exposure, but are not moving appreciably
1 if low possibility for MC to be present at or migrate to within a reasonable radius of influence of a well or
point of exposure
1
Sensitive Species Habitat and Threatened and Endangered Species
No sensitive species were identified in groundwater. Groundwater is assumed to discharge to the ocean.
5 if identified receptors exposed to potentially MC-impacted water from groundwater or groundwater
sources
3 if potential for receptors exposed to potentially MC-impacted water from groundwater or groundwater
sources
1 if little or no potential for receptors exposed to potentially MC-impacted water from groundwater or
groundwater sources
1
Groundwater Receptor Score 4
Notes:
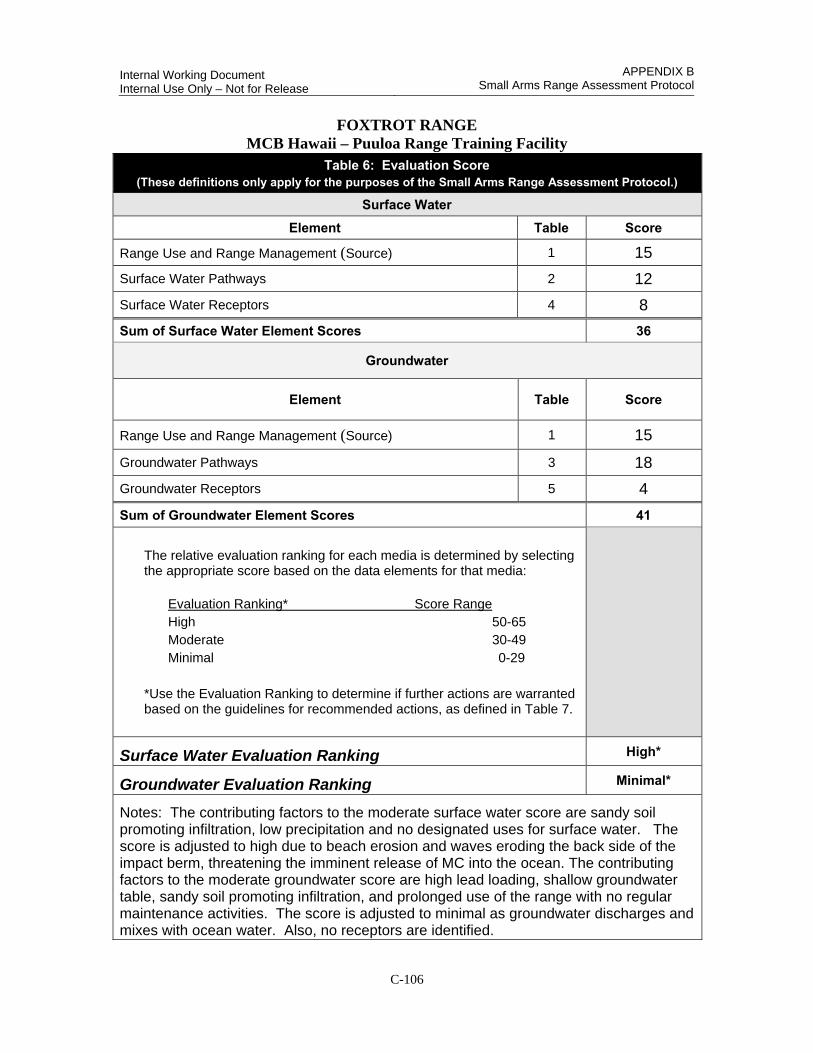
Internal Working Document Internal Use Only – Not for Release
APPENDIX B Small Arms Range Assessment Protocol
C-106
FOXTROT RANGE MCB Hawaii – Puuloa Range Training Facility
Table 6: Evaluation Score (These definitions only apply for the purposes of the Small Arms Range Assessment Protocol.)
Surface Water Element Table Score
Range Use and Range Management (Source) 1 15
Surface Water Pathways 2 12
Surface Water Receptors 4 8
Sum of Surface Water Element Scores 36
Groundwater
Element Table Score
Range Use and Range Management (Source) 1 15
Groundwater Pathways 3 18
Groundwater Receptors 5 4
Sum of Groundwater Element Scores 41
The relative evaluation ranking for each media is determined by selecting the appropriate score based on the data elements for that media:
Evaluation Ranking* Score Range High 50-65 Moderate 30-49 Minimal 0-29
*Use the Evaluation Ranking to determine if further actions are warrantedbased on the guidelines for recommended actions, as defined in Table 7.
Surface Water Evaluation Ranking High*
Groundwater Evaluation Ranking Minimal*
Notes: The contributing factors to the moderate surface water score are sandy soil promoting infiltration, low precipitation and no designated uses for surface water. The score is adjusted to high due to beach erosion and waves eroding the back side of the impact berm, threatening the imminent release of MC into the ocean. The contributing factors to the moderate groundwater score are high lead loading, shallow groundwater table, sandy soil promoting infiltration, and prolonged use of the range with no regular maintenance activities. The score is adjusted to minimal as groundwater discharges and mixes with ocean water. Also, no receptors are identified.
APPENDIX C Small Arms Range Assessment Protocol
C-107
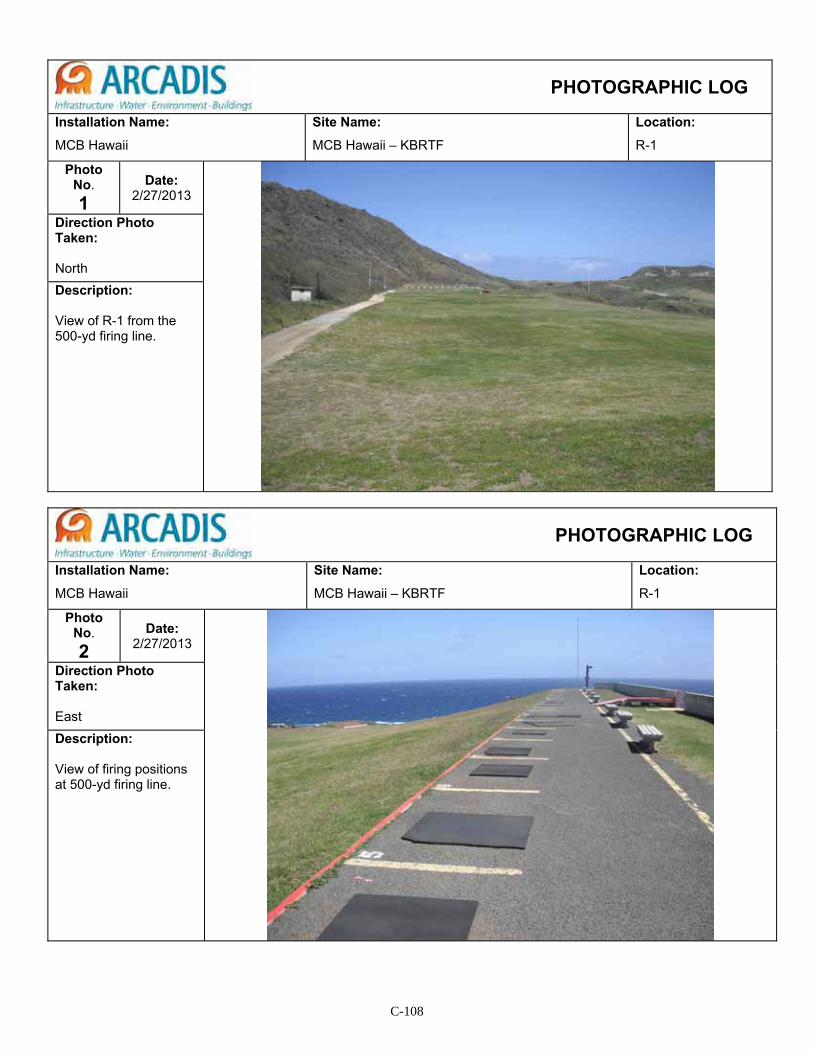
C-108
PHOTOGRAPHIC LOG
Installation Name: MCB Hawaii
Site Name: MCB Hawaii – KBRTF
Location: R-1
Photo No. 1
Date: 2/27/2013
Direction Photo Taken:
North Description:
View of R-1 from the 500-yd firing line.
PHOTOGRAPHIC LOG
Installation Name: MCB Hawaii
Site Name: MCB Hawaii – KBRTF
Location: R-1
Photo No. 2
Date: 2/27/2013
Direction Photo Taken:
East Description:
View of firing positions at 500-yd firing line.
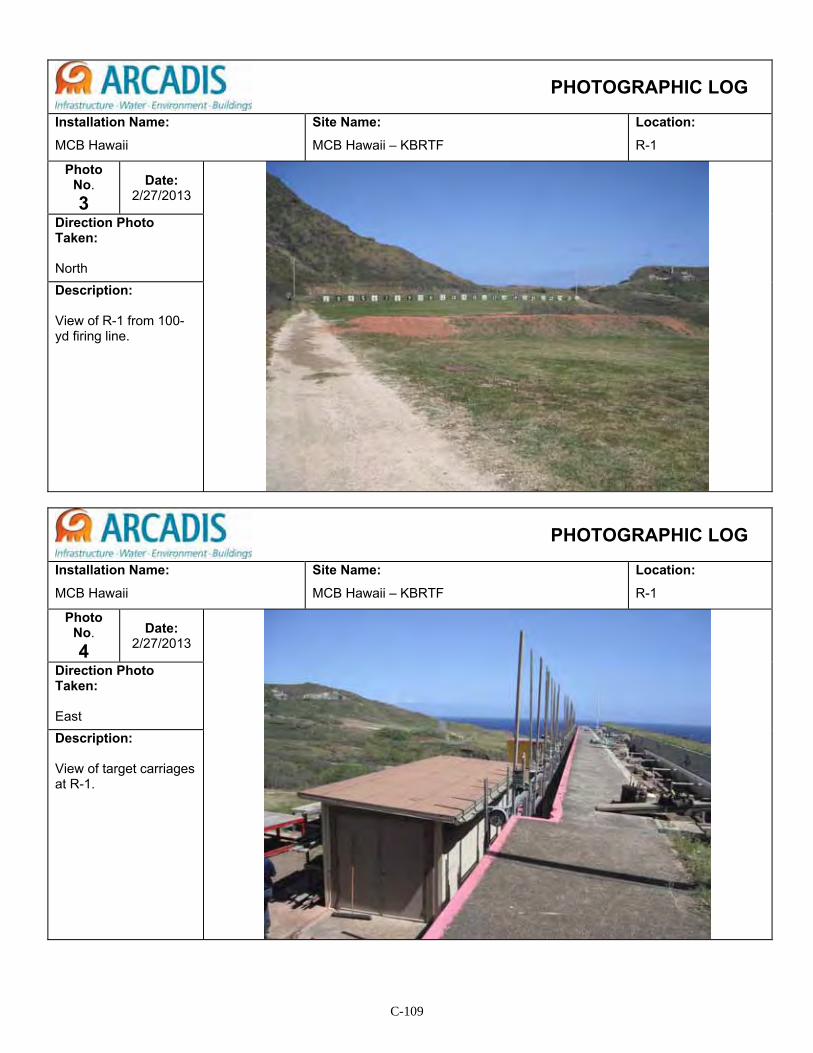
C-109
PHOTOGRAPHIC LOG
Installation Name: MCB Hawaii
Site Name: MCB Hawaii – KBRTF
Location: R-1
Photo No. 3
Date: 2/27/2013
Direction Photo Taken: North Description: View of R-1 from 100-yd firing line.
PHOTOGRAPHIC LOG
Installation Name: MCB Hawaii
Site Name: MCB Hawaii – KBRTF
Location: R-1
Photo No. 4
Date: 2/27/2013
Direction Photo Taken: East Description: View of target carriages at R-1.
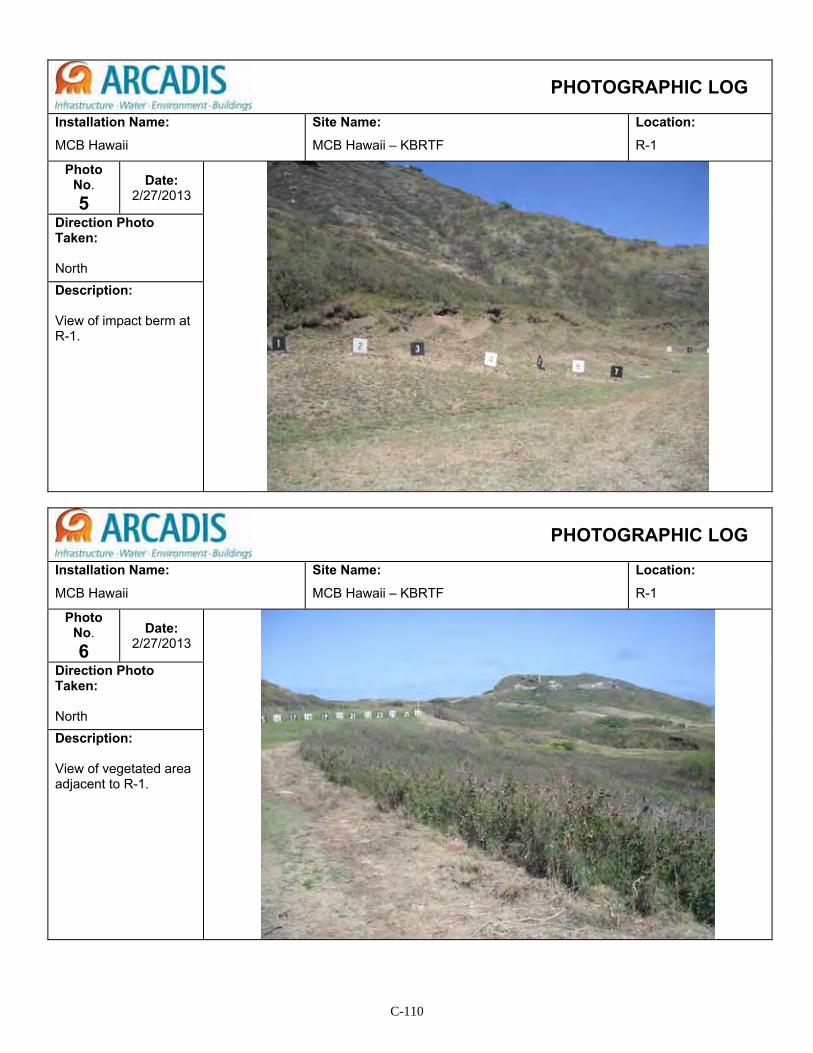
C-110
PHOTOGRAPHIC LOG
Installation Name: MCB Hawaii
Site Name: MCB Hawaii – KBRTF
Location: R-1
Photo No. 5
Date: 2/27/2013
Direction Photo Taken:
North Description:
View of impact berm at R-1.
PHOTOGRAPHIC LOG
Installation Name: MCB Hawaii
Site Name: MCB Hawaii – KBRTF
Location: R-1
Photo No. 6
Date: 2/27/2013
Direction Photo Taken:
North Description:
View of vegetated area adjacent to R-1.
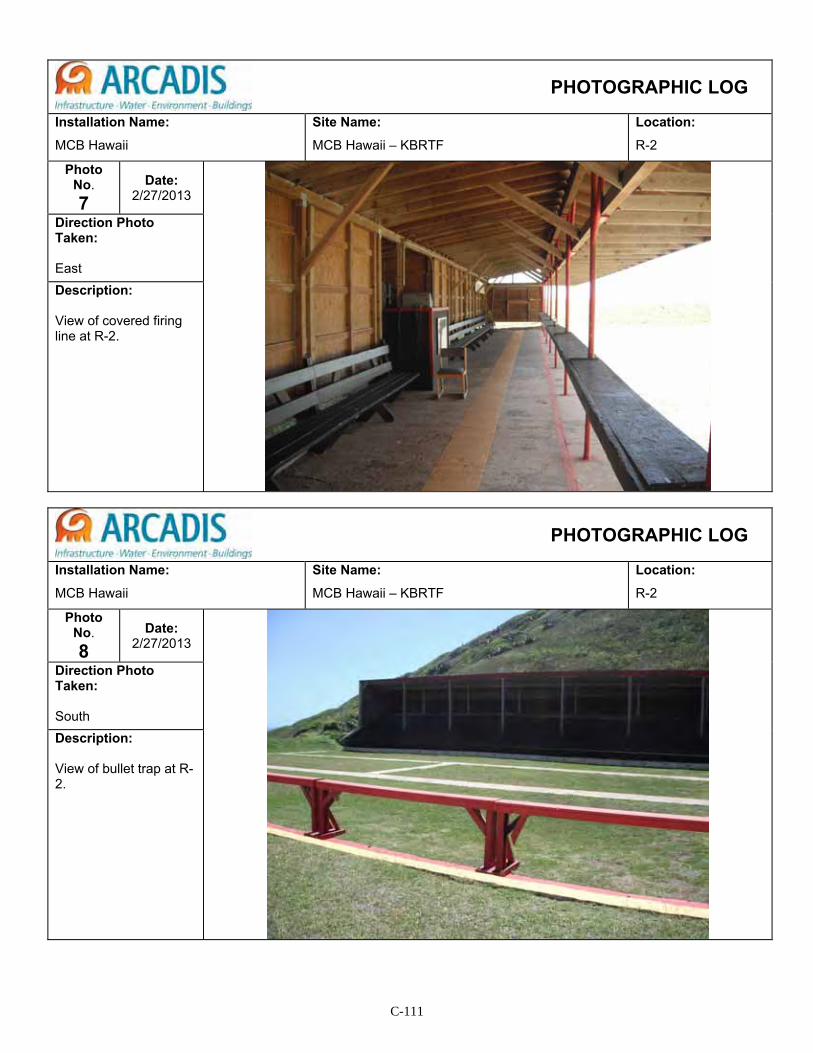
C-111
PHOTOGRAPHIC LOG
Installation Name: MCB Hawaii
Site Name: MCB Hawaii – KBRTF
Location: R-2
Photo No. 7
Date: 2/27/2013
Direction Photo Taken:
East Description:
View of covered firing line at R-2.
PHOTOGRAPHIC LOG
Installation Name: MCB Hawaii
Site Name: MCB Hawaii – KBRTF
Location: R-2
Photo No. 8
Date: 2/27/2013
Direction Photo Taken:
South Description:
View of bullet trap at R-2.
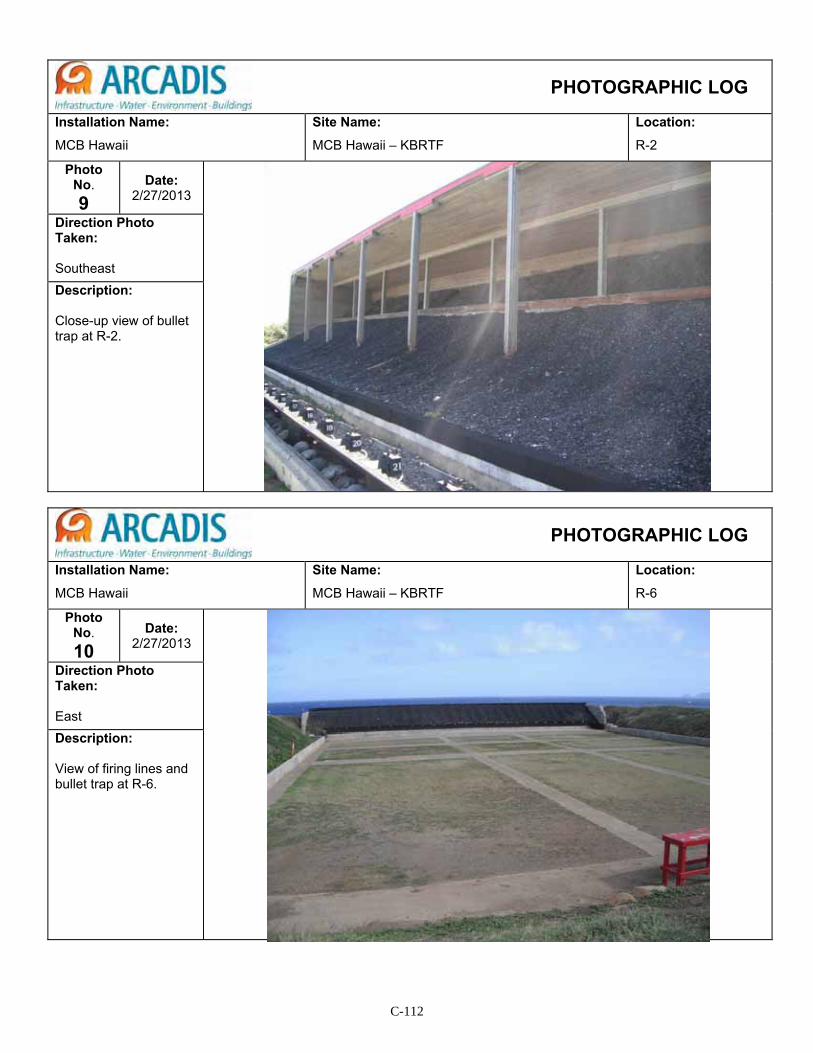
C-112
PHOTOGRAPHIC LOG
Installation Name: MCB Hawaii
Site Name: MCB Hawaii – KBRTF
Location: R-2
Photo No. 9
Date: 2/27/2013
Direction Photo Taken:
Southeast Description:
Close-up view of bullet trap at R-2.
PHOTOGRAPHIC LOG
Installation Name: MCB Hawaii
Site Name: MCB Hawaii – KBRTF
Location: R-6
Photo No. 10
Date: 2/27/2013
Direction Photo Taken:
East Description:
View of firing lines and bullet trap at R-6.
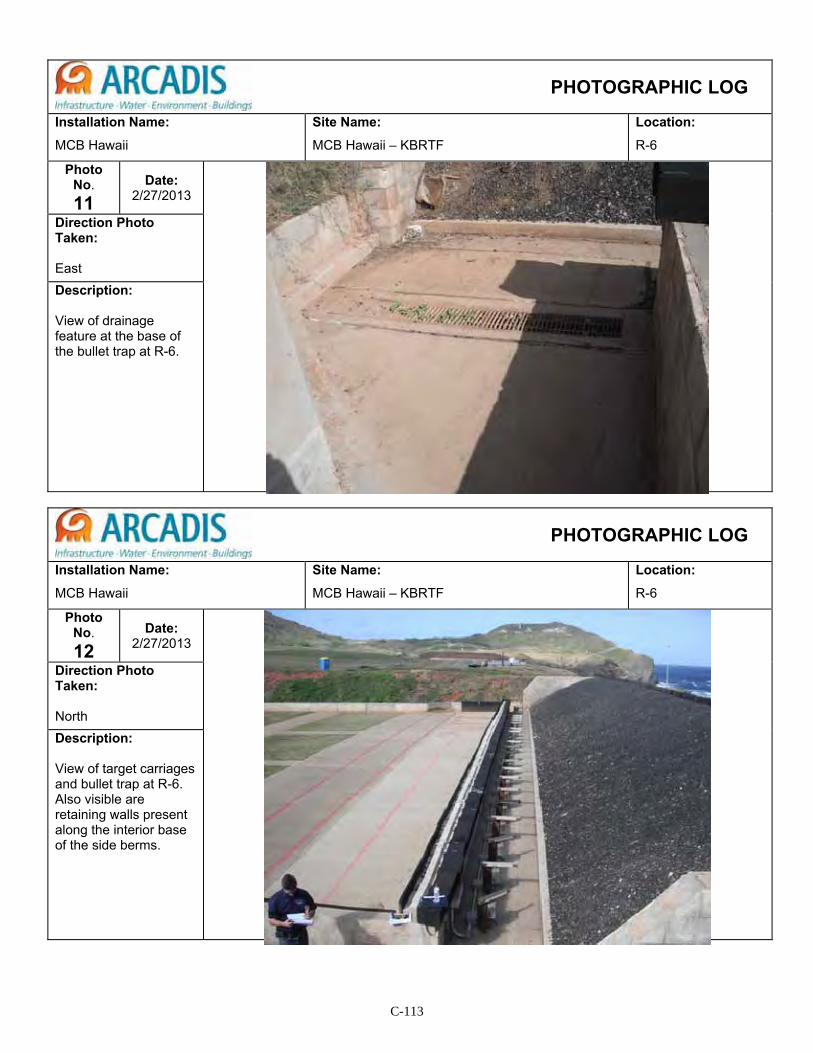
C-113
PHOTOGRAPHIC LOG
Installation Name: MCB Hawaii
Site Name: MCB Hawaii – KBRTF
Location: R-6
Photo No. 11
Date: 2/27/2013
Direction Photo Taken: East Description: View of drainage feature at the base of the bullet trap at R-6.
PHOTOGRAPHIC LOG
Installation Name: MCB Hawaii
Site Name: MCB Hawaii – KBRTF
Location: R-6
Photo No. 12
Date: 2/27/2013
Direction Photo Taken: North Description: View of target carriages and bullet trap at R-6. Also visible are retaining walls present along the interior base of the side berms.
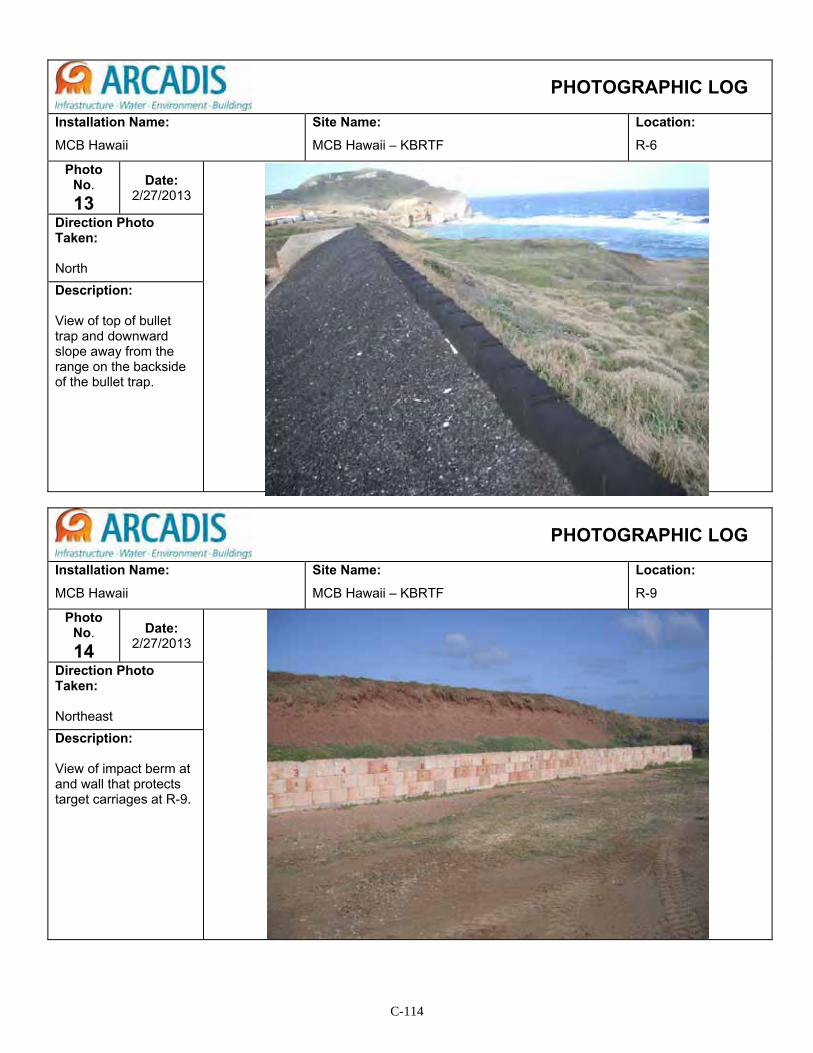
C-114
PHOTOGRAPHIC LOG
Installation Name: MCB Hawaii
Site Name: MCB Hawaii – KBRTF
Location: R-6
Photo No. 13
Date: 2/27/2013
Direction Photo Taken: North Description: View of top of bullet trap and downward slope away from the range on the backside of the bullet trap.
PHOTOGRAPHIC LOG
Installation Name: MCB Hawaii
Site Name: MCB Hawaii – KBRTF
Location: R-9
Photo No. 14
Date: 2/27/2013
Direction Photo Taken: Northeast Description: View of impact berm at and wall that protects target carriages at R-9.
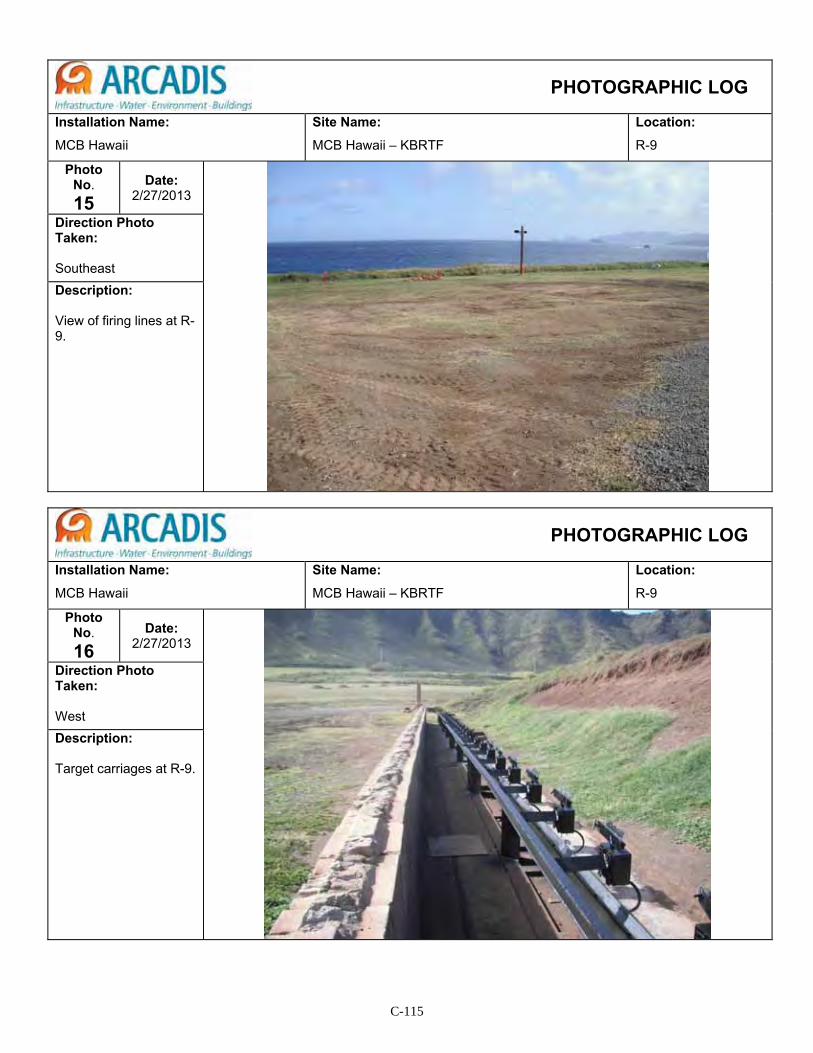
C-115
PHOTOGRAPHIC LOG
Installation Name: MCB Hawaii
Site Name: MCB Hawaii – KBRTF
Location: R-9
Photo No. 15
Date: 2/27/2013
Direction Photo Taken: Southeast Description: View of firing lines at R-9.
PHOTOGRAPHIC LOG
Installation Name: MCB Hawaii
Site Name: MCB Hawaii – KBRTF
Location: R-9
Photo No. 16
Date: 2/27/2013
Direction Photo Taken: West Description: Target carriages at R-9.
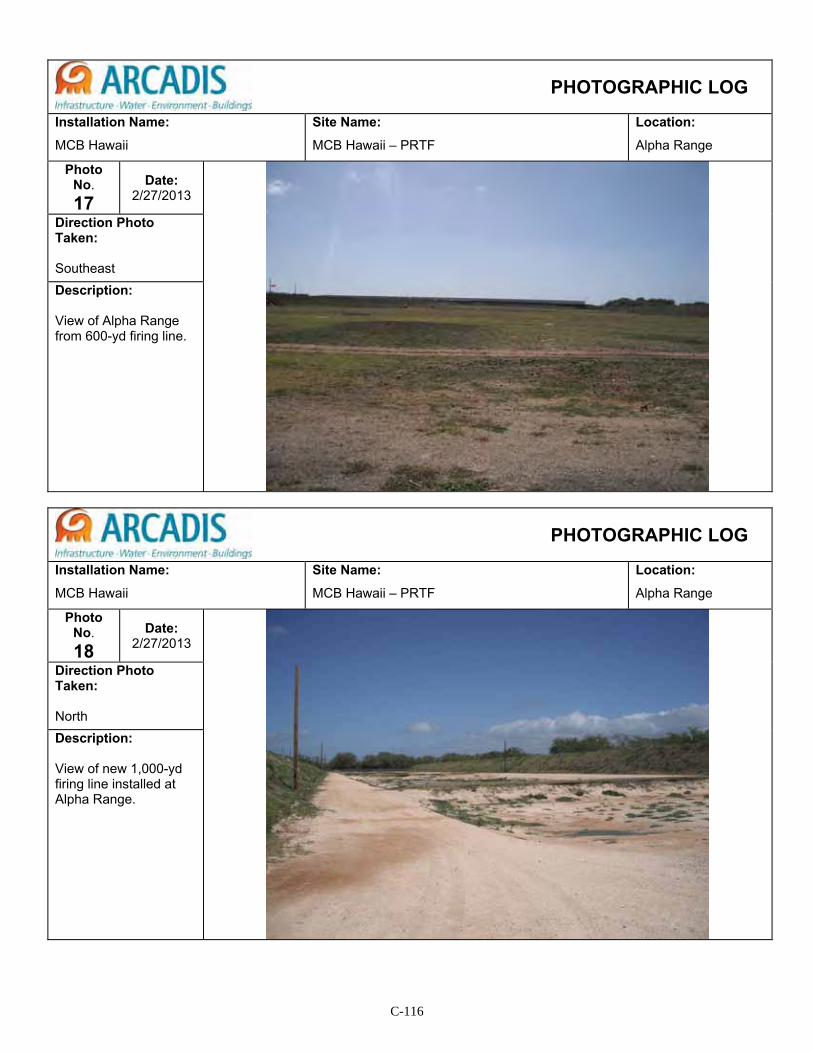
C-116
PHOTOGRAPHIC LOG
Installation Name: MCB Hawaii
Site Name: MCB Hawaii – PRTF
Location: Alpha Range
Photo No. 17
Date: 2/27/2013
Direction Photo Taken:
Southeast Description:
View of Alpha Range from 600-yd firing line.
PHOTOGRAPHIC LOG
Installation Name: MCB Hawaii
Site Name: MCB Hawaii – PRTF
Location: Alpha Range
Photo No. 18
Date: 2/27/2013
Direction Photo Taken:
North Description:
View of new 1,000-yd firing line installed at Alpha Range.
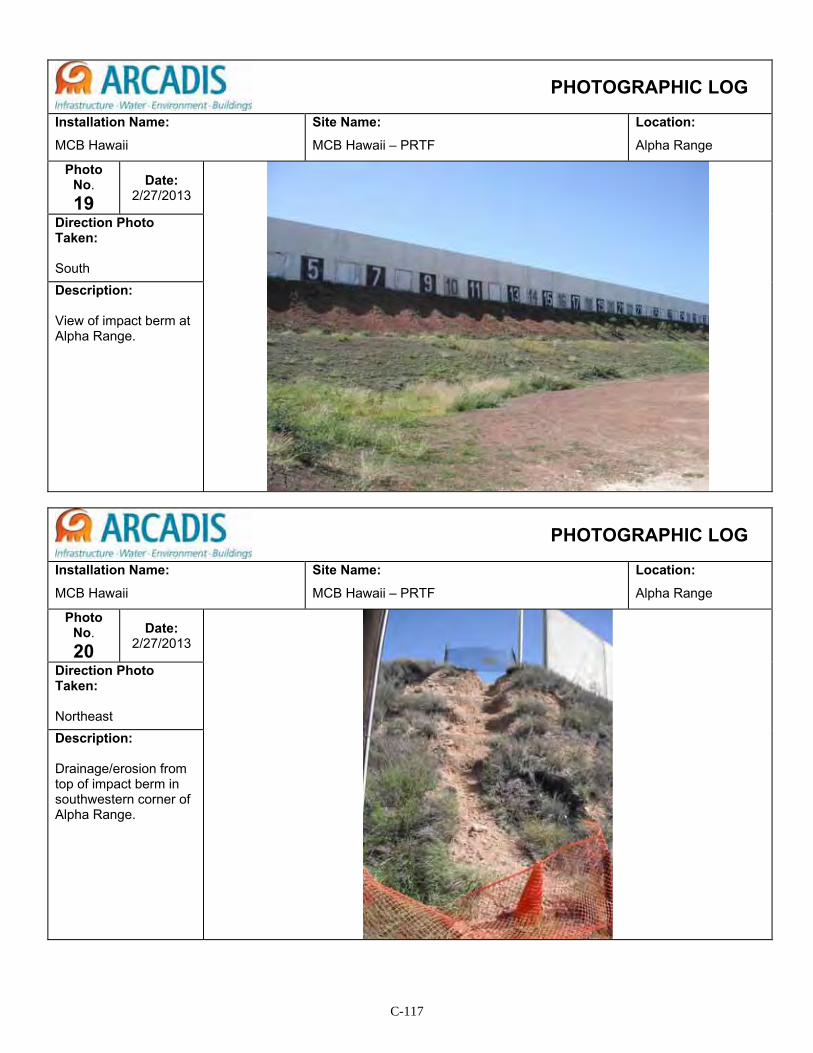
C-117
PHOTOGRAPHIC LOG
Installation Name: MCB Hawaii
Site Name: MCB Hawaii – PRTF
Location: Alpha Range
Photo No. 19
Date: 2/27/2013
Direction Photo Taken:
South Description:
View of impact berm at Alpha Range.
PHOTOGRAPHIC LOG
Installation Name: MCB Hawaii
Site Name: MCB Hawaii – PRTF
Location: Alpha Range
Photo No. 20
Date: 2/27/2013
Direction Photo Taken:
Northeast Description:
Drainage/erosion from top of impact berm in southwestern corner of Alpha Range.
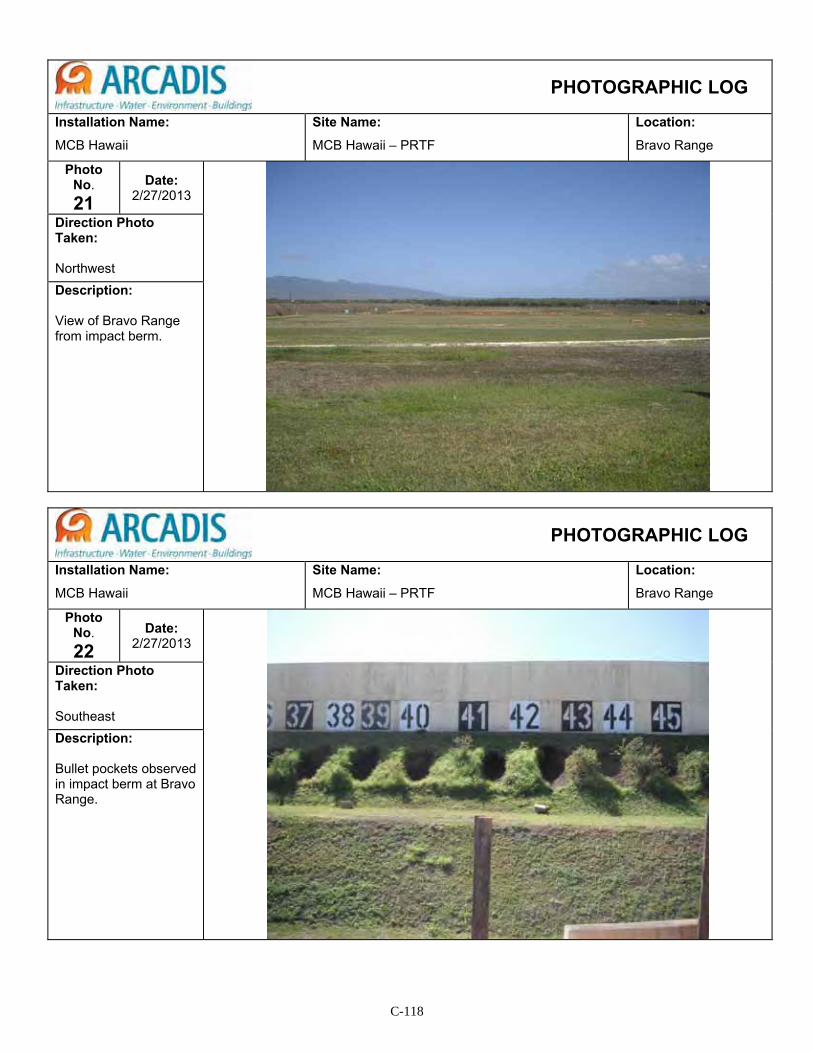
C-118
PHOTOGRAPHIC LOG
Installation Name: MCB Hawaii
Site Name: MCB Hawaii – PRTF
Location: Bravo Range
Photo No. 21
Date: 2/27/2013
Direction Photo Taken:
Northwest Description:
View of Bravo Range from impact berm.
PHOTOGRAPHIC LOG
Installation Name: MCB Hawaii
Site Name: MCB Hawaii – PRTF
Location: Bravo Range
Photo No. 22
Date: 2/27/2013
Direction Photo Taken:
Southeast Description:
Bullet pockets observed in impact berm at Bravo Range.
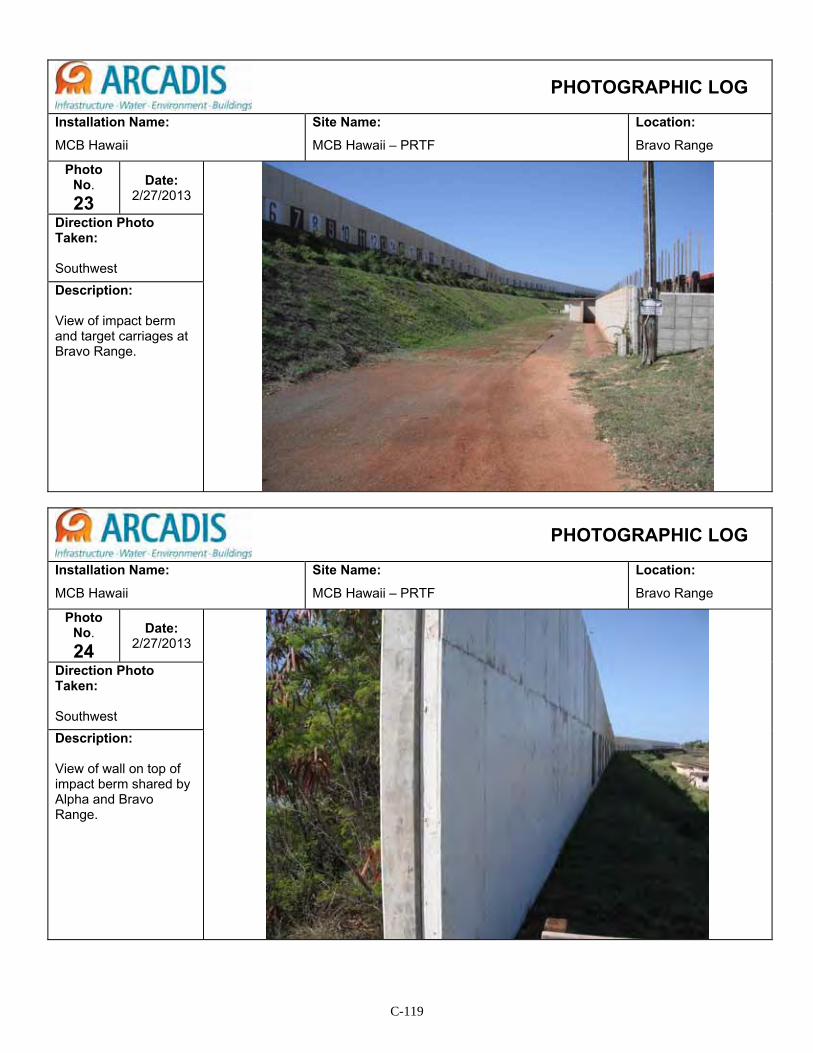
C-119
PHOTOGRAPHIC LOG
Installation Name: MCB Hawaii
Site Name: MCB Hawaii – PRTF
Location: Bravo Range
Photo No. 23
Date: 2/27/2013
Direction Photo Taken: Southwest Description: View of impact berm and target carriages at Bravo Range.
PHOTOGRAPHIC LOG
Installation Name: MCB Hawaii
Site Name: MCB Hawaii – PRTF
Location: Bravo Range
Photo No. 24
Date: 2/27/2013
Direction Photo Taken: Southwest Description: View of wall on top of impact berm shared by Alpha and Bravo Range.
C-120
PHOTOGRAPHIC LOG
Installation Name: MCB Hawaii
Site Name: MCB Hawaii – PRTF
Location: Bravo Range
Photo No. 25
Date: 2/27/2013
Direction Photo Taken: Description: Protective SACON block in front of sprinkler system on impact berm of Bravo Range.
PHOTOGRAPHIC LOG
Installation Name: MCB Hawaii
Site Name: MCB Hawaii – PRTF
Location: Charlie Range
Photo No. 26
Date: 2/27/2013
Direction Photo Taken: South Description: View of Charlie Range.
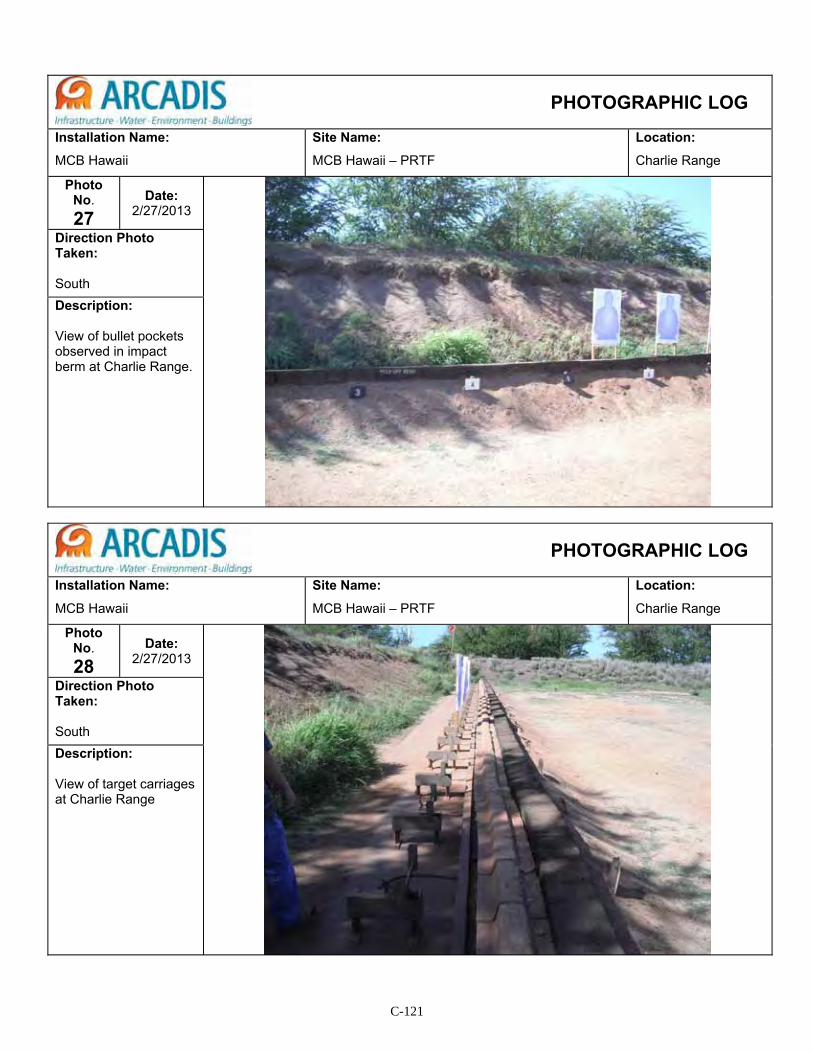
C-121
PHOTOGRAPHIC LOG
Installation Name: MCB Hawaii
Site Name: MCB Hawaii – PRTF
Location: Charlie Range
Photo No. 27
Date: 2/27/2013
Direction Photo Taken: South Description: View of bullet pockets observed in impact berm at Charlie Range.
PHOTOGRAPHIC LOG
Installation Name: MCB Hawaii
Site Name: MCB Hawaii – PRTF
Location: Charlie Range
Photo No. 28
Date: 2/27/2013
Direction Photo Taken: South Description: View of target carriages at Charlie Range
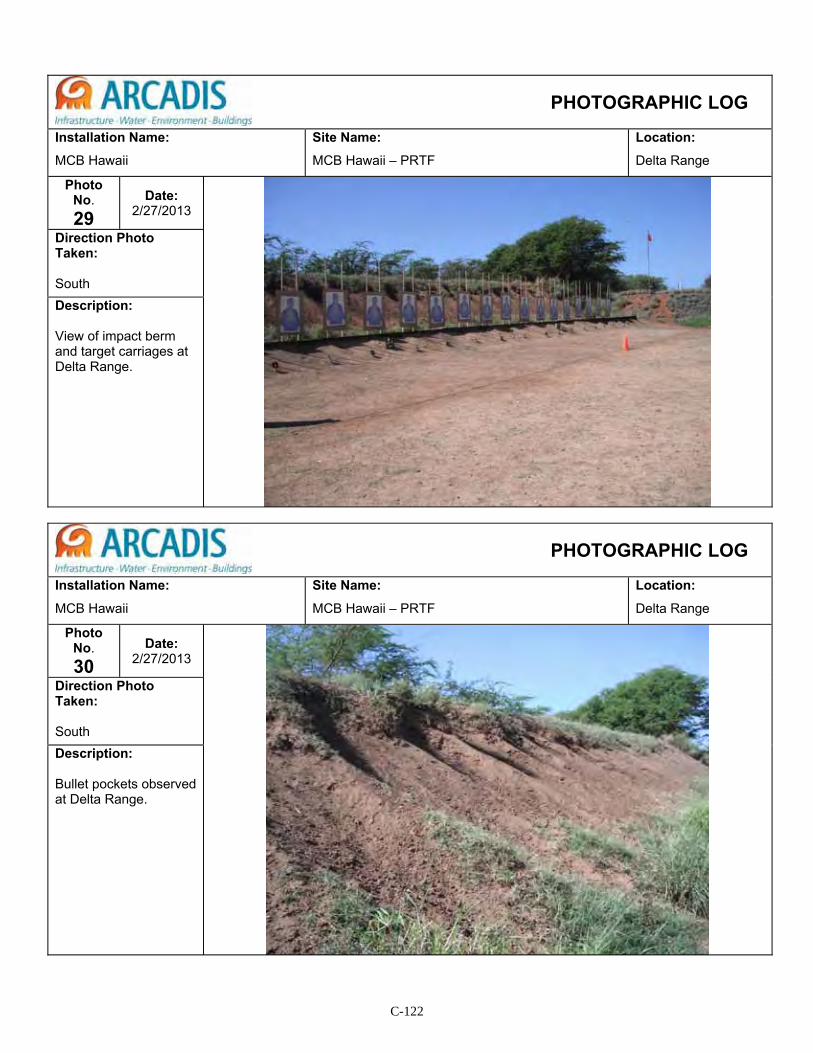
C-122
PHOTOGRAPHIC LOG
Installation Name: MCB Hawaii
Site Name: MCB Hawaii – PRTF
Location: Delta Range
Photo No. 29
Date: 2/27/2013
Direction Photo Taken: South Description: View of impact berm and target carriages at Delta Range.
PHOTOGRAPHIC LOG
Installation Name: MCB Hawaii
Site Name: MCB Hawaii – PRTF
Location: Delta Range
Photo No. 30
Date: 2/27/2013
Direction Photo Taken: South Description: Bullet pockets observed at Delta Range.
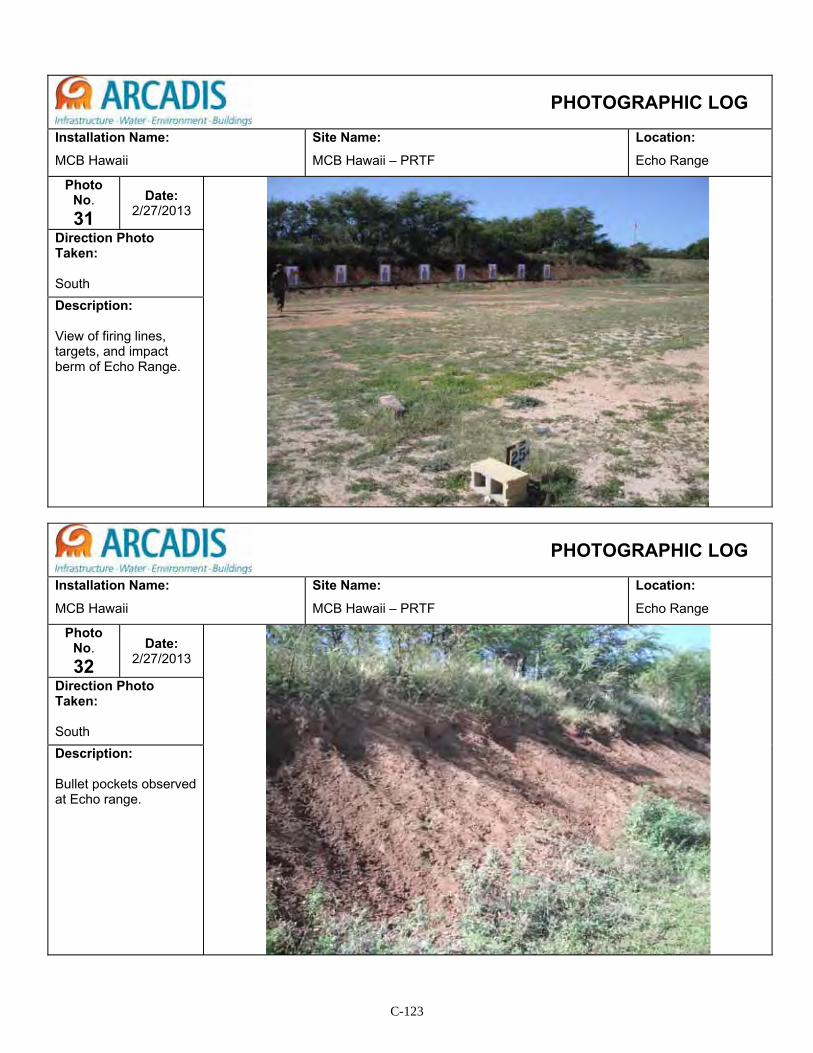
C-123
PHOTOGRAPHIC LOG
Installation Name: MCB Hawaii
Site Name: MCB Hawaii – PRTF
Location: Echo Range
Photo No. 31
Date: 2/27/2013
Direction Photo Taken: South Description: View of firing lines, targets, and impact berm of Echo Range.
PHOTOGRAPHIC LOG
Installation Name: MCB Hawaii
Site Name: MCB Hawaii – PRTF
Location: Echo Range
Photo No. 32
Date: 2/27/2013
Direction Photo Taken: South Description: Bullet pockets observed at Echo range.
C-124
PHOTOGRAPHIC LOG
Installation Name: MCB Hawaii
Site Name: MCB Hawaii – PRTF
Location: Foxtrot Range
Photo No. 33
Date: 2/27/2013
Direction Photo Taken: West Description: View of firing lines and target carriages at Foxtrot Range.
PHOTOGRAPHIC LOG
Installation Name: MCB Hawaii
Site Name: MCB Hawaii – PRTF
Location: Foxtrot Range
Photo No. 34
Date: 2/27/2013
Direction Photo Taken: Southwest Description: Bullet pockets observed in impact berm at Foxtrot Range.
C-125
PHOTOGRAPHIC LOG
Installation Name: MCB Hawaii
Site Name: MCB Hawaii – PRTF
Location: Foxtrot Range
Photo No. 35
Date: 2/27/2013
Direction Photo Taken: Southwest Description: View of backside of Foxtrot Range that is eroding into the Pacific Ocean.