Embed Size (px)
Citation preview

Final Report Phase Two of Florida Cap‐and‐Trade Project: Economic Analysis
Center for Economic Forecasting and Analysis, the Florida State University Energy Studies, Public Utility Research Center, the University of Florida October 31, 2010
Phase Two of Florida C&T Project: Economic Analysis
ii
Authors Dr. Julie Harrington Director, Center for Economic Forecasting and Analysis, Florida State University, FSU Research Complex, 3200 Commonwealth Blvd. Tallahassee, Fl. 32303. Tel. (850) 644‐7357. Email: [email protected]
Ted Kury Director, Energy Studies, Public Utility Research Center, The University of Florida, Warrington College of Business Administration, 205 MAT. PO Box 117142. Gainesville, FL 32611‐7142. Tel. (352) 392‐7842. Email: [email protected]
Zafar Siddiqui Research Assistant, Center for Economic Forecasting and Analysis, Florida State University, FSU Research Complex, 3200 Commonwealth Blvd. Tallahassee, Fl. 32303. Tel. (850) 645‐0192. Email: [email protected]
Dr. Bassam Awad Research Associate , Center for Economic Forecasting and Analysis, Florida State University, FSU Research Complex, 3200 Commonwealth Blvd. Tallahassee, Fl. 32303. Email: [email protected]
Stephen Muscarella Research Assistant, Center for Economic Forecasting and Analysis, Florida State University, FSU Research Complex, 3200 Commonwealth Blvd. Tallahassee, Fl. 32303. Tel. (850) 645‐0191. Email: [email protected]

Phase Two of Florida C&T Project: Economic Analysis
iii
Acknowledgements
The Florida State University Office Center of Economic Forecasting and Analysis and the University of Florida Public Utility Research Center would like to express its sincere thanks to the Florida Department of Environmental Protection Air Division, and in particular, Julie Ferris, who spearheaded this project and provided a keen historical and current perspective with respect to air resources policymaking in Florida and the U.S. In addition, she brought equal amounts of grit and humor to the project as the team adjusted to the everevolving or changing policy climate during the project’s timeframe. Another key asset was Tom Rogers, of the FDEP Air Division, who was instrumental in providing innovative and technical input throughout the project. Appreciation is also extended to the project’s informational group1 formed at the project’s inception, including stakeholders from primarily the state electric utility industries, to provide guidance as to the more feasible data sources available for the project modeling team. Many thanks to CEFA graduate students Zafar Siddiqui, Dr. Bassam Awad, Stephen Muscarella, and David Glassner who brought high levels of interest, patience and computer programming, among other skillsets, to the complex system of capandtrade program economic modeling. In addition, the authors are grateful to the US EPA (Denise Mulholland and Jared Creason) , to REMI, and to Scott Beecher, of the Florida Reliability Coordinating Council (FRCC) for providing clarification on power generation planning relating to Florida.
1 Data Informational Group members included: Anne Smith, Bob Kappelmann, Charles Rossman, Joshua Ellwein, George Cavros, Gretchen Greene, Jennifer Fisher, Jim Dean, Joseph Miakisz, Mike Kennedy, M. Lee, Roger Lewis, and FDEP and FSEC team members.

Phase Two of Florida C&T Project: Economic Analysis
iv
Executive Summary This report represents the second phase of economic analysis done in support of the Florida Department of Environmental Protection’s (FDEP) efforts to address the provisions of Section 403.44, F.S., to consider developing a state cap‐and‐trade(C&T) rule.. The objective of the Phase Two project involves data compilation and analysis of the potential C&T program design options representing a first step in developing the modeling framework or methodology to gage potential impacts of carbon regulation on the state economy. The analysis highlights the major economic drivers and ways of considering the relationships between key variables. Additional and ongoing efforts will be needed to fine‐tune projections and consideration of specific policy options. An economic Dispatch model including all the electric generating units in the state2, was designed and built by the project team, to examine the minimal costs required in order to provide the amount of electricity demanded by end‐users in each hour. The costs to produce this electricity were driven by the type of generating unit, its operating efficiency, the variable costs required to operate and maintain the unit, and the price of its fuel. The project team then analyzed the effects that various emissions prices (and their concurrent emissions levels) have on Florida’s level of carbon dioxide emissions and the amounts of fuel consumed for electric generation, over time, to year 2030. The findings reveal that at relatively low emissions prices, emissions levels decrease, but that coal usage actually increases as fuel sources such as petroleum coke and fuel oil are displaced. Once this initial reduction has been achieved, further increases in carbon prices may do little to decrease emissions until a “critical point” is reached. The Dispatch model results showed that at $45/MT, a critical point occurred where coal was displaced by natural gas. Typically, coal is much cheaper than natural gas, so the additional cost due to emissions has to reach a sufficient level for natural gas generation to begin to displace coal. Another “critical point” was reached at $90/MT, where natural gas was displaced by other clean fuel sources. In this case, the critical point for the switch to other fuel sources occurred from years 2025 – 2030, where natural gas was displaced by clean fuel sources; comprising renewable, or biomass, and advanced nuclear.
In order to obtain estimates of the different types of macroeconomic effects of the carbon cap and carbon cap scenarios on the Florida economy, the project team applied a well‐established analytical tool known as the REMI model. Regional Economic Models, Inc., (REMI PI+ v1.1.6) 2009 is a widely used dynamic (multiple time period, up to year 2050) integrated input‐output and econometric model. The REMI modeling team developed a series of assumptions for modeling, and for comparisons to be made between the “business as usual”, or BAU, and “with a cap‐and‐trade program”, cases. The input data used for the REMI model was solely based on the Dispatch model output data for both the base cap‐and‐trade analysis, in addition to the scenario analyses. The scenario analyses included: low, base, and high fuel costs, five percent load reduction and/or load increase, allowance price(s), coal, among others. In addition, the modeling team examined energy efficiency analyses, based on current policy bill analyses, such as Waxman‐Markey. 2 Dispatch data for Version 1.10 included 525 generating units; 32 were outside the state, in Georgia and Alabama.

Phase Two of Florida C&T Project: Economic Analysis
v
The economic impact results, based on the Dispatch model inputs, for the comparison between the BAU or base, and cap‐and‐trade program, reveal that with current conditions, the impacts on the Florida economy will be negative, on GDP, Income and Jobs, for years 2017 ‐ 2030. Decline in GDP peaks in 2024 at $3.23 billion and then begins to recover. The impact on disposable personal income peaks to a decline of $3.27 billion by 2024. It should be noted that the analyses did not reallocate or redistribute the potential revenues generated from the allowances to other areas; such as government spending or energy efficiency programs.
The Dispatch model estimated the individual generating units associated costs of a cap‐and‐trade program, and the REMI model reported the economic impacts pertaining to the Florida economy as a result of a state cap‐and‐trade program. The results of the study can be summarized as follows: The Dispatch model results showed that at $45/MT, a critical point occurred where coal
was displaced by natural gas. Another “critical point” was reached at $90/MT, where natural gas was displaced by other clean fuel sources. In this case, the critical point for the switch to other fuel sources occurred from years 2025 – 2030, where natural gas was displaced by clean fuel sources; comprising renewable, or biomass.
The implementation of a Florida‐specific cap‐and‐trade program based on current FRCC Load and Resource Plan Dispatch model results for individual power generating units, will currently have negative economic impacts to the Florida economy, in terms of GDP, income and jobs. The scenario, or sensitivity, analysis performed across the project timeline of years 2011‐2030, yielded the following results: Fuel prices (low, base and high), the 5% load increase, and the use of coal without
carbon capture and storage show negative economic impacts throughout the entire time period.
The $21 allowance price showed mixed results; with negative economic impacts to year 2017, and then positive impacts to year 2030.
With the launch of a cap‐in‐trade program in Florida, it is notable that scenarios assuming increased energy efficiency and a 5% load reduction yield positive economic impact results for the Florida economy to year 2030. .
Possible Next Steps
To continue to identify key relationships and highlight Florida‐specific strengths and vulnerabilities should a national policy be enacted.
To continue to analyze and fine‐tune the methodology regarding optimal energy mix at the most cost effective utility generation mix for ratepayers, while still meeting projected carbon reduction objectives.
Determine what percentage of renewable energy mix is cost effective over time, and feasible, through biomass, and other options.
Continue to build assumptions in the modeling methodology that include expectations of technological improvements, and corresponding cost reductions over time, among other assumptions.

Phase Two of Florida C&T Project: Economic Analysis
vi
Table of Contents AUTHORS ................................................................................................................................ II
ACKNOWLEDGEMENTS ........................................................................................................... III
EXECUTIVE SUMMARY ............................................................................................................ IV
TABLE OF CONTENTS .............................................................................................................. VI
LIST OF TABLES ...................................................................................................................... VII
LIST OF FIGURES .................................................................................................................... VII
INTRODUCTION ....................................................................................................................... 1 Background ......................................................................................................................................................................................................... 1 Phase One Report Conclusions ................................................................................................................................................................... 2 PHASE TWO ECONOMIC ANALYSIS FRAMEWORK .................................................................... 3 Characteristics of Emission Caps ............................................................................................................................................................... 5 Model of Economic Dispatch ....................................................................................................................................................................... 6 Data Sources ....................................................................................................................................................................................................... 7 Model Operation ............................................................................................................................................................................................... 8 Model Output ..................................................................................................................................................................................................... 8 The Model's Conclusions ............................................................................................................................................................................. 12 LINKAGES BETWEEN ECONOMIC DISPATCH AND REMI .......................................................... 14 The REMI Model Methodology ................................................................................................................................................................. 14 Data Compatibility of the Dispatch Model and the REMI Model ................................................................................................ 14 Variable Description on Dispatch ............................................................................................................................................................ 15 Initial Input Data for Economic Dispatch Model ............................................................................................................................... 15 Fuel Mix Generated by Dispatch with Different Carbon Prices .................................................................................................. 18 Policy Scenarios .............................................................................................................................................................................................. 21 Scenario Description as Modeled in the Dispatch Model .............................................................................................................. 21 DISPATCH MODEL AND REMI MODEL SIMULATION RESULTS ................................................ 26 Dispatch Model Results for the BAU Scenario .................................................................................................................................... 26 The Dispatch Model Results of a Cap‐and‐Trade Program (BAU with Caps) ........................................................................ 32
The Dispatch Model Results Comparison between BAU and a Cap‐and‐Trade Program (Caps minus BAU)............. 33 Policy Scenarios using REMI Comparison ............................................................................................................................................... 41 Low and High Fuel Cost Projections Scenario ....................................................................................................................................... 42 5% Load Reduction and 5% Increase Scenario .................................................................................................................................... 49 Allowance Price of $21 Scenario ................................................................................................................................................................. 57 Energy Efficiency Scenario(s) ...................................................................................................................................................................... 61 Coal Scenario Without Carbon Capture and Storage .......................................................................................................................... 69
Economic Impact Results in REMI (from Years 2011 to 2030) .................................................................................................. 73 FINAL CONCLUSIONS ............................................................................................................. 74
LITERATURE REVIEW .............................................................................................................. 80 Consequences of Alternative U.S. C&T Policies: Controlling Both Emissions and Costs: The Brooking’s Report . 80
Policy Scenarios.................................................................................................................................................................................................. 80 Modeling Approach ........................................................................................................................................................................................... 81 Reference Scenario (BAU): ............................................................................................................................................................................ 82 Results .................................................................................................................................................................................................................... 83 Alternative Scenarios ....................................................................................................................................................................................... 90 Conclusions .......................................................................................................................................................................................................... 90
Energy Technology Perspective‐2008................................................................................................................................................... 90 MIT Assessment of U.S. C&T Proposals ................................................................................................................................................. 93 Addressing Climate Change with a Comprehensive U.S. C&T System, the KSG Report .................................................... 95 U.S. Low Carbon Economic Tool ............................................................................................................................................................... 95 Regional Greenhouse Gas Initiative Report: ....................................................................................................................................... 96
Phase Two of Florida C&T Project: Economic Analysis
vii
REFERENCES .......................................................................................................................... 98
APPENDIX A – FLORIDA’S 2008 ENERGY BILL ‐ CLIMATE PROTECTION ACT .......................... 100 Florida Energy Bill ...................................................................................................................................................................................... 100 Florida Climate Protection Act .............................................................................................................................................................. 100 Proposed Market‐Based Emissions Abatement Program (C&T) ............................................................................................ 100 APPENDIX B. SYNOPSIS OF C&T STUDIES AND ARTICLES ...................................................... 106
Studies.................................................................................................................................................... Error! Bookmark not defined. Overview of RGGI CO2 Budget Trading Program ........................................................................................................................... 106 Regional Greenhouse Gas Initiative Executive Summary ........................................................................................................... 106
Articles ................................................................................................................................................... Error! Bookmark not defined.
List of Tables Table 1: Initial Caps to Follow in Florida .................................................................................................................................................. 4 Table 2: Caps CO2 Equivalents ....................................................................................................................................................................... 4 Table 3: Fixed and Variable Costs (Generating Unit Cost Classification) .................................................................................... 7 Table 4: Economic Dispatch Model ........................................................................................................................................................... 16 Table 5: Current Total Levelized Costs of New Generation for Different Fuel Types .......................................................... 17 Table 6: Dispatch Model Results ................................................................................................................................................................ 18 Table 7: Dispatch Model Output and REMI Model Input Match ................................................................................................... 20 Table 8: Constraints on Coal in the Dispatch Model .......................................................................................................................... 24 Table 9: Dispatch Output Data without Caps ........................................................................................................................................ 26 Table 10: Dispatch Model Output Data Projections of the Cap‐and‐Trade Program 2011‐2030 ................................... 32 Table 11: Difference in Electricity and Production Costs between BAU and Cap‐and‐Trade Program ....................... 34 Table 12: Economic Impact Summary for Years 2011 ‐ 2030 ....................................................................................................... 73 Table 14: Reduction in Discounted Consumption Due to Each Policy ....................................................................................... 85 Table 15: Effects of Each Policy on Individual Sectors in Year 2025 .......................................................................................... 88
List of Figures Figure 1: Power Generation CO2 Emissions in Florida ........................................................................................................................ 3 Figure 2: Power Generation CO2 Emissions in Florida ‐ All Other Sectors (1990‐2008) ...................................................... 4 Figure 3: Incremental Cost of Electricity under Increasing Emissions Prices ........................................................................... 9 Figure 4: Emission Levels under Different Emissions Prices ........................................................................................................ 10 Figure 5: Avg. Emission Levels during (2010‐2024)‐Different Emissions Prices ................................................................. 11 Figure 6: Average Annual Emissions Levels for the Period (2010‐2024) ................................................................................ 11 Figure 7: Fuel Usage in 2012 under Different Emissions Prices .................................................................................................. 12 Figure 8: Final Demand in Million MWh for Years 2011‐2030 ..................................................................................................... 18 Figure 9: Fuel Mix Generated at CO2 Price $13/MT ........................................................................................................................... 19 Figure 10: Fuel Mix Generated at CO2 Price $33/MT ........................................................................................................................ 20 Figure 11: Fuel Prices (Base Case, Low and High Cases) ................................................................................................................. 22 Figure 12: Annual Generation by Fuel Type for Years 2011‐2030 ............................................................................................. 23 Figure 13: Electricity Fuel and Production Costs for BAU without Caps for Years 2011‐2030 ...................................... 27 Figure 14: GDP and Disposable Personal Income for BAU without Caps for Years 2011‐2030 ..................................... 28 Figure 15: Population and Employment for BAU without Caps for Years 2011‐2030 ....................................................... 29 Figure 16: Population and Employment Growth Rates for BAU without Caps for Years 2011‐2030 .......................... 30 Figure 17: Revenues and Expenditures for BAU without Caps for Years 2011‐2030 ......................................................... 31 Figure 18: Budget Surplus Trend for BAU without Caps for Years 2011‐2030 ..................................................................... 31 Figure 19: Electricity and Production Costs with a Cap‐and‐Trade Program for Years 2011‐2030 ............................ 33 Figure 20: Difference in Electricity and Production Costs between BAU and Cap‐and‐Trade Program for Years 2011‐2030 .................................................................................................................................................................................................................................. 35 Figure 21: Difference in Projected Fuel Costs for Generating Units between BAU and Cap‐and‐Trade Program for Years 2011‐ 2030 .......................................................................................................................................................................................................... 36 Figure 22: Difference in Emissions Price, Total Emissions Cost, and Emissions Level between BAU and Cap‐and‐Trade Program for Years 2011‐2030 .................................................................................................................................................................... 37 Figure 23: Difference in Production Costs between BAU and Cap‐and‐Trade Program for Years 2011‐2030 ........ 37

Phase Two of Florida C&T Project: Economic Analysis
viii
Figure 24: Difference in GDP and Disposable Personal Income between BAU and Cap‐and‐Trade Program for Years 2011‐2030 ....................................................................................................................................................................................................................... 38 Figure 25: Difference in Employment between BAU and Cap‐and‐Trade Program for Years 2011‐2030 ................. 39 Figure 26: Difference in Employment Growth Rates between BAU and Cap‐and‐Trade Program for Years 2011‐2030 .................................................................................................................................................................................................................................. 40 Figure 27: Difference in State of Florida Revenues and Expenditures between BAU and Cap‐and‐Trade Program for Years 2011‐2030 ........................................................................................................................................................................................................... 40 Figure 28: Projected State Budget Deficit for BAU – Caps (or with a Cap‐and‐Trade Program) for Years 2011‐2030 .................................................................................................................................................................................................................................. 41 Figure 29: Fuel Costs for Generating Units for Low Fuel Costs with a Cap‐and‐Trade Program for Years 2011‐2030 .................................................................................................................................................................................................................................. 42 Figure 30: Emissions for Generating Units for Low Fuel Costs with a Cap‐and‐Trade Program for Years 2011‐2030 .................................................................................................................................................................................................................................. 43 Figure 31: Production Costs for Low Fuel Costs with a Cap‐and‐Trade Program for Years 2011‐2030 .................... 43 Figure 32: GDP and Disposable Personal Income for Low Fuel Costs with a Cap‐and‐Trade Program for Years 2011‐2030 .................................................................................................................................................................................................................................. 44 Figure 33: Employment for Low Fuel Costs with a Cap‐and‐Trade Program for Years 2011‐2030 ............................. 45 Figure 34: Fuel Costs for Generating Units for High Fuel Costs with a Cap‐and‐Trade Program for Years 2011‐2030 .................................................................................................................................................................................................................................. 46 Figure 35: Emissions for Generating Units for High Fuel Costs with a Cap‐and‐Trade Program for Years 2011‐2030 .................................................................................................................................................................................................................................. 47 Figure 36: Production Costs for High Fuel Costs with a Cap‐and‐Trade Program for Years 2011‐2030 ................... 47 Figure 37: GDP and Disposable Personal Income for High Fuel Costs with a Cap‐and‐Trade Program for Years 2011‐2030 .................................................................................................................................................................................................................................. 48 Figure 38: Employment for High Fuel Costs with a Cap‐and‐Trade Program for Years 2011‐2030 ............................ 49 Figure 39: Fuel Costs for Generating Units for 5% Load Reduction with a Cap‐and Trade Program for Years 2011‐2030 .................................................................................................................................................................................................................................. 50 Figure 40: Emissions for Generating Units for 5% Load Reduction with a Cap‐and‐Trade Program for Years 2011‐2030 .................................................................................................................................................................................................................................. 50 Figure 41: Production Costs for 5% Load Reduction with a Cap‐and‐Trade Program for Years 2011‐2030 ........... 51 Figure 42: GDP and Disposable Personal Income for 5% Load Reduction with a Cap‐and‐Trade Program for years 2011‐2030 ....................................................................................................................................................................................................................... 52 Figure 43: Employment for 5% Load Reduction with a Cap‐and‐Trade Program for years 2011‐2030 .................... 53 Figure 44: Fuel Costs for Generating Units for 5% Load Increase with a Cap‐and‐Trade Program for Years 2011‐2030 .................................................................................................................................................................................................................................. 54 Figure 45: Emissions for Generating Units for 5% Load Increase with a Cap‐and‐Trade Program for Years 2011‐2030. .................................................................................................................................................................................................................................. 55 Figure 46: Production Costs for 5% Load Increase with a Cap‐and‐Trade Program for Years 2011‐2030 .............. 55 Figure 47: GDP and Disposable Personal Income for 5% Load Increase with a Cap‐and‐Trade Program for Years 2011‐2030 ....................................................................................................................................................................................................................... 56 Figure 48: Employment for 5% Load Increase with a Cap‐and‐Trade Program for Years 2011‐2030 ....................... 57 Figure 49: Fuel Costs for Generating Units for $21 Allowance Price with a Cap‐and‐Trade Program for Years 2011‐2030 .................................................................................................................................................................................................................................. 58 Figure 50: Emissions for Generating Units for $21 Allowance Price with a Cap‐and‐Trade Program for Years 2011‐2030 .................................................................................................................................................................................................................................. 58 Figure 51: Production Costs for $21 Allowance Price with a Cap‐and‐Trade Program for Years 2011‐2030 ......... 59 Figure 52: GDP and Disposable Personal Income for $21 Allowance Price with a Cap‐and‐Trade Program for Years 2011‐2030 ....................................................................................................................................................................................................................... 60 Figure 53: Employment for $21 Allowance Price with a Cap‐and‐Trade Program for Years 2011‐2030 .................. 61 Figure 54: Fuel Costs for Generating Units for ACEEE with a Cap‐and‐Trade Program for Years 2011‐2030 ........ 62 Figure 55: Emissions for Generating Units for ACEEE with a Cap‐and‐Trade Program for Years 2011‐2030......... 63 Figure 56: Production Costs for ACEEE with a Cap‐and‐Trade Program for Years 2011‐2030 ..................................... 63 Figure 57: GDP and Disposable Personal Income for ACEEE with a Cap‐and‐Trade Program for Years 2011‐203064 Figure 58: Employment for ACEEE with a Cap‐and‐Trade Program for Years 2011‐2030 .............................................. 65 Figure 59: Fuel Costs for Generating Units for WM with a Cap‐and‐Trade Program for Years 2011‐2030 .............. 65 Figure 60: Emissions for Generating Units for WM with a Cap‐and‐Trade Program for Years 2011‐2030 .............. 66 Figure 61: Production Costs for WM with a Cap‐and‐Trade Program for Years 2011‐2030 ........................................... 67 Figure 62: GDP and Disposable Personal Income for WM with a Cap‐and‐Trade Program for Years 2011‐2030 . 68 Figure 63: Employment for WM with a Cap‐and‐Trade Program for Years 2011‐2030 .................................................... 68 Figure 64: Fuel Costs for Generating Units for Coal with a Cap‐and‐Trade Program for Years 2011‐2030 .............. 69 Figure 65: Emissions for Generating Units for Coal with a Cap‐and‐Trade Program for Years 2011‐2030 .............. 70

Phase Two of Florida C&T Project: Economic Analysis
ix
Figure 66: Production Costs for Coal with a Cap‐and‐Trade Program for Years 2011‐2030 .......................................... 71 Figure 67: GDP and Disposable Personal Income for Coal with a Cap‐and‐Trade Program for Years 2011‐2030 . 72 Figure 68: Employment for Coal with a Cap‐and‐Trade Program for Years 2011‐2030 ................................................... 72 Figure 69: Carbon Price Caps for Different Scenarios for Years 2011‐2030 ........................................................................... 73 Figure 70: Historical and Projected U.S. Real GDP and Energy‐Related CO2 Emissions ..................................................... 82 Figure 71: Annual U.S. CO2 Emissions for Policy Scenarios and Reference Case ................................................................... 83 Figure 72: Allowance Price 2010 to 2050 under Four Policy Scenarios ................................................................................... 84 Figure 73: Allowance Values Under the Four Policy Scenarios .................................................................................................... 86 Figure 74: The U.S. GDP Under Four Policy Scenarios ...................................................................................................................... 86 Figure 75: Effects on Purchaser’s Prices in 2015 ................................................................................................................................ 87 Figure 76: Effect of Alternative Policies on the U.S. Trade Balance ........................................................................................... 88 Figure 77: Effect of Alternative Policies on the U.S. Real Effective Exchange Rate............................................................... 89 Figure 78: Marginal Emission Reduction Cost for the Global Energy System (2050) ......................................................... 91 Figure 79: Comparison of a 450 PPM Case and the BLUE Map Scenario 2005‐2050 .......................................................... 92 Figure 80: Sector‐wise Comparison of a 450 PPM Case and the BLUE Map Scenario 2005‐2050 ................................ 93

Phase Two of Florida C&T Project: Economic Analysis
1
Introduction
Background The Phase Two report for the Florida Department of Environmental Protection (FDEP) represents the preliminary economic and modeling analysis component in the development of a state cap‐and‐trade (C&T) rule proposal according to Section 403.44, F.S., to reduce greenhouse gas (GHG) emissions. The Phase Two report is divided into 5 sections. In Section 1, a brief introduction outlines the purpose of the economic analyses for this report and summarizes the findings of the Phase One report. Section 2 presents an overview of the economic analysis framework, based on the economic Dispatch model. Section 3 describes the linkage between the economic Dispatch and the REMI model, and provides a description of the REMI model; including the assumptions, input data, policy variables and options (or scenarios) selected for the economic impact analyses. Section 4 presents and interprets the REMI model simulation results. Section 5 provides a summary of C&T economic analyses research conducted. Appendix A details Florida’s 2008 Energy Bill ‐ Climate Protection Act and Appendix B includes the news reported, during the same timeframe as this study, from a federal, regional and other state’s perspective. The objective of the Phase Two project involves data compilation and analysis of the FDEP C&T program design. The following tasks were included (or will be) in this phase of the analysis:
Quantify the cost‐effectiveness of the C&T system in combination with other state policies and measures in meeting statewide targets.
Quantify benefits to the state's economy for early adoption of a C&T system for greenhouse gases in the context of proposed federal climate change legislation.
Analyze the relationship between allowances and the specific amounts of greenhouse gas emissions they represent.
Analyze the length of allowance periods. Identify entities responsible for acquiring and surrendering allowances. Analyze the length of the individual compliance periods over which entities must account
for emissions and surrender allowances equal to emissions. Analyze the timeline of allowance issuance from the initiation of the program through 2050. Propose a process for the trade of allowances between major emitters, including a registry,
tracking, or accounting system for such trades. Analyze the consistency of the program with other state and possible federal efforts. Identify cost containment mechanisms to mitigate price and cost risks associated with the
electric generation market in this state. Identify relative costs and benefits of auction system and free allowance system. Determine methods, requirements, and conditions for emission allowances. Identify how specific design elements will impact electricity prices for consumers. Quantify overall costs and benefits of C&T to state economy in general. Identify which features of the system would be most advantageous to the Florida economic
and regulatory environment. Identify advantages and disadvantages of State of Florida joining RGGI.

Phase Two of Florida C&T Project: Economic Analysis
2
This Phase Two draft report begins by providing an introduction touching on the historic and outlining the current (as of June 2010) status of the C&T program in Florida.
Phase One Report Conclusions To date, the U.S. House of Representatives has passed a comprehensive energy and climate bill. As federal action progresses Florida’s economic modeling should shift from state‐specific C&T regulations to modeling federal action.
The Phase One report, authored by Dr. Andrew Keeler of Ohio State University, was completed in May 2009. The report highlighted the major choices Florida faces in designing a utility‐sector C&T program as a means of meeting the state’s GHG reduction goals and stressed that the likelihood of an economy‐wide federal C&T policy creates unavoidable uncertainty for Florida’s policy development process, and that the state will have to pay close attention to making sure its actions make sense if such a federal policy is implemented. The report found that:
The most visible and contentious issues about which the state will have to make decision are those of allowance allocation and the use of allowance value. The report lays out a range of options for these choices, emphasizing that the way allowance value is used is more critical than the allocation scheme per se. It uses numerical examples to illustrate the effects of alternative choices on ratepayers, energy efficiency programs, and the state’s fiscal position. It also suggests issues for more detailed modeling of a C&T program’s economic effects that would help the state to make informed decisions about allowance allocation and how allowance value is used.
Overall costs and economic impacts of the program will also be affected by rules for generating offset allowances, and by the formation of and rules for links with other state of regional GHG C&T programs. The report discusses the key issues affecting the state’s choices in these critical areas.
Even with careful planning and a robust set of policies toward offsets, linking with other programs, and energy efficiency, there remain economic risks of a C&T program in a new area like GHGs. The report addresses policies that directly address downside economic risk through the release of additional allowances when predetermined conditions are met.
Florida is justifiably concerned with leakage from the reductions achieved by a C&T program. The report discusses the issue, and is not optimistic that a Florida policy can be completely successful in limiting the problem. A federal C&T policy is much more likely to effectively prevent leakage.
Florida is examining C&T as one of a suite of policy initiatives to reduce GHG emissions in the state and prepare for a low‐carbon economy in the future.
Continuing policy development in energy efficiency programs, portfolio standards and/or feed‐in tariffs, and other areas is a good strategy given that an individual state C&T program may not be the best use of Florida’s administrative and economic resources.

Phase Two of Florida C&T Project: Economic Analysis
3
Phase Two Economic Analysis Framework As provided for in Section 403.44, F.S, FDEP began the rule making process for a statewide cap‐and‐trade system in December of 2008 by hosting workshops with stakeholders and taking comments and suggestions on various design considerations. While FDEP has no immediate plans to continue or complete rule making, it has focused efforts on completing the Phase Two economic modeling. Some of the stakeholder feedback and workshop discussion has been incorporated in the Phase Two economic analysis, such as consideration of the electric utility sector only. Electric utilities have been defined as those generating 25 MW or greater where the unit derives 10% or more of its heat input from fossil fuel. Figure 1and 2 show the trend of GHG emissions from the utility sector in Florida from 1990 to 20083.
Figure 1: Power Generation CO2 Emissions in Florida
3 www.eia.gov/cneaf/electricity/epa/emission_state.xls
0
20
40
60
80
100
120
140
Million CO
2MT
Florida Power Generation CO2 Emissions ‐ Total and Electric Utility
Total Electric Power Industry (Million)
Electric Utility (Million)

Phase Two of Florida C&T Project: Economic Analysis
4
Figure 2: Power Generation CO2 Emissions in Florida ‐ All Other Sectors (1990‐2008)
In determining the caps, Florida’s initial caps would follow in accordance with emission reduction goals set forth in Executive Order 07‐127 and are represented in Table 1.
Table 1: Initial Caps to Follow in Florida Year GHG Reduction Goal 2017 2000 Levels2025 1990 Levels2050 80% below 1990 Levels
Discussion in the stakeholder workshops included a recommendation to establish a pre‐2017 cap in order to better ensure real emission reductions by the cap dates. These proposed caps are presented in table 2 in terms of million tons of CO2. 4
Table 2: Caps CO2 Equivalents Cap Year Set to Year: Proposed Cap (Million Metric Tons) 2012 2005 128.82017 2000 122.32025 1990 89.52050 20% of 1990 17.9
Note: The proposed cap is set for a subset of large electric generating units that account for most, but not all, of the CO2 emissions from this sector.
4 Florida Department of Environmental Protection May 19, 2009. Electric Utility GG C&T workshop. http://www.dep.state.fl.us/air/rules/ghg/electric.htm
0.0
1.0
2.0
3.0
4.0
5.0
6.0
7.0
8.0
Millions CO
2MT
Florida Power Generation CO2 Emissions ‐ Other Sectors
Commercial Cogen
Commercial Non‐Cogen
Industrial Cogen
Industrial Non‐Cogen
IPP NAICS‐22 Cogen
IPP NAICS‐22 Non‐Cogen

Phase Two of Florida C&T Project: Economic Analysis
5
Consideration of developments at the federal level are also important. If Congress eventually passes some type of C&T legislation, those provisions will likely drive economic modeling considerations. Given the unknowns about federal policy, the economic analysis will make reasonable attempts to include the most salient aspects of federal policy, particularly provisions that will be key drivers in Florida’s economy. To date, some consensus is occurring between the federal proposals and some of the consensus positions of key stakeholders. These C&T design aspects include:
A “trial period” with a free distribution of allowances. One possible allowance method could be based on a hybrid approach; based on generation and CO2 emissions (the Edison Electric method).
Leakage could be monitored at the state level until a national policy is in place. Out‐of‐state generation of energy used in Florida will be considered for the economic analysis.
The Marginal Effects of the Price for Carbon: Quantifying the Effects on the Market for Electric Generation in Florida.
Studies on the economic impact of CO2 pricing on the market for electric generation have been performed for the ERCOT region in Texas5, as well as the PJM region in the Northeastern United States.6 Examining the conclusion for those two studies shows how the relative carbon intensity of the electric generation fleet can have a marked impact on the economic effects of CO2 pricing. Therefore, a distinct model for the state of Florida is necessary to measure that impact.
Characteristics of Emission Caps A cap is a regulatory device used to limit the production of certain substances, often byproducts of the production of other goods. In the case of Florida Statute 403.44, the target of the cap is the carbon dioxide that is produced as a by‐product of the generation of electricity. Emissions caps can be one of two types, either restrictive or nonrestrictive. A cap that is nonrestrictive is one where the cap does not affect current production of electricity. That is, if an emissions cap is placed at a level at or above the unconstrained level of emissions produced by the electric generation sector, then the cap will have no affect on the market as “business as usual” (BAU) is allowed to continue. If, however, a cap is placed at a level below the level of emissions produced in an unconstrained market, then this will impose an additional constraint on the generating system. This additional constraint will necessitate a cost. That is, if a firm is considered, without any constraint, to be producing goods at the least possible cost, then applying an additional constraint will necessarily lead to increased costs. In the case of an emissions cap, the monetization of this constraint is a price on the emission of carbon dioxide. So an imposed emissions limit at or above the “business as usual” or unconstrained case implies an emissions price of zero. As the emissions cap decreases below the unconstrained case, the emissions price increases.
The strategies to reduce emissions from the electric generation sector are limited. In the short term, the generators can adjust the types of fuels that they use, known as fuel‐switching, or reduce the amount of electricity that they produce. In the long term, the generators options expand to
5 http://www.ercot.com/content/news/presentations/2009/Carbon_Study_Report.pdf 6 http://www.pjm.com/documents/~/media/documents/reports/20090127‐carbon‐emissions‐whitepaper.ashx

Phase Two of Florida C&T Project: Economic Analysis
6
strategies such as: improving the thermal efficiency of existing power plants (and thus reduce fuel consumption), construction of new power plants that produce electricity while emitting less (or no) carbon dioxide, or developing and exploiting technologies that capture a portion of the carbon dioxide emitted. An electric generation unit‐level economic Dispatch model can be used to simulate the effects that the price of emissions (or, similarly, an emissions cap) has on the electricity sector.
Model of Economic Dispatch The problem of least‐cost economic dispatch of a group of electric generating units is to minimize the aggregate costs required to provide the amount of electricity demanded by end‐users in each hour. The costs to produce this electricity will be driven by the type of generating unit, its operating efficiency, the variable costs required to operate and maintain the unit, and the price of its fuel. The variable costs are the costs that increase as production increases, and decrease as production decreases. The differences between fixed and variable costs are shown in Table 3.

Phase Two of Florida C&T Project: Economic Analysis
7
Table 3: Fixed and Variable Costs (Generating Unit Cost Classification) Classification Cost Description
Fixed Costs
Capital Costs Costs required to build the power plant
Fixed Operations and Maintenance Expenses
Costs to operate and maintain the plant that do not vary with the level of production, such as annual maintenance costs and some salaries
Variable Costs
Variable Operations and Maintenance Expenses
Costs to operate and maintain the plant that vary with the level of production, such as more regular maintenance and equipment costs, and some salaries
Fuel Costs associated with procuring, handling, transferring, or delivering fuel to the plant
Emissions Costs associated with emission of carbon dioxide Once a price to emit carbon dioxide is introduced, the cost of emissions is added to the dispatch decision as well. This cost will be driven by the operating efficiency of the generating unit and by the type of fuel, as some generating fuels emit relatively more carbon dioxide when burned. The fuels that emit relatively more carbon dioxide when burned, such as coal and petroleum coke, are often referred to as “dirty” fuels, and the fuels that emit relatively less, such as natural gas, are referred to as “clean” fuels. Therefore, the price of emissions may necessitate the switch from a dirtier generating fuel to a cleaner one by an individual generator capable of burning more than one type of fuel, or may lead to a generator that burns a dirtier fuel being replaced by a generator that burns a cleaner fuel.
The calculation of the optimum is made in two stages. First, the hourly cost is calculated for each available generating unit. For units with the capability to burn different fuels, the cost and emissions rate of each fuel are considered and the least‐cost alternative is selected. Second, all of the generating units are ordered from lowest cost to highest, and the units with the lowest hourly costs are dispatched until the hourly electric loads are met.
Data Sources Data for individual generating units, such as summer and winter generating capacity, prime mover, and fuel sources, were acquired from the United States Department of Energy’s Energy Information Administration (EIA) Form 860 (Annual Electric Generator Report) and Form 861 (Annual Electric Power Industry Database) databases. Data on generating unit operating efficiency, such as heat rate, were acquired from EIA Form 423 (Monthly Cost and Quality of Fuels for Electric Plants Data) filings from each of the utilities that are required to file the report. Some plant level operating data, such as variable operating and maintenance expenses, were acquired from utility responses on Form 1 (Annual Report of Major Electric Utility) to the Federal Energy Regulatory Commission (FERC). Other operating and contract data, as well as long term load forecasts, were acquired from the Regional Load and Resource Plan published by the Florida Reliability Coordinating Council. Actual hourly loads were acquired from utility responses on Form 714 (Annual Electric Control and Planning Area Report) to the FERC.
Data for projected generating units were acquired from the Regional Load and Resource Plan. Projected fuel prices are taken from the 2009 Annual Energy Outlook published by the EIA. The

Phase Two of Florida C&T Project: Economic Analysis
8
Annual Energy Outlook Reference Case is used for the base scenario, and high and low price scenarios are developed from the High and Low Price cases.
Model Operation Within each month of the model run, the model first determines the order of dispatch in which the generating units will be dispatched to meet electric load, often called the generation stack, and then dispatches the generation stack against the monthly load shape on an hourly basis. When ordering the generation stack, the model considers the fuel cost, variable operation and maintenance expenses, unit efficiency, and emissions price. The model then selects the least‐cost fuel source for any unit with the capability to switch fuels.
When dispatching each unit, the model discounts each unit’s production capacity by the unit’s availability factor. This availability factor reflects distinct operating characteristics of different types of generating units. Electrical generation in different types of units may or may not be controlled by the operator of the unit. For a unit that burns fossil fuels, for example, if the power plant is running and has fuel available, it will generate electricity. These types of units are also called dispatchable units. For a unit that relies on the sun or the wind to generate electricity, however, that power plant will not produce electricity if the sun is not shining or the wind is not blowing. These types of units are called nondispatchable units.
For nondispatchable units, then, the availability factor reflects the amount of time that the sun is shining or the wind is blowing. For dispatchable units, this availability factor reflects the times when the unit is available to generate. The unit may be unavailable due to either a planned or unplanned outage. Ideally, two factors would be used to reflect unit availability. The first would reflect planned unit outages, most commonly for routine maintenance. The second factor would reflect unplanned, or forced, outages; the instances where a unit breaks down unexpectedly. However, individual unit outage schedules are difficult to acquire, are dynamic, and can be indeterminate for extended timeframes. To ameliorate these modeling limitations, a discount methodology using an availability factor, often called a “derate” methodology, is employed.
Model Output During execution, the model tracks the energy production for each unit, as well as the units of fuel burned, the total dispatch costs, and the carbon emissions. These output variables can be aggregated by utility, type of plant, fuel type, and by custom classifications.
The model output consists of matched sets of emissions prices, emissions levels, and the amounts of each generating fuel burned for each model year. Therefore, each level of emissions will imply a price of emissions and a fuel mix, and vice versa. In that manner, we can find the price of emissions and mixture of generating fuels that correspond to each level of carbon dioxide emissions, for each compliance year in the analysis. Further, we can also compute the effects of different levels of emissions (and the resulting emissions prices) to allow the computation of the marginal effects of the emissions policy.
For this section of the analysis, the model was examined for the years 2011‐2030, varying the CO2 price from $0 to $90 per ton. The research team looked at how several output variables behave

Phase Two of Florida C&T Project: Economic Analysis
9
both over time and across the spectrum of CO2 prices. The first variable was the change associated with the average variable cost component of electricity production.
Figure 3: Incremental Cost of Electricity under Increasing Emissions Prices
Figure 3 shows the variable cost of electricity over time, under increasing emissions prices. While the relationship does change slightly as viewed further into the future, the relationship between emissions prices and incremental cost is fairly stable, as a $1 increase in emissions prices tends to raise the price of electricity in Florida by just under 55¢ per MWh, or about $6.60 per year for a family that uses 1000 kWh per month, and this effect stays relatively constant for emissions prices from $1 to $90/ton.

Phase Two of Florida C&T Project: Economic Analysis
10
Figure 4: Emission Levels under Different Emissions Prices
Figure 4 illustrates the effects of simulating various carbon dioxide emissions prices on the emissions of the electric generating sector. Emissions levels are initially reduced 2‐3% under relatively low emissions prices. This is primarily due to the displacement of petroleum coke as a generating fuel in Florida. However, emissions levels then reach a plateau, whose magnitude varies, during which increasing the price of emissions has relatively little effect on overall emissions levels. Once emissions prices exceed a critical value, however, a rapid decline in emissions levels occurs. This decline in emissions occurs as coal‐fired generation is displaced by natural gas, and eventually by cleaner forms of generation.
Knowledge of the shape of this emissions surface is important for two major policy questions. First, it allows us to see the role that increasing the price of CO2 has on emissions levels. If the aim of environmental policy is to reduce emissions in the most cost‐effective manner, it is important to know the marginal reduction associated with the price of emissions. In this particular instance, the difference in emissions reduction from a $10 emissions price and a $40 emissions price is very small. Yet, as depicted in the following figures, it can be seen that the difference in realized wholesale prices will be about $15/MWh higher with a $40 emissions price than a $10 emissions price. Whether the relatively small reduction in emissions is worth this extra cost is an important policy decision. Second, this emissions surface can allow the evaluation of the different paths that can be used to achieve emissions milestones. For example, environmental policy may state an emissions goal of a 25% reduction in emissions by 2025, but no interim goals. This 25% reduction can be achieved with a gradually declining emissions cap over many years, or an emissions cap that

Phase Two of Florida C&T Project: Economic Analysis
11
is imposed suddenly in 2025. Either way, the understanding of the interaction between CO2 price and CO2 emissions cap is critical.
Figure 5: Avg. Emission Levels during (2010‐2024)‐Different Emissions Prices
Figure 6: Average Annual Emissions Levels for the Period (2010‐2024)
0
20
40
60
80
100
120
140
0 0 0 0 0 0 60 60 60 60 60 70 70 70 90 90 90 90 90 90
CO
2MMT
$/MT
Emissions Level
0
20
40
60
80
100
120
140
160
CO
2MMT
Year
Emission Level
Phase Two of Florida C&T Project: Economic Analysis
12
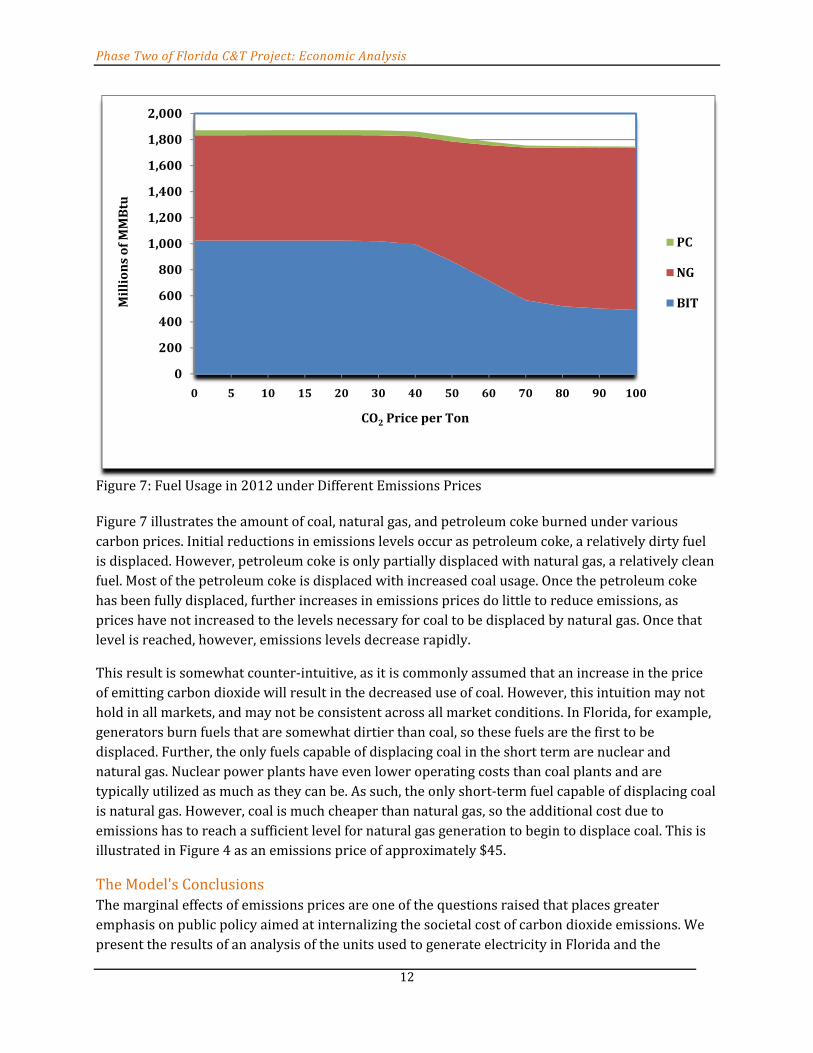
Figure 7: Fuel Usage in 2012 under Different Emissions Prices Figure 7 illustrates the amount of coal, natural gas, and petroleum coke burned under various carbon prices. Initial reductions in emissions levels occur as petroleum coke, a relatively dirty fuel is displaced. However, petroleum coke is only partially displaced with natural gas, a relatively clean fuel. Most of the petroleum coke is displaced with increased coal usage. Once the petroleum coke has been fully displaced, further increases in emissions prices do little to reduce emissions, as prices have not increased to the levels necessary for coal to be displaced by natural gas. Once that level is reached, however, emissions levels decrease rapidly.
This result is somewhat counter‐intuitive, as it is commonly assumed that an increase in the price of emitting carbon dioxide will result in the decreased use of coal. However, this intuition may not hold in all markets, and may not be consistent across all market conditions. In Florida, for example, generators burn fuels that are somewhat dirtier than coal, so these fuels are the first to be displaced. Further, the only fuels capable of displacing coal in the short term are nuclear and natural gas. Nuclear power plants have even lower operating costs than coal plants and are typically utilized as much as they can be. As such, the only short‐term fuel capable of displacing coal is natural gas. However, coal is much cheaper than natural gas, so the additional cost due to emissions has to reach a sufficient level for natural gas generation to begin to displace coal. This is illustrated in Figure 4 as an emissions price of approximately $45.
The Model's Conclusions The marginal effects of emissions prices are one of the questions raised that places greater emphasis on public policy aimed at internalizing the societal cost of carbon dioxide emissions. We present the results of an analysis of the units used to generate electricity in Florida and the
0
200
400
600
800
1,000
1,200
1,400
1,600
1,800
2,000
0 5 10 15 20 30 40 50 60 70 80 90 100
Millions of MMBtu
CO2 Price per Ton
PC
NG
BIT

Phase Two of Florida C&T Project: Economic Analysis
13
marginal effects of carbon prices on their dispatch. Using the operating characteristics of Florida’s generating units, and a least‐cost economic Dispatch model, we analyze the effects that various emissions prices (and their concurrent emissions levels) have on Florida’s level of carbon dioxide emissions and the amounts of fuel consumed for electric generation. We find that at relatively low emissions prices emissions levels decrease, but that coal usage actually increases as fuel sources such as petroleum coke and fuel oil are displaced. Once this initial reduction has been achieved, further increases in carbon prices may do little to decrease emissions until a “critical point” has been achieved, and coal can be displaced by natural gas. These counter‐intuitive results suggest that the marginal effects of emissions prices may vary greatly with the emissions price level and the fundamental characteristics of the market.

Phase Two of Florida C&T Project: Economic Analysis
14
Linkages between Economic Dispatch and REMI
The REMI Model Methodology In order to obtain estimates of the different types of macroeconomic effects of the carbon cap scenarios on the Florida economy, we will apply a well‐established analytical tool known as the REMI model. The REMI modeling team developed a series of assumptions for a baseline case and for a comparison case (with associated carbon caps by year) for the following aforementioned scenarios (low, base, high fuel costs, load reduction/increase, allowance price, coal, among others). In addition, the modeling team examined energy efficiency technologies and investment in energy measures and associated savings.
Regional Economic Models, Inc., (REMI PI+ v1.1.6) 2009 is a widely used dynamic (multiple time period, up to year 2050) integrated input‐output and econometric model. REMI is used extensively to measure proposed legislative and other program and policy economic impacts across the private and public sectors of the state by the Florida Joint Legislative Management Committee, Division of Economic & Demographic Research, the Florida Department of Labor, and other state and local government agencies. In addition, it is the chosen tool to measure these impacts by a number of universities and private research groups that evaluate economic impacts across the state and nation. FSU CEFA uses the REMI model that has been developed for the state of Florida and includes 169 sectors (based on the North American Industrial Classification System, or NAICS). The REMI outputs (or results) will include the economic impacts7 to Florida of a C&T Program (compared to the baseline of no C&T Program) with respect to the aforementioned scenarios.
Conceptually, the model consists of five basic blocks: (1) output, (2) labor and capital demands, (3) population and labor supply, (4) wages, prices, and profits, and (5) market shares. All of these blocks have been calibrated to the Florida economy using state specific data. The detailed structure of the REMI model requires an extensive amount of data. By translating each of the emission reduction scenarios into changes in sector spending over the full time horizon of the analysis (2011 through 2050), REMI then establishes a new set of economic outputs. These can then be compared to a “Business‐as‐Usual”, or “BAU”, forecast to determine net changes on Gross Domestic Product (GDP), income (wages) and employment (jobs).
The REMI economic analyses will initially provide an overview of the Florida economy (from Years 2011 – 2030) under the current BAU (or baseline) perspective, i.e., without a C&T program. In subsequent REMI analyses, comparisons will always be made between the BAU (or without a caps program) and CAPS (or with a caps program) case(s), with corresponding economic impact results specific to the Florida economy.
Data Compatibility of the Dispatch Model and the REMI Model The dispatch and REMI model(s) will be using the same optimum sources of cost data8, where appropriate. The Dispatch model examines individual generating units in its’ cost matrix, whereas the REMI model is broader in orientation, yet specific to, the Florida economy. The Dispatch model 7 In terms of Gross State Product (GSP), employment (jobs), and personal income, from years 2011 to 2050 8 Determined by the FESC team members with additional individual generator data (where outliers occur with the reported generator units) provided by the DMG

Phase Two of Florida C&T Project: Economic Analysis
15
output(s) to be used as the REMI model input(s) by the economic modeling team are the wholesale firm power/fuel prices, which reflect the cost of generation alone9. The wholesale price (electricity) is then converted to relative retail energy prices for the commercial, industrial and residential energy customers using a conversion based on “End use Energy prices by Sector and Source” from the Energy Information Administration (EIA).10 The conversion factors/ratios were applied for oil, natural gas and electricity by utilizing “End‐Use Energy Prices by Sector & Source” from published forecast data from the Energy Information Administration.11 Florida corresponds to Division 5, the South Atlantic Region, according to the Census Division List of EIA. An annual projected series of retail factors is computed as the ratio of the published retail price t, class_ j : published generation price_ t, where t = year and j = residential, industrial, or commercial. Also included in both the dispatch and REMI models are the generating units production costs (including total fuel plus operating and maintenance, fuel adders, and emission costs) and investment (capital outlay) for new generation. The new generation is based on the LRP and on the most recent levelized cost figures12 with corresponding year projected online. In addition, the Dispatch model provided the REMI economic modeling team with the resultant investment mix for traditional and renewable energy generation technologies.
Variable Description on Dispatch The main variables of the Dispatch model are explained as under:
Electricity Fuel Cost is the total fuel cost projected by the Dispatch model in order to produce/generate the total electricity demand.
Production cost is the total cost of producing the demanded MWh of electricity. It is the total fuel cost plus Operation & Maintenance cost plus fuel adders plus emissions costs.
Consumer Price is the total variable costs divided by MWh of electricity plus the fixed cost adder for Florida. The fixed cost adder is $58. Dispatch results provide consumer price in $/MWh. In order to streamline it for REMI input we convert it to ‘total price to the consumers’ by multiplying with the demanded amount of electricity in MWh. Hence, the consumer price is obtained in millions of dollars.
Final Demand: Dispatch model calculates the Final Demand in MWh. It is the projected total electricity consumption in Florida over the modeled period.
Initial Input Data for Economic Dispatch Model Table 4 presents the economic Dispatch model initial input data, including the load shape forecast, and proposed emissions caps to Year 2030.
9 The fuel costs include generation, but not transmission and distribution costs. 10 http://www.eia.doe.gov/oiaf/aeo/supplement, Tables 11,12,20 11 See: http://www.eia.doe.gov/oiaf/aeo/supplement, Tables 15 and 79 12 Source: Energy Information Administration, Annual Energy Outlook 2010, December 2009, DOE/EIA‐0383(2009)

Phase Two of Florida C&T Project: Economic Analysis
16
Table 4: Economic Dispatch Model Year Demand (MW) Final Demand
(MWh) Load Factor (%) Emissions Cap
(MMT)
2011 49,042 239,293,000 55.70% 128.8
2012 49,633 243,713,000 56.05% 128.8
2013 50,400 249,451,000 56.35% 128.8
2014 51,017 253,842,000 56.80% 128.8
2015 51,831 257,896,000 56.80% 128.8
2016 52,452 260,780,000 56.76% 128.8
2017 53,517 264,875,000 56.35% 122.3
2018 54,380 269,626,000 56.60% 122.3
2019 55,411 274,249,000 56.50% 122.3
2020 56,519 279,734,000 56.50% 122.3
2021 57,649 285,329,000 56.35% 122.3
2022 58,802 291,035,000 56.50% 122.3
2023 59,978 296,856,000 56.50% 122.3
2024 61,178 302,793,000 56.50% 122.3
2025 62,401 308,849,000 56.35% 89.5
2026 63,649 315,026,000 56.50% 89.5
2027 64,922 321,326,000 56.50% 89.5
2028 66,221 327,753,000 56.50% 89.5
2029 67,545 334,308,000 56.35% 89.5
2030 68,896 340,994,000 56.50% 70

Phase Two of Florida C&T Project: Economic Analysis
17
The following table below shows the inputs in the Dispatch model that comprise the current total levelized costs of new generation, in addition to the costs associated with changing, or increasing carbon prices.
Table 5: Current Total Levelized Costs of New Generation for Different Fuel Types
Generation Type
Total System Levelized
Cost ($/MWh) $10/MT $20/MT $30/MT $40/MT $50/MT $60/MT $70/MT $80/MT $90/MT
Conventional Coal 100.40 108.97 117.53 126.10 134.67 143.24 151.80 160.37 168.94 177.51
Advanced Coal 110.50 118.66 126.82 134.99 143.15 151.31 159.47 167.64 175.80 183.96 NG Conventional Combined Cycle 83.10 86.92 90.74 94.56 98.39 102.21 106.03 109.85 113.67 117.49 NG Advanced Combined Cycle 79.30 82.89 86.47 90.06 93.64 97.23 100.81 104.40 107.99 111.57 NG Conventional Combustion Turbine 139.50 145.24 150.98 156.72 162.46 168.20 173.94 179.69 185.43 191.17 Advanced Combustion Turbine 123.50 128.43 133.37 138.30 143.23 148.17 153.10 158.03 162.96 167.90
Advanced Nuclear 119.00 119.00 119.00 119.00 119.00 119.00 119.00 119.00 119.00 119.00
Wind 149.30 149.30 149.30 149.30 149.30 149.30 149.30 149.30 149.30 149.30
Wind – Offshore 191.10 191.10 191.10 191.10 191.10 191.10 191.10 191.10 191.10 191.10
Solar PV 396.10 396.10 396.10 396.10 396.10 396.10 396.10 396.10 396.10 396.10
Solar Thermal 256.60 256.60 256.60 256.60 256.60 256.60 256.60 256.60 256.60 256.60
Geothermal 115.70 115.70 115.70 115.70 115.70 115.70 115.70 115.70 115.70 115.70
Biomass 111.00 111.00 111.00 111.00 111.00 111.00 111.00 111.00 111.00 111.00
Hydro 119.90 119.90 119.90 119.90 119.90 119.90 119.90 119.90 119.90 119.90
The highlighted values indicate the least‐cost new generation for a given carbon cost. At a carbon price of $90/MT, biomass generation becomes the least expensive power source. This threshold is significant because biomass is considered a net zero emitter of carbon (although this point is still being debated), and theoretically, if sufficient biomass were available, generation could gradually shift to this zero emitting source and carbon emissions would decrease to zero in time. But realistically, there would be limitations on biomass availability and other forms of generation would be required. Nevertheless, it makes the point for the purpose of carbon pricing in the effort to decrease carbon emissions. With a carbon price, the model eventually reaches a cost point where zero‐emitting or low‐emitting generation choices become the most economical means of producing electricity.
The Dispatch model results are presented in the following table. The carbon price is defined in terms of dollar per MT and increases gradually from zero dollars per MT (2011‐2014) to 90 dollars per MT in 2030. The Dispatch model provides a projection of consumer price in millions of dollars which rises from $22.387 billion in 2011 to $39.522 billion in the year 2030. Final demand is projected by the model in Megawatts hour of electricity. Production cost is the total fuel cost plus operation and maintenance cost plus fuel adders plus emissions costs, and is calculated in millions of dollars.

Phase Two of Florida C&T Project: Economic Analysis
18
Table 6: Dispatch Model Results
Year Carbon Price ($/MT)
Consumer Price ($ Million)
Production Cost Final Demand
Emissions Cap
($ Million) (MWh) (Million MT)
2011 0 22,387 8,508 239,293,000 128.8
2012 0 23,004 8,869 243,713,000 128.8
2013 0 23,540 9,071 249,451,000 128.8
2014 0 23,819 9,096 253,842,000 128.8
2015 0 24,329 9,371 257,896,000 128.8
2016 0 24,863 9,738 260,780,000 128.8
2017 60 33,217 17,854 264,875,000 122.3
2018 60 33,288 17,650 269,626,000 122.3
2019 60 33,370 17,463 274,249,000 122.3
2020 60 34,285 18,060 279,734,000 122.3
2021 60 35,231 18,682 285,329,000 122.3
2022 70 37,494 20,614 291,035,000 122.3
2023 70 38,433 21,215 296,856,000 122.3
2024 70 39,293 21,731 302,793,000 122.3
2025 90 35,767 17,854 308,849,000 89.5
2026 90 36,445 18,173 315,026,000 89.5
2027 90 37,119 18,482 321,326,000 89.5
2028 90 37,856 18,847 327,753,000 89.5
2029 90 38,695 19,305 334,308,000 89.5
2030 90 39,522 19,744 340,994,000 70
Figure 8: Final Demand in Million MWh for Years 2011‐2030
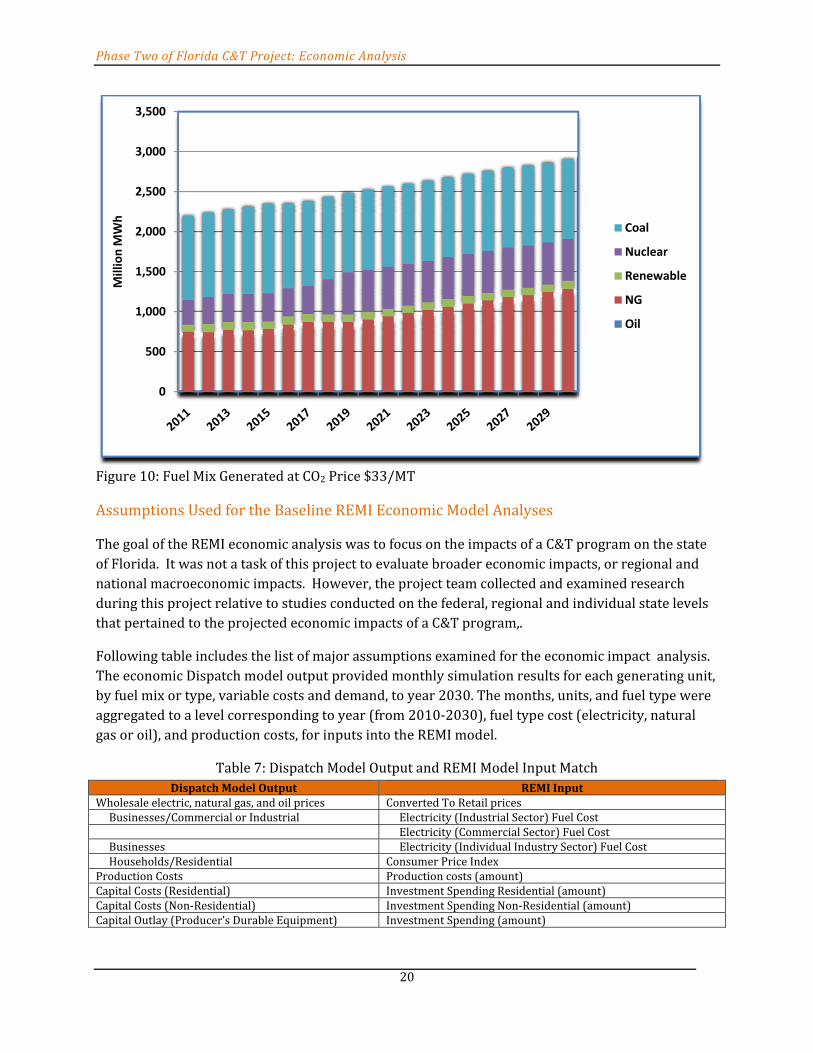
Fuel Mix Generated by Dispatch with Different Carbon Prices Following two figures represent different fuel mix generated by the Dispatch model as a result of increasing carbon prices. The fuels are categorized as coal, nuclear, natural gas, oil, and renewable..
0
50
100
150
200
250
300
350
400
Million M
Wh

Phase Two of Florida C&T Project: Economic Analysis
19
The Dispatch model run begins with $13/MT carbon prices with increasing increments of $4/MT, up to $33/MT. First figure represents the fuel mix generated at $13/MT carbon price, whereas the next one gives the fuel mix burned at carbon price of $33/MT.
Figure 9: Fuel Mix Generated at CO2 Price $13/MT
0
500
1,000
1,500
2,000
2,500
3,000
3,500
Million M
Wh Coal
Nuclear
Renewable
NG
Oil
Phase Two of Florida C&T Project: Economic Analysis
20
Figure 10: Fuel Mix Generated at CO2 Price $33/MT
Assumptions Used for the Baseline REMI Economic Model Analyses
The goal of the REMI economic analysis was to focus on the impacts of a C&T program on the state of Florida. It was not a task of this project to evaluate broader economic impacts, or regional and national macroeconomic impacts. However, the project team collected and examined research during this project relative to studies conducted on the federal, regional and individual state levels that pertained to the projected economic impacts of a C&T program,.
Following table includes the list of major assumptions examined for the economic impact analysis. The economic Dispatch model output provided monthly simulation results for each generating unit, by fuel mix or type, variable costs and demand, to year 2030. The months, units, and fuel type were aggregated to a level corresponding to year (from 2010‐2030), fuel type cost (electricity, natural gas or oil), and production costs, for inputs into the REMI model.
Table 7: Dispatch Model Output and REMI Model Input Match Dispatch Model Output REMI Input
Wholesale electric, natural gas, and oil prices Converted To Retail prices Businesses/Commercial or Industrial Electricity (Industrial Sector) Fuel Cost Electricity (Commercial Sector) Fuel Cost Businesses Electricity (Individual Industry Sector) Fuel Cost Households/Residential Consumer Price Index Production Costs Production costs (amount)Capital Costs (Residential) Investment Spending Residential (amount) Capital Costs (Non‐Residential) Investment Spending Non‐Residential (amount) Capital Outlay (Producer’s Durable Equipment) Investment Spending (amount)
0
500
1,000
1,500
2,000
2,500
3,000
3,500Million M
Wh
Coal
Nuclear
Renewable
NG
Oil
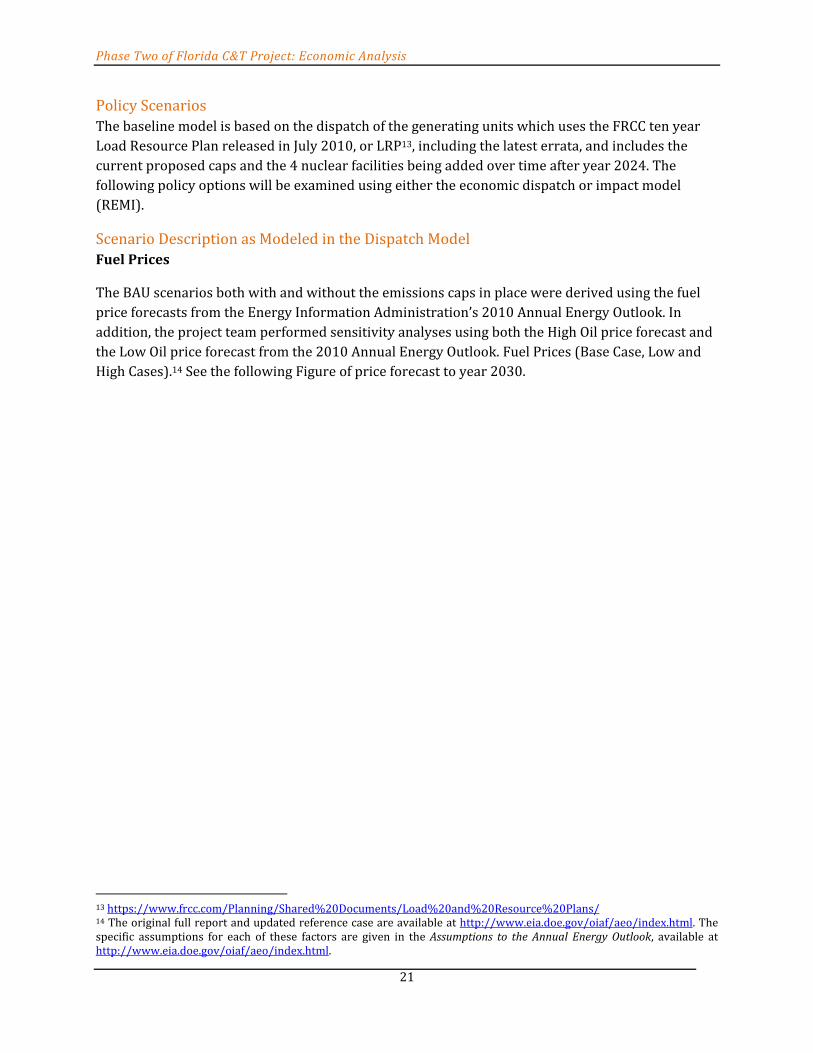
Phase Two of Florida C&T Project: Economic Analysis
21
Policy Scenarios The baseline model is based on the dispatch of the generating units which uses the FRCC ten year Load Resource Plan released in July 2010, or LRP13, including the latest errata, and includes the current proposed caps and the 4 nuclear facilities being added over time after year 2024. The following policy options will be examined using either the economic dispatch or impact model (REMI).
Scenario Description as Modeled in the Dispatch Model Fuel Prices
The BAU scenarios both with and without the emissions caps in place were derived using the fuel price forecasts from the Energy Information Administration’s 2010 Annual Energy Outlook. In addition, the project team performed sensitivity analyses using both the High Oil price forecast and the Low Oil price forecast from the 2010 Annual Energy Outlook. Fuel Prices (Base Case, Low and High Cases).14 See the following Figure of price forecast to year 2030.
13 https://www.frcc.com/Planning/Shared%20Documents/Load%20and%20Resource%20Plans/ 14 The original full report and updated reference case are available at http://www.eia.doe.gov/oiaf/aeo/index.html. The specific assumptions for each of these factors are given in the Assumptions to the Annual Energy Outlook, available at http://www.eia.doe.gov/oiaf/aeo/index.html.
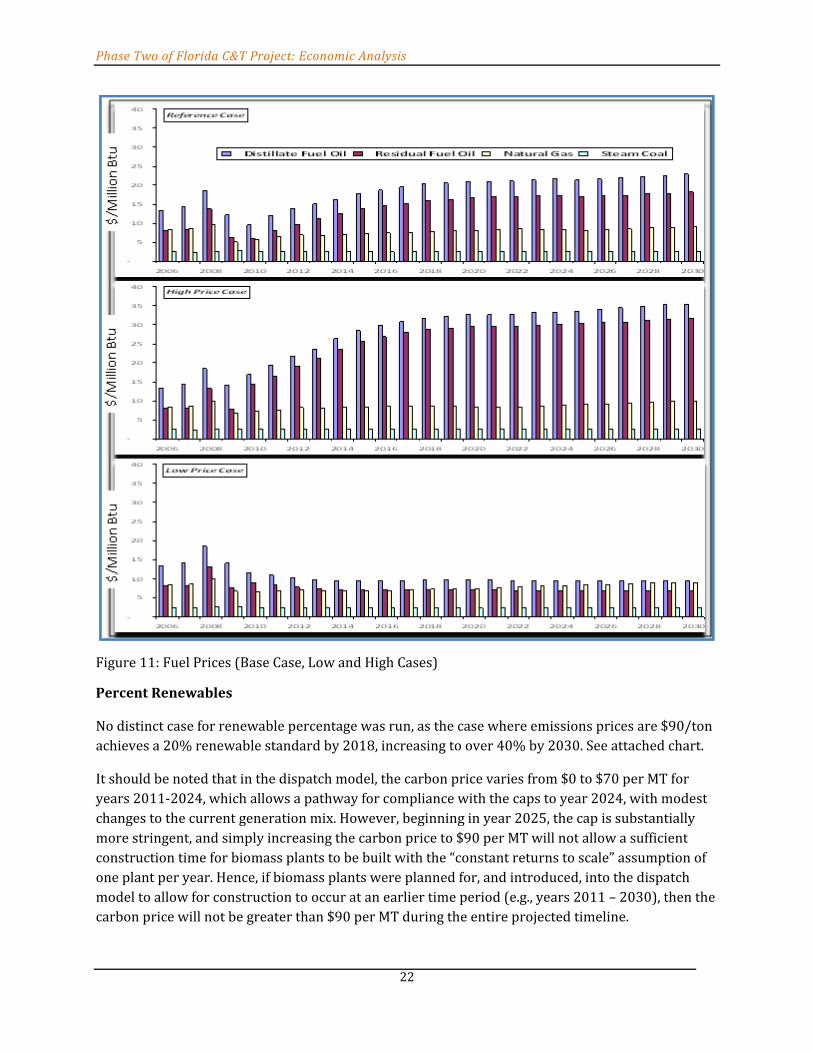
Phase Two of Florida C&T Project: Economic Analysis
22
Figure 11: Fuel Prices (Base Case, Low and High Cases)
Percent Renewables
No distinct case for renewable percentage was run, as the case where emissions prices are $90/ton achieves a 20% renewable standard by 2018, increasing to over 40% by 2030. See attached chart.
It should be noted that in the dispatch model, the carbon price varies from $0 to $70 per MT for years 2011‐2024, which allows a pathway for compliance with the caps to year 2024, with modest changes to the current generation mix. However, beginning in year 2025, the cap is substantially more stringent, and simply increasing the carbon price to $90 per MT will not allow a sufficient construction time for biomass plants to be built with the “constant returns to scale” assumption of one plant per year. Hence, if biomass plants were planned for, and introduced, into the dispatch model to allow for construction to occur at an earlier time period (e.g., years 2011 – 2030), then the carbon price will not be greater than $90 per MT during the entire projected timeline.

Phase Two of Florida C&T Project: Economic Analysis
23
Figure 12: Annual Generation by Fuel Type for Years 2011‐2030
The Dispatch model did include a clean energy mix by constraining composition of new generation to include: 25% Advanced Nuclear, 25% Solar PV, 25% Wind (Offshore), and 25% Biomass.
The project team initially planned the programming methodology for this renewable scenario to reflect the Waxman‐Markey15 (WM) and the EPA method. The WM method modeled that low or zero carbon primary energy (nuclear, renewable, and CCS) will rise to 18% of primary energy by year 2020, 26% by 2030, and 46% by 2050. EPA analyzed some scenarios including: no policy (base or reference, and renewable energy remains steady at 14% throughout the time period). EPA also examined a few additional sensitivity cases.16 With the current objective function of least cost dispatch, the model builds biomass plants only, as the renewable component of the fuel mix. This is due to the assumption in the model, and based on the most current EIA levelized cost data, that biomass is the most cost effective solution concerning renewable fuels. However, given the model’s assumption of constant returns to scale in terms of new plant construction, it is assumed that with ample planning time (from as early as year 2011), it is possible to reach a cost effective result, with a carbon price of $90 per MT to year 2030, to maintain the fuel mix within the carbon reduction cap as it becomes more stringent, over time. Contrary to this, if we allow for increasing returns to scale then the model can potentially utilize other cleaner fuels like nuclear, wind, solar, geo‐thermal, and
15 Waxman‐Markey April 20 2009 Exec Summary states that EPA prelim analysis shows that renewable energy penetration accelerates by 150% over the next 2 decades. 16 U.S. Environmental Protection Agency, Office of Atmospheric Programs. EPA Preliminary Analysis of the Waxman‐Markey Discussion Draft: The American Clean Energy and Security Act of 2009 in the 111th Congress. April 2009.
0
50
100
150
200
250
300
350
400
Millions of MWh
Annual Generation by Fuel Type
Sum of Coal Sum of Nuclear Sum of Nat Gas Sum of Oil Sum of Renewable

Phase Two of Florida C&T Project: Economic Analysis
24
other zero or low emission generation fuel sources, however, such investigation was beyond the scope (e.g., time and resources) of this study.
Allowance Price
The project team ran distinct cases for the range of allowance prices that have been proposed as the ‘equilibrium’ allowance prices in studies by Waxman‐Markey and the EPA. The project team found that this range of allowance prices $13‐$33/MT CO2e17 have a negligible effect on emissions in the state of Florida that would result in most market participants simply purchasing allowances rather than abating emissions. The WM analysis: included using the EPA modeling results ranging from $13‐$17 per MT CO2e in year 2015 and from $17 to $22/MT CO2e in year 2020, in the baseline scenario. This occurred after upgrading to the AEO 2009 baseline case, including a lower rate of GDP growth compared to 2006 (2.5‐3.0%) and the 2007 Energy Independence and Security Act (EISA). Across ALL the scenarios modeled, the allowance price ranges from $13‐$26/MT CO2e in 2015, and from $17 ‐ $33/MT CO2e, in year 2020.
Coal Without Carbon Capture and Storage
Under the reduction in coal generation scenario, the project team constrained the Dispatch model to generate no more than the following percentage of electricity from coal in any given year, and reduced overall electric demand by 10%.
Table 8: Constraints on Coal in the Dispatch Model
Year % Electricity Generated by Coal 2017 30.00%2018 25.00%2019 34.00%2020 23.00%2021 22.00%2022 21.00%2023 20.00%2024 18.00%2025 16.60%2026 16.60%2027 16.60%2028 16.60%2029 16.60%2030 16.60%
Energy Efficiency
The project team conducted 2 energy efficiency scenarios. The first scenario is named ACEEE18 and was based on a previous Florida study on Energy Efficiency conducted in 2007 whereby load was
17 Stated here in $/MT CO2e or $/MT CO2 equivalents. 1 MT = 2,204.623lbs. For clarity in the report, the “e” is dropped, however all MT units are in equivalents. 18 Based on the Report “Potential for Energy Efficiency and Renewable Energy to Meet Florida’s Growing Energy Demands.” American Council for an Energy‐Efficient Economy. June 2007.

Phase Two of Florida C&T Project: Economic Analysis
25
decreased by 9% from years 2013‐2022, and 15% in 2023‐2030. In the second, named WM19, load was decreased by 8% in 2020‐2030. This was based on the WM approach where for energy efficiency scenarios, 40% of 20% renewable is equal to 8% energy efficiency by year 2020.
Load Growth
Load forecasts for BAU and BAU with caps scenarios were derived using the 2010 FRCC Load and Resource Plan. For sensitivity cases, the project team considered load deviations that were 5% higher and 5% lower than the expected load case for the period 2009‐2030.
19 Transformed to energy efficiency of 8% by Year 2020 (assuming 40% or 20% renewable energy) included in the former Waxman Markey bill.

Phase Two of Florida C&T Project: Economic Analysis
26
Dispatch Model and REMI Model Simulation Results Once the inputs are entered and the economic modeling analysis has been performed, REMI provides numerous economic impacts including effects on the population as well as the economy. Florida gross domestic/state Product (GDP/GSP) and real disposable income results are expressed in terms of billions of dollars. The employment results are expressed in terms of thousands of jobs.
Dispatch Model Results for the BAU Scenario The following Table includes the Dispatch model projections in the standard BAU case, which represents the current situation with no caps. The projections extend for twenty years from 2011 to 2030. All the output cost data (and input data for the REMI model) are in 2008 dollars, including consumer price.
The fuel cost of electricity in the industrial sector is projected to reach $7.085 billion by the end of year 2011. It is projected to nearly double in twenty years (in 2030) to $13.602 billion with constant and increasing projected fuel costs.
Table 9: Dispatch Output Data without Caps20
Year
Electricity Fuel Cost (All Industrial
Sectors) $(M)
Electricity Fuel Cost (All
Commercial Sectors) $(M)
Electricity Consumer Price
$(M)
Production Cost $ (M)
Emissions Level Million MT
Investment $ (M)
2011 7,084.5 8,967.2 10,371.3 8,507.6 117.0 170.72
2012 7,428.8 9,426.7 10,890.7 8,869.1 117.2 341.43
2013 7,513.8 9,545.2 11,115.2 9,071.5 118.5 512.15
2014 7,607.6 9,663.6 11,321.2 9,096.2 122.1 682.86
2015 7,896.0 10,042.3 11,775.3 9,370.9 124.6 853.58
2016 8,226.7 10,478.5 12,278.5 9,738.1 127.9 1,024.29
2017 8,441.8 10,754.7 12,631.2 9,982.8 129.2 1,195.01
2018 8,416.2 10,723.5 12,611.3 9,900.6 126.1 1,365.72
2019 8,451.5 10,770.7 12,678.9 9,851.2 122.5 1,536.44
2020 8,790.5 11,202.2 13,204.3 10,191.9 124.5 1,707.15
2021 9,160.4 11,672.7 13,787.4 10,566.0 126.5 1,877.87
2022 9,583.6 12,211.0 14,439.9 10,973.7 128.5 2,048.58
2023 9,965.7 12,702.7 15,025.8 11,311.5 130.6 2,219.30
2024 10,164.5 12,963.6 15,318.9 11,606.9 132.8 2,390.01
2025 10,590.3 13,504.2 15,986.8 11,997.5 134.9 2,560.73
2026 11,008.1 14,037.4 16,626.1 12,425.6 137.1 2,731.44
2027 11,593.4 14,783.5 17,510.7 12,839.9 139.4 2,902.16
2028 12,131.7 15,470.8 18,315.9 13,294.4 141.7 3,072.87
2029 12,830.0 16,359.0 19,393.6 13,806.3 144.0 3,243.59
2030 13,602.2 17,343.5 20,560.8 14,312.0 146.5 3,414.30
20 Adjusted from Wholesale to Retail prices using Industrial/Commercial/Residential Ratios

Phase Two of Florida C&T Project: Economic Analysis
27
The characteristics of the electricity fuel cost in the commercial sector are similar to those in the industrial sector even though the former is on average higher than the latter, by 21.5%. The fuel cost of electricity use in the commercial sector is projected to reach $8.967 billion by the end of year 2011. It is also projected to nearly double in twenty years to $17.344 billion.
Figure 13: Electricity Fuel and Production Costs for BAU without Caps for Years 2011‐2030
The production cost of electric power generation (including transmission, and distribution) series follows a similar trend line as the electricity fuel cost series. The production cost is projected to reach $8.508 billion in 2011 and continues to increase until it is projected to reach $14.312 billion in 2030. Again, the increased costs are linear and exhibit a slow rate of growth. The incremental change is true for consumer price as well, which grows 52% from 2011 to 2030.
Figures 14‐18 represent the projected trends in the main macroeconomic indicators in the absence of caps; or a cap‐and‐trade program. The indicators encompass GDP, Disposable Personal Income, Employment, Population, and State Revenues and Expenditures for the period 2010‐2030.
The economic impact analysis performed in REMI was based on 2008 economic data. During this time period, 2008 was in the middle of the most recent recession, hence, the REMI model has

Phase Two of Florida C&T Project: Economic Analysis
28
accounted for the current economic situation when the U.S. economy began shrinking in the end of 2007, as concluded by the National Bureau of Economic Analysis.21
GDP is projected to reach $621 billion by the end of the current year and increase by $420 billion in 2030, totaling $1,041 billion at the end of year 2030. The annual growth rate of GDP in the State of Florida is projected to average 3.4% over the projected time frame.
Disposable Personal Income (DPI) is projected to reach $553 billion in 2010 and $842 billion in 2030 with an average amount of increase of $289 billion. In the twenty‐year period, the annual increase is projected to average $14.4 billion. The annual growth rate in DPI is expected to reach 2.6% over time.
Figure 14: GDP and Disposable Personal Income for BAU without Caps for Years 2011‐2030
Figure 15 shows the general trend in population and employment in Florida over the next 20 years. The population growth rate averages 1.7% during the period 2011‐2030. However, the population growth rate gradually declines from about 1.8% in the period 2011‐2016, to 1.7% in the period 2017‐2027, and then to 1.6% during the period (2028‐2030).
21 “The committee identified December 2007 as the peak month, after determining that the subsequent decline in economic activity was large enough to qualify as a recession.” NBER Determination of the December 2007 Peak in Economic Activity. 2008
0
200
400
600
800
1,000
$ ( Billions)
Real Disposable Personal Income Real GDP

Phase Two of Florida C&T Project: Economic Analysis
29
Figure 15: Population and Employment for BAU without Caps for Years 2011‐2030
The total employment in Florida is projected to increase by 2,482 employees in 2030 when compared to 2010, with an annual percentage increase of 6.2%. However, the year‐to‐year growth of employment does not follow a gradual semi‐linear path like the population growth. In 2011, the employment growth rate is projected to reach 1.0%, and is projected to keep increasing until it peaks in 2013 where it is estimated to reach 1.4%. After that, with the exception of 2019, the annual growth rate of employment is projected to continue falling until it reaches a trough in year 2020. Thereafter, it is projected to keep increasing until the end of year 2030.
0
5
10
15
20
25
30Thousands
Employment Population

Phase Two of Florida C&T Project: Economic Analysis
30
Figure 16: Population and Employment Growth Rates for BAU without Caps for Years 2011‐2030
Regarding the State of Florida Revenues and Expenditures that are represented in Figure 17, it is projected that the State will attain a surplus of $13.8 billion annually for the time period 2011‐2030. As depicted on Figure 18, this “rosy outlook” estimate is enhanced by another projection that the state surplus will keep growing at increasing rates.
0.0%
0.2%
0.4%
0.6%
0.8%
1.0%
1.2%
1.4%
1.6%
1.8%
2.0%Population Growth Employment Growth

Phase Two of Florida C&T Project: Economic Analysis
31
Figure 17: Revenues and Expenditures for BAU without Caps for Years 2011‐2030
Figure 18: Budget Surplus Trend for BAU without Caps for Years 2011‐2030
0
20
40
60
80
100
120
140$ ( Billions)
State Expenditures State Revenues
0
5
10
15
20
25
2010 2015 2020 2025 2030
$ (Billion)
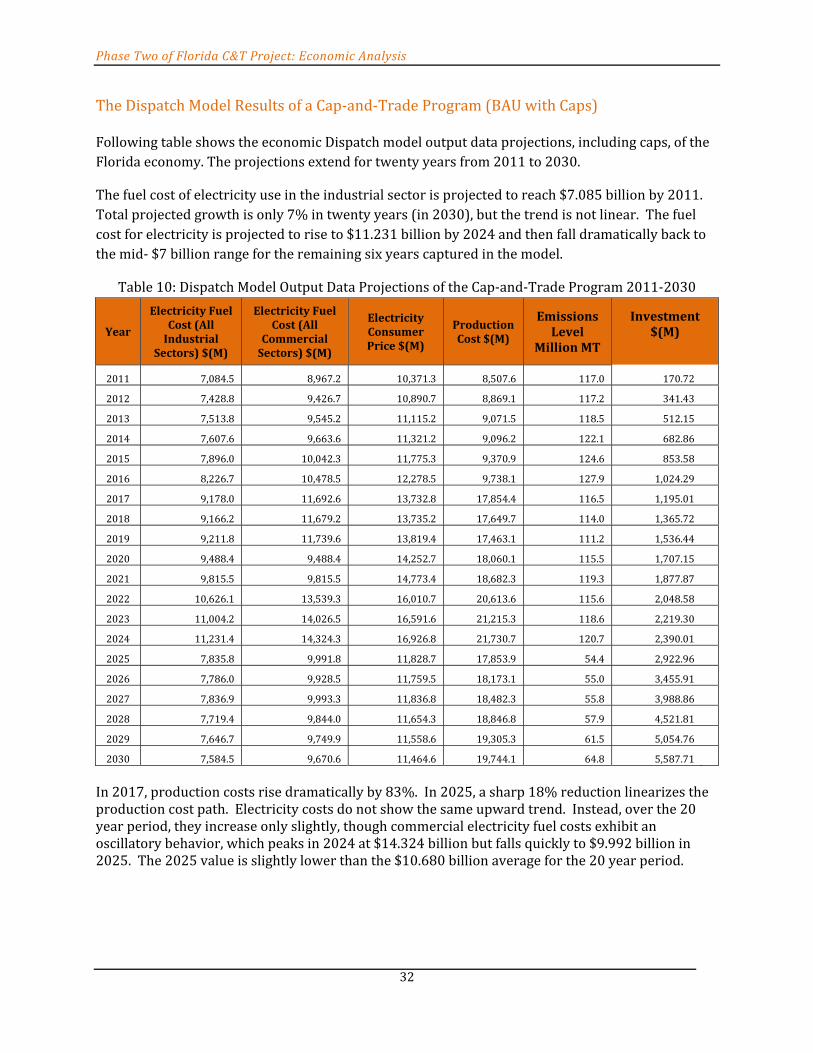
Phase Two of Florida C&T Project: Economic Analysis
32
The Dispatch Model Results of a Cap‐and‐Trade Program (BAU with Caps)
Following table shows the economic Dispatch model output data projections, including caps, of the Florida economy. The projections extend for twenty years from 2011 to 2030.
The fuel cost of electricity use in the industrial sector is projected to reach $7.085 billion by 2011. Total projected growth is only 7% in twenty years (in 2030), but the trend is not linear. The fuel cost for electricity is projected to rise to $11.231 billion by 2024 and then fall dramatically back to the mid‐ $7 billion range for the remaining six years captured in the model.
Table 10: Dispatch Model Output Data Projections of the Cap‐and‐Trade Program 2011‐2030
Year
Electricity Fuel Cost (All Industrial
Sectors) $(M)
Electricity Fuel Cost (All
Commercial Sectors) $(M)
Electricity Consumer Price $(M)
Production Cost $(M)
Emissions Level
Million MT
Investment $(M)
2011 7,084.5 8,967.2 10,371.3 8,507.6 117.0 170.72
2012 7,428.8 9,426.7 10,890.7 8,869.1 117.2 341.43
2013 7,513.8 9,545.2 11,115.2 9,071.5 118.5 512.15
2014 7,607.6 9,663.6 11,321.2 9,096.2 122.1 682.86
2015 7,896.0 10,042.3 11,775.3 9,370.9 124.6 853.58
2016 8,226.7 10,478.5 12,278.5 9,738.1 127.9 1,024.29
2017 9,178.0 11,692.6 13,732.8 17,854.4 116.5 1,195.01
2018 9,166.2 11,679.2 13,735.2 17,649.7 114.0 1,365.72
2019 9,211.8 11,739.6 13,819.4 17,463.1 111.2 1,536.44
2020 9,488.4 9,488.4 14,252.7 18,060.1 115.5 1,707.15
2021 9,815.5 9,815.5 14,773.4 18,682.3 119.3 1,877.87
2022 10,626.1 13,539.3 16,010.7 20,613.6 115.6 2,048.58
2023 11,004.2 14,026.5 16,591.6 21,215.3 118.6 2,219.30
2024 11,231.4 14,324.3 16,926.8 21,730.7 120.7 2,390.01
2025 7,835.8 9,991.8 11,828.7 17,853.9 54.4 2,922.96
2026 7,786.0 9,928.5 11,759.5 18,173.1 55.0 3,455.91
2027 7,836.9 9,993.3 11,836.8 18,482.3 55.8 3,988.86
2028 7,719.4 9,844.0 11,654.3 18,846.8 57.9 4,521.81
2029 7,646.7 9,749.9 11,558.6 19,305.3 61.5 5,054.76
2030 7,584.5 9,670.6 11,464.6 19,744.1 64.8 5,587.71
In 2017, production costs rise dramatically by 83%. In 2025, a sharp 18% reduction linearizes the production cost path. Electricity costs do not show the same upward trend. Instead, over the 20 year period, they increase only slightly, though commercial electricity fuel costs exhibit an oscillatory behavior, which peaks in 2024 at $14.324 billion but falls quickly to $9.992 billion in 2025. The 2025 value is slightly lower than the $10.680 billion average for the 20 year period.

Phase Two of Florida C&T Project: Economic Analysis
33
Figure 19: Electricity and Production Costs with a Cap‐and‐Trade Program for Years 2011‐2030
The Dispatch Model Results Comparison between BAU and a Cap‐and‐Trade Program (Caps minus BAU)
The comparisons between BAU and a cap‐and‐trade program are calculated by taking differences between the two economic projections (cap‐and‐trade minus BAU). Therefore, for example, positive results for measures such as GDP, disposable income, and jobs indicate that cap‐and‐Trade is projected to have a positive economic impact of the Florida economy. However, positive results for the variable “costs” indicate that cap‐and‐trade is more costly when compared with the BAU.
With the implementation of a cap‐and‐trade program, there is no difference in terms of electricity and production cost impacts, until year 2017. From the years 2017 to 2024 the effect of the emissions cap is increasing industrial fuel costs, commercial fuel costs, and production costs by an average of $843 million, $1.075 billion, and $8.611 billion, respectively. Year 2024 is projected to be the costliest year for enacting a cap‐and‐trade system under existing conditions. However, in year 2025, both fuel and production costs fall dramatically across the board despite the stricter emissions cap of 89.5 MMT, in 2025. This is due to new generating units becoming available (i.e., higher initial capital costs but lower variable costs). By 2030, industrial fuel costs are down $6.0

Phase Two of Florida C&T Project: Economic Analysis
34
billion and commercial fuel costs are down $7.7 billion, while consumer price falls to $5.4 billion from a peak of $10.1 billion.
The Dispatch output prepared for REMI input is given in the table below:
Table 11: Difference in Electricity and Production Costs between BAU and Cap‐and‐Trade Program
Year
Electricity Fuel Cost (All Industrial
Sectors) $(M)
Electricity Fuel Cost (All
Commercial Sectors) $(M)
Electricity Consumer Price
$(M)
Production Cost $ (M)
Emissions Level
Million MT
Investment $ (M)
2011 0 0 0 0 0.0 0.00
2012 0 0 0 0 0.0 0.00
2013 0 0 0 0 0.0 0.00
2014 0 0 0 0 0.0 0.00
2015 0 0 0 0 0.0 0.00
2016 0 0 0 0 0.0 0.00
2017 736 938 1,102 7,872 ‐12.7 0.00
2018 750 956 1,124 7,749 ‐12.1 0.00
2019 760 969 1,141 7,612 ‐11.3 0.00
2020 698 889 1,048 7,868 ‐9.0 0.00
2021 655 835 986 8,116 ‐7.2 0.00
2022 1,043 1,328 1,571 9,640 ‐12.9 0.00
2023 1,039 1,324 1,566 9,904 ‐12.0 0.00
2024 1,067 1,361 1,608 10,124 ‐12.1 0.00
2025 ‐2,754 ‐3,512 ‐4,158 5,856 ‐80.5 362.24
2026 ‐3,222 ‐4,109 ‐4,867 5,747 ‐82.1 724.47
2027 ‐3,757 ‐4,790 ‐5,674 5,642 ‐83.5 1,086.71
2028 ‐4,412 ‐5,627 ‐6,662 5,552 ‐83.8 1,448.94
2029 ‐5,183 ‐6,609 ‐7,835 5,499 ‐82.5 1,811.18
2030 ‐6,018 ‐7,673 ‐9,096 5,432 ‐81.7 2,173.41
The long term effect of the emissions cap is that electricity fuel costs in the industrial, commercial and residential sectors will be less than the BAU from years 2025‐2030. Production costs will be expected to decrease during that same time period given the influx of additional capital costs (with reduced variable costs). It’s important to note, as mentioned earlier, that fuel costs are one component, and a major driver, of production costs. In addition to fuel costs, there are other variables included in production costs, such as operation & maintenance cost, fuel adders, and emissions costs, however, from years 2025 – 2030, fuel costs comprise an average of 38.1% of production costs.

Phase Two of Florida C&T Project: Economic Analysis
35
Figure 20: Difference in Electricity and Production Costs between BAU and Cap‐and‐Trade Program
for Years 2011‐2030
Fuels are grouped as Coal, Nuclear, Natural Gas, Oil, and Renewable. The fuel costs associated with natural gas are greater for years 2017 – 2024 before subsequent sharp decreases from years 2025 to 2030. This is a result of the change in fuel mix to a cleaner source. Coal also experiences a sharp decrease in year 2025. Oil, nuclear and renewables do not enter the fuel mix portfolio in a significant way (due to the latest EIA levelized cost figures).
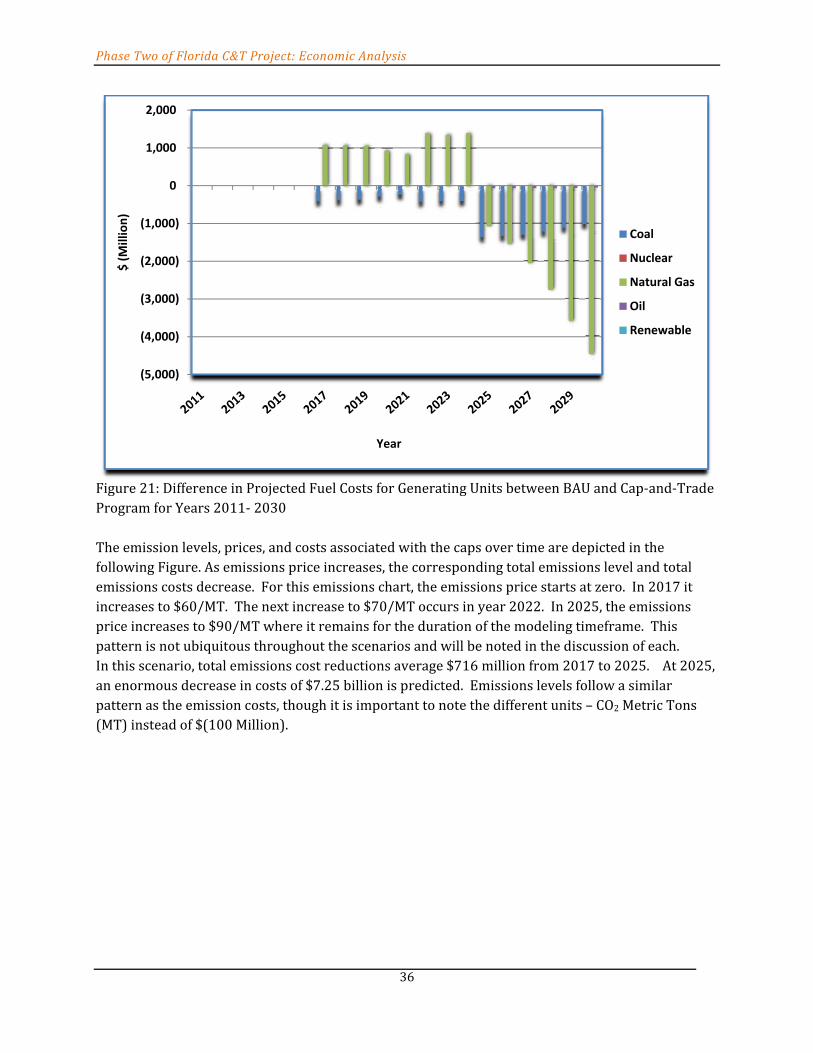
Phase Two of Florida C&T Project: Economic Analysis
36
Figure 21: Difference in Projected Fuel Costs for Generating Units between BAU and Cap‐and‐Trade Program for Years 2011‐ 2030 The emission levels, prices, and costs associated with the caps over time are depicted in the following Figure. As emissions price increases, the corresponding total emissions level and total emissions costs decrease. For this emissions chart, the emissions price starts at zero. In 2017 it increases to $60/MT. The next increase to $70/MT occurs in year 2022. In 2025, the emissions price increases to $90/MT where it remains for the duration of the modeling timeframe. This pattern is not ubiquitous throughout the scenarios and will be noted in the discussion of each. In this scenario, total emissions cost reductions average $716 million from 2017 to 2025. At 2025, an enormous decrease in costs of $7.25 billion is predicted. Emissions levels follow a similar pattern as the emission costs, though it is important to note the different units – CO2 Metric Tons (MT) instead of $(100 Million).
(5,000)
(4,000)
(3,000)
(2,000)
(1,000)
0
1,000
2,000 $ (Million)
Year
Coal
Nuclear
Natural Gas
Oil
Renewable

Phase Two of Florida C&T Project: Economic Analysis
37
Figure 22: Difference in Emissions Price, Total Emissions Cost, and Emissions Level between BAU and Cap‐and‐Trade Program for Years 2011‐2030
Production costs are higher under the cap‐and‐trade program starting in 2017. From 2017 to 2030, the average production costs are $7.3 billion per year higher than BAU.
Figure 23: Difference in Production Costs between BAU and Cap‐and‐Trade Program for Years 2011‐2030
(100)
(80)
(60)
(40)
(20)
0
20
40
60
80
100
Total Emissions Cost $(100Million)
Emissions Price $/MT
(90)
(80)
(70)
(60)
(50)
(40)
(30)
(20)
(10)
0
Emissions level CO₂ MMT
0
2,000
4,000
6,000
8,000
10,000
12,000
$ (Million)
Year

Phase Two of Florida C&T Project: Economic Analysis
38
GDP under the cap‐and‐trade program is projected to be less than GDP under the BAU by $1.59 billion in 2017 and $2.46 billion in 2030. There is an average difference of $2.53 billion from 2017 to 2030 or 0.36% lower GDP per year under the cap‐and‐trade Program.
Disposable Personal Income under the cap‐and‐trade program is projected to be less than BAU by $2.35 billion by the end of the current year and end at $2.37 billion in 2030. The annual difference is projected to average 0.46% from 2017 to 2030.
Figure 24: Difference in GDP and Disposable Personal Income between BAU and Cap‐and‐Trade Program for Years 2011‐2030
The impact of caps on employment in Florida is not much different from the impact on GDP and real disposable personal income. In 2017, immediately with the initialization of carbon prices, Florida suffers a loss of 16,100 jobs. This decline continues as the caps become more binding with higher carbon price peaking to a loss of 31,800 thousand jobs in 2024. The situation starts improving after year 2025 due in part to the addition of new renewable (biomass) power plants.
(3.50)
(3.00)
(2.50)
(2.00)
(1.50)
(1.00)
(0.50)
0.00
$ (Billion)
Gross Domestic Product Real Disposable Personal Income

Phase Two of Florida C&T Project: Economic Analysis
39
Figure 25: Difference in Employment between BAU and Cap‐and‐Trade Program for Years 2011‐2030
The total employment in Florida is projected to decrease by 22,665 employees in 2030 when compared to 2010. However, the year‐to‐year growth of employment does not follow a gradual semi‐linear path like the population growth. Whereas population growth continues to fall, employment starts to rebound in 2024, growing at average of 5.4% until 2030.
(35)
(30)
(25)
(20)
(15)
(10)
(5)
0
Thousands
Employment
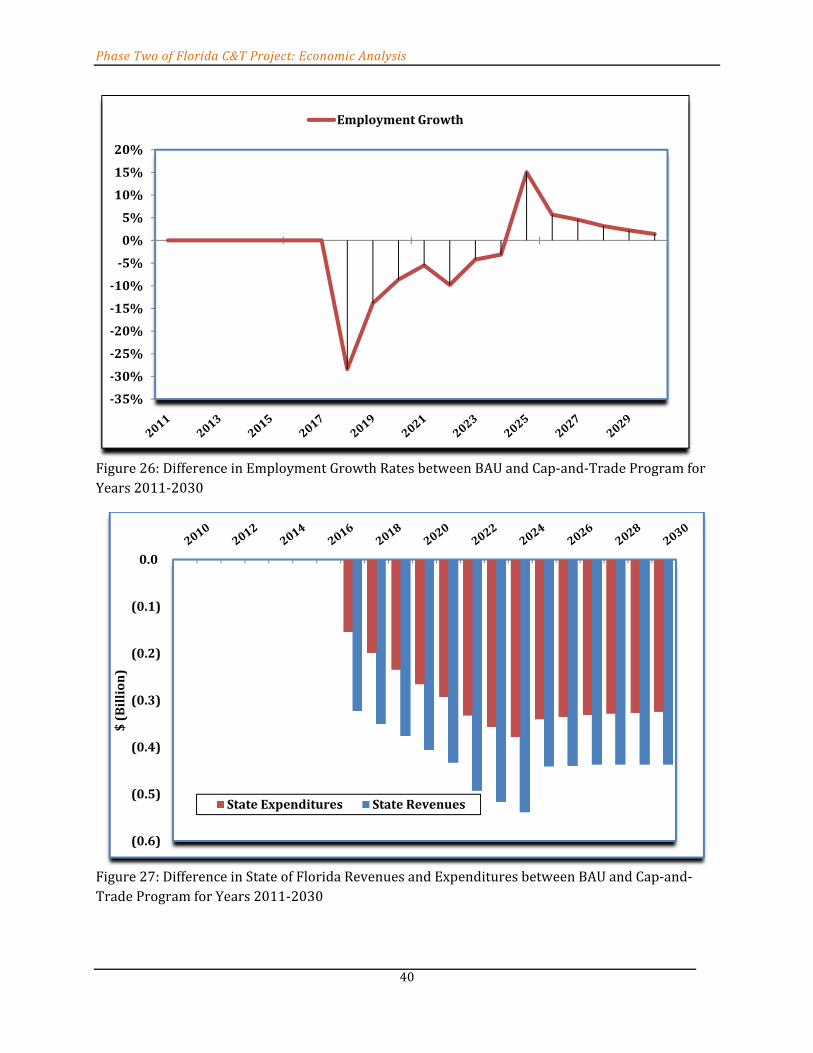
Phase Two of Florida C&T Project: Economic Analysis
40
Figure 26: Difference in Employment Growth Rates between BAU and Cap‐and‐Trade Program for Years 2011‐2030
Figure 27: Difference in State of Florida Revenues and Expenditures between BAU and Cap‐and‐Trade Program for Years 2011‐2030
35%
30%
25%
20%
15%
10%
5%
0%
5%
10%
15%
20%
Employment Growth
(0.6)
(0.5)
(0.4)
(0.3)
(0.2)
(0.1)
0.0
$ (Billion)
State Expenditures State Revenues

Phase Two of Florida C&T Project: Economic Analysis
41
Regarding the State of Florida Revenues and Expenditures that are represented in Figure 27, it is projected that the surplus in the BAU scenario will be offset by a larger sized deficit under the cap‐and‐trade program. As depicted on Figure 28, this “dismal outlook” estimate is partially offset by the projection that the difference between BAU and cap‐and‐trade will decrease over the thirteen year time period. As noted earlier, the revenues collected from the proposed cap‐and‐trade program were not reallocated to government spending, or any other appropriate sectors, for this particular REMI model results examination.
Figure 28: Projected State Budget Deficit for BAU – Caps (or with a Cap‐and‐Trade Program) for Years 2011‐2030
Policy Scenarios using REMI Comparison
Each policy scenario represents a unique policy option or set of options. The policy options represent actions or events that could potentially take place in the future. The results indicate a projection of increases or decreases associated with implementing a cap‐and‐trade program with various policy options described in the set of scenarios.
The economic impact results are compared to the relative changes expected between BAU and a cap‐and‐trade program given the policy options described in each scenario. In addition, each policy can be compared to just having a cap‐and‐trade program (BAU – Caps). While all the policies, on average, mitigate the predicted negative impact of cap‐and‐trade, positive economic impacts are predicted for the 5% Load Reduction, $21 Allowance Price, ACEEE, WM, and Coal scenarios.
(1.8)
(1.6)
(1.4)
(1.2)
(1.0)
(0.8)
(0.6)
(0.4)
(0.2)
0.0
$ (Billion)
Budget Deficit

Phase Two of Florida C&T Project: Economic Analysis
42
Low and High Fuel Cost Projections Scenario The research team performed scenarios with low fuel cost and high fuel cost projections.22 These two scenarios were then compared with the Dispatch model BAU and with the Dispatch model with caps.
The following figure is based on the Dispatch model results for low fuel cost projections. Coal starts out with larger increases; for the entire period costs average $1.386 billion. Natural gas shows the highest increases, which peak in 2025 at $8.076 billion. Nuclear and oil are about the same for all the scenarios. Nuclear starts at $141 million and ends at $239 million. Oil starts at about $75 million with subsequent reductions over time except in the $21 Allowance Price scenario. For all scenarios, renewable costs are zero.
Figure 29: Fuel Costs for Generating Units for Low Fuel Costs with a Cap‐and‐Trade Program for Years 2011‐2030 Emissions price follows a slightly different incremental increase for the low fuel cost scenario. Total emissions costs rise until 2025 and then fall 41.5% to $4.9 billion. Emissions level stays fairly constant from 2011 to 2024. In 2025, the level drops 54.5% to 54.7 CO2 MMT and stays under 60 CO2 MMT through 2030.
22 The original full report and updated reference case are available at http://www.eia.doe.gov/oiaf/aeo/index.html. The specific assumptions for each of these factors are given in the Assumptions to the Annual Energy Outlook, available at http://www.eia.doe.gov/oiaf/aeo/index.html.
0
1,000
2,000
3,000
4,000
5,000
6,000
7,000
8,000
9,000
10,000
$ (Million)
Year
Renewable
Oil
Natural Gas
Nuclear
Coal

Phase Two of Florida C&T Project: Economic Analysis
43
Figure 30: Emissions for Generating Units for Low Fuel Costs with a Cap‐and‐Trade Program for Years 2011‐2030
Production Costs for the low cost scenario with caps are lower than those in the cap‐and‐trade Program every year except 2016. The largest reduction takes place from 2017 to 2022 in which decreases average $2.0 billion. This is an average of 10.9% cost reduction when compared to the current projected fuel costs for a state cap‐and trade program.
Figure 31: Production Costs for Low Fuel Costs with a Cap‐and‐Trade Program for Years 2011‐2030
0
10
20
30
40
50
60
70
80
90
100
Total Emissions Cost $(100Million)
Emissions Price $/MT
0
20
40
60
80
100
120
140
Emissions level CO₂ MMT
(2,500)
(2,000)
(1,500)
(1,000)
(500)
0
500
1,000
$ (Million)
Year

Phase Two of Florida C&T Project: Economic Analysis
44
Below are the REMI results for the low fuel cost projections. In the year 2011, GDP increases $97 million and reaches a$234 million increase in year 2017. From year 2017, GDP under the caps declines sharply to a negative peak of $28.9 billion in year 2024. GDP is projected to reach $883 billion in 2024 under the BAU, which is 3.27% higher than GDP under this policy scenario of low fuel costs with a cap‐and‐trade program.
Disposable personal income experiences a similar trend as a result of caps. It declines by $1.8 billion in year 2017 with higher negative values as the caps become more binding with higher carbon prices, as illustrated in the Figure below. Compared to a cap‐and‐trade program (BAU – Caps), GDP and income follow the same trend. However, the negative impact is mitigated slightly in the later years by the low fuel costs parameter. GDP averages $316 million per year higher and income is $342 million per year higher than GDP and income in the cap‐and‐trade program. This is the smallest offset of all the policy scenarios.
Figure 32: GDP and Disposable Personal Income for Low Fuel Costs with a Cap‐and‐Trade Program for Years 2011‐2030
With low fuel cost projections under the cap‐and‐trade program, the Florida economy maintains a small, positive increase in jobs until 2016. At that point, job loss becomes severe with higher carbon prices. Job losses peak in 2024 with a loss of 28,045 jobs. Lower fuel costs mitigate the negative impact on jobs of the cap‐and‐trade program by an average of 3,328 jobs per year.
(3,500)
(3,000)
(2,500)
(2,000)
(1,500)
(1,000)
(500)
0
500
$ (Million)
Year
GDP
Real Disp. Pers. Inc

Phase Two of Florida C&T Project: Economic Analysis
45
Figure 33: Employment for Low Fuel Costs with a Cap‐and‐Trade Program for Years 2011‐2030
In the high fuel case with caps, fuel costs follow similar trends. Coal averages $1.593 billion for the period of the scenario and natural gas peaks at $8.613 billion in 2024.
(30,000)
(25,000)
(20,000)
(15,000)
(10,000)
(5,000)
0
5,000
Year
Employment

Phase Two of Florida C&T Project: Economic Analysis
46
Figure 34: Fuel Costs for Generating Units for High Fuel Costs with a Cap‐and‐Trade Program for Years 2011‐2030
For the High Fuel Cost scenario, the incremental emissions price increases occur similarly but not the same as the Low Fuel Cost scenario. The emissions level cost and emissions level for the High Fuel Cost case appear similar to the Low Fuel Cost case. The major difference is that for the final six years, the costs are higher. Emissions level is 66.6 CO2 MMT which is higher than the Low Fuel Cost scenario by 8.4 CO2 MMT and total emissions costs are $6.0 billion, which is higher by $754 million.
0
2,000
4,000
6,000
8,000
10,000
12,000 $ (Million)
Year
Renewable
Oil
Natural Gas
Nuclear
Coal

Phase Two of Florida C&T Project: Economic Analysis
47
Figure 35: Emissions for Generating Units for High Fuel Costs with a Cap‐and‐Trade Program for Years 2011‐2030
In contrast to the Low Fuel Cost scenario, the High Fuel Cost with caps scenario shows increases in production costs compared to the cap‐and‐trade program. With the exception of Year 2022, production costs increase by an average of $397 million per year. Including 2022, production costs average an increase of $317 million under high fuel costs with caps. Compared to the average yearly production costs of $16.0 billion under the cap‐and‐trade program, the average increase in costs is 1.98% per year.
Figure 36: Production Costs for High Fuel Costs with a Cap‐and‐Trade Program for Years 2011‐2030
0
10
20
30
40
50
60
70
80
90
100
Total Emissions Cost $(100Million)
Emissions Price $/MT
0
20
40
60
80
100
120
140
Emissions level CO₂ MMT
(1,400)
(1,200)
(1,000)
(800)
(600)
(400)
(200)
0
200
400
600
800
$ ( M
illion)

Phase Two of Florida C&T Project: Economic Analysis
48
With the imposition of caps in year 2011, GDP declines only $51 million under the high fuel price projection. This negative impact contrasts with the low fuel case which maintains a positive GDP comparison through year 2015. After 2015, the high fuel case has much less abrupt decreases in GDP compared to the low fuel case. GDP under the high fuel case with caps is never less than 0.032% of GDP under BAU. Disposable personal income declines by $80 million in year 2011, with greater negative values as the caps become more binding with higher carbon price. While the high fuel costs scenario is detrimental to the economy compared to BAU, its negative effect is far less than the cap‐and‐trade program. The high fuel cost scenario saves an average of $1.625 billion per year in GDP and $1.676 billion per year in income that would otherwise have been lost under cap‐and‐trade. Out of all the scenarios, this is the third worst at mitigating the negative economic impact of cap‐and‐trade.
Figure 37: GDP and Disposable Personal Income for High Fuel Costs with a Cap‐and‐Trade Program for Years 2011‐2030
The effect on employment is also negative. In year 2011, the Florida economy loses about 583 jobs compared to BAU, with job loss becoming greater with associated higher carbon prices. However, this impact over the twenty year period is lower than the impact under the low fuel cost projection, where the Florida economy is projected to experience losses in the tens of thousands.
(300)
(200)
(100)
0
100
200
300
$ (Million)
Year
GDP
Real Disp. Pers. Inc

Phase Two of Florida C&T Project: Economic Analysis
49
Figure 38: Employment for High Fuel Costs with a Cap‐and‐Trade Program for Years 2011‐2030
5% Load Reduction and 5% Increase Scenario There were two scenarios included in this Dispatch model run; one scenario examined a 5% load reduction to year 2030, and the second scenario ran a projection based on a 5% load increase over time23. Under the load increase scenario, the Dispatch model builds ‘NG Advanced Combined Cycle’ plants as new plants for the Carbon prices from $0/MT to $90/MT. However, for the prices of $90/MT or greater, the model builds ‘biomass’ plants. Biomass plants in the model, were based on the EIA levelized cost figures, is currently less costly than nuclear plants, in terms of initial capital outlay.
These two scenarios were then compared with the BAU Dispatch model and then, similar to the low and high fuel cost scenarios, compared with the Dispatch model with caps.
The fuel costs associated with the 5% Load Reduction show increasing costs for natural gas until year 2025. Fuel costs for natural gas are lower than the low fuel and high fuel scenarios. Natural gas peaks at $6.994 billion. Coal has a similar average to the low and high fuel scenarios of $1.567 billion, but there is more variability over time. Costs for coal in the beginning are higher from years 2011 to 2024, and lower after year 2024, than when compared with the low and high fuel cost scenarios.
23 Based on the Florida Reliability Coordinating Council, Inc. (FRCC) July 2010 Regional Load and Resource Plan.
(3,000)
(2,500)
(2,000)
(1,500)
(1,000)
(500)
0
500
1,000
1,500
Year
Employment

Phase Two of Florida C&T Project: Economic Analysis
50
Figure 39: Fuel Costs for Generating Units for 5% Load Reduction with a Cap‐and Trade Program for Years 2011‐2030
Emissions price takes a more extreme approach in this scenario as compared to previous scenarios. Rather than fitting in from 2017 to 2030, the incremental increases start in year 2022. As with the other scenarios, total emissions cost and emission level experience the same dip in year 2025. Emission level ends 2030 at 56.2 CO2 MMT and total emissions cost ends at $5.1 billion.
Figure 40: Emissions for Generating Units for 5% Load Reduction with a Cap‐and‐Trade Program for Years 2011‐2030
0
1,000
2,000
3,000
4,000
5,000
6,000
7,000
8,000
9,000
10,000 $ (Million)
Year
Renewable
Oil
Natural Gas
Nuclear
Coal
0
10
20
30
40
50
60
70
80
90
100
Total Emissions Cost $(100Million)
Emissions Price $/MT
0
20
40
60
80
100
120
140
Emissions level CO₂ MMT

Phase Two of Florida C&T Project: Economic Analysis
51
Decreases in production cost vary tremendously in this scenario. From years 2017 to 2022, peak decreases in production cost reach $9.1 billion, which is a 44.1% decrease from the current projected cap‐and‐trade program for the same year. Excluding years 2017 – 2022, the annual average cost decrease is $1.4 billion.
Figure 41: Production Costs for 5% Load Reduction with a Cap‐and‐Trade Program for Years 2011‐2030
Unlike the previous scenarios, the REMI output for GDP and personal disposable income shows gains under the 5% Load Reduction Scenario, especially from years 2017 to 2022, where GDP averages an annual increase of $3.8 billion and income averages $4.2 billion. These are 0.48% and 0.62% average increases compared to BAU. Those levels drop down in years 2023 and 2024, and eventually settle at around $1.3 billion for both GDP and Income. However, the 5% load reduction scenario is able to more than offset the negative impacts of the cap‐and‐trade program on GDP and disposable income. In fact, this is the second best policy scenario modeled in terms of mitigating the negative economic impact of a cap‐and‐trade program. The average yearly offset in GDP and income compared to the cap‐and‐trade program are $3.664 billion and $3.790, respectively.
(10,000)
(9,000)
(8,000)
(7,000)
(6,000)
(5,000)
(4,000)
(3,000)
(2,000)
(1,000)
0
$ (Million)
Year

Phase Two of Florida C&T Project: Economic Analysis
52
Figure 42: GDP and Disposable Personal Income for 5% Load Reduction with a Cap‐and‐Trade Program for years 2011‐2030
Not surprisingly given the GDP and income projections, the effect on employment from 5% Load Reduction is positive. In 2011, Florida economy gains 2,302 jobs and experiences a job increase, until a peak in year 2022, of 44,198 jobs new jobs created compared to the BAU. This projection is much more positive than estimates for the cap‐and‐trade program. On average, 37,055 more jobs per year are created under 5% load reduction than the cap‐and‐trade.
0
500
1,000
1,500
2,000
2,500
3,000
3,500
4,000
4,500
5,000$ (Million)
Year
GDP
Real Disp. Pers. Inc

Phase Two of Florida C&T Project: Economic Analysis
53
Figure 43: Employment for 5% Load Reduction with a Cap‐and‐Trade Program for years 2011‐2030
In the 5% Load Increase scenario, a similar trend to the previous scenarios shows that after year 2024, fuel costs for natural gas and coal are not as severe. In this 5% Load Increase scenario, natural gas peaks at $9.919 billion in 2024. Coal averages $1.413 billion for the period with higher fuel costs in the earlier years.
0
5,000
10,000
15,000
20,000
25,000
30,000
35,000
40,000
45,000
50,000
Year
Employment

Phase Two of Florida C&T Project: Economic Analysis
54
Figure 44: Fuel Costs for Generating Units for 5% Load Increase with a Cap‐and‐Trade Program for Years 2011‐2030
Emissions price is modeled with a more gradual increase in this scenario. Emissions costs and level have a similar trend line when compared with the previous scenarios with the main exception that the costs and levels are higher. Total emissions cost in year 2030 in the Load Increase scenario is $6.4 billion, which is $1.3 billion more than the Load Reduction scenario. Similarly, the emissions level in this scenario is 64.6 CO2 MMT, which is 8.5 CO2 MMT greater than the Load Reduction scenario. These results are expected under an increased load projection since higher levels of electricity production, with corresponding increases in fuel costs, were included as inputs to the model. Higher costs for energy result in increased unemployment leaving consumers with less discretionary income. This reduces consumer spending, and consequently, economic activity is reduced.24
24 http://www.eurojournals.com/IRJFE%206%20kooros.pdf
0
2,000
4,000
6,000
8,000
10,000
12,000 $ (Million)
Year
Renewable
Oil
Natural Gas
Nuclear
Coal
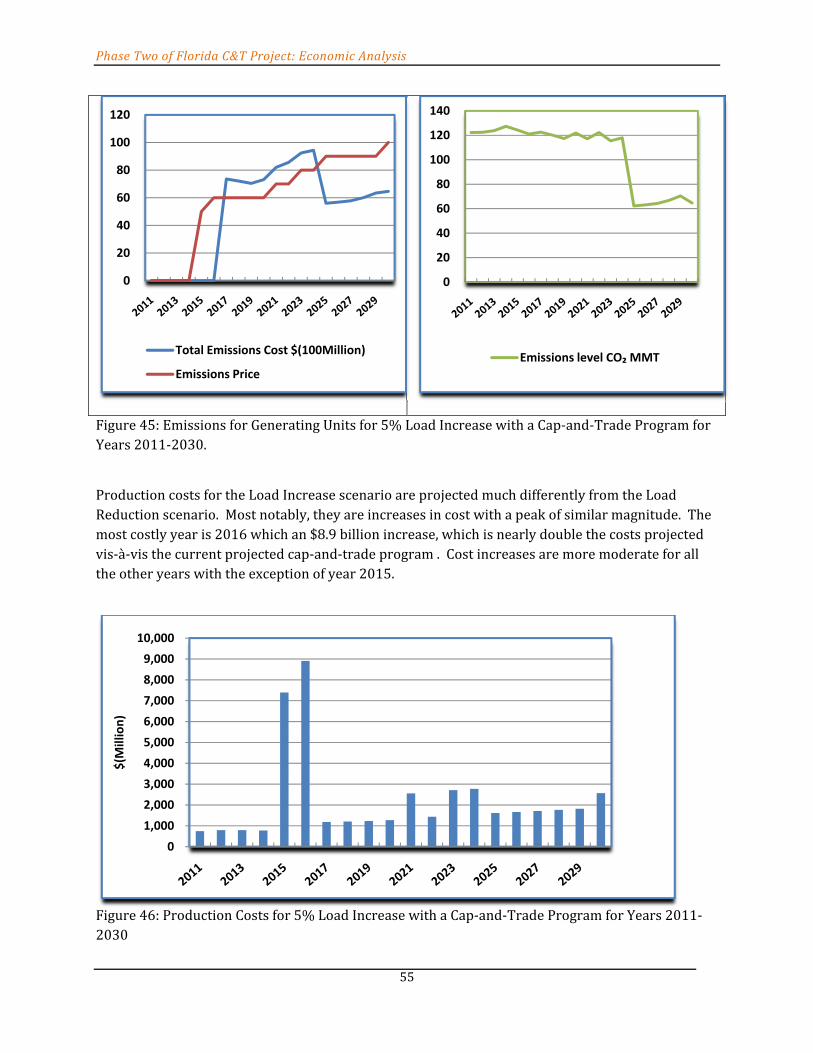
Phase Two of Florida C&T Project: Economic Analysis
55
Figure 45: Emissions for Generating Units for 5% Load Increase with a Cap‐and‐Trade Program for Years 2011‐2030.
Production costs for the Load Increase scenario are projected much differently from the Load Reduction scenario. Most notably, they are increases in cost with a peak of similar magnitude. The most costly year is 2016 which an $8.9 billion increase, which is nearly double the costs projected vis‐à‐vis the current projected cap‐and‐trade program . Cost increases are more moderate for all the other years with the exception of year 2015.
Figure 46: Production Costs for 5% Load Increase with a Cap‐and‐Trade Program for Years 2011‐2030
0
20
40
60
80
100
120
Total Emissions Cost $(100Million)
Emissions Price
0
20
40
60
80
100
120
140
Emissions level CO₂ MMT
0
1,000
2,000
3,000
4,000
5,000
6,000
7,000
8,000
9,000
10,000
$(M
illion)

Phase Two of Florida C&T Project: Economic Analysis
56
The 5% Load Increase scenario impacts GDP and disposable personal income negatively in contrast to the positive economic impacts attributed to 5% Load Reduction. In the Load Increase scenario, GDP and income drop immediately in year 2011 and reach a maximum decline of $2.3 billion and $2.9 billion, respectively in 2016. The losses level out from 2017 to 2030, in which both GDP and disposable income average a decrease of $1.1 billion. This represents a 0.12% and 0.15% decrease when compared to the current projected GDP, and income results under the cap‐and‐trade program. This is the second worst policy scenario at relieving the negative effects of the cap‐and‐trade program.
Figure 47: GDP and Disposable Personal Income for 5% Load Increase with a Cap‐and‐Trade Program for Years 2011‐2030
Again, in contrast to the 5% Load Reduction Scenario, there are job losses in the 5% Load Increase scenario. 2016 is the worst year which results in jobs losses totaling 25,238. For the remaining years, the model predicts an average loss of 10,782 jobs.
(3,500)
(3,000)
(2,500)
(2,000)
(1,500)
(1,000)
(500)
0
$ (Million)
Year
GDP
Real Disp. Pers. Inc
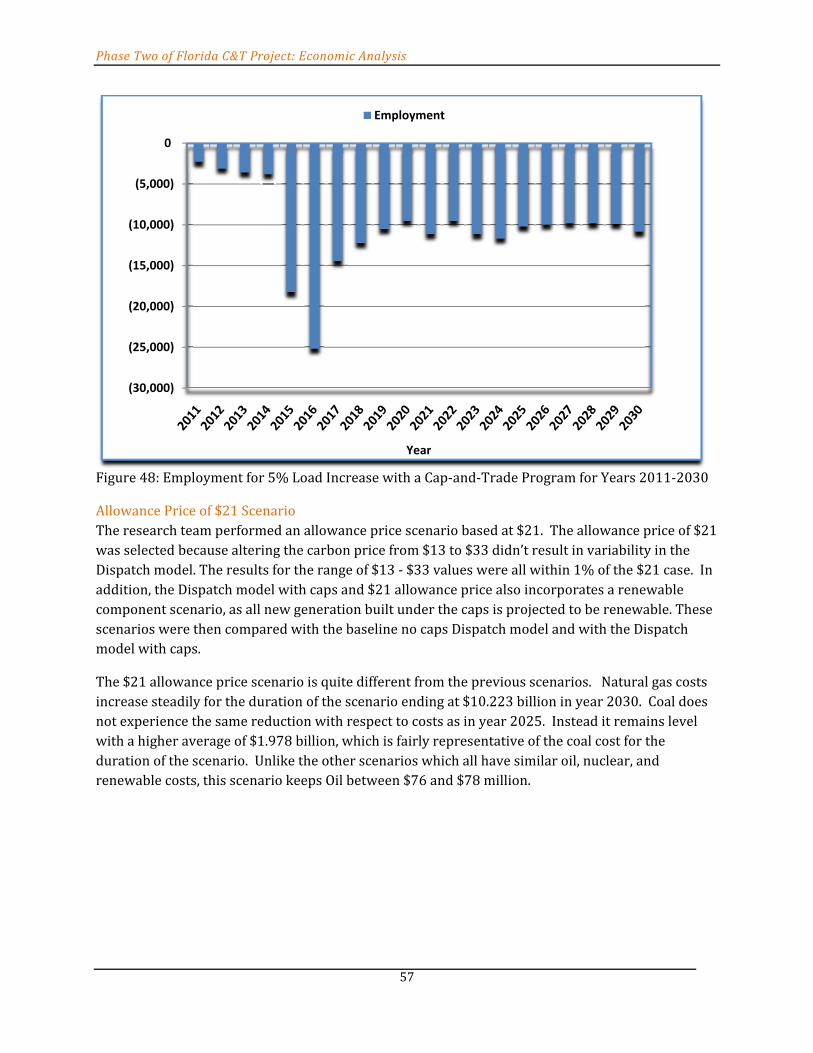
Phase Two of Florida C&T Project: Economic Analysis
57
Figure 48: Employment for 5% Load Increase with a Cap‐and‐Trade Program for Years 2011‐2030
Allowance Price of $21 Scenario The research team performed an allowance price scenario based at $21. The allowance price of $21 was selected because altering the carbon price from $13 to $33 didn’t result in variability in the Dispatch model. The results for the range of $13 ‐ $33 values were all within 1% of the $21 case. In addition, the Dispatch model with caps and $21 allowance price also incorporates a renewable component scenario, as all new generation built under the caps is projected to be renewable. These scenarios were then compared with the baseline no caps Dispatch model and with the Dispatch model with caps.
The $21 allowance price scenario is quite different from the previous scenarios. Natural gas costs increase steadily for the duration of the scenario ending at $10.223 billion in year 2030. Coal does not experience the same reduction with respect to costs as in year 2025. Instead it remains level with a higher average of $1.978 billion, which is fairly representative of the coal cost for the duration of the scenario. Unlike the other scenarios which all have similar oil, nuclear, and renewable costs, this scenario keeps Oil between $76 and $78 million.
(30,000)
(25,000)
(20,000)
(15,000)
(10,000)
(5,000)
0
Year
Employment

Phase Two of Florida C&T Project: Economic Analysis
58
Figure 49: Fuel Costs for Generating Units for $21 Allowance Price with a Cap‐and‐Trade Program for Years 2011‐2030
With the emissions price set at $21, total emission cost stays closely linked to the price, though some growth occurs. Unlike other scenarios, the emissions level does not diminish over time. Instead it continues on a linear growth path from 2019 onward reaching $145 million by 2030.
Figure 50: Emissions for Generating Units for $21 Allowance Price with a Cap‐and‐Trade Program for Years 2011‐2030
0
2,000
4,000
6,000
8,000
10,000
12,000
14,000
$ (Million)
Year
Renewable
Oil
Natural Gas
Nuclear
Coal
0
5
10
15
20
25
30
35
Total Emissions Cost $(100Million)
Emissions Price $/MT
0
20
40
60
80
100
120
140
160
Emissions level CO₂ MMT

Phase Two of Florida C&T Project: Economic Analysis
59
Production costs increase until 2017. The difference in cost from Year 2016 to 2017 is $7.8 billion. From years 2017 to 2024, production costs are projected to be 28.7% lower than under the current cap‐and‐trade program, averaging $5.5 billion in cost savings. Cost reductions lessen for the remainder of the scenario.
Figure 51: Production Costs for $21 Allowance Price with a Cap‐and‐Trade Program for Years 2011‐2030
As depicted in the following figure, GDP and income are negative from years 2011 through 2016, with an average decrease of $921 million and $1.1 billion, respectively. In year 2017, a sharp increase in GDP occurs which peaks at $2.6 billion, a 0.29% improvement from BAU, with a corresponding income of $2.5 billion, in year 2024. From years 2025 to 2030, the economic impacts for GDP lessen, but remain positive. The negative results predicted in the first six years detract from the positive effects of this policy scenario, however the overall economic impact is positive. Compared to a cap‐and‐trade program alone, the average offset $2.533 billion per year and $2.551 billion per year for GDP and income, respectively.
(8,000)
(6,000)
(4,000)
(2,000)
0
2,000
4,000
$ (Million)
Year

Phase Two of Florida C&T Project: Economic Analysis
60
Figure 52: GDP and Disposable Personal Income for $21 Allowance Price with a Cap‐and‐Trade Program for Years 2011‐2030
Employment for the $21 Allowance Scenario follows a similar pattern to aforementioned GDP and income projections. In the first six years, from 2011 to 2016, there are job losses which are abruptly turned around in year 2017. Peak additions to employment occur in year 2024 with 24,740 jobs. Job growth then trails off during years 2025 to 2030. Still, this scenario has the fourth highest offset in job increases on average with 24,482 more jobs created per year than the cap‐and‐trade program.
(1,500)
(1,000)
(500)
0
500
1,000
1,500
2,000
2,500
3,000 $ (Million)
Year
GDP
Real Disp. Pers. Inc

Phase Two of Florida C&T Project: Economic Analysis
61
Figure 53: Employment for $21 Allowance Price with a Cap‐and‐Trade Program for Years 2011‐2030
Energy Efficiency Scenario(s)
There were two energy efficiency scenarios included in the Dispatch model runs. The parameters for the first scenario were set based on parameters in a report by the American Council for an Energy‐Efficient Economy (ACEEE). The ACEEE25 scenario examined a 9% energy efficiency improvement starting in year 2013, ramping up to 15% energy efficiency gain in year 2023 forward, and modeled as reductions in peak demand. The second energy efficiency scenario used several parameters set in the Waxman Markey (WM) bill. The WM26 scenario reflected a 20% renewable, or 8% energy efficiency, by year 2020, over time. These two scenarios were then compared with the BAU Dispatch model and then, similar to the low and high fuel cost scenarios, compared with the Dispatch model with caps.
In the ACEEE scenario, the coal exhibits the same patterns and magnitudes as most of the previous scenarios. However, natural gas has much lower cost increases predicted under this model run. It peaks at $5.179 billion in 2022 which is nearly $2 billion less than all the other scenarios shown so far.
25 Based on the Report “Potential for Energy Efficiency and Renewable Energy to Meet Florida’s Growing Energy Demands.” American Council for an Energy‐Efficient Economy. June 2007. 26 Transformed to energy efficiency of 8% by Year 2020 (assuming 40% or 20% renewable energy) included in the former Waxman Markey bill.
(15,000)
(10,000)
(5,000)
0
5,000
10,000
15,000
20,000
25,000
30,000
Employment

Phase Two of Florida C&T Project: Economic Analysis
62
Figure 54: Fuel Costs for Generating Units for ACEEE with a Cap‐and‐Trade Program for Years 2011‐2030
In the ACEEE27 scenario, the emissions price is changed once from $0/MT, to $90/MT in year 2025, but the emissions costs and emission level do not vary greatly from what has been mentioned. Both are on the lower end of the spectrum: 45.6 CO2 MMT for emissions level and $4.5 billion for total emissions cost by year 2030.
27 Represented by a 9% energy efficiency improvement starting in year 2013, ramping up to 15% energy efficiency gain in year 2023 forward. The fuel cost mix represents absolute values generated by the dispatch model.
0
1,000
2,000
3,000
4,000
5,000
6,000
7,000
8,000
$ (Million)
Year
Renewable
Oil
Natural Gas
Nuclear
Coal

Phase Two of Florida C&T Project: Economic Analysis
63
Figure 55: Emissions for Generating Units for ACEEE with a Cap‐and‐Trade Program for Years 2011‐2030
Economic analyses results depicting a reduction in production costs is the highest in this scenario. In year 2024, production costs decrease by $12.9 billion, which is 59.4% less than production costs under the current projected the cap‐and‐trade program. From the years 2025 to 2030, costs average a reduction of $3.9 billion per year.
Figure 56: Production Costs for ACEEE with a Cap‐and‐Trade Program for Years 2011‐2030
0
10
20
30
40
50
60
70
80
90
100
Total Emissions Cost $(100Million)
Emissions Price $/MT
0
20
40
60
80
100
120
140
Emissions level CO₂ MMT
(14,000)
(12,000)
(10,000)
(8,000)
(6,000)
(4,000)
(2,000)
0
$ (Million)
Year

Phase Two of Florida C&T Project: Economic Analysis
64
The ACEEE scenario predicts the highest positive economic impact of all the models. As with the other scenarios, GDP and income are slow to increase at first, but eventually rise significantly for the years 2017 to 2024, before dropping back down. In this ACEEE energy efficiency model, GDP peaks at $6.4 billion, a 0.73% increase from BAU, while income peaks at $6.3 billion, a 0.86% increase from BAU. The ACEEE not only nullifies the effect of cap‐and‐trade restrictions, but does so to the highest extent, on average, of any of the other models. The parameters in the ACEEE scenario generate an average difference per year of $4.660 billion in GDP and $4.767 billion in income compared to cap‐and‐trade.
Figure 57: GDP and Disposable Personal Income for ACEEE with a Cap‐and‐Trade Program for Years 2011‐2030
Employment follows the same trend as GDP and income. Under the ACEEE scenario, it is slow to increase until year 2017, which shows an increase of employment by 33,484 jobs from BAU. From years 2017 to 2024, new job growth continues, with a peak of 62,174 additional jobs, as projected by the model. Again, the ACEEE shows the most substantial economic impact in reference to job creation. On average, the ACEEE policy scenario generates 46,630 more jobs per year than cap‐and‐trade alone.
0
1,000
2,000
3,000
4,000
5,000
6,000
7,000
$ (Million)
Year
GDP
Real Disp. Pers. Inc
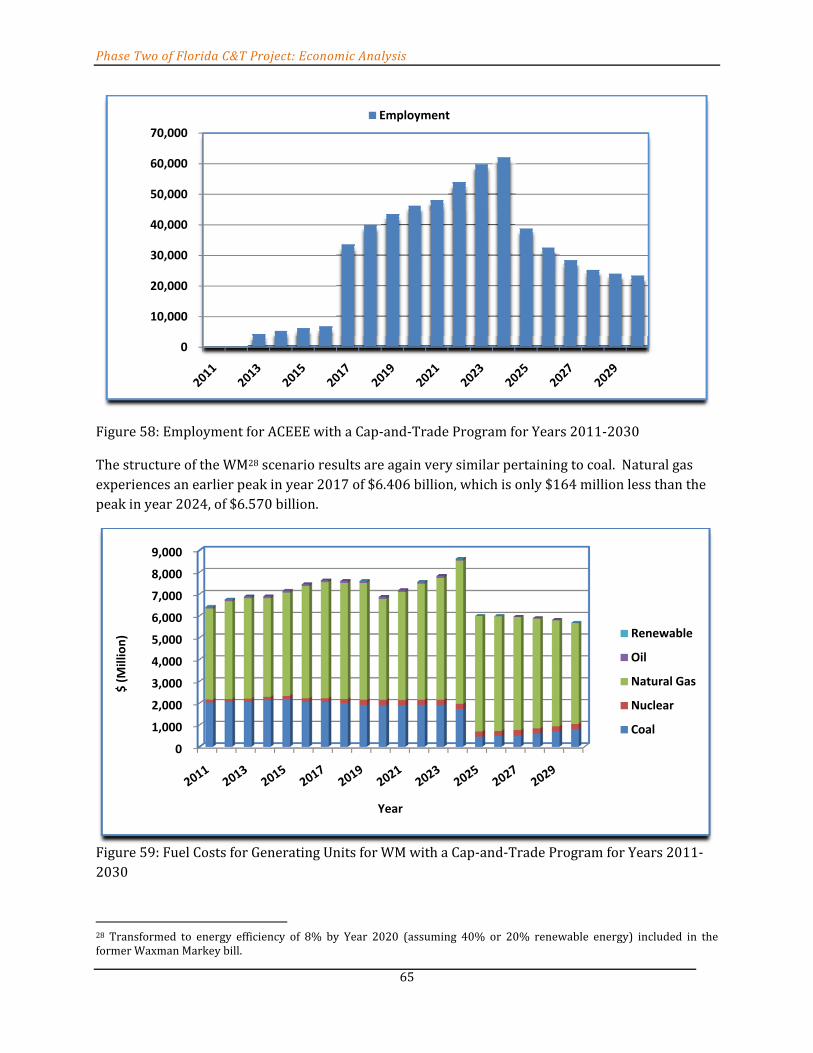
Phase Two of Florida C&T Project: Economic Analysis
65
Figure 58: Employment for ACEEE with a Cap‐and‐Trade Program for Years 2011‐2030
The structure of the WM28 scenario results are again very similar pertaining to coal. Natural gas experiences an earlier peak in year 2017 of $6.406 billion, which is only $164 million less than the peak in year 2024, of $6.570 billion.
Figure 59: Fuel Costs for Generating Units for WM with a Cap‐and‐Trade Program for Years 2011‐2030
28 Transformed to energy efficiency of 8% by Year 2020 (assuming 40% or 20% renewable energy) included in the former Waxman Markey bill.
0
10,000
20,000
30,000
40,000
50,000
60,000
70,000
Employment
0
1,000
2,000
3,000
4,000
5,000
6,000
7,000
8,000
9,000
$ (Million)
Year
Renewable
Oil
Natural Gas
Nuclear
Coal

Phase Two of Florida C&T Project: Economic Analysis
66
The different set up for emissions price shows two carbon price caps. The first is in year 2017 at $60/MT and the second is in year 2025 at $90/MT. The emissions cost and emission level follow the same trend and amounts as in the ACEEE scenario. There is little difference between the year 2030 values in the WM and ACEEE cases.
Figure 60: Emissions for Generating Units for WM with a Cap‐and‐Trade Program for Years 2011‐2030
Production cost reductions are slow to occur in this scenario, but once they do, they peak in 2024 at $3.5 billion and average $2.8 billion per year. This is an average cost reduction of 13.6% from the just the cap‐and‐trade program.
0
10
20
30
40
50
60
70
80
90
100
Total Emissions Cost $(100Million)
Emissions Price $/MT
0
20
40
60
80
100
120
140
Emissions level CO₂ MMT

Phase Two of Florida C&T Project: Economic Analysis
67
Figure 61: Production Costs for WM with a Cap‐and‐Trade Program for Years 2011‐2030
The REMI economic impact results for the WM scenario show a positive effect on GDP and income, starting in year 2020. The average effect on GDP is a $976 million increase; the average effect on disposable personal income is $983 million. While these effects are much smaller than those in the ACEEE scenario, they still represent an improvement from BAU. The WM scenario has the least positive economic impact of all the positive scenarios with roughly fifty percent the effectiveness as the ACEEE scenario.
(4,000)
(3,500)
(3,000)
(2,500)
(2,000)
(1,500)
(1,000)
(500)
0
$ (Million)
Year
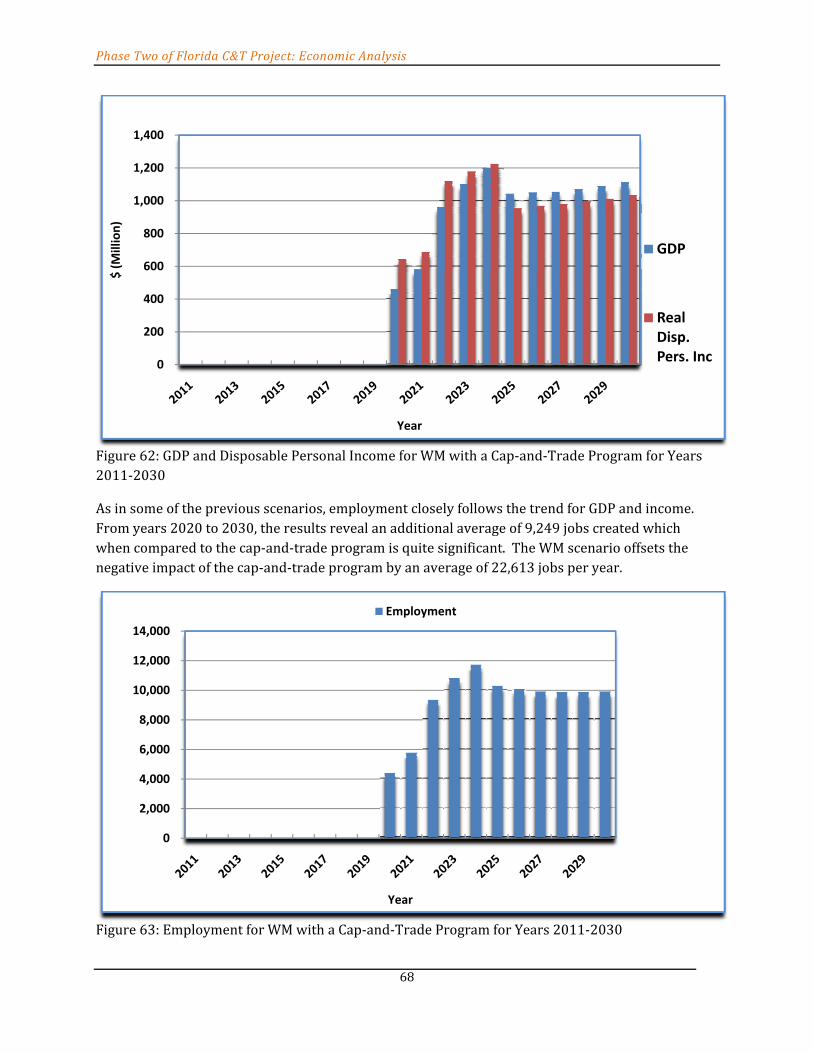
Phase Two of Florida C&T Project: Economic Analysis
68
Figure 62: GDP and Disposable Personal Income for WM with a Cap‐and‐Trade Program for Years 2011‐2030
As in some of the previous scenarios, employment closely follows the trend for GDP and income. From years 2020 to 2030, the results reveal an additional average of 9,249 jobs created which when compared to the cap‐and‐trade program is quite significant. The WM scenario offsets the negative impact of the cap‐and‐trade program by an average of 22,613 jobs per year.
Figure 63: Employment for WM with a Cap‐and‐Trade Program for Years 2011‐2030
0
200
400
600
800
1,000
1,200
1,400
$ (Million)
Year
GDP
Real Disp. Pers. Inc
0
2,000
4,000
6,000
8,000
10,000
12,000
14,000
Year
Employment

Phase Two of Florida C&T Project: Economic Analysis
69
Coal Scenario Without Carbon Capture and Storage Fuel costs in the coal scenario are quite variable with respect to natural gas. With the exception of year 2019, natural gas fuel costs are positive. Fuel costs in the coal scenario for natural gas are on the higher end of the scenarios with a peak of $8.898 billion in year 2024. The average cost per year for coal is $1.323 billion, which is on the lower end when compared with the other scenarios. Fuel costs for nuclear and other are about the same. From years 2011 to 2025, other sources average a $191 million reduction in fuel costs. It is important to note that the coal scenario (in the Dispatch model program) includes a 10% load reduction, as well, thereby serving to further mitigate costs.
Figure 64: Fuel Costs for Generating Units for Coal with a Cap‐and‐Trade Program for Years 2011‐2030
The coal scenario follows the $90/MT carbon price cap in 2025 similar to the ACEEE scenario. The emissions cost and emission levels follow a similar trend as shown previously, but the changes are of different magnitude. The coal scenario finishes 2030 with an emissions level of 63.7 CO2 MMT and a total emissions cost of $5.7 billion.
0
2,000
4,000
6,000
8,000
10,000
12,000
$(Million)
Year
Renewable
Oil
Natural Gas
Nuclear
Coal

Phase Two of Florida C&T Project: Economic Analysis
70
Figure 65: Emissions for Generating Units for Coal with a Cap‐and‐Trade Program for Years 2011‐2030
Production cost for the coal scenario shows a unique trend. It is either slightly increasing or experiencing large reductions according to the model. For the cost reducing years, it averages a $7.7 billion decrease per year.
0
10
20
30
40
50
60
70
80
90
100
Total Emissions Cost $(100Million)
Emissions Price $/MT
0
20
40
60
80
100
120
140
Emissions level CO2 MT

Phase Two of Florida C&T Project: Economic Analysis
71
Figure 66: Production Costs for Coal with a Cap‐and‐Trade Program for Years 2011‐2030
The REMI results for the coal scenario predict the third highest positive economic impact of all the scenarios. A slow start followed by a large eight year spike in GDP and income occurs from years 2017 to 2024. During this period, GDP averages an increase in $3.1 billion, and income averages $3.3 billion, due to the coal scenario specifications. The increase is followed by a smaller estimated economic impact for years 2025 through 2030. The difference in average yearly GDP and income between the coal scenario and cap‐and‐trade is $3.327 billion and $3.410 billion, respectively.
(10,000)
(8,000)
(6,000)
(4,000)
(2,000)
0
2,000 $ (Million)
Year

Phase Two of Florida C&T Project: Economic Analysis
72
Figure 67: GDP and Disposable Personal Income for Coal with a Cap‐and‐Trade Program for Years 2011‐2030
Employment experiences a similar positive impact in the coal scenario following a slow start. In year2024, REMI estimates an additional 38,518 jobs created compared to BAU. The average job creation from years 2017 to 2030 is 22,894 per year. Compared to the cap‐and‐trade program, jobs are offset by an average of 33,339 jobs per year in the coal scenario.
Figure 68: Employment for Coal with a Cap‐and‐Trade Program for Years 2011‐2030
The following figure provides a summary of the varying carbon prices with respect to the aforementioned scenarios.
(500)
0
500
1,000
1,500
2,000
2,500
3,000
3,500
4,000
4,500
$( Million)
Year
GDP
Real Disp. Pers. Inc
(5,000)
0
5,000
10,000
15,000
20,000
25,000
30,000
35,000
40,000
45,000
Year
Employment

Phase Two of Florida C&T Project: Economic Analysis
73
Figure 69: Carbon Price Caps for Different Scenarios for Years 2011‐2030
Economic Impact Results in REMI (from Years 2011 to 2030) The following table presents a summary of the cumulative economic impacts (from years 2011 – 2030) of a proposed cap‐and‐trade program and the associated scenarios, in terms of GDP, employment and income.
Table 12: Economic Impact Summary for Years 2011 ‐ 2030 Economic Impact of Scenarios Including CAPS
GDP* Employment Income*
CapandTrade Program $(23,682,687,101) (350,524) $(24,785,504,158)
Low Fuel Cost $(19,108,644,877) (283,967) $(19,787,196,366)
High Fuel Cost $(2,117,540,518) (30,439) $(2,313,632,128)
5% Load Increase $(14,287,377,295) (207,155) $(15,612,059,304)
5% Load Reduction $ 27,045,358,561 390,566 $ 28,275,431,264
Allowance Price of $21 $ 9,215,659,092 139,123 $ 8,627,556,599
ACEEE $ 40,011,766,753 582,077 $41,099,277,371
WM $ 6,818,368,051 101,742 $ 6,930,017,522
Coal $21,733,413,852 316,262 $22,298,824,126
* both GDP and Income in Net Present Value (NPV) Dollars
0
20
40
60
80
100
120$/M
T
Without caps
With Caps
Low Fuel
High Fuel
$ 21 Allowance
5% LR
5% LI
EE ‐ ACEEE
EE ‐WM
Coal

Phase Two of Florida C&T Project: Economic Analysis
74
Final Conclusions The Phase Two report for the Florida Department of Environmental Protection (FDEP) represents the preliminary economic and modeling analysis component in the development of a state cap‐and‐trade (C&T) rule proposal according to Section 403.44, F.S., to reduce greenhouse gas (GHG) emissions. The objective of the Phase Two project involves data compilation and analysis of the FDEP C&T program design. The Phase One report highlighted the major choices Florida faces in designing a utility‐sector C&T program as a means of meeting the state’s GHG reduction goals and stressed that the likelihood of an economy‐wide federal C&T policy creates unavoidable uncertainty for Florida’s policy development process, and that the state will have to pay close attention to making sure its actions make sense if such a federal policy is implemented., To date, the U.S. House of Representatives has passed a comprehensive energy and climate bill. As federal action progresses, Florida’s economic modeling should shift from state‐specific C&T regulations to modeling federal action.
This Phase Two analysis represents a first step in the modeling framework or methodology to gage potential impacts of carbon regulation on the state economy. The analysis highlights the major economic drivers and ways of considering the relationships between key variables. Additional and ongoing efforts will be needed to fine‐tune projections and consideration of specific policy options.
Emissions caps can be one of two types, either restrictive or nonrestrictive. In the case of an emissions cap, the monetization of this constraint is a price on the emission of carbon dioxide. So an imposed emissions limit at or above the “business as usual” or unconstrained case implies an emissions price of zero. As the emissions cap decreases below the unconstrained case, the emissions price increases. The strategies to reduce emissions from the electric generation sector are limited. In the short term, the generators can adjust the types of fuels that they use, known as fuel‐switching, or reduce the amount of electricity that they produce. In the long term, the generators options expand to strategies such as: improving the thermal efficiency of existing power plants (and thus reduce fuel consumption), construction of new power plants that produce electricity while emitting less (or no) carbon dioxide, or developing and exploiting technologies that capture a portion of the carbon dioxide emitted. An electric generation unit‐level economic Dispatch model can be used to simulate the effects that the price of emissions (or, similarly, an emissions cap) has on the electricity sector.
An economic Dispatch model including all the electric generating units in the state29, was designed and built by the project team, to examine the minimal costs required in order to provide the amount of electricity demanded by end‐users in each hour. The costs to produce this electricity were driven by the type of generating unit, its operating efficiency, the variable costs required to operate and maintain the unit, and the price of its fuel. The project team then analyzed the effects that various emissions prices (and their concurrent emissions levels) have on Florida’s level of carbon dioxide emissions and the amounts of fuel consumed for electric generation, over time, to year 2030. The findings reveal that at relatively low emissions prices, emissions levels decrease, but
29 Dispatch data for Version 1.10 included 525 generating units; 32 were outside the state, in Georgia and Alabama.
Phase Two of Florida C&T Project: Economic Analysis
75
that coal usage actually increases as fuel sources such as petroleum coke and fuel oil are displaced. Once this initial reduction has been achieved, further increases in carbon prices may do little to decrease emissions until a “critical point” is reached. The Dispatch model results showed that at $45/MT, a critical point occurred where coal was displaced by natural gas. Typically, coal is much cheaper than natural gas, so the additional cost due to emissions has to reach a sufficient level for natural gas generation to begin to displace coal. Another “critical point” was reached at $90/MT, where natural gas was displaced by other clean fuel sources. In this case, the critical point for the switch to other fuel sources occurred from years 2025 – 2030, where natural gas was displaced by clean fuel sources; comprising renewable, or biomass, and advanced nuclear.
The project team ran distinct cases for the range of allowance prices that have been proposed as the ‘equilibrium’ allowance prices in studies by WM and other studies. The project team found that the range of allowance prices from $13‐$33/MT have a negligible effect on emissions in the state of Florida that would result in most market participants simply purchasing allowances rather than abating emissions. For natural gas, a slight increase occurs when the price goes from $13/MT to $33/MT. Under the $13/MT carbon price scenario, 740 million MWh is generated in 2011 and 1.282 billion MWh is generated in 2030. With the $33/MT carbon price, those figures change slightly, to 745 million MWh and 1.284 billion MWh, respectively.
In order to obtain estimates of the different types of macroeconomic effects of the carbon cap and carbon cap scenarios on the Florida economy, the project team applied a well‐established analytical tool known as the REMI model. Regional Economic Models, Inc., (REMI PI+ v1.1.6) 2009 is a widely used dynamic (multiple time period, up to year 2050) integrated input‐output and econometric model. The REMI modeling team developed a series of assumptions for modeling, and for comparisons to be made between the “business as usual”, or BAU, and “with a cap‐and‐trade program”, cases. The input data used for the REMI model was solely based on the Dispatch model output data for both the base cap‐and‐trade analysis, in addition to the scenario analyses. The scenario analyses included: low, base, and high fuel costs, five percent load reduction and/or load increase, allowance price(s), coal, among others. In addition, the modeling team examined energy efficiency analyses, based on current policy bill analyses, such as Waxman‐Markey. The economic impact results, based on the Dispatch model inputs, for the comparison between the BAU or base, and cap‐and‐trade program, reveal that with current conditions, the impacts on the Florida economy will be negative, on GDP, Income and Jobs, for years 2017 ‐ 2030. Decline in GDP peaks in 2024 at $3.23 billion and then begins to recover. The impact on disposable personal income peaks to a decline of $3.27 billion by 2024. It should be noted that the analyses did not reallocate or redistribute the potential revenues generated from the allowances to other areas; such as government spending or energy efficiency programs.
The first scenario the project team examined concerned fuel prices. The BAU scenarios both with and without the emissions caps in place were derived using the fuel price forecasts from the Energy Information Administration’s 2010 Annual Energy Outlook. With low fuel cost projections, the Florida economy maintains a small, positive increase in jobs until 2016. At that point, job loss becomes substantial, over the project timeframe and with increasing carbon prices. Job losses peak

Phase Two of Florida C&T Project: Economic Analysis
76
in 2024 with an expected loss of 28,045 jobs. With the imposition of caps in the year 2011, GDP stays positive at $97 million and reaches $234 million in 2017. From year 2017 on, GDP declines sharply to a negative peak of $28.9 billion in 2024, with slow recovery thereafter. Disposable personal income experiences a similar trend as a result of caps. It declines by $1.8 billion in year 2017 with higher negative values as the caps become more binding with higher carbon prices.
With the addition of caps in year 2011, GDP experiences a decline of $51 million under the high fuel price projection. This negative impact is more severe at first than the low fuel case which maintains a positive GDP through year 2015. Disposable personal income declines by $80 million in year 2011, with greater negative values as the caps become more binding with associated higher carbon prices. The effect on employment is also negative. In year 2011, the Florida economy loses about 583 jobs, with job loss becoming greater with associated higher carbon prices. However, this impact over the twenty year period is lower than the impact under the low fuel cost projections, where the Florida economy is projected to experience losses in the tens of thousands.
No distinct case for renewable percentage was analyzed per se, however, when the emission prices or price of carbon reaches $90/MT, it achieves a 20% renewable standard by year 2018, and increases to about 42% renewable generation, by year 203030.
The project team examined scenarios regarding nuclear generation in Florida. The modeling results showed that new biomass generation is built before any new nuclear generation, so the no new nuclear scenario, the unconstrained nuclear scenario, and the BAU with caps scenario all produced similar results.
Load forecasts for BAU and BAU with caps scenarios were derived using the 2010 FRCC Load and Resource Plan. There were two scenarios included in the dispatch model run; one scenario examined a 5% load reduction to Year 2030, and the second scenario ran a projection based on a 5% load increase over time31. Under the load increase scenario, the Dispatch model builds “NG Advanced Combined Cycle’” plants as new plants for the Carbon prices from $0/MT to $90/MT. However, for the prices of $90/MT or greater, the model builds “biomass” plants. Biomass plants in the model, were based on the EIA levelized cost figures, are currently less costly than nuclear plants, in terms of initial capital outlay. The REMI results for GDP and personal disposable income show gains in both impact areas under the 5% Load Reduction Scenario, especially from years 2017 to 2022, where GDP averages $3.8 billion and income averages $4.2 billion. Those levels drop down in years 2023 and 2024, and eventually settle at around $1.3 billion for both GDP and Income. The effect on employment from 5% Load Reduction is positive. In 2011, Florida economy gains 2,302 jobs and experiences a job increase, until a peak in year 2022, of 44,198 jobs. This projection is significantly greater than the 5% Load Increase scenario which has estimated job losses for the duration of the twenty year period. The 5% Load Increase Scenario impacts GDP and disposable personal income negatively in contrast to the positive economic impacts attributed to 5% Load Reduction. In the Load Increase Scenario, GDP and income drop immediately in year 2011 and reach a maximum decline of $2.3 billion and $2.9 billion, respectively in year 2016. The losses level 30 The Dispatch model did include a clean energy mix by constraining composition of new generation to include: 25% Advanced Nuclear, 25% Solar PV, 25% Wind (Offshore), and 25% Biomass. 31 Based on the Florida Reliability Coordinating Council, Inc. (FRCC) July 2010 Regional Load and Resource Plan.

Phase Two of Florida C&T Project: Economic Analysis
77
out from years 2017 to 2030, in which both GDP and income average a decrease of $1.1 billion, respectively. In contrast to the 5% Load Reduction Scenario, there are job losses in the 5% Load Increase Scenario. 2016 is the worst year which results in jobs losses totaling 25,238. For the remaining years, the model predicts an average loss of 10,782 jobs. Higher costs for energy result in increased unemployment leaving consumers with less discretionary income. This reduces consumer spending, and consequently, economic activity is reduced.32 As it is mentioned that, the least cost assumption, the model builds bio‐mass plants only as renewable part of fuel mix due to the obvious reason that it is assumed to be the cheapest renewable fuel. A constant return to scale assumption in the model, enables it to keep building the biomass plants as against the economic intuition of rising prices of biomass with rising demand. Contrary to this, if we allow for increasing returns to scale then the model can potentially utilize other cleaner fuels like nuclear, wind, solar, geo‐thermal, on‐shore wind among others, however such investigation is beyond the scope of this study.
The research team performed an allowance price scenario based at $21. The allowance price of $21 was selected because altering the carbon price from $13 to $33 didn’t result in variability in the dispatch model. The results for the range of $13 ‐ $33 values were all within 1% of the $21 case. In addition, the dispatch model with caps and $21 allowance price also incorporates a renewable component scenario, as all new generation built under the caps is projected to be renewable. As depicted in the following figure, GDP and income are negative from years 2011 through 2016, with an average decrease of $921 million and $1.1 billion, respectively. In year 2017, a sharp increase in GDP occurs which peaks at $2.6 billion with a corresponding income of $2.5 billion, in year 2024. From years 2025 to 2030, the economic impacts for GDP lessen, however remain positive. Job loss occurs in the first six years of the addition of caps, from years 2011 to 2016 which abruptly turn around in year 2017. Peak additions to employment occur in year 2024 with 24,740 jobs. Job growth then trails off during years 2025 to 2030.
The project team conducted 2 energy efficiency scenarios. The first scenario, ACEEE, was based on a previous Florida study on Energy Efficiency conducted in 2007 whereby load was decreased by 9% from years 2013‐2022, and 15% in 2023‐2030. In the second, WM, load was decreased by 8% in 2020‐2030. This was based on the WM approach where for energy efficiency scenarios, 40% of 20% renewable is equal to 8% energy efficiency by year 2020. As with other scenarios, GDP and income are slow to increase at first, but eventually rise significantly for the years 2017 to 2024 before dropping back down. In this ACEEE energy efficiency model, GDP peaks at $6.4 billion while income peaks at $6.3 billion. Employment follows the same trend as GDP and income. Under the ACEEE scenario it is slow to increase until year 2017, which shows an increase of employment by 33,484 jobs. From years 2017 to 2024, job growth continues with a peak of 62,174 additional jobs, as predicted by the model. The REMI economic impact results for the WM scenario show a positive effect on GDP and income, starting in year 2020. The average effect on GDP is a $976 million increase; the average effect on disposable personal income is $983 million. As in some of the previous scenarios, employment closely follows the impacts trend over time for GDP and income.
32 http://www.eurojournals.com/IRJFE%206%20kooros.pdf

Phase Two of Florida C&T Project: Economic Analysis
78
From years 2020 to 2030, the results reveal an additional annual average of 9.249 jobs. The economic analyses results, in terms of energy efficiency at the generating units level, can have a dramatic impact on lowering the costs of reducing carbon emissions.
Under the reduction in coal generation scenario, the project team constrained the dispatch model to generate no more than the following percentage of electricity from coal in any given year, and reduced overall electric demand by 10%. The scenario was based on suggestions provided by the FDEP team. The Coal scenario has slight negative impact on income and GDP from 2011 till 2016. From 2017, there is a significant positive trend for employment as well as GDP and Income. This positive trend peaks in 2024 and then starts declining from 2025 and keeps on declining until year 2030.
Limitations of the Study
One of the main limitations of this analysis, and a factor that affected the modeling results, is the consideration of cap‐and‐trade as a Florida‐only/state specific program. By limiting the model to a state system, these results amplify the adverse cost impacts of carbon regulation by not taking advantage of the potential cost reductions that a national program might offer through increased competition with policies, such as an offsets policy. For these reasons, one conclusion derived from this report is that a state‐only cap‐and‐trade program, based on the current FRCC 10‐year load and resource plan projections, is not economically feasible for Florida. The results for renewable or clean energy options were limited to those that can be considered in the dispatch model, which included biomass, wind, solar and nuclear power. Renewable energy is a key component of meeting emission targets while delivering the least‐cost power options. To keep emission prices from becoming greater than $90 per MT, some lower cost alternative will need to be considered, starting in year 2011, to eventually comprise 40% of the generation mix. This analysis shows that 40% being covered by biomass in year 2030, which may not be feasible. Other renewable or clean energy options, or pathways, will need to be considered and incorporated into some type of energy plan.
The modeling framework was based on the latest FRCC 10‐year load and resource plan, and EIA levelized cost data, among other sources of current and reliable data projections. An assumption of reduced costs due to technological advances was not considered in this analysis.
With the current objective function of least cost dispatch, the model builds biomass plants only, as the renewable component of the fuel mix. This is due to the assumption in the model, and based on the most current EIA levelized cost data, that biomass is the most cost effective solution concerning renewable fuels. However, given the model’s assumption of constant returns to scale in terms of new plant construction, it is assumed that with ample planning time (from as early as year 2011), it is possible to reach a cost effective result, with a carbon price of $90 per MT to year 2030, to maintain the fuel mix within the carbon reduction cap as it becomes more stringent, over time. Contrary to this, if we allow for increasing returns to scale then the model can potentially utilize other cleaner fuels like nuclear, wind, solar, geo‐thermal, and other zero or low emission generation fuel sources, however, such investigation was beyond the scope (e.g., time and resources) of this study.

Phase Two of Florida C&T Project: Economic Analysis
79
In Summary: The Phase Two report for the Florida Department of Environmental Protection (FDEP) represents the preliminary economic and modeling analysis component in the development of a state cap‐and‐trade (C&T) rule proposal according to Section 403.44, F.S., to reduce greenhouse gas (GHG) emissions. The project team used two economic models to conduct the economic and modeling analysis component; the economic Dispatch and REMI models. The Dispatch model estimated the individual generating units associated costs of a cap‐and‐trade program, and the REMI model reported the economic impacts pertaining to the Florida economy as a result of a state cap‐and‐trade program. The results of the study can be summarized as follows: The Dispatch model results showed that at $45/MT, a critical point occurred where coal
was displaced by natural gas. Another “critical point” was reached at $90/MT, where natural gas was displaced by other clean fuel sources. In this case, the critical point for the switch to other fuel sources occurred from years 2025 – 2030, where natural gas was displaced by clean fuel sources; comprising renewable, or biomass.
The implementation of a Florida‐specific cap‐and‐trade program based on current FRCC Load and Resource Plan Dispatch model results for individual power generating units, will currently have negative economic impacts to the Florida economy, in terms of GDP, income and jobs. The scenario, or sensitivity, analysis performed across the project timeline of years 2011‐2030, yielded the following results: Fuel prices (low, base and high), the 5% load increase, and the coal scenario show
negative economic impacts throughout the entire time period. The $21 allowance price showed mixed results; with negative economic impacts to
year 2017, and then positive impacts to year 2030. With the launch of a cap‐in‐trade program in Florida, it is notable that both energy
efficiency scenarios and the 5% load reduction scenarios yield positive economic impact results to year 2030, for the Florida economy.
Possible Next Steps
To continue to identify key relationships and highlight Florida‐specific strengths and vulnerabilities should a national policy be enacted.
To continue to analyze and fine‐tune the methodology regarding optimal energy mix at the most cost effective utility generation mix for ratepayers, while still meeting projected carbon reduction objectives.
Determine what percentage of renewable energy mix is cost effective over time, and feasible, through biomass, and other options. The dispatch model output results of 40% biomass in year 2030, can be viewed by most experts as currently not a feasible or realistic solution. More research is needed to identify energy alternatives (particularly post‐year 2025) and/or pathways that could comprise the up to 40% renewable energy mix needed for estimated power generation, while still meeting projected emissions caps.
Continue to build assumptions in the modeling methodology that include expectations of technological improvements, and corresponding cost reductions over time, among other assumptions.

Phase Two of Florida C&T Project: Economic Analysis
80
Literature Review With our integrated approach, we create hypothetical scenarios under different policy options. Under each option, we model subsequent affects on economic variables like gross domestic product, disposable personal income, total employment, emission levels under different CO2 prices, or dispatched fuel‐mix with gradual reduction in emission caps, among others.
This section of the report provides an overview of various scenario analyses performed by other researchers (public and private sectors while preparing similar reports on C&T, carbon pricing, energy technology and related areas. The review is diversified and comprehensive in the sense that we try to include scenarios from studies that are done not only at federal and state level, but also include a study that covers scenarios on a global level.
Following is an overview of some reports that perform scenario analysis with respect to different policies on C&T.
Consequences of Alternative U.S. C&T Policies: Controlling Both Emissions and Costs: The Brooking’s Report The Brookings report analyzes a range of possible C&T policies for the U.S. at federal level. The seven policy scenarios that are analyzed meet similar long run environmental objectives, but differ in their emissions trajectories and costs. The first policy, hits the emissions targets proposed by the current U.S. administration. The second hits the targets in an early “discussion draft” version of the bill proposed by Representatives Waxman and Markey. The report models both of these approaches as annual caps on U.S. emissions that decline linearly over the lifetime of the policy to reach in 2050 an emissions level that is 83 percent below 2005 levels. It considers two additional policies that would achieve much the same long run environmental goals as the first two policies but which minimize the cost. The last three policies augment the current administration’s target proposal with three different cost‐containment mechanisms. 33
Policy Scenarios The four policy scenarios analyzed by the report in details are described below:
1. The first policy that the report examines is based on targets consistent with proposals by the administration of President Obama. The target is that emissions in 2020 and 2050 would be reduced by 14 percent and 83 percent, respectively, from 2005 emissions levels.34 The president has not specified targets for specific years before 2020 and between 2020 and 2050, so theReport assumes a linear path of emissions reductions from 2012 to 2020, and then another linear path of reductions (with a slightly different slope) from 2020 to 2050. This scenario is referred as the “OA” policy in the report, referring to Obama Administration.
2. The second policyconsidered sets year‐by‐year reduction targets for 2020, 2030, and 2050 of 20, 40, and 83 percent, respectively, relative to 2005 emissions. These targets were first
33 McKibbin, Warwick J., Adele Morris, Peter J. Wilcoxen, Yiyong Cai. Consequences of Alternative U.S. C&T Policies: Controlling Both Emissions and Costs. Brooking’s Institute. http://www.brookings.edu/~/media/Files/rc/reports/2009/07_cap_and_trade/0727_cost_containment.pdf 34 White House Office of Management and Budget (2009) p. 21

Phase Two of Florida C&T Project: Economic Analysis
81
proposed by Representatives Waxman and Markey in their April 2009 discussion draft (DD) bill before the Energy and Commerce Committee of the House of Representatives.35 Subsequent versions of the legislation included less stringent targets, but the Report analyzes the initial draft targets because they likely represent the upper bound on reductions for the year 2020 that the current Congress will consider. Again linear paths of emissions reductions are assumed from 2012 through the targets in the later years. This is referred to as the “DD” policy.
3. The third and forth scenarios meet comparable long run goals but do not impose year‐by‐year emissions targets. In both of these alternative approaches, allowance prices rise at the real interest rate, a trajectory known as a “Hotelling path” after the work of Harold Hotelling. Hotelling (1931) showed that the price of an exhaustible resource grows at the real interest rate when owners maximize the value of their resource over the extraction period. If firms have perfect foresight and full flexibility in banking and borrowing allowances, then the real price of allowances will grow at the real risk‐free interest rate. Intuitively, if the allowance price rises any faster than the interest rate, investors could make a profit by banking allowances and selling them later. If the price rises more slowly than the interest rate, firms could profit by borrowing allowances from future years. Together, these incentives mean that firms will use banking and borrowing to shift allowances between periods until an equilibrium is reached in which the price of an allowance rises at the long run real interest rate, which is assumed in the Report at 4 percent. Third scenario is the Hotelling path, named as, “Hotelling 2050” or “H50”. This scenario achieves the same long run annual emissions target as the OA policy (83 percent below 2005 emissions by 2050) via an allowance price path that rises at the interest rate, but does not necessarily match OA emissions in earlier years. Results from Section 3 show this approach results in higher cumulative emissions than the OA scenario. However, reductions relative to business as usual (BAU) appear early on as the economy adjusts at least cost towards the long run target.
4. The second Hotelling path, called “Hotelling Cumulative” or HC, would achieve the same cumulative emissions as OA, but again with an allowance price path rising at the interest rate. As a result, it would minimize the overall cost and would distribute emissions reductions over the years from 2012 to 2050 differently. This path would emerge under the OA policy if firms had full flexibility in banking and borrowing allowances during that period.36
Modeling Approach The report incorporates a G‐Cubed Model to compare and analyze the 4 policy scenarios. The G‐Cubed model is an intertemporal computable general equilibrium (CGE) model of the world economy (Also known as a dynamic stochastic general equilibrium – or DSGE – model in the macroeconomics and central banking literature).
35 Waxman‐Markey (2009) 36 Brooking’s Report July 24th 2009

Phase Two of Florida C&T Project: Economic Analysis
82
Reference Scenario (BAU): One of the most important factors in modeling a cap on carbon emissions is the model’s assumptions (or in the case of G‐Cubed, its endogenous projections) about future emissions and economic activity in the absence of the cap. This is called the reference scenario, and it is a major factor in explaining why different economic models produce different estimates for the cost of a particular climate bill – the lower emissions are in the reference scenario, the less abatement is needed to hit a particular cap.
In this report, the researchers first construct a reference scenario for the entire world that reflects their best estimate of the likely evolution of each region’s economy without concerted climate policy measures. To generate this reference scenario, they calibrate the model to reproduce approximately the relationship between economic growth and emissions growth in the U.S. and other regions over the past decade. They then include the climate policies announced by various governments to create the reference scenario in which the U.S. policy decisions are framed.
Figure 70 shows two key variables in the reference scenario for the U.S. The solid blue curve shows historical levels of real U.S. GDP through 2008, and the dashed blue curve leading from it is the reference scenario’s projected real GDP from 2010 to 2050. The model is solved from 2002 under a range of assumptions about technical change, productivity growth by sector, and population growth by country. The red curves show historical (solid) and projected (dashed) energy‐related CO2 emissions for the U.S. over the same periods. In the reference scenario, emissions grow about 0.7 percent per year from 2010 to 2050, a rate significantly lower than economic growth (about 2.8 percent per year). Thus this reference scenario continues the long historical decline in the emissions intensity of the U.S. economy.
Figure 70: Historical and Projected U.S. Real GDP and Energy‐Related CO2 Emissions
Source: Brooking’s Report July 24th 2009.

Phase Two of Florida C&T Project: Economic Analysis
83
Results The Report describes results for different policy scenarios as compared to the reference case and also by comparing different policies. By slowing the growth of atmospheric concentrations of greenhouse gases, these policies can reduce the risk of economic and ecological damage from climate disruptions and ocean acidification. Some of these benefits could derive indirectly by reducing climate feedbacks, for example by limiting increases in natural emissions sources that result from warming. The Report, however, does not attempt to monetize these effects. Instead, it measures the atmospheric benefit of each policy by computing the overall reduction in cumulative emissions it generates relative to the emissions in the reference scenario.37 CO2 Emissions Levels
Figure 71: Annual U.S. CO2 Emissions for Policy Scenarios and Reference Case
As shown in the Figure 71, each emissions level is consistently below the orange emissions curve, which shows U.S. emissions when other countries take action but the U.S. does not. Comparing the OA and HC trajectories, which produce identical cumulative emissions, shows that OA departs from cost‐minimization by allowing relatively more emissions in the very short and very long runs (before 2020 and after 2045), but compensates with larger reductions in the middle of the period. Roughly speaking, the reductions under OA begin more gradually than the cost‐minimizing path but then accelerate more rapidly. In addition, the cost‐minimizing path requires significantly larger cuts
37 Brooking’s Report July 24th 2009.
Source: Brooking’s Report July 24th 2009.

Phase Two of Florida C&T Project: Economic Analysis
84
in the very long run in order to achieve the same cumulative reduction as OA. Annual and cumulative reductions under each policy are summarized in the table below.
Table 13: Effect of Policies on Emissions (Billions MT of CO2) Annual Reduction Relative to Reference Case Cumulative 20102050
2020 2030 2040 2050 Emissions Reduction
Policy
OA 1.4 3.2 5.1 7.0 154 134 (47%) DD 1.7 3.4 5.2 7.0 148 141 (49%) H50 1.3 2.2 4.0 7.0 176 112 (39%) HC 1.5 2.7 4.8 7.6 154 134 (47%)
Source: Brooking’s Report July 24th 2009
Figure 72: Allowance Price 2010 to 2050 under Four Policy Scenarios
The market price of allowances gives firms the incentive to abate their emissions up to the point where the incremental cost of emissions abatement is equal to the price of an allowance. This incentive applies whether or not the firms already have sufficient allowances (for example, via free allocations from the government) because firms can make additional profit by selling excess allowances if their abatement costs are lower than the allowance price. Thus the allowance price (alternatively called the price on carbon) reflects the abatement cost of the last ton of reductions
Source: Brooking’s Report July 24th 2009.

Phase Two of Florida C&T Project: Economic Analysis
85
necessary to meet the constraint. The total cost of abatement is the sum of all the individual tons of abatement, most of which come at lower cost than the last ton.
As noticed, the Hotelling paths have sharply higher initial prices than the year‐by year policies OA and DD. This suggests that if allowed, firms would choose to bank in the early years of the OA and DD policies because the real price of allowances is climbing faster than the real interest rate. Firms could profit by purchasing allowances in the early years and selling them later. However, the differential shrinks over time as the OA and DD targets become tighter. Between about 2020 and 2040, the price under the OA and DD policies exceeds both Hotelling prices. Finally, in the last decade of the policy, the HC price once again exceeds the OA and DD prices. In this period the price of allowances in the OA and DD policies is rising more slowly than the 4 percent real annual increase of the Hotelling curves. This suggests that in those scenarios, firms would wish to draw down stocks of banked allowances because gains from holding them longer would be lower than potential gains from alternative investments.
Welfare Cost of Scenarios In addition to the total cost of abatement, the positive price on carbon emissions can produce other costs to the economy that lower the welfare of households. A higher carbon price results in higher energy prices and therefore higher prices throughout the economy. This reduces the amount of consumption achievable for a given level of spending by households. The rise in energy prices does not necessarily result in sustained inflation in the economy as long as the central bank does not accommodate the price increase. However, this results in higher interest rates during the transition which raises mortgage costs and reduces the welfare of borrowers. One way to measure the overall drop in welfare created by the policy is to compute the present discounted value of the stream of real personal consumption over the time frame of the analysis. Given the long time horizon of the policies considered here, the discount factor has a significant effect on the calculation so the Report presents results for two different rates. The first (2.2 percent) reflects the real rate of time preference in the model, and the second (4 percent) represents the long run real interest rate. Table 13 reports, for each policy, the welfare cost as measured by the present discounted value of the resulting drop in personal consumption from 2010 to 2050.
Table 14: Reduction in Discounted Consumption Due to Each Policy38 2.2% discount rate 4.0% discount rate
Percent Present Value Percent Present Value
Policy
OA ‐0.45% $1.9 trillion ‐0.36% $1.1 trillion DD ‐0.49% $2.0 trillion ‐0.39% $1.3 trillion H50 ‐0.28% $1.1 trillion ‐0.23% $0.6 trillion HC ‐0.38% $1.6 trillion ‐0.31% $0.9 trillion
Allowance Values under the Four Policy Scenarios The total value of allowances distributed in a given year is the allowance price times the cap for that year. Figure 73 shows that the overall allowance value varies a great deal over the 2010 to 2050 time frame, starting low, peaking between 2025 and 2035, and dropping considerably by 2050. Although the price of individual allowances climbs steadily through 2050, the declining number of allowances eventually drives the total value of allowances down. 38 Source: Brooking’s Report July 24th 2009

Phase Two of Florida C&T Project: Economic Analysis
86
Figure 73: Allowance Values Under the Four Policy Scenarios
U.S GDP under the Four Policy Scenarios
Figure 74: The U.S. GDP Under Four Policy Scenarios
Source: Brooking’s Report July 24th 2009.
Source: Brooking’s Report July 24th 2009.

Phase Two of Florida C&T Project: Economic Analysis
87
The dark green curve at the left of the diagram shows historical GDP and the orange dashed curve shows future growth under the reference scenario. The four scenarios representing alternative U.S. climate policies are slightly lower than the reference case by the year 2050. In that year, the percent reduction in the level of GDP relative to the baseline, 2.5 percent, is about equal to the 2.4 percent annual rate of GDP growth. That is, the accumulated effect of carbon controls through 2050 is roughly equivalent to reaching 2050’s reference GDP in 2051 rather than 2050. The four control trajectories are essentially indistinguishable from one another and are also difficult to distinguish from the reference case through about 2025.
Effect on Purchaser’s Price At the industry level, all four control policies principally affect the energy sectors. Figure 75 shows the percentage change in purchasers’ prices in 2015 relative to the reference scenario. Energy prices rise considerably as a result of the carbon price. The largest increase occurs in the coal industry because the carbon content of coal per unit of energy is substantially higher than other fossil fuels. The increase in coal prices, in turn, raises the cost of electricity and drives up its price. The price of crude oil also rises under each of the policies, which raises the price of refined petroleum products. Outside the five energy sectors the price effects are quite small because energy is only a small share of costs in those sectors. As a result, an increase of 10 to 15 percent in electricity or refined petroleum prices only raises downstream prices by a fraction of a percent.
Figure 75: Effects on Purchaser’s Prices in 2015
Source: Brooking’s Report July 24th 2009.

Phase Two of Florida C&T Project: Economic Analysis
88
Sector Level Results Table 14 shows sector‐level results for the year 2025 as percent changes from the reference scenario in the same year.
Table 15: Effects of Each Policy on Individual Sectors in Year 2025
Sector Price (%) Output (%) Employment (%)
OA DD H50 HC OA DD H50 HC OA DD H50 HC Electric Utilities 12.7 14.2 9.1 11.0 ‐10.1 ‐11.3 ‐7.2 ‐8.7 ‐23.9 ‐26.6 ‐16.9 ‐20.4 Gas Utilities 2.0 2.3 1.5 1.8 ‐1.9 ‐2.1 ‐1.3 ‐1.6 0.3 0.5 0.3 0.4 Petrol. Refining 27.1 30.3 18.0 22.5 ‐32.3 ‐36.1 ‐23.1 ‐27.8 ‐13.8 ‐15.4 ‐10.1 ‐12.0 Coal Mining 96.4 107.4 68.7 82.8 ‐35.7 ‐39.7 ‐24.1 ‐30.0 ‐39.4 ‐43.4 ‐25.8 ‐32.0 Crude Oil & Gas 35.0 39.1 24.8 30.0 ‐36.4 ‐40.6 ‐26.1 ‐31.5 ‐32.9 ‐36.7 ‐23.3 ‐28.0 Mining 0.9 1.0 0.4 0.6 ‐2.3 ‐2.4 ‐1.2 ‐1.6 ‐1.3 ‐1.2 ‐0.5 ‐0.8 Agriculture 0.5 0.5 0.2 0.3 ‐0.7 ‐0.7 ‐0.5 ‐0.6 0.7 0.9 0.4 0.6 Forestry & Wood ‐0.3 ‐0.3 ‐0.5 ‐0.5 ‐1.0 ‐0.9 ‐0.2 ‐0.3 ‐0.5 ‐0.3 0.1 0.0 Durables ‐0.7 ‐0.7 ‐0.7 ‐0.8 ‐1.6 ‐1.6 ‐0.3 ‐0.7 ‐1.6 ‐1.5 ‐0.3 ‐0.7 Non‐Durables 0.5 0.6 0.1 0.2 ‐0.4 ‐0.5 ‐0.2 ‐0.3 0.1 0.2 0.1 0.2 Transportation 0.8 0.9 0.5 0.6 ‐0.7 ‐0.7 ‐0.4 ‐0.5 ‐0.1 ‐0.1 0.0 0.0 Services 0.3 0.3 0.2 0.2 0.2 0.3 0.2 0.2 0.4 0.5 0.3 0.4 Brooking’s Report July 24th 2009.
By 2025, the greater mid‐term stringency of OA and DD causes the increase in energy prices and decrease in energy output to be larger in magnitude than under the H50 and HC policies. The effects on employment are also larger in magnitude, with more workers moving out of most energy sectors and into agriculture, non‐durable manufacturing and services. Natural gas utilities are an interesting exception: demand remains relatively strong as electric utilities shift from coal to gas, and employment rises slightly as gas producers shift slightly toward more labor‐intensive practices.
Effect on the U.S. Trade Balance The Figure below shows the change in the U.S. trade balance over time for each policy relative to the reference scenario.
Figure 76: Effect of Alternative Policies on the U.S. Trade Balance
Source: Brooking’s Report July 24th 2009.

Phase Two of Florida C&T Project: Economic Analysis
89
A negative value indicates that the policy moves the trade balance towards deficit and a positive value indicates movement towards surplus. There are a number of ways to interpret the trade balance. The more conventional approach is to note that as the U.S. takes action on emissions which raise the price of energy, U.S. exports, particularly energy intensive exports become less competitive on world markets. This implies that exports should decline relative to imports and the trade balance would therefore worsen. In the initial years this is largest for the cost‐minimizing HC scenario since the initial energy price rise is largest for this policy. An alternative way to understand the results is to note that the current account is the net of aggregate saving and investment decisions in the economy. With a given level of payments servicing net external debt, it is the outcome of saving and investment decisions that determines the trade balance and the change in the price of energy determines the composition of the trade balance.
Effect of Alternative Policy Scenarios on U.S. Real Effective Exchange Rate: Figure 77 shows the change in real effective exchange rate in the United States for the years (2010‐2035).
Figure 77: Effect of Alternative Policies on the U.S. Real Effective Exchange Rate
A rise in this ratio relative to the reference scenario is an appreciation of the real effective exchange rate. The rise in carbon price tends to raise the price of U.S. goods. The U.S. dollar exchange rate
Source: Brooking’s Report July 24th 2009.

Phase Two of Florida C&T Project: Economic Analysis
90
does not offset this and thus the appreciation of the real effective exchange rate reflects the rise in the relative price of U.S. goods as a result of the rise in energy prices.
Alternative Scenarios The Brooking’s Report additionally incorporates two alternative scenarios with cost containment mechanisms: a price ceiling policy that allows the government to sell additional emissions allowances at a pre‐set price each year, limiting how high market permit prices would go, and a price collar that includes a price floor as well as a price ceiling. Different CO2 emissions have been analyzed under different allowance prices.
Conclusions The results presented in the Report indicate that the U.S. can reduce cumulative carbon dioxide emissions over the period 2010‐2050 by 112 to 141 billion MT, or by 40 to 50 percent relative to business as usual (BAU), at a present value cost in forgone consumption of $0.6 to $2 trillion 2008 dollars. By 2050, each of the policies that are analyzed in the Report would reduce U.S. GDP relative to the baseline by about 2.5 percent, which is essentially the same as the 2.4 percent baseline rate of GDP growth. That is, the accumulated effect of carbon controls through 2050 is roughly equivalent to reaching 2050’s reference GDP in 2051 rather than 2050. The scenarios that achieve the targets proposed by the Obama administration and the targets included in an early version of the Waxman‐Markey bill produce similar outcomes. The Obama target scenario has slightly higher emissions but also has slightly lower costs. At a 4 percent discount rate, the two policies are $200 to $400 billion more costly in present value than the cost minimizing approaches, out of a total cost of around $1 trillion 2008 dollars.
Energy Technology Perspective‐200839 International Energy Agency (IEA) has done scenario analysis and strategies to 2050 in the ‘Energy Technology Perspective’‐2008. This study is about the role of technology in CO2 mitigation and identifies road maps that specify development needs.
This scenario analysis deals with energy‐related CO2 emissions, which account for most of anthropogenic greenhouse gas emissions. The so‐called ‘ACT Scenario’ shows that global CO2 emissions could be brought back to the 2005 level by 2050, whereas the “BLUE Scenario” targets a 50% reduction in CO2 emissions by 2050. It employs a completely different energy system and is possible only if almost whole world participates in it.
Under ACT scenario, technologies that already exist, or are in an advanced stage of development, can bring global CO2 emission back to current levels by 2050. Emissions need to peak between 2020 and 2030. The ACT Map implies adoption of a wide range of technologies with marginal costs up to U.S.D. 50 per ton of CO2 saved when fully commercialized. This level of effort affects certain energy related activities profoundly. It would approximately double the generating costs of a coal power station not equipped with CO2 capture and storage. The task is difficult and costly. Additional investment needs in the energy sector are estimated at U.S.D. 17 trillion between the starting point and 2050. This is on average around U.S.D. 400 billion per year, roughly equivalent to the gross
39 IEA ETP 2008. Available at http://www.iea.org/Textbase/npsum/ETP2008SUM.pdf
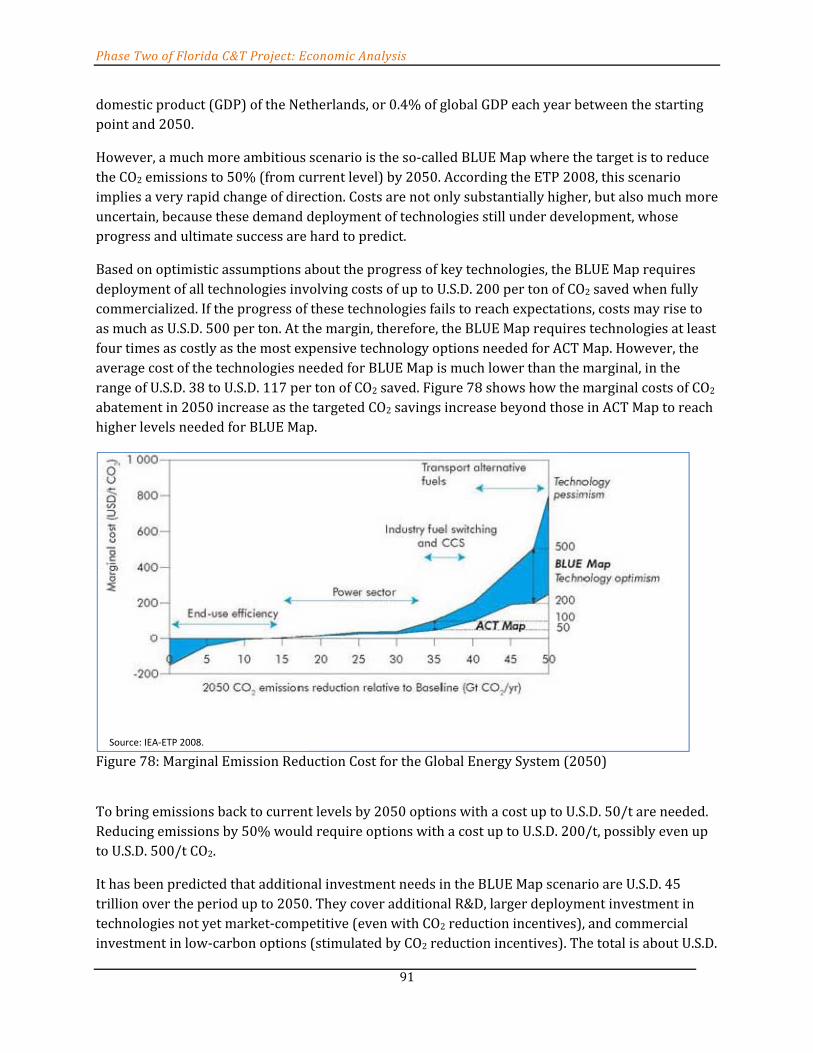
Phase Two of Florida C&T Project: Economic Analysis
91
domestic product (GDP) of the Netherlands, or 0.4% of global GDP each year between the starting point and 2050.
However, a much more ambitious scenario is the so‐called BLUE Map where the target is to reduce the CO2 emissions to 50% (from current level) by 2050. According the ETP 2008, this scenario implies a very rapid change of direction. Costs are not only substantially higher, but also much more uncertain, because these demand deployment of technologies still under development, whose progress and ultimate success are hard to predict.
Based on optimistic assumptions about the progress of key technologies, the BLUE Map requires deployment of all technologies involving costs of up to U.S.D. 200 per ton of CO2 saved when fully commercialized. If the progress of these technologies fails to reach expectations, costs may rise to as much as U.S.D. 500 per ton. At the margin, therefore, the BLUE Map requires technologies at least four times as costly as the most expensive technology options needed for ACT Map. However, the average cost of the technologies needed for BLUE Map is much lower than the marginal, in the range of U.S.D. 38 to U.S.D. 117 per ton of CO2 saved. Figure 78 shows how the marginal costs of CO2 abatement in 2050 increase as the targeted CO2 savings increase beyond those in ACT Map to reach higher levels needed for BLUE Map.
Figure 78: Marginal Emission Reduction Cost for the Global Energy System (2050)
To bring emissions back to current levels by 2050 options with a cost up to U.S.D. 50/t are needed. Reducing emissions by 50% would require options with a cost up to U.S.D. 200/t, possibly even up to U.S.D. 500/t CO2.
It has been predicted that additional investment needs in the BLUE Map scenario are U.S.D. 45 trillion over the period up to 2050. They cover additional R&D, larger deployment investment in technologies not yet market‐competitive (even with CO2 reduction incentives), and commercial investment in low‐carbon options (stimulated by CO2 reduction incentives). The total is about U.S.D.
Source: IEA‐ETP 2008.

Phase Two of Florida C&T Project: Economic Analysis
92
1.1 trillion per year. This is roughly equivalent to the current GDP of Italy. It represents an average of some 1.1% of global GDP each year from the starting point until 2050. This expenditure reflects a re‐direction of economic activity and employment, and not necessarily a reduction of GDP. While there will be impacts on global GDP, these are hard to predict and were stated to be beyond the scope of the ETP.
One of the main areas covered under the ETP 2008 is decarbonization of power generation. This can be achieved through a combination of renewables, nuclear power, and use of CCS at fossil fuel plants. Whichever the final target, action in all these areas is urgent and necessary. It is particularly important to avoid lock‐in of inefficient technologies for decades to come. In the BLUE Map scenario, higher‐cost options such as CCS in industry and alternative transport fuels need to be deployed. Figure below shows the sources of CO2 savings in the BLUE Map scenario compared to the Baseline scenario. Policy makers should remember that long lead times are frequently required to implement changes and that priorities in each country will vary according to national circumstances. Reducing energy sector methane emissions, moreover, is also an important part of an overall climate change strategy, as these emissions offer significant near‐term and cost‐effective greenhouse gas reduction opportunities.
Figure 79: Comparison of a 450 PPM Case and the BLUE Map Scenario 2005‐2050
Sector‐wise contributions identified in ETP 2008, cover the power, industry, buildings and transport sectors. Starting from the baseline emissions of 62 Gt CO2, the BLUE Map scenario targets CO2 emissions in the range of 14 Gt. Percentile sector‐wise contributions towards this mitigation scenario are 30% form power Sector, 19% from industry, 17% from buildings and 26% from transport sector as exhibited in next figure.
Source: IEA‐ETP 2008.

Phase Two of Florida C&T Project: Economic Analysis
93
Figure 80: Sector‐wise Comparison of a 450 PPM Case and the BLUE Map Scenario 2005‐2050
MIT Assessment of U.S. C&T Proposals
The MIT Emissions Prediction and Policy Analysis model is applied to an assessment of a set of C&T proposals that were considered by the U.S. Congress in 2007. The bills specify emissions reductions to be achieved through 2050 for the standard six‐gas basket of greenhouse gases. They fall into two groups: one specifies emissions reductions of 50% to 80% below 1990 levels by 2050; the other establishes a tightening target for emissions intensity and stipulates a time‐path for a “safety valve” limit on the emission price that approximately stabilizes U.S. emissions at the 2008 level. A set of three synthetic emissions paths are defined that span the range of stringency of these proposals, and these “core” cases are analyzed for their consequences in terms of emissions prices, effects on energy markets, welfare cost, the potential revenue generation if allowances are auctioned and the gains if permit revenue were used to reduce capital or labor taxes. 40
The initial period prices for the first group of proposals, in carbon dioxide equivalents, are estimated between $30 and $50 per ton CO2‐e depending on where each falls in the 50% to 80% range, with these prices rising by a factor of four by 2050. Welfare costs are less than 0.5% at the start, rising in the most stringent case to near 2% in 2050. If allowances were auctioned these proposals could produce revenue between $100 billion and $500 billion per year depending on the case. Emissions prices for the second group, which result from the specified safety‐valve path, rise from $7 to $40 over the study period, with welfare effects rising from near zero to approximately a 0.5% loss in 2050. Revenue in these proposals depends on how many allowances are freely distributed.
40 The web link http://web.mit.edu/globalchange/www/MITJPSPGC_Rpt146.pdf includes an assessment of U.S. C&T proposals.
Source: IEA‐ETP 2008.

Phase Two of Florida C&T Project: Economic Analysis
94
To analyze these proposals assumptions are made about mitigation effort abroad, and simulations are provided to illuminate terms‐of‐trade effects that influence the emissions prices and welfare effects, and even the environmental effectiveness, of U.S. actions. Sensitivity tests also are provided of several of the design features imposed in the “core” scenarios including the role of banking, the specification of less than complete coverage of economic sectors, and the development of international permit trading. Also, the Report explores the effects of alternative assumptions about nuclear power development. Of particular importance in these simulations is the role of biofuels, and analysis is provided of the implications of these proposals for land use and agriculture.
In the end, the U.S. proposals, and the assumptions about effort elsewhere, are extended to 2100 to allow exploration of the potential role of these bills in the longer‐term challenge of reducing climate change risk. The study contains simulations using the MIT Integrated System Model which show that the 50% to 80% targets are consistent with global goals of atmospheric stabilization at 450 to 550 ppm CO2 but only if other nations, including the developing countries, follow.

Phase Two of Florida C&T Project: Economic Analysis
95
Addressing Climate Change with a Comprehensive U.S. C&T System, the KSG Report
The KSG Report describes and analyzes an up‐stream, economy‐wide CO2 C&T system which implements a gradual trajectory of emissions reductions (with inclusion over time of non‐CO2 greenhouse gases), and includes mechanisms to reduce cost uncertainty. Initially, half of the allowances are allocated through auction and half through free distribution, with the share being auctioned gradually increasing to 100 percent over 25 years. The system provides for linkage with emission reduction credit projects in other countries, harmonization over time with effective C&T systems in other countries and regions, and appropriate linkage with actions taken in other countries, in order to establish a level playing field among domestically produced and imported products.41
U.S. Low Carbon Economic Tool
McKinsey & Company recently launched a tool that incorporates different models like sectoral models, fossil fuel price model, carbon price model and/or power price model to generate inputs to be fed into REMI PI+ macroeconomic model in order to get forecasted or projected values of economic variables like GDP, jobs, exports/imports, industry‐wise output, etc. They test their model under various policy scenarios e.g. in order to test emission reductions to be achieved by 2030 they build the ‘abatement by sector’ in 2030 under seven different policy scenarios. The sectors they chose are buildings, industry, renewable power, conventional power, transportation, domestic offsets and international offsets.42
The tool is basically a set of multiple interlinked models that calculates the potential economic impacts of a wide range of potential energy and climate policies‐including both cap‐and–trade and uncapped policy frameworks ‐ for the 48 continental United States and 165 industry sectors. Users can define the type of policy to model (e.g. efficiency mandates combined with a clean energy standard but without a cap, or a C&T system with efficiency mandates and subsidies for clean energy) and a number of background assumptions (e.g. learning rates for clean technologies), and the tool generates an overview of the policy’s impact on GDP, jobs, and prices at the state and industry level by the year through 2030.
Stages of the Tool
The tool works in two stages. Stage I calculates the four primary direct effects of the policy ‐ changes in demand, changes in energy prices, changes in industry cost structure and changes in tax. Stage II aggregates these changes into the appropriate sectors and feeds them into a macroeconomic model of the U.S. economy created by REMI.
41Addressing Climate Change with a Comprehensive U.S. C&T System – Kennedy School of Government (KSG), Harvard University. Available at: http://www.hks.harvard.edu/m‐rcbg/rpp/Working%20papers/RPP_2007_07Stavins.pdf
42 U.S. Low Carbon Economic Tool by the McKinsey & Company

Phase Two of Florida C&T Project: Economic Analysis
96
Stage I 1. Changes in demand: Variations in demand are naturally expected as a result of policy
changes. The result might be a greater demand for solar panels, insulation, or smart devices or reduced demand for electricity and fossil fuels. As explained by the researchers the tool combines McKinsey’s abatement curves with models of consumer, investor, and business behavior to quantify the expected size of these demand shifts in each year through 2030.
2. Changes in energy price: Energy prices may vary in multiple ways, including reduced or increased reliance on expensive peak‐capacity electricity as demand changes, lower marginal coal production costs if demand falls, and in the case of policies with carbon pricing, higher carbon costs for electric generators, carbon revenue rebates to electric generators and consumers, and potential changes in pricing mechanisms (e.g. increase in the ‘coal floor’ for natural gas prices when carbon prices rise. The McKinsey tool models these and other factors to calculate potential deflections from BAU pricing levels.
3. Changes in industry cost structure: Various policy scenarios will impact the costing of different industries differently. Some industries face increased cost as a result of higher energy prices, the direct and indirect effects of carbon prices(if applicable), and carbon revenue refunds. These can be captured by assigning to each industry the cost changes that are appropriate to its energy consumption and covered GHG emissions.
4. Changes in Taxes: Policies that increase government spending (like subsidies for renewable) will eventually have an impact on taxes. In the model/tool, the incremental spending is financed at prevailing rates for 30‐year government bonds and increase taxes by the amount required to service this debt. Whereas the indirect tax consequences are handled within the macroeconomic model.
Stage II
In step II, the tool aggregates these changes into the appropriate sectors and feeds them into REMI, a macroeconomic model of the U.S. economy. REMI is a DGE model that calculates the overall economic implications of the policy as the U.S adapts to new levels of demand, prices, costs and taxation. Depending on the scenario, the tool provides multiple outputs for analyzing the impact of the given policy. These range from an increase/decrease in GDP; electricity prices by year and region; an increase/decrease in jobs by year, state and industry; incremental spending on clean technologies, and/or carbon prices by year.
Regional Greenhouse Gas Initiative Report:
RGGI is the first mandatory cap‐and‐trade program in the United States for carbon dioxide (CO2). It is a ten‐state cooperative effort to reduce greenhouse gas emissions from electric power generation.

Phase Two of Florida C&T Project: Economic Analysis
97
In September 2008, the world’s largest carbon auction was held. It encompassed 10 northeastern states: CT, DE, MA, MD, ME, NH, NJ, NY, RI, VT. The program affects about 225 facilities (those with fossil fuel‐fired generators of 25MW or greater).43
Revenues from auctions will be used to bolster investment in energy efficiency and renewables. Offsets are also going to be used for plants to meet their 3.3% compliance obligations. Offsets include landfill gas recovery and agricultural methane recapture.
Models are predicting a 1‐3% increase on retail energy rates. There are triggers in place if prices rise higher than expected. The allowance prices are passed on to the consumer. This will let everyone know the price of allowances and force plants to alter their production. By letting market forces set the price instead of government mandate, firms and plants can take the most cost‐efficient action.
43 http://www.rggi.org/docs/RGGI_Executive%20Summary_4.22.09.pdf

Phase Two of Florida C&T Project: Economic Analysis
98
References Congressional Budget Office. The Estimated Costs to Households from the C&T Provision of H.R. 2454, June 2009.
Cooper, Mark. A Consumer Analysis of Energy Efficiency and Renewable Energy Standards: A Cornerstone of Consumer Friendly Energy/Environmental Policy. Consumer Federation of America, May 2009.
Economic Development Research Group. Economic Impacts of Proposed Northeast Regional Greenhouse Gas Initiative. Northeast Regional Greenhouse Gas Initiative, April 2006.
Elliott, M. Eldridge, A. Shipley, S. Laitner, S. Nadel, P. Fairey, R. Vieira, J.Sonne, A. Silverstein, B. Hedmand and K. Darrow. Potential for Energy Efficiency and Renewable Energy to Meet Florida’s Growing Energy Demands. American Council for an Energy‐Efficient Economy. June 2007.
Florida Department of Environmental Protection, Division of Air Resource Management, Electric Utility Greenhouse Gas C&T Workshop Series.
Florida Department of Environmental Protection, May 19, 2009 Electric Utility GG C&T workshop. http://www.dep.state.fl.us/air/rules/ghg/electric.htm
Florida Governor’s Action Team on Energy & Climate Change. Florida’s Energy & Climate Change Action Plan. October 2008. http://www.flclimatechange.us/documents.cfm
International Energy Agency. Energy Technology Perspective‐2008 ‐ Scenario Analysis. 2008.
Roland‐Hurst, David, and Fredrich Kahrl. The Florida Economy and a Federal Carbon Cap. June 2009. http://are.berkeley.edu/~dwrh/CERES_Web/Docs/FL_Economy_RHK090616.pdf
Rose, Adam and Dan Wei. The Economic Impact of the Florida Energy and Climate Change Action Plan on the State’s Economy. Center for Climate Strategies, June 2009.
McKibbin, Warwick J., Adele Morris, Peter J. Wilcoxen, Yiyong Cai. Consequences of Alternative U.S. C&T Policies: Controlling Both Emissions and Costs. Brooking’s Institute. Available at: http://www.brookings.edu/~/media/Files/rc/reports/2009/07_cap_and_trade/0727_cost_containment.pdf
Mckinsey & Company. U.S. Low Carbon Economic Tool. March 2010. Available at: http://www.mckinsey.com/clientservice/sustainability/pdf/U.S._LowCarbonEcon_Tool.pdf
Montgomery, D., R. Baron, P. Bernstein, S. Bloomberg, K. Ditzel, L. Lane, A. Smith, S. Tuladhar, and M. Yuan. Impact on the Economy of the American Clean Energy and Security Act of 2009 (H.R. 2454). CRA International, May 2009.
Montgomery, D., J. Plewes, A. Smith, and S. Tuladhar. Economic Analysis of Florida’s Executive Order 07‐127. CRA International, December 2007.

Phase Two of Florida C&T Project: Economic Analysis
99
Stavins, Rober. Addressing Climate Change with a Comprehensive U.S. C&T System. Kennedy School of Government, Harvard University. 2007. Available at: http://www.hks.harvard.edu/m‐rcbg/rpp/Working%20papers/RPP_2007_07Stavins.pdf
Tuerck, D., M. Head, P. Bachman, A. Sanchez‐Penalver. The Economic Analysis of the Western Climate Initiative’s Regional C&T Program. The Beacon Hill Institute at Suffolk University. March 2009.
U.S. Environmental Protection Agency, Office of Atmospheric Programs. EPA Preliminary Analysis of the Waxman‐Markey Discussion Draft: The American Clean Energy and Security Act of 2009 in the 111th Congress. April 2009. http://www.epa.gov/climatechange/economics/pdfs/WM‐Analysis.pdf

Phase Two of Florida C&T Project: Economic Analysis
100
Appendix A – Florida’s 2008 Energy Bill Climate Protection Act
Florida Energy Bill On June 25, 2008, Florida passed the House Bill 7135, which is a wide‐ranging energy bill that calls for advancing energy efficiency and renewable energy in Florida, while cutting greenhouse gas emissions. It also requires the Florida Public Service Commission to establish a renewable portfolio standard that will specify a minimum percentage of retail electricity sales that must be supplied by renewable energy. The bill does not set a minimum standard or timeline, but it does require the commission to prepare a draft rule by February 2009 and present it to the legislature for approval.44
Florida Climate Protection Act The energy bill contains the Florida Climate Protection Act. The Act states that it is in the best interest of Florida to document greenhouse gas emissions and to pursue a market‐based emissions abatement program, such as a C&T regulatory program that will reduce greenhouse gas emissions. Companies that exceed their emissions caps must buy credits from companies that polluted less than their allotment. Greenhouse gases (GHGs) can include carbon dioxide, methane, nitrous oxide, and fluorinated gases such as hydrofluorocarbons, perfluorocarbons, and sulfur hexafluoride.45
This C&T system is an administrative approach used to control pollution by providing a limit on total allowable emissions. It provides for allowances to emit a certain amount of pollution. It also allows polluters to transfer allowances in order to comply with emission limits. The allowances will be issued through allotments or auction, which allows polluters to emit specific amounts of greenhouse gases.46
This Act only applies to major emitters, which are defined in the Bill as electric utilities only. The major emitters must also use The Climate Registry for the purpose of emission registration and reporting. It also allows the Department of Environmental Protection (DEP) permission to require quality‐assured data from continuous emissions monitoring systems. The statewide cap, methods for allocating the cap, the process for issuing emissions allowances, and timeline have not been set yet. The rules for the C&T program will be decided by the DEP, who will consult with the Florida Energy and Climate Commission, the Florida Service Commission, and the Governor’s Action Team for Energy and Climate Change. The DEP will not adopt the rules until after January 1, 2010, and they will not become effective until ratified by the Legislature.47
Proposed Market‐Based Emissions Abatement Program (C&T) Section 65. 403.44 Florida Climate Protection Act.—
44 “Florida Energy Bill to Boost Efficiency and Renewable Energy” U.S. Department of Energy. 45 “Florida Energy Bill, HB 7135.” Florida House of Representatives. 46 “Florida Energy Bill, HB 7135.” Florida House of Representatives. 47 “Florida Energy Bill, HB 7135.” Florida House of Representatives.

Phase Two of Florida C&T Project: Economic Analysis
101
1) The Legislature finds it is in the best interest of the state to document, to the greatest extent practicable, greenhouse gas emissions and to pursue a market‐based emissions abatement program, such as C&T, to address greenhouse gas emissions reductions.
2) As used in this section, the term:
(a) "Allowance" means a credit issued by the department through allotments or auction which represents an authorization to emit specific amounts of greenhouse gases, as further defined in department rule.
(b) "C&T" or "emissions trading" means an administrative approach used to control pollution by providing a limit on total allowable emissions, providing for allowances to emit pollutants, and providing for the transfer of the allowances among pollutant sources as a means of compliance with emission limits.
(c) "Greenhouse gas" or "GHG" means carbon dioxide, methane, nitrous oxide, and fluorinated gases such as hydrofluorocarbons, perfluorocarbons, and sulfur hexafluoride.
(d) "Leakage" means the offset of emission abatement that is achieved in one location subject to emission control regulation by increased emissions in unregulated locations.
(e) "Major emitter" means an electric utility regulated under this chapter.
(3) A major emitter shall be required to use The Climate Registry for purposes of emission registration and reporting.
(4) The department shall establish the methodologies, reporting periods, and reporting systems that shall be used when major emitters report to The Climate Registry. The department may require the use of quality‐assured data from continuous emissions monitoring systems.
(5) The department may adopt rules for a C&T regulatory program to reduce greenhouse gas emissions from major emitters. When developing the rules, the department shall consult with the Florida Energy and Climate Commission and the Florida Public Service Commission and may consult with the Governor's Action Team for Energy and Climate Change. The department shall not adopt rules until after January 1, 2010. The rules shall not become effective until ratified by the Legislature.
(6) The rules of the C&T regulatory program shall include, but are not limited to:
(a) A statewide limit or cap on the amount of greenhouse gases emitted by major emitters.
(b) Methods, requirements, and conditions for allocating the cap among major emitters.
(c) Methods, requirements, and conditions for emissions allowances and the process for issuing emissions allowances.
(d) The relationship between allowances and the specific amounts of greenhouse gas emissions they represent.

Phase Two of Florida C&T Project: Economic Analysis
102
(e) The length of allowance periods and the time over which entities must account for emissions and surrender allowances equal to emissions.
(f) The timeline of allowances from the initiation of the program through to 2050.
(g) A process for the trade of allowances between major emitters, including a registry, tracking, or accounting system for such trades.
(h) Cost containment mechanisms to reduce price and cost risks associated with the electric generation market in this state. Cost containment mechanisms to be considered for inclusion in the rules include, but are not limited to:
1. Allowing major emitters to borrow allowances from future time periods to meet their greenhouse gas emission limits.
2. Allowing major emitters to bank greenhouse gas emission reductions in the current year to be used to meet emission limits in future years.
3. Allowing major emitters to purchase emissions offsets from other entities that produce verifiable reductions in unregulated greenhouse gas emissions or that produce verifiable reductions in greenhouse gas emissions through voluntary practices that capture and store greenhouse gases that otherwise would be released into the atmosphere. In considering this cost containment mechanism, the department shall identify sectors and activities outside of the capped sectors, including other state, federal, or international activities, and the conditions under which reductions there can be credited against emissions of capped entities in place of allowances issued by the department. The department shall also consider potential methods and their effectiveness to avoid double‐incentivizing such activities.
4. Providing a safety valve mechanism to ensure that the market prices for allowances or offsets do not surpass a predetermined level compatible with the affordability of electric utility rates and the well‐being of the state's economy. In considering this cost containment mechanism, the department shall evaluate different price levels for the safety valve and methods to change the price level over time to reflect changing state, federal, and international markets, regulatory environments, and technological advancements.
In considering cost containment mechanisms for inclusion in the rules, the department shall evaluate the anticipated overall effect of each mechanism on the abatement of greenhouse gas emissions and on electricity ratepayers and the benefits and costs of each to the state's economy, and shall also consider the interrelationships between the mechanisms under consideration.
(i) A process to allow the department to exercise its authority to discourage leakage of GHG emissions to neighboring states attributable to the implementation of this program.

Phase Two of Florida C&T Project: Economic Analysis
103
(j) Provisions for a trial period on the trading of allowances before full implementation of a trading system.
(7) In recommending and evaluating proposed features of the C&T system, the following factors shall be considered:
(a) The overall cost‐effectiveness of the C&T system in combination with other policies and measures in meeting statewide targets.
(b) Minimizing the administrative burden to the state of implementing, monitoring, and enforcing the program.
(c) Minimizing the administrative burden on entities covered under the cap.
(d) The impacts on electricity prices for consumers.
(e) The specific benefits to the state's economy for early adoption of a C&T system for greenhouse gases in the context of federal climate change legislation and the development of new international compacts.
(f) The specific benefits to the state's economy associated with the creation and sale of emissions offsets from economic sectors outside of the emissions cap.
(g) The potential effects on leakage if economic activity relocates out of the state.
(h) The effectiveness of the combination of measures in meeting identified targets.
(i) The implications for near‐term periods of long‐term targets specified in the overall policy.
(j) The overall costs and benefits of a C&T system to the state economy.
(k) How to moderate impacts on low‐income consumers that result from energy price increases.
(l) Consistency of the program with other state and possible federal efforts.
(m) The feasibility and cost‐effectiveness of extending the program scope as broadly as possible among emitting activities and sinks in Florida.
(n) Evaluation of the conditions under which Florida should consider linking its trading system to the systems of other states or other countries and how that might be affected by the potential inclusion in the rule of a safety valve.
(8) Recognizing that the international, national, and neighboring state policies and the science of climate change will evolve, prior to submitting the proposed rules to the Legislature for consideration, the department shall submit the proposed rules to the Florida Energy and Climate Commission, which shall review the proposed rules and submit a report to the Governor, the

Phase Two of Florida C&T Project: Economic Analysis
104
President of the Senate, the Speaker of the House of Representatives, and the department. The report shall address:
(a) The overall cost‐effectiveness of the proposed C&T system in combination with other policies and measures in meeting statewide targets.
(b) The administrative burden to the state of implementing, monitoring, and enforcing the program.
(c) The administrative burden on entities covered under the cap.
(d) The impacts on electricity prices for consumers.
(e) The specific benefits to the state's economy for early adoption of a C&T system for greenhouse gases in the context of federal climate change legislation and the development of new international compacts.
(f) The specific benefits to the state's economy associated with the creation and sale of emissions offsets from economic sectors outside of the emissions cap.
(g) The potential effects on leakage if economic activity relocates out of the state.
(h) The effectiveness of the combination of measures in meeting identified targets.
(i) The economic implications for near‐term periods of short‐term and long‐term targets specified in the overall policy.
(j) The overall costs and benefits of a C&T system to the economy of the state.
(k) The impacts on low‐income consumers that result from energy price increases.
(l) The consistency of the program with other state and possible federal efforts.
(m) The evaluation of the conditions under which the state should consider linking its trading system to the systems of other states or other countries and how that might be affected by the potential inclusion in the rule of a safety valve.
(n) The timing and changes in the external environment, such as proposals by other states or implementation of a federal program that would spur reevaluation of the Florida program.
(o) The conditions and options for eliminating the Florida program if a federal program were to supplant it.
(p) The need for a regular reevaluation of the progress of other emitting regions of the country and of the world, and whether other regions are abating emissions in a commensurate manner.

Phase Two of Florida C&T Project: Economic Analysis
105
(q) The desirability of and possibilities of broadening the scope of the state's C&T system at a later date to include more emitting activities as well as sinks in Florida, the conditions that would need to be met to do so, and how the program would encourage these conditions to be met, including developing monitoring and measuring techniques for land use emissions and sinks, regulating sources upstream, and other considerations.

Phase Two of Florida C&T Project: Economic Analysis
106
Appendix B. Synopsis of C&T Studies and Articles
Overview of RGGI CO2 Budget Trading Program http://www.rggi.org/docs/program_summary_10_07.pdf
The basis of RGGI was created through the Model Rule which was edited and revised by politicians, energy experts and public opinion. The Model Rule was based off of an actual EPA rule provision for the creation and functioning of a C&T program. Fossil fuel‐fired generators of 25MW are held responsible for 95% of their CO2 emissions. Fossil fuel‐fired is defined as any generator using more than 5% fossil fuel. States must stabilize CO2 emissions for 6 years from 2009‐2014 and decrease emissions by 2.5% per year from 2015‐1018. This will decrease the annual CO2 emissions budget from 188,076,976 short tons to 169,269,278 short tons.
Most C&T programs give allowances to generators for free whereas RGGI sells allowances through regional auctions. It is up to the state to regulate their allocation of allowances. However, 25% minimum must be placed towards consumer benefit programs (i.e. energy efficiency, reward investment, renewable energy products). Most states are auctioning 100% or close and then contributing the necessary amount to consumer benefit programs.
It is believed that the introduction of green energy would not necessarily decrease overall CO2 emissions as the other generators would continue to produce CO2. In order to combat this, allowances can be awarded for the voluntary purchase of renewable energy generators.
Regional Greenhouse Gas Initiative Executive Summary http://www.rggi.org/docs/RGGI_Executive%20Summary_4.22.09.pdf
RGGI is the first mandatory C&T program; in September 2008, the world’s largest carbon auction was held. It encompassed 10 northeastern states: CT, DE, MA, MD, ME, NH, NJ, NY, RI, VT. The program affects about 225 facilities (those with fossil fuel‐fired generators of 25MW or greater).
Revenues from auctions will be used to bolster investment in energy efficiency and renewables. Offsets are also going to be used for plants to meet their 3.3% compliance obligations. Offsets include landfill gas recovery and agricultural methane recapture.
Models are predicting a 1‐3% increase on retail energy rates. There are triggers in place if prices rise higher than expected. The allowance prices are passed on to the consumer. This will let everyone know the price of allowances and force plants to alter their production. By letting market forces set the price instead of government mandate, firms and plants can take the most cost‐efficient action.
5/5/09
http://www.nytimes.com/gwire/2009/05/05/05greenwire‐were‐working‐out‐the‐issues‐house‐dems‐say‐aft‐19116.html
The bill for a national C&T program is still trying to get pushed through by Memorial Day from Rep. Henry Waxman of California. He is familiar with WCI and from what I read about him he was

Phase Two of Florida C&T Project: Economic Analysis
107
somewhat involved with its creation. So he is knowledgeable about C&T. The GOP are creating their own “summit” aimed at what they believe is just an energy tax. This rift between parties could lead to a dead bill.
http://www.google.com/hostednews/ap/article/ALeqM5g5i6DVVs_EMnlyec8G47kVl3oMZQD980AUK2
The “cash for clunkers” clause may still meet some opposition in the senate. The bill proposes that persons who replace old, low efficiency cars with new fuel‐efficient models could receive $3500 or $4500. This clause is attached to the C&T bill which is having trouble getting through as well.
Obama’s budget expects $650 billion from a C&T program which would go back to families needing help to pay for higher energy prices.
In August, 2008 the allowances in RGGI sold for a clearing price of $3.07. In March of 2009 the clearing price was $3.51
5/13/09
http://www.istockanalyst.com/article/viewarticle/articleid/3229711
There were some leaked memos from the EPA stating that a federal C&T program could have drastic, negative effects on the U.S. economy. The EPA maintains that it isn’t going to be deterred by this but it will have to readjust its proposed program. This article goes into more detail: http://online.wsj.com/article/SB124214922088511421.html #mod=rss_whats_news_us_business
http://exceptionmag.com/news/green/000952/americans‐are‐clueless‐about‐C&T
Article did a poll on persons to see if they could correctly identify C&T. 24% were correct, 29% believe it has to do with Wall Street and 17% believe it is to do with health care reform. 30% had no idea.
http://www.foxnews.com/politics/2009/05/12/waxman‐confident‐cap‐trade‐pass‐house‐memorial‐day/
Waxman is still pushing to get the bill through on time. If it gets through committee it will spend most of the summer on the floor. It’s unclear if Waxman was aware of the EPA leak and if that could affect the deadline, or even the whole bill.
5/15/09
The bill passed through the committee with a new provision to give 2% of allowances to refineries for free. It will have to make it through the Energy and Commerce Committee this coming week. One more addition from Democrats is that 50% of allowances should be given to local electric distributors, trade‐sensitive industries and automakers (which they already did with the 3% allowances).

Phase Two of Florida C&T Project: Economic Analysis
108
http://www.beaconhill.org/BHIStudies/WCI‐2009/WCIReportFinal090323.pdf
Impact study done by Beacon Hill which reports that the Western Climate Initiative (WCI) will do damage to the west economy even on the best circumstances. Charts on pages 19 and 20 give more detail about lost jobs and investment.
http://www.westernclimateinitiative.org/WCI_Documents.cfm
This is the response to stakeholder comments and is the final draft for the mandatory reporting of WCI.
5/18/09
www.rggi.org/docs/remi_stakeholder_presentation_11_17_05‐final.ppt
This is a great PowerPoint slideshow with information on RGGI from REMI models. It gives lots of details and solid numbers on the effects of no regulation, federal regulation, or their own regulation.
http://www.westernroundtable.com/Default.aspx
This is the Western Business Roundtable site. They are western business owners, representatives, etc... Their studies are consistently anti‐regulation and alternative energy. This is a big power fighting the WCI.
http://des.nh.gov/organization/divisions/air/tsb/tps/climate/rggi/documents/economic_faqs.pdf
A breakdown report for New Hampshire and the effects of RGGI. It seems that the C&T (C&T) system is going to increase energy prices by almost 3 times as much than if the system was not enacted. They also state that the increase in costs will be most directly borne by the consumers. Their argument is that the revenues generated from the auctions will allow rebates to ratepayers.
http://www.edrgroup.com/pdf/rggi%20economic%20impacts%20report%20edrgroup%20‐%20final042106.pdf
Another study of RGGI as a whole. Starting on page 25 it gives tables comparing the change with no program, RGGI, and the federal program.
http://www.midwesternaccord.org/
This is the MGGA – Midwestern Greenhouse Gas Accord. Similar to the RGGI and WCI, but for Midwestern states like Illinois, Iowa, Kansas, Michigan, Minnesota, Wisconsin, and Manitoba, Canada.
http://www.allamericanpatriots.com/48751896‐midwest‐governors‐to‐develop‐regional‐plan‐to‐cap‐and‐reduce‐global‐warming‐emis
Article about MGGA. States that this is their Plan B in case the federal program does not pass.

Phase Two of Florida C&T Project: Economic Analysis
109
http://www.sustainablebusiness.com/index.cfm/go/news.display/id/18203
Waxman gave free allowances to more than just the automakers. 85% of all the allowances are going to be allocated freely to certain industries. This article breaks down what industries get what percentage.
http://savannahnow.com/node/721708
An article covering the effects of the federal system in Georgia states that when the UK implemented a similar plan and gave free allowances, there was price volatility. It could be the fate of the U.S. if 85% of allowances are free. It also breaks down the economic impact of the program. These numbers are highly positive for the state of Georgia.
http://www.carbonpositive.net/viewarticle.aspx?articleID=1547
Goes over results from multiple polls about people’s perceptions of C&T. 77% of those polled favored C&T and 44% wanted to see the revenues go towards renewable energy research and rebates for higher energy costs.
5/19/09
http://www.washingtonpost.com/wp‐dyn/content/article/2009/05/18/AR200905 1802647.html
This is an op‐ed on how the trade portion of the national C&T program could cause widespread market volatility of electricity prices since the EPA program would deregulate the price controls currently used to keep prices stable. It makes sense, especially since there is an article in the bill which will let banks and hedge funds purchase allowances and make commissions selling them to companies that need them. Seems to be another aspect that will increase costs to the consumer with no real positive outcome to persuade innovation and investment in alternative energy.
http://www.huffingtonpost.com/bill‐chameides/indiana‐governor‐cap‐and_b_204810.html
The Governor of Indiana is opposing the C&T is not a good sign for its progress.
http://www.wctv.tv/news/headlines/45343352.html
An article relating to Florida. It outlines the new rebate plan that Crist just signed and it mentions his involvement with C&T in that last paragraph.
5/29/09
http://www.businessweek.com/magazine/content/09_23/b4134051760768.htm?chan=globalbiz_europe+index+page_finance%2C+markets+%2Bamp%3B+investing
C&T is not only affecting the power generation market, but also the banking sector. Projections show that trading could top out at $1 trillion in 2020.

Phase Two of Florida C&T Project: Economic Analysis
110
http://blogs.wsj.com/environmentalcapital/2009/05/29/hsbc‐down‐on‐waxman‐markey‐climate‐bill/
HSBC is unhappy with the change in direction of the bill; it won’t promote as much trading and credit buying as was proposed before. This will affect the international market for investment in energy credits.
http://www.nytimes.com/gwire/2009/05/26/26greenwire‐carbon‐allowances‐‐‐‐the‐glue‐in‐house‐energy‐10416.html?pagewanted=all
The article covers anticipated costs of carbon credits and the states that will be most affected. It seems that states heavy in coal burning energy will be hit with the largest costs. West Virginia, Kentucky and North Dakota are just a few.
http://agmetalminer.com/2009/05/29/will‐C&T‐cost‐american‐jobs/
Article assesses the notion that an increase on the price of energy will cause producing firms to cut jobs.
6/3/09
http://www.mnn.com/earth‐matters/energy/stories/transition‐from‐oil‐to‐renewable‐energy‐100‐years‐away‐says‐exxon‐mobil
Study done by Exxon Mobil states that oil will still be dominant energy source for 100 more years.
http://www.examiner.com/x‐1109‐Dallas‐Environmental‐Policy‐Examiner~y2009m6d1‐EU‐greenhouse‐gases‐decline‐due‐to‐warmer‐weather‐not‐capandtrade
Recent research shows that a reduction in greenhouse gasses in EU is due to higher than average temperatures which have led to a decrease in consumption for household energy use in conjunction with an increase in fuel prices.
6/5/09
http://news.cnet.com/8301‐11128_3‐10257627‐54.html
Covers a firm that has received a patent for monitoring greenhouse gas emissions along with a web based program and a few others proposed for new monitoring systems.
http://www.businessgreen.com/business‐green/news/2243619/cap‐trade‐hit‐utilities‐hard
Proposes that utility companies would suffer tremendous losses due to emission taxes. High emitters could lose almost a third of all revenue.
6/8/09

Phase Two of Florida C&T Project: Economic Analysis
111
http://redgreenandblue.org/2009/06/08/farm‐state‐democrats‐wont‐support‐climate‐bill‐without‐ethanol‐safeguards/
Democrats in the Midwest don’t plan on allowing a climate bill through unless ethanol is excluded from carbon emission taxes.
http://www.socialfunds.com/news/article.cgi/2713.html
Another article stating that if firms have to pay the projected cost of carbon emissions, their revenue will be cut almost in half.
http://www.businessinsider.com/cbo‐C&T‐bill‐will‐reduce‐deficit‐by‐24‐billion‐2009‐6
Covers the CBO’s statement that the C&T will create $24 billion in revenue from 2010‐2019. It also goes on to compare the predictions for Clean Air Act and the Medicare bill and how both revenue projections turned out to be false.
6/9/08
http://www.publicnewsservice.org/index.php?/content/article/9226‐1
Describes the effect that C&T would have on Ohio – heavy coal consumers and home to many manufacturers that need large amounts of energy to operate. These costs will get passed onto consumers somehow.
6/10/09
http://www.trucknews.com/issues/ISArticle.asp?aid=1000329981
Response by the ATA (American Trucking Association) that the C&T bill will increase fuel prices and decrease viability of trucking.
http://cornandsoybeandigest.com/ag‐issues/washington‐policy/0610‐cop‐and‐trade‐impact‐farmers/
Links to a Heritage Foundation study on how the C&T bill would affect farmers of different crops.
6/12/09
http://www.porkmag.com/directories.asp?pgID=675&ed_id=7737
An article from a pork producer magazine. Shows that the C&T bill will not only affect power plants, but also pork producers that emit beyond the specified allowance of gas from their facilities.
6/15/09
http://www.nytimes.com/gwire/2009/06/15/15greenwire‐senate‐committee‐looks‐to‐complete‐energy‐bill‐13069.html

Phase Two of Florida C&T Project: Economic Analysis
112
Follows the bill as it enters markup process. Amendments are being added and removed across the board to try and appease all sides.
6/22/09
http://are.berkeley.edu/~dwrh/CERES_Web/Docs/FL_Economy_RHK090616.pdf
An excellent study covering the effect of the Federal cap on the Florida economy.
http://www.latimes.com/news/nationworld/nation/la‐na‐coal22‐2009jun22,0,6722721.story
Follows the bill and the fact that it will still include provisions for coal burning power generation when the original bill proposed to not allow coal be protected.
6/23/09
http://news.prnewswire.com/DisplayReleaseContent.aspx?ACCT=104&STORY=/www/story/06‐23‐2009/0005048648&EDATE=
Covers the outcome of the most recent RGGI auction, which accumulated $104.2 million in the process of selling carbon credits.
http://wonkroom.thinkprogress.org/2009/06/23/waxman‐markey‐postcard/
Provides a link to the EPA study which states that utility bills would be 7% lower in 2020 due to the enactment of the bill.
6/24/09
http://blog.heritage.org/2009/06/24/governors‐beware‐C&T‐will‐squeeze‐your‐budget/
Provides a chart of projected decreases in operating surplus for each state if the C&T bill is passed.
http://economix.blogs.nytimes.com/2009/06/24/how‐much‐C&T‐would‐cost‐families/
Covers the effect of the C&T bill will have on households and how they can expect to be reimbursed if they fall into appropriate needs categories.
http://blogs.wsj.com/environmentalcapital/2009/06/24/epa‐sees‐limited‐renewable‐energy‐growth‐under‐waxman‐markey/
Study released by EPA states that there may be less renewable energy opportunities in 2020 with a C&T bill opposed to continuing market operation as it exists now.
6/26/09
http://www.tallahassee.com/apps/pbcs.dll/article?AID=2009906260315
Op‐Ed piece in favor of the C&T bill. Reiterates that Gov. Crist is strongly in favor of the legislation.

Phase Two of Florida C&T Project: Economic Analysis
113
http://www.tallahassee.com/apps/pbcs.dll/article?AID=2009906260314
An argument against the C&T bill that states there is a large population of scientists against it due to the implications it will have on the economy.
http://www.renewableenergyworld.com/rea/news/article/2009/06/climate‐and‐the‐3100‐lie‐detector
Describes the discrepancies of the MIT report stating that the new bill will cost families $3,100. Apparently the MIT model is outdated. The figure they come up with in the new report is close to the $175 proposed by legislators.
http://www.dailypress.com/news/dp‐news_howtheyvoted_0627jun27,0,6719368.story
Covers the basic breakdown of what the bill entailed. Lowering emissions by 17% of 2005 levels by 2020 and 83% by 2050.
http://www.ibtimes.com/articles/20090626/C&T‐vote‐results‐final.htm
In depth listing of each representative and his or her vote on the C&T bill.
6/27/09
http://www.tallahassee.com/apps/pbcs.dll/article?AID=2009906280312
Response by Rep. Allen Boyd on the passing of the C&T bill.
http://www.bellona.org/weblog/1246081351.91
Brief report on breakdown of voting for the C&T bill. 211 Democrats and 8 Republicans for, 44 Democrats voted against.
6/29/09
http://news.prnewswire.com/ViewContent.aspx?ACCT=109&STORY=/www/story/06‐29‐2009/0005052129&EDATE=
An extensive article covering what each power producing firm plans to invest into green technology. Goes into great detail about effects the bill could cause.
http://www.reuters.com/article/earth2Tech/idU.S.48749101720090629
A point of view article covering how different sectors of the economy, environmentalists and the energy industry among others, are viewing the recent passing of the bill.
http://www.thedailygreen.com/environmental‐news/latest/house‐C&T‐bill‐47062902
Describes what large agencies have to say about the newly passed bill. 15 different groups are noted, ranging from Greenpeace to U.S Chamber of Commerce.

Phase Two of Florida C&T Project: Economic Analysis
114
7/7/09
http://online.wsj.com/article/SB124698120257506383.html
Covers the possibility that because the Democrats have a 60 seat majority in the senate they may be able to pass C&T with no problem. Although there are some Democrats that are wary of the bill.
http://dealbook.blogs.nytimes.com/2009/07/07/C&T‐meets‐ma/?scp=2&sq=cap%20and%20trade&st=cse
Interesting article covering the idea that the C&T bill will increase mergers and acquisitions so that companies may not have to pay such high fines for not meeting regulations. This could cause anti‐trust and monopoly problems down the road and it is just a means to circumvent the C&T bill.
7/9/09
http://www.economist.com/specialreports/displaystory.cfm?story_id=13938859
Texas is increasing its energy diversity. Being a strongly oil producing state it is good to see investors taking charge to help develop alternative sources. If this can be done in Texas it will hopefully promote change in other parts of the country.
7/10/09
http://blog.heritage.org/2009/07/09/morning‐bell‐epa‐admits‐C&T‐will‐fail/
Gives good links within the article on some holes that seem to be present in the Waxman‐Markley bill. Mentions the possibility that U.S. action alone will not affect global CO2 levels and there may be discrepancies in what the effect the bill will have on the economy.
http://www.environmentalleader.com/2009/07/09/group‐seeks‐1‐of‐C&T‐proceeds‐for‐green‐education/
A letter to the Senate proposing that education get 1% of the sales revenue generated by carbon trading.
7/16/09
http://www.pnas.org/content/106/27/10933.full.pdf
Study from Harvard stating that there may be more global possibilities for wind than was previously believed. The study is short but goes into excellent detail.
http://www.aceee.org/energy/national/recovery.htm
Tool that can help figure numbers for employment given the composition of the Federal Stimulus package.
7/17/09

Phase Two of Florida C&T Project: Economic Analysis
115
http://news.cnet.com/8301‐11128_3‐10286278‐54.html
Article features how homes may be able to power themselves if designed correctly.
http://www.triplepundit.com/pages/t‐boone‐pickens‐to‐sell‐667‐wind‐turbine.php
T. Boone Pickens was leading the way for alternative energy and has now backed out of a large installment of wind turbines.
7/20/09
http://www.nytimes.com/2009/07/20/business/energy‐environment/20iht‐green20.html?_r=1&scp=2&sq=cap%20and%20trade&st=cse
The Senate is still in conference about the C&T bill. Last week they brought in representatives to educate them about how the program is working in Europe – where this kind of legislation has been in use the longest.
http://www.nytimes.com/imagepages/2009/06/27/us/20090627‐nat‐climate.ready.html
Graphic representation of the bill, how many permits total will be available, and the portion of those being auctioned or allocated. Also shows the projected emissions given current rate and that with the bill implemented.
http://cboblog.cbo.gov/?p=316
Blog entry from the director of the CBO with their own graph of emissions under different programs.
http://www.cbo.gov/ftpdocs/104xx/doc10432/07‐09‐RegionalEffects_Cap‐Trade.pdf
Study proposes that the C&T program would be relatively even across the country.
7/21/09
NARUC Report
The report claims that free allocation of allowances would increase “unproductive costs” which the authors define as costs that will affect consumers and the economy. It is believed that regulation is going to increase per‐kWh electricity costs for consumers no matter the construction of the regulation. However, the way in which the funds from allowances are invested can produce positive outcomes. The authors believe that the cost of these new innovations will be approximately half of the cost of the emission allowances. This will keep the new technologies fairly low in cost. These are all productive costs, or costs that are helpful to consumers in the sense that they will benefit from lower costs as technological abilities increase efficiency and lower emissions, thus decreasing the cost of buying allowances.
The authors examine three different allowance possibilities to determine their effects on consumers (page 5). A program of free allowances to generators would increase costs to consumers

Phase Two of Florida C&T Project: Economic Analysis
116
by $27 billion. The program with the least impact to consumers is allocating allowances to LDCs (Local Distribution Companies). This program would increase the cost to consumers by almost $14 billion. The authors of the report believe that the allocation to LDCs is the most effective program due to the fact that it will only cause a $1.88/MWh increase per plant in a cost regulated environment, compared to almost three times the cost in a market‐based environment. The charts on page 11 and 12 help to show the costs in different scenarios and environments.
http://belfercenter.ksg.harvard.edu/publication/19185/realistic_costs_of_carbon_capture.html
States that the cost of technology to recapture carbon emissions would be close to $150/ton. This information was not taken into account in the NARUC report, which assumed a general $20/ton emission allowance cost. Currently, this price difference would not entice plants to invest in such technology. However, if the funds from emission allowances are invested into carbon capture, it can help to lower technology cost and make it an alternative to emission allowances. This would continue to reduce emissions and lower the cost impact on consumers.
7/22/09
http://www.wnd.com/index.php?fa=PAGE.view&pageId=104619
A survey done by an independent website found that consumers are not as likely to accept the increased costs associated with a C&T program. 63% will not want to pay higher prices and 23% support C&T.
http://www.gasworld.com/news.php?a=4006
A review of the C&T program from a website directed at power producers. It gives a different view of how it is perceived by those that will be affected by it.
7/24/09
http://www.desmoinesregister.com/article/20090723/BU.S.INESS01/907230365/1030
This article talks about how the change from land being turned into forests to alleviate some emissions will actually take away from farming land, thus decreasing the supply and increasing commodity and food costs.
http://thepacker.com/U.S.DA‐study‐supports‐climate‐change‐bill/Article.aspx?articleid=368458&authorid=117&feedid=215&src=recent
The U.S.DA supports the C&T bill because it will increase revenues to certain farming producers in the long run. The study did not cover specialty crops, but it did cover corn and soybeans along with others. The fact that it included corn and soybeans could be the reason for the positive outlook.
http://www.cattlenetwork.com/Content.asp?ContentID=332857
An article from a cattle directed website states that the increase in energy prices will drive up prices for propane, electricity and diesel fuel which will increase production costs.

Phase Two of Florida C&T Project: Economic Analysis
117
7/27/09
http://www.heritage.org/Research/EnergyandEnvironment/bg2303.cfm
The Heritage Foundation examines some of the discrepancies of the PERI report. It states that the report does not take into account price changes caused by implementing the C&T program and how that will affect investment and thus jobs created by planned investment.
8/3/09
http://www.mondaq.com/article.asp?articleid=83710
Update on the current status of the WCI and how it is implementing reporting requirements and other necessary monitoring tools.
http://www.rightsidenews.com/200907295713/energy‐and‐environment/exposing‐waxman‐markey‐climate‐bill.html
Speech by Senator Inhofe about the intricacies and contradictory language of the C&T bill. The bill itself claims it will create jobs, but in a provision elsewhere in the document, it states that the government will essentially pay severance to workers who lose their jobs due to the taxes and mandates of the bill.
http://www.springfieldnewssun.com/news/springfield‐business‐news/guebert‐C&T‐plan‐will‐be‐good‐for‐farmers‐231940.html
Explains that even if the C&T program imposes costs on farmers, the current subsidies and insurances they receive from the government will prevent negative revenues. There are various different scenarios presented from different reports depending on what prices they used as standards to project into the future.
8/7/09
http://greeninc.blogs.nytimes.com/2009/08/04/climate‐bill‐would‐raise‐costs‐slightly/
Findings that the C&T program would raise electricity rates by 3‐4% and raise gasoline by 23 cents a gallon by 2020. The report states that as energy prices increase, real output decreases.
http://www.ncpa.org/sub/dpd/index.php?Article_ID=18291
A similar program alternative to C&T. Highlights the carbon offset program as developed by the United Nations.
http://www.heritage.org/Research/EnergyandEnvironment/cda0904.cfm
A look at the projected effect of the C&T program as researched by the Heritage Foundation. Per their report, the bill will not increase employment at all, only decreasing slightly towards 2020 then again eliminating over 1 million jobs.

Phase Two of Florida C&T Project: Economic Analysis
118
8/14/09
http://webarchive.nationalarchives.gov.uk/+/http:/www.hm‐treasury.gov.uk/independent_reviews/stern_review_economics_climate_change/stern_review_report.cfm
Full Stern Review available for download.
http://www.nytimes.com/gwire/2009/08/04/04greenwire‐technology‐smorgasbord‐needed‐to‐meet‐climate‐35698.html
Review of the EPRI report and how it touts the need for multiple different technologies to meet energy demand and cutting carbon emissions.
http://www.greentechmedia.com/articles/read/epri‐CO2‐cuts‐will‐cost‐a‐lot‐more‐without‐nuclear‐and‐clean‐coal/
States that cost of a portfolio program without nuclear and clean coal would cost the American household $16,000 in increased energy costs.
8/26/09
http://uk.reuters.com/article/idUKTRE57N13320090824
Examines how the C&T bill would affect oil refining within the U.S.. Predicts an 19.4% increase of imported refined oil, opposed to 9.6% if not passed. It shows a basic downturn across the U.S. refining industry as they would have to purchase credits that foreign firms would not, thus driving the market overseas.
http://sify.com/news/biofuels‐to‐have‐greatest‐impact‐on‐land‐use‐and‐habitat‐news‐scitech‐ji0pudhdgbh.html
The effect of biomass is not limited to the implications of the Waxman‐Markley bill. A study done by an ecologist predicts the amount of biomass that will be consumed by 2030 and how the bill will increase this number.
8/31/09
http://www.reuters.com/article/companyNews/idUKTRE57R4JJ20090828
A report from an American based refinery (the largest in the country) states that the C&T bill will cost them $7 billion a year. This will then be passed on to consumers. All of this is because refineries won’t get the large amount of free allowances they were promised in the beginning. The company would rather a 10 or 20 cent tax be added to gasoline than the C&T bill.
http://www.msnbc.msn.com/id/32619955/ns/business‐personal_finance/wid/7/
The last half of this article gives the pertinent information of how other economists feel about the possible effects of the C&T bill. 56% believe that it will increase emissions of overseas production.

Phase Two of Florida C&T Project: Economic Analysis
119
http://www.thedailygreen.com/environmental‐news/latest/global‐warming‐lobbying‐47082602
Gives a quick and dirty breakdown of how the lobbyists for oil and other Non‐Clean energy firms compare to those for Alternative or Clean energy. Also shows the 6:1 spending ratio of oil and gas to alternative energy lobbyists.
9/9/09
http://www.nytimes.com/cwire/2009/09/08/08climatewire‐C&T‐in‐senate‐limbo‐as‐obama‐makes‐92462.html?pagewanted=1
The ability for C&T to pass seems to be entirely dependent on the healthcare front. The priority is unclear. Very lengthy article mainly covering the concerns of certain legislators and others involved in the bill.
http://www.joc.com/node/413252
This seems to be the beginnings of a competitive bill. It’s not too clear how it matches up with the Waxman‐Markley bill.
http://www.reuters.com/article/idU.S.TRE5875WW20090909
It seems that the bill is being pushed until midterms so that Congress can get a feel on public opinion of the bill.
9/17/09
http://www.washingtonpost.com/wp‐dyn/content/article/2009/09/16/AR2009091603524.html
Report stated that if 100% of permits were auctioned instead of the majority being freely allocated as previously planned, the government would see an increase from $100 billion in revenue to $200 billion.
9/22/09
http://www.forbes.com/2009/09/21/enel‐cap‐trade‐business‐energy‐conti.html
A good interview with a foreign view on C&T and how it works within the market (i.e. entrepreneurs seeing it as a new market for capital investment, etc).
9/24/09
http://www.environmentalleader.com/2009/09/24/caterpillar‐fedex‐join‐debate‐over‐carbon‐tax‐vs‐C&T/
Shipping companies (and Caterpillar) express their sentiments on which they would prefer to have, a carbon tax or a C&T system.
10/7/09

Phase Two of Florida C&T Project: Economic Analysis
120
http://www.etaiwannews.com/etn/news_content.php?id=1070960&lang=eng_news
A good review of what vocabulary has changed in the bill.
http://www.forbes.com/2009/10/06/utility‐stock‐winners‐personal‐finance‐transmission.html
A few of the outside plans associated with alleviating the costs of the C&T bill – creating cleaner energy which could then sell permits and allowances to other, less clean companies.
http://www.wvmetronews.com/index.cfm?func=displayfullstory&storyid=32767
Interesting view from a large electric energy power company president that supports the C&T bill. He aims to save more credits than the company needs and then be able to sell them at profit.
10/14/09
http://www.ajc.com/opinion/C&T‐try‐158252.html
The legislation is pushing for a system that is less complicated and open to market problems than the trade aspect of the C&T bill. They are looking towards a tax on carbon emissions.
http://www.nytimes.com/cwire/2009/10/09/09climatewire‐offshore‐drilling‐could‐add‐subtract‐support‐14894.html
The effect of opening up drilling in the Gulf could have far reaching effects. However, they would still be required to purchase permits or allowances. So the question becomes, is it even worth it for oil companies to pursue this venture with the threat of the C&T bill?
11/3/09
http://news.morningstar.com/articlenet/article.aspx?id=313294&SR=BSI916
A very in‐depth look at how farmers would be affected by C&T and what impacts that would have elsewhere.
http://atr.org/brief‐summary‐kerry‐boxer‐climate‐tax‐a4126
Great summary of the newly proposed Kerry‐Boxer tax.
http://www.nationaljournal.com/njonline/ee_20091030_7146.php
A study done about the polling of Americans on the issue of C&T. Most are unaware of what it actually is, where it is in legislation or what its effects will be. Something to think about when people use poll figures to try and justify a point.
11/5/09
http://www.ecofactory.com/news/dems‐bend‐gop‐C&T‐boycott‐110409

Phase Two of Florida C&T Project: Economic Analysis
121
The GOP boycotted the mark up session of the C&T bill, effectively delaying any progress for 5 weeks. During this time the EPA is planning to conduct necessary research to build up a case for C&T. The author mentions that the C&T bill for sulfur dioxide took over 15 years to craft and has been largely successful. So the goal of the Democrats to push the bill through in 7 weeks seems to be a big point of contention for the GOP.
http://www.news‐register.net/page/content.detail/id/530517.html?nav=511
An interesting, if somewhat biased article that makes note of the calls from the EU for America to accept C&T policy and to also help alleviate some of the problems in less developed nations despite the negative impact it will have on some states.
11/8/09
http://www.reuters.com/article/GCA‐GreenBusiness/idU.S.TRE5A442T20091105?page Number=1&virtualBrandChannel=11621
An excellent article outlining the likely course of C&T. Clearly the biggest problems will come with the threat of filibuster in the Senate. This article gives a great look into the future, covering the percentage that would be freely allocated and to what industries.
http://policyintegrity.org/publications/documents/EconomistsandClimateChange.pdf
A study done that surveyed 114 economists that had published papers in the top‐25 economic journals in the past 15 years on the topic of climate change. They were able to weed out any responses from economists that were not familiar in the field of climate change. Many figures give a good perspective of the general view. One thing to make note of if that over 55% of responders favored a general tax on carbon while 35% favored C&T as the solutions.
11/12/09
http://news.cnet.com/8301‐11128_3‐10396328‐54.html
An article addressing the undersecretary of science at the DOE and his views on how energy needs to change and what possible market system would work. He stated that while not only are onshore wind and hydropower economically competitive, but that a simple tax on carbon emissions would only push the energy production market towards natural gas. The need for C&T is due to its ability to push the market in the direction of truly clean energy systems. The other problem to tackle is the lag in time from implementation to effect when talking about energy production change.
http://www.oregonlive.com/environment/index.ssf/2009/11/nike_apples_climate_change_pos.html
Interesting take on companies and firms that support the C&T bill but mainly produce from markets outside the U.S.. This leads to moral hazard. It would increase prices of domestically produced goods, while imports are able to gain control of the market. The only cure for this if the

Phase Two of Florida C&T Project: Economic Analysis
122
“green image” phenomenon takes hold and Americans buy products that cost more because they are produced with low emissions.
11/15/09
http://www.eenews.net/public/climatewire/2009/11/04/1
There is still a lot of hesitation from the EPA to release any hard numbers on the C&T bill. It happens all too often that a solid number is released and then when that number changes, a firestorm is created and leads to dissention and filibustering across both aisles. There is still a discrepancy about the total benefit from the bill, somewhere between $383 billion to $5.5 trillion.
http://online.wsj.com/article/SB10001424052748703683804574532022758745200.html
Two EPA employees created a 10 minute YouTube video (liked to in the article) explaining what the major shortcomings of the C&T are. The fear is that the EPA is keeping certain research and scientists that contradict the “agenda” of the agency quiet in order to continue on with the proposed C&T plan.
11/17/09
http://www.startribune.com/blogs/70040227.html?elr=KArks:DCiUMEaPc:UiD3aPc:_Yyc:aUU
Senators lay out their issues with C&T. If there are not enough allowances made to large industries and power producers, the costs will be passed on to the consumers. They are also arguing that allowances should be increased for coal‐dependent companies that are going to experience higher emission rates due to the nature of coal.
http://cbo.gov/ftpdocs/104xx/doc10458/11‐23‐GHG_Emissions_Brief.pdf
This report from the CBO illustrates some of their findings on the costs of reducing greenhouse emissions with a C&T program. The work includes two graphs of their projections. The graph on percent change in real GDP growth is poignant. It shows an effect of negative GDP change for the next 40 years.
11/22/09
http://www.ens‐newswire.com/ens/nov2009/2009‐11‐21‐091.asp
This article states that the Senate is going to delay any further action on the climate bill until after the Copenhagen Talks and possibly after finishing the health care bill which may not be until 2010.
http://www.businessweek.com/magazine/content/09_48/b4157054815275.htm
This article discusses the ability for landowning corporations to sell the “carbon offsets” of sovereign forests at incredible profits in a C&T system. This could cause problems as it may be cheaper for companies to forcibly purchase land to act as their own carbon offsets which would lead to a land grab race and drive up the price of land.

Phase Two of Florida C&T Project: Economic Analysis
123
11/30/09
http://www.wvpubcast.org/newsarticle.aspx?id=12218
This article debates a report from the banking giant HSBC that states the use of Midwestern coal will be the easiest way to meet the growing energy demands in the United States. This is only going to be accurate if the energy market sees a need for increases in coal and coal burning power plants in the face of possible cost increases in sequestration.
http://www.nytimes.com/2009/11/26/us/politics/26climate.html?_r=1&hp
The goals of the Obama administration seem to have some solid foundation as they are a main focus at the Copenhagen Talks. By 2050, the goal is to have 83% less emissions than 2005 levels. While support in the Senate may be lacking, it is hopeful that support on the world stage can offer something to emphasize the need for a strict program.
http://www.digitaljournal.com/article/282797
China is now expecting subsidization in order to achieve its emission cutting goals from other industrialized nations. They are saying they will not participate in any plan that is measurable or verifiable. This is a very bad outlook for the possibility of an international plan.
12/4/09
http://www.sciencedirect.com/science?_ob=ArticleURL&_udi=B6V7G‐4XB1T9V‐1&_user=2139768&_rdoc=1&_fmt=&_orig=search&_sort=d&_docanchor=&view=c&_searchStrId=1135361633&_rerunOrigin=scholar.google&_acct=C000054272&_version=1&_urlVersion=0&_userid=2139768&md5=6c01d4d35dcebd187325fda2f62d3492
This paper covers the economic impact of policy implementation in the EU’s ETS. It would be beneficial to follow how this system progresses as it can give information about how populations and firms react to policies and what does and does not work in certain situations. A program as large as the ETS is relevant to the future of any program in the United States as it will be compared not only in success but in its ability as a revenue generator.
http://www.americanprogress.org/issues/2009/12/ten_reasons_farmers.html
A solid argument for farmers to support legislation to limit emissions. Farmers experience hardship from changing climates and more harsh extremes of seasons. The farmers can make money by selling their land as a carbon pollution offset which acts as carbon sequestration. There are many arguments for farmers to support the legislation, but the fear of rises in fuel and fertilizer prices as a result of the caps is greater than the vision for future self‐sustainability of farmers without the need for government subsidies.
12/9/09
http://heinonline.org/HOL/Page?handle=hein.journals/staev28&div=4&g_sent=1&collection=journals

Phase Two of Florida C&T Project: Economic Analysis
124
A very interesting paper on the differences between enacting a carbon tax versus a carbon C&T system. The comparison of the benefits and effects starts on page 35. One of the main points of argument is that C&T insures Benefit Certainty because there is a definite limit on the total amount of emissions allowed. However the system is volatile in its trading because it sets a cap with no regard for the economy and could impose other costs. A carbon tax insures Cost Certainty in that the amount of the tax is known in advance and any change in the tax is foreseen and can be viewed before it is enacted. This leads to a lack of knowing the benefits of the tax because the response to it would depend on the economy and the market.
12/11/09
http://www.courthousenews.com/2009/12/11/Senators_Propose_Bill_to_Limit_C&T.htm
Covers some aspects of the new version of the bill like the limitation of emissions for firms that produce or import things like oil and coal. It is looking like it will be backed more favorably by Republicans now that the language has been changed. It also has goals of 17 percent reduction in near term and 80 percent by mid‐century.
http://www.forbes.com/2009/12/08/environmental‐protection‐agency‐copenhagen‐markets‐carbon.html
The certainty of the EPA findings on carbon dioxide emissions and their negative effect on the human population has allowed them to push forward with a quantitative way to assess its damage. This article also includes information about a firm called Knight Capital that is entering the market of carbon trading. It would be important to monitor these firms as they are going to have a large impact on not only the quality and ability of trading, but also the wealth distribution and their impact on local economies with the revenues they will receive from acting as these carbon credit institutions.
http://www.examiner.com/x‐1109‐Dallas‐Environmental‐Policy‐Examiner~y2009m12d11‐European‐taxpayers‐lose‐73‐billion‐in‐C&T‐fraud
The EU’s Emissions Trading System has fallen prey to something that could possibly be a problem in the states if a trading system is enacted. Firms were selling credits multiple times over and not returning the VAT to the government. It cost $7.3 billion dollars in losses. This is something that could prove detrimental to the efficiency of a trading system and it causes a lack of confidence in the actions taken by firms.
http://www.kmeg14.com/Global/story.asp?S=11658527
An article outlining the argument of farmers against the C&T bill. Forcing farmers to idle land (plant trees on it for carbon storage) will replace land used for crops. This could lead to higher ethanol prices along with escalating food prices. However, there is a definite impact of ending subsidization. Subsidies go toward keeping lands unplanted in order to keep prices elevated. Without them, an increase supply would bring prices down.

Phase Two of Florida C&T Project: Economic Analysis
125
http://www.brookings‐tsinghua.cn/~/media/Files/rc/reports/2009/07_cap_and_trade/ 0727_cost_containment.pdf
This paper covers the assessment of 7 different C&T programs and their cost effectiveness. It directly covers the Obama Administration plan, an early draft of the Waxman‐Markley bill, two others that are similar to the first two but minimize cost, and then three that augment the Obama plan with different cost‐containments. Their findings are very important in assessing what needs to be introduced into programs to make them the most beneficial.
http://www.heatingoil.com/blog/ny‐lawsuit‐threatens‐regional‐C&T‐system‐a‐sign‐of‐whats‐to‐come1210/
A firm in New York is fighting against the state’s right to regulate emissions, declaring it unconstitutional. The firm is facing financial troubles which may be caused as a result of the emissions limitations and is trying to find a way out of trouble. Either way this will be a landmark case in emissions regulation literature. If the courts rule in favor of the firm it could become an enormous obstacle and maybe even a death knell to any regulatory legislation covering emissions.
12/15/09
http://ohiofarmer.com/story.aspx?s=33902&c=8
Another legislative bill may be brought to life later this week in the Senate as a few other Senators are trying to push a “cap‐and‐dividend” system in which polluters can only trade emission credits among themselves. This removes the ability of outside markets forming and possibly the ability to defraud the system as was demonstrated in the EU ETS most recently. The findings state that a family of four could expect an average of $1,100 in returns from the government with this new system. This could offset the rising cost of energy that is expected to occur if any such emission limiting regulation is put into place.
http://www.google.com/hostednews/ap/article/ALeqM5gox9Zdh0GPPNR0NlWXqEskdhSUiwD9CJK7SG0
This article addresses the views of average Americans in a recently conducted poll on their support of C&T legislation and its possible effects. 40 percent of respondents supported some kind of action to slow global warming, while 59% wouldn’t support a C&T proposition if it meant paying $10 more a month on their utility bill while 75% wouldn’t support it if it meant paying $25 more a month. This disconnect between a desire to act on a growing problem and the absence of support for a program that offers an answer seems to show that this may not be the kind of program the American people are looking for.
http://www.cattlenetwork.com/TDA‐‐How‐‐Cap‐‐‐Trade‐‐Will‐Affect‐You/2009‐12‐14/Article.aspx?oid=966743
An anti‐C&T from the view of an agricultural supporter that takes a strong stance that C&T legislation would destroy the entire domestic industry. The argument that developing nations should not be given lenient standards or as much financial backing seems to be a big point of

Phase Two of Florida C&T Project: Economic Analysis
126
contention and conflict when you examine how many subsidies the agricultural industry receives from its own government. The main part of the argument is that C&T will effectively choke off any ability to prosper as an industry.
12/24/09
http://www.cnbc.com/id/34585126
The growing interest in nuclear power could greatly increase with the C&T program. After years of being a nearly dormant industry in the U.S. due to various reasons from safety to costs it resurfacing, especially in Florida. If the incentives for “clean” energy are large enough, we will be seeing an even larger amount of nuclear plants built as they are going to be some of the more favorable for industry leaders.
http://www.ens‐newswire.com/ens/dec2009/2009‐12‐24‐091.asp
A great article covering various polls done on citizen’s beliefs or skepticisms of global warming. There are clearly correlations between political party and belief in global warming. This has been shown in the House and Senate as Democratic representatives are almost fully in support of any C&T legislation while the Republican side has seemed to follow what the polls suggest and don’t support any legislation. This will be very important as elections come around.
12/28/09
http://green.venturebeat.com/2009/12/28/climate‐bill‐chaos‐your‐guide‐to‐the‐two‐newest‐proposals/
There are new bills being proposed to the legislator as the Kerry‐Boxer begins to hit some snags in committee. The article links to both articles and gives a brief synopsis of them with a good comparison. The bills are essentially just different enough to appeal to the majority of the House and Senate. It changes the benchmarks for the years and the logistics of how the C&T system will actually be integrated and disseminated to industries and companies.
http://www.cleanskies.com/articles/new‐york‐settles‐77‐million‐natural‐gas‐lawsuit
The lawsuit linked to a few weeks back has been settled. The state has agreed to pay for the offsets required by the companies, totaling $7.7 million. This seems to be a complete breakdown of any jurisdiction in the RGGI infrastructure. The idea that companies must be reimbursed seems to completely contradict the purpose of the program. There seems to be very little stopping all other participating companies from using the same defense.
http://www.examiner.com/x‐32222‐Philadelphia‐Elections‐2010‐Examiner~y2009m12d28‐Senate‐likely‐to‐table‐C&T‐in‐2010
This article addresses the fact that if the Senate does not pick up the C&T bill and pass it, the bill will be dropped and will have to start again next session in the House. This could cause serious

Phase Two of Florida C&T Project: Economic Analysis
127
problems as we saw how long it took for the Kerry‐Boxer and Waxman‐Markley bills to get out of the House. It could be a long time before the passing of a C&T bill.
12/29/09
http://www.investors.com/NewsAndAnalysis/Article.aspx?id=516681
The “afforestation” section of the C&T bill seems to be a large point of contention. It’s projected effect on the price of food and how it will alter the proportions in the market are some of the most highly debated issues in the agriculture industry. Clearly there is a large negative perception of it, but no one has assessed what the change would be from farmers forgoing subsidies to not plant certain crops and instead take up the planting of trees. This would free up more money for the federal government with which they could subsidize the price of food to a certain extent or create other programs to combat rising food costs.
http://agweb.com/DairyToday/Article.aspx?id=155109
All the points made in this article are worth looking at, but number 10 is particularly important. Livestock owners trying to recapture methane in order to receive carbon credits. Changes in the legislation will help increase incentives and credits to recapture.
12/31/09
http://www.webcpa.com/debits_credits/Carbon‐Taxes‐Run‐into‐Hot‐H2O‐52860‐1.html
This article presents the problems in France and Minnesota. France is planning to implement a C&T program, but the exemptions for the tax are leading to 93% of all industry being exempt, clearly creating a vastly inefficient system that would do no good in regulating emissions. The problem in Minnesota goes back to the New York case that the regulation is against state constitutions. But in this case it is North Dakota versus Minnesota in the sense that regulation of coal plants in Minnesota would adversely affect North Dakota. These developments are going to drastically alter the landscape in which C&T legislation must navigate as more and more legal problems begin to arise.
http://green.venturebeat.com/2009/12/31/stealthy‐c3‐raises‐26m‐to‐manage‐carbon‐but‐what‐will‐it‐actually‐be‐doing/
We may need to do some research on this C3 company as it may be useful in seeing how they plan to track and assess carbon emissions. This could help us because they may be chosen as the ones to regulate and report emissions if legislation gets passed; it would be beneficial to know their workings and how they plan on assembling information. It could also help in assessing impact in Florida to see what companies they use and how much emissions they produce.
http://deltafarmpress.com/legislative/laws‐column‐1231/
This is a very good article coming from the agricultural industry and their assessment of the C&T legislation. The fact that there are some industry heads that aren’t crying “the sky is falling” when a

Phase Two of Florida C&T Project: Economic Analysis
128
model indicates decreases in production is an interesting fact. The other model produced seems to have an interesting take that there may be $70 per ton credits for planting trees. This does not say which numbers they used to come up with that or how many acres that would be.
1/1/10
http://www.gazette.com/opinion/trade‐91568‐cap‐new.html
A succinct covering of issues that climate change legislation has faced over the past few months. The controversy over the reliability of the scientific community has caused shockwaves to radiate through the country and has shaken the foundation that any legislation was built on. As the data has been previously augmented, it is now not implausible that research based on that data is also severely flawed as a result. This could cause serious issues as more work is made to pass the C&T bill.
http://www.yumasun.com/opinion/global‐55216‐warming‐greenhouse.html
This article makes a point that the Australian Parliament has denied a similar C&T program presented before them. Australia is known to be one of the more environmentally conscious countries in the world with an incredibly large pro‐environment interest group base. The fact that they have rejected such a proposal should be an indication that they are either expecting a “better” program or they believe that it is not the correct response to the situation.
http://jacksonville.bizjournals.com/jacksonville/stories/2010/01/04/story6.html?b=1262581200^2659241
A very good article outlining the recent results of the year for Northeastern Florida. A quick mention about C&T and the seemingly industry‐held belief that it is going to increase costs or at least introduce fees not previously accounted for. The industry is going to view this as an attack on their profit margin in order to gain support against it. The detriments of this widespread belief could cause serious problems for the advancement of any legislation.
1/11/10
http://latimesblogs.latimes.com/greenspace/2010/01/C&T‐california.html
In California, advisory committee to the California Air Resources Board recommended that 75% of revenues generated by auctioning greenhouse gas permits be given back to residents. Governor Arnold Schwarzenegger applauds the committee for supporting what he views as the best policy – tax cuts, rebates, and incentives. Industry lobbyists oppose the direction of the policy citing a study that estimates an increase of $3,875 per year to households.
2/27/10
http://www.washingtonpost.com/wp‐dyn/content/article/2010/02/26/AR2010022606084. html3/25/10

Phase Two of Florida C&T Project: Economic Analysis
129
An article detailing the extent of disagreement among politicians and business and the attempt to find common ground. Facing opposition to set national targets, legislators have sought to break their goals into three sectors – electricity utilities, transportation, and industry. The new legislation hits each sector separately and also includes an expansion of domestic oil and gas offshore drilling. It also provides assistance to constructing nuclear power plants and carbon sequestration and storage projects at coal‐fired utilities.
4/1/10
http://www.heritage.org/Research/Reports/2010/04/EPAs‐Global‐Warming‐Regulations‐A‐Threat‐to‐American‐Agriculture
This piece discusses the impact of C&T and EPA regulations on farmers. The agricultural sector is energy intensive and the measures proposed will most likely result in increased costs. Provisions to offset the increased costs, such as emissions credits for planting trees, are not enough to make up the difference. There is also concern in the agricultural sector that the EPA has too much authority to set global warming regulations that have a substantial impact on their cost structure.
4/11/10
http://www.nytimes.com/2010/04/12/business/energy‐environment/12iht‐green12.html
Another reporter detailing the shortcomings of C&T. As seen in Europe, tax fraud, theft, and doubtful claims of carbon reduction are some of the issues that plague the system. In addition, the initial give away of permits allows the dirtiest industries to make exorbitant profits while the cap is still set high. Despite all this, governments still stand to make enormous sums from the system and view the aforementioned issues as part of the start up process.
4/15/10
http://views.washingtonpost.com/climate‐change/post‐carbon/2010/04/nine_democrats outline_manufacturing_demands.html
Sens. John Kerry (D‐Mass.), Lindsey O. Graham (R‐S.C.) and Joseph I. Lieberman (D‐Conn.) set April 26, 2010 as the date when they will release their revised climate bill. The date is a bit later than expected but the bill is proof of action‐oriented negotiations taking place.
4/16/10
http://www.businessweek.com/ap/financialnews/D9F456EO0.htm
Canada is ready to implement a C&T system but will wait until the U.S. is in the same position. The environment minister, Jim Prentice, is committed to reducing emissions but not to the point where it is willing to move without its “principle environmental and economic partner.” In the meantime, Canada will pursue alternatives that are not trade sensitive such as thermal electricity or improving treatment of waste water in cities.
4/20/10

Phase Two of Florida C&T Project: Economic Analysis
130
http://www.nytimes.com/cwire/2010/04/20/20climatewire‐as‐senate‐debates‐climate‐bill‐house‐members‐79731.html
A speculative article about the Senate and House bills on climate change. Amid the turmoil, support and opposition are coming from all angles. Democrats hope to get 60 or more votes in the Senate as a signal that legislation could move through the House successfully. There’s a good chance the bill will become a lame duck due to midterm elections.
4/26/10
http://www.npr.org/templates/story/story.php?storyId=126280761
This article goes into the partisan divide that is presenting an obstacle to climate legislation. Though the C&T system implemented to curb acid rain was a success under George H.W. Bush, it is no longer popular among Republicans. One point of contingency is whether the permits are given away or auctioned. Republicans argue that the auction is essentially a $2‐3 trillion tax.
http://www.eenews.net/public/Greenwire/2010/04/26/1
An update on the legislative process. The climate bill should be drafted by this afternoon at which point the next step would be to send it to the EPA for modeling. While proponents see this as a major step toward passing the bill, there are still several government reviews necessary including a Congressional Budget Office analysis and feedback from the EIA. In addition, the bill will continue to encounter Republican opposition. Republicans are concerned the bill analyzed by the EPA could be significantly different from the bill brought to the floor. The earliest the bill will make it to the floor is early June given the six weeks required by the EPA to develop their model.
4/27/10
http://www.reuters.com/article/idU.S.N2712004820100427?type=marketsNews
Uncertainty about the climate bill is dampening investor enthusiasm for clean tech. Given the time frame, investors think it is unlikely the bill will be passed this year. Additionally, investors have been frustrated with the slowness on clear energy policies from the Obama administration.
4/28/10
http://www.reuters.com/article/idU.S.TRE63R2SH20100428
This article discusses the delayed bill and its effects on investors in the voluntary carbon market. The bill was supposed to announce factors that would send a jolt to the U.S. carbon market which is currently all but inactive. Investors are now waiting for some indication about the direction before making moves.
http://online.wsj.com/article/SB10001424052748704471204575209353762420206.html?mod=WSJ_World_LEFTSecondNews

Phase Two of Florida C&T Project: Economic Analysis
131
Australia is delaying its carbon plan. They are having many of the same issues as the U.S. – polarized political parties and industry outcries. 90% of Australia’s electricity is derived from coal plants. Climate change was among the top priorities for policy development, so this delay impacts the credibility of the government’s claims. Political popularity appears to be playing a large role in the adoption of climate change policies.
4/29/10
http://abcnews.go.com/Politics/wireStory?id=10505720
As the climate bill legislation drags on, the issue of immigration has emerged through the cracks. Obama stated that he did not want to try and force an immigration bill “for the sake of politics.” It has been a difficult legislative year and derailing the climate bill is cause for frustration since it is much farther along than immigration.
4/30/10
http://planetgore.nationalreview.com/post/?q=Nzc4YTU1ZTk0Y2NlODE2MGRiNzFjYjZkMjg1YmU4ZWU=
The author makes a couple speculative points about why the C&T bill has not been revealed to anyone. He cites political risk and possible short comings of the legislation.
5/3/10
http://www.foxnews.com/opinion/2010/05/03/deneen‐borelli‐tom‐borelli‐tea‐party‐cap‐trade‐global‐warming/
This article discusses a change in direction that has disrupted the C&T legislation. Senate Majority Leader Harry Reid's abrupt proposal to move immigration reform in front of climate change legislation upset Senator Lindsey Graham leading Graham to believe political interests are at the heart of Reid's strategy. On top of the political upheaval, public opinion polls are showing global warming as a low priority. Furthermore, the Tea Party movement is keen to prevent C&T legislation from passing.
http://www.theatlantic.com/food/archive/2010/05/the‐wonders‐of‐C&T‐for‐fishermen/39760/
An article detailing the recent adoption of "catch shares" in New England fisheries. As usual fisherman are unhappy, but the article cites evidence that the method, in use since 1970 in New Zealand and Australia, increases boat revenues and the chance of maintaining a sustainable fishing stock while decreasing the amount of injuries.
http://www.examiner.com/x‐325‐Global‐Warming‐Examiner~y2010m5d3‐Oil‐spill‐may‐kill‐C&T‐legislation
One of the concessions for the C&T legislation was to allow more off‐shore drilling, but with the recent oil spill, politicians are reconsidering that position. The safety of off‐shore drilling is being reviewed in detail to analyze the likelihood of future catastrophes.

Phase Two of Florida C&T Project: Economic Analysis
132
5/4/10
http://www.nlpc.org/stories/2010/05/04/pepsico’s‐lobbying‐C&T‐hit‐annual‐meeting
This article discusses the conflicts of interest with PepsiCo and its support of climate change legislation. As a member of U.S.CAP, PepsiCo is part of the mission to curb greenhouse gas emissions via strong national legislation. PepsiCo is highly concerned about its image to consumers, so it takes steps to keep appearances. The motivations and weight of those actions is dubious.
http://pakobserver.net/detailnews.asp?id=28926
This article pronounces that C&T is dead. All around the world, politicians are looking at the program and reconsidering its costs and benefits. Australia has been a big actor in this play with their abandonment of the plan. Alternative plans are now in the works.
http://www.unionleader.com/article.aspx?headline=James+M.+Taylor%3A+Cap+and+trade+‐‐+taxing+our+way+to+bankruptcy&articleId=3ca52278‐77d7‐4eb3‐b281‐cb7df413220b
Another sound off from the conservative side proclaiming C&T to be extraordinarily costly in addition to current renewable energies available.
5/5/10
http://www.nytimes.com/gwire/2010/05/05/05greenwire‐senate‐C&T‐bill‐coming‐out‐next‐week‐44983.html
Senators Kerry and Lieberman state that the climate bill will come out next week with or without the support of Senator Lindsey Graham. This article gives a little more detail about the bill and continues to speculate how the legislation will be viewed in the Senate. Without 60 votes, the bill probably will not be passed.
5/6/10
http://gcdailyworld.com/story/1632660.html
Indiana Coal Mining will be impacted by the climate legislation as coal emits a large amount of carbon dioxide. Almost all of Indiana is powered by coal, which means the climate bill would force some serious changes. There may need to be an exception in coal‐powered states.
http://www.the‐signal.com/news/article/28228/
This article asks six pertinent questions about the climate legislation. Ultimately, the author is against it.
http://www.foxnews.com/story/0,2933,592243,00.html

Phase Two of Florida C&T Project: Economic Analysis
133
A cynical article discussing the history of C&T in politics. The green movement has been the center of many politician’s careers. The article frames it as an overarching plan with high payoffs where the final step is getting the government involved.
5/7/10
http://www.risk.net/energy‐risk/news/1635252/duke‐energy‐refuses‐disclose‐cap‐trade‐lobby‐spend
Duke Energy is lobbying to get the climate legislation passed. Its shareholders want to know the extent of the expenditures. Duke refused to provide this information. The company and its shareholders have different positions. Shareholders think the climate bill will increase costs whereas Duke is committed to reducing greenhouse emissions.
http://www.icis.com/Articles/2010/05/07/9357621/oil‐spill‐sinks‐climate‐bill‐us‐senator.html
Senator Graham believes the oil spill has added unforeseen factors that need to be included in the climate bill. Therefore, not surprisingly, he recommends delaying its release and reevaluating its goals.
5/9/10
http://www.courier‐journal.com/article/20100509/NEWS0106/5090312/1008/NEWS01/Top+Senate+candidates+from+Kentucky+oppose+Obama+s+C&T+proposal
Like Indiana, Kentucky is highly reliant on coal for its electricity needs. They are the third largest coal producing state. Despite political disagreement on many issues, the top senate candidates are all in agreement that C&T would be devastating to the state of Kentucky.
5/10/10
http://www.americanthinker.com/2010/05/capandtrade_is_back.html
Brian Sussman, author of Climategate gives his take on C&T. He argues that the burden of the increased costs will fall squarely on consumers. The loan guarantees for nuclear power are meant to lure in gullible Republicans. He cites the $10 billion Mt. Yucca project to dispose of nuclear waste that was abandoned. In addition, he believes there will be job loss in the manufacturing sector as companies face the increased costs of curtailing carbon emissions. As evidence, he notes the House Bill which includes three years of unemployment pay at 70%, retraining, and relocating expenses to those whose jobs are moved abroad. The $1.3 to $1.9 trillion government revenue projected from 2012 to 2019 will come straight out of the tax payer’s wallet for an issue he believes has no scientific grounding.
http://dailycaller.com/2010/05/10/congresss‐impending‐climate‐bill‐whats‐in‐it/
This article gives a breakdown of the key points faced by the climate legislation.

Phase Two of Florida C&T Project: Economic Analysis
134
http://news.firedoglake.com/2010/05/07/graham‐wants‐world‐to‐stop‐for‐him‐and‐the‐climate‐bill/
Senator Graham is quoted announcing the end of the C&T bill. A new model is being developed which focuses on energy independence, job creation, and cleaner air. He praises the steps made to renew interest in nuclear energy. However, he believes the legislation is rightfully taking a backseat to more pressing issues.
5/11/10
http://www.triplepundit.com/2010/05/besieged‐climate‐bill‐due‐out‐tomorrow/
After a few hiccups, the bill is supposed to come out tomorrow. The loss of Senator Graham, the oil spill, and the appointment of Elena Kagan have all been obstacles in the three week delay.
http://dailycaller.com/2010/05/10/expect‐a‐surprise‐C&T‐vote‐in‐the‐senate/
Some senators believe the EPA’s greenhouse gas rule is invading their space. In response, Lisa Murkowski (R‐Alaska) introduced a resolution to disapprove this agency action. Murkowski has been successful, completing all the necessary steps for her debate to take the floor and to curb the authority of the EPA.
http://www.eenews.net/EEDaily/2010/05/11/1/
Article that addresses who’s to blame for the oil spill. Three companies were involved, each with the ability to point the finger and shift the blame. BP is legally responsible, but the rig was run by Transocean. Transocean does not fault the blow out preventers (BOPs), because it does not make sense given the point of progress of the rig. Instead, a faulty cement job looks more likely. Halliburton was responsible for cementing the well into place, but will point the finger back at BP who altered the process from what Halliburton intended to do. Regardless, the impact of this disaster will have implications on climate legislation.
5/12/10
http://senatus.wordpress.com/2010/05/12/lieberman‐kerry‐unveil‐the‐american‐power‐act/
Links to the bill that was released. Includes summary, section by section summary, and the entire bill.
5/13/10
http://www.eenews.net/climatewire/2010/05/13/1/
The climate bill is finally released. With nearly 1000 pages in legislation and 8 months in the making, it still has a way to go. Obama thinks it’s time for the U.S. to start moving away from oil and the bill is an important step in that process. While the bill has a lot of support from key people, it still faces opposition from senators who believe the price hike will outweigh the benefits. The bill attempts to mitigate these concerns with rebates on utility bills. A major hurdle that still remains is

Phase Two of Florida C&T Project: Economic Analysis
135
offshore drilling. There is very little flexibility among those who are in favor and those who oppose it.
http://www.eenews.net/climatewire/2010/05/13/2/
The battle between cleantech and oil companies in California is creating a “call to arms” scenario. The cleantech industry is bracing itself by raising money to make sure they can put up a fight. The result in California may have critical implications for the direction of climate legislation. California is one of the most progressive states when it comes to clean energy. If legislation doesn’t go through there, there could be a domino effect with other states.
http://www.eenews.net/EEDaily/2010/05/13/1/
The opposition to the climate bill plans to launch a campaign aimed to educate the public about the legislation and its possible consequences. One of its major weapons is targeting citizen’s distaste for high gasoline prices. The opposition believes there’s a good chance that higher energy prices will be passed from suppliers to consumers. Supporters deny this claim and point out the benefits to consumers outlined in the bill. Regardless of the truth, heavy marketing campaigns will look to influence public opinion.
http://www.eenews.net/EEDaily/2010/05/13/2/
The oil spill is giving supporters of the climate bill timely material to remind the public of the pitfalls of oil. While it acts as an underscore for the importance of climate legislation, environmentalists are quick to point out their regret that it happened in the first place. However, the connection between climate legislation and the oil spill is not necessarily that precise and the opposition will probably acknowledge it as a separate issue.
http://www.time.com/time/health/article/0,8599,1988975,00.html
This is a great comprehensive article which echoes most of what’s already been detailed in this synopsis.
5/14/10
http://www.eenews.net/climatewire/2010/05/14/1/
Traders in the carbon markets are not sure what to make of the bill. In its stipulation it says that primary trading and futures contracts can only be traded by “registered participants.” This is an extraordinarily vague term that does not give traders much information to work with.
5/17/10
http://www.mccookgazette.com/story/1635284.html
U.S. Senator Ben Nelson of Nebraska addresses his concerns about the climate bill. He does not think the legislation will achieve its goals. Instead he sees adverse effects. He doubts the climate

Phase Two of Florida C&T Project: Economic Analysis
136
bill will receive the 60 votes needed to pass through the senate. Still, he is in favor of working toward climate change legislation.
5/19/10
http://www.dallasblog.com/201005191006548/dallas‐blog/bill‐white‐has‐path‐forward‐on‐C&T.html
Bill White, nominee for governor of Texas, is taking a stance on the C&T legislation. He believes the strategy for reducing emissions needs a specific outline before any more stringent measures are put into place.
http://www.eenews.net/Greenwire/2010/05/19/1/
Three reports released today suggest that the U.S. curb its carbon emissions. The reports add to the compilation of evidence in favor of global warming. The studies support the level of CO2 reductions by 2050 that have been laid out by the Obama administration and point to human activity as a main source of climate change.
5/20/10
http://canadafreepress.com/index.php/article/23416
This article argues that the climate bill legislation was handled very similarly to the health care bill. Once Democrats realized the public opposition to their proposals, they tried to get them passed quickly. This technique didn’t work with the climate bill, so instead the Obama administration is trying to get the new rules into EPA regulations.
http://www.nytimes.com/cwire/2010/05/20/20climatewire‐reading‐the‐tea‐leaves‐on‐the‐sen‐murkowski‐67433.html
Senator Lisa Murkowski has until June 7th to thwart the new EPA regulations under the Clean Air Act. The results of this effort are likely to be an important indicator of the climate bill’s success in congress. The article outlines some of the strategies that are involved.
http://www.eenews.net/Greenwire/2010/05/20/1/
An economic study by the Peterson Institute estimates a decade of multi‐billion dollar investments over the next decade and 200,000 jobs per year created if the climate bill is passed. The study shows a reshuffling of U.S. energy supplies that would foster economic growth.
5/21/10
http://www.thenewamerican.com/index.php/economy/economics‐mainmenu‐44/3596‐freezing‐the‐economy‐with‐global‐warming‐taxes‐a‐regulation
The author points out the contradicting policy options. In times of recession, sound economics suggest lessening tax and regulatory burdens on the private sector. The climate legislation will

Phase Two of Florida C&T Project: Economic Analysis
137
have the opposite effect. Regardless of that point, recent scientific and economic evidence is showing that the legislation will be extremely costly with little or no benefit to the environment. Additionally, the green jobs created still lead to a net loss in jobs. A study from Spain’s efforts to create green jobs revealed a cost of over $700,000 per job created alongside a 77% price increase of electricity.
http://frontpagemag.com/2010/05/21/the‐anti‐copenhagen/
A positive review of the Heartland Institute’s Fourth International Conference on Climate Change. The author praises the conference for its diverse representation of ideas and interests. He says the conference brings together a bunch of dissenters where there is no underlying consensus. Instead, there is open‐minded debate.
5/22/10
http://www.americanthinker.com/blog/2010/05/report_from_the_heartland_inst.html
A reporter gives an account of the Fourth International Conference on Climate Change at the Heartland Institute. 73 scientists, economists, and policy experts representing 23 countries were present. The reporter highlights two speakers who believe the current attempts to curb climate change are a waste of time and resources, including C&T.
5/24/10
http://sentinelsource.com/articles/2010/05/24/features/environment/free/id_401580.txt
A report on the time sensitive nature of addressing climate change. The article touches briefly on the recently released reports citing the need for action and strategic planning to “adapt to the inevitable.” At the end, the reporter puts a blurb about the oil spill’s effects, citing senators on both sides of the issue.
http://www.nytimes.com/2010/05/25/business/global/25carbon.html?partner=rss&emc=rss
C&T is failing in Europe. Tax fraud and profiteering from selling of pollution permits which were given away are just two of the issues. Measurement of the proper cost of carbon permits and the amount of carbon pollution has been extremely inaccurate. Cheap permits don’t incentivize companies to curb carbon pollution. Overestimates of carbon emissions result in too many permits being released. Revising the legislation is currently underway. One suggestion from bankers is the creation of a green bond.
http://www.lexology.com/library/detail.aspx?g=ad7e5212‐674b‐40ae‐9183‐ad8b0fc742ef
This article talks about the funding and benefits available to early adopters of carbon capture and sequestering (CSS) technology. Up to $2 billion per year for up to 10 years would be made available in grants to accelerate the commercial viability of CSS which supplements the $2.4 billion already available from the Economic Stimulus Act. The quantity of funding, duration of funding, and quality standards are laid out as well.

Phase Two of Florida C&T Project: Economic Analysis
138
http://www.politico.com/news/stories/0510/37660.html
The EPA can extend its control under the Clean Air Act which requires any source emitting over 250 tons of carbon dioxide a year to capture its emissions. This is a very small amount which would include farmers, rural schools, and hospitals.
5/25/10
http://www.americanthinker.com/2010/05/nonpartisan_proof_capandtrade.html
The acerbic Brian Sussman, author of Climategate chimes in again. Proponents of the climate bill were quick to point out the benefits cited in the Peterson report. Sussman notes that the report says the legislation will cause a net job loss due to losses in coal, manufacturing, and livestock industries. The report also states that there will be higher energy prices; however, low income homes will be compensated.
http://online.wsj.com/article/SB10001424052748703559004575256981030653158.html?mod=googlenews_wsj
California was a pioneering state with its AB‐32 bill outlining a C&T system in 2007. The bill was supposed to induce an economy‐expanding green job future. A study released on May 13 reveals that higher energy prices in California have adverse impacts on jobs, income, business profits, and the cost of living. Not acting in unison with broader policy is one major pitfall. While Californians may be happy to bear the higher energy costs, polluting businesses are likely to relocate and continue with their carbon emissions.
http://www.examiner.com/x‐30768‐Philadelphia‐DNC‐Examiner~y2010m5d25‐KerryLieberman‐resurrect‐CapandTrade‐debate‐with‐new‐American‐Power‐Act
A liberal weighs in with some poignant arguments. He thinks the passing of the bill will lead the rest of the world in the charge to reduce human impact on the environment. He makes a sharp point about the Republican opposition – a year ago opponents of the bill were arguing that climate change research was either pointless or incorrect. Now Republicans are using arguments that the bill will only cause minimum temperature drops by citing research they previously refuted or denied. He goes on to mention the current hot topic of offshore drilling which was an important aspect of the bill. The current disaster in the gulf has made the concession to enable offshore drilling a bit more complicated.
5/26/10
http://www.onlinetes.com/tes‐0510‐editorial‐cap‐trade.aspx
This article recognized the need to improve our energy sector, but not through a political agenda. The EPA declared carbon dioxide to be a threat to the environment. This claim is somewhat preposterous from a simple, biological perspective. The EPA needs a power check and therefore this author is in support of Senator Lisa Murkowski’s efforts.

Phase Two of Florida C&T Project: Economic Analysis
139
5/27/10
http://www.rollcall.com/features/Five‐Months_Five‐Ways/five_months_five_ways/4673 3‐1.html
A skeptic of the bill once again points out that the U.S. needs to create jobs rather than release a bill that will cost hundreds of billions of dollars. He cites the Treasury Departments documents for these figures. A more interesting point he makes is that climate change needs a global commitment, particularly from China and India, the world’s leading emitters. Without international participation, jobs and emissions will just shift overseas.
http://www.capitalpress.com/california/ws‐climate‐bill‐052110
The stalling bill is ratcheting up the tension from both sides. Companies and investors are poised to act with the passing of the legislation while opponents are trying to fend off EPA regulations. According to the author, it does not look likely the climate legislation will go through this year. Public opinion is shifting as well as Rasmussen polls are showing large decreases in the concern that humans are causing global warming.
http://www.foxnews.com/opinion/2010/05/27/phil‐kerpen‐epa‐senate‐showdown‐lisa‐murkowski‐jay‐rockefeller/
This article expresses similar concerns about the extent of the EPA’s authority. Senator Murkowski’s efforts are receiving support from both sides who believe it’s undesirable to allow the EPA to make regulations that could have an enormous impact on the economy.
5/28/10
http://www.greenandsave.com/green_news/climate‐weather/us‐climate‐bill‐stalls‐senate‐amid‐controversy‐6593
In order to appease both sides, the bill was designed to be a compromise between traditional energy supporters and environmentalists. As with any compromise, both sides must give a little ground. The Peterson Institute study is an important first step toward getting the 60 votes to pass the legislation. The EPA and the EIA are set to release their studies next month which could be pivotal to the bill’s success.
http://www.inforum.com/event/article/id/280016/group/Opinion/
The article suggests the climate bill would be bad for the sugar beet industry in North Dakota and Minnesota. While the bill has exemptions for farmers, the beet processing plants are run on coal.
http://www.nytimes.com/gwire/2010/05/28/28greenwire‐sen‐graham‐suggests‐climate‐bill‐focused‐only‐42668.html
Republican Senator Graham expresses his support of some of the ideology of the climate bill. He wants the legislation to pass, but he’s willing to give more ground to conservatives by only placing the cap on power plants. His primary goal is to jump start alternative power production.
Phase Two of Florida C&T Project: Economic Analysis
140
6/2/10
http://www.ft.com/cms/s/0/47ff464e‐6e11‐11df‐ab79‐00144feabdc0.html
Barclays made an aggressive move in the carbon trading business yesterday. The UK bank bought Sweden’s Tricorona for £98m in cash, which represents a 40 per cent premium based on Tricorona’s stock price. Tricorona specializes in generating carbon emission reduction credits from greenhouse gas reduction projects in developing countries. The largest markets are still in the EU, but the U.S. may be entering the mix soon.
http://www.google.com/hostednews/afp/article/ALeqM5jnzj1M1iionvV‐5UTL0V299cX‐IQ
Obama uses strong language linking the oil spill to the need for the U.S. to put the climate legislation in place. He sees the future of energy moving away from oil and wants to ensure the “ingenuity of our entrepreneurs is unleashed.” He’s preparing for the fight to get the bill through congress despite its current unpopularity.
http://www.grist.org/article/2010‐06‐02‐does‐the‐senate‐climate‐bill‐gut‐the‐clean‐air‐act/
The article cites cost benefit analyses performed by the EPA concerning the regulations they’ve passed under the Clean Air Act. According to those reports, the EPA has been wildly successful. The climate legislation will greatly undermine the EPA’s efforts if passed. The article details the pros and cons.
http://thehill.com/blogs/congress‐blog/energy‐a‐environment/101051‐disapproval‐resolution‐june‐2010‐sen‐lisa‐murkowski
Senator Murkowski puts her concerns about the EPA’s power grasp into her own words.
http://www.livemint.com/2010/06/02220830/India‐opposes‐carbon‐tax‐on‐im.html?h=B India opposes a carbon tax on imports. While nations in Europe and North America have historically emitted the bulk of atmospheric carbon in their pursuit of industrial development, they now want the developing countries of Asia, Africa and Latin America to scale back their pace of development to reduce emissions. Leading developing nations such as China, India, Brazil and South Africa insist the industrialized nations must transfer their technologies and offer financial support to them in return.
6/3/10
http://www.theatlanticwire.com/opinions/view/opinion/Will‐the‐Oil‐Spill‐Help‐Secure‐C&T‐3847
This article summarizes and links to 5 other articles about the oil spill’s effect on climate legislation. The first article mentions that Obama is using the momentum from the oil spill to get the legislation through Congress. The second does not look favorably upon the political strategizing. The third points out that C&T is a top priority, but remains unpopular. The fourth cites a recent study of the detrimental economic impacts. The fifth mentions that the oil spill is sidetracking Obama’s agenda

Phase Two of Florida C&T Project: Economic Analysis
141
to get the climate bill passed. In short, these five articles echo what has been said over and over since the introduction of the idea to limit carbon emissions.
6/4/10
http://www.nlpc.org/stories/2010/06/04/wal‐mart‐support‐obamacare‐C&T‐ripped‐annual‐meeting
Walmart is supporting C&T legislation to the displeasure of this op‐ed writer. The writer uses the “American People” as his voice to express his opinion.
http://www.ft.com/cms/s/0/b93374b0‐6f70‐11df‐9f43‐00144feabdc0.html
This writer questions whether using the oil crisis to move the climate bill through Congress represents good leadership. If a bill can’t be sold on its own merits, that is a convincing case for its inadequacy. Also, pointing fingers at BP is a bit hypocritical since the recent debates on the climate bill included expansion of offshore drilling and fairly low liability standards for accidents. The best course would be for more political cooperation at every level and to work with BP to get the oil to stop leaking.
http://www2.tricities.com/tri/news/local/article/cantor_says_obamas_agenda_has_scared_the_american_people/47167/
The second‐most‐powerful Republican in the U.S. House of Representatives, Eric Cantor believes the country is at a crossroads. Tough decisions are on the horizon that will decide whether government expands or contracts. The C&T bill is creating a veil of uncertainty that is keeping the economy on hold until a decision is made. Cantor is pushing to prevent the push toward big government.
6/7/10
http://www.steel.org/AM/Template.cfm?Section=Industry_News&TEMPLATE=/CM/ContentDisplay.cfm&CONTENTID=38595f
An update on Senator Murkowski’s bid to mitigate the power of the EPA’s “command and control.” In three days, the Senate will vote to curb the EPA’s ability to influence climate policy. Free market types see the EPA’s regulatory as a “threat.” Since the climate bill is stalling in Congress, the EPA could set its own C&T regulation. However, it’s unclear whether the EPA could craft a law that would stand up under judicial scrutiny. In order for Senator Murkowski’s proposed “disapproval resolution” to succeed, it will need to pass through the Senate and House and be signed by President Obama. With a Democratic majority in Congress and a President eager to enact climate legislation, the outlook for Murkowski’s success is grim.
http://www.grist.org/article/2010‐06‐07‐is‐the‐climate‐bill‐going‐to‐pass‐top‐five‐things‐to‐watch/

Phase Two of Florida C&T Project: Economic Analysis
142
This article lists the top five things that will determine whether the climate bill passes. The first is Senator Murkowski’s resolution as previously mentioned. The second is the committee chairs who are working to write up a bill for July that will pass through Congress. The third is an alternative energy legislation written by Republican Senator Richard Lugar which does not include C&T. The fourth is the political impact of the oil spill. The fifth is the President himself.
http://canadafreepress.com/index.php/article/23986
An interesting article linking past failures in landmark governmental action to the climate bill. The author cites the Treaty of Versailles and the Kyoto Accord as references. The former is used to parallel the “pay for your sins” aspect of the climate bill – the U.S. must make reparations for its “aggression and profligate ways.” The latter is used to emphasize the futility of the guilt approach. “No nation achieved Kyoto Protocol CO2 reduction targets and the Copenhagen Conference of the Parties was a bust,” according to the author.
6/8/10
http://www.npr.org/templates/story/story.php?storyId=127555794
The best outcome for Democrats is to pass the climate legislation but the alternative could be “a pork‐loaded energy bill, new taxes on oil companies, and an EPA empowered to go ahead with its own version of cap‐and‐trade.”
http://swampland.blogs.time.com/2010/06/07/bp‐the‐end‐of‐cap‐trade/?xid=rss‐topstories
The Bingaman Bill proposed last June by Senate Energy Committee Chairman Jeff Bingaman is back on the table as a viable option. The bill has already been backed by four Republicans and the oil and gas industry, which are major hurdles to the cap and trade legislation. The Bingaman Bill, notably, leaves out cap and trade but it includes renewable energy standards, more financing options for clean energy, an update of the energy grid, and increased efficiency measures.
Senator Lugar is one of a small group of Senate moderates in the Republican party willing to work on the carbon emissions issue. This article reviews his proposals; the measures he suggests are likely to fall short, but the willingness to negotiate is seen an important step forward.
6/9/10
http://www.grist.org/article/2010‐06‐07‐david‐roberts‐right‐wrong‐on‐clean‐air‐act‐senate‐climate‐bill/
A long article from a climate legislation supporter. He thinks letting the EPA regulate through the Clean Air Act is a completely underpowered effort to curb carbon emissions. He chastises those with similar beliefs for ceding too much ground in order to reach a compromise. Then he highlights parts of the American Power Act that don’t do enough to curb climate change.

Phase Two of Florida C&T Project: Economic Analysis
143
http://www.examiner.com/x‐5908‐Environmental‐Policy‐Examiner~y2010m6d9‐Effect‐of‐2010‐elections‐on‐carbon‐cap‐and‐trade‐Climate‐Change‐policy
According to the author, an environmental policy analyst, the 2010 elections will have no effect on climate change policy nor will Senator Murkowski’s efforts.
6/10/10
http://www.insideindianabusiness.com/newsitem.asp?ID=42094
Senator Lugar released his own climate bill yesterday. It can be found here: http://lugar.senate.gov/energy. This article highlights his position.
Lugar mentions that “the real cost of petroleum includes the use of our military to defend shipping lanes and maintain geopolitical stability in oil producing regions. More troubling, four‐fifths of the world’s oil reserves are controlled by government‐owned oil companies, and many of these regimes do not wish us well or have shown some proclivity to use oil as a weapon of foreign policy.”
The Senator believes that emphasizing carbon reductions ahead of energy needs is a mistake. There are better alternatives to achieving both goals. He suggests “fixing the major leaks” in the energy system. A practical approach involves prioritizing “the cheapest and easiest energy savings: to achieve efficiencies in our buildings, appliances and industrial processes.”
His plan includes the following objectives:
· Reduce our foreign oil dependency; · Save Americans money on their energy bills; · Improve our industrial competitiveness; · Invest in cleaner and more diverse energy choices; and · Better use our domestic fossil fuel resources.
The plan would generate the following savings by 2030:
· Cut foreign oil dependence by more than 40 percent; · Decrease national energy consumption by 11 percent; · Reduce average household electric bills by 15 percent; and · Cut greenhouse gas emissions by more than 20 percent, or about 1.6 billion metric tons – the equivalent of taking more than 240 million cars off our highways.
http://www.businessweek.com/news/2010‐06‐10/republicans‐try‐to‐sink‐epa‐carbon‐rules‐before‐energy‐debate.html
Senator Murkowski’s long shot bid to curb EPA power takes the floor today. While the opposition isn’t likely to stop the EPA’s regulations, the level of support it receives will be a strong indicator about whether to climate bill will pass. “Democrats currently hold 59 seats in the Senate

Phase Two of Florida C&T Project: Economic Analysis
144
and the Republicans have 41. The number of Democrats who join Murkowski will…influence Reid’s decision on whether to include carbon caps in the energy bill.”
http://www.theatlantic.com/national/archive/2010/06/bp‐vs‐obamas‐climate‐complacency/57951/
Interesting first sentence: “Engulfed by the worst environmental disaster in US history, Barack Obama is trying to change the subject.” The article accuses Chief of Staff Rahm Emanuel of preventing a more in‐depth and effective push toward climate policy in his strategizing with the President. In 2009, Emanuel is quoted saying, "we want to do this climate bill, but success breeds success. We need to put points on the board. We only want to do things that are going to be successful. If the climate bill bogs down, we move on. We've got health care."
The strategy for the climate bill became a stealth approach, but the bill was too controversial to go unnoticed. Now, the oil spill has removed the offshore bargaining chip that the climate bill was going to use to get its other agendas passed.
6/11/10
http://bignews.biz/?id=883086&keys=Senator‐Lisa‐Murkowski‐DisapprovalResolution
Senator Murkowski’s closing remarks to the unsuccessful Disapproval Resolution.
http://www.alaskadispatch.com/voices/the‐concerned/5640‐epa‐dont‐worry‐murkowski‐that‐was‐just‐the‐first‐period
A couple interesting points here. The author is disappointed that Murkowski’s efforts didn’t succeed, but he mentions that the EPA’s regulations have had not seemed to have much effect since the passing of the Clean Air Act in 1990. He also mentions how the political favors used in this unsuccessful bid could be beneficial for future political strategizing.
6/16/10
http://www.cbsnews.com/8301‐503544_162‐20007883‐503544.html
Obama’s speech last night did not contain a specific, clear message in the direction of cap and trade legislation. Cap and trade supporters were miffed by the lack of information in Obama’s address. Conservatives, on the other hand, were surprised by Obama’s continued support for cap and trade.
http://www.allheadlinenews.com/articles/7019006941
Quebec and Ontario have become early adopters of cap and trade. Manitoba and British Columbia should be on the way.

Phase Two of Florida C&T Project: Economic Analysis
145
http://news.bostonherald.com/business/general/view/20100616scott_brown/srvc=home&position=also
Massachusetts Republican Senator Scott Brown urged Obama to forge a bipartisan energy plan citing the distaste for any more taxes. Instead, the focus should be on creating jobs and not using the BP oil spill to push a cap and trade agenda.
6/17/10
http://www.nytimes.com/cwire/2010/06/17/17climatewire‐conservatives‐work‐to‐tar‐cap‐and‐trade‐bill‐42785.html
A new twist to the political strategizing around the BP oil spill. Republicans are claiming that the climate bill was essentially written by BP, so it’s an “inconvenient truth” that the administration is now trying to admonish the oil company. BP has publicly announced its support of the climate bill on numerous occasions, specifically pinpointing cap and trade as an important solution to climate change. Ultimately, the claims by Republicans are the same kind of political maneuvering that Democrats used when the oil spill first struck.
http://blog.heritage.org/2010/06/17/epa%E2%80%99s‐new‐analysis‐of‐cap‐and‐trade‐same‐old‐faulty‐logic/
The author criticizes the EPA’s study of cap and trade citing specific methodological errors. 1. Inappropriate use of discounting. 2. Doesn’t fully measure the costs – uses average household size which is 2.6. Costs to a family of four increase costs 53%. Also, the analysis uses changes in consumption as opposed to changes in income which underplays peoples’ response for economic reasons outlined in the article. 3. Generous assumptions involving CCS technology, the use of offsets, and nuclear power. 4. The costs will be forced onto the economy which undermines green jobs, environmental benefits, and oil use reduction.
6/18/10
http://www.nytimes.com/cwire/2010/06/18/18climatewire‐senate‐democrats‐getting‐more‐pessimistic‐on‐29916.html
Senate Democrats are pessimistic about the climate bill’s likelihood of passing. Virtually no Republicans support the bill, so it would need support from nearly all the Democrats. Cap and trade is too contentious to garner 60 votes, but a straight energy bill may be able to pass.
6/21/10
http://www.grist.org/article/2010‐06‐21‐is‐a‐utility‐only‐cap‐and‐trade‐bill‐worth‐passing/
While a few liberals in Senate fight to keep cap and trade alive, the centrist movement is to focus on an energy‐only option. One idea within the centrist mindset is a cap and trade system only for utilities. An economy wide cap is better in this author’s opinion since it allows more free

Phase Two of Florida C&T Project: Economic Analysis
146
flowing movements to where cost reductions can be found. However, focusing on one sector may be better than nothing.
http://voices.washingtonpost.com/ezra‐klein/2010/06/a_utilities‐only_cap‐and‐trade.html
Graph of carbon reductions by 2030 by industry.
6/25/10
http://www.nytimes.com/cwire/2010/06/25/25climatewire‐senate‐democrats‐plot‐impenetrable‐path‐to‐v‐66658.html
Democrats are forming a political strategy to get the votes for the climate bill. “Its basic thrust appears to be a plan to anchor the climate and energy effort to widely popular legislation that would overhaul offshore drilling regulations in the wake of the Gulf spill, and then dare Republicans to vote against it.”
6/28/10
http://theenergycollective.com/jessejenkins/38725/scaled‐back‐climate‐bill‐likely‐strand‐energy‐innovation
Scaling back the cap and trade bill to only include utilities weakens the policy’s framework considerably by limiting the size of the market. Several leading energy policy think tanks, a group of 34 Nobel Laureates, essentially all of the nation's leading research universities, and a new council of high‐tech industry titans are urging congress to ramp up clean energy funding. The sentiment in the article is stated, “if the U.S. does not level the scale of investment needed to spur both incremental and transformative innovation and improvement across a suite of clean technologies, any other proposal ‐‐ be it cap and trade or otherwise – ‘will not do much good. Incrementalism will neither fill the gaps, nor create the sweeping change this nation needs in energy. Bold action is required.’"
6/29/10
http://content.usatoday.com/communities/theoval/post/2010/06/obama‐senators‐grapple‐with‐cap‐and‐trade‐energy‐bill/1
The push for cap and trade still isn’t appealing to Republicans who are more focused on jobs. However, there from Republicans on electric cars, nuclear power plants, and increased R&D.
7/2/2010
http://www.nytimes.com/cwire/2010/07/02/02climatewire‐manufacturers‐worry‐of‐pitfalls‐from‐utility‐3804.html
While the utility only cap may be a reasonable compromise, it could put additional pressure on the manufacturing industry which requires a lot of energy, often in from coal fired power plants.

Phase Two of Florida C&T Project: Economic Analysis
147
7/6/2010
http://www.huffingtonpost.com/david‐yarnold/five‐denier‐myths‐about‐t_b_636239.html
A pro cap and trade author cites and refutes 5 of the arguments made by opponents.
http://switchboard.nrdc.org/blogs/dbryk/northeast_senators_uniquely_po.html
From a Dale Bryk’s blog: “The Northeast states figured out long ago that the biggest job killing energy taxes are $5 gasoline prices and $200 heating bills which result from failed energy policies or no policies at all. And they are not alone: twenty five states have committed to adopt mandatory, comprehensive policies designed to shift their economies away from reliance on dirty old fuels, volatile energy prices and the antiquated power plants that our grandparents built and move towards clean technologies and innovation that bring jobs, lower energy bills, and can help make US businesses more competitive in today’s global markets.”
http://www.wctrib.com/event/article/id/69507/
Climate change legislation could offer economic benefits to farmers, if they have a role in shaping it. That’s the gist of a study by Informa Economics for the American Farmland Trust and the National Association of Wheat Growers. Among new sources of
revenue for farmers would be carbon sequestration.
7/7/10
http://ecocentric.blogs.time.com/2010/07/07/cap‐and‐trade‐isnt‐that‐costly/
A look at the costs estimated by various sources. The first study shows that curbing global warming by 450ppm by 2100 would cost 6% of global GDP while doing nothing would only cost 3%. But the severity that global warming has a wide range and that study assumes a small impact. According to the Congressional Budget Office (CBO) the American Power Act would “reduce the budget deficit by about $19 billion over the 2011 to 2020 period” and “raise government revenue by about $751 billion.”
Read more: http://ecocentric.blogs.time.com/2010/07/07/cap‐and‐trade‐isnt‐that‐costly/#ixzz0v09su0K2
7/12/10
http://online.wsj.com/article/SB10001424052748704895204575321160587141150.html
The acid rain market in the United States provides an excellent case study for a cap program. From the 1990s to 2008, sulfur dioxide emissions were cut 52% which shoes an effective program. But currently, new regulations set by the EPA will undermine the system. The EPA has set tighter limits and hampered the trading system. Upwind factories will have to have more sulfur

Phase Two of Florida C&T Project: Economic Analysis
148
dioxide offsets. In addition, credits purchased in the old set up will be void and new credits will have to be purchased. The current value of the new allowances on the market is zero, however.
7/21/10
http://online.wsj.com/article/SB10001424052748703724104575379320910452894.html
The author from the Heritage Foundation believes all the climate bills attempted thus far, will lead to the same conditions that led to the housing bubble. “It would do this by providing financial incentives to the federally funded metropolitan planning organizations to shift transportation resources and passengers away from automobiles to public transit and forms of non‐motorized transportation.” The article mainly discusses how the changes in land use result in very small gains but come at the large cost of government coercion. The final point is that “communities that adopted the sort of land use regulations and restrictions implied by S. 1733 became highly unaffordable for the typical family.”
7/23/10
http://blogs.wsj.com/washwire/2010/07/23/no‐cap‐and‐trade‐form‐circle‐start‐firing/
The blog post details the finger pointing that is occurring due to the climate bill’s failure to launch.
http://www.foxnews.com/opinion/2010/07/23/phil‐kerpen‐democrat‐obama‐climate‐cap‐trade‐senate/
Fox News article discussing the subterfuge of cap and trade. It’s a way to hide a tax from the American people. A carbon tax was tried by Gore and Clinton, but it was unpopular. The author calls cap and trade a tax with an unknown rate.
7/25/10
http://www.nytimes.com/2010/07/26/opinion/26douthat.html
Supporters of cap and trade are looking to point fingers. They’ve blamed Obama, but mainly they target conservatives which they should. But the conservative movement’s roots are grounded in history.
“The Seventies were a great decade for apocalyptic enthusiasms, and none was more potent than the fear that human population growth had outstripped the earth’s carrying capacity. According to a chorus of credentialed alarmists, the world was entering an age of sweeping famines, crippling energy shortages, and looming civilizational collapse.
It was not lost on conservatives that this analysis led inexorably to left‐wing policy prescriptions — a government‐run energy sector at home, and population control for the teeming masses overseas.
Phase Two of Florida C&T Project: Economic Analysis
149
Social conservatives and libertarians, the two wings of the American right, found common ground resisting these prescriptions. And time was unkind to the alarmists. The catastrophes never materialized, and global living standards soared. By the turn of the millennium, the developed world was worrying about a birth dearth.
This is the lens through which most conservatives view the global warming debate. Again, a doomsday scenario has generated a crisis atmosphere, which is being invoked to justify taxes and regulations that many left‐wingers would support anyway.”
The author admits that global warming research points to a different kind of problem with a different solution, but a global overhaul of regulation may not be as good as just muddling through.
7/26/10
http://www.bloomberg.com/news/2010‐07‐26/utility‐companies‐just‐exhausted‐after‐defeat‐on‐cap‐and‐trade‐measure.html
Even the utility‐only measure has stalled in Congress. Cap and trade is still expected in the future, but when is anybody’s guess.
7/27/10
http://www.nytimes.com/cwire/2010/07/27/27climatewire‐cap‐and‐trade‐advocates‐see‐tougher‐battle‐a‐78288.html
The composition of the House and Senate is likely to become more Republican in the upcoming elections which will make it more difficult to get a climate bill passed. While some still work to get something into place this year, many are taking a longer term approach saying that the evolution of the bill will eventually lead to something both parties can agree on. Although, one policy expert notes, "Sometimes, when the party balance is closer, it actually becomes easier to put together bipartisan coalitions because you've got to get some things done."
http://www.csmonitor.com/USA/Politics/2010/0727/Stripped‐down‐energy‐bill‐leaves‐out‐cap‐and‐trade
A trimmed down energy bill. It includes provisions to make sure BP pays for the spill. It also lays out requirements for oil companies to invest in clean up technologies. Four other points are bulleted.
Providing incentives for turning the nation‘s heavy truck fleet to natural gas and toward electrification of the nation‘s transportation sector.
Promoting "clean energy job creation" providing $5 billion of rebates to encourage homeowners to make efficiency upgrades as part of the Home Star program.
Fully funding a Land and Water Conservation Fund over the next five years to ensure that vital US lands and waters are protected into the future from climate change damage.

Phase Two of Florida C&T Project: Economic Analysis
150
Increasing the $1 billion liability cap of the Oil Spill Liability Trust Fund to $5 billion and increasing fees to pay for it by requiring that oil companies pay 49 cents per barrel into the Oil Spill Liability Trust Fund.
7/28/10
http://green.blogs.nytimes.com/2010/07/28/cap‐and‐trade‐is‐dead‐long‐live‐cap‐and‐trade/?src=mv
Even though cap and trade is dead in the US Senate, “representatives of some of the Western Climate Initiative, a group of seven states and four Canadian provinces, unveiled a rough blueprint for a cap‐and‐trade program that would begin operating in 2012.” A big difference in this group is that none of the states or provinces is uses coal fired electricity. Instead, the biggest carbon emissions come from transportation. Though federal law is not necessary to enact these laws, the lack of federal support decreases the value of the carbon allowances as seen coalition of ten states in New England and the mid‐Atlantic.