Embed Size (px)
Citation preview
Final
pH (H+ Ion Mass)
Total Maximum Daily Load (TMDL)
for
Rock Creek of South Fork Cumberland River and White Oak Creek of Rock Creek Watersheds
(McCreary County, Kentucky)
Kentucky Department for Environmental Protection
Division of Water
Frankfort, Kentucky
January 2006
i
pH (H+ Ion Mass) Total Maximum Daily Load (TMDL)
for Rock Creek of South Fork Cumberland River and
White Oak Creek of Rock Creek Watersheds (McCreary County, Kentucky)
Kentucky Department for Environmental Protection
Division of Water
Frankfort, Kentucky
List of Contributors
Dr. Lindell Ormsbee, Supervisor Mohammad Tufail, P.E., Data Analysis and Report Preparation
The Tracy Farmer Center for the Environment
University of Kentucky, Lexington, Kentucky 40506
The Natural Resources and Environmental Protection Cabinet does not discriminate on the basis of race, color, natural origin, sex, age, religion, or disability and provides on request, reasonable accommodations including auxiliary aids and services necessary to afford an individual with a disability an equal opportunity to participate in all services, programs, and activities.
Printed on Recycled Paper
ii
Table of Contents
Page List of Contributors i
Table of Contents ii
List of Figures and Tables iii
TMDL Fact Sheet iv
Introduction 1
Problem Definition 9
Target Identification 10
Source Assessment 12
TMDL Development 12
Model Development 13
Critical Flow and TMDL Determination 16
Hydrogen Ion Loading Model 18
Predicted Load 28
Load Reduction Allocation 29
Permitting 30
Implementation/Remediation Strategy 33
Load Reduction Strategy Using Limestone Sand 33
Public Participation 37
Literature Cited 38
Appendix A: Mining Permits Numbering System 40
iii
List of Figures and Tables Figures Page
1. Location of the Rock Creek Watershed ...........................................................................1
2. Sampling Sites Monitored by Kentucky Division of Water (KDOW)........................... 4
3. Coal Mine Portals and Refuse Dumps in Rock Creek Watershed.................................. 6
4. Paint Cliff Vertical Flow System Components (Phase I) ................................................8
5. Water Tank Hollow Refuse Area After Reclamation (Phase II) .....................................9
6. Activity Coefficients of H+ as a Function of Ionic Strength..........................................14
7. Relationship Between Flow (Discharge) and Maximum Ion Load for a pH of 6.0.......15
8. Relation Between Basin Area and the Critical Flow .....................................................17
9-26. Relation Between Flow and Ion Load for Sites 1 - 18 ...................................... 19-27
27. Relation Between CaCO3 Loading and the Required Hydrogen Ion Reduction .........35
28. Relation Between CaCO3 Loading and the Required Hydrogen Ion Reduction
(Used for Load Reductions Less Than 200 g/day) ......................................................36
Tables Page
1. Recent Mining Permits in the Rock Creek Watershed ...................................................2
2. Kentucky KDOW Sampling Results, 1999-2000 ..........................................................5
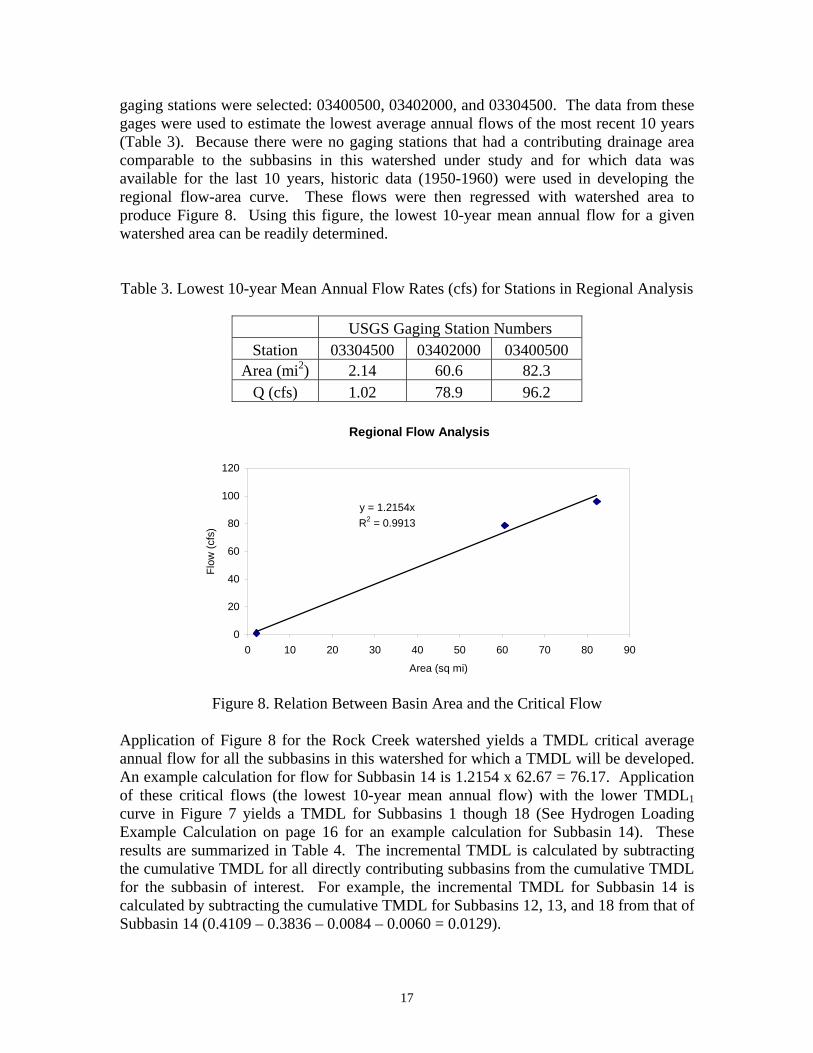
3. Lowest 10-year Mean Annual Flow Rates (cfs) for Stations in Regional Analysis… 17
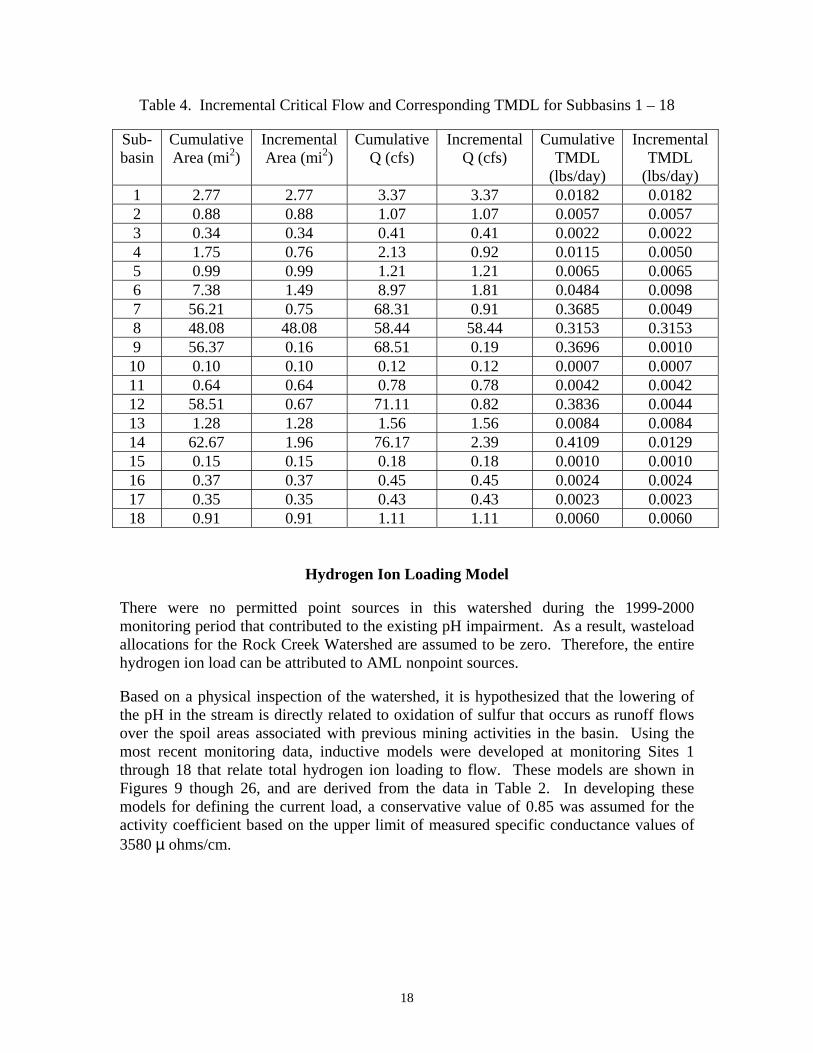
4. Incremental Critical Flow and Corresponding TMDL for Subbasins 1 - 18 ...............18
5. Predicted Cumulative and Incremental Ion Load for Subbasins 1 - 18 .......................29
6. TMDL Summary and Reduction Needed for Subbasin 1 - 18.....................................30
7. Wasteload and Load Allocation for Each Subbasin in the Rock Creek Watershed ....32
8. CaCO3 Loadings for Rock Creek.................................................................................37
iv
Rock Creek of South Fork Cumberland River and White Oak Creek of Rock Creek
Total Maximum Daily Load (TMDL) Fact Sheet Project Name: Rock Creek of South Fork Cumberland River and
White Oak Creek of Rock Creek Location: McCreary County, Kentucky Scope/Size: Rock Creek, watershed 40,109 acres (62.67 mi2) Stream Segments: Rock Creek River Mile 0.0 to 4.1 White Oak Creek River Mile 0.0 to 4.2 Land Type: forest, agricultural, barren/spoil Type of Activity: acid mine drainage (AMD) caused by abandoned mines Pollutant(s): H+ Ion mass, sulfuric acid TMDL Issues: Nonpoint sources Water Quality Standard/Target: pH shall not be less than six (6.0) or more than nine (9.0)
and shall not fluctuate more than one and zero-tenths (1.0) pH unit over a 24-hour period. This standard is found within regulation 401 KAR 5:031.
Data Sources: Kentucky Pollutant Discharge Elimination System Permit
Historical Sampling Data, Murray State University Sampling Data
Control Measures: Kentucky nonpoint source TMDL implementation plan,
Kentucky Watershed Framework Summary: Rock Creek and White Oak Creek were determined as not
supporting the designated uses of primary and secondary contact recreation (swimming and wading) and warm water aquatic habitat (aquatic life). Therefore, the creeks were placed on the 1996 and subsequent 303(d) lists for TMDL development. The creek segments are characterized by a depressed pH, the result of AMD from abandoned mining sites. In developing the TMDL for Rock Creek and White Oak Creek, pH readings and corresponding streamflow measurements were made at eighteen different locations
v
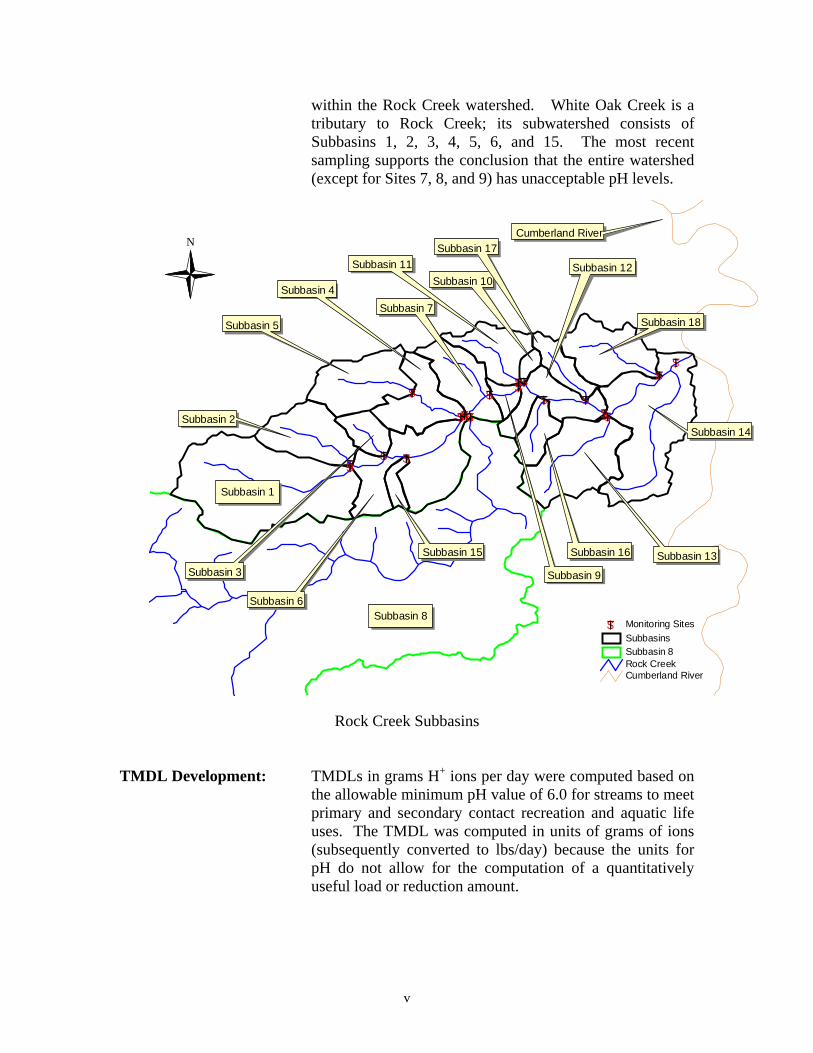
within the Rock Creek watershed. White Oak Creek is a tributary to Rock Creek; its subwatershed consists of Subbasins 1, 2, 3, 4, 5, 6, and 15. The most recent sampling supports the conclusion that the entire watershed (except for Sites 7, 8, and 9) has unacceptable pH levels.
$T$T$T
$T
$T
$T
$T
$T
$T$T$T
$T$T
$T
$T
$T $T
$T
Cumberland RiverRock Creek Subbasin 8Subbasins
$T Monitoring SitesSubbasin 8
Subbasin 1
Subbasin 2
Subbasin 5
Subbasin 4Subbasin 7
Subbasin 11Subbasin 10
Subbasin 9
Subbasin 16
Subbasin 17
Subbasin 12
Subbasin 13
Subbasin 18
Subbasin 3
Subbasin 14
Cumberland RiverN
Subbasin 6
Subbasin 15
Rock Creek Subbasins
TMDL Development: TMDLs in grams H+ ions per day were computed based on
the allowable minimum pH value of 6.0 for streams to meet primary and secondary contact recreation and aquatic life uses. The TMDL was computed in units of grams of ions (subsequently converted to lbs/day) because the units for pH do not allow for the computation of a quantitatively useful load or reduction amount.
vi
In recognition of the inherent difficulties associated with imposition of a “no-exceedance” pH criteria on potentially intermittent streams, the Kentucky Division of Water (KDOW) has decided to use the lowest one year average discharge of the most recent 10-year flow record as the flow basis for setting the appropriate TMDL and associated loading reduction. Previous pH TMDLs have used a 3-year recurrence interval of the average flow as the critical flow. However, this flow resulted in a target discharge that frequently was significantly greater than any of the observed flows for the sites as collected over several years. Thus use of a 3-year flow would require an extrapolation of the observed ion vs. flow model, well beyond the upper limit of the observed data. The selection of the 10-year frequency was based on a consideration of water quality standards (WQSs) (i.e. 7Q10). However, since many of these streams have a 7Q10 of zero, a greater duration was needed. The consensus of the KDOW was to use the 1-year duration. The use of an average annual flow as the basis for determining the TMDL provides a more appropriate mechanism for determining: (1) the total annual load; (2) the total annual reduction that would be derived from an annual summation of the daily TMDLs; and (3) the associated daily load reductions for the critical year using historical daily flows.
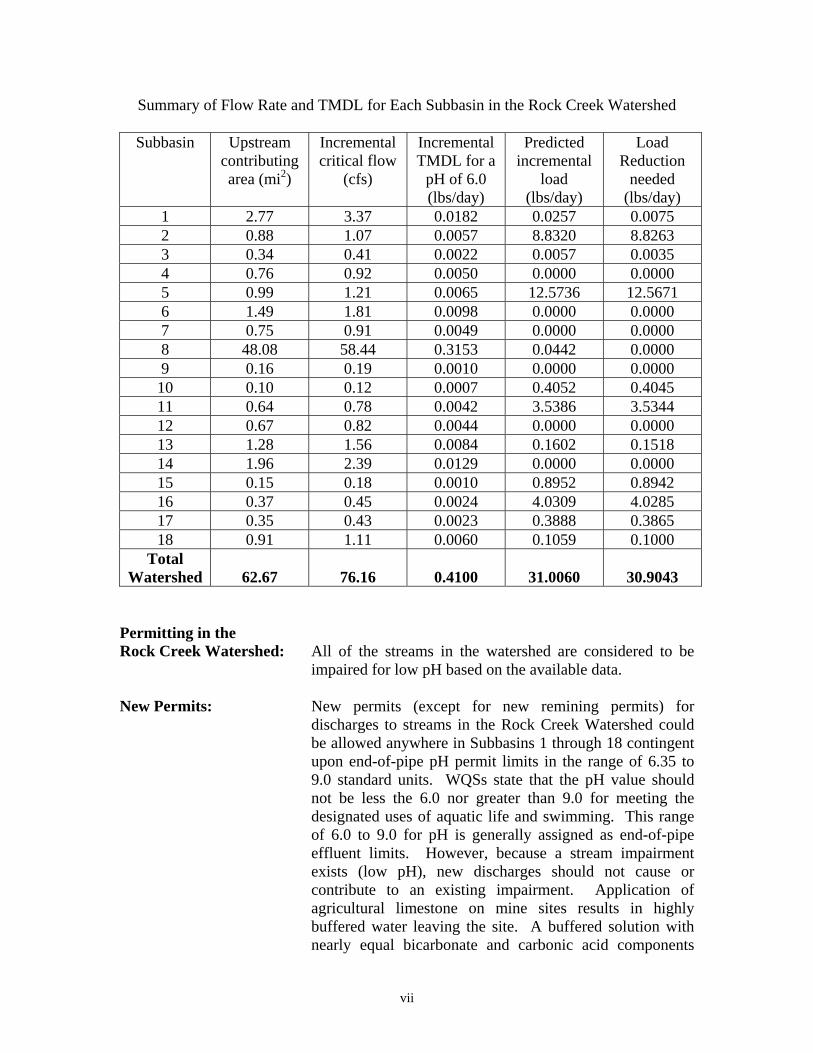
TMDL for Rock Creek: In developing a TMDL for Rock Creek, there are two
possible strategies. Either a cumulative TMDL may be obtained for the downstream extent of the impaired portion of the watershed, or separate TMDLs (and associated load reductions) may be developed for each individual subbasin. As a result of the availability of sampling data at multiple sampling points, individual TMDLs were developed for all subbasins that were impaired because of low pH. The low pH condition extends to Site 14, which is located approximately 0.25 miles upstream from the confluence of Rock Creek with Cumberland River. The TMDLs and associated load reductions for subbasins in the Rock Creek watershed are shown below.
vii
Summary of Flow Rate and TMDL for Each Subbasin in the Rock Creek Watershed
Subbasin Upstream contributing area (mi2)
Incremental critical flow
(cfs)
Incremental TMDL for a
pH of 6.0 (lbs/day)
Predicted incremental
load (lbs/day)
Load Reduction
needed (lbs/day)
1 2.77 3.37 0.0182 0.0257 0.0075 2 0.88 1.07 0.0057 8.8320 8.8263 3 0.34 0.41 0.0022 0.0057 0.0035 4 0.76 0.92 0.0050 0.0000 0.0000 5 0.99 1.21 0.0065 12.5736 12.5671 6 1.49 1.81 0.0098 0.0000 0.0000 7 0.75 0.91 0.0049 0.0000 0.0000 8 48.08 58.44 0.3153 0.0442 0.0000 9 0.16 0.19 0.0010 0.0000 0.0000 10 0.10 0.12 0.0007 0.4052 0.4045 11 0.64 0.78 0.0042 3.5386 3.5344 12 0.67 0.82 0.0044 0.0000 0.0000 13 1.28 1.56 0.0084 0.1602 0.1518 14 1.96 2.39 0.0129 0.0000 0.0000 15 0.15 0.18 0.0010 0.8952 0.8942 16 0.37 0.45 0.0024 4.0309 4.0285 17 0.35 0.43 0.0023 0.3888 0.3865 18 0.91 1.11 0.0060 0.1059 0.1000
Total Watershed
62.67
76.16
0.4100
31.0060
30.9043
Permitting in the Rock Creek Watershed: All of the streams in the watershed are considered to be
impaired for low pH based on the available data. New Permits: New permits (except for new remining permits) for
discharges to streams in the Rock Creek Watershed could be allowed anywhere in Subbasins 1 through 18 contingent upon end-of-pipe pH permit limits in the range of 6.35 to 9.0 standard units. WQSs state that the pH value should not be less the 6.0 nor greater than 9.0 for meeting the designated uses of aquatic life and swimming. This range of 6.0 to 9.0 for pH is generally assigned as end-of-pipe effluent limits. However, because a stream impairment exists (low pH), new discharges should not cause or contribute to an existing impairment. Application of agricultural limestone on mine sites results in highly buffered water leaving the site. A buffered solution with nearly equal bicarbonate and carbonic acid components
viii
will have a pH of 6.35 (Carew, personal communication, 2004). Discharge of this buffered solution will use up free hydrogen ions in the receiving stream, thus it should not cause or contribute to an existing low pH impairment. New permits having an effluent limit pH of 6.35 to 9.0 will not be assigned a hydrogen ion load as part of a Waste Load Allocation (WLA).
Remining Permits: Remining permits may be approved on a case-by-case basis
where streams are impaired because of low pH from abandoned mines. Permit approval is contingent on reclamation of the site after mining activities are completed. Existing water quality conditions must be maintained or improved during the course of remining. The permittee is required to monitor in-stream conditions during remining to make sure that current water quality conditions are maintained or improved. Reclamation of the site is the ultimate goal, but WQSs (pH of 6.0 to 9.0 standard units) may not necessarily be met in the interim if the Commonwealth issues a variance to the discharger. In instances where the Commonwealth issues a variance for a remining activity consistent with this regulation, hydrogen ion loads from this remining activity are allowed to exceed the WLA. The variance allows an exception to the applicable WQS as well as the TMDL. Remining therefore constitutes a means whereby a previously disturbed and unreclaimed area can be reclaimed. The authority for remining is defined in Section 301(p) of the Federal Clean Water Act; Chapter 33, Section 1331(p) of the U.S. Code – Annotated (the Rahall Amendment to the Federal Clean Water Act); and the Kentucky Administrative Regulations (401 KAR 5:029 and 5:040).
The remediation of the remining site will result in a reduction of the nonpoint source ion load of the subbasin where the remining is done. When remining is completed, the remediation should result in a reduction in the load allocation. Follow-up, in-stream monitoring will need to be done at the subbasin outfall to determine the effect of reclamation activities following remining on the overall ion load coming from the subbasin. There are currently no active remining permits in the Rock Creek watershed.
ix
General KPDES Permit for Coal Mine Discharges: This permit covers all new and existing discharges
associated with coal mine runoff. This permit does not authorize discharges that (1) are subject to an existing individual KPDES permit or application, (2) are subject to a promulgated storm water effluent guidelines or standard, (3) the Director has determined to be or may reasonably be expected to be contributed to a violation of a water of a WQS or to the impairment of a 303(d) listed water, or (4) are into a surface water that has been classified as an Exceptional or Outstanding or National Resource Water. A signed copy of a Notice of Intent (NOI) form must be submitted to the Kentucky Division of Water (KPDES Branch) when the initial application is filed with the Division of Mine Permits. However, coverage under this general permit may be denied and submittal of an application for an individual KPDES permit may be required based on a review of the NOI and/or other information.
Antidegradation Policy: Kentucky’s Antidegradation Policy was approved by EPA
on April 12, 2005. For impaired waters, general permit coverage will not be allowed for one or more of the pollutants commonly associated with coal mining (i.e., sedimentation, solids, pH, metals, alkalinity of acidity). The individual permit process remains the same except new conditions may apply if a Total Maximum Daily Load (TMDL) has been developed and approved.
Distribution of Load: Because there were no point source discharges active
during the 1999-2000 monitoring period, the existing hydrogen ion load for the watershed was defined entirely as a nonpoint source load. Because new permits (pH 6.35 to 9.0) should not cause or contribute to the existing impairment and remining permits would be exempt from the TMDL requirements, no load has been provided for the WLA category.
x
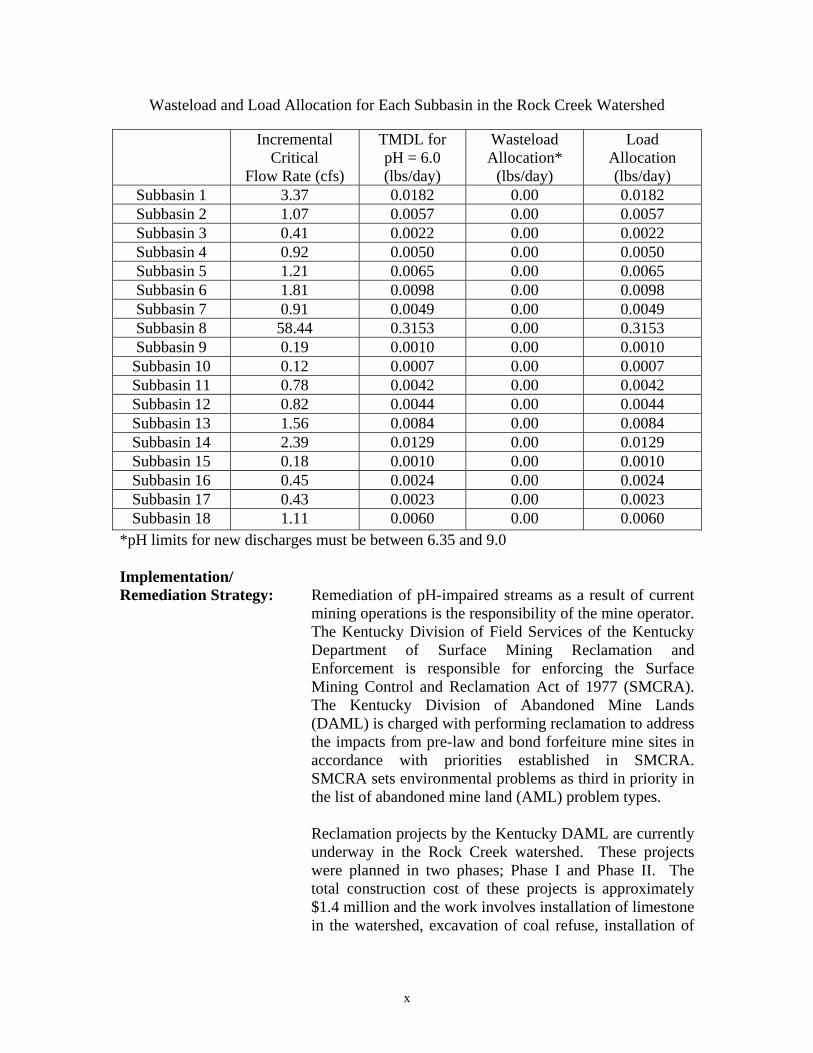
Wasteload and Load Allocation for Each Subbasin in the Rock Creek Watershed
Incremental Critical
Flow Rate (cfs)
TMDL for pH = 6.0 (lbs/day)
Wasteload Allocation*
(lbs/day)
Load Allocation (lbs/day)
Subbasin 1 3.37 0.0182 0.00 0.0182 Subbasin 2 1.07 0.0057 0.00 0.0057 Subbasin 3 0.41 0.0022 0.00 0.0022 Subbasin 4 0.92 0.0050 0.00 0.0050 Subbasin 5 1.21 0.0065 0.00 0.0065 Subbasin 6 1.81 0.0098 0.00 0.0098 Subbasin 7 0.91 0.0049 0.00 0.0049 Subbasin 8 58.44 0.3153 0.00 0.3153 Subbasin 9 0.19 0.0010 0.00 0.0010 Subbasin 10 0.12 0.0007 0.00 0.0007 Subbasin 11 0.78 0.0042 0.00 0.0042 Subbasin 12 0.82 0.0044 0.00 0.0044 Subbasin 13 1.56 0.0084 0.00 0.0084 Subbasin 14 2.39 0.0129 0.00 0.0129 Subbasin 15 0.18 0.0010 0.00 0.0010 Subbasin 16 0.45 0.0024 0.00 0.0024 Subbasin 17 0.43 0.0023 0.00 0.0023 Subbasin 18 1.11 0.0060 0.00 0.0060
*pH limits for new discharges must be between 6.35 and 9.0 Implementation/ Remediation Strategy: Remediation of pH-impaired streams as a result of current
mining operations is the responsibility of the mine operator. The Kentucky Division of Field Services of the Kentucky Department of Surface Mining Reclamation and Enforcement is responsible for enforcing the Surface Mining Control and Reclamation Act of 1977 (SMCRA). The Kentucky Division of Abandoned Mine Lands (DAML) is charged with performing reclamation to address the impacts from pre-law and bond forfeiture mine sites in accordance with priorities established in SMCRA. SMCRA sets environmental problems as third in priority in the list of abandoned mine land (AML) problem types.
Reclamation projects by the Kentucky DAML are currently underway in the Rock Creek watershed. These projects were planned in two phases; Phase I and Phase II. The total construction cost of these projects is approximately $1.4 million and the work involves installation of limestone in the watershed, excavation of coal refuse, installation of

xi
limestone channels, installation of vertical flow systems, and reclamation of acidic refuse and landslides. For 2000, the total federal Kentucky AML budget allocation was approximately $17 million. However, the bulk of these funds were used to support Priority 1 (extreme danger of adverse effects to public health, safety, welfare, and property) and Priority 2 (adverse effects to public health, safety, and welfare) projects. Of the total annual federal budget allocation, AML receives only approximately $700,000 in Appalachian Clean Streams Initiative funds, which are targeted for Priority 3 environmental problems. Based on the cost of current remediation efforts, it would appear that a significant increase in federal funding to the DAML projects, particularly Priority 3 projects, would be required in order for the AML program to play a significant part in meeting the TMDL implementation requirement associated with pH-impaired streams in the state of Kentucky.
1
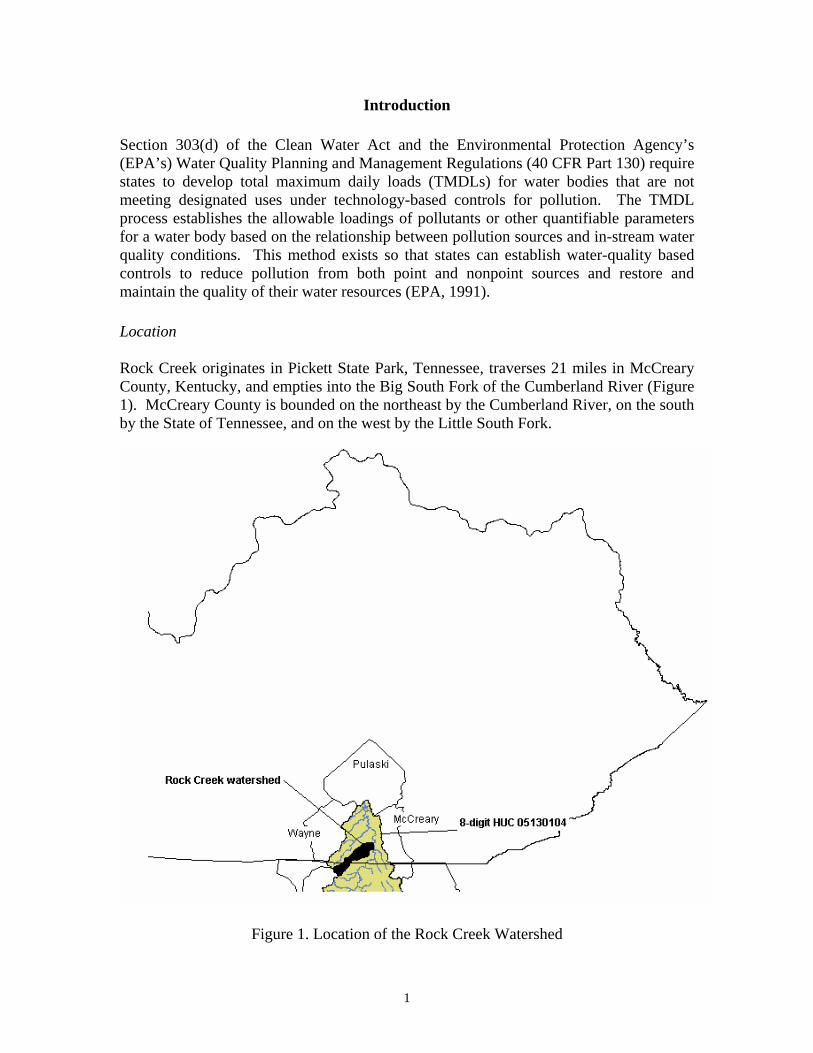
Introduction Section 303(d) of the Clean Water Act and the Environmental Protection Agency’s (EPA’s) Water Quality Planning and Management Regulations (40 CFR Part 130) require states to develop total maximum daily loads (TMDLs) for water bodies that are not meeting designated uses under technology-based controls for pollution. The TMDL process establishes the allowable loadings of pollutants or other quantifiable parameters for a water body based on the relationship between pollution sources and in-stream water quality conditions. This method exists so that states can establish water-quality based controls to reduce pollution from both point and nonpoint sources and restore and maintain the quality of their water resources (EPA, 1991). Location Rock Creek originates in Pickett State Park, Tennessee, traverses 21 miles in McCreary County, Kentucky, and empties into the Big South Fork of the Cumberland River (Figure 1). McCreary County is bounded on the northeast by the Cumberland River, on the south by the State of Tennessee, and on the west by the Little South Fork.
Figure 1. Location of the Rock Creek Watershed
2
Hydrologic Information Rock Creek’s main stem is approximately 35.7 miles long and drains an area of 40,109 acres (62.67 sq. miles). The average gradient is 23 feet per mile. Elevations for Rock Creek range from 1600 ft above mean sea level (msl) in the headwaters to 775 ft above msl at the mouth. White Oak Creek is a tributary to Rock Creek.
Geologic Information The Rock Creek watershed lies within the Escarpment physiographic sub-region, which is characterized by rugged topography. It defines the transition from the Mississippian Plateau to the Eastern Mountains Coal Field Region. Valleys are either steep-sided or cliffy and the ridges are narrow. This area is underlain by sandstone and shale of Pennsylvanian age ( US Department of Agriculture, 1964). Landuse Information Coal, oil, and natural gas are among the natural resources of McCreary County. Agriculture and silviculture are the main landuses in McCreary County. Mining disturbs small areas. Soils Information The Rock Creek watershed is dominated by nearly level loamy and clayey soils near to the mouth and level to steep loamy soils in the headwaters. Most of the watershed is Udorthents soil, which consists of strip mine spoil containing rock fragments. Mining History Mining activities in the Rock Creek Watershed have occurred since the 1940’s. A list of recent mining permits that have been issued for Rock Creek is provided in Table 1. Mining permits in Kentucky are classified on the basis of whether the original permit was issued prior to May 3, 1978 (pre-law permit), after January 18, 1983 (post-Kentucky primacy) or between these dates (interim period). An explanation of the permit numbering system is provided in Appendix A.
Table 1. Recent Mining Permits in the Rock Creek Watershed Permit Assoc. Company Area Date
# (acres) Issued 0745005 Ramex Mining Corporation 7.10 1/8/1981 2740069 The Sterns Company 19.00 4/24/1980 0745008 Ramex Mining Corporation 5.62 1/29/1981
3
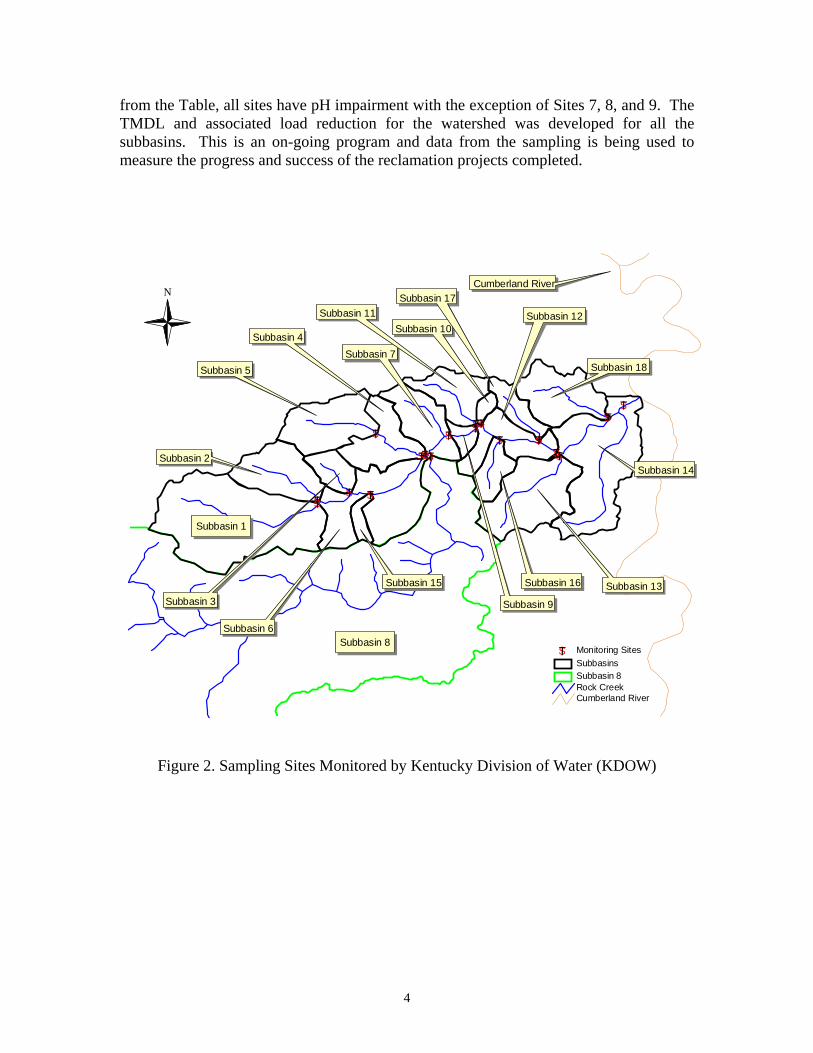
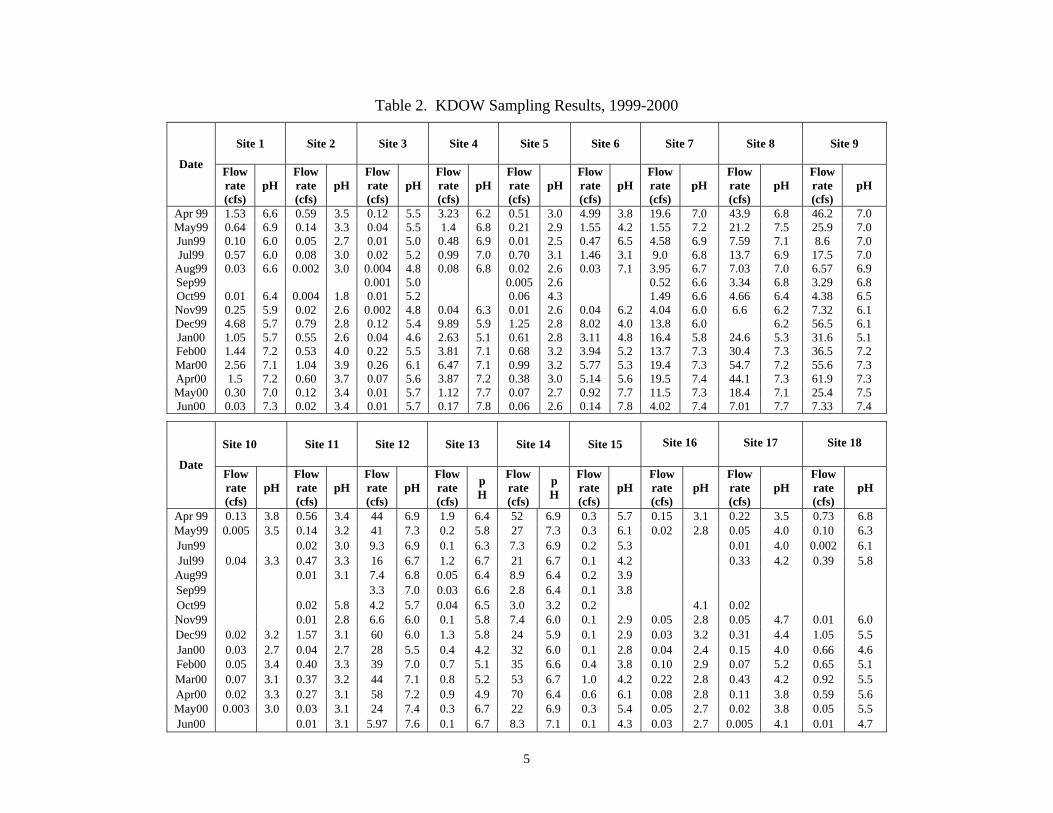
All permits are secured through reclamation bonds. A reclamation bond is a financial document submitted to the Kentucky Department of Surface Mining Reclamation and Enforcement (DSMRE) prior to mine permit issuance. A bond guarantees mining and reclamation operations will be conducted by mining companies according to regulations and the terms of the approved permit. If a coal company cannot comply with these conditions, the bond is "forfeited" (paid to the DSMRE) for eventual use by the Division of Abandoned Mine Lands (DAML) in reclaiming the mined area. Reclamation bonds may be submitted in the forms of cash, certificate of deposit, letter of credit or surety (insurance policy). A reclamation bond may be returned to a coal company by either of two methods: administrative or phase (on-ground reclamation). Administrative releases occur when new bonds are substituted for the original bonds. Administrative releases are also given for areas of a mine site, which are permitted but never disturbed by mining or for areas, which are included under a second more recently issued permit. Phase releases occur in three stages and according to specific reclamation criteria: Phase One – all mining is complete, and backfilling, grading and initial seeding of mined areas have occurred; Phase Two – a minimum of two years of growth on vegetated areas since initial seeding, the vegetation is of sufficient thickness to prevent erosion and pollution of areas outside the mine area with mine soils, and any permanent water impoundments have met specifications for future maintenance by the landowner; and Phase Three – a minimum of five years of vegetative growth since initial seeding and the successful completion of reclamation operations in order for the mined area to support the approved post-mining land use. Up to 60 percent of the original bond amount is released at Phase One. An additional 25 percent is returned at Phase Two, with the remainder of the reclamation bond released at Phase Three. Once a permit is released and the reclamation bond returned, the state cannot require additional remediation action by the mining company unless it is determined that fraudulent documentation was submitted as part of the remediation process. Monitoring History The waters of Rock Creek were monitored as early as 1978 by the Division of Water (KDOW) as reported in The Effects of Coal Mining Activities on the Water Quality of Streams in the Western and Eastern Coalfields of Kentucky, published in 1981 by the KDOW as part of an agreement with the DAML. In 1995, initial water sampling of over 41 mine portals by the DSMRE personnel identified the mine sites that were major contributors to the acid mine drainage (AMD) entering the Lower Rock Creek watershed. “Acid and metal loading was calculated for each portal and passive treatment options were explored using the water chemistry analysis for each portal discharge” (Carew et. al., 2003). In 1998, a biological and water-monitoring program began in the lower Rock Creek watershed at the sites indicated in Figure 2. The White Oak subwatershed consists of Subbasins 1, 2, 3, 4, 5, 6, and 15. A summary of the results obtained from these sites is shown in Table 2. As can be seen
4
from the Table, all sites have pH impairment with the exception of Sites 7, 8, and 9. The TMDL and associated load reduction for the watershed was developed for all the subbasins. This is an on-going program and data from the sampling is being used to measure the progress and success of the reclamation projects completed.
Figure 2. Sampling Sites Monitored by Kentucky Division of Water (KDOW)
$T$T$T
$T
$T
$T
$T
$T
$T$T$T
$T$T
$T
$T
$T $T
$T
Cumberland RiverRock Creek Subbasin 8Subbasins
$T Monitoring SitesSubbasin 8
Subbasin 1
Subbasin 2
Subbasin 5
Subbasin 4Subbasin 7
Subbasin 11Subbasin 10
Subbasin 9
Subbasin 16
Subbasin 17
Subbasin 12
Subbasin 13
Subbasin 18
Subbasin 3
Subbasin 14
Cumberland RiverN
Subbasin 6
Subbasin 15
5
Table 2. KDOW Sampling Results, 1999-2000
Site 1
Site 2
Site 3
Site 4
Site 5
Site 6
Site 7
Site 8
Site 9
Date Flow rate (cfs)
pH Flow rate (cfs)
pH Flow rate (cfs)
pH Flow rate (cfs)
pH Flow rate (cfs)
pH Flow rate (cfs)
pH Flow rate (cfs)
pH Flow rate (cfs)
pH Flow rate (cfs)
pH
Apr 99 1.53 6.6 0.59 3.5 0.12 5.5 3.23 6.2 0.51 3.0 4.99 3.8 19.6 7.0 43.9 6.8 46.2 7.0 May99 0.64 6.9 0.14 3.3 0.04 5.5 1.4 6.8 0.21 2.9 1.55 4.2 1.55 7.2 21.2 7.5 25.9 7.0 Jun99 0.10 6.0 0.05 2.7 0.01 5.0 0.48 6.9 0.01 2.5 0.47 6.5 4.58 6.9 7.59 7.1 8.6 7.0 Jul99 0.57 6.0 0.08 3.0 0.02 5.2 0.99 7.0 0.70 3.1 1.46 3.1 9.0 6.8 13.7 6.9 17.5 7.0
Aug99 0.03 6.6 0.002 3.0 0.004 4.8 0.08 6.8 0.02 2.6 0.03 7.1 3.95 6.7 7.03 7.0 6.57 6.9 Sep99 0.001 5.0 0.005 2.6 0.52 6.6 3.34 6.8 3.29 6.8 Oct99 0.01 6.4 0.004 1.8 0.01 5.2 0.06 4.3 1.49 6.6 4.66 6.4 4.38 6.5 Nov99 0.25 5.9 0.02 2.6 0.002 4.8 0.04 6.3 0.01 2.6 0.04 6.2 4.04 6.0 6.6 6.2 7.32 6.1 Dec99 4.68 5.7 0.79 2.8 0.12 5.4 9.89 5.9 1.25 2.8 8.02 4.0 13.8 6.0 6.2 56.5 6.1 Jan00 1.05 5.7 0.55 2.6 0.04 4.6 2.63 5.1 0.61 2.8 3.11 4.8 16.4 5.8 24.6 5.3 31.6 5.1 Feb00 1.44 7.2 0.53 4.0 0.22 5.5 3.81 7.1 0.68 3.2 3.94 5.2 13.7 7.3 30.4 7.3 36.5 7.2 Mar00 2.56 7.1 1.04 3.9 0.26 6.1 6.47 7.1 0.99 3.2 5.77 5.3 19.4 7.3 54.7 7.2 55.6 7.3 Apr00 1.5 7.2 0.60 3.7 0.07 5.6 3.87 7.2 0.38 3.0 5.14 5.6 19.5 7.4 44.1 7.3 61.9 7.3 May00 0.30 7.0 0.12 3.4 0.01 5.7 1.12 7.7 0.07 2.7 0.92 7.7 11.5 7.3 18.4 7.1 25.4 7.5 Jun00 0.03 7.3 0.02 3.4 0.01 5.7 0.17 7.8 0.06 2.6 0.14 7.8 4.02 7.4 7.01 7.7 7.33 7.4
Site 10 Site 11 Site 12 Site 13 Site 14 Site 15
Site 16
Site 17
Site 18
Date
Flow rate (cfs)
pH Flow rate (cfs)
pH Flow rate (cfs)
pH Flow rate (cfs)
pH
Flow rate (cfs)
pH
Flow rate (cfs)
pH Flow rate (cfs)
pH Flow rate (cfs)
pH Flow rate (cfs)
pH
Apr 99 0.13 3.8 0.56 3.4 44 6.9 1.9 6.4 52 6.9 0.3 5.7 0.15 3.1 0.22 3.5 0.73 6.8 May99 0.005 3.5 0.14 3.2 41 7.3 0.2 5.8 27 7.3 0.3 6.1 0.02 2.8 0.05 4.0 0.10 6.3 Jun99 0.02 3.0 9.3 6.9 0.1 6.3 7.3 6.9 0.2 5.3 0.01 4.0 0.002 6.1 Jul99 0.04 3.3 0.47 3.3 16 6.7 1.2 6.7 21 6.7 0.1 4.2 0.33 4.2 0.39 5.8
Aug99 0.01 3.1 7.4 6.8 0.05 6.4 8.9 6.4 0.2 3.9 Sep99 3.3 7.0 0.03 6.6 2.8 6.4 0.1 3.8 Oct99 0.02 5.8 4.2 5.7 0.04 6.5 3.0 3.2 0.2 4.1 0.02 Nov99 0.01 2.8 6.6 6.0 0.1 5.8 7.4 6.0 0.1 2.9 0.05 2.8 0.05 4.7 0.01 6.0 Dec99 0.02 3.2 1.57 3.1 60 6.0 1.3 5.8 24 5.9 0.1 2.9 0.03 3.2 0.31 4.4 1.05 5.5 Jan00 0.03 2.7 0.04 2.7 28 5.5 0.4 4.2 32 6.0 0.1 2.8 0.04 2.4 0.15 4.0 0.66 4.6 Feb00 0.05 3.4 0.40 3.3 39 7.0 0.7 5.1 35 6.6 0.4 3.8 0.10 2.9 0.07 5.2 0.65 5.1 Mar00 0.07 3.1 0.37 3.2 44 7.1 0.8 5.2 53 6.7 1.0 4.2 0.22 2.8 0.43 4.2 0.92 5.5 Apr00 0.02 3.3 0.27 3.1 58 7.2 0.9 4.9 70 6.4 0.6 6.1 0.08 2.8 0.11 3.8 0.59 5.6 May00 0.003 3.0 0.03 3.1 24 7.4 0.3 6.7 22 6.9 0.3 5.4 0.05 2.7 0.02 3.8 0.05 5.5 Jun00 0.01 3.1 5.97 7.6 0.1 6.7 8.3 7.1 0.1 4.3 0.03 2.7 0.005 4.1 0.01 4.7
6
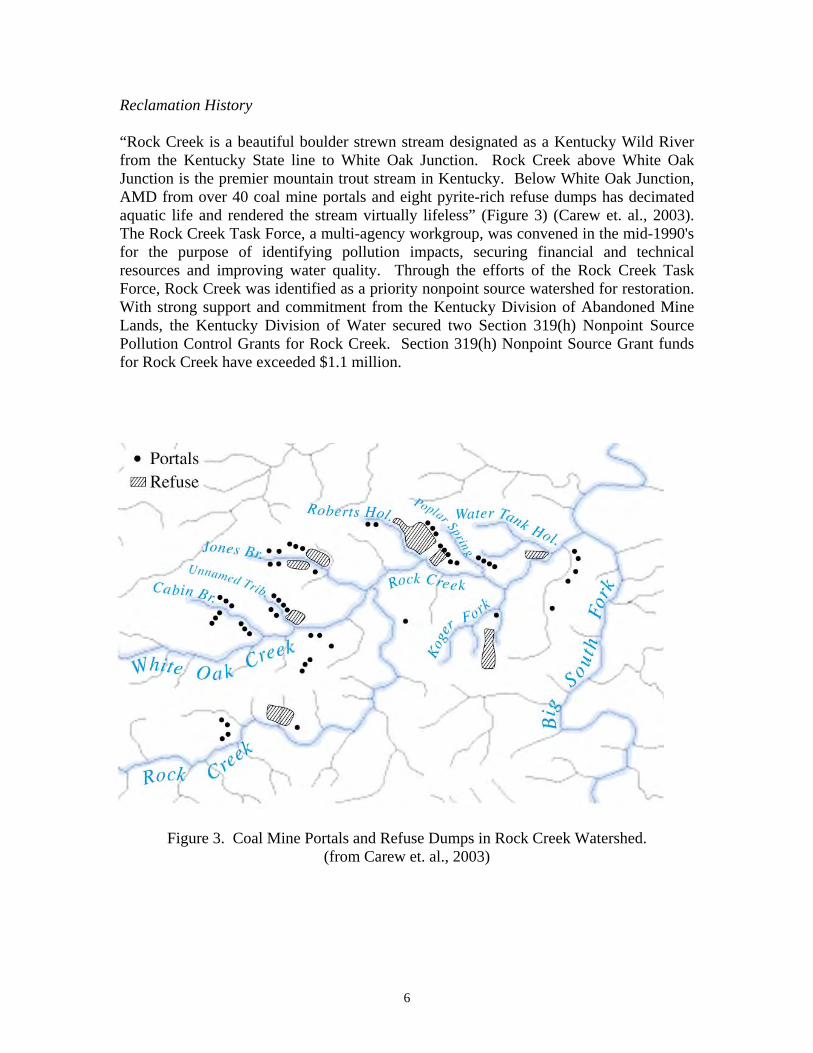
Reclamation History “Rock Creek is a beautiful boulder strewn stream designated as a Kentucky Wild River from the Kentucky State line to White Oak Junction. Rock Creek above White Oak Junction is the premier mountain trout stream in Kentucky. Below White Oak Junction, AMD from over 40 coal mine portals and eight pyrite-rich refuse dumps has decimated aquatic life and rendered the stream virtually lifeless” (Figure 3) (Carew et. al., 2003). The Rock Creek Task Force, a multi-agency workgroup, was convened in the mid-1990's for the purpose of identifying pollution impacts, securing financial and technical resources and improving water quality. Through the efforts of the Rock Creek Task Force, Rock Creek was identified as a priority nonpoint source watershed for restoration. With strong support and commitment from the Kentucky Division of Abandoned Mine Lands, the Kentucky Division of Water secured two Section 319(h) Nonpoint Source Pollution Control Grants for Rock Creek. Section 319(h) Nonpoint Source Grant funds for Rock Creek have exceeded $1.1 million.
Figure 3. Coal Mine Portals and Refuse Dumps in Rock Creek Watershed.
(from Carew et. al., 2003)
7
“The impacted area of the Rock Creek watershed includes White Oak Creek from Cabin Branch downstream to the confluence with Rock Creek at White Oak Junction, as well as Rock Creek from White Oak Junction to the confluence with the Big South Fork. All tributaries to White Oak Creek and this portion of Rock Creek are included. The reclamation project sites are located within the impacted area specifically in Cabin Branch, Cooperative North Portal, Jones Branch, and an unnamed tributary on White Oak Creek; and in Roberts Hollow, Paint Cliff, Poplar Spring Hollow, Koger Fork, and the mouth of Water Tank Hollow on Rock Creek.” (Carew et. al., 2003). In 1998, “acid loadings were calculated for each tributary and in the spring of 2000 dosing of selected tributaries with sand-sized limestone particles began. Within two months, the flow out of Rock Creek into the Big South Fork of the Cumberland River changed from net acidic to net alkaline. After four months, similar results were obtained in White Oak Creek, a major source of AMD to Rock Creek.” (Carew et. al., 2003). The reclamation projects for the Rock Creek watershed were completed in two distinct phases and a summary of these phases is below. Phase I “In the fall of 2000, construction began on a reclamation project targeting several of the worst AMD sites in the lower Rock Creek watershed. Pyrite-rich refuse was removed from the banks of Rock Creek. Open limestone channels were installed routing AMD through the limestone before discharging into the stream, and a modified vertical flow wetland was installed at a site with limited distance between the AMD source and the receiving stream. Dosing with limestone sand continued monthly with permanent dosing stations being established farther upstream in the impacted tributaries.” (Carew et. al., 2003). The total cost for this phase of the reclamation project was $650,000. Phase II “In the fall of 2002, with the procurement of additional funding, construction began on Phase II of the Rock Creek Watershed Reclamation Project. Additional open limestone channels were installed routing AMD from mine portals to the receiving streams. Limestone channel lining was placed directly into four severely impacted tributaries of Rock Creek, treating the AMD before it enters Rock Creek. A two-acre landslide was stabilized and revegetated, and an on-bench acidic pond was eliminated. Dosing of the tributaries with sand-sized limestone particles was reduced as the reclamation in the tributaries was accomplished.” (Carew et. al., 2003). The total cost for this phase of the reclamation project was $750,000.
8
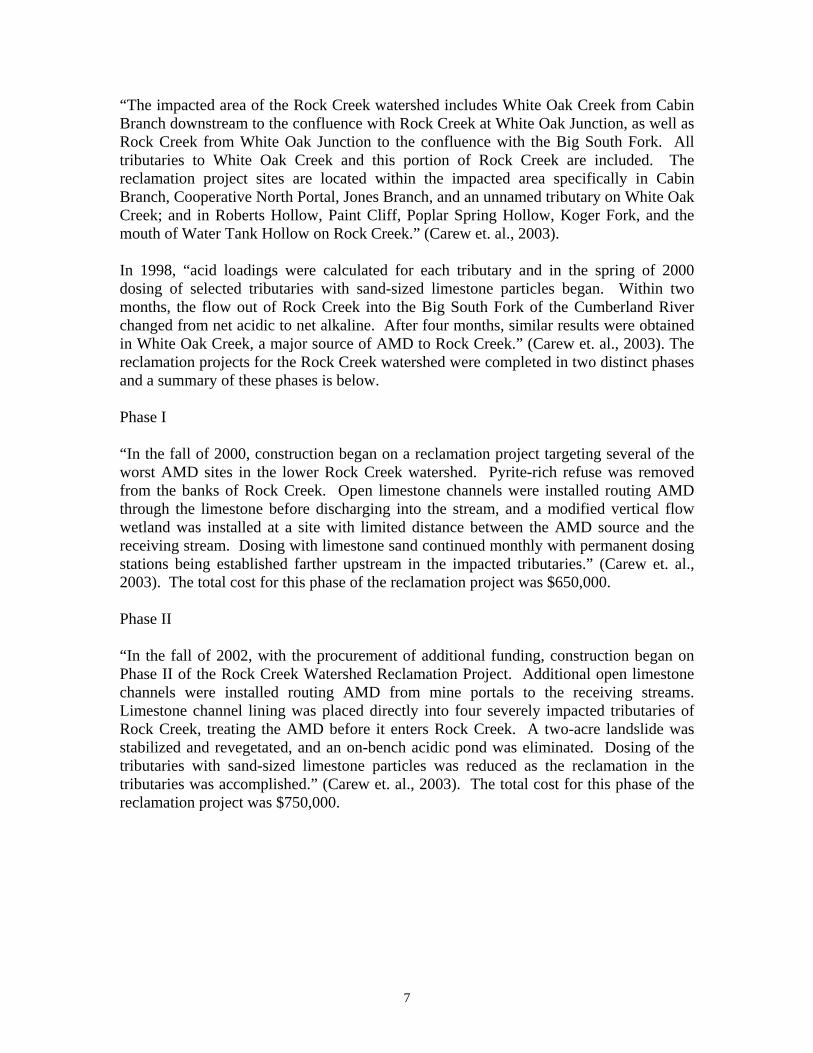
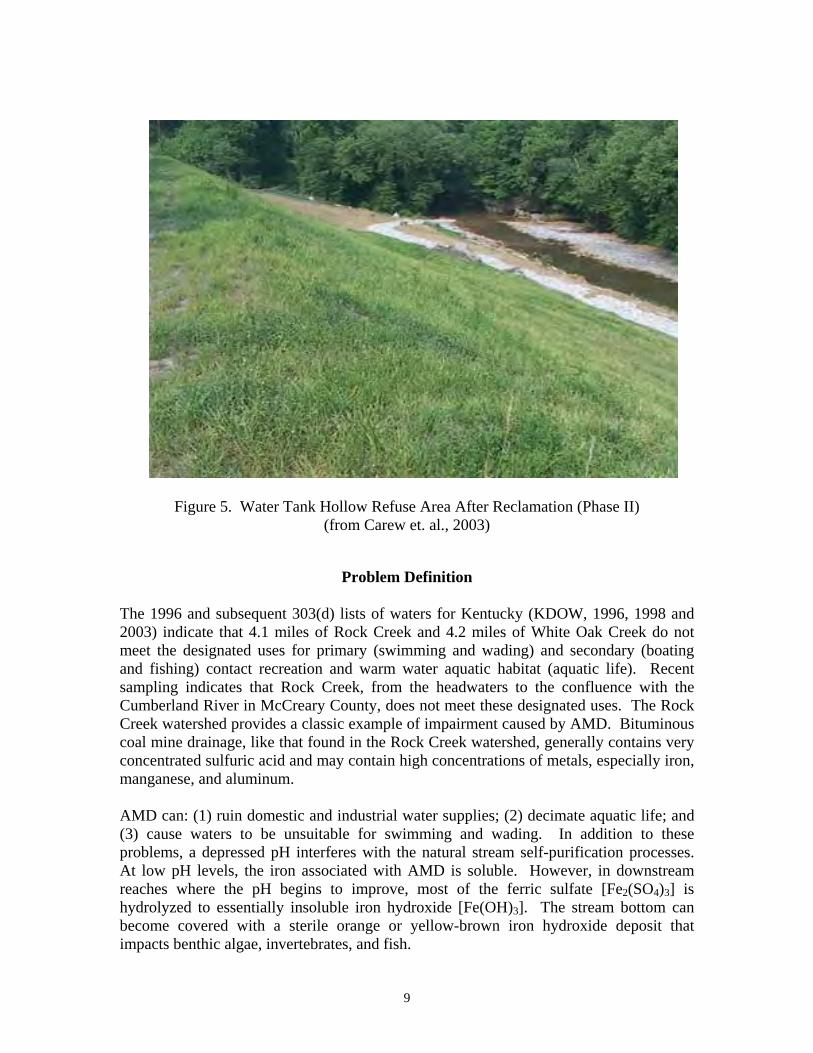
Summary of Activities Techniques used to accomplish the goals of reclamation include monthly dosing with limestone sand, removal and treatment of acidic refuse from the banks of Rock Creek, installation of open limestone channels, and installation of a modified vertical flow system at Paint Cliff. A summary of the reclamation activities completed under both Phase I and Phase II are given below, also see Figure 4 and Figure 5.
80,000 tons of limestone installed in watershed (30,000 Phase I & 50,000 Phase II) 25,000 cubic yards of refuse excavated from banks of Rock Creek (Phase I) 20,000 feet of limestone channel installed (7,000 Phase I & 13,000 Phase II) Vertical Flow System Installed at Paint Cliff (Phase I) 20 Acres of acidic refuse reclaimed (17 acres Phase I & 3 acres Phase II) 2 Acres of landslides reclaimed (Phase II) Total Construction Cost $1,400,000 ($650,000 Phase I, $750,000 Phase II) Acid loading from Rock Creek into the Big South Fork of the Cumberland River has been reduced from a monthly average of 121 tons to near zero after these projects (Carew et. al., 2003).
Figure 4. Paint Cliff Vertical Flow System Components (Phase I)
(from Carew et. al., 2003)
9
Figure 5. Water Tank Hollow Refuse Area After Reclamation (Phase II)
(from Carew et. al., 2003)
Problem Definition
The 1996 and subsequent 303(d) lists of waters for Kentucky (KDOW, 1996, 1998 and 2003) indicate that 4.1 miles of Rock Creek and 4.2 miles of White Oak Creek do not meet the designated uses for primary (swimming and wading) and secondary (boating and fishing) contact recreation and warm water aquatic habitat (aquatic life). Recent sampling indicates that Rock Creek, from the headwaters to the confluence with the Cumberland River in McCreary County, does not meet these designated uses. The Rock Creek watershed provides a classic example of impairment caused by AMD. Bituminous coal mine drainage, like that found in the Rock Creek watershed, generally contains very concentrated sulfuric acid and may contain high concentrations of metals, especially iron, manganese, and aluminum. AMD can: (1) ruin domestic and industrial water supplies; (2) decimate aquatic life; and (3) cause waters to be unsuitable for swimming and wading. In addition to these problems, a depressed pH interferes with the natural stream self-purification processes. At low pH levels, the iron associated with AMD is soluble. However, in downstream reaches where the pH begins to improve, most of the ferric sulfate [Fe2(SO4)3] is hydrolyzed to essentially insoluble iron hydroxide [Fe(OH)3]. The stream bottom can become covered with a sterile orange or yellow-brown iron hydroxide deposit that impacts benthic algae, invertebrates, and fish.
10
The sulfuric acid in AMD is formed by the oxidation of sulfur contained in the coal and the rock or clay found above and below the coal seams. Most of the sulfur in the unexposed coal is found in a pyritic form as iron pyrite and marcasite (both having the chemical composition FeS2). In the process of mining, the iron sulfide (FeS2) is uncovered and exposed to the oxidizing action of oxygen in the air (O2), water, and sulfur-oxidizing bacteria. The end products of the reaction are as follows: 4 FeS2 + 14 O2 + 4 H20 + bacteria → 4 Fe + SO4 + 4 H2SO4 (1) The subsequent oxidation of ferrous iron and acid solution to ferric iron is generally slow. The reaction may be represented as: 4 FeSO4 + O2 + 2 H2SO4 → 2 Fe2(SO4)3 + 2 H2O (2) As the ferric acid solution is further diluted and neutralized in a receiving stream and the pH rises, the ferric iron [Fe3+ or Fe2(SO4)3] hydrolyses and ferric hydroxide [Fe(OH)3 ] may precipitate according to the reaction:
2 Fe2(SO4)3 + 12 H2O → 4 Fe(OH)3 + 6 H2SO4 (3) The brownish yellow ferric hydroxide (Fe(OH)3) may remain suspended in the stream even when it is no longer acidic. Although the brownish, yellow staining of the stream-banks and water doesn't cause the low pH, it does indicate that there has been production of sulfuric acid. The overall stoichiometric relationship is shown in equation (4): 4 FeS2 + 15 O2 + 14 H2O ←→ 8 H2SO4 + 4 Fe(OH)3 (4) This reaction (eqn. 4) indicates that a net of 4 moles of H+ are liberated for each mole of pyrite (FeS2) oxidized, making this one of the most acidic weathering reactions known.
Target Identification
The endpoint or goal of a pH TMDL is to achieve a pH concentration and associated hydrogen ion load in lbs/day that supports aquatic life and recreation uses. The pH criterion to protect these uses is in the range of 6.0 to 9.0 (Title 401, Kentucky Administrative Regulations, Chapter 5:031). For a watershed impacted by AMD, the focus will be on meeting the lower criterion. Water quality criteria have not been specified in terms of a particular frequency of occurrence. As pointed out in the recent NRC TMDL report (2001), “All chemical criteria should be defined in terms of magnitude, frequency, and duration. Each of these three components is pollutant-specific and may vary with season. The frequency component should be expressed in terms of a number of allowed flow excursions in a specified period (return period) and not in terms
11
of the low flow or an absolute “never to be exceeded” limit. Water quality criteria may occasionally be exceeded because of the variability of natural systems and discharges from point and nonpoint sources.” Small intermittent streams are especially vulnerable to this variability. The Technical Support Document for Water Quality-Based Toxic Control (EPA, 1991b) states that daily receiving water concentrations (loads) can be ranked from the lowest to the highest without regard to time sequence. In the absence of continuous monitoring, such values can be obtained through continuous simulation or monte-carlo analysis. A probability plot can be constructed from these ranked values, and the frequency of occurrence of any 1-day concentration of interest can be determined. Where the frequency (or probability) of the resulting concentration is greater than the maximum exceedance frequency of the water quality target (e.g. once in 10 years), associated load reductions will be required until the resulting concentration is above the minimum target value (e.g. pH = 6.0). Where the load and the associated target value can be directly related through a flow rate (also referred to as discharge or streamflow), the frequency (or probability) of the associated flow rate (e.g. 365Q10) can be directly related to the frequency (or probability) of the target pH. In recognition of the inherent difficulties associated with imposition of a “no-exceedance” pH criteria on potentially intermittent streams, the KDOW has decided to use the lowest one year average daily discharge of the most recent 10-year flow record as the flow basis for setting the appropriate TMDL and associated load reduction. Previous pH-TMDLs have used a 3-year recurrence interval of the average flow as the critical flow. However, this flow resulted in a target discharge that frequently was significantly greater than any of the observed flows for the sites as collected over several years. Thus use of a 3-year flow would require an extrapolation of the observed ion vs. flow model, well beyond the upper limit of the observed data. The selection of the 10-year frequency was based on a consideration of water quality standards (WQSs) (i.e. 7Q10). However, since many of these streams have a 7Q10 of zero, a greater duration was needed. The consensus of the KDOW was to use the 1-year duration. Use of an average daily flow over a one year period as the basis for determining the TMDL provides an appropriate mechanism for determining: (1) the total annual load; (2) the total annual reduction that would be derived from an annual summation of both the daily TMDLs; and (3) the associated daily load reductions for the critical year using the actual historical daily flows. The equivalent total annual load can be determined by simply multiplying the TMDL (derived by using the average daily flow) by 365 days. Likewise, the equivalent total annual load reduction can be obtained by multiplying the average daily load reduction (derived by using the average daily flow over a one year period) by 365 days. Although the 10-year lowest average annual flow (which roughly corresponds to the 365Q10) is typically only exceeded by approximately 20% of the days in the critical year, it still provides for explicit load reductions for approximately 80% of the total annual flow. For actual daily flows less than average flow, incremental load reductions may be accomplished by explicit imposition of a pH standard of 6 units.
12
Source Assessment Point Source Loads During the 1999-2000 sampling period, there were no active permitted point source loads contributing to the existing pH violations in the watershed. Nonpoint Source Loads Previous monitoring has been performed in the Rock Creek watershed in conjunction with mining permits. The historic pH readings at these sites indicate severe impairment to the Rock Creek waters. In 1998, a biological and water-monitoring program began in the lower Rock Creek watershed at the sites indicated in Figure 2. A summary of the results obtained from these sites is shown in Table 2. As can be seen from the Table, all sites have pH impairment with the exception of Sites 7, 8, and 9.
TMDL Development Theory The TMDL is a term used to describe the maximum amount of a pollutant a stream can assimilate without violating WQSs, and it includes a MOS. The units of a load measurement are mass of pollutant per unit time (i.e. mg/hr, lbs/day). In the case of pH there is no direct associated mass unit (pH is measured in Standard Units). The TMDL is comprised of the sum of individual wasteload allocations (WLAs) for point sources, and load allocations (LAs) for both nonpoint sources and natural background levels for a given watershed. The sum of these components may not result in exceedance of WQSs for that watershed. In addition, the TMDL must include a MOS, either implicitly or explicitly, that accounts for the uncertainty in the relation between pollutant loads and the quality of the receiving water body. Conceptually, this definition is denoted by the equation:
TMDL = Sum (WLAs) + Sum (LAs) + MOS (8) Margin of Safety The MOS is part of the TMDL development process (Section 303(d)(1)(C) of the Clean Water Act). There are two basic methods for incorporating the MOS (EPA, 1991):
1) Implicitly incorporate the MOS using conservative model assumptions to develop allocations, or
13
2) Explicitly specify a portion of the total TMDL as the MOS using the remainder for allocations.
Model Development The magnitude of the associated hydrogen ion load in a water column (in terms of activity) can be determined by measuring the pH of the water. The relationship between hydrogen load and pH can be expressed as follows:
{H3O+} = 10-pH or more commonly {H+} = 10-pH (5)
Where pH is the negative log of the H+ ion activity in mol/L. To convert between the measured activity {H+} and the actual molar concentration [H+], the activity is divided by an activity coefficient, γ.
[H+] = {H+}/γ (6)
The activity coefficient, γ, is dependent on the ionic strength µ of the source water under consideration. The ionic strength of a given source water can be approximated by estimating the TDS (total dissolved solids in mg/liter or ppm) and applying the following relationship (Snoeyink and Jenkins, 1980):
µ = (2.5 * 10-5) * TDS (7) Alternatively, the ionic strength of a given source of water may be related to the measured specific conductance (SC) through the following relationship (Snoeyink and Jenkins, 1980):
µ = (1.6 * 10-5) * SC (8)
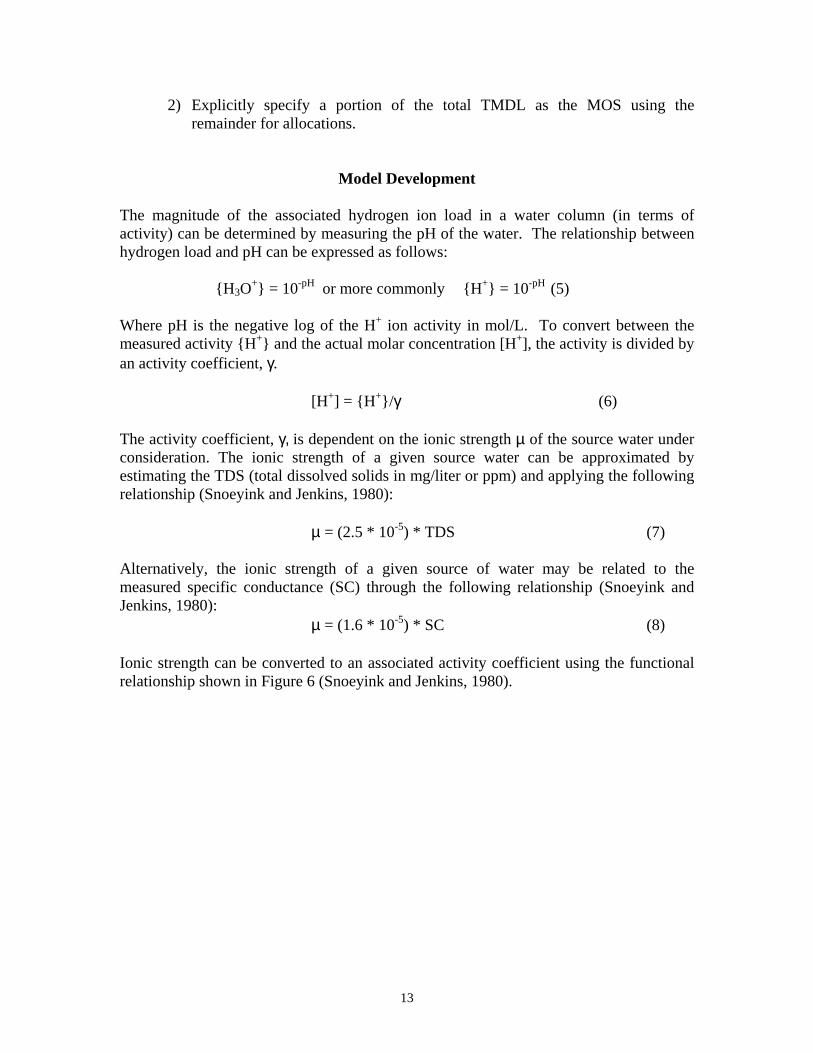
Ionic strength can be converted to an associated activity coefficient using the functional relationship shown in Figure 6 (Snoeyink and Jenkins, 1980).
14
Figure 6. Activity Coefficients of H+ as a Function of Ionic Strength (Snoeyink and Jenkins, 1980)
In the absence of actual measured values of TDS or specific conductance, an estimate of the upper limit of the ionic strength may be obtained from an evaluation of historic values of TDS or specific conductance collected in the area. For example, an evaluation of over 141 measurements of specific conductance obtained from streams in three eastern Kentucky counties (McCreary, Whitley, and Pulaski) revealed a range of values from 3 to 3660 µ ohms/cm. Use of an upper limit of 3660 µ ohms/cm yields an ionic strength of 0.0586 or approximately 0.06. Use of a value of ionic strength of 0.06 yields an activity coefficient of approximately 0.85. For the Rock Creek watershed, specific conductance values were observed to vary from 7 to 3660 µ ohms/cm, which yields ionic strength values from 0.0001 to 0.0586 respectively. Application of Figure 6 for the observed ionic strengths in Rock Creek yields activity coefficients of approximately 0.99 to 0.85. The atomic weight of hydrogen is one gram per mole. Thus, the concentration of hydrogen ions in mol/L is also the concentration in g/L. Multiplying the concentration of hydrogen ions by the average flow rate for a given day results in a hydrogen ion load for that day in grams/day. As a result, for any given flow rate there is a maximum ion load that the stream can assimilate before a minimum pH value of 6.0 is violated. Thus, for any given day a TMDL may be calculated for that day using the average daily flow and a minimum pH standard of 6 units. Because pH and the equivalent hydrogen ion load can be related as a function of flow rate and ionic strength, a functional relationship can be developed between flow rate and the associated ion loading for a given pH value. By specifying a minimum pH value (6.0)
0.0001
0.001
0.01
0.1
0.830.850.870.890.910.930.950.970.99
Activity Coefficient,
Ioni
c S
treng
th¬
γ
15
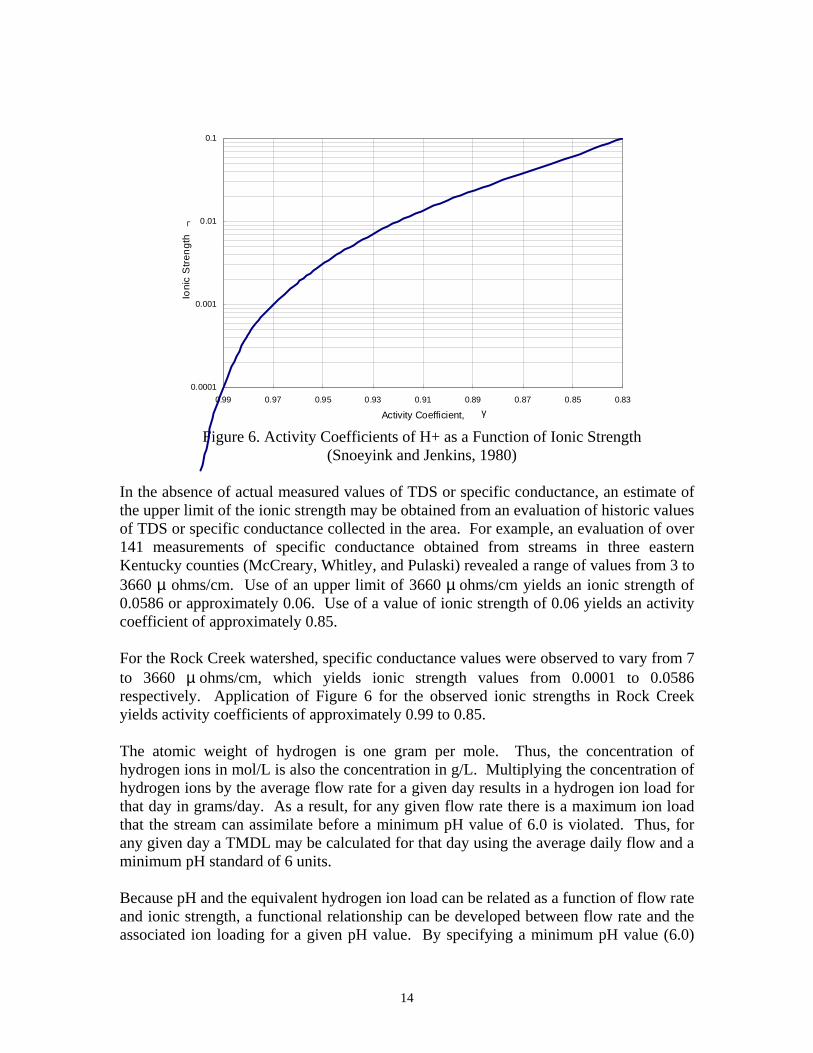
and an associated minimum activity correction factor (0.85), an envelope of maximum hydrogen ion loads that could still yield a pH of 6 may be obtained as a function of flow rate (see the upper TMDLx curve in Figure 7). In using the proposed methodology, the MOS may be incorporated explicitly through the properties of water chemistry that determine the relationship between pH and hydrogen ion concentration. In an electrically neutral solution, the activity coefficient (γ in equation 6) is assumed to be equal to 1.0, meaning that there is no quantitative difference between activity and molar concentration. In the case of AMD there obviously exists the possibility of additional ions in the water column that may affect the relationship between the measured activity and the associated ion load. To develop a TMDL for an impaired stream, the most conservative approach would be to assume an activity coefficient of 1.0, which would yield the lowest value for the TMDL for a given range of activity coefficients (see lower TMDL1 curve in Figure 7). The difference between the maximum TMDLx (based on the observed activity coefficient) and the minimum TMDL1 (based on an activity coefficient of 1.0) would provide a margin of safety (MOS) in setting the TMDL for the stream as well as for calculating the associated load reduction. In developing a TMDL for the Rock Creek Watershed, the TMDL for each of the Subbasins 1 through 18 will be established assuming an activity coefficient of 1.0, while the observed load will be determined using an activity coefficient of 0.85, providing for an upper limit of a MOS of approximately 15 percent. Even though this MOS can be deemed as an explicit MOS, for this TMDL it will be expressed as an implicit MOS because a conservative assumption has been used to determine the value of the TMDL.
0
50
100
150
200
250
300
350
0 20 40 60 80 100 120Discharge (cfs)
H+
ion
load
ing
(g/d
)
Figure 7. Relation Between Flow (Discharge) and Maximum Ion Load for a pH of 6.0
} MOS Observed TMDLX
Enforced TMDL1
16
Hydrogen Loading Example Calculation
In order to demonstrate the hydrogen loading conversion procedure, use the following data for Subbasin 14 (Site 14) of Rock Creek: • Critical discharge (Q) = 76.17 cfs (cumulative upstream area of 62.67 mi2) • Measured pH = 6.0 The pH can be converted to a mole/liter measurement (i.e. moles [H+]/liter) by applying the following relationship: pH = -log {H+} The resulting moles of hydrogen are the anti-log of -6.0, which is 0.000001 moles/liter. The units need to be converted into grams/cubic ft. This is accomplished by applying the following conversion factors: • There is one gram per mole of hydrogen. • 1 liter = 0.035314667 cubic feet (0.000001 moles/liter)*(1 gram/mole)*(1liter/0.035314667 ft3) = 0.0000283168 g/ft3 The goal is to achieve a loading rate in terms of g/day, or lbs/day. If the amount of hydrogen in grams/cubic foot is multiplied by the given flow rate in cubic feet/second and a conversion factor of 86,400 s/day, then the load is computed as: (0.0000283168 g/ft3)*(76.17 ft3/s)*(86400s/1day) = 186.36 g/day, or 0.4109 lbs/day Assuming an activity correction factor of 0.85, the maximum load is 219.25 g/day, or 0.4834 lbs/day: 186.36 g/day / 0.85 = 219.25 g/day, or 0.4834 lbs/day Thus, by using an activity coefficient of 1.0 instead of 0.85 to develop the TMDL values, a MOS of approximately 15 percent is assumed.
Critical Flow and TMDL Determination Because maximum hydrogen ion loading values can be directly related to flow rate (Figure 7), the associated allowable ion loading exceedance frequency can be directly related to the frequency of the flow. In order to find the lowest 10-year average annual discharge for the Rock Creek watershed, a regional hydrologic frequency analysis was used. Regional analysis can be used to develop an inductive model using data collected at streamflow gaging stations that are located in the same hydrologic region as the watershed of interest. For this study, the following US Geological Survey (USGS)
17
gaging stations were selected: 03400500, 03402000, and 03304500. The data from these gages were used to estimate the lowest average annual flows of the most recent 10 years (Table 3). Because there were no gaging stations that had a contributing drainage area comparable to the subbasins in this watershed under study and for which data was available for the last 10 years, historic data (1950-1960) were used in developing the regional flow-area curve. These flows were then regressed with watershed area to produce Figure 8. Using this figure, the lowest 10-year mean annual flow for a given watershed area can be readily determined.
Table 3. Lowest 10-year Mean Annual Flow Rates (cfs) for Stations in Regional Analysis
USGS Gaging Station Numbers Station 03304500 03402000 03400500
Area (mi2) 2.14 60.6 82.3 Q (cfs) 1.02 78.9 96.2
Figure 8. Relation Between Basin Area and the Critical Flow Application of Figure 8 for the Rock Creek watershed yields a TMDL critical average annual flow for all the subbasins in this watershed for which a TMDL will be developed. An example calculation for flow for Subbasin 14 is 1.2154 x 62.67 = 76.17. Application of these critical flows (the lowest 10-year mean annual flow) with the lower TMDL1 curve in Figure 7 yields a TMDL for Subbasins 1 though 18 (See Hydrogen Loading Example Calculation on page 16 for an example calculation for Subbasin 14). These results are summarized in Table 4. The incremental TMDL is calculated by subtracting the cumulative TMDL for all directly contributing subbasins from the cumulative TMDL for the subbasin of interest. For example, the incremental TMDL for Subbasin 14 is calculated by subtracting the cumulative TMDL for Subbasins 12, 13, and 18 from that of Subbasin 14 (0.4109 – 0.3836 – 0.0084 – 0.0060 = 0.0129).
Regional Flow Analysis
y = 1.2154xR2 = 0.9913
0
20
40
60
80
100
120
0 10 20 30 40 50 60 70 80 90
Area (sq mi)
Flow
(cfs
)
18
Table 4. Incremental Critical Flow and Corresponding TMDL for Subbasins 1 – 18 Sub-basin
Cumulative Area (mi2)
Incremental Area (mi2)
Cumulative Q (cfs)
Incremental Q (cfs)
Cumulative TMDL
(lbs/day)
Incremental TMDL
(lbs/day) 1 2.77 2.77 3.37 3.37 0.0182 0.0182 2 0.88 0.88 1.07 1.07 0.0057 0.0057 3 0.34 0.34 0.41 0.41 0.0022 0.0022 4 1.75 0.76 2.13 0.92 0.0115 0.0050 5 0.99 0.99 1.21 1.21 0.0065 0.0065 6 7.38 1.49 8.97 1.81 0.0484 0.0098 7 56.21 0.75 68.31 0.91 0.3685 0.0049 8 48.08 48.08 58.44 58.44 0.3153 0.3153 9 56.37 0.16 68.51 0.19 0.3696 0.0010 10 0.10 0.10 0.12 0.12 0.0007 0.0007 11 0.64 0.64 0.78 0.78 0.0042 0.0042 12 58.51 0.67 71.11 0.82 0.3836 0.0044 13 1.28 1.28 1.56 1.56 0.0084 0.0084 14 62.67 1.96 76.17 2.39 0.4109 0.0129 15 0.15 0.15 0.18 0.18 0.0010 0.0010 16 0.37 0.37 0.45 0.45 0.0024 0.0024 17 0.35 0.35 0.43 0.43 0.0023 0.0023 18 0.91 0.91 1.11 1.11 0.0060 0.0060
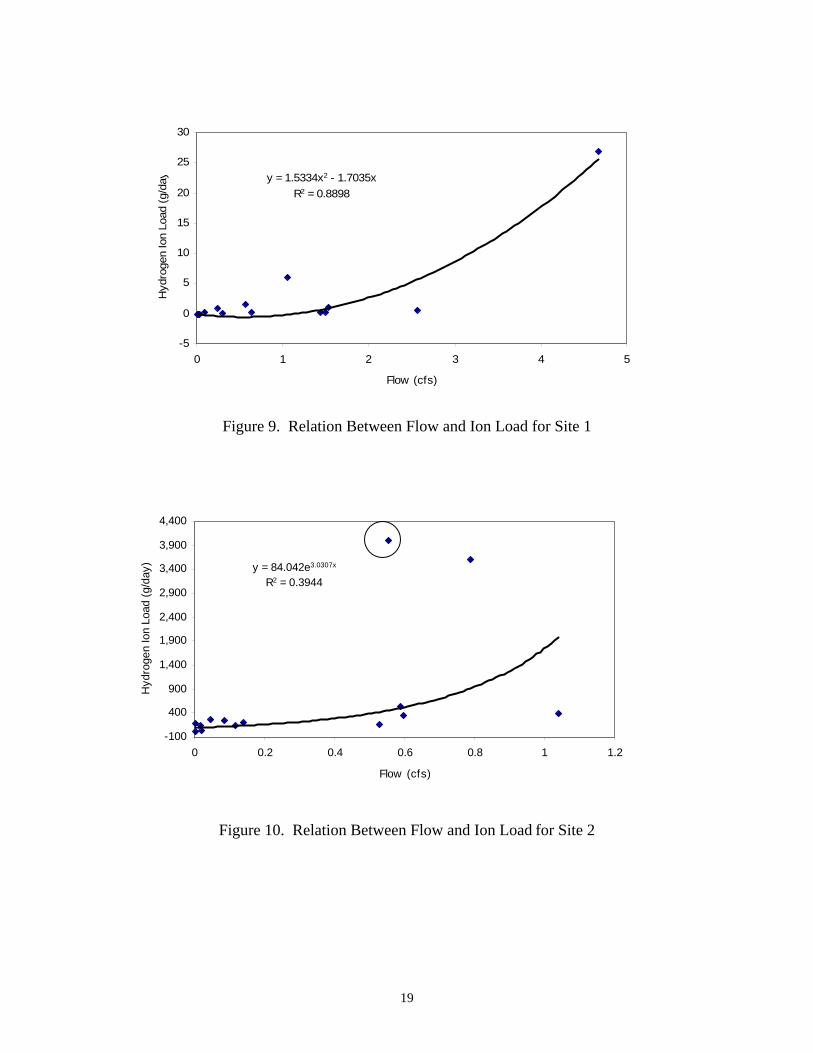
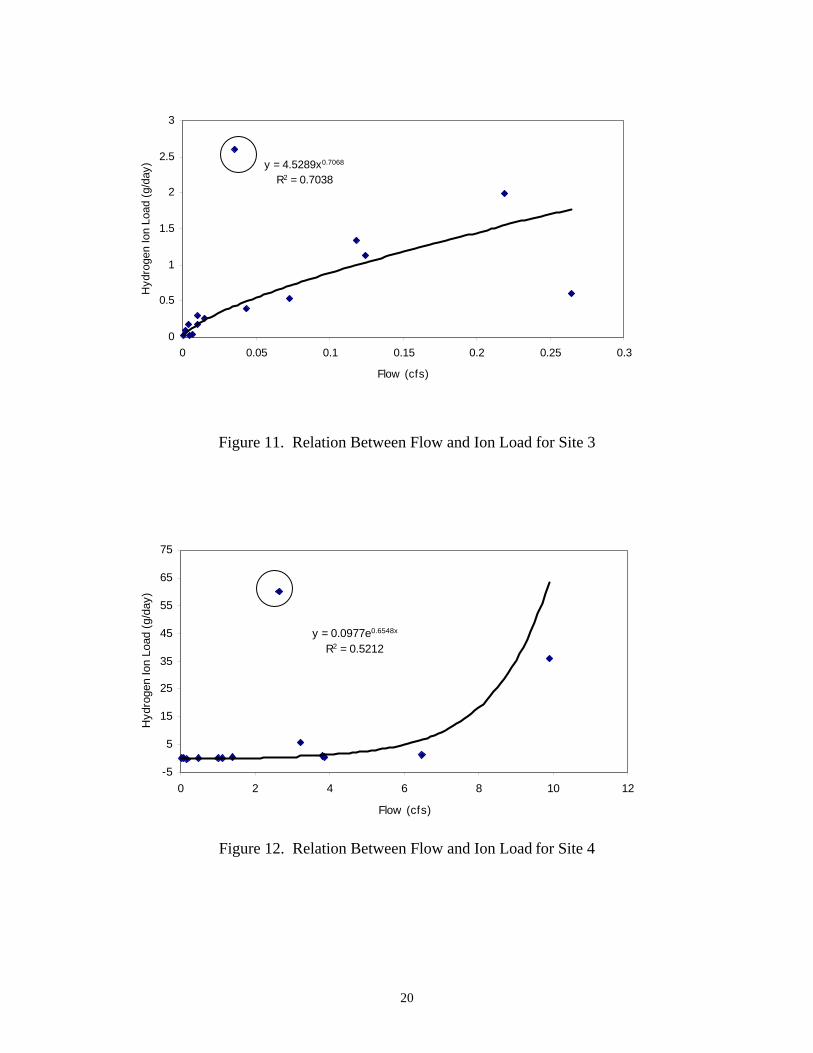
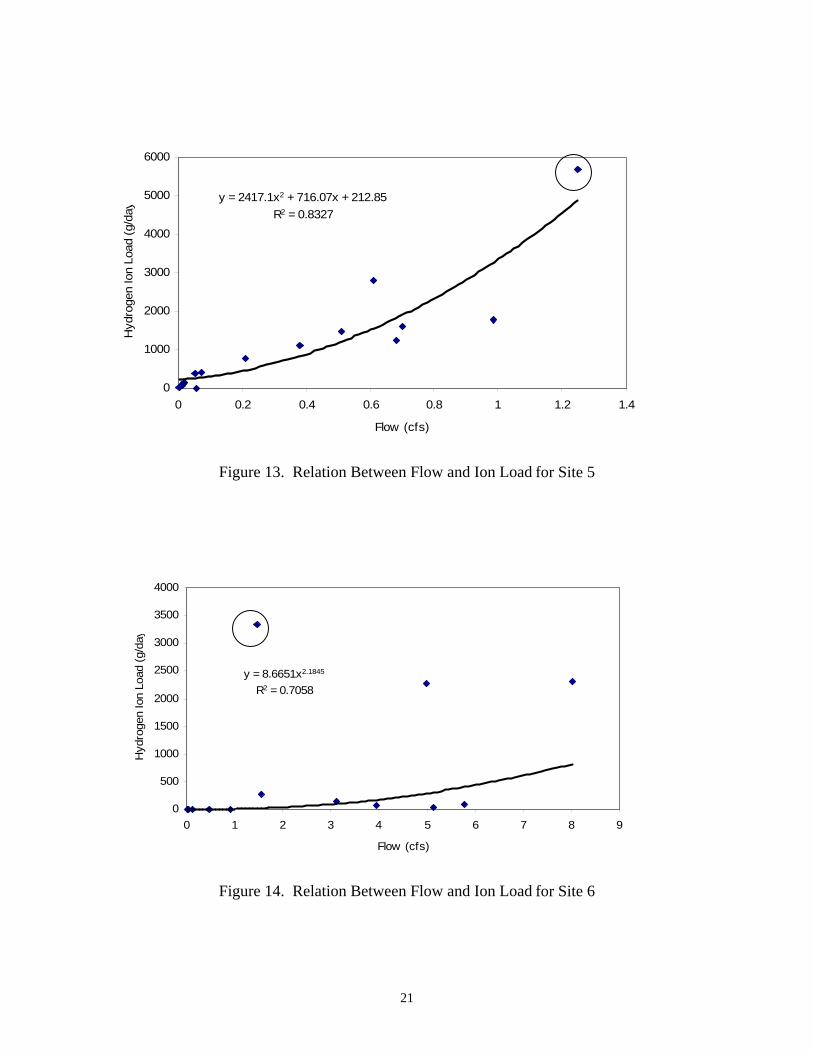
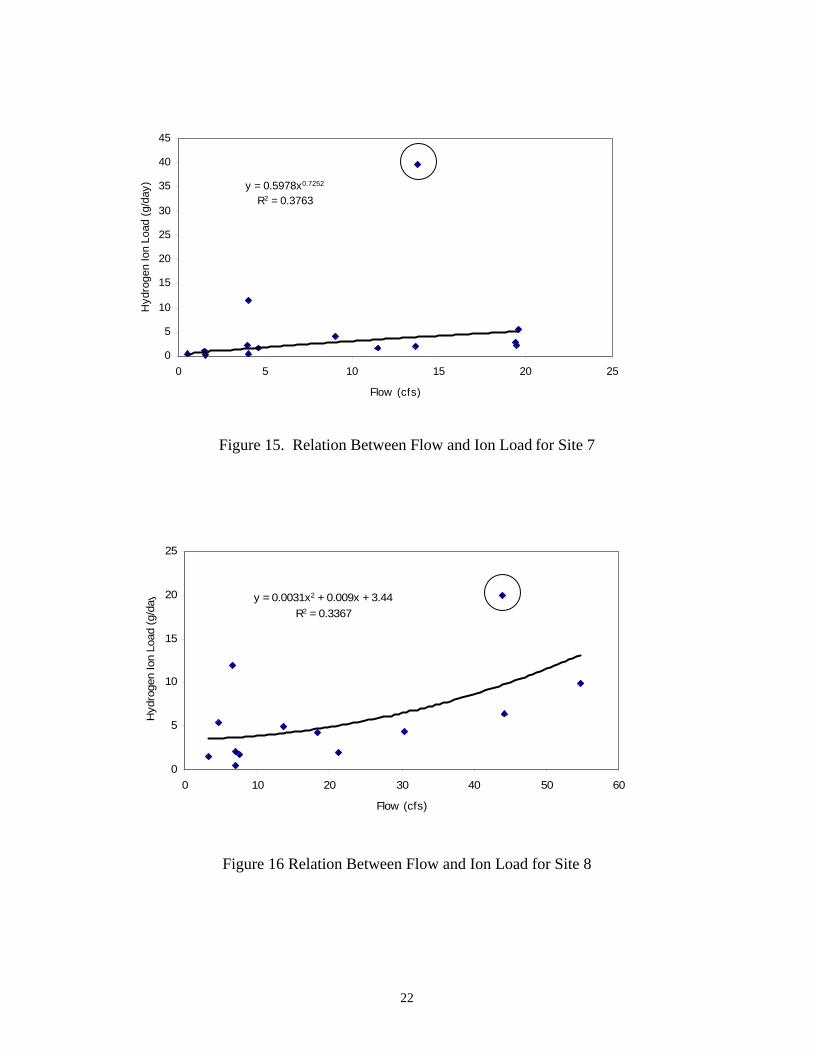
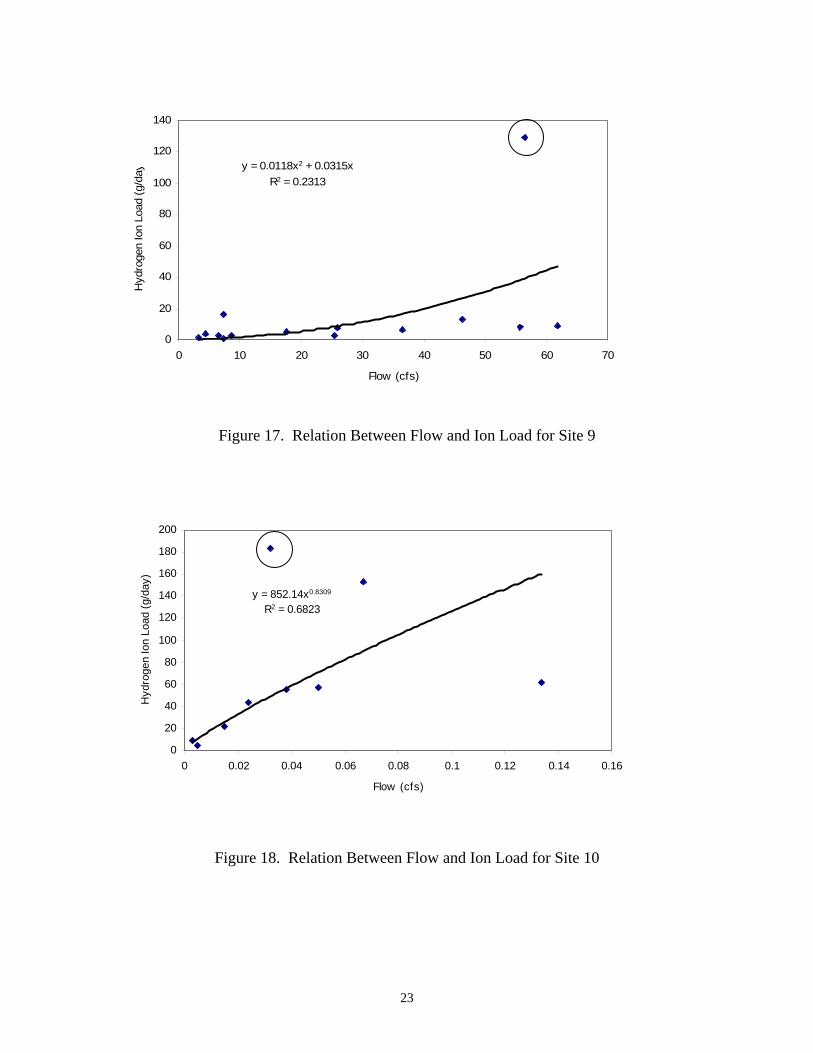
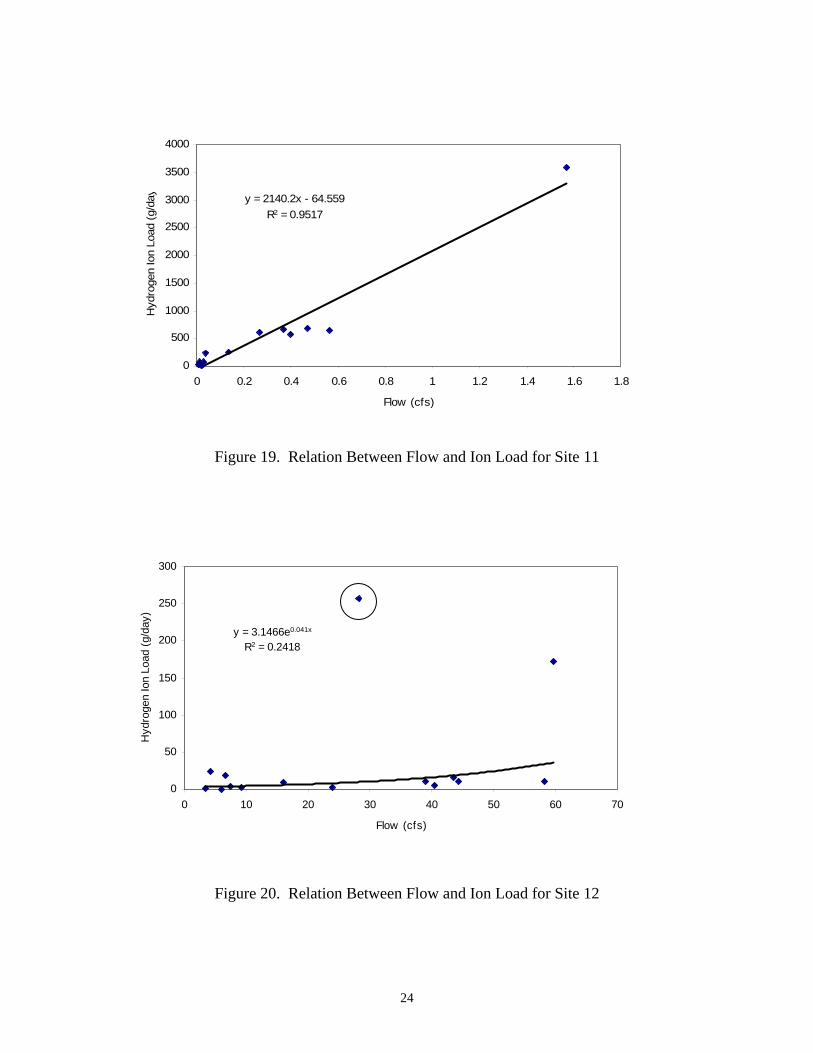
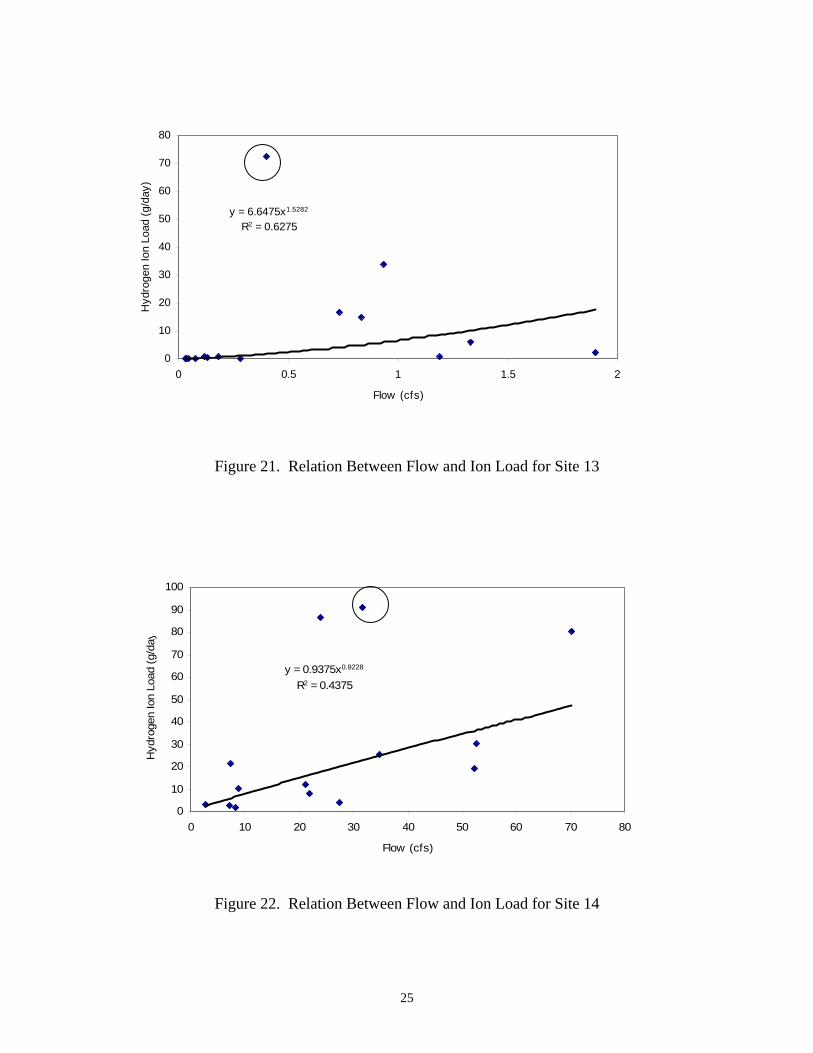
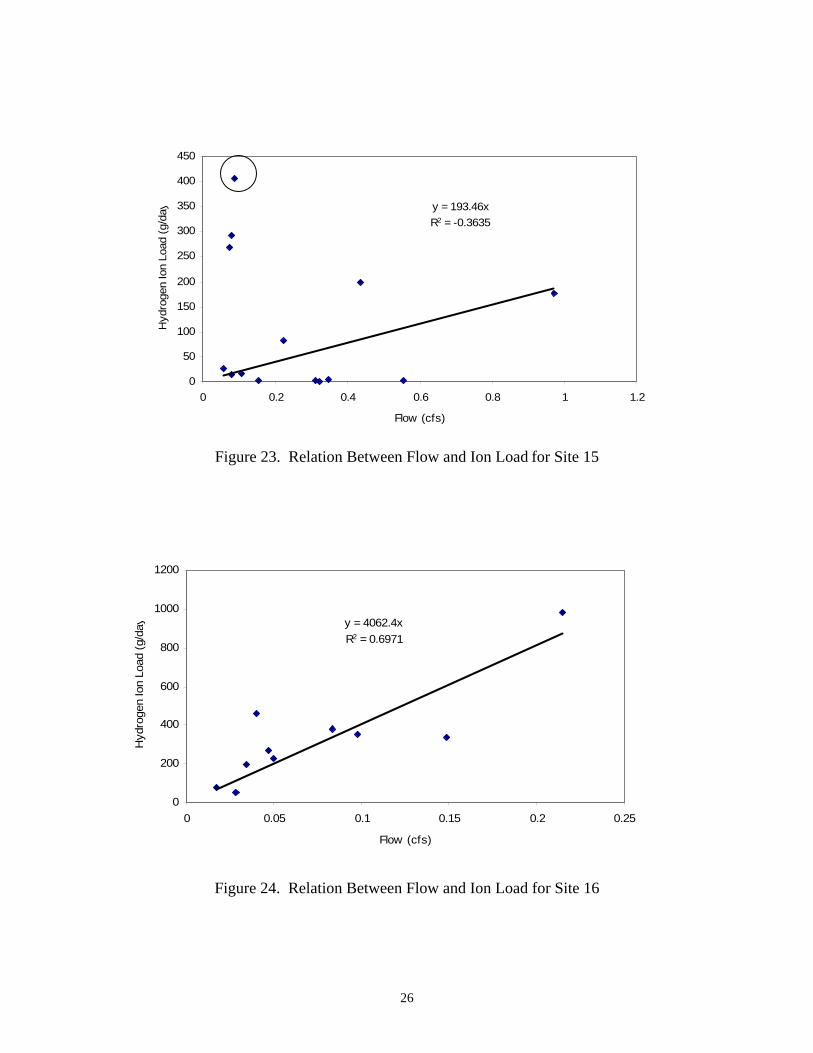
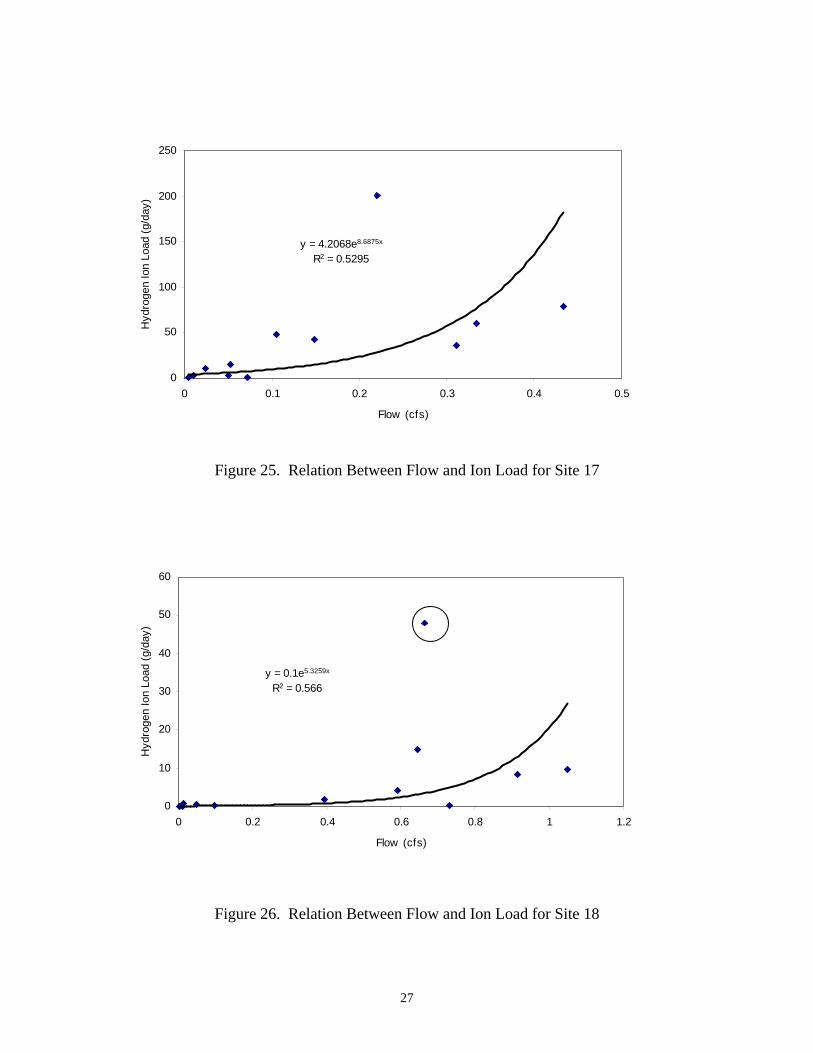
Hydrogen Ion Loading Model There were no permitted point sources in this watershed during the 1999-2000 monitoring period that contributed to the existing pH impairment. As a result, wasteload allocations for the Rock Creek Watershed are assumed to be zero. Therefore, the entire hydrogen ion load can be attributed to AML nonpoint sources. Based on a physical inspection of the watershed, it is hypothesized that the lowering of the pH in the stream is directly related to oxidation of sulfur that occurs as runoff flows over the spoil areas associated with previous mining activities in the basin. Using the most recent monitoring data, inductive models were developed at monitoring Sites 1 through 18 that relate total hydrogen ion loading to flow. These models are shown in Figures 9 though 26, and are derived from the data in Table 2. In developing these models for defining the current load, a conservative value of 0.85 was assumed for the activity coefficient based on the upper limit of measured specific conductance values of 3580 µ ohms/cm.
19
Figure 9. Relation Between Flow and Ion Load for Site 1
y = 84.042e3.0307x
R2 = 0.3944
-100
400
900
1,400
1,900
2,400
2,900
3,400
3,900
4,400
0 0.2 0.4 0.6 0.8 1 1.2
Flow (cfs)
Hyd
roge
n Io
n Lo
ad (g
/day
)
Figure 10. Relation Between Flow and Ion Load for Site 2
y = 1.5334x2 - 1.7035xR2 = 0.8898
-5
0
5
10
15
20
25
30
0 1 2 3 4 5
Flow (cfs)
Hyd
roge
n Io
n Lo
ad (g
/day
20
y = 4.5289x0.7068
R2 = 0.7038
0
0.5
1
1.5
2
2.5
3
0 0.05 0.1 0.15 0.2 0.25 0.3
Flow (cfs)
Hyd
roge
n Io
n Lo
ad (g
/day
)
Figure 11. Relation Between Flow and Ion Load for Site 3
y = 0.0977e0.6548x
R2 = 0.5212
-5
5
15
25
35
45
55
65
75
0 2 4 6 8 10 12
Flow (cfs)
Hyd
roge
n Io
n Lo
ad (g
/day
)
Figure 12. Relation Between Flow and Ion Load for Site 4
21
Figure 13. Relation Between Flow and Ion Load for Site 5
Figure 14. Relation Between Flow and Ion Load for Site 6
y = 2417.1x2 + 716.07x + 212.85R2 = 0.8327
0
1000
2000
3000
4000
5000
6000
0 0.2 0.4 0.6 0.8 1 1.2 1.4
Flow (cfs)
Hyd
roge
n Io
n Lo
ad (g
/day
y = 8.6651x2.1845
R2 = 0.7058
0
500
1000
1500
2000
2500
3000
3500
4000
0 1 2 3 4 5 6 7 8 9
Flow (cfs)
Hyd
roge
n Io
n Lo
ad (g
/day
22
y = 0.5978x0.7252
R2 = 0.3763
0
5
10
15
20
25
30
35
40
45
0 5 10 15 20 25
Flow (cfs)
Hyd
roge
n Io
n Lo
ad (g
/day
)
Figure 15. Relation Between Flow and Ion Load for Site 7
Figure 16 Relation Between Flow and Ion Load for Site 8
y = 0.0031x2 + 0.009x + 3.44R2 = 0.3367
0
5
10
15
20
25
0 10 20 30 40 50 60
Flow (cfs)
Hyd
roge
n Io
n Lo
ad (g
/day
23
Figure 17. Relation Between Flow and Ion Load for Site 9
y = 852.14x0.8309
R2 = 0.6823
0
20
40
60
80
100
120
140
160
180
200
0 0.02 0.04 0.06 0.08 0.1 0.12 0.14 0.16
Flow (cfs)
Hyd
roge
n Io
n Lo
ad (g
/day
)
Figure 18. Relation Between Flow and Ion Load for Site 10
y = 0.0118x2 + 0.0315xR2 = 0.2313
0
20
40
60
80
100
120
140
0 10 20 30 40 50 60 70
Flow (cfs)
Hyd
roge
n Io
n Lo
ad (g
/day
24
Figure 19. Relation Between Flow and Ion Load for Site 11
y = 3.1466e0.041x
R2 = 0.2418
0
50
100
150
200
250
300
0 10 20 30 40 50 60 70
Flow (cfs)
Hyd
roge
n Io
n Lo
ad (g
/day
)
Figure 20. Relation Between Flow and Ion Load for Site 12
y = 2140.2x - 64.559R2 = 0.9517
0
500
1000
1500
2000
2500
3000
3500
4000
0 0.2 0.4 0.6 0.8 1 1.2 1.4 1.6 1.8
Flow (cfs)
Hyd
roge
n Io
n Lo
ad (g
/day
25
y = 6.6475x1.5282
R2 = 0.6275
0
10
20
30
40
50
60
70
80
0 0.5 1 1.5 2
Flow (cfs)
Hyd
roge
n Io
n Lo
ad (g
/day
)
Figure 21. Relation Between Flow and Ion Load for Site 13
Figure 22. Relation Between Flow and Ion Load for Site 14
y = 0.9375x0.9228
R2 = 0.4375
0
10
20
30
40
50
60
70
80
90
100
0 10 20 30 40 50 60 70 80
Flow (cfs)
Hyd
roge
n Io
n Lo
ad (g
/day
26
Figure 23. Relation Between Flow and Ion Load for Site 15
Figure 24. Relation Between Flow and Ion Load for Site 16
y = 193.46xR2 = -0.3635
0
50
100
150
200
250
300
350
400
450
0 0.2 0.4 0.6 0.8 1 1.2
Flow (cfs)
Hyd
roge
n Io
n Lo
ad (g
/day
y = 4062.4xR2 = 0.6971
0
200
400
600
800
1000
1200
0 0.05 0.1 0.15 0.2 0.25
Flow (cfs)
Hyd
roge
n Io
n Lo
ad (g
/day
27
y = 4.2068e8.6875x
R2 = 0.5295
0
50
100
150
200
250
0 0.1 0.2 0.3 0.4 0.5
Flow (cfs)
Hyd
roge
n Io
n Lo
ad (g
/day
)
Figure 25. Relation Between Flow and Ion Load for Site 17
y = 0.1e5.3259x
R2 = 0.566
0
10
20
30
40
50
60
0 0.2 0.4 0.6 0.8 1 1.2
Flow (cfs)
Hyd
roge
n Io
n Lo
ad (g
/day
)
Figure 26. Relation Between Flow and Ion Load for Site 18
28
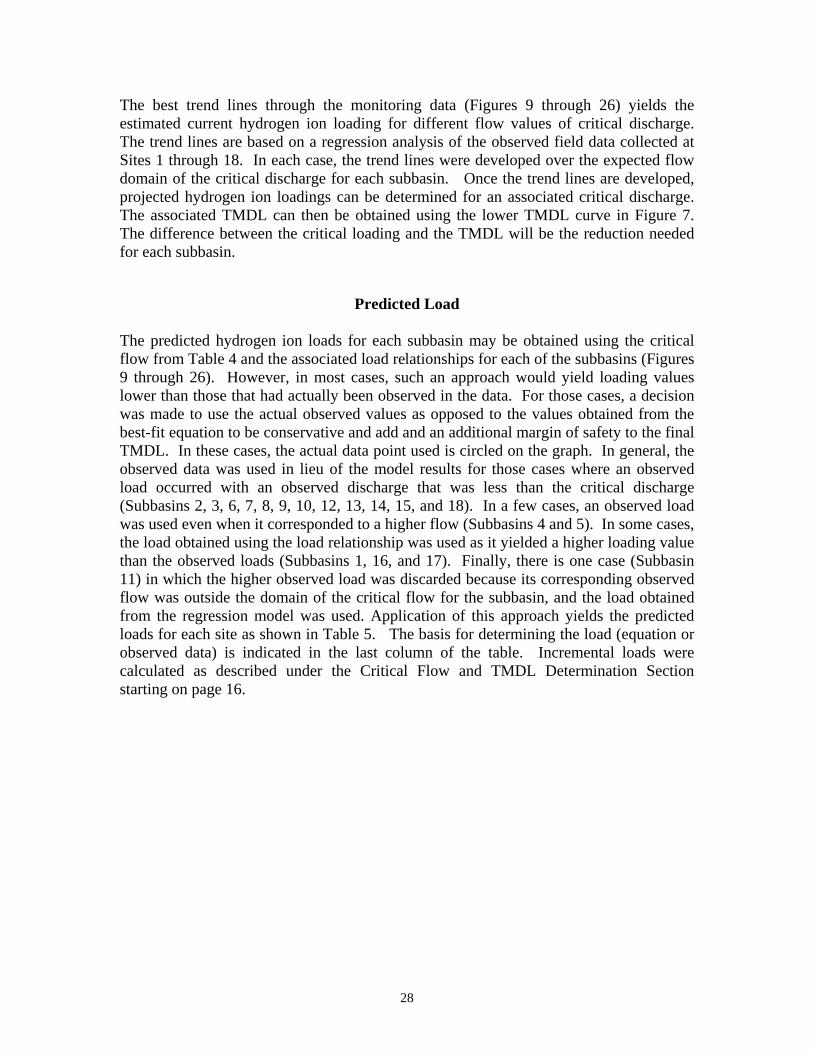
The best trend lines through the monitoring data (Figures 9 through 26) yields the estimated current hydrogen ion loading for different flow values of critical discharge. The trend lines are based on a regression analysis of the observed field data collected at Sites 1 through 18. In each case, the trend lines were developed over the expected flow domain of the critical discharge for each subbasin. Once the trend lines are developed, projected hydrogen ion loadings can be determined for an associated critical discharge. The associated TMDL can then be obtained using the lower TMDL curve in Figure 7. The difference between the critical loading and the TMDL will be the reduction needed for each subbasin.
Predicted Load
The predicted hydrogen ion loads for each subbasin may be obtained using the critical flow from Table 4 and the associated load relationships for each of the subbasins (Figures 9 through 26). However, in most cases, such an approach would yield loading values lower than those that had actually been observed in the data. For those cases, a decision was made to use the actual observed values as opposed to the values obtained from the best-fit equation to be conservative and add and an additional margin of safety to the final TMDL. In these cases, the actual data point used is circled on the graph. In general, the observed data was used in lieu of the model results for those cases where an observed load occurred with an observed discharge that was less than the critical discharge (Subbasins 2, 3, 6, 7, 8, 9, 10, 12, 13, 14, 15, and 18). In a few cases, an observed load was used even when it corresponded to a higher flow (Subbasins 4 and 5). In some cases, the load obtained using the load relationship was used as it yielded a higher loading value than the observed loads (Subbasins 1, 16, and 17). Finally, there is one case (Subbasin 11) in which the higher observed load was discarded because its corresponding observed flow was outside the domain of the critical flow for the subbasin, and the load obtained from the regression model was used. Application of this approach yields the predicted loads for each site as shown in Table 5. The basis for determining the load (equation or observed data) is indicated in the last column of the table. Incremental loads were calculated as described under the Critical Flow and TMDL Determination Section starting on page 16.
29
Table 5. Predicted Cumulative and Incremental Ion Load for Subbasins 1 - 18
Sub- basin
Cumulative Flow (cfs)
Incremental Flow (cfs)
Predicted load
(gm/day) Cumulative
Predicted load
(lbs/day) Cumulative
Predicted load
(lbs/day) Incremental
Load Basis (Equation
or Observed)
1 3.37 3.37 11.6750 0.0257 0.0257 Equation 2 1.07 1.07 4005.4329 8.8320 8.8320 Observed 3 0.41 0.41 2.6028 0.0057 0.0057 Observed 4 2.13 0.92 60.1306 0.1326 0.0000 Observed 5 1.21 1.21 5702.2954 12.5736 12.5736 Observed 6 8.97 1.81 3338.0478 7.3604 0.0000 Observed 7 68.31 0.91 39.7209 0.0876 0.0000 Observed 8 58.44 58.44 20.0265 0.0442 0.0442 Observed 9 68.51 0.19 129.1779 0.2848 0.0000 Observed 10 0.12 0.12 183.7764 0.4052 0.4052 Observed 11 0.78 0.78 1604.7970 3.5386 3.5386 Equation 12 71.11 0.82 257.5883 0.5680 0.0000 Observed 13 1.56 1.56 72.6439 0.1602 0.1602 Observed 14 76.17 2.39 91.2429 0.2012 0.0000 Observed 15 0.18 0.18 406.0034 0.8952 0.8952 Observed 16 0.45 0.45 1828.0800 4.0309 4.0309 Equation 17 0.43 0.43 176.3247 0.3888 0.3888 Equation 18 1.11 1.11 48.0074 0.1059 0.1059 Observed
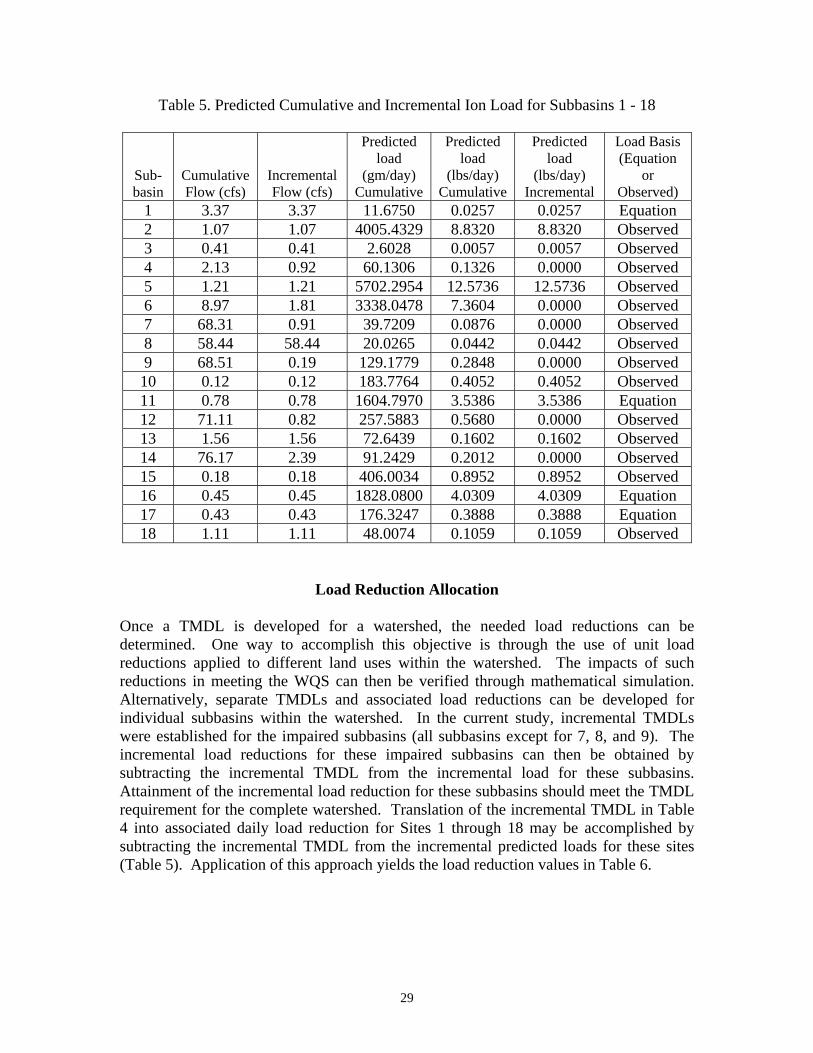
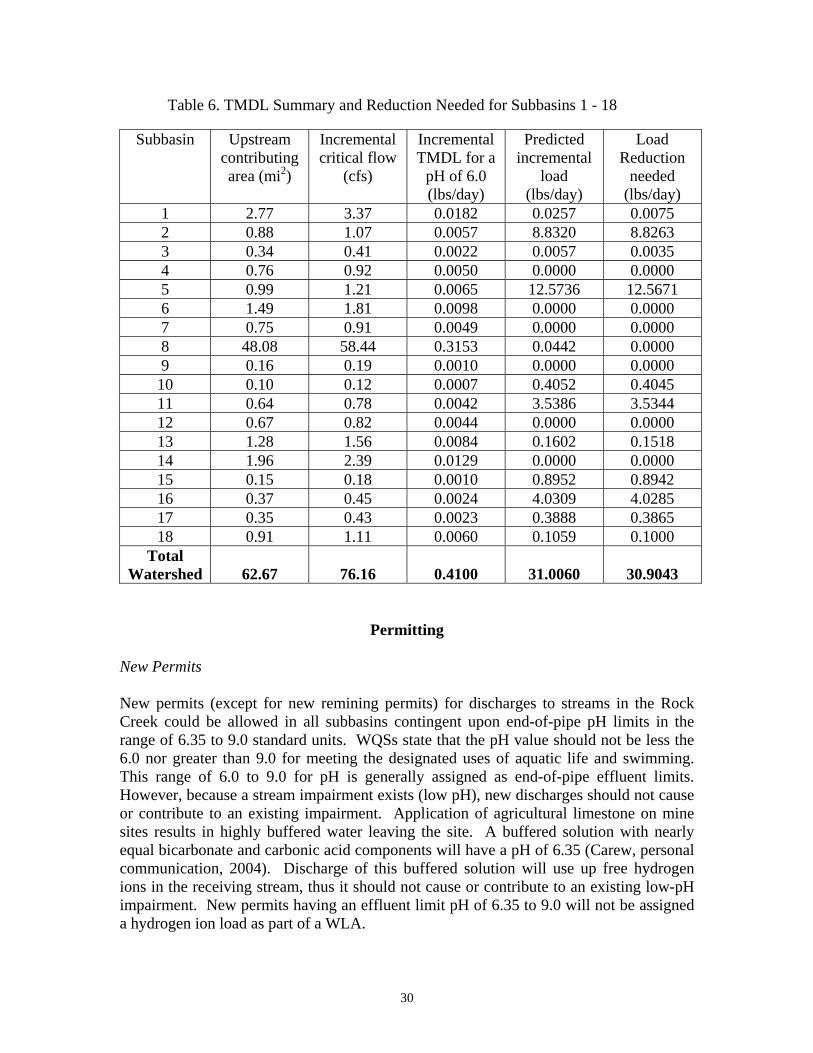
Load Reduction Allocation Once a TMDL is developed for a watershed, the needed load reductions can be determined. One way to accomplish this objective is through the use of unit load reductions applied to different land uses within the watershed. The impacts of such reductions in meeting the WQS can then be verified through mathematical simulation. Alternatively, separate TMDLs and associated load reductions can be developed for individual subbasins within the watershed. In the current study, incremental TMDLs were established for the impaired subbasins (all subbasins except for 7, 8, and 9). The incremental load reductions for these impaired subbasins can then be obtained by subtracting the incremental TMDL from the incremental load for these subbasins. Attainment of the incremental load reduction for these subbasins should meet the TMDL requirement for the complete watershed. Translation of the incremental TMDL in Table 4 into associated daily load reduction for Sites 1 through 18 may be accomplished by subtracting the incremental TMDL from the incremental predicted loads for these sites (Table 5). Application of this approach yields the load reduction values in Table 6.
30
Table 6. TMDL Summary and Reduction Needed for Subbasins 1 - 18
Subbasin Upstream contributing area (mi2)
Incremental critical flow
(cfs)
Incremental TMDL for a
pH of 6.0 (lbs/day)
Predicted incremental
load (lbs/day)
Load Reduction
needed (lbs/day)
1 2.77 3.37 0.0182 0.0257 0.0075 2 0.88 1.07 0.0057 8.8320 8.8263 3 0.34 0.41 0.0022 0.0057 0.0035 4 0.76 0.92 0.0050 0.0000 0.0000 5 0.99 1.21 0.0065 12.5736 12.5671 6 1.49 1.81 0.0098 0.0000 0.0000 7 0.75 0.91 0.0049 0.0000 0.0000 8 48.08 58.44 0.3153 0.0442 0.0000 9 0.16 0.19 0.0010 0.0000 0.0000 10 0.10 0.12 0.0007 0.4052 0.4045 11 0.64 0.78 0.0042 3.5386 3.5344 12 0.67 0.82 0.0044 0.0000 0.0000 13 1.28 1.56 0.0084 0.1602 0.1518 14 1.96 2.39 0.0129 0.0000 0.0000 15 0.15 0.18 0.0010 0.8952 0.8942 16 0.37 0.45 0.0024 4.0309 4.0285 17 0.35 0.43 0.0023 0.3888 0.3865 18 0.91 1.11 0.0060 0.1059 0.1000
Total Watershed
62.67
76.16
0.4100
31.0060
30.9043
Permitting New Permits New permits (except for new remining permits) for discharges to streams in the Rock Creek could be allowed in all subbasins contingent upon end-of-pipe pH limits in the range of 6.35 to 9.0 standard units. WQSs state that the pH value should not be less the 6.0 nor greater than 9.0 for meeting the designated uses of aquatic life and swimming. This range of 6.0 to 9.0 for pH is generally assigned as end-of-pipe effluent limits. However, because a stream impairment exists (low pH), new discharges should not cause or contribute to an existing impairment. Application of agricultural limestone on mine sites results in highly buffered water leaving the site. A buffered solution with nearly equal bicarbonate and carbonic acid components will have a pH of 6.35 (Carew, personal communication, 2004). Discharge of this buffered solution will use up free hydrogen ions in the receiving stream, thus it should not cause or contribute to an existing low-pH impairment. New permits having an effluent limit pH of 6.35 to 9.0 will not be assigned a hydrogen ion load as part of a WLA.
31
Remining Permits Remining permits may be approved on a case-by-case basis where streams are impaired because of low pH from abandoned mines. Existing water quality conditions must be maintained or improved during the course of mining. Permit approval is contingent on reclamation of the site after mining activities are completed. Reclamation of the site is the ultimate goal, but WQSs (pH of 6.0 to 9.0 standard units) may not necessarily be met in the interim if the Commonwealth issues a variance to the permittee. In instances where the Commonwealth issues a variance for a remining activity consistent with this regulation, hydrogen ion loads from this remining activity are allowed to exceed the WLA. The variance allows an exception to the applicable WQS as well as to the TMDL. Remining therefore constitutes a means whereby a previously disturbed and unreclaimed area can be reclaimed. The authority for remining is defined in Section 301(p) of the Federal Clean Water Act; Chapter 33, Section 1331(p) of the U.S. Code – Annotated (the Rahall Amendment to the Federal Clean Water Act); and the Kentucky Administrative Regulations (401 KAR 5:040 and 5:029). The eventual reclamation of the remining site should result in a reduction of the nonpoint source ion load of the subbasin. The reclamation should also result in an improved stream condition (increased pH) because a previously disturbed and unreclaimed area will be reclaimed. Follow-up, in-stream monitoring would need to be done at the subbasin outfall to determine the effect of reclamation activities following remining on the overall ion load coming from the subbasin. General KPDES Permit for Coal Mine Discharges This permit covers all new and existing discharges associated with coal mine runoff. This permit does not authorize discharges that (1) are subject to an existing individual KPDES permit or application, (2) are subject to a promulgated storm water effluent guidelines or standard, (3) the Director has determined to be or may reasonably be expected to be contributed to a violation of a water of a WQS or to the impairment of a 303(d) listed water, or (4) are into a surface water that has been classified as an Exceptional or Outstanding or National Resource Water. A signed copy of a Notice of Intent (NOI) form must be submitted to the Kentucky Division of Water (KPDES Branch) when the initial application is filed with the Division of Mine Permits. However, coverage under this general permit may be denied and submittal of an application for an individual KPDES permit may be required based on a review of the NOI and/or other information.
32
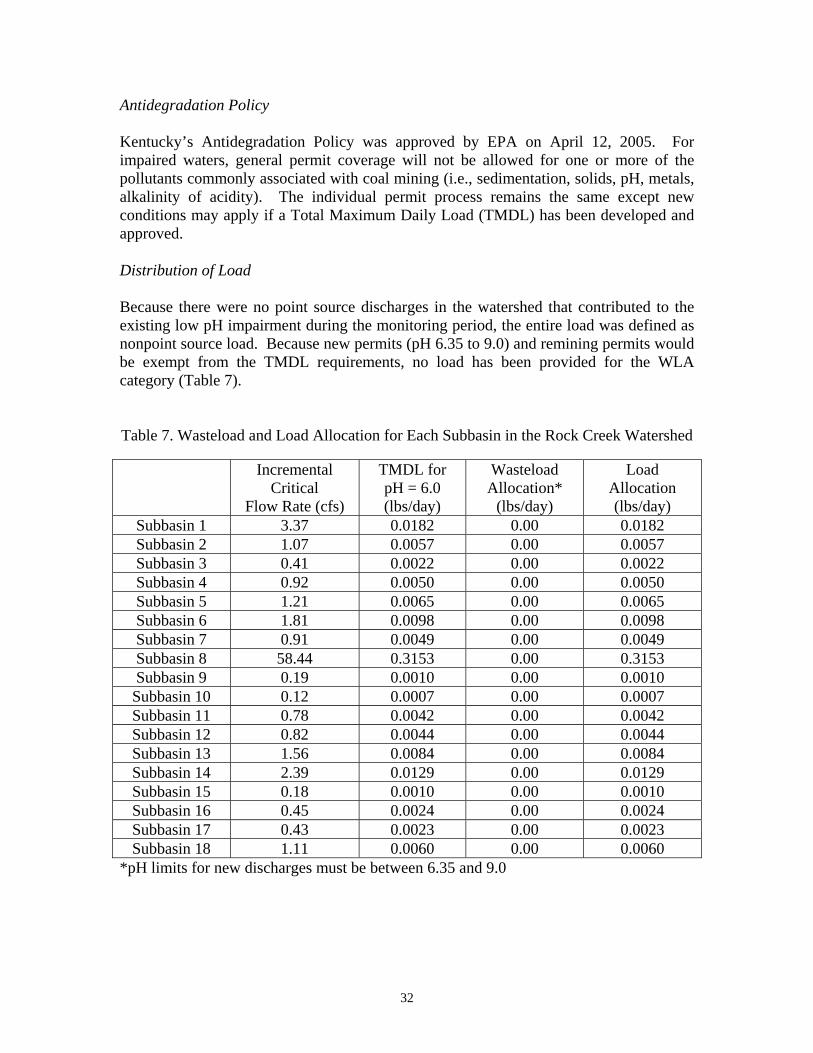
Antidegradation Policy Kentucky’s Antidegradation Policy was approved by EPA on April 12, 2005. For impaired waters, general permit coverage will not be allowed for one or more of the pollutants commonly associated with coal mining (i.e., sedimentation, solids, pH, metals, alkalinity of acidity). The individual permit process remains the same except new conditions may apply if a Total Maximum Daily Load (TMDL) has been developed and approved. Distribution of Load Because there were no point source discharges in the watershed that contributed to the existing low pH impairment during the monitoring period, the entire load was defined as nonpoint source load. Because new permits (pH 6.35 to 9.0) and remining permits would be exempt from the TMDL requirements, no load has been provided for the WLA category (Table 7).
Table 7. Wasteload and Load Allocation for Each Subbasin in the Rock Creek Watershed
Incremental Critical
Flow Rate (cfs)
TMDL for pH = 6.0 (lbs/day)
Wasteload Allocation*
(lbs/day)
Load Allocation (lbs/day)
Subbasin 1 3.37 0.0182 0.00 0.0182 Subbasin 2 1.07 0.0057 0.00 0.0057 Subbasin 3 0.41 0.0022 0.00 0.0022 Subbasin 4 0.92 0.0050 0.00 0.0050 Subbasin 5 1.21 0.0065 0.00 0.0065 Subbasin 6 1.81 0.0098 0.00 0.0098 Subbasin 7 0.91 0.0049 0.00 0.0049 Subbasin 8 58.44 0.3153 0.00 0.3153 Subbasin 9 0.19 0.0010 0.00 0.0010 Subbasin 10 0.12 0.0007 0.00 0.0007 Subbasin 11 0.78 0.0042 0.00 0.0042 Subbasin 12 0.82 0.0044 0.00 0.0044 Subbasin 13 1.56 0.0084 0.00 0.0084 Subbasin 14 2.39 0.0129 0.00 0.0129 Subbasin 15 0.18 0.0010 0.00 0.0010 Subbasin 16 0.45 0.0024 0.00 0.0024 Subbasin 17 0.43 0.0023 0.00 0.0023 Subbasin 18 1.11 0.0060 0.00 0.0060
*pH limits for new discharges must be between 6.35 and 9.0
33
Implementation/Remediation Strategy Remediation of pH-impaired streams as a result of current mining operations is the responsibility of the mine operator. The Kentucky Division of Field Services of the DSMRE is responsible for enforcing the Surface Mining Control and Reclamation Act of 1977 (SMCRA). The Kentucky Division of Abandoned Mine Lands (DAML) is charged with performing reclamation to address the impacts from pre-law and bond forfeiture mine sites in accordance with priorities established in SMCRA. SMCRA sets environmental problems as third in priority in the list of AML problem types. As discussed earlier, two separate phases of reclamation projects for the Rock Creek watershed have been completed. A summary of the reclamation activities completed under both Phase I and Phase II are given below.
80,000 tons of limestone installed in watershed (30,000 Phase I & 50,000 Phase II) 25,000 cubic yards of refuse excavated from banks of Rock Creek (Phase I) 20,000 feet of limestone channel installed (7,000 Phase I & 13,000 Phase II) Vertical Flow System Installed at Paint Cliff (Phase I) 20 Acres of acidic refuse reclaimed (17 acres Phase I & 3 acres Phase II) 2 Acres of landslides reclaimed (Phase II) Total Construction Cost $1,400,000 ($650,000 Phase I, $750,000 Phase II) As a result of these reclamation projects, acid loading from Rock Creek into the Big South Fork of the Cumberland River has been reduced from a monthly average of 121 tons to near zero. For 2000, the total federal Kentucky AML budget allocation was approximately $17 million. However, the bulk of these funds were used to support Priority 1 (extreme danger of adverse effects to public health, safety, welfare, and property) and Priority 2 (adverse effects to public health, safety, and welfare) projects. Of the total annual federal budget allocation, AML receives only approximately $700,000 in Appalachian Clean Streams Initiative funds, which are targeted for Priority 3 environmental problems. Based on the cost of current remediation efforts, it would appear that a significant increase in federal funding to DAML projects, particularly Priority 3 projects, would be required in order for the DAML program to play a significant part in meeting the TMDL implementation associated with pH-impaired streams in the state of Kentucky.
Load Reduction Strategy Using Limestone Sand
Recent studies in Kentucky (Carew, 1998) and West Virginia (Clayton, et. al., 1998 and Carew, 1998) have demonstrated that limestone sand can be used as an effective agent for restoring the pH in acidified streams. For streams with a pH < 6, CaCO3 may be used to neutralize free hydrogen ions based on the following relationship:
CaCO3 + 2H+ → H2CO3 + Ca2+ (11)
34
Thus, the theoretical total mass of CaCO3 required to neutralize 1 gm of H+ ions can be obtained by dividing the molecular weight of CaCO3 (100) by the molecular weight of 2 hydrogen atoms (2) to yield:
Required mass of limestone = 50*Mass of Hydrogen Ions (12) Or, in terms of a required annual load:
Annual required mass of limestone = 18,250*Mass of Hydrogen Ions (g/day) (13) In practice, however, this value will only represent a lower bound of the required mass as a result of two issues: 1) not all the limestone added to a stream will be readily available as soluble CaCO3, and 2) an increasing fraction of the CaCO3 mass will be required to neutralize other metal ions (e.g. Fe, Al, Mn) that will also most likely be present in the AMD, especially in the case of streams with pH < 4.5 (Snoeyink and Jenkins, 1980). One way to deal with the first limitation is to simply add more limestone to the stream. Recent studies in both West Virginia and Kentucky have found that application rates of 2 to 4 times the theoretical limestone requirement have been found to be effective in restoring AMD streams. The most effective way to deal with the second limitation is to determine the additional amount of limestone that must be added to neutralize both the hydrogen ions and the additional ions that might be present. One way to approximate this quantity is by calculating the total acidity in the water column (as expressed directly as CaCO3).
Total acidity is normally defined as a measure of the concentration of acids (both weak and strong) that react with a strong base. Acidity may be determined analytically by titrating a water sample with a standard solution of a strong base (e.g. NaOH) to an electrometrically observed end point pH of 8.3. (For waters associated with AMD it is important that any ferric salts present must first be oxidized prior to the determination of the total acidity). The required mass of NaOH required to raise the sample pH to 8.3 can then be expressed directly in terms of CaCO3 as follows:
Acidity, as mg CaCO3 = 50,000*(mL of NaOH)*(Normality of NaOH) (14) Weight of sample used (mg)
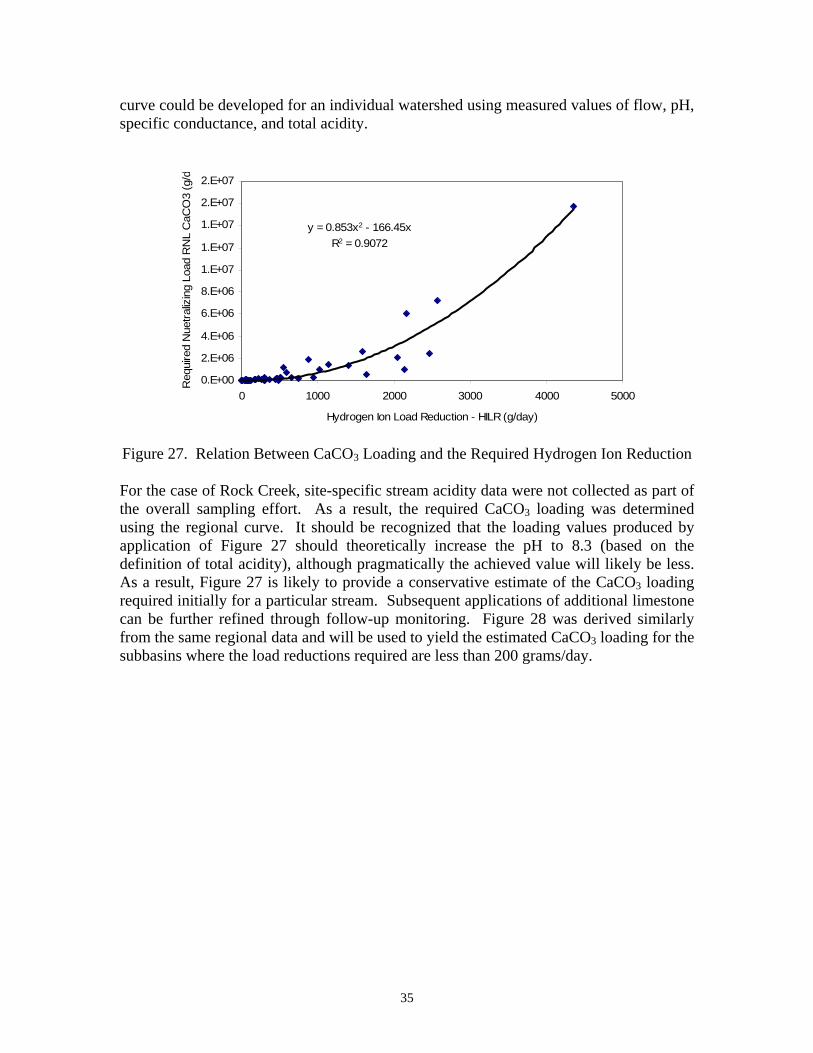
In general, a relationship between pH (or the associated mass of free hydrogen ions), and the total acidity can be readily developed for a given stream using measured values of pH and acidity (Clayton, et. al, 1998). Using measured streamflow data, an additional relationship between the required hydrogen ion reduction (required to raise the pH up to 8.3) and the corresponding load of CaCO3 (required to neutralize both the hydrogen ions and other free ions) can also be developed, as shown in Figure 27. In this particular case, Figure 27 was constructed from an analysis of data from five separate watersheds in the eastern Kentucky Coal Fields, and thus provides a regional curve for application to similar watersheds in the area. A similar curve could be developed for application to watersheds in other areas using regional data for that area. Alternatively, a site-specific
35
curve could be developed for an individual watershed using measured values of flow, pH, specific conductance, and total acidity. Figure 27. Relation Between CaCO3 Loading and the Required Hydrogen Ion Reduction
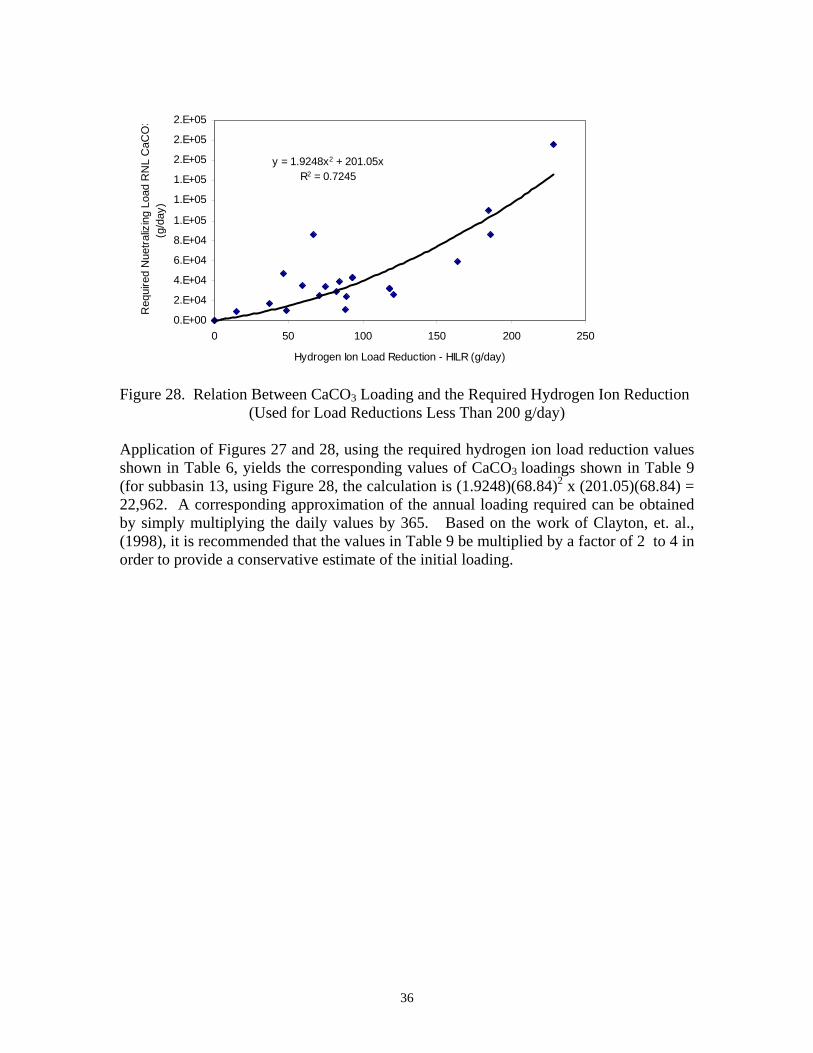
For the case of Rock Creek, site-specific stream acidity data were not collected as part of the overall sampling effort. As a result, the required CaCO3 loading was determined using the regional curve. It should be recognized that the loading values produced by application of Figure 27 should theoretically increase the pH to 8.3 (based on the definition of total acidity), although pragmatically the achieved value will likely be less. As a result, Figure 27 is likely to provide a conservative estimate of the CaCO3 loading required initially for a particular stream. Subsequent applications of additional limestone can be further refined through follow-up monitoring. Figure 28 was derived similarly from the same regional data and will be used to yield the estimated CaCO3 loading for the subbasins where the load reductions required are less than 200 grams/day.
y = 0.853x2 - 166.45xR2 = 0.9072
0.E+00
2.E+06
4.E+06
6.E+06
8.E+06
1.E+07
1.E+07
1.E+07
2.E+07
2.E+07
0 1000 2000 3000 4000 5000
Hydrogen Ion Load Reduction - HILR (g/day)
Req
uire
d N
uetra
lizin
g Lo
ad R
NL
CaC
O3
(g/d
36
y = 1.9248x2 + 201.05xR2 = 0.7245
0.E+00
2.E+04
4.E+04
6.E+04
8.E+04
1.E+05
1.E+05
1.E+05
2.E+05
2.E+05
2.E+05
0 50 100 150 200 250
Hydrogen Ion Load Reduction - HILR (g/day)
Req
uire
d N
uetra
lizin
g Lo
ad R
NL
CaC
O3
(g/d
ay)
Figure 28. Relation Between CaCO3 Loading and the Required Hydrogen Ion Reduction
(Used for Load Reductions Less Than 200 g/day)
Application of Figures 27 and 28, using the required hydrogen ion load reduction values shown in Table 6, yields the corresponding values of CaCO3 loadings shown in Table 9 (for subbasin 13, using Figure 28, the calculation is (1.9248)(68.84)2 x (201.05)(68.84) = 22,962. A corresponding approximation of the annual loading required can be obtained by simply multiplying the daily values by 365. Based on the work of Clayton, et. al., (1998), it is recommended that the values in Table 9 be multiplied by a factor of 2 to 4 in order to provide a conservative estimate of the initial loading.
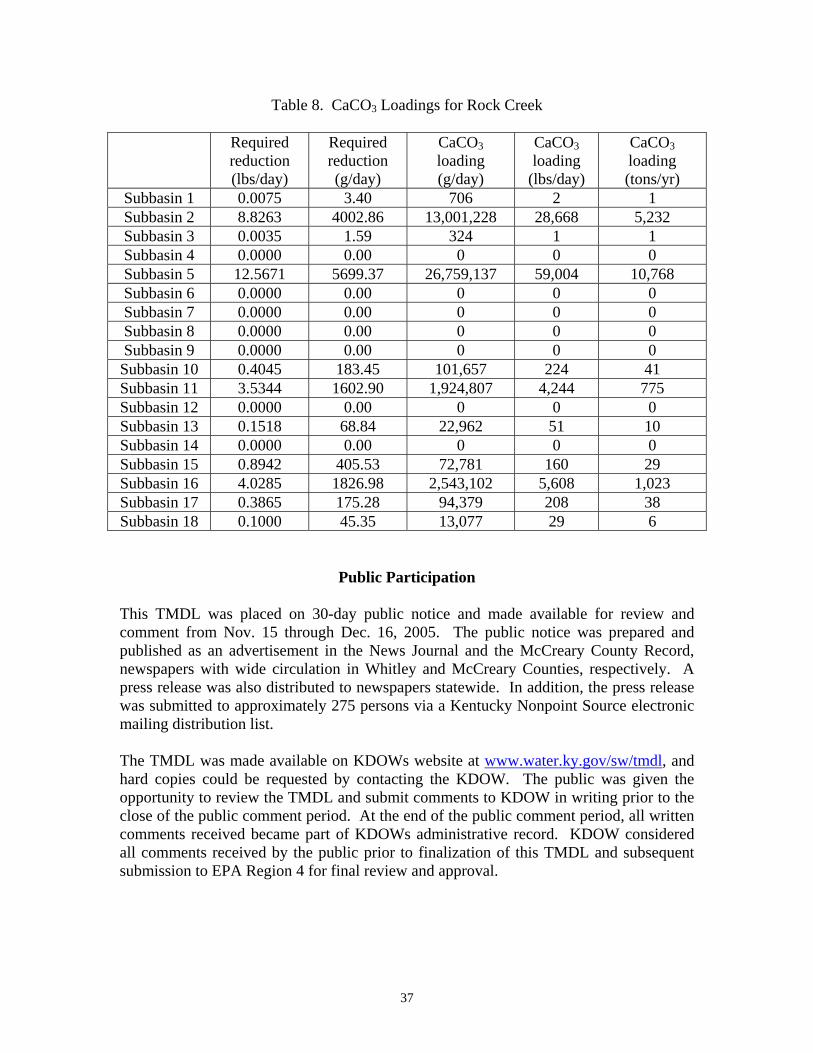
37
Table 8. CaCO3 Loadings for Rock Creek
Required reduction (lbs/day)
Required reduction (g/day)
CaCO3
loading (g/day)
CaCO3 loading
(lbs/day)
CaCO3 loading (tons/yr)
Subbasin 1 0.0075 3.40 706 2 1 Subbasin 2 8.8263 4002.86 13,001,228 28,668 5,232 Subbasin 3 0.0035 1.59 324 1 1 Subbasin 4 0.0000 0.00 0 0 0 Subbasin 5 12.5671 5699.37 26,759,137 59,004 10,768 Subbasin 6 0.0000 0.00 0 0 0 Subbasin 7 0.0000 0.00 0 0 0 Subbasin 8 0.0000 0.00 0 0 0 Subbasin 9 0.0000 0.00 0 0 0 Subbasin 10 0.4045 183.45 101,657 224 41 Subbasin 11 3.5344 1602.90 1,924,807 4,244 775 Subbasin 12 0.0000 0.00 0 0 0 Subbasin 13 0.1518 68.84 22,962 51 10 Subbasin 14 0.0000 0.00 0 0 0 Subbasin 15 0.8942 405.53 72,781 160 29 Subbasin 16 4.0285 1826.98 2,543,102 5,608 1,023 Subbasin 17 0.3865 175.28 94,379 208 38 Subbasin 18 0.1000 45.35 13,077 29 6
Public Participation
This TMDL was placed on 30-day public notice and made available for review and comment from Nov. 15 through Dec. 16, 2005. The public notice was prepared and published as an advertisement in the News Journal and the McCreary County Record, newspapers with wide circulation in Whitley and McCreary Counties, respectively. A press release was also distributed to newspapers statewide. In addition, the press release was submitted to approximately 275 persons via a Kentucky Nonpoint Source electronic mailing distribution list.
The TMDL was made available on KDOWs website at www.water.ky.gov/sw/tmdl, and hard copies could be requested by contacting the KDOW. The public was given the opportunity to review the TMDL and submit comments to KDOW in writing prior to the close of the public comment period. At the end of the public comment period, all written comments received became part of KDOWs administrative record. KDOW considered all comments received by the public prior to finalization of this TMDL and subsequent submission to EPA Region 4 for final review and approval.
38
LITERATURE CITED Carew, M, (1998) Rock Creek Reclamation Project, Kentucky Department for Surface
Mining Reclamation and Enforcement, Kentucky Division of Abandoned Mine Lands, 12 pp.
Carew, M.B., L. Volk, and D. Wilson, 2003. Acid Mine Drainage Characterization and
Abatement in the Lower Rock Creek Watershed. Proceedings of the National Abandoned Mine Land Programs 25th Annual Conference, Louisville, Kentucky September 28 – October 1, 2003.
Carew, M, (2004) Personal Communication dated 11/8/2004. Clayton, J.L., Dannaway, E.S., Menendez, R., Rauch, H.W., Renton, J.J., Sherlock, S.M.
and Zurbuch, P.E. (1998). “Application of limestone to restore fish communities in acidified streams”. North American Journal of Fisheries Management, 18: 347-360.
EPA, (1981) Clean Water Act, Section 303(d), 40 CFR Part 130, 1991b. EPA, (1991) Technical Support Document for Water Quality-based Toxics Control, EPA
505/2-90-001, March 1991. Kentucky Administrative Regulations, (2002) Title 401, Chapters 5:029, 5:031, and
5:040. Kentucky Division of Water, (1981) The Effects of Coal Mining Activities on the Water
Quality of Streams in the Western and Eastern Coalfields of Kentucky, Department for Environmental Protection, Kentucky Natural Resources and Environmental Protection Cabinet.
Kentucky Division of Water, (1996) 303(d) List of Waters for Kentucky, Department for
Environmental Protection, Kentucky Natural Resources and Environmental Protection Cabinet.
Kentucky Division of Water, (1998) 303(d) List of Waters for Kentucky, Department for
Environmental Protection, Kentucky Natural Resources and Environmental Protection Cabinet.
Kentucky Division of Water, (2003). 2002 303(d) List of Waters for Kentucky,
Department for Environmental Protection, Kentucky Natural Resources and Environmental Protection Cabinet.
National Research Council. (2001). “Assessing the TMDL approach to water quality
management.” National Academy Press, Washington, D. C.

39
Snoeyink, V.L., and Jenkins, D., (1980) Water Chemistry, Wiley, Inc, New York, NY, 1980, pp. 77-78.
US Department of Agriculture, Soil Survey of Pulaski County, Kentucky, 1974
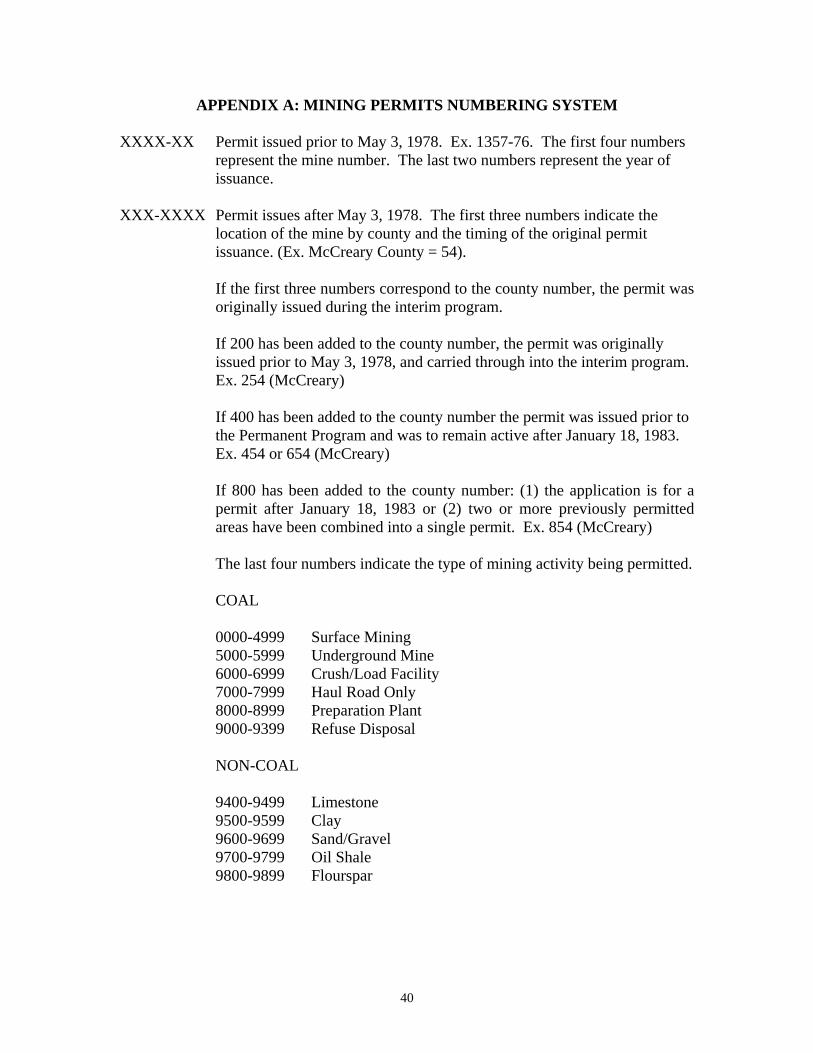
40
APPENDIX A: MINING PERMITS NUMBERING SYSTEM
XXXX-XX Permit issued prior to May 3, 1978. Ex. 1357-76. The first four numbers represent the mine number. The last two numbers represent the year of issuance. XXX-XXXX Permit issues after May 3, 1978. The first three numbers indicate the location of the mine by county and the timing of the original permit issuance. (Ex. McCreary County = 54). If the first three numbers correspond to the county number, the permit was originally issued during the interim program. If 200 has been added to the county number, the permit was originally issued prior to May 3, 1978, and carried through into the interim program. Ex. 254 (McCreary) If 400 has been added to the county number the permit was issued prior to the Permanent Program and was to remain active after January 18, 1983. Ex. 454 or 654 (McCreary)
If 800 has been added to the county number: (1) the application is for a permit after January 18, 1983 or (2) two or more previously permitted areas have been combined into a single permit. Ex. 854 (McCreary)
The last four numbers indicate the type of mining activity being permitted. COAL 0000-4999 Surface Mining 5000-5999 Underground Mine 6000-6999 Crush/Load Facility 7000-7999 Haul Road Only 8000-8999 Preparation Plant 9000-9399 Refuse Disposal NON-COAL 9400-9499 Limestone 9500-9599 Clay 9600-9699 Sand/Gravel 9700-9799 Oil Shale 9800-9899 Flourspar

![PH regulation. Blood pH pH = measure of hydrogen ion concentration pH = -log [H + ] Blood pH = 7.35-7.45 pH imbalances are quickly lethal body needs](https://img.pdfslide.us/doc/110x75/56649d6b5503460f94a4a848/ph-regulation-blood-ph-ph-measure-of-hydrogen-ion-concentration-ph-log.jpg)


![A table for converting pH to hydrogen ion concentration ... · Title: A table for converting pH to hydrogen ion concentration [H+] over the range 5-9 Author: Fiorica V Keywords: PH](https://img.pdfslide.us/doc/110x75/5e602fc7fd14e55da05c6be4/a-table-for-converting-ph-to-hydrogen-ion-concentration-title-a-table-for-converting.jpg)