Embed Size (px)
Citation preview


TABLE OF CONTENTS
Statement of Constitutional and Legal AuthoritySummary of the Fiscal Year 2012 Budget Resolution
I. A Choice of Two Futures .................................................................................... 9Introduction Components of the Federal Budget The Crushing Burden of Debt A Reform Agenda for the U.S. Government
II. Fiscal Year 2012 Budget Resolution ................................................................... 27 Efficient, Effective and Responsible Government.................................................................................... 28
Providing for the Common Defense Streamlining Other Government Agencies Restraining the Growth of Government by Repealing the Health Care Law Ending Corporate Welfare Changing Washington’s Culture of Spending
Strengthening the Social Safety Net ......................................................................................................... 38
Repairing a Broken Medicaid System Stopping the Abuse of Medicaid by Repealing the Health Care Law Protecting Assistance for Those in Need Preparing the Workforce for a 21st Century Economy
Fulfilling the Mission of Health and Retirement Security for All Americans .................................... 44
Saving Medicare Stopping the Raid on Medicare by Repealing the Health Care Law Advancing Social Security Reforms
Pro-Growth Tax Reform .............................................................................................................................. 50
Simplifying the Tax Code for Individuals Stopping Job-Destroying Tax Hikes by Repealing the Health Care Law Making the Corporate Code More Competitive
III. The Path to Prosperity ........................................................................................ 55 Lifting the Crushing Burden of Debt
Removing the Hurdles to Economic Growth
Appendix I: Summary TablesAppendix II: A Pro-Growth Budget

STATEMENT OF CONSTITUTIONAL AND LEGAL AUTHORITY
Article I of the U.S. Constitution grants Congress the power to appropriate funds from the Treasury, pay the obligations of and raise revenue for the federal government, and publish statements and accounts of all financial transactions.
By law, Congress is also obligated to write a budget representing its plan to carry out these transactions in the forthcoming fiscal years. While the President is required to propose his administration’s budget requests for Congress’s consideration, Congress alone is responsible for writing the laws that raise revenues, appropriate funds, and prioritize taxpayer dollars within an overall federal budget.
The budget resolution is the only legislative vehicle that views government comprehensively. It provides the framework for the consideration of other legislation. Ultimately, a budget is much more than a series of numbers. It also serves as an expression of Congress’s principles, vision and philosophy of governing.
This Budget Resolution for Fiscal Year 2012 intends to recommit the nation fully to the timeless principles of American government enshrined in the U.S. Constitution – liberty, limited government, and equality under the rule of law. It seeks to guide policies by those principles, freeing the nation from the crushing burden of debt that is now threatening its future.
This budget is submitted, as prescribed by law, to apply these principles, reflect this vision, and provide a framework for the orderly execution of Congress’s constitutional duties for Fiscal Year 2012 and beyond.
House Budget Committee | April 5, 2011 4

SUMMARY OF THE FISCAL YEAR 2012 BUDGET RESOLUTION
Where the President has failed, House Republicans will lead. This budget helps spur job creation today, stops spending money the government doesn’t have, and lifts the crushing burden of debt. This plan puts
the budget on the path to balance and the economy on the path to prosperity.
KEY FACTSSPENDING
Cuts $6.2 trillion in government spending over the next decade compared to the President’s budget, and
$5.8 trillion relative to the current-policy baseline.
Eliminates hundreds of duplicative programs, reflects the ban on earmarks, and curbs corporate welfare
bringing non-security discretionary spending to below 2008 levels.
Brings government spending to below 20 percent of the economy, a sharp contrast to the President’s
budget, in which spending never falls below 23 percent of GDP over the next decade.
DEBT AND DEFICITS
Reduces deficits by $4.4 trillion compared to the President’s budget over the next decade.
Surpasses the President’s low benchmark of sustainability – which his own budget fails to meet –
by reaching primary balance in 2015.
Puts the budget on the path to balance and pays off the debt.
TAXES
Keeps taxes low so the economy can grow. Eliminates roughly $800 billion in tax increases imposed by
the President’s health care law. Prevents the $1.5 trillion tax increase called for in the President’s budget.
Calls for a simpler, less burdensome tax code for households and small businesses. Lowers tax rates for
individuals, businesses and families. Sets top rates for individuals and businesses at 25 percent. Improves
incentives for growth, savings, and investment.
GROWTH AND JOBS
Creates nearly 1 million new private-sector jobs next year and results in 2.5 million additional private
sector jobs in the last year of the decade.
Spurs economic growth, increasing real GDP by $1.5 trillion over the decade.
Unleashes prosperity and economic security, yielding $1.1 trillion in higher wages and an average $1,000
per year in higher income for each family.
KEY OBJECTIVES
ECONOMIC GROWTH AND JOB CREATION: Fosters a better environment for private-sector job creation
by lifting debt-fueled uncertainty and advancing pro-growth tax reforms.
SPENDING CUTS AND CONTROLS: Stops Washington from spending money it does not have on
government programs that do not work. Locks in spending cuts with spending controls.
REAL SECURITY: Fulfills the mission of health and retirement security for all Americans by making the
tough decisions necessary to save critical health and retirement programs.
PATIENT-CENTERED HEALTH CARE: Repeals and defunds the President’s health care law, advancing instead
common-sense solutions focused on lowering costs, expanding access and protecting the doctor-patient
relationship.
RESTORING AMERICA’S EXCEPTIONAL PROMISE: Tackles the existential threat posed by rapidly
growing government and debt, applying the nation’s timeless principles to this generation’s
greatest challenge. Ensures that the next generation inherits a stronger, more prosperous America.
House Budget Committee | April 5, 2011 5

KEY COMPONENTS
Efficient, Effective and Responsible Government
Prioritizing National Security: Reflects $178 billion in savings identified by Defense Secretary Robert
Gates, reinvesting $100 billion in higher military priorities and dedicating the rest to deficit reduction.
Streamlining Other Government Agencies:
Returns non-security discretionary spending to below 2008 levels.
Repeals the new health care law and moves toward patient-centered reform.
Reduces the bureaucracy’s reach by applying private-sector realities to the federal government’s
civilian workforce.
Targets hundreds of government programs that have outlived their usefulness.
Ending Corporate Welfare: Ends the taxpayer bailouts of failed financial institutions, reforms Fannie Mae
and Freddie Mac, and stops Washington from picking the winners and losers across sectors of the
economy.
Boosting American Energy Resources: Removes barriers to safe, responsible energy exploration in the
United States; unlocks American energy production to help lower costs, create jobs, and reduce
dependence on foreign fossil fuels.
Changing Washington’s Culture of Spending: Locks in savings with enforceable spending caps and budget-
process reforms, addressing not only what Washington spends, but also how tax dollars are spent.
Strengthening the Social Safety Net
Repairing a Broken Medicaid System: Ends an onerous, one-size-fits-all approach by converting the
federal share of Medicaid spending into a block grant that gives states the flexibility to tailor their
Medicaid programs to the specific needs of their residents.
Preparing the Workforce for a 21st Century Economy: Consolidates the complex maze of dozens of
overlapping job-training programs into more accessible, accountable career scholarships aimed at
empowering American workers to compete in the global economy.
Fulfilling the Mission of Health and Retirement Security
Saving Medicare: Protects those in and near retirement from any disruptions and offers future
beneficiaries the same kind of health-care options now enjoyed by members of Congress.
Advancing Social Security Solutions: Forces action by the President and both chambers of Congress to
ensure the solvency of this critical program.
Promoting Economic Growth and Job Creation
Individual Tax Reform: Simplifies the broken tax code, lowering rates and clearing out the burdensome
tangle of loopholes that distort economic activity; brings the top rate from 35 to 25 percent to promote
growth and job creation.
Corporate Tax Reform: Improves incentives for job creators to work, invest, and innovate in the United
States by lowering the corporate tax rate from 35 percent, which is the highest in the industrialized
world, to a more competitive 25 percent.
House Budget Committee | April 5, 2011 6

A CONTRAST IN BUDGETS
The Path to Prosperity President’s FY2012 Budget
Spending Cuts $6.2 trillion in spending cuts relative to President’s budget; $5.8 trillion in
spending cuts relative to CBO’s current-policy baseline
$400 billion in new spending above CBO’s current-policy
baseline
Spending Levels Brings non-security discretionary spending to below pre-stimulus, pre-
bailout levels
Locks in reckless spending spree
Taxes Stops all of President’s taxes; Reforms the broken tax code
Imposes a $1.5 trillion tax increase
Corporate Tax Lowers the corporate tax rate to 25 percent to promote job creation and
global competitiveness
Leaves in place the highest corporate tax rate in the developed world,
driving jobs overseas
Size of Government Brings government down to below 20 percent of GDP by 2015;
15 percent of GDP in 2050
Spending as a percent of GDP never drops below 23 percent; Commits to the explosive growth of government
Deficit Brings deficits under $1 trillion in FY2012; Reduces deficits $4.4 trillion relative to President’s budget; Puts the
budget on a path to balance
$1.2 trillion deficit in FY2012 marks the fourth straight deficit exceeding
the $1 trillion mark
Primary Balance Primary balance (spending – interest payments = revenue) is reached in 2015
Never reaches primary balance – failing to clear even the low bar the
administration set for itself
Debt Held by Public Reduces the debt by $4.7 trillion relative to the President’s budget; Pays off the debt
over time
Adds $9.1 trillion to the debt over the next decade; Accelerates a debt-fueled
economic crisis
Health Care Repeals the job-destroying health care law Accelerates the job-destroying health care law
Jobs Spurs economic growth and job creation through real reform; According to the
Heritage Center for Data Analysis, help creates nearly 1 million new private-
sector jobs next year
Accelerates tax hikes, health care law, debt and government spending –
policies that result in slower economic growth and fewer American
jobs
House Budget Committee | April 5, 2011 7

House Budget Committee | April 5, 2011 8

CHOICEOF
TWO FUTURES
House Budget Committee | April 5, 2011 9

INTRODUCTION
Americans face a monumental choice about the future of their country.
This budget resolution reflects that choice. It disavows the relentless government spending, taxing, and borrowing that are leading America, right at this moment, toward a debt-fueled economic crisis and the demise of America’s exceptional promise.
It chooses instead a path to prosperity – by limiting government to its core constitutional roles, keeping America’s promises to seniors, and unleashing the genius of America’s workers, investors, and entrepreneurs.
For too long, policymakers in Washington have traveled the path of least resistance – a path that has, unsurprisingly, led the nation downhill. The empty promises made by Washington over the years have resulted in economic hardships today and increasing pessimism about tomorrow.
Government at all levels is mired in debt. Mismanagement and overspending have left the nation on the brink of bankruptcy. Only recently, millions of American families saw their dreams destroyed in a financial disaster caused by misguided policies, perverse incentives, and irresponsible leadership. This crisis squandered the nation’s savings and crippled its economy.
At a time when the free-market foundations of the American economy were in desperate need of restoration and repair, the last Congress took actions that further undermined them. The President and his party’s leaders embarked on a stimulus spending spree that added hundreds of billions of dollars to the debt, yet failed to deliver on its promises to create jobs. Acute economic hardship was exploited to enact unprecedented expansions of government power.
This did not sit well with the American people. Citizens stood up and demanded that their leaders reacquaint themselves with America’s founding ideals of liberty, limited government, and equality under the rule of law.
In recent years, both political parties have squandered the public’s trust. The American people ended a unified Republican majority in 2006, just as they ended a unified Democratic majority last fall. Americans reject leaders who focus on the pursuit of power at the expense of principle. They reject empty promises from a government that cannot live within its means. They deserve the truth about the nation’s fiscal and economic challenges. They deserve – and demand – honest leaders willing to stand for solutions.
Congress can no longer afford to ignore these demands. Political parties lose elections, and life in the republic goes on. But a government that loses its sovereignty to its bondholders cannot long guarantee its people’s prosperity – or secure their freedom. A government that buries the next generation under an avalanche of debt cannot claim the moral high ground in the world. A government that allows economic destinies to be determined by political considerations rather than merit cannot lead the world in productivity and growth. And a government that promotes dependency and undermines the institutions of faith and family will inevitably weaken the nation’s greatest strength: the exceptional character of its entrepreneurial, self-reliant, and hard-working citizens.
This budget, The Path to Prosperity, heeds America’s political, economic, and moral imperatives by confronting the nation’s most urgent fiscal challenges.
This Path to Prosperity draws upon solutions from across the political spectrum and builds upon the important work of the President’s bipartisan Commission on Fiscal Responsibility and Reform. House Budget Committee | April 5, 2011 10

This Path to Prosperity reflects input from leaders at the state and local level, economists and experts who have testified before the House Budget Committee, and American citizens calling for honest leadership and real solutions.
This Path to Prosperity applies America’s timeless principles to today’s greatest challenges by committing to three key goals: lifting the crushing burden of debt, fulfilling the mission of health and retirement security for all Americans, and strengthening the foundations of economic growth and job creation.
Above all, this Path to Prosperity calls for a government faithful to its limited but noble mission: securing every American’s right to pursue a destiny of his or her choosing. This budget rejects a culture of complacency, offers reforms that promote initiative by rewarding effort, and aims to restore the dynamism that has defined America over the generations.
In the words of Abraham Lincoln, “We cannot escape history. We of this Congress and this Administration will be remembered in spite of ourselves.” Will this be remembered as the Congress that did nothing as the nation slouched toward a preventable debt crisis and irreversible decline? Or will it instead be remembered as the Congress that did the hard work of preventing that crisis – the one that chose the path to prosperity?
Decline is antithetical to the American Idea. America is a nation conceived in liberty, dedicated to equality, and defined by limitless opportunity. In all the chapters of human history, there has never been anything quite like America. This budget’s goal is to keep it exceptional, and to preserve its promise for the next generation.
House Budget Committee | April 5, 2011 11
COMPONENTS OF THE FEDERAL BUDGET
Before laying out a vision for the future of the country – for that is what a federal budget is – it is first necessary to provide an honest assessment of the facts.
Understanding how the government spends the money it takes in by taxing and borrowing is the first step toward the goal of reversing the tide of red ink and getting the economy growing again.
That understanding begins with the elements of the federal budget:
Annually Approved Spending
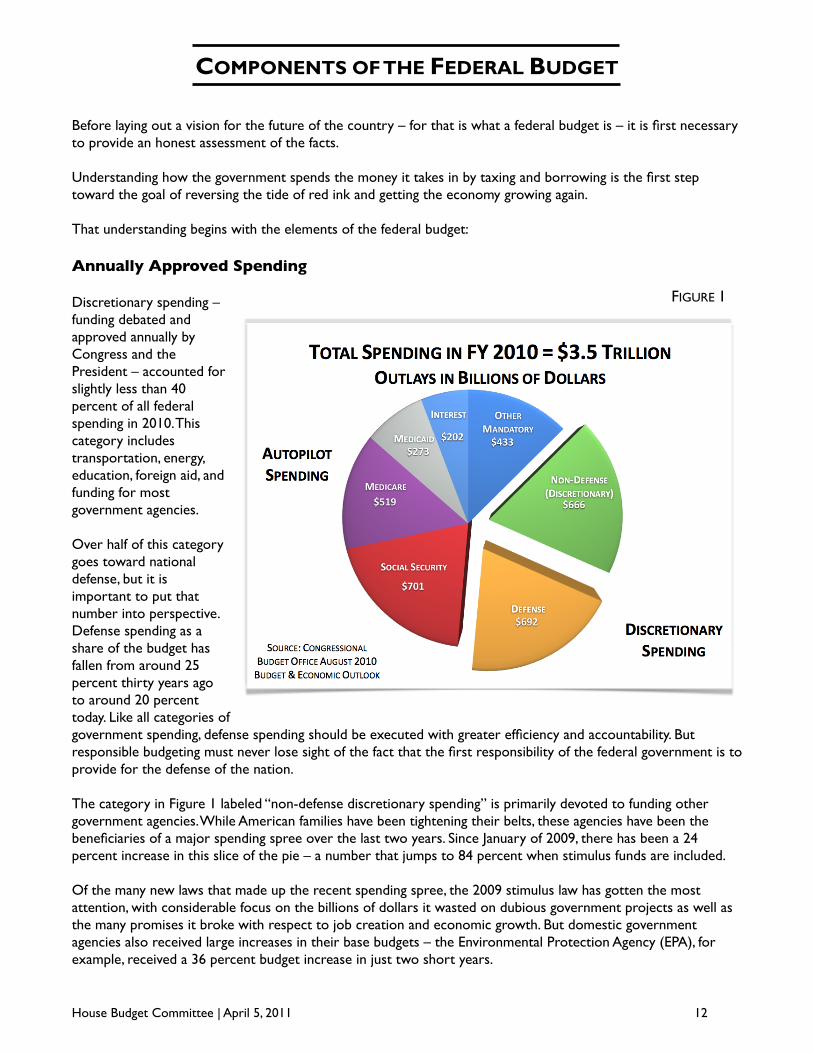
Discretionary spending – funding debated and approved annually by Congress and the President – accounted for slightly less than 40 percent of all federal spending in 2010. This category includes transportation, energy, education, foreign aid, and funding for most government agencies.
Over half of this category goes toward national defense, but it is important to put that number into perspective. Defense spending as a share of the budget has fallen from around 25 percent thirty years ago to around 20 percent today. Like all categories of government spending, defense spending should be executed with greater efficiency and accountability. But responsible budgeting must never lose sight of the fact that the first responsibility of the federal government is to provide for the defense of the nation.
The category in Figure 1 labeled “non-defense discretionary spending” is primarily devoted to funding other government agencies. While American families have been tightening their belts, these agencies have been the beneficiaries of a major spending spree over the last two years. Since January of 2009, there has been a 24 percent increase in this slice of the pie – a number that jumps to 84 percent when stimulus funds are included.
Of the many new laws that made up the recent spending spree, the 2009 stimulus law has gotten the most attention, with considerable focus on the billions of dollars it wasted on dubious government projects as well as the many promises it broke with respect to job creation and economic growth. But domestic government agencies also received large increases in their base budgets – the Environmental Protection Agency (EPA), for example, received a 36 percent budget increase in just two short years.
House Budget Committee | April 5, 2011 12
FIGURE 1

An inevitable consequence of the last Congress’s decision to ramp up spending so quickly was that billions of Americans’ hard-earned tax dollars were squandered. The Government Accountability Office (GAO) – the non-partisan agency that audits the government’s books – recently found between $100 billion to $200 billion in duplication, overlap, and waste in federal spending.1
Clearly, Congress must restore discipline to this category. Already this year, the House of Representatives voted to return spending on domestic government agencies to their pre-stimulus levels, and the House continues to push the Senate and the President to bring spending under control for the remainder of the current fiscal year.
The Path to Prosperity builds on these efforts to cut spending, ensuring government can efficiently and effectively meet its proper responsibilities. But getting discretionary spending under control is only a first step toward fiscal sustainability. The real drivers of the nation’s debt lie elsewhere.
Autopilot Spending
Programs that have “autopilot” spending authority under existing law make up the rest of the budget. Because permanent law governs the funding levels of programs in this category, it is usually referred to as “mandatory spending,” even though Congress can change the law at any time.
As illustrated in Figure 1, autopilot spending accounted for around 60 percent of all federal spending in 2010. Congress does not regularly debate, annually appropriate or properly scrutinize this category of spending. If an individual meets legal eligibility requirements for these government programs, he or she automatically receives – or “is legally entitled” – to the benefit. This category includes food stamps, unemployment benefits, and farm subsidies – programs that are frequently referred to as “entitlement programs.”
The three largest entitlement programs are Social Security, Medicare, and Medicaid. Congress created these programs in the middle decades of the last century in response to a problem that has preoccupied American lawmakers for over a century: How can government best preserve the freedom to risk and to dare, in pursuit of dreams large and small, while providing a safety net for those citizens who meet with misfortune along the way?
For decades, seniors have been able to rely on Social Security and Medicare for their basic retirement needs, while Medicaid has sought to ensure that low-income Americans would not go without essential health care. But Americans will not be able to rely on these programs for much longer unless Congress repairs and reforms them. Social Security, Medicare and Medicaid all face structural problems that are driving them – and the country – into bankruptcy.
Unlike defense, the share of the budget that goes to these entitlement programs is growing rapidly. In 1970, these major entitlements consumed about 20 percent of the budget – a number that has grown to over 40 percent today (see Figure 1). Unless action is taken to reform these programs, they will continue to crowd out all other national priorities until they break the federal budget.
Simply put, these programs were created with a 20th-century economy in mind. They were not designed for the new demographic and economic challenges of the 21st century.
There are three key forces driving Social Security, Medicare and Medicaid into bankruptcy. All three are interrelated, even though some of them affect one program more than the others.
Demographics
The first is demographic. This problem is most clearly seen in the financing for Social Security.
Social Security is financed through a pay-as-you-go system, which means that current workers’ Social Security taxes are used to pay benefits for current retirees. In 1935 when Social Security was enacted, there were about
House Budget Committee | April 5, 2011 13
1 Government Accountability Office. Opportunities to Reduce Potential Duplication in Government Programs, Save Tax Dollars, and Enhance Revenue. March 2011. http://www.gao.gov/new.items/d11318sp.pdf

42 working-age Americans for each retiree. The average life expectancy for men in America was 60 years; for women it was 64. With these demographics, it was easy for the program to generate sufficient revenue to meet its promises to those over 65.
The demographic situation has changed dramatically, however, since the creation of the program. In 1950, there were 3.5 million beneficiaries. Currently, there are over 50 million beneficiaries – an over fourteen-fold increase.
The explosion of payments in the 75 years since the Social Security system was enacted will be dwarfed by the demographic demands about to come. The first members of the baby-boom generation – those born between 1946 and 1964 – are already eligible for early retirement. At the same time, thanks to innovations in medical technology and health care, life expectancies have lengthened to an average of 75 years for men and 80 years for women, and are expected to grow further.
Not only is our nation aging, there has also been a demographic shift to a lower retirement age. In 1945, the average age of retirement was 69.6 years. In 2009, it was 63.8 years.
To put this in perspective, when Social Security was first enacted in 1935, each worker, on average, was contributing less than 2.5 percent of one retiree’s benefits. By 2030, each wage earner will be paying for nearly half of each retired person’s full benefits.
This represents a massive shift of earnings away from younger families trying to build their futures, toward Social Security recipients. No economy can grow and thrive under that heavy a tax burden.
Real reform – especially with respect to Social Security – must reflect demographic reality.
Economics
The second force is economic. For much of the last two years, Washington has been embroiled in a bruising debate over a law that was supposed to provide a “comprehensive” solution to the nation’s health-care problems by putting even more of the health sector under government control. Yet rapidly rising health-care costs remain as big a problem as ever. In 2010, health-care costs rose by over 7 percent, compared to around 1 percent for all other goods and services.
This is putting enormous pressure on Medicare and Medicaid. But these programs aren’t just affected by rapidly rising health-care costs – they are actually a key driver of inflation in the health-care sector. Nearly 50 cents of every dollar spent on health care in this country is spent by federal, state or local government. Because of the design and structure of these programs, much of the government’s money gets wasted – and shows up as inflation in the cost of care.
House Budget Committee | April 5, 2011 14
FIGURE 2

Everyone who is on Medicare or knows someone on Medicare has stories about waste in the system – unnecessary tests, redundant treatments, and the cost in both time and money of mistaken billings and misplaced records. This kind of waste is inevitable in a top-down, government-run system, and it’s a big reason that costs have spiraled out of control.
Moreover, America’s health-care entitlements are currently set up as open-ended, blank-check commitments to reimburse health-care providers for services – and this very structure raises costs and reduces efficiency. Blank-check commitments create perverse incentives for everyone in the health-care system to maximize his or her share of this apparently limitless government subsidy. This leads to waste and fraud on a massive scale.
Last year’s health-care law – with its maze of mandates, dictates, controls, tax hikes and subsidies – exacerbates the flaws in this model and will push costs further in the wrong direction. Already, health insurance companies have announced big premium hikes related to the law’s new mandates. Its so-called cost controls amount to the same kind of fee-for-service reductions that have failed to control costs in Medicare for decades. (Providers predictably increase the number of services provided for each condition as the government lowers fees.) And it will dramatically expand a Medicaid program that is already breaking state budgets and adding to a growing flood of red ink at the federal level.
Real reform – especially with respect to Medicare – must eliminate this unsustainable waste and reduce inefficiencies and costs by giving beneficiaries themselves more control over their own health-care benefits and decisions.
Skewed political incentives
The third force, particularly with regard to Medicaid, boils down to a question of control. In this country, where should power reside? Should it be centralized in the hands of federal bureaucrats, or decentralized across the country at the state, local and individual level? The current incentive structure, with most of the power concentrated at the federal level, drives the heedless expansion of government programs and therefore the growth of health-care costs for all Americans.
As government increases subsidies and control over the price and delivery of health care, it saps the system of innovation and efficiency, and it pushes quality health care out of reach for those who are not eligible for federal programs. This results in more demands to increase federal subsidies and control. Any effort to propose significant reforms to these programs triggers a barrage of demagoguery and entrenched resistance.
Skewed political incentives have proved especially damaging in the Medicaid program. Because the federal government matches every state dollar spent on the program, states do not pay the full cost of expanding benefits. At the same time, every dollar in Medicaid expenditures cut from state budgets triggers more than a dollar worth of cuts in federal funding. These incentives encourage states to expand the program beyond those who are truly in need.
Worse, states are not given the flexibility to design their Medicaid programs in smart or efficient ways. When even their smaller share of the tab becomes unaffordable, as has happened in many states recently, it is often the case that their only option is to impose across-the-board reductions in reimbursements to doctors, which leave many doctors unwilling to see Medicaid patients. As a result, these patients are left with fewer options and lower-quality care. The new health care law, with its large expansions of Medicaid, will funnel more people into a broken system.
Real reform – especially with respect to Medicaid – must give states the flexibility they need to better assist their most vulnerable populations.
House Budget Committee | April 5, 2011 15

Empty promises
Policymakers have known about these problems for decades, but few have been willing to propose real solutions.
Figure 3 makes it very clear that, absent action, Social Security, Medicare and Medicaid will soon grow to consume every dollar of revenue that the government raises in taxes. At that point, policymakers would be left with no good options. Making do without any federal government departments, including the military, is not really option, and neither is raising taxes to a level that no free and prospering economy could sustain.
Of course, if Congress continues to delay, it will lose even the ability to make such choices on its own terms. The foreign governments and institutional lenders that finance America’s debt would cut up the nation’s credit cards before things got that far. That would mean sudden, steep cuts in entitlement benefits to current seniors, less help for the poor, and a crushing tax burden on young families.
Each year that Congress fails to act, the U.S. government gets closer to breaking promises to current retirees, while adding to a growing pile of empty promises made to future generations. The government’s unfunded liabilities – promises the government makes to current workers about their health and retirement security for which it has no means to pay – are growing by trillions of dollars a year.
America has seen unfunded obligations much, much less severe than these take down some of its proudest companies. In industries such as steel, aviation and autos, workers lost promised benefits when their employers failed to take timely, responsible steps to update their unworkable, 20th-century benefit structures. Many retirees lost the critical health and retirement benefits that they were counting on.
House Budget Committee | April 5, 2011 16
FIGURE 3
FIGURE 4

Unless Congress acts, Americans can expect the same thing to happen to Social Security and Medicare. Under current law, Social Security benefits are scheduled to be cut by 22 percent in 2037, when the Social Security trust fund runs out of assets and payroll taxes are not sufficient to cover benefits owed. Medicare is on a similarly unsustainable path – the Medicare trend line illustrated in Figure 3 is a mathematical impossibility. Future benefit cuts – against a backdrop of skyrocketing health-care costs – are a certainty if the program goes unreformed.
Americans have had enough instability in their lives, and they deserve a federal health and retirement safety net that they can count on. If Congress wants to avoid defaulting on federal health and retirement programs, it must adopt a program of gradual adjustment – one that frees the nation from the shadow of debt, strengthens its health and retirement safety net, protects those in or near retirement from any disruptions in their benefits, and supports robust economic growth and job creation.
Taxes
The U.S. government is not running sustained deficits because Americans are taxed too little. The government is running deficits because it spends too much.
Over the past 40 years, government revenue has averaged between 18 percent and 19 percent of GDP. This level has generally been compatible with prosperity, even though there is broad agreement that the structure of the tax code should be simplified and made more conducive to economic growth, high wages and entrepreneurship.
Figure 5 shows that Washington has a spending problem, not a revenue problem. The President’s budget would drive both spending and revenues to historic highs as a share of the total U.S. economy. The trend is clear: Chasing ever-higher spending with ever-higher tax rates would leave the U.S. economy at a severe disadvantage compared to the rest of the world, to say nothing of the pain felt by American families deprived of the chance to save for a better future.
Nor can the government solve this problem just by raising the top individual tax rates: Even if it were wise to
raise taxes on the most successful small businesses in America – most of which are owned by individuals and file at individual rates – the government cannot even come close to closing the fiscal gap that way. To close the fiscal gap by raising the top rates, the government would have to collect an additional $500,000 each year on average from every taxpayer in the top two brackets, on top of what these taxpayers already pay.
The non-partisan Congressional Budget Office has concluded that the tax rates needed to sustain the nation’s current fiscal trajectory into the future would end up sinking the economy.2 That is one reason that the
House Budget Committee | April 5, 2011 172 Congressional Budget Office. Letter to Congressman Paul D. Ryan. May 2008.
FIGURE 5

President’s Commission on Fiscal Responsibility and Reform proposed, as part of an overall effort to fix the nation’s unsustainable deficits, a fundamental tax reform plan that actually lowered income tax rates to promote growth, while eliminating tax loopholes to broaden the tax base.3
A broader base with lower rates is central to a fair, efficient and sustainable tax code, and the economic growth spurred by such a reform is a precondition to fixing the nation’s fiscal mess.
Deficits and Debt
When the government spends more than it takes in through taxes, it has to borrow money to cover the shortfall. The deficit is how much the nation has to borrow to fund the gap between spending and revenue in a given year. The debt is the total amount outstanding that the government owes – it represents the accumulation of deficits over time.
This year is projected to mark the third straight year in which the nation borrows over $1 trillion. The gross debt is scheduled to hit $14 trillion, which is nearly the size of the entire U.S. economy. The President’s budget would nearly double this debt over the next ten years, bringing it to $26 trillion. Clearly, Congress must address this crisis now – before it is too late.
House Budget Committee | April 5, 2011 18
3 The National Commission on Fiscal Responsibility and Reform. The Moment of Truth. December 2010. http://www.fiscalcommission.gov/sites/fiscalcommission.gov/files/documents/TheMomentofTruth12_1_2010.pdf

THE CRUSHING BURDEN OF DEBT
The United States is facing a crushing burden of debt – a debt that will soon surpass the size of the entire U.S. economy and ultimately capsize it if left on its present course.
This is not the future of a proud and prosperous nation. It is the future of a nation in decline – its best days come and gone. Yet decline is not inevitable. Congress has all the fiscal powers necessary to command a change of course. But it must find the will to change, and find it quickly, in order to avoid this fate.
America’s unsustainable budget path is no longer a problem that is far off in the future. The lenders who buy much of the federal government’s debt have noticed the disconnect between the government’s perilous fiscal situation and the low rates of interest it is paying on the bonds that constitute the government’s debts. Some have even decided to purge their portfolios of U.S. debt, and others are advising their clients to do the same.4
Through its interventions into the economy, the Federal Reserve has recently become the largest buyer of government debt in the country, and these purchases have helped keep interest rates low. But the Fed is scheduled to stop making these purchases this summer. Congress must show the market that it has a credible plan for getting the national debt under control, in order to ease concerns over the government’s credit-worthiness and stave off an interest-rate spike.
This budget is offered in the hope that it might demonstrate the new House majority’s determination to face the government’s most difficult fiscal challenges.
An Unsustainable Path
The recent sovereign debt crises in Greece and other highly-indebted European countries provide a cautionary tale of the rough justice of the marketplace – lenders cannot and will not finance unsustainable deficits forever, and when they cut up the credit cards of profligate countries, severe economic turmoil ensues.
Over the past few years, Americans have seen just how quickly a severe financial crisis can create widespread pain and chaos. But the last crisis was foreseen only by a small number of perceptive individuals who recognized the implications of unwise decisions being made in Washington and on Wall Street.
By contrast, nearly every fiscal expert and advisor in Washington has warned that a major debt crisis is inevitable if the U.S. government remains on its current unsustainable path. The government’s failure to prevent this completely preventable crisis would rank among history’s most infamous episodes of political malpractice.
House Budget Committee | April 5, 2011 19
4 “Pimco’s Biggest Fund Dumps Treasury Bond Holdings.” Reuters with CNBC.com, March 9, 2011 http://www.cnbc.com/id/41990901/ (accessed March 31, 2011).
FIGURE 6

Erskine Bowles, the Democratic co-chairman of the President’s Fiscal Commission, said it best: “The era of deficit denial is over.”5
Nearing a Debt Crisis
Like a household or business, a nation’s indebtedness is best understood in terms of how much it owes relative to how much it makes. By that measure, debt held by the public – money that the U.S. government owes to others – will reach nearly 70 percent of the entire U.S. economy this year.
If this were merely a temporary rise in the debt, it would not be so alarming. However, the spending spree of the last two years, combined with the coming retirement of nearly 80 million baby boomers, threaten to turn these recent deficit spikes into a permanent plunge into debt.
Debt in excess of 60 percent of the economy is not sustainable for an extended period of time. That is bad news for the United States. According to the non-partisan CBO, the President’s budget would keep the debt climbing as a share of the economy in the decade ahead, from nearly 70 percent this year to over 87 percent of the U.S. economy by 2021. University of Maryland economist Carmen Reinhart testified before the House Budget Committee that 90 percent is often a trigger point for economic decline.6
How a Debt Crisis Would Unfold
Spiraling interest rates
The first sign that a debt crisis has arrived is that bond investors lose confidence in a government’s ability to pay its debts – and by that point, it is usually too late to avoid severe disruption and economic pain. Right now, the U.S. government is able to borrow at historically low rates, partly because of the Fed’s interventions in the market, but also because the bonds of most foreign countries are looking even riskier. Neither of these conditions is going to last. Interest rates – and the burden of paying interest on the debt – have nowhere to go but up.
Interest payments are already consuming around 10 cents of every tax dollar. But as interest rates rise from their current historically low levels and debt continues to mount, interest payments are projected to consume over 20 percent of all tax revenue by 2020.
That means that one in five tax dollars will be dedicated to making interest payments by the end of the decade – and that’s according to optimistic projections about interest rates. If interest rates increase by a higher-than-expected amount in future – which appears to be more likely – then the nation’s interest payments could cost trillions of dollars more.
Foreign flight
It would be one thing if the U.S. government owed most of this money to domestic lenders. But the nation’s reliance on foreign creditors has increased dramatically over the past few decades. Foreigners now own roughly half of all publicly held U.S. debt, a sharp increase from a generation ago when foreigners owned just 5 percent of U.S. debt. This makes the nation vulnerable to a sudden shift in foreign-investor sentiment, particularly during a time of crisis.
If foreign investors, especially foreign governments such as China, begin to lose confidence in the U.S. government’s ability to solve its most difficult fiscal challenges, they will demand higher compensation to offset the perceived risk of holding U.S. debt – meaning sharply higher interest rates.
House Budget Committee | April 5, 2011 20
5 Wolf, Richard. “Are We Ready to Cut the U.S. Deficit?” USA TODAY, November 29, 2010 http://www.usatoday.com/printedition/news/20101129/1adeficit29_cv.art.htm (accessed March 31, 2011).
6 Reinhart, Carmen M. Testimony before the U.S. House, Committee on the Budget. Lifting the Crushing Burden of Debt. Hearing, March 10, 2011.

During the financial crisis, foreigners flocked to Treasury debt simply because other investments looked so unsafe by comparison, and this helped keep interest rates low. But these investment flows work both ways, as the heavily indebted nations of Europe have recently learned. If the Congress continues to put off difficult choices regarding the nation’s long-term problems, foreign investors will re-evaluate the creditworthiness of the United States and demand higher interest rates.
The Consequences of Inaction
Stagflation
The economic effects of a debt crisis on the United States would be far worse than what the nation experienced during the financial crisis of 2008. For starters, no entity on the planet is large enough to bail out the U.S. government. Absent a bailout, the only solutions to a debt crisis would be truly painful: massive tax increases, sudden and disruptive cuts to vital programs, runaway inflation, or all three. This would create a huge hole in the economy that would be exacerbated by panic.
Even if high debt did not cause a crisis, however, the nation would still be in for a long and grinding period of economic decline if it stayed on its current path. A recent study completed by Reinhart and economist Ken Rogoff of Harvard confirms this common-sense conclusion. The study found conclusive empirical evidence that total debt exceeding 90 percent of the economy has a significant negative effect on economic growth.7
The study looked specifically at the United States, focusing on growth and inflation relative to past periods when this nation has experienced high debt levels. The study found that not only is average economic growth dramatically lower when gross U.S. debt exceeds 90 percent of the economy, but inflation also becomes a problem.
Essentially, the study confirmed that massive debts of the kind the nation is on track to accumulate are associated with “stagflation” – a toxic mix of economic stagnation and rising inflation.
Real pain for families
Warning signs in financial markets would merely be a harbinger of the real economic pain that would eventually be felt by American families in the event of a debt crisis.
Much higher interest rates on government debt would translate into much higher interest rates on mortgages, credit cards and car loans. These higher rates would most likely come as a shock to most Americans, who have grown accustomed to borrowing in a climate of historically-low interest rates. It might even shock those who lived through the double-digit interest rates of the early 1980s.
House Budget Committee | April 5, 2011 21
7 Reinhart, Carmen M. and Kenneth S. Rogoff. “Growth in a Time of Debt.” January 2010. http://www.economics.harvard.edu/files/faculty/51_Growth_in_Time_Debt.pdf
FIGURE 7
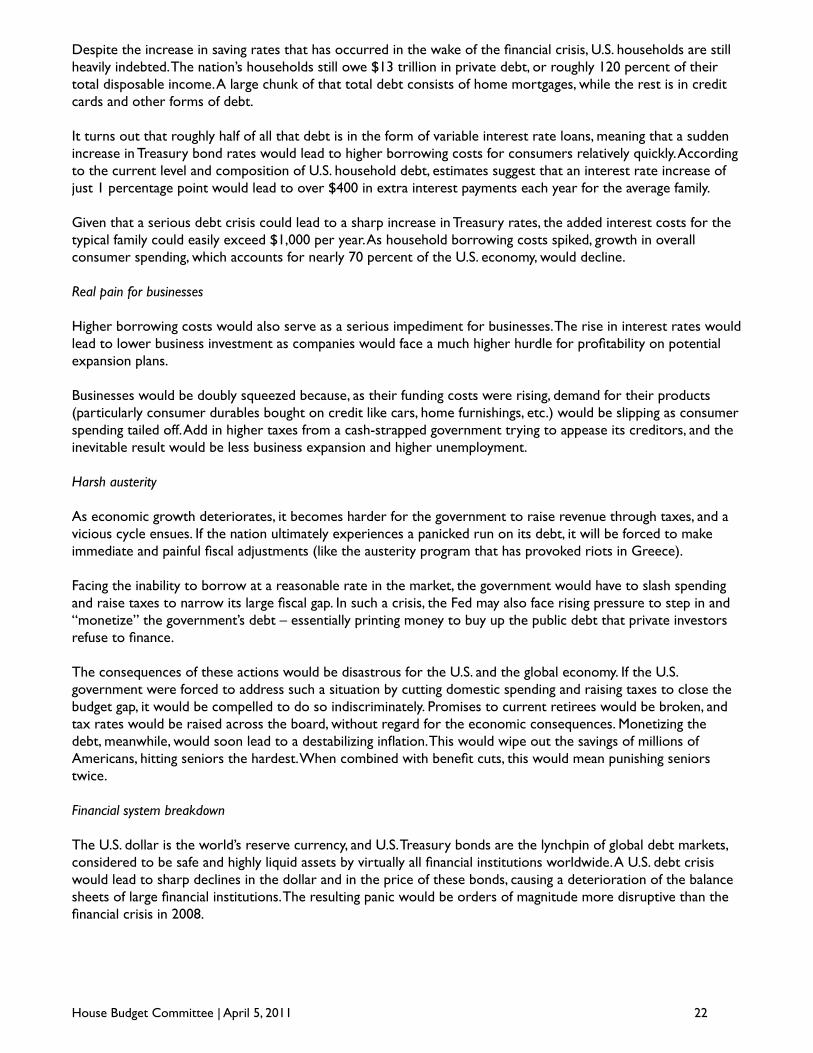
Despite the increase in saving rates that has occurred in the wake of the financial crisis, U.S. households are still heavily indebted. The nation’s households still owe $13 trillion in private debt, or roughly 120 percent of their total disposable income. A large chunk of that total debt consists of home mortgages, while the rest is in credit cards and other forms of debt.
It turns out that roughly half of all that debt is in the form of variable interest rate loans, meaning that a sudden increase in Treasury bond rates would lead to higher borrowing costs for consumers relatively quickly. According to the current level and composition of U.S. household debt, estimates suggest that an interest rate increase of just 1 percentage point would lead to over $400 in extra interest payments each year for the average family.
Given that a serious debt crisis could lead to a sharp increase in Treasury rates, the added interest costs for the typical family could easily exceed $1,000 per year. As household borrowing costs spiked, growth in overall consumer spending, which accounts for nearly 70 percent of the U.S. economy, would decline.
Real pain for businesses
Higher borrowing costs would also serve as a serious impediment for businesses. The rise in interest rates would lead to lower business investment as companies would face a much higher hurdle for profitability on potential expansion plans.
Businesses would be doubly squeezed because, as their funding costs were rising, demand for their products (particularly consumer durables bought on credit like cars, home furnishings, etc.) would be slipping as consumer spending tailed off. Add in higher taxes from a cash-strapped government trying to appease its creditors, and the inevitable result would be less business expansion and higher unemployment.
Harsh austerity
As economic growth deteriorates, it becomes harder for the government to raise revenue through taxes, and a vicious cycle ensues. If the nation ultimately experiences a panicked run on its debt, it will be forced to make immediate and painful fiscal adjustments (like the austerity program that has provoked riots in Greece).
Facing the inability to borrow at a reasonable rate in the market, the government would have to slash spending and raise taxes to narrow its large fiscal gap. In such a crisis, the Fed may also face rising pressure to step in and “monetize” the government’s debt – essentially printing money to buy up the public debt that private investors refuse to finance.
The consequences of these actions would be disastrous for the U.S. and the global economy. If the U.S. government were forced to address such a situation by cutting domestic spending and raising taxes to close the budget gap, it would be compelled to do so indiscriminately. Promises to current retirees would be broken, and tax rates would be raised across the board, without regard for the economic consequences. Monetizing the debt, meanwhile, would soon lead to a destabilizing inflation. This would wipe out the savings of millions of Americans, hitting seniors the hardest. When combined with benefit cuts, this would mean punishing seniors twice.
Financial system breakdown
The U.S. dollar is the world’s reserve currency, and U.S. Treasury bonds are the lynchpin of global debt markets, considered to be safe and highly liquid assets by virtually all financial institutions worldwide. A U.S. debt crisis would lead to sharp declines in the dollar and in the price of these bonds, causing a deterioration of the balance sheets of large financial institutions. The resulting panic would be orders of magnitude more disruptive than the financial crisis in 2008.
House Budget Committee | April 5, 2011 22

The Path to Decline
In the end, the debate about rising U.S. debt is not just about dollars and cents, but also about America’s status as a world power and its freedom to act in its own best interests. If the nation stays on its current path, interest payments on the national debt will begin to exceed yearly defense spending just 11 years from now. In just 16 years, yearly interest expenses will be double national defense spending.
If it stays on its current fiscal path, the United States will be unable to afford its role as an economic and military superpower. Other nations with very different interests will rush in to fill that role.
Last year in Foreign Affairs magazine, financial historian Niall Ferguson surveyed some of the great empire declines throughout history and observed that “most imperial falls are associated with fiscal crises. All the… cases were marked by sharp imbalances between revenues and expenditures, as well as difficulties with financing public debt. Alarm bells should be ringing loudly… [for] the United States.”8
America must not lose its role in the world. For this and many other reasons, Congress must act now to change the nation’s fiscal course. The new House majority was sent here by the American people to get spending under control, keep taxes low, and confront these great challenges today to allow this generation to pass an even greater nation along to the next generation.
Congress can choose to let this nation go the way of fallen empires, or it can begin – today – the work of restoring the vitality and greatness of America.
House Budget Committee | April 5, 2011 23
8 Ferguson, Niall. “Complexity and Collapse: Empires on the Edge of Chaos.” Foreign Affairs, March/ April 2010.

A REFORM AGENDA FOR THE U.S. GOVERNMENT
When it comes to this generation’s defining challenge – the explosive growth of the national debt – the simple truth is that Washington has not been honest with the American people.
The last Congress added trillions to the problem, and the current administration has offered no serious plan to address the sea of red ink. There is a vacuum of leadership in Washington. This budget attempts to lead where others have fallen short. To do otherwise would consign the United States to a diminished future – a future that disrespects the sacrifices that generations of American families have made to secure the promise of this exceptional nation.
This budget offers America a model of government guided by the timeless principles of the American Idea: free market democracy, open competition, a robust private sector bound by rules of honesty and fairness, a secure safety net, and equal opportunity for all under a limited constitutional government of popular consent.
In certain key respects, the federal government has strayed from these timeless principles. This budget offers a set of fundamental reforms to put the nation back on the right track.
1. Reform government to make it more efficient, effective and responsible
The role of the federal government is both vital and limited. When government takes on too many tasks, it usually doesn’t do any of them very well. Limited government also means effective government. This budget recommits the federal government to the security of every American citizen’s natural right to life, liberty and the pursuit of happiness, while fostering an environment for economic growth and private-sector job creation.
Providing for the common defense: Recognizing that the first job of government is to secure the safety and liberty of its citizens from threats at home and abroad, this budget rejects proposals to make deep, across-the-board cuts in funding for national defense. Instead, it reflects the $178 billion in savings identified by Defense Secretary Robert Gates, $100 billion of which would be reinvested in higher military priorities. American men and women in uniform are presently engaged with a fierce enemy and dealing with emerging threats around the world. This budget achieves savings in the category of national defense without jeopardizing preparedness or critical missions.
Streamlining other government agencies: Government spending on domestic departments and agencies has grown too much, too fast over the past decade, with much of the money going to programs and projects the nation can do without. This budget starts to restore spending discipline to a government that badly needs it by returning non-security discretionary spending to well below 2008 levels. It reduces the bureaucracy’s reach by applying private-sector realities to the federal government’s civilian workforce. It targets hundreds of government programs that have outlived their usefulness. It reflects an extension of the moratorium on earmarks. And it repeals the government takeover of health care enacted last year and moves toward patient-centered reform.
Ending corporate welfare: There is a growing and pernicious trend of government overreach into sectors of the private economy – a trend that stacks the deck in favor of entrenched interests and stifles growth. This budget ends the taxpayer bailouts of failed financial institutions and stops Washington from picking the winners and losers across sectors of the economy.
Boosting American energy resources: Too great a percentage of America’s vast natural resources remain locked behind bureaucratic barriers and red tape. This budget removes moratoriums on safe, responsible energy exploration in the United States, ends Washington policies that drive up gas prices, and unlocks American energy production to help lower costs, create jobs, and reduce dependence on foreign oil.
Changing Washington’s culture of spending: The budget process in Washington contains numerous structural flaws that bias the federal government toward ever-higher levels of spending. This budget locks in savings with enforceable spending caps and budget-process reforms, addressing not only what Washington spends, but also how tax dollars are spent.
House Budget Committee | April 5, 2011 24

2. Reform welfare to strengthen the social safety net
This budget builds upon the historic progress of bipartisan welfare reform in the late 1990s. It strengthens Medicaid, food stamps and job-training programs by providing states with greater flexibility to help recipients build self-sufficient futures for themselves and their families.
Repairing a broken Medicaid system: Medicaid’s flawed financing structure has created rapidly rising costs that are nearly impossible to check. This budget ends an onerous, one-size-fits-all approach by converting the federal share of Medicaid spending into a block grant that gives states the flexibility to tailor their Medicaid programs to the needs of their unique populations.
Protecting assistance for those in need: The welfare reformers of the 1990s were not able to extend their work beyond cash welfare to other means-tested programs. This budget extends those successes to other areas of the safety net to ensure that America’s safety net does not become a hammock that lulls able-bodied citizens into lives of complacency and dependency.
Preparing the workforce for a 21st century economy: The government’s dozens of job-training programs suffer from overlapping responsibilities and too often lack accountability. The government must do a much better job of leveraging and targeting existing resources in this policy area. This budget consolidates a complex maze of dozens of job-training programs into more accessible, accountable career scholarships aimed at empowering American workers with the resources they need to pursue their dreams.
3. Reform government programs to fulfill the mission of health and retirement security
This budget puts an end to empty promises from a broke government, offering instead real security through real reforms. The framework established in this budget secures health and retirement benefit programs both for current beneficiaries, who will receive the benefits they’ve organized their retirements around, and for future generations, who will inherit stronger programs they can count on when they retire.
Saving Medicare: A flaw in Medicare’s structure is driving up health-care costs, which are, in turn, threatening to bankrupt the system – and ultimately the nation. This budget saves Medicare by fixing this flawed structure so that the program will be there for future generations. These changes will not affect those in and near retirement in any way. When younger workers become eligible for Medicare, they will be able to choose from a list of guaranteed coverage options, enjoying the same kind of choices in their plans that members of Congress enjoy today. Medicare would then provide a payment to subsidize the cost of the plan. In addition, Medicare will provide increased assistance for lower-income beneficiaries and those with greater health risks. Reform that empowers individuals — with a strengthened safety net for the poor and the sick — will guarantee that Medicare can fulfill the promise of health security for America’s seniors.
Advancing Social Security solutions: The risk to Social Security, driven by demographic changes, is nearer at hand than most acknowledge. This budget heads off a crisis by forcing action from the President and both chambers of Congress to ensure the solvency of this critical program – creating the space for bipartisan solutions.
4. Reform the tax code to promote economic growth and job creation
This budget recognizes that the nation’s fiscal health requires a vibrant, growing private sector. It charts a prosperous path forward by reforming a tax code that is overly complex and unfair.
Individual tax reform: The current code for individuals is too complicated, with high marginal rates that discourage growth. This budget embraces the widely acknowledged principles of pro-growth tax reform by proposing to consolidate tax brackets and lower tax rates, with a top rate of 25 percent, while clearing out the burdensome tangle of loopholes that distort economic activity.
Corporate tax reform: American businesses labor under the highest corporate income tax in the developed world. The perverse incentives created by the corporate income tax do a lot of damage, yet the tax itself raises relatively little revenue. This budget improves incentives for job creators to work, invest, and innovate in the United States by lowering the corporate rate from 35 percent to a much more competitive 25 percent.
House Budget Committee | April 5, 2011 25
The Choice
Throughout history, Americans have selflessly tackled the difficult challenges before the republic, whether civil war, economic depression, or military threats from abroad.
From the beginning, our nation has been marked by hardship, yet defined by great courage and achievement in monumental efforts.
Each generation has been tested, and each generation has found strength in America’s highest principles and called forth its deepest virtues to make certain that the next generation inherited a stronger, more prosperous and free America.
Today, the nation’s crushing burden of debt jeopardizes this legacy.
This generation must not be the first generation to fail – to break the link that binds our past, our present and our future.
America is drawing perilously close to a tipping point that has the potential to curtail free enterprise, transform its government, and weaken its national identity in ways that may not be reversible.
In this we face two dangers: long-term economic decline as the number of makers diminishes and the number of takers grows and, worse, gradual moral-political decline as dependency and passivity weaken the nation’s character and as the power to make decisions is stripped from individuals and their elected representatives and given to non-elected bureaucracies.
The Path to Prosperity charts a different course.
This budget provides a plan for assuring that this generation upholds America’s historic legacy, rediscovers her abiding principles, and charts a new path to prosperity.
It marks a new federal commitment, assuring this nation’s workers, savers and investors that the new House majority recognizes the threat that unlimited government poses to the American way of life, and that it is determined to fulfill its commitments and responsibly restrain government’s growth.
Restoring limits to the size and scope of government is not a partisan issue. In his State of the Union Address on January 4, 1935, President Franklin Roosevelt – in words later repeated by President Ronald Reagan – warned of the threat to America’s national character from permanent dependency on government:
The lessons of history, confirmed by the evidence immediately before me, show conclusively that continued dependence upon relief induces a spiritual and moral disintegration fundamentally destructive to the national fiber. To dole out relief in this way is to administer a narcotic, a subtle destroyer of the human spirit… It is in violation of the traditions of America.
Americans truly face a monumental choice – a choice that can no longer be avoided.
The Path to Prosperity is the groundwork for a serious conversation about the future of this exceptional nation.
While an important statement of priorities, a budget is merely a blueprint for the actual work of statecraft. The elected representatives of the American people – in the House of Representatives, in the Senate and in the White House – now must take up the tools and start building the future Americans deserve.
This generation’s defining moment has arrived.
House Budget Committee | April 5, 2011 26

FISCAL YEAR2012
BUDGET RESOLUTION
House Budget Committee | April 5, 2011 27

EFFICIENT, EFFECTIVE AND RESPONSIBLE GOVERNMENT
The role of the federal government is both vital and limited. Among its core responsibilities, the federal government is tasked with defending the nation from attack and providing for the common defense; securing America’s borders; protecting innocent life; upholding laws and constitutional rights; ensuring domestic tranquility; and promoting equal opportunity for all Americans.
Consistent with the principles enshrined in America’s founding documents, “the pursuit of happiness” depends upon individual liberty, and individual liberty requires limited government. When government takes on too many tasks, it usually does not do any of them very well. It’s no coincidence that trust in government is at an all-time low now that the size of government is at an all-time high.
This budget seeks to recommit the federal government to the security of every person’s natural right to life, liberty and the pursuit of happiness. By curbing the excesses of government, a responsible, sustainable budget can focus government on its critical responsibilities.
Providing For the Common Defense
Major proposals
• Provide $692.5 billion for national defense spending in Fiscal Year 2012, an amount that is consistent with America’s military goals and strategies.
• Reduce inefficient spending by $178 billion, following guidance from Defense Secretary Robert Gates. Reinvest $100 billion of these savings into key combat capabilities, and put the rest toward deficit reduction.
The first job of government is to secure the safety and liberty of its citizens from threats at home and abroad. The United States spends a great deal on defense in nominal terms, but the share of the nation’s resources devoted to defense has declined from its Cold War average of 5.5 percent to just under 5 percent today. Defense constitutes around 20 percent of federal spending – well below the 25 percent it constituted just 30 years ago.
Like all categories of government spending, defense spending should be executed with efficiency and accountability. But a responsible budget must never lose sight of the fact that the first responsibility of the federal government is to provide for the common defense. The men and women in uniform are not mere line items on a budget spreadsheet, especially when thousands of America’s troops remain in harm’s way around the world.
America remains a nation at war. Brave men and women in uniform are engaged with a fierce enemy in Afghanistan, Iraq, and other theaters of the ongoing global war on terrorism. This budget reflects a commitment to support this nation’s troops and to prioritize national security. For Fiscal Year 2012, this committee assumes $553.1 billion in budgetary authority for the regular operations of the Department of Defense. It also assumes full funding for the modernization of the infrastructure that builds and maintains the nation’s nuclear weapons systems. In addition, this budget includes $117.8 billion for ongoing military operations in Afghanistan and Iraq.
After an exhaustive review of the Pentagon’s budget, Defense Secretary Robert Gates identified $178 billion in efficiencies and savings, $100 billion of which would be reinvested in higher priority combat capabilities.9 And conscious of the growing threat posed by the national debt to the economic foundations of national security, $78 billion of the identified savings would be dedicated to deficit reduction. The Department of Defense, under Secretary Gates’s leadership, has started to take the steps to root out waste and ensure that every taxpayer dollar is maximized to keep America safe.
The United States cannot retreat in its aggressive campaign against the global network of terrorists intent on taking American lives and destroying the American way of life. Steadfast leadership from the military, the heroism of its men and women in uniform, and the unseen efforts of the intelligence community remain instrumental in preventing terrorists from repeating the atrocities perpetrated on American soil on September 11, 2001. This
House Budget Committee | April 5, 2011 28
9 Gates, Robert M. “Statement on Department Budget and Efficiencies” (speech delivered at The Pentagon, January 06, 2011). http://www.defense.gov/speeches/speech.aspx?speechid=1527
budget reflects unequivocal support for American troops and their tireless efforts to keep America safe from harm.
Streamlining Other Government Agencies
Major proposals
• Build on continued efforts to pare back spending on non-security government bureaucracies to below 2008 levels and hold this category of spending to a five-year freeze.
• Take action to eliminate wasteful Washington spending, building upon the suggestions of the President’s Fiscal Commission, the work of the new House Majority, and the proposals put forward by an array of non-partisan, independent watchdogs that have worked to expose the abuse of taxpayer dollars.
• Boost private-sector employment by slowing the explosive growth of the public sector, achieving a 10 percent reduction over the next three years in the federal workforce through attrition, coupled with a pay freeze for the next five years and reforms to government workers’ generous benefit packages.
Since 2008, spending on non-security government agencies has increased by 24 percent – a number that jumps to 84 percent when stimulus funds are included. This massive spending spree not only failed to deliver on its promise to create jobs, but also plunged us deeper into debt.
Some in Washington have cautioned against cutting any spending now. A few continue to argue that Congress should increase this category of spending. They claim that cutting spending now would endanger the recovery.
These arguments rely on the same outdated models that predicted that the stimulus would keep unemployment below 8 percent – in reality, unemployment hit 10 percent. Endless rounds of borrowing and spending will never produce lasting prosperity. This approach has manifestly failed to deliver promised economic growth and job creation.
The problem is simple: When many families and businesses look at the size of the debt and the rate at which politicians in Washington are adding to it, they fear that America is heading for a diminished future. Instead of investing for tomorrow, consumers and businesses are approaching a weak economy and an uncertain future with great caution.
Whether branded as stimulus or rebranded as investment, government spending is no substitute for a true recovery led by the private sector. All of this borrowed money and debt is fueling uncertainty for businesses and job creators, who know that today’s deficits are tomorrow’s interest-rate and tax increases.
Ending the spending spree
Because the 111th Congress’s failed to advance a budget, failed to enact any appropriations bills, and failed to pass the legislation necessary to keep the government operating for the current fiscal year, the 112th Congress began its work in the aftermath of an unprecedented collapse of the budget process. The new House majority devoted considerable effort to repairing this budget breakdown and funding government for the current fiscal year, while simultaneously developing this Path to Prosperity budget for Fiscal Year 2012.
In early February, the House of Representatives passed legislation, H.R. 1, to fund the federal government for the remainder of 2011.10 This legislation would have spent $100 billion less than the President had requested – the largest spending reduction in non-defense discretionary spending in the history of the republic – and would have eliminated spending on 149 government programs while reducing spending in approximately 650 additional government programs.
House Budget Committee | April 5, 2011 29
10 U.S. Congress. House. Full-Year Continuing Appropriations Act, 2011. H.R. 1. 112th Cong., 1st sess., 2011. http://www.gpo.gov/fdsys/pkg/BILLS-112hr1ih/pdf/BILLS-112hr1ih.pdf

Senate Democrats have blocked this legislation, so the debate over funding for the current fiscal year continues. In the meantime, however, this budget builds upon all of the cuts passed by the House of Representatives on February 19, 2011. These cuts reduced government spending on non-security government agencies to the levels that prevailed in 2008 – before the stimulus, the bailouts, and the President’s spending spree.
Getting spending back to 2008 levels is a necessary first step. In the last two years, the budgets for many domestic agencies have grown far beyond what is justified by their properly limited missions. For example, the Environmental Protection Agency’s (EPA) budget has grown by 36 percent since 2008 – a number that jumps to 131 percent when the stimulus is included. The EPA has not been secretive about what it plans to do with this money: It seeks to implement a unilateral version of the job-destroying cap-and-tax program that failed to pass the Senate last year.
House Budget Committee | April 5, 2011 30
RESTRAINING THE GROWTH OF GOVERNMENT BY REPEALING THE HEALTH CARE LAW
Perhaps there is no question more hotly disputed in Washington than what to do about the rapidly rising cost of health care. There appear to be two contrasting approaches to solving this difficult problem:
1.Put the government in charge of ever-increasing swaths of the health care marketplace, and so let bureaucrats determine prices and dictate treatment options to doctors and patients; or
2.Give patients more control over the money this nation spends on health care, and so let competition in the marketplace control costs, improve quality, and expand access.
Option 1 raises two questions: Would this really control health care costs? And, if so, at what cost to the nation’s freedom? To answer the first question is to answer the second: If government alone could determine the price of all medical services by fiat; forbid doctors and hospitals to leave the system; require all Americans to participate; and prevent patients from using too much of this “free” health care by imposing tight restrictions on every American’s access to treatment – then it is possible that health care costs would cease their relentless rise. However, as James Capretta, a budget and health care expert, testified before the House Budget Committee, the federal government has attempted countless times to regulate health care to control costs and invariably these proposals have failed and costs have continued to climb.
Nevertheless, even if these efforts worked, the tradeoff in terms of lost freedom would be completely unacceptable. This approach would transform the relationship between citizen and state, leaving individuals helplessly dependent on their government. On a more practical level, it would substantially diminish quality of and access to care. There is no way for “experts” in Washington to know more about the health care needs of individual Americans than those individuals and their doctors know.
The new health-care law, rammed through Congress last year on a partisan vote, has taken the nation one step closer to this fully government-run system. The problems with this approach are already popping up all over the country. Health care costs continue to escalate relentlessly. The new law has aggravated the worst aspects of the U.S. health care system, without fixing what was broken.
The country needs to move away from this centralized system, not towards it. This budget starts by repealing the costly new government-run health care law, saving roughly $725 billion over ten years by repealing the new exchange subsidies and making sure that not a penny goes toward implementing the new law. Then, this budget goes further with reforms that make government health-care programs more responsive to consumer choice.

Another example can be found at the Department of Health and Human Services, where the baseline budget has swelled by nearly 15 percent over the last two years as the administration has staffed up to implement its disastrous new health care law. This law has taken the nation one step closer to a fully government-run health care system. It has aggravated the worst aspects of the health care system, without fixing what was broken. This budget repeals it to make way for true, patient-centered reforms.
These cases demonstrate that the massive budget increases of the last two years have served, not to help agencies meet existing missions more effectively, but to create new missions that lie beyond the proper scope of the federal government and serve dubious public policy goals.
But Washington’s spending problem did not just develop in the last two years. It will require even more work to undo the damage of years of reckless spending increases. This budget restores fiscal discipline to a government that badly needs it by reducing spending below the levels set by H.R. 1. It does this, not through indiscriminate cuts, but by assuming the elimination of dozens of wasteful and duplicative programs identified by non-partisan watchdogs and government auditors.
Eliminating wasteful spending
This budget works to ensure that government agencies can operate effectively and efficiently at these levels by targeting wasteful and duplicative programs for elimination. In doing so, it builds on the successes of independent watchdogs and draws on good ideas from both sides of the aisle. With this budget, Congress finally incorporates many common-sense proposals for reducing waste that went unheralded for too long.
Anti-Fraud Accounts: The federal government wastes billions of American taxpayers’ dollars each year by making improper payments to individuals, organizations, and contractors. In 2010 alone, the federal government made an estimated $125 billion in improper payments. This budget funds targeted increases in anti-fraud accounts, saving billions of dollars in waste, fraud, and abuse in the Medicare, Medicaid, Unemployment Insurance, Supplemental Security Income, and Disability Insurance programs. This budget anticipates the enactment of legislation that together with the anti-fraud spending increases would save a total of $26 billion over the next ten years.
Earmark ban: Under the watch of both political parties, Congress grew addicted to the practice of pork-barrel spending. Taxpayers were rightfully angered to learn of their hard-earned tax dollars squandered on the infamous Bridge to Nowhere in Alaska and the Rain Forest Museum in Iowa. More troubling than these egregious examples of waste is the corruptibility of the process. Earmarks aren’t inherently problematic, but when former members of Congress are in jail for selling earmarks, there’s something seriously wrong with the process.
In the 111th Congress, House Republicans established a self-imposed ban on the practice of pork-barrel spending through the broken earmark process. The new House majority earlier this year expanded this earmark moratorium for the entire House. This budget continues to ban the practice for Fiscal Year 2012. This is not a partisan issue – it is a good-government issue.
Fiscal Commission recommendations: The President’s Fiscal Commission recommended several ways to achieve discretionary savings.11 This budget adopts many of their proposals, such as reducing the federal auto fleet by 20 percent, excluding the Department of Defense and the U.S. Postal Service. In 2010, the federal government reported a worldwide inventory of over 662,000 vehicles and spent $4.6 billion on its fleet. In addition, the 2009 stimulus bill provided $300 million to “green the federal fleet” by purchasing 17,205 vehicles – a back-door bailout for the already bailed-out automakers.
This budget builds on the Fiscal Commission’s recommendation by proposing to sell a portion of the federal fleet to reduce the deficit and to get rid of unneeded vehicles, saving hundreds of millions of dollars.
The Fiscal Commission highlighted another area where the mismanagement of taxpayer-owned assets and the sheer amount of waste are staggering: federal real estate and other property. Simply put, there is very little incentive for agencies to dispose of unneeded properties and very few repercussions from holding onto these properties indefinitely. The federal government owns, leases or manages about one million properties
House Budget Committee | April 5, 2011 31
11 The National Commission on Fiscal Responsibility and Reform. The Moment of Truth.

nationwide. Of those, non-defense buildings accounted for at least 400,000 of the total. And yet, the government’s track record for real estate asset sales has been very poor.
In 2009, federal agencies only received about $50 million in proceeds from the sale of 2,228 assets – an average of $22,500 per property. Many buildings were simply given away as below-market-value bargains or even for free. On top of that, agencies reported spending $150 million in 2009 on the operating costs alone of properties that were already deemed to be unneeded and were waiting to either be sold or disposed.
The government can and must do a better job managing and selling assets that are the rightful property of taxpayers. This budget supports streamlining the process and loosening regulations for the disposal and sale of federal property to eliminate red tape and waste, setting enforceable targets for asset sales, and holding government agencies accountable for the buildings they oversee. If done correctly, taxpayers can recoup billions of dollars from selling unused government property.
Government Accountability Office (GAO) recommendations: Each year, in response to a new statutory requirement, GAO issues a report on eliminating duplicative government programs and saving taxpayers money. This year, in their inaugural report, GAO identified dozens of examples of waste and over $100 billion in savings.12 This budget draws inspiration from the GAO’s recommendations in many areas, one of which is the Highway Trust Fund.
Over the past decade, highway spending has mostly exceeded the gas-tax revenues that finance the fund, because gas-tax levels leveled off while spending grew. Spending, meanwhile, has increasingly been diverted to non-highway projects, such as bike trails and museums, and politicized through earmarks such as the Bridge to Nowhere mentioned above.
To make up for funding shortfalls, the trust fund has required three large transfusions of taxpayer dollars from general revenues, totaling $35 billion since 2008. Without reform, another infusion will be necessary in 2013. This budget anticipates that Congress can keep the Highway Trust Fund solvent without additional general fund transfers or increases in the gasoline tax by consolidating dozens of separate highway programs that GAO has identified as duplicative. This will help focus every dollar on pursuing a targeted and cohesive national transportation policy.
YouCut: Last year, House Republicans launched an initiative to engage the American people in a project to help change Washington’s pervasive culture of spending. Led by then-House Minority Whip Eric Cantor, the program – dubbed “YouCut” – identified several egregious spending items, allowing the American people to cast their vote on what spending cut they’d like to see the House floor vote on.13 The program continued into the new majority, with several specific pieces of legislation having passed the House of Representatives.
This budget builds on the proposals that have emerged from the YouCut process, such as the idea to eliminate the printing for member offices of every introduced bill. Whenever a member of Congress introduces a bill or resolution, the Government Printing Office prints several hundred paper copies. In the last Congress, members introduced 13,683 bills and resolutions, which works out to millions of paper copies.
While some copies may be necessary for the official record-keeping of Congress, many of them are typically thrown away. This year Congress will spend approximately $7 million printing bills and resolutions. Eliminating excessive printing in favor of making sure that bills are available online for anyone to examine will achieve significant savings for taxpayers, while still ensuring accountable and open government.
Other examples of wasteful spending: This budget doesn’t just take the recommendations of others – it draws upon House Budget Committee investigations that combed the federal budget for other examples of wasteful spending. While no federal department is free of inefficiency, the Department of Transportation offered a number of areas where spending could be cut back responsibly.
House Budget Committee | April 5, 2011 32
12 Government Accountability Office. Opportunities to Reduce Potential Duplication in Government Programs, Save Tax Dollars, and Enhance Revenue.
13 http://www.majorityleader.gov/YouCut/

Since 2008, funding for the Department of Transportation has grown by 24 percent – and that doesn’t count the stimulus spike, which nearly doubled transportation spending in one year. The mechanisms of federal highway and transit spending have become distorted, leading to imprudent, irresponsible, and often downright wasteful spending. Further, however worthy some highway projects might be, their capacity as job creators has been vastly oversold, as demonstrated by the extravagant but unfulfilled promises that accompanied the 2009 stimulus bill, particularly with regard to high-speed rail.
In the wake of these failures, and with the federal government’s fiscal challenges making long-term subsidization infeasible, high-speed rail and other new intercity rail projects should be pursued only if they can be established as self-supporting commercial services. The threat of large, endless subsidies is precisely the reason governors across the country are rejecting federally-funded high-speed rail projects. This budget eliminates these projects, which have failed numerous and clear cost-benefit analyses.
Slowing the bureaucracy’s explosive growth
The federal government has added 155,000 new workers since the President took office. It is no coincidence that private-sector employment continues to recover only sluggishly while the government grows at breakneck speeds. To fuel the public sector’s growth, Washington must either tax the private sector or issue debt (i.e. impose a deferred tax upon the private sector).
The federal government’s responsibilities are dependent on a strong federal workforce. Federal workers deserve to be compensated for their important work, but pay levels, pay increases and benefit packages need to be reformed to be in line with the private sector.
Salaries for federal workers continue to outpace pay for their private-sector counterparts. Average wages in the federal civilian workforce ($74,311 in 2010) far eclipse the $49,777 median wages in private industry. When generous benefit packages are included, the advantages enjoyed by government workers are even more pronounced. The roughly 2 million federal civilian workers received average compensation packages of $101,628 in 2010, far in excess of their private-sector counterparts. Immune from the effects of the recession, federal workers have received regular salary bumps and cost-of-living-adjustments, regardless of productivity or economic realities.
The reforms called for in this budget aim to slow the federal government’s unsustainable growth, and reflect the growing frustration of workers across the country at the different set of rules enjoyed by government employees. It reduces the public-sector bureaucracy, not through layoffs, but via a gradual, sensible attrition policy, permitting the federal government to hire only one new employee for every three federal workers who retire. By 2014, this reform would result in a 10 percent reduction in the federal workforce.
Additionally, it freezes federal pay through 2015. And it reduces taxpayers’ disproportionate share of the financing for the Federal Employee Pension Plan by requiring federal employees to pay for half of the defined benefit they receive at retirement, an increase from their current contribution of 0.8 percent of payroll. This proposal takes its cue directly from the Fiscal Commission.14 When combined, these proposals will save taxpayers approximately $375 billion over ten years.
Ending Corporate Welfare
Major proposals
• Revisit the financial-reform regulation enacted hastily last year and eliminate provisions that make future bailouts more likely.
• Privatize the business of government-owned housing giants, Fannie Mae and Freddie Mac, so that they are no longer exposing taxpayers to trillions of dollars’ worth of risk.
• Restore competition and exploration as the key to a vibrant energy sector, and gets the government out of the business of picking winners and losers.
House Budget Committee | April 5, 2011 33
14 The National Commission on Fiscal Responsibility and Reform. The Moment of Truth.

• Reflect the economic reality of record-high farm income by restructuring farm programs, saving taxpayers money and increasing farmer independence.
Growing concern with the expansive growth of government is not limited to the resources taken from the private sector in the form of taxes and borrowing. There is a growing and pernicious trend of government overreach into the private economy, stacking the deck in favor of entrenched interests and stifling growth. Encroaching into industries across the U.S. economy, corporate welfare represents a threat to both America’s fiscal sustainability and its economic dynamism. This budget not only seeks to limit the size of government, but also reestablish the proper purpose of government.
Companies have a right to pursue their narrow self-interest, but when these actions involve reducing open competition and transparency for short-term gain, they undermine the very free enterprise system that made their success possible. Regressive taxpayer funding lavished upon large banks, auto companies, and others rarely makes for sound public policy, but such forms of corporate welfare are especially irresponsible in the face of record budget deficits and a crushing burden of debt.
This budget charts a path forward for a limited, effective government to get out of the business of picking winners and losers in the economy. Government reforms must aim always to reduce hurdles for entrepreneurs and small businesses to create and innovate, not raise barriers for new market participants by stacking the deck in favor of entrenched interests. At a time when private-sector job growth is urgently needed, government shouldn’t stifle America’s engines of job creation.
Ending the bailouts
This budget proposes to end the cycle of future bailouts perpetuated by the financial-regulation law authored last year by Senator Chris Dodd and Representative Barney Frank (Dodd-Frank).
Their financial overhaul is not reform. Its fundamental architecture expands and centralizes power in Washington, doubling down on the root causes of the 2008 crisis. It contains layer-upon-layer of new bureaucracy sewn together by complex regulations, yet it fails to address key problems, such as Fannie Mae and Freddie Mac, that led to the worst financial meltdown in recent history. Although the bill is dubbed “Wall Street Reform,” it actually intensifies the problem of too-big-to-fail by giving large, interconnected financial institutions advantages that small firms will not enjoy.
While the authors of Dodd-Frank went to great lengths to denounce bailouts, this law only sustains them. The Federal Deposit Insurance Corporation (FDIC) now has the authority to access taxpayer dollars in order to bail out the creditors of large, “systemically significant” financial institutions. CBO’s expected cost for this new authority is $26 billion, although CBO Director Douglas Elmendorf recently testified that “the cost of the program will depend on future economic and financial events that are inherently unpredictable.” In other words, another large-scale financial crisis in which creditors are guaranteed to get government bailouts would cost taxpayers much, much more.
This budget would end the regime now enshrined into law that paves the way for future bailouts. The federal government has a critical role in helping to ensure financial markets are fair and transparent, and in holding accountable those who violate the rules. Future reforms should aim to restore the principles that have made American capital markets the envy of the world: freedom to participate, an unbreakable link between performance and reward, continued attachment to risk, and a sense of responsibility that ensures that those who seek to reap the gains also bear the full risk of losses.
Reforming Fannie Mae and Freddie Mac
Since the government creation of their duopoly, government-sponsored enterprises (GSEs) Fannie Mae and Freddie Mac have dramatically altered mortgage markets in the United States, ultimately contributing to their precipitous collapse in 2008. Fannie’s and Freddie’s core business is to increase the supply of mortgage credit by purchasing loans and packaging them into mortgage-backed securities (MBS) that carry the GSEs’ guarantee of principal and interest. They also issue debt securities in the capital markets to finance purchases of mortgages and MBS they hold in their portfolios.
House Budget Committee | April 5, 2011 34

In the years leading up to the housing crisis, and with the help of some lawmakers in Congress, Fannie and Freddie abused their roles in stimulating homeownership. They began to replace prudent lending standards with a drive to guarantee and hold more mortgages, some of them risky, in order to maximize commissions. This squeezed much healthy underwriting out of the private sector, driving it increasingly to riskier, more exotic mortgage instruments. When the real estate market cooled in mid-2008, housing values began to nosedive, foreclosures rose sharply, and Fannie and Freddie experienced staggering losses as a result. The U.S. government was on the hook for the housing goliaths they had created and chartered.
The GSEs’ losses were so severe that they were placed into conservatorship in September 2008, with the Department of the Treasury taking a major ownership interest in both. As a result, CBO made Fannie and Freddie an explicit part of the federal budget, accounting for their liabilities as liabilities of the government. CBO estimated a $248 billion cost of bringing their existing losses onto the government books in 2009. While under conservatorship, CBO estimates that Fannie and Freddie could cost taxpayers an all-in $370 billion through 2021. In contrast, the administration does not fully account for the taxpayer exposure of Fannie and Freddie, instead leaving them off-budget.
So far, Treasury has bailed out Fannie and Freddie to the tune of $150 billion. Fannie Mae, Freddie Mac, and another government housing agency, Ginnie Mae, now own or insure 95 percent of the entire U.S. housing market. On their current course, the GSEs represent a failed experiment in corporate welfare and the largest bailout of financial institutions in recent history. Corporate welfare arrangements like the GSEs socialize risk by shifting losses to the taxpayers, but allow profits to accrue to management, bondholders and Wall Street institutions that trade mortgage-backed securities.
This budget will put an end to the practice of corporate welfare and taxpayer bailouts in housing finance. It proposes eventual elimination of Fannie Mae and Freddie Mac, winding down their government guarantee and ending taxpayer subsidies. It supports increasing the guarantee fees Fannie and Freddie charge lenders in order to bring private capital back, shrinking their retained portfolios, and enacting various measures that would bring transparency and accountability to the GSEs. At the same time, it will put in place measures to discourage shifting of taxpayer risk to the Federal Housing Administration and other government-backed entities as Fannie and Freddie are dismantled.
The housing-finance system of the future will allow private-market secondary lenders to fairly, freely and transparently compete, with the knowledge that they will ultimately bear appropriate risk for the loans they guarantee. Their viability and profitability will be determined by the soundness of their practices and the value of their services.
Eliminating welfare for energy companies
Since his inauguration, the President has promoted a heavy-handed compliance culture in the energy sector, brimming with regulations and reckless spending on government-appointed winners and losers. Instead of promoting policy rooted in innovation and the entrepreneurial strength of American business, the President’s agenda has consolidated decision-making in Washington through a toxic mix of increased spending and more regulations.
Regulations have extracted some $1.75 trillion per year from the economy, according to a recent report from the Small Business Administration, including $281 billion for environmental regulations that disproportionately hit small businesses.15 The President has also stifled domestic energy production by blocking or delaying production both onshore and offshore, destroying jobs and idling American energy sources. The stimulus alone allocated $80 billion of taxpayers’ dollars specifically for politically favored renewable-energy interests.
The results are plain to see: Gas prices have more than doubled since the President took office. Burdensome and ineffective regulations on businesses in the service of dubious environmental goals have driven up the prices of many products and services, while creating barriers for needed capital investment and job creation.
House Budget Committee | April 5, 2011 35
15 Crain, Nicole V. and W. Mark Crain. “The Impact of Regulatory Costs on Small Firms.” Small Business Research Survey. September 2010. http://archive.sba.gov/advo/research/rs371.pdf

To stop Washington’s policies that are driving up gas prices, and to expand American energy production and create more American jobs, the new House majority launched the American Energy Initiative earlier this year.16 This initiative provides a critical check on policies that make it more difficult to reduce dependence on fossil fuels from foreign nations.
It scales back spending on government bureaucracies seeking to impose a job-destroying national energy tax. It assumes increased revenues from bonus bids, rents, royalties, and fees as a result of lifting moratoriums and bans on safe, environmentally responsible exploration for domestic energy supplies. And it encourages the development of American-made renewable and alternative energy sources, including nuclear, wind, solar, and more, affirming the position that environmental stewardship and economic growth are not mutually exclusive goals.
This budget would continue funding essential government missions, including energy security and basic research and development, while paring back spending in areas of duplication or non-core functions, such as applied and commercial research or development projects best left to the private sector.
Ultimately, the best energy policy is one that encourages robust competition and innovation to ensure the American people an affordable and stable supply of energy. This budget would roll back federal intervention and expensive corporate-welfare funding directed to the president’s allied industries. Instead, it would promote policies aimed at reliable energy, lower energy prices, greater revenue generation through prosperity, and market-based solutions to the goal of sustainable energy.
Aligning agricultural programs with economic reality
Against the backdrop of an overall economy that is recovering slowly, the American agricultural sector is racing ahead. The record-breaking prosperity of American farmers and farm communities is to be celebrated. But it also calls for a re-examination of federal agricultural programs that spend billions each year, to ensure that taxpayers aren’t funding support for a sector that is more than capable of thriving on its own.
Net farm income this year is forecast to be the second-highest recorded in the past 35 years. Production costs have risen, but income has risen faster as prices for major commodities such as corn and soybeans have outstripped even the rising cost of energy. The top five earnings years for farmers in the last 35 years have occurred in the last decade. Yet, at the same time, numerous overlapping government programs exist to provide income support to farmers.
With crop prices – and deficits – hitting new highs, it is time to adjust support to this industry to reflect economic realities. This budget proposes two major reforms to achieve this: First, reduce the fixed payments that go to farmers irrespective of price levels, to reflect that soaring commodity prices are reducing the need for high levels of farm-income support. Second, reform the open-ended nature of the government’s support for crop insurance, so that agricultural producers assume the same kind of responsibility for managing risk that other businesses do.
Recognizing that the Agriculture Committee is responsible for implementing these reductions, and to maintain flexibility for the Agriculture Committee, this proposal assumes that these savings do not take effect until the beginning of the next farm bill. These reforms will save taxpayers nearly $30 billion over the next decade.
Changing Washington’s Culture of Spending
Major proposals
• Establish a cap on discretionary spending for fiscal year 2012, and outline a path for enforceable statutory caps for the next decade.
• Establish a binding cap on total spending as a percentage of the economy at levels projected to result from this budget resolution. Caps on the total size of government would be enforced by sequester.
House Budget Committee | April 5, 2011 36
16 http://www.facebook.com/AmericanEnergy

• Require any increase in debt levels to be accompanied by spending reductions to levels set this budget resolution. If Congress fails to achieve these spending reductions, there will be an across-the-board spending reduction at the end of the year.
• Create a budget point of order against legislation that would increase net mandatory spending beyond the ten-year window of the budget resolution, a limitation that can help check congressional appetite to create costly open-ended entitlement programs.
• Close the loophole that allows discretionary limits to be circumvented through advance appropriations.
• Take mandatory spending off of autopilot by requiring regular congressional review of mandatory spending programs, and outline path to allow Congress to make mandatory spending subject to the appropriations process.
The rules in Washington are stacked in favor of people who want to spend money. The federal budget process contains numerous structural flaws that bias the government toward ever-higher levels of spending. Large swaths of the budget are not held accountable on an annual basis, and federal budget rules assume that taxpayer money belongs to Washington, not taxpayers.
A handful of simple budget-process reforms could start to correct this bias in favor of a government that spends – and taxes – only as much as it needs. This budget closely scrutinizes not only what Washington spends, but also the manner in which the American peoples’ hard-earned tax dollars are spent. It follows the lead of the President’s Fiscal Commission, which put forward several bold budget process reforms, including statutory discretionary spending caps enforced by automatic across-the-board cuts if spending exceeds these caps.17
This reform and others would make it easier for spending hawks in Congress to ensure the responsible stewardship of American’s tax dollars. This budget includes many bold proposals for reducing spending so that government lives within its means. But these spending reductions won’t last unless Congress enacts real caps to ensure that the gains we make today will last into the future.
House Budget Committee | April 5, 2011 37
17 The National Commission on Fiscal Responsibility and Reform. The Moment of Truth.

STRENGTHENING THE SOCIAL SAFETY NET
There is a widely shared consensus in this country in support of a strong safety net for Americans who, through no fault of their own, have fallen on hard times. However, the government programs that make up this safety net are failing both the citizens who rely on them and the taxpayers who fund them. It should not come as a surprise that a system designed in the 1960s is not equipped to deal with the unique pressures of the 21st century.
From a budgetary perspective, these programs are growing at an unsustainable rate. Medicaid spending is growing by over 7 percent a year – far faster than the growth of the overall economy. Federal spending on food stamps has quadrupled over the past ten years. And spending on federal rental assistance programs has increased by 33 percent since 2006. This rate of spending will strain the safety net until it breaks, necessitating much higher taxes on all Americans and indiscriminate cuts that hit the poorest Americans the hardest.
From a moral perspective, these programs are failing the very people they are intended to help. First, the strains they have placed on federal and state budgets have effectively broken these programs, especially Medicaid. In response to budget constraints, governments continually underpay doctors and hospitals – making across-the-board cuts to a one-size-fits-all program instead of implementing smart reforms that allow states to carefully tailor benefits. As a result, doctors and nurses are fleeing the system to escape endless red tape and underpayments. Meanwhile, beneficiaries are left with fewer provider choices and reduced access to care.
Second, many of these programs do not provide beneficiaries with the tools they need to bounce back into self-sufficient working lives as quickly as possible. Bipartisan efforts in the late 1990s transformed cash welfare by encouraging work, limiting the duration of benefits, and giving states more control over the money being spent. Opponents of these reforms said that they would lead to large increases in poverty and despair.
Instead, the exact opposite occurred. These reforms cut welfare caseloads in half against a backdrop of falling poverty rates. Child-poverty rates fell by 1 percent per year in the five years following the passage of the 1996 welfare-reform bill. Today, a smaller percentage of American children live in poverty than in 1995, even though the nation is still emerging from a severe recession.18
These reforms worked because the best welfare program is one that ends with a job and a stable, independent life for the individual. Now it is time to implement these same reforms across other areas of the social safety net, especially Medicaid (medical care for the poor), the Supplemental Nutrition Assistance Program (the food stamp program), various federal housing initiatives, and other programs that have not been significantly reformed since they were created decades ago.
If government is going to require able-bodied recipients of aid to find work, as it should, then it must also do a better job of helping them bounce back into productive working lives. Federal education and job-training programs are badly in need of updating in order to keep the workforce competitive in a 21st-century, global economy. The government must do a better job of targeting resources to make sure America’s workforce is adaptable and its workers are secure.
The safety net should never become a hammock, lulling able-bodied citizens into lives of complacency and dependency. Instead, the aim should be to empower individuals, putting them in stronger position to achieve. Government can play a positive role in this area with policies aimed at helping the less fortunate get back on their feet while encouraging the chronically impoverished to achieve greater control over their lives.
In proposing reforms that promote independence, this budget not only builds on the successes of the reforms of the late 1990s – it also draws upon ideas embodied in The Welfare Reform Act of 2011, a legislative proposal put forward by Republican Study Committee Chairman Jim Jordan, House Budget Committee Vice Chairman Scott Garrett, House Budget Committee member Jason Chaffetz, and other reformers in the House.19
House Budget Committee | April 5, 2011 38
18 U.S. Census Bureau. Poverty Data. “Table 3. Poverty Status of People, by Age, Race, and Hispanic Origin: 1959 to 2009” http://www.census.gov/hhes/www/poverty/data/historical/hstpov3.xls (accessed March 31, 2011).
19 U.S. Congress. House. The Welfare Reform Act of 2011. H.R. 1167. 112th Cong., 1st sess., 2011. http://rsc.jordan.house.gov/UploadedFiles/JORDAN_009_xml.pdf

Repairing a Broken Medicaid System
Major proposals
• Secure the Medicaid benefit by converting the federal share of Medicaid spending into a block grant tailored to meet each state’s needs, indexed for inflation and population growth. This reform ends the misguided one-size-fits-all approach that has tied the hands of so many state governments. States will no longer be shackled by federally determined program requirements and enrollment criteria. Instead, they will have the freedom and flexibility to tailor a Medicaid program that fits the needs of their unique populations.
• Improve the health-care safety net for low-income Americans by giving states the ability to offer their Medicaid populations more options and better access to care. Medicaid recipients, like all Americans, deserve to choose their own doctors and make their own health care decisions, instead of having Washington dictate those decisions for them.
• Save $750 billion over ten years, contributing to the long-term stabilization of the federal government’s fiscal path and encouraging fiscal responsibility at the state level.
Medicaid, the program created in the 1960s to provide health-care coverage for the poor, is coming apart at the seams. The open-ended nature of the program’s financing structure has created rapidly rising costs that are nearly impossible to check. In 1966, the first year of the program’s operation, total costs were $400 million. By 2009, the total cost of administering Medicaid had soared to $378.6 billion. Absent fundamental reform, costs are expected to continue climbing and are expected to reach a total of $840 billion by 2019.
Under Medicaid, state governments and the federal government share the cost of providing medical services to low-income families. But a flawed federal-state matching formula has fueled runaway state spending – and the results in terms of state debt are plain to see. Medicaid is now the largest line-item on most states’ budgets – surpassing even education – and accounted for 22 percent of total state spending in 2010.
Meanwhile, much of the federal government’s share of the spending is wasted because the bureaucracy cannot provide adequate oversight of this open-ended program: Medicaid’s improper payment rate is over 10 percent, more than three times the amount of waste that other federal agencies generate. This translates into $33 billion worth of waste each year.
Medicaid’s current structure gives states a perverse incentive to grow the program and little incentive to save. The federal government pays an average of 57 cents of every dollar spent on Medicaid. Expanding Medicaid coverage during boom years is tempting and easy to do – state governments pay less than half the cost of such expansions. Yet to restrain Medicaid’s growth, states must rescind a dollar’s worth of coverage to save 43 cents.
Moreover, states are not given adequate flexibility when it comes to achieving those savings – one-size-fits-all federal mandates tie their hands with regard to coverage options, and many times the only way states can achieve savings is through formulaic cuts to medical providers. This is why so many doctors refuse to take Medicaid – states have reduced their reimbursements below what the market will bear.20
For doctors who see Medicaid patients at below-market reimbursement rates, losses are shifted to non-Medicaid patients.21 The cost-shifting that occurs from government rationing remains a significant contributor to health inflation, which in turn puts quality, affordable health coverage out-of-reach for an increasing number of Americans.
At the same time, federal spending has followed the same exploding trajectory as states. The Congressional Budget Office estimates that federal spending on Medicaid will grow annually by 7 percent from nearly $260
House Budget Committee | April 5, 2011 39
20 Sack, Kevin. “As Medicaid Payments Shrink, Patients Are Abandoned.” The New York Times, March 15, 2010 http://www.nytimes.com/2010/03/16/health/policy/16medicaid.html (accessed March 31, 2011).
21 Trapp, Doug. “Low Medicare, Medicaid Pay Rates Impact Private Costs.” American Medical News, January 5, 2009 http://www.ama-assn.org/amednews/2009/01/05/gvsb0105.htm (accessed March 31, 2011).

billion in 2012 and to nearly $560 billion within the next ten years. Should this problem continue to be ignored, two outcomes are inevitable: significant cuts in benefits and massive tax increases.
All Americans will pay more because of this broken Medicaid system – and not just in higher taxes. Because Medicaid’s reimbursement rates have been ratcheted down to below-market levels, the care that Medicaid patients receive is often substandard. Recent studies have indicated that Medicaid patients are more likely to die after coronary artery bypass surgery, less likely to get standard care for blocked heart arteries, and more likely to die from treatable cancer, than those with other coverage options.22 By some measures, such as in-hospital death rates following major surgeries, Medicaid patients fared even worse than the uninsured.23
Medicaid has fostered a two-tiered hierarchy within the health-care marketplace that stigmatizes Medicaid enrollees, and its perverse funding structure is exacerbating budget pressures at the state and federal level, while creating a mountain of waste. With administrators looking to control costs and providers refusing to participate in a system that severely under-reimburses their services, Medicaid beneficiaries are ultimately left navigating an increasingly complex system for even the most basic procedures. Absent reform, Medicaid will not be able to deliver on its promise to provide a sturdy health-care safety net for society’s most vulnerable.
The key to the welfare reform of the late 1990s was Congress’s decision to grant states the ability to design their own systems. It is now time to grant them the same flexibility with regard to Medicaid.
House Budget Committee | April 5, 2011 40
22 Gottlieb, Scott, M.D. “Medicaid Is Worse Than No Coverage at All.” The Wall Street Journal, March 10, 2011 http://online.wsj.com/article/SB10001424052748704758904576188280858303612.html (accessed March 31, 2011).
23 Ibid.
STOPPING THE ABUSE OF MEDICAID BY REPEALING THE HEALTH CARE LAW
One of the most problematic aspects of the health care law enacted last year is that it puts an additional 20 million Americans by 2019 into a Medicaid system that is fundamentally broken.
Medicaid is failing the 50 million Americans it already serves. A growing number of physicians and hospitals will no longer accept large numbers of Medicaid patients, as federal and state governments have reduced reimbursement rates to the point where doctors are losing money every time a Medicaid patient walks through their doors. Pushing even more people into this broken system will only put additional strain on those provider networks that are still willing to take Medicaid patients. The result will be poor-quality care and long waits for vulnerable citizens.
Medicaid is putting too much strain on federal and state budgets as it is. State budgets are strained to the breaking point by a Medicaid system that doesn’t work, and the federal government’s share of the burden is unmanageable. The new health care law would make this problem worse by increasing federal spending by $627 billion over the next decade, according to CBO. And according to Medicaid’s non-partisan chief actuary, state spending is projected to grow to over $327 billion by 2019.
The new law makes bad incentives worse, not better. Making matters worse, the federal government will temporarily pay 100 percent of the costs of new enrollees, reducing incentives for states to control Medicaid costs. This window of more generous federal funding will encourage states to add as many new people to their Medicaid rolls as they can while the federal government is picking up the tab. However, states will eventually be on the hook for additional costs.
The way forward in Medicaid is to follow the reforms included in this budget, not expand a broken program. Repealing the new law and replacing it with true, patient-centered reforms will better serve Medicaid patients while contributing to solvency of federal and state budgets.

Offering states more flexibility for their Medicaid beneficiaries will remove the stigma Medicaid recipients face, and allow them to take advantage of a range of options available. Several of the nation’s governors have made innovative proposals to fix Medicaid. This budget encourages further efforts in this direction.
Protecting Assistance for Those in Need
Major proposals
• Convert the Supplemental Nutrition Assistance Program (SNAP) into a block grant tailored for each state’s low-income population, indexed for inflation and eligibility beginning in 2015 – after employment has recovered. Make aid contingent on work or job training.
• Encourage recipients of federal housing aid to lead lives of increased self-sufficiency by decreasing disparities between assisted and unassisted renters and by making aid contingent on work or job training.
The welfare reforms of the late 1990s are a success story of modern domestic policy, but they did not go as far as many think. Reformers were not able to extend their work beyond cash welfare to the other 77 means-tested programs that the federal government operates. Notably, programs that subsidize food and housing for low-income Americans remain dysfunctional, and their explosive growth is threatening the overall strength of the safety net. If the government continues running trillion-dollar deficits and experiences a debt crisis, the poor and vulnerable will undoubtedly be the hardest hit, as the federal government’s only recourse will be severe, across-the-board cuts.
The Supplemental Nutritional Assistance Program (SNAP, formerly known as food stamps) serves a vital role in the safety net by providing food aid to low-income Americans. But this program cannot continue to grow at its current rates. The cost of this program has exploded in the last decade, from less than $18 billion in 2001 to over $80 billion today. As recently as 2007, SNAP was projected to cost slightly less than $400 billion over 10 years. Currently, it is projected to cost almost $700 billion.
Much of this is clearly due to the recession, but not all of it: Enrollment has grown from 17.3 million recipients in 2001, to 23.8 million in 2004, to 28.2 million in 2008, to 44.3 million today. The trend is one of relentless and unsustainable growth – the large recession-driven spike came on top of very large increases that occurred during years of economic growth.
The blame lies with the same flawed structure that has fueled unsustainable growth in Medicaid. State governments receive federal dollars in proportion to how many people they enroll in the program, which gives them an incentive to add individuals to the rolls. States have little incentive to do everything they can to make sure that able-bodied adults on food stamps are working, looking for work, or enrolled in job training.
Spending on Federal Housing Assistance, by contrast, isn’t growing due to flawed state formulas or even because of the recession – it is growing because policymakers are choosing to grow it, and because there are no time limits or work requirements that encourage recipients to lead lives of increased self-sufficiency. Federal rental subsidies have increased by 33 percent since 2006, and the President’s budget would increase them even further. This is taking the nation’s welfare policy in the wrong direction – America needs a strong safety net, not one that is strained to the breaking point.
As it does with regard to Medicaid, this budget would extend the successes of welfare reform to food aid and housing by implementing reforms that give states more flexibility to meet the needs of low-income populations and to make sure that the truly needy receive the assistance they need to live meaningful, independent lives.
With regard to SNAP, this budget proposes to apply two of the reforms that guided the success of welfare reform in the late 1990s. First, it ends the flawed incentive structure that rewards states for signing up ever-higher numbers of recipients. By capping the open-ended federal subsidy and freeing states to come up with innovative approaches to delivering aid to those who truly need it, this reform encourages states to reduce rolls and help recipients find work. Second, it calls for the kind of time limits and work requirements that proved successful at cutting welfare rolls in half and reducing poverty nationwide. These changes would be phased in gradually, however, to give states and recipients time to adjust and the economy time to recover.
House Budget Committee | April 5, 2011 41

With regard to housing, this budget calls for federal time limits and work requirements to extend the successes of welfare reform to rental assistance programs. It reduces incentives for dependency by narrowing the gap between assisted renters and unassisted renters with the same income levels, while continuing to provide a safety net to make sure that those with very low incomes can afford housing. Finally, it stops the explosive growth of this program so that aid can be focused on the truly needy.
Preparing the Workforce for a 21st Century Economy
Major proposals
• Return Pell grants to their pre-stimulus levels to curb rising tuition inflation and make sure aid is targeted to the truly needy.
• Consolidate dozens of overlapping job-training programs into more accountable career scholarships to improve access to career development assistance and strengthen the first rung on the ladder out of poverty.
• Restore funding for the D.C. Opportunity Scholarship Program, giving thousands of elementary-school students in Washington, D.C. the chance at a better education and building a model of success for improving education nationwide.
Imposing time limits and work requirements on federal need-based aid is a positive reform. But government-supported job-training programs must be accountable and effective so that vulnerable citizens can take advantage of them. This budget includes reforms to do just that.
As the U.S. economy becomes more complex and innovative, workers will have to be more knowledgeable and flexible to succeed – which means they will need additional education and/or job training throughout their careers. Life-long learning is becoming a necessary part of career development. Government cannot insulate workers from the forces of change and globalization, but it can help facilitate the training needed to avoid, or push through, any period of uncertainty or unemployment.
While the nation’s existing job-training system has been improved over ineffective strategies of the past, the government can do a much better job of leveraging and targeting existing resources. The current policy landscape is dotted with failed, unaccountable and duplicative job-training programs – there are at least 49 such programs spread across nine agencies.
A 2008 study released by the Department of Labor found that the benefits of the nation’s primary network of job-training programs – the network created by the 1998 Workforce Investment Act (WIA) – were “small or nonexistent” for laid-off workers.24 Similarly, the Government Accountability Office, in a September 2008 report, concluded the Department of Labor did not set up comparable performance measures for $900 million in WIA grants that it awarded over seven years, so there is no way to evaluate their impact.25
The United States has an abundance of opportunities for those seeking additional education beyond high school. There are thousands of public and private colleges and universities. There is a robust system of community colleges that offer vocational training, two-year degrees, and established ladders to four-year institutions. There are also a number of for-profit and non-profit organizations that offer in-class and online instruction to advance basic literacy and various job skills.
Congress must do a better job of delivering job training resources in a targeted, accountable way to people who need them, so that more can take advantage of the nation’s network of private and non-profit job training centers. The last Congress did nothing to streamline the nation’s duplicative job-training programs. Instead, it recklessly expanded Pell grants for higher education beyond government’s means to pay, exacerbating an existing trend of spending-driven tuition inflation and endangering the viability of the program for the truly needy.
House Budget Committee | April 5, 2011 42
24 U.S. Department of Labor. Workforce Investment Act Non-Experimental Net Impact Evaluation. December 2008.
25 Scott, George A. Testimony before the U.S. Senate, Health, Education, Labor and Pensions Subcommittee on Employment and Workforce Safety. Investing in a Skilled Workforce: Making the Best Use of Tax-Payer Dollars to Maximize Results. Hearing, September 23, 2008.

The President’s budget recognizes that Pell spending is on an unsustainable path and recommends a few reforms to start to get control of the program’s costs. This budget takes the necessary next steps to ensure Pell spending is brought under control and targeted to the truly needy instead of being captured in the form of tuition increases. Recent studies have demonstrated that increases in Pell grants appear to be matched nearly one for one by increases in tuition at private universities.26
Second, this budget advances reforms to increase job-training outcomes across the board. It improves accountability by calling for the consolidation of duplicative federal job-training programs into more accountable, targeted career scholarship programs. Instead of wasting job-training money on duplicative administrative bureaucracy, this budget calls for job-training programs to be streamlined and better coordinated with each other and with the Pell program to maximize every dollar to those who need it.
This budget advances improved oversight and accountability for all job-training programs and the Pell program by tracking the type of training provided, the cost per student, employment after training, and whether or not trainees are working in the field for which they were trained. These programs should also track beneficiaries’ participation levels in federal support programs (e.g. welfare and SNAP) before and up to five years after training to determine if the training led to self-sufficiency. These common-sense measures will enable policymakers to determine whether the private and non-profit institutions that train beneficiaries of these programs are training them effectively.
In addition to a recommitment to lifelong learning initiatives, this budget takes significant strides toward strengthening educational opportunities for thousands of children trapped in failing schools. This budget restores funding for the D.C. Opportunity Scholarship Program. Created in 2003, this educational program empowered thousands of Washington, D.C.’s neediest children to escape failing schools and made possible their participation in schools of their choosing.
While the President and his party’s leaders engaged in their stimulus spending spree, they explicitly defunded this critical program. Refusing to reauthorize the D.C. Opportunity Scholarship Program, the President and his party’s policies are restricting parental options and denying low-income students access to a high-quality education in the nation’s capital.
This budget would reinstate the successful D.C. Opportunity Scholarship Program. Additional funding for this program would be offset by means-testing the D.C. Tuition Assistance Grant Program (DCTAG) that provides D.C. residents up to $10,000 grants per year for five years to make up the difference between in-state and out-of-state tuition. Currently, the DCTAG program is neither need- nor merit-based, and it is available to those from families with incomes of up to $1 million per year.
The House of Representatives recently passed legislation to restore the D.C. Opportunity Scholarship Program in an effort to restore hope for a brighter future to thousands of children in need.27 This budget builds on bipartisan education reform aimed at giving America’s next generation – especially children in need – hope and opportunity for a brighter future.
A strong social safety net must couple state flexibility and individual work requirements with a streamlined, targeted system for providing low-income Americans the resources they need to train for work and prepare for independent lives.
This budget builds on the successes of the past, advances proposals put forward by the reformers of today, and lays the groundwork for a flexible, competitive workforce in the future.
House Budget Committee | April 5, 2011 43
26 Singell, Larry D., Jr. and Joe A. Stone. For Whom the Pell Tolls: The Response of University Tuition to Federal Grants-in-Aid. September 2005. http://pages.uoregon.edu/lsingell/Pell_Bennett.pdf
27 U.S. Congress. House. The Scholarships for Opportunity and Results Act (SOAR) Act. H.R. 471. 112th Cong., 1st sess., 2011. http://www.gpo.gov/fdsys/pkg/BILLS-112hr471eh/pdf/BILLS-112hr471eh.pdf

FULFILLING THE MISSION OF HEALTH AND RETIREMENT SECURITY FOR ALL AMERICANS
America continues to pursue two interconnected domestic policy goals: Opportunity, which allows individuals to take risks and work hard to improve in life; and security, which protects the rewards of risk-taking and hard work from the vagaries of life.
When the unprecedented miseries of the Great Depression destroyed the savings and jobs of millions, America responded to the need of working families for a basic level of economic security. The nation formed a social contract to provide this security for workers in retirement or in unemployment. Social Security was later supplemented by Medicare to assist the health care needs of senior citizens.
Social Security and Medicare were created to provide a minimum level of security below which no one would be allowed to fall. Funded by current workers’ and employers’ contributions, beneficiaries are provided resources to supplement their personal savings for a secure retirement.
This social contract with working households was not intended to encourage government dependency or stigmatize beneficiaries. It was meant to respect the honest pride Americans take in work, independence, and the fulfillment of their responsibilities to self and family.
Unfortunately, years of neglect by policymakers unwilling to confront the structural challenges of these pay-as-you-go security programs have left Medicare and Social Security threatened by out-of-control costs, their funds increasingly drawn from general revenues and their day of fiscal reckoning fast approaching. Left unchecked, the explosive growth of these programs, especially Medicare, threatens not only the ability of government to keep its promises to beneficiaries, but also the solvency of the federal government and the health of the U.S. economy. Denying the existence of these severe problems is tantamount to actively allowing these crucial programs to collapse.
It is morally unconscionable for elected leaders to cling to an unsustainable status quo with respect to America’s health and retirement security programs. Current seniors and future generations deserve better than empty promises and a diminished country. Current retirees deserve the benefits around which they organized their lives. Future generations deserve health and retirement security they can count on. By making gradual structural improvements, Congress can preserve America’s social contract with retired workers.
Saving Medicare
Major proposals
• Save Medicare for current and future generations while making no changes for those in and near retirement. For younger workers, when they reach eligibility, Medicare will provide a Medicare payment and a list of guaranteed coverage options from which recipients can choose a plan that best suits their needs. These future Medicare beneficiaries will be able to choose a plan the same way members of Congress do. Medicare will provide additional assistance for lower-income beneficiaries and those with greater health risks.
• Ensure that the cost of frivolous litigation is not passed on to consumers in the form of higher health-care premiums by capping non-economic damages in medical liability lawsuits.
• Stop the raid on the Medicare trust fund that was going to be used to pay for the new health care law. Any current-law Medicare savings must go to saving Medicare, not financing the creation of new open-ended health-care entitlements.
• Fix the Medicare physician payment formula for the next ten years so that Medicare beneficiaries continue to have access to health care.
House Budget Committee | April 5, 2011 44

With the creation of Medicare in 1965, the United States made a commitment to help fund the medical care of elderly Americans without exhausting their life savings or the assets and incomes of their working children and younger relatives. In urging the creation of Medicare, President Kennedy said that such a program was chiefly needed to protect, not the poor, but people who had worked for years and suddenly found all their savings gone because of a costly health problem.28
Created with the mission of providing health coverage for America’s retirees, Medicare’s structural imbalance threatens beneficiaries’ access to quality, affordable care. A flaw in the structure of the program is driving up health care costs, which are, in turn, threatening to bankrupt the system – and ultimately the nation. Unless Congress fixes what’s broken in Medicare, without breaking what’s working, the program will end up causing exactly what it was created to avoid – millions of American seniors without adequate health security and a younger working generation saddled with enormous debts to pay for spending levels that cannot be sustained.
The Medicare program attempts to do two things to make sure that all seniors have secure, affordable health insurance that works. First, recognizing that seniors need extra protection when it comes to health coverage, it pools risk among all seniors to ensure that they enjoy secure access to care. This budget strengthens and enhances this aspect of Medicare so that seniors will have more health-care choices within the same stabilized risk pool.
Second, Medicare subsidizes coverage for seniors to ensure that coverage is affordable. Affordability is a critical goal, but the subsidy structure of Medicare is fundamentally broken and drives costs in the opposite direction. The open-ended, blank-check nature of the Medicare subsidy drives health-care inflation at an astonishing pace, threatens the solvency of this critical program, and creates inexcusable levels of waste in the system.
Politicians’ repeated efforts to patch this problem without reforming the structure of the subsidy have amounted to one failure after another. Time and again, Congress has applied band-aids to control costs by reducing the rate at which doctors and hospitals are reimbursed for treating Medicare patients. These repeated fee reductions have had two consequences: Providers have either increased the volume of services they provide for each condition, leading to waste, fraud and abuse; or they have stopped accepting Medicare patients, limiting access for seniors.
Despite these repeated fee reductions, the rising cost of Medicare has continued unabated. Today, Medicare spending is growing at a rate of 7.2 percent every year. This is more than twice as fast as this nation’s economy is growing. The unchecked growth of the Medicare program cannot be sustained – eventually, it will threaten not just the affordability of coverage for seniors, but also the security that comes with knowing that coverage can be obtained at any price.
Letting government break its promises to current seniors and to future generations is unacceptable. The reforms outlined in this budget protect and preserve Medicare for those in and near retirement, while saving and strengthening this critical program so that future generations can count on it to be there when they retire.
This budget ends the raid on the Medicare trust fund that began with passage of the new health care law last year. It ensures that any potential savings in current law go to shore up Medicare, not to pay for new entitlements. In addition to repealing the health care law’s new rationing board and its unfunded long-term care entitlement, this budget stabilizes plan choices for current seniors.
This budget also achieves savings by advancing common-sense curbs on abusive and frivolous lawsuits. Medical lawsuits and excessive verdicts increase health care costs and result in reduced access to care. When mistakes happen, patients have a right to fair representation and fair compensation. But the current tort litigation system too often serves the interests of lawyers while driving up costs.
This budget fixes the Medicare physician payment formula for the next ten years so that Medicare beneficiaries continue to have access to health care. It provides for a reimbursement system that fairly compensates physicians who treat Medicare beneficiaries while providing incentives to improve quality and efficiency.
House Budget Committee | April 5, 2011 45
28 President John F. Kennedy. Address at a New York Rally in Support of the President’s Program of Medical Care for the Aged. May 20, 1962.

Finally, this budget will save Medicare for future generations, protecting those in and near retirement from any changes while forging for younger workers a Medicare program modeled on the system of affordable, quality health coverage options now enjoyed by members of Congress.
Premium support – a better way to deliver secure benefits
Starting in 2022, new Medicare beneficiaries will be enrolled in the same kind of health care program that members of Congress enjoy. Future Medicare recipients will be able to choose from a list of guaranteed coverage options, and they will be given the ability to choose a plan that works best for them. This is not a voucher program, but rather a premium-support model. A Medicare premium-support payment would be paid, by Medicare, to the plan chosen by the beneficiary, subsidizing its cost.
House Budget Committee | April 5, 2011 46
STOPPING THE RAID ON MEDICARE BY REPEALING THE HEALTH CARE LAW
The health-care law last year was emblematic of the wrong way to fix the problems with Medicare. First, it raided the program to fund a new, unsustainable, open-ended health-care entitlement. Second, it created a government panel with the power to save money by rationing care and restricting access to treatments.
The federal government cannot spend the same dollar twice. The trillion-dollar overhaul of the U.S. health-care sector enacted by the last Congress was filled with gimmicks and double-counting to hide its true cost. The most egregious example of this was the way the overhaul’s supporters claimed that it would both shore up the Medicare trust fund and offset the cost of the expensive new health-care entitlement that the new law created.
The President himself announced that the new law “actually added at least a dozen years to the solvency of Medicare,” while also claiming that it wouldn’t add to the deficit. But at the House Budget Committee’s first hearing of the year, Medicare’s chief actuary, Rick Foster, testified that it would be impossible for the new law to do both unless the savings were double-counted.
“Both will happen as a result of the same one set of savings, under Medicare,” Foster explained. “But it takes two sets of money to make it happen… when we need the money to extend the Hospital Insurance Trust Fund, we have a promissory note… and Treasury has to pay that money back. But they have to get it from somewhere. That’s the missing link.”
Rationing is an inferior solution to Medicare’s problems. There are two ways to control health care spending: Give bureaucrats more control to ration care, or give patients more power to reward providers who deliver high-quality, low-cost care (and deny business to those who fail to provide quality, affordable, care).
The new health care law empowers bureaucrats at the expense of patients and providers, setting up an unelected board of “experts” – the Independent Payment Advisory Board, or IPAB – tasked with squeezing savings out of Medicare through formulaic rationing. One-size-fits-all decisions to restrict certain treatments punish beneficiaries by hitting all providers of the same treatment with across-the-board cuts, with no regard to measures of quality or patient satisfaction.
This budget would eliminate IPAB and stop the raid on Medicare. Then, after ensuring that current-law savings go to shore up Medicare for those in and near retirement, this budget makes sure that the program is there for future generations by adopting a better way to control costs – through true choice and competition, ensuring that patients and doctors are at the center of health care in the United States.

The premium-support model would operate similar to the way the Medicare prescription-drug benefit program works today. The Medicare premium-support payment would be adjusted so that wealthier beneficiaries would receive a lower subsidy, the sick would receive a higher payment if their conditions worsened, and lower-income seniors would receive additional assistance to cover out-of-pocket costs.
This approach to strengthen the Medicare program ensures security and affordability for seniors now and into the future. First, it ensures security by setting up a tightly regulated exchange for Medicare plans. Health plans that choose to participate in the Medicare exchange must agree to offer insurance to all Medicare beneficiaries, to avoid cherry-picking and ensure that Medicare’s sickest and highest-cost beneficiaries receive coverage. This reform builds upon the bipartisan Rivlin-Ryan Medicare reform plan advanced in the President’s Fiscal Commission in 2010.29
While there would be no disruptions in the current Medicare fee-for-service program for those currently enrolled or becoming eligible in the next ten years, all seniors would have the choice to opt into the new Medicare program once it begins in 2022. No senior would be forced to stay in the old program. This budget gives seniors the freedom to choose a plan that works best for them and guarantees health security throughout their retirement years.
These reforms also ensure affordability by fixing the currently broken subsidy system and letting market competition work as a real check on widespread waste and skyrocketing health-care costs. Putting patients in charge of how their health care dollars are spent will force providers to compete against each other on price and quality. That’s how markets work: The customer is the ultimate guarantor of value.
For too long in the Medicare system, the federal government, not the patient, has been the customer – and the government has been a clumsy, ineffective steward of value. Controlling costs without limiting access or sacrificing quality has proved to be an impossible task for government bureaucrats. In a vain attempt to get control of the waste in the system, Washington has made across-the-board payment reductions to providers without regard to quality or patient satisfaction. It hasn’t worked. Costs have continued to grow, seniors continue to lose access to quality care, and the program remains on a path to bankruptcy. Absent reform, Medicare will be unable to meet the needs of current seniors or future generations.
In health care, as in any other economic arrangement, control of money is power. When it comes to controlling health-care costs and saving the nation from bankruptcy, the question is: Who gets the power? One centralized federal government, or 50 million empowered seniors holding providers accountable in a true marketplace? Patient power will always serve the needs of the people far better than bureaucrats managing the decline of a government-run system on the verge of bankruptcy.
Reform aimed to empower individuals — with a strengthened safety net for the poor and the sick — will not only ensure the fiscal sustainability of this program, the federal budget, and the U.S. economy. It will also guarantee that Medicare can fulfill the promise of health security for America’s seniors.
Advancing Social Security Reforms
Major proposals
• Force policymakers to come to the table and enact common-sense reforms to keep the program solvent for current beneficiaries and make it stronger for future generations. Social Security must be reformed to prevent severe cuts in future benefits.
• Set in motion the process of reforming Social Security by establishing a requirement that in the event that the Social Security program is not sustainable, the President, in conjunction with the Board of Trustees, must submit a plan for restoring balance to the fund. The budget then requires congressional leaders in both the U.S. House of Representatives and U.S. Senate to put forward their best ideas as well.
House Budget Committee | April 5, 2011 47
29 Rivlin, Alice M. and Paul D. Ryan. A Long-Term Plan for Medicare and Medicaid. November 17, 2010. http://budget.house.gov/News/DocumentSingle.aspx?DocumentID=225826

• Move the conversation to solutions that save Social Security, thus providing the space to forge a bipartisan path forward and ensure that Social Security remains a key part of retirement security for the future.
One common reaction to the question of what to do about the problem with Social Security has unfortunately been, “What problem?” The deniers claim that the Social Security trust fund will remain solvent for another 16 years, at which point the government could theoretically cover the shortfall by raising taxes. Others downplay whether any changes to Social Security will be necessary – they claim that sustained economic growth could take care of the problem all by itself.
Neither is correct. First, any value in the balances in the Social Security trust fund is derived from dubious government accounting. The trust fund is not a real savings account. From 1983 to 2011, the trust fund collected more in Social Security taxes than it paid out in Social Security benefits. But the government borrowed all of these surpluses and spent them on other government programs unrelated to Social Security. The trust fund holds Treasury securities, but the ability to redeem these securities is completely dependent on the Treasury’s ability to raise money through taxes or borrowing.
Beginning in 2011, the Social Security started paying out more in benefits than it collected in taxes – a trend that will skyrocket as the baby boomers continue to retire. In order to pay full benefits, the government must pay back the money it owes Social Security.
Those who wish to solve this problem by raising taxes are ignoring the profound economic damage that such large tax increases would entail. Just lifting the cap on income subject to Social Security taxes, as some have proposed, would, when combined with the Obama administration’s other preferred tax policies, lift the top marginal tax rate to over 60 percent.
Most economists agree that raising marginal tax rates that high would create a significant drag on economic growth, job creation, productivity and wages. This nation cannot fix its retirement-security system by leaving young families with nothing to save.
President Roosevelt himself viewed Social Security as an evolving program. As he wrote in a 1939 message to Congress, “We shall make the most orderly progress if we look upon Social Security as a development toward a goal rather than a finished product. We shall make the most lasting progress if we recognize that Social Security can furnish only a base upon which each one of our citizens may build his individual security through his own individual efforts.”30
The evolution must continue today, because Social Security’s fragile condition poses a serious problem that threatens to break the broader compact in which workers support the generation preceding them, and earn the support of those who follow. The legacy envisioned by President Roosevelt must be upheld.
The House Budget Committee believes there is a bipartisan path forward on Social Security – one that requires all parties first to acknowledge the fiscal realities of this critical program. The President’s Fiscal Commission recently made a positive first step by advancing solutions to ensure the solvency of Social Security.
The Commission suggested a more progressive benefit structure, with benefits for higher-income workers growing more slowly than those of workers with lower incomes who are more vulnerable to economic shocks in retirement. It also recommended reforms that take account of increases in longevity, to arrest the demographic problems that are undermining Social Security’s finances.31
In addition, there is bipartisan consensus that Social Security reform should provide more help to those who fall below the poverty line after retirement. There is no security in a program that is blind to the needs of the nation’s most vulnerable citizens. Lower-income seniors should receive more targeted assistance than those who have had ample opportunity to save for retirement.
House Budget Committee | April 5, 2011 48
30 President Franklin D. Roosevelt. A Message Transmitting to the Congress a Report of the Social Security Board Recommending Certain Improvements in the Law. January 16, 1939.
31 The National Commission on Fiscal Responsibility and Reform. The Moment of Truth.

While certain details of the Commission’s Social Security proposals, particularly on the tax side, are of debatable merit, the Commission undoubtedly made positive steps forward on bipartisan solutions to strengthen Social Security. This budget builds upon the Commission’s work, forcing action to solve this pressing problem by requiring the President to put forward specific ideas on fixing Social Security.
In a shared call for leadership, this budget also puts the onus on Congress to offer legislation to ensure the sustainable solvency of this critical program. Both parties must work together to chart a path forward on common sense reforms, and this budget provides the nation’s leaders with the tools to get there.
This century can be America’s greatest century, but it will take strong leadership from this generation. The window to avert disruptions is quickly closing. Each year that passes without meaningful action, the debt grows larger, the problems grow more entrenched, and the available options grow fewer in number and greater in pain.
If the nation acts now, those in and near retirement can enjoy the continuity of health and retirement arrangements around which they have organized their lives. If Washington continues to play politics with the future of these programs, however, then it won’t just be future generations at risk: Current retirees will also find their benefits subject to the vagaries of a severe debt crisis.
This will not just mean painful benefit cuts for current seniors – it will mean huge tax increases on younger working families, robbing them of the opportunity to save for their own retirements. And it will mean that those pledges of future health and retirement security that the government is currently making to younger families are nothing but empty promises. Unless government acts, Medicare and Social Security will not be there for younger families.
People are living longer. The baby boomers are beginning to retire. Health-care costs are skyrocketing. These are facts, and they require a better approach to renew the social contract. This budget fulfills the mission of health and retirement security for all Americans by saving and strengthening existing programs through common-sense reforms. The 112th Congress has a unique opportunity to fix what is broken in these programs without breaking what’s working.
The solutions are clear; what remains in question is whether elected leaders have the resolve to save these programs.
House Budget Committee | April 5, 2011 49

PRO-GROWTH TAX REFORM
A pro-growth tax system should be simple, efficient and fair. The U.S. tax code fails on all three counts.
The system is notoriously complex, as individuals, families and employers spend over six billion hours and over $160 billion per year trying to negotiate a labyrinth of deductions and credits, a tangle of different rules for characterizing income, and a variety of schedules for taxing that income. Simply put, the code is too costly and too burdensome.
The code is also patently unfair, as many of the deductions and preferences in the system – which serve to narrow the tax base – are mainly used by a relatively small class of mostly higher-income individuals. Washington should not be in the business of picking winners and losers.
Finally, the U.S. tax structure is highly inefficient, as tax considerations rather than economic fundamentals often distort individual decisions to work, save, and invest, which leads to a misallocation of resources and slower economic growth.
This budget attacks all three of these problems with a set of fundamental reforms drawn from a broad consensus of economic experts and based on the principle that government should never take a dollar from one of its citizens unless that dollar is needed for an absolutely vital national purpose.
It draws on the commonly held view that the key to pro-growth tax reform is lowering tax rates while broadening the tax base – that is, letting individuals keep more of the money they earn, while getting rid of distortions, loopholes and preferences that divert economic resources from their most efficient uses.
The recommendations of the President’s Fiscal Commission were clear on this point: lower tax rates are critical to economic growth. The Commission’s proposal offered a growth-oriented, simplified code, with individual tax brackets as low as 8 percent, 14 percent and 23 percent – and reduced the corporate tax rate to as low as 26 percent.32 This budget builds upon the clear bipartisan consensus that lower rates and a broader base are key guideposts for pro-growth tax reform.
In addition, this budget starts, not by asking what is the “right mix” of tax increases and spending cuts to balance the budget, but by asking what is the purpose of government, and then raising only as much revenue as the federal government needs to efficiently fund those missions that rightly belong in its domain, while maximizing economic growth and job creation.
Simplifying the Tax Code for Individuals
Major proposals
• Reject the President’s call to raise taxes. Instead, keep overall revenue as a share of the economy at historical averages between 18 and 19 percent, a level compatible with growth, and – if the spending restraints in this budget are enacted – sufficient to fund government operations over time.
• Reform the tax code by consolidating the current six brackets and cutting the top individual rate from 35 percent to 25 percent.
• Broaden the tax base to keep revenue as a share of the economy at levels sufficient to fund critical missions that rightly belong in the domain of the federal government (as outlined elsewhere in this budget).
In 1981, President Ronald Reagan inherited a stagnant economy and a tax code that featured 16 brackets, with a top rate of 70 percent. When he left office in 1989, the tax code had been simplified down to just three brackets, with a top rate of 28 percent. Reagan’s tax reforms proved to be a cornerstone of the unprecedented economic boom that occurred in the decade during his presidency and continued in the decade that followed.
House Budget Committee | April 5, 2011 50
32 The National Commission on Fiscal Responsibility and Reform. The Moment of Truth.

Over time, additional brackets, credits and carve-outs have grown on the tax code like weeds. In the last ten years alone, there have been nearly 4,500 changes made to the tax code. The current version for individuals has six brackets, with a top rate of 35 percent (which is set to climb to nearly 40 percent after the end of 2012). Individuals react negatively toward the tax code partly because it is complex and attempts to steer them toward certain activities and away from others. In addition, there are always a few “surprises” that end up raising their tax bills. One such surprise – the Alternative Minimum Tax (AMT) – was initially designed to hit very high-income taxpayers, but instead ensnares a growing number of middle-class households because of a flawed design.
Creating new brackets and raising top rates is an idea that is often touted as a way to raise revenue by making only wealthy Americans bear a greater share of the burden. Most economists, however, disagree. Economic theory suggests, and most empirical studies prove, that marginal tax-rate hikes – tax increases that reduce incentives to work, save and invest for additional income above a certain cutoff – reduce economic output, while marginal rate reductions increase output, mainly by letting people keep more of each dollar they earn and thereby strengthening incentives to work, produce, and invest in the future.
Lower economic output mutes the revenue effect of top-rate tax increases. Top rates have risen and fallen dramatically in the past, with little overall effect on tax revenue as a share of the economy. The United States has set the top individual rate as high as 90 percent and as low as 28 percent, but income tax revenue has remained fairly steady despite these sharp rate swings.
The biggest driver of revenue to the federal government isn’t higher rates – it’s economic growth. Growth is the key to fiscal sustainability – and low rates are the key to growth.
Nor are the effects of marginal tax-rate increases confined to wealthy households. Three quarters of the nation’s small businesses file as individuals, meaning that higher individual rates make it harder for these vital enterprises to compete. Small businesses are responsible for almost two thirds of the jobs created in the United States in the past 15 years, and almost 50 percent of small-business profits are taxed at the top two rates.33 34 Raising these rates means increasing taxes on the most successful job creators in America.
Raising taxes on capital is another idea that purports to affect the wealthy but actually hurts all participants in the economy. Mainstream economics, not to mention common sense, teaches that raising taxes on any activity generally results in less of it. Economics and common sense also teach that the size of a nation’s capital stock – the pool of saved money available for investment and job creation – has an effect on employment, productivity, and wages. Tax reform should promote savings and investment because more savings and more investment mean a larger stock of capital available for job creation. That means more jobs, more productivity, and higher wages for all American workers.
The negative effects of high rates on work, savings and investment are compounded when a large mix of exemptions, deductions and credits are added in. Sometimes referred to as “tax expenditures,” these distortions are similar to government spending – instead of markets directing economic resources to their most efficient uses, the government directs resources to politically favored uses, creating a drag on growth.
The key difference is that, with spending, the government collects the money first in the form of taxes from those who earned it, and reallocates the money elsewhere. With tax expenditures, government agrees not to collect the money as long as it is put to a government-approved use. Other tax expenditures literally do take the form of spending through the tax code, because they “return” more money than the taxes owed.
Tax expenditures have a huge impact on the federal budget, resulting in over $1 trillion in forgone revenue each year (although the exact definition of a “tax expenditure” is subject to debate.) To put that number in perspective, $1 trillion is roughly the total amount the government collects each year in federal income taxes.
Eliminating large tax expenditures would not be for the purpose of increasing total tax revenues. Instead, when offset by lower rates, it would have a doubly positive impact on the economy – it would stop diverting economic
House Budget Committee | April 5, 2011 51
33 Headd, Brian. An Analysis of Small Business and Jobs. Small Business Administration. Office of Advocacy. March 2010. http://www.sba.gov/advocacy/849/7642
34 Internal Revenue Service. Statistics of Income. “Table 1.4 All Returns: Sources of Income, Adjustments, and Tax Items, by Size of Adjusted Gross Income, Tax Year 2008.” http://www.irs.gov/pub/irs-soi/08in14ar.xls (accessed March 31, 2011).

resources to less productive uses, while making possible the lower tax rates that provide greater incentives for economic growth.
President Reagan’s tax reforms inaugurated an era of great prosperity. It is time to reclaim his legacy and once again enact a fundamental reform of the tax code as the final step in rebuilding the foundations for economic growth: spending restraint, reasonable and predictable regulations, sound money, and a simple tax code with low rates.
This budget starts with the proposition that first, Congress must do no harm. It assumes that Congress will not allow massive, across-the-board tax increases to hit the economy in 2013, when current law calls for the tax cuts that were enacted in 2001 and 2003 to expire. And it assumes that Congress will not let the AMT ensnare growing numbers of middle-class taxpayers.
House Budget Committee | April 5, 2011 52
STOP JOB-DESTROYING TAX HIKES BY REPEALING THE HEALTH CARE LAW
The health-care law enacted last year contained roughly $800 billion in new taxes and tax increases – the result of dozens of changes to tax law that added complexity and unfairness to the code.
New taxes on employers make American businesses less competitive. The new law hits all businesses that do not purchase a one-size-fits-all, federally approved health insurance plan for their workers to pay a large tax penalty as a consequence. Employers and labor groups pointed out that this new tax would result in mass layoffs or in millions of workers losing their coverage. As a result, the administration has granted hundreds waivers to exempt certain businesses and unions from the new law, according to the Department of Health and Human Services. But government should not be granting waivers based on political connections – it should repeal this harmful tax before it does any more damage.
Higher taxes on wages and investment income will discourage hiring and eat into America’s capital stock. The new law imposes a 0.9 percent surtax on wages and a 3.8 percent surtax on interest, dividends, and capital gains. Both taxes only apply to filers in the top two income brackets, but as discussed elsewhere in this section, those filers include small businesses employing millions of Americans, and the new taxes on capital will reduce the pool of capital available for investment and job creation.
The new “Cadillac Tax” on high-cost employer-provided health plans doesn’t resolve the inequitable treatment of health care costs in the tax code. The new health care law would, starting in 2018, impose a new tax on high-cost, employer-provided health plans. The tax was meant to encourage employers to offer a greater percentage of compensation in the form of wages rather than health benefits. Instead of dealing with the inequitable tax treatment of health-care costs in a straightforward way, by simplifying the code, this tax would add an additional layer of complexity, while being used to fund a new open-ended health-care entitlement.
The U.S. economy needs more jobs, not more job-destroying taxes. The U.S. health-care sector needs more new treatments and cures, not fewer. And U.S. citizens deserve a tax code that does not discriminate between, for example, the self-employed and those employed by large companies. Repealing the new health-care law is the first step toward fulfilling all three of these goals and implementing true patient-centered health care in America.

The new, simplified code outlined in this budget will continue to raise sufficient revenue to fund the government by broadening the tax base, eliminating or limiting as necessary existing tax deductions, exclusions, and other special provisions. These carve-outs have distorted economic activity and necessitated high tax rates that hurt growth. Getting rid of these tax expenditures will make the tax code simpler, fairer and more conducive to economic growth and job creation.
Taken together, these reforms will promote prosperity and help put government back onto a sustainable fiscal path.
Making the Corporate Code More Competitive
Major proposals
• Encourage economic growth and job creation by lowering the corporate tax rate from 35 percent, which is the highest in the developed world, to a much more competitive 25 percent.
• Remove distortions from the code by eliminating or modifying deductions, credits and special carve-outs that leave many companies paying no tax at all.
The United States currently labors under the highest corporate income tax rate in the developed world. Corporate income taxes create large distortions in economic activity, changing corporate behavior in ways that reduce efficiency and create a drag on growth.
The perverse incentives created by the tax do a lot of damage, yet the tax itself raises relatively little revenue – only 10 percent of the total federal tax take comes from taxing corporate income. A 2005 report from the non-partisan Congressional Budget Office reinforced this conclusion, stating that “distortions that the corporate income tax induces are large compared with the revenues that the tax generates.”35
The problem with the corporate income tax is that corporations are not taxpayers – they are tax collectors. Taxes on corporate income are borne by shareholders, employees and customers. Investors pay the cost in diminished returns. Workers pay the cost in lower wages. And consumers pay the cost in higher prices.
Workers in particular could benefit from a reduction in the corporate tax rate. Another recent study from the CBO concluded that “domestic labor bears slightly more than 70 percent of the burden” of the corporate income tax.36
Instead of making the corporate tax code more competitive by reducing rates across the board, Congress has responded to corporate complaints about this high tax burden by filling the code with loopholes and special carve-outs. The biggest corporations that can afford the best lawyers have figured out how to use the code to avoid paying taxes altogether.37 It is the smaller companies that suffer disproportionately from an unfair and complex corporate tax code and high corporate rates.
Lowering corporate rates is a reform that is long overdue. This simple policy change would provide an immediate boost to a lagging economy by increasing wages, lowering costs, and providing greater returns on investments in U.S. companies. It would bring the U.S. corporate tax rate closer to the rates of other developed nations, helping American businesses compete in the international marketplace on a level playing field.
This reform would also boost investment flows in the United States and encourage more foreign companies to do business and create jobs in the U.S. economy. It would lessen incentives for U.S.-based multinational corporations to avoid high U.S. taxes by keeping their profits offshore. That would encourage these companies to reinvest their profits and capital in the United States.
House Budget Committee | April 5, 2011 53
35Congressional Budget Office. Corporate Income Tax Rates: International Comparisons. November 2005. http://www.cbo.gov/ftpdocs/69xx/doc6902/11-28-CorporateTax.pdf
36 Randolph, William. “International Burdens of the Corporate Income Tax.” Working Paper Series, Congressional Budget Office. August 2006. http://www.cbo.gov/ftpdocs/75xx/doc7503/2006-09.pdf
37 Kocieniewski, David. “G.E.’s Strategies Let It Avoid Taxes Altogether.” The New York Times. March 24, 2011. http://www.nytimes.com/2011/03/25/business/economy/25tax.html (accessed March 31, 2011).

This budget would offset lower rates with a broader base, scaling back or eliminating entirely the deductions and credits that have skewed corporate behavior and benefitted the largest corporations disproportionately. Government should not be in the business of picking winners and losers in the market. A single low, fair and simple rate is as good for American businesses as it is for the individual Americans they employ.
This budget, by lowering tax rates and broadening the tax base, follows the same principles that guided the tax proposals contained in the President’s Fiscal Commission. But rather than allow government’s share of the economy to rise to 21 percent, as the Commission’s proposals would allow, this budget includes real spending restraint that enables government’s share of the economy to remain below its historical average of 19 percent.
This is important, not because 19 percent is a magic number, but because Washington should not solve its spending problems by taking even more money from taxpayers. American families have had to cut their own budgets in the last few years, and it is time for Washington to do the same. By returning government to its proper roles, this budget brings spending in line with taxes – not the other way around.
In addition to reorienting the tax code with pro-growth incentives, this budget fixes a major problem that has distorted economic activity in the United States: Its reforms are meant to be permanent changes in law, not temporary booster shots or short-term cuts with built-in expiration dates. American families and businesses need – and deserve – certainty and predictability when it comes to taxes, so they can plan for their economic futures.
Keeping families and businesses in a state of uncertainty about taxes is unfair, and it hurts the economy. This budget ends the gimmickry and gives citizens a fair and simple tax code that they can count on.
House Budget Committee | April 5, 2011 54

PATHTO
PROSPERITY
House Budget Committee | April 5, 2011 55

LIFTING THE CRUSHING BURDEN OF DEBT
The reforms outlined in this document would put the federal budget on the path to balance and the American economy on the path to prosperity. A clear alternative to a future of debt and decline, this budget offers the American people a path forward to restore America’s exceptional promise.
Government Spending
The President’s budget commits Americans to a future in which the federal government consumes an ever-growing share of resources from the productive sector of our economy, suffocating investment and stifling growth. Under the President’s budget, the federal government will spend $46 trillion over the next decade. Government spending runs at record post-World War II levels, never falling below 23 percent of the economy in this decade.
Going forward, the President’s budget doesn’t just fail to curb the unsustainable spending trajectory. It will in fact make matters worse. Autopilot spending will soon crowd out all other priorities in the federal budget, with spending on Medicare, Medicaid, Social Security and interest on the national debt eclipsing all anticipated revenue by 2025. Borrowing and spending by the public sector will crowd out investment and growth in the private sector. In the years ahead, government spending will skyrocket to record levels that a free economy simply cannot sustain.
This budget charts a brighter future. With responsible spending cuts now and structural reforms of government spending programs going forward, this budget ensures government spending remains on a sustainable path. Government spending will fall below 20 percent of the economy by 2015. This budget will continue to increase funding levels for government’s core responsibilities and advance national priorities, albeit at a more sustainable rate. As the economy grows, government spending as a share of the economy will steadily recede over the decades ahead.
Deficits
The insistence by the President and his party’s leaders on spending money the government does not have has yielded trillion-dollar deficits now and into the future. According to the CBO, the President’s budget will result in a record fourth-straight deficit in excess of $1 trillion, and climb above trillion dollars for the last three years of the ten-year budget window. His budget never reaches “primary balance,” meaning that it fails to clear even the low bar the Administration set for itself in justifying its claims of sustainability. The deficit path ahead commits America to economic decline and a diminished future.
This budget charts a sustainable path going forward, ultimately erasing the budget deficit completely. It brings the deficit below $1 trillion in FY2012, whereas the President’s budget produces a record fourth-straight trillion House Budget Committee | April 5, 2011 56
FIGURE 8

dollar budget next year. Over the next decade, this budget results in $4.4 trillion of deficit reduction compared to President Obama’s budget. This surpasses the President’s low benchmark of sustainability by reaching primary balance in 2015.
According to the Congressional Budget Office, this budget charts a path to complete balance. By 2040, the CBO estimates that this budget will produce annual surpluses and begin paying down the national debt. By contrast, under the status quo, the annual deficit would grow to consume one fifth of the entire U.S. economy.
Debt
By continuing Washington’s spending spree, the President’s budget adds $13 trillion dollars to the debt over the next decade. Under his budget, debt held by the public would double by 2016 compared with the President’s first year in office, and triple by the end of the budget window.
By failing to address the unsustainable growth of autopilot spending programs, the President’s budget commits this nation to a crushing burden of debt. The CBO estimates that under the President’s budget, debt held by the public will near 90 percent of the entire economy by the end of the decade. The explosive growth of debt will continue in the years ahead. The CBO projects debt as a share of the economy to grow to 146 percent in 2030, 233 percent in 2040, and an unfathomable 344 percent in 2050.
House Budget Committee | April 5, 2011 57
FIGURE 9
FIGURE 10

If policymakers continue down the present course, the consequences will be dire. American families are still reeling from the hardships of the recent economic downturn, and millions of individuals remain out of work. Yet Washington continues to erect new barriers to growth, to raise the hurdles to sustained private-sector job creation, and – most distressingly – to accelerate the nation ever-faster toward a debt-fueled economic crisis.
The CBO has warned that “persistent deficits and continually mounting debt would have several negative economic consequences for the United States… a growing level of federal debt would also increase the probability of a sudden fiscal crisis.”38
The Path to Prosperity lifts the crushing burden of debt, making it possible for the economy to grow and for Americans to prosper. This budget would cut trillions of dollars from the debt relative to the President’s budget in every year of their long-term analysis. In 2022, the debt would be over 25 percent lower than would be the case under the status quo; 56 percent less in 2030; 79 percent in 2040. By 2050, this budget would cut the debt in half relative to where it stands today, lifting nearly $120 trillion of debt relative to the President’s path.
House Budget Committee | April 5, 2011 58
38 Congressional Budget Office. Federal Debt and the Risk of a Fiscal Crisis. July 27, 2010. http://www.cbo.gov/ftpdocs/116xx/doc11659/07-27_Debt_FiscalCrisis_Brief.pdf

REMOVING THE HURDLES TO ECONOMIC GROWTH
Each and every reform in this budget is advanced with a clear focus on economic growth and job creation. Overhauling the cumbersome tax code puts job creators in a better position to create and innovate here in America. Strengthening the safety net encourages all Americans to contribute to moving our economy forward. Curbing government’s overreach in American industry invites dynamism back into the economy. Getting a grip on Washington’s spending and deficits liberates our economy from the shackles of debt.
Most budgetary analyses rely on “static” models, which do not take into account the positive macroeconomic feedback effects that result from pro-growth reforms. Under a “dynamic” analysis of this budget, the Heritage Center for Data Analysis made clear that this budget would provide a powerful boost to the economy – now and into the future.
According to Heritage, this budget “would significantly strengthen economic performance throughout the economy and dramatically improve federal fiscal results.”
According to the analysis, this budget would produce the following results:
Faster economic growth: $1.5 trillion in additional real gross domestic product over the decade.
More jobs: Nearly one million new private sector jobs next year and 2.5 million new private sector jobs in the last year of the decade.
Higher wages: $1.1 trillion in higher wages, salary and income.
More prosperity: $9.35 trillion in higher real household income, translating into an average of $1,000 per year in higher income for each family.
By achieving sustainable levels of spending, deficits and debt – along with growth-oriented reforms to the tax code, this budget sets the nation on a path to prosperity.
Americans face the most predictable economic crisis in this nation’s history. Absent reform, the panic ahead is no longer a question of if, but rather when. A deterioration of confidence by investors in government’s ability to pay its bills will drive interest rates up, increasing borrowing costs for government, small businesses and families alike. A vicious cycle of debt will compound upon itself; the available exit options once the crisis hits will be limited; and all will involve pain.
There is still time to make the changes necessary to avert the harsh austerity that credit markets would impose upon us – to avoid indiscriminate cuts for current beneficiaries of government programs, an immediate weakening of our defense capabilities, and a wave of growth-stifling tax hikes.
But the window of opportunity to avert such austerity is quickly closing. This is America’s moment to advance a plan for prosperity.
This budget offers America a model of government that is guided by the timeless principles of the American Idea.
This budget provides policymakers with a blueprint to put our budget on the path to balance and our economy on the path to prosperity.
This budget assures America’s seniors – those who are currently retired and future retirees – that their health and retirement security will be preserved and strengthened.
This budget provides parents with hope that their children can inherit a strong, free and prosperous America.
Submitted for consideration to the United States Congress, and to the American people, this budget represents the new House majority’s answer to history’s call.
House Budget Committee | April 5, 2011 59

House Budget Committee | April 5, 2011 60

APPENDIX ISUMMARY TABLES
House Budget Committee | April 5, 2011 61

S-‐1 FY2012 BUDGET RESOLUTIONFY2012 BUDGET RESOLUTIONFY2012 BUDGET RESOLUTIONFY2012 BUDGET RESOLUTIONFY2012 BUDGET RESOLUTIONFY2012 BUDGET RESOLUTIONFY2012 BUDGET RESOLUTIONFY2012 BUDGET RESOLUTIONFY2012 BUDGET RESOLUTIONFY2012 BUDGET RESOLUTIONFY2012 BUDGET RESOLUTIONFY2012 BUDGET RESOLUTION(NOMINAL DOLLARS IN BILLIONS)(NOMINAL DOLLARS IN BILLIONS)(NOMINAL DOLLARS IN BILLIONS)(NOMINAL DOLLARS IN BILLIONS)(NOMINAL DOLLARS IN BILLIONS)(NOMINAL DOLLARS IN BILLIONS)(NOMINAL DOLLARS IN BILLIONS)(NOMINAL DOLLARS IN BILLIONS)(NOMINAL DOLLARS IN BILLIONS)(NOMINAL DOLLARS IN BILLIONS)(NOMINAL DOLLARS IN BILLIONS)(NOMINAL DOLLARS IN BILLIONS)
2011 2012 2013 2014 2015 2016 2017 2018 2019 2020 2021 2012-‐2021
OUTLAYS 3,618 3,529 3,558 3,583 3,667 3,855 3,996 4,123 4,354 4,547 4,745 39,958
REVENUES 2,230 2,533 2,860 3,094 3,237 3,377 3,589 3,745 3,939 4,142 4,354 34,870
DEFICIT -‐1,388 -‐995 -‐698 -‐489 -‐431 -‐478 -‐407 -‐378 -‐415 -‐405 -‐391 -‐5,088
DEBT HELD BY THE PUBLIC
10,351 11,418 12,216 12,797 13,319 13,876 14,351 14,787 15,242 15,673 16,068 n.a.
AS A SHARE OF GDP 10-‐YEAR
2011 2012 2013 2014 2015 2016 2017 2018 2019 2020 2021 AVERAGE
OUTLAYS 24.1 22.5 21.7 20.8 20.2 20.1 19.9 19.7 19.9 19.9 19.9 20.5
REVENUES 14.8 16.1 17.4 17.9 17.8 17.6 17.9 17.9 18.0 18.2 18.3 17.7
DEFICIT 9.2 6.3 4.3 2.8 2.4 2.5 2.0 1.8 1.9 1.8 1.6 2.7
DEBT HELD BY THE PUBLIC
68.8 72.8 74.5 74.2 73.2 72.5 71.6 70.6 69.7 68.7 67.5 71.5
UPDATED ON APRIL 11, 2011 TO ASSUME ADOPTION OF THE MANAGER'S AMENDMENT.

S-‐2 FY2012 BUDGET RESOLUTION VS. CBO BASELINEFY2012 BUDGET RESOLUTION VS. CBO BASELINEFY2012 BUDGET RESOLUTION VS. CBO BASELINEFY2012 BUDGET RESOLUTION VS. CBO BASELINEFY2012 BUDGET RESOLUTION VS. CBO BASELINEFY2012 BUDGET RESOLUTION VS. CBO BASELINEFY2012 BUDGET RESOLUTION VS. CBO BASELINEFY2012 BUDGET RESOLUTION VS. CBO BASELINEFY2012 BUDGET RESOLUTION VS. CBO BASELINEFY2012 BUDGET RESOLUTION VS. CBO BASELINEFY2012 BUDGET RESOLUTION VS. CBO BASELINEFY2012 BUDGET RESOLUTION VS. CBO BASELINE(NOMINAL DOLLARS IN BILLIONS)(NOMINAL DOLLARS IN BILLIONS)(NOMINAL DOLLARS IN BILLIONS)(NOMINAL DOLLARS IN BILLIONS)(NOMINAL DOLLARS IN BILLIONS)(NOMINAL DOLLARS IN BILLIONS)(NOMINAL DOLLARS IN BILLIONS)(NOMINAL DOLLARS IN BILLIONS)(NOMINAL DOLLARS IN BILLIONS)(NOMINAL DOLLARS IN BILLIONS)(NOMINAL DOLLARS IN BILLIONS)(NOMINAL DOLLARS IN BILLIONS)
2011 2012 2013 2014 2015 2016 2017 2018 2019 2020 2021 2012-‐2021
OUTLAYS -‐11 -‐111 -‐221 -‐371 -‐513 -‐605 -‐665 -‐733 -‐794 -‐865 -‐935 -‐5,812
REVENUES 0 -‐25 -‐227 -‐346 -‐406 -‐448 -‐482 -‐527 -‐544 -‐561 -‐597 -‐4,162
DEFICIT -‐11 -‐86 6 -‐24 -‐107 -‐157 -‐183 -‐206 -‐250 -‐304 -‐338 -‐1,649
DEBT HELD BY THE PUBLIC
-‐11 -‐98 -‐94 -‐122 -‐236 -‐406 -‐613 -‐853 -‐1,151 -‐1,519 -‐1,941 n.a.
FY2012 BUDGET RESOLUTION VS. PRESIDENT’S BUDGETFY2012 BUDGET RESOLUTION VS. PRESIDENT’S BUDGETFY2012 BUDGET RESOLUTION VS. PRESIDENT’S BUDGETFY2012 BUDGET RESOLUTION VS. PRESIDENT’S BUDGETFY2012 BUDGET RESOLUTION VS. PRESIDENT’S BUDGETFY2012 BUDGET RESOLUTION VS. PRESIDENT’S BUDGETFY2012 BUDGET RESOLUTION VS. PRESIDENT’S BUDGETFY2012 BUDGET RESOLUTION VS. PRESIDENT’S BUDGETFY2012 BUDGET RESOLUTION VS. PRESIDENT’S BUDGETFY2012 BUDGET RESOLUTION VS. PRESIDENT’S BUDGETFY2012 BUDGET RESOLUTION VS. PRESIDENT’S BUDGETFY2012 BUDGET RESOLUTION VS. PRESIDENT’S BUDGET(NOMINAL DOLLARS IN BILLIONS)(NOMINAL DOLLARS IN BILLIONS)(NOMINAL DOLLARS IN BILLIONS)(NOMINAL DOLLARS IN BILLIONS)(NOMINAL DOLLARS IN BILLIONS)(NOMINAL DOLLARS IN BILLIONS)(NOMINAL DOLLARS IN BILLIONS)(NOMINAL DOLLARS IN BILLIONS)(NOMINAL DOLLARS IN BILLIONS)(NOMINAL DOLLARS IN BILLIONS)(NOMINAL DOLLARS IN BILLIONS)(NOMINAL DOLLARS IN BILLIONS)
2011 2012 2013 2014 2015 2016 2017 2018 2019 2020 2021 2012-‐2021
OUTLAYS -‐37 -‐179 -‐241 -‐393 -‐523 -‐620 -‐691 -‐773 -‐846 -‐935 -‐1,011 -‐6,214
REVENUES 0 -‐11 -‐39 -‐118 -‐206 -‐258 -‐228 -‐249 -‐240 -‐240 -‐243 -‐1,831
DEFICIT -‐38 -‐169 -‐203 -‐275 -‐318 -‐363 -‐463 -‐524 -‐606 -‐696 -‐768 -‐4,382
DEBT HELD BY THE PUBLIC
-‐38 -‐243 -‐444 -‐719 -‐1,041 -‐1,416 -‐1,902 -‐2,463 -‐3,121 -‐3,885 -‐4,738 n.a.
UPDATED ON APRIL 11, 2011 TO ASSUME ADOPTION OF THE MANAGER'S AMENDMENT.

S-‐3 FY2012 BUDGET RESOLUTION BY MAJOR CATEGORYFY2012 BUDGET RESOLUTION BY MAJOR CATEGORYFY2012 BUDGET RESOLUTION BY MAJOR CATEGORYFY2012 BUDGET RESOLUTION BY MAJOR CATEGORYFY2012 BUDGET RESOLUTION BY MAJOR CATEGORYFY2012 BUDGET RESOLUTION BY MAJOR CATEGORYFY2012 BUDGET RESOLUTION BY MAJOR CATEGORYFY2012 BUDGET RESOLUTION BY MAJOR CATEGORYFY2012 BUDGET RESOLUTION BY MAJOR CATEGORYFY2012 BUDGET RESOLUTION BY MAJOR CATEGORYFY2012 BUDGET RESOLUTION BY MAJOR CATEGORYFY2012 BUDGET RESOLUTION BY MAJOR CATEGORY(NOMINAL DOLLARS IN BILLIONS)(NOMINAL DOLLARS IN BILLIONS)(NOMINAL DOLLARS IN BILLIONS)(NOMINAL DOLLARS IN BILLIONS)(NOMINAL DOLLARS IN BILLIONS)(NOMINAL DOLLARS IN BILLIONS)(NOMINAL DOLLARS IN BILLIONS)(NOMINAL DOLLARS IN BILLIONS)(NOMINAL DOLLARS IN BILLIONS)(NOMINAL DOLLARS IN BILLIONS)(NOMINAL DOLLARS IN BILLIONS)(NOMINAL DOLLARS IN BILLIONS)
2011 2012 2013 2014 2015 2016 2017 2018 2019 2020 2021 2012-‐2021
SECURITY 711 683 679 686 697 714 725 736 757 772 788 7,236
GLOBAL WAR ON
TERROR76 118 93 65 54 51 50 50 50 50 50 630
NON-‐SECURITY 565 485 435 409 392 379 373 369 370 373 380 3,966
MEDICAID 275 259 262 248 243 252 263 265 280 291 305 2,667
MEDICARE 563 560 601 636 666 720 748 776 839 893 953 7,392
PRESIDENT'S HEALTH CARE LAW
0 0 0 0 0 0 0 0 0 0 0 0
SOCIAL SECURITY 727 760 799 841 888 939 995 1,058 1,124 1,194 1,266 9,863
OTHER MANDATORY 489 408 372 308 270 279 264 242 267 268 269 2,947
NET INTEREST 212 256 319 391 457 521 578 627 667 706 735 5,258
TOTAL OUTLAYS 3,618 3,529 3,558 3,583 3,667 3,855 3,996 4,123 4,354 4,547 4,745 39,958
UPDATED ON APRIL 11, 2011 TO ASSUME ADOPTION OF THE MANAGER'S AMENDMENT.

S-‐4 FY2012 BUDGET RESOLUTION VS. CBO BASELINE BY MAJOR CATEGORYFY2012 BUDGET RESOLUTION VS. CBO BASELINE BY MAJOR CATEGORYFY2012 BUDGET RESOLUTION VS. CBO BASELINE BY MAJOR CATEGORYFY2012 BUDGET RESOLUTION VS. CBO BASELINE BY MAJOR CATEGORYFY2012 BUDGET RESOLUTION VS. CBO BASELINE BY MAJOR CATEGORYFY2012 BUDGET RESOLUTION VS. CBO BASELINE BY MAJOR CATEGORYFY2012 BUDGET RESOLUTION VS. CBO BASELINE BY MAJOR CATEGORYFY2012 BUDGET RESOLUTION VS. CBO BASELINE BY MAJOR CATEGORYFY2012 BUDGET RESOLUTION VS. CBO BASELINE BY MAJOR CATEGORYFY2012 BUDGET RESOLUTION VS. CBO BASELINE BY MAJOR CATEGORYFY2012 BUDGET RESOLUTION VS. CBO BASELINE BY MAJOR CATEGORYFY2012 BUDGET RESOLUTION VS. CBO BASELINE BY MAJOR CATEGORY
SECURITY
GLOBAL WAR ON TERROR
NON-‐SECURITY
MEDICAID
MEDICARE
PRESIDENT'S HEALTH CARE LAW
SOCIAL SECURITY
OTHER MANDATORY
NET INTEREST
TOTAL OUTLAYS
SECURITY
GLOBAL WAR ON TERROR
NON-‐SECURITY
MEDICAID
MEDICARE
PRESIDENT'S HEALTH CARE LAW
SOCIAL SECURITY
OTHER MANDATORY
NET INTEREST
TOTAL OUTLAYS
(NOMINAL DOLLARS IN BILLIONS)(NOMINAL DOLLARS IN BILLIONS)(NOMINAL DOLLARS IN BILLIONS)(NOMINAL DOLLARS IN BILLIONS)(NOMINAL DOLLARS IN BILLIONS)(NOMINAL DOLLARS IN BILLIONS)(NOMINAL DOLLARS IN BILLIONS)(NOMINAL DOLLARS IN BILLIONS)(NOMINAL DOLLARS IN BILLIONS)(NOMINAL DOLLARS IN BILLIONS)(NOMINAL DOLLARS IN BILLIONS)(NOMINAL DOLLARS IN BILLIONS)
2011 2012 2013 2014 2015 2016 2017 2018 2019 2020 2021 2012-‐2021
4 28 25 27 27 26 24 21 17 12 8 214
2 -‐10 -‐58 -‐95 -‐111 -‐119 -‐122 -‐126 -‐130 -‐134 -‐138 -‐1,044
-‐15 -‐76 -‐117 -‐143 -‐164 -‐183 -‐199 -‐215 -‐228 -‐239 -‐246 -‐1,810
0 -‐1 -‐13 -‐45 -‐63 -‐73 -‐82 -‐102 -‐112 -‐131 -‐150 -‐771
0 0 1 3 4 3 0 -‐3 -‐9 -‐14 -‐17 -‐30
0 -‐6 -‐9 -‐66 -‐122 -‐164 -‐182 -‐194 -‐208 -‐219 -‐233 -‐1,403
0 0 0 0 0 0 0 0 0 0 0 0
-‐2 -‐44 -‐47 -‐49 -‐78 -‐82 -‐82 -‐83 -‐82 -‐85 -‐87 -‐719
0 -‐1 -‐2 -‐3 -‐6 -‐13 -‐21 -‐31 -‐42 -‐56 -‐72 -‐248
-‐11 -‐111 -‐221 -‐371 -‐513 -‐605 -‐665 -‐733 -‐794 -‐865 -‐935 -‐5,812
FY2012 BUDGET RESOLUTION VS. PRESIDENT'S FY2012 BUDGET BY MAJOR CATEGORYFY2012 BUDGET RESOLUTION VS. PRESIDENT'S FY2012 BUDGET BY MAJOR CATEGORYFY2012 BUDGET RESOLUTION VS. PRESIDENT'S FY2012 BUDGET BY MAJOR CATEGORYFY2012 BUDGET RESOLUTION VS. PRESIDENT'S FY2012 BUDGET BY MAJOR CATEGORYFY2012 BUDGET RESOLUTION VS. PRESIDENT'S FY2012 BUDGET BY MAJOR CATEGORYFY2012 BUDGET RESOLUTION VS. PRESIDENT'S FY2012 BUDGET BY MAJOR CATEGORYFY2012 BUDGET RESOLUTION VS. PRESIDENT'S FY2012 BUDGET BY MAJOR CATEGORYFY2012 BUDGET RESOLUTION VS. PRESIDENT'S FY2012 BUDGET BY MAJOR CATEGORYFY2012 BUDGET RESOLUTION VS. PRESIDENT'S FY2012 BUDGET BY MAJOR CATEGORYFY2012 BUDGET RESOLUTION VS. PRESIDENT'S FY2012 BUDGET BY MAJOR CATEGORYFY2012 BUDGET RESOLUTION VS. PRESIDENT'S FY2012 BUDGET BY MAJOR CATEGORYFY2012 BUDGET RESOLUTION VS. PRESIDENT'S FY2012 BUDGET BY MAJOR CATEGORY
(NOMINAL DOLLARS IN BILLIONS)(NOMINAL DOLLARS IN BILLIONS)(NOMINAL DOLLARS IN BILLIONS)(NOMINAL DOLLARS IN BILLIONS)(NOMINAL DOLLARS IN BILLIONS)(NOMINAL DOLLARS IN BILLIONS)(NOMINAL DOLLARS IN BILLIONS)(NOMINAL DOLLARS IN BILLIONS)(NOMINAL DOLLARS IN BILLIONS)(NOMINAL DOLLARS IN BILLIONS)(NOMINAL DOLLARS IN BILLIONS)(NOMINAL DOLLARS IN BILLIONS)
2011 2012 2013 2014 2015 2016 2017 2018 2019 2020 2021 2012-‐2021
0 0 0 0 0 0 0 0 0 0 0 0
0 0 0 0 0 0 0 0 0 0 0 0
-‐14 -‐69 -‐80 -‐84 -‐95 -‐107 -‐117 -‐129 -‐137 -‐150 -‐148 -‐1,117
0 -‐1 -‐14 -‐44 -‐61 -‐69 -‐77 -‐97 -‐106 -‐125 -‐140 -‐735
0 -‐12 -‐22 -‐25 -‐28 -‐32 -‐38 -‐44 -‐54 -‐63 -‐71 -‐389
0 -‐6 -‐9 -‐66 -‐122 -‐164 -‐182 -‐194 -‐208 -‐219 -‐233 -‐1,403
-‐14 0 0 0 1 1 1 2 2 2 2 11
-‐7 -‐87 -‐107 -‐156 -‐186 -‐199 -‐205 -‐212 -‐216 -‐221 -‐225 -‐1,814
-‐2 -‐4 -‐9 -‐18 -‐32 -‐50 -‐73 -‐98 -‐127 -‐160 -‐196 -‐767
-‐37 -‐179 -‐241 -‐393 -‐523 -‐620 -‐691 -‐773 -‐846 -‐935 -‐1,011 -‐6,214
UPDATED ON APRIL 11, 2011 TO ASSUME ADOPTION OF THE MANAGER'S AMENDMENT.

S-‐5 FY2012 BUDGET RESOLUTION VS STATUS QUOFY2012 BUDGET RESOLUTION VS STATUS QUOFY2012 BUDGET RESOLUTION VS STATUS QUOFY2012 BUDGET RESOLUTION VS STATUS QUOFY2012 BUDGET RESOLUTION VS STATUS QUOFY2012 BUDGET RESOLUTION VS STATUS QUOFY2012 BUDGET RESOLUTION VS STATUS QUOFY2012 BUDGET RESOLUTION VS STATUS QUO
CBO LONG-‐TERM ANALYSIS % OF GDPCBO LONG-‐TERM ANALYSIS % OF GDPCBO LONG-‐TERM ANALYSIS % OF GDPCBO LONG-‐TERM ANALYSIS % OF GDPCBO LONG-‐TERM ANALYSIS % OF GDPCBO LONG-‐TERM ANALYSIS % OF GDPCBO LONG-‐TERM ANALYSIS % OF GDPCBO LONG-‐TERM ANALYSIS % OF GDP
PROJECTEDPROJECTEDPROJECTEDPROJECTEDPROJECTEDPROJECTEDPROJECTEDPROJECTED
TOTAL REVENUES
TOTAL SPENDING
DEFICIT (-‐) OR SURPLUS
DEBT HELD BY THE PUBLIC
TOTAL REVENUES
TOTAL SPENDING
DEFICIT (-‐) OR SURPLUS
DEBT HELD BY THE PUBLIC
20222022 20302030 20402040 20502050
CHAIRMAN'S MARKCHAIRMAN'S MARKCHAIRMAN'S MARKCHAIRMAN'S MARKCHAIRMAN'S MARKCHAIRMAN'S MARKCHAIRMAN'S MARKCHAIRMAN'S MARK
18 ½18 ½ 19 19 19 19 19 19
20 ¼20 ¼ 20 ¾20 ¾ 18 ¾18 ¾ 14 ¾14 ¾
-‐2-‐2 -‐1 ¾-‐1 ¾ ¼¼ 4 ¼4 ¼
7070 6464 4848 1010
ALTERNATIVE FISCAL SCENARIOALTERNATIVE FISCAL SCENARIOALTERNATIVE FISCAL SCENARIOALTERNATIVE FISCAL SCENARIOALTERNATIVE FISCAL SCENARIOALTERNATIVE FISCAL SCENARIOALTERNATIVE FISCAL SCENARIOALTERNATIVE FISCAL SCENARIO
19 ¼19 ¼ 19 ¼19 ¼ 19 ¼19 ¼ 19 ¼19 ¼
26 ¾26 ¾ 32 ¼32 ¼ 38 ½38 ½ 45 ¼45 ¼
-‐7 ½-‐7 ½ -‐13 -‐13 -‐19 ¼-‐19 ¼ -‐26 -‐26
9595 146146 233233 344344
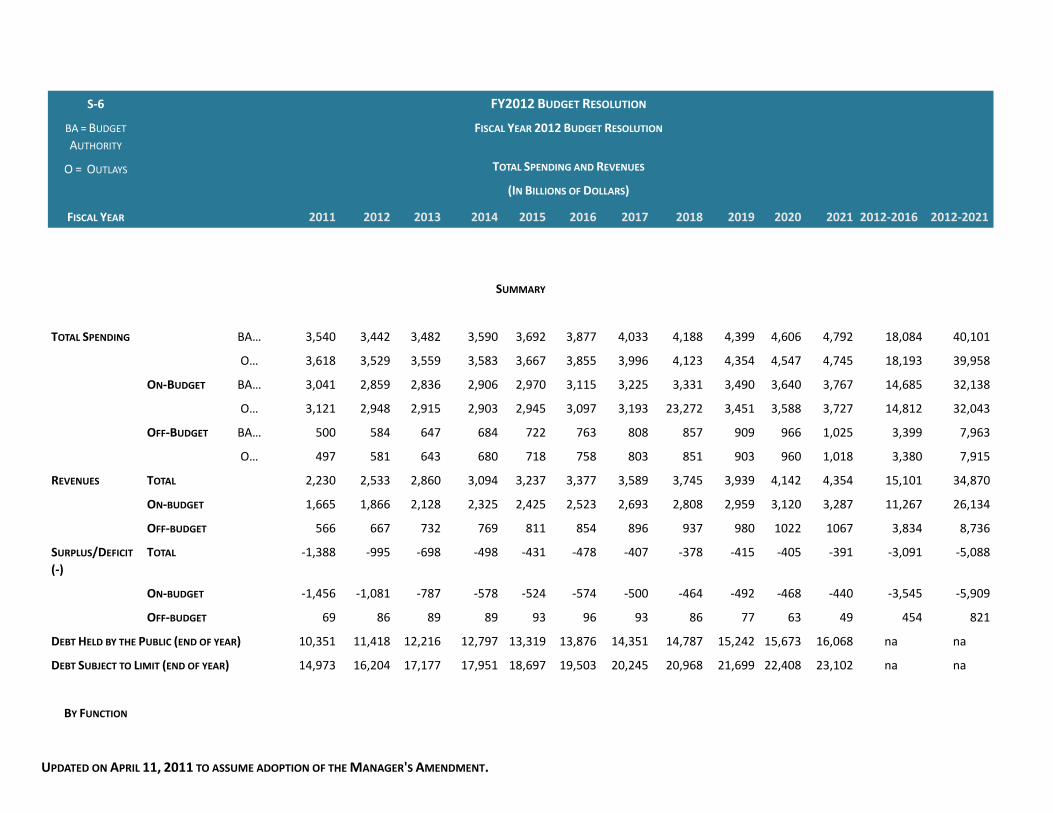
S-‐6 FY2012 BUDGET RESOLUTIONFY2012 BUDGET RESOLUTIONFY2012 BUDGET RESOLUTIONFY2012 BUDGET RESOLUTIONFY2012 BUDGET RESOLUTIONFY2012 BUDGET RESOLUTIONFY2012 BUDGET RESOLUTIONFY2012 BUDGET RESOLUTIONFY2012 BUDGET RESOLUTIONFY2012 BUDGET RESOLUTIONFY2012 BUDGET RESOLUTIONFY2012 BUDGET RESOLUTIONFY2012 BUDGET RESOLUTIONFY2012 BUDGET RESOLUTIONFY2012 BUDGET RESOLUTION
BA = BUDGET AUTHORITY
FISCAL YEAR 2012 BUDGET RESOLUTIONFISCAL YEAR 2012 BUDGET RESOLUTIONFISCAL YEAR 2012 BUDGET RESOLUTIONFISCAL YEAR 2012 BUDGET RESOLUTIONFISCAL YEAR 2012 BUDGET RESOLUTIONFISCAL YEAR 2012 BUDGET RESOLUTIONFISCAL YEAR 2012 BUDGET RESOLUTIONFISCAL YEAR 2012 BUDGET RESOLUTIONFISCAL YEAR 2012 BUDGET RESOLUTIONFISCAL YEAR 2012 BUDGET RESOLUTIONFISCAL YEAR 2012 BUDGET RESOLUTIONFISCAL YEAR 2012 BUDGET RESOLUTIONFISCAL YEAR 2012 BUDGET RESOLUTIONFISCAL YEAR 2012 BUDGET RESOLUTIONFISCAL YEAR 2012 BUDGET RESOLUTION
O = OUTLAYS TOTAL SPENDING AND REVENUESTOTAL SPENDING AND REVENUESTOTAL SPENDING AND REVENUESTOTAL SPENDING AND REVENUESTOTAL SPENDING AND REVENUESTOTAL SPENDING AND REVENUESTOTAL SPENDING AND REVENUESTOTAL SPENDING AND REVENUESTOTAL SPENDING AND REVENUESTOTAL SPENDING AND REVENUESTOTAL SPENDING AND REVENUESTOTAL SPENDING AND REVENUESTOTAL SPENDING AND REVENUESTOTAL SPENDING AND REVENUESTOTAL SPENDING AND REVENUES
(IN BILLIONS OF DOLLARS)(IN BILLIONS OF DOLLARS)(IN BILLIONS OF DOLLARS)(IN BILLIONS OF DOLLARS)(IN BILLIONS OF DOLLARS)(IN BILLIONS OF DOLLARS)(IN BILLIONS OF DOLLARS)(IN BILLIONS OF DOLLARS)(IN BILLIONS OF DOLLARS)(IN BILLIONS OF DOLLARS)(IN BILLIONS OF DOLLARS)(IN BILLIONS OF DOLLARS)(IN BILLIONS OF DOLLARS)(IN BILLIONS OF DOLLARS)(IN BILLIONS OF DOLLARS)
FISCAL YEAR 2011 2012 2013 2014 2015 2016 2017 2018 2019 2020 2021 2012-‐2016 2012-‐2021
SUMMARYSUMMARYSUMMARYSUMMARYSUMMARYSUMMARYSUMMARYSUMMARYSUMMARYSUMMARYSUMMARYSUMMARYSUMMARYSUMMARYSUMMARYSUMMARY
TOTAL SPENDING BA… 3,540 3,442 3,482 3,590 3,692 3,877 4,033 4,188 4,399 4,606 4,792 18,084 40,101
O… 3,618 3,529 3,559 3,583 3,667 3,855 3,996 4,123 4,354 4,547 4,745 18,193 39,958
ON-‐BUDGET BA… 3,041 2,859 2,836 2,906 2,970 3,115 3,225 3,331 3,490 3,640 3,767 14,685 32,138
O… 3,121 2,948 2,915 2,903 2,945 3,097 3,193 23,272 3,451 3,588 3,727 14,812 32,043
OFF-‐BUDGET BA… 500 584 647 684 722 763 808 857 909 966 1,025 3,399 7,963
O… 497 581 643 680 718 758 803 851 903 960 1,018 3,380 7,915
REVENUES TOTAL 2,230 2,533 2,860 3,094 3,237 3,377 3,589 3,745 3,939 4,142 4,354 15,101 34,870
ON-‐BUDGET 1,665 1,866 2,128 2,325 2,425 2,523 2,693 2,808 2,959 3,120 3,287 11,267 26,134
OFF-‐BUDGET 566 667 732 769 811 854 896 937 980 1022 1067 3,834 8,736
SURPLUS/DEFICIT (-‐)
TOTAL -‐1,388 -‐995 -‐698 -‐498 -‐431 -‐478 -‐407 -‐378 -‐415 -‐405 -‐391 -‐3,091 -‐5,088
ON-‐BUDGET -‐1,456 -‐1,081 -‐787 -‐578 -‐524 -‐574 -‐500 -‐464 -‐492 -‐468 -‐440 -‐3,545 -‐5,909
OFF-‐BUDGET 69 86 89 89 93 96 93 86 77 63 49 454 821
DEBT HELD BY THE PUBLIC (END OF YEAR)DEBT HELD BY THE PUBLIC (END OF YEAR)DEBT HELD BY THE PUBLIC (END OF YEAR) 10,351 11,418 12,216 12,797 13,319 13,876 14,351 14,787 15,242 15,673 16,068 na na
DEBT SUBJECT TO LIMIT (END OF YEAR)DEBT SUBJECT TO LIMIT (END OF YEAR)DEBT SUBJECT TO LIMIT (END OF YEAR) 14,973 16,204 17,177 17,951 18,697 19,503 20,245 20,968 21,699 22,408 23,102 na na
BY FUNCTION
UPDATED ON APRIL 11, 2011 TO ASSUME ADOPTION OF THE MANAGER'S AMENDMENT.

S-‐6 FY2012 BUDGET RESOLUTIONFY2012 BUDGET RESOLUTIONFY2012 BUDGET RESOLUTIONFY2012 BUDGET RESOLUTIONFY2012 BUDGET RESOLUTIONFY2012 BUDGET RESOLUTIONFY2012 BUDGET RESOLUTIONFY2012 BUDGET RESOLUTIONFY2012 BUDGET RESOLUTIONFY2012 BUDGET RESOLUTIONFY2012 BUDGET RESOLUTIONFY2012 BUDGET RESOLUTIONFY2012 BUDGET RESOLUTIONFY2012 BUDGET RESOLUTIONFY2012 BUDGET RESOLUTION
BA = BUDGET AUTHORITY
FISCAL YEAR 2012 BUDGET RESOLUTIONFISCAL YEAR 2012 BUDGET RESOLUTIONFISCAL YEAR 2012 BUDGET RESOLUTIONFISCAL YEAR 2012 BUDGET RESOLUTIONFISCAL YEAR 2012 BUDGET RESOLUTIONFISCAL YEAR 2012 BUDGET RESOLUTIONFISCAL YEAR 2012 BUDGET RESOLUTIONFISCAL YEAR 2012 BUDGET RESOLUTIONFISCAL YEAR 2012 BUDGET RESOLUTIONFISCAL YEAR 2012 BUDGET RESOLUTIONFISCAL YEAR 2012 BUDGET RESOLUTIONFISCAL YEAR 2012 BUDGET RESOLUTIONFISCAL YEAR 2012 BUDGET RESOLUTIONFISCAL YEAR 2012 BUDGET RESOLUTIONFISCAL YEAR 2012 BUDGET RESOLUTION
O = OUTLAYS TOTAL SPENDING AND REVENUESTOTAL SPENDING AND REVENUESTOTAL SPENDING AND REVENUESTOTAL SPENDING AND REVENUESTOTAL SPENDING AND REVENUESTOTAL SPENDING AND REVENUESTOTAL SPENDING AND REVENUESTOTAL SPENDING AND REVENUESTOTAL SPENDING AND REVENUESTOTAL SPENDING AND REVENUESTOTAL SPENDING AND REVENUESTOTAL SPENDING AND REVENUESTOTAL SPENDING AND REVENUESTOTAL SPENDING AND REVENUESTOTAL SPENDING AND REVENUES
(IN BILLIONS OF DOLLARS)(IN BILLIONS OF DOLLARS)(IN BILLIONS OF DOLLARS)(IN BILLIONS OF DOLLARS)(IN BILLIONS OF DOLLARS)(IN BILLIONS OF DOLLARS)(IN BILLIONS OF DOLLARS)(IN BILLIONS OF DOLLARS)(IN BILLIONS OF DOLLARS)(IN BILLIONS OF DOLLARS)(IN BILLIONS OF DOLLARS)(IN BILLIONS OF DOLLARS)(IN BILLIONS OF DOLLARS)(IN BILLIONS OF DOLLARS)(IN BILLIONS OF DOLLARS)
FISCAL YEAR 2011 2012 2013 2014 2015 2016 2017 2018 2019 2020 2021 2012-‐2016 2012-‐2021
NATIONAL DEFENSE (050)NATIONAL DEFENSE (050) BA… 561 583 600 617 629 642 654 666 678 690 703 3,070 6,461
O… 640 594 597 607 619 635 643 650 667 679 691 3,052 6,383
INTERNATIONAL AFFAIRS (150)INTERNATIONAL AFFAIRS (150) BA… 52 37 36 32 30 29 31 32 33 34 35 164 327
O… 44 36 35 34 33 32 32 32 30 30 31 170 324
GENERAL SCIENCE, SPACE, GENERAL SCIENCE, SPACE, BA… 29 27 27 27 27 27 28 28 29 30 30 137 282
AND TECHNOLOGY (250)AND TECHNOLOGY (250) O… 31 30 28 28 27 28 28 28 29 29 30 141 285
ENERGY (270) BA… 7 7 4 1 1 1 1 1 1 1 1 14 20
O… 13 16 10 5 1 0 0 1 0 0 0 32 35
NATURAL RESOURCES ANDNATURAL RESOURCES AND BA… 32 32 29 25 27 25 26 27 27 28 28 139 274
ENVIRONMENT (300)ENVIRONMENT (300) O… 40 37 33 29 29 26 26 25 25 26 26 154 284
AGRICULTURE (350)AGRICULTURE (350) BA… 26 20 18 17 17 17 17 17 17 17 18 90 176
O… 22 20 22 16 17 17 16 16 16 17 17 91 173
COMMERCE AND HOUSING COMMERCE AND HOUSING BA… -‐7 15 4 1 -‐2 -‐3 -‐0 0 0 0 0 14 14
CREDIT (370) O… -‐7 17 3 -‐14 -‐19 -‐23 -‐24 -‐26 -‐17 -‐18 -‐19 -‐37 -‐140
ON-‐BUDGET BA… -‐10 14 4 1 -‐3 -‐3 -‐0 -‐0 -‐0 -‐0 -‐0 13 12
O… -‐10 16 3 -‐14 -‐19 -‐23 -‐24 -‐26 -‐18 -‐18 -‐20 -‐38 -‐143
OFF-‐BUDGET BA… 4 1 -‐0 0 0 0 0 0 0 0 0 1 3
O… 4 1 -‐0 0 0 0 0 0 0 0 0 1 3
TRANSPORTATION (400)TRANSPORTATION (400) BA… 85 64 65 64 60 69 66 71 67 67 69 322 662
O… 95 80 71 68 66 66 67 67 70 72 77 351 704
COMMUNITY AND REGIONALCOMMUNITY AND REGIONAL BA… 16 12 11 11 11 11 11 11 12 12 12 57 115

S-‐6 FY2012 BUDGET RESOLUTIONFY2012 BUDGET RESOLUTIONFY2012 BUDGET RESOLUTIONFY2012 BUDGET RESOLUTIONFY2012 BUDGET RESOLUTIONFY2012 BUDGET RESOLUTIONFY2012 BUDGET RESOLUTIONFY2012 BUDGET RESOLUTIONFY2012 BUDGET RESOLUTIONFY2012 BUDGET RESOLUTIONFY2012 BUDGET RESOLUTIONFY2012 BUDGET RESOLUTIONFY2012 BUDGET RESOLUTIONFY2012 BUDGET RESOLUTIONFY2012 BUDGET RESOLUTION
BA = BUDGET AUTHORITY
FISCAL YEAR 2012 BUDGET RESOLUTIONFISCAL YEAR 2012 BUDGET RESOLUTIONFISCAL YEAR 2012 BUDGET RESOLUTIONFISCAL YEAR 2012 BUDGET RESOLUTIONFISCAL YEAR 2012 BUDGET RESOLUTIONFISCAL YEAR 2012 BUDGET RESOLUTIONFISCAL YEAR 2012 BUDGET RESOLUTIONFISCAL YEAR 2012 BUDGET RESOLUTIONFISCAL YEAR 2012 BUDGET RESOLUTIONFISCAL YEAR 2012 BUDGET RESOLUTIONFISCAL YEAR 2012 BUDGET RESOLUTIONFISCAL YEAR 2012 BUDGET RESOLUTIONFISCAL YEAR 2012 BUDGET RESOLUTIONFISCAL YEAR 2012 BUDGET RESOLUTIONFISCAL YEAR 2012 BUDGET RESOLUTION
O = OUTLAYS TOTAL SPENDING AND REVENUESTOTAL SPENDING AND REVENUESTOTAL SPENDING AND REVENUESTOTAL SPENDING AND REVENUESTOTAL SPENDING AND REVENUESTOTAL SPENDING AND REVENUESTOTAL SPENDING AND REVENUESTOTAL SPENDING AND REVENUESTOTAL SPENDING AND REVENUESTOTAL SPENDING AND REVENUESTOTAL SPENDING AND REVENUESTOTAL SPENDING AND REVENUESTOTAL SPENDING AND REVENUESTOTAL SPENDING AND REVENUESTOTAL SPENDING AND REVENUES
(IN BILLIONS OF DOLLARS)(IN BILLIONS OF DOLLARS)(IN BILLIONS OF DOLLARS)(IN BILLIONS OF DOLLARS)(IN BILLIONS OF DOLLARS)(IN BILLIONS OF DOLLARS)(IN BILLIONS OF DOLLARS)(IN BILLIONS OF DOLLARS)(IN BILLIONS OF DOLLARS)(IN BILLIONS OF DOLLARS)(IN BILLIONS OF DOLLARS)(IN BILLIONS OF DOLLARS)(IN BILLIONS OF DOLLARS)(IN BILLIONS OF DOLLARS)(IN BILLIONS OF DOLLARS)
FISCAL YEAR 2011 2012 2013 2014 2015 2016 2017 2018 2019 2020 2021 2012-‐2016 2012-‐2021
DEVELOPMENT (450)DEVELOPMENT (450) O… 24 24 21 18 14 12 11 11 11 11 12 89 145
EDUCATION, TRAINING, EMPLOYMENTEDUCATION, TRAINING, EMPLOYMENT BA… 58 67 64 66 69 73 75 77 78 80 81 340 731
AND SOCIAL SERVICES (500)AND SOCIAL SERVICES (500) O… 100 100 73 68 70 73 76 77 78 80 81 385 777
HEALTH (550) BA… 376 342 344 338 327 320 340 350 372 396 405 1,671 3,533
O… 376 347 341 320 315 325 343 347 369 382 401 1,648 3,489
MEDICARE (570)MEDICARE (570) BA… 491 482 520 550 573 619 638 657 711 758 809 2,744 6,318
O… 491 482 520 550 573 619 638 657 712 758 809 2,745 6,320
INCOME SECURITY (600)INCOME SECURITY (600) BA… 592 502 487 457 431 437 437 441 457 468 481 2,314 4,599
O… 603 501 487 456 429 439 435 434 454 466 478 2,312 4,579
SOCIAL SECURITY (650)SOCIAL SECURITY (650) BA… 735 769 808 851 898 949 1,006 1,069 1,135 1,206 1,278 4,274 9,968
O… 733 766 804 847 893 944 1,001 1,063 1,130 1,200 1,272 4,255 9,921
ON-‐BUDGET BA… 107 54 29 33 36 40 44 49 54 59 64 193 462
O… 107 55 29 33 36 40 44 49 54 59 64 193 462
OFF-‐BUDGET BA… 629 715 779 818 861 909 962 1,020 1,082 1,148 1,214 4,081 9,507
O… 626 712 775 814 857 904 957 1,015 1,076 1,141 1,208 4,062 9,458
VETERANS BENEFITS ANDVETERANS BENEFITS AND BA… 129 128 130 1344 138 147 146 145 155 160 164 678 1,449
SERVICES (700)SERVICES (700) O… 128 127 130 134 138 147 146 145 155 159 164 675 1,443
ADMINISTRATION OF JUSTICE (750)ADMINISTRATION OF JUSTICE (750) BA… 47 57 45 45 45 47 46 47 48 51 53 239 483
O… 55 54 50 49 47 49 47 47 48 50 52 248 493
GENERAL GOVERNMENT (800)GENERAL GOVERNMENT (800) BA… 26 23 22 22 22 22 22 23 24 24 24 112 229
O… 27 27 23 23 22 22 22 22 22 23 23 117 229
NET INTEREST (900)NET INTEREST (900) BA… 212 256 319 390 457 521 578 627 667 706 735 1,944 5,258

S-‐6 FY2012 BUDGET RESOLUTIONFY2012 BUDGET RESOLUTIONFY2012 BUDGET RESOLUTIONFY2012 BUDGET RESOLUTIONFY2012 BUDGET RESOLUTIONFY2012 BUDGET RESOLUTIONFY2012 BUDGET RESOLUTIONFY2012 BUDGET RESOLUTIONFY2012 BUDGET RESOLUTIONFY2012 BUDGET RESOLUTIONFY2012 BUDGET RESOLUTIONFY2012 BUDGET RESOLUTIONFY2012 BUDGET RESOLUTIONFY2012 BUDGET RESOLUTIONFY2012 BUDGET RESOLUTION
BA = BUDGET AUTHORITY
FISCAL YEAR 2012 BUDGET RESOLUTIONFISCAL YEAR 2012 BUDGET RESOLUTIONFISCAL YEAR 2012 BUDGET RESOLUTIONFISCAL YEAR 2012 BUDGET RESOLUTIONFISCAL YEAR 2012 BUDGET RESOLUTIONFISCAL YEAR 2012 BUDGET RESOLUTIONFISCAL YEAR 2012 BUDGET RESOLUTIONFISCAL YEAR 2012 BUDGET RESOLUTIONFISCAL YEAR 2012 BUDGET RESOLUTIONFISCAL YEAR 2012 BUDGET RESOLUTIONFISCAL YEAR 2012 BUDGET RESOLUTIONFISCAL YEAR 2012 BUDGET RESOLUTIONFISCAL YEAR 2012 BUDGET RESOLUTIONFISCAL YEAR 2012 BUDGET RESOLUTIONFISCAL YEAR 2012 BUDGET RESOLUTION
O = OUTLAYS TOTAL SPENDING AND REVENUESTOTAL SPENDING AND REVENUESTOTAL SPENDING AND REVENUESTOTAL SPENDING AND REVENUESTOTAL SPENDING AND REVENUESTOTAL SPENDING AND REVENUESTOTAL SPENDING AND REVENUESTOTAL SPENDING AND REVENUESTOTAL SPENDING AND REVENUESTOTAL SPENDING AND REVENUESTOTAL SPENDING AND REVENUESTOTAL SPENDING AND REVENUESTOTAL SPENDING AND REVENUESTOTAL SPENDING AND REVENUESTOTAL SPENDING AND REVENUES
(IN BILLIONS OF DOLLARS)(IN BILLIONS OF DOLLARS)(IN BILLIONS OF DOLLARS)(IN BILLIONS OF DOLLARS)(IN BILLIONS OF DOLLARS)(IN BILLIONS OF DOLLARS)(IN BILLIONS OF DOLLARS)(IN BILLIONS OF DOLLARS)(IN BILLIONS OF DOLLARS)(IN BILLIONS OF DOLLARS)(IN BILLIONS OF DOLLARS)(IN BILLIONS OF DOLLARS)(IN BILLIONS OF DOLLARS)(IN BILLIONS OF DOLLARS)(IN BILLIONS OF DOLLARS)
FISCAL YEAR 2011 2012 2013 2014 2015 2016 2017 2018 2019 2020 2021 2012-‐2016 2012-‐2021
O… 212 256 319 390 457 521 578 627 667 706 735 1,944 5,258
ON-‐BUDGET BA… 330 373 435 508 578 648 712 770 818 864 900 2,542 6,606
O… 330 373 435 508 578 648 712 770 818 864 900 2,542 6,606
OFF-‐BUDGET BA… -‐118 -‐117 -‐116 -‐118 -‐121 -‐127 -‐134 -‐142 -‐151 -‐158 -‐165 -‐598 -‐1,349
O… -‐118 -‐117 -‐116 -‐118 -‐121 -‐127 -‐134 -‐142 -‐151 -‐158 -‐165 -‐598 -‐1,349
ALLOWANCES (920)ALLOWANCES (920) BA… -‐-‐ -‐6 -‐5 -‐11 -‐17 -‐23 -‐29 -‐34 -‐40 -‐45 -‐51 -‐61 -‐260
O… -‐-‐ -‐3 -‐6 -‐12 -‐17 -‐23 -‐29 -‐34 -‐40 -‐45 -‐51 -‐61 -‐259
ON-‐BUDGET BA… -‐-‐ -‐6 -‐4 -‐10 -‐16 -‐22 -‐28 -‐33 -‐38 -‐44 -‐49 -‐60 -‐251
O… -‐-‐ -‐3 -‐6 -‐11 -‐17 -‐23 -‐28 -‐33 -‐38 -‐44 -‐49 -‐59 -‐251
OFF-‐BUDGET BA… -‐-‐ -‐0 -‐0 -‐0 -‐0 -‐1 -‐1 -‐1 -‐1 -‐1 -‐2 -‐2 -‐8
O… -‐-‐ -‐0 -‐0 -‐0 -‐0 -‐1 -‐1 -‐1 -‐1 -‐1 -‐2 -‐2 -‐8
UNDISTRIBUTED OFFSETTING UNDISTRIBUTED OFFSETTING BA… -‐87 -‐100 -‐97 -‐99 -‐102 -‐104 -‐110 -‐117 -‐123 -‐128 -‐133 -‐503 -‐1,114
RECEIPTS (950)RECEIPTS (950) O… -‐87 -‐100 -‐97 -‐99 -‐102 -‐104 -‐110 -‐117 -‐123 -‐128 -‐133 -‐503 -‐1,114
ON-‐BUDGET BA… -‐72 -‐85 -‐81 -‐83 -‐85 -‐86 -‐91 -‐97 -‐102 -‐106 -‐110 -‐419 -‐925
O… -‐72 -‐85 -‐81 -‐83 -‐85 -‐86 -‐91 -‐97 -‐102 -‐106 -‐110 -‐419 -‐925
OFF-‐BUDGET BA… -‐15 -‐15 -‐16 -‐17 -‐17 -‐18 -‐19 -‐20 -‐21 -‐22 -‐23 -‐83 -‐189
O… -‐15 -‐15 -‐16 -‐17 -‐17 -‐18 -‐19 -‐20 -‐21 -‐22 -‐23 -‐83 -‐189
GLOBAL WAR ON TERRORISM (970)GLOBAL WAR ON TERRORISM (970) BA… 159 127 50 50 50 50 50 50 50 50 50 327 577
O… 76 118 93 65 54 51 50 50 50 50 50 381 630
APPENDIX IIA PRO-GROWTH
BUDGET

APPENDIX II: A PRO-GROWTH BUDGET
Economic Analysis of the House Budget Resolution by the Center for Data Analysis at The Heritage Foundation
April 5, 2011
Congressman Paul Ryan (R-WI), chairman of the Committee on the Budget of the U.S. House of Representatives, requested by letter that the Center for Data Analysis (CDA) undertake an economic analysis of the House Budget Resolution for federal fiscal year 2012 through 2021. The Chairman specifically asked the CDA to perform conventional and dynamic budget analysis, or analysis that is based on largely “static” budget models and on economic models with dynamic economic properties. These economic models estimate the likely effects of policy change on the major components of economic activity—supply of resources, prices, demographic change, and so forth—which might affect federal fiscal results through revenues and outlay costs.
This report summarizes the results of the CDA’s analysis of the House Budget Resolution using these models. As a general matter, the CDA found that implementing the policy changes behind the Budget Resolution would significantly strengthen economic performance throughout the economy and dramatically improve federal fiscal results. This analysis demonstrates that significant actions can be taken now to reform our tax code and rein in the drivers of fiscal imbalances.
Economic and Fiscal Results
The tax and program changes behind the Budget Resolution produce much stronger economic performance when compared to the rate and level of economic activity in the baseline. Lower taxes stimulate greater investment, which expands the size of business activity. This expansion fuels a demand for more labor, which enters a labor market that contains workers who themselves face lower taxes. Consequently, significantly higher employment ensues.
Gains in employment along with lower taxes lead to higher household incomes. The growth of business enterprise coupled with the increase in disposable income fuels more extensive savings and investment by households, which results in the growth of household assets. The stock and value of residential structures increases, as does the volume of household net worth.
As a consequence of the growth in the size of the economy (for example, $1.5 trillion over ten years in additional economic output results from the budget plan), the income base from which the federal government draws its taxes grows significantly. The growth in federal tax revenues under the budget plan matches the growth in the baseline, despite a significant drop in the tax rate and other changes in tax policy favorable to taxpayers.
This obvious strengthening in the tax base and in federal receipts is accompanied by substantially improved fiscal results on the outlay side. Total outlays fall by a total of $9.3 trillion over the ten-year period, 2012 to 2021. This significant decrease leads to a sharp reduction in the total amount of federal

debt: By 2021, publicly held debt is $9.9 trillion lower than in the baseline, which forecasts an economic and fiscal scenario without the policy changes of the Budget Resolution. The yields on 10-year Treasury notes fall by 84 basis points by 2021, and the effective interest rate on the Federal Reserve’s interbank borrowing rate is nearly a full percentage point lower than it is in the baseline.
These are highly positive results, but more steps need to be taken to rein in spending by reforming the drivers of fiscal imbalances. The period 2012 through 2021 is the opening scene in the nation’s long struggle to fund the retirement of the most numerous generation ever to retire while keeping the economy moving forward for those Americans who are below 30 years of age today. To achieve such fiscal sanity given these changes in demography, the tax code and the mandatory spending programs need substantial reform.
Nevertheless, this model-based analysis of the House Budget Resolution and the policy changes underneath it clearly show that a solid step toward a stronger economic and fiscal future can be taken with every confidence of success.
To read the summary results and learn more about the report’s methodology: http://budget.house.gov/UploadedFiles/heritageanalysis452011.pdf


![[Updated] The Bridge to Prosperity: Reverse Reckless Cuts, Restore Our Infrastructure, and Revive Jobs](https://img.pdfslide.us/doc/110x75/577cc53a1a28aba7119bbc9b/updated-the-bridge-to-prosperity-reverse-reckless-cuts-restore-our-infrastructure.jpg)