Embed Size (px)
Citation preview

Summary Report for Sub-Sea and Sub-Surface Oil and Dispersant
Detection: Ecotoxicity Addendum
Prepared for
Julia A. Hein, CAPT, U.S. Coast Guard
Federal On-Scene Coordinator Deepwater Horizon MC252
July 8, 2011
Op
erat
ion
al S
cien
ce A
dvi
sory
Tea
m (O
SA
T)
Gu
lf C
oast
In
cid
ent M
anag
emen
t Tea
m
2
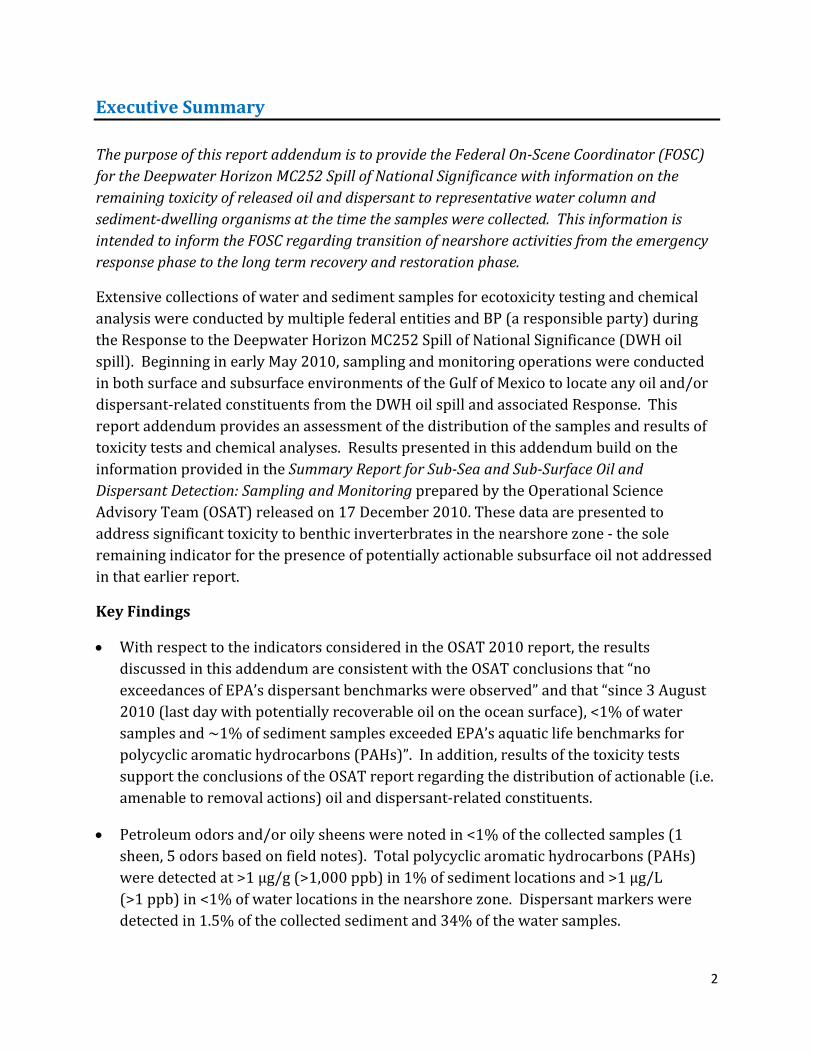
Executive Summary
The purpose of this report addendum is to provide the Federal On‐Scene Coordinator (FOSC)
for the Deepwater Horizon MC252 Spill of National Significance with information on the
remaining toxicity of released oil and dispersant to representative water column and
sediment‐dwelling organisms at the time the samples were collected. This information is
intended to inform the FOSC regarding transition of nearshore activities from the emergency
response phase to the long term recovery and restoration phase.
Extensive collections of water and sediment samples for ecotoxicity testing and chemical
analysis were conducted by multiple federal entities and BP (a responsible party) during
the Response to the Deepwater Horizon MC252 Spill of National Significance (DWH oil
spill). Beginning in early May 2010, sampling and monitoring operations were conducted
in both surface and subsurface environments of the Gulf of Mexico to locate any oil and/or
dispersant‐related constituents from the DWH oil spill and associated Response. This
report addendum provides an assessment of the distribution of the samples and results of
toxicity tests and chemical analyses. Results presented in this addendum build on the
information provided in the Summary Report for Sub‐Sea and Sub‐Surface Oil and
Dispersant Detection: Sampling and Monitoring prepared by the Operational Science
Advisory Team (OSAT) released on 17 December 2010. These data are presented to
address significant toxicity to benthic inverterbrates in the nearshore zone ‐ the sole
remaining indicator for the presence of potentially actionable subsurface oil not addressed
in that earlier report.
Key Findings
With respect to the indicators considered in the OSAT 2010 report, the results
discussed in this addendum are consistent with the OSAT conclusions that “no
exceedances of EPA’s dispersant benchmarks were observed” and that “since 3 August
2010 (last day with potentially recoverable oil on the ocean surface), <1% of water
samples and ~1% of sediment samples exceeded EPA’s aquatic life benchmarks for
polycyclic aromatic hydrocarbons (PAHs)”. In addition, results of the toxicity tests
support the conclusions of the OSAT report regarding the distribution of actionable (i.e.
amenable to removal actions) oil and dispersant‐related constituents.
Petroleum odors and/or oily sheens were noted in <1% of the collected samples (1
sheen, 5 odors based on field notes). Total polycyclic aromatic hydrocarbons (PAHs)
were detected at >1 µg/g (>1,000 ppb) in 1% of sediment locations and >1 µg/L
(>1 ppb) in <1% of water locations in the nearshore zone. Dispersant markers were
detected in 1.5% of the collected sediment and 34% of the water samples.

3
A total of 3,548 toxicity tests were conducted during the DWH oil spill and associated
Response, making this the most extensive testing program ever conducted to
characterize the effects of an oil spill in the marine environment. Overall, statistically
significant effects were reported in 10% of the toxicity tests.
Based on evaluation of analytical chemistry results for the toxicity samples collected
after 3 August 2010, 1% of sediment locations and <1% of water locations exceeded
EPA’s chronic aquatic benchmark for PAHs. None of the water or sediment pre‐impact
samples exceeded the benchmark.
None of the concentrations of dispersant‐related constituents found in the sediment
and water samples collected after 3 August 2010 in the nearshore zone exceeded EPA’s
chronic aquatic benchmarks.
Statistically significant effects were observed at 31% of the 104 pre‐impact locations.
Seventy‐nine of the pre‐impact locations were resampled after 3 August 2010, and 32%
of the locations (24 sediment and 2 water locations) showed significant effects.
Of the locations sampled after 3 August 2010, 18 showed significant effects and had
chemical fingerprints characteristic of MC252 oil. Fifty‐five locations (51 sediment and
4 water locations) that showed significant effects were not characteristic of MC252 oil.
Out of a total of 647 nearshore locations sampled after 3 August 2010, 451 locations
were not fingerprinted due to low total PAH concentrations. Of these locations, 145
locations showed significant effects (total PAH concentrations <0.32 µg/g [320 ppb] in
sediment, <0.03 µg/L [0.03 ppb] in water), and 306 locations did not show significant
effects (total PAH concentrations <0.58 µg/g [580 ppb] in sediment, <0.18 µg/L [0.18
ppb] in water).
These data were collected to determine the presence or absence of potentially
actionable oil and not to develop empirical relationships between oil constituents and
toxicity. While representative of conditions in the Gulf of Mexico after 3 August 2010,
the skewed distribution and narrow range of concentrations of constituents measured
in this data set do not support development of empirical relationships with toxicity.
Based on evaluation of the extensive dataset of toxicity test results and associated chemical
analyses, the sampling conducted during the Response is adequate for decision‐making by
the FOSC regarding when to transition nearshore activities from the emergency response
phase to long‐term recovery and restoration phase. In some of the locations with
significant effects in the toxicity tests, MC252 oil was present at levels above EPA’s chronic
aquatic benchmark for PAHs. Additional locations that contained MC252 oil did not show
significant toxicity test effects. Further locations were not fingerprinted due to low total

4
PAH concentrations. In some samples, other contaminants (e.g., metals, biogenic or
pyrogenic sources of PAHs) or physicochemical characteristics (e.g., ammonia, grain size,
carbon content) may have contributed to or caused significant effects. Statistically
significant effects in laboratory tests may or may not be biologically or ecologically
relevant. Long‐term chronic effects on aquatic life are being assessed as part of the injury
assessment conducted through the Natural Resources Damage Assessment (NRDA) process
and Gulf of Mexico Research Institute (GRI)‐funded research. Several factors should be
considered in interpreting the findings of this report for any purpose besides assessment of
actionable oil, including variations in detection limits and sampling methods, assumptions
used to calculate chronic aquatic life ratios and fingerprinting of the samples.

5
Table of Contents
Executive Summary ...................................................................................................................................................... 2
Section 1: Introduction ............................................................................................................................................... 7
Section 2: Sample Collection and Testing ........................................................................................................... 9
2.1 Nearshore Zone Samples ....................................................................................................................... 10
Section 3: Data Evaluation and Interpretation ............................................................................................ 14
3.1 Approach Used to Evaluate Data ....................................................................................................... 14
3.2 EPA’s Chronic Aquatic Benchmark for PAHs ................................................................................ 14
3.3 Fingerprinting of Toxicity Samples .................................................................................................. 15
3.4 Evaluation of Pre‐Impact Samples .................................................................................................... 17
3.5 Evaluation of Samples Collected After 3 August 2010 ............................................................. 18
3.5.1 Re‐Evaluation of Pre‐Impact Locations .................................................................................. 19
3.6 In‐Slick Monitoring .................................................................................................................................. 20
3.7 Integrated Toxicity Assessment ......................................................................................................... 21
3.7.1 Relationship Between Toxicity and Chemical Results ..................................................... 22
3.7.2 Dispersant Analyses ........................................................................................................................ 23
3.7.3 Integrated Data Evaluation .......................................................................................................... 24
Section 4: Additional Toxicity Tests ................................................................................................................... 28
Section 5: Conclusions .............................................................................................................................................. 29
Section 6: References ................................................................................................................................................ 32
Section 7: Maps ........................................................................................................................................................... 34
Map 7.1: Sampling Zones .................................................................................................................. 34
Map 7.2: Nearshore Toxicity Sample Locations ..................................................................... 34
Map 7.3: Pre‐Impact Toxicity ......................................................................................................... 34
Map 7.4: Nearshore Toxicity Samples Collected After 3 August 2010 ......................... 34
Map 7.5: Exceedances of EPA’s Chronic Aquatic Benchmark for PAHs ....................... 34
Map 7.6: MC252 Oil Fingerprint Results for Nearshore Samples ................................... 34
Map 7.7: Sediment Toxicity Samples Collected After 3 August 2010 ........................... 34
Map 7.8: Water Toxicity Samples Collected After 3 August 2010 .................................. 34
Map 7.9: Resample of Pre‐Impact Toxicity After 3 August 2010 .................................... 34

6
Map 7.10: Dispersant Samples Collected After 3 August 2010 .......................................... 34
Map 7.11: Integrated Evaluation of Data – Significant Effects ............................................ 34
Appendices ..................................................................................................................................................................... 35

7
Section 1: Introduction
The purpose of this report addendum is to provide the Federal On‐Scene Coordinator
(FOSC) for the Deepwater Horizon MC252 Spill of National Significance with information
on the remaining toxicity of released oil and dispersant to representative water column
and sediment‐dwelling organisms at the time the samples were collected. This
information is intended to inform the FOSC regarding the transition of nearshore
activities from the emergency response phase to the long term recovery and restoration
phase.
During the Deepwater Horizon MC252 Spill of National Significance (DWH oil spill), oil and
gas were discharged from the wellhead approximately 5,000 feet (1500 meters) below the
sea surface for 87 days until the well was successfully capped on 15 July 2010. After the
National Incident Command (NIC) directive of 3 August 2010 (which approximately
coincided with the last visual observations of oil on the ocean surface), the response
initiated a comprehensive sampling and monitoring program to locate and identify
potentially actionable oil in the sub‐surface environment. Substantial quantities of
dissolved and dispersed oil were deposited in the sub‐surface environment of the Gulf of
Mexico (“sub‐surface” refers in this report to both the water column and the bottom
sediments) as a result of naturally occurring physical processes, the use of drilling muds
during relief well drilling activities, and dispersant use as a response option.
Beginning in early May 2010, sampling and monitoring operations were conducted in both
surface and sub‐surface environments of the Gulf of Mexico to locate any oil and/or
dispersant‐related constituents from the DWH oil spill and associated Response. A
multitude of state and federal agencies, BP contractors, academics, and non‐governmental
organizations performed pre‐impact (defined in this report as the period between the rig
explosion and shoreline oiling) sampling and numerous sampling programs throughout the
Response. A summary report prepared by the Operational Science Advisory Team (OSAT)
on 17 December 2010 included an assessment of the qualitative and quantitative analytical
data collected in the nearshore, offshore, and deep‐water zones during the Response. The
OSAT report ‘provides an assessment of the distribution of actionable (i.e. amenable to
removal actions) oil and dispersant‐related constituents that remain in the water column
and/or bottom sediments and provides a summary of sampling results to inform decision
makers on further oil removal operations’ (OSAT 2010, pg. 1).
As stated in the OSAT report, the results of toxicity tests conducted on various benthic and
pelagic species were not included in the report, and would be the subject of an addendum
to the report. Toxicity to benthic invertebrates in the nearshore zone is one of the specific
indicators established by the Unified Area Command (UAC) to define the presence or

8
absence of potentially actionable oil. This report addendum summarizes the toxicity tests
and associated chemical data developed during the DWH oil spill and associated Response.
Additionally, to provide a synopsis of all toxicity data generated during the DWH oil spill
and associated Response, results of toxicity tests conducted on samples collected in the
deepwater and offshore zones are also summarized in this document.
The intent of the sampling and monitoring program discussed in the OSAT report and this
report addendum was to assess the presence of oil and dispersant‐related constituents and
not for assessing long‐term ecological impacts in sub‐surface environments. Additional
work is underway to fully evaluate the acute and chronic impacts of the DWH oil spill and
associated Response as part of the Natural Resource Damage Assessment (NRDA) process
and Gulf of Mexico Research Initiative (GRI)‐funded independent research.

9
Section 2: Sample Collection and Testing
Ecotoxicity tests evaluate the effects of environmental samples on the survival, growth,
reproduction, or metabolism of test organisms. Toxicity testing using animals representing
different trophic levels and taxonomic groups can indicate whether samples contain
substances that are toxic under laboratory conditions. Responses in test samples are
compared to laboratory control samples that represent "ideal" conditions for the test
species. Different test organisms vary in their sensitivity to individual contaminants, and
different responses may be observed in short‐term vs. longer‐term exposures. Some test
organisms are also sensitive to factors such as sediment grain size, ammonia, or salinity.
The benefit of toxicity testing using environmental samples is that it provides an integrated
assessment of adverse effects in whole samples. However, determining the definitive cause
of observed responses in laboratory toxicity tests using whole environmental samples is
not possible without significant further effort to fractionate the samples to rule out
alternative causes. Toxicity tests were conducted during the Response as part of an
integrated evaluation of the impacts on aquatic life in the immediate context of a removal
action.
Toxicity tests with benthic and pelagic species were conducted in the laboratory by
multiple agencies (U.S. Environmental Protection Agency [EPA] Regions 4 and 6, U.S.
Geological Survey [USGS]) and BP contractors using water and sediment samples collected
in the nearshore zone (waters inshore of the 3 nautical miles state waters boundary) (Map
7.1). The sampling zone designations used in this report are consistent with those
identified in the OSAT report (OSAT 2010). Raw data (e.g., collection date, location
coordinates, sample depth, test conditions and results) for all tests discussed in this
document are available at www.restorethegulf.gov and GeoPlatform.gov
(http://www.geoplatform.gov/gulfresponse/).
In this report, the term “location” is used to identify a point in time and space where a
sample was collected for testing/analysis, while “test” is used to define an evaluation of a
sample using a particular organism, exposure time, and set of endpoints. A unique location
is defined by the following data: sample coordinates, collection date, media type, and
sample depth (for water samples). Only locations that included paired toxicity test results
and chemical analyses were evaluated. Each data provider conducted quality assurance
evaluations of their own data. Data providers evaluated test results and identified
significant endpoints using standard statistical analysis programs.
Results from a toxicity test were considered “significant” if effects on any test endpoint
(e.g., survival, growth, fertilization, development, biomass, fecundity) were observed in the
field‐collected samples in relation to the untreated laboratory controls. As a conservative
approach, for each location, any statistical difference (p<0.05) between the field‐collected

10
samples and untreated laboratory controls for any endpoint in any toxicity test was
considered a significant effect. Statistically significant effects in laboratory tests may or
may not be biologically or ecologically relevant.
Multiple toxicity tests and chemical analyses were performed on samples collected from
the same location. As a result, the following approach was developed to calculate the
number of locations and tests. To calculate number of locations evaluated for a time period
or endpoint, the dataset was sorted by sample chemical analysis results, and then by
toxicity test results. To calculate number of tests evaluated for a time period or endpoint,
the dataset was sorted by toxicity test endpoint, and then by sample chemical analysis
results. Chemical analysis results were not available at 8 locations with toxicity data, so
these data were not included in the assessment, but all data can be found at
www.restorethegulf.gov and www.geoplatform.gov/gulfresponse/.
2.1 Nearshore Zone Samples
A total of 1,609 toxicity tests (Table 1) were conducted with eleven test species (Table 2)
on samples collected at 751 locations in the nearshore zone (Figure 1, Map 7.2). Pre‐
impact sediment toxicity tests were conducted at 104 locations by the EPA and USGS
beginning on 2 May 2010 (Map 7.3). Toxicity test samples were collected after 3 August
2010 at 647 locations by the EPA, USGS, and BP based on the extent of oil at surface (from
ships, aircraft, satellites, and in situ sampling and observations) and from knowledge of the
nearshore physical oceanography (i.e., movement of water and sediments) (Strategic Plan,
UAC 2010). Samples for chemical analysis were collected at all 647 locations.
Table 1. Summary of toxicity tests conducted on sediment and water samples collected in
the nearshore zone.
Sample Type
Test Type Duration Endpoint Number of Tests
Water
Fish 96 hrs Survival 126
7 days Survival, Growth, Biomass 36
Mysid 96 hrs Survival 93
7 days Survival, Growth, Fecundity, Biomass
30
Pink Shrimp 7 days Survival 88
Sea Urchin 120 min Fertilization 2
Mollusc 48 hrs Survival, Embryo Development 20
Diatom 96 hrs Growth 68
Algae 96 hrs Growth 68

11
Sediment
Amphipod 96 hrs Survival, Growth 74
10 days Survival, Growth, Reburial 505
Worm 10 days Survival 112
Mysid 48 hrs Survival 256
96 hrs Survival, Growth 65
Sea Urchin 60 min, 48 hrs
Fertilization, Embryo Development 66
Table 2. List of species evaluated in toxicity tests with water column and
sediment samples collected in the offshore and nearshore zones.
Scientific Name Common NameAmericamysis bahia(also known as Mysidopsis bahia)
Mysid shrimp
Arbacia punctulata Sea urchinCrassostrea gigas Pacific oyster (Mollusc)Cyprinodon variegatus Sheepshead minnowDunaliella tertiolecta AlgaeFarfantepanaeus duorarum Pink shrimpLeptocheirus plumulosus AmphipodMenidia beryllina Inland silversides fishMytilus galloprovincialis Mussel (Mollusc)Neanthes arenaceodentata Polychaete wormSkeletonema costatum Diatom
Figure 1. Summary of sediment and water column toxicity tests performed on nearshore
samples collected by the EPA, USGS, and BP.
0
100
200
300
400
500
600
700
Number of Tests
Test Type
Summary of Ecotoxicity Tests
Number of Tests
Water Sediment
12
Water samples were collected in the field using sampling devices (e.g., GO‐FLO bottles) that
can be deployed in closed position, then opened at the desired sample depth, filled and
closed, before the bottle is returned to the surface. In shallow water, samples were
collected by dipping the sample container in the water to a sufficient depth to collect below
the surface, while minimizing disturbance of bottom sediments. Sediment in the deeper
portions of the nearshore zone was collected using grab samplers (e.g., Ponar, Van Veen).
Sediment in shallow water was collected using push core tubes or scoops. After collection,
overlying water was removed, and sediment samples were collected from the top 1‐3 cm of
the grab samples to capture recent accumulation. All collected samples were held on ice at
4 °C from collection and during transport under Chain‐of‐Custody to the respective
laboratories for toxicity testing and chemical analysis. Sampling and toxicity test
procedures are outlined in Quality Assurance Project Plans prepared by each data provider.
Tests were performed in accordance with EPA (1994; 1995, 2002a, b) and ASTM (E724,
E1367, E1563, E1611) guidance. Toxicity tests were conducted on water samples
following salinity adjustment, if necessary to achieve test conditions appropriate for the
test species. Whole sediment toxicity tests were conducted with the amphipod, worm and
mysid following sample homogenization and sieving. Mysids would be exposed to chemical
constitutents leaching out of the sediment into the overlying water, while amphipods and
worms are burrowers in the sediment. Porewater samples were evaluated in the sea
urchin tests, and were extracted from the sediment and centrifuged at 1200 g for 20 min. to
remove suspended particulates from the supernatant before use. The toxicity tests
conducted by all entities were performed to determine if there was a significant difference
between the undiluted surface water, porewater, or whole sediment sample (100%
exposure) and the associated laboratory control. In some of the tests, additional dilutions
were evaluated as part of the study design.
One of the criteria established by EPA (1995, 2002a, b) and ASTM E1367 for toxicity test
acceptability relates to control survival. Each test method contains specific test
acceptability criteria (e.g., 90% control survival for acute toxicity tests, 80% control
survival for chronic toxicity tests) which define minimum acceptable control performance
for each endpoint, statistical resolution, and test conditions. Test acceptability criteria
were used to evaluate laboratory performance. Positive control samples were used to
demonstrate sensitivity of test organisms to contaminants. Test acceptability criteria were
evaluated by all data providers, and data used in this report met the established criteria.
Pre‐impact toxicity tests (183 tests) were conducted on samples collected at 104 locations
in the five potentially affected coastal states (Alabama, Florida, Louisiana, Mississippi,
Texas) by considering the location of sensitive natural resources and availability of
historical data. Pre‐impact toxicity tests included: 1) the 10‐day Leptocheirus plumulosus
(burrowing amphipod) sediment survival test, 2) the 10‐day Neanthes arenanceodentata

13
(polychaete worm) survival test, 3) the 96‐hour Menidia beryllina (inland silverside fish)
surface water survival test, 4) the 7‐day Cyprinodon variegatus (sheepshead minnow)
surface water survival test, 5) the 48‐hour and 96‐hour Americamysis bahia (mysid shrimp,
formerly known as Mysidopsis bahia) surface water and sediment survival tests, and 6) 30‐
min and 48‐hour Arbacia punctulata (sea urchin) sediment porewater fertilization and
embryological tests.
Toxicity testing efforts continued through the Response, with 1426 additional tests
conducted on samples collected after 3 August 2010 as part of the Strategic Plan (UAC
2010) using a variety of species at 647 locations (Map 7.4). During this time, 79 pre‐impact
locations were revisited by the EPA and USGS, and a number of new locations were added.
Locations sampled by the EPA, USGS, and BP included targeted sites where oil had been
observed previously during the Response. Surface water and sediment toxicity tests with
additional species and endpoints were included in the later efforts.
Nearshore toxicity tests with water column samples collected after 3 August 2010
included: 1) 96‐hour Americamysis bahia survival test, 2) 7‐day Americamysis bahia
survival, growth, and fecundity test, 3) 96‐hour Menidia beryllina survival tests, 4) 7‐day
Menidia beryllina survival and growth test, 5) 7‐day Farfantepanaeus duorarum (pink
shrimp) survival test, 6) 48‐hour Crassostrea gigas (oyster) survival and development test,
7) 48‐hour Mytilus galloprovincialis (mussel) survival and development test, 8) 96‐hour
Skeletonema costatum (marine diatom) toxicity test, and 9) 96‐hour Dunaliella tertiolecta
(marine algae) toxicity test. Sediment tests included: 1) 96‐hour and 10‐day Leptocheirus
plumulosus survival and reburial test, 2) 10‐day Neanthes arenanceodentata survival test,
3) 96‐hour Americamysis bahia whole sediment survival test, and 4) 60‐min and 48‐hour
Arbacia punctulata (sea urchin) fertilization and embryological test.
Additional toxicity tests were conducted in the offshore and deepwater zones. These
results will be identified and summarized in subsequent sections of the report. The results
of the toxicity tests for samples collected in these zones were included to assist in
interpretation of toxicity to benthic invertebrates in the nearshore zone.

14
Section 3: Data Evaluation and Interpretation
Toxicity test results and associated analytical data for samples collected by all entities
discussed in this report are accessible from http://www.restorethegulf.gov/,
GeoPlatform.gov (http://www.geoplatform.gov/gulfresponse/), and other sources.
Summary reports of toxicity test procedures and results from EPA and USGS as part of the
DWH oil spill and associated Response have been compiled (EPA Region 4, 2010; USGS
2011b).
3.1 Approach Used to Evaluate Data
Toxicity test results from all data providers were compiled in a centralized database.
Integration of the data sets involved standardization of terminology and endpoints. Once
the master database was compiled, the next step in the evaluation process was to review
the toxicity test results on an individual species‐specific basis to look for trends in
significance/non‐significance with respect to time, spatial distribution, and among data
providers.
As an initial approach, analytical chemistry results were evaluated for associations with
toxicity test endpoints. Appendices A and B present the results of rank correlations
between the measured chemical parameters and toxicity test endpoints. Correlations are
presented for detected analytes only; all non‐detected analytes are not included in these
Appendices. Of particular focus during this evaluation were the concentrations of oil and
dispersant‐related constituents and the association between these compounds and the
toxicity test endpoints in the nearshore zone.
3.2 EPA’s Chronic Aquatic Benchmark for PAHs
As summarized in the OSAT (2010) report, benchmark values have been developed by the
EPA1, 2 to evaluate for potential adverse effects to aquatic life. To calculate screening values
for the Response, a total of 41 oil‐related organic compounds were assessed jointly through
a mixture approach because they can have a cumulative effect on aquatic organisms (See
Appendix A.3 in OSAT 2010). The oil‐related compounds reviewed by this process include
7 volatile organic compounds, 16 parent polycyclic aromatic hydrocarbons (PAHs) and 18
alkylated homologues of the parent PAHs. The individual compounds are given potency
divisors, which are used in calculating the cumulative toxicity of the mixture of compounds
in each sample – hereafter referred to as the chronic aquatic life ratio. For sediment
samples, the amount of total organic carbon (TOC) in the sediment is factored into the
1 http://www.epa.gov/bpspill/water‐benchmarks.html 2 http://www.epa.gov/bpspill/sediment‐benchmarks.html

15
calculation because organic matter can bind PAHs, reducing their effective toxicity. If the
alkylated PAHs were not measured, an “alkylation multiplier” was used (See Appendix A.3
in OSAT 2010). To assess the potential hazard to aquatic organisms, the chronic aquatic
life ratios for each hydrocarbon component are summed and compared to a hazard index
value of 1. A value >1 indicates that the sample has the potential to cause an acute or
chronic effect to aquatic organisms based on literature‐derived screening values (EPA
2003). Appendix A.3 to the OSAT (2010) report describes the calculations in more detail
and includes a complete list of the compounds used in the assessment and their divisors as
well as a discussion of the development of the multipliers and the uncertainty associated
with their use with regard to the DWH oil spill data.
The chronic aquatic life ratio calculations presented in this report addendum (Figures 2
and 3) include a subset of the results compiled in the OSAT (2010) report and additional
analytical chemistry results not available at the time the OSAT report was prepared. For
calculations of the chronic aquatic life ratios, values below detection limits were treated as
0 rather than using other approaches, such as one‐half the detection limit. It is noted that
this approach has the potential to underestimate concentrations. The results presented in
Figures 2 and 3 include the chemical analyses associated with the toxicity tests
summarized in Figures 3.2 and 3.3 in the OSAT (2010) report, as well as the results of
additional chemical analyses and fingerprinting. None of the locations referenced in
Figures 2 and 3 were resampled (each data point is a unique location). Only sample
locations that included paired toxicity test results and chemical analyses were evaluated.
None of the pre‐impact samples (water or sediment) exceeded EPA’s chronic aquatic
benchmark for PAHs (hazard index <1) (Table 3). Six locations sampled after 3 August
2010 (5 sediment and 1 water) exceeded EPA’s chronic aquatic benchmark for PAHs (Map
7.5).
3.3 Fingerprinting of Toxicity Samples
Nearshore sediment samples that exceeded the EPA’s chronic aquatic benchmark for PAHs
(Map 7.5) and had at least one significant toxicity endpoint were reviewed to assess the
likelihood that the oil‐related exceedances resulted from MC252 oil (Appendix C). Prior
fingerprinting assessments posted on GeoPlatform.gov and reported by USGS (2010,
2011a) were incorporated into this review. Additional characterizations were performed
on sediment samples that showed significant effects in the toxicity tests and had total PAH
concentrations >0.32 µg/g (320 ppb) and water samples that showed significant effects
with total PAH concentrations >0.03 µg/L (0.03 ppb). Characterizations performed on
samples from locations that did not show significant effects had total PAH concentrations
>0.58 µg/g (580 ppb) in sediment and 0.18 µg/L (0.18 ppb) in water. Characterizations
were also performed by the USGS (2010, 2011a) on all of their collected samples.
Evaluations of the detected PAHs and their distribution ‘fingerprint’ were conducted on

16
samples from 196 nearshore locations to determine whether the sample was
“characteristic” or “not characteristic” of MC252 oil (Appendix C). If examination of the
sample yielded insufficient data to make a determination or suggested that MC252 oil was
present and mixed with other sources, the sample was considered “indeterminate” and the
sample was identified as characteristic of MC252 oil (Map 7.6). Samples that contain low
concentrations of PAHs may not yield sufficient information to determine whether they are
characteristic of MC252 oil.
Figure 2. Summary of chronic aquatic life ratios for nearshore sediment samples collected
by the EPA, USGS, and BP after August 3, 2010. The horizontal dotted line represents the
EPA’s chronic aquatic benchmark of 1.
Figure 3. Summary of chronic aquatic life ratios for nearshore water samples collected
by the EPA, USGS, and BP after August 3, 2010. The horizontal dotted line represents the
EPA’s chronic aquatic benchmark of 1.
0.0001
0.001
0.01
0.1
1
10
Aug Sep Oct Nov
Chronic A
quatic Life Ratio
Time
PAHs detected, not fingerprinted
Consistent with MC252
Not consistent with MC252
0.000001
0.00001
0.0001
0.001
0.01
0.1
1
10
Aug Sep Oct Nov
Chronic A
quatic Life Ratio
Time
PAHs detected, not fingerprinted
Consistent with MC252
Not consistent with MC252
17
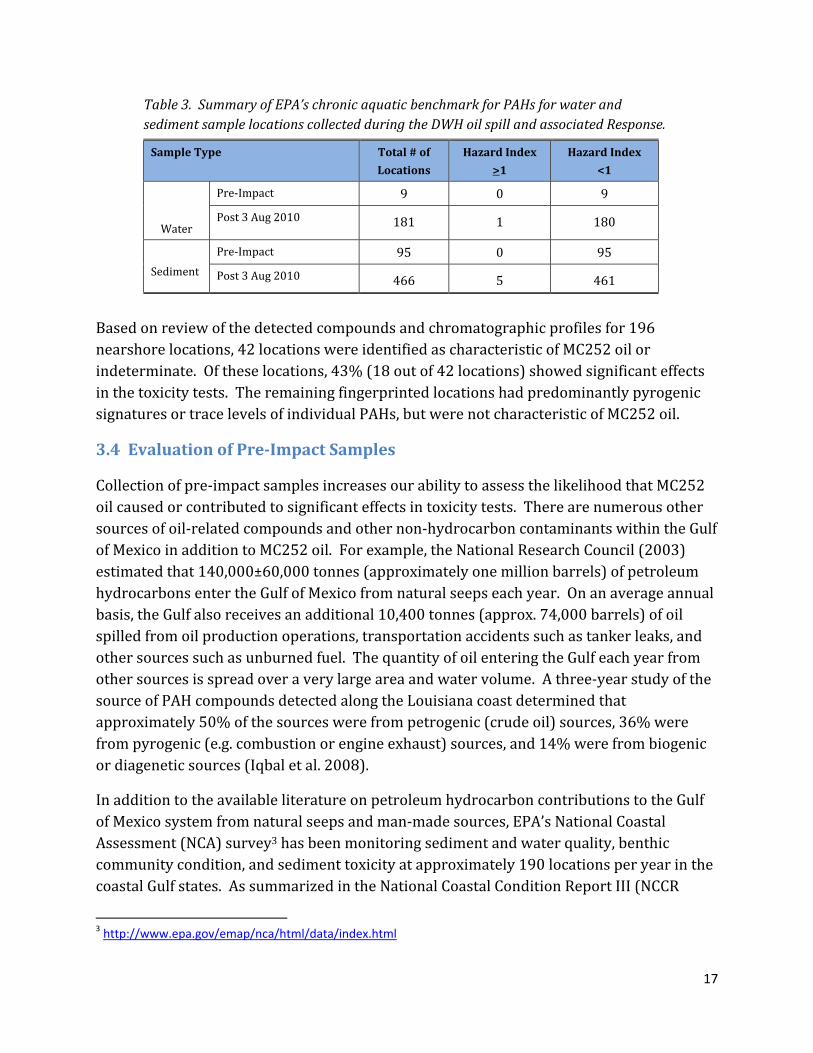
Table 3. Summary of EPA’s chronic aquatic benchmark for PAHs for water and
sediment sample locations collected during the DWH oil spill and associated Response.
Sample Type Total # of
Locations
Hazard Index
>1
Hazard Index
<1
Water
Pre‐Impact 9 0 9
Post 3 Aug 2010 181 1 180
Sediment
Pre‐Impact 95 0 95
Post 3 Aug 2010 466 5 461
Based on review of the detected compounds and chromatographic profiles for 196
nearshore locations, 42 locations were identified as characteristic of MC252 oil or
indeterminate. Of these locations, 43% (18 out of 42 locations) showed significant effects
in the toxicity tests. The remaining fingerprinted locations had predominantly pyrogenic
signatures or trace levels of individual PAHs, but were not characteristic of MC252 oil.
3.4 Evaluation of Pre‐Impact Samples
Collection of pre‐impact samples increases our ability to assess the likelihood that MC252
oil caused or contributed to significant effects in toxicity tests. There are numerous other
sources of oil‐related compounds and other non‐hydrocarbon contaminants within the Gulf
of Mexico in addition to MC252 oil. For example, the National Research Council (2003)
estimated that 140,000±60,000 tonnes (approximately one million barrels) of petroleum
hydrocarbons enter the Gulf of Mexico from natural seeps each year. On an average annual
basis, the Gulf also receives an additional 10,400 tonnes (approx. 74,000 barrels) of oil
spilled from oil production operations, transportation accidents such as tanker leaks, and
other sources such as unburned fuel. The quantity of oil entering the Gulf each year from
other sources is spread over a very large area and water volume. A three‐year study of the
source of PAH compounds detected along the Louisiana coast determined that
approximately 50% of the sources were from petrogenic (crude oil) sources, 36% were
from pyrogenic (e.g. combustion or engine exhaust) sources, and 14% were from biogenic
or diagenetic sources (Iqbal et al. 2008).
In addition to the available literature on petroleum hydrocarbon contributions to the Gulf
of Mexico system from natural seeps and man‐made sources, EPA’s National Coastal
Assessment (NCA) survey3 has been monitoring sediment and water quality, benthic
community condition, and sediment toxicity at approximately 190 locations per year in the
coastal Gulf states. As summarized in the National Coastal Condition Report III (NCCR
3 http://www.epa.gov/emap/nca/html/data/index.html

18
2008, 2005), the NCA program is a collaborative effort among the EPA, NOAA, the U.S. Fish
and Wildlife Service, and the U.S. Department of Agriculture. Additional data were
collected under the NCA in 2009 and 2010, but the report summarizing the results is not
yet available. Sediment data collected from 2000 – 2006 as part of the NCA program using
the amphipod, Ampelisca abdita, showed that selected sites in each of the states had
survival <80% in 10‐day sediment toxicity tests, with the percent of sites showing impact
ranging from 1% in Louisiana (2 out of 159 sites) to 23% in Florida. A number of the sites
showing toxicity in Florida may be associated with naturally high levels of hydrogen sulfide
in the sediments rather than anthropogenic contamination (NCCR 2005). Sediment
contaminants in the reported 190 locations included a variety of metals (e.g., arsenic,
nickel, mercury, silver, cadmium, copper) which exceeded sediment ERL guidelines (an
indicator of toxicity) in 28% of the estuarine area, and pesticides or polychlorinated
biphenyls (PCBs), which exceeded guidelines in 14% of the area (NCCR 2005). Polycyclic
aromatic hydrocarbons (PAHs) rarely exceeded the guidelines in the Gulf Coast estuaries
(NCCR 2005).
As part of the DWH oil spill response, the EPA and USGS collected pre‐impact sediment
samples from 104 locations for toxicity testing (183 tests) and chemical analyses in the
nearshore zone prior to the oil making landfall (Map 7.3). Sampling locations were
selected based on NOAA trajectory modeling of areas likely to be impacted by MC252 oil.
Based on data from 183 tests, statistically significant effects (test vs. control) were
observed in 30% (31 out of 104 locations) of the pre‐impact locations (Map 7.3),
demonstrating that samples were toxic prior to oil making landfall.
3.5 Evaluation of Samples Collected After 3 August 2010
Sediment and water samples from 647 nearshore locations (1,426 toxicity tests) were
collected after 3 August 2010 by EPA, USGS, and BP (Maps 7.7 and 7.8). Samples were
evaluated as part of the Strategic Plan (UAC 2010) to assess the ‘presence of oil that could be
removed to prevent, minimize, or mitigate damage to the public health or welfare
(hereinafter referred to as “actionable oil”)’. As part of this assessment, 79 pre‐impact
locations were revisited by the EPA and USGS. Parallel samples were also collected at 49
coastal locations by USGS and BP.
Nineteen percent of the sediment and water samples collected after 3 August 2010 (267
tests at 218 locations) show a significant effect compared to their associated controls.
Greater effects were seen in sediment samples than in water samples. At locations where
multiple test organisms were evaluated, significant effects were observed in more than one
test at 18% (33 out of 185 locations) of the sediment locations and 13% (4 out of 31
locations) of the water locations.

19
The majority of the primary test endpoints (percent survival, percent normal development
of sea urchin) were greater than 80% survival (Figure 4).
3.5.1 Re‐Evaluation of Pre‐Impact Locations
Based on the toxicity results of the pre‐impact samples coupled with historical surveys
(NCCR 2008, 2005), evaluation of the likelihood that MC252 oil caused or contributed to
significant effects in toxicity tests should consider potential contributions from other
factors. Seventy‐nine of the 104 pre‐impact locations were resampled after the well was
capped as part of the toxicity evaluation (Appendix D). Twenty‐four pre‐impact locations
showed significant effects in any test, and 25 locations had significant effects after 3 August
2010 (Map 7.9). Of the reevaluated pre‐impact locations, 14 locations changed in their
designation from significant to not significant and 15 locations changed from not
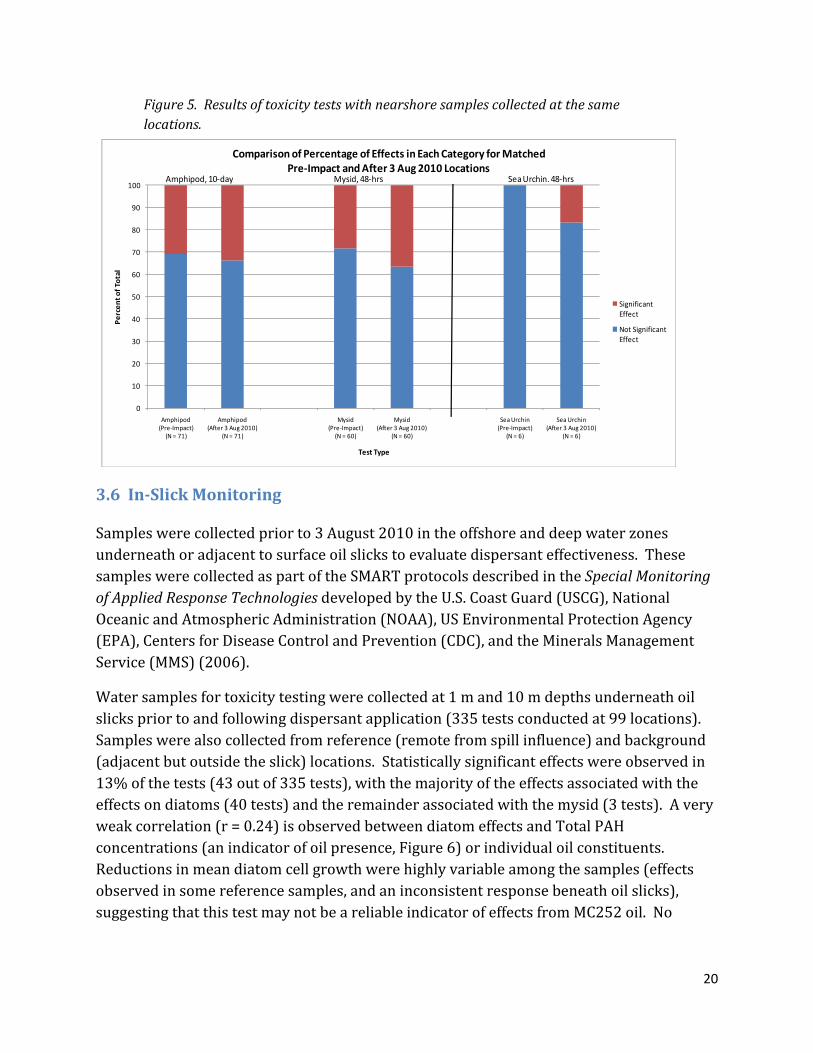
significant to significant. As summarized in Figure 5 for the amphipod, mysid and sea
urchin results from the same paired set of samples (e.g. samples collected at the same
location prior to and following well capping), toxicity results were generally consistent
among the samples, with no apparent increase in toxicity in the samples associated with
DWH oil spill and associated Response (Appendix D).
Figure 4. Results of toxicity tests with nearshore samples collected after 3 August
2010.
0
20
40
60
80
100
Fish (Acute)
Fish (Chronic)
Mysid (Acute)
Mysid (Chronic)
Pink Shrimp (Chronic)
Mollusc Amphipod Mysid (Acute)
Worm Sea Urchin
(N=123) (N=30) (N=90) (N=30) (N=88) (N=20) (N=499) (N=248) (N=111) (N=49)
Percent of Total
Test Type
Percentage of Toxicity Tests in Each Category for Samples Collected After 3 August 2010
<70%
70‐80%
80‐90%
>90%
Endpoint for sea urchin test was % normal development
Water Sediment Percent Survival
20
Figure 5. Results of toxicity tests with nearshore samples collected at the same
locations.
3.6 In‐Slick Monitoring
Samples were collected prior to 3 August 2010 in the offshore and deep water zones
underneath or adjacent to surface oil slicks to evaluate dispersant effectiveness. These
samples were collected as part of the SMART protocols described in the Special Monitoring
of Applied Response Technologies developed by the U.S. Coast Guard (USCG), National
Oceanic and Atmospheric Administration (NOAA), US Environmental Protection Agency
(EPA), Centers for Disease Control and Prevention (CDC), and the Minerals Management
Service (MMS) (2006).
Water samples for toxicity testing were collected at 1 m and 10 m depths underneath oil
slicks prior to and following dispersant application (335 tests conducted at 99 locations).
Samples were also collected from reference (remote from spill influence) and background
(adjacent but outside the slick) locations. Statistically significant effects were observed in
13% of the tests (43 out of 335 tests), with the majority of the effects associated with the
effects on diatoms (40 tests) and the remainder associated with the mysid (3 tests). A very
weak correlation (r = 0.24) is observed between diatom effects and Total PAH
concentrations (an indicator of oil presence, Figure 6) or individual oil constituents.
Reductions in mean diatom cell growth were highly variable among the samples (effects
observed in some reference samples, and an inconsistent response beneath oil slicks),
suggesting that this test may not be a reliable indicator of effects from MC252 oil. No
0
10
20
30
40
50
60
70
80
90
100
Amphipod(Pre‐Impact)(N = 71)
Amphipod(After 3 Aug 2010)
(N = 71)
Mysid(Pre‐Impact)(N = 60)
Mysid(After 3 Aug 2010)
(N = 60)
Sea Urchin(Pre‐Impact)
(N = 6)
Sea Urchin(After 3 Aug 2010)
(N = 6)
Percent of Total
Test Type
Comparison of Percentage of Effects in Each Category for Matched Pre‐Impact and After 3 Aug 2010 Locations
SignificantEffect
Not SignificantEffect
Amphipod, 10‐day Mysid, 48‐hrs Sea Urchin, 48‐hrs

21
significant mortality was observed in the fish and limited effects were observed in the
mysid tests (3 out of 99 tests).
Figure 6. Distribution of toxicity test results for diatoms with total polycyclic aromatic
hydrocarbon concentrations for samples collected as part of on‐water slick
monitoring.
Water samples were analyzed for hydrocarbons, dispersant marker dipropylene glycol n‐
butyl ether (DPnB), and metals. Seventeen of the locations exceeded EPA’s chronic aquatic
benchmark for PAHs, including 2 locations outside slicks. The maximum level of detected
DPnB in the samples was 240 µg/L (cf. EPA screening level of 1 mg/L). There was a
correlation between the concentration of DPnB in the surface water samples (1 m depth)
and the measured total PAH (r = 0.55 ‐ Figure 7). Higher levels of DPnB were seen in the 1
meter samples than in the 10 meter samples, a pattern consistent with the hydrocarbon
levels. The co‐occurrence of Total PAH and dispersant marker concentrations in water at
10 m depth suggests that dispersants were effective at dispersing oil into the water
column.
3.7 Integrated Toxicity Assessment
Multiple lines of evidence were used to evaluate whether the observed effects in the water
and sediment tests could be attributed to the DWH oil spill and associated Response. The
association between toxicity and chemistry was evaluated using each unique combination
of toxicity and chemistry collected at a location. For example, if both sediment and water
were evaluated at a location, this would result in two evaluation units for that location.
0
20
40
60
80
100
0.001 0.01 0.1 1 10 100
Diatom
‐Pe
rcen
t Growth In
hibitio
n
Total PAH (ug/L)
Not significant
significant

22
Figure 7. Association between total PAHs and dispersant marker for on water in‐slick
sample locations collected during the DWH oil spill and associated Response.
3.7.1 Relationship Between Toxicity and Chemical Results
As an initial assessment of potentially actionable oil, the relationship between toxicity and
chemical analyses in the nearshore zone were evaluated using correlations calculated for
all test endpoints and chemical constituents (e.g., individual PAHs, total PAH, EPA chronic
aquatic life ratio, individual metals) (see Appendix A). Evaluation of relationships between
toxicity and each of the chemical constituents show no significant correlations (see
Appendix B). For example, the relationship between percent survival and total PAHs and
EPA chronic aquatic life ratios for the amphipod toxicity test is shown in Figure 8. Similar
weak correlations are also seen between toxicity and individual PAHs, sub‐groups of PAH
compounds (e.g., alkylated hydrocarbons, low molecular weight hydrocarbons, high
molecular weight hydrocarbons), dispersant constituents, and metals (see Appendices A
and B).
The Spearman non‐parametric rank correlation method was used because the measured
parameters and toxicity endpoint values are not normally distributed. Toxicity (response
variable) and concentrations of chemical constituents (explanatory variables) both
exhibited highly skewed distributions (e.g., many locations with no significant toxicity in
any tests [429 out of 647 locations], most percent survival > 80% ‐ see Figure 4, low
concentrations of chemical constituents).
Correlations presented in Appendix A are based on concentrations of each parameter
above their detection limit (i.e., non‐detect results excluded). This approach, although
known to result in a bias in the correlations, was utilized to assess any possible association
between parameters and toxicity endpoints. These analyses were unable to identify any
1
10
100
1,000
10,000
100,000
10 100 1,000 10,000 100,000 1,000,000
Total PAH (n
g/L)
Total DPnB (ng/L)
1 m depth
10 m depth

23
factor which was a significant contributor to observed toxicity, including MC252 oil and
dispersant‐related constituents providing support to the OSAT (2010) conclusions
regarding actionable oil. It should be noted that while useful for addressing actionable oil,
the skewed distributions coupled with the narrow range of both response and explanatory
variables do not support development of empirical relationships with toxicity.
3.7.2 Dispersant Analyses
Dispersant constituents were analyzed in 55% of the nearshore samples collected after 3
August 2010 (359 out of 647 locations) (Map 7.10). The dispersant constituents that were
analyzed included dipropylene glycol n‐butyl ether (DPnB), propylene glycol, and
dioctylsulfosuccinate sodium salt (DOSS). Only 68 samples (7 sediment and 61 water
samples) had detectable concentrations of one of the dispersant constituents (Table 4).
None of the concentrations of dispersant‐related constituents found in the sediment and
water samples collected in the nearshore zone exceeded EPA’s chronic aquatic benchmarks
(see Appendix A.1 of OSAT 2010 report, UAC 2010). DPnB was the most commonly
analyzed and detected constituent (range of detection limits for sediment 0.00034 to 0.52
µg/g [0.34 to 520 ppb], for water 0.0014 to 1.0 µg/L [0.0014 to 1.0 ppb]) and was found in
62 (1 sediment and 61 water samples) of the 286 samples.
Figure 8. Distribution of amphipod results with total polycyclic aromatic hydrocarbons
and EPA chronic aquatic life ratio for samples collected after 3 August 2010. The
horizontal dotted line represents the EPA’s chronic aquatic benchmark of 1.
0
20
40
60
80
100
0.0001 0.001 0.01 0.1 1 10
Percen
t Survival
Total PAH (μg/g)
Amphipod (96 hour)
Amphipod (10 day)

24
Significant effects were observed in 25% (17 out of 68 samples) of the samples with
detectable levels of the dispersant constituents DPnB and propylene glycol. No detectable
levels of DOSS (range of detection limits 2.45 to 20 µg/L) were found in these samples.
Evaluation of relationships between toxicity test results and dispersant constituent
concentrations alone and relative to total PAHs are presented in Appendix B. DPnB was
detected in water samples at concentrations <0.3 µg/L (cf. EPA screening level of 1 mg/L).
Propylene glycol was detected in sediment samples at 1 µg/g or less (cf. EPA screening
level of 500,000 µg/L). In addition to the very low levels of detected dispersant
constituents, Total PAH concentrations in the samples showing significant effects were less
than 0.05 µg/L in water and 0.01 µg/g in sediment, well below the EPA’s chronic aquatic
benchmark for PAHs.
Table 4. Summary of dispersant analyses for nearshore water and sediment sample
locations collected during the DWH oil spill and associated Response.
Sample Type Total # of
Locations Detected
Not Detected
Not Analyzed
Water
Pre‐Impact 9 0 9 0
Post 3 Aug 2010 181 61 117 3
Sediment
Pre‐Impact 95 0 19 76
Post 3 Aug 2010 466 7 174 285
3.7.3 Integrated Data Evaluation
Assessment of the contribution of MC252 oil to the observed effects in the samples
collected after 3 August 2010 was first evaluated by calculating correlations between
toxicity test endpoints and chemical constituents (Appendices A and B). No relationship
0
20
40
60
80
100
0.0001 0.001 0.01 0.1 1 10
Percen
t Survival
EPA Chronic Aquatic Life Ratio for PAHs [log axis]
Amphipod (96 hour)
Amphipod (10 day)

25
between measured chemical constituents and effects in the toxicity tests was apparent.
Building on this initial assessment, the spatial extent and distribution of the co‐occurrence
of significant effects and MC252 oil was examined by 1) identifying locations with
significant effects in at least one endpoint, 2) evaluating the chromatographic fingerprints
of the samples with calculated Total PAHs >0.32 µg/g (320 ppb) in sediment, <0.03 µg/L
(0.03 ppb) in water for samples with significant effects in toxicity tests and calculated Total
PAHs >0.58 µg/g (580 ppb) in sediment, >0.18 µg/L (0.18 ppb) in water for samples with
no significant effects for consistency with MC252 oil, and 3) calculating EPA’s chronic
aquatic life ratios for PAHs for each of these samples (Figure 9). The distribution and range
of concentrations of constituents measured in this data set were representative of
conditions in the Gulf of Mexico after 3 August 2010, but do not support development of
empirical relationships with toxicity.
For a number of locations (218 out of 647 locations), significant effects were observed in
the toxicity tests (Figure 9) (Map 7.11). Samples from 18 of these locations contained oil
characteristic of MC252 oil, and 55 locations were not characteristic. The remaining 145
locations were not fingerprinted due to the low levels of TPAHs detected (<0.32 µg/g (320
ppb) in sediment, <0.03 µg/L (0.03 ppb) in water). The chronic aquatic life ratios for
samples showing significant effects in any of the three categories (characteristic, not
characterized, and not characteristic) ranged from 0 to 3.29 (median 0 to 0.004, mean
0.0004 to 0.36). This indicates that the distribution is skewed towards low concentrations
relative to EPA’s chronic aquatic benchmark for PAHs.
For the remaining locations sampled after 3 August 2010 (429 out of 647 locations), no
significant effects were observed in the toxicity tests (Figure 9). Samples from 24 of these
locations with no significant effects were fingerprinted as containing oil characteristic of
MC252 oil, while samples from 99 locations were not characteristic, and samples from the
remaining 306 locations were not fingerprinted. The chronic aquatic life ratios for samples
showing no significant effects in any of the three categories ranged from 0 to 1.21 (median
0 to 0.03, mean 0.0005 to 0.19). This indicates that the distribution is skewed towards low
concentrations relative to EPA’s chronic aquatic benchmark for PAHs.
Results of the pre‐impact tests show there are significant effects in nearshore sediment and
water that are not related to MC252 oil (Figure 9). The chronic aquatic life ratios for
samples showing significant effects ranged from 0 to 0.05 (median 0, mean 0.002). The
chronic aquatic life ratios for samples not showing significant effects ranged from 0 to 0.15
(median 0, mean 0.005).
Other factors contributing to the significant effects observed in the toxicity tests may have
included metals, other PAH sources, other oil constituents, and sediment and water quality
characteristics. Grain size was identified as a contributing factor in worm tests conducted

26
by EPA Region 4 (EPA 2010). A similar pattern with grain size was observed in the BP
amphipod tests. Ammonia was the primary contaminant in three of the sea urchin
fertilization and embryological development tests based on toxicity identification
evaluations conducted by the USGS (USGS 2011b).
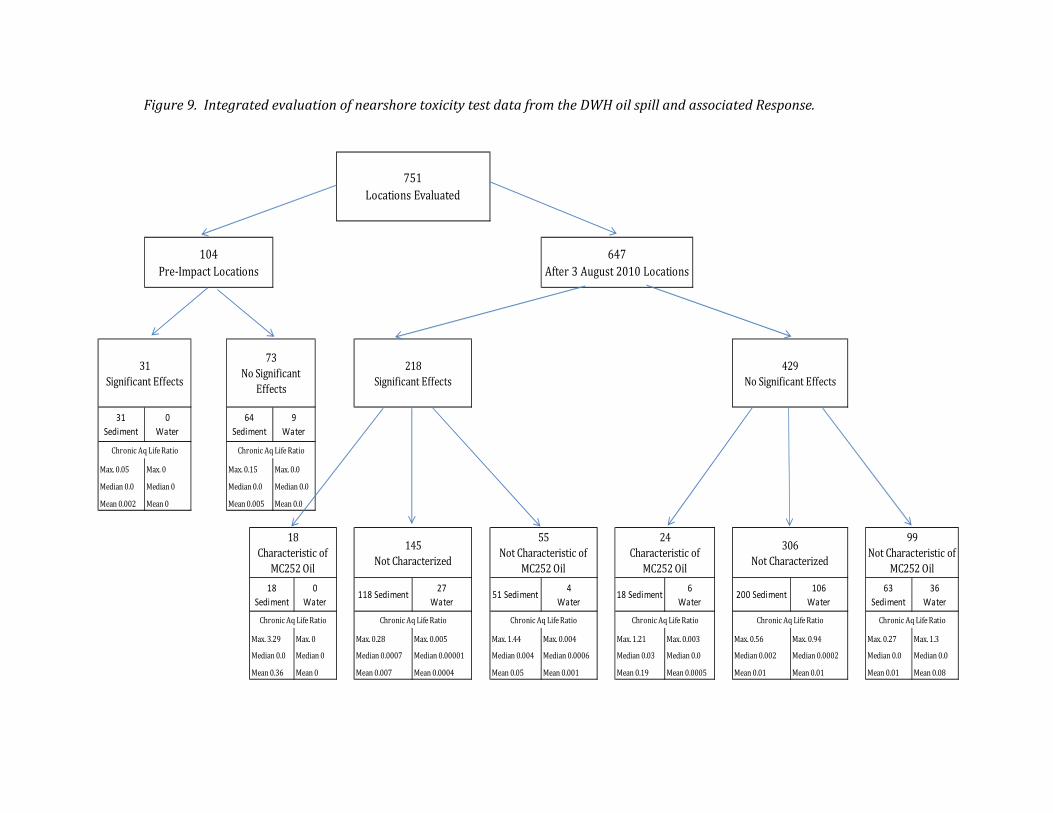
Figure 9. Integrated evaluation of nearshore toxicity test data from the DWH oil spill and associated Response.
Max. 0.94
Median 0.002 Median 0.0002
Max. 0.27 Max. 1.3
Median 0.0 Median 0.0
Max. 1.21 Max. 0.003
Median 0.03 Median 0.0
Max. 0.56Max. 0.005
Median 0.0007 Median 0.00001
Max. 1.44 Max. 0.004
Median 0.004 Median 0.0006
Max. 3.29 Max. 0
Median 0.0 Median 0
Max. 0.28
Chronic Aq Life Ratio
Chronic Aq Life Ratio
Max. 0.05
Median 0.0
Max. 0
Median 0
Max. 0.15 Max. 0.0
Median 0.0 Median 0.0
Chronic Aq Life RatioChronic Aq Life RatioChronic Aq Life RatioChronic Aq Life RatioChronic Aq Life Ratio
36
Water200 Sediment
106
Water18 Sediment
6
Water
751
Locations Evaluated
306
Not Characterized
18
Sediment
0
Water
63
Sediment51 Sediment
4
Water118 Sediment
27
Water
64
Sediment
9
Water
99
Not Characteristic of
MC252 Oil
647
After 3 August 2010 Locations
218
Significant Effects
18
Characteristic of
MC252 Oil
145
Not Characterized
55
Not Characteristic of
MC252 Oil
24
Characteristic of
MC252 Oil
429
No Significant Effects
104
Pre‐Impact Locations
31
Significant Effects
73
No Significant
Effects
31
Sediment
0
Water
Chronic Aq Life Ratio
Mean 0.002 Mean 0 Mean 0.005 Mean 0.0
Mean 0.36 Mean 0 Mean 0.007 Mean 0.0004 Mean 0.05 Mean 0.01 Mean 0.08Mean 0.001 Mean 0.19 Mean 0.0005 Mean 0.01 Mean 0.01

28
Section 4: Additional Toxicity Tests
Additional toxicity tests were conducted in the field and laboratory with samples from the
deep water zone (region seaward of the 200‐m bathymetric contour [approximately the
continental shelf break]) and the offshore zone (region between the state water’s boundary
and the 200 m bathymetric contour, which delineates the continental shelf break) to guide
DWH oil spill response actions. Raw data (e.g., collection date, location coordinates, sample
depth, test conditions and results) for these additional tests are available at
www.restorethegulf.gov and http://www.geoplatform.gov/gulfresponse/.
Screening toxicity tests were conducted during the Response with water and sediment
samples collected in the deep water zone using the commercially available rotifer toxicity
test (RotoxKit M™) and Microtox® procedures. Rotifer tests were conducted shipboard on
freshly collected samples during subsurface dispersant application as mandated by the
Dispersant Monitoring and Assessment Directive issued 10 May 2010 by the USCG and EPA
to BP. Water samples were collected at depth using a rosette containing a Niskin bottle
array. The RotoxKit M test kits and protocol were used for the rotifer (Brachionus
plicatilis) tests. Of the 1,047 samples evaluated with rotifer, 2% (22 samples) showed
mortality of greater than 20%.
Microtox tests were conducted at an onshore laboratory with shipboard‐frozen sediment
and water samples from locations in the deep water zone as outlined in the Strategic Plan
for Sub‐Sea and Sub‐Surface Oil and Dispersant Detection, Sampling, and Monitoring issued
13 November 2010 by the Deepwater Horizon MC252 Response Unified Area Command
(Strategic Plan). Sediment samples were taken from the top 3 cm of sediment collected
from the sea floor with multicorers. Water samples used for toxicity testing were collected
from the supernatant water overlying the sediment in the core tube. The Microtox analyzer
and protocol were used for the photoluminescent marine bacteria (Vibrio fischeri) tests. Of
the 557 Microtox tests performed, <1% of the sediment tests ( 2 out of 227 tests) had EC50
values less than 1,000 mg/L and 1.5% of the supernatant tests (5 out of 330 tests) showed
decreases in detectable light emission in undiluted samples.

29
Section 5: Conclusions
The OSAT 2010 report concluded that sampling was adequate to address the presence and
distribution of sub‐surface oil and dispersants (with the exception of very shallow
nearshore areas where submerged tar mats may be present) (UAC 2010). The results of
the toxicity tests summarized in this addendum support the conclusions of the OSAT report
regarding the absence of actionable (i.e. amenable to removal actions) oil and dispersant‐
related constituents in the nearshore zone.
A conservative approach was utilized in this report addendum to evaluate the toxicity tests
and associated analytical chemistry data generated by the EPA, USGS, and BP. Extensive
evaluation of the data using a variety of approaches and statistical analyses determined
that:
A total of 3,548 toxicity tests were conducted during the DWH oil spill and associated
Response, making this the most extensive testing program ever conducted to
characterize the effects of an oil spill in the marine environment. Overall, statistically
significant effects were reported in 10% of the toxicity tests.
Of the 1,426 toxicity tests conducted on samples (including 907 sediment and 519
water tests) collected after 3 August 2010 in the nearshore zone from 647 locations,
19% (267 tests) showed statistically significant effects compared to their associated
controls.
Based on evaluation of analytical chemistry results for the toxicity samples collected
after 3 August 2010, 1% of sediment locations (5 out of 466 locations) and <1% of
water locations (1 out of 181 locations) exceeded EPA’s chronic aquatic benchmark for
PAHs. None of the water or sediment pre‐impact samples exceeded the benchmark.
None of the concentrations of dispersant‐related constituents found in the sediment
and water samples collected after 3 August 2010 in the nearshore zone exceeded EPA’s
chronic aquatic benchmarks.
Statistically significant effects were observed in 31% of the 104 pre‐impact locations in
the near shore zone. Seventy‐nine of the pre‐impact locations were resampled after 3
August 2010, and 32% of those locations (24 sediment and 2 water locations) show
significant effects.
Of the 466 sediment locations sampled after 3 August 2010 in the nearshore zone, 18
showed significant effects and had chemical fingerprints characteristic of MC252 oil.
30
Fifty‐five locations (51 sediment and 4 water locations) that showed significant effects
were not characteristic of MC252 oil.
Out of a total of 647 nearshore locations sampled after 3 August 2010, 451 locations
were not fingerprinted due to low total PAH concentrations. Of these locations, 145
locations showed significant effects (total PAH concentrations <0.32 µg/g [320 ppb] in
sediment, <0.03 µg/L [0.03 ppb] in water), and 306 locations did not show significant
effects (total PAH concentrations <0.58 µg/g [580 ppb] in sediment, <0.18 µg/L [0.18
ppb] in water).
These data were collected to determine the presence or absence of potentially
actionable oil in the nearshore zone and not to develop empirical relationships between
oil constituents and toxicity. While representative of conditions in the Gulf of Mexico
after 3 August 2010, the skewed distribution and narrow range of concentrations of
constituents measured in this data set do not support development of empirical
relationships with toxicity.
Based on evaluation of the extensive dataset of toxicity test results and associated chemical
analyses, the sampling conducted during the Response was adequate for decision‐making
by the FOSC regarding when to transition nearshore activities from the emergency
response phase to the long‐term recovery and restoration phase. MC252 oil was present in
some of the samples showing significant effects in the toxicity tests. Additional locations
that contained MC252 oil did not show significant toxicity test effects. Further locations
were not fingerprinted due to low total PAH concentrations. In some samples, other
contaminants (e.g. metals, ammonia, other PAH sources) may be contributing to significant
effects observed. In EPA Region 4 (2010), for example, grain size was identified as a factor
in the significant effects observed in the worm tests. Ammonia was the primary
contaminant in three of the sea urchin fertilization and embryological development tests,
based on toxicity identification evaluation (USGS 2011b). Long‐term chronic effects to the
environment are being assessed as part of the injury assessment conducted through the
Natural Resources Damage Assessment (NRDA) process.
This Ecotoxicity Addendum to the OSAT (2010) report provides an assessment of the
effects of field‐collected samples on water column and sediment‐dwelling organisms in the
nearshore zone. This information is intended to support decisions on further oil removal
operations in that area. Addressing other questions, including the long‐term
environmental impacts of the DWH oil spill, is beyond the scope of this report.
Ecotoxicity information was evaluated as one indicator of the presence of actionable
MC252 oil. The OSAT is confident that the quality of these data is sufficient to address the
presence or absence of MC252 oil within the context of an operational emergency response

31
evaluation. However, several factors should be considered in interpreting the findings of
this document for any other purpose besides assessment of actionable oil.
Sample detection limits varied. Because some analytes had very high detection limits, the treatment of “below detection” results (calculating them as zeros rather than using other approaches, such as one‐half the detection limit) has the potential to underestimate concentrations.
The chronic aquatic life ratios used in the Chronic Aquatic Benchmark for PAHs are estimates. Since some calculations did not include contribution of volatile organic compounds, ratios may be underestimated in some circumstances. Some analyses did not include alkylated compounds. The use of a multiplier for these samples to adjust total concentrations could underestimate or overestimate concentrations. The use of benchmarks alone may be insufficient to predict toxicity, cover all possible effects and modes of action, or life stages.
Many TOC values used in calculating the Chronic Aquatic Benchmark for PAHs for sediments are estimates. Actual sample results were often not used to interpret concentrations relative to benchmarks. Although a conservative TOC concentration was applied, this could underestimate or overestimate exceedances of sediment quality benchmarks for individual samples.
Determining whether MC252 oil is present in any sample is dependent on the chemical analyses performed and can be confounded by the presence of multiple hydrocarbon sources.
Variability in sample collection procedures may influence the chemical analyses and toxicity test results.

32
Section 6: References
ASTM E724. Standard Guide for Conducting Static Acute Toxicity Tests Starting with Embryos of Four Species of Saltwater Bivalve Molluscs. ASTM International, West Conshohocken, PA.
ASTM E1367. Standard Test Method for Measuring the Toxicity of Sediment‐Associated Contaminants with Estuarine and Marine Invertebrates. ASTM International, West Conshohocken, PA.
ASTM E1563. Standard Guide for Conducting Static Acute Toxicity Tests with Echinoid Embryos. ASTM International. West Conshohocken, PA.
ASTM E 1611. Standard Guide for Conducting Sediment Toxicity Tests with Polychaetous Annelids. ASTM International. West Conshohocken, PA.
Deepwater Horizon MC252 Response Unified Area Command (UAC). 2010. Strategic Plan for Sub‐Sea and Sub‐Surface Oil and Dispersant Detection, Sampling, and Monitoring. Dated 13 November 2010.
EPA. 1994. Methods for Assessing the Toxicity of Sediment‐Associated Contaminants with Estuarine and Marine Amphipods. EPA/600‐R‐94/025. United States Environmental Protection Agency. Office of Research and Development. Washington, DC.
EPA. 1995. Short‐Term Methods for Estimating the Short‐Term Chronic Toxicity of Effluents and Receiving Waters to West Coast Marine and Estuarine Organisms. EPA/600‐R‐95/136. United States Environmental Protection Agency. Office of Research and Development. Washington, DC.
EPA. 2002a. Methods for Measuring the Acute Toxicity of Effluents and Receiving Waters to Freshwater and Marine Organisms. EPA/821‐R‐02/012. United States Environmental Protection Agency. Office of Water. Washington, DC.
EPA. 2002b. Short‐Term Methods for Estimating the Chronic Toxicity of Effluents and Receiving Waters to Marine and Estuarine Organisms. EPA/821‐R‐02/014. United States Environmental Protection Agency. Office of Research and Development. Washington, DC.
EPA. 2003. Procedures for the Derivation of Equilibrium Partitioning Sediment Benchmarks (ESBs) for the Protection of Benthic Organisms. PAH Mixtures. EPA/600‐R‐02/013. United States Environmental Protection Agency. Washington, DC.
EPA Region 4. 2010. Toxicity Assessment of Surface Water and Sediments from the Deepwater Horizon Response from the Coasts of Florida, Mississippi, and Alabama, SESD Project No. 10‐0607. United States Environmental Protection Agency Region 4. Science and Ecosystem Support Division, Enforcement and Investigations Branch. Athens, GA. 6 December 2010.

33
Iqbal, J., E.B. Overton and D. Gisclair. 2008. Polycyclic Aromatic Hydrocarbons in Louisiana Rivers and Coastal Environments: Source Fingerprinting and Forensic Analysis. Environmental Forensics. 9(1): 63‐74. DOI: 10.1080/15275920801888301.
NCCR. 2008. National Coastal Condition Report III. U.S. Environmental Protection Agency, Office of Research and Development, Office of Water, Washington, DC. EPA/842‐R‐08‐002.
National Research Council. 2003. Oil in the Sea III: Inputs, Fates, and Effects. National Academy Press. Washington, DC. 280 pp.
OSAT. 2010. Summary Report for Sub‐Sea and Sub‐Surface Oil and Dispersant Detection: Sampling and Monitoring. Operational Science Advisory Team, Unified Area Command, Deepwater Horizon MC252, 17 December 2010.
U.S. Coast Guard, National Oceanic and Atmospheric Administration, U.S. Environmental Protection Agency, Centers for Disease Control and Prevention, Minerals Management Service. 2006. Special monitoring of applied response technologies. Version 8/2006. 43 pp. http://response.restoration.noaa.gov/book_shelf/648_SMART.pdf
USGS. 2010. Reconnaissance of Macondo‐1 Well Oil in Sediment and Tarballs from the
Northern Gulf of Mexico Shoreline, Texas to Florida. U.S. Geological Survey. Open‐File
Report 2010‐1290.
USGS. 2011a. Petroleum Hydrocarbons in Sediment from the Northern Gulf of Mexico
Shoreline, Texas to Florida. U.S. Geological Survey. Open File Report 2011‐1014.
USGS. 2011b. Sediment Pore‐Water Toxicity Test Results and Preliminary Toxicity
Identification of Post‐Landfall Pore‐Water Samples Collected Following the Deepwater
Horizon Oil Release, Gulf of Mexico, 2010. U.S. Geological Survey. Open‐File Report 2011‐
1078.

34
Section 7: Maps
Map 7.1: Sampling Zones
Map 7.2: Nearshore Toxicity Sample Locations
Map 7.3: Pre‐Impact Toxicity
Map 7.4: Nearshore Toxicity Samples Collected After 3 August 2010
Map 7.5: Exceedances of EPA’s Chronic Aquatic Benchmark for PAHs
Map 7.6: MC252 Oil Fingerprint Results for Nearshore Samples
Map 7.7: Sediment Toxicity Samples Collected After 3 August 2010
Map 7.8: Water Toxicity Samples Collected After 3 August 2010
Map 7.9: Resample of Pre‐Impact Toxicity After 3 August 2010
Map 7.10: Dispersant Samples Collected After 3 August 2010
Map 7.11: Integrated Evaluation of Data – Significant Effects

35
Appendices
Appendix A: Correlation Matrix of Toxicity Test Endpoints with Chemical Analytes
Appendix B: Distribution Plots of Toxicity Test Endpoints with TPAH and EPA’s Chronic
Aquatic Benchmark for PAHs
Appendix C: Sample Fingerprinting
Appendix D: Toxicity Re‐Evaluation of Pre‐Impact Samples
Appendix E: List of Acronyms
Appendix F: OSAT Membership