Embed Size (px)
Citation preview
FINAL REPORT
EVALUATION STUDY
DIVERSIFICATION OF AGRICULTURAL CROPS, VALUE ADDITION AND MARKETING
under
RLTAP
On behalf of
Planning & Coordination Department Government of Orissa
D. J. Research & Consultancy Pvt. Ltd. N 1/69, IRC Village, Nayapalli,
Bhubaneswar-15, Orissa Website: www.djrc.org
Strictly Confidential
Not to be quoted without prior approval of P&C Department, Government of Orissa
Evaluation Team Members 1. Dr. Damodar Tripathy 2. Dr. Jiten Kumar Misra 3. Mr. Bidhan Kumar Mohapatra 4. Mr. Manoj Kumar Sarangi 5. Mr. Rahul Singh 6. Mr. Bhagaban Parida 7. Mr. Bibhu Sankar Mahapatra 8. Mr. Ashok Kumar Panda 9. Miss Priyambada Muduli 10. Mr. Sisir Kumar Behera 11.Mr. Siba Sankar Rout
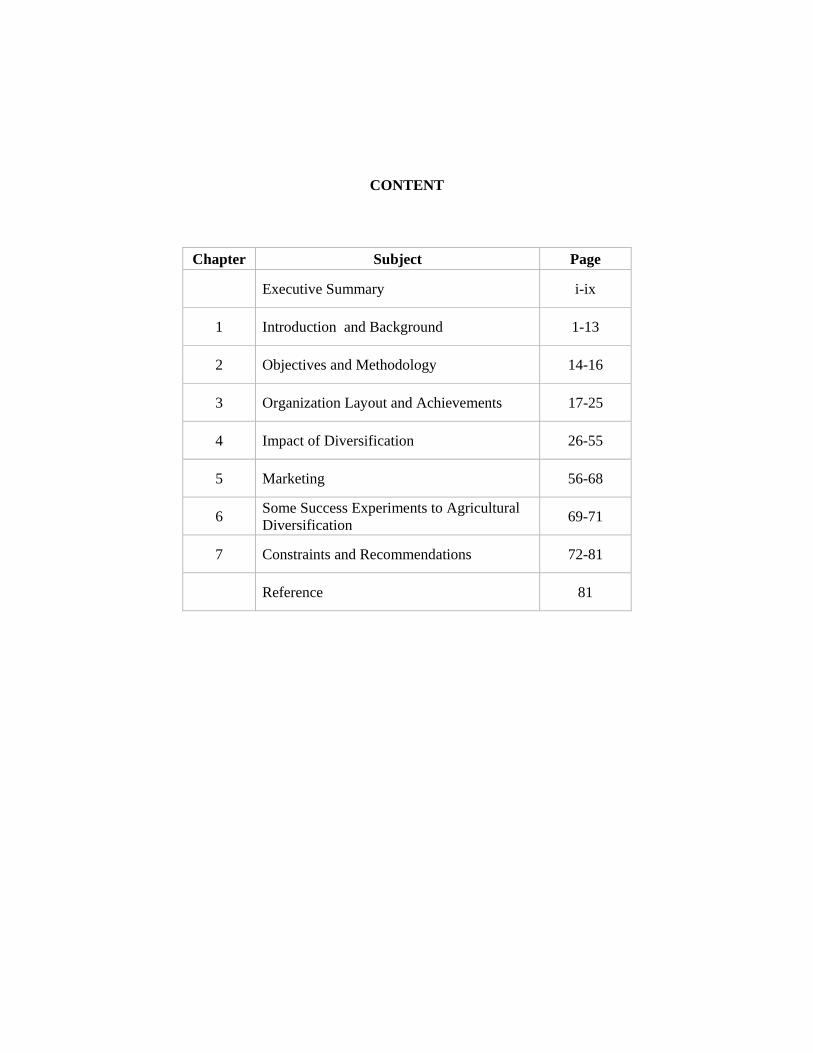
CONTENT
Chapter Subject Page
Executive Summary i-ix
1 Introduction and Background 1-13
2 Objectives and Methodology 14-16
3 Organization Layout and Achievements 17-25
4 Impact of Diversification 26-55
5 Marketing 56-68
6 Some Success Experiments to Agricultural Diversification 69-71
7 Constraints and Recommendations 72-81
Reference 81
List of Tables
Sl. No. Table No. Table Name
1 Table: 1.1 Key Indicators of KBK Region (2005-06) 2 Table 1.2 Cropping Intensity
3 Table 1.3 Comparison between Gross Cropped Area and Gross Irrigated Area (1996-97)
4 Table 1.4 Comparison between Gross Cropped Area and Irrigated Area (2005-06)
5 Table 1.5 Variation in Area, Yield and Production of Rice
6 Table 1.6 Percentage Change in Area, Yield and Production of Rice in KBK Districts
7 Table 1.7 Variation in Area, Yield and Production of Ragi in KBK Districts
8 Table 1.8 Percentage Change in Area, Yield and Production of Ragi in KBK Districts
9 Table 2.1 Details of Sampling
10 Table 3.1 Allocation and Expenditure of Funds Towards Diversification of Agricultural Crops under RLTAP in KBK districts
11 Table: 4.1 Crop-wise change in Area, Output, Yield and Value Among Beneficiaries in Kharif Season of six surveyed districts
12 Table: 4.2 Crop-wise change in Area, Output, Yield and Value Among Beneficiaries in Rabi Season of six surveyed districts
13 Table: 4.3 Crop wise change in Area, Output, Yield and Value of Beneficiaries of Bolangir District (Kharif)
14 Table: 4.4 Crop wise change in Area, Output, Yield and Value of Non-Beneficiaries of Bolangir District (Kharif)
15 Table: 4.5 Crop wise change in Area, Output, Yield and Value of Beneficiaries of Kalahandi District (Kharif)
16 Table: 4.6 Crop wise change in Area, Output, Yield and Value of Non-Beneficiaries of Kalahandi District (Kharif)
17 Table: 4.7 Crop wise change in Area, Output, Yield and Value of Beneficiaries of Malkangiri District (Kharif)
18 Table: 4.8 Crop wise change in Area, Output, Yield and Value of Non-Beneficiaries of Malkangiri District (Kharif)
19 Table: 4.9 Crop wise change in Area, Output, Yield and Value of Beneficiaries of Nawarangpur District (Kharif)
20 Table: 4.10 Crop wise change in Area, Output, Yield and Value of Non-Beneficiaries of Nawarangpur District (Kharif)
21 Table: 4.11 Crop wise change in Area, Output, Yield and Value of Beneficiaries of Nuapada District (Kharif)
22 Table: 4.12 Crop wise change in Area, Output, Yield and Value of Non-Beneficiaries of Nuapada District (Kharif)
23 Table: 4.13 Crop wise change in Area, Output, Yield and Value of Beneficiaries of Sonepur District (Kharif)
Sl. No. Table No. Table Name
24 Table: 4.14 Crop wise change in Area, Output, Yield and Value of Non-Beneficiaries of Sonepur District (Kharif)
25 Table: 4.15 Crop wise change in Area, Output, Yield and Value of Beneficiaries of Bolangir District (Rabi)
26 Table: 4.16 Crop wise change in Area, Output, Yield and Value of Non-Beneficiaries of Bolangir District (Rabi)
27 Table: 4.17 Crop wise change in Area, Output, Yield and Value of Beneficiaries of Kalahandi District (Rabi)
28 Table: 4.18 Crop wise change in Area, Output, Yield and Value of Non-Beneficiaries of Kalahandi District (Rabi)
29 Table: 4.19 Crop wise change in Area, Output, Yield and Value of Beneficiaries of Malkangiri District (Rabi)
30 Table: 4.20 Crop-wise Change in Area, Output, Yield and Value of Non-Beneficiaries of Malkangiri District (Rabi)
31 Table: 4.21 Crop wise change in Area, Output, Yield and Value of Beneficiaries of Nawarangpur District (Rabi)
32 Table: 4.22 Crop wise change in Area, Output, Yield and Value of Non-Beneficiaries of Nawarangpur District (Rabi)
33 Table: 4.23 Crop-wise Change in Area, Output, Yield and Value of Beneficiaries of Nuapada District (Rabi)
34 Table: 4.24 Crop wise change in Area, Output, Yield and Value of Non-Beneficiaries of Nuapada District (Rabi)
35 Table: 4.25 Crop wise change in Area, Output, Yield and Value of Beneficiaries of Sonepur District (Rabi)
36 Table: 4.26 Crop wise change in Area, Output, Yield and Value of Non-Beneficiaries of Sonepur District (Rabi)
37 Table: 4.27 District wise Monthly Net Per capita Income from Agriculture
38 Table: 4.28 Details of income earned through Agriculture and Secondary Occupations
39 Table: 4.29 District-wise percentage of users of various Agricultural Implements
40 Table: 4.30 Percentage of households taking loans for various purposes
41 Table: 5.1 Procurement of cotton by different agencies in KBK districts 2005-06
List of Annexure
Sl. No. Annexure Annexure Name
1 Annexure 1.1 Rainfall in KBK Districts
2 Annexure 3.1 Achievements under Agriculture Diversification in six surveyed Districts of KBK region from 2001-02 to 2005-06
3 Annexure 4.1 A Note on Diversification Index
4 Annexure 4.2 Crop-wise change in Area, Output, Yield and Value Among Beneficiaries in Kharif Season
5 Annexure 4.3 Crop-wise Change in Area, Output, Yield and Value Among Beneficiaries in Rabi Season
6 Annexure 4.4 Crop-wise change in Area, Output, Yield and Value Among Non-beneficiaries in Kharif
7 Annexure 4.5 Change in Area, Output, Yield and Value Among Non-beneficiaries in Rabi Season
8 Annexure 4.6 Percent Change in cost per hectare under different heads
9 Annexure 4.7 Evaluation of Net income from Agriculture of Beneficiaries and Non-Beneficiaries (in Rupees per hectare)
10 Annexure 4.8 Additional Income Other than Agriculture (Yearly) 11 Annexure 5.1 Selling of crops at Different Centres 12 Annexure 5.2 District wise sale price of produce at different Centres 13 Annexure 5.3 Establishment of Market Yards (RLTAP 2002-03)
14 Annexure 5.4 Activities taken up in KBK Districts in terms of Improving and Establishing Market Yards (RLTAP 2003-04)
i
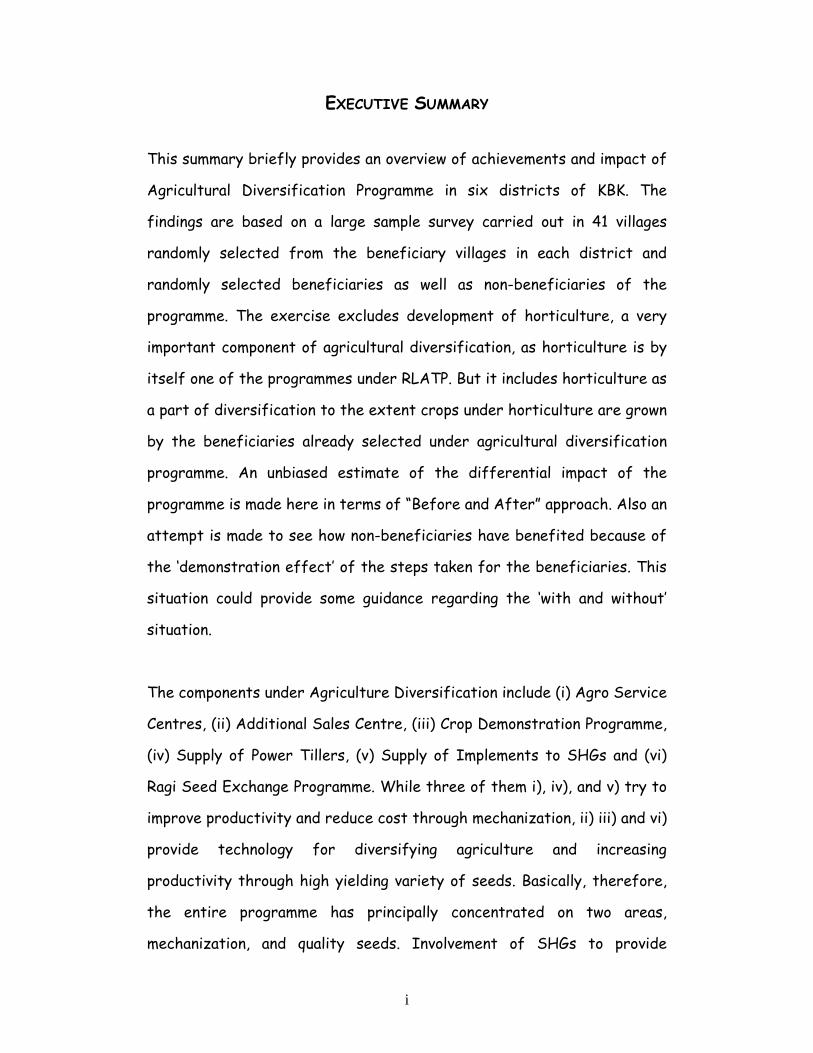
EXECUTIVE SUMMARY
This summary briefly provides an overview of achievements and impact of
Agricultural Diversification Programme in six districts of KBK. The
findings are based on a large sample survey carried out in 41 villages
randomly selected from the beneficiary villages in each district and
randomly selected beneficiaries as well as non-beneficiaries of the
programme. The exercise excludes development of horticulture, a very
important component of agricultural diversification, as horticulture is by
itself one of the programmes under RLATP. But it includes horticulture as
a part of diversification to the extent crops under horticulture are grown
by the beneficiaries already selected under agricultural diversification
programme. An unbiased estimate of the differential impact of the
programme is made here in terms of “Before and After” approach. Also an
attempt is made to see how non-beneficiaries have benefited because of
the ‘demonstration effect’ of the steps taken for the beneficiaries. This
situation could provide some guidance regarding the ‘with and without’
situation.
The components under Agriculture Diversification include (i) Agro Service
Centres, (ii) Additional Sales Centre, (iii) Crop Demonstration Programme,
(iv) Supply of Power Tillers, (v) Supply of Implements to SHGs and (vi)
Ragi Seed Exchange Programme. While three of them i), iv), and v) try to
improve productivity and reduce cost through mechanization, ii) iii) and vi)
provide technology for diversifying agriculture and increasing
productivity through high yielding variety of seeds. Basically, therefore,
the entire programme has principally concentrated on two areas,
mechanization, and quality seeds. Involvement of SHGs to provide
ii
agricultural implements that appears to have done extremely well in
providing custom services to farmers at affordable cost adds another
positive dimension to it.
Agricultural mechanization has the potential to improve agriculture
productivity. As Orissa’s agriculture is highly under capitalized and under
mechanized it was envisaged that provision of Agro Service Centres,
while increasing agricultural productivity and reducing cost per unit of
output will help in increasing the income of the unemployed educated
youth through their custom hiring services to farmers. It would also help
in sensitizing farmers about the various farm machineries that will
improve productivity. Within a span of 5 years (2001-02 to 2005-06) 56
Agro Service Centres have been opened in the six-surveyed districts.
With a view to acquainting farmers with new crops or new ways of growing
crops to increase yield and returns, Crop Demonstration Programmes
were implemented in farmers’ fields where farmers observed for
themselves the advantages. Paddy and ragi are the chief cereals of the
tribals of the KBK region. Appropriately crop demonstration programme
included paddy, ragi along with moong (pulses) and niger (oilseed). The
demonstration programme was carried out in 0.5 acre of land per
beneficiary in the year 2002-03. The total number of beneficiaries
under paddy demonstration was 2120. Ragi Demonstration was taken up in
Kalahandi, Malkangiri and Nawarangpur with 200 beneficiaries in each
district. For production increase and quality improvement of pulses moong
demonstration programme was also implemented in all the six districts.
The farmers used to produce local variety of moong with low yield and
returns. The HYV varieties like PDM-11 could suitably replace the local
iii
varieties both in kharif and rabi. Oilseed production in the state has been
going down. In order to boost production of oilseeds, niger, usually a dry
land crop, was rightly chosen for demonstration. The total number of
beneficiaries under niger demonstration was 400.
Power Tillers were supplied to the SC/ST farmers at a subsidized rate of
50% (25% RLTAP + 25% Work Plan, Agriculture Department) to improve
production and save money and time for cultivation. A total of 208 power
tillers have been supplied across all the six districts (from 2001-02 to
2005-06). Due to poor financial condition and lack of sufficient
purchasing power tribal farmers were not able to avail power tillers at
even a subsidized rate. Therefore it is necessary to make an income
assessment of farmers and their family condition based on which
necessary changes can be incorporated in the subsidy rate and the
scheme as a whole to make it more effective.
A total of 8682 SHGs are functioning actively in all KBK districts. The
Agriculture Department provides implements to the SHGs at subsidized
rates. The SHGs contribute 5% of the cost (Rs 51,500/-) i.e. Rs 2,575/-
per kit. All the implements supplied have extensive working capacity with
the benefits of saving time, cost and labour. SHGs provide these
implements to farmers in their operating area on a rental basis. Thus by
giving SHGs the charge of these implements the Agricultural Department
has been successful in providing implement facility to farmers at
affordable prices and have been able to intensify implement use. It has
been observed that across all surveyed districts these implements have
been well maintained by the SHGs. As the equipments relate to seasonal
use, from discussions with beneficiaries as well as SHGs, it was learnt
iv
that capacity utilization of these equipments has been very high, nearly
100%. It is one of the most successful components of the programme.
Even if full cost recovery is pursued, the SHGs would be in a position to
pay back the entire cost of these implements within a period of three
years.
Agriculture Department exchanges HYV variety of ragi i.e. Bhairavi with
traditional variety. A total of 9288 farmers have benefited from this
exchange process from 2001-02 to 2005-06. However, farmers revert
back to traditional varieties within a year or two of the exchange
programme. This leads to a decline in yield rates after a short span, of
yield increase. Agriculture Department provides seeds to the farmers
through additional sales centres. A total of 57 additional sales centres
have been opened between 2003-04 and 2005-06 and the subsidy availed
per sales centre is Rs 10,000/-
Crop Diversification: The highlighting feature of cultivation in terms of
cereals during Kharif is the decline in area, production and yield rate of
ragi and diversification towards paddy. This is hard to understand when
we take into consideration that ragi is covered under two components of
the Crop Diversification programme i.e. Ragi Seed Exchange Programme
and Ragi Crop Demonstration Programme. The primary reason for this is
low level of acceptance of high yielding varieties provided by the
Agriculture Department. The tribals do not find hybrid varieties of ragi
palatable in comparison to the traditional varieties. Further, the Crop
Demonstration Programme was undertaken in the year 2002-03 and the
benefits that accrued initially have not continued up to the present
v
period. Farmers also find that paddy cultivation is slightly more
remunerative than ragi cultivation.
The value of output in terms of cereals has gone up by about 44%. Among
the major pulses there has not been a very significant change in terms of
area under cultivation in the surveyed districts as a whole. However, the
yield rates of all the pulses have gone up leading to a 50% increase in
value of output, by itself a significant achievement.
One of the most positive changes seen is the diversification of new area
brought under cultivation towards cotton. This change is most prominent
in Bolangir and Kalahandi. Among oilseeds the area under Sesame has gone
up by 24%. Though the area under groundnut has gone down, the yield
has increased by 61%. The use of hybrid and improved seeds over
traditional seeds has increased substantially and is one of the
contributing factors towards increase in yield of different crops.
The Rabi period is marked by the absence of paddy in many districts and
diversification into more pulses and vegetables though the area under
cultivation is substantially less than that in the Kharif season. Most of
the newly cultivated land has been diverted towards pulses, moong in
particular, a low water intensive crop. The impact of the diversification
process is seen in the case of oilseeds such as groundnut, sunflower and
sesame where the area under cultivation has increased by 63%. The total
change in area under cultivation among pulses is 64% and the value of
output of pulses has increased by 94%.
vi
Cost and Income: The cost of production relates to labour, seeds,
ploughing, pesticides, fertilizers, transport and miscellaneous
expenditures. Diversification has entailed higher level of input
intensification. It has been observed that the increase in value of output,
barring Nuapada, is to a large extent a function of increase in
expenditure on seeds and fertilizers. The overall increase in cost in
descending order is 89%, 67%, 66%, 42%, 36% and 29% in the case of
Bolangir, Malkangiri, Kalahandi, Nuapada, Nawarangpur and Sonepur
respectively. Income from agriculture, taking all the districts as a whole,
has increased by 51% among beneficiaries and 45.5% among non-
beneficiaries. On a per hectare basis, however, it is seen that while the
beneficiaries have realized a net additional benefit of Rs 2304 per ha,
the non-beneficiaries have gained only by Rs 1846/ha over their ‘before’
status. The most important aspect of crop diversification programme is
the demonstration effect that the programme has on the ‘non-
beneficiaries’ making them virtual beneficiaries of the programme.
Overall, this is a very positive development.
There are however wide variations in benefit accrual across districts; as
low as Rs.652/- per hectare in Nuapada and a high of Rs.3,922/- per
hectare in Malkangiri. While the latter has done badly in watershed, it
has done well benefiting from agricultural diversification. Marketing
facility provided under RLATP, has done well for the farmers to have
ready access and much better price as compared to the ‘before’ situation.
Marketing: Marketing facilities form a crucial part of the diversification
process as they provide avenues for realizing proper value for the
agricultural products. The three main centres for selling crops are
markets, mandies and farm gates. There is variation in percentage of
vii
households selling products at different centres in accordance with type
of crop, accessibility and distance. Many new market yards have been
established under RLTAP in 2002-03 and 2003-04 in various districts to
facilitate the selling and procurement of crop products and to provide
reasonable remunerations to farmers. Overall, mandies feature as a
prominent selling center in Kalahandi and Nuapada. Access to markets is
more in Malkangiri, Kalahandi and Sonepur. Farm gates are common selling
centres across all the districts.
In Bolangir the average price of cotton is marginally higher in the mandi
(Rs 2,100/qntl) as compared to price at farmgate (Rs 2,050/qntl). Price
of paddy at the local market and mandi are the same (Rs 500/qntl) and
slightly less at the farm gate (Rs 460/qntl). In Kalahandi there is not
much difference in average paddy prices between farmgates and local
markets (Rs 490/qntl and Rs 493/qntl respectively) but the maximum
price at mandies is substantially higher i.e. Rs 570/qntl in comparison to
Rs 490/- per quintal at farmgates. In Malkangiri average prices of paddy
at farmgates, market and mandies are Rs 4,57,490/- and Rs 520/qntl.
However, groundnut sold at markets fetches a much higher average price
(Rs 1,200/qntl) in comparison to farmgates (Rs 750/qntl). In Nawarangpur
paddy sold at farm gates averages Rs 467/qntl in comparison to Rs
500/qntl at mandies. Paddy in Nuapada is sold at almost the same rate
(about Rs 475/qntl) both at markets and farmgates. In the above district
moong fetches a higher average price in markets (Rs 2,350/qntl).
The most commonly used implement across all the districts is the plough.
The highest percentage of households using plough is in Nawarangpur
followed by Malkangiri. This percentage is lowest in Kalahandi where only
viii
60% of the surveyed households are using plough. Another commonly used
implement is the Sprayer with nearly 55% of the households across all
the six districts using Sprayers. The use of sprayers is highest in the
case of Sonepur (73%) and lowest in the case of Kalahandi (37%). The use
of power tillers is marginally significant in the case of Nawarangpur
(8.33%) and Malkangiri (6.67%).
The most common reason for taking loan is for agricultural purposes. The
percentage of people availing loans for agriculture is highest in
Nawarangpur (44% in the case of beneficiaries and 42% in the case of
non-beneficiaries) followed by Sonepur. A positive impact of the
diversification programme is apparent in the districts of Kalahandi,
Malkangiri and Sonepur in that the percentage of non-beneficiaries
availing loans is significantly higher than beneficiaries. This suggests
that beneficiaries have been utilizing a part of their increased
additional incomes as agricultural investment.
The programme on the whole had a positive impact in terms of motivating
farmers from a static paddy oriented cropping system to a more
diversified income generating cropping system. There would be more
lasting changes if the intensity of follow-ups on crop demonstration to be
undertaken in future is increased. Increase in subsidies and financial
support is bound by funds available, however, quality of grass-root level
implementation is much more important for realizing development
programme targets. Instead of having agricultural diversification as a
programme, it should form a component of agricultural planning for the
district.
ix
The findings of this study along with the study conducted in two other
districts should be utilized while getting the study conducted on
horticulture development in KBK region. All the three studies will provide
guidance to the nature of future intervention in the region to have
accelerated agricultural growth with diversification and agro-processing
as a major strategy for development of the region.
1
CHAPTER 1
INTRODUCTION AND BACKGROUND
Introduction
Change over from a production system of mono crop or a few crops to more crops
over various seasons of a year or a few years can be defined as crop diversification.
Pingali and Rosegrant feel, ‘Initially, diversification implies the addition of other
crops and other enterprises at the farm household levels’1. Agricultural diversification
is used as a strategy to reduce risks associated with traditional agriculture and
improve returns to investment in commercial agriculture. Diversification with
intensive use of inputs has the potential to increase profit with greater market
orientation of products. Technology (quality seeds, fertilizers, and implements),
market, information and higher level of farm management through intensive crop
specific farmer training are some of the critical inputs to success of diversification
interventions.
Effective management of natural resources helps in accelerating crop diversification.
Policies that aid diversification strategies (water use, watershed development, control
of soil erosion and arresting desertification etc.) if precede diversification
implementation process, results are substantially close to targets. While price policy
interventions in certain areas may limit diversification (Asia for rice crop), in other
areas (in India and some countries of Africa and Latin America for example), pro-
active crop price policies have helped in substantial crop diversification.2
Agricultural Policy (1996) of Orissa emphasized agricultural diversification as a
major policy shift to minimize sectoral risk and improve land productivity per ha and
household farm income. Possibility of agricultural trade between regions and states
and export potential has provided additional incentives to diversification. With a view
to increasing income of poor farmers in underdeveloped KBK districts agricultural
diversification programme has been taken up since 2002. 1 Pingali Prabhu L and Mark W. Rosegrant, “ Agricultural commercialization and diversification: processes and policies’, Food Policy, Vol. 20 No.3 June 1995 2 Christofer L. Delago (1995), ‘ Agricultural diversification and export promotion in sub-Saharan Africa’, Food Policy, Vol. 20 No.3 June 1995
2
Cropping pattern changes are influenced by several factors that could be grouped
under two heads, price and non-price. While price factor will include price for a
particular product and inputs required, and price of competing crop (s), non-price
factors will comprise rainfall, irrigation, technology, markets and infrastructure and
subsidy on inputs. Although the price policy intended that government influence the
non-price factors, in Orissa, price factor might have played an important role.3
Need of Crop Diversification
Diversification of crops refers to change or shift in crops, their variety and the
cropping pattern. Crop diversification is necessary due to change in market, food
habits, weather aberration, and availability of high value and efficient crops. Crop
diversification is necessary due to some factors, which are stated below.
1. To mitigate the adverse food situation.
2. Ensure constant flow of income.
3. Employment generation.
4. Alleviate hunger and malnutrition.
5. Mitigate ill effect of unusual weather.
6. Increase the income of the small and marginal farmers.
Why it is necessary in KBK?
KBK region is quite backward in terms of market facilities, communication facilities,
employment opportunities, nutritional support and income of the peoples. As most of
the population is tribal and dependant on agriculture, a change in condition of the
people can be brought about most effectively through development of agriculture. For
the development of agriculture it is necessary to sensitize the people in terms of
changing their cropping pattern. Cropping pattern includes crop, variety, and the
cropping system. Through development of agriculture, the income of the farmers will
increase and the adverse food situation reversed. With respect to the KBK districts it
3 For detailed discussion on factors underlying changes in cropping patterns see Ashok Gulati and Tim Kelley (1999), ‘Trade Liberalization & Indian Agriculture- Cropping Pattern Changes and Efficiency Gains in Semi-arid Tropics’, Oxford University Press
3
is even more critical to diversify in order to increase the purchasing capacity of the
population that is the lowest among all the regions in the State.
Initiation of RLTAP
In the year 1988 a special area programme, Area Development Approach for Poverty
Termination (ADAPT) was formulated and implemented in 15 Blocks i.e. 8 Blocks in
Kalahandi and 7 Blocks in Koraput district. But short-term strategies were not
adequate to face the multifaceted backwardness of the total KBK region. Therefore a
Long Term Action Plan (LTAP) planned for three undivided districts of KBK
(Koraput, Bolangir and Kalahandi) started in the year 1993. But the fund supply in
LTAP was found to be inadequate to meet all the expenses required to have
developments envisaged for the region.
For the overall development of KBK region the Government of India prepared a
Revised Long Term Action Plan in the year 1998 instead of Long Term Action Plan
having a time period ranging from 1998-99 to 2006-07 with Rs.6251.08 crores under
different heads. The RLTAP was prepared in a sub-plan mode to address the peculiar
socio-economic problems of the backward region. The plan envisaged all-round
socio-economic development of the KBK region with Central and State assistance.
General Scenario of KBK Districts
The KBK districts account for a population of nearly 73 lakhs over 47646 Sq.Km. of
geographical area of the state. 91% of the people of this region still live in villages. In
comparison to the State’s population density of 236/Sq.Km. the region is sparsely
populated having a density of 153/Sq.Km. As per the 2001 census about 28 lakh
(38.41%) people of these districts belong to schedule tribe (ST) communities
including four primitive tribal groups, i.e. Bonda, Dadai, Langia Soura and Dongaria
Kandhas. In addition scheduled caste communities account for 16.26% (11.8 lakhs)
population of the region. The total literacy of KBK is only 43.33%; female literacy
being down to 29.10%. As per the 1997 BPL survey4, about 16.5 lakh (71.79%) rural
4 Panchayat Raj Department , Government of Orissa
4
Land Classification of Cultivated Area of KBK Region
0
50
100
150
200
250
BO
LAN
GIR
SON
EPU
R
KA
LAH
AN
DI
NA
WA
PAR
A
MA
LKA
NG
IRI
NA
WA
RA
NG
PUR
RA
YA
GA
DA
KO
RA
PUT
Are
a ('0
00 H
a)
HIGH MEDIUM LOW
families were living Below Poverty Line in this region. Results of the latest BPL
survey are not yet published.
In the KBK region 10.64 lakh families are dependant on agriculture. The region has
18.51 lakh hectare of cultivated area which is 30% of the State’s net cultivable area.
Irrigation facilities are underdeveloped to the extent that only 21.91% (4.06 lakh ha)
of the total cultivated area is under irrigation. Agricultural productivity has remained
rather low due to poor irrigation facilities and lack of use of new technology. Most of
the agriculture is dependant on rainfall, which varies between 1378mm to 1522mm.
Other socio economic indicators including population composition and density, net
area irrigated and connectivity of villages to growth centres and service centres are far
from satisfactory.
Land Classification
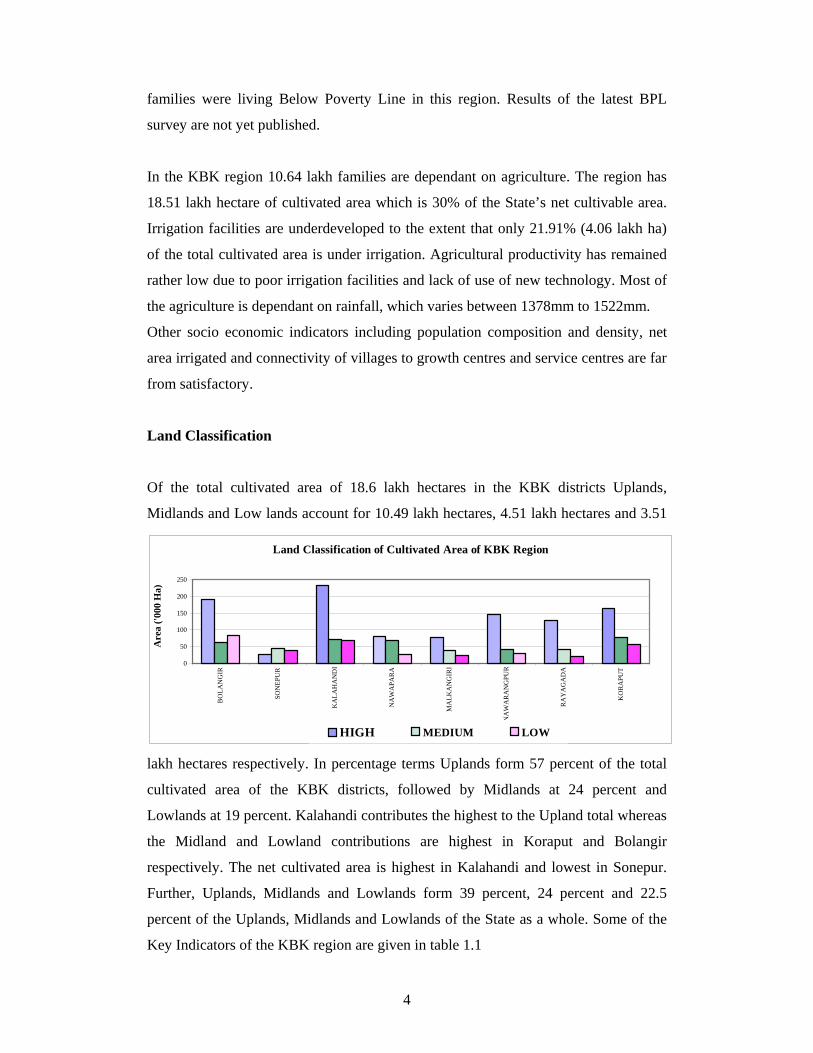
Of the total cultivated area of 18.6 lakh hectares in the KBK districts Uplands,
Midlands and Low lands account for 10.49 lakh hectares, 4.51 lakh hectares and 3.51
lakh hectares respectively. In percentage terms Uplands form 57 percent of the total
cultivated area of the KBK districts, followed by Midlands at 24 percent and
Lowlands at 19 percent. Kalahandi contributes the highest to the Upland total whereas
the Midland and Lowland contributions are highest in Koraput and Bolangir
respectively. The net cultivated area is highest in Kalahandi and lowest in Sonepur.
Further, Uplands, Midlands and Lowlands form 39 percent, 24 percent and 22.5
percent of the Uplands, Midlands and Lowlands of the State as a whole. Some of the
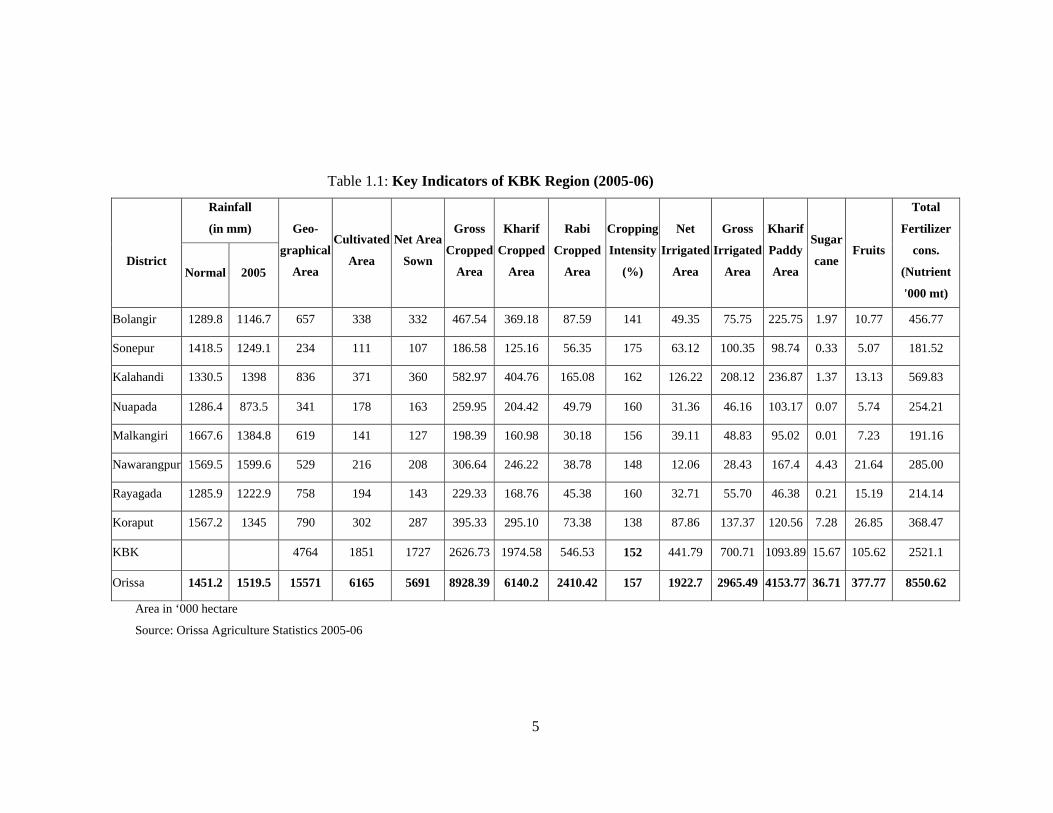
Key Indicators of the KBK region are given in table 1.1
5
Table 1.1: Key Indicators of KBK Region (2005-06)
District
Rainfall
(in mm) Geo-
graphical
Area
Cultivated
Area
Net Area
Sown
Gross
Cropped
Area
Kharif
Cropped
Area
Rabi
Cropped
Area
Cropping
Intensity
(%)
Net
Irrigated
Area
Gross
Irrigated
Area
Kharif
Paddy
Area
Sugar
cane Fruits
Total
Fertilizer
cons.
(Nutrient
'000 mt)
Normal 2005
Bolangir 1289.8 1146.7 657 338 332 467.54 369.18 87.59 141 49.35 75.75 225.75 1.97 10.77 456.77
Sonepur 1418.5 1249.1 234 111 107 186.58 125.16 56.35 175 63.12 100.35 98.74 0.33 5.07 181.52
Kalahandi 1330.5 1398 836 371 360 582.97 404.76 165.08 162 126.22 208.12 236.87 1.37 13.13 569.83
Nuapada 1286.4 873.5 341 178 163 259.95 204.42 49.79 160 31.36 46.16 103.17 0.07 5.74 254.21
Malkangiri 1667.6 1384.8 619 141 127 198.39 160.98 30.18 156 39.11 48.83 95.02 0.01 7.23 191.16
Nawarangpur 1569.5 1599.6 529 216 208 306.64 246.22 38.78 148 12.06 28.43 167.4 4.43 21.64 285.00
Rayagada 1285.9 1222.9 758 194 143 229.33 168.76 45.38 160 32.71 55.70 46.38 0.21 15.19 214.14
Koraput 1567.2 1345 790 302 287 395.33 295.10 73.38 138 87.86 137.37 120.56 7.28 26.85 368.47
KBK 4764 1851 1727 2626.73 1974.58 546.53 152 441.79 700.71 1093.89 15.67 105.62 2521.1
Orissa 1451.2 1519.5 15571 6165 5691 8928.39 6140.2 2410.42 157 1922.7 2965.49 4153.77 36.71 377.77 8550.62
Area in ‘000 hectare
Source: Orissa Agriculture Statistics 2005-06

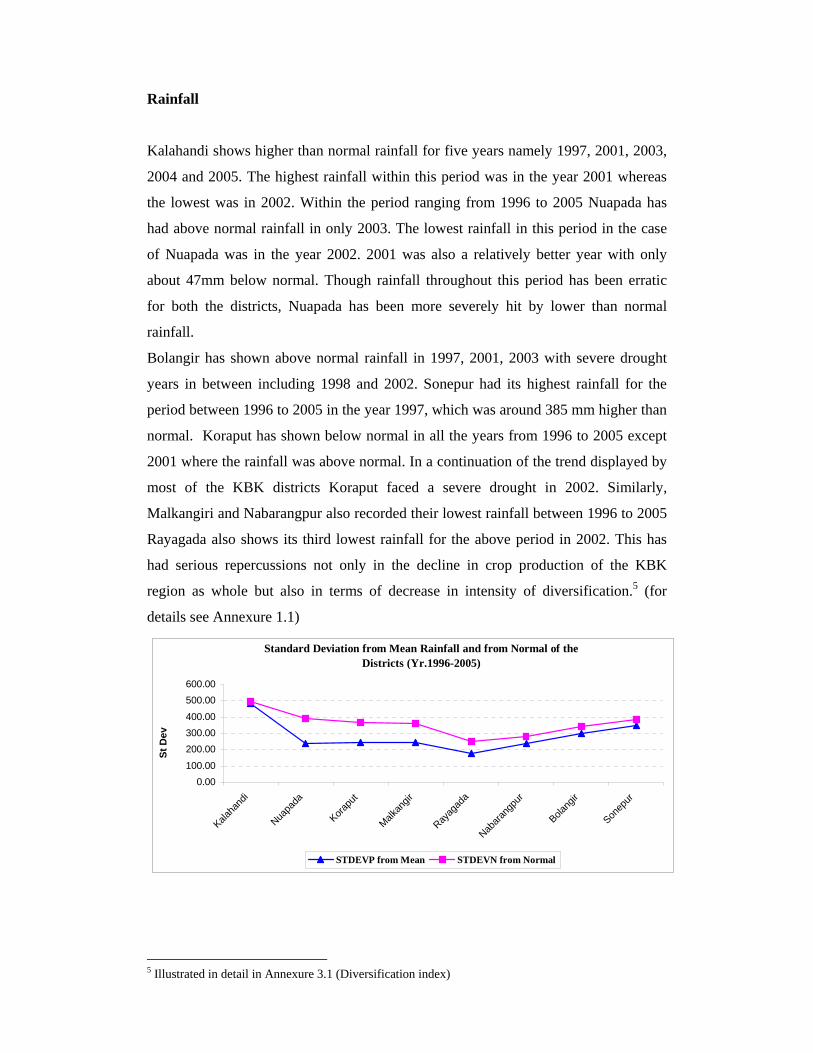
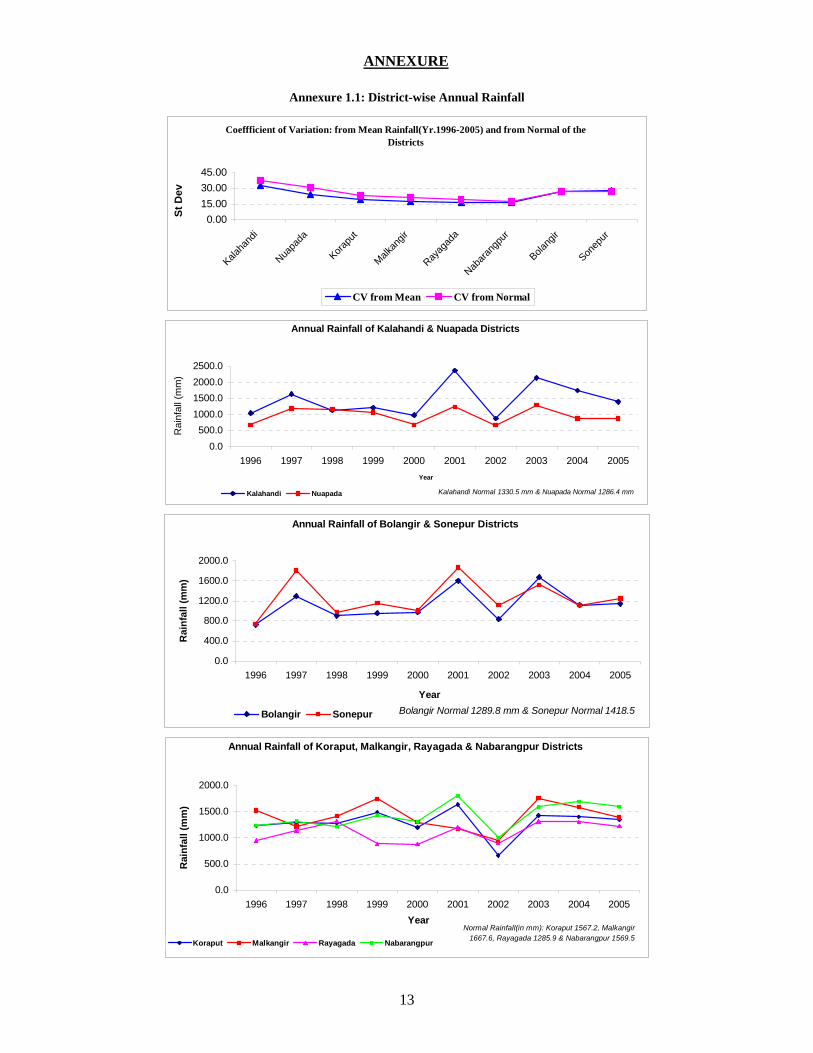
Rainfall
Kalahandi shows higher than normal rainfall for five years namely 1997, 2001, 2003,
2004 and 2005. The highest rainfall within this period was in the year 2001 whereas
the lowest was in 2002. Within the period ranging from 1996 to 2005 Nuapada has
had above normal rainfall in only 2003. The lowest rainfall in this period in the case
of Nuapada was in the year 2002. 2001 was also a relatively better year with only
about 47mm below normal. Though rainfall throughout this period has been erratic
for both the districts, Nuapada has been more severely hit by lower than normal
rainfall.
Bolangir has shown above normal rainfall in 1997, 2001, 2003 with severe drought
years in between including 1998 and 2002. Sonepur had its highest rainfall for the
period between 1996 to 2005 in the year 1997, which was around 385 mm higher than
normal. Koraput has shown below normal in all the years from 1996 to 2005 except
2001 where the rainfall was above normal. In a continuation of the trend displayed by
most of the KBK districts Koraput faced a severe drought in 2002. Similarly,
Malkangiri and Nabarangpur also recorded their lowest rainfall between 1996 to 2005
Rayagada also shows its third lowest rainfall for the above period in 2002. This has
had serious repercussions not only in the decline in crop production of the KBK
region as whole but also in terms of decrease in intensity of diversification.5 (for
details see Annexure 1.1)
Standard Deviation from Mean Rainfall and from Normal of the Districts (Yr.1996-2005)
0.00100.00
200.00300.00400.00
500.00600.00
Kalaha
ndi
Nuapa
da
Korapu
t
Malkan
gir
Rayag
ada
Nabara
ngpu
r
Bolang
ir
Sonep
ur
St D
ev
STDEVP from Mean STDEVN from Normal
5 Illustrated in detail in Annexure 3.1 (Diversification index)
8
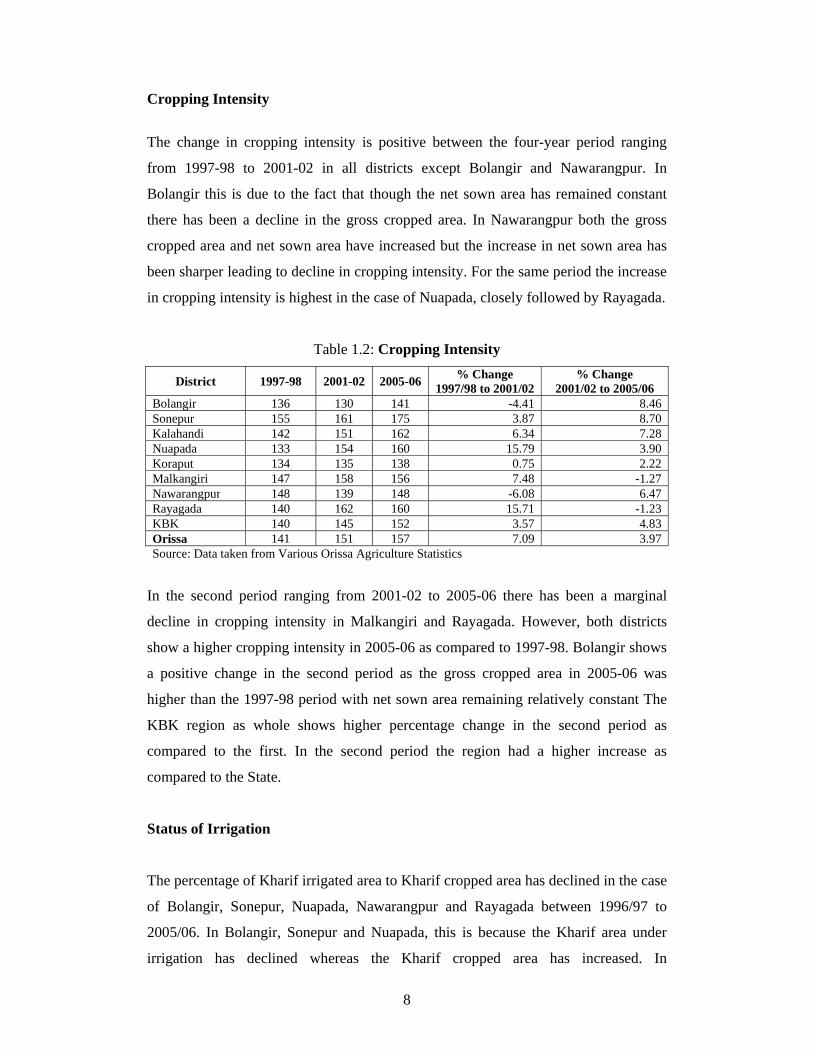
Cropping Intensity
The change in cropping intensity is positive between the four-year period ranging
from 1997-98 to 2001-02 in all districts except Bolangir and Nawarangpur. In
Bolangir this is due to the fact that though the net sown area has remained constant
there has been a decline in the gross cropped area. In Nawarangpur both the gross
cropped area and net sown area have increased but the increase in net sown area has
been sharper leading to decline in cropping intensity. For the same period the increase
in cropping intensity is highest in the case of Nuapada, closely followed by Rayagada.
Table 1.2: Cropping Intensity
District 1997-98 2001-02 2005-06 % Change 1997/98 to 2001/02
% Change 2001/02 to 2005/06
Bolangir 136 130 141 -4.41 8.46Sonepur 155 161 175 3.87 8.70Kalahandi 142 151 162 6.34 7.28 Nuapada 133 154 160 15.79 3.90 Koraput 134 135 138 0.75 2.22 Malkangiri 147 158 156 7.48 -1.27 Nawarangpur 148 139 148 -6.08 6.47Rayagada 140 162 160 15.71 -1.23KBK 140 145 152 3.57 4.83 Orissa 141 151 157 7.09 3.97 Source: Data taken from Various Orissa Agriculture Statistics
In the second period ranging from 2001-02 to 2005-06 there has been a marginal
decline in cropping intensity in Malkangiri and Rayagada. However, both districts
show a higher cropping intensity in 2005-06 as compared to 1997-98. Bolangir shows
a positive change in the second period as the gross cropped area in 2005-06 was
higher than the 1997-98 period with net sown area remaining relatively constant The
KBK region as whole shows higher percentage change in the second period as
compared to the first. In the second period the region had a higher increase as
compared to the State.
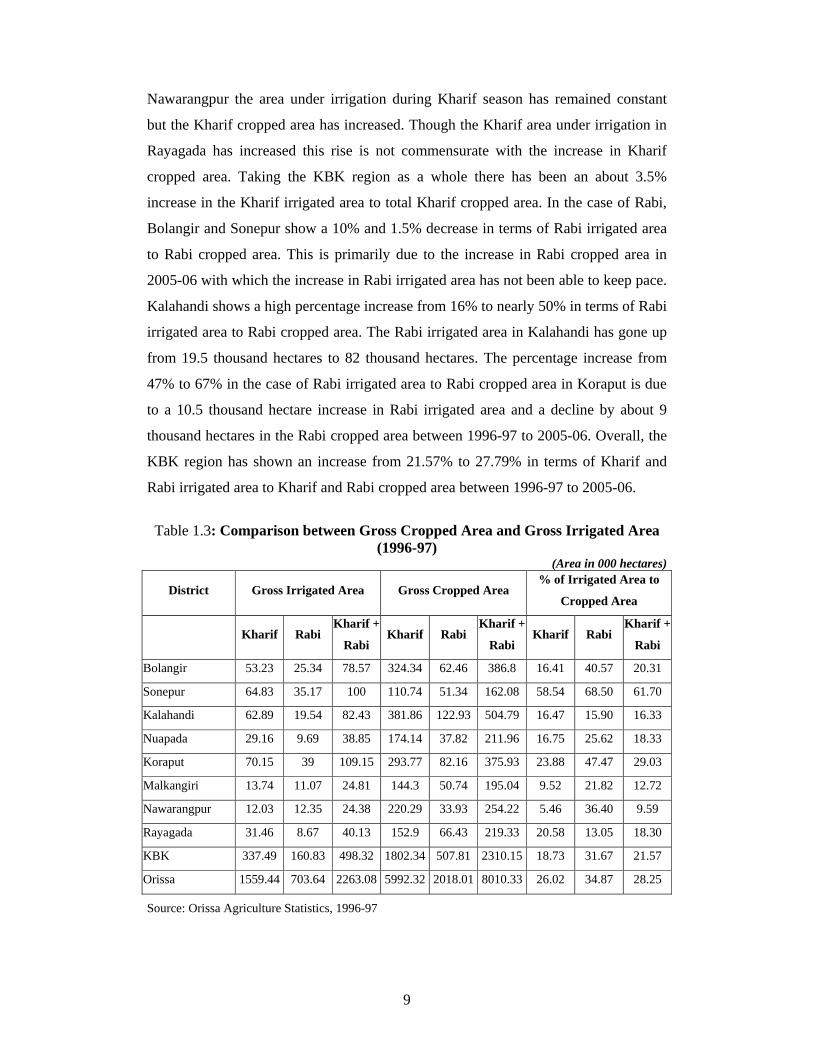
Status of Irrigation
The percentage of Kharif irrigated area to Kharif cropped area has declined in the case
of Bolangir, Sonepur, Nuapada, Nawarangpur and Rayagada between 1996/97 to
2005/06. In Bolangir, Sonepur and Nuapada, this is because the Kharif area under
irrigation has declined whereas the Kharif cropped area has increased. In
9
Nawarangpur the area under irrigation during Kharif season has remained constant
but the Kharif cropped area has increased. Though the Kharif area under irrigation in
Rayagada has increased this rise is not commensurate with the increase in Kharif
cropped area. Taking the KBK region as a whole there has been an about 3.5%
increase in the Kharif irrigated area to total Kharif cropped area. In the case of Rabi,
Bolangir and Sonepur show a 10% and 1.5% decrease in terms of Rabi irrigated area
to Rabi cropped area. This is primarily due to the increase in Rabi cropped area in
2005-06 with which the increase in Rabi irrigated area has not been able to keep pace.
Kalahandi shows a high percentage increase from 16% to nearly 50% in terms of Rabi
irrigated area to Rabi cropped area. The Rabi irrigated area in Kalahandi has gone up
from 19.5 thousand hectares to 82 thousand hectares. The percentage increase from
47% to 67% in the case of Rabi irrigated area to Rabi cropped area in Koraput is due
to a 10.5 thousand hectare increase in Rabi irrigated area and a decline by about 9
thousand hectares in the Rabi cropped area between 1996-97 to 2005-06. Overall, the
KBK region has shown an increase from 21.57% to 27.79% in terms of Kharif and
Rabi irrigated area to Kharif and Rabi cropped area between 1996-97 to 2005-06.
Table 1.3: Comparison between Gross Cropped Area and Gross Irrigated Area
(1996-97) (Area in 000 hectares)
District Gross Irrigated Area Gross Cropped Area % of Irrigated Area to
Cropped Area
Kharif Rabi Kharif +
Rabi Kharif Rabi
Kharif +
Rabi Kharif Rabi
Kharif +
Rabi
Bolangir 53.23 25.34 78.57 324.34 62.46 386.8 16.41 40.57 20.31
Sonepur 64.83 35.17 100 110.74 51.34 162.08 58.54 68.50 61.70
Kalahandi 62.89 19.54 82.43 381.86 122.93 504.79 16.47 15.90 16.33
Nuapada 29.16 9.69 38.85 174.14 37.82 211.96 16.75 25.62 18.33
Koraput 70.15 39 109.15 293.77 82.16 375.93 23.88 47.47 29.03
Malkangiri 13.74 11.07 24.81 144.3 50.74 195.04 9.52 21.82 12.72
Nawarangpur 12.03 12.35 24.38 220.29 33.93 254.22 5.46 36.40 9.59
Rayagada 31.46 8.67 40.13 152.9 66.43 219.33 20.58 13.05 18.30
KBK 337.49 160.83 498.32 1802.34 507.81 2310.15 18.73 31.67 21.57
Orissa 1559.44 703.64 2263.08 5992.32 2018.01 8010.33 26.02 34.87 28.25
Source: Orissa Agriculture Statistics, 1996-97
10
Table 1.4: Comparison between Gross Cropped Area and Irrigated Area (2005-06) (Area in 000 hectares)
District Gross Irrigated Area Gross Cropped Area % of Irrigated to Cropped Area
Kharif Rabi Kharif + Rabi Kharif Rabi Kharif +
Rabi Kharif Rabi Kharif + Rabi
Bolangir 49.35 26.4 75.75 369.18 87.59 456.77 13.37 30.14 16.58
Sonepur 63.12 37.23 100.35 125.16 56.35 181.51 50.43 66.07 55.29
Kalahandi 126.22 81.9 208.12 404.76 165.08 569.84 31.18 49.61 36.52
Nuapada 31.36 14.8 46.16 204.62 49.79 254.41 15.33 29.72 18.14
Koraput 87.86 49.51 137.37 295.1 73.38 368.48 29.77 67.47 37.28
Malkangiri 39.11 9.72 48.83 160.98 30.18 191.16 24.29 32.21 25.54
Nawarangpur 12.06 16.37 28.43 246.22 38.78 285 4.90 42.21 9.98
Rayagada 32.71 22.99 55.7 168.76 45.38 214.14 19.38 50.66 26.01
KBK 441.79 258.92 700.71 1974.78 546.53 2521.31 22.37 47.38 27.79
Orissa 1922.7 1042.79 2965.49 6140.2 2410.42 8550.62 31.31 43.26 34.68
Source: Orissa Agricultural Statistics, 2005-06
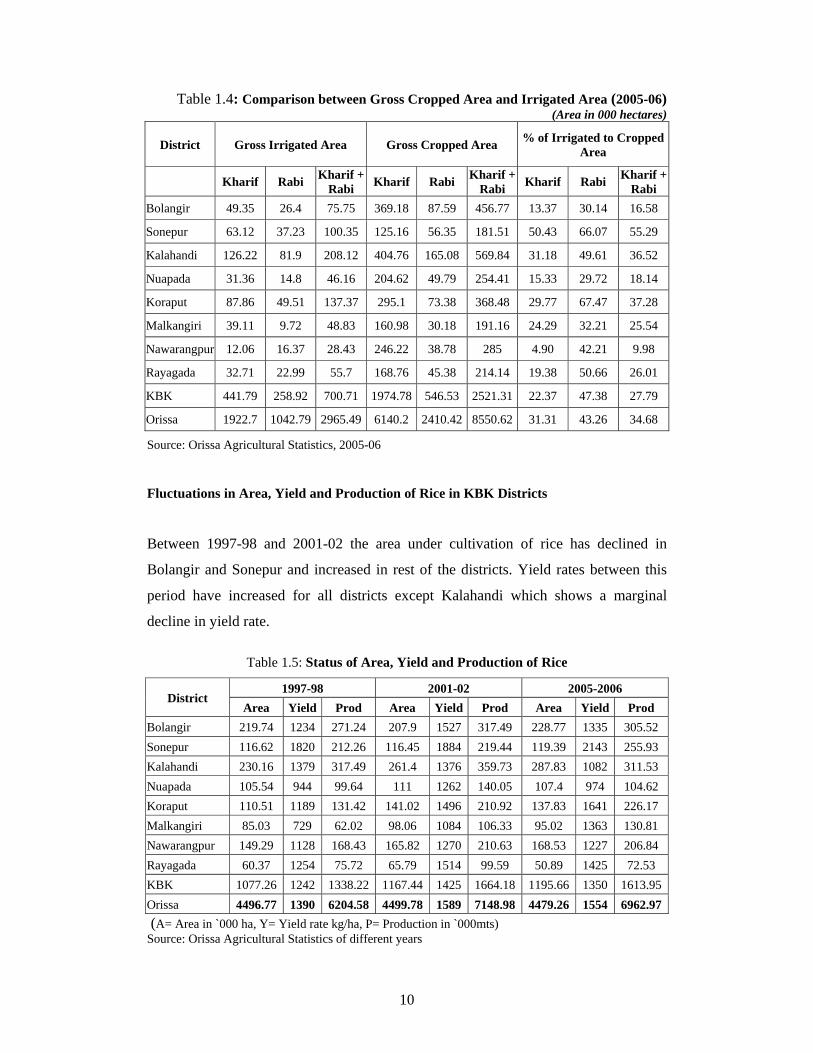
Fluctuations in Area, Yield and Production of Rice in KBK Districts
Between 1997-98 and 2001-02 the area under cultivation of rice has declined in
Bolangir and Sonepur and increased in rest of the districts. Yield rates between this
period have increased for all districts except Kalahandi which shows a marginal
decline in yield rate.
Table 1.5: Status of Area, Yield and Production of Rice
District 1997-98 2001-02 2005-2006
Area Yield Prod Area Yield Prod Area Yield Prod Bolangir 219.74 1234 271.24 207.9 1527 317.49 228.77 1335 305.52 Sonepur 116.62 1820 212.26 116.45 1884 219.44 119.39 2143 255.93 Kalahandi 230.16 1379 317.49 261.4 1376 359.73 287.83 1082 311.53 Nuapada 105.54 944 99.64 111 1262 140.05 107.4 974 104.62 Koraput 110.51 1189 131.42 141.02 1496 210.92 137.83 1641 226.17 Malkangiri 85.03 729 62.02 98.06 1084 106.33 95.02 1363 130.81 Nawarangpur 149.29 1128 168.43 165.82 1270 210.63 168.53 1227 206.84 Rayagada 60.37 1254 75.72 65.79 1514 99.59 50.89 1425 72.53 KBK 1077.26 1242 1338.22 1167.44 1425 1664.18 1195.66 1350 1613.95 Orissa 4496.77 1390 6204.58 4499.78 1589 7148.98 4479.26 1554 6962.97 (A= Area in `000 ha, Y= Yield rate kg/ha, P= Production in `000mts) Source: Orissa Agricultural Statistics of different years
11
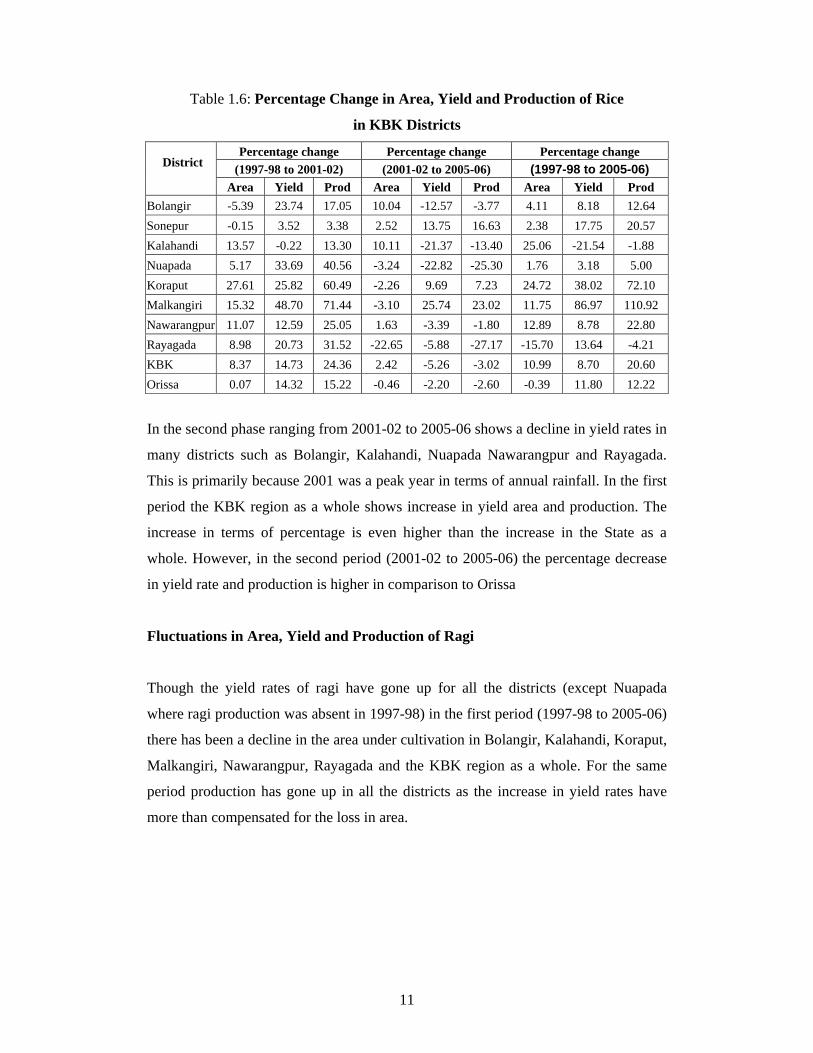
Table 1.6: Percentage Change in Area, Yield and Production of Rice
in KBK Districts
District
Percentage change Percentage change Percentage change (1997-98 to 2001-02) (2001-02 to 2005-06) (1997-98 to 2005-06)
Area Yield Prod Area Yield Prod Area Yield Prod Bolangir -5.39 23.74 17.05 10.04 -12.57 -3.77 4.11 8.18 12.64 Sonepur -0.15 3.52 3.38 2.52 13.75 16.63 2.38 17.75 20.57 Kalahandi 13.57 -0.22 13.30 10.11 -21.37 -13.40 25.06 -21.54 -1.88 Nuapada 5.17 33.69 40.56 -3.24 -22.82 -25.30 1.76 3.18 5.00 Koraput 27.61 25.82 60.49 -2.26 9.69 7.23 24.72 38.02 72.10 Malkangiri 15.32 48.70 71.44 -3.10 25.74 23.02 11.75 86.97 110.92 Nawarangpur 11.07 12.59 25.05 1.63 -3.39 -1.80 12.89 8.78 22.80 Rayagada 8.98 20.73 31.52 -22.65 -5.88 -27.17 -15.70 13.64 -4.21 KBK 8.37 14.73 24.36 2.42 -5.26 -3.02 10.99 8.70 20.60 Orissa 0.07 14.32 15.22 -0.46 -2.20 -2.60 -0.39 11.80 12.22
In the second phase ranging from 2001-02 to 2005-06 shows a decline in yield rates in
many districts such as Bolangir, Kalahandi, Nuapada Nawarangpur and Rayagada.
This is primarily because 2001 was a peak year in terms of annual rainfall. In the first
period the KBK region as a whole shows increase in yield area and production. The
increase in terms of percentage is even higher than the increase in the State as a
whole. However, in the second period (2001-02 to 2005-06) the percentage decrease
in yield rate and production is higher in comparison to Orissa
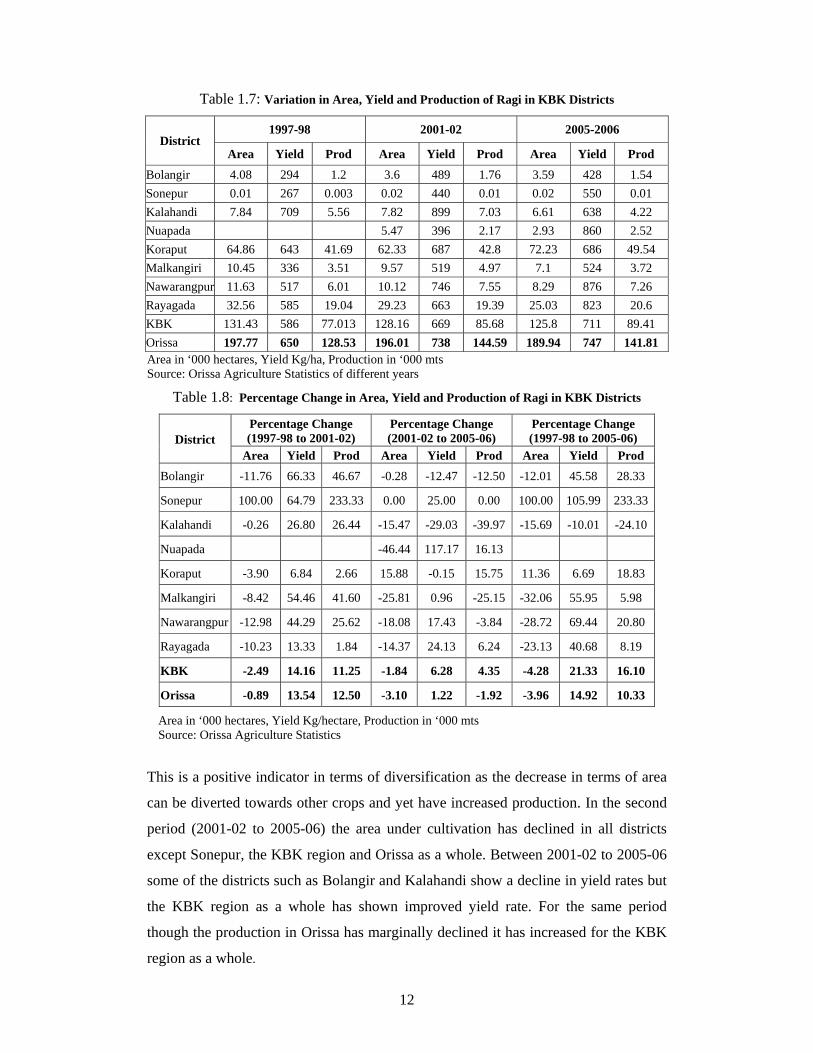
Fluctuations in Area, Yield and Production of Ragi
Though the yield rates of ragi have gone up for all the districts (except Nuapada
where ragi production was absent in 1997-98) in the first period (1997-98 to 2005-06)
there has been a decline in the area under cultivation in Bolangir, Kalahandi, Koraput,
Malkangiri, Nawarangpur, Rayagada and the KBK region as a whole. For the same
period production has gone up in all the districts as the increase in yield rates have
more than compensated for the loss in area.
12
Table 1.7: Variation in Area, Yield and Production of Ragi in KBK Districts
District 1997-98 2001-02 2005-2006
Area Yield Prod Area Yield Prod Area Yield Prod
Bolangir 4.08 294 1.2 3.6 489 1.76 3.59 428 1.54 Sonepur 0.01 267 0.003 0.02 440 0.01 0.02 550 0.01 Kalahandi 7.84 709 5.56 7.82 899 7.03 6.61 638 4.22 Nuapada 5.47 396 2.17 2.93 860 2.52 Koraput 64.86 643 41.69 62.33 687 42.8 72.23 686 49.54 Malkangiri 10.45 336 3.51 9.57 519 4.97 7.1 524 3.72 Nawarangpur 11.63 517 6.01 10.12 746 7.55 8.29 876 7.26 Rayagada 32.56 585 19.04 29.23 663 19.39 25.03 823 20.6 KBK 131.43 586 77.013 128.16 669 85.68 125.8 711 89.41 Orissa 197.77 650 128.53 196.01 738 144.59 189.94 747 141.81 Area in ‘000 hectares, Yield Kg/ha, Production in ‘000 mts Source: Orissa Agriculture Statistics of different years
Table 1.8: Percentage Change in Area, Yield and Production of Ragi in KBK Districts
District Percentage Change (1997-98 to 2001-02)
Percentage Change (2001-02 to 2005-06)
Percentage Change (1997-98 to 2005-06)
Area Yield Prod Area Yield Prod Area Yield Prod Bolangir -11.76 66.33 46.67 -0.28 -12.47 -12.50 -12.01 45.58 28.33
Sonepur 100.00 64.79 233.33 0.00 25.00 0.00 100.00 105.99 233.33
Kalahandi -0.26 26.80 26.44 -15.47 -29.03 -39.97 -15.69 -10.01 -24.10
Nuapada -46.44 117.17 16.13
Koraput -3.90 6.84 2.66 15.88 -0.15 15.75 11.36 6.69 18.83
Malkangiri -8.42 54.46 41.60 -25.81 0.96 -25.15 -32.06 55.95 5.98
Nawarangpur -12.98 44.29 25.62 -18.08 17.43 -3.84 -28.72 69.44 20.80
Rayagada -10.23 13.33 1.84 -14.37 24.13 6.24 -23.13 40.68 8.19
KBK -2.49 14.16 11.25 -1.84 6.28 4.35 -4.28 21.33 16.10
Orissa -0.89 13.54 12.50 -3.10 1.22 -1.92 -3.96 14.92 10.33
Area in ‘000 hectares, Yield Kg/hectare, Production in ‘000 mts Source: Orissa Agriculture Statistics
This is a positive indicator in terms of diversification as the decrease in terms of area
can be diverted towards other crops and yet have increased production. In the second
period (2001-02 to 2005-06) the area under cultivation has declined in all districts
except Sonepur, the KBK region and Orissa as a whole. Between 2001-02 to 2005-06
some of the districts such as Bolangir and Kalahandi show a decline in yield rates but
the KBK region as a whole has shown improved yield rate. For the same period
though the production in Orissa has marginally declined it has increased for the KBK
region as a whole.
13
Annexure 1.1: District-wise Annual Rainfall
Coeffficient of Variation: from Mean Rainfall(Yr.1996-2005) and from Normal of the Districts
0.0015.0030.0045.00
Kalaha
ndi
Nuapa
da
Korapu
t
Malkan
gir
Rayag
ada
Nabara
ngpu
r
Bolang
ir
Sonep
ur
St D
ev
CV from Mean CV from Normal
Annual Rainfall of Kalahandi & Nuapada Districts
0.0500.0
1000.01500.02000.02500.0
1996 1997 1998 1999 2000 2001 2002 2003 2004 2005Year
Rai
nfal
l (m
m)
Kalahandi Nuapada Kalahandi Normal 1330.5 mm & Nuapada Normal 1286.4 mm
Annual Rainfall of Bolangir & Sonepur Districts
0.0
400.0
800.0
1200.0
1600.0
2000.0
1996 1997 1998 1999 2000 2001 2002 2003 2004 2005
Year
Rai
nfal
l (m
m)
Bolangir Sonepur Bolangir Normal 1289.8 mm & Sonepur Normal 1418.5
Annual Rainfall of Koraput, Malkangir, Rayagada & Nabarangpur Districts
0.0
500.0
1000.0
1500.0
2000.0
1996 1997 1998 1999 2000 2001 2002 2003 2004 2005Year
Rai
nfal
l (m
m)
Koraput Malkangir Rayagada Nabarangpur
Normal Rainfall(in mm): Koraput 1567.2, Malkangir 1667.6, Rayagada 1285.9 & Nabarangpur 1569.5
ANNEXURE
14
CHAPTER 2
OBJECTIVE AND METHODOLOGY
Objectives of the Study
• To evaluate the extent to which the objectives of the programme /schemes
have been achieved.
• To identify the constraint faced by the implementing agency and the extent to
which the achievements were affected by the constraints.
• To identify the constraint faced by the beneficiaries and the extent to which
the constraint affect the benefits.
• To ascertain special efforts, if any made by the implementing agency to short
fall and accelerate the achievements.
• To identify Best Practices
• To recommend special measures to improve outcomes/achievements of the
programme
Scope of the Study
This study deals with Diversification of Agricultural Crops under RLTAP in 6 KBK
districts, namely Bolangir, Kalahandi, Malkangiri, Nawarangpur, Nuapada and
Sonepur , in which different activities undertaken in order to achieve the objectives of
the programme have been analyzed. The total study analyzes the socio-economic
condition, standard of living of the people, their income and expenditure, etc. Thus,
the evaluation aims at comparing the over all development of the tribal people in the
KBK districts in pre and post diversification programme status. The study will help
the government to rethink its strategies and make necessary changes in the
programme and plan accordingly. It will also help the research organizations, NGOs,
researchers and other people involved in different development activities.
15
Study Methodology
The study has been based on secondary and primary data collected from different
sources. The secondary data based on physical and financial achievement till 2005-06
has been collected from District and State levels in order to have a clear picture of the
programme.
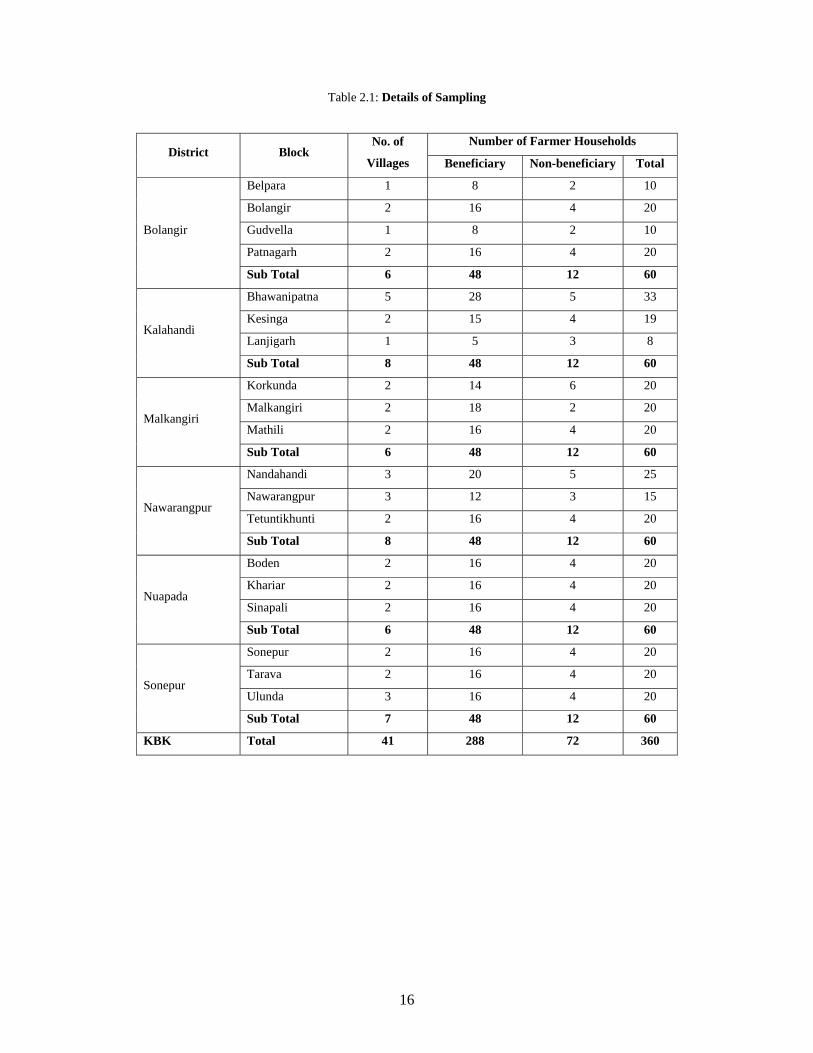
Primary data has been collected from the ground level through questionnaire method.
The questionnaire of the beneficiary deals with over all development of agriculture
and increase in standard of living in pre and post period of Agriculture
Diversification. Three blocks each from Kalahandi, Nuapada, Sonepur, Malkangiri
and Nawarangpur have been randomly selected. However, in the case of Bolangir 4
blocks have been selected due to unavailability of beneficiaries. In all 41 villages have
been selected, 6 villages each from Bolangir, Malkangiri and Nuapada districts, 8
villages each from Kalahandi and Nawarangpur districts and 7 villages from Sonepur
district . From each village beneficiaries and non-beneficiaries of the programme have
been interviewed so as to select 48 beneficiaries and 20% non-beneficiaries (12
households out of a total of 60) from each district. In the KBK districts 288
beneficiaries and 72 non-beneficiaries have been selected under the study. The
evaluation is based on a direct questionnaire method both for beneficiaries and non-
beneficiaries. Those farmers who have not received any benefit from the RLTAP
scheme have been classified as non-beneficiaries. Additional information has also
been collected from the district head and other related government officials.
Study Limitation
The study is based on secondary and primary data; the former, published and
unpublished, collected from the government sources and the latter from the primary
survey conducted. Data and information from beneficiaries and non-beneficiaries
were collected through interviews and by recall method that suffers from recall-
memory problems about various details. All efforts were made to probe and obtain
adequate information for analysis.

16
Table 2.1: Details of Sampling
District Block No. of
Villages
Number of Farmer Households
Beneficiary Non-beneficiary Total
Bolangir
Belpara 1 8 2 10
Bolangir 2 16 4 20
Gudvella 1 8 2 10
Patnagarh 2 16 4 20
Sub Total 6 48 12 60
Kalahandi
Bhawanipatna 5 28 5 33
Kesinga 2 15 4 19
Lanjigarh 1 5 3 8
Sub Total 8 48 12 60
Malkangiri
Korkunda 2 14 6 20
Malkangiri 2 18 2 20
Mathili 2 16 4 20
Sub Total 6 48 12 60
Nawarangpur
Nandahandi 3 20 5 25
Nawarangpur 3 12 3 15
Tetuntikhunti 2 16 4 20
Sub Total 8 48 12 60
Nuapada
Boden 2 16 4 20
Khariar 2 16 4 20
Sinapali 2 16 4 20
Sub Total 6 48 12 60
Sonepur
Sonepur 2 16 4 20
Tarava 2 16 4 20
Ulunda 3 16 4 20
Sub Total 7 48 12 60
KBK Total 41 288 72 360

14
CHAPTER 2
OBJECTIVE AND METHODOLOGY
Objectives of the Study
• To evaluate the extent to which the objectives of the programme /schemes
have been achieved.
• To identify the constraint faced by the implementing agency and the extent to
which the achievements were affected by the constraints.
• To identify the constraint faced by the beneficiaries and the extent to which
the constraint affect the benefits.
• To ascertain special efforts, if any made by the implementing agency to short
fall and accelerate the achievements.
• To identify Best Practices
• To recommend special measures to improve outcomes/achievements of the
programme
Scope of the Study
This study deals with Diversification of Agricultural Crops under RLTAP in 6 KBK
districts, namely Bolangir, Kalahandi, Malkangiri, Nawarangpur, Nuapada and
Sonepur , in which different activities undertaken in order to achieve the objectives of
the programme have been analyzed. The total study analyzes the socio-economic
condition, standard of living of the people, their income and expenditure, etc. Thus,
the evaluation aims at comparing the over all development of the tribal people in the
KBK districts in pre and post diversification programme status. The study will help
the government to rethink its strategies and make necessary changes in the
programme and plan accordingly. It will also help the research organizations, NGOs,
researchers and other people involved in different development activities.

15
Study Methodology
The study has been based on secondary and primary data collected from different
sources. The secondary data based on physical and financial achievement till 2005-06
has been collected from District and State levels in order to have a clear picture of the
programme.
Primary data has been collected from the ground level through questionnaire method.
The questionnaire of the beneficiary deals with over all development of agriculture
and increase in standard of living in pre and post period of Agriculture
Diversification. Three blocks each from Kalahandi, Nuapada, Sonepur, Malkangiri
and Nawarangpur have been randomly selected. However, in the case of Bolangir 4
blocks have been selected due to unavailability of beneficiaries. In all 41 villages have
been selected, 6 villages each from Bolangir, Malkangiri and Nuapada districts, 8
villages each from Kalahandi and Nawarangpur districts and 7 villages from Sonepur
district . From each village beneficiaries and non-beneficiaries of the programme have
been interviewed so as to select 48 beneficiaries and 20% non-beneficiaries (12
households out of a total of 60) from each district. In the KBK districts 288
beneficiaries and 72 non-beneficiaries have been selected under the study. The
evaluation is based on a direct questionnaire method both for beneficiaries and non-
beneficiaries. Those farmers who have not received any benefit from the RLTAP
scheme have been classified as non-beneficiaries. Additional information has also
been collected from the district head and other related government officials.
Study Limitation
The study is based on secondary and primary data; the former, published and
unpublished, collected from the government sources and the latter from the primary
survey conducted. Data and information from beneficiaries and non-beneficiaries
were collected through interviews and by recall method that suffers from recall-
memory problems about various details. All efforts were made to probe and obtain
adequate information for analysis.
16
Table 2.1: Details of Sampling
District Block No. of
Villages
Number of Farmer Households
Beneficiary Non-beneficiary Total
Bolangir
Belpara 1 8 2 10
Bolangir 2 16 4 20
Gudvella 1 8 2 10
Patnagarh 2 16 4 20
Sub Total 6 48 12 60
Kalahandi
Bhawanipatna 5 28 5 33
Kesinga 2 15 4 19
Lanjigarh 1 5 3 8
Sub Total 8 48 12 60
Malkangiri
Korkunda 2 14 6 20
Malkangiri 2 18 2 20
Mathili 2 16 4 20
Sub Total 6 48 12 60
Nawarangpur
Nandahandi 3 20 5 25
Nawarangpur 3 12 3 15
Tetuntikhunti 2 16 4 20
Sub Total 8 48 12 60
Nuapada
Boden 2 16 4 20
Khariar 2 16 4 20
Sinapali 2 16 4 20
Sub Total 6 48 12 60
Sonepur
Sonepur 2 16 4 20
Tarava 2 16 4 20
Ulunda 3 16 4 20
Sub Total 7 48 12 60
KBK Total 41 288 72 360
17
CHAPTER 3
ORGANISATION LAYOUT AND ACHIEVEMENTS
Introduction
Agriculture sector plays a crucial role in the State’s economy as it contributes by more
than ¼ to the Net State Domestic Product (NSDP) and provides employment, directly
or indirectly to nearly two third of the total work-force. It is the largest private sector
of the State’s economy. Agriculture in Orissa continues to be characterized by low
productivity due to traditional agricultural practices, inadequate capital formation and
low investment, inadequate irrigation facilities and uneconomic size of holdings.
Nearly 62% of the cultivable land is rain fed and exposed to the vagaries of the
monsoon. The per capita availability of cultivated land which was 0.39 hectares in
1950-51 has declined to 0.16 hectare in 2002-03. Recognizing the importance of this
sector to the State’s economy, the State Government came up with a comprehensive
Agricultural Policy (1996) according agriculture the status of an industry. It
emphasized, among others, diversification of crops and agricultural activities as a
strategy to accelerate sector’s growth while minimizing the risk to farmers. The small
and marginal farmers, through appropriate crop diversification, were to spread their
risks. The Tenth Plan has also emphasized promoting integrated development of
agriculture and horticulture through area expansion of commercial crops including
fruit crops, vegetables, spices, root and tuber crops and floriculture.
Organizational Structure
The Department of Agriculture is in charge of a Minister of Cabinet rank. He is
assisted by a Principal Secretary for administration, programme implementation and
coordination of programmes. The Principal Secretary also looks after Horticulture,
Soil Conservation and Watershed Mission. The Secretary (Agriculture) is the
administrative head of four Directorates under his purview. Above the Principal
Secretary, there is an Agricultural Production Commissioner of the rank of Chief
Secretary, who overviews, among other departments, the functioning of Department
of Agriculture for accelerating growth of agriculture and related sectors.
18
a) Directorate of Agriculture & Food Production
The Directorate is headed by a Director with 27 Deputy Directors working below him
at the Range Level who give assessment reports on implementation of agricultural
programmes in the districts under their jurisdiction. At the District and Sub-division
level there are District Agricultural Officers (DAO) and Additional District
Agricultural Officers (ADAO). At present there are 47 DAOs and ADAOs in the
Directorate. At the Block level Agricultural Extension Officers (AEO) and Junior
Agricultural officers (JAO) coordinate activities and report on progress to the DAO
and ADAO. Village Agricultural Workers (VAW) help promote agricultural
programme implementation at the Gram Panchayat level.
Based on reports on progress of implementation, prospects and constraints provided
by DDA/DAO/JAO & VLWs the Director submits a monthly report to the Secretary
at the government level. The report contains information on crop coverage,
agricultural inputs required and supplied stages of agricultural operation, crop yield
and production and progress of implementation of various agricultural schemes.
b) Directorate of Horticulture
Director of Horticulture is the administrative head of this directorate. At the district
and sub-division level coordination and supervision is done by designated Deputy
Director Horticulture or/and Horticulturist/Assistant Horticulture Officer. Further
below the administrative set-up are Junior Horticulture Officers who look after the
Block level set-up. The Gram Panchayat level is managed by Grafter and Gardeners.
Information flows from the Gram Panchayat level upwards and based on such
information the Director furnishes report to the Secretary where government
intervention is required. Such reports covers information relating to crop coverage and
produce, monthly progress report on implementation of various schemes.
c) Directorate of Soil Conservation
The Director is the administrative head of the Soil Conservation Department and
assisted by 20 Soil Conservation officers at the Range level followed by Assistant
19
Soil Conservation officers at the District and sub-division level. The block level is
managed by Junior Soil Conservation Officer (JSCO). Information on implementation
of various
schemes are assimilated at the Directorate level and furnished to the government
every month
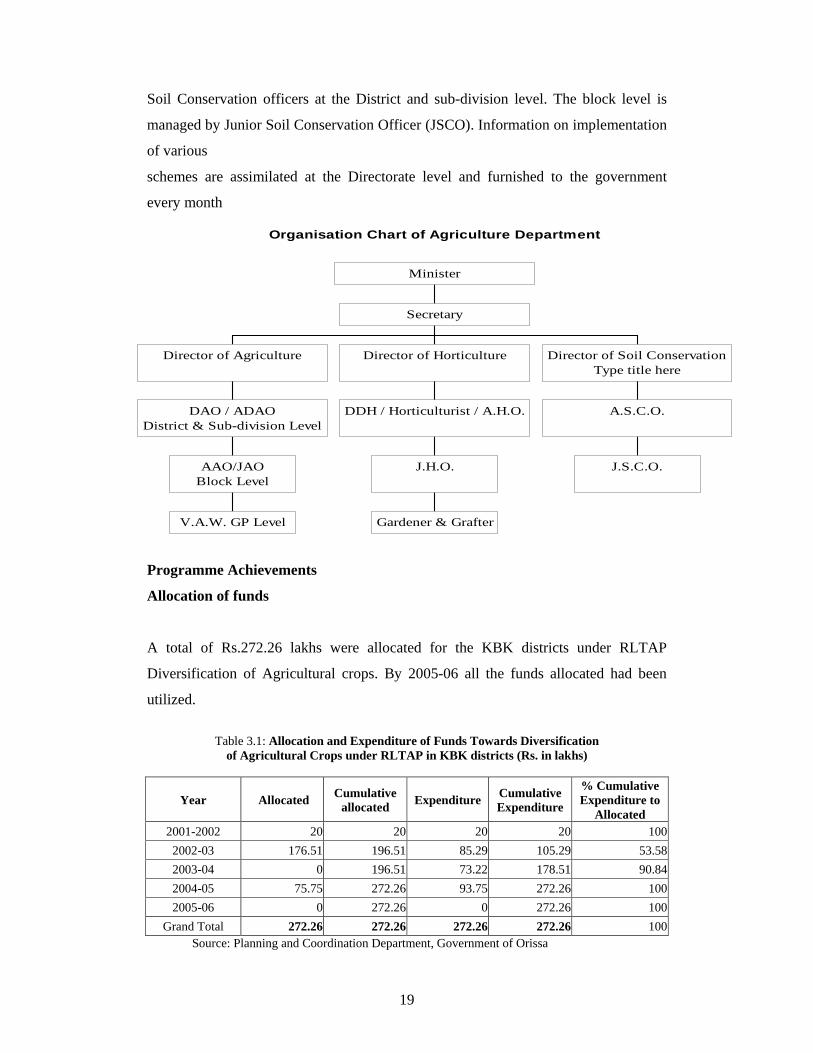
Programme Achievements
Allocation of funds
A total of Rs.272.26 lakhs were allocated for the KBK districts under RLTAP
Diversification of Agricultural crops. By 2005-06 all the funds allocated had been
utilized.
Table 3.1: Allocation and Expenditure of Funds Towards Diversification
of Agricultural Crops under RLTAP in KBK districts (Rs. in lakhs)
Year Allocated Cumulative allocated Expenditure Cumulative
Expenditure
% Cumulative Expenditure to
Allocated 2001-2002 20 20 20 20 1002002-03 176.51 196.51 85.29 105.29 53.582003-04 0 196.51 73.22 178.51 90.842004-05 75.75 272.26 93.75 272.26 1002005-06 0 272.26 0 272.26 100
Grand Total 272.26 272.26 272.26 272.26 100Source: Planning and Coordination Department, Government of Orissa
Organisation Chart of Agriculture Department
V.A.W. GP Level
AAO/JAOBlock Level
DAO / ADAODistrict & Sub-division Level
Director of Agriculture
Gardener & Grafter
J.H.O.
DDH / Horticulturist / A.H.O.
Director of Horticulture
J.S.C.O.
A.S.C.O.
Director of Soil ConservationType title here
Secretary
Minister
20
Cumulatively, 100% of the funds were utilized by 2001-02, 53.58% by 2002-03,
90.84% by 2003-04 and 100% of the funds by 2004-05.
Components under Agriculture Diversification
The components under Agriculture Diversification include opening of (1) Agro
Service Centres, (2) Additional Sales Centre, (3) Crop Demonstration Programme, (4)
Supply of Power Tillers, (5) Supply of Implements to SHGs and (6) Ragi Seed
Exchange Programme.
An attempt has been made to record achievements made under each component.
Agro Service Centre
Agricultural mechanization is a major factor in improving agricultural productivity.
As Orissa’s agriculture in the past was highly under capitalized and under mechanized
it was envisaged that provision of Agro Service Centres will help farmers to have
access to various mechanized services at reduced lower cost per unit of output as
compared to traditional services for cultivation and harvest. These services would
increase productivity of land and labour while helping unemployed educated youth to
provide custom hiring services to farmers and earn income. It will also help in
sensitizing other farmers through demonstration effect about the use of various farm
machineries. Within a span of 5 years (2001-02 to 2005-06) 56 Agro Service Centres
have been opened in the six-surveyed districts of which Sonepur has the highest (23),
followed by Kalahandi (17), Nawarangpur (10), Bolangir (5) and Malkangiri (1). The
amount of subsidy availed per Agro Service Centre is Rs. 2 lakhs out of the total
investment of about 5 lakhs. This subsidy is provided through the Agricultural
Production and Industrial Corporation Limited (APICOL). The eligibility criterion for
opening of Agro Service Centre is that the beneficiary should have a minimum of 10
acres of land. This is a major constraint of this component, as most of the farmers do
not have 10 acres of land and belong to BPL category. Due to this, they are not able to
fulfill the above criterion. Tractors, Power tillers, Rotavetors, Levelers, Water pumps
and other agricultural equipments are supplied to the farmers on rent through these
Centres. For smooth functioning of these Centres beneficiaries need to extend their
21
area of coverage. They also need to build up capacity for the maintenance of
equipment. One of the challenges facing Agro Service Centres is that due to existence
of parallel markets many farmers opt to hire equipment from other places, as the
hiring rates are cheaper than the charges of Agro Service Centres. After the
harvesting season Agro Service Centres become partially redundant as there are not
many farmers availing equipments. However, even if the equipment is not in use,
around 10% of the total cost is required for maintenance. Due to lack of proper
repairing facilities nearby the cost of repair goes up when the equipments are repaired
at distant markets. Delay in sanctioning of loans to beneficiaries by financial
institutions hampers the spread of Agro Service Centres.1
Crop Demonstration Programme
With a view to acquainting farmers with new crops or new ways of growing crops to
increase yield and returns Crop Demonstration Programmes were implemented in
farmers’ fields where farmers experienced for themselves the advantages. Paddy and
ragi are the chief cereals of the tribals of the KBK region. Appropriately, Crop
Demonstration Programmes included paddy, ragi along with moong and, dry-land
oilseed, niger. The demonstration programme was taken up on the basis of 0.5 acre
per beneficiary in the year 2002-03. In the Demonstration Programme HYV seeds
like Khandagiri, Lalata and Swarna were tried. The total number of beneficiaries
under paddy demonstration was 2120 across the six districts with Kalahandi having
the highest (480) and Malkangiri the lowest (200). Thus, in total 1060 acre of land
was under the Demonstration Programme. The total subsidy availed was Rs 10 lakhs
spread over the districts of Kalahandi (Rs 3 lakhs). Malkangiri (Rs 1.21 lakhs),
Nuapada (Rs 1.5 lakhs), Sonepur (Rs 1.62 lakhs) and Nawarangpur (Rs 2.5 lakhs).
Ragi Demonstration was taken up in Kalahandi, Malkangiri and Nawarangpur with
200 beneficiaries in each district. Ragi being the second major food source after
paddy the acceptance of ragi demonstration programmes was high. The traditional
ragi duration is of five months whereas the demonstrated Bhairavi variety is of 3 ½
month duration. Further, the hybrid variety contains 8% to 10% protein in comparison
1 For example, Shri Vishnu Prasad Gupta a beneficiary of Agro Service Centre, took a loan of 1.4 lakhs from State Bank of India (Nawarangpur Branch). Due to delay in the processing of his documents the opening of his Agro Service Centre was delayed by a year.
22
to 6% to 8% in the case of the traditional variety. The net area under ragi
demonstration was 300 acres at 0.5 acre per beneficiary. The total subsidy availed was
around Rs 0.9 lakhs. For increase in production and quality improvement of pulses
moong (green gram) demonstration programme was implemented in all the six
districts. The farmers earlier used to produce local variety of moong with low yield
and returns. The HYV varieties like PDM-11 can suitably replace the local varieties
both in Kharif and Rabi. The Agricultural Department through demonstration
programmes assures the farmers that with about the same expenditure as in the case of
the local variety they will get 120% more production through use of HYV seed
variety. The total number of beneficiaries under moong demonstration was 2330 in
1165 acre of land, half an acre per beneficiary. The total subsidy availed was Rs 4.23
lakhs out of which the highest was availed by Kalahandi (Rs 1.96 lakhs) and the
lowest by Nawarangpur (Rs 0.33 lakhs).
Oilseeds production in the state has been going down during the last decade. In order
to boost production of oilseeds, niger, usually a dryland crop, was rightly chosen for
demonstration. The total number of beneficiaries under niger demonstration was 400
the highest being in Kalahandi (200) followed by Malkangiri (75), Nawarangpur (75)
and Nuapada (50). A total of Rs 0.93 lakhs was availed as subsidy across all the
districts in which niger demonstration was taken up.
These demonstration programmes were primarily aimed at the introduction of high
yielding varieties of crops. The programmes also highlighted the use of fertilizers,
pesticides and demonstrated improved cropping pattern. Though these programmes
have been effective to an extent, lack of follow up provision of HYV seeds,
propagation by extension officials, and non-record of demonstration results and its
dissemination did not help in increasing substantial area under these crops. It is vital
to continue these programmes for successive years so that the beneficiaries do not
revert back to use of traditional varieties.
Supply of Power Tiller
Power Tillers have been supplied to the SC/ST farmers at a subsidized rate of 50%
(25% RLTAP + 25% Work Plan, Agriculture Department) to improve production and
23
save money and time. An estimate based on discussion with farmers has shown that
ploughing of 1 acre of land by bullocks (including labour charges) costs Rs 600. In
the case of power tiller this cost comes to Rs 450 with better tillage. A total of 208
power tillers have been supplied across all the six districts during 2001-02 to 2005-06
with Kalahandi (57), Bolangir (11), Malkangiri (16), Sonepur (85) Nawarangpur (29)
and Nuapada (10). The total subsidy availed across all the six districts was Rs 94.77
lakhs out of which Rs 30.89 lakhs was availed by Kalahandi and Rs 44.66 lakhs by
Sonepur. Due to very poor financial condition tribal farmers are not able to avail
power tillers at even a subsidized rate. Therefore it is necessary to make changes in
the financing pattern so that the tribal farmers in groups can approach for bank loan
and avail subsidy to purchase power tillers. They also need training to maintain the
equipment. In this regard a maintenance programme is likely to be effective.
Supply of Agricultural Implements to SHGs
A number of SHGs are functioning actively in all KBK districts. The Agriculture
Department provides to some of these SHGs implements such as Power Thresher cum
Winnowers, Low-lift Hand Pumps, Hand-Winnowers, Power Sprayers, Hand
Compression Sprayers, Puddlers, and Pulse Threshers at subsidized rates. The SHGs
contribute 5% of the total cost (Rs 51500) i.e. Rs 2575. Out of these some implements
such as Power Sprayers are not used very widely due to inadequate knowledge and
low scale operations. All the implements supplied have the benefits of saving time,
cost, labour and have extensive working capacity. SHGs provide these implements to
farmers in their operating area on a rental basis. Thus by giving SHGs the charge of
these implements the Agricultural Department has been successful in providing
implement facility to farmers at affordable prices and intensify implement use. 444
beneficiaries have benefited under this scheme. 100 sets of implements including
Power Threshers, Hand Pumps, Hand Winnowers, Power Sprayers, Hand
Compression Sprayers, and Pulse and Pedal Threshers were distributed between
2001/02 to 2005/06. In terms of numbers Kalahandi accounted for the highest (30) set
of implements followed by Bolangir (20), Malkangiri (20), Nawarangpur (20) and
Sonepur (10). Total subsidy availed under this component was Rs 47.91 lakhs. It has
been observed in the above-mentioned districts that these implements were well
maintained by the SHGs. As the equipments relate to seasonal use, from discussions
24
with beneficiaries as well as SHGs, it was learnt that capacity utilization of these
equipments is very high, nearly 100%. This is a highly successful scheme.
Ragi Seeds Exchange
Ragi is an important staple food specifically for the tribal people. The Agriculture
Department exchanges HYV variety of ragi i.e. Bhairavi with the traditional variety
grown by farmers. The period to maturity of the hybrid variety is shorter and the
protein content is higher in comparison to the traditional variety. The total number of
beneficiaries covered under this component was highest in the year 2004-05 (3829)
followed by 2003-04 (3161). A total of 9288 farmers have benefited from this
exchange process from 2001-02 to 2005-06. Out of this total the highest number of
beneficiaries was in Kalahandi (4052) followed by Nawarangpur (2906), Malkangiri
(1881), Sonepur (284) and Bolangir (165). The total subsidy availed was Rs 3.59
lakhs. However, farmers have reverted back to traditional varieties within a year or
two of the exchange programme due to improper follow-up. The yield rate reverts
back to the previous level.
Opening of Additional Sales Centre
Agriculture Department provides seeds to the farmers through additional sales
centres. A total of 57 Additional Sales Centres were opened between 2003-04 and
2005-06 in Bolangir, Nuapada, Sonepur and Kalahandi. No Additional Sales Centre
was opened in Malkangiri. The subsidy availed per Sales Centre was Rs 10000. The
total subsidy availed amounted to Rs 5.7 lakhs. The district wise distribution of total
subsidy was Rs 1.4 lakhs, Rs 1.3 lakhs, Rs 1.2 lakhs and Rs 1.8 lakhs in the cases
Bolangir, Nuapada, Sonepur and Kalahandi respectively. It has been found that the
number of Sales Centres is not enough to fulfill the demands of the farmers. However,
the Sales Centres have been able to meet the requirement of approximately 15-20
farmers requiring quality seeds. The impact of the components implemented have
been analyzed in the next chapter. (for details see Annexure 3.1)
25
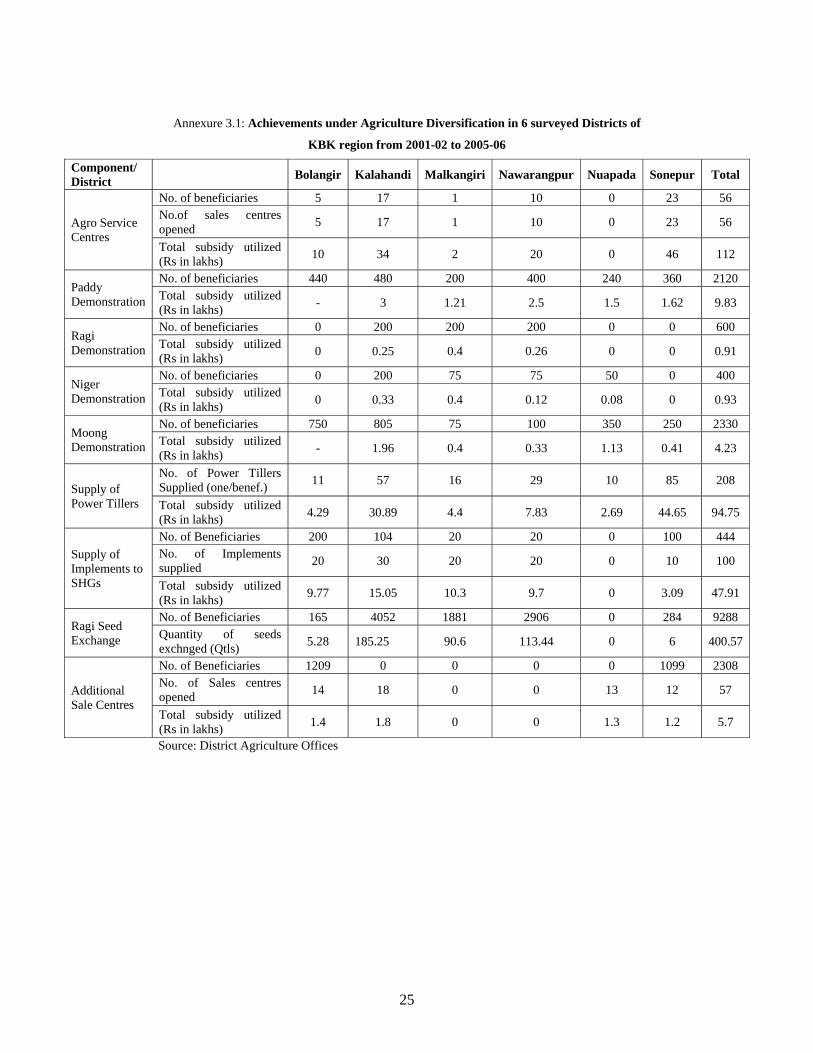
Annexure 3.1: Achievements under Agriculture Diversification in 6 surveyed Districts of
KBK region from 2001-02 to 2005-06
Component/ District Bolangir Kalahandi Malkangiri Nawarangpur Nuapada Sonepur Total
Agro Service Centres
No. of beneficiaries 5 17 1 10 0 23 56 No.of sales centres opened 5 17 1 10 0 23 56
Total subsidy utilized (Rs in lakhs) 10 34 2 20 0 46 112
Paddy Demonstration
No. of beneficiaries 440 480 200 400 240 360 2120 Total subsidy utilized (Rs in lakhs) - 3 1.21 2.5 1.5 1.62 9.83
Ragi Demonstration
No. of beneficiaries 0 200 200 200 0 0 600 Total subsidy utilized (Rs in lakhs) 0 0.25 0.4 0.26 0 0 0.91
Niger Demonstration
No. of beneficiaries 0 200 75 75 50 0 400 Total subsidy utilized (Rs in lakhs) 0 0.33 0.4 0.12 0.08 0 0.93
Moong Demonstration
No. of beneficiaries 750 805 75 100 350 250 2330 Total subsidy utilized (Rs in lakhs) - 1.96 0.4 0.33 1.13 0.41 4.23
Supply of Power Tillers
No. of Power Tillers Supplied (one/benef.) 11 57 16 29 10 85 208
Total subsidy utilized (Rs in lakhs) 4.29 30.89 4.4 7.83 2.69 44.65 94.75
Supply of Implements to SHGs
No. of Beneficiaries 200 104 20 20 0 100 444 No. of Implements supplied 20 30 20 20 0 10 100
Total subsidy utilized (Rs in lakhs) 9.77 15.05 10.3 9.7 0 3.09 47.91
Ragi Seed Exchange
No. of Beneficiaries 165 4052 1881 2906 0 284 9288 Quantity of seeds exchnged (Qtls) 5.28 185.25 90.6 113.44 0 6 400.57
Additional Sale Centres
No. of Beneficiaries 1209 0 0 0 0 1099 2308 No. of Sales centres opened 14 18 0 0 13 12 57
Total subsidy utilized (Rs in lakhs) 1.4 1.8 0 0 1.3 1.2 5.7
Source: District Agriculture Offices
26
CHAPTER 4
IMPACT OF DIVERSIFICATION Ideally impact of a programme should be assessed independent of influence of other
concurrent programmes/schemes being implemented in the same area. However, it is
difficult to isolate the impact of a particular programme in question when the multi-
colinearity among programmes is high. If a number of programmes of a particular genre are
being implemented simultaneously within a region, the impact of the programme concerned
will certainly be influenced and the additional benefits before and after programme
implementation will show the direction of the impact. Agricultural diversification is not
independent of watershed development, irrigation, general extension improvement and
better planning and implementation of all agriculture related components ongoing in KBK
project area. The assessment therefore makes an attempt to estimate the overall impact on
beneficiaries of Agricultural Diversification. The following analysis highlights positive
indicators in terms of diversification and provides an overall assessment of the impact of
the programme.
Changes that have occurred in crop composition, area coverage, yield, output and value of
output in respect of beneficiaries and non-beneficiaries are analyzed for all the six districts
taken together as well as for individual districts. Input intensification and cost of
production, additional net income accrual from agriculture and from all household activities
associated with the above changes are also analyzed for measuring total impact of the
programme on beneficiaries and the demonstration effect changes in respect of
beneficiaries. To facilitate understanding, season-wise analysis has been preferred.
Seasons and Crop Diversification
The major crops grown across all the six surveyed districts of the KBK region are paddy,
ragi and maize in terms of cereals and biri, kulthi and moong in the case of pulses. Paddy
cultivation dominates the cropping pattern to such an extent that achievements made in
terms of diversification sometimes become overshadowed due to the small weightage of
crops diversified into. Diversification towards commercial crops has taken place in the
form of groundnut, cotton and sugarcane. From the primary sample survey cotton emerges
as a crop with high value per unit but its production is limited to mainly two KBK districts
Bolangir and Kalahandi.
27
Kharif
The highlighting feature of cultivation in terms of cereals among beneficiaries in the Kharif
season is marked by a decline in the area, production and yield rate of ragi and
diversification towards paddy. This is hard to understand when we take into perspective
that ragi is covered under two components of the Crop Diversification Programme i.e. Ragi
Seed Exchange Programme and Ragi Crop Demonstration Programme. One primary reason
for this is the low level of acceptance of high yielding varieties provided by the Agriculture
Department. The tribals do not find hybrid varieties of ragi palatable in comparison to the
traditional varieties. The price in the market for high yielding variety is not very
remunerative. Further, although the Crop Demonstration Programme was undertaken in the
year 2002-03, the benefits that would accrue in that period or in subsequent period have not
continued up to the present period. Farmers also find that paddy cultivation is slightly more
remunerative than ragi cultivation. The area under ragi was only 7.67% of the area under
paddy pre-implementation which has decreased to 4.11% of the area under paddy at
present. So, in terms of coverage ragi does not influence the net cereal production to a high
extent. Consequently, the value of output in terms cereals has gone up by about 44%.
Among the major pulses comprising of arhar, biri, moong and chana there has not been a
very significant change in terms of area under cultivation in the surveyed districts as a
whole. However, the yield rates of all the pulses have gone up leading to a 50% increase in
value of output.
One of the most positive changes seen is the diversification of new area brought under
cultivation towards cotton. Among the sample households the area under cultivation has
gone up from a mere 3 hectares to about 40 hectares. This change is most prominent in
Bolangir and Kalahandi. Among oilseeds the area under til has gone up by 24%. Though
the area under groundnut has gone down, the yield has increased by 61%. This inclination
towards til over groundnut is also commensurate with the district figures where the area
under groundnut between 2001-02 and 2004-05 has increased from 52000 hectares to
58000 hectares whereas in the case of til the area has increased from 82000 hectares to
100000 hectares among the six surveyed districts. Sugarcane has also increased in terms of
area and yield. A positive impact of the various programmes undertaken by the Agriculture
Department is an increase in the yield rates of most of the crops.
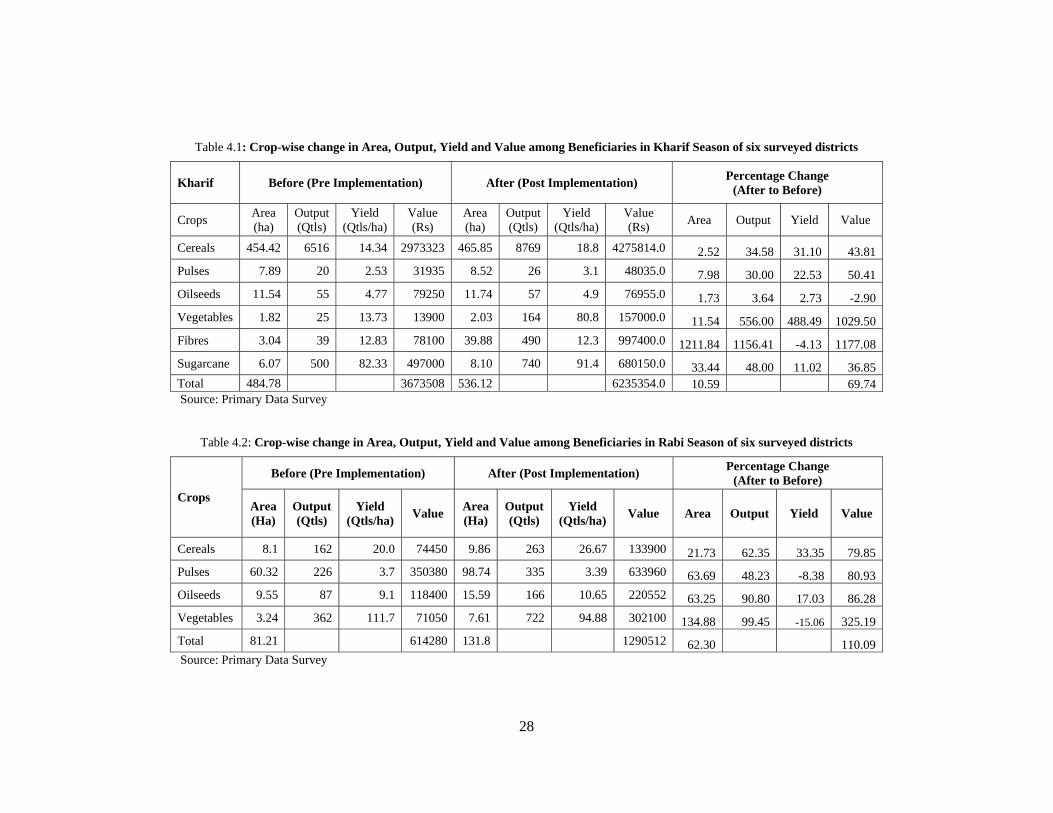
28
Table 4.1: Crop-wise change in Area, Output, Yield and Value among Beneficiaries in Kharif Season of six surveyed districts
Kharif Before (Pre Implementation) After (Post Implementation) Percentage Change (After to Before)
Crops Area (ha)
Output (Qtls)
Yield (Qtls/ha)
Value (Rs)
Area (ha)
Output (Qtls)
Yield (Qtls/ha)
Value (Rs) Area Output Yield Value
Cereals 454.42 6516 14.34 2973323 465.85 8769 18.8 4275814.0 2.52 34.58 31.10 43.81 Pulses 7.89 20 2.53 31935 8.52 26 3.1 48035.0 7.98 30.00 22.53 50.41 Oilseeds 11.54 55 4.77 79250 11.74 57 4.9 76955.0 1.73 3.64 2.73 -2.90 Vegetables 1.82 25 13.73 13900 2.03 164 80.8 157000.0 11.54 556.00 488.49 1029.50Fibres 3.04 39 12.83 78100 39.88 490 12.3 997400.0 1211.84 1156.41 -4.13 1177.08 Sugarcane 6.07 500 82.33 497000 8.10 740 91.4 680150.0 33.44 48.00 11.02 36.85 Total 484.78 3673508 536.12 6235354.0 10.59 69.74 Source: Primary Data Survey
Table 4.2: Crop-wise change in Area, Output, Yield and Value among Beneficiaries in Rabi Season of six surveyed districts
Crops
Before (Pre Implementation) After (Post Implementation) Percentage Change (After to Before)
Area (Ha)
Output (Qtls)
Yield (Qtls/ha) Value Area
(Ha) Output (Qtls)
Yield (Qtls/ha) Value Area Output Yield Value
Cereals 8.1 162 20.0 74450 9.86 263 26.67 133900 21.73 62.35 33.35 79.85 Pulses 60.32 226 3.7 350380 98.74 335 3.39 633960 63.69 48.23 -8.38 80.93 Oilseeds 9.55 87 9.1 118400 15.59 166 10.65 220552 63.25 90.80 17.03 86.28 Vegetables 3.24 362 111.7 71050 7.61 722 94.88 302100 134.88 99.45 -15.06 325.19 Total 81.21 614280 131.8 1290512 62.30 110.09 Source: Primary Data Survey
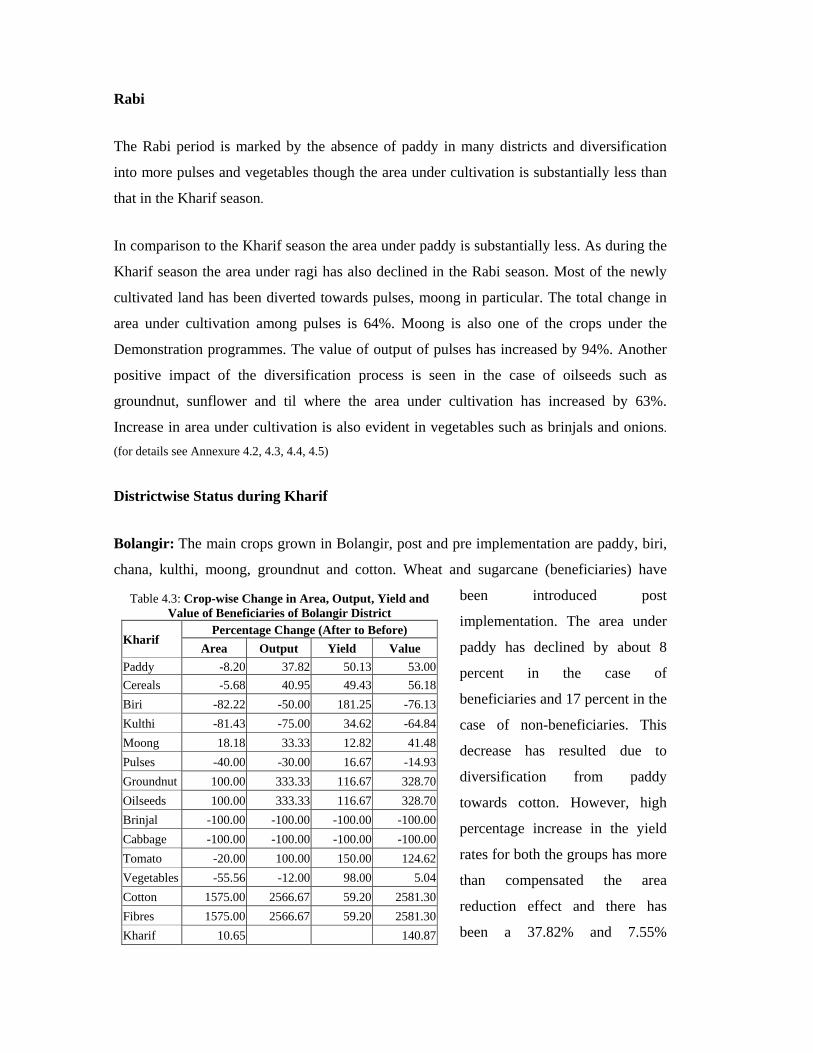
Rabi
The Rabi period is marked by the absence of paddy in many districts and diversification
into more pulses and vegetables though the area under cultivation is substantially less than
that in the Kharif season.
In comparison to the Kharif season the area under paddy is substantially less. As during the
Kharif season the area under ragi has also declined in the Rabi season. Most of the newly
cultivated land has been diverted towards pulses, moong in particular. The total change in
area under cultivation among pulses is 64%. Moong is also one of the crops under the
Demonstration programmes. The value of output of pulses has increased by 94%. Another
positive impact of the diversification process is seen in the case of oilseeds such as
groundnut, sunflower and til where the area under cultivation has increased by 63%.
Increase in area under cultivation is also evident in vegetables such as brinjals and onions.
(for details see Annexure 4.2, 4.3, 4.4, 4.5)
Districtwise Status during Kharif
Bolangir: The main crops grown in Bolangir, post and pre implementation are paddy, biri,
chana, kulthi, moong, groundnut and cotton. Wheat and sugarcane (beneficiaries) have
been introduced post
implementation. The area under
paddy has declined by about 8
percent in the case of
beneficiaries and 17 percent in the
case of non-beneficiaries. This
decrease has resulted due to
diversification from paddy
towards cotton. However, high
percentage increase in the yield
rates for both the groups has more
than compensated the area
reduction effect and there has
been a 37.82% and 7.55%
Table 4.3: Crop-wise Change in Area, Output, Yield and Value of Beneficiaries of Bolangir District
Kharif Percentage Change (After to Before)
Area Output Yield Value Paddy -8.20 37.82 50.13 53.00Cereals -5.68 40.95 49.43 56.18Biri -82.22 -50.00 181.25 -76.13Kulthi -81.43 -75.00 34.62 -64.84Moong 18.18 33.33 12.82 41.48Pulses -40.00 -30.00 16.67 -14.93Groundnut 100.00 333.33 116.67 328.70Oilseeds 100.00 333.33 116.67 328.70Brinjal -100.00 -100.00 -100.00 -100.00Cabbage -100.00 -100.00 -100.00 -100.00Tomato -20.00 100.00 150.00 124.62Vegetables -55.56 -12.00 98.00 5.04Cotton 1575.00 2566.67 59.20 2581.30Fibres 1575.00 2566.67 59.20 2581.30Kharif 10.65 140.87
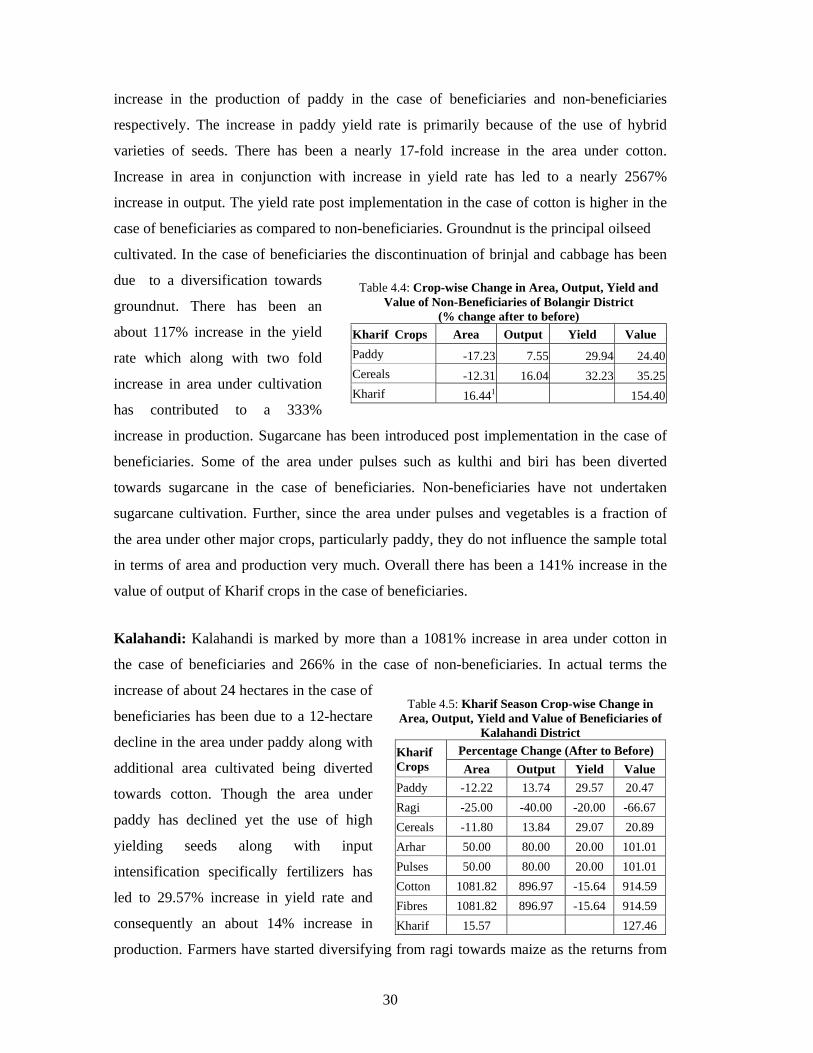
30
Table 4.4: Crop-wise Change in Area, Output, Yield and Value of Non-Beneficiaries of Bolangir District
(% change after to before) Kharif Crops Area Output Yield Value Paddy -17.23 7.55 29.94 24.40Cereals -12.31 16.04 32.23 35.25Kharif 16.441 154.40
increase in the production of paddy in the case of beneficiaries and non-beneficiaries
respectively. The increase in paddy yield rate is primarily because of the use of hybrid
varieties of seeds. There has been a nearly 17-fold increase in the area under cotton.
Increase in area in conjunction with increase in yield rate has led to a nearly 2567%
increase in output. The yield rate post implementation in the case of cotton is higher in the
case of beneficiaries as compared to non-beneficiaries. Groundnut is the principal oilseed
cultivated. In the case of beneficiaries the discontinuation of brinjal and cabbage has been
due to a diversification towards
groundnut. There has been an
about 117% increase in the yield
rate which along with two fold
increase in area under cultivation
has contributed to a 333%
increase in production. Sugarcane has been introduced post implementation in the case of
beneficiaries. Some of the area under pulses such as kulthi and biri has been diverted
towards sugarcane in the case of beneficiaries. Non-beneficiaries have not undertaken
sugarcane cultivation. Further, since the area under pulses and vegetables is a fraction of
the area under other major crops, particularly paddy, they do not influence the sample total
in terms of area and production very much. Overall there has been a 141% increase in the
value of output of Kharif crops in the case of beneficiaries.
Kalahandi: Kalahandi is marked by more than a 1081% increase in area under cotton in
the case of beneficiaries and 266% in the case of non-beneficiaries. In actual terms the
increase of about 24 hectares in the case of
beneficiaries has been due to a 12-hectare
decline in the area under paddy along with
additional area cultivated being diverted
towards cotton. Though the area under
paddy has declined yet the use of high
yielding seeds along with input
intensification specifically fertilizers has
led to 29.57% increase in yield rate and
consequently an about 14% increase in
production. Farmers have started diversifying from ragi towards maize as the returns from
Table 4.5: Kharif Season Crop-wise Change in Area, Output, Yield and Value of Beneficiaries of
Kalahandi District Kharif Crops
Percentage Change (After to Before) Area Output Yield Value
Paddy -12.22 13.74 29.57 20.47 Ragi -25.00 -40.00 -20.00 -66.67 Cereals -11.80 13.84 29.07 20.89 Arhar 50.00 80.00 20.00 101.01 Pulses 50.00 80.00 20.00 101.01 Cotton 1081.82 896.97 -15.64 914.59 Fibres 1081.82 896.97 -15.64 914.59 Kharif 15.57 127.46
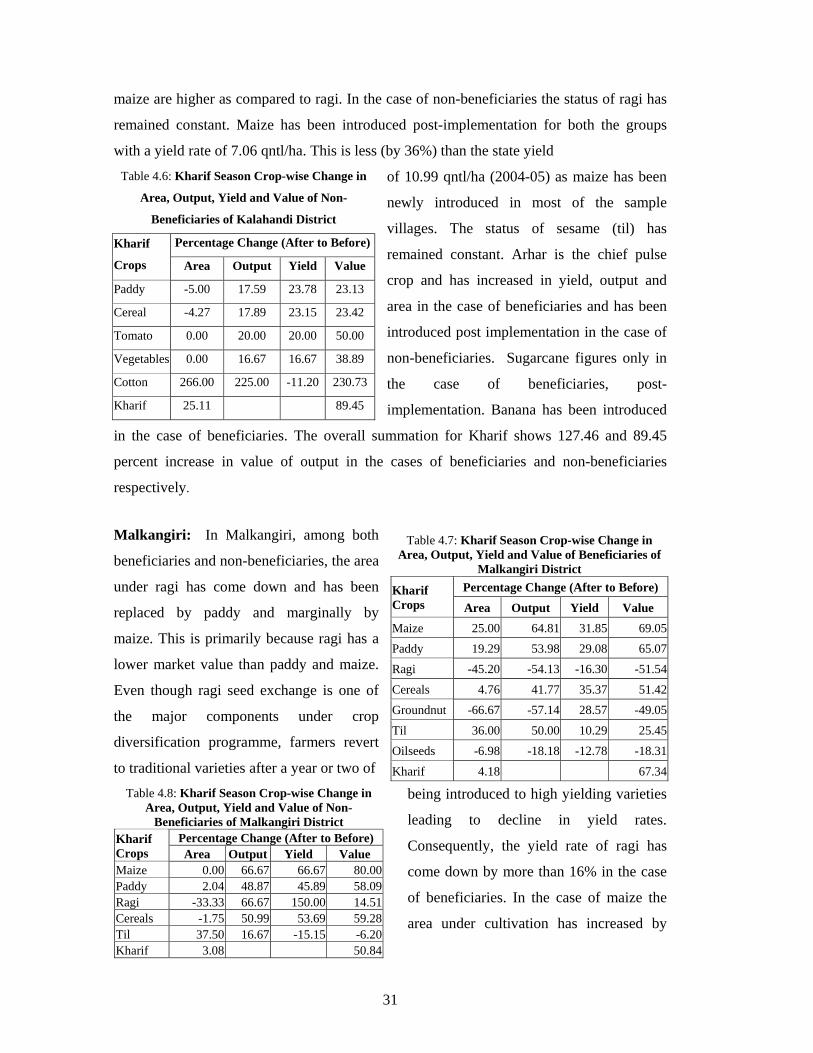
31
Table 4.8: Kharif Season Crop-wise Change in Area, Output, Yield and Value of Non-
Beneficiaries of Malkangiri District Kharif Crops
Percentage Change (After to Before) Area Output Yield Value
Maize 0.00 66.67 66.67 80.00Paddy 2.04 48.87 45.89 58.09Ragi -33.33 66.67 150.00 14.51Cereals -1.75 50.99 53.69 59.28Til 37.50 16.67 -15.15 -6.20Kharif 3.08 50.84
maize are higher as compared to ragi. In the case of non-beneficiaries the status of ragi has
remained constant. Maize has been introduced post-implementation for both the groups
with a yield rate of 7.06 qntl/ha. This is less (by 36%) than the state yield
of 10.99 qntl/ha (2004-05) as maize has been
newly introduced in most of the sample
villages. The status of sesame (til) has
remained constant. Arhar is the chief pulse
crop and has increased in yield, output and
area in the case of beneficiaries and has been
introduced post implementation in the case of
non-beneficiaries. Sugarcane figures only in
the case of beneficiaries, post-
implementation. Banana has been introduced
in the case of beneficiaries. The overall summation for Kharif shows 127.46 and 89.45
percent increase in value of output in the cases of beneficiaries and non-beneficiaries
respectively.
Malkangiri: In Malkangiri, among both
beneficiaries and non-beneficiaries, the area
under ragi has come down and has been
replaced by paddy and marginally by
maize. This is primarily because ragi has a
lower market value than paddy and maize.
Even though ragi seed exchange is one of
the major components under crop
diversification programme, farmers revert
to traditional varieties after a year or two of
being introduced to high yielding varieties
leading to decline in yield rates.
Consequently, the yield rate of ragi has
come down by more than 16% in the case
of beneficiaries. In the case of maize the
area under cultivation has increased by
Table 4.6: Kharif Season Crop-wise Change in
Area, Output, Yield and Value of Non-
Beneficiaries of Kalahandi District
Kharif
Crops
Percentage Change (After to Before)
Area Output Yield Value
Paddy -5.00 17.59 23.78 23.13
Cereal -4.27 17.89 23.15 23.42
Tomato 0.00 20.00 20.00 50.00
Vegetables 0.00 16.67 16.67 38.89
Cotton 266.00 225.00 -11.20 230.73
Kharif 25.11 89.45
Table 4.7: Kharif Season Crop-wise Change in Area, Output, Yield and Value of Beneficiaries of
Malkangiri District
Kharif Crops
Percentage Change (After to Before) Area Output Yield Value
Maize 25.00 64.81 31.85 69.05Paddy 19.29 53.98 29.08 65.07Ragi -45.20 -54.13 -16.30 -51.54Cereals 4.76 41.77 35.37 51.42Groundnut -66.67 -57.14 28.57 -49.05Til 36.00 50.00 10.29 25.45Oilseeds -6.98 -18.18 -12.78 -18.31Kharif 4.18 67.34
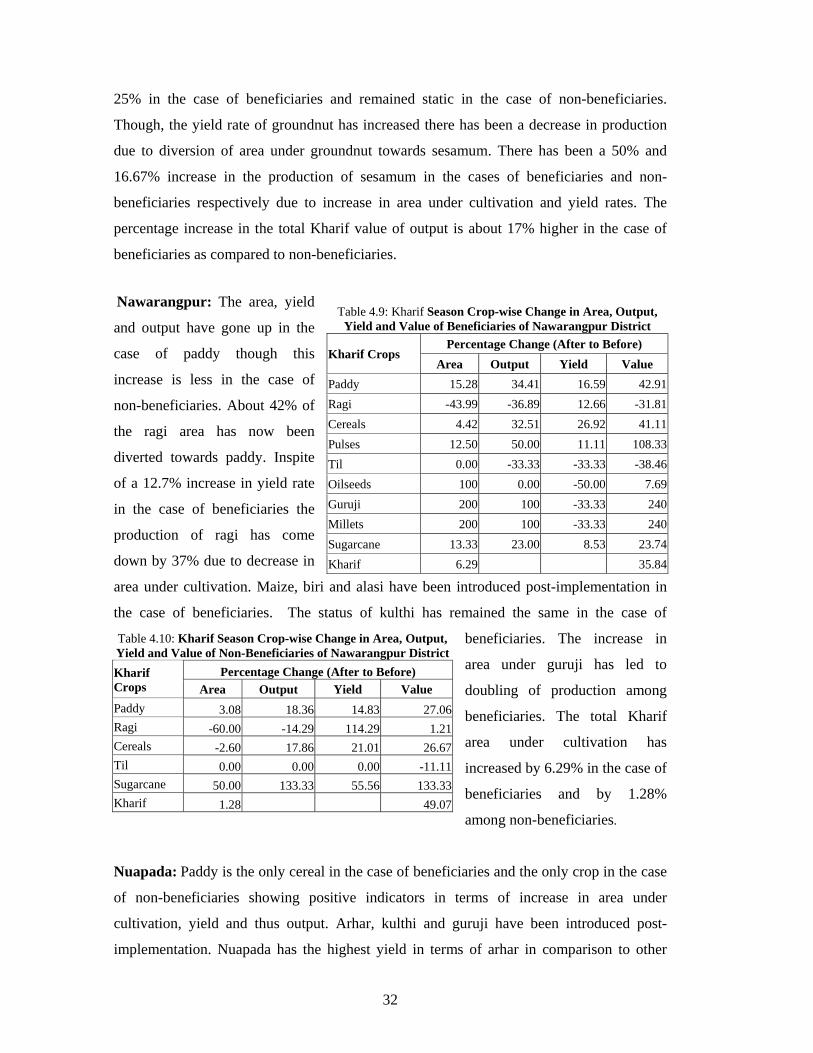
32
25% in the case of beneficiaries and remained static in the case of non-beneficiaries.
Though, the yield rate of groundnut has increased there has been a decrease in production
due to diversion of area under groundnut towards sesamum. There has been a 50% and
16.67% increase in the production of sesamum in the cases of beneficiaries and non-
beneficiaries respectively due to increase in area under cultivation and yield rates. The
percentage increase in the total Kharif value of output is about 17% higher in the case of
beneficiaries as compared to non-beneficiaries.
Nawarangpur: The area, yield
and output have gone up in the
case of paddy though this
increase is less in the case of
non-beneficiaries. About 42% of
the ragi area has now been
diverted towards paddy. Inspite
of a 12.7% increase in yield rate
in the case of beneficiaries the
production of ragi has come
down by 37% due to decrease in
area under cultivation. Maize, biri and alasi have been introduced post-implementation in
the case of beneficiaries. The status of kulthi has remained the same in the case of
beneficiaries. The increase in
area under guruji has led to
doubling of production among
beneficiaries. The total Kharif
area under cultivation has
increased by 6.29% in the case of
beneficiaries and by 1.28%
among non-beneficiaries.
Nuapada: Paddy is the only cereal in the case of beneficiaries and the only crop in the case
of non-beneficiaries showing positive indicators in terms of increase in area under
cultivation, yield and thus output. Arhar, kulthi and guruji have been introduced post-
implementation. Nuapada has the highest yield in terms of arhar in comparison to other
Table 4.9: Kharif Season Crop-wise Change in Area, Output, Yield and Value of Beneficiaries of Nawarangpur District
Kharif Crops Percentage Change (After to Before)
Area Output Yield Value Paddy 15.28 34.41 16.59 42.91Ragi -43.99 -36.89 12.66 -31.81Cereals 4.42 32.51 26.92 41.11Pulses 12.50 50.00 11.11 108.33Til 0.00 -33.33 -33.33 -38.46Oilseeds 100 0.00 -50.00 7.69Guruji 200 100 -33.33 240Millets 200 100 -33.33 240Sugarcane 13.33 23.00 8.53 23.74Kharif 6.29 35.84
Table 4.10: Kharif Season Crop-wise Change in Area, Output, Yield and Value of Non-Beneficiaries of Nawarangpur DistrictKharif Crops
Percentage Change (After to Before)Area Output Yield Value
Paddy 3.08 18.36 14.83 27.06Ragi -60.00 -14.29 114.29 1.21Cereals -2.60 17.86 21.01 26.67Til 0.00 0.00 0.00 -11.11Sugarcane 50.00 133.33 55.56 133.33Kharif 1.28 49.07
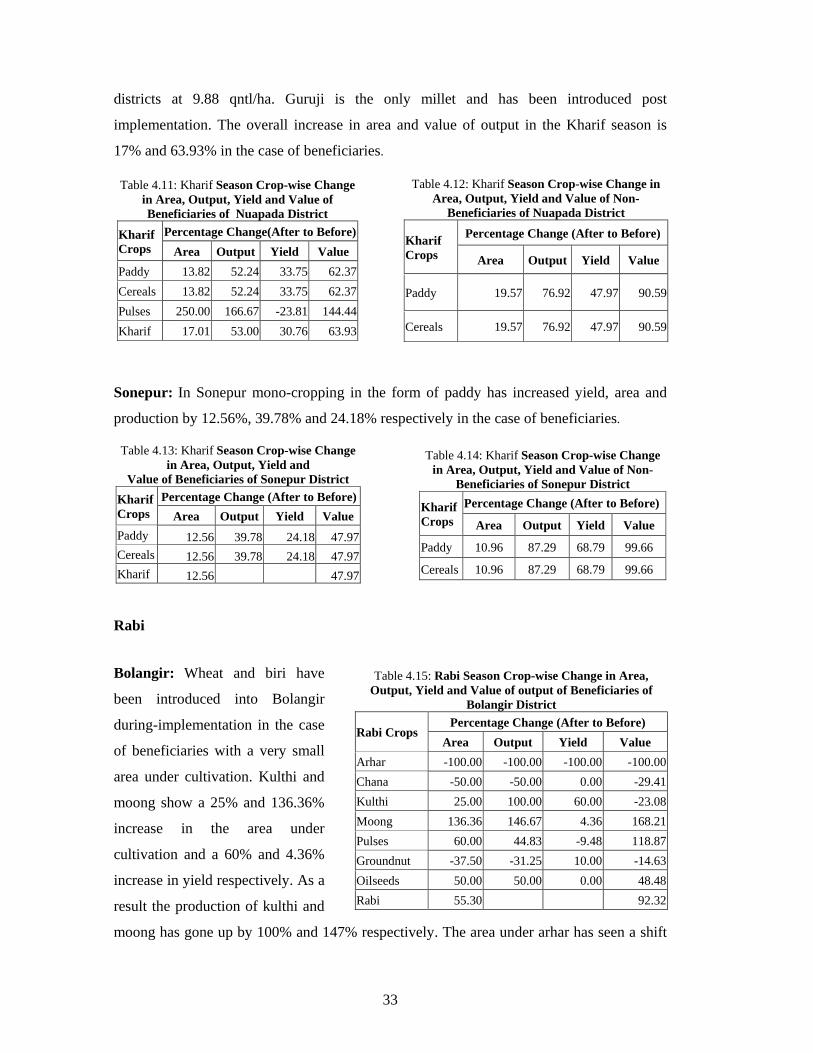
33
Table 4.15: Rabi Season Crop-wise Change in Area, Output, Yield and Value of output of Beneficiaries of
Bolangir District
Rabi Crops Percentage Change (After to Before)
Area Output Yield Value Arhar -100.00 -100.00 -100.00 -100.00Chana -50.00 -50.00 0.00 -29.41Kulthi 25.00 100.00 60.00 -23.08Moong 136.36 146.67 4.36 168.21Pulses 60.00 44.83 -9.48 118.87Groundnut -37.50 -31.25 10.00 -14.63Oilseeds 50.00 50.00 0.00 48.48Rabi 55.30 92.32
districts at 9.88 qntl/ha. Guruji is the only millet and has been introduced post
implementation. The overall increase in area and value of output in the Kharif season is
17% and 63.93% in the case of beneficiaries.
Sonepur: In Sonepur mono-cropping in the form of paddy has increased yield, area and
production by 12.56%, 39.78% and 24.18% respectively in the case of beneficiaries.
Rabi
Bolangir: Wheat and biri have
been introduced into Bolangir
during-implementation in the case
of beneficiaries with a very small
area under cultivation. Kulthi and
moong show a 25% and 136.36%
increase in the area under
cultivation and a 60% and 4.36%
increase in yield respectively. As a
result the production of kulthi and
moong has gone up by 100% and 147% respectively. The area under arhar has seen a shift
Table 4.11: Kharif Season Crop-wise Change in Area, Output, Yield and Value of Beneficiaries of Nuapada District
Kharif Crops
Percentage Change(After to Before)Area Output Yield Value
Paddy 13.82 52.24 33.75 62.37Cereals 13.82 52.24 33.75 62.37Pulses 250.00 166.67 -23.81 144.44Kharif 17.01 53.00 30.76 63.93
Table 4.12: Kharif Season Crop-wise Change in Area, Output, Yield and Value of Non-
Beneficiaries of Nuapada District
Kharif Crops
Percentage Change (After to Before)
Area Output Yield Value
Paddy 19.57 76.92 47.97 90.59
Cereals 19.57 76.92 47.97 90.59
Table 4.13: Kharif Season Crop-wise Change in Area, Output, Yield and
Value of Beneficiaries of Sonepur District Kharif Crops
Percentage Change (After to Before)Area Output Yield Value
Paddy 12.56 39.78 24.18 47.97Cereals 12.56 39.78 24.18 47.97Kharif 12.56 47.97
Table 4.14: Kharif Season Crop-wise Change in Area, Output, Yield and Value of Non-
Beneficiaries of Sonepur District
Kharif Crops
Percentage Change (After to Before)
Area Output Yield Value
Paddy 10.96 87.29 68.79 99.66
Cereals 10.96 87.29 68.79 99.66
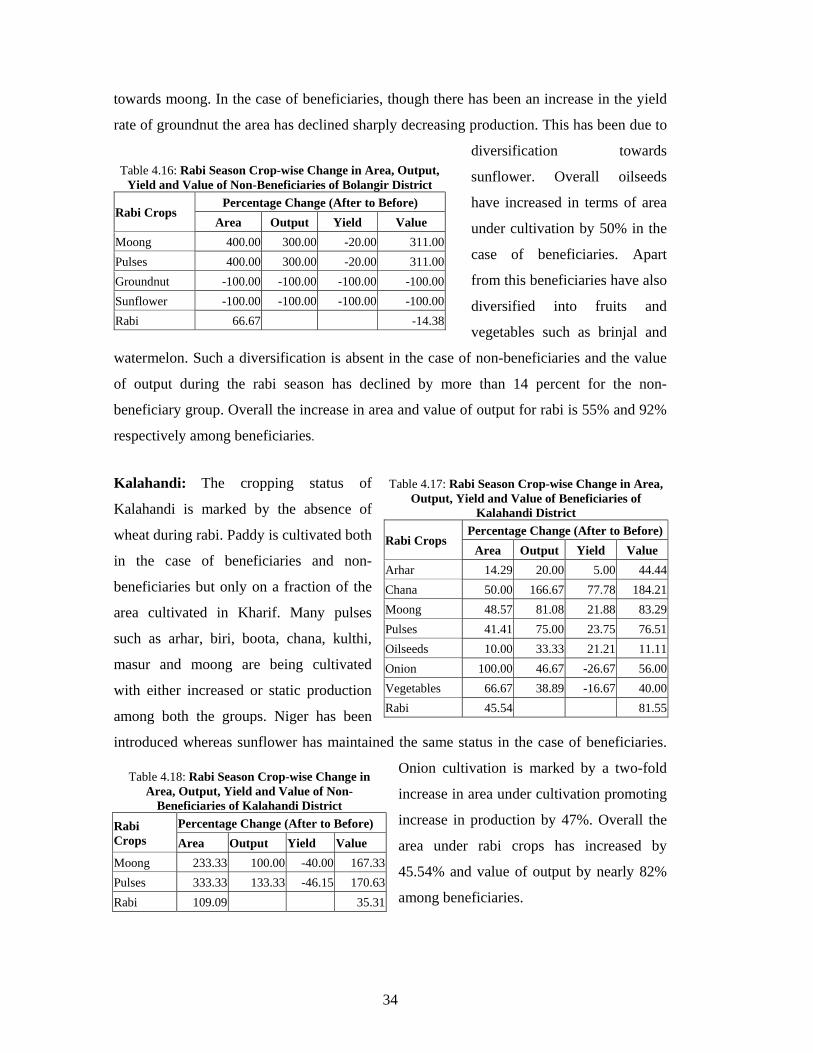
34
Table 4.16: Rabi Season Crop-wise Change in Area, Output, Yield and Value of Non-Beneficiaries of Bolangir District
Rabi Crops Percentage Change (After to Before)
Area Output Yield Value Moong 400.00 300.00 -20.00 311.00Pulses 400.00 300.00 -20.00 311.00Groundnut -100.00 -100.00 -100.00 -100.00Sunflower -100.00 -100.00 -100.00 -100.00Rabi 66.67 -14.38
towards moong. In the case of beneficiaries, though there has been an increase in the yield
rate of groundnut the area has declined sharply decreasing production. This has been due to
diversification towards
sunflower. Overall oilseeds
have increased in terms of area
under cultivation by 50% in the
case of beneficiaries. Apart
from this beneficiaries have also
diversified into fruits and
vegetables such as brinjal and
watermelon. Such a diversification is absent in the case of non-beneficiaries and the value
of output during the rabi season has declined by more than 14 percent for the non-
beneficiary group. Overall the increase in area and value of output for rabi is 55% and 92%
respectively among beneficiaries.
Kalahandi: The cropping status of
Kalahandi is marked by the absence of
wheat during rabi. Paddy is cultivated both
in the case of beneficiaries and non-
beneficiaries but only on a fraction of the
area cultivated in Kharif. Many pulses
such as arhar, biri, boota, chana, kulthi,
masur and moong are being cultivated
with either increased or static production
among both the groups. Niger has been
introduced whereas sunflower has maintained the same status in the case of beneficiaries.
Onion cultivation is marked by a two-fold
increase in area under cultivation promoting
increase in production by 47%. Overall the
area under rabi crops has increased by
45.54% and value of output by nearly 82%
among beneficiaries.
Table 4.17: Rabi Season Crop-wise Change in Area, Output, Yield and Value of Beneficiaries of
Kalahandi District
Rabi Crops Percentage Change (After to Before)
Area Output Yield Value Arhar 14.29 20.00 5.00 44.44Chana 50.00 166.67 77.78 184.21Moong 48.57 81.08 21.88 83.29Pulses 41.41 75.00 23.75 76.51Oilseeds 10.00 33.33 21.21 11.11Onion 100.00 46.67 -26.67 56.00Vegetables 66.67 38.89 -16.67 40.00Rabi 45.54 81.55
Table 4.18: Rabi Season Crop-wise Change in Area, Output, Yield and Value of Non-
Beneficiaries of Kalahandi DistrictRabi Crops
Percentage Change (After to Before) Area Output Yield Value
Moong 233.33 100.00 -40.00 167.33Pulses 333.33 133.33 -46.15 170.63Rabi 109.09 35.31
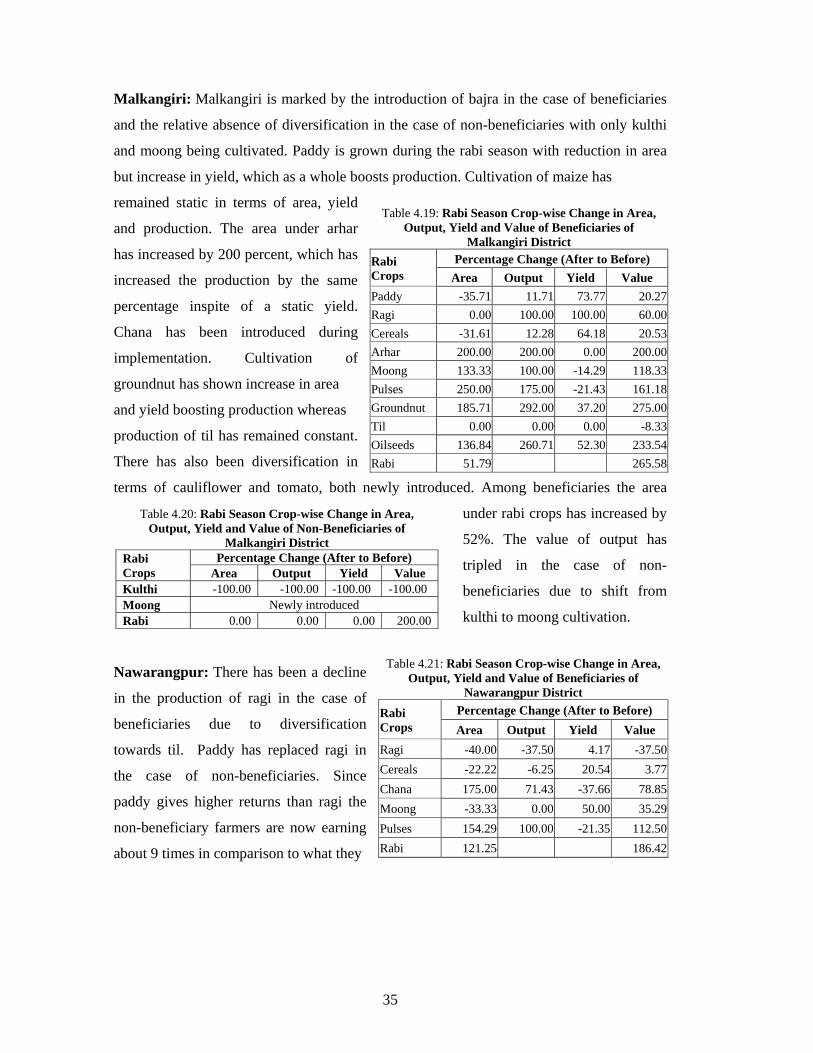
35
Table 4.20: Rabi Season Crop-wise Change in Area, Output, Yield and Value of Non-Beneficiaries of
Malkangiri DistrictRabi Crops
Percentage Change (After to Before) Area Output Yield Value
Kulthi -100.00 -100.00 -100.00 -100.00 Moong Newly introduced Rabi 0.00 0.00 0.00 200.00
Malkangiri: Malkangiri is marked by the introduction of bajra in the case of beneficiaries
and the relative absence of diversification in the case of non-beneficiaries with only kulthi
and moong being cultivated. Paddy is grown during the rabi season with reduction in area
but increase in yield, which as a whole boosts production. Cultivation of maize has
remained static in terms of area, yield
and production. The area under arhar
has increased by 200 percent, which has
increased the production by the same
percentage inspite of a static yield.
Chana has been introduced during
implementation. Cultivation of
groundnut has shown increase in area
and yield boosting production whereas
production of til has remained constant.
There has also been diversification in
terms of cauliflower and tomato, both newly introduced. Among beneficiaries the area
under rabi crops has increased by
52%. The value of output has
tripled in the case of non-
beneficiaries due to shift from
kulthi to moong cultivation.
Nawarangpur: There has been a decline
in the production of ragi in the case of
beneficiaries due to diversification
towards til. Paddy has replaced ragi in
the case of non-beneficiaries. Since
paddy gives higher returns than ragi the
non-beneficiary farmers are now earning
about 9 times in comparison to what they
Table 4.19: Rabi Season Crop-wise Change in Area, Output, Yield and Value of Beneficiaries of
Malkangiri District Rabi Crops
Percentage Change (After to Before) Area Output Yield Value
Paddy -35.71 11.71 73.77 20.27Ragi 0.00 100.00 100.00 60.00Cereals -31.61 12.28 64.18 20.53Arhar 200.00 200.00 0.00 200.00Moong 133.33 100.00 -14.29 118.33Pulses 250.00 175.00 -21.43 161.18Groundnut 185.71 292.00 37.20 275.00Til 0.00 0.00 0.00 -8.33Oilseeds 136.84 260.71 52.30 233.54Rabi 51.79 265.58
Table 4.21: Rabi Season Crop-wise Change in Area, Output, Yield and Value of Beneficiaries of
Nawarangpur District
Rabi Crops
Percentage Change (After to Before) Area Output Yield Value
Ragi -40.00 -37.50 4.17 -37.50Cereals -22.22 -6.25 20.54 3.77Chana 175.00 71.43 -37.66 78.85Moong -33.33 0.00 50.00 35.29Pulses 154.29 100.00 -21.35 112.50Rabi 121.25 186.42
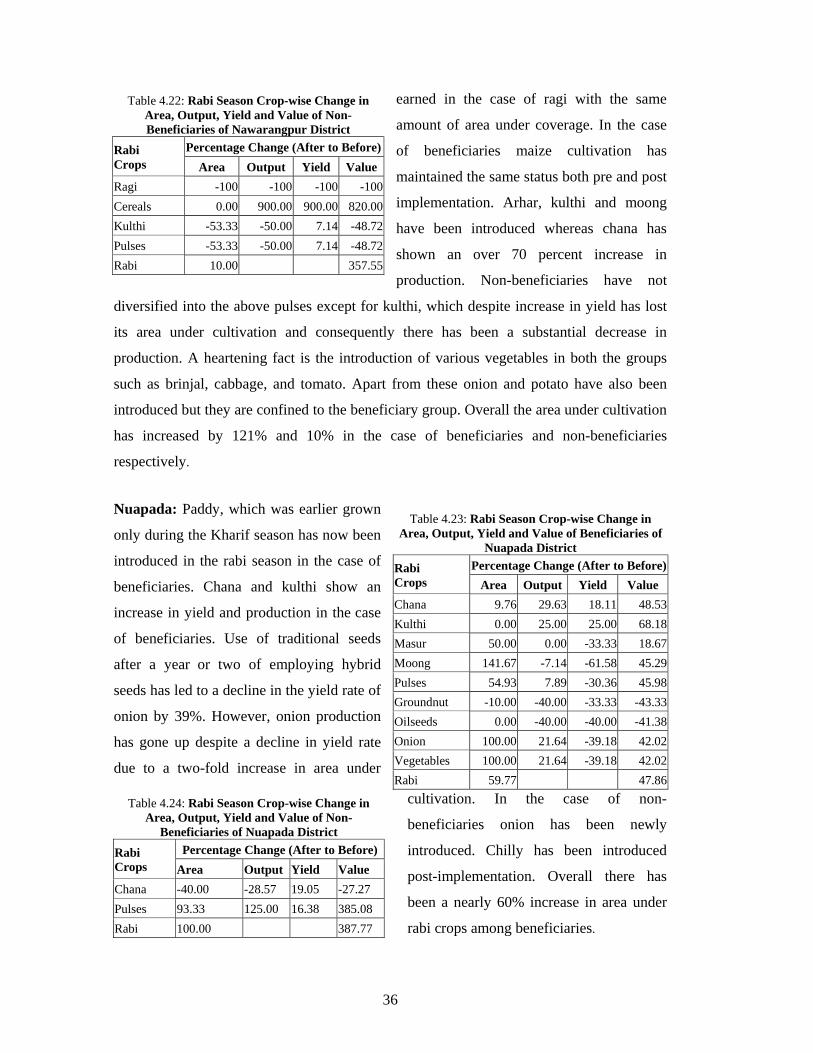
36
Table 4.24: Rabi Season Crop-wise Change in Area, Output, Yield and Value of Non-
Beneficiaries of Nuapada District
Rabi Crops
Percentage Change (After to Before) Area Output Yield Value
Chana -40.00 -28.57 19.05 -27.27 Pulses 93.33 125.00 16.38 385.08 Rabi 100.00 387.77
earned in the case of ragi with the same
amount of area under coverage. In the case
of beneficiaries maize cultivation has
maintained the same status both pre and post
implementation. Arhar, kulthi and moong
have been introduced whereas chana has
shown an over 70 percent increase in
production. Non-beneficiaries have not
diversified into the above pulses except for kulthi, which despite increase in yield has lost
its area under cultivation and consequently there has been a substantial decrease in
production. A heartening fact is the introduction of various vegetables in both the groups
such as brinjal, cabbage, and tomato. Apart from these onion and potato have also been
introduced but they are confined to the beneficiary group. Overall the area under cultivation
has increased by 121% and 10% in the case of beneficiaries and non-beneficiaries
respectively.
Nuapada: Paddy, which was earlier grown
only during the Kharif season has now been
introduced in the rabi season in the case of
beneficiaries. Chana and kulthi show an
increase in yield and production in the case
of beneficiaries. Use of traditional seeds
after a year or two of employing hybrid
seeds has led to a decline in the yield rate of
onion by 39%. However, onion production
has gone up despite a decline in yield rate
due to a two-fold increase in area under
cultivation. In the case of non-
beneficiaries onion has been newly
introduced. Chilly has been introduced
post-implementation. Overall there has
been a nearly 60% increase in area under
rabi crops among beneficiaries.
Table 4.22: Rabi Season Crop-wise Change in Area, Output, Yield and Value of Non-Beneficiaries of Nawarangpur District
Rabi Crops
Percentage Change (After to Before)Area Output Yield Value
Ragi -100 -100 -100 -100Cereals 0.00 900.00 900.00 820.00Kulthi -53.33 -50.00 7.14 -48.72Pulses -53.33 -50.00 7.14 -48.72Rabi 10.00 357.55
Table 4.23: Rabi Season Crop-wise Change in Area, Output, Yield and Value of Beneficiaries of
Nuapada District Rabi Crops
Percentage Change (After to Before)Area Output Yield Value
Chana 9.76 29.63 18.11 48.53Kulthi 0.00 25.00 25.00 68.18Masur 50.00 0.00 -33.33 18.67Moong 141.67 -7.14 -61.58 45.29Pulses 54.93 7.89 -30.36 45.98Groundnut -10.00 -40.00 -33.33 -43.33Oilseeds 0.00 -40.00 -40.00 -41.38Onion 100.00 21.64 -39.18 42.02Vegetables 100.00 21.64 -39.18 42.02Rabi 59.77 47.86
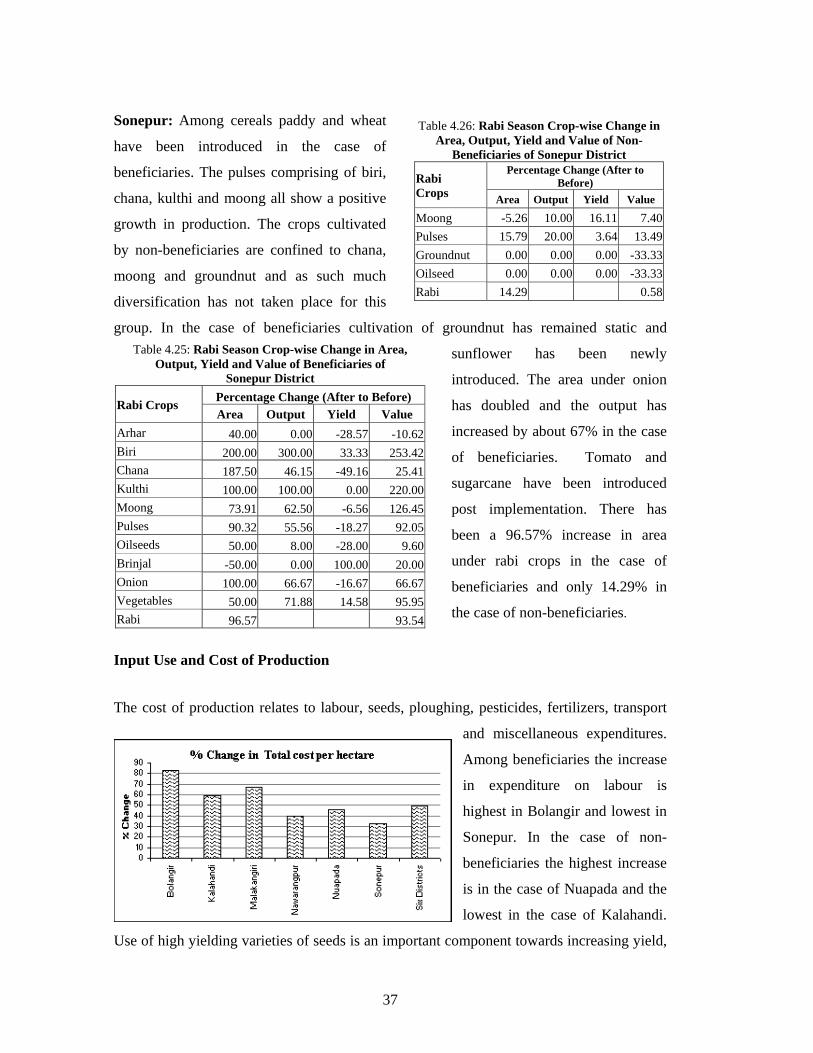
37
Table 4.26: Rabi Season Crop-wise Change in Area, Output, Yield and Value of Non-
Beneficiaries of Sonepur District
Rabi Crops
Percentage Change (After to Before)
Area Output Yield Value
Moong -5.26 10.00 16.11 7.40Pulses 15.79 20.00 3.64 13.49Groundnut 0.00 0.00 0.00 -33.33Oilseed 0.00 0.00 0.00 -33.33Rabi 14.29 0.58
Table 4.25: Rabi Season Crop-wise Change in Area, Output, Yield and Value of Beneficiaries of
Sonepur District
Rabi Crops Percentage Change (After to Before) Area Output Yield Value
Arhar 40.00 0.00 -28.57 -10.62Biri 200.00 300.00 33.33 253.42Chana 187.50 46.15 -49.16 25.41Kulthi 100.00 100.00 0.00 220.00Moong 73.91 62.50 -6.56 126.45Pulses 90.32 55.56 -18.27 92.05Oilseeds 50.00 8.00 -28.00 9.60Brinjal -50.00 0.00 100.00 20.00Onion 100.00 66.67 -16.67 66.67Vegetables 50.00 71.88 14.58 95.95Rabi 96.57 93.54
Sonepur: Among cereals paddy and wheat
have been introduced in the case of
beneficiaries. The pulses comprising of biri,
chana, kulthi and moong all show a positive
growth in production. The crops cultivated
by non-beneficiaries are confined to chana,
moong and groundnut and as such much
diversification has not taken place for this
group. In the case of beneficiaries cultivation of groundnut has remained static and
sunflower has been newly
introduced. The area under onion
has doubled and the output has
increased by about 67% in the case
of beneficiaries. Tomato and
sugarcane have been introduced
post implementation. There has
been a 96.57% increase in area
under rabi crops in the case of
beneficiaries and only 14.29% in
the case of non-beneficiaries.
Input Use and Cost of Production
The cost of production relates to labour, seeds, ploughing, pesticides, fertilizers, transport
and miscellaneous expenditures.
Among beneficiaries the increase
in expenditure on labour is
highest in Bolangir and lowest in
Sonepur. In the case of non-
beneficiaries the highest increase
is in the case of Nuapada and the
lowest in the case of Kalahandi.
Use of high yielding varieties of seeds is an important component towards increasing yield,
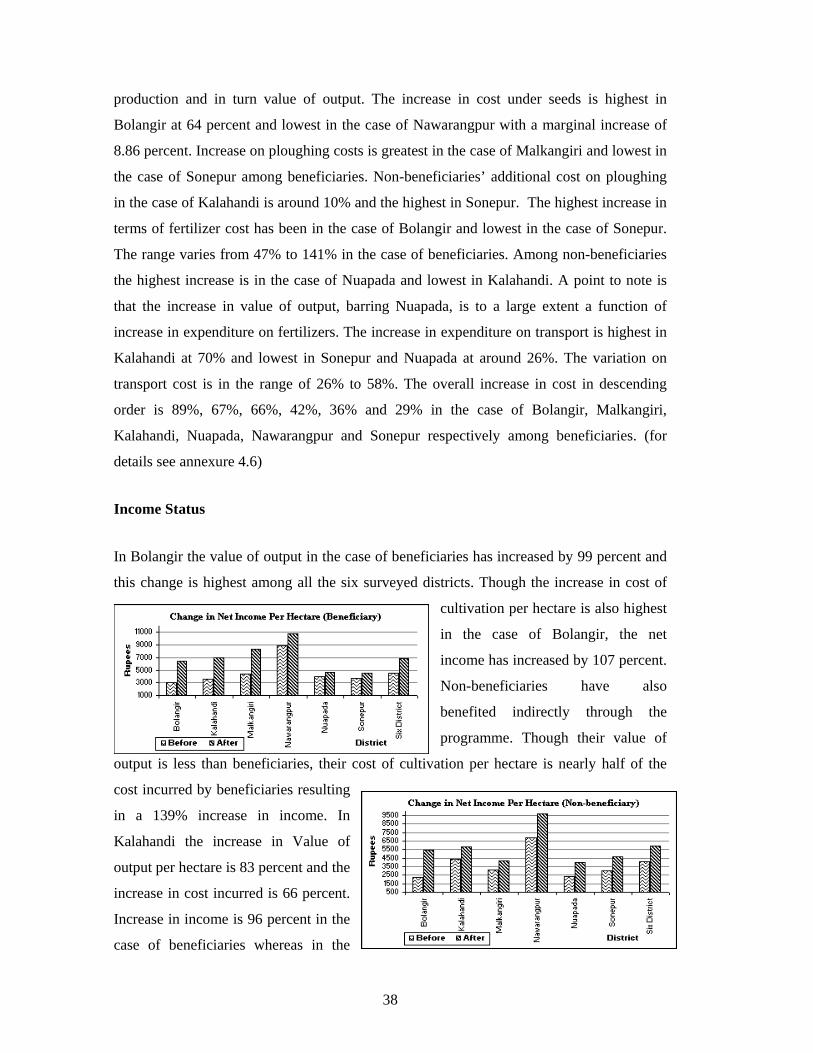
38
production and in turn value of output. The increase in cost under seeds is highest in
Bolangir at 64 percent and lowest in the case of Nawarangpur with a marginal increase of
8.86 percent. Increase on ploughing costs is greatest in the case of Malkangiri and lowest in
the case of Sonepur among beneficiaries. Non-beneficiaries’ additional cost on ploughing
in the case of Kalahandi is around 10% and the highest in Sonepur. The highest increase in
terms of fertilizer cost has been in the case of Bolangir and lowest in the case of Sonepur.
The range varies from 47% to 141% in the case of beneficiaries. Among non-beneficiaries
the highest increase is in the case of Nuapada and lowest in Kalahandi. A point to note is
that the increase in value of output, barring Nuapada, is to a large extent a function of
increase in expenditure on fertilizers. The increase in expenditure on transport is highest in
Kalahandi at 70% and lowest in Sonepur and Nuapada at around 26%. The variation on
transport cost is in the range of 26% to 58%. The overall increase in cost in descending
order is 89%, 67%, 66%, 42%, 36% and 29% in the case of Bolangir, Malkangiri,
Kalahandi, Nuapada, Nawarangpur and Sonepur respectively among beneficiaries. (for
details see annexure 4.6)
Income Status
In Bolangir the value of output in the case of beneficiaries has increased by 99 percent and
this change is highest among all the six surveyed districts. Though the increase in cost of
cultivation per hectare is also highest
in the case of Bolangir, the net
income has increased by 107 percent.
Non-beneficiaries have also
benefited indirectly through the
programme. Though their value of
output is less than beneficiaries, their cost of cultivation per hectare is nearly half of the
cost incurred by beneficiaries resulting
in a 139% increase in income. In
Kalahandi the increase in Value of
output per hectare is 83 percent and the
increase in cost incurred is 66 percent.
Increase in income is 96 percent in the
case of beneficiaries whereas in the
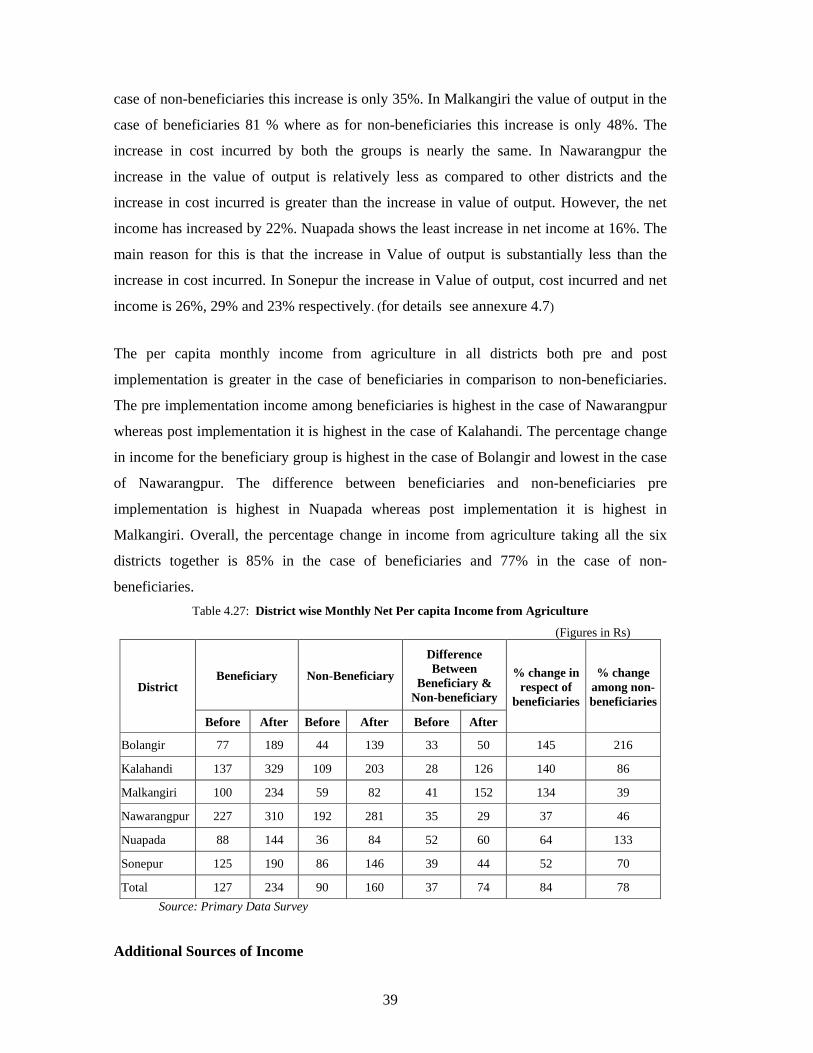
39
case of non-beneficiaries this increase is only 35%. In Malkangiri the value of output in the
case of beneficiaries 81 % where as for non-beneficiaries this increase is only 48%. The
increase in cost incurred by both the groups is nearly the same. In Nawarangpur the
increase in the value of output is relatively less as compared to other districts and the
increase in cost incurred is greater than the increase in value of output. However, the net
income has increased by 22%. Nuapada shows the least increase in net income at 16%. The
main reason for this is that the increase in Value of output is substantially less than the
increase in cost incurred. In Sonepur the increase in Value of output, cost incurred and net
income is 26%, 29% and 23% respectively. (for details see annexure 4.7)
The per capita monthly income from agriculture in all districts both pre and post
implementation is greater in the case of beneficiaries in comparison to non-beneficiaries.
The pre implementation income among beneficiaries is highest in the case of Nawarangpur
whereas post implementation it is highest in the case of Kalahandi. The percentage change
in income for the beneficiary group is highest in the case of Bolangir and lowest in the case
of Nawarangpur. The difference between beneficiaries and non-beneficiaries pre
implementation is highest in Nuapada whereas post implementation it is highest in
Malkangiri. Overall, the percentage change in income from agriculture taking all the six
districts together is 85% in the case of beneficiaries and 77% in the case of non-
beneficiaries. Table 4.27: District wise Monthly Net Per capita Income from Agriculture
(Figures in Rs)
District Beneficiary Non-Beneficiary
Difference Between
Beneficiary & Non-beneficiary
% change in respect of
beneficiaries
% change among non-beneficiaries
Before After Before After Before After
Bolangir 77 189 44 139 33 50 145 216
Kalahandi 137 329 109 203 28 126 140 86
Malkangiri 100 234 59 82 41 152 134 39
Nawarangpur 227 310 192 281 35 29 37 46
Nuapada 88 144 36 84 52 60 64 133
Sonepur 125 190 86 146 39 44 52 70
Total 127 234 90 160 37 74 84 78 Source: Primary Data Survey
Additional Sources of Income
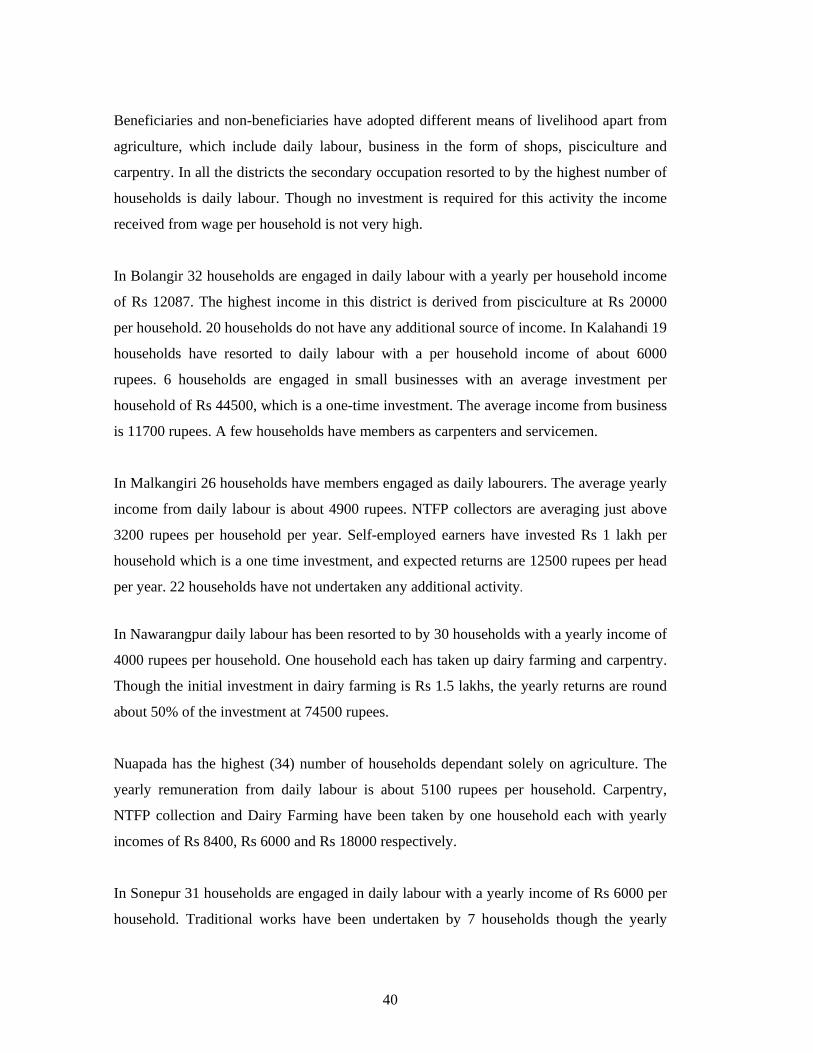
40
Beneficiaries and non-beneficiaries have adopted different means of livelihood apart from
agriculture, which include daily labour, business in the form of shops, pisciculture and
carpentry. In all the districts the secondary occupation resorted to by the highest number of
households is daily labour. Though no investment is required for this activity the income
received from wage per household is not very high.
In Bolangir 32 households are engaged in daily labour with a yearly per household income
of Rs 12087. The highest income in this district is derived from pisciculture at Rs 20000
per household. 20 households do not have any additional source of income. In Kalahandi 19
households have resorted to daily labour with a per household income of about 6000
rupees. 6 households are engaged in small businesses with an average investment per
household of Rs 44500, which is a one-time investment. The average income from business
is 11700 rupees. A few households have members as carpenters and servicemen.
In Malkangiri 26 households have members engaged as daily labourers. The average yearly
income from daily labour is about 4900 rupees. NTFP collectors are averaging just above
3200 rupees per household per year. Self-employed earners have invested Rs 1 lakh per
household which is a one time investment, and expected returns are 12500 rupees per head
per year. 22 households have not undertaken any additional activity.
In Nawarangpur daily labour has been resorted to by 30 households with a yearly income of
4000 rupees per household. One household each has taken up dairy farming and carpentry.
Though the initial investment in dairy farming is Rs 1.5 lakhs, the yearly returns are round
about 50% of the investment at 74500 rupees.
Nuapada has the highest (34) number of households dependant solely on agriculture. The
yearly remuneration from daily labour is about 5100 rupees per household. Carpentry,
NTFP collection and Dairy Farming have been taken by one household each with yearly
incomes of Rs 8400, Rs 6000 and Rs 18000 respectively.
In Sonepur 31 households are engaged in daily labour with a yearly income of Rs 6000 per
household. Traditional works have been undertaken by 7 households though the yearly
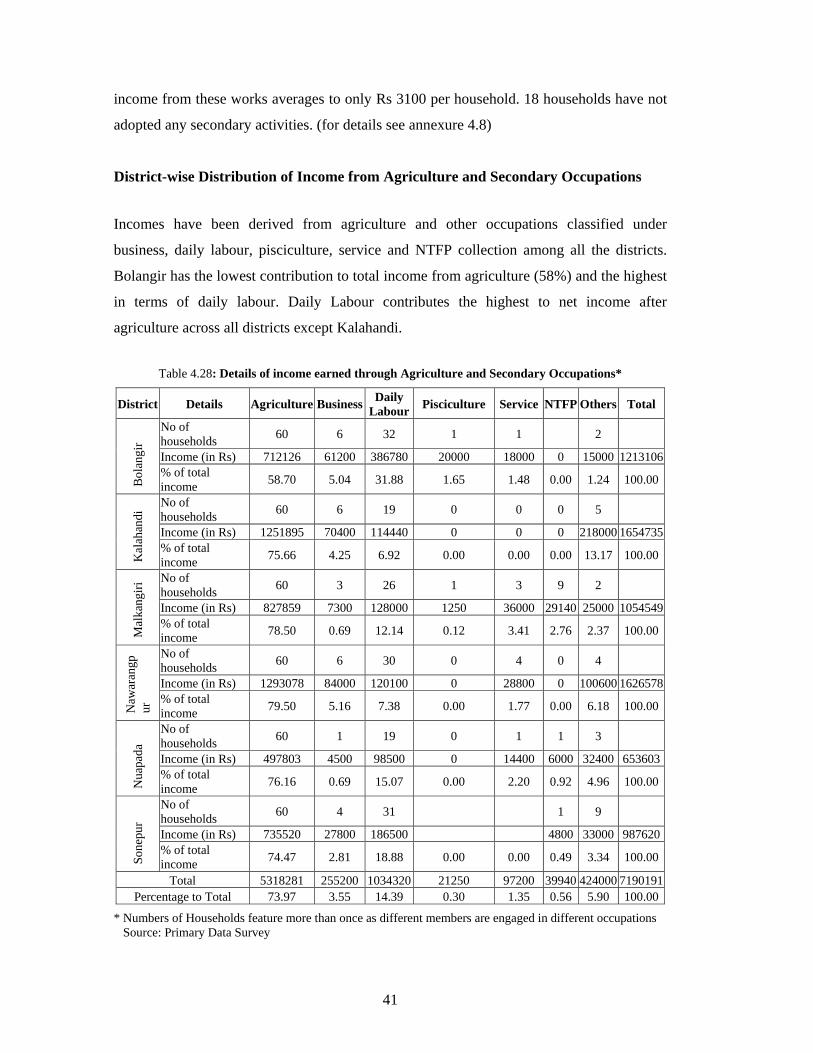
41
income from these works averages to only Rs 3100 per household. 18 households have not
adopted any secondary activities. (for details see annexure 4.8)
District-wise Distribution of Income from Agriculture and Secondary Occupations
Incomes have been derived from agriculture and other occupations classified under
business, daily labour, pisciculture, service and NTFP collection among all the districts.
Bolangir has the lowest contribution to total income from agriculture (58%) and the highest
in terms of daily labour. Daily Labour contributes the highest to net income after
agriculture across all districts except Kalahandi.
Table 4.28: Details of income earned through Agriculture and Secondary Occupations*
District Details Agriculture Business Daily Labour Pisciculture Service NTFP Others Total
Bol
angi
r
No of households 60 6 32 1 1 2
Income (in Rs) 712126 61200 386780 20000 18000 0 15000 1213106% of total income 58.70 5.04 31.88 1.65 1.48 0.00 1.24 100.00
Kal
ahan
di No of
households 60 6 19 0 0 0 5
Income (in Rs) 1251895 70400 114440 0 0 0 218000 1654735% of total income 75.66 4.25 6.92 0.00 0.00 0.00 13.17 100.00
Mal
kang
iri No of
households 60 3 26 1 3 9 2
Income (in Rs) 827859 7300 128000 1250 36000 29140 25000 1054549% of total income 78.50 0.69 12.14 0.12 3.41 2.76 2.37 100.00
Naw
aran
gpur
No of households 60 6 30 0 4 0 4
Income (in Rs) 1293078 84000 120100 0 28800 0 100600 1626578% of total income 79.50 5.16 7.38 0.00 1.77 0.00 6.18 100.00
Nua
pada
No of households 60 1 19 0 1 1 3
Income (in Rs) 497803 4500 98500 0 14400 6000 32400 653603% of total income 76.16 0.69 15.07 0.00 2.20 0.92 4.96 100.00
Sone
pur
No of households 60 4 31 1 9
Income (in Rs) 735520 27800 186500 4800 33000 987620% of total income 74.47 2.81 18.88 0.00 0.00 0.49 3.34 100.00
Total 5318281 255200 1034320 21250 97200 39940 424000 7190191Percentage to Total 73.97 3.55 14.39 0.30 1.35 0.56 5.90 100.00
* Numbers of Households feature more than once as different members are engaged in different occupations Source: Primary Data Survey
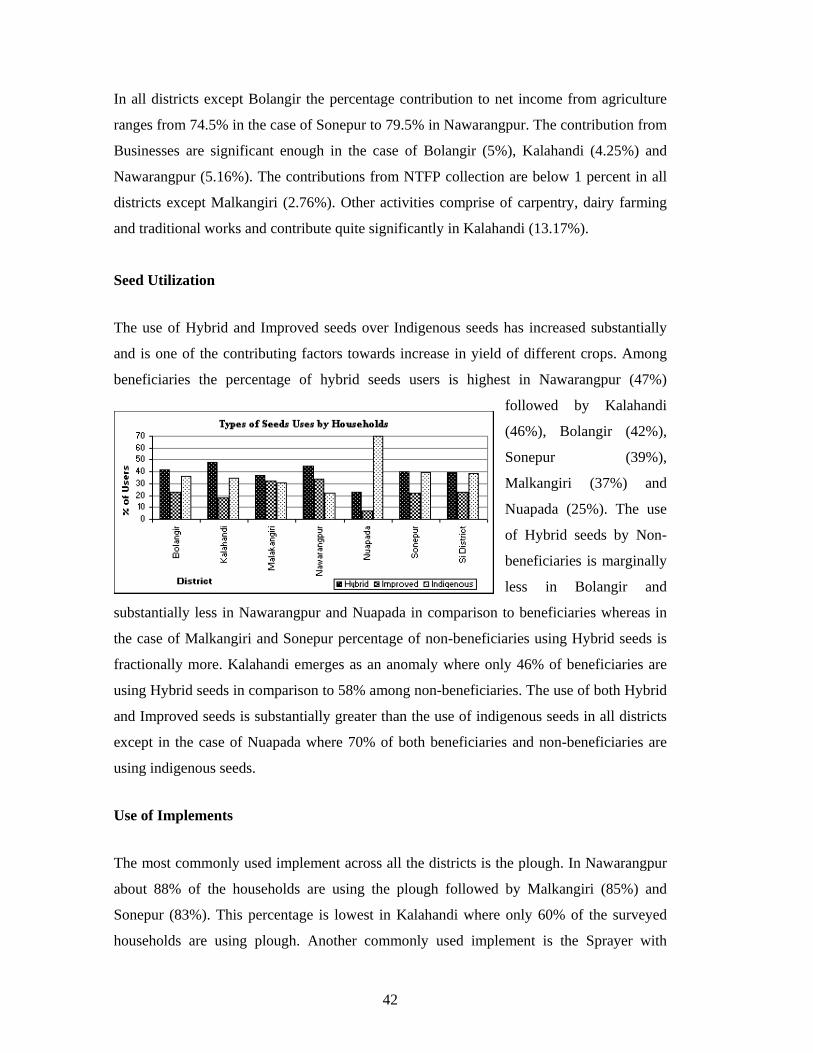
42
In all districts except Bolangir the percentage contribution to net income from agriculture
ranges from 74.5% in the case of Sonepur to 79.5% in Nawarangpur. The contribution from
Businesses are significant enough in the case of Bolangir (5%), Kalahandi (4.25%) and
Nawarangpur (5.16%). The contributions from NTFP collection are below 1 percent in all
districts except Malkangiri (2.76%). Other activities comprise of carpentry, dairy farming
and traditional works and contribute quite significantly in Kalahandi (13.17%).
Seed Utilization
The use of Hybrid and Improved seeds over Indigenous seeds has increased substantially
and is one of the contributing factors towards increase in yield of different crops. Among
beneficiaries the percentage of hybrid seeds users is highest in Nawarangpur (47%)
followed by Kalahandi
(46%), Bolangir (42%),
Sonepur (39%),
Malkangiri (37%) and
Nuapada (25%). The use
of Hybrid seeds by Non-
beneficiaries is marginally
less in Bolangir and
substantially less in Nawarangpur and Nuapada in comparison to beneficiaries whereas in
the case of Malkangiri and Sonepur percentage of non-beneficiaries using Hybrid seeds is
fractionally more. Kalahandi emerges as an anomaly where only 46% of beneficiaries are
using Hybrid seeds in comparison to 58% among non-beneficiaries. The use of both Hybrid
and Improved seeds is substantially greater than the use of indigenous seeds in all districts
except in the case of Nuapada where 70% of both beneficiaries and non-beneficiaries are
using indigenous seeds.
Use of Implements
The most commonly used implement across all the districts is the plough. In Nawarangpur
about 88% of the households are using the plough followed by Malkangiri (85%) and
Sonepur (83%). This percentage is lowest in Kalahandi where only 60% of the surveyed
households are using plough. Another commonly used implement is the Sprayer with
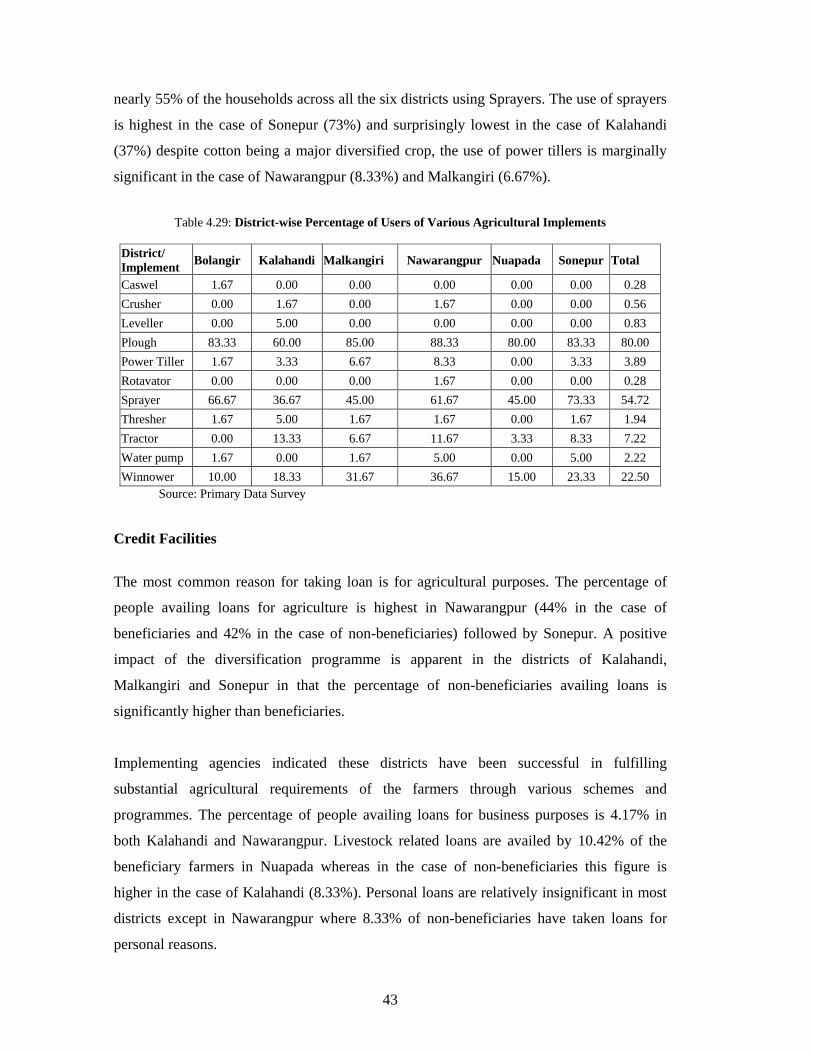
43
nearly 55% of the households across all the six districts using Sprayers. The use of sprayers
is highest in the case of Sonepur (73%) and surprisingly lowest in the case of Kalahandi
(37%) despite cotton being a major diversified crop, the use of power tillers is marginally
significant in the case of Nawarangpur (8.33%) and Malkangiri (6.67%).
Table 4.29: District-wise Percentage of Users of Various Agricultural Implements
District/ Implement Bolangir Kalahandi Malkangiri Nawarangpur Nuapada Sonepur Total
Caswel 1.67 0.00 0.00 0.00 0.00 0.00 0.28 Crusher 0.00 1.67 0.00 1.67 0.00 0.00 0.56 Leveller 0.00 5.00 0.00 0.00 0.00 0.00 0.83 Plough 83.33 60.00 85.00 88.33 80.00 83.33 80.00 Power Tiller 1.67 3.33 6.67 8.33 0.00 3.33 3.89 Rotavator 0.00 0.00 0.00 1.67 0.00 0.00 0.28 Sprayer 66.67 36.67 45.00 61.67 45.00 73.33 54.72 Thresher 1.67 5.00 1.67 1.67 0.00 1.67 1.94 Tractor 0.00 13.33 6.67 11.67 3.33 8.33 7.22 Water pump 1.67 0.00 1.67 5.00 0.00 5.00 2.22 Winnower 10.00 18.33 31.67 36.67 15.00 23.33 22.50
Source: Primary Data Survey
Credit Facilities
The most common reason for taking loan is for agricultural purposes. The percentage of
people availing loans for agriculture is highest in Nawarangpur (44% in the case of
beneficiaries and 42% in the case of non-beneficiaries) followed by Sonepur. A positive
impact of the diversification programme is apparent in the districts of Kalahandi,
Malkangiri and Sonepur in that the percentage of non-beneficiaries availing loans is
significantly higher than beneficiaries.
Implementing agencies indicated these districts have been successful in fulfilling
substantial agricultural requirements of the farmers through various schemes and
programmes. The percentage of people availing loans for business purposes is 4.17% in
both Kalahandi and Nawarangpur. Livestock related loans are availed by 10.42% of the
beneficiary farmers in Nuapada whereas in the case of non-beneficiaries this figure is
higher in the case of Kalahandi (8.33%). Personal loans are relatively insignificant in most
districts except in Nawarangpur where 8.33% of non-beneficiaries have taken loans for
personal reasons.
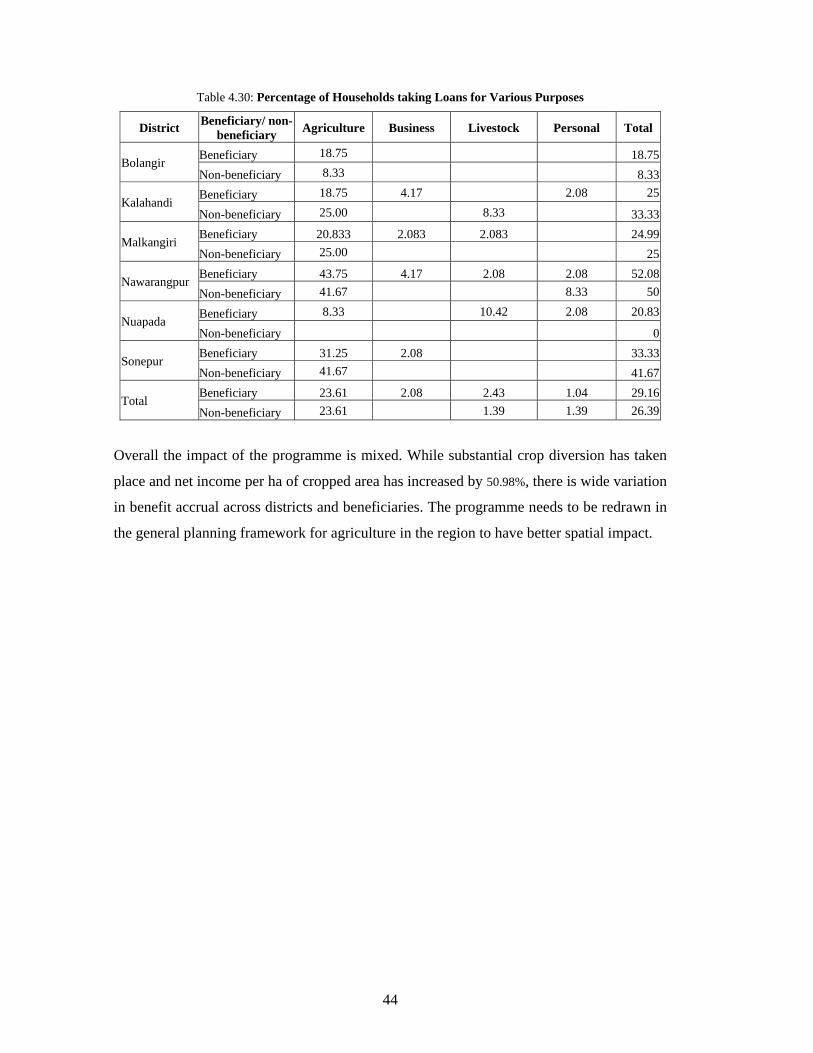
44
Table 4.30: Percentage of Households taking Loans for Various Purposes
District Beneficiary/ non-beneficiary Agriculture Business Livestock Personal Total
Bolangir Beneficiary 18.75 18.75Non-beneficiary 8.33 8.33
Kalahandi Beneficiary 18.75 4.17 2.08 25
Non-beneficiary 25.00 8.33 33.33
Malkangiri Beneficiary 20.833 2.083 2.083 24.99Non-beneficiary 25.00 25
Nawarangpur Beneficiary 43.75 4.17 2.08 2.08 52.08Non-beneficiary 41.67 8.33 50
Nuapada Beneficiary 8.33 10.42 2.08 20.83
Non-beneficiary 0
Sonepur Beneficiary 31.25 2.08 33.33Non-beneficiary 41.67 41.67
Total Beneficiary 23.61 2.08 2.43 1.04 29.16Non-beneficiary 23.61 1.39 1.39 26.39
Overall the impact of the programme is mixed. While substantial crop diversion has taken
place and net income per ha of cropped area has increased by 50.98%, there is wide variation
in benefit accrual across districts and beneficiaries. The programme needs to be redrawn in
the general planning framework for agriculture in the region to have better spatial impact.
45
ANNEXURE
Annexure 4.1
A Note on Diversification Index
Diversification index is a mathematical expression of the intensity of crop diversification.
Calculation of Diversification Index1 is as follows:
DI = 1-Σ (Aij/Σ Aij) 2 (Where Aij is the area under production of the ith crop in the jth year
and the value ranges between 0 to 1. The higher the value the
greater is the diversification.)
In the year 2005-06 the highest diversification was in the case of Nuapada. Overall
Nuapada and Malkangiri show higher diversification indexes in 5 and 3 years respectively
and all the districts show a decline in the index value in the year 2002-03 possibly because
of a drastic decline in annual rainfall across all the six districts. Among all the districts
Sonepur has shown the least diversification for most of the years.
Comparison between 1996-97 and 1997-98
There is a sharp increase in the index value in the case of Bolangir between 1996-97 and
1997-98. This is because the area under cultivation had gone up most possibly because the
rainfall in 1997 was around 500mm higher than 1996. Further the area under paddy
increased but not in the same proportion as the increase in cropped area. This gave more
area for diversification into other crops. Sonepur, which has the highest percentage of rice
under cultivation to total area cultivated shows an increase in the index value for the same
period. In Sonepur though the rainfall increased substantially in 1997 in comparison to
1996 there was insignificant change in the area under cultivation. There was however a
decline in the area under rice cultivation giving crops such as condiments and spices area to
expand. In Kalahandi the diversification index did not changed much as the area under
cultivation had not increased significantly. Though rice area has increased moong another
1 Area of all major crops (common among all districts) was summed for each district for 10 years i.e. 1996-97 to 2005-06. Thereafter the formula was applied to each individual crop and consequently the index was calculated for that particular district and year.
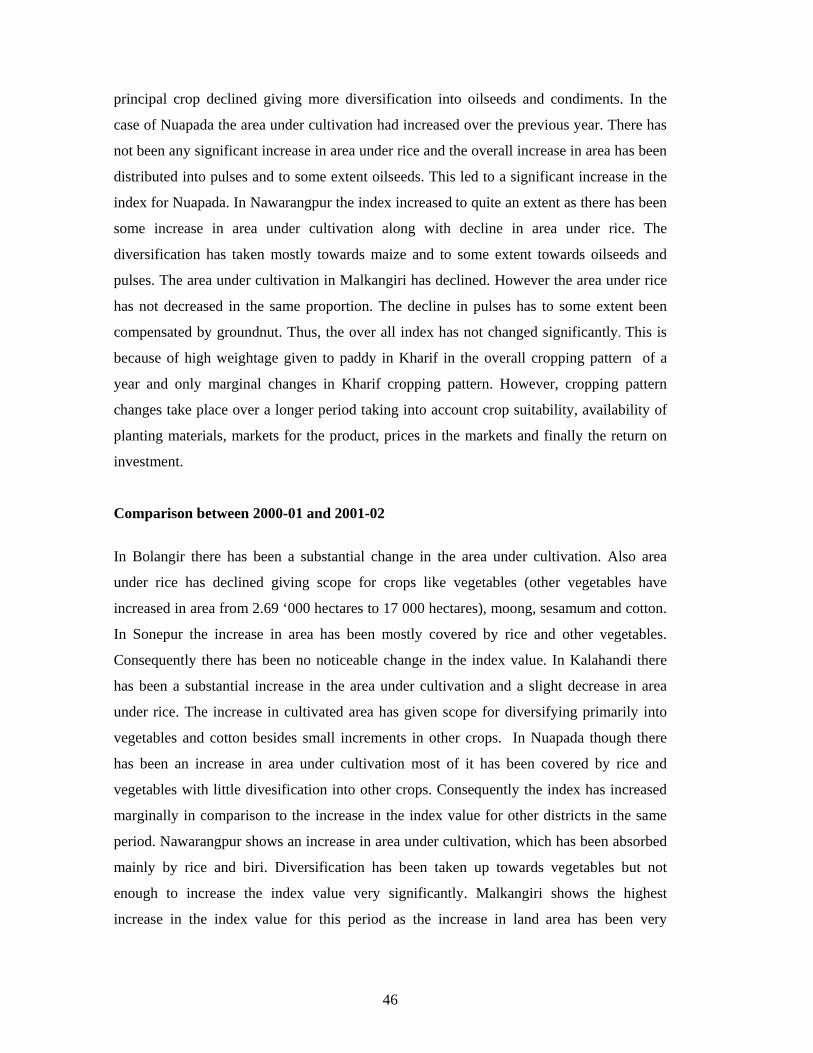
46
principal crop declined giving more diversification into oilseeds and condiments. In the
case of Nuapada the area under cultivation had increased over the previous year. There has
not been any significant increase in area under rice and the overall increase in area has been
distributed into pulses and to some extent oilseeds. This led to a significant increase in the
index for Nuapada. In Nawarangpur the index increased to quite an extent as there has been
some increase in area under cultivation along with decline in area under rice. The
diversification has taken mostly towards maize and to some extent towards oilseeds and
pulses. The area under cultivation in Malkangiri has declined. However the area under rice
has not decreased in the same proportion. The decline in pulses has to some extent been
compensated by groundnut. Thus, the over all index has not changed significantly. This is
because of high weightage given to paddy in Kharif in the overall cropping pattern of a
year and only marginal changes in Kharif cropping pattern. However, cropping pattern
changes take place over a longer period taking into account crop suitability, availability of
planting materials, markets for the product, prices in the markets and finally the return on
investment.
Comparison between 2000-01 and 2001-02
In Bolangir there has been a substantial change in the area under cultivation. Also area
under rice has declined giving scope for crops like vegetables (other vegetables have
increased in area from 2.69 ‘000 hectares to 17 000 hectares), moong, sesamum and cotton.
In Sonepur the increase in area has been mostly covered by rice and other vegetables.
Consequently there has been no noticeable change in the index value. In Kalahandi there
has been a substantial increase in the area under cultivation and a slight decrease in area
under rice. The increase in cultivated area has given scope for diversifying primarily into
vegetables and cotton besides small increments in other crops. In Nuapada though there
has been an increase in area under cultivation most of it has been covered by rice and
vegetables with little divesification into other crops. Consequently the index has increased
marginally in comparison to the increase in the index value for other districts in the same
period. Nawarangpur shows an increase in area under cultivation, which has been absorbed
mainly by rice and biri. Diversification has been taken up towards vegetables but not
enough to increase the index value very significantly. Malkangiri shows the highest
increase in the index value for this period as the increase in land area has been very
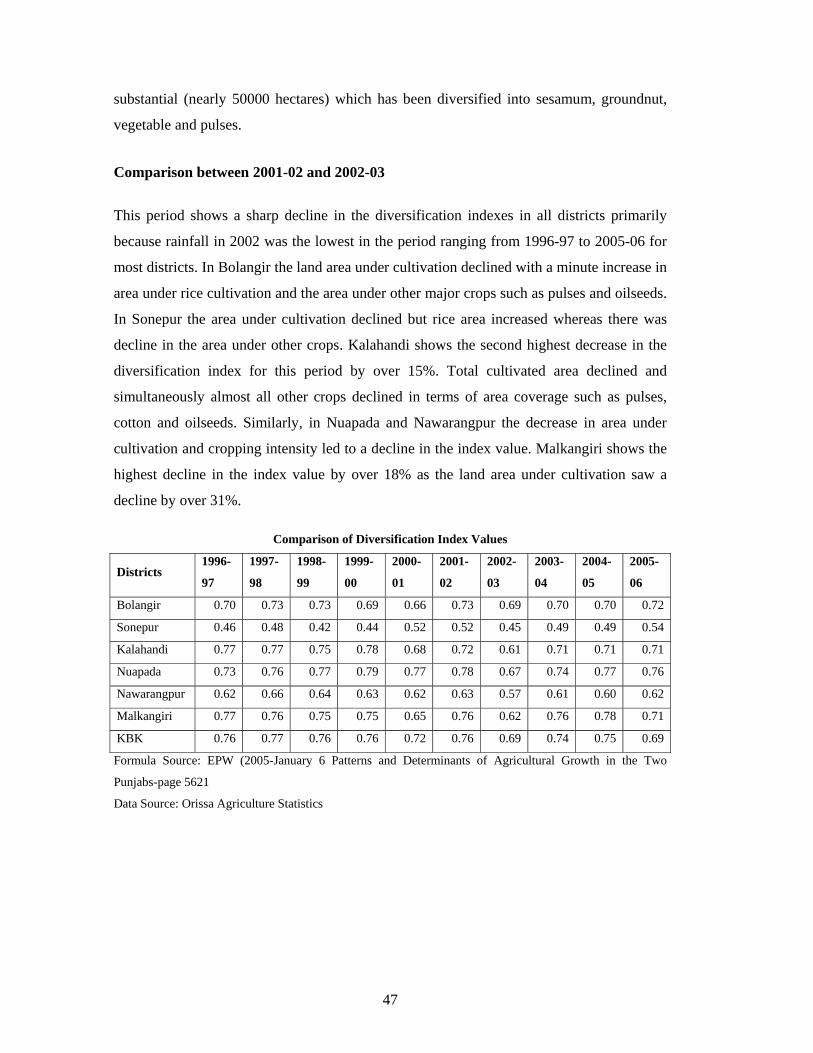
47
substantial (nearly 50000 hectares) which has been diversified into sesamum, groundnut,
vegetable and pulses.
Comparison between 2001-02 and 2002-03
This period shows a sharp decline in the diversification indexes in all districts primarily
because rainfall in 2002 was the lowest in the period ranging from 1996-97 to 2005-06 for
most districts. In Bolangir the land area under cultivation declined with a minute increase in
area under rice cultivation and the area under other major crops such as pulses and oilseeds.
In Sonepur the area under cultivation declined but rice area increased whereas there was
decline in the area under other crops. Kalahandi shows the second highest decrease in the
diversification index for this period by over 15%. Total cultivated area declined and
simultaneously almost all other crops declined in terms of area coverage such as pulses,
cotton and oilseeds. Similarly, in Nuapada and Nawarangpur the decrease in area under
cultivation and cropping intensity led to a decline in the index value. Malkangiri shows the
highest decline in the index value by over 18% as the land area under cultivation saw a
decline by over 31%.
Comparison of Diversification Index Values
Districts 1996-
97
1997-
98
1998-
99
1999-
00
2000-
01
2001-
02
2002-
03
2003-
04
2004-
05
2005-
06
Bolangir 0.70 0.73 0.73 0.69 0.66 0.73 0.69 0.70 0.70 0.72
Sonepur 0.46 0.48 0.42 0.44 0.52 0.52 0.45 0.49 0.49 0.54
Kalahandi 0.77 0.77 0.75 0.78 0.68 0.72 0.61 0.71 0.71 0.71
Nuapada 0.73 0.76 0.77 0.79 0.77 0.78 0.67 0.74 0.77 0.76
Nawarangpur 0.62 0.66 0.64 0.63 0.62 0.63 0.57 0.61 0.60 0.62
Malkangiri 0.77 0.76 0.75 0.75 0.65 0.76 0.62 0.76 0.78 0.71
KBK 0.76 0.77 0.76 0.76 0.72 0.76 0.69 0.74 0.75 0.69
Formula Source: EPW (2005-January 6 Patterns and Determinants of Agricultural Growth in the Two
Punjabs-page 5621
Data Source: Orissa Agriculture Statistics
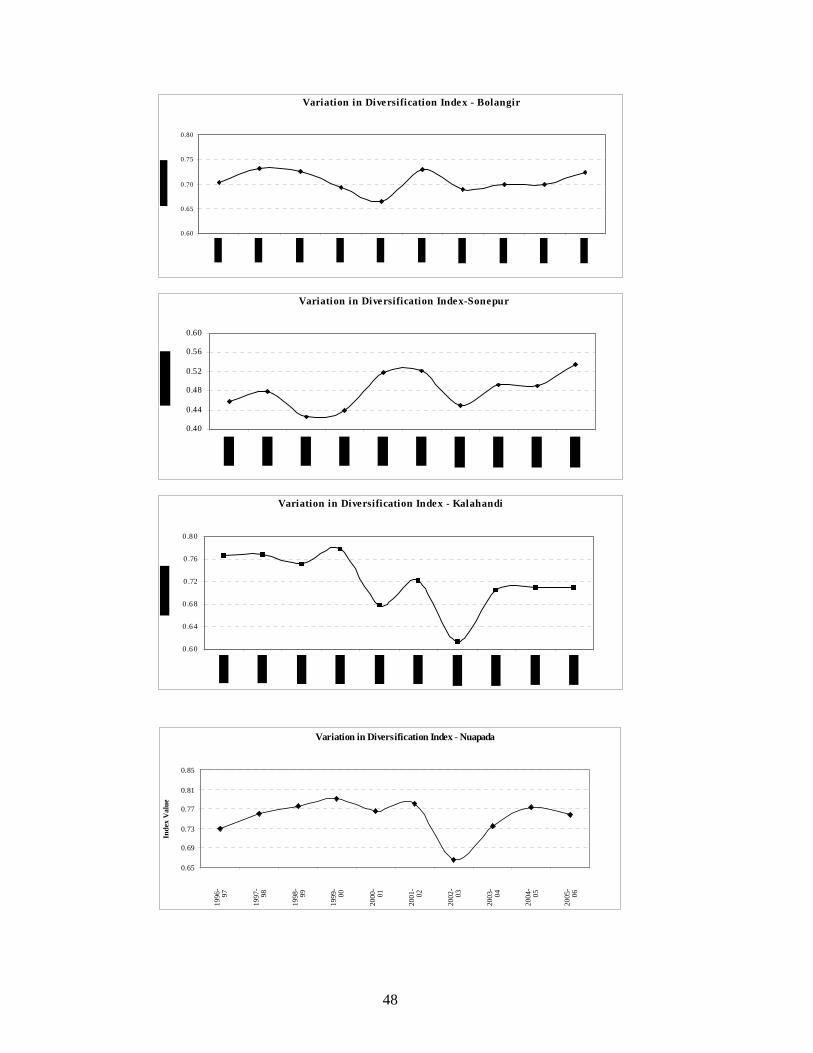
48
Variation in Diversification Index - Bolangir
0.60
0.65
0.70
0.75
0.80
Variation in Diversification Index-Sonepur
0.40
0.44
0.48
0.52
0.56
0.60
Variation in Diversification Index - Kalahandi
0 .6 0
0 .6 4
0 .6 8
0 .72
0 .76
0 .8 0
Variation in Diversification Index - Nuapada
0.65
0.69
0.73
0.77
0.81
0.85
1996
-97
1997
-98
1998
-99
1999
-00
2000
-01
2001
-02
2002
-03
2003
-04
2004
-05
2005
-06
Inde
x V
alue
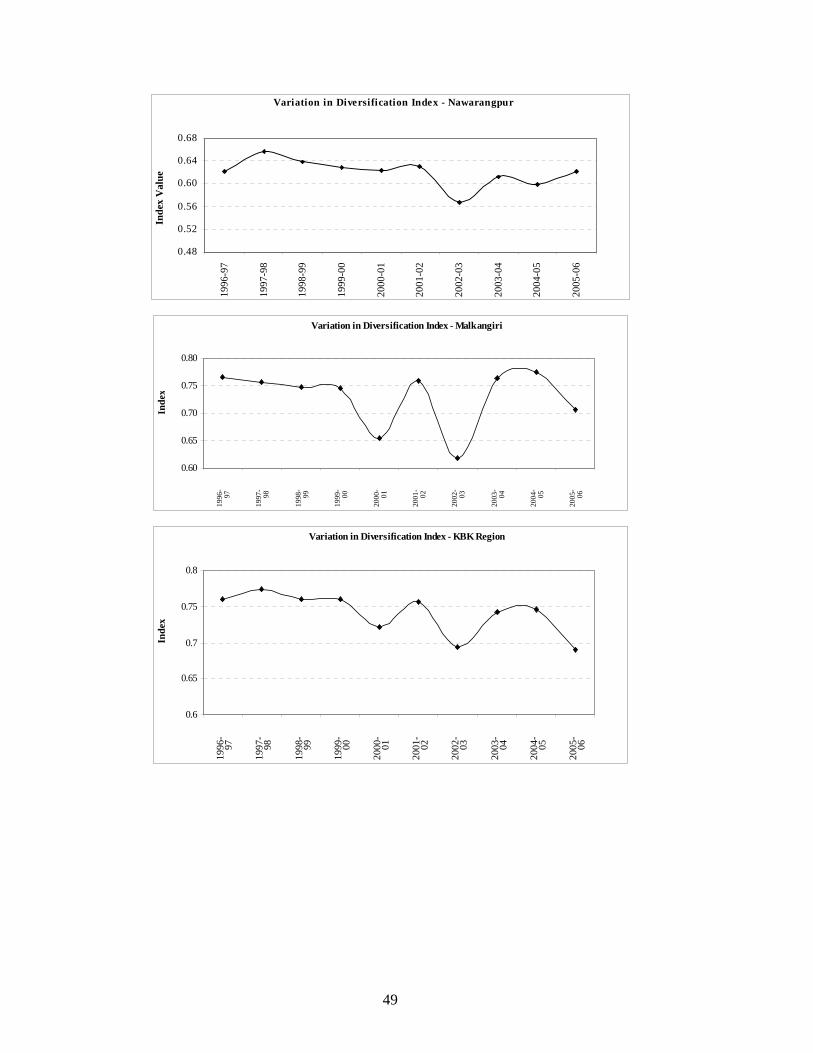
49
Variation in Diversification Index - Nawarangpur
0.48
0.52
0.56
0.60
0.64
0.68
1996
-97
1997
-98
1998
-99
1999
-00
2000
-01
2001
-02
2002
-03
2003
-04
2004
-05
2005
-06
Inde
x V
alue
Variation in Diversification Index - Malkangiri
0.60
0.65
0.70
0.75
0.80
1996
-97
1997
-98
1998
-99
1999
-00
2000
-01
2001
-02
2002
-03
2003
-04
2004
-05
2005
-06
Inde
x
Variation in Diversification Index - KBK Region
0.6
0.65
0.7
0.75
0.8
1996
-97
1997
-98
1998
-99
1999
-00
2000
-01
2001
-02
2002
-03
2003
-04
2004
-05
2005
-06
Inde
x
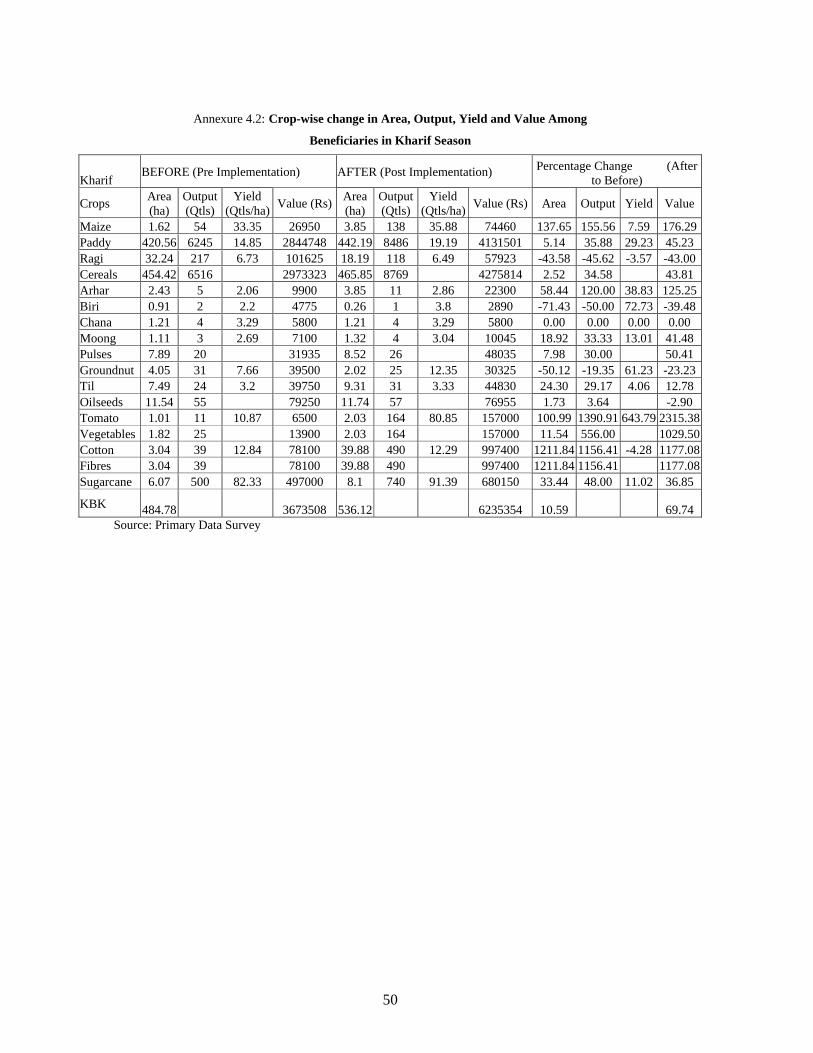
50
Annexure 4.2: Crop-wise change in Area, Output, Yield and Value Among
Beneficiaries in Kharif Season
Kharif BEFORE (Pre Implementation) AFTER (Post Implementation) Percentage Change (After
to Before)
Crops Area (ha)
Output (Qtls)
Yield (Qtls/ha) Value (Rs) Area
(ha)Output (Qtls)
Yield (Qtls/ha) Value (Rs) Area Output Yield Value
Maize 1.62 54 33.35 26950 3.85 138 35.88 74460 137.65 155.56 7.59 176.29Paddy 420.56 6245 14.85 2844748 442.19 8486 19.19 4131501 5.14 35.88 29.23 45.23 Ragi 32.24 217 6.73 101625 18.19 118 6.49 57923 -43.58 -45.62 -3.57 -43.00Cereals 454.42 6516 2973323 465.85 8769 4275814 2.52 34.58 43.81 Arhar 2.43 5 2.06 9900 3.85 11 2.86 22300 58.44 120.00 38.83 125.25Biri 0.91 2 2.2 4775 0.26 1 3.8 2890 -71.43 -50.00 72.73 -39.48Chana 1.21 4 3.29 5800 1.21 4 3.29 5800 0.00 0.00 0.00 0.00 Moong 1.11 3 2.69 7100 1.32 4 3.04 10045 18.92 33.33 13.01 41.48 Pulses 7.89 20 31935 8.52 26 48035 7.98 30.00 50.41 Groundnut 4.05 31 7.66 39500 2.02 25 12.35 30325 -50.12 -19.35 61.23 -23.23Til 7.49 24 3.2 39750 9.31 31 3.33 44830 24.30 29.17 4.06 12.78 Oilseeds 11.54 55 79250 11.74 57 76955 1.73 3.64 -2.90Tomato 1.01 11 10.87 6500 2.03 164 80.85 157000 100.99 1390.91 643.79 2315.38Vegetables 1.82 25 13900 2.03 164 157000 11.54 556.00 1029.50Cotton 3.04 39 12.84 78100 39.88 490 12.29 997400 1211.84 1156.41 -4.28 1177.08Fibres 3.04 39 78100 39.88 490 997400 1211.84 1156.41 1177.08Sugarcane 6.07 500 82.33 497000 8.1 740 91.39 680150 33.44 48.00 11.02 36.85
KBK 484.78 3673508 536.12 6235354 10.59 69.74 Source: Primary Data Survey
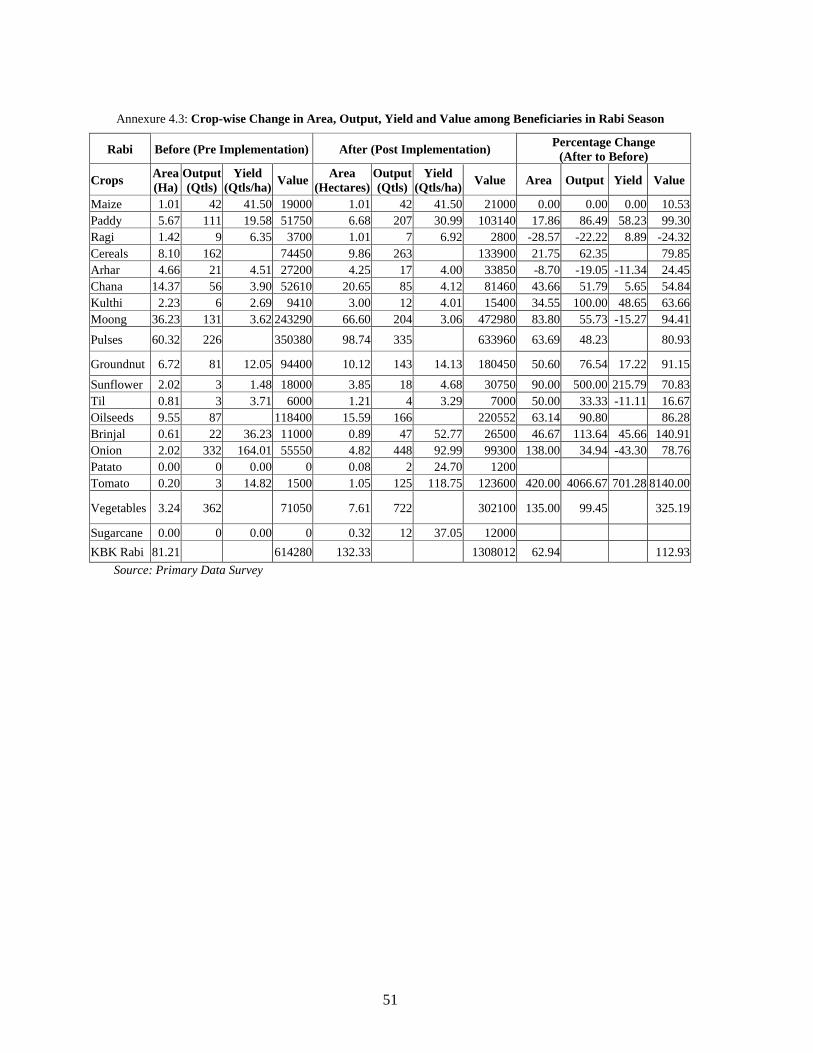
51
Annexure 4.3: Crop-wise Change in Area, Output, Yield and Value among Beneficiaries in Rabi Season
Rabi Before (Pre Implementation) After (Post Implementation) Percentage Change (After to Before)
Crops Area (Ha)
Output (Qtls)
Yield (Qtls/ha) Value Area
(Hectares)Output (Qtls)
Yield (Qtls/ha) Value Area Output Yield Value
Maize 1.01 42 41.50 19000 1.01 42 41.50 21000 0.00 0.00 0.00 10.53Paddy 5.67 111 19.58 51750 6.68 207 30.99 103140 17.86 86.49 58.23 99.30Ragi 1.42 9 6.35 3700 1.01 7 6.92 2800 -28.57 -22.22 8.89 -24.32Cereals 8.10 162 74450 9.86 263 133900 21.75 62.35 79.85Arhar 4.66 21 4.51 27200 4.25 17 4.00 33850 -8.70 -19.05 -11.34 24.45Chana 14.37 56 3.90 52610 20.65 85 4.12 81460 43.66 51.79 5.65 54.84Kulthi 2.23 6 2.69 9410 3.00 12 4.01 15400 34.55 100.00 48.65 63.66Moong 36.23 131 3.62 243290 66.60 204 3.06 472980 83.80 55.73 -15.27 94.41Pulses 60.32 226 350380 98.74 335 633960 63.69 48.23 80.93
Groundnut 6.72 81 12.05 94400 10.12 143 14.13 180450 50.60 76.54 17.22 91.15Sunflower 2.02 3 1.48 18000 3.85 18 4.68 30750 90.00 500.00 215.79 70.83Til 0.81 3 3.71 6000 1.21 4 3.29 7000 50.00 33.33 -11.11 16.67Oilseeds 9.55 87 118400 15.59 166 220552 63.14 90.80 86.28Brinjal 0.61 22 36.23 11000 0.89 47 52.77 26500 46.67 113.64 45.66 140.91Onion 2.02 332 164.01 55550 4.82 448 92.99 99300 138.00 34.94 -43.30 78.76Patato 0.00 0 0.00 0 0.08 2 24.70 1200 Tomato 0.20 3 14.82 1500 1.05 125 118.75 123600 420.00 4066.67 701.28 8140.00
Vegetables 3.24 362 71050 7.61 722 302100 135.00 99.45 325.19
Sugarcane 0.00 0 0.00 0 0.32 12 37.05 12000 KBK Rabi 81.21 614280 132.33 1308012 62.94 112.93
Source: Primary Data Survey
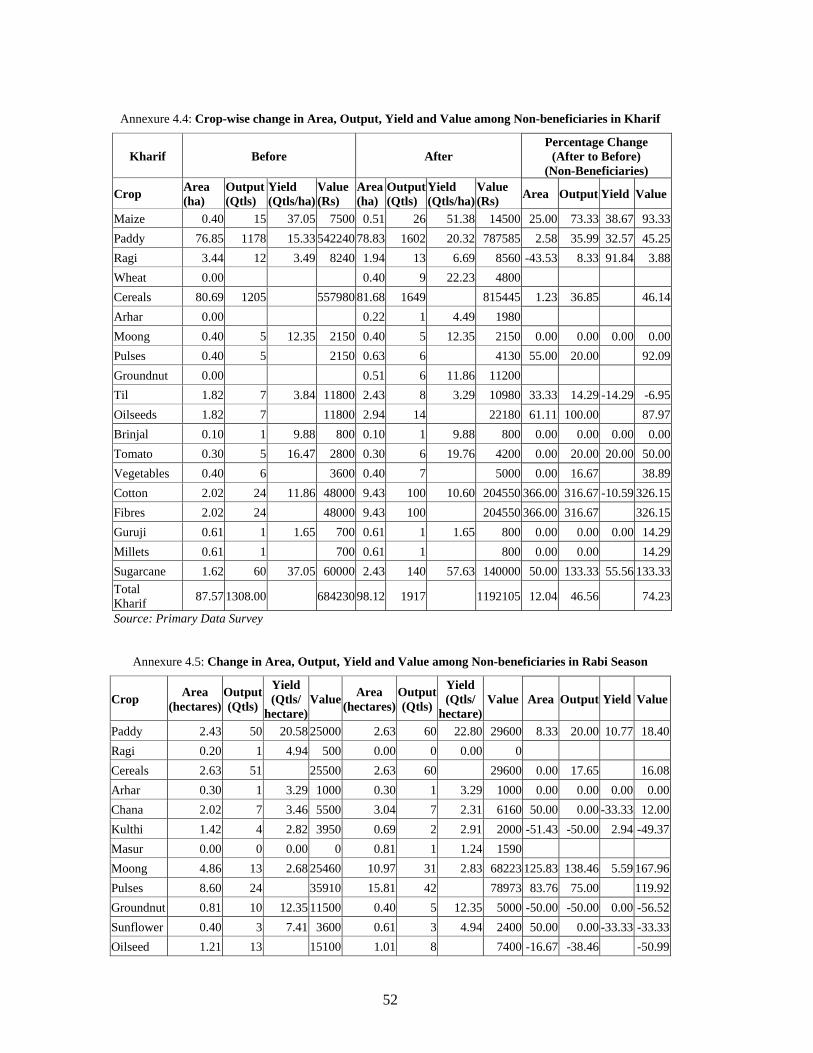
52
Annexure 4.4: Crop-wise change in Area, Output, Yield and Value among Non-beneficiaries in Kharif
Kharif Before After Percentage Change
(After to Before) (Non-Beneficiaries)
Crop Area (ha)
Output (Qtls)
Yield (Qtls/ha)
Value (Rs)
Area (ha)
Output (Qtls)
Yield (Qtls/ha)
Value (Rs) Area Output Yield Value
Maize 0.40 15 37.05 7500 0.51 26 51.38 14500 25.00 73.33 38.67 93.33Paddy 76.85 1178 15.33 542240 78.83 1602 20.32 787585 2.58 35.99 32.57 45.25Ragi 3.44 12 3.49 8240 1.94 13 6.69 8560 -43.53 8.33 91.84 3.88Wheat 0.00 0.40 9 22.23 4800 Cereals 80.69 1205 557980 81.68 1649 815445 1.23 36.85 46.14Arhar 0.00 0.22 1 4.49 1980 Moong 0.40 5 12.35 2150 0.40 5 12.35 2150 0.00 0.00 0.00 0.00Pulses 0.40 5 2150 0.63 6 4130 55.00 20.00 92.09Groundnut 0.00 0.51 6 11.86 11200 Til 1.82 7 3.84 11800 2.43 8 3.29 10980 33.33 14.29 -14.29 -6.95Oilseeds 1.82 7 11800 2.94 14 22180 61.11 100.00 87.97Brinjal 0.10 1 9.88 800 0.10 1 9.88 800 0.00 0.00 0.00 0.00Tomato 0.30 5 16.47 2800 0.30 6 19.76 4200 0.00 20.00 20.00 50.00Vegetables 0.40 6 3600 0.40 7 5000 0.00 16.67 38.89Cotton 2.02 24 11.86 48000 9.43 100 10.60 204550 366.00 316.67 -10.59 326.15Fibres 2.02 24 48000 9.43 100 204550 366.00 316.67 326.15Guruji 0.61 1 1.65 700 0.61 1 1.65 800 0.00 0.00 0.00 14.29Millets 0.61 1 700 0.61 1 800 0.00 0.00 14.29Sugarcane 1.62 60 37.05 60000 2.43 140 57.63 140000 50.00 133.33 55.56 133.33Total Kharif 87.57 1308.00 684230 98.12 1917 1192105 12.04 46.56 74.23
Source: Primary Data Survey
Annexure 4.5: Change in Area, Output, Yield and Value among Non-beneficiaries in Rabi Season
Crop Area (hectares)
Output (Qtls)
Yield (Qtls/
hectare) Value Area
(hectares)Output (Qtls)
Yield (Qtls/
hectare)Value Area Output Yield Value
Paddy 2.43 50 20.58 25000 2.63 60 22.80 29600 8.33 20.00 10.77 18.40Ragi 0.20 1 4.94 500 0.00 0 0.00 0 Cereals 2.63 51 25500 2.63 60 29600 0.00 17.65 16.08Arhar 0.30 1 3.29 1000 0.30 1 3.29 1000 0.00 0.00 0.00 0.00Chana 2.02 7 3.46 5500 3.04 7 2.31 6160 50.00 0.00 -33.33 12.00Kulthi 1.42 4 2.82 3950 0.69 2 2.91 2000 -51.43 -50.00 2.94 -49.37Masur 0.00 0 0.00 0 0.81 1 1.24 1590 Moong 4.86 13 2.68 25460 10.97 31 2.83 68223 125.83 138.46 5.59 167.96Pulses 8.60 24 35910 15.81 42 78973 83.76 75.00 119.92Groundnut 0.81 10 12.35 11500 0.40 5 12.35 5000 -50.00 -50.00 0.00 -56.52Sunflower 0.40 3 7.41 3600 0.61 3 4.94 2400 50.00 0.00 -33.33 -33.33Oilseed 1.21 13 15100 1.01 8 7400 -16.67 -38.46 -50.99
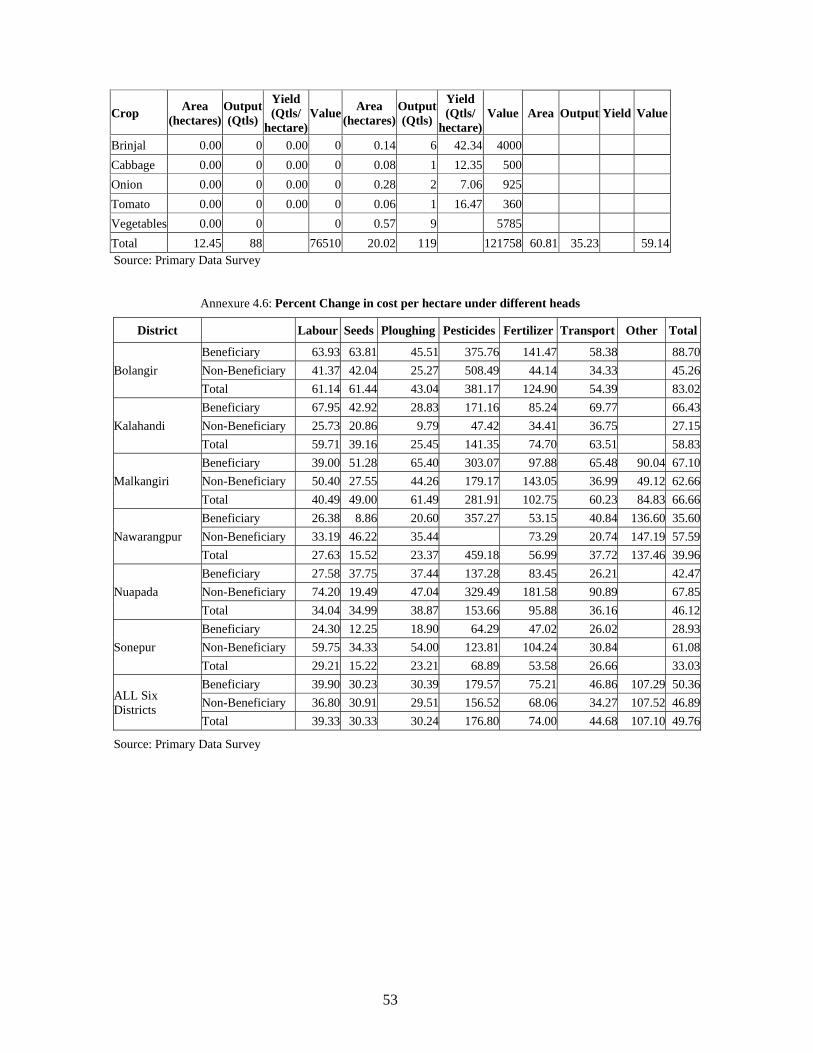
53
Crop Area (hectares)
Output (Qtls)
Yield (Qtls/
hectare) Value Area
(hectares)Output (Qtls)
Yield (Qtls/
hectare)Value Area Output Yield Value
Brinjal 0.00 0 0.00 0 0.14 6 42.34 4000 Cabbage 0.00 0 0.00 0 0.08 1 12.35 500 Onion 0.00 0 0.00 0 0.28 2 7.06 925 Tomato 0.00 0 0.00 0 0.06 1 16.47 360 Vegetables 0.00 0 0 0.57 9 5785 Total 12.45 88 76510 20.02 119 121758 60.81 35.23 59.14Source: Primary Data Survey
Annexure 4.6: Percent Change in cost per hectare under different heads
District Labour Seeds Ploughing Pesticides Fertilizer Transport Other Total
Bolangir Beneficiary 63.93 63.81 45.51 375.76 141.47 58.38 88.70Non-Beneficiary 41.37 42.04 25.27 508.49 44.14 34.33 45.26Total 61.14 61.44 43.04 381.17 124.90 54.39 83.02
Kalahandi Beneficiary 67.95 42.92 28.83 171.16 85.24 69.77 66.43Non-Beneficiary 25.73 20.86 9.79 47.42 34.41 36.75 27.15Total 59.71 39.16 25.45 141.35 74.70 63.51 58.83
Malkangiri Beneficiary 39.00 51.28 65.40 303.07 97.88 65.48 90.04 67.10Non-Beneficiary 50.40 27.55 44.26 179.17 143.05 36.99 49.12 62.66Total 40.49 49.00 61.49 281.91 102.75 60.23 84.83 66.66
Nawarangpur Beneficiary 26.38 8.86 20.60 357.27 53.15 40.84 136.60 35.60Non-Beneficiary 33.19 46.22 35.44 73.29 20.74 147.19 57.59Total 27.63 15.52 23.37 459.18 56.99 37.72 137.46 39.96
Nuapada Beneficiary 27.58 37.75 37.44 137.28 83.45 26.21 42.47Non-Beneficiary 74.20 19.49 47.04 329.49 181.58 90.89 67.85Total 34.04 34.99 38.87 153.66 95.88 36.16 46.12
Sonepur Beneficiary 24.30 12.25 18.90 64.29 47.02 26.02 28.93Non-Beneficiary 59.75 34.33 54.00 123.81 104.24 30.84 61.08Total 29.21 15.22 23.21 68.89 53.58 26.66 33.03
ALL Six Districts
Beneficiary 39.90 30.23 30.39 179.57 75.21 46.86 107.29 50.36Non-Beneficiary 36.80 30.91 29.51 156.52 68.06 34.27 107.52 46.89Total 39.33 30.33 30.24 176.80 74.00 44.68 107.10 49.76
Source: Primary Data Survey
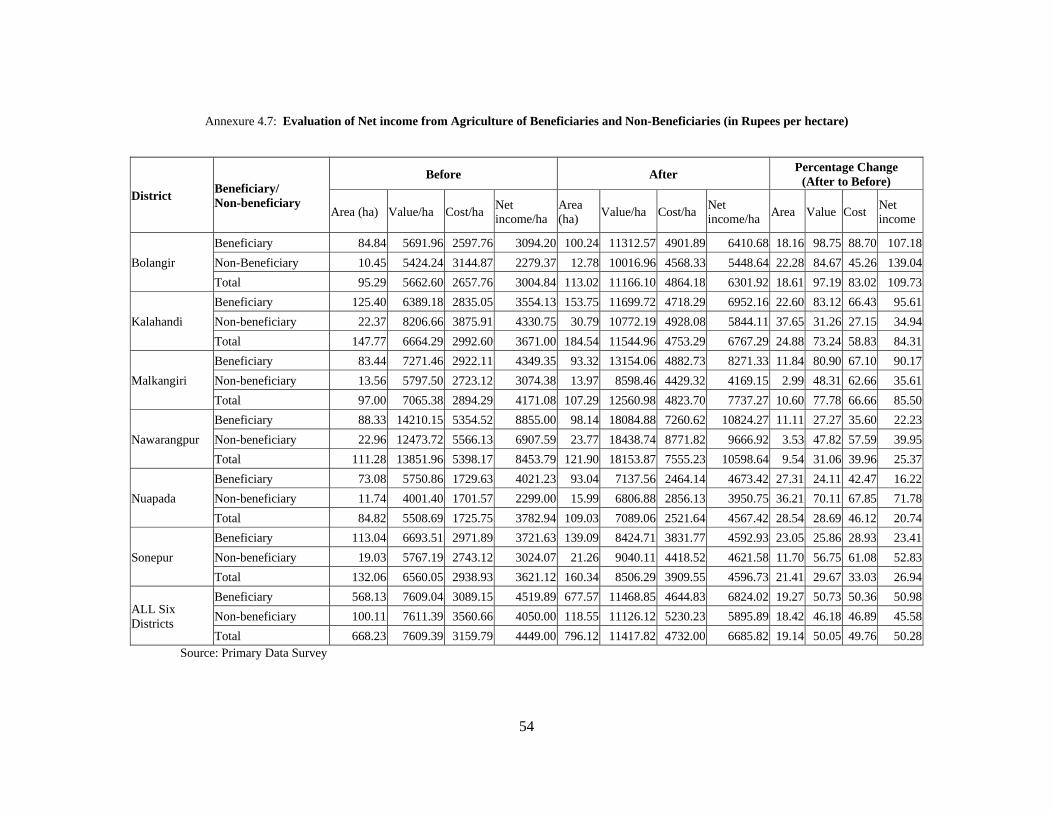
54
Annexure 4.7: Evaluation of Net income from Agriculture of Beneficiaries and Non-Beneficiaries (in Rupees per hectare)
District Beneficiary/ Non-beneficiary
Before After Percentage Change (After to Before)
Area (ha) Value/ha Cost/ha Net income/ha
Area (ha) Value/ha Cost/ha Net
income/ha Area Value Cost Net income
Bolangir Beneficiary 84.84 5691.96 2597.76 3094.20 100.24 11312.57 4901.89 6410.68 18.16 98.75 88.70 107.18Non-Beneficiary 10.45 5424.24 3144.87 2279.37 12.78 10016.96 4568.33 5448.64 22.28 84.67 45.26 139.04Total 95.29 5662.60 2657.76 3004.84 113.02 11166.10 4864.18 6301.92 18.61 97.19 83.02 109.73
Kalahandi Beneficiary 125.40 6389.18 2835.05 3554.13 153.75 11699.72 4718.29 6952.16 22.60 83.12 66.43 95.61Non-beneficiary 22.37 8206.66 3875.91 4330.75 30.79 10772.19 4928.08 5844.11 37.65 31.26 27.15 34.94Total 147.77 6664.29 2992.60 3671.00 184.54 11544.96 4753.29 6767.29 24.88 73.24 58.83 84.31
Malkangiri Beneficiary 83.44 7271.46 2922.11 4349.35 93.32 13154.06 4882.73 8271.33 11.84 80.90 67.10 90.17Non-beneficiary 13.56 5797.50 2723.12 3074.38 13.97 8598.46 4429.32 4169.15 2.99 48.31 62.66 35.61Total 97.00 7065.38 2894.29 4171.08 107.29 12560.98 4823.70 7737.27 10.60 77.78 66.66 85.50
Nawarangpur Beneficiary 88.33 14210.15 5354.52 8855.00 98.14 18084.88 7260.62 10824.27 11.11 27.27 35.60 22.23Non-beneficiary 22.96 12473.72 5566.13 6907.59 23.77 18438.74 8771.82 9666.92 3.53 47.82 57.59 39.95Total 111.28 13851.96 5398.17 8453.79 121.90 18153.87 7555.23 10598.64 9.54 31.06 39.96 25.37
Nuapada Beneficiary 73.08 5750.86 1729.63 4021.23 93.04 7137.56 2464.14 4673.42 27.31 24.11 42.47 16.22Non-beneficiary 11.74 4001.40 1701.57 2299.00 15.99 6806.88 2856.13 3950.75 36.21 70.11 67.85 71.78Total 84.82 5508.69 1725.75 3782.94 109.03 7089.06 2521.64 4567.42 28.54 28.69 46.12 20.74
Sonepur Beneficiary 113.04 6693.51 2971.89 3721.63 139.09 8424.71 3831.77 4592.93 23.05 25.86 28.93 23.41Non-beneficiary 19.03 5767.19 2743.12 3024.07 21.26 9040.11 4418.52 4621.58 11.70 56.75 61.08 52.83Total 132.06 6560.05 2938.93 3621.12 160.34 8506.29 3909.55 4596.73 21.41 29.67 33.03 26.94
ALL Six Districts
Beneficiary 568.13 7609.04 3089.15 4519.89 677.57 11468.85 4644.83 6824.02 19.27 50.73 50.36 50.98Non-beneficiary 100.11 7611.39 3560.66 4050.00 118.55 11126.12 5230.23 5895.89 18.42 46.18 46.89 45.58Total 668.23 7609.39 3159.79 4449.00 796.12 11417.82 4732.00 6685.82 19.14 50.05 49.76 50.28
Source: Primary Data Survey
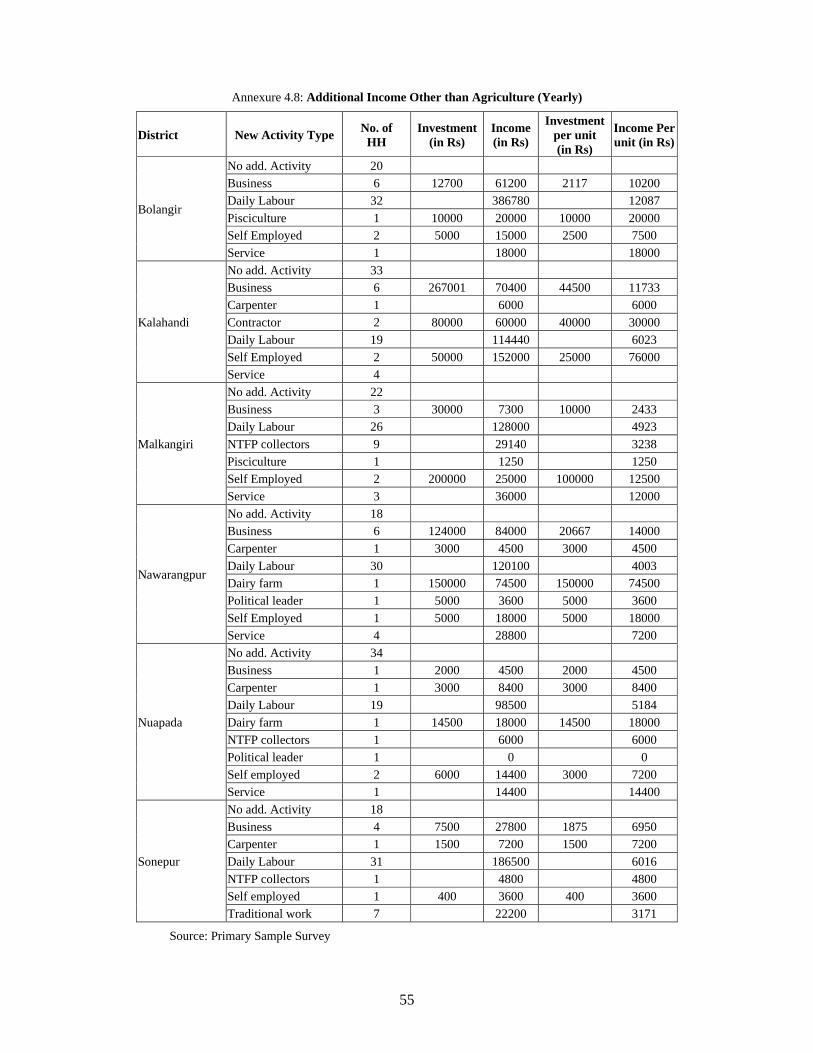
55
Annexure 4.8: Additional Income Other than Agriculture (Yearly)
District New Activity Type No. of HH
Investment (in Rs)
Income (in Rs)
Investment per unit (in Rs)
Income Per unit (in Rs)
Bolangir
No add. Activity 20 Business 6 12700 61200 2117 10200 Daily Labour 32 386780 12087 Pisciculture 1 10000 20000 10000 20000 Self Employed 2 5000 15000 2500 7500 Service 1 18000 18000
Kalahandi
No add. Activity 33 Business 6 267001 70400 44500 11733 Carpenter 1 6000 6000 Contractor 2 80000 60000 40000 30000 Daily Labour 19 114440 6023 Self Employed 2 50000 152000 25000 76000 Service 4
Malkangiri
No add. Activity 22 Business 3 30000 7300 10000 2433 Daily Labour 26 128000 4923 NTFP collectors 9 29140 3238 Pisciculture 1 1250 1250 Self Employed 2 200000 25000 100000 12500 Service 3 36000 12000
Nawarangpur
No add. Activity 18 Business 6 124000 84000 20667 14000 Carpenter 1 3000 4500 3000 4500 Daily Labour 30 120100 4003 Dairy farm 1 150000 74500 150000 74500 Political leader 1 5000 3600 5000 3600 Self Employed 1 5000 18000 5000 18000 Service 4 28800 7200
Nuapada
No add. Activity 34 Business 1 2000 4500 2000 4500 Carpenter 1 3000 8400 3000 8400 Daily Labour 19 98500 5184 Dairy farm 1 14500 18000 14500 18000 NTFP collectors 1 6000 6000 Political leader 1 0 0 Self employed 2 6000 14400 3000 7200 Service 1 14400 14400
Sonepur
No add. Activity 18 Business 4 7500 27800 1875 6950 Carpenter 1 1500 7200 1500 7200 Daily Labour 31 186500 6016 NTFP collectors 1 4800 4800 Self employed 1 400 3600 400 3600 Traditional work 7 22200 3171
Source: Primary Sample Survey
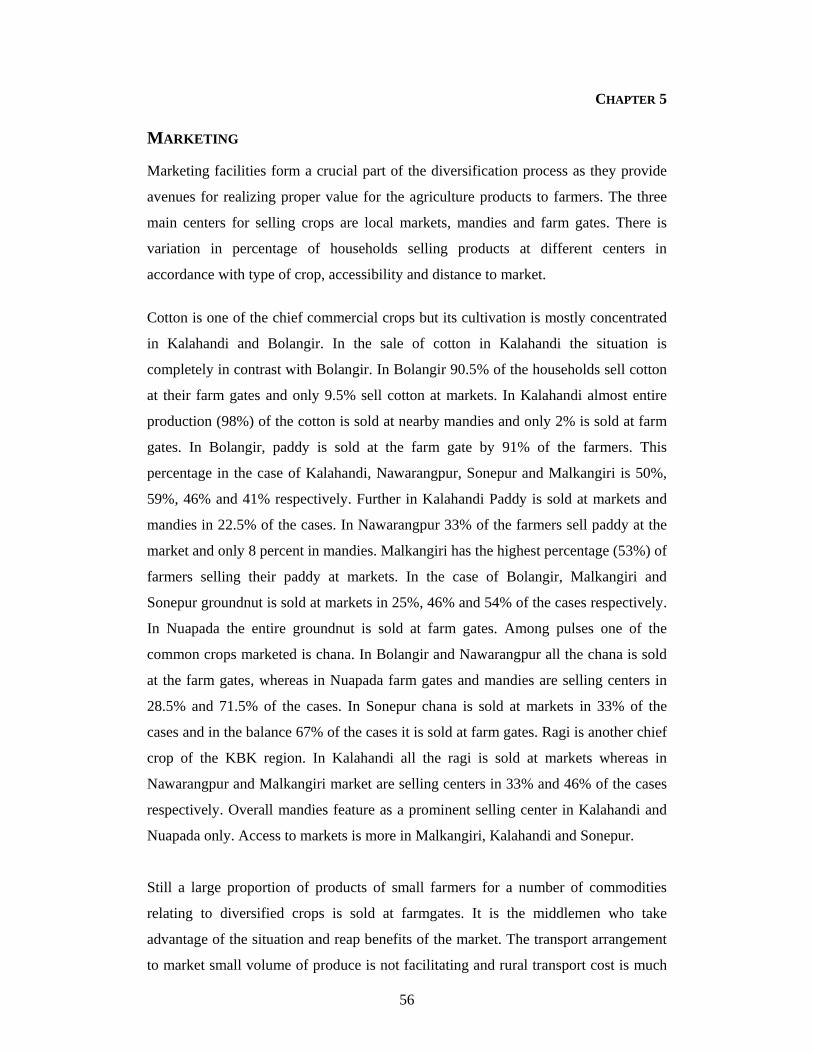
56
CHAPTER 5 MARKETING Marketing facilities form a crucial part of the diversification process as they provide
avenues for realizing proper value for the agriculture products to farmers. The three
main centers for selling crops are local markets, mandies and farm gates. There is
variation in percentage of households selling products at different centers in
accordance with type of crop, accessibility and distance to market.
Cotton is one of the chief commercial crops but its cultivation is mostly concentrated
in Kalahandi and Bolangir. In the sale of cotton in Kalahandi the situation is
completely in contrast with Bolangir. In Bolangir 90.5% of the households sell cotton
at their farm gates and only 9.5% sell cotton at markets. In Kalahandi almost entire
production (98%) of the cotton is sold at nearby mandies and only 2% is sold at farm
gates. In Bolangir, paddy is sold at the farm gate by 91% of the farmers. This
percentage in the case of Kalahandi, Nawarangpur, Sonepur and Malkangiri is 50%,
59%, 46% and 41% respectively. Further in Kalahandi Paddy is sold at markets and
mandies in 22.5% of the cases. In Nawarangpur 33% of the farmers sell paddy at the
market and only 8 percent in mandies. Malkangiri has the highest percentage (53%) of
farmers selling their paddy at markets. In the case of Bolangir, Malkangiri and
Sonepur groundnut is sold at markets in 25%, 46% and 54% of the cases respectively.
In Nuapada the entire groundnut is sold at farm gates. Among pulses one of the
common crops marketed is chana. In Bolangir and Nawarangpur all the chana is sold
at the farm gates, whereas in Nuapada farm gates and mandies are selling centers in
28.5% and 71.5% of the cases. In Sonepur chana is sold at markets in 33% of the
cases and in the balance 67% of the cases it is sold at farm gates. Ragi is another chief
crop of the KBK region. In Kalahandi all the ragi is sold at markets whereas in
Nawarangpur and Malkangiri market are selling centers in 33% and 46% of the cases
respectively. Overall mandies feature as a prominent selling center in Kalahandi and
Nuapada only. Access to markets is more in Malkangiri, Kalahandi and Sonepur.
Still a large proportion of products of small farmers for a number of commodities
relating to diversified crops is sold at farmgates. It is the middlemen who take
advantage of the situation and reap benefits of the market. The transport arrangement
to market small volume of produce is not facilitating and rural transport cost is much
57
higher than the urban transport cost. As transaction cost in rural areas is high,
substantial portion of benefits that could have been derived by the farmers engaged in
diversifying their cropping pattern in fact goes to middlemen. (for details see
annexure 5.1) District wise Sale of Produce In Bolangir the average price of cotton is marginally higher in the mandi (Rs
2100/qntl) as compared to price at farmgate (Rs 2050/qntl). Price of paddy at the local
market and mandi are the same (Rs 500/qntl) and 8% less at the farm gate (Rs
460/qntl). In Kalahandi there is not much difference in average paddy prices between
farmgates and local markets (Rs 490/qntl and Rs 493/qntl respectively) but the
maximum price at mandies is substantially higher i.e. Rs 570/qntl in comparison to Rs
490/qntl at farmgates. In Malkangiri average prices of paddy at farmgates, market and
mandies are Rs 457/qntl, Rs 490/qntl and Rs 520/qntl. In Nawarangpur paddy sold at
farm gates averages Rs 467/qntl in comparison to Rs 500/qntl at mandies. Paddy in
Nuapada is sold at the almost the same rate (about Rs 475/qntl) both at markets and
farmgates. In the above district moong fetches a higher average price in Markets (Rs
2350/qntl). However, groundnut sold at local markets fetches a much higher average
price (Rs 1200/qntl) in comparison to farm gates (Rs 750/qntl). (for details see
annexure 5.1)
The disposal of the
produce after the harvest
and the return obtained
have a significant effect
on production and on the
welfare of the cultivator.
Production in agriculture being seasonal, the crop is harvested during a short period
and consumed gradually. While commodities like cotton and groundnut require large
storage space which the average cultivator lacks, fruits, vegetables and sugarcane are
of a perishable nature. The farmer has, therefore, to dispose of his surplus
immediately either at the village or at the mandi. In the absence of staying power the
large number of small farmers compete with each other and the markets witness
conditions of occasional glut and scarcity. A major part of the commercial crops like
cotton, jute, sugarcane and oilseeds has to be marketed immediately as the farmers are
58
in need of cash for meeting their dues and other expenses. As regards food grains the
marketable surplus varies by crops and regions but may be placed at about 20 to 30
per cent under normal conditions. The total quantity and value of the marketed
produce, even in a predominantly subsistence economy as in Orissa is considerable.
(for details see Annexure 5.2)
Storage and Warehousing1 Another difficulty that the societies encounter relates to storage facilities. Most of the
surplus produce in an area is assembled and sold at the mandi or market. Release of
goods and their dispatch either on consignment or sale can be arranged more quickly
from the godowns at the mandi than from those located in the rural areas. It would,
therefore, be an advantage to develop storage facilities at mandi centres. Some
godowns space-temporary, semi-temporary or permanent are available in every
mandi. This accommodation is often unsatisfactory as it fails to provide adequate
protection to goods from damage and deterioration by moisture, rodents, insects,
pests, etc. Moreover, even for getting such space, fairly high rent has to be paid. So it
is necessary to develop the infrastructure of mandi by which farmers will get more
benefit.
Establishment of Market Yards under RLTAP
Under RLTAP scheme in KBK district marketing facilities have been provided so that
farmers can get a reasonable price for their produce. In Malkangiri district 8 market
yards are functioning in different places under the Malkangiri RMC. In Nawarangapur
district two market yards are functioning at Raighar and Umerkote under the
Nawarangpur RMC. Bolangir district has two RMCs, at Bolangir and Kantabanjhi
with 1 and 2 market yards respectively. Sonepur district has an RMC at Dunguripalli
where there is a single market yard. Kalahandi district has three RMCs at Mukhiguda,
Junagarh and Bhawanipatna with 2 market yards, 1 market yard and 1market yard
under these RMCs respectively. In Nuapada one market yard has been established at
Boden under the Khariar Road RMC. A market yard has also been established at
Kotpad under Jeypore RMC of Koraput district. The total project cost of market yards
established under RLTAP in the KBK Districts is 420 lakhs @ of 20 lakhs per market
yard. This cost also includes 20 lakhs in terms of support services under the Orissa 1 Source: from ws.ori.nic/diorissa/market.htm
59
State Agri-Marketing Board. The Government share for the above market yards is
90% amounting to a total of 396 lakhs. The RMC share is 10% of the total cost
amounting to a total of Rs. 24 lakhs. In Malkangiri district market yards have been
constructed without any sharing of cost by the RMC and the total cost has been borne
by the Government This district has been given special assistance due most
undeveloped and extremist prone area. Farmers face problems in selling their
produces by covering a long distance from their farm gate. So to facilitate the farmers
it is necessary to establish more market yards in those districts having least number of
market yards. (for details on Financial expenditure see annexure 5.3)
Facilities at Established Market Yards in the surveyed districts (2002-03)
Bolangir: Under Bolangir RMC Tusura subsidiary market yard has been established
with two godowns of 250 MT and 500 MT capacity. There are two covered pindies and
an auction hall. The market yard also has an open auction pindi along with a paddy
cleaner, mini grader, weighing scale and moisture meter. Three tube wells have also
been provided. Under Kantabanji RMC, Mandal and Moribahal subsidiary markets have
been established. The Muribahal subsidiary market yard has a godown of 500 MT
capacity, 4 open pindies, an auction hall and four farmers’ information centres. The
Mandal subsidiary market yard has a godown of 500 MT capacity, four open pindies, a
covered pindi and a tube well.
Kalahandi: In 2002-03 Ladugaon and Bandanakana subsidiary market yards were
established. In the same year Charbahal and Biswanathpur subsidiary market yards
were established under Junagarh and Bhawanipatna RMC. Through these market
yards 5 godowns with a total capacity of 2100 MT, 2 open auction pindies, one open
pindi, 7 drying platforms and 2 auction halls have been constructed. Further facilities
such as farmers restshed and farmers’ information centres have also been established.
Malkangiri: In Malkangiri RMC Padia, MV-72, Bhejangiwada, MV-79, Potteru,
Korukonda, Bhejaguda subsidiary market yards were established in 2002-03. As a
whole these market yards provide facilities for storage in 4 godowns with a total
capacity of 400 MT. There are 72 open pindies, 16 covered pindies, 8 tube wells, 12
shop rooms and 7 internal roads in total. Farmers rest shed and sanitation facilities
have been provided in all the market yards.
60
Nawarangpur: Under Nawarangpur RMC Raigarh and Umarkotte subsidiary market
yards have been established. In Raigarh subsidiary market yard there are 25 godowns,
24 numbers with a capacity of 20 MT and one with a capacity of 1000 MT. There are
8 open pindies and 24 shop rooms. There is also a staff quarter and an office building
with electrification and sanitation facilities. Umerkote subsidiary market yard has 33
godowns one with a capacity of 1000 MT and the rest with capacity of 20 MT each.
There is also a drying platform along with four open pindies four covered pindies,
four auction pindies along with four shop rooms. Further grading facilities include a
mechanized paddy cleaner and a cooling chamber. Electrification and water facilities
have also been provided.
Nuapada: Under Khariar road RMC Boden subsidiary market yard has been
established with 12 open pindies, two covered pindies, 2 tube wells and a watchman
shed.
Sonepur: In Dunguripalli principal market yard 21 godowns 16 with a capacity of 25
MT and 5 with a capacity of 50 MT have been constructed. There are also five open
pindies one covered pindi, one auction hall. One mechanized paddy cleaner with a
capacity of 5 tonnes per hour, 3 small paddy cleaners, one automatic weighing and
bagging machine, a weigh bridge with a capacity of 25 MT, a min grader, four
weighing scales and two moisture meters have been provided. Water facilities include
a tube well and a bore well. Sanitation and electrification facilities have also been
provided.
Facilities provided to KBK Districts under RLTAP in 2003-04 in terms of Marketing
Grading Facilities and Cooling Chambers
The introduction of proper grades and standards is another matter with regard to
which the assistance is provide by the RMCs. Grading of farmers' produce before sale
on the basis of well defined grades in a regulated market will help in the proper
valuation of their produce which will enable them to claim a price commensurate with
the quality offered, thus providing an incentive to improve its quality, Grade standards
are also necessary as a basis for the issue of negotiable receipts by development of
public storage facilities.
61
Two mini grading units have been established each at Nawarangpur, Malkangiri,
Dunguripalli, Bolangir, Kantabanjhi, Mukhiguda, Kesinga, Bhawanipatna, Khariar
Road, Jeypore, Dumuriput and Gunupur whereas in Birmaharajpur and Junagarh 1
and 3 grading units have been established respectively. The total Project cost is 15
lakhs at 0.5 lakhs per unit. The cost for the installment of these units is totally borne
by the Government. Even though efforts have been made to help farmers by the
establishment of these grading units the number of units is still insufficient. In total 8
cooling chambers or cold rooms have been opened at market yards in Koraput,
Jeypore and Nawarangpur. The total project cost for these Cooling chambers is 40
lakhs which has been sanctioned by the Government @ rate of Rs 5 lakhs per cooling
chamber.
Electrification of Market yards
Electrification is necessary for the operation of many market facilities such as
grading, operation of mechanized paddy cleaners and functioning of cooling
chambers. A total of 8 market yards have been electrified at Dunguripalli Sonepur)
(1), Bolangir (2), Kantabanjhi (2), Kesinga (2) and Kahariar Road (1) at a total project
cost of 12 lakhs @ of 1.5 lakhs per market yard.
Mechanized Paddy Cleaners
Six mechanized paddy cleaners have been installed at Nawarangpur, Bolangir,
Junagarh, Khariar Road, Jeypore and Gunupur at a total cost of 66 lakhs @ 11 lakhs
per installation.
Additional Market Yards A total cost of Rs 47.77 lakhs was provisioned for the development of market yards
out of which 43 lakhs had been sanctioned in 2003-04.
(for details see Annexure 5.4)
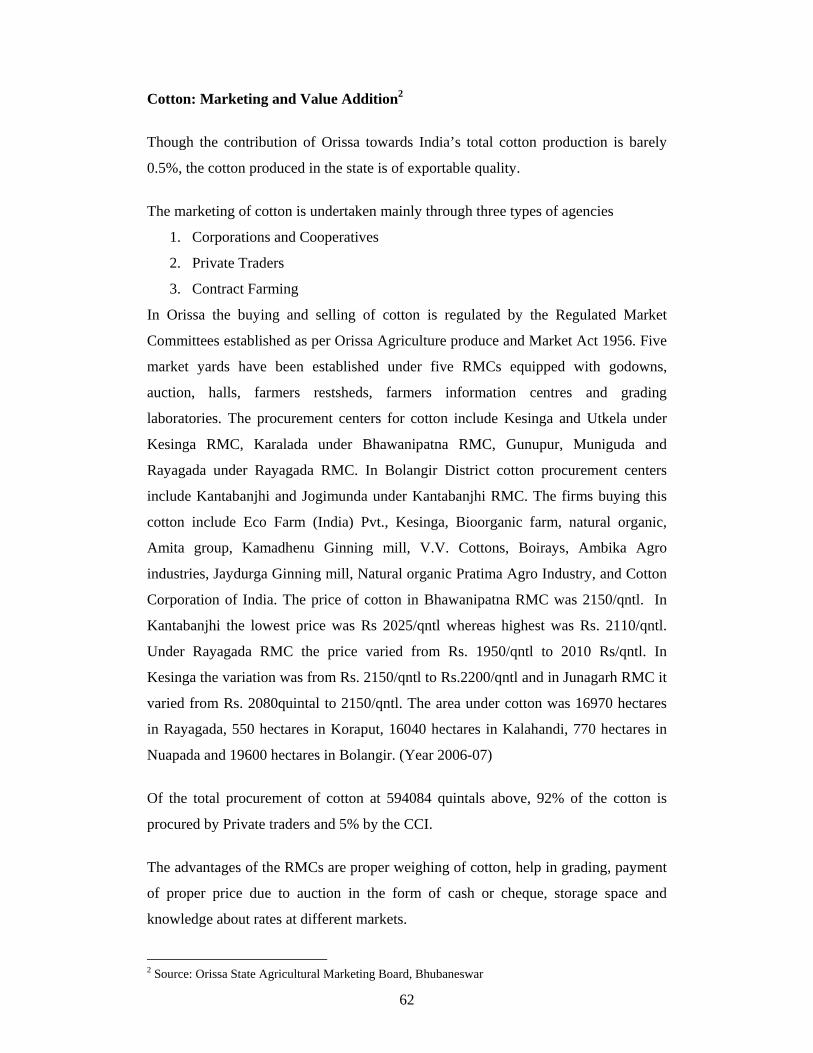
62
Cotton: Marketing and Value Addition2
Though the contribution of Orissa towards India’s total cotton production is barely
0.5%, the cotton produced in the state is of exportable quality.
The marketing of cotton is undertaken mainly through three types of agencies
1. Corporations and Cooperatives
2. Private Traders
3. Contract Farming
In Orissa the buying and selling of cotton is regulated by the Regulated Market
Committees established as per Orissa Agriculture produce and Market Act 1956. Five
market yards have been established under five RMCs equipped with godowns,
auction, halls, farmers restsheds, farmers information centres and grading
laboratories. The procurement centers for cotton include Kesinga and Utkela under
Kesinga RMC, Karalada under Bhawanipatna RMC, Gunupur, Muniguda and
Rayagada under Rayagada RMC. In Bolangir District cotton procurement centers
include Kantabanjhi and Jogimunda under Kantabanjhi RMC. The firms buying this
cotton include Eco Farm (India) Pvt., Kesinga, Bioorganic farm, natural organic,
Amita group, Kamadhenu Ginning mill, V.V. Cottons, Boirays, Ambika Agro
industries, Jaydurga Ginning mill, Natural organic Pratima Agro Industry, and Cotton
Corporation of India. The price of cotton in Bhawanipatna RMC was 2150/qntl. In
Kantabanjhi the lowest price was Rs 2025/qntl whereas highest was Rs. 2110/qntl.
Under Rayagada RMC the price varied from Rs. 1950/qntl to 2010 Rs/qntl. In
Kesinga the variation was from Rs. 2150/qntl to Rs.2200/qntl and in Junagarh RMC it
varied from Rs. 2080quintal to 2150/qntl. The area under cotton was 16970 hectares
in Rayagada, 550 hectares in Koraput, 16040 hectares in Kalahandi, 770 hectares in
Nuapada and 19600 hectares in Bolangir. (Year 2006-07)
Of the total procurement of cotton at 594084 quintals above, 92% of the cotton is
procured by Private traders and 5% by the CCI.
The advantages of the RMCs are proper weighing of cotton, help in grading, payment
of proper price due to auction in the form of cash or cheque, storage space and
knowledge about rates at different markets.
2 Source: Orissa State Agricultural Marketing Board, Bhubaneswar
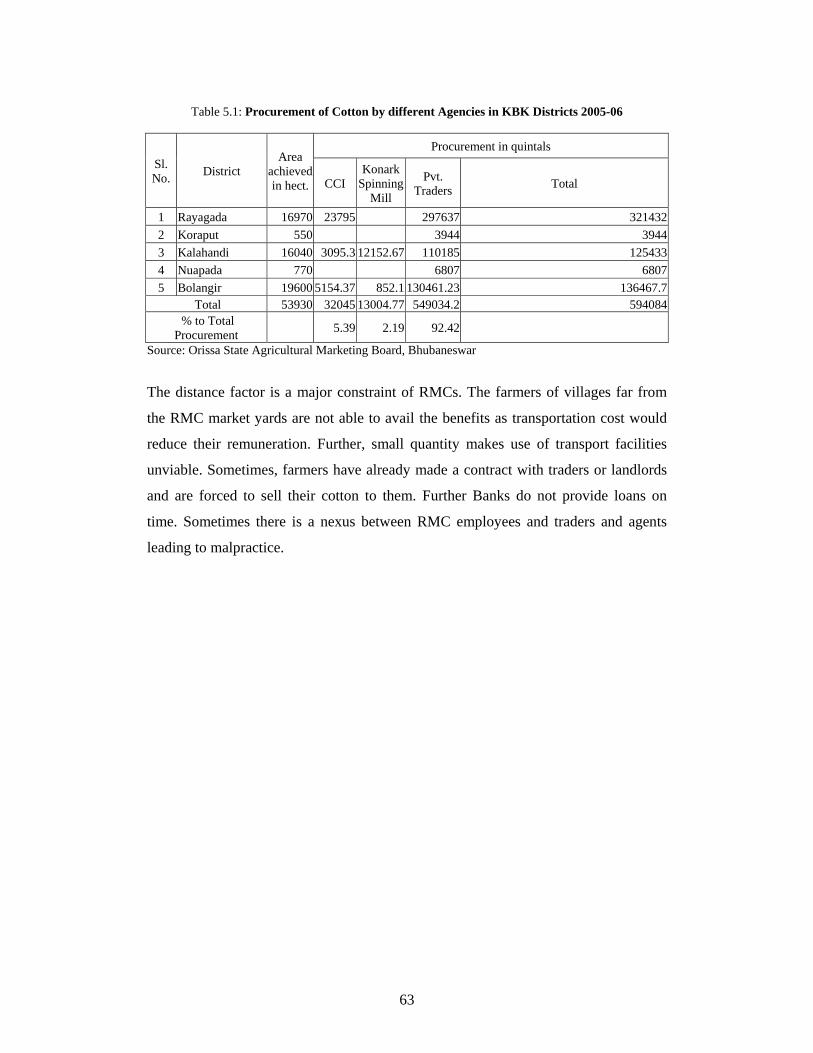
63
Table 5.1: Procurement of Cotton by different Agencies in KBK Districts 2005-06
Sl. No. District
Area achieved in hect.
Procurement in quintals
CCI Konark
Spinning Mill
Pvt. Traders Total
1 Rayagada 16970 23795 297637 3214322 Koraput 550 3944 39443 Kalahandi 16040 3095.3 12152.67 110185 1254334 Nuapada 770 6807 68075 Bolangir 19600 5154.37 852.1 130461.23 136467.7
Total 53930 32045 13004.77 549034.2 594084 % to Total
Procurement 5.39 2.19 92.42
Source: Orissa State Agricultural Marketing Board, Bhubaneswar
The distance factor is a major constraint of RMCs. The farmers of villages far from
the RMC market yards are not able to avail the benefits as transportation cost would
reduce their remuneration. Further, small quantity makes use of transport facilities
unviable. Sometimes, farmers have already made a contract with traders or landlords
and are forced to sell their cotton to them. Further Banks do not provide loans on
time. Sometimes there is a nexus between RMC employees and traders and agents
leading to malpractice.
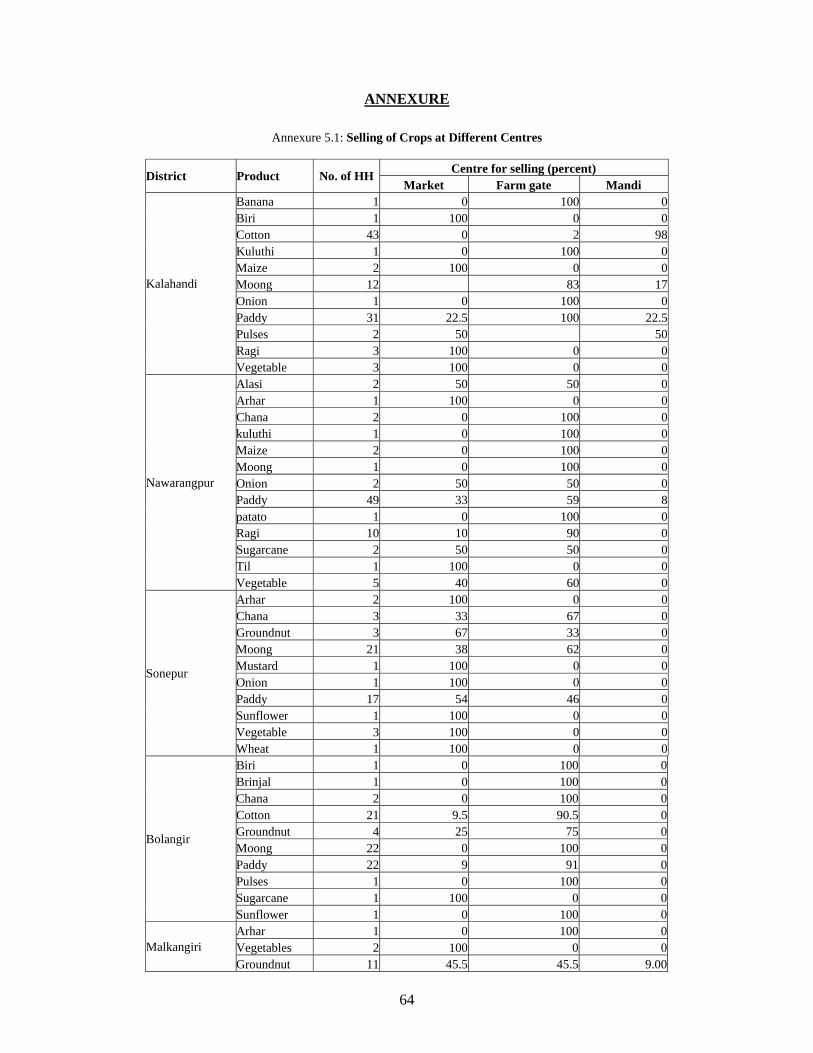
64
ANNEXURE
Annexure 5.1: Selling of Crops at Different Centres
District Product No. of HH Centre for selling (percent) Market Farm gate Mandi
Kalahandi
Banana 1 0 100 0Biri 1 100 0 0Cotton 43 0 2 98Kuluthi 1 0 100 0Maize 2 100 0 0Moong 12 83 17Onion 1 0 100 0Paddy 31 22.5 100 22.5Pulses 2 50 50Ragi 3 100 0 0Vegetable 3 100 0 0
Nawarangpur
Alasi 2 50 50 0Arhar 1 100 0 0Chana 2 0 100 0kuluthi 1 0 100 0Maize 2 0 100 0Moong 1 0 100 0Onion 2 50 50 0Paddy 49 33 59 8patato 1 0 100 0Ragi 10 10 90 0Sugarcane 2 50 50 0Til 1 100 0 0Vegetable 5 40 60 0
Sonepur
Arhar 2 100 0 0Chana 3 33 67 0Groundnut 3 67 33 0Moong 21 38 62 0Mustard 1 100 0 0Onion 1 100 0 0Paddy 17 54 46 0Sunflower 1 100 0 0Vegetable 3 100 0 0Wheat 1 100 0 0
Bolangir
Biri 1 0 100 0Brinjal 1 0 100 0Chana 2 0 100 0Cotton 21 9.5 90.5 0Groundnut 4 25 75 0Moong 22 0 100 0Paddy 22 9 91 0Pulses 1 0 100 0Sugarcane 1 100 0 0Sunflower 1 0 100 0
Malkangiri Arhar 1 0 100 0Vegetables 2 100 0 0Groundnut 11 45.5 45.5 9.00
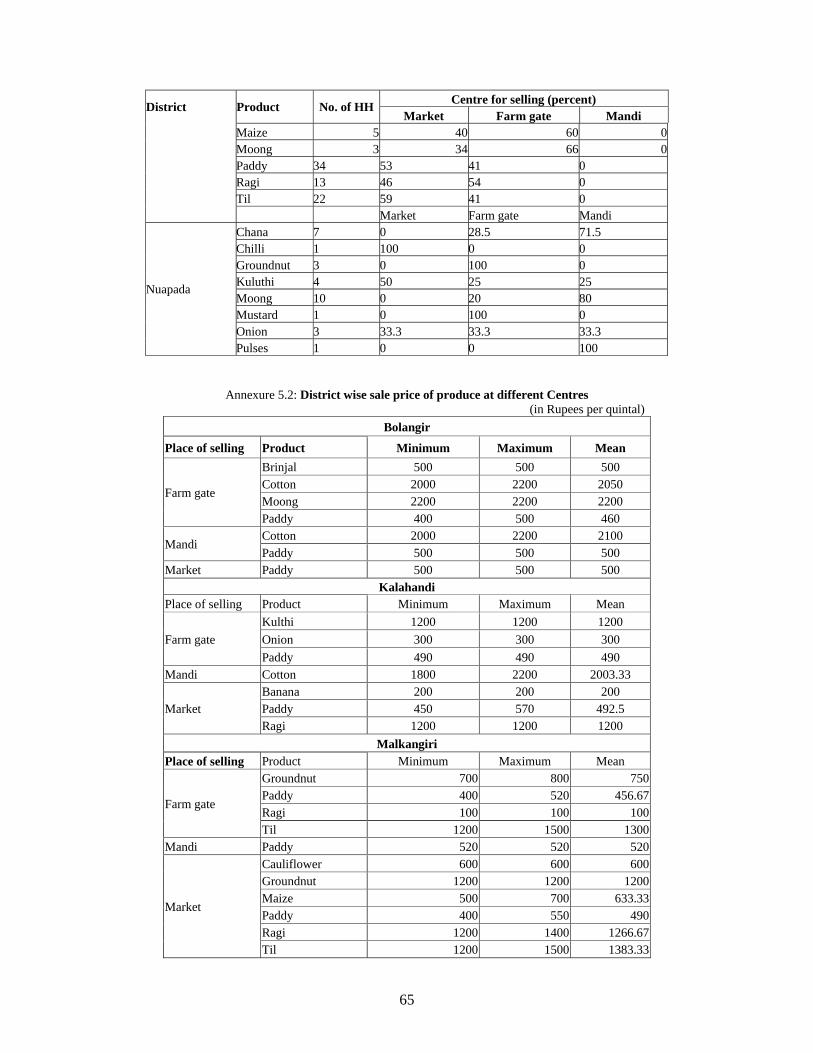
65
District Product No. of HH Centre for selling (percent) Market Farm gate Mandi
Maize 5 40 60 0Moong 3 34 66 0Paddy 34 53 41 0 Ragi 13 46 54 0 Til 22 59 41 0 Market Farm gate Mandi
Nuapada
Chana 7 0 28.5 71.5 Chilli 1 100 0 0 Groundnut 3 0 100 0 Kuluthi 4 50 25 25 Moong 10 0 20 80 Mustard 1 0 100 0 Onion 3 33.3 33.3 33.3 Pulses 1 0 0 100
Annexure 5.2: District wise sale price of produce at different Centres (in Rupees per quintal)
Bolangir
Place of selling Product Minimum Maximum Mean
Farm gate
Brinjal 500 500 500 Cotton 2000 2200 2050 Moong 2200 2200 2200 Paddy 400 500 460
Mandi Cotton 2000 2200 2100 Paddy 500 500 500
Market Paddy 500 500 500 Kalahandi
Place of selling Product Minimum Maximum Mean
Farm gate Kulthi 1200 1200 1200 Onion 300 300 300 Paddy 490 490 490
Mandi Cotton 1800 2200 2003.33
Market Banana 200 200 200 Paddy 450 570 492.5 Ragi 1200 1200 1200
Malkangiri Place of selling Product Minimum Maximum Mean
Farm gate
Groundnut 700 800 750 Paddy 400 520 456.67 Ragi 100 100 100 Til 1200 1500 1300
Mandi Paddy 520 520 520
Market
Cauliflower 600 600 600 Groundnut 1200 1200 1200 Maize 500 700 633.33 Paddy 400 550 490 Ragi 1200 1400 1266.67 Til 1200 1500 1383.33
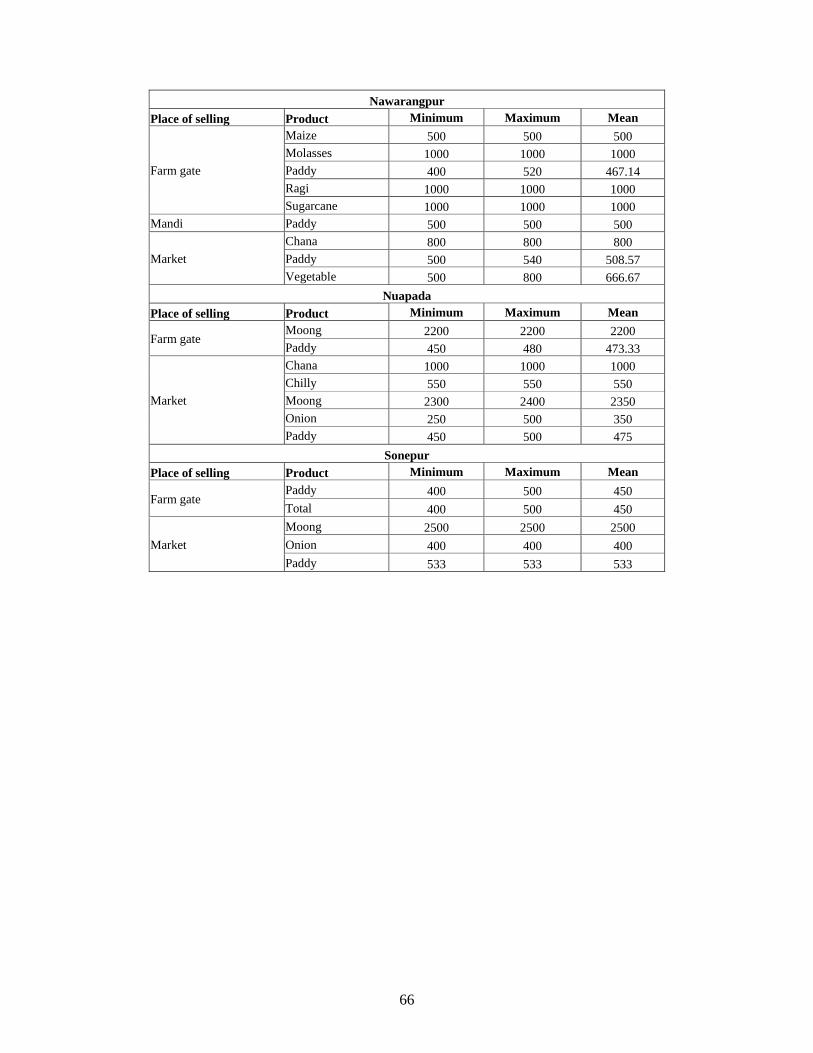
66
Nawarangpur Place of selling Product Minimum Maximum Mean
Farm gate
Maize 500 500 500 Molasses 1000 1000 1000 Paddy 400 520 467.14 Ragi 1000 1000 1000 Sugarcane 1000 1000 1000
Mandi Paddy 500 500 500
Market Chana 800 800 800 Paddy 500 540 508.57 Vegetable 500 800 666.67
Nuapada Place of selling Product Minimum Maximum Mean
Farm gate Moong 2200 2200 2200 Paddy 450 480 473.33
Market
Chana 1000 1000 1000 Chilly 550 550 550 Moong 2300 2400 2350 Onion 250 500 350 Paddy 450 500 475
Sonepur Place of selling Product Minimum Maximum Mean
Farm gate Paddy 400 500 450 Total 400 500 450
Market Moong 2500 2500 2500 Onion 400 400 400 Paddy 533 533 533
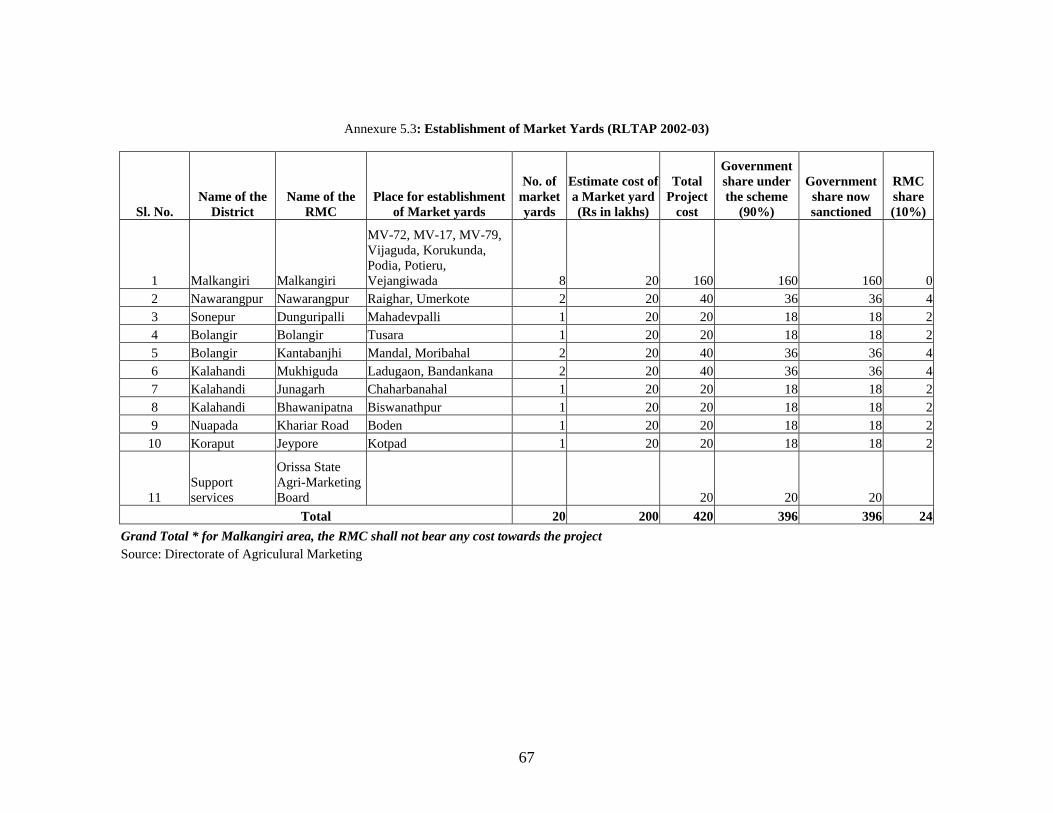
67
Annexure 5.3: Establishment of Market Yards (RLTAP 2002-03)
Sl. No. Name of the
District Name of the
RMC Place for establishment
of Market yards
No. of market yards
Estimate cost of a Market yard (Rs in lakhs)
Total Project
cost
Government share under the scheme
(90%)
Government share now sanctioned
RMC share (10%)
1 Malkangiri Malkangiri
MV-72, MV-17, MV-79, Vijaguda, Korukunda, Podia, Potieru, Vejangiwada 8 20 160 160 160 0
2 Nawarangpur Nawarangpur Raighar, Umerkote 2 20 40 36 36 43 Sonepur Dunguripalli Mahadevpalli 1 20 20 18 18 24 Bolangir Bolangir Tusara 1 20 20 18 18 25 Bolangir Kantabanjhi Mandal, Moribahal 2 20 40 36 36 46 Kalahandi Mukhiguda Ladugaon, Bandankana 2 20 40 36 36 47 Kalahandi Junagarh Chaharbanahal 1 20 20 18 18 28 Kalahandi Bhawanipatna Biswanathpur 1 20 20 18 18 29 Nuapada Khariar Road Boden 1 20 20 18 18 2
10 Koraput Jeypore Kotpad 1 20 20 18 18 2
11 Support services
Orissa State Agri-Marketing Board 20 20 20
Total 20 200 420 396 396 24Grand Total * for Malkangiri area, the RMC shall not bear any cost towards the project Source: Directorate of Agriculural Marketing
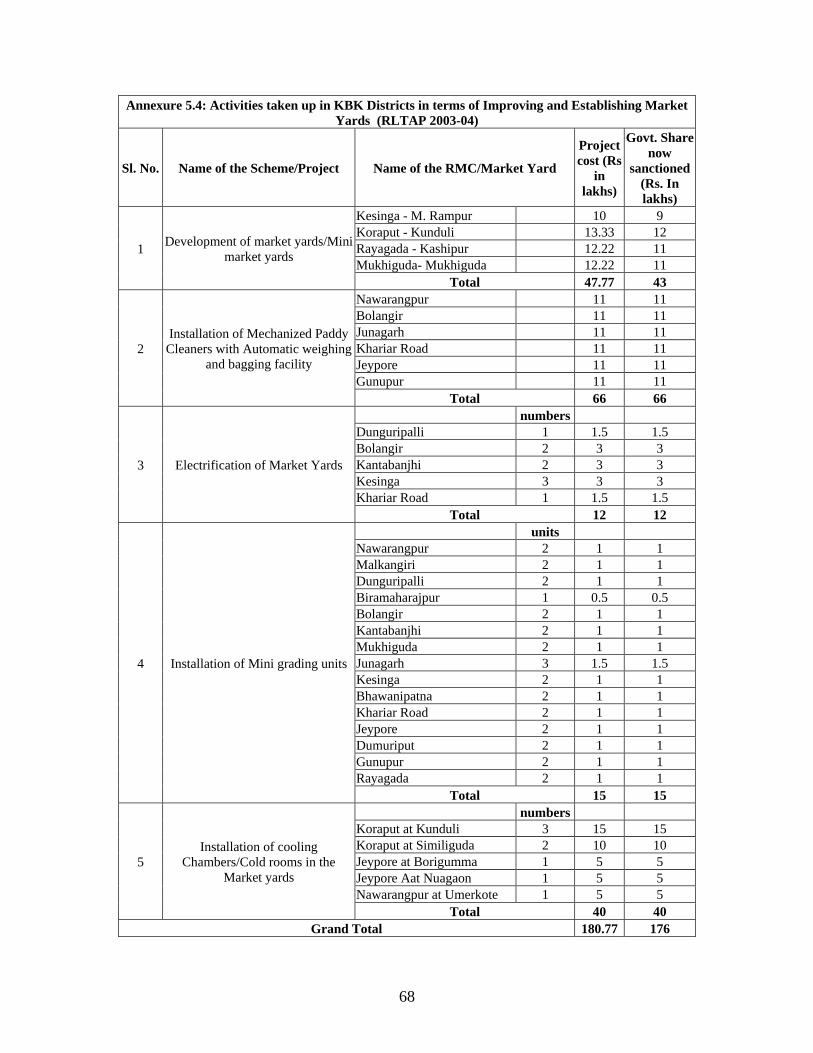
68
Annexure 5.4: Activities taken up in KBK Districts in terms of Improving and Establishing Market Yards (RLTAP 2003-04)
Sl. No. Name of the Scheme/Project Name of the RMC/Market Yard
Project cost (Rs
in lakhs)
Govt. Share now
sanctioned (Rs. In lakhs)
1 Development of market yards/Mini market yards
Kesinga - M. Rampur 10 9 Koraput - Kunduli 13.33 12 Rayagada - Kashipur 12.22 11 Mukhiguda- Mukhiguda 12.22 11
Total 47.77 43
2 Installation of Mechanized Paddy
Cleaners with Automatic weighing and bagging facility
Nawarangpur 11 11 Bolangir 11 11 Junagarh 11 11 Khariar Road 11 11 Jeypore 11 11 Gunupur 11 11
Total 66 66
3 Electrification of Market Yards
numbers Dunguripalli 1 1.5 1.5 Bolangir 2 3 3 Kantabanjhi 2 3 3 Kesinga 3 3 3 Khariar Road 1 1.5 1.5
Total 12 12
4 Installation of Mini grading units
units Nawarangpur 2 1 1 Malkangiri 2 1 1 Dunguripalli 2 1 1 Biramaharajpur 1 0.5 0.5 Bolangir 2 1 1 Kantabanjhi 2 1 1 Mukhiguda 2 1 1 Junagarh 3 1.5 1.5 Kesinga 2 1 1 Bhawanipatna 2 1 1 Khariar Road 2 1 1 Jeypore 2 1 1 Dumuriput 2 1 1 Gunupur 2 1 1 Rayagada 2 1 1
Total 15 15
5 Installation of cooling
Chambers/Cold rooms in the Market yards
numbers Koraput at Kunduli 3 15 15 Koraput at Similiguda 2 10 10 Jeypore at Borigumma 1 5 5 Jeypore Aat Nuagaon 1 5 5 Nawarangpur at Umerkote 1 5 5
Total 40 40 Grand Total 180.77 176
69
CHAPTER 6 SOME SUCCESS EXPERIMENTS TO AGRICULTURAL DIVERSIFICATION 1. Success in Inter-Cropping
The1 resource poor farmers of Nagupalla village of Kalahandi were growing cotton
under rainfed condition in uplands with poor crop management practices. Cotton was
being grown along with random sowing of pigeonpea without adopting proper
intercropping practices. As a result productivity of both crops was low. Under the
field level demonstration programme on Cotton Production Technology of TMC MM-
II, scientists of KVK, Kalahandi visited Nagupalla village during June-2005 and
persuaded the farmers to follow the integrated crop management practice. Sri
Kamalakanta Goud, a progressive farmer cultivated 0.4 ha under hybrid cotton
(Tulasi) intercropped with pigeonpea (Cv-ICPL 87-119) (8 row cotton: 2 row pigeon
pea). Following this method he has used 20% less fertilizer in cotton crop and applied
only phosphoculture in pigeonpea. Another important aspect was that the bollworm
Helicoverpa armigera was found infesting pigeon pea without affecting the cotton
crop. The pest was easily managed by spraying pesticide in pigeonpea. Under the
supervision of the scientists of KVK, Kalahandi, Sri Goud incurred expenditure of Rs.
4500/- and obtained seed cotton and pigeon grain yield of 6 quintals and 1.5 quintals
respectively, earning a net profit of Rs 10000/- per acre. Being inspired other cotton
farmers of surrounding villages have become interested to follow the method of
intercropping pigeonpea with cotton to get a higher return.
2. Kharif onion Cultivation – A Boon to Kalahandi Farmers:
Growing of onion is an age-old traditional practice of Kalahandi farmers. But in the
absence of adoption of proper technology, farmers used to get very poor yield.
Participatory survey and on farm trials on farmers’ field have shown that intervention
of new variety could yield much more. Sri Bhubaneswar Bhoi a progressive farmer of
village Kinerkela of Kesinga Block actively participated in the programme and
harvested a yield of 80 quintals per hectare. High production brought him
1 Source: “Krushi Vigyan Kendra”, Bhawanipatana
70
substantially higher income. Dr. Hossain, T.O. KVK, Kalahandi feels that impact of
such on farm trials have long lasting impact among the onion growers of the district.
3. Hybrid Sunflower Cultivation Pays High Dividends
After harvesting of Kharif paddy farmers of village Kasurpada of Kesinga block were
growing sunflower CV. Morden under poor management condition as a result of
which the productivity was poor (10.5 quintals per hectare) under the FLD (Oilseeds
and pulses) programme. Scientists of KVK, Kalahandi visited Kasurpada village
impressed upon the villagers to go in for hybrid sunflower cultivation with scientific
agro-techniques for high returns. Sri Kesaba Chandra Bhoi, a progressive farmer,
cultivated 0.4 ha hybrid sunflower (Jwalamukhi) with recommended package of
practices under the supervision of scientists of KVK Kalahandi. Sri Bhoi, incurred an
expenditure of Rs. 2600, and obtained seed yield of 19.5 quintals per hectare, getting
a net profit of Rs. 7,400 in a period of 3½ months. Being inspired, other sunflower
growers of Kasurpada village have taken up hybrid sunflower cultivation with high
returns.
4. In Malkangiri District, during 2002-03 a set of different agriculture implements
were provided to 20 SHGs for Rs. 2575 after 95% subsidy on total cost of Rs. 51500
per set. The agricultural implement kit includes one power thresher, 3 low-lift hand
pumps, four hand winnowers, one power spray, three hand compression sprayers, one
puddler (99 model), one pulse thresher and one puddle thresher. To avail this
agricultural implement kit the SHG group deposited Rs 2575 (5% of the total cost).
An SHG ‘Shyama’ operating in MV-7 village of Malkangiri district, since 2001 has
17 female members. Each member has contributed to the SHG fund Rs 50/month.
After two years of starting operations the SHG received a set from the Agriculture
Department after paying Rs 2575 and began to custom hire these implements to needy
farmers in their own and nearby villages at a competitive price in relations to charges
of similar implements being floated in other major markets. The farmers were very
receptive to the rates of the Self Help Group. Further the SHG also provided valuable
instructions regarding the operation of the implements. During the year 2003-04 the
SHG had already earned Rs 70000 by hiring the implements to the farmers. This has
inspired many women SHG groups to come forward with greater interest for the
71
implementation of this programme. It would be helpful if the scheme continues for an
extended period. With additional resources generated by custom hiring of services,
the group has also undertaken kerosene dealership, MDM programme and selling of
fertilizers.
Migration Check: A remote village shows the way In a region where migration has become a way of life, Sargiguda in Muribahal block of Balangir district has set an example by being the only village to have checked the trend without the help of the administration or the government. The 130-odd families, including 84 BPL families, in the village have managed to keep themselves busy throughout the year, thanks to their innovative initiatives. The villagers have dug up about 500 'chuans' (small open wells) on their own in between their agricultural fields to take care of their irrigation needs throughout the year. As a result, while about 50 acres are cultivated in rabi season, the figure goes up to 100 acres in kharif and winter season. The villagers grow paddy, 'kolath' (kulthi), dal, 'mandia' (ragi), sugarcane and a variety of vegetables. Sargiguda also has an advantage as far as its location is concerned. Rainwater from the hills collects at this village. Besides, since it is one of the seven villages that have been protecting the Khujen forest, the dense vegetation helps in recharging groundwater and ensures enough water in the wells throughout the year. "No youth in the village sits idle. Either they sell the agricultural produce in the market or help in crushing sugarcane. Others sell sugarcane juice. "Some youths also collect iron, tin, bottles and plastic materials from different houses and exchange them for eatables! No wonder, the village has carved a niche for itself not only in Muribahal but also in neighboring Bangomunda and Tureikela blocks. "These villagers have scripted a success story as they have understood their priorities better than the government officials," claims of 'Vikalpa', an NGO operating in the area. Most of the government programmes are broad based rather than being local specific. So they do not serve the purpose. "Instead of pushing a plethora of government schemes down their throats, the villagers should be allowed to manage their own resources and development will follow". Source: The Times of India, Bhubaneswar Edition, Dated 14 April 2006, Friday
72
CHAPTER 7 CONSTRAINTS AND RECOMMENDATIONS Introduction
Although called a programme, components of agricultural diversification have been
implemented independently without proper planning of personnel, resources, and
convergence with other programmes. Beneficiary participation in planning has been
completely neglected at planning stage. Government has tried to achieve good results
through supply side management without any regard to the needs of farmers. This is
the main lacuna of the programme. Several constraints faced by both the
implementing agencies and the farmers are detailed below:
Constraints Faced by the Implementing Agency
Non-acceptance of HYV Seeds by the Farmers
The tribal people have a prejudice in terms of using high yielding variety of seeds.
They believe that the cost that would incur by using these seeds for cultivation
purposes would be very high and would not lead to proportional returns. They also
believe that the taste of crops cultivated through such seeds would not be palatable.
Irregular Supply and Failure in Germination of Seeds
There is irregularity in the supply of the seeds to the farmers from the Agriculture
Department. In about 30-40% of cases the field level officers are not able to supply
the seeds before the sowing period. It is estimated that in relation to demand, supply
of quality seed falls short by 50-60% less. For various reasons germination of seeds
supplied by the Agriculture Department is not fully satisfactory. The follow-up to
examine the causes of low germination is simply missing.
Constraints in Opening of Agro-service Centers
As per the guidelines, there is a provision for opening an agro-service centre where
beneficiaries have atleast 10 acres of land. It is difficult to find farmers who fulfill the
above criterion. This has resulted in inadequate numbers of service centres opening in
73
many districts. In Malkangiri only one service centre has been opened during 2000-01
to 2005-06 whereas in Nuapada no service centre has opened during the same period.
Saving seeds from HYV crops for subsequent year
The farmers who are provided with HYV seeds by the Agriculture Department do not
save seeds from their own production for the next year unlike in the case of traditional
varieties. Many feel that HYV seeds from their produce are not as good as fresh HYV
seeds purchased from government stores (shops). Sometimes this induces them to
revert to traditional seeds in the next cropping season if adequate HYV seeds are not
available from government sources. As a result, the return from cultivation of crops
drops in subsequent years. As an example hybrid varieties of ragi are provided under
two components of the Agriculture Diversification Programme, namely Ragi Seed
Exchange Programme and Ragi Crop Demonstration. Inspite of the inclusion of 200
beneficiaries in each district (Nawarangpur, Malkangiri and Kalahandi) under Ragi
Crop Demonstration Programme, the practice of using HYV seeds has not taken root
in the minds of the farmers. Farmers revert back to the use of traditional varieties after
a year or two. Consequently, the yield of ragi in Malkangiri and Kalahandi districts
has declined by 16% and 20% respectively. Constraints Faced by the Beneficiaries
Inadequate Land and Irrigation Facilities
Most of the lands in the KBK region are high lands and small in size. This makes the
application of new agricultural techniques such as the use of tractors uneconomical. It
is also difficult to provide irrigation facilities for highlands. As HYV seeds require
more water than traditional varieties it makes cultivation on high lands using HYV
seeds difficult.
Irregular Supply of Seeds
Supply of the seeds to the farmers is sometimes highly irregular and as a consequence
they are not able to use the HYV seeds during the sowing period. Sometimes the
supply of seeds is not in accordance with demand. This forces many farmers to
purchase seeds from the market, which provide no guarantee of high output. Further,
74
the supply of fertilizers and pesticides is not adequate and is not in accordance with
the time of application.
High Wear and Tear of Agricultural Implements
Though agricultural implements are supplied to the farmers to facilitate cultivation,
within a year or two the implements wear down. Since there is no facility for the
repair of these implements (along with lack of financial resources to get them
repaired) they become redundant after two to three years.
Low Returns from Agriculture
Although income has increased after introduction of the programme, the level of
income is still below the poverty line. As most of the farmers belong to the BPL
category they do not have enough resources to invest in diversified cash crops. Market
development to cater to the needs of small producers having small surplus to sell is
highly inadequate. These small producers do not get reasonable price for their
products.
Poor Supervision by the Agricultural Officers
Supervision by agricultural officers leaves much to be desired. They themselves are
not adequately trained. This is accentuated by frequent transfers from the region. This
causes de-motivation among farmers, as the confidence generated through dealing
with a particular official is difficult to sustain after the official’s transfer. Further,
replaced officials do not always carry with them proper insight regarding the
intricacies of the functioning of various schemes in that particular area. By the time
they get acquainted to the area, they are transferred on their own initiative to get out
of KBK
Need of Training and Demonstration Programme
Though demonstration programmes on different crops like paddy, ragi, moong and
niger have been imparted in all the six districts yet large number of farmers do not get
proper training for improving quality and quantity of production. Hardly any record
about the achievements or failures of crop demonstration is maintained as learning
75
which can guide future course of action. In the training programmes provided to the
farmers, training is limited to a day or two thereby limiting the coverage area content.
There is hardly any follow up. Beneficiaries have complained that there is no follow-
up after a demonstration programmes due to which acceptance of HYV seeds,
changing agricultural practices to increase production and diversion towards cash
crops are not fully effective
Ignorance Regarding Credit Facilities
Farmers interested in undertaking cash crop cultivation are not able do so due to
financial constraints for purchasing high cost but critical inputs They have poor
knowledge regarding credit facilities (amount, interest, repayment process) offered
by various financial institutions including banks.
Advance Price Negotiation
Most of the farmers avail credit from Mahajans or moneylenders. Urgent financial
requirements force the people to negotiate with the creditors in terms of price fixation
for their crops. In cases where the farmers are not able to repay the debt, they are
forced to sell their produce at the price negotiated upon irrespective of the price
prevalent in the market. In almost all cases the negotiated price for future output is 30
to 50% lower than the market prices
Lease in Farming
In cases where farmers are operating on lands leased by landlords, they are expected
to provide a certain proportion of the produce to the landowners in accordance with
the contract made at the time of lease. During seasons when production is low,
farmers are not able to fulfill the conditions of the contract. In such cases they are
forced to repay from other sources such as taking loans from money lenders. This
indebtness leads to a cycle of extreme poverty.
Low Returns due to Inadequate Market Facility
In many places there is no government mandi or market functioning where farmers
can sell their commodities at reasonable prices, which would give reasonable value to
76
the farmers for their products. Lack of proper marketing facilities forces farmers to
sell their produce to local businessmen who exploit them by setting much lower prices
as compared to prices in the wholesale or retail markets.
Lack of Storage Facility
Lack of storage facilities at market place forces farmers to sell their produce on the
same day when they bring their produce to the market. Knowing this vulnerability of
the farmers the middleman and businessmen exploit them by setting low prices.
Farmers fearing loss in quality of their produce are forced to agree to the terms of the
buyers. Due to poverty farmers are not able to make storage facilities of their own. It
has been seen that in some areas of Nuapada district onion is produced widely but
there is no storage facility for the produce forcing farmers to sell at the existing price.
Exploitation by Middlemen
Most of the farmers being tribal and living below the poverty line need immediate
cash to meet daily requirements. The middlemen advance money and later lift the
produce assuring that the balance will be paid within a short span. However, it is seen
that the farmers have not received their balance in certain places even 4 years after
some agricultural produce was sold to middlemen.
77
RECOMMENDATIONS
There is serious capacity constraint at district level to review all agricultural
programmes and schemes and forge a linkage among them. Each programme or
scheme is independently implemented and monitored regarding achievements in
relation to targets instead of finding out its development effectiveness. Overall the
programme has shown some mixed results. While diversification of crops has taken
place in certain areas leading to increase in farmers’ income, this increase has not
sufficiently pushed them up to achieve ‘Above Poverty Level’ status. The programme
needs a thorough revision and re-orientation. In fact it does not seem to be a
programme. The components look like sub-components of a scheme. What is required
is building up of management capacity initially at district levels and subsequently at
lower levels (Blocks, Panchayats) etc. Agricultural diversification is a function of
several supply side and demand side factors varying across districts and within Blocks
of a district. Programme components are to be tailor-made to suit specific
requirements of regions and specific group of farmers. Some of the steps
recommended are detailed below:
Timely Supply of Good Quality HYV Seeds
It is very important that the seeds supplied to the farmers must be of good quality.
These seeds must be checked in the laboratories to improve seed germination.
Farmers grain from HYV seeds should be tested by government for their quality. It is
necessary that seeds must be supplied in time in accordance with the needs of the
farmers through opening of additional seed sales centres to minimize transaction costs
involved in purchasing seeds from the market and also to ensure seed quality.
Improvement in Training Quality and Increase in Number of Demonstration
Programme
Although some farmers have begun using HYV seeds lack of quality training
sometimes leads to modest results, which are not up to the expectation of the farmers.
Thus demonstration programmes should also complement distribution of HYV seeds
in order to equip farmers with production improvement techniques (How many days
the demonstration programme has been done)
78
Supply of Agricultural Implements
As a substantial number of farmers of the KBK region are under the BPL category
they are not in a position to purchase the agricultural implements at the existing
subsidy rates given by the agricultural department. In conjunction to the provision of
higher subsidy on agricultural implements there should also be also a provision for the
payment of the balance amount on easy installment basis.
Motivation among Officials
Due to the lack of interest among the agricultural officers at the field level the
implementation of various programmes is not running efficiently. If officers were
given incentives in accordance with their achievement of targets and quality of
programme output, it would prompt officers to operate with more zeal. Further,
flexibility in implementation in accordance with the type of problems would give
officers more options to bring about desired results
Motivation among Farmers
Department should try to communicate with the farmers through methods which have
more impact on their minds such as organization of ‘palla’ and drama skits.
Innovative ideas should be communicated through projectors and other modern
technology.
Market Facility
It is necessary that government should provide market facility for existing and newly
introduced crops. Before introduction of any crop it is necessary to provide market
facility to the farmers through which they will be motivated to cultivate newly
introduced crops.
Value Addition
Since farmers get immediate cash at local markets or at the farm gate they are induced
into disposing of their crops as soon as harvests are over. To increase the value of the
farmers’ produce, government should encourage the sale of produce in mandies. The
79
mode of operation in the mandies is highly cumbersome. Further there are only 3 to 4
mandies per districts. The constraints faced by farmers in selling at mandies should be
smoothened out. Value addition can also take place by opening of more agro-
processing units. In comparison to selling paddy, processed rice would fetch a higher
price.
Crop Insurance
There is no assurance with respect to satisfactory returns from agriculture due to
various reasons such as natural calamities. Sometimes farmers have to face severe
losses when there is failure of crops. To mitigate the effect it is vital to introduce
insurance on crops like cotton and sugarcane.
Crop insurance is covering only 14 per cent of the farmers. The need is to expand the
cover to all farmers and all crops in a time bound manner. The scheme needs to be
made more farmer friendly and the premium should be reduced.
Special Importance to the Landless Agricultural Labourers
For the landless agricultural labourers (both men and women), the aim should be to
convert them into skilled workers, thereby adding economic value to their time and
labour. The training should be in skills which can help in organizing market driven
enterprises and the training methodology should be based on the principle of learning
by doing.
Development of Agri-risk Fund
The government of India may step in to create an Agri-risk fund to provide relief
(waiver in full/ part of loan and interest) to the farmers in the case of successive
drought, etc, and also waiver of interest on loaning in areas hit by drought, floods,
heavy pest infestation etc. This fund should have contributions from the Central
Government, State Government and banks in pre-determined fashion. 1
1 Agricultural Renewal and prosperity/ Yojana/ jan 2007/ page-90
80
Development of Soil Testing Laboratories
Re–tooling and re-equipment of all soil testing laboratories should be taken up in
order to provide each household with a Soil Health Card. The soil health card should
stimulate balanced fertilization, including the amelioration of micronutrient
deficiencies.2
Introduction of Low Water-Intensive Crops
As the rainfall in the region is very erratic, the yield of traditional crops cultivated
within the KBK region varies from year to year. Therefore, to mitigate the negative
impact in years when rainfall is less, there should be a diversification towards crops,
which require less water such as pulses and oilseeds. However, since the management
of these crops requires more care training should also be imparted.
Creating Awareness Regarding Kisan Call Centres
Government of Orissa has established Kisan Call Centres for providing instant
solution to problems faced by farmers at the field level. The calls to these centres are
toll free. But as farmers are not aware about this facility they are not in a position to
avail the benefits. Therefore, it is essential to generate awareness among the farmers
for better utilization of this service.
CONCLUSION
The programme on the whole had a positive impact in terms of motivating farmers
from a static paddy oriented cropping system to a more diversified income generating
cropping system. There would be more lasting changes if the intensity of follow-ups
on crop demonstration to be undertaken in future is increased. Increase in subsidies
and financial support is bound by funds available, however, quality of grass-root level
implementation is much more important for realizing development programme
targets. Instead of having agricultural diversification as a programme, it should form a
component of agricultural planning for the district.
2 Ibid
81
REFERENCES
Arabinda Ghosh Diversifying Agriculture: The New Mantra, Yojana, January 2001
Ashok Gulati and Tim Kelley (1999)
‘Trade Liberalization & Indian Agriculture-Cropping Pattern Changes and Efficiency Gains in Semi-arid Tropics’, Oxford University Press
B. Bhuyan Marketing of Agricultural Produce in Orissa
Christofer L. Delago (1995)
‘Agricultural diversification and export promotion in sub-Saharan Africa’, Food Policy, Vol 20 No.3 June 1995
Dr. Damodar Tripathy, Julie Tripathy
Agricultural Diversification, Migration and Poverty Reduction in Orissa: in Interpretative Analysis
Government of Orissa Orissa Agricultural Statistics, 1995-96 to 2005-06.
Government of Orissa Agronica, Directorate of Agriculture and Food production.
Government of Orissa, Panchayati Raj Department
1997 BPL Survey
Government of Orissa, Planning and Coordination Department
Revised Annual Action Plan under RLTAP for KBK Districts, 2002-03
Pingali Prabhu L and Mark W. Rosegrant
“Agricultural commercialization and diversification: processes and policies’, Food Policy, Vol 20 No.3 June 1995
R S Sidhu, A S Bhullar Patterns and Determinants of Agricultural Growth in the Two Punjabs, EPW December 31, 2005-January 6, 2006
Surinder Sud Crop Insurance and National Agricultural Policy, Yojana, January 2001
Vishal Rawat Agricultural Spectrum, December 2004
Website www.ori.nic/diorissa/market.htm
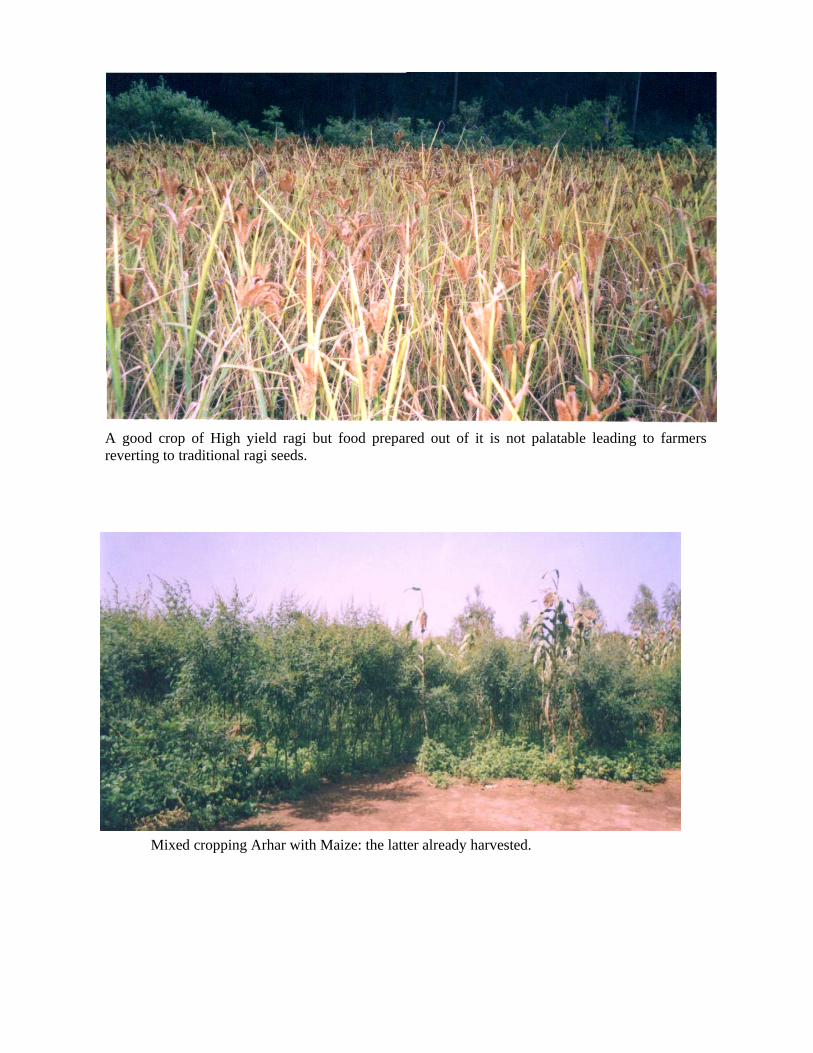
A good crop of High yield ragi but food prepared out of it is not palatable leading to farmers reverting to traditional ragi seeds.
Mixed cropping Arhar with Maize: the latter already harvested.
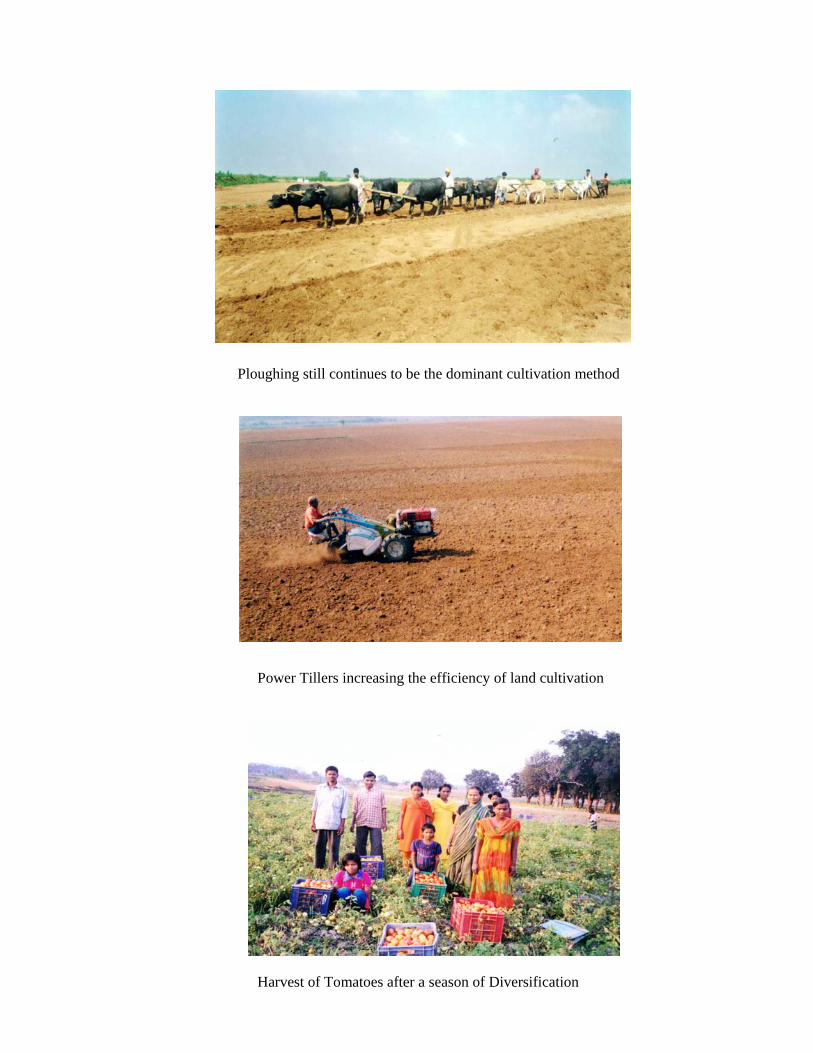
Power Tillers increasing the efficiency of land cultivation
Ploughing still continues to be the dominant cultivation method
Harvest of Tomatoes after a season of Diversification
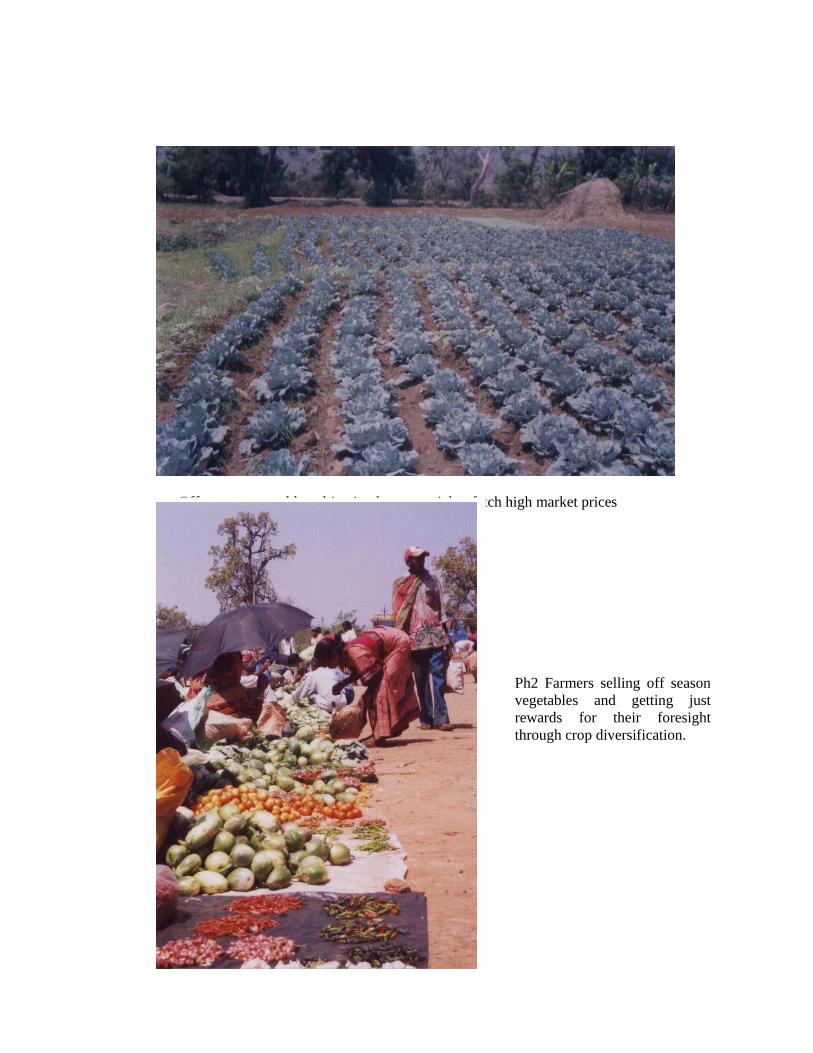
Off season vegetable cultivation has potential to fetch high market prices
Ph2 Farmers selling off season vegetables and getting just rewards for their foresight through crop diversification.