Embed Size (px)
Citation preview
Final
Lagoon Pond Estuarine System
Total Maximum Daily Loads
For Total Nitrogen (CN- 390.1)
COMMONWEALTH OF MASSACHUSETTS
EXECUTIVE OFFICE OF ENERGY AND ENVIRONMENTAL AFFAIRS
MATTHEW A. BEATON, SECRETARY
MASSACHUSETTS DEPARTMENT OF ENVIRONMENTAL PROTECTION
MARTIN SUUBERG, COMMISSIONER
BUREAU OF WATER RESOURCES
DOUGLAS FINE, ASSISTANT COMMISSIONER
July 2015
ii
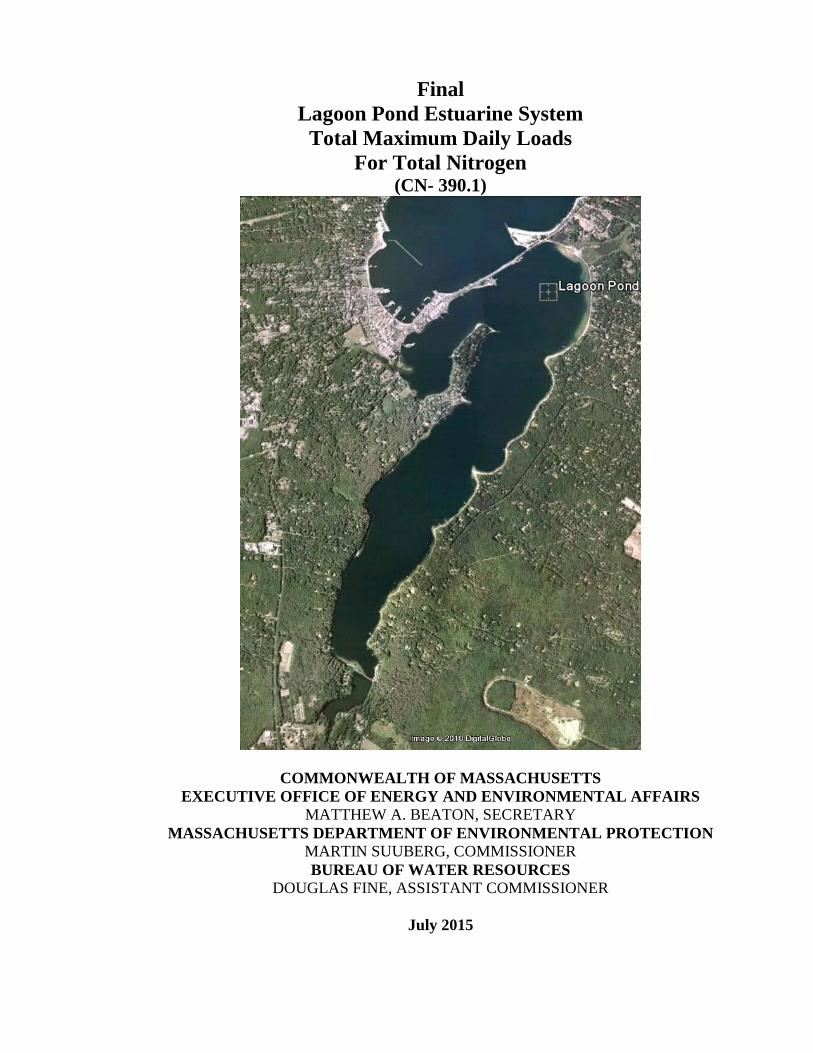
Lagoon Pond Estuarine System
Total Maximum Daily Loads
For Total Nitrogen
Key Feature: Total Nitrogen TMDL for Lagoon Pond Estuarine
System
Location: EPA Region 1, Oak Bluffs and Tisbury, MA
Land Type: New England Coastal
303d Listing: Lagoon Pond (segment MA97-11) is listed in Category 5
of the 2012 MA Intergrated List of Waters as impaired
for fecal coliform and estuarine bioassessments
Data Sources: University of Massachusetts – Dartmouth/School for
Marine Science and Technology; US Geological Survey;
Applied Coastal Research and Engineering, Inc.; Cape
Cod Commission; Martha’s Vineyard Commission;
Towns of Oak Bluffs and Tisbury
Data Mechanism: Massachusetts Surface Water Quality Standards,
Ambient Data and Linked Watershed Model
Monitoring Plan: Martha’s Vineyard Commission/Towns of Oak Bluffs
and Tisbury - Lagoon Pond Water Quality Monitoring
Program with technical assistance by SMAST
Control Measures: Sewering, Stormwater Management, Attenuation by
Impoundments and Wetlands, Fertilizer Use By-laws,
Agricultural BMPs
Lagoon Pond

iii
Executive Summary
Problem Statement
Excessive nitrogen (N) originating from a variety of sources has added to the impairment of
the environmental quality of Lagoon Pond. In general, excessive N in these waters is
indicated by:
Loss of eelgrass beds, which are critical habitats for macroinvertebrates and fish;
Undesirable increases in macro-algae, which are much less beneficial than eelgrass;
Periodic decreases in dissolved oxygen concentrations that threaten aquatic life;
Reductions in the diversity of benthic animal populations;
Periodic algae blooms.
With proper management of N inputs these trends can be reversed. Without proper
management more severe problems might develop, including:
Periodic fish kills;
Unpleasant odors and scum;
Benthic communities reduced to the most stress-tolerant species, or in the worst cases,
near loss of the benthic animal communities.
Coastal communities, including Oak Bluffs and Tisbury, rely on clean, productive, and
aesthetically pleasing marine and estuarine waters for tourism, recreational swimming,
fishing, and boating, as well as for commercial fin fishing and shellfishing. Failure to reduce
and control N loadings could lead to further loss of eelgrass and possible increases in macro-
algae, a higher frequency of undesirable decreases in dissolved oxygen concentrations and
fish kills, widespread occurrence of unpleasant odors and visible scum, and a complete loss of
benthic macroinvertebrates throughout most of the system. As a result of these environmental
impacts commercial and recreational uses of Lagoon Pond will be greatly reduced.
Sources of Nitrogen
Nitrogen enters the waters of coastal embayments/ponds from the following sources:
The watershed;
on-site subsurface wastewater disposal (septic) systems
natural background
runoff
fertilizers
wastewater treatment facilities
landfills
agricultural activities
Atmospheric deposition
Nutrient-rich bottom sediments in the embayments/ponds
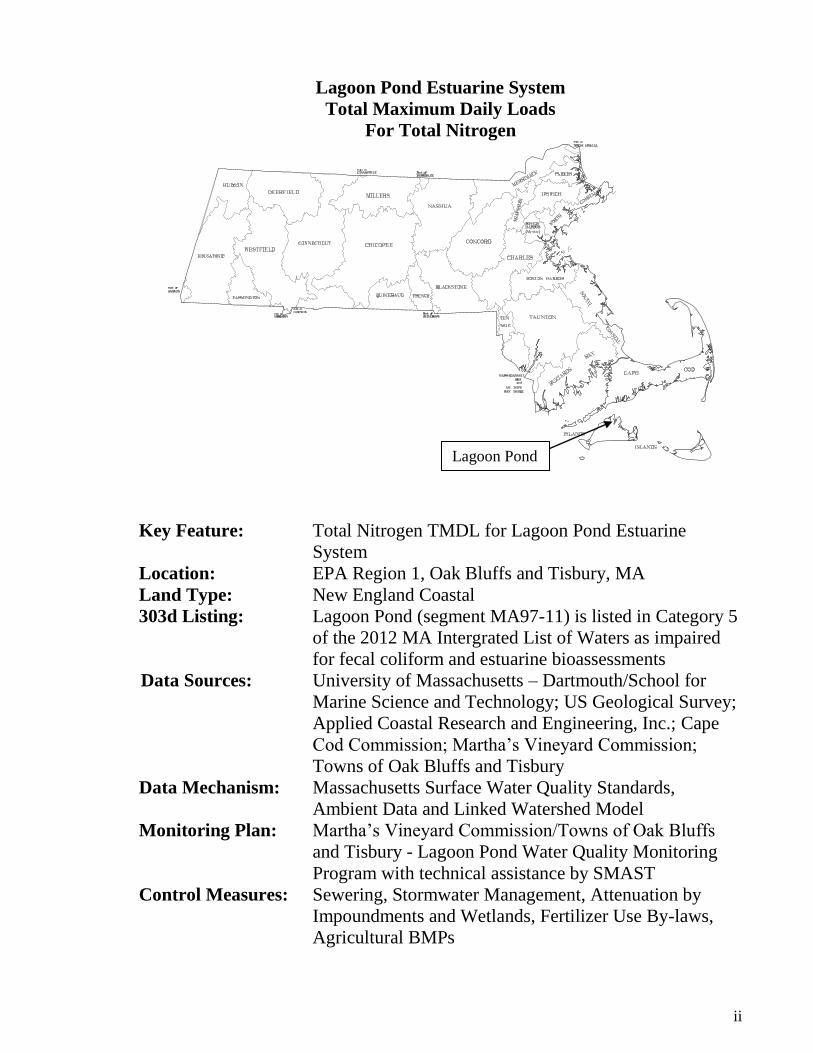
Figures ES-A and ES-B below indicate the percent contributions of the various sources of N
to Lagoon Pond. Values are based on Table ES-1 and Table IV-2 from the MEP Technical
Report. Most of the controllable N load to Lagoon Pond originates from wastewater.
iv
Figure ES-A: Percent Contributions of All Nitrogen Sources to Lagoon Pond
Figure ES-B: Percent Contributions of Controllable Nitrogen Sources to Lagoon Pond
Septic Systems 34%
Fertilizer 2%
Agriculture 3%
Landfill <1%
Runoff from Impervious Surfaces
5%
Atm Deposition to Natural Surfaces
2%
Atmospheric Deposition to
Estuary Surface 8%
Sediments 46%
Septic Systems
76%
Fertilizer 5%
Agriculture 8%
Landfill <1%
Runoff from Impervious Surfaces
11%

v
Target Threshold Nitrogen Concentrations and Loadings
The N load to the estuary each day is 101.7 kg/day. The resultant concentrations of N in
Lagoon Pond range from 0.333mg/L (milligrams per liter of N) to 0.418 mg/L (range of
average of yearly means from 6 stations collected from 2002 – 2007 as reported in Table VI-1
the MEP Technical report and included in Appendix A of this report).
In order to restore and protect this embayment system, N loadings, and subsequently the
concentrations of N in the water, must be reduced to levels below the thresholds that cause the
observed environmental impacts. This concentration will be referred to as the target threshold
N concentration. It is the goal of the TMDL to reach this target threshold N concentration, as
it has been determined for each impaired waterbody segment. The Massachusetts Estuaries
Project (MEP) has determined that for this embayment system a N tidally averaged
concentration of 0.35 mg/L at the sentinel station (LGP-2) will improve fringing eelgrass
habitat within the main basin of Lagoon Pond (East Arm) and restore benthic habitat for
infaunal animals in the West Arm (South End Basin). The mechanism for achieving this
target threshold N concentration is to reduce the N loadings to the Lagoon Pond estuarine
system. Based on sampling and modeling analysis and the resulting Technical Report, the
MEP has determined that the Total Maximum Daily Load (TMDL) of N to meet the target
threshold N concentration of 0.35 mg/L is 74 kg N/day for the entire system. One scenario
modeled by the MEP indicates that a reduction of 50% of the septic load from the
subwatershed areas of Lagoon Pond (East Arm) and the West Arm (South End Basin) will
meet this TMDL. This document presents the TMDL for this water body and provides
guidance to the watershed communities of Oak Bluffs and Tisbury on possible ways to reduce
the N loadings to within the recommended TMDL and protect the waters of this estuarine
system.
Implementation
The primary goal of TMDL implementation will be lowering the concentrations of N. This
can be achieved by reducing the loadings from on-site subsurface wastewater disposal
systems by 50% in the Lagoon Pond (East Arm) and West Arm (South End Basin)
subwatersheds. However, there are a variety of loading reduction scenarios that could achieve
the target threshold N concentration. Local officials can explore other loading reduction
scenarios through additional modeling as part of their Comprehensive Wastewater
Management Plan (CWMP). Implementing best management practices (BMPs) to reduce N
loadings from fertilizers, agriculture and runoff where possible will also help to lower the
total N load to these systems. Hydrologic modeling of the addition of culverts through Beach
Road showed that N concentration improvements would be confined to the West Arm (South
End Basin) and would not affect N concentrations in the main basin of Lagoon Pond. The
recommended method of TMDL implementation will likely be a combination of reducing the
loadings from any and all sources of N in the watershed. The appropriateness of any of the
alternatives will depend on local conditions and will have to be determined on a case-by-case
basis using an adaptive management approach. Finally, growth within the communities of
Oak Bluffs and Tisbury that would exacerbate the problems associated with N loading should
be guided by considerations of water quality-associated impacts. Methodologies for reducing

vi
N loading from septic systems, stormwater runoff and fertilizers are provided in detail in the
“MEP Embayment Restoration and Guidance for Implementation Strategies”, available on the
MassDEP website: http://www.mass.gov/eea/agencies/massdep/water/watersheds/coastal-
resources-and-estuaries.html..

vii
Table of Contents
Executive Summary ...................................................................................................................iii Introduction ................................................................................................................................. 1 Description of Water Bodies and Priority Ranking .................................................................... 2 Problem Assessment ................................................................................................................... 5 Pollutant of Concern, Sources and Controllability ..................................................................... 7
Description of the Applicable Water Quality Standards ............................................................. 8 Methodology - Linking Water Quality and Pollutant Sources ................................................... 9 Total Maximum Daily Loads .................................................................................................... 17 TMDL Values for the Lagoon Pond Estuarine System ............................................................ 23
Implementation Plans ................................................................................................................ 23 Monitoring Plan ........................................................................................................................ 25
Reasonable Assurances ............................................................................................................. 26 Public Participation ................................................................................................................... 27
Appendix A ............................................................................................................................... 28 Appendix B ............................................................................................................................... 29 Appendix C ............................................................................................................................... 30
Appendix D ............................................................................................................................... 31
viii
List of Figures
Figure ES-A: Percent Contributions of All Nitrogen Sources to Lagoon Pond ....................... iv Figure ES-B: Percent Contributions of Controllable Nitrogen Sources to Lagoon Pond ......... iv Figure 1: Overview of Lagoon Pond .......................................................................................... 3 Figure 2: Lagoon Pond Watershed Area Delineation ................................................................ 4
Figure 3: Oak Bluffs and Tisbury Resident Population ............................................................. 6 Figure 4: Percent Contribution of All Nitrogen Sources to Lagoon Pond ................................. 7 Figure 5: Lagoon Pond Long Term Monitoring Stations. ...................................................... 15 Figure 6: Controllable Nitrogen Loading Sources to Lagoon Pond ........................................ 20
List of Tables
Table 1: Comparison of MassDEP and SMAST Impaired Parameters for Lagoon Pond ......... 4
Table 2: General Summary of Conditions Related to the Major Indicators of Habitat
Impairment Observed in the Lagoon Pond Estuarine System ................................................... 5 Table 3: Observed Present Nitrogen Concentrations and Sentinel Station Threshold Nitrogen
Target Concentration for Lagoon Pond.................................................................................... 13 Table 4: Nitrogen Loading to Lagoon Pond ............................................................................ 14
Table 5: Present Watershed Nitrogen Loading Rates, Calculated Loading Rates that are
Necessary to Achieve Target Threshold Nitrogen Concentrations and the Percent Reductions
of the Existing Loads Necessary to Achieve the Target Threshold Loadings ......................... 16 Table 6: Summary of the Present Septic System Loads and the Loading Reductions that
would be Necessary to Achieve the TMDL by Reducing Septic System Loads Alone .......... 17 Table 7: The Total Maximum Daily Load for the Lagoon Pond Estuarine System ............... 23 Table A-1: Summary of the Nitrogen Concentrations for the Lagoon Pond Estuarine System
.................................................................................................................................................. 28 Table B-1: Lagoon Pond Estuarine System 2 Total Nitrogen TMDLs and 1 Pollution
Prevention Total Nitrogen TMDL ........................................................................................... 29 Table C-1: The Lagoon Pond System Estimated Waste Load Allocation (WLA) from Runoff
of all Impervious Areas within 200 Feet of Water Bodies....................................................... 30
1
Introduction
Section 303(d) of the Federal Clean Water Act requires each state (1) to identify waters that
are not meeting water quality standards and (2) to establish Total Maximum Daily Loads
(TMDLs) for such waters for the pollutants of concern. The TMDL allocation establishes the
maximum loadings (of pollutants of concern) from all contributing sources that a water body
may receive and still meet and maintain its water quality standards and designated uses,
including compliance with numeric and narrative standards. The TMDL development process
may be described in four steps, as follows:
1. Determination and documentation of whether or not a water body is presently meeting
its water quality standards and designated uses.
2. Assessment of present water quality conditions in the water body, including estimation
of present loadings of pollutants of concern from both point sources (discernable,
confined, and concrete sources such as pipes) and non-point sources (diffuse sources that
carry pollutants to surface waters through runoff or groundwater).
3. Determination of the loading capacity of the water body. EPA regulations define the
loading capacity as the greatest amount of loading that a water body can receive without
violating water quality standards. If the water body is not presently meeting its designated
uses, then the loading capacity will represent a reduction relative to present loadings.
4. Specification of load allocations based on the loading capacity determination for non-
point sources and point sources that will ensure that the water body will not violate water
quality standards.
After public comment and final approval by the EPA, the TMDL will serve as a guide for
future implementation activities. The MassDEP will work with Oak Bluffs and Tisbury to
develop specific implementation strategies to reduce N loadings and will assist in developing
a monitoring plan for assessing the success of the nutrient reduction strategies.
In the Lagoon Pond estuarine system the pollutant of concern for this TMDL (based on
observations of eutrophication) is the nutrient nitrogen. Nitrogen is the limiting nutrient in
coastal and marine waters so as its concentration increases, so does plant productivity. This
leads to nuisance populations of macro-algae and increased concentrations of phytoplankton
and epiphyton and imperil the healthy ecology of the affected water bodies.
The TMDL for total N for the Lagoon Pond estuarine system is based primarily on data
collected, compiled and analyzed by University of Massachusetts Dartmouth’s School for
Marine Science and Technology (SMAST), the Martha’s Vineyard Commission/Towns of
Oak Bluffs and Tisbury Water Quality Monitoring Programs, and others, as part of the
Massachusetts Estuaries Project (MEP). The data were collected over a study period from
2002 to 2007. This study period will be referred to as the “Present Conditions” in the TMDL
since it contains the most recent data available. The MEP Technical Report entitled: Linked
Watershed Embayment Model to Determine Critical Nitrogen Loading Thresholds for the

2
Lagoon Pond Embayment System, Oak Bluffs and Tisbury Massachusetts,can be found at
http://www.oceanscience.net/estuaries/reports.htm.
The MEP Technical Report presents the results of the analyses of this coastal embayment
system using the MEP Linked Watershed-Embayment Nitrogen Management Model (Linked
Model). The analyses were performed to assist Oak Bluffs and Tisbury with decisions on
current and future wastewater planning, wetland restoration, anadromous fish runs,
shellfisheries, open-space and harbor maintenance programs. A critical element of this
approach is the assessment of water quality monitoring data, historical changes in eelgrass
distribution, time-series water column oxygen measurements and benthic community
structure that were conducted on this embayment. These assessments served as the basis for
generating a N loading threshold for use as a goal for watershed N management. The TMDL
is based on the site-specific target threshold N concentration generated for this embayment.
Thus, the MEP offers a science-based management approach to support the wastewater
management planning and decision-making process in the Towns of Oak Bluffs and Tisbury.
Description of Water Bodies and Priority Ranking
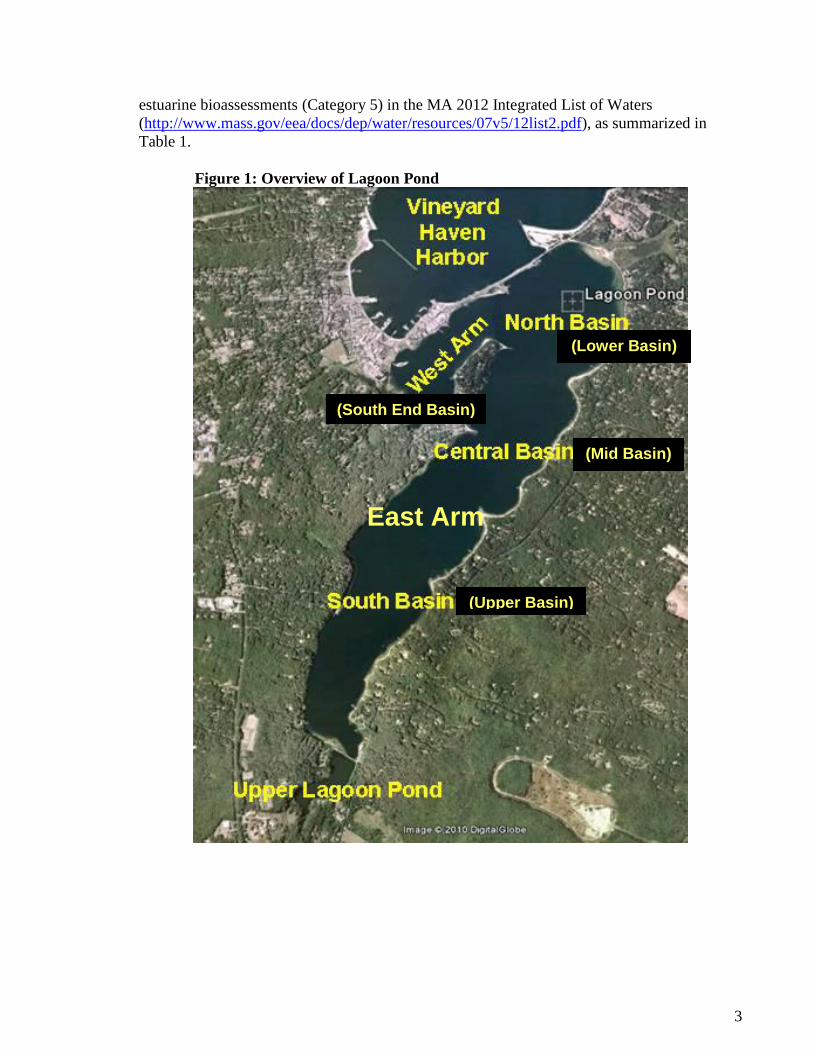
The Lagoon Pond estuarine system is a simple estuary with a single armored inlet through the
barrier beach. Its 3,889 acre watershed is situated along the eastern edge of Martha’s
Vineyard and is bounded by the Sengekontacket Pond watershed to the east. Lagoon Pond
itself is 573 acres and lies in a north/south orientation with one small tributary cove referred
to as the West Arm (also called the South End Basin in the MEP Technical Report), and the
main tidal reach (East Arm) consisting of a lower (North Basin), middle (Central Basin) and
upper basin (South Basin) based upon geomorphologic features (see Figures 1 and 2). Tidal
water from Vineyard Sound enters the basin at the northern end of the East Arm and
circulates through channels and across flats moving southward up the East Arm or into the
much smaller, shallow West Arm. In the Lagoon Pond watershed, freshwater directly
discharges from Upper Lagoon Pond into the South Basin of the East Arm with the remainder
of the freshwater watershed inputs to the estuary via direct groundwater.
The formation of the Lagoon Pond estuarine system has and continues to be greatly affected
by coastal processes, specifically the role that the barrier beach plays in separating the pond
from Vineyard Sound source waters. Prior to the inlet being armored for construction of the
Beach Road Bridge, the ecological and biogeochemical structure of the pond is likely to have
changed over time as the barrier beach naturally breached in different locations and
intermittently closed in as a function of storm frequency and intensity.
The nature of enclosed embayments in populous regions brings two opposing elements to
bear: 1) as protected marine shoreline they are popular regions for boating, recreation and
land development; and 2) as enclosed bodies of water they may not be readily flushed of the
pollutants that they receive due to the proximity and density of development near and along
their shores. In particular, the Lagoon Pond estuarine system is at risk of further
eutrophication from high nutrient loads in the groundwater and runoff from the watershed.
This estuarine system is already listed as waters requiring a TMDL for fecal coliform and
3
estuarine bioassessments (Category 5) in the MA 2012 Integrated List of Waters
(http://www.mass.gov/eea/docs/dep/water/resources/07v5/12list2.pdf), as summarized in
Table 1.
Figure 1: Overview of Lagoon Pond
(Upper Basin)
(Mid Basin)
(Lower Basin)
East Arm
(South End Basin)

4
Figure 2: Lagoon Pond Watershed Area Delineation
Table 1: Comparison of MassDEP and SMAST Impaired Parameters for Lagoon Pond
1 Water body segment is listed in Category 5 of the MA 2012 Integrated List of Waters)
2 As determined by the MEP Lagoon Pond Study and reported in the Technical Report
A complete description of this embayment system is presented in Chapters I and IV of the
MEP Technical Report. A majority of the information on this embayment system is drawn
from this report. Chapters VI and VII of the MEP Technical Report provide assessment data
that show that the Lagoon Pond estuarine system is impaired because of elevated nutrients,
low dissolved oxygen levels, elevated chlorophyll a levels, eelgrass loss and degraded benthic
fauna habitat. Please note that pathogens are listed in Table 1 for completeness. Further
discussion of pathogens is beyond the scope of this TMDL.
The embayment addressed by this document is determined to be a high priority based on three
significant factors: (1) the initiative that the towns have taken to assess the conditions of the
entire embayment system; (2) the commitment made by the towns to restore and preserve the
embayment; and (3) the extent of impairment in the embayment. In particular, this
Name
Water
Body
Segment
Description Size DEP Listed
Parameter1
SMAST Impaired
Parameter2
Lagoon
Pond MA97-11
From Head of the Pond Road to
confluence with Vineyard Haven
Harbor at Beach Road, Tisbury/Oak
Bluffs, Martha's Vineyard.
0.819
sq. mi.
-Estuarine
Bioassessments
-Fecal coliform
-Nutrients
-DO level
-Chlorophyll a
-Eelgrass loss
-Benthic fauna
5
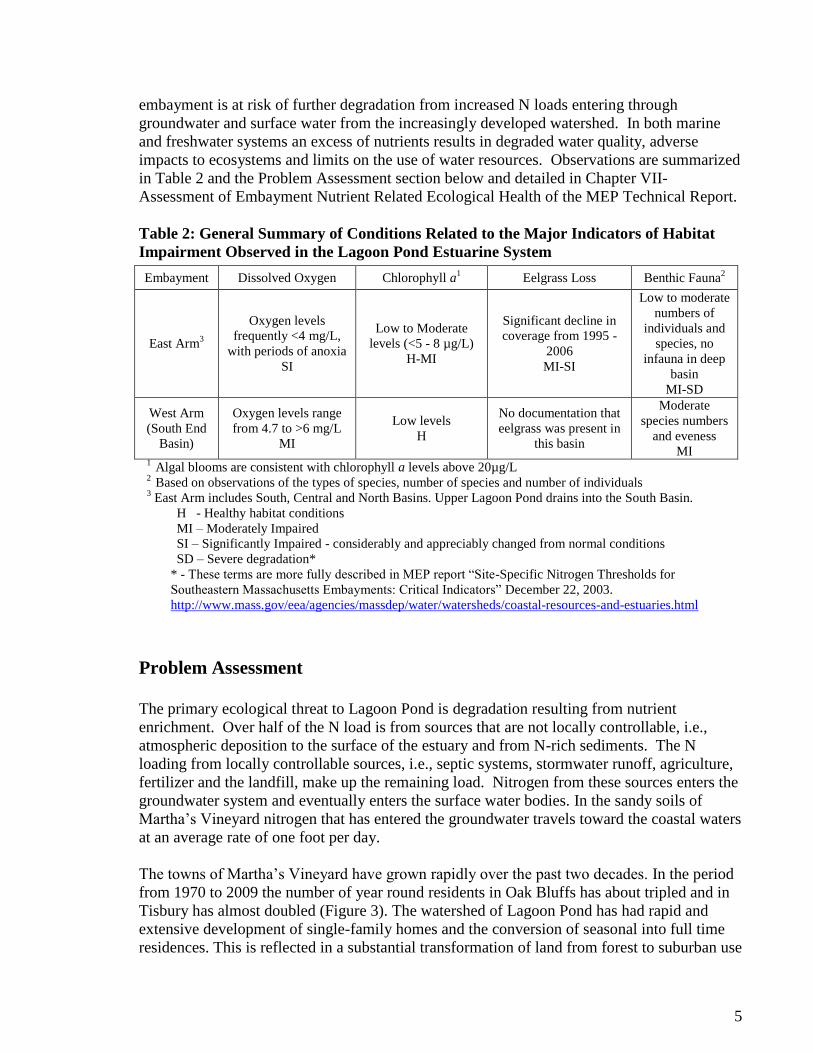
embayment is at risk of further degradation from increased N loads entering through
groundwater and surface water from the increasingly developed watershed. In both marine
and freshwater systems an excess of nutrients results in degraded water quality, adverse
impacts to ecosystems and limits on the use of water resources. Observations are summarized
in Table 2 and the Problem Assessment section below and detailed in Chapter VII-
Assessment of Embayment Nutrient Related Ecological Health of the MEP Technical Report.
Table 2: General Summary of Conditions Related to the Major Indicators of Habitat
Impairment Observed in the Lagoon Pond Estuarine System
Problem Assessment
The primary ecological threat to Lagoon Pond is degradation resulting from nutrient
enrichment. Over half of the N load is from sources that are not locally controllable, i.e.,
atmospheric deposition to the surface of the estuary and from N-rich sediments. The N
loading from locally controllable sources, i.e., septic systems, stormwater runoff, agriculture,
fertilizer and the landfill, make up the remaining load. Nitrogen from these sources enters the
groundwater system and eventually enters the surface water bodies. In the sandy soils of
Martha’s Vineyard nitrogen that has entered the groundwater travels toward the coastal waters
at an average rate of one foot per day.
The towns of Martha’s Vineyard have grown rapidly over the past two decades. In the period
from 1970 to 2009 the number of year round residents in Oak Bluffs has about tripled and in
Tisbury has almost doubled (Figure 3). The watershed of Lagoon Pond has had rapid and
extensive development of single-family homes and the conversion of seasonal into full time
residences. This is reflected in a substantial transformation of land from forest to suburban use
Embayment
Dissolved Oxygen Chlorophyll a1
Eelgrass Loss Benthic Fauna2
East Arm3
Oxygen levels
frequently <4 mg/L,
with periods of anoxia
SI
Low to Moderate
levels (<5 - 8 µg/L)
H-MI
Significant decline in
coverage from 1995 -
2006
MI-SI
Low to moderate
numbers of
individuals and
species, no
infauna in deep
basin
MI-SD
West Arm
(South End
Basin)
Oxygen levels range
from 4.7 to >6 mg/L
MI
Low levels
H
No documentation that
eelgrass was present in
this basin
Moderate
species numbers
and eveness
MI 1
Algal blooms are consistent with chlorophyll a levels above 20µg/L 2
Based on observations of the types of species, number of species and number of individuals 3 East Arm includes South, Central and North Basins. Upper Lagoon Pond drains into the South Basin.
H - Healthy habitat conditions
MI – Moderately Impaired
SI – Significantly Impaired - considerably and appreciably changed from normal conditions
SD – Severe degradation*
* - These terms are more fully described in MEP report “Site-Specific Nitrogen Thresholds for
Southeastern Massachusetts Embayments: Critical Indicators” December 22, 2003.
http://www.mass.gov/eea/agencies/massdep/water/watersheds/coastal-resources-and-estuaries.html
6
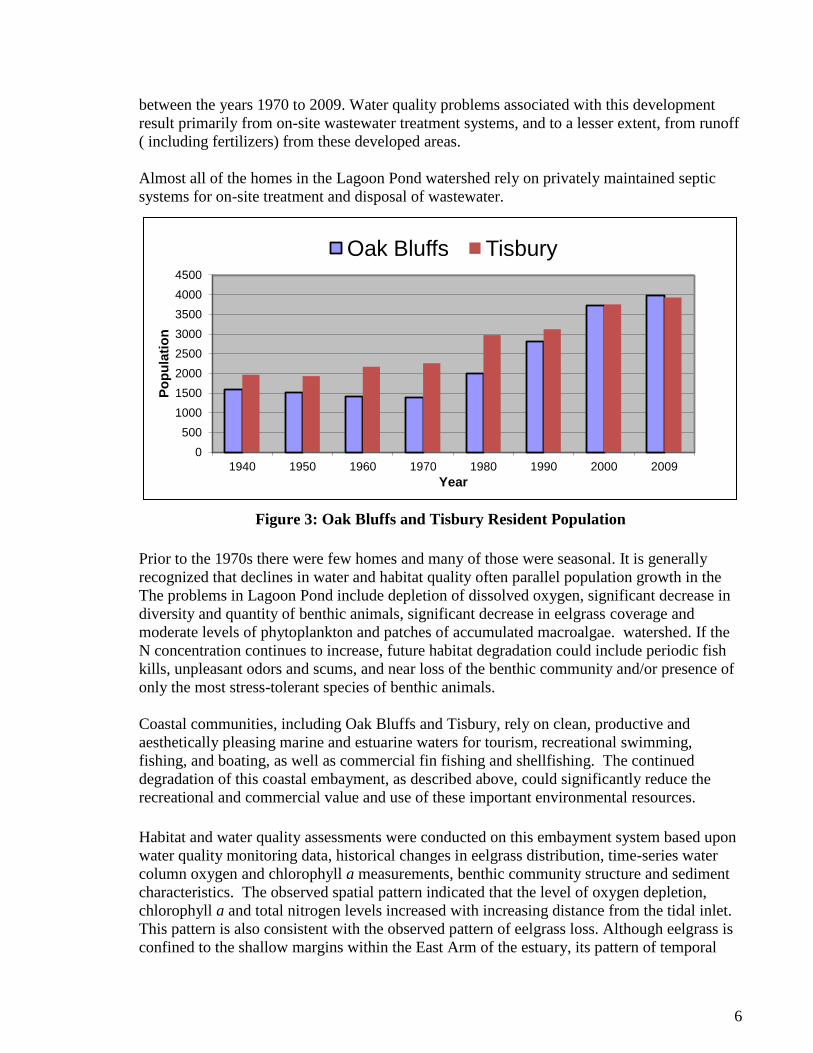
between the years 1970 to 2009. Water quality problems associated with this development
result primarily from on-site wastewater treatment systems, and to a lesser extent, from runoff
( including fertilizers) from these developed areas.
Almost all of the homes in the Lagoon Pond watershed rely on privately maintained septic
systems for on-site treatment and disposal of wastewater.
Figure 3: Oak Bluffs and Tisbury Resident Population
Prior to the 1970s there were few homes and many of those were seasonal. It is generally
recognized that declines in water and habitat quality often parallel population growth in the
The problems in Lagoon Pond include depletion of dissolved oxygen, significant decrease in
diversity and quantity of benthic animals, significant decrease in eelgrass coverage and
moderate levels of phytoplankton and patches of accumulated macroalgae. watershed. If the
N concentration continues to increase, future habitat degradation could include periodic fish
kills, unpleasant odors and scums, and near loss of the benthic community and/or presence of
only the most stress-tolerant species of benthic animals.
Coastal communities, including Oak Bluffs and Tisbury, rely on clean, productive and
aesthetically pleasing marine and estuarine waters for tourism, recreational swimming,
fishing, and boating, as well as commercial fin fishing and shellfishing. The continued
degradation of this coastal embayment, as described above, could significantly reduce the
recreational and commercial value and use of these important environmental resources.
Habitat and water quality assessments were conducted on this embayment system based upon
water quality monitoring data, historical changes in eelgrass distribution, time-series water
column oxygen and chlorophyll a measurements, benthic community structure and sediment
characteristics. The observed spatial pattern indicated that the level of oxygen depletion,
chlorophyll a and total nitrogen levels increased with increasing distance from the tidal inlet.
This pattern is also consistent with the observed pattern of eelgrass loss. Although eelgrass is
confined to the shallow margins within the East Arm of the estuary, its pattern of temporal
0
500
1000
1500
2000
2500
3000
3500
4000
4500
1940 1950 1960 1970 1980 1990 2000 2009
Po
pu
lati
on
Year
Oak Bluffs Tisbury

7
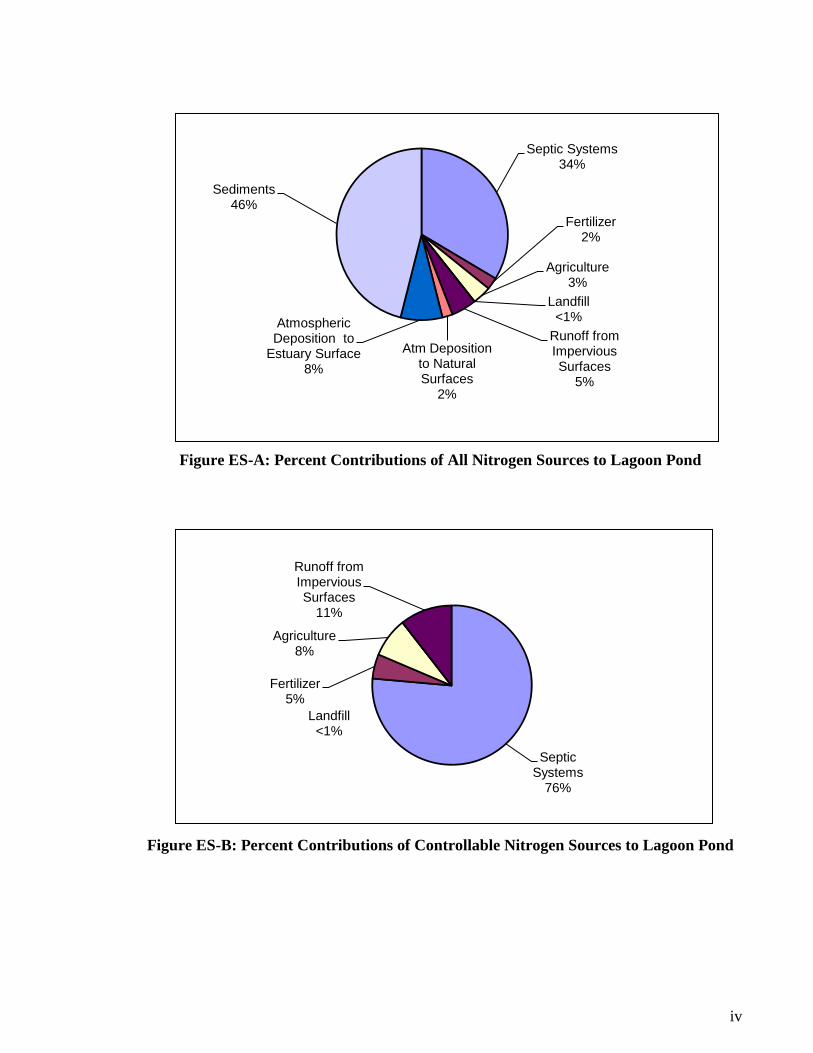
Septic Systems
34%
Fertilizer 2%
Agriculture 3%
Landfill <1%
Runoff from Impervious Surfaces
5%
Atm Deposition to
Natural Surfaces
2%
Atmospheric Deposition to
Estuary Surface
8%
Sediments 46%
loss is consistent with an estuarine system that is beyond its ability to assimilate nitrogen
loads without impairment. Benthic habitat is also impaired by nitrogen enrichment but the
level appears to be worse in deep versus shallow water. The MEP study found that impacts
from nutrient enrichment in Lagoon Pond are magnified by its basin structure, which when
combined with the depositional nature of the basins and periodic reduced vertical mixing,
results in poor quality benthic animal habitat within the deeper waters of the basins of the East
Arm. At present, eelgrass exists mainly within the North Basin of Lagoon Pond closest to the
inlet with narrow beds in the shallow (<2m) water margins fringing the basins within the
Central and South Basins of the East Arm. There is no eelgrass in the West Arm although
information from 1987 indicates that it did exist there. The absence of eelgrass in this basin is
consistent with its level of nitrogen enrichment (average of 0.386 mg N/L which is the similar
to the South Basin of the East Arm (average 0.384 mg N/L) which has also lost much of its
fringing eelgrass beds while the eelgrass beds that persist are in areas with significantly lower
nitrogen levels. Historical and present absence of eelgrass in the deep basins (4 – 10 m) is
likely due to insufficient light based on depth rather than nutrient enrichment.
Pollutant of Concern, Sources and Controllability
In Lagoon Pond, as in most marine and coastal waters, the limiting nutrient is nitrogen (N).
Nitrogen concentrations beyond those expected naturally contribute to undesirable water
quality and habitat conditions (as described above).
Lagoon Pond has had extensive data collected and analyzed through the MEP with the
cooperation and assistance from the Towns of Oak Bluffs and Tisbury and the Martha’s
Vineyard Commission. Data collection included both water quality and hydrodynamics as
described in Chapters I, IV, V, VI, and VII of the MEP Technical Report. These
investigations revealed that loadings of nutrients, especially N, are much larger than they
would be under natural conditions and as a result the water quality has deteriorated. Figure 4
illustrates the sources and percent contributions of N into Lagoon Pond.
Figure 4: Percent Contribution of All Nitrogen Sources to Lagoon Pond

8
The level of “controllability” of each source, however, varies widely:
Agricultural – related N loadings can be controlled through agricultural BMPs.
Atmospheric deposition to estuary surface - cannot be controlled locally – it is only through
regional and national air pollution control initiatives that significant reductions are feasible.
Atmospheric deposition to natural surfaces (forests, fields, etc.) in the watershed –
atmospheric deposition (loadings) to these areas cannot adequately be controlled locally,
however the N from these sources might be subjected to enhanced natural attenuation as it
moves towards the estuary.
Fertilizer – related N loadings can be reduced through bylaws and public education.
Landfill – related N loadings can be controlled through appropriate BMP and management
techniques;
Natural background - background load if the entire watershed was still forested and contained
no anthropogenic sources. It cannot be controlled.
Nitrogen from sediments - control by such measures as dredging is not feasible on a large
scale. However, the concentrations of N in sediments, and thus the loadings from the
sediments, will decline over time if sources in the watershed are removed, or reduced to the
target levels discussed later in this document. In addition, increased dissolved oxygen will
help keep N from fluxing.
Septic systems - sources of N are the largest controllable sources. These can be controlled by
a variety of case-specific methods including: sewering and treatment at centralized or
decentralized locations, transporting and treating septage at treatment facilities with N
removal technology either in or out of the watershed, or installing N-reducing on-site
wastewater treatment systems.
Stormwater Runoff – related N loadings can be reduced through best management practices
(BMPs), bylaws, stormwater infrastructure improvements and public education.
Cost/benefit analyses will have to be conducted for all possible N loading reduction
methodologies in order to select the optimal control strategies, priorities, and schedules.
Description of the Applicable Water Quality Standards
The Water Quality Classification of Lagoon Pond is SA. Water quality standards of particular
interest to the issues of cultural eutrophication are dissolved oxygen, nutrients, aesthetics, excess
plant biomass and nuisance vegetation. The Massachusetts Water Quality Standards (314
CMR 4.00) contain numeric criteria for dissolved oxygen but have only narrative standards
that relate to the other variables, as described below:
9
314 CMR 4.05(5)(a) states “Aesthetics – All surface waters shall be free from pollutants in
concentrations or combinations that settle to form objectionable deposits; float as debris,
scum, or other matter to form nuisances; produce objectionable odor, color, taste, or turbidity;
or produce undesirable or nuisance species of aquatic life.”
314 CMR 4.05(5)(c) states, “Nutrients. Unless naturally occurring, all surface waters shall
be free from nutrients in concentrations that would cause or contribute to impairment of
existing or designated uses and shall not exceed the site specific criteria developed in a
TMDL or as otherwise established…”
314 CMR 4.05(5)(b) states: “Bottom Pollutants or Alterations. All surface waters shall be free
from pollutants in concentrations or combinations or from alterations that adversely affect the
physical or chemical nature of the bottom, interfere with the propagation of fish or shellfish,
or adversely affect populations of non-mobile or sessile benthic organisms.”
314 CMR 4.05(b) 1: Class SA
1. Dissolved Oxygen - Dissolved Oxygen. Shall not be less than 6.0 mg/L. Where
natural background conditions are lower, DO shall not be less than natural
background. Natural seasonal and daily variations that are necessary to protect
existing and designated uses shall be maintained.
Thus, the assessment of eutrophication is based on site-specific information within a general
framework that emphasizes impairment of uses and preservation of a balanced indigenous
flora and fauna. This approach is recommended by the US Environmental Protection Agency
in their draft Nutrient Criteria Technical Guidance Manual for Estuarine and Coastal Marine
Waters (EPA-822-B-01-003, Oct 2001). The Guidance Manual notes that lakes, reservoirs,
streams and rivers may be subdivided by classes, allowing reference conditions for each class
and facilitating cost-effective criteria development for nutrient management. However,
individual estuarine and coastal marine waters tend to have unique characteristics and
development of individual water body criteria is typically required.
Methodology - Linking Water Quality and Pollutant Sources
Extensive data collection and analyses have been described in detail in the MEP Technical
Report. Those data were used by SMAST to assess the loading capacity of each sub-
embayment. Physical (Chapter V), chemical, and biological (Chapters IV, VII, and VIII) data
were collected and evaluated. The primary water quality objective was represented by
conditions that:
1) Restore the natural distribution of eelgrass because it provides valuable habitat for
shellfish and finfish;
2) Prevent algal blooms;
3) Protect benthic communities from impairment or loss;
4) Maintain dissolved oxygen concentrations that are protective of the estuarine
communities.

10
The details of the data collection, modeling and evaluation are presented and discussed in
Chapters IV, V, VI, VII and VIII of the MEP Technical Report. The main aspects of the data
evaluation and modeling approach of this study are summarized below.
The core of the Massachusetts Estuaries Project analytical method is the Linked Watershed-
Embayment Management Modeling Approach. It fully links watershed inputs with
embayment circulation and N characteristics and is characterized as follows:
• Requires site specific measurements within the watershed and each sub-embayment;
• Uses realistic “best-estimates” of N loads from each land-use (as opposed to loads with
built-in “safety factors” like Title 5 design loads);
• Spatially distributes the watershed N loading to the embayment;
• Accounts for N attenuation during transport to the embayment;
• Includes a 2D or 3D embayment circulation model depending on embayment structure;
• Accounts for basin structure, tidal variations, and dispersion within the embayment;
• Includes N regenerated within the embayment;
• Is validated by independent hydrodynamic, N concentration, and ecological data;
• Is calibrated and validated with field data prior to generation of “what if” scenarios.
The Linked Model has been applied previously to watershed N management in numerous
embayments throughout Southeastern Massachusetts. In these applications it became clear
that the model can be calibrated and validated, and has use as a management tool for
evaluating watershed N management options.
The Linked Model, when properly calibrated and validated for a given embayment, becomes a
N management planning tool as described in the model overview below. The model can
assess solutions for the protection or restoration of nutrient-related water quality and allows
testing of management scenarios to support cost/benefit evaluations. In addition, once a
model is fully functional it can be refined for changes in land-use or embayment
characteristics at minimal cost. Also, since the Linked Model uses a holistic approach that
incorporates the entire watershed, embayment and tidal source waters, it can be used to
evaluate all projects as they relate directly or indirectly to water quality conditions within its
geographic boundaries. It should be noted that this approach includes high-order, watershed
and sub-watershed scale modeling necessary to develop critical nitrogen targets for each
major sub-embayment. The models, data and assumptions used in this process are specifically
intended for the purposes stated in the MEP Technical Report, upon which this TMDL is
based. As such, the Linked Model process does not contain the type of data or level and scale
of analysis necessary to predict the fate and transport of nitrogen through groundwater from
11
specific sources. In addition, any determinations related to direct and immediate hydrologic
connection to surface waters are beyond the scope of the MEP’s Linked Model process.
The Linked Model provides a quantitative approach for determining an embayment's: (1) N
sensitivity; (2) N threshold loading levels (TMDL); and (3) response to changes in loading
rate. The approach is fully field validated and unlike many approaches, accounts for nutrient
sources, attenuation, and recycling and variations in tidal hydrodynamics (Figure I-3 of the
MEP Technical Report). This methodology integrates a variety of field data and models,
specifically:
• Monitoring - multi-year embayment nutrient sampling;
• Hydrodynamics;
Embayment bathymetry (depth contours throughout the embayment)
Site-specific tidal record (timing and height of tides)
Water velocity records (in complex systems only)
Hydrodynamic model
• Watershed N Loading;
Watershed delineation
Stream flow (Q) and N load
Land-use analysis (GIS)
Watershed N model
• Embayment TMDL – Synthesis;
Linked Watershed-Embayment N Model
Salinity surveys (for linked model validation)
Rate of N recycling within embayment
Dissolved oxygen record
Macrophyte survey
Infaunal survey
Application of the Linked Watershed-Embayment Model
The approach developed by the MEP for applying the linked model to specific embayments
for the purpose of developing target threshold N loading rates includes:
1) Selecting one or two sub-embayments within the embayment system located close
to the inland-most reach or reaches which typically has/have the poorest water
quality within the system. These are called “sentinel” stations;
2) Using site-specific information and a minimum of three years of sub-embayment-
specific data to select target threshold N concentrations for each sub-embayment.
This is done by refining the draft target threshold N concentrations that were
developed as the initial step of the MEP process. The target threshold N

12
concentrations that were selected generally occur in higher quality waters near the
mouth of the embayment system;
3) Running the calibrated water quality model using different watershed N loading
rates, to determine the loading rate which will achieve the target threshold N
concentration at the sentinel station. Differences between the modeled N load
required to achieve the target threshold N concentration, and the present watershed
N load represent N management goals for restoration and protection of the
embayment system as a whole.
Previous sampling and data analyses and the modeling activities described above resulted in
four major outputs that were critical to the development of the TMDL. Two outputs are
related to N concentration:
the present N concentrations in the sub-embayments;
site-specific target threshold N concentrations.
Two outputs are related to N loadings:
the present N loads to the sub-embayments;
load reductions necessary to meet the site specific target threshold N concentrations.
In summary, meeting the water quality standards by reducing the N concentration (and thus
the N load) at the sentinel station(s), the water quality goals will be met throughout the entire
system.
A brief overview of each of the outputs follows.
Nitrogen concentrations in the embayment
a) Observed “present” conditions:
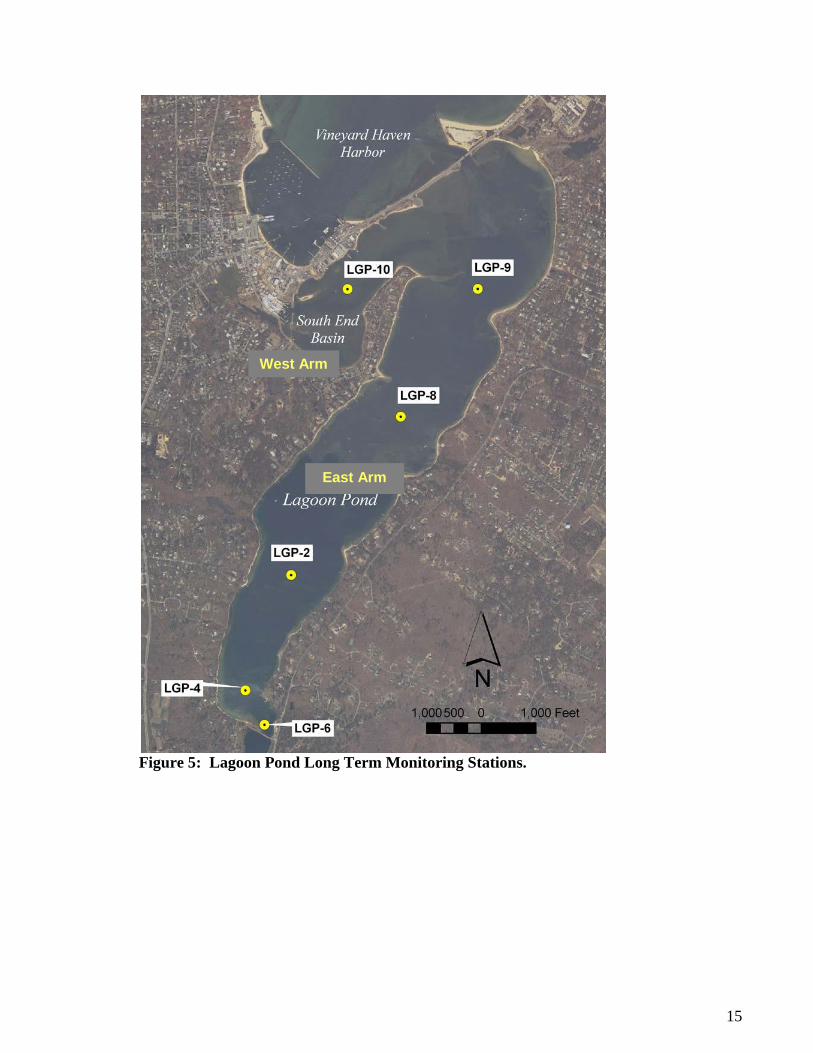
Table 3 presents the average concentrations of N measured in this system from data collected
at six stations during the period 2002 through 2007. Nitrogen concentrations range from
0.333 – 0.418 mg/L throughout the Lagoon Pond estuarine system. The lowest average
concentration is found in the North Basin closest to the inlet (Station LPG-9) and the highest
average is from the South Basin at the southernmost station (LGP-6). See Figure 5 for station
locations. The overall means and standard deviations of the averages are presented in
Appendix A, Table A-1 (reprinted from Table VI-1 of the MEP Technical Report).
b) Modeled site-specific target threshold N concentrations:
The target threshold N level for an embayment represents the average water column
concentration of N that will support the habitat quality or dissolved oxygen conditions
being sought. The water column N level is ultimately controlled by the integration of the
watershed N load, the N concentration in the inflowing tidal waters (boundary condition)
13
and dilution due to ground or surface water flows. The water column N concentration is
also modified by the extent of sediment regeneration, by direct atmospheric deposition, and
phytoplankton uptake.
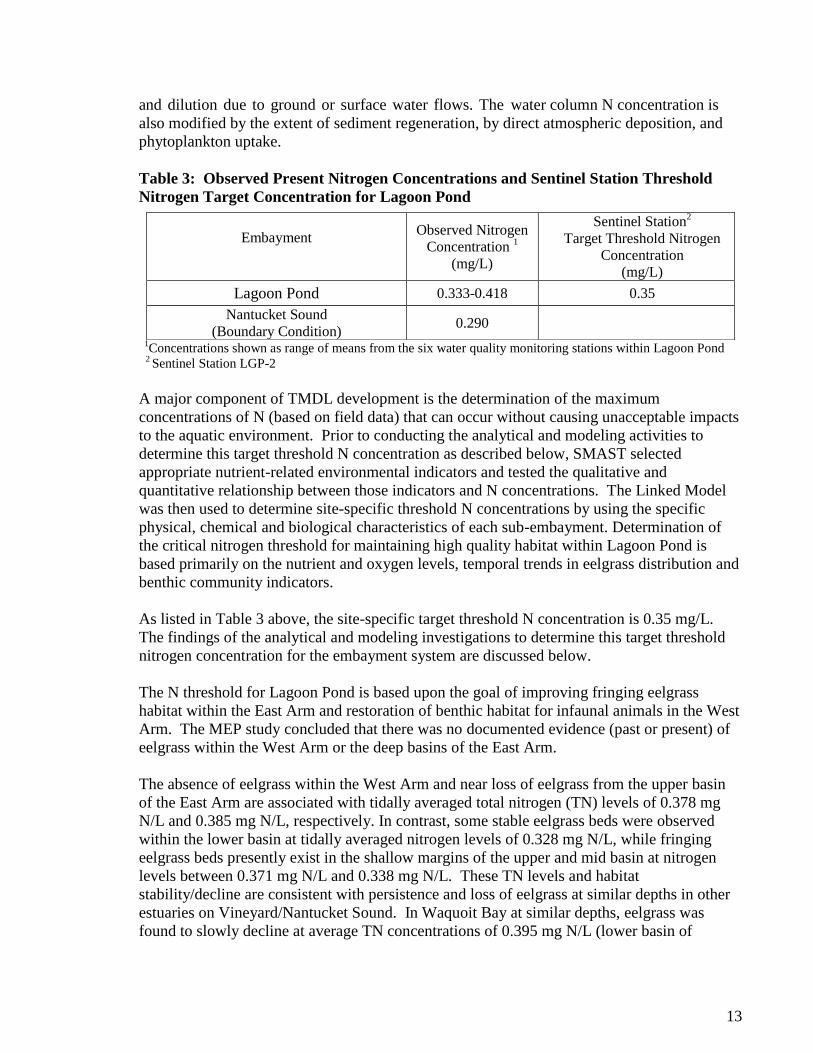
Table 3: Observed Present Nitrogen Concentrations and Sentinel Station Threshold
Nitrogen Target Concentration for Lagoon Pond
1Concentrations shown as range of means from the six water quality monitoring stations within Lagoon Pond
2 Sentinel Station LGP-2
A major component of TMDL development is the determination of the maximum
concentrations of N (based on field data) that can occur without causing unacceptable impacts
to the aquatic environment. Prior to conducting the analytical and modeling activities to
determine this target threshold N concentration as described below, SMAST selected
appropriate nutrient-related environmental indicators and tested the qualitative and
quantitative relationship between those indicators and N concentrations. The Linked Model
was then used to determine site-specific threshold N concentrations by using the specific
physical, chemical and biological characteristics of each sub-embayment. Determination of
the critical nitrogen threshold for maintaining high quality habitat within Lagoon Pond is
based primarily on the nutrient and oxygen levels, temporal trends in eelgrass distribution and
benthic community indicators.
As listed in Table 3 above, the site-specific target threshold N concentration is 0.35 mg/L.
The findings of the analytical and modeling investigations to determine this target threshold
nitrogen concentration for the embayment system are discussed below.
The N threshold for Lagoon Pond is based upon the goal of improving fringing eelgrass
habitat within the East Arm and restoration of benthic habitat for infaunal animals in the West
Arm. The MEP study concluded that there was no documented evidence (past or present) of
eelgrass within the West Arm or the deep basins of the East Arm.
The absence of eelgrass within the West Arm and near loss of eelgrass from the upper basin
of the East Arm are associated with tidally averaged total nitrogen (TN) levels of 0.378 mg
N/L and 0.385 mg N/L, respectively. In contrast, some stable eelgrass beds were observed
within the lower basin at tidally averaged nitrogen levels of 0.328 mg N/L, while fringing
eelgrass beds presently exist in the shallow margins of the upper and mid basin at nitrogen
levels between 0.371 mg N/L and 0.338 mg N/L. These TN levels and habitat
stability/decline are consistent with persistence and loss of eelgrass at similar depths in other
estuaries on Vineyard/Nantucket Sound. In Waquoit Bay at similar depths, eelgrass was
found to slowly decline at average TN concentrations of 0.395 mg N/L (lower basin of
Embayment
Observed Nitrogen
Concentration 1
(mg/L)
Sentinel Station2
Target Threshold Nitrogen
Concentration (mg/L)
Lagoon Pond 0.333-0.418 0.35
Nantucket Sound (Boundary Condition)
0.290

14
Waquoit Bay) and was also lost from the Centerville River at a tidally averaged TN of 0.395
mg N/L. In the West Falmouth Harbor Estuary on Buzzards Bay eelgrass declined when
nitrogen enrichment resulted in levels over 0.35 mg N/L. Therefore, it appears that the
threshold for stable eelgrass habitat in Lagoon Pond must be less than 0.385 mg N/L, as this is
the present level and loss is continuing. Similarly, it appears that eelgrass beds presently exist
in Lagoon Pond at nitrogen levels between 0.371 mg N/L and 0.338 mg N/L. However, at the
higher end of this range some loss is continuing.
Based upon these observations and those from other systems, a tidally averaged nitrogen
threshold for Lagoon Pond of 0.35 mg N/L was established to support restoration of the
impaired eelgrass habitat at depth (~2 m) as found historically. This threshold is for the
sentinel station LGP-2 located at the upper extent of the major fringing beds observed in 1995
(Figure 5). Lowering the level of nitrogen enrichment at the sentinel station will also lower
nitrogen levels throughout the estuary with the concurrent effect of improving infaunal
habitats in the West Arm.
Nitrogen loadings to the embayment
a) Present loading rates:
In the Lagoon Pond estuarine system overall, the highest N loading from controllable sources
is from on-site wastewater treatment systems which is almost always the highest N loading
source in other coastal embayments as well. The septic system loading is 34.4 kg N/day in
Lagoon Pond. The total N loading from all sources is 101.7 kg N/day across the Lagoon Pond
embayment. A further breakdown of N loading by source is presented in Table 5. The data
on which Table 4 is based can be found in Table ES-1 of the MEP Technical Report.
Table 4: Nitrogen Loading to Lagoon Pond
As previously indicated, the present N loadings to Lagoon Pond must be reduced in order to
restore conditions and to avoid further nutrient-related adverse environmental impacts. The
critical final step in the development of the TMDL is modeling and analysis to determine the
loadings required to achieve the target threshold N concentrations.
Embayment
Present Non-
Wastewater
Watershed Load1
(kg N/day)
Present Septic
System
Load
(kg N/day)
Present
Atmospheric
Deposition2
(kg N/day)
Present Load
from Nutrient
Rich Sediments
(kg N/day)
Total nitrogen
load from all
sources
(kg N/day)
Lagoon Pond 12.4 34.4 8.1 46.9 101.7
1 Includes fertilizers, runoff, agriculture, landfill and atmospheric deposition to lakes and natural surfaces. 2 Includes atmospheric deposition to the estuarine surface only.
15
Figure 5: Lagoon Pond Long Term Monitoring Stations.
West Arm
East Arm
16
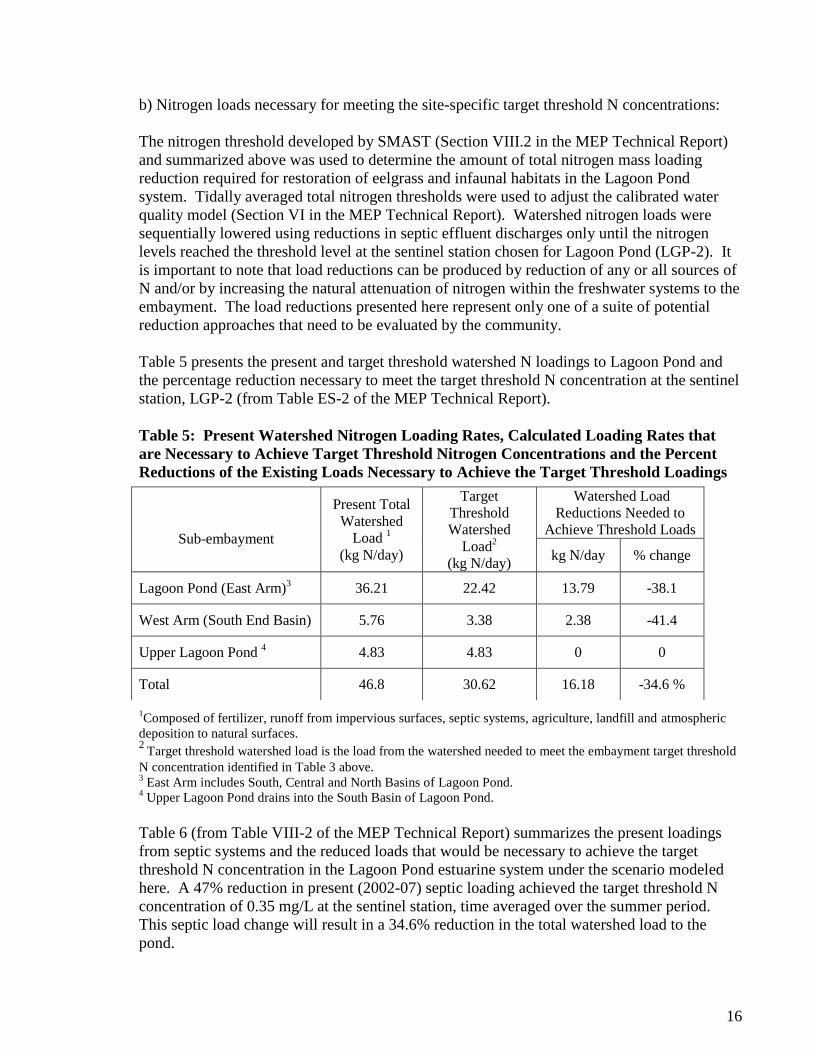
b) Nitrogen loads necessary for meeting the site-specific target threshold N concentrations:
The nitrogen threshold developed by SMAST (Section VIII.2 in the MEP Technical Report)
and summarized above was used to determine the amount of total nitrogen mass loading
reduction required for restoration of eelgrass and infaunal habitats in the Lagoon Pond
system. Tidally averaged total nitrogen thresholds were used to adjust the calibrated water
quality model (Section VI in the MEP Technical Report). Watershed nitrogen loads were
sequentially lowered using reductions in septic effluent discharges only until the nitrogen
levels reached the threshold level at the sentinel station chosen for Lagoon Pond (LGP-2). It
is important to note that load reductions can be produced by reduction of any or all sources of
N and/or by increasing the natural attenuation of nitrogen within the freshwater systems to the
embayment. The load reductions presented here represent only one of a suite of potential
reduction approaches that need to be evaluated by the community.
Table 5 presents the present and target threshold watershed N loadings to Lagoon Pond and
the percentage reduction necessary to meet the target threshold N concentration at the sentinel
station, LGP-2 (from Table ES-2 of the MEP Technical Report).
Table 5: Present Watershed Nitrogen Loading Rates, Calculated Loading Rates that
are Necessary to Achieve Target Threshold Nitrogen Concentrations and the Percent
Reductions of the Existing Loads Necessary to Achieve the Target Threshold Loadings
1Composed of fertilizer, runoff from impervious surfaces, septic systems, agriculture, landfill and atmospheric
deposition to natural surfaces. 2
Target threshold watershed load is the load from the watershed needed to meet the embayment target threshold
N concentration identified in Table 3 above. 3 East Arm includes South, Central and North Basins of Lagoon Pond.
4 Upper Lagoon Pond drains into the South Basin of Lagoon Pond.
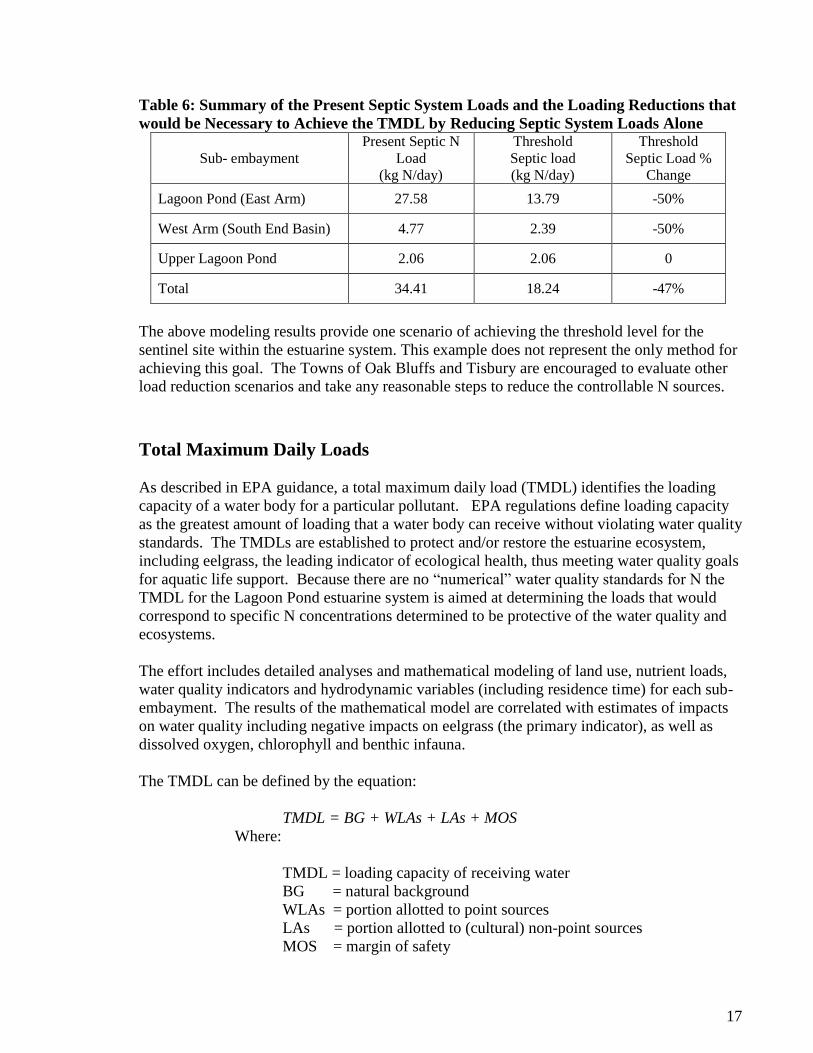
Table 6 (from Table VIII-2 of the MEP Technical Report) summarizes the present loadings
from septic systems and the reduced loads that would be necessary to achieve the target
threshold N concentration in the Lagoon Pond estuarine system under the scenario modeled
here. A 47% reduction in present (2002-07) septic loading achieved the target threshold N
concentration of 0.35 mg/L at the sentinel station, time averaged over the summer period.
This septic load change will result in a 34.6% reduction in the total watershed load to the
pond.
Sub-embayment
Present Total
Watershed Load
1 (kg N/day)
Target Threshold Watershed
Load2
(kg N/day)
Watershed Load
Reductions Needed to
Achieve Threshold Loads
kg N/day % change
Lagoon Pond (East Arm)3 36.21 22.42 13.79 -38.1
West Arm (South End Basin) 5.76 3.38 2.38 -41.4
Upper Lagoon Pond 4 4.83 4.83 0 0
Total 46.8 30.62 16.18 -34.6 %
17
Table 6: Summary of the Present Septic System Loads and the Loading Reductions that
would be Necessary to Achieve the TMDL by Reducing Septic System Loads Alone
Sub- embayment Present Septic N
Load (kg N/day)
Threshold Septic load (kg N/day)
Threshold
Septic Load % Change
Lagoon Pond (East Arm) 27.58 13.79 -50%
West Arm (South End Basin) 4.77 2.39 -50%
Upper Lagoon Pond 2.06 2.06 0
Total 34.41 18.24 -47%
The above modeling results provide one scenario of achieving the threshold level for the
sentinel site within the estuarine system. This example does not represent the only method for
achieving this goal. The Towns of Oak Bluffs and Tisbury are encouraged to evaluate other
load reduction scenarios and take any reasonable steps to reduce the controllable N sources.
Total Maximum Daily Loads
As described in EPA guidance, a total maximum daily load (TMDL) identifies the loading
capacity of a water body for a particular pollutant. EPA regulations define loading capacity
as the greatest amount of loading that a water body can receive without violating water quality
standards. The TMDLs are established to protect and/or restore the estuarine ecosystem,
including eelgrass, the leading indicator of ecological health, thus meeting water quality goals
for aquatic life support. Because there are no “numerical” water quality standards for N the
TMDL for the Lagoon Pond estuarine system is aimed at determining the loads that would
correspond to specific N concentrations determined to be protective of the water quality and
ecosystems.
The effort includes detailed analyses and mathematical modeling of land use, nutrient loads,
water quality indicators and hydrodynamic variables (including residence time) for each sub-
embayment. The results of the mathematical model are correlated with estimates of impacts
on water quality including negative impacts on eelgrass (the primary indicator), as well as
dissolved oxygen, chlorophyll and benthic infauna.
The TMDL can be defined by the equation:
TMDL = BG + WLAs + LAs + MOS
Where:
TMDL = loading capacity of receiving water
BG = natural background
WLAs = portion allotted to point sources
LAs = portion allotted to (cultural) non-point sources
MOS = margin of safety
18
Background Loading
Natural background N loading is included in the loading estimates, but is not quantified and
presented separately. Background loading was calculated on the assumption that the entire
watershed is forested with no anthropogenic sources of N. It is accounted for in this study but
not defined as a separate component. Readers are referred to Table ES-1 of the MEP
Technical Report for estimated loading due to natural conditions.
Waste Load Allocations
Waste load allocations identify the portion of the loading capacity allocated to existing and
future point sources of wastewater. EPA interprets 40 CFR 130.2(h) to require that
allocations for NPDES regulated discharges of stormwater be included in the waste load
component of the TMDL. For purposes of the Lagoon Pond TMDL, there are no NPDES
regulated areas for the discharges of stormwater in the watershed. However, MassDEP also
considered the nitrogen load reductions from impervious areas adjacent to the waterbody
necessary to meet the target nitrogen concentrations in the WLA. Since the majority of the N
loading from the watershed comes from septic systems and to a lesser extent agriculture,
fertilizer, the landfill, and storm water that infiltrates into the groundwater, the allocation of N
for any stormwater pipes that discharge directly to this embayment is insignificant but is
estimated here for completeness.
In estimating the nitrogen loadings from impervious sources, MassDEP considered that most
stormwater runoff from impervious surfaces in the watershed is not discharged directly into
surface waters, but, rather, percolates into the ground. The geology on Cape Cod and the
Islands consists primarily of glacial outwash sands and gravels, and water moves rapidly
through this type of soil profile. A systematic survey of stormwater conveyances on the
Islands has never been undertaken. Nevertheless, most catch basins on the Islands are known
to MassDEP to have been designed as leaching catch basins in light of the permeable
overburden. MassDEP, therefore, recognized that most stormwater that enters a catch basin in
these areas will percolate into the local groundwater table rather than directly discharge to a
surface waterbody.
As described in the Methodology Section (above), the Linked Model accounts for storm water
loadings and groundwater loading in one aggregate allocation as a non-point source.
However, MassDEP also considered that some stormwater may be discharged directly to
surface waters through outfalls. In the absence of specific data or other information to
accurately quantify stormwater discharged directly to surface waters, MassDEP assumed that
all impervious surfaces within 200 feet of the shoreline, as calculated from MassGIS data
layers, would discharge directly to surface waters, whether or not it in fact did so. MassDEP
selected this approach because it considered it unlikely that any stormwater collected farther
than 200 feet from the shoreline would be directly discharged into surface waters. Although
the 200 foot approach provided a gross estimate, MassDEP considered it a reasonable and
conservative approach given the lack of pertinent data and information about stormwater
collection systems on Martha’s Vineyard. For Lagoon Pond this calculated stormwater WLA
based on the 200 foot buffer is 0.40% of the total watershed N load or 0.19 kg N/day as
compared to the overall watershed N load of 48 kg N/day to the embayment (see Appendix C
19
for details). This conservative load is a negligible amount of the total nitrogen load to the
embayment when compared to other sources.
Load Allocations
Load allocations identify the portion of loading capacity allocated to existing and future
nonpoint sources. In the case of the Lagoon Pond estuarine system, the controllable nonpoint
source loadings are primarily from on-site subsurface wastewater disposal systems.
Additional N sources include agriculture, stormwater runoff (except from impervious cover
within 200 feet of the waterbody which is defined above as part of the waste load), fertilizers,
landfill, atmospheric deposition and nutrient-rich sediments.
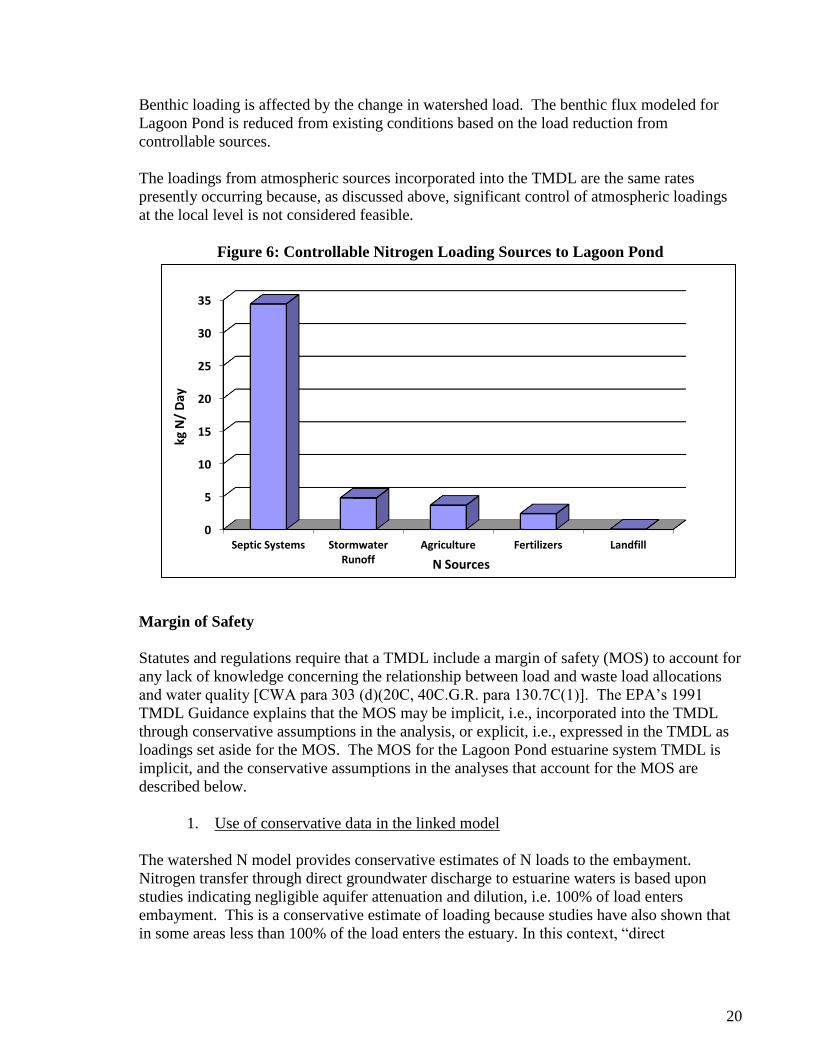
Figure ES-B (above) and Figure 6 (below) illustrate that septic systems are the most
significant portion of the controllable N load (34.4 kg N/day), with stormwater runoff a
distant second (4.8 kg N/day). Other controllable sources combined contribute 6.1 kg N/day
(from Table IV-2 in the MEP Technical Report). In addition, there are nonpoint sources of N
from sediments, natural background and atmospheric deposition that are not feasibly
controllable.
Generally, stormwater that is subject to the EPA Phase II Program would be considered a part
of the wasteload allocation rather than the load allocation. As presented in Chapters IV, V,
and VI of the MEP Technical Report, on the Islands, the vast majority of stormwater
percolates into the aquifer and enters the embayment system through groundwater. As a
result, the TMDL accounts for stormwater loadings and groundwater loadings in one
aggregate allocation as a non-point source. Ultimately, when the Phase II Program is
implemented in Oak Bluffs and Tisbury, new studies and possibly further modeling will
identify what portion of the stormwater load may be controllable through Best Management
Practices (BMPs).
The sediment loading rates incorporated into the TMDL are lower than the existing sediment
flux rates listed in Table 5 above because projected reductions of N loadings from the
watershed will result in reductions of nutrient concentrations in the sediments, and therefore,
over time, reductions in loadings from the sediments will occur. Benthic N flux is a function
of N loading and particulate organic N (PON).
Projected benthic fluxes are based upon projected PON concentrations and watershed N
loads and are calculated by multiplying the present N flux by the ratio of projected PON to
present PON using the following formulae:
Projected N flux = (present N flux) (PON projected / PON present)
When: PON projected = (Rload ) (DPON) + PON present offshore
When Rload = (projected N load) / (Present N load)
And DPON is the PON concentration above background determined by:
DPON = (PON present embayment – PON present offshore)
20
Benthic loading is affected by the change in watershed load. The benthic flux modeled for
Lagoon Pond is reduced from existing conditions based on the load reduction from
controllable sources.
The loadings from atmospheric sources incorporated into the TMDL are the same rates
presently occurring because, as discussed above, significant control of atmospheric loadings
at the local level is not considered feasible.
Figure 6: Controllable Nitrogen Loading Sources to Lagoon Pond
Margin of Safety
Statutes and regulations require that a TMDL include a margin of safety (MOS) to account for
any lack of knowledge concerning the relationship between load and waste load allocations
and water quality [CWA para 303 (d)(20C, 40C.G.R. para 130.7C(1)]. The EPA’s 1991
TMDL Guidance explains that the MOS may be implicit, i.e., incorporated into the TMDL
through conservative assumptions in the analysis, or explicit, i.e., expressed in the TMDL as
loadings set aside for the MOS. The MOS for the Lagoon Pond estuarine system TMDL is
implicit, and the conservative assumptions in the analyses that account for the MOS are
described below.
1. Use of conservative data in the linked model
The watershed N model provides conservative estimates of N loads to the embayment.
Nitrogen transfer through direct groundwater discharge to estuarine waters is based upon
studies indicating negligible aquifer attenuation and dilution, i.e. 100% of load enters
embayment. This is a conservative estimate of loading because studies have also shown that
in some areas less than 100% of the load enters the estuary. In this context, “direct
0
5
10
15
20
25
30
35
Septic Systems Stormwater Runoff
Agriculture Fertilizers Landfill
kg N
/ D
ay
N Sources

21
groundwater discharge” refers to the portion of fresh water that enters an estuary as
groundwater seepage into the estuary itself, as opposed to the portion of fresh water that
enters as surface water inflow from streams, which receive much of their water from
groundwater flow. Nitrogen from the upper watershed regions which travel through ponds or
wetlands almost always enter the embayment via stream flow and are directly measured (over
12-16 months) to determine attenuation. In these cases, the land-use model has shown a
slightly higher predicted N load than the measured discharges in the streams/rivers that have
been assessed to date. Therefore, the watershed model as applied to the surface water
watershed areas again presents a conservative estimate of N loads because the actual
measured N in streams was lower than the modeled concentrations.
The hydrodynamic and water quality models have been assessed directly. In the many
instances where the hydrodynamic model predictions of volumetric exchange (flushing) have
also been directly measured by field measurements of instantaneous discharge, the agreement
between modeled and observed values has been >95%. Since the water quality model
incorporates all of the outputs from the other models, this good correlation indicates a high
degree of certainty in the final result. The level of accuracy and precision of the model
provides a high degree of confidence in the output so less of a margin of safety is required.
Similarly, the water column N validation dataset was also conservative. The model is
validated to measured water column N. However, the model predicts average summer N
concentrations. The very high or low measurements are marked as outliers. The effect is to
make the N threshold more accurate and scientifically defensible. If a single measurement
two times higher than the next highest data point in the series raises the average 0.05 mg N/L,
this would allow for a higher “acceptable” load to the embayment. Marking the very high
outlier is a way of preventing a single and rare bloom event from changing the N threshold for
a system. This effectively strengthens the data set so that a higher margin of safety is not
required.
Finally, the predicted reductions of the amount of N released from the sediments are most
likely underestimates, i.e. conservative. The reduction is based solely on a reduced deposition
of PON due to lower primary production rates under the reduced N loading in these systems.
As the N loading decreases and organic inputs are reduced it is likely that rates of coupled
remineralization-nitrification, denitrification and sediment oxidation will increase.
Benthic regeneration of N is dependent upon the amount of PON deposited to the sediments
and the percentage that is regenerated to the water column versus being denitrified or buried.
The regeneration rate projected under reduced N loading conditions was based upon two
assumptions: (1) PON in the embayment in excess of that of inflowing tidal water (boundary
condition) results from production supported by watershed N inputs; and (2) Presently
enhanced production will decrease in proportion to the reduction in the sum of watershed N
inputs and direct atmospheric N input. The latter condition would result in equal embayment
versus boundary condition production and PON levels if watershed N loading and direct
atmospheric deposition could be reduced to zero (an impossibility of course). This
proportional reduction assumes that the proportion of remineralized N will be the same as
22
under present conditions, which is almost certainly an underestimate. As a result, future N
regeneration rates are overestimated which adds to the margin of safety.
2. Conservative sentinel station/target threshold nitrogen concentration
Conservatism was used in the selection of the sentinel station and target threshold N
concentration. The concentration was chosen based on areas within the system that showed
somewhat stable eelgrass or benthic animal (infaunal) communities and not those just starting
to show impairment, which would have slightly higher N concentration. Meeting the target
threshold N concentration at the sentinel station will result in reductions of N concentrations
in the rest of the system.
3. Conservative approach
The linked model accounted for all stormwater loadings and groundwater loadings in
one aggregate allocation as a non point source and this aggregate load is accounted for
in the load allocation. The method of calculating the WLA in the TMDL for impervious
cover within the 200 foot buffer area of the waterbody was conservative as it did not
disaggregate this negligible load from the modeled stormwater LA, hence this approach
further enhances the MOS.
The target loads were based on tidally averaged N concentrations on the outgoing tide which
is the worst case condition because that is when the N concentrations are the highest. The N
concentrations will be lower on the flood tides; therefore, this approach is conservative.
In addition to the margin of safety within the context of setting the N threshold levels
described above, a programmatic margin of safety also derives from continued monitoring of
this embayment to support adaptive management. This continuous monitoring effort provides
the ongoing data to evaluate the improvements that occur over the multi-year implementation
of the N management plan. This will allow refinements to the plan to ensure that the desired
level of restoration is achieved.
Seasonal Variation
Since the TMDLs for the waterbody segments are based on the most critical time period, i.e.
the summer growing season, the TMDLs are protective for all seasons. The daily loads can
be converted to annual loads by multiplying by 365 (the number of days in a year). Nutrient
loads to the embayment are based on annual loads for two reasons. The first is that primary
production in coastal waters can peak in both the late winter-early spring and in the late
summer-early fall periods. Second, as a practical matter, the types of management necessary
to control the N load do not lend themselves to intra-annual manipulation since a considerable
portion of the N is from non-point sources. Thus, calculating annual loads is most
appropriate, since it is difficult to control non-point sources of N on a seasonal basis and N
sources can take considerable time to migrate to impacted waters.
23
TMDL Values for the Lagoon Pond Estuarine System
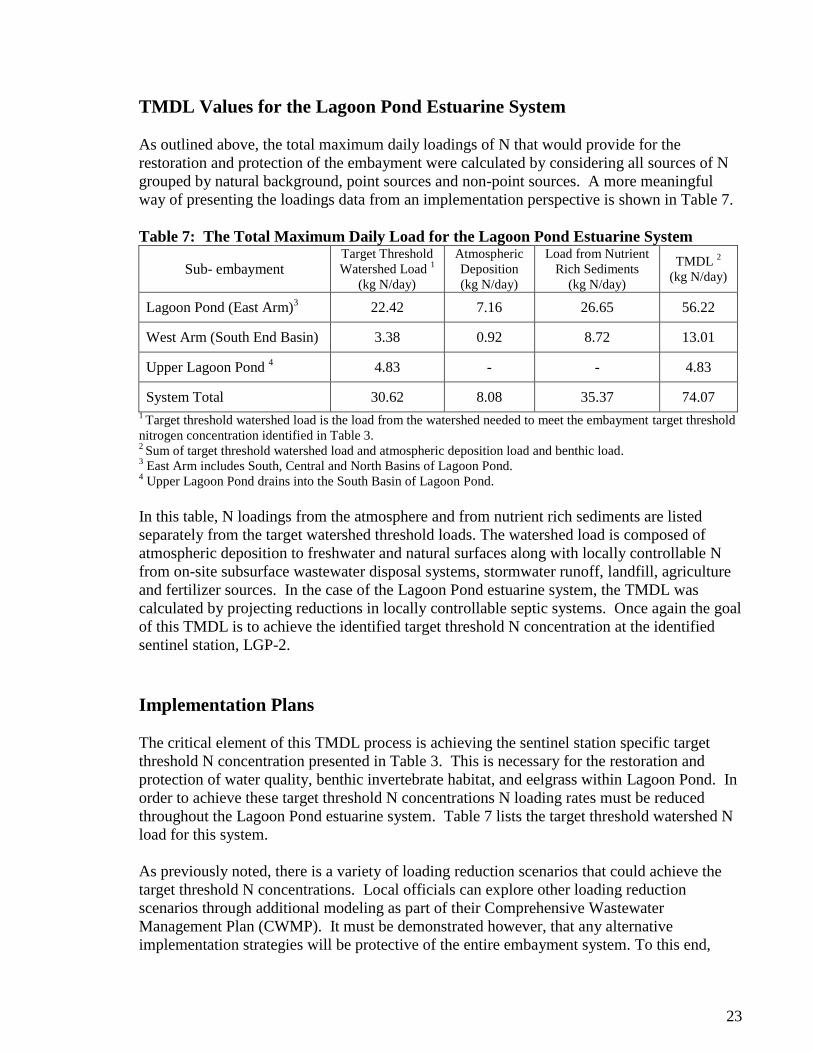
As outlined above, the total maximum daily loadings of N that would provide for the
restoration and protection of the embayment were calculated by considering all sources of N
grouped by natural background, point sources and non-point sources. A more meaningful
way of presenting the loadings data from an implementation perspective is shown in Table 7.
Table 7: The Total Maximum Daily Load for the Lagoon Pond Estuarine System
Sub- embayment Target Threshold
Watershed Load 1
(kg N/day)
Atmospheric
Deposition
(kg N/day)
Load from Nutrient
Rich Sediments
(kg N/day)
TMDL 2
(kg N/day)
Lagoon Pond (East Arm)3 22.42 7.16 26.65 56.22
West Arm (South End Basin) 3.38 0.92 8.72 13.01
Upper Lagoon Pond 4 4.83 - - 4.83
System Total 30.62 8.08 35.37 74.07 1 Target threshold watershed load is the load from the watershed needed to meet the embayment target threshold
nitrogen concentration identified in Table 3. 2 Sum of target threshold watershed load and atmospheric deposition load and benthic load.
3 East Arm includes South, Central and North Basins of Lagoon Pond.
4 Upper Lagoon Pond drains into the South Basin of Lagoon Pond.
In this table, N loadings from the atmosphere and from nutrient rich sediments are listed
separately from the target watershed threshold loads. The watershed load is composed of
atmospheric deposition to freshwater and natural surfaces along with locally controllable N
from on-site subsurface wastewater disposal systems, stormwater runoff, landfill, agriculture
and fertilizer sources. In the case of the Lagoon Pond estuarine system, the TMDL was
calculated by projecting reductions in locally controllable septic systems. Once again the goal
of this TMDL is to achieve the identified target threshold N concentration at the identified
sentinel station, LGP-2.
Implementation Plans
The critical element of this TMDL process is achieving the sentinel station specific target
threshold N concentration presented in Table 3. This is necessary for the restoration and
protection of water quality, benthic invertebrate habitat, and eelgrass within Lagoon Pond. In
order to achieve these target threshold N concentrations N loading rates must be reduced
throughout the Lagoon Pond estuarine system. Table 7 lists the target threshold watershed N
load for this system.
As previously noted, there is a variety of loading reduction scenarios that could achieve the
target threshold N concentrations. Local officials can explore other loading reduction
scenarios through additional modeling as part of their Comprehensive Wastewater
Management Plan (CWMP). It must be demonstrated however, that any alternative
implementation strategies will be protective of the entire embayment system. To this end,
24
additional linked model runs can be performed by the MEP at a nominal cost to assist the
planning efforts of the town in achieving target N loads that will result in the desired target
threshold N concentration.
Because the vast majority of controllable N load is from individual septic systems from
private residences, the CWMP should assess the most cost-effective options for achieving the
target threshold N watershed loads, including but not limited to, sewering and treatment for N
control of sewage and septage at either centralized or de-centralized locations, and
denitrifying systems for all private residences.
The CWMP should include a schedule of the selected strategies and estimated timelines for
achieving those targets. However, the MassDEP realizes that an adaptive management
approach may be used to observe implementation results over time and allow for adjustments
based on those results. If a community chooses to implement TMDL measures without a
CWMP it must demonstrate that these measures will achieve the target threshold N
concentration. (Note: Communities that choose to proceed without a CWMP will not be
eligible for State Revolving Fund 0% loans.)
The watershed communities of Oak Bluffs and Tisbury are urged to meet the target threshold
N concentrations by reducing N loadings from any and all sources, through whatever means
are available and practical, including reductions in stormwater runoff and/or fertilizer use
within the watershed through the establishment of local by-laws and/or the implementation of
stormwater BMPs, in addition to reductions in on-site subsurface wastewater disposal system
loadings.
All of the towns on Martha’s Vineyard adopted identical fertilizer regulations in the spring of
2014. This Regulation provides for a reduction of nitrogen and phosphorus going into the
Island’s Water Resources by means of an organized system of education, licensure, regulation
of practice, and enforcement. The Regulation is intended to contribute to the island’s ability to
protect, maintain, and ultimately improve the water quality in all its Water Resources and
assist in achieving compliance with any applicable water quality standards relating to
controllable nitrogen and phosphorus. http://mvboh.org/fertilizer.html
Although no towns in the Lagoon Pond watershed are Phase II regulated stormwater
communities, the Oak Bluffs Board of Health has adopted “Stormwater Management
Regulations” that have the same intentions as the Phase II Stormwater Regulations by
providing adequate protection against pollutants, flooding, siltation, and other drainage
problems.
MassDEP’s MEP Implementation Guidance report
(http://www.mass.gov/eea/agencies/massdep/water/watersheds/coastal-resources-and-
estuaries.html) provides N loading reduction strategies that are available to Oak Bluffs and
Tisbury that could be incorporated into the implementation plans. The following topics
related to N reduction are discussed in the Guidance:
Wastewater Treatment;
On-Site Treatment and Disposal Systems
Cluster Systems with Enhanced Treatment

25
Community Treatment Plants
Municipal Treatment Plants and Sewers
Tidal Flushing;
Channel Dredging
Inlet Alteration
Culvert Design and Improvements
Stormwater Control and Treatment*;
Source Control and Pollution Prevention
Stormwater Treatment
Attenuation via Wetlands and Ponds;
Water Conservation and Water Reuse;
Management Districts;
Land Use Planning and Controls;
Smart Growth
Open Space Acquisition
Zoning and Related Tools
Nutrient Trading. *The Towns of Oak Bluffs and Tisbury are not part of the 237 communities in Massachusetts currently covered
by the Phase II stormwater program requirements.
Monitoring Plan
MassDEP is of the opinion that there are two forms of monitoring that are useful to determine
progress towards achieving compliance with the TMDL. MassDEP’s position is that
implementation will be conducted through an iterative process where adjustments may be
needed in the future. The two forms of monitoring include: 1) tracking implementation
progress as approved in the town CWMP plan; and 2) monitoring ambient water quality
conditions, including but not limited to, the sentinel station identified in the MEP Technical
Report.
The CWMP will evaluate various options to achieve the goals set out in the TMDL and
Technical Report. It will also make a final recommendation based on existing or additional
modeling runs, set out required activities and identify a schedule to achieve the most cost
effective solution that will result in compliance with the TMDL. Once approved by
MassDEP, tracking progress on the agreed-upon plan will, in effect, also be tracking progress
towards water quality improvements in conformance with the TMDL.
Relative to water quality, MassDEP believes that an ambient monitoring program, much
reduced from the data collection activities needed to properly assess conditions and to
populate the model, will be important to determine actual compliance with water quality
standards. Although the TMDL load values are not fixed the target threshold N,
concentrations at the sentinel stations are. Through discussions amongst the MEP it is
generally agreed that existing monitoring programs which were designed to thoroughly assess
conditions and populate water quality models can be substantially reduced for compliance
monitoring purposes. Although more specific details need to be developed on a case by case
26
basis, MassDEP's current thinking is that about half the current effort (using the same data
collection procedures) would be sufficient to monitor compliance over time and to observe
trends in water quality changes. In addition, the benthic habitat and communities would
require periodic monitoring on a frequency of about every 3-5 years. Finally, in addition to
the above, existing monitoring conducted by MassDEP for eelgrass should continue into the
future to observe any changes that may occur to eelgrass populations as a result of restoration
efforts.
The MEP will continue working with the Towns of Oak Bluffs and Tisbury to develop and
refine monitoring plans that remain consistent with the goals of the TMDL. It must be
recognized however that development and implementation of a monitoring plan will take
some time, but it is more important at this point to focus efforts on reducing existing
watershed loads to achieve water quality goals.
Reasonable Assurances
MassDEP possesses the statutory and regulatory authority, under the water quality standards
and/or the State Clean Water Act (CWA), to implement and enforce the provisions of the
TMDL through its many permitting programs, including requirements for N loading
reductions from on-site subsurface wastewater disposal systems. However, because most
non-point source controls are voluntary, reasonable assurance is based on the commitment of
the locality involved. Oak Bluffs and Tisbury have demonstrated this commitment through
the comprehensive wastewater planning that they initiated well before the generation of the
TMDL. The towns expect to use the information in this TMDL to generate support from their
citizens to take the necessary steps to remedy existing problems related to N loading from on-
site subsurface wastewater disposal systems, stormwater, and runoff (including fertilizers) and
to prevent any future degradation of these valuable resources. Moreover, reasonable
assurances that the TMDL will be implemented include enforcement of regulations,
availability of financial incentives and local, state and federal programs for pollution control.
Stormwater NPDES permit coverage will address discharges from municipally owned
stormwater drainage systems. Enforcement of regulations controlling non-point discharges
include local implementation of the Commonwealth’s Wetlands Protection Act and Rivers
Protection Act; Title 5 regulations for on-site subsurface wastewater disposal systems and
other local regulations such as the Town of Rehoboth’s stable regulations. Financial
incentives include federal funds available under Sections 319, 604 and 104(b) programs of the
CWA, which are provided as part of the Performance Partnership Agreement between
MassDEP and EPA. Other potential funds and assistance are available through
Massachusetts’ Department of Agriculture’s Enhancement Program and the United States
Department of Agriculture’s Natural Resources Conservation Services. Additional financial
incentives include income tax credits for Title 5 upgrades and low interest loans for Title 5
on-site subsurface wastewater disposal system upgrades available through municipalities
participating in this portion of the state revolving fund program.
27
As the towns implement this TMDL, the TMDL values (kg/day of N) will be used by
MassDEP as guidelines for permitting activities and should be used by local communities as a
management tool.
Public Participation
The Department publically announced the draft TMDL in October 25, 2012 and copies were
made available to all key stakeholders. The draft TMDL was posted on the Department’s web
site for public review at the same time. In addition, a public meeting was held at the Oak
Bluffs Public Library on November 28, 2012 for all interested parties and the public comment
period extended until close of business January 18, 2013. Christine Duerring (MassDEP)
summarized the Mass Estuaries Project and described the Draft Nitrogen TMDL Report
findings. This final version of the TMDL report includes both a summary of the public
comments together with the Department's response to the comments and scanned image of the
attendance sheets from the meetings (Appendix E). MassDEP MEP representatives at the
public meeting included Christine Duerring, Rick Dunn, Brian Dudley, Lynne Welsh and
Cathy Vakalopoulos.

28
Appendix A
Table A-1: Summary of the Nitrogen Concentrations for the Lagoon Pond Estuarine
System
(from Chapter VI of the accompanying MEP Technical Report)
Measured data and modeled Nitrogen concentrations for the Lagoon Pond estuarine system. All concentrations are given in mg/L N. “Data mean” values are calculated as the average of the separate yearly means. Data represented in this table were collected in the summers of 2002 through 2007.
Sub-Embayment MEP
monitoring station
data mean
s.d. all data
N model min
model max
model average
Lagoon Pond head at dike
LGP-6 0.418 0.071 23 0.408 0.424 0.413
Lagoon Pond Head
LGP-4 0.384 0.077 100 0.384 0.387 0.385
Lagoon Pond upper Basin
LGP-2 0.360 0.067 135 0.370 0.372 0.371
Lagoon Pond mid Basin
LGP-8 0.359 0.070 66 0.334 0.342 0.338
Lagoon Pond lower Basin
LGP-9 0.333 0.058 60 0.322 0.336 0.328
West Arm (South End Basin)
LGP-10 0.386 0.075 35 0.370 0.391 0.378
Nantucket Sound
NTKS 0.290 0.052 48 - - -
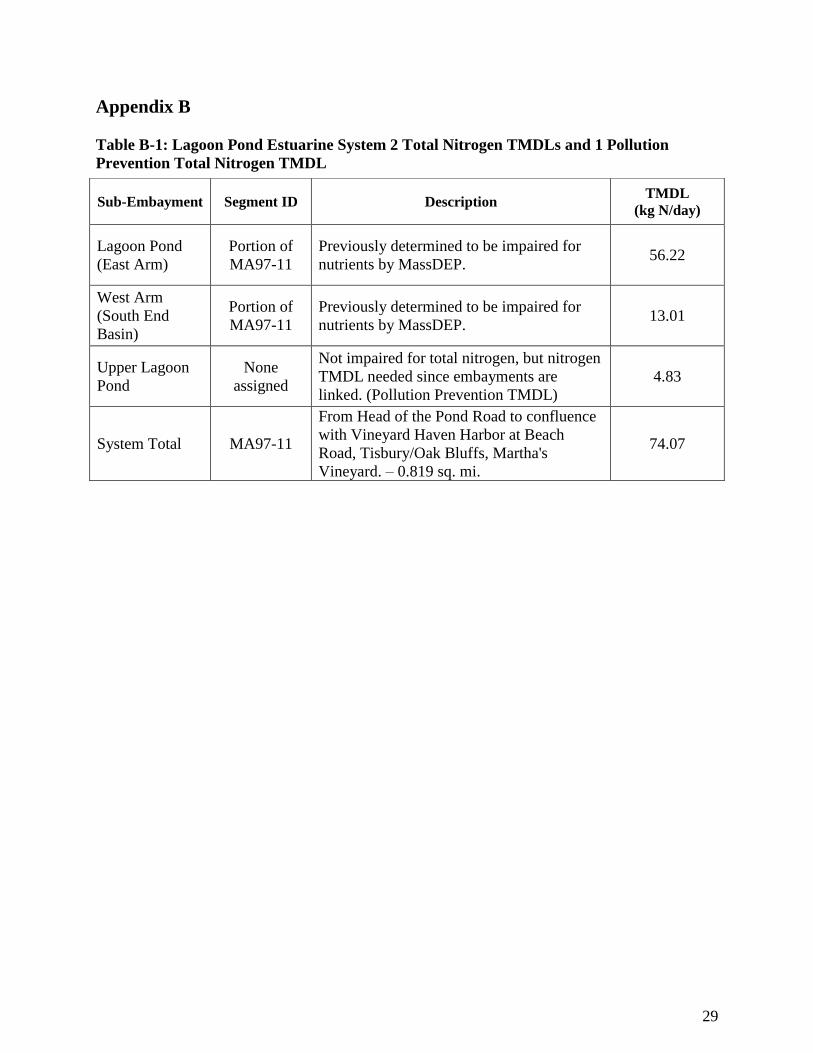
29
Appendix B
Table B-1: Lagoon Pond Estuarine System 2 Total Nitrogen TMDLs and 1 Pollution
Prevention Total Nitrogen TMDL
Sub-Embayment Segment ID Description TMDL
(kg N/day)
Lagoon Pond
(East Arm)
Portion of
MA97-11
Previously determined to be impaired for
nutrients by MassDEP. 56.22
West Arm
(South End
Basin)
Portion of
MA97-11
Previously determined to be impaired for
nutrients by MassDEP. 13.01
Upper Lagoon
Pond
None
assigned
Not impaired for total nitrogen, but nitrogen
TMDL needed since embayments are
linked. (Pollution Prevention TMDL)
4.83
System Total MA97-11
From Head of the Pond Road to confluence
with Vineyard Haven Harbor at Beach
Road, Tisbury/Oak Bluffs, Martha's
Vineyard. – 0.819 sq. mi.
74.07
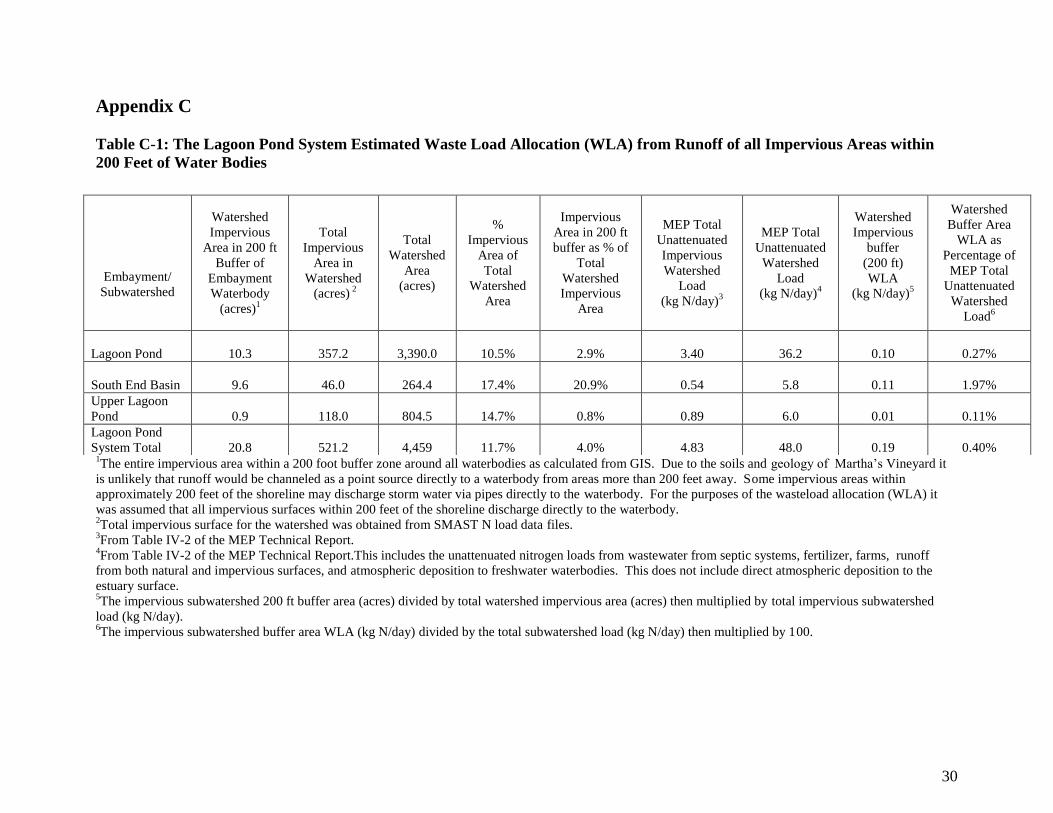
30
Appendix C
Table C-1: The Lagoon Pond System Estimated Waste Load Allocation (WLA) from Runoff of all Impervious Areas within
200 Feet of Water Bodies
1The entire impervious area within a 200 foot buffer zone around all waterbodies as calculated from GIS. Due to the soils and geology of Martha’s Vineyard it
is unlikely that runoff would be channeled as a point source directly to a waterbody from areas more than 200 feet away. Some impervious areas within
approximately 200 feet of the shoreline may discharge storm water via pipes directly to the waterbody. For the purposes of the wasteload allocation (WLA) it
was assumed that all impervious surfaces within 200 feet of the shoreline discharge directly to the waterbody. 2Total impervious surface for the watershed was obtained from SMAST N load data files.
3From Table IV-2 of the MEP Technical Report.
4From Table IV-2 of the MEP Technical Report.This includes the unattenuated nitrogen loads from wastewater from septic systems, fertilizer, farms, runoff
from both natural and impervious surfaces, and atmospheric deposition to freshwater waterbodies. This does not include direct atmospheric deposition to the
estuary surface. 5The impervious subwatershed 200 ft buffer area (acres) divided by total watershed impervious area (acres) then multiplied by total impervious subwatershed
load (kg N/day). 6The impervious subwatershed buffer area WLA (kg N/day) divided by the total subwatershed load (kg N/day) then multiplied by 100.
Embayment/
Subwatershed
Watershed
Impervious
Area in 200 ft
Buffer of
Embayment
Waterbody
(acres)1
Total
Impervious
Area in
Watershed
(acres) 2
Total
Watershed
Area
(acres)
%
Impervious
Area of
Total
Watershed
Area
Impervious
Area in 200 ft
buffer as % of
Total
Watershed
Impervious
Area
MEP Total
Unattenuated
Impervious
Watershed
Load
(kg N/day)3
MEP Total
Unattenuated
Watershed
Load
(kg N/day)4
Watershed
Impervious
buffer
(200 ft)
WLA
(kg N/day)5
Watershed
Buffer Area
WLA as
Percentage of
MEP Total
Unattenuated
Watershed
Load6
Lagoon Pond 10.3
357.2
3,390.0 10.5% 2.9% 3.40 36.2 0.10 0.27%
South End Basin 9.6
46.0
264.4 17.4% 20.9% 0.54 5.8 0.11 1.97%
Upper Lagoon
Pond 0.9
118.0
804.5 14.7% 0.8% 0.89 6.0 0.01 0.11%
Lagoon Pond
System Total 20.8 521.2 4,459 11.7% 4.0% 4.83 48.0 0.19 0.40%
31
Appendix D
Massachusetts Estuaries Project (MEP)
Response to Comments
For DRAFT TOTAL MAXIMUM DAILY LOAD (TMDL) REPORT FOR FARM POND
(Report Dated September, 2012)
DRAFT TMDL REPORT FOR LAGOON POND
(Report Dated September, 2012)
DRAFT TMDL REPORT FOR SENGEKONTACKET POND
(Report Dated September, 2012)
Written Comments received from the Lagoon, Farm, and Sengekontacket Ponds TMDL
Public Meeting November 28, 2012, Oak Bluffs, MA:
Comment letter received from David Grunden
Oak Bluffs Shellfish Constable
P.O. Box 1327
Oak Bluffs, Ma 02557
Email attachment dated November 29, 2012
The TMDL meeting here in Oak Bluffs went very well. The turnout for the meeting
showed the concern of the town residents and support of improving the coastal pond water
quality. I look forward to be working with you to meet the TMDL limits and improve the health
of our ponds.
I am surprised, but pleased to hear that the required nutrient monitoring will be less than
what we have been doing. This will free up some Town funds to move forward in other
projects/programs that can benefit the ponds in other ways, including additional municipal
shellfish and or sea vegetable aquaculture.
The Town has a grant proposal pending to begin a five year monitoring program to
monitor the changes in Farm Pond with the installation of the planned larger culvert. Dr. Mary
Carman (WHOI) and Dr Dan Blackwood (USGS) will be working with the Town if we receive
the grant funding. We will be documenting pre and post culvert installation impacts. If you have
macro-invertebrate monitoring protocols it is possible to include them in this project. I am sure
there hasn’t been any macro-invertebrate monitoring in the pond since it was done by MEP. I
also have a good species inventory that was completed in 2005 as a historical baseline.
I would encourage you to consider and promote alternative denitrifying methods (not just
alternative enhanced septic systems). The Town has been looking at several alternative
approaches such as:
1. Shellfish remediation – we have a grant proposal pending to grow 500K oysters
each year in Majors Cove (Sengekontacket). The proposal is to do this every year,
holding the juveniles over the winter before planting them out for future
recreational harvest. The Town of Edgartown is also seeking funding to conduct a
mirror of this project on their side of Major’s Cove; therefore culturing one
32
million animals each and every year. There are several peer reviewed scientific
publications that report the benefit and calculate the nitrogen removed from the
water by shellfish, particularly oysters. I would like to suggest you contact Dr.
Bob Rhealt the Executive Director of the East Coast Shellfish Growers
Association (401-783-3360 or [email protected]). I am also attaching a paper that
speaks to using shellfish as “nutrient trading credits” that may finance additional
shellfish aquaculture. “EPA’s water quality guidelines would allow shellfish to be
used in a nutrient trading process” (Golan, R. paper attached).
2. Oak Bluffs in collaboration with John Todd Associates filed a 319 proposal to
develop a “floating island” in upper end of Lagoon Pond. This would essentially
be hydroponically grown marsh grasses and other appropriate salt tolerant native
plants. This approach has worked very successfully in fresh water systems. The
319 funding was not granted. We are currently looking for other funding sources
for this approach.
3. We also want to explore the potential of promoting sea vegetable (sea weed)
culture. There are trials being conducted this winter in Lagoon Pond growing
Sugar Kelp (Laminaria saccharina). This is a winter crop that is fast growing and
utilizes nitrogen during the winter months. This coming summer we will be
working with Dr. Scott Lindell of Marine Biological Laboratories in Woods Hole
and grow out other species of sea vegetables during the summer months in
Lagoon pond.
4. Perhaps not for these three ponds, but for Sunset Lake; currently in the MEP
evaluation. There is methodology to essentially dig a trench and fill it with
material that will fix the nitrogen in the ground water before entering this coastal
pond and Oak Bluffs Harbor has some merit. One side has been sewered, but the
other side has not and there is a large Town Park with space to implement this
technology.
5. Restoring upland marshes should also be encouraged. If these systems can be
restored or re-created they should increase the natural attenuation of nitrogen. As
pointed out in your presentation there are currently no surface water inputs for
Farm Pond. However, there once was a small alewife fishery there. Historically,
there were two small inland ponds that have now been taken over by Phragmites
so now there is little or no standing water and the alewife spawning habitat is lost.
6. Is there any consideration by MA DEP to partner with a Town (like Oak Bluffs)
to evaluate any of the above alternatives? Oak Bluffs has partnered several times
with other agencies on projects in our ponds. Currently we are collaborating on
projects with Woods Hole Oceanographic Institute, US EPA Region 1 and US
EPA Atlantic Ecology Division. I encourage partnering and collaboration using
our ponds as the research/monitoring sites. Currently we have the following
ongoing projects:
Dr Mary Carman – WHOI – fragmentation and re-attaching of the
invasive colonial tunicate Didemnum vexillun. This has
implications of introduction and colonization of other areas
including on eelgrass leaves. Note: on related previous projects we
documented D. vexillum growing on eelgrass for the first time in
33
scientific literature and also collected some data showing the
colonial tunicates on the eelgrass does stress the plant, slows the
growth rate and have fewer shoots.
Dr Phil Colaruso US EPA Region 1 – obtained funding to further
examine the impacts colonial tunicates are having on the eelgrass
meadows. They grow on the eelgrass blades and reduce areas for
photosynthesis – but they are filter feeders. Is this a net negative or
a net positive for the eelgrass habitat? EPA’s Atlantic Ecology
Division is taking the lead on this project.
I am concerned that while during the presentation “adaptive management” was
mentioned a few times, but in the question and answer portion it was made clear that a complete
Comprehensive Wastewater Management Plan (CWMP) would need to be filed and approved at
the start. This leaves little opportunity to do adaptive management. When asked the reply was
that the CWMP could be changed or amended. That process would likely take months and make
“adaptive management” simply a sound bite. I would encourage you to relax this posture to
better consider and support alternative approaches that will likely be cost beneficial for the Town
as opposed to sewering. Although we recognize that some amount of sewering will be required
to meet the nitrogen thresholds and we are evaluating options of where to sewer.
(DEP Responses 1-6 are numbered to respond in accordance with the number of the questions
in the letter above.)
DEP Response 1: MassDEP has no experience regarding the effectiveness of using shellfish
farming as an implementation method for nitrogen attenuation in an embayment or salt pond in
order to meet a nitrogen TMDL. We are aware that the states of Connecticut and New York have
recently been investigating this possibility in Long Island Sound but no conclusions have been
drawn as yet. Studies in the Chesapeake Bay area have suggested that very large areas of
shellfish may be needed to see measurable improvements. In theory, the concept makes sense
and could have very positive outcomes for the town by way of increased shellfish revenue and
improved water quality, however at this time MassDEP cannot recommend or discourage
shellfish farming as a viable TMDL implementation option without additional information. In
general MassDEP promotes activities that reduce the nitrogen loads at their sources and
encourages the town to explore all feasible alternatives to reduce sources of nitrogen.
DEP Response 2-5: MassDEP encourages the town to explore all feasible alternatives to reduce
nitrogen. MassDEP acknowledges that the ongoing research on these alternatives may
eventually provide adequate documentation include them as feasible nitrogen removal
techniques. However, in addition to the questions MassDEP has regarding the documented
effectiveness of in-situ treatments for water column nitrogen reduction to meet the TMDL such as
you described using shellfish and/or macrophytes, these bio-remediation methods are dependent
on often uncontrollable environmental factors that potentially could render the operation
ineffective for extended period of time. DEP foresees that TMDL implementation plans that
include such alternatives would still likely need to be coupled with sustainable and reliable
methods that control N pollution at the source such as sewering, stormwater management BMPs
and fertilizer controls.

34
DEP Response 6: DEP is presently discussing with EEEA how to assess alternative technologies
and approaches to reduce nitrogen and what the minimum monitoring requirements should be
however these monitoring approaches will vary a great deal depending on the technology being
used as well as site-specific conditions thus requiring site-specific approaches. At the present
time there is no established program within DEP designed to assess new technologies nor
provide funding for this purpose but we are receptive to working with Towns on pilot studies that
may be proposed for this purpose as CWMP studies identify specific technologies and potential
site locations for pilot studies in the future.
Finally, we suggest the Town contact Dr. Brian Howes at UMass Dartmouth to obtain the
specific macroinvertebrate monitoring protocols used during the MEP process to ensure that
Town samples are comparable to those used to develop the TMDL.
Comment letter received from Dan Martino
Vineyard Haven, MA
Email dated November 29, 2012
Thank you for coming to Oak Bluffs last night and presenting your findings. Invaluable
information. Thank you.
I am a little disappointed that there is no deadline or repercussions for the towns if they do not
meet the set nitrogen limits. I would like a see a deadline set by the EPA, which states that the
towns MUST present a plan by 2015. I would then like to see a deadline date of 2020 in which
the towns must begin implementing the plan. If the towns do not meet these deadlines, fines or
some similar type of punishment should be handed out. Failure to set a deadline, or
repercussions, will only allow the projects to delay, as they have for the last 50 years.
Again, I would like to see deadlines put into place. I feel this is the only way we will see
progress.
DEP Response: The amount of time needed to implement the CWMP plan will highly depend on
what alternative actions are chosen to meet the TMDL. It is for this reason DEP has not
specified a date certain in the TMDL. It is our position and anticipation however that the CWMP
not only identify a recommended plan which will meet the TMDL but also that the CWMP will
contain a schedule for implementation which would be formerly approved by DEP. As long as a
plan is developed and actions are being taken at a reasonable pace to achieve the goals of the
TMDL, MassDEP will use discretion in taking enforcement steps. However, in the event that
reasonable progress is not being made, MassDEP can take enforcement action through the
broad authority granted by the Massachusetts Clean Waters Act, the Massachusetts Water
Quality Standards, and through point source discharge permits.
Verbal comments from the audience compiled by DEP during the Lagoon, Farm, and
Sengekontacket Ponds TMDL Public Meeting, November 28, 2012, Oak Bluffs Library:
35
Comment: Does nitrogen entering the system close to shore (e.g. Ocean Heights,
Sengekontacket) impair water quality more? If we have to sewer, wouldn’t it make sense
to sewer homes closer to the shore?
DEP Response: Homes closer to the waterbody allow nitrogen to get to that waterbody faster.
Those further away may take longer but still get there over time and are dependent upon the
underlying geology. However, what is more important is the density of homes. Larger home
density means more nitrogen being discharged thus the density typically determines where to
sewer to maximize reductions. Also there are many factors that influence water quality such as
flushing and morphology of the water body.
Comment: Do you take into account how long it takes groundwater to travel? DEP Response: Yes, the MEP Technical report has identified long term (greater than 10 years)
and short term time of travel boundaries in the ground-watershed.
Comment: What if a town can’t meet its TMDL?
DEP Response: A TMDL is simply a nutrient budget that determines how much nitrogen
reduction is necessary to meet water quality goals as defined by state Water Quality Standards.
It is unlikely that the TMDL cannot be achieved however in rare occasions it can happen. In
those rare cases the Federal Clean Water Act provides an alternative mechanism which is called
a Use Attainability Analysis (UAA). The requirements of that analysis are specified in the Clean
Water Act but to generalize the process, it requires a demonstration would have to be made that
the designated use cannot be achieved. Another way of saying this is that a demonstration would
have to be made that the body of water cannot support its designated uses such as fishing,
swimming or protection of aquatic biota. This demonstration is very difficult and must be
approved by the U.S. Environmental Protection Agency. As long as a plan is developed and
actions are being taken at a reasonable pace to achieve the goals of the TMDL, MassDEP will
use discretion in taking enforcement steps. However, in the event that reasonable progress is not
being made, MassDEP can take enforcement action through the broad authority granted by the
Massachusetts Clean Waters Act, the Massachusetts Water Quality Standards, and through point
source discharge permits.
Comment: What is the relationship between the linked model and the CWMP?
DEP Response: The model is a tool that was developed to assist the Town to evaluate potential
nitrogen reduction options and determine if they meet the goals of the TMDL at the established
sentinel station in each estuary. The CWMP is the process used by the Town to evaluate your
short and long-term needs, define options, and ultimately choose a recommended option and
schedule for implementation that meets the goals of the TMDL. The models can be used to assist
the Towns during the CWMP process.
Comment: Is there a federal mandate to reduce fertilizer use?
DEP Response: No, it is up to the states and/or towns to address this issue.
Comment: Will monitoring continue at all stations or just the sentinel stations?
DEP Response: At a minimum, DEP would like to see monitoring continued at the sentinel
stations monthly, May-September in order to determine compliance with the TMDL. However,
ideally, it would be good to continue monitoring all of the stations, if possible. The benthic

36
stations can be sampled every 3-5 years since changes are not rapid. The towns may want to
sample additional locations if warranted. DEP plans to continue its program of eelgrass
monitoring.
Comment: What is the state’s expectation with CWMPs?
DEP Response: The CWMP is intended to provide the Towns with potential short and long-term
options to achieve water quality goals and therefore provides a recommended plan and schedule
for sewering/infrastructure improvements and other nitrogen reduction options necessary to
achieve the TMDL. The state also provides a low interest loan program called the state revolving
fund or SRF to help develop these plans. Towns can combine forces to save money when they
develop their CWMPS.
Comment: Can we submit parts of the plan as they are completed?
DEP Response: Submitting part of a plan is not recommended because no demonstration can be
made that the actions will meet the requirements of the TMDL. With that said however the plan
can contain phases using an adaptive approach if determined to be reasonable and consistent
with the TMDL.
Comment: How do we know the source of the bacteria (septic vs. cormorants, etc.)? DEP Response: This was not addressed because this is a nitrogen TMDL and not a bacteria
TMDL.
Comment: Is there a push to look at alternative new technologies?
DEP Response: Yes, the Massachusetts Septic System Test Center is located on Cape Cod and
operated by the Barnstable County Department of Health and Environment. This Center tests
and tracks advanced innovative and alternative septic system treatment technologies. DEP
evaluates pilot studies for alternative technologies but will not approve a system unless it has
been thoroughly studied and documented to be successful.
Shellfish Constable: How about using shellfish to remediate and reduce nitrogen
concentrations?
DEP Response: Although MassDEP is not opposed to this approach in concept and the
approach is gaining favor in some areas of the country presently this is not an approved method
because of a lack of understanding regarding how much nitrogen is removed over a specified
period of time. Some examples of systems where research is being conducted include Long
Island Sound (LIS), , Wellfleet, and Chesapeake Bay where oysters are being evaluated for
remediation but the complete science is still not well defined. There are also many unknowns
that can affect nitrogen uptake associated with proper management of the beds and it is likely
that very large areas of shellfish may be needed to see measureable improvements.
Shellfish Constable: Dr. Mike Rice is studying quahogs….
DEP Response: Another question about this type of approach is how to manage harvesting. We
just don’t know enough about the viability of this kind of approach. See our comments in the
prior response.
Comment: The TMDL is a maximum number, but we can still go lower.
37
DEP Response: The state’s goal is to achieve designated uses and water quality criteria. There
is nothing however that prevents a Town from implementing measures that go beyond that goal.
It should also be noted that the TMDL is developed conservatively with a factor of safety
included
Comment: Isn’t it going to take several years to reach the TMDL?
DEP Response: It is likely that several years will be necessary to achieve reductions and to see a
corresponding response in the estuary. However, the longer it takes to implement solutions, the
longer it is going to take to achieve the goals.
Comment: The TMDL is based on current land use but what about future development?
DEP Response: The MEP Study and the TMDL also takes buildout into account for each
community.
Comment: What about innovative technologies?
DEP Response: Through the CWMP there is a push to look at innovative alternatives but they
need to be tested and approved by DEP. Other options to explore besides conventional sewering
include: improving flushing and increasing opportunities for freshwater attenuation further up in
the watershed (without worsening water quality).
Comment: We are an island and we need to work together to do some of these studies and
see what works. We will have to eventually sewer because we won’t be able to rely on these
“cute” alternatives like oysters and banning fertilizers.
DEP Response: MassDEP agrees. That is one reason why it is important to develop a complete
CWMP so that all of the pieces of the plan can be evaluated as a whole, working together.
General frequently asked questions:
1) Can a CWMP include the acquisition of open space, and if so, can State Revolving
Funds (SRF) be used for this?
DEP Response: State Revolving funds can be used for open space preservation if a specific
watershed property has been identified as a critical implementation measure for meeting the
TMDL. The SRF solicitation should identify the land acquisition as a high priority project
for this purpose which would then make it eligible for the SRF funding list. However, it
should be noted that preservation of open space will only address potential future nitrogen
sources (as predicted in the build-out scenario in the MEP Technical report) and not the
current situation. The town will still have to reduce existing nitrogen sources to meet the
TMDL.
2) Do we expect eelgrass to return if the nitrogen goal is higher than the concentration
that can support eelgrass?
DEP Response: There are a number of factors that can control the ability of eelgrass to re-
establish in any area. Some are of a physical nature (such as boat traffic, water depth, or
even sunlight penetration) and others are of a chemical nature like nitrogen. Eelgrass
decline in general has been directly related to the impacts of eutrophication caused by
38
elevated nitrogen concentrations. Therefore, if the nitrogen concentration is elevated enough
to cause symptoms of eutrophication to occur, eelgrass growth will not be possible even if all
other factors are controlled and the eelgrass will not return until the water quality conditions
improve.
3) Who is required to develop the CWMP? Can it be written in-house if there is
enough expertise?
DEP Response: The CWMP can be prepared by the town. There are no requirements that it
must be written by an outside consultant; however, the community should be very confident
that its in-house expertise is sufficient to address the myriad issues involved in the CWMP
process. MassDEP would strongly recommend that any community wishing to undertake this
endeavor on its own should meet with MassDEP to develop an appropriate scope of work
that will result in a robust and acceptable plan.
4) Have others written regional CWMPs (i.e. included several neighboring towns)?
What about an island-wide CWMP?
DEP Response: Joint CWMPs have been developed by multiple Towns particularly where
Districts are formed for purposes of wastewater treatment. Some examples include the
Upper Blackstone Water Pollution Abatement District that serve all or portions of the
towns Holden, Millbury, Rutland West Boylston and the City of Worcester and the Greater
Lawrence Sanitary District that serves the greater Lawrence area including portions of
Andover, N. Andover, Methuen and Salem NH.. There have also been recent cases where
Towns have teamed up to develop a joint CWMP where districts have not been formed. The
most recent example are the Towns discharging to the Assabet River. They include the
Towns of Westboro and Shrewsbury, Marlboro and Northboro, Hudson, and Maynard. The
reason these towns joined forces was they received higher priority points in the SRF
coming in as a group than they otherwise would have individually.
An island-wide CWMP is not required but towns may want to consider the economic,
environmental and engineering benefits of some form of regional CWMP to address
watershed-wide wastewater management issues that cross municipal boundaries.
39

40
41
42