Embed Size (px)
Citation preview

INTEGRATED DEVELOPMENT PLAN
2012 – 2017
OVERSTRAND MUNICIPALITY “Centre of Excellence”
Final May 2012

TABLE OF CONTENTS Page
Preface, Vision, Mission and Strategic Priorities 2 Foreword by Executive Mayor 3 Foreword by Municipal Manager 5 1. INTRODUCTION AND BACKGROUD 1.1 Introduction 6 1.2 Legal context 6 1.3 IDP process 6 2. STRATEGIC ANALYSIS 2.1 Overstrand Overview 7 2.1.1 Demographics 9 3.1.1 SITUATIONAL ANALYSIS 13 3.2 Status quo per National Key Performance Area 13 3.2.1 Governance & Public Participation 13 3.2.1.1 Political Governance Structure 13 3.2.1.2 Administrative Governance Structure 14 3.2.1.3 Public Accountability 16 3.2.1.4 Overstrand Ward Based Profiles / Survey 17 3.2.2 Municipal Transformation and Organisational Development 17 3.2.2.1 Occupational Levels – Race 17 3.2.2.2 HR Policies and Plans 18 3.2.2.3 Vacancy Rate 19 3.2.3 Basic Service Delivery 19 3.2.3.1 Basic Service Delivery challenges 19 3.2.4 Local Economic Development 22 3.2.5 Municipal Financial Viability and Management 23 4. STRATEGIC DIRECTIVES 4.1 Five year IDP and its strategic focus and direction 24 4.2 Putting programmes / plans / strategy into actions per Key Performance
Area 25 5. FUNCTIONAL AREAS OF MUNICIPAL ACTIVITIES 5.1 Linkage of Strategic Priorities/Objectives with Functional Areas/Services 71 5.2 Description of Functional Areas 71
6. LOCAL ECONOMIC DEVELOPMENT
7. OVERSTRAND TURNAROUND STRATEGY 7.1 Housing 88 7.2 Water Demand Management 90 7.3 Performance Management 91 7.4 Basic Service Delivery 92 7.5 Supply Chain Management 99 7.6 MFMA 100
Final Integrated Development Plan 2012/2013
8. SERVICE LEVEL AGREEMENTS 102
9. ALIGNMENT OF NATIONAL AND PROVINCIAL DIRECTIVES 113 10. SECTORAL PLANS / POLICIES APPROVED 115 11. WARD BASED PROFILES/SURVEY 117 12. SECTORAL PLANS ANNEXURE 1 - Water Services Development Plan 160 ANNEXURE 2 - Integrated Waste Management Plan 223 ANNEXURE 3 - Local Integrated Transport Plan 228 ANNEXURE 4 - Spatial Development Framework 258 ANNEXURE 5 - Environmental Management Plan 267 ANNEXURE 6 – Disaster Management Framework 270 13. BUDGETARY ANNEXURES 288 14. MAPPED SECTOR PROJECTS 311
2
_______________________________________________________________________ P R E F A C E
This Integrated Development Plan (IDP) is a plan, which will inform our communities on how the Overstrand Municipality will utilize its resources for the 3rd Generation IDP of the 2012/2017 IDP cycle.
The IDP is a mechanism and instrument that seeks to give meaning to developmental local government, where people themselves are active participants in the identification of needs, priorities and strategies for the reconstruction and development of communities.
Why is the IDP necessary?
It enables the Municipality to manage the process of fulfilling its developmental responsibilities.
Through the IDP, the Municipality is informed about the problems affecting its residents. It is thus able to develop and implement appropriate strategies and projects to address the problems.
It helps to make more effective use of scarce resources. Helps to speed up delivery. Helps to attract additional funds. Helps to strengthen democracy and hence institutional
transformation because decisions are made in a democratic and transparent manner, rather than just by a few.
Promises intergovernmental coordination.
The Overstrand Municipality, adopted the following Vision, Mission and Strategic objectives after various interaction with stakeholders.
Our Vision Statement
To be a centre of excellence for the community
Our Mission Statement
Creation of sustainable communities by delivering optimal services to support economic, social and environmental goals
Our Strategic Objectives
The provision of democratic and accountable governance The provision and maintenance of municipal services The encouragement of structured community participation in
the matters of the municipality The creation and maintenance of a safe and healthy
environment The promotion of tourism, economic and social development

- 3 –
___________________________________________________________________________
Final Integrated Development Plan 2012/13
Foreword by the Executive Mayor This is the first edition of the third generation of our Integrated Development Plan, compiled over the past ten months to run concurrently with the term of the Municipal Council that was elected in May 2011. I believe that, as in the past, we are going to learn and appreciate the value of this document as the key to the life of a municipality. It is setting out our strategic direction and guiding us as community, council and municipal officials in our efforts to improve the quality of life and the environment in our beloved Overstrand, within the confines of the limited resources at our disposal. Following on the May 2011 municipal elections, officials worked together with the new council and community structures to draft this new plan, building on the successes of the past, but also realizing that we have new challenges to face. I am glad to report that although we had to appoint a new municipal manager and effect other changes in top management, we were lucky to do it from within our organization, enabling us to have an almost seamless change-over. Graag betuig ek my vertroue in ons nuwe Munisipale Bestuurder, mnr Coenie Groenewald, asook in sy opvolger as Direkteur: Bestuursdienste, me Desirée Arrison, en wens ek hulle ‘n termyn van sukses en hoogtepunte toe. Die vertrekpunt vir ons nuwe Geïntegreerde Ontwikkelingsplan (GOP) het sy wortels in ons vorige een, naamlik die treffende visiestelling: OM ’N SENTRUM VAN UITNEMENDHEID VIR ONS GEMEENSKAP TE WEES – eenvoudig, maar inspirerend! In die vorige vyf jaar was hierdie visiestelling vir almal ’n rigsnoer en ek glo dit gaan ook in die toekoms vir ons die pad vorentoe wys!
Die opstel en bywerk van ’n GOP verg samewerking met die gemeenskap. Ten eerste moet daar so wyd moontlik met rolspelers geskakel word wat beteken dat tyd met wykskomitees, organisasies en belangegroepe bestee word om seker te maak waaraan ons mense werklik ’n behoefte het. Hierdie behoeftes weerspieël die diversiteit van ons gemeenskap en maak ons bewus van die kwesbaarheid van kleinode, veral ons pragtige natuur waaraan ons nie altyd dink nie. I would like to share with you a few thoughts that arose from our analysis of the strengths, weaknesses, opportunities and threats for Overstrand Municipality. Our strengths were seen as the knowledgeable dedicated staff, the cohesion between the political and executive structures, good policies, procedures and processes, sound financial management, sound infrastructure management, the ward committee system and unqualified audit reports. Our weaknesses are the perceived style of silo management, lack of facilities at corporate head office, the backlog in service infrastructure, inadequate operation and maintenance of assets, inadequate public communication and participation, a lack of social upliftment strategies with regard to leisure time, capacity building, youth, drugs and early childhood development, lack of mobility for commuters and lack of succession planning in senior positions. Opportunities await us in terms of the utilization of our natural assets for tourism, an attractive environment for investments in the area, public-private partnerships, positive spin-off from the implementation of Batho Pele principles, cutting costs in terms of shared services and an improved grading of the municipality. The threats lies in the state of the economy, labour and other inhibiting legislation, unsustainable financial resources, unemployment, water resources, unfunded mandates, crime and

- 4 –
___________________________________________________________________________
Final Integrated Development Plan 2012/13
vandalism, electricity price hikes and shortages, global warming, civic intolerance and public apathy, inadequate suitable land for housing, the possibility of a single public service and the impact of the national health service on municipalities. Our mission statement was revised to address the abovementioned in our strategic objectives, focus areas and accompanying programmes as follow:
Mission The creation of sustainable communities by delivering optimal services to support economic, social and environmental goals.
Strategic objectives
o The provision of democratic and accountable governance;
o The provision and maintenance of municipal services; o The encouragement of structured community
participation in the matters of the municipality; o The creation and maintenance of a safe and healthy
environment; and o The promotion of tourism, economic and social
development. Focus areas
Basic Service Delivery o Effective development of the Municipal Infrastructure; o Effective management, operation and maintenance
of municipal infrastructure; Social Upliftment and Economic Development
o Development of sustainable human settlements o Creation of an environment conducive for local
economic development o Development of strategies and projects for vulnerable
groupings Optimisation of financial resources
o Effective financial management
Good governance o Effective co-operative government within the
constitutional mandate o Effective communication and community
involvement o Sound municipal administration/Institutional
Development/Institutional Development Safe and Healthy Environment
o Effective public safety and disaster management o Effective environmental management.
Die GOP bring vir ons leiers die verantwoordelikheid om te sorg dat daar deurentyd op doeltreffende, effektiewe en ekonomiese bestuur gefokus moet word ten einde ons strategiese prioriteite na te streef. In die lig hiervan deel ek graag twee van my gunsteling akkronieme:
ACF – ATTITUDE, COMMUNICATION AND FEEDBACK; en
BOLB – BEPLAN, ORGANISEER, LEIDING GEE EN BEHEER. My sincere thanks to all who made a contribution towards this new IDP, including councillors, ward committee members, non-governmental organisations and individuals, and a special word of appreciation to the officials who not only had to compile the IDP but must see that it is implemented and becomes an integral part of our daily existence. NICOLETTE BOTHA-GUTHRIE EXECUTIVE MAYOR 30 May 2012
- 5 –
___________________________________________________________________________
Final Integrated Development Plan 2012/13
Foreword by the Municipal Manager The Constitution of the Republic of South Africa, 1996 commits local government to
providing democratic and accountable government for local communities;
ensuring the provision of services to communities in a sustainable manner;
promoting social and economic development; promoting a safe and healthy environment; and encouraging the involvement of communities and
community organisations in the matters of local government.
This five year Integrated Development Plan (IDP) sets the strategic and budget priorities for purposes of fulfilling our aforementioned constitutional obligations. It furthermore aligns the resources and capacity of our municipality to our overall development aims and it helps us to set our budget priorities. The global economic crisis is having a negative impact also on our municipality and we had to change certain patterns and/or directions to accommodate the economic conditions in which we found ourselves. The challenge now is one of maintaining the necessary balance between income, expenditure and growth and in our endeavour to do this; this IDP enables us to make the best of our scarce resources. This IDP is furthermore a plan for all our communities and not just for specific areas. It should remind us, when we draw up our plans and programmes for service delivery and development, that we must always have our communities in
mind and that our plans must be based on the real needs of our communities. A very important matter, without derogating from the abovementioned constitutional obligations, is the creation of more job opportunities. Though it is not the direct function of the municipality to create such, it is our obligation to provide effective service delivery such as clean water, refuse removal, electricity, well-maintained roads and other infrastructure and a corruption-free administration. This will create an environment where investors and entrepreneurs will want to do business – the main source of sustainable job creation – and for this purpose a well thought through IDP, such as this one, is inevitable. Lastly I wish to convey my sincere appreciation to the Executive Mayor and all Councillors, colleagues and members of the public who positively contributed to the compilation of this document under the competent guidance of colleague Desireé Arrison, our Director: Management Services. COENIE GROENEWALD MUNICIPAL MANAGER 30 May 2012

- 6 –
___________________________________________________________________________
Final Integrated Development Plan 2012/13
CHAPTER 1 INTRODUCTION AND BACKGROUND
1.1 Introduction
The Integrated Development Plan (IDP) for the Overstrand Municipality is the over-arching strategic plan for the municipal area.
The plan will attempt to guide development within the area in order to achieve long sustainable development. The IDP needs to be developed to ensure that it remains the principal management tool and strategic instrument for the municipality.
1.2 Legal context The IDP is compiled in terms of Chapter 5 of the Local Government: Municipal Systems Act (MSA) (Act 32 of 2000). Section 26 of the MSA states that the following core components should be included in the plan: · the municipal council’s vision for the long term development
of the municipality with special emphasis on the municipality’s most critical development and internal transformation needs
· an assessment of the existing level of development in the municipality, which must include an identification of communities which do not have access to basic municipal services;
· the council’s development priorities and objectives for its elected term, including its local economic development aims and its internal transformation needs
· the council’s development strategies which must be aligned with any national or provincial sectoral plans and planning requirements binding on the municipality in terms of legislation;
· a spatial development framework which must include the provision of basic guidelines for a land use management system for the municipality
· the council’s operational strategies; · applicable disaster management plans; · a financial plan, which must include a budget projection for
at least the next three years; and · the key performance indicators and performance targets. Overstrand municipal council will adopt the 2012/2017 IDP as its “single, inclusive and strategic plan” that will guide and inform the development of our municipality. 1.3 IDP process
Two processes are identified during compilation: Drafting of the master plan – this refers to the compilation of a long term strategic plan for the municipal area (2012 – 2017) as prescribed in Section 25 of the MSA. This master plan is not annually amended, since it is a long term plan and not an operational plan. Annual Planning – this refers to the review of the IDP as referred to in Section 34 of the MSA. During August 2011, the Overstrand Municipal Council approved the IDP Process Plan and Budget Schedule, detailing the process for the IDP and Budget development for 2012/2013. This process plan was also included in the agenda of the August Ward Committee cycle. The municipality utilizes its ward committees as the primary consultative structure with regard to planning. The inputs of the

- 7 –
___________________________________________________________________________
Final Integrated Development Plan 2012/13
ward committees in all thirteen wards, councillors and officials were taken into account during this process. To guide this process the Executive Mayor, as part of her responsibilities in terms of the Local Government: Municipal Structures Act, 1998 (Act 117 of 1998) (Structures Act) conducted strategic workshops outlining the process and development of the new 5 year vision, mission and strategic objectives.
CHAPTER 2
STRATEGIC ANALYSIS This Chapter will provide a strategic analysis of external and internal issues that impact on the Overstrand Municipal area 2.1 Overstrand overview Overstrand Municipality is located along the south western coastline of the Overberg District Municipal area bordering the City of Cape Town in the west and Cape Agulhas Municipality in the east. Its northern neighbour is Theewaterskloof Municipality.

- 8 –
___________________________________________________________________________
Final Integrated Development Plan 2012/13
Overstrand is a dynamic unity combining great potential and a beautiful setting. Our task is to bring about growth and development to the benefit of all our people, in their different communities, whilst maintaining a balance with nature. The Municipality covers a land area of approximately 2 125 km2, with a population currently estimated at 87 000 people and covers the areas of Hangklip/Kleinmond, Greater Hermanus, Stanford and Greater Gansbaai. The municipal area has a coastline of approximately 200 km, stretching from Rooi Els in the west to Quinn Point in the east. In addition to the endless, pristine beaches dotting the coastline, the Overstrand boasts 3 Blue Flag beaches. Tourism is a major economic driver in the area and its popularity as a holiday destination results in a fourfold increase of its population over the holiday seasons. This influx places a great strain on the existing municipal services and roads infrastructure. Major towns in the Overstrand area: - Gansbaai Gansbaai is situated in the centre of a number of small bays with miles of unspoiled beaches, fynbos rich nature reserves, ancient milkwood forests, historically significant caves and breath-taking sea views. Shark cage diving has become synonymous with Gansbaai and specialised boats leave from the Kleinbaai harbour daily so that extreme adventure seekers can have close encounters with great white sharks. Gansbaai is the business and industrial centre of the Greater Gansbaai region. Fishing is the main commercial activity and marine based industry includes abalone farms and a fishery. The property development sector is expanding and the hospitality industry brings much needed revenue to the area.
With the fertile Baardskeerdersbos valley, the fresh water caves at De Kelders, the white sands of Pearly Beach, the jackass penguins at Dyer’s Island and the renowned Shark Alley, Gansbaai is truly a uniquely attractive region within Overstrand Municipality. Kleinmond/Hangklip The Kleinmond- Hangklip coastal area including of Betty’s Bay, Hangklip, Pringle Bay and Rooi Els has the unique status of being situated in the Kogelberg Biosphere Reserve which was the first UNESCO designated biosphere reserve in South Africa. Biosphere reserves are tasked with becoming role-models of sustainability and demonstrate the balance between people and the environment to the benefit of both. Kleinmond has an active harbour and many commercial fishermen make their living along the Hangklip coastline. Whether it’s hiking in the biosphere reserve with its 1 800 floral species, a visit to the Stony Point penguin colony, a tour of the Biosphere Eco-Centre in Rooi Else, a picnic in the Harold Porter Botanical Gardens, shopping and sundowners in Kleinmond’s quaint Harbour Road, a day on the beach with family and friends, or a fleeting glimpse of the heard of wild horses roaming the dunes, eco-tourism is quite definitely the economic life-blood of this scenically magnificent and environmentally sensitive area of the Overstrand Hermanus In the past decade Hermanus has established itself as the business and cultural heart of the Overstrand. Although it may have shed its sleepy holiday town image and is able to boast a modern infrastructure, sophisticated specialty shops, shopping centres and restaurants to rival the best in the world, Hermanus has managed to retain the charm of its fishing village heritage. Hermanus is situated between sweeping mountains and the sparkling Atlantic Ocean and is only a short scenic 1½ hrs (140 km) drive from Cape Town. Tourism is a main contributor to the economy of Hermanus and businesses catering for the robust hospitality industry are plentiful. Visitors to the

- 9 –
___________________________________________________________________________
Final Integrated Development Plan 2012/13
town can choose from over 100 accommodation options ranging from upmarket B&Bs, guesthouses, luxury resorts and boutique hotels to budget priced self-catering and back-packer establishments. Hermanus is known as the best land based whale watching destination in the world and from June through to December each year thousands of tourists visit our shores to marvel at the magnificent southern right whales as they splash and romp and nurture their newborn calves. Whale watching cruises depart from the New Harbour daily and flights to view the giants of the deep from the air are also very popular. The Hemel-en-Aarde wine route is one of the latest attractions to be registered as an official wine route. Hermanus has a well-developed industrial area and over the last 10 years enjoyed growth in the building sector with security villages, private homes, holiday resorts and commercial and retail property development projects adding to the economic wealth of the area. Hermanus is also a leader in commercial abalone farming and development of further aquaculture farms is anticipated. Agriculture, manufacturing, wholesale and retail businesses, financial and investment companies and the wine industry also contribute significantly to the economic prosperity. The Administrative head office of the Municipality is also situated in the Centre in Hermanus. Stanford Stanford is essentially a farming community with the Klein River meandering through lush fields and village homes built along its banks. The rural atmosphere of the old village with its many historical features has been retained and preserved thanks to the foresight of the Stanford Conservation Trust and the Stanford Heritage Committee. Stanford has a peaceful and quiet charm which has drawn many people from the city in search of the quality of life a small village
offers. Many of the old homes have been renovated and restored and countless new homes have been built in Stanford in the past decade. They all prescribe to the “Stanford Style” so that the unique character of the village is maintained. Stanford’s economy is driven by tourism, the wine estates, the commercial harvesting of fynbos, farming and smaller businesses like estate agencies and grocery shops, which offer services to the community. Stanford is very much a horse riding community and hosts a number of riding shows and gymkhanas in the village 2.1.1 Demographics
The Overstrand population is estimated at 87 747 or 39.64% of the Overberg District’s population of 221 349 in 2010. The average population growth in the Overstrand municipal area shows a positive rate of 5.58% per year over the past two years. Source: Western Cape Department of Social Development Population Projections Populations projected as at 14 February of 2008, 2009 and 2010.
The total number of households within the municipal area increased from 30 796 households in the 2008/09 financial year to a total of 31 357 in 2010/11. This indicates an increase of 1.82% in the total number of households within the municipal area over the two years.
Households 2008/09 2009/10 2010/11 FEB 2012
Number of households in municipal area 30 796 31 053 31 357 31 295
Number of indigent households in municipal area
2 615 2 864 5 241 5 531
The graph below shows that the total number of indigent households increased from 8.49% in the 2008/09 financial year to 16.71% in 2010/11. The indigent households show an average annual increase of 53.77% growth over the past two years. This high percentage is

- 10 –
___________________________________________________________________________
Final Integrated Development Plan 2012/13
mainly due by the 99.52% increase in the number of indigent households from 2009/10 to 2010/11 during which the municipality extended the indigent policy to include all properties valued under R50 000 as from 1 July 2010.
The graph below shows the population by race
The graph below indicates the population categories by gender/age
Education

- 11 –
___________________________________________________________________________
Final Integrated Development Plan 2012/13
The number of learners (from Grade R to 12) enrolled in schools in this municipality increased by an annual average rate of 4.0 per cent from 7 378 learners in year 2000 to 10 965 learners in 2010. In 2010, 3 064 learners (32.9 per cent of total learners) have enrolled in the foundation education phase, ranging from Grade R to Grade 3. The introduction of the Grade R seems to have good uptake as Grade R learner enrolment increased by an annual average rate of 24.0 per cent between 2000 and 2010. The primary phase (Grades 4 to 7) recorded an enrolment figure of 4 080 learners (or 37.2 per cent) in 2010. The number of learners in the primary phase increased by an annual average rate of 3.5 per cent from 2 892 learners in year 2000 to 4 080 learners in 2010. A total of 3 268 learners (29.8 per cent of total learners) enrolled in the secondary phases (grade 8 to 12) in 2010. The number of learners in the secondary phase increased by an annual average rate of 4.1 per cent from 2 195 learners in year 2000 to 3 268 learners in 2010. In 2010, Overstrand had fifteen (15) schools of which ten (10) were no fees schools. Literacy Rate The information on literacy is sourced from the Department of Social Development since it tracks literacy rates per municipality as an indicator pertaining to poverty alleviation. The literacy rate for the Overstrand is 84.5 per cent and highlights persons 14 years and older who have successfully completed 7 years formal education (passed Grade 7/ Standard 5).
Health
Access to Health Facilities
Overstrand Municipality has a total of 13 primary health care facilities including 8 clinics, 4 satellite clinics and 1 district hospital. Overstrand Municipality has one registered anti-retroviral treatment (ART) centre, and 9 TB clinics. Household Income In 2001, 54.0 per cent of households earned income between R0 to R42 000; 31.9 per cent earned between R42 000 to R132 000; 13.8 per cent between R132 000 and R600 000 and 0.3 per cent earned above R600 000. In 2009, 30.2 per cent of households earned income between R0 to R42 000; 37.0 per cent earned between R42 000 to R132 000; 30.3 per cent between R132 000 and R600 000 and 2.5 per cent earned above R600 000. Note: Rand value shown in nominal terms.
- 12 –
___________________________________________________________________________
Final Integrated Development Plan 2012/13
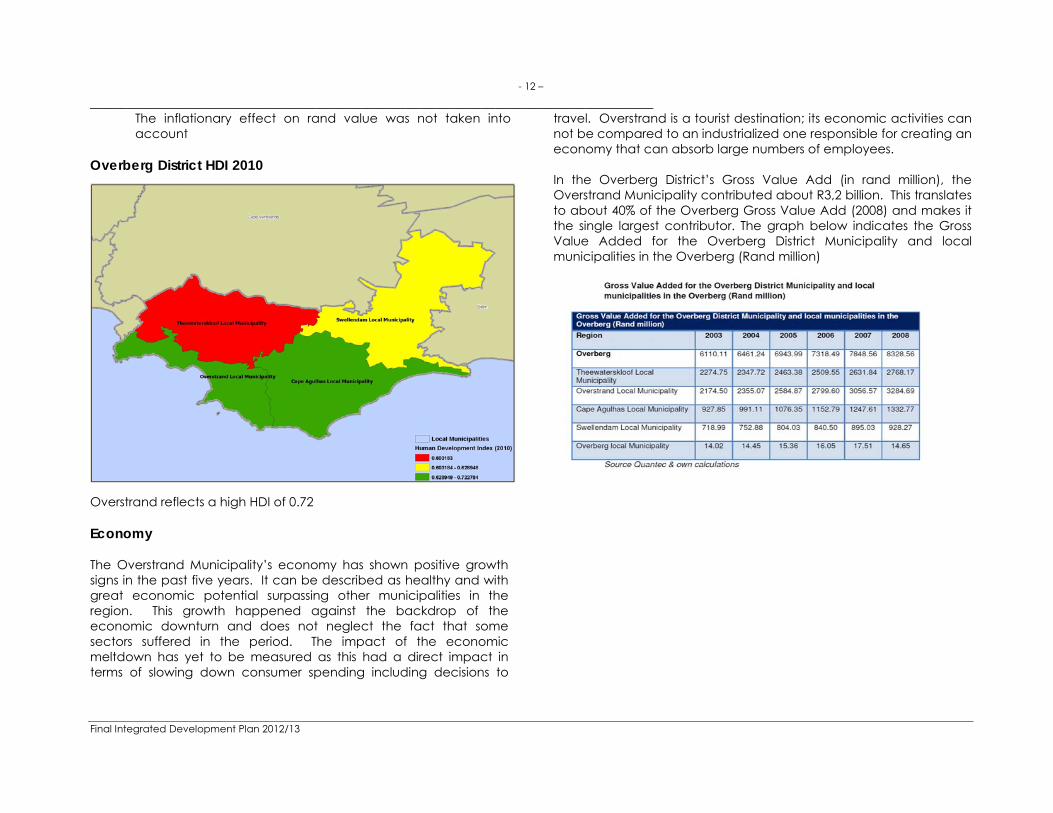
The inflationary effect on rand value was not taken into account
Overberg District HDI 2010 Overstrand reflects a high HDI of 0.72 Economy The Overstrand Municipality’s economy has shown positive growth signs in the past five years. It can be described as healthy and with great economic potential surpassing other municipalities in the region. This growth happened against the backdrop of the economic downturn and does not neglect the fact that some sectors suffered in the period. The impact of the economic meltdown has yet to be measured as this had a direct impact in terms of slowing down consumer spending including decisions to
travel. Overstrand is a tourist destination; its economic activities can not be compared to an industrialized one responsible for creating an economy that can absorb large numbers of employees. In the Overberg District’s Gross Value Add (in rand million), the Overstrand Municipality contributed about R3,2 billion. This translates to about 40% of the Overberg Gross Value Add (2008) and makes it the single largest contributor. The graph below indicates the Gross Value Added for the Overberg District Municipality and local municipalities in the Overberg (Rand million)
- 13 –
___________________________________________________________________________
Final Integrated Development Plan 2012/13
CHAPTER 3
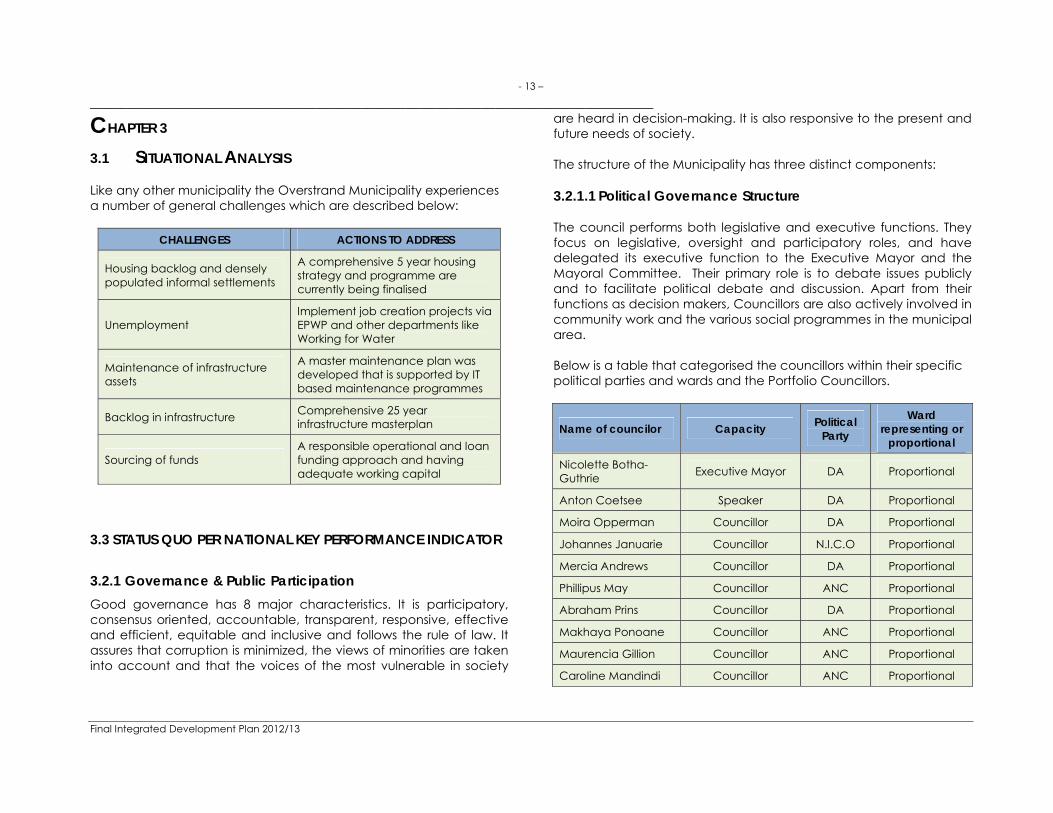
3.1 SITUATIONAL ANALYSIS Like any other municipality the Overstrand Municipality experiences a number of general challenges which are described below:
CHALLENGES ACTIONS TO ADDRESS
Housing backlog and densely populated informal settlements
A comprehensive 5 year housing strategy and programme are currently being finalised
Unemployment Implement job creation projects via EPWP and other departments like Working for Water
Maintenance of infrastructure assets
A master maintenance plan was developed that is supported by IT based maintenance programmes
Backlog in infrastructure Comprehensive 25 year infrastructure masterplan
Sourcing of funds A responsible operational and loan funding approach and having adequate working capital
3.3 STATUS QUO PER NATIONAL KEY PERFORMANCE INDICATOR
3.2.1 Governance & Public Participation Good governance has 8 major characteristics. It is participatory, consensus oriented, accountable, transparent, responsive, effective and efficient, equitable and inclusive and follows the rule of law. It assures that corruption is minimized, the views of minorities are taken into account and that the voices of the most vulnerable in society
are heard in decision-making. It is also responsive to the present and future needs of society. The structure of the Municipality has three distinct components: 3.2.1.1 Political Governance Structure The council performs both legislative and executive functions. They focus on legislative, oversight and participatory roles, and have delegated its executive function to the Executive Mayor and the Mayoral Committee. Their primary role is to debate issues publicly and to facilitate political debate and discussion. Apart from their functions as decision makers, Councillors are also actively involved in community work and the various social programmes in the municipal area. Below is a table that categorised the councillors within their specific political parties and wards and the Portfolio Councillors.
Name of councilor Capacity Political Party
Ward representing or
proportional
Nicolette Botha-Guthrie Executive Mayor DA Proportional
Anton Coetsee Speaker DA Proportional
Moira Opperman Councillor DA Proportional
Johannes Januarie Councillor N.I.C.O Proportional
Mercia Andrews Councillor DA Proportional
Phillipus May Councillor ANC Proportional
Abraham Prins Councillor DA Proportional
Makhaya Ponoane Councillor ANC Proportional
Maurencia Gillion Councillor ANC Proportional
Caroline Mandindi Councillor ANC Proportional

- 14 –
___________________________________________________________________________
Final Integrated Development Plan 2012/13
FINANCE & ECONOMIC
DEVELOPMENT
FINANCE & ECONOMIC
DEVELOPMENT
Name of councilor Capacity Political Party
Ward representing or
proportional
Marilyn Pie Councillor ANC Proportional
Linda Ndevu Councillor DA Proportional
Philippus Appelgrein Ward Councillor DA 9
Lianda Beyers – Cronje Ward Councillor DA 4
Mzameni Mshenxiswa Ward Councillor ANC 5
Dudley Coetzee Ward Councillor DA 11
Elzette Nell Ward Councillor DA 13
Pieter Scholtz Ward Councillor DA 2
Rudolph Smith Ward Councillor DA 8
Ben Solomon Ward Councillor DA 7
Vuyani Macotha Ward Councillor ANC 12
Ntombizinee Sapepa Ward Councillor ANC 6
Lisel Krige Ward Councillor DA 10
Mageret Lerm Ward Councillor DA 3
Nomaxesibe Nqinata Ward Councillor ANC 1
Mayoral Committee 3.2.1.2 Administrative Governance Structure The Municipal Manager is the Chief Accounting Officer of the Municipality. He is the head of the administration, and primarily has to serve as chief custodian of service delivery and implementation of political priorities. He is assisted by his direct reports, which constitutes the Management Team, whose structure is outlined in the table below:
Executive Mayor Clr Nicolette Botha-Guthrie
Deputy Executive
Mayor Ald Pieter
Scholtz
Speaker Ald Anton Coetsee
INFRASTRUCURE & PLANNING
Clr Ben Solomon
Clr Phillip Appelgrein
MANAGEMENT SERVICES
Clr Rudlolf Smith
PROTECTION SERVICES
Clr Moria Opperman
COMMUNITY SERVICES

- 15 –
___________________________________________________________________________
Final Integrated Development Plan 2012/13
The administrative component is aligned with the National Key Performance Areas and has been divided into the Office of the Municipal Manager and 6 directorates OFFICE OF THE MUNICIPAL MANAGER The Municipal Manager as head of the administration is responsible and accountable for tasks and functions as provided for in Section 55 of the Systems Act, other functions/tasks as provided for in legislation, as well as functions delegated by the Executive Mayor and Council. The Municipal Manager is also the Municipal Electoral Officer for Overstrand and appointed as such by the Electoral Commision. The Internal Audit section reports directly to the Municipal Manager as the accounting officer. DIRECTORATE MANAGEMENT SERVICES The main function of this directorate is to provide corporate support to the Council and Municipality and to ensure compliance with best
practice municipal administration norms and standards. The directorate consist of a Director and incorporates the departments of Communication Services, Human Resources, ICT Services, Strategic Services, Legal Services, Council Support Services and TASK (Tuned Assessment of Skills and Knowledge). DIRECTORATE: FINANCE The core function of this directorate is to ensure sound financial management. This directorate consists of the Chief Financial Officer as head of the directorate and the Accounting Services, Expenditure and Asset, Revenue and Valuations and Supply Chain Management sections. DIRECTORATE: ECONOMIC DEVELOPMENT The main function of this directorate is to promote economic development initiatives, tourism, sustainable job creation, and poverty reduction and shared growth that integrates and connects the Municipality, its citizens and its natural resources. This directorate consists of a Director and a Manager: Economic Development as well as a Project Manager for Economic Development. DIRECTORATE: INFRASTRUCTURE AND PLANNING This directorate’s focus is the planning of infrastructure, development planning and control, property management, environmental management, building control and the corporate GIS system. This directorate consists of a Director, Infrastructural Management, Environmental Services, Town Planning, Building Control, Solid Waste and Electricity Services.
Coenie Groenewald
Municipal Manager
Soli Madikane LED
Roderick Williams Community Services
Stephen Muller Infrastructure
& Planning
Neville Michaels Protection Services
Henk Kleinloog Finance
Desiree Arrison Management
Services
- 16 –
___________________________________________________________________________
Final Integrated Development Plan 2012/13
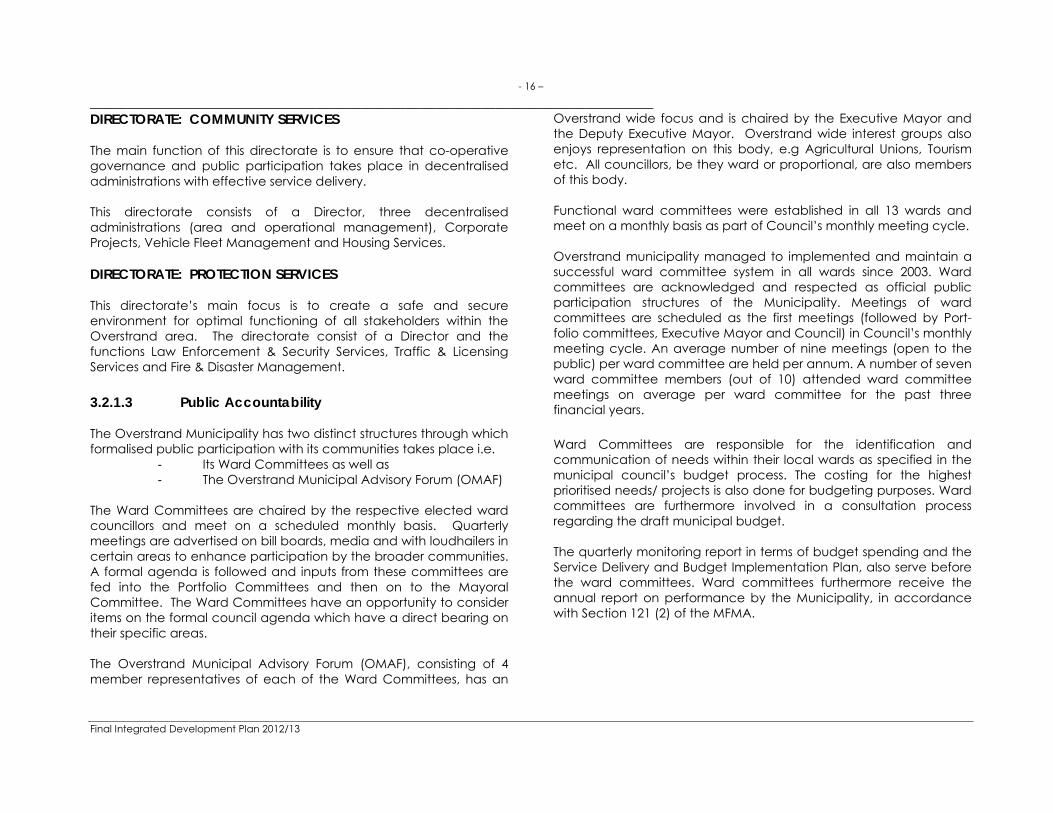
DIRECTORATE: COMMUNITY SERVICES The main function of this directorate is to ensure that co-operative governance and public participation takes place in decentralised administrations with effective service delivery. This directorate consists of a Director, three decentralised administrations (area and operational management), Corporate Projects, Vehicle Fleet Management and Housing Services. DIRECTORATE: PROTECTION SERVICES This directorate’s main focus is to create a safe and secure environment for optimal functioning of all stakeholders within the Overstrand area. The directorate consist of a Director and the functions Law Enforcement & Security Services, Traffic & Licensing Services and Fire & Disaster Management. 3.2.1.3 Public Accountability The Overstrand Municipality has two distinct structures through which formalised public participation with its communities takes place i.e.
- Its Ward Committees as well as - The Overstrand Municipal Advisory Forum (OMAF)
The Ward Committees are chaired by the respective elected ward councillors and meet on a scheduled monthly basis. Quarterly meetings are advertised on bill boards, media and with loudhailers in certain areas to enhance participation by the broader communities. A formal agenda is followed and inputs from these committees are fed into the Portfolio Committees and then on to the Mayoral Committee. The Ward Committees have an opportunity to consider items on the formal council agenda which have a direct bearing on their specific areas. The Overstrand Municipal Advisory Forum (OMAF), consisting of 4 member representatives of each of the Ward Committees, has an
Overstrand wide focus and is chaired by the Executive Mayor and the Deputy Executive Mayor. Overstrand wide interest groups also enjoys representation on this body, e.g Agricultural Unions, Tourism etc. All councillors, be they ward or proportional, are also members of this body. Functional ward committees were established in all 13 wards and meet on a monthly basis as part of Council’s monthly meeting cycle. Overstrand municipality managed to implemented and maintain a successful ward committee system in all wards since 2003. Ward committees are acknowledged and respected as official public participation structures of the Municipality. Meetings of ward committees are scheduled as the first meetings (followed by Port- folio committees, Executive Mayor and Council) in Council’s monthly meeting cycle. An average number of nine meetings (open to the public) per ward committee are held per annum. A number of seven ward committee members (out of 10) attended ward committee meetings on average per ward committee for the past three financial years. Ward Committees are responsible for the identification and communication of needs within their local wards as specified in the municipal council’s budget process. The costing for the highest prioritised needs/ projects is also done for budgeting purposes. Ward committees are furthermore involved in a consultation process regarding the draft municipal budget. The quarterly monitoring report in terms of budget spending and the Service Delivery and Budget Implementation Plan, also serve before the ward committees. Ward committees furthermore receive the annual report on performance by the Municipality, in accordance with Section 121 (2) of the MFMA.

- 17 –
___________________________________________________________________________
Final Integrated Development Plan 2012/13
3.2.1.4 Overstrand Ward Based Profiles / Survey The Overstrand Ward Based Survey is a joint partnership between Statistics South Africa and the Overstrand Municipality. The Overstrand Ward Based Survey is a very unique project. Three distinct features makes this project unique, not only for the Overstrand, but in South Africa as a whole.
1. The whole data collection process is conducted with CN3 devices (GPS enabled hand held devices).
2. It is the first time ever in South Africa that listing is done with a device.
3. This project is the largest of its kind ever to be conducted in South African at municipal level.
The main focus of the project is to collect socio-economic data at household level. Since the data is conducted with handheld devices no additional data capturing is required which reduces the required time to complete the process. Captured data is send to a server and is immediately available for analysis. This not only enables accurate management of the project but also ensures that data analysis can be finalised as soon as the enumerators have completed data collection. Data collection with the devices has the further advantage of producing GPS data with a sub-metre accuracy which can be synced with our GIS systems to produce a geographic presentation of the data. This has already been done to great effect with data already captured. The project is being conducted in two phases. The first phase of the project focuses on what has been termed priority wards i.e. Wards: 1, 2, 4, 5, 6, 8, 11 and 12. The result is that approximately 10 500 households are being targeted in phase 1.
3.2.2 Municipal Transformation and Organisational Development
The following table indicates the municipality’s performance in terms of the National Key Performance Indicators required in terms of the Local Government: Municipal Planning and the Performance Management Regulations of 2001 and section 43 of the MSA.
KPA & INDICATORS MUNICIPAL
ACHIEVEMENT MUNICIPAL
ACHIEVEMENT MUNICIPAL
ACHIEVEMENT
2008/09 2009/10 2010/11
The number of people from employment equity target groups employed in the three highest levels of management in compliance with a municipality’s approved employment equity plan
63 64 54
The percentage of a municipality’s budget actually spent on implementing its workplace skills plan
100 100 100
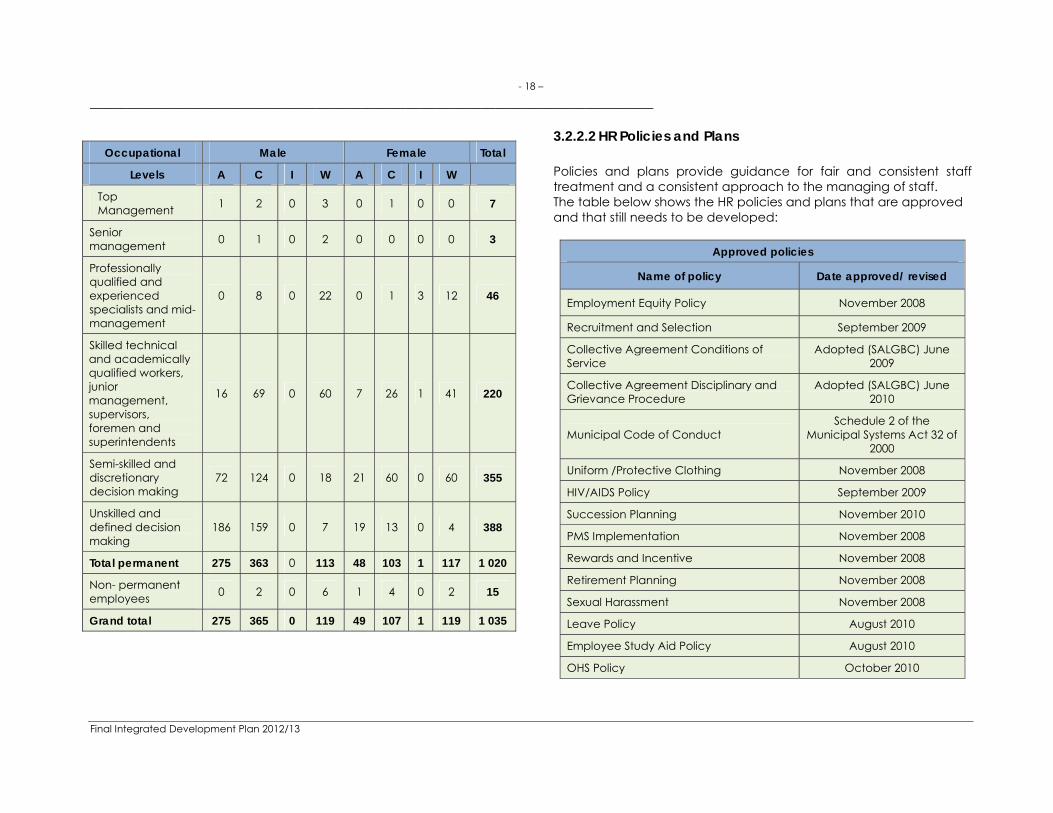
3.2.2.1 Occupational Levels – Race The table below categories the number of employees by race within the occupational levels:
- 18 –
___________________________________________________________________________
Final Integrated Development Plan 2012/13
Occupational Male Female Total
Levels A C I W A C I W
Top Management 1 2 0 3 0 1 0 0 7
Senior management 0 1 0 2 0 0 0 0 3
Professionally qualified and experienced specialists and mid- management
0 8 0 22 0 1 3 12 46
Skilled technical and academically qualified workers, junior management, supervisors, foremen and superintendents
16 69 0 60 7 26 1 41 220
Semi-skilled and discretionary decision making
72 124 0 18 21 60 0 60 355
Unskilled and defined decision making
186 159 0 7 19 13 0 4 388
Total permanent 275 363 0 113 48 103 1 117 1 020
Non- permanent employees 0 2 0 6 1 4 0 2 15
Grand total 275 365 0 119 49 107 1 119 1 035
3.2.2.2 HR Policies and Plans Policies and plans provide guidance for fair and consistent staff treatment and a consistent approach to the managing of staff. The table below shows the HR policies and plans that are approved and that still needs to be developed:
Approved policies
Name of policy Date approved/ revised
Employment Equity Policy November 2008
Recruitment and Selection September 2009
Collective Agreement Conditions of Service
Adopted (SALGBC) June 2009
Collective Agreement Disciplinary and Grievance Procedure
Adopted (SALGBC) June 2010
Municipal Code of Conduct Schedule 2 of the
Municipal Systems Act 32 of 2000
Uniform /Protective Clothing November 2008
HIV/AIDS Policy September 2009
Succession Planning November 2010
PMS Implementation November 2008
Rewards and Incentive November 2008
Retirement Planning November 2008
Sexual Harassment November 2008
Leave Policy August 2010
Employee Study Aid Policy August 2010
OHS Policy October 2010

- 19 –
___________________________________________________________________________
Final Integrated Development Plan 2012/13
Approved policies
TASK Job Evaluation Policy October 2010
Gift policy for officials June 2011
Staff Succession planning policy guidelines
November 2010
3.2.2.3 Vacancy Rate The approved organogram for the municipality had 1 090 posts as at the end of March 2012. The actual positions filled are indicated in the tables below by post level and by functional level
PER POST LEVEL
Post level Filled Vacant
MM & MSA section 57 & 56 7 0
Middle management 568 56
Admin Officers 24 1
General Workers 421 13
Total 1 020 70
PER FUNCTIONAL LEVEL
Functional area Filled Vacant
Municipal Manager 7 0
Management Services 41 8
Financial Services 111 7
Community Services 674 39
Protection Services 63 7
Infrastructure and Planning Services 120 9
Economic Development Services 4 0
PER POST LEVEL
Post level Filled Vacant
Total 1 020 70 3.2.3 BASIC SERVICE DELIVERY 3.2.3.1 Basic services delivery challenges The following table indicates the service delivery challenges faced by the municipality
Service Area Challenge Actions to address
Water
Replacement of ageing water pipes
Increase capital budget
Reduction of water losses
Leak detection and water replacement projects
Roads Maintenance of existing tarred roads
Budget for reseal of roads
Water and Sanitation Scarcity of skilled personnel
Sourcing of accredited trainer in order to train operators

- 20 –
___________________________________________________________________________
Final Integrated Development Plan 2012/13
The following table indicates the municipality’s performance in terms of the National Key Performance Indicators required in terms of the Local Government: Municipal Planning and the Performance Management Regulations of 2001 and section 43 of the MSA.
Capital budget spent on municipal services The percentage (%) of the total approved capital budget spent on each municipal service respectively for the 2008/09, 2009/10 and 2010/11 financial years respectively are as follows:
Financial Year
Housing Water Sanitation Refuse Removal
Electricity
Streets & Storm Water
Community
facilities
(%) (%) (%) (%) (%) (%) (%)
2008/09 0.95 31.4 10.36 3.35 18.55 18.79 12.40
2009/10 - 26.04 4.49 5.24 24.26 23.19 15.59
2010/11 4.79 22.91 10.83 1.33 23.18 18.66 5.86
The graph below shows the different water service delivery levels
per total households and the progress per year
The graph below shows the different sanitation/sewerage service delivery levels per total households and the progress per year.
KPA & indicators Municipal
achievement Municipal
achievement Municipal
achievement
2008/09 2009/10 2010/11
Basic Service Delivery
The percentage of households earning less than R 1 100 per month with access to free basic services
8.49 9.22 16.71
The percentage of households with access to basic level of water
100 100 100
The percentage of households with access to basic level of sanitation
100 100 100
The percentage of households with access to basic level of electricity
100 100 100
The percentage of households with access to basic level of solid waste removal
100 100 100

- 21 –
___________________________________________________________________________
Final Integrated Development Plan 2012/13
The graph shows the number of households categorised into the different service levels
The graph indicates the different refuse removal standards which the households are receiving
The following tables give an overview of the total kilometers of roads maintained and new roads tarred
Financial year
Total km tarred roads
Km of new tar roads
Km existing
tar roads re-tarred
Km of existing tar roads re-sheeted
Km tar roads
maintained
2008/09 280 10 1.5 8.5 290
2009/10 290 1 3 8.7 291
2010/11 291 2 3 27 293

- 22 –
___________________________________________________________________________
Final Integrated Development Plan 2012/13
Gravel Roads
Financial year
Total km gravel roads
Km new gravel roads
constructed
Km gravel roads
upgraded to tar
Km gravel roads
graded/maintained
2008/09 174 0 10 164
2009/10 164 0 1 163
2010/11 161 0 2 159
The table below shows the costs involved for the maintenance and construction of roads within the municipal area:
Financial year
New & Replacements Resealed Maintained
2008/09 9 080 000 12 500 000 44 675 414
2009/10 3 348 000 14 182 128 47 355 939
2010/11 2 460 000 21 504 897 64 798 318 The table below shows the total kilometers of stormwater maintained and upgraded as well as the kilometers of new stormwater pipes installed:
Financial year
Total km Stormwater measures
Km new stormwater measures
Km stormwater measures upgraded
Km stormwater measures
maintained
2008/09 539 7 4 546
2009/10 546 8 7 554
2010/11 554 3 5 557
The table below indicates the amount of money spend on stormwater projects:
Financial year Storm water Measures
Capital Maintained
2008/09 12 800 000 4 900 285
2009/10 7 300 000 4 466 621
2010/11 5 100 000 4 418 538
3.2.4 LOCAL ECONOMIC DEVELOPMENT The following challenges with regard to the implementation of the LED strategy are:
Description Actions to address
Lack of understanding from public and stakeholders with regards to LED and our functions
More information sessions to n understanding of the work and
enhance understanding
Municipal policies and red tape that puts a strain on development
Develop more user developmental friendly municipal policies to support emerging entrepreneurs/contractors with start-up
Reliable and up to date data to make positive impact
Collect own socio-economic data and collaborate with STATSSA
Mobilisation of resources Development of a donor database
Impact of National/International economic situation
Risk analysis exercises, discussions and foresting activities
Overstrand has a strong seasonal economy
Assist tourism industry in the development of a more comprehensive marketing strategy.
- 23 –
___________________________________________________________________________
Final Integrated Development Plan 2012/13
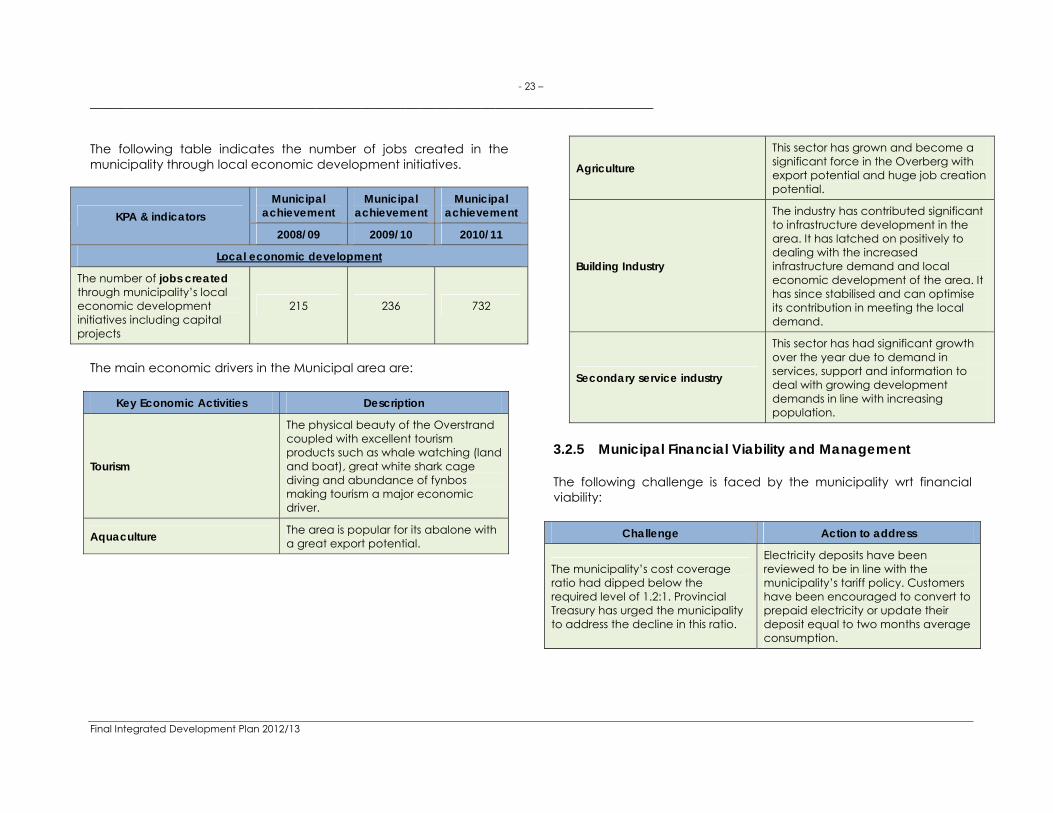
The following table indicates the number of jobs created in the municipality through local economic development initiatives.
KPA & indicators Municipal
achievement Municipal
achievement Municipal
achievement
2008/09 2009/10 2010/11
Local economic development
The number of jobs created through municipality’s local economic development initiatives including capital projects
215 236 732
The main economic drivers in the Municipal area are:
3.2.5 Municipal Financial Viability and Management The following challenge is faced by the municipality wrt financial viability:
Challenge Action to address
The municipality’s cost coverage ratio had dipped below the required level of 1.2:1. Provincial Treasury has urged the municipality to address the decline in this ratio.
Electricity deposits have been reviewed to be in line with the municipality’s tariff policy. Customers have been encouraged to convert to prepaid electricity or update their deposit equal to two months average consumption.
Key Economic Activities Description
Tourism
The physical beauty of the Overstrand coupled with excellent tourism products such as whale watching (land and boat), great white shark cage diving and abundance of fynbos making tourism a major economic driver.
Aquaculture The area is popular for its abalone with a great export potential.
Agriculture
This sector has grown and become a significant force in the Overberg with export potential and huge job creation potential.
Building Industry
The industry has contributed significant to infrastructure development in the area. It has latched on positively to dealing with the increased infrastructure demand and local economic development of the area. It has since stabilised and can optimise its contribution in meeting the local demand.
Secondary service industry
This sector has had significant growth over the year due to demand in services, support and information to deal with growing development demands in line with increasing population.

- 24 –
___________________________________________________________________________
Final Integrated Development Plan 2012/13
The following table indicates the municipality’s performance in terms of Municipal financial viability:
KPA & INDICATOR 07/08 08/09 09/10 2010/11
Debt coverage ((Total operating revenue-operating grants received)/debt service payments due within the year)
26.1 18.7 23.3 27
Service debtors to revenue – (Total outstanding service debtors/ revenue received for services)
23% 15.1% 14.3% 13.3%
Cost coverage ((Available cash+ investments)/ Monthly fixed operating expenditure
6.97 0.99 1.25 3.83
The municipality is more reliant on grants to finance expenditure than other municipalities with the same nature, due to our limited revenue raising capacity. The following graph indicates the municipality’s reliance on grants as
percentage for the last three financial years
CHAPTER 4 STRATEGIC DIRECTIVES 4.1 The five year IDP and its strategic focus and direction The 2012/2013 – 2017 IDP development started with a strategic workshop by the Executive Management Team. Having consensus on the context within which the Municipality operates, a SWOT analysis was done to identify the real issues within the internal and external environments. This led to the development of a new Vision, Mission and Strategic goals. The following five focus areas were decided upon to guide the new 5 year cycle:
Basic Service Delivery Social upliftment and Economic development Optimization of financial resources Good Governance Safe and Healthy Environment
These focus areas were linked to the following programmes / plans in guiding the corporate planning of the municipality Key performance areas for 2012 – and beyond
Programmes / plans / strategies linked to focus areas
KPA OS 1 Basic Service Delivery
KPA OS 1(a) Effective Development of Municipal Infrastructure KPA OS 1(b) Effective Management, Operation and Maintenance of Municipal

- 25 –
___________________________________________________________________________
Final Integrated Development Plan 2012/13
Infrastructure
KPA OS 2 Social upliftment and Economic development
KPA OS 2(a) Development of sustainable Human Settlements KPA OS 2(b) Creation of an environment conducive for LED KPA OS 2(c) Development of strategies linked to projects for vulnerable groupings
KPA OS 3 Optimization of financial resources
KPA OS 3(a) Effective financial management
KPA OS 4 Good Governance
KPA OS 4(a) Effective co-operative government within the Constitutional mandate KPA OS 4(b) Effective communication and community involvement
KPA OS 4(c) Sound municipal administration/Institutional Development
KPA OS 5 Safe and Healthy Environment
KPA OS 5(a)
Effective public safety and disaster management KPA OS 5(b)
Effective Environmental Management
Putting programmes / plans / strategy into action KPA OS 1(a) Effective Development of Municipal Infrastructure 1.1. Introduction
To ensure the long term sustainability of the municipal area and its sub-region, the efficient provision, operation and maintenance of infrastructure for basic services are crucial. In the municipal context, basic services are electricity, water, sanitation (sewerage and solid waste) and roads (with associated stormwater). Infrastructure for basic services must be provided to realize the spatial development goals as set out in the spatial development framework (SDF). The continued outward spread of low density development on the edges of Overstrand towns is leading to significant and rapid increases in the urban footprint of the towns. This urban sprawl threatens the long term sustainability of the Overstrand environment and raised the following specific concerns:
Natural undeveloped area and agricultural land are increasingly being consumed by urban development,
Low density urban sprawl results in long travel distances. Due to a lack of public transport, this results in more private road transport that leads to increasing traffic congestion and CO2 emissions,
Low density development increases the cost of infrastructure provision and maintenance. It dissipates the positive effect of agglomeration and economies of scale, causing operational inefficiencies and a wastage of supporting economic resources and infrastructure.

- 26 –
___________________________________________________________________________
Final Integrated Development Plan 2012/13
To address these concerns, the municipality developed a Growth Management Strategy (GMS). The GMS uses densification as the main tool to positively redress and counteract the effects of urban sprawl. The GMS forms part of the SDF and was approved by Council in January 2011. The municipality received an award from the South African Planning Association for this work. The objectives of the GMS are to: Inform the SDF with an integrated densification policy that is area specific and sensitive to the character, heritage and environmental conditions unique to each area and town.
Integrate, update and rationalize service provision and infrastructure planning,
Provide an integrated policy framework that will guide the detailed planning and design of market driven development initiatives and inform the compilation of more detailed precinct plans for specific areas or identified opportunities, and
Align density patterns, trends and proposals with the land use management regulations, zoning schemes, infrastructure capacity and future infrastructure requirements.
The master plans for each basic infrastructure service was reviewed and realigned to support the GMS. 1.2. Water services
The main planning documents for water services are:
The Water Services Development Plan 2012/13, The Water Master Plan as revised with the development of
the GMS, Comprehensive Bulk Infrastructure Master Plan (Water and
Sanitation) – November 2010, and Water Services Asset Register.
Based on these documents, an assessment was made of the water infrastructure requirement for the next 25 years. The assessment is based on the following:
Bulk and internal requirements are included, Replacement of current infrastructure that is in a poor or very
poor condition, Projects already started (and funded) are not included, Costs are in R x 106 (millions), and Costs are based on 2010 prices.
Details of the projects included in the assessment can be found in the planning documents mentioned above. Major projects planned for the short to medium term are:
Water Demand Management: replacement of leaking water pipes, replacement of old and defective water meters, repairs of leak in low income areas and the installation of pressure control valves,
Construction of new bulk water reservoirs in Rooi Els and Sandbaai,
Upgrading the bulk water supply in Baardskeerdersbos,
Area Sources TreatmentReticulation
(Pipes, pumps and reservoirs)
Total(Rm)
Buffels River System 20.0 20.0 30.3 70.3Kleinmond 0.0 0.0 8.9 8.9Greater Hermanus 52.5 52.5 145.3 250.3Stanford 0.0 1.0 13.3 14.3Greater Gansbaai 0.0 5.0 61.4 66.4Pearly Beach 0.0 3.0 1.0 4.0Total for new infrastructure required
73 82 260 414
408
822
Add: Infrastructure in poor condition to be replaced
Total required for the next 25 year (Rm)

- 27 –
___________________________________________________________________________
Final Integrated Development Plan 2012/13
Upgrading the bulk water supply in Hermanus: new 10 Ml per day treatment facility for groundwater and the commissioning of the Camphill and Volmoed well fields,
Bulk water upgrades for Hawston, Eluxolweni, Stanford, Zwelihle and Mt Pleasant to accommodate low cost and gap housing developments,
Due to the current drought situation in the Hermanus area, the municipality has decided to further diversify its water sources. It was decided to develop the following two sources:
Reclaimed water
Water reclamation is the process whereby waste water that has been treated to “general standard” (safe to be released into the environment) is treated further with ultra filtration, reverse osmosis and other processes to produce very clean water for drinking purposes. At present, approximately 5Ml per day is available for reclamation in Hermanus. This water is currently released into the sea. At present, this is the cheapest, most effective and environmentally friendliest additional water source that can be developed. Desalinated sea water
Although desalination of sea water is still the most expensive source of drinking water, it is clear that in the long term (10 years) desalination of sea water will become one of the sources for drinking water of Hermanus. We believe the cost of the technology will come down in time, and therefore a desalination treatment facility of up to 5Ml per day is envisaged by 2022.
1.3. Sanitation services
The main planning documents for sanitation services are:
The Water Services Development Plan 2012/13, Integrated Waste Management Plan, The Sewerage Master Plan as revised with the development
of the GMS, Comprehensive Bulk Infrastructure Master Plan (Water and
Sanitation) – November 2010, and Sewerage Asset Register.
Based on these documents, an assessment was made of the sewerage infrastructure requirement for the next 25 years. The assessment is based on the following:
Bulk and internal requirements are included, Replacement of current infrastructure that is in a poor or very
poor condition, Projects already started (and funded) are not included, Costs are in R x 106 (millions), and Costs are based on 2010 prices.
AreaReticulation (Pipes
and pumps)Treatment
Total(Rm)
Buffels River 199.5 27.0 226.5Kleinmond 40.2 6.0 46.2Greater Hermanus 89.3 30.0 119.3Stanford 16.5 5.0 21.5Greater Gansbaai 123.2 3.0 126.2Pearly Beach 25.9 3.0 28.9Total for new infrastructure required
495 74 569
99
668
Add: Infrastructure in poor condition to be replaced
Total required for the next 25 year (Rm)
Details of the projects included in the assessment can be found in the planning documents mentioned above.
- 28 –
___________________________________________________________________________
Final Integrated Development Plan 2012/13
Major projects planned for the short to medium term are:
Improved sludge handling facilities at the Kleinmond and Gansbaai Waste Water Works,
Upgrading of the Stanford Waste Water Works Upgrading of the Hawston Waste Water Works Upgrading of various sewage pump stations Construction of a Waste Water Treatment Works (package
plant) at Pearly Beach to accommodate the low cost housing development at Eluxolweni.
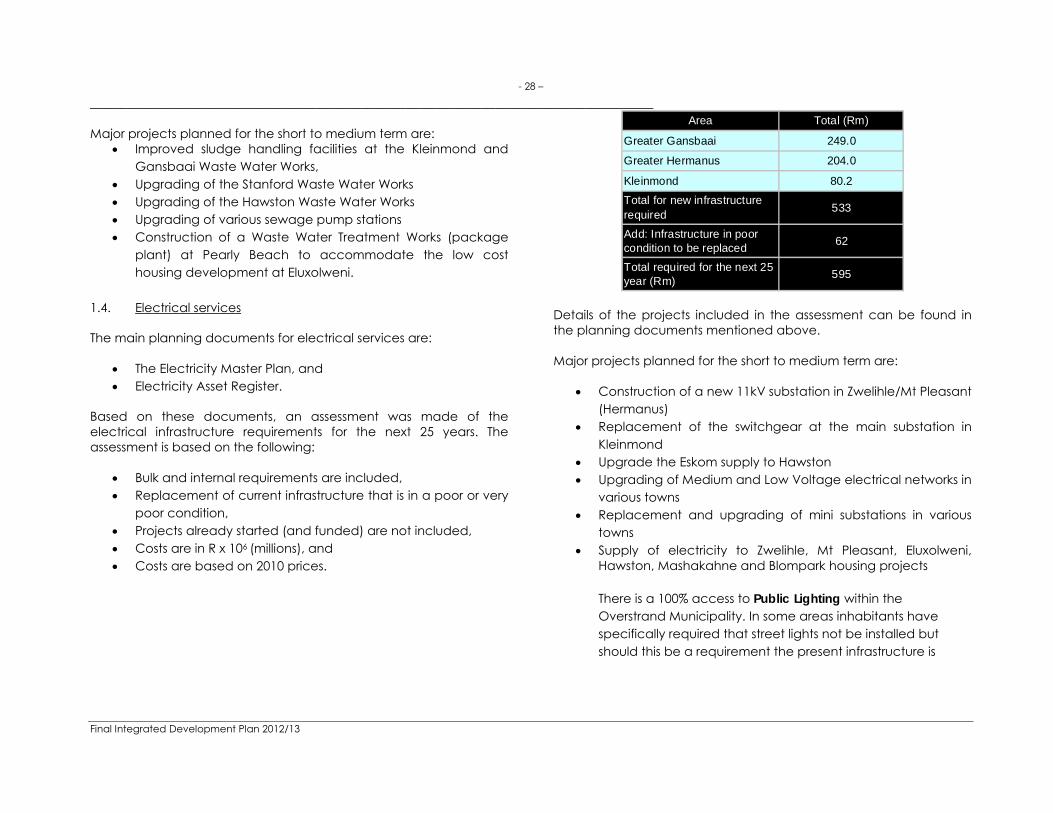
1.4. Electrical services
The main planning documents for electrical services are:
The Electricity Master Plan, and Electricity Asset Register.
Based on these documents, an assessment was made of the electrical infrastructure requirements for the next 25 years. The assessment is based on the following:
Bulk and internal requirements are included, Replacement of current infrastructure that is in a poor or very
poor condition, Projects already started (and funded) are not included, Costs are in R x 106 (millions), and Costs are based on 2010 prices.
Area Total (Rm)
Greater Gansbaai 249.0
Greater Hermanus 204.0
Kleinmond 80.2
Total for new infrastructure required
533
Add: Infrastructure in poor condition to be replaced
62
Total required for the next 25 year (Rm)
595
Details of the projects included in the assessment can be found in the planning documents mentioned above.
Major projects planned for the short to medium term are:
Construction of a new 11kV substation in Zwelihle/Mt Pleasant (Hermanus)
Replacement of the switchgear at the main substation in Kleinmond
Upgrade the Eskom supply to Hawston Upgrading of Medium and Low Voltage electrical networks in
various towns Replacement and upgrading of mini substations in various
towns Supply of electricity to Zwelihle, Mt Pleasant, Eluxolweni,
Hawston, Mashakahne and Blompark housing projects There is a 100% access to Public Lighting within the Overstrand Municipality. In some areas inhabitants have specifically required that street lights not be installed but should this be a requirement the present infrastructure is

- 29 –
___________________________________________________________________________
Final Integrated Development Plan 2012/13
sufficiently suitable to cater for the installation of street lights or other forms of public lighting. Energy Plan
Request for proposals planned to set up an Integrated
Electricity Development Plan (IEDP) to address future needs of energy consumption. The plan will be based on the equivalent national energy plan mentioned in the national Energy Act and will be set up for a period of 20 years into the future. The plan will look into reduction of fossil fueled energy and will look at increased usage of green energy (Sun, wave, wind, etc.). Investigations will be made into utilizing bad green house gasses, such as methane, by burning these to produce energy to generate electricity. This generation unit could also look at utilizing refuse dumping sites, sewage purification sites and dairy farm sites. This unit could also be used to process large amounts of biomass which is to be generated by clearing non-indigenous trees etc. Electricity Savings: a. Request for proposals to be published to invite interested parties to investigate the own energy usage of the Overstrand Municipality and effecting savings by installing high energy effective equipment. Since Eskom supplies funding mechanisms, and since many of these service providers offered own funding, it is seen as a low cost project with high benefits. b. Request for proposals to be published to attract the subsidised installation of energy saving measures such as Solar Hot Water Systems at housing scheme units, solar powered street lights, solar powered traffic lights etc.
c. The Municipality is currently installing a Hot Water Cylinder (HWC) control system whereby HWCs is to be switched off during peak periods from Eskom. This same system is to be used to accurately measure the electricity consumption savings thus achieved. This system will then be used to track the actual savings of fossil fuel electricity and the increase of Green Powered electricity
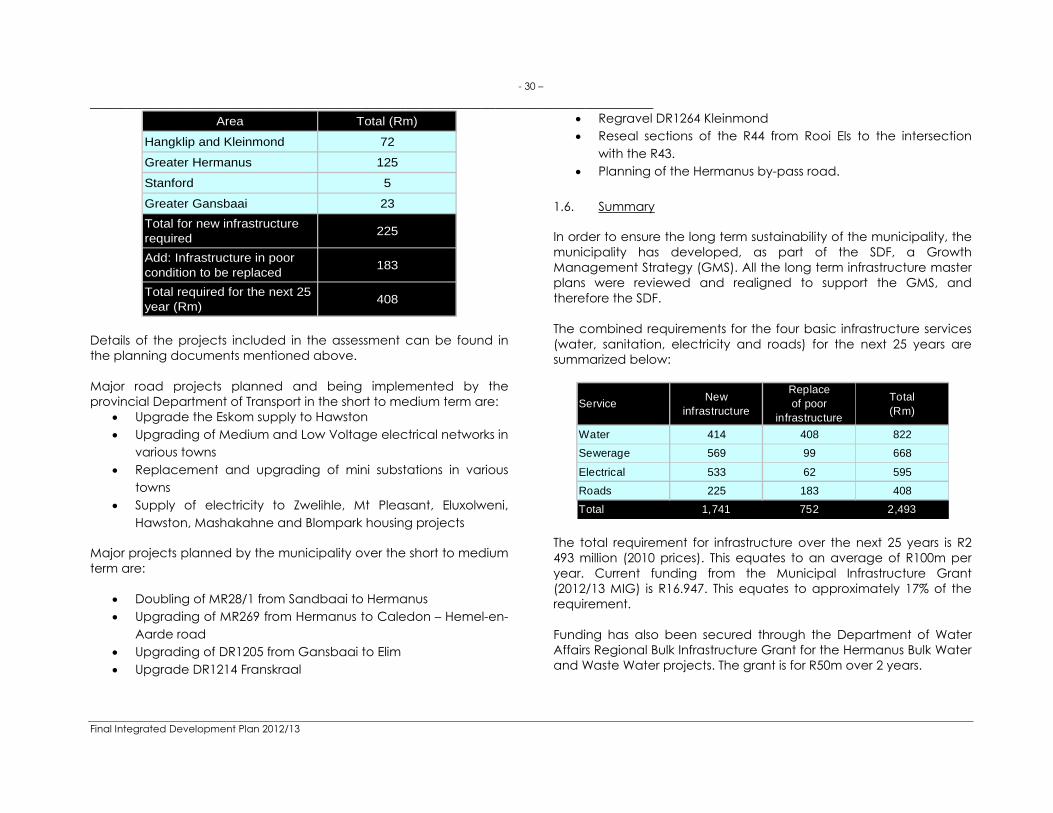
1.5. Roads The main planning documents for roads are:
The Integrated Transport Plan, The Pavement Management System (PMS), and The Roads Asset Register.
Based on these documents, an assessment was made of the roads infrastructure requirements for the next 25 years. The assessment is based on the following:
Upgrading of gravel roads to surfaced roads are included, Only municipal streets and municipal road projects are
included. Projects by the Provincial Department of Transport are excluded,
Replacement of current infrastructure that is in a poor or very poor condition,
Projects already started (and funded) are not included, Costs are in R x 106 (millions), and Costs are based on 2010 prices.
- 30 –
___________________________________________________________________________
Final Integrated Development Plan 2012/13
Area Total (Rm)
Hangklip and Kleinmond 72
Greater Hermanus 125
Stanford 5
Greater Gansbaai 23
Total for new infrastructure required
225
Add: Infrastructure in poor condition to be replaced
183
Total required for the next 25 year (Rm)
408
Details of the projects included in the assessment can be found in the planning documents mentioned above.
Major road projects planned and being implemented by the provincial Department of Transport in the short to medium term are:
Upgrade the Eskom supply to Hawston Upgrading of Medium and Low Voltage electrical networks in
various towns Replacement and upgrading of mini substations in various
towns Supply of electricity to Zwelihle, Mt Pleasant, Eluxolweni,
Hawston, Mashakahne and Blompark housing projects
Major projects planned by the municipality over the short to medium term are:
Doubling of MR28/1 from Sandbaai to Hermanus Upgrading of MR269 from Hermanus to Caledon – Hemel-en-
Aarde road Upgrading of DR1205 from Gansbaai to Elim Upgrade DR1214 Franskraal
Regravel DR1264 Kleinmond Reseal sections of the R44 from Rooi Els to the intersection
with the R43. Planning of the Hermanus by-pass road.
1.6. Summary
In order to ensure the long term sustainability of the municipality, the municipality has developed, as part of the SDF, a Growth Management Strategy (GMS). All the long term infrastructure master plans were reviewed and realigned to support the GMS, and therefore the SDF. The combined requirements for the four basic infrastructure services (water, sanitation, electricity and roads) for the next 25 years are summarized below:
ServiceNew
infrastructure
Replaceof poor
infrastructure
Total(Rm)
Water 414 408 822
Sewerage 569 99 668
Electrical 533 62 595
Roads 225 183 408
Total 1,741 752 2,493 The total requirement for infrastructure over the next 25 years is R2 493 million (2010 prices). This equates to an average of R100m per year. Current funding from the Municipal Infrastructure Grant (2012/13 MIG) is R16.947. This equates to approximately 17% of the requirement. Funding has also been secured through the Department of Water Affairs Regional Bulk Infrastructure Grant for the Hermanus Bulk Water and Waste Water projects. The grant is for R50m over 2 years.
- 31 –
___________________________________________________________________________
Final Integrated Development Plan 2012/13
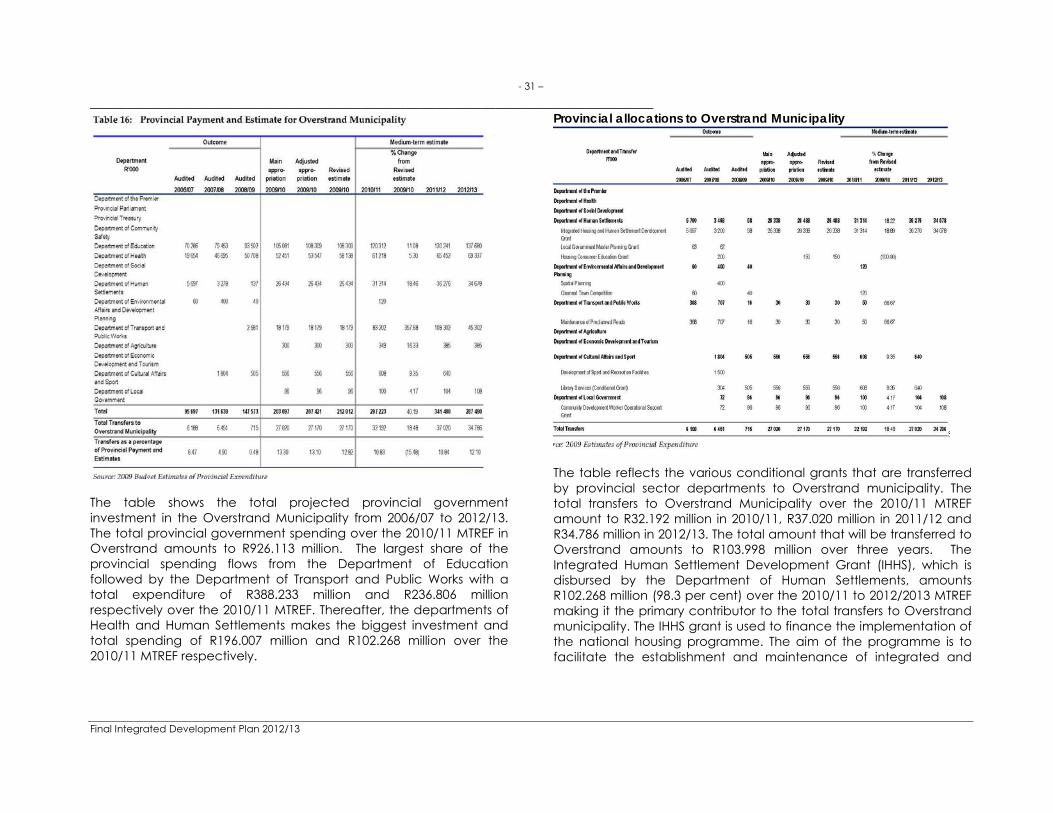
The table shows the total projected provincial government investment in the Overstrand Municipality from 2006/07 to 2012/13. The total provincial government spending over the 2010/11 MTREF in Overstrand amounts to R926.113 million. The largest share of the provincial spending flows from the Department of Education followed by the Department of Transport and Public Works with a total expenditure of R388.233 million and R236.806 million respectively over the 2010/11 MTREF. Thereafter, the departments of Health and Human Settlements makes the biggest investment and total spending of R196.007 million and R102.268 million over the 2010/11 MTREF respectively.
Provincial allocations to Overstrand Municipality
The table reflects the various conditional grants that are transferred by provincial sector departments to Overstrand municipality. The total transfers to Overstrand Municipality over the 2010/11 MTREF amount to R32.192 million in 2010/11, R37.020 million in 2011/12 and R34.786 million in 2012/13. The total amount that will be transferred to Overstrand amounts to R103.998 million over three years. The Integrated Human Settlement Development Grant (IHHS), which is disbursed by the Department of Human Settlements, amounts R102.268 million (98.3 per cent) over the 2010/11 to 2012/2013 MTREF making it the primary contributor to the total transfers to Overstrand municipality. The IHHS grant is used to finance the implementation of the national housing programme. The aim of the programme is to facilitate the establishment and maintenance of integrated and
- 32 –
___________________________________________________________________________
Final Integrated Development Plan 2012/13
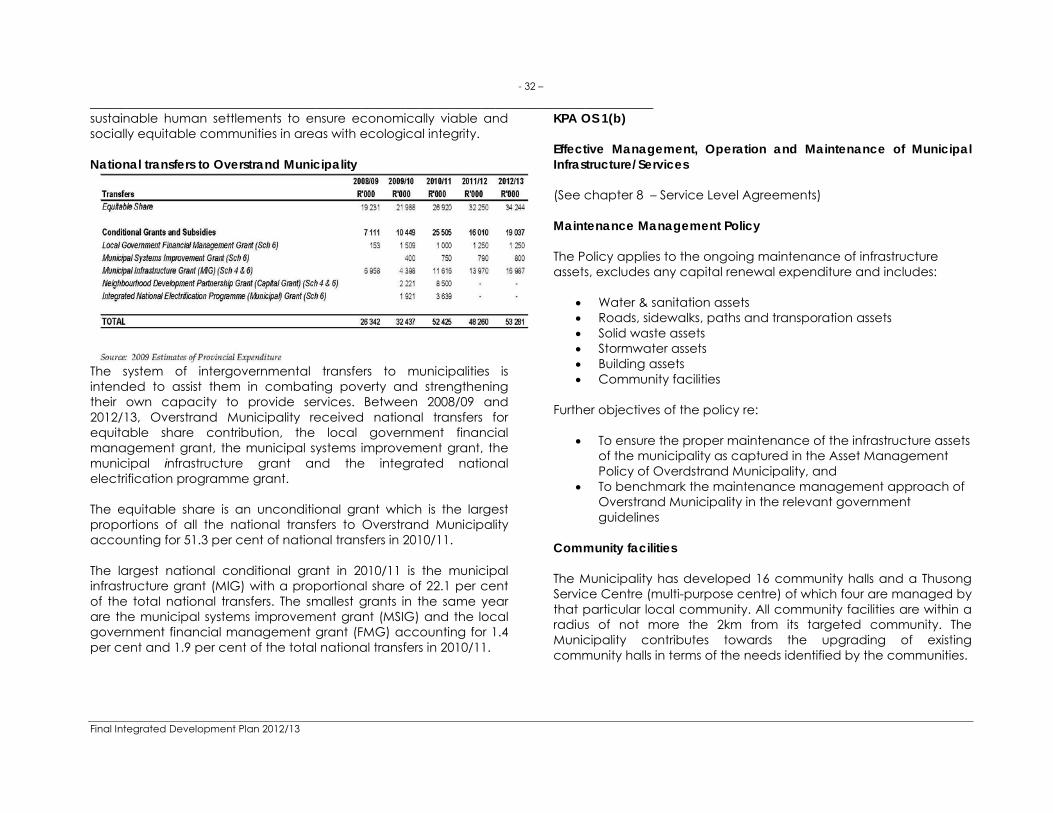
sustainable human settlements to ensure economically viable and socially equitable communities in areas with ecological integrity. National transfers to Overstrand Municipality
The system of intergovernmental transfers to municipalities is intended to assist them in combating poverty and strengthening their own capacity to provide services. Between 2008/09 and 2012/13, Overstrand Municipality received national transfers for equitable share contribution, the local government financial management grant, the municipal systems improvement grant, the municipal infrastructure grant and the integrated national electrification programme grant. The equitable share is an unconditional grant which is the largest proportions of all the national transfers to Overstrand Municipality accounting for 51.3 per cent of national transfers in 2010/11. The largest national conditional grant in 2010/11 is the municipal infrastructure grant (MIG) with a proportional share of 22.1 per cent of the total national transfers. The smallest grants in the same year are the municipal systems improvement grant (MSIG) and the local government financial management grant (FMG) accounting for 1.4 per cent and 1.9 per cent of the total national transfers in 2010/11.
KPA OS 1(b) Effective Management, Operation and Maintenance of Municipal Infrastructure/Services (See chapter 8 – Service Level Agreements) Maintenance Management Policy The Policy applies to the ongoing maintenance of infrastructure assets, excludes any capital renewal expenditure and includes:
Water & sanitation assets Roads, sidewalks, paths and transporation assets Solid waste assets Stormwater assets Building assets Community facilities
Further objectives of the policy re:
To ensure the proper maintenance of the infrastructure assets of the municipality as captured in the Asset Management Policy of Overdstrand Municipality, and
To benchmark the maintenance management approach of Overstrand Municipality in the relevant government guidelines
Community facilities The Municipality has developed 16 community halls and a Thusong Service Centre (multi-purpose centre) of which four are managed by that particular local community. All community facilities are within a radius of not more the 2km from its targeted community. The Municipality contributes towards the upgrading of existing community halls in terms of the needs identified by the communities.

- 33 –
___________________________________________________________________________
Final Integrated Development Plan 2012/13
The Municipality approached government departments for the establishment of their offices within the Thusong Service Centre in Hawston. The requirement from these particular departments was used to inform the building plans for the block of offices and the related business plan for the development. The Thusong Service Centre is currently in operation with a hall, (can host indoor sport), kitchen, ablution facilities, administrative office, and for other offices. The operational budget of the Municipality makes provision for personnel and maintenance costs of the facility. The location of the Thusong Service Centre is also central to all the communities within the Overstrand municipal area. KPA OS 2(a) Development of sustainable Human Settlements HOUSING 1. BACKGROUND 1.1 Introduction The Overstrand Municipality has aligned its vision with that of the Western Cape Provincial Government which promotes the development of integrated and sustainable human settlements with access to social and economic opportunities for all its citizens. Therefore it is necessary that all spheres of government cooperate in fulfilling this vision. To address an issue such as integrated and sustainable human settlements, a definite strategy is needed in the approach to housing. A simple definition of strategy is: ‘A long term action plan in achieving a goal’, for this reason the Overstrand Municipality has compiled a comprehensive 5-Year Human Settlement Strategy and programme guide and improve housing development and delivery within the municipality.
The purpose of this document is therefore to provide a link between the IDP and the Overstrand Housing Strategy as well as indicate how the strategy via the action plan will be implemented. Various Housing Programmes, each with its own projects that will run over a period of five-years will form the basis of this strategy. 2. SETTING THE CONTEXT In the process of developing a strategic housing plan for the Overstrand Municipality it became clear that an understanding must be developed for the existing legislative and policy guidelines that exist in the National and Provincial spheres of Government and which would inform any strategic planning that is being done by the Municipality. To fully understand the context of housing in South Africa, a comprehensive legislative background is needed. It should be noted that all the relevant legislation and policy frameworks will not be discussed in this document due to its limited content. It has however been dealt with comprehensively in the Overstrand Housing Strategy. National and Regional legislation form the basic foundation of how local legislation and policy frameworks are implemented in the housing context in South Africa. The following will facilitate an understanding of the legislative framework in which Housing is addressed in the different spheres of Government.
The Constitution of the Republic of South Africa The Housing Act, 1997 Local Government Municipal Systems Act, 2000

- 34 –
___________________________________________________________________________
Final Integrated Development Plan 2012/13
National Policy guidelines impacting on housing may be found in mainly three sets of documents: firstly, the National Spatial Development Perspective (NSDP), secondly the Comprehensive Plan for the Development of Sustainable Human Settlements – “Breaking New Ground”, and thirdly the Housing Code. In addition to the National Legislative context, a Housing Strategy has to be implemented within the framework, policies and strategies of the Provincial Government of the Western Cape. The following documents outline this foundation:
The Western Cape’s Provincial Spatial Development Framework (PSDF)
Western Cape Sustainable Human Settlement Strategy Western Cape Strategic Five Year Plan Strategic Objective 6: Developing Integrated and
Sustainable Human Settlements Other important guiding instruments on local level that needs to be taken in account are the Overstrand SDF and the Overstrand Growth Management Strategy. 3. IDENTIFING THE ISSUES 3.1 Problem Statement The following issues and problems regarding housing delivery in the Overstrand Municipal area were identified by way of a series of workshops, which included officials from the Municipality and the Provincial Government, consultants involved in the compilation of the Growth Management Strategy and consultants appointed by the Provincial Government to facilitate a Human Settlement Plan for the Municipality: The current housing delivery model cannot address the current
and future need for housing, as the growing demand continues to exceed supply. Much of this demand consists of
families living in informal structures (in informal settlements and backyards).
Current municipal DORA allocation does not allow the municipality to catch-up with its backlog.
All the necessary supporting services e.g. social and economic facilities, police and health services do not accompany housing developments.
The housing code does not make provision for higher density developments where properties are owned by beneficiaries. The code mostly provide for rental stock only in the development of higher density units
The DORA-allocation needs to be increased if CRU-units are to be built by the municipality. Community Residential Units (CRU) are not currently provided by the Municipality.
The Overstrand Municipality finds that that Provincial Government’s strategies are often generic and not practical at ground level. For example, spatial planning problems arise as a result of the tight urban edge. The limited land available in Hermanus proper (the major economic node) may not be suitable in terms of economic growth and opportunities.
Housing land is not transferred from Public Works to the Municipality.
There are a huge number of back-yarders who are currently renting from the main beneficiary.
Lack of proper functioning “Support Organisations” to commence with Enhanced People’s Housing Project (EPHP).
Ownership is also a problem. There is a historic problem in transferring title deeds to beneficiaries.
Beneficiary education about ownership responsibilities. Housing Projects put an operational burden on the municipality
and the normal tax base of the municipality.

- 35 –
___________________________________________________________________________
Final Integrated Development Plan 2012/13
The Overstrand Municipality is also faced by economic constraints in relative income groups and a gap in the property market. There are many families with a household income that exceeds the upper limit for subsidised housing, however not meeting the minimum to access mortgage finance. These households fall in the category R3 500 – R9 000. Provision also needs to be made for a category earning less than R3 500 per month.
One of the key challenges to the development of sustainable human settlements is the limited availability of well-located suitable land if a site and service delivery model is followed.
High cost of the sustainable development with specific reference to energy efficiency in the development of human settlements. The technology used should be sustainable and practical. The housing codes need to consider the operation impact/expense of the technologies used.
3.2 Housing Demand The Housing demand for Overstrand is notoriously difficult to pin down. Reasons include fluctuating demand, inclusion of households living in backyard dwellings, and inclusion of households living in overcrowded conditions to name a few. The problems are exacerbated by limited availability of suitable land and increasing cost of infrastructure. The housing demand, even the lowest number is simply a target to aim for when satisfying the quantitative aspects associated with the creation of integrated sustainable human settlements. The total housing demand in the Overstrand municipality is the sum of the people living in informal settlements as well as the number of backyard dwellers. It is important to note that there is no reliable information available on the number of backyard dwellers, making it increasingly difficult to accurately plan for future housing needs in the Overstrand area.
The table below indicate the total units per informal area, this specify the demand that originates from people living in informal settlements.
TOWN INFORMAL SETTLEMENT
TOTAL INFORMAL UNITS PER AREA JUNE 2011
UPDATED UNITS PER AREA DEC 2011
SIZE M² DISTANCE TO NEAREST MUNICIPAL BUILDING / STORE
KM LOCATION
Stanford Die Kop 142 137 36285 3
Municipal Store, 8&9 Heuwel street, Industrial Park
Gansbaai Mashakhane 1335 1327 141778 2.5
Municipal store,Voortrekker
road, Erf 210
Gansbaai Beverly Hills 106 103 20670 2m
Municipal store,Voortrekker
road, Erf 211
Gansbaai Eluxolweni 172 171 39170 25
Municipal store,Voortrekker
road, Erf 212
Kleinmond Overhills 579 365 50000 2 Municipal store, 13 Avenue, Kleinmond
Zwelihle Tsepe-Tsepe 222 221 8265,46 2 Housing Offices, Stil
street, Hermanus
Zwelihle Service Side 79 79 1647 2.1 Housing Offices, Stil
street, Hermanus
Zwelihle Thambo Square 400 398 26759,8 2
Housing Offices, Stil street, Hermanus
Zwelihle Asazani 72 72 5208 2.1 Housing Offices, Stil
street, Hermanus
Zwelihle Mandela Square 207 206 10550 2.2
Housing Offices, Stil street, Hermanus
Zwelihle New Camp 53 55 1050 2 Housing Offices, Stil
street, Hermanus
Zwelihle Transit Camp 315 315 19096,35 1.9 Housing Offices, Stil
street, Hermanus
TOTAL 3682 3449 306358 48.8
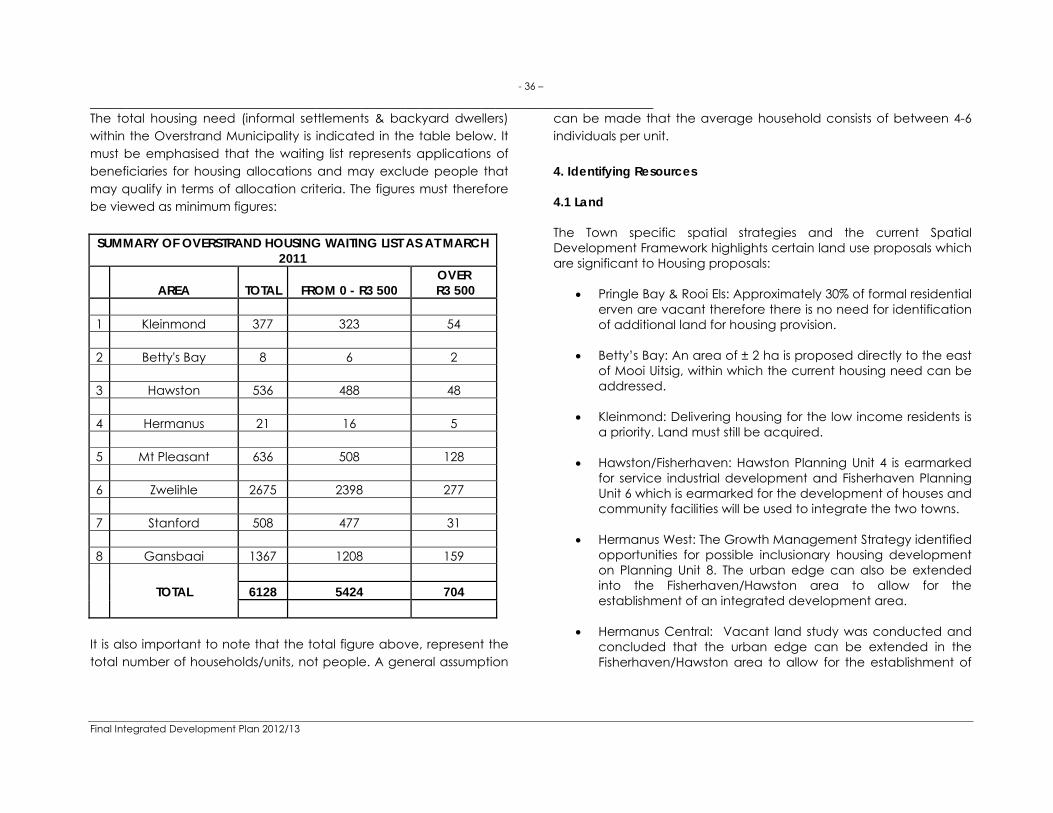
- 36 –
___________________________________________________________________________
Final Integrated Development Plan 2012/13
The total housing need (informal settlements & backyard dwellers) within the Overstrand Municipality is indicated in the table below. It must be emphasised that the waiting list represents applications of beneficiaries for housing allocations and may exclude people that may qualify in terms of allocation criteria. The figures must therefore be viewed as minimum figures:
SUMMARY OF OVERSTRAND HOUSING WAITING LIST AS AT MARCH 2011
AREA TOTAL FROM 0 - R3 500 OVER
R3 500 1 Kleinmond 377 323 54 2 Betty's Bay 8 6 2 3 Hawston 536 488 48 4 Hermanus 21 16 5 5 Mt Pleasant 636 508 128 6 Zwelihle 2675 2398 277 7 Stanford 508 477 31 8 Gansbaai 1367 1208 159 TOTAL 6128 5424 704
It is also important to note that the total figure above, represent the total number of households/units, not people. A general assumption
can be made that the average household consists of between 4-6 individuals per unit. 4. Identifying Resources 4.1 Land The Town specific spatial strategies and the current Spatial Development Framework highlights certain land use proposals which are significant to Housing proposals:
Pringle Bay & Rooi Els: Approximately 30% of formal residential erven are vacant therefore there is no need for identification of additional land for housing provision.
Betty’s Bay: An area of ± 2 ha is proposed directly to the east
of Mooi Uitsig, within which the current housing need can be addressed.
Kleinmond: Delivering housing for the low income residents is
a priority. Land must still be acquired.
Hawston/Fisherhaven: Hawston Planning Unit 4 is earmarked for service industrial development and Fisherhaven Planning Unit 6 which is earmarked for the development of houses and community facilities will be used to integrate the two towns.
Hermanus West: The Growth Management Strategy identified
opportunities for possible inclusionary housing development on Planning Unit 8. The urban edge can also be extended into the Fisherhaven/Hawston area to allow for the establishment of an integrated development area.
Hermanus Central: Vacant land study was conducted and
concluded that the urban edge can be extended in the Fisherhaven/Hawston area to allow for the establishment of

- 37 –
___________________________________________________________________________
Final Integrated Development Plan 2012/13
an integrated development area, providing a full range of housing types and land uses.
Stanford: The Municipality intends developing an IRDP project
on a 30 ha portion of Growth Management Strategy Planning Unit 9 over the next 5 years.
Greater Gansbaai: Identified area south of Masakhane and
the suitability of land located west of Blompark is being investigated.
Pearly Beach: Identified area south of Eluxolweni. Strategy is also to provide a balanced mix of residential housing in the area east of Charlie van Breda Drive.
4.2 Funding In order to effectively execute the Overstrand Housing Strategy Five-Year Plan, various funding sources are needed. For any strategy to be successfully implemented it should be noted that funding allocations must be well structured according to the different needs and abilities of not only the Local Municipality involved but also the National and Provincial Departments. Funding for housing development is generated via the three spheres of government. Local-, Provincial- and National Government are all financially accountable and responsible for the overall success of housing delivery. Funding sources consist of the following
o Housing subsidy: Responsible for internal infrastructure and top structures.
o Municipal Infrastructure Grant (MIG): Responsible for bulk water, roads, stormwater and street lighting.
o Municipality: Special needs o Department of Energy (DoE): Bulk and internal electricity.
4.3 Human Resources The Overstrand municipality appointed an Implementing agent to guide and handle the delivery of subsidised housing. This agent will manage the implementation of Overstrand housing projects. 5. HOUSING STRATEGY The main vision is to not only eradicate the current housing backlog, but to develop and plan for future integrated communities and settlements that would be able to sustain the growing needs for housing in such a way that all people will benefit from the housing developments. Thus it is imperative for clear and concise goals and objectives to be set out firmly supported by the vision. The intention is to achieve the following three goals in order to realize the vision of sustainable and integrated human settlements:
Accelerated delivery of housing opportunities A sense of ownership, rights and responsibilities amongst
beneficiaries. Optimal and sustainable use of resources
Specific objectives need to be set in place to achieve the above mentioned goals: Objective 1: Upscale provision and implementation of serviced sites. Objective 2: Increasing densities of new human settlement developments on well located land. Objective 3: Reduce bulk infrastructure as a constraint to human settlement development. Objective 4: Acquiring well-located land for well-planned Integrated Human Settlements.

- 38 –
___________________________________________________________________________
Final Integrated Development Plan 2012/13
Objective 5: Provide a fair allocation of housing opportunities. Objective 6: Increase beneficiary involvement in the development of housing opportunities. Objective 7: Enhancing supply of new rental housing opportunities and encourage improved property management of rental stock. Objective 8: Increase sustainable resource use by exploring alternative technologies and building methodologies. This vision will be achieved by implementing different programmes that are relevant to the specific projects undertaken. These programmes are discussed in more detail in the action plan under section 7.2 6. ESTABLISHING PRIORITIES The Turn-Around Strategy, where housing is provided for the disadvantaged communities, has been identified as a priority within the Overstrand Municipality. The reason for identifying this as a priority lies in the relative stagnation that crept into the provision of housing in the Overstrand in the last few years. To illustrate this, the following statistics need to be considered:
Since 1996 and up to the end of 2004, a total of 4560 housing units have been provided in the Overstrand Municipal area.
After that date, two projects were approved by the Provincial Authorities, namely those at Kleinmond (611 units approved of which only 410 are currently under construction) and Stanford (389 units approved of which only 88 units realised).
These figures must be seen against the current estimated backlog of at least 7619 names on the housing waiting list, a figure of 4 900 estimated backyard dwellers and a
currently undisclosed number of squatters which are not included in the above figures.
The need for a Turn-Around Strategy was identified during 2009 when the Municipality had to manage the departure of its Housing Manager. Since then, various measures were put in place to speed up its housing delivery process. 7. ACTION PLAN 7.1 Introduction A detailed action plan has been designed to reduce the backlog and address the current housing need. This Housing Strategy Five-Year Plan incorporates several housing programmes, each addressing different needs and is focused on specific projects. The housing function within the Municipality has been re-organised, by placing the housing delivery process within the Directorate Infrastructure and Planning, whilst retaining housing administration in the Directorate Community Services. This facilitated a more streamlined process. The funding sources for each of the projects are also indicated in the strategy and were discussed in section 4.2. The expenditures are allocated in the budget for the next five years. This strategy is designed in such a way that it makes provision to continue after the initial five years. 7.2 Housing Programmes and Related Projects The following housing programmes form part of the strategy:
1. Integrated residential Development Programme (IRDP)
This programme has been introduced to facilitate the development of integrated human settlements in well-located areas that provide convenient access to urban

- 39 –
___________________________________________________________________________
Final Integrated Development Plan 2012/13
amenities, including places of employment. The Programme is aimed at creating social cohesion. The IRDP provides for the acquisition of land, servicing of stands for a variety of land uses including commercial, recreational, schools and clinics, as well as residential stands for low, middle and high income groups. The land use and income group mix will be based on local planning and needs assessment. The projects that will form part of this programme include: Stanford, Hawston 1 & 2, Betty’s Bay and Gansbaai 1 & 2.
2. Upgrading of Informal Settlements This Programme is aimed at the in situ upgrading of informal settlements. In circumstances where the terrain is not suitable for human settlement, residents may be relocated and settled elsewhere. The projects that will form part of this programme include: Kleinmond, Hermanus, Gansbaai and Pearly Beach.
3. Provision of Economic & Social Facilities The Programme deals with the development of primary public, social and economic facilities within existing and new housing areas, as well as within informal settlement upgrading projects, in cases where municipalities are unable to provide such facilities. Project Hermanus/Zwelihle will form this programme. It will include upgrading of soccer fields and a crèche.
4. Institutional Subsidies The Institutional Housing Subsidy Programme has been introduced to provide capital grants to social housing institutions which construct and manage affordable rental units.
The projects that will form part of this programme include: Swartdamweg, Gansbaai, Kleinmond, Zwelihle, Hermanus, Hawston, Greater Hermanus and Greater Gansbaai.
5. Enhanced People’s Housing Process (EPHP)
This is a government housing support programme that assists households who wish to enhance their houses by actively contributing towards the building of their own homes. The process allows beneficiaries to establish a housing support organisation that will provide them with organisational, technical and administrative assistance. The projects that will form part of this programme include: Kleinmond, Hermanus, Gansbaai and Pearly Beach.
6. Emergency Housing Programme (EHP)
During the process of upgrading informal settlements, it may be necessary to temporarily re-locate households while services are being installed or formal houses are being built on sites previously occupied by informal structures. Funding under the Programme will be made available to municipalities as grants for the provision of temporary aid and assistance will be limited to absolute essentials. Kleinmond is included as a project of this programme.
7. Social Housing Programme
This programme applies only to “restructuring zones” which are identified by municipalities as areas of economic opportunity and where urban renewal/restructuring impacts can best be achieved. The Programme also aims at developing affordable rental in areas where bulk infrastructure may be under-utilised, therefore improving urban efficiency. The municipality has now embarked on a process in collaboration with the Western Cape Human Settlement Department to identify Restructuring zones and specific projects.

- 40 –
___________________________________________________________________________
Final Integrated Development Plan 2012/13
8. Community Residential Units (CRU)
This programme aims to facilitate the provision of secure, stable rental tenure for lower income persons/households. The grant includes funding for the capital costs of project development and future long-term capital maintenance costs.
7.3 Policy adjustments Since acceptance of its housing programme and policy in 2010, certain funding and implementation realities led to the Municipality accepting certain policy shifts in its housing strategy. The following measures were decided upon. 1. In situ upgrading of informal settlements was identified as top priority. 2. The provision of serviced sites in IRDP projects will receive priority above top structures.
This does not mean that no top structures will be provided, but rather that the availability of funds will determine when top structures will be provided.
3. The Municipality accepted the Social Housing Programme as
part of its Housing Strategy. The target groups that will be addressed are firstly those people that earn between R1500 and R3500 and who prefer a rental option and secondly those people that earn between R3501 and R7500 who do not qualify for a housing subsidy, but who can also not afford a housing loan in order to acquire GAP housing. As soon as restructuring zones have been accepted and projects identified, the housing programme must be adjusted accordingly.
4. It is reiterated that CRU (Community Residential Units) would not be implemented until an appropriate management model is provided which does not require the Municipality to own, administer and maintain such units.
5. The provision of GAP housing for income earners above
R7500 to R15 000, who still cannot access a normal housing loan will be promoted by the Municipality and implemented as part of the Integrated Residential Development Programme.
6. In the light of financial constraints, the current 5 year
programme had to be extended to an eight to ten year programme in order to make it more affordable to the Municipality. Policy measures which impact on the 5 year programme had to be incorporated in the programme with immediate effect.
CONCLUSION The main objective of this chapter in the IDP is to provide a clear understanding of the Overstrand Human Settlement Strategy and how it engages with the Five-Year Plan to act in accordance with the vision of creating sustainable human settlements. In the process of achieving the vision, definite problems were identified. The strategy is designed in such a way that it addresses the problems with specific objectives. A detailed action plan has been set in place to reduce the backlog and address the current and future housing need. This Housing Strategy Five-Year Plan will incorporate several housing programmes, each focused on and addressing different needs. The Overstrand municipality has compiled a comprehensive 5-Year Human Settlement Strategy to guide and improve housing delopment and is specifically focussed on delivery within the Municipality. ** 5 year housing plan attached

- 41 –
___________________________________________________________________________
Final Integrated Development Plan 2012/13
KPA OS 2(b) Creation of an environment conducive for LED (See chapter 6) KPA OS 2(c) Development of strategies linked to projects for vulnerable groupings DEVELOPMENT OF STRATEGIES AND PROJECTS FOR VULNERABLE GROUPINGS The focus of social development programmes should be on the social inclusion of those who are marginalised. Poverty is a multidimensional concept that includes not only income poverty, but also the denial of opportunities and choices most basic to human development to lead a long, healthy, creative life, and enjoy a decent standard of living, freedom, dignity, self-esteem, and respect of others. It is because of these features that women, children, disabled, youth, elderly and people with HIV/AIDS are considered vulnerable or marginalised. Social development intervention strategies can take many different forms and may be categorised into the following modes of interventions: community based development strategies and support for
vulnerable groups including children, youth, women, older persons, people with disabilities, displaced persons;
Community information, education and communication strategies; and
Advocacy strategies. Social policy and planning strategies A combination of these different interventions is deployed in this Social Development Plan. However, due to the multidimensional nature of poverty and the conditions that leads to the perpetual marginalisation of specific groups of people, this plan cannot be
comprehensive, but needs to be supplement and expanded by all relevant sector departments both nationally and locally as well as by all the numerous organisations who strive to improve the lives of the vulnerable groups in our communities. The real plan that will have a lasting impact therefore lie in the cooperation and coordination of the efforts of all the role players involved. With this plan the municipality extends an open invitation to partners from government and civil society to work with us in an open and coordinated approach to alleviate and improve the conditions of the marginalised groups in our society. This plan is the beginning of a journey to a better tomorrow. In keeping with the dynamism of social conditions we will continuously collect the necessary socio-economic data necessary to improve and sharpen our efforts. Hence we will review the plan on a annual basis, not only to improve and amend our efforts, but also to include the programmes and projects from our government partners as they come on line and join us in our efforts, and to ensure that this plan remains relevant an up to date. Current known conditions have dictated the content of this plan to a large extend. As such the immediate to short term will focus a substantial amount of effort on the ECD sector. This sector faces major challenges which have a direct impact on women (educators and carers) and children. Women in turn are regarded as an essential focus point for any poverty reduction strategy and by implication for social development. It should be noted that although the youth and elderly are not explicitly mentioned in this plan they are considered vulnerable and marginalised and are therefore by included by implication. The current reality and immediate needs of the youth are more directly addressed by the LED Department through the creation of employment opportunities and skills development projects. Through the Junior Town Council additional projects and programmes are rolled out to the youth.

- 42 –
___________________________________________________________________________
Final Integrated Development Plan 2012/13
CHILDREN
OBJECTIVES BASELINE ACTIVITIES RESPONSIBILITY & STAKEHOLDERS INDICATORS
WHEN
2012/13 2013/14 2014/15 2015/16
INSTITUTIONAL ARRANGEMENTS
Establish municipal strategy and
policy to allign fuctions and services to
improve and regulate ECD
sector
No policies in place
Develop ECD policy
Social Department Department of Social
Development ECD Sector role
players
Adopted ECD policy
June 2012 review review review
No Strategies in place
Develop ECD strategy
Social Department Department of Social
Development ECD Sector role players Council
Adopted ECD strategy July 2012 review review review
No Functions assigned
Explore and apply for Social Development
Functions contemplated in
Children's Act
Social Department Department of Social
Development ECD Sector role players Council
Municipal Manager
Assignment of functions
contemplated in Child Care Act to
Overstrand Municipality
By 2013 roll-out roll-out
FACILITIES
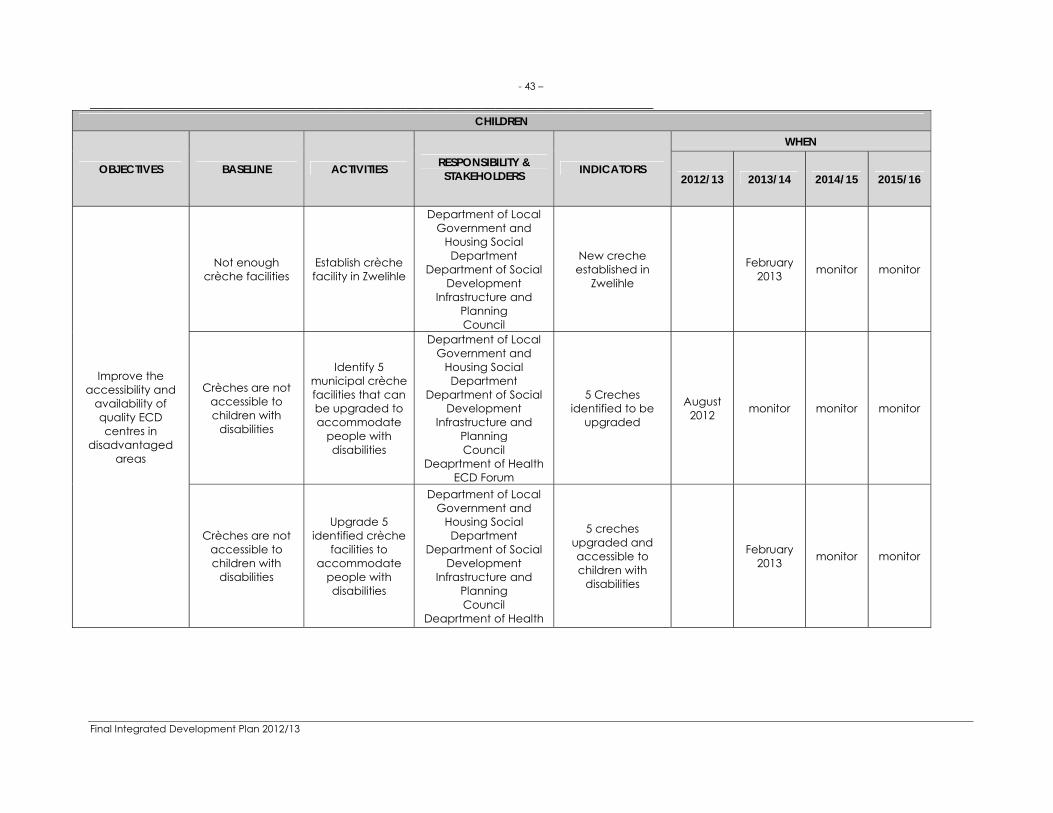
- 43 –
___________________________________________________________________________
Final Integrated Development Plan 2012/13
CHILDREN
OBJECTIVES BASELINE ACTIVITIES RESPONSIBILITY & STAKEHOLDERS INDICATORS
WHEN
2012/13 2013/14 2014/15 2015/16
Improve the accessibility and
availability of quality ECD centres in
disadvantaged areas
Not enough crèche facilities
Establish crèche facility in Zwelihle
Department of Local Government and
Housing Social Department
Department of Social Development
Infrastructure and Planning Council
New creche established in
Zwelihle February
2013 monitor monitor
Crèches are not accessible to children with
disabilities
Identify 5 municipal crèche facilities that can be upgraded to accommodate
people with disabilities
Department of Local Government and
Housing Social Department
Department of Social Development
Infrastructure and Planning Council
Deaprtment of Health ECD Forum
5 Creches identified to be
upgraded
August 2012 monitor monitor monitor
Crèches are not accessible to children with
disabilities
Upgrade 5 identified crèche
facilities to accommodate
people with disabilities
Department of Local Government and
Housing Social Department
Department of Social Development
Infrastructure and Planning Council
Deaprtment of Health
5 creches upgraded and accessible to children with
disabilities
February
2013 monitor monitor
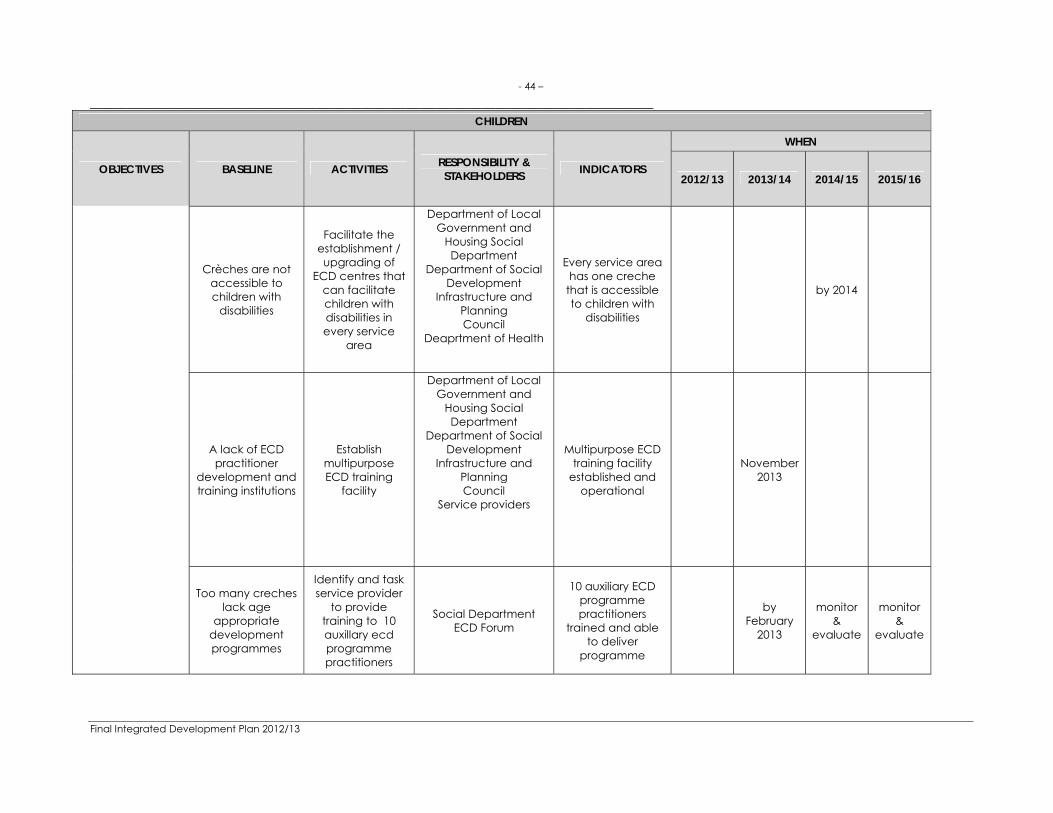
- 44 –
___________________________________________________________________________
Final Integrated Development Plan 2012/13
CHILDREN
OBJECTIVES BASELINE ACTIVITIES RESPONSIBILITY & STAKEHOLDERS INDICATORS
WHEN
2012/13 2013/14 2014/15 2015/16
Crèches are not accessible to children with
disabilities
Facilitate the establishment / upgrading of
ECD centres that can facilitate children with disabilities in every service
area
Department of Local Government and
Housing Social Department
Department of Social Development
Infrastructure and Planning Council
Deaprtment of Health
Every service area has one creche
that is accessible to children with
disabilities
by 2014
A lack of ECD practitioner
development and training institutions
Establish multipurpose ECD training
facility
Department of Local Government and
Housing Social Department
Department of Social Development
Infrastructure and Planning Council
Service providers
Multipurpose ECD training facility
established and operational
November
2013
Too many creches lack age
appropriate development programmes
Identify and task service provider
to provide training to 10 auxillary ecd programme practitioners
Social Department ECD Forum
10 auxiliary ECD programme practitioners
trained and able to deliver
programme
by February
2013
monitor &
evaluate
monitor &
evaluate
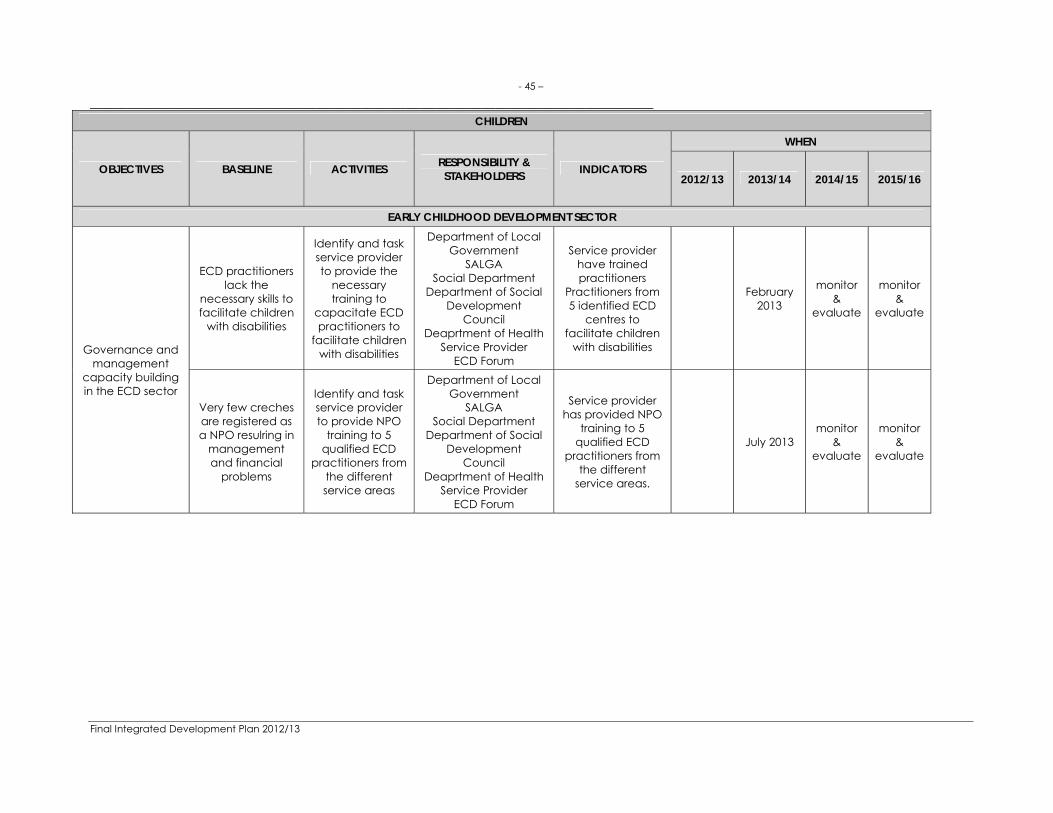
- 45 –
___________________________________________________________________________
Final Integrated Development Plan 2012/13
CHILDREN
OBJECTIVES BASELINE ACTIVITIES RESPONSIBILITY & STAKEHOLDERS INDICATORS
WHEN
2012/13 2013/14 2014/15 2015/16
EARLY CHILDHOOD DEVELOPMENT SECTOR
Governance and management
capacity building in the ECD sector
ECD practitioners lack the
necessary skills to facilitate children
with disabilities
Identify and task service provider to provide the
necessary training to
capacitate ECD practitioners to
facilitate children with disabilities
Department of Local Government
SALGA Social Department
Department of Social Development
Council Deaprtment of Health
Service Provider ECD Forum
Service provider have trained practitioners
Practitioners from 5 identified ECD
centres to facilitate children
with disabilities
February
2013
monitor &
evaluate
monitor &
evaluate
Very few creches are registered as a NPO resulring in
management and financial
problems
Identify and task service provider to provide NPO
training to 5 qualified ECD
practitioners from the different service areas
Department of Local Government
SALGA Social Department
Department of Social Development
Council Deaprtment of Health
Service Provider ECD Forum
Service provider has provided NPO
training to 5 qualified ECD
practitioners from the different
service areas.
July 2013 monitor
& evaluate
monitor &
evaluate

- 46 –
___________________________________________________________________________
Final Integrated Development Plan 2012/13
CHILDREN
OBJECTIVES BASELINE ACTIVITIES RESPONSIBILITY & STAKEHOLDERS INDICATORS
WHEN
2012/13 2013/14 2014/15 2015/16
Many creches have inadequate
management and governance
structures
Identify and task service provider
to provide management
and governance training training to 10 creches
with challeneges and qualifies
personnel
Department of Local Government
SALGA Social Department
Department of Social Development
Council Deaprtment of Health
Service Provider
Service provider have provided
management and governance
training to 10 ECD centres with
qualified personnel who experienced
management and governance challenges
July 2013 repeat
Information sharing,
communication and capacity
building
Parents are not aware of the
importance of early childhood
development and what to expect from chreches
Develop and distribute 5000
ECD information brochures
Social Department Department of Social
Development ECD Forum
Creches Clinics
5000 ECD Information brochures,
developed, printed and distributed
by July 2013 repeat repeat
Information sessions with at
least 200 parents on ECD
Social Department Department of Social
Development ECD Forum
Creches Clinics
400 parents have attended ECD
information sessions
by July 2013 repeat repeat

- 47 –
___________________________________________________________________________
Final Integrated Development Plan 2012/13
CHILDREN
OBJECTIVES BASELINE ACTIVITIES RESPONSIBILITY & STAKEHOLDERS INDICATORS
WHEN
2012/13 2013/14 2014/15 2015/16
ECD Practitioners are not informed about the new
Children's Act and the minimum
norms and standards
Information sessions and brochures for
ECD practitioners on the new
Childrens's Act
Social Department Department of Social
Development ECD Forum
Creches Clinics
200 ECD practitioners have
attended an information session
on the new children's act and
the minumum norms and standards
by July 2013 repeat repeat
Information session with 100
ECD practitioners on how to
register with the Department of
Social Development & the importance of a registered
programme
Social Department Department of Social
Development ECD Forum
Creches
100 ECD practitioners
attended information session on how to register
with the Department of
Social Development &
the importance of a registered programme
by July 2013 repeat repeat
Only one ECD forum that does not represent all
the ECD's
Facilitate the Establishment of ECD forums in all
service areas
Social Department Department of Social
Development ECD Forum
Creches
ECD practitioners attend ECD forums in their areas on a
quarterly basis
by March 2013 ongoing ongoing
MONITORING AND EVALUATION
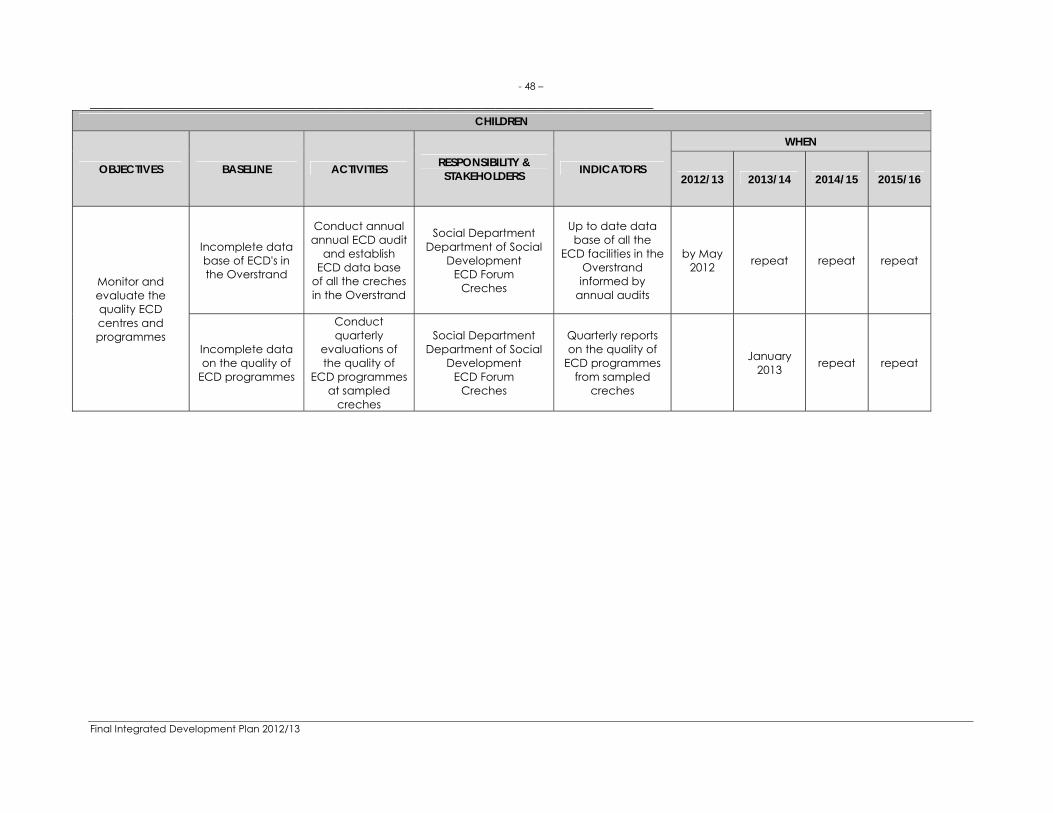
- 48 –
___________________________________________________________________________
Final Integrated Development Plan 2012/13
CHILDREN
OBJECTIVES BASELINE ACTIVITIES RESPONSIBILITY & STAKEHOLDERS INDICATORS
WHEN
2012/13 2013/14 2014/15 2015/16
Monitor and evaluate the quality ECD centres and programmes
Incomplete data base of ECD's in the Overstrand
Conduct annual annual ECD audit
and establish ECD data base
of all the creches in the Overstrand
Social Department Department of Social
Development ECD Forum
Creches
Up to date data base of all the
ECD facilities in the Overstrand informed by
annual audits
by May 2012 repeat repeat repeat
Incomplete data on the quality of
ECD programmes
Conduct quarterly
evaluations of the quality of
ECD programmes at sampled
creches
Social Department Department of Social
Development ECD Forum
Creches
Quarterly reports on the quality of
ECD programmes from sampled
creches
January
2013 repeat repeat
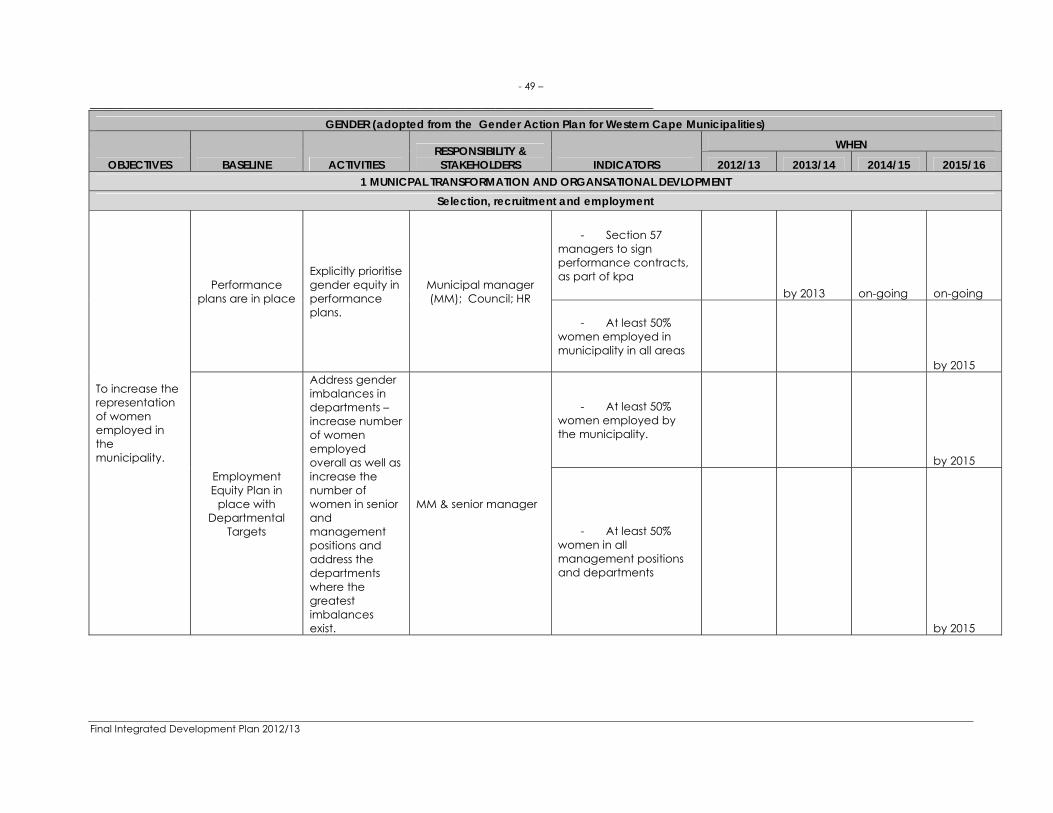
- 49 –
___________________________________________________________________________
Final Integrated Development Plan 2012/13
GENDER (adopted from the Gender Action Plan for Western Cape Municipalities)
OBJECTIVES BASELINE ACTIVITIES RESPONSIBILITY & STAKEHOLDERS INDICATORS
WHEN
2012/13 2013/14 2014/15 2015/16 1 MUNICPAL TRANSFORMATION AND ORGANSATIONAL DEVLOPMENT
Selection, recruitment and employment
To increase the representation of women employed in the municipality.
Performance plans are in place
Explicitly prioritise gender equity in performance plans.
Municipal manager (MM); Council; HR
- Section 57 managers to sign performance contracts, as part of kpa
by 2013 on-going on-going
- At least 50% women employed in municipality in all areas
by 2015
Employment Equity Plan in
place with Departmental
Targets
Address gender imbalances in departments – increase number of women employed overall as well as increase the number of women in senior and management positions and address the departments where the greatest imbalances exist.
MM & senior manager
- At least 50% women employed by the municipality.
by 2015
- At least 50% women in all management positions and departments
by 2015
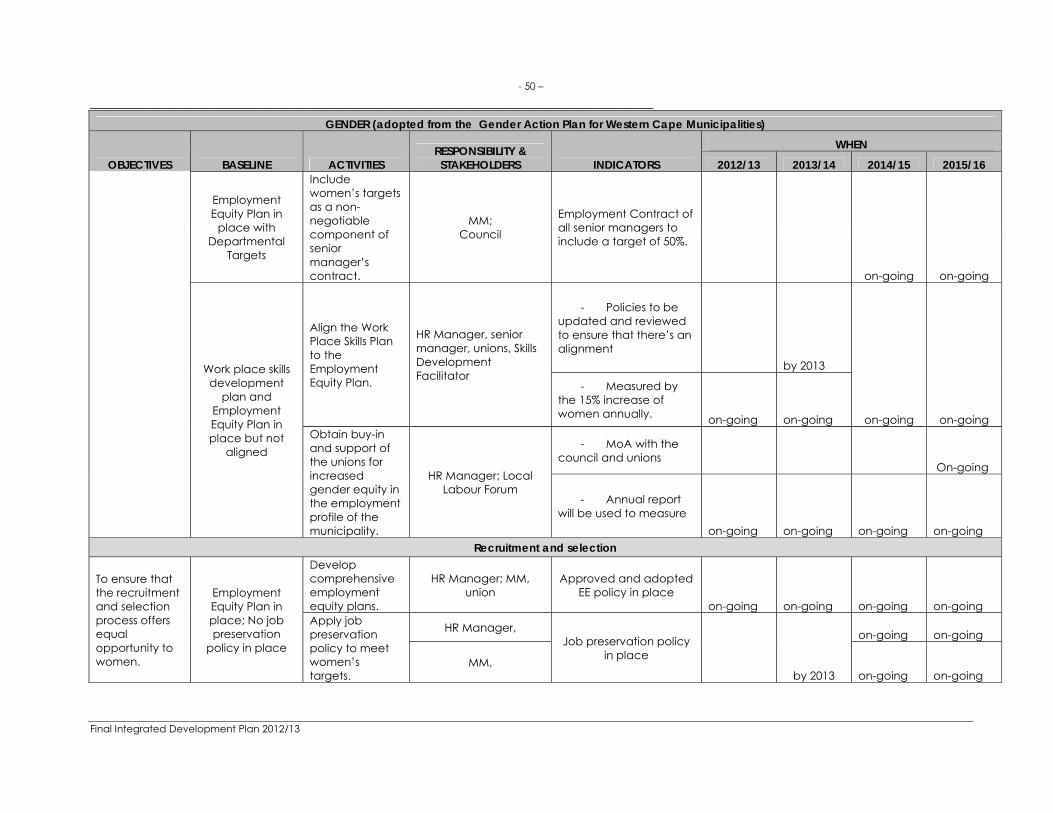
- 50 –
___________________________________________________________________________
Final Integrated Development Plan 2012/13
GENDER (adopted from the Gender Action Plan for Western Cape Municipalities)
OBJECTIVES BASELINE ACTIVITIES RESPONSIBILITY & STAKEHOLDERS INDICATORS
WHEN
2012/13 2013/14 2014/15 2015/16
Employment Equity Plan in
place with Departmental
Targets
Include women’s targets as a non-negotiable component of senior manager’s contract.
MM; Council
Employment Contract of all senior managers to include a target of 50%.
on-going on-going
Work place skills development
plan and Employment Equity Plan in place but not
aligned
Align the Work Place Skills Plan to the Employment Equity Plan.
HR Manager, senior manager, unions, Skills Development Facilitator
- Policies to be updated and reviewed to ensure that there’s an alignment
by 2013
on-going on-going
- Measured by the 15% increase of women annually. on-going on-going
Obtain buy-in and support of the unions for increased gender equity in the employment profile of the municipality.
HR Manager; Local Labour Forum
- MoA with the council and unions
On-going
- Annual report will be used to measure
on-going on-going on-going on-going Recruitment and selection
To ensure that the recruitment and selection process offers equal opportunity to women.
Employment Equity Plan in place; No job preservation
policy in place
Develop comprehensive employment equity plans.
HR Manager; MM, union
Approved and adopted EE policy in place
on-going on-going on-going on-going Apply job preservation policy to meet women’s targets.
HR Manager, Job preservation policy
in place
by 2013
on-going on-going
MM, on-going on-going
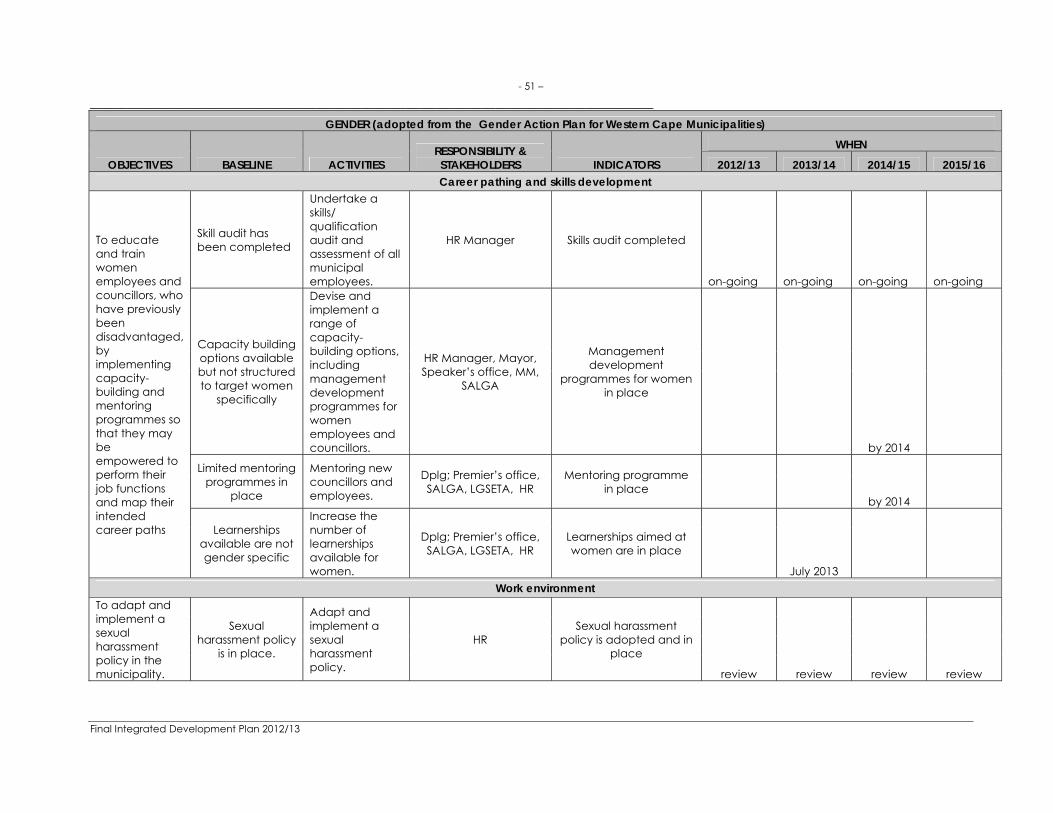
- 51 –
___________________________________________________________________________
Final Integrated Development Plan 2012/13
GENDER (adopted from the Gender Action Plan for Western Cape Municipalities)
OBJECTIVES BASELINE ACTIVITIES RESPONSIBILITY & STAKEHOLDERS INDICATORS
WHEN
2012/13 2013/14 2014/15 2015/16 Career pathing and skills development
To educate and train women employees and councillors, who have previously been disadvantaged, by implementing capacity-building and mentoring programmes so that they may be empowered to perform their job functions and map their intended career paths
Skill audit has been completed
Undertake a skills/ qualification audit and assessment of all municipal employees.
HR Manager Skills audit completed
on-going on-going on-going on-going
Capacity building options available but not structured to target women
specifically
Devise and implement a range of capacity-building options, including management development programmes for women employees and councillors.
HR Manager, Mayor, Speaker’s office, MM,
SALGA
Management development
programmes for women in place
by 2014
Limited mentoring programmes in
place
Mentoring new councillors and employees.
Dplg; Premier’s office, SALGA, LGSETA, HR
Mentoring programme in place
by 2014
Learnerships available are not gender specific
Increase the number of learnerships available for women.
Dplg; Premier’s office, SALGA, LGSETA, HR
Learnerships aimed at women are in place
July 2013 Work environment
To adapt and implement a sexual harassment policy in the municipality.
Sexual harassment policy
is in place.
Adapt and implement a sexual harassment policy.
HR Sexual harassment
policy is adopted and in place
review review review review

- 52 –
___________________________________________________________________________
Final Integrated Development Plan 2012/13
GENDER (adopted from the Gender Action Plan for Western Cape Municipalities)
OBJECTIVES BASELINE ACTIVITIES RESPONSIBILITY & STAKEHOLDERS INDICATORS
WHEN
2012/13 2013/14 2014/15 2015/16 To ensure the safety of women who work late at night on and off premises.
No policy or guidelines in
place
Take measures to ensure the safety of women who have to work late
HR; managers, HOD's
Strategies and protocol in place to ensure the safety of women who
have to work late
March 2013 on-going on-going
Social development
To educate women in poor communities on
social grants and how to access to
these.
Not all women in poor communities know how to, or where to apply
for a social grant
Work in partnership with Provincial dpt, SASSA and women’s groups to increase awareness of social grants, distribution of the booklets x 1000 quarterly.
Social Department; Dep of Soc Dev, SASSA
4000 booklets distributed yearly during awareness
campaigns
1st campaign
March 2012 repeat repeat
Education programmes on Social Grants to identified areas (WBS Data)
Social Department; Dep of Soc Dev, SASSA
Education programmes hosted annually in every
service delivery area 1st event
November 2012 repeat repeat repeat
To challenge the belief that childcare is the sole responsibility of women and to educate men on parenting responsibilities.
Women carry the main burden of
parenting responsibilities
Conduct annual awareness programmes on parenting responsibilities for men and women.
Social Department, DSD, ECD Forum,
NGO's
Awareness programmes hosted annually in every
service delivery area. 1st event
November 2012 repeat repeat repeat

- 53 –
___________________________________________________________________________
Final Integrated Development Plan 2012/13
GENDER (adopted from the Gender Action Plan for Western Cape Municipalities)
OBJECTIVES BASELINE ACTIVITIES RESPONSIBILITY & STAKEHOLDERS INDICATORS
WHEN
2012/13 2013/14 2014/15 2015/16 Poverty reduction
Women are more severely affected by poverty particularly since poverty does no
Poverty areas are currently too
broadly approached
Conduct socio-economic household survey to identify specific poverty pockets
IDP, Social Dev Unit, Stats SA
Socio-economic household analysis
complete and poverty pockets identified.
May 2012
Monitor and
Evaluate
Monitor and
Evaluate
Monitor and
Evaluate Communities
have access to social grants but events are not
streamlined and lack protocol / coordination
Facilitate improved access to social grants by developing a protocol
Social Dev Unit, SASSA, Social Development Protocol in place
February
2013 maintain maintain
Poor households face food
scarcity and poor nutrition
Facilitate and support food security and nutrition programmes.
LED, Social Dev Unit, Department of
Agriculture, Department of Rural
Development
1 Food security and nutrition programme
implemented annually
March 2013 repeat repeat
2 GENDER-BASED VIOLENCE Prevention
Public education
Increase public safety in areas where gender based violence is high.
Some informal areas provide little safety to
prevent gender based violence.
Improve street lighting in public places and develop green routes
national, DPLG, Protection Services, Community Services, Social Department; FBO'S, NGO,S
Reduction in public gender based violence
July 2013

- 54 –
___________________________________________________________________________
Final Integrated Development Plan 2012/13
GENDER (adopted from the Gender Action Plan for Western Cape Municipalities)
OBJECTIVES BASELINE ACTIVITIES RESPONSIBILITY & STAKEHOLDERS INDICATORS
WHEN
2012/13 2013/14 2014/15 2015/16
To mount high profile campaigns during the Sixteen Days of Activism
Mayor and councillors are involved with the 16 Days campaign
Broad based 16 day campaigns with high profile participation
National dept provincial Local govt, NGOs, FBOs CBOs, SALGA
Broad based high impact 16 Days campaign successfully implemented more than a 1000 people reached annually
Dec Dec Dec Dec
OBJECTIVES BASELINE ACTIVITIES RESPONSIBILITY & STAKEHOLDERS INDICATORS
WHEN
2012/13 2013/14 2014/15 2015/16
INSTITUTIONAL ARRANGEMENTS GENERAL
Support to organisations and groups delivering programmes and projects to vulnerable groups
Facilitate the accessibilty of municipal facilities for programmes and projects aimed at vulnerable groups.
Social Department Department of Social Development Department of Health NGO's
Organisations and groups utilise municipal facilities for the provision of programmes and projects aimed at vulnerable groups ongoing ongoing ongoing ongoing

- 55 –
___________________________________________________________________________
Final Integrated Development Plan 2012/13
OBJECTIVES BASELINE ACTIVITIES RESPONSIBILITY & STAKEHOLDERS INDICATORS
WHEN
2012/13 2013/14 2014/15 2015/16
Financial GRANTS to organisations and groups for development orientated programmes and projects
Provide GRANTS to organisations and groups for development orientated programmes and projects
Communication Department MM Council
Organisations and groups receive Grant-in-Aid for development orientated programmes and projects ongoing ongoing ongoing ongoing
Networking, cooperation and coordination with respect to projects and programmes aimed at vulnerable groups
No comprehensive data base of services and service providers that focus on vulnerable groups
Establish a data base of the various service providers in Overstrand and the projects and programmes that they run
Social Department Department of Social Development Department of Health NGO's; NPO's; CBO's; Welfare Organisations
Data base of all services and service providers that focus on vulnerable groups
by February 2013 maintain maintain
The Social Department actively engage with service providers
The Social Department actively engage with service providers
Social Department Department of Social Development Department of Health NGO's; NPO's; CBO's; Welfare Organisations
The Social Department participate in forums, meetings and activities of service providers maintain maintain maintain maintain

- 56 –
___________________________________________________________________________
Final Integrated Development Plan 2012/13
OBJECTIVES BASELINE ACTIVITIES RESPONSIBILITY & STAKEHOLDERS INDICATORS
WHEN
2012/13 2013/14 2014/15 2015/16
The Social Department have the capacity to advise and guide organisations in the development of project and funding proposals
Provide advise and guidance to organisations and individuals on the development of project and funding proposals
Social Department Department of Social Development Department of Health NGO's; NPO's; CBO's; Welfare Organisations
Advice and guidance is provided to organisations on the development of project and funding prposals ongoing ongoing ongoing ongoing
Capacity building and information
sharing
Funding and project proposals from individuals and organisations often lack the required rigidity to qualify for funding
Annual workshop aimed at educating organisations and individuals on project design and proposal writing
Social Department Department of Social Development Department of Health NGO's; NPO's; CBO's; Welfare Organisations
Annual workshop attended by organisations and individuals that provide services and programmes to vulnerable groups From 2013 repeat repeat

- 57 –
___________________________________________________________________________
Final Integrated Development Plan 2012/13
OBJECTIVES BASELINE ACTIVITIES RESPONSIBILITY & STAKEHOLDERS INDICATORS
WHEN
2012/13 2013/14 2014/15 2015/16
Social Development information is not widely available from a central location.
Establish a Social Development Website on the Municipal Web Page to inform and update role players, on policies, guidelines and programmes and projects of the municipality and other government and non-government organisations
Social Department Department of Social Development Department of Health NGO's; NPO's; CBO's; Welfare Organisations
Social Development Website is established
November 2012 maintain maintain maintain
HIV/AIDS ORGANISATIONAL DEVELOPMENT
Institutional Capacity
Develop and maintain HIV/AIDS workplace policy
HIV/AIDS workplace policy in place
HR; LLF; MM; Council; Strategic Management; DoH; DoL
HIV/AIDS Workplace policy adopted by council
review and update
review and update
review and update review and update
FOOD SECURITY
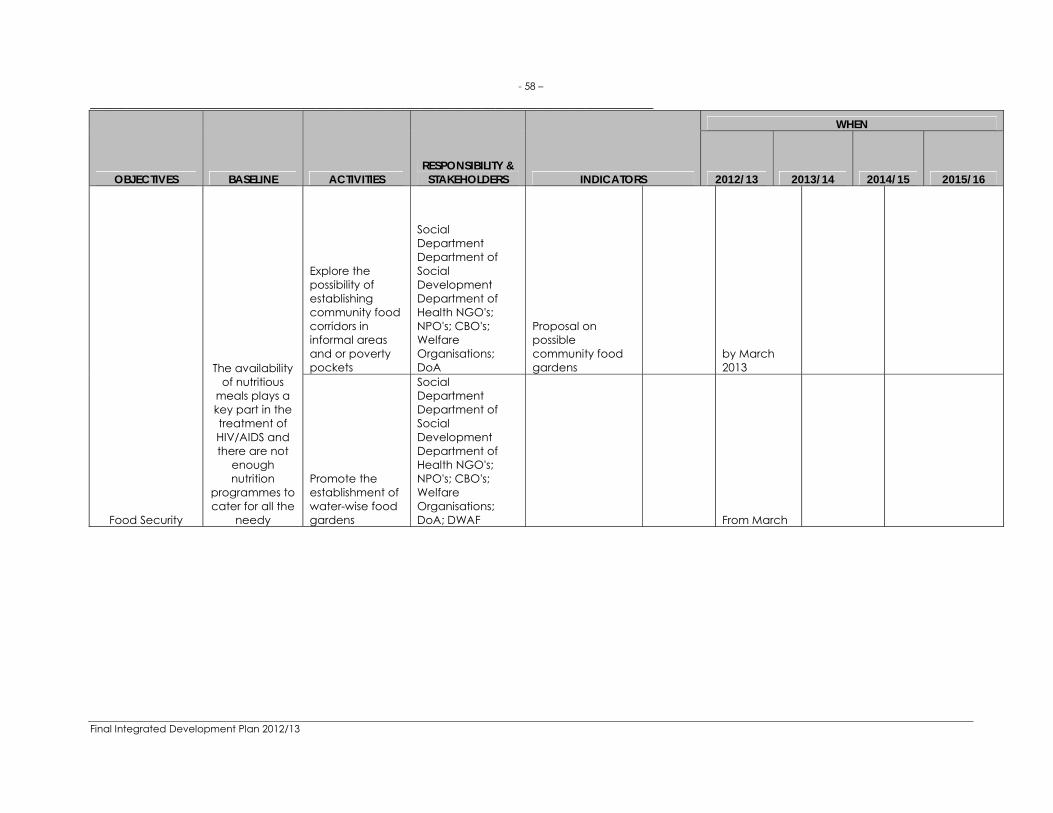
- 58 –
___________________________________________________________________________
Final Integrated Development Plan 2012/13
OBJECTIVES BASELINE ACTIVITIES RESPONSIBILITY & STAKEHOLDERS INDICATORS
WHEN
2012/13 2013/14 2014/15 2015/16
Food Security
The availability of nutritious
meals plays a key part in the treatment of HIV/AIDS and there are not
enough nutrition
programmes to cater for all the
needy
Explore the possibility of establishing community food corridors in informal areas and or poverty pockets
Social Department Department of Social Development Department of Health NGO's; NPO's; CBO's; Welfare Organisations; DoA
Proposal on possible community food gardens
by March 2013
Promote the establishment of water-wise food gardens
Social Department Department of Social Development Department of Health NGO's; NPO's; CBO's; Welfare Organisations; DoA; DWAF From March
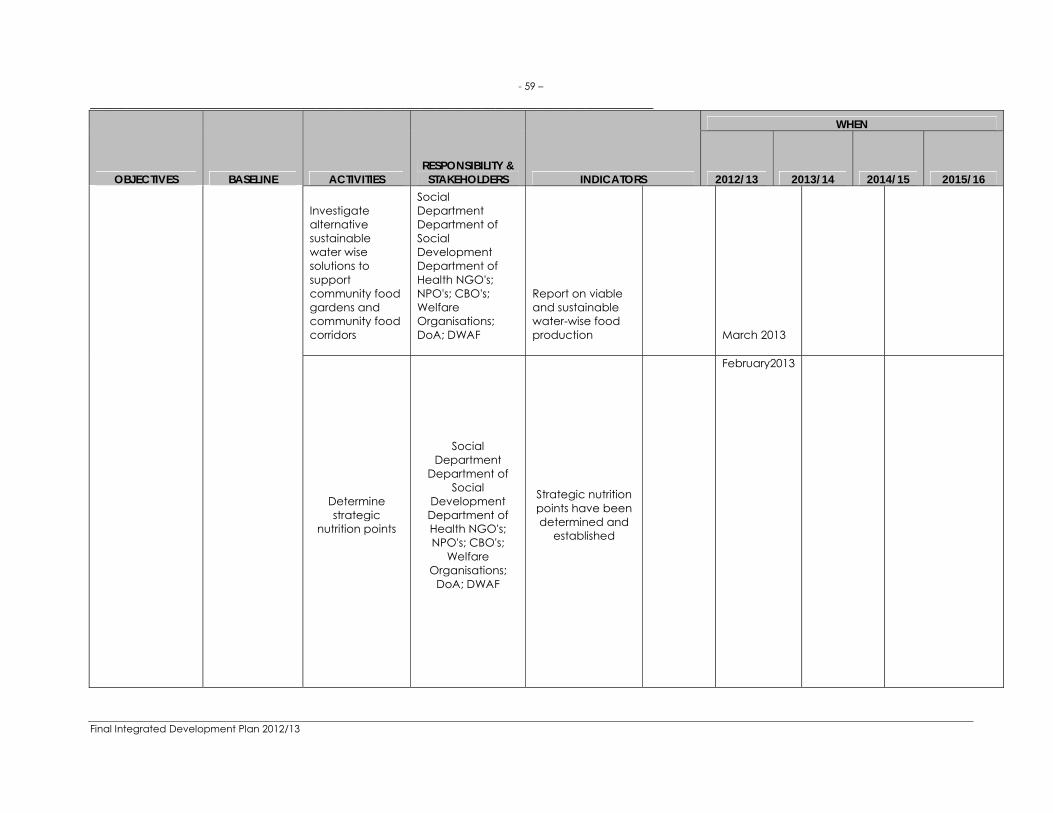
- 59 –
___________________________________________________________________________
Final Integrated Development Plan 2012/13
OBJECTIVES BASELINE ACTIVITIES RESPONSIBILITY & STAKEHOLDERS INDICATORS
WHEN
2012/13 2013/14 2014/15 2015/16
Investigate alternative sustainable water wise solutions to support community food gardens and community food corridors
Social Department Department of Social Development Department of Health NGO's; NPO's; CBO's; Welfare Organisations; DoA; DWAF
Report on viable and sustainable water-wise food production
March 2013
Determine strategic
nutrition points
Social Department
Department of Social
Development Department of Health NGO's; NPO's; CBO's;
Welfare Organisations;
DoA; DWAF
Strategic nutrition points have been determined and
established
February2013
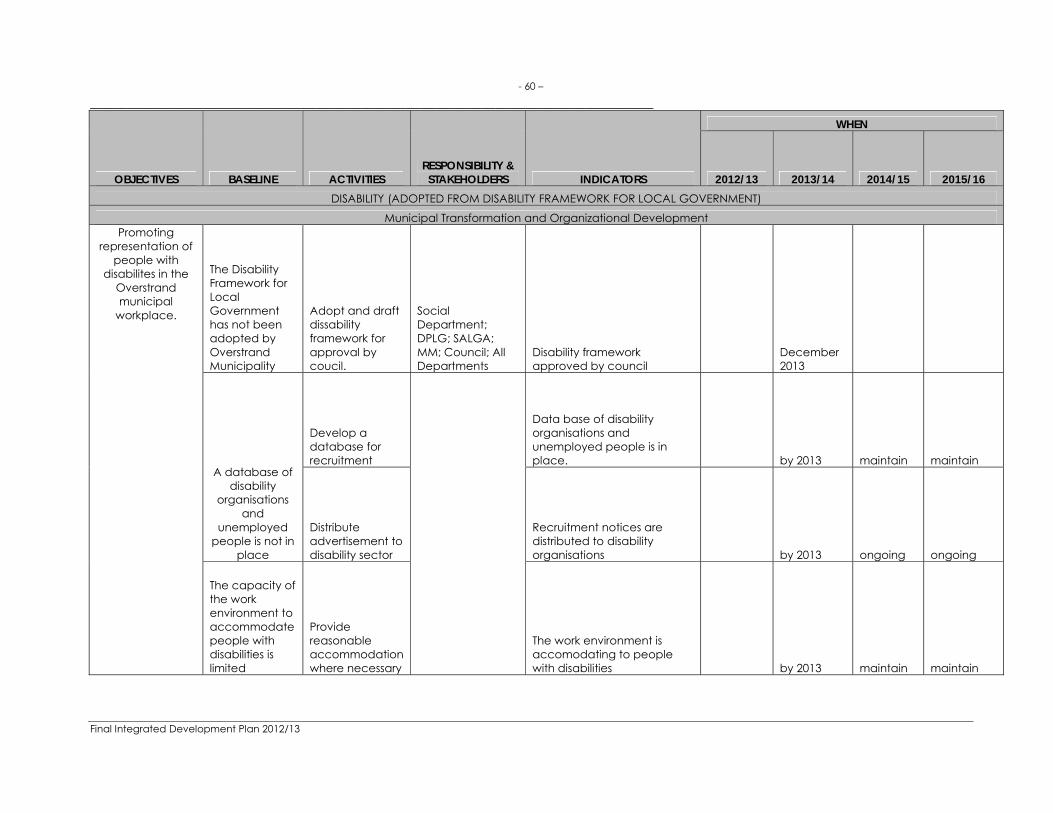
- 60 –
___________________________________________________________________________
Final Integrated Development Plan 2012/13
OBJECTIVES BASELINE ACTIVITIES RESPONSIBILITY & STAKEHOLDERS INDICATORS
WHEN
2012/13 2013/14 2014/15 2015/16 DISABILITY (ADOPTED FROM DISABILITY FRAMEWORK FOR LOCAL GOVERNMENT)
Municipal Transformation and Organizational Development Promoting
representation of people with
disabilites in the Overstrand municipal
workplace.
The Disability Framework for Local Government has not been adopted by Overstrand Municipality
Adopt and draft dissability framework for approval by coucil.
Social Department; DPLG; SALGA; MM; Council; All Departments
Disability framework approved by council
December 2013
A database of disability
organisations and
unemployed people is not in
place
Develop a database for recruitment
Data base of disability organisations and unemployed people is in place. by 2013 maintain maintain
Distribute advertisement to disability sector
Recruitment notices are distributed to disability organisations by 2013 ongoing ongoing
The capacity of the work environment to accommodate people with disabilities is limited
Provide reasonable accommodation where necessary
The work environment is accomodating to people with disabilities by 2013 maintain maintain

- 61 –
___________________________________________________________________________
Final Integrated Development Plan 2012/13
OBJECTIVES BASELINE ACTIVITIES RESPONSIBILITY & STAKEHOLDERS INDICATORS
WHEN
2012/13 2013/14 2014/15 2015/16
Building regulations on accessibility is not envorced consistently
Enforce builing regulations on accessibility
All municipal buildings comply with building regulations on disability by 2014 maintain maintain
Promoting awareness on disability issues
Awareness campaigns on disability does not happen every year.
Undertake awareness-raising campaign / programmes during disability month on disability and disability rights
Social Department; DoSD; ODM; NGO's; NPO's
Relebant disablity-friendly materials and communication tools developed and utilized during disability month annually
December 2012
December 2013
December 2014
December 2015
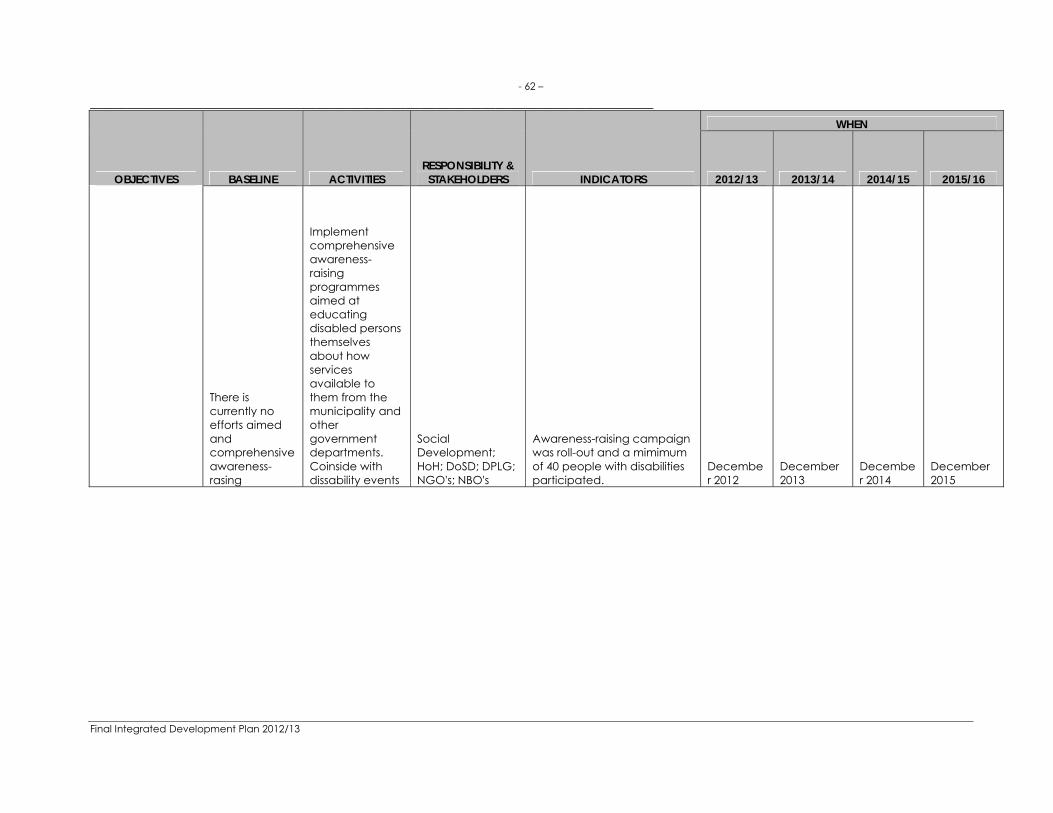
- 62 –
___________________________________________________________________________
Final Integrated Development Plan 2012/13
OBJECTIVES BASELINE ACTIVITIES RESPONSIBILITY & STAKEHOLDERS INDICATORS
WHEN
2012/13 2013/14 2014/15 2015/16
There is currently no efforts aimed and comprehensive awareness-rasing
Implement comprehensive awareness-raising programmes aimed at educating disabled persons themselves about how services available to them from the municipality and other government departments. Coinside with dissability events
Social Development; HoH; DoSD; DPLG; NGO's; NBO's
Awareness-raising campaign was roll-out and a mimimum of 40 people with disabilities participated.
December 2012
December 2013
December 2014
December 2015
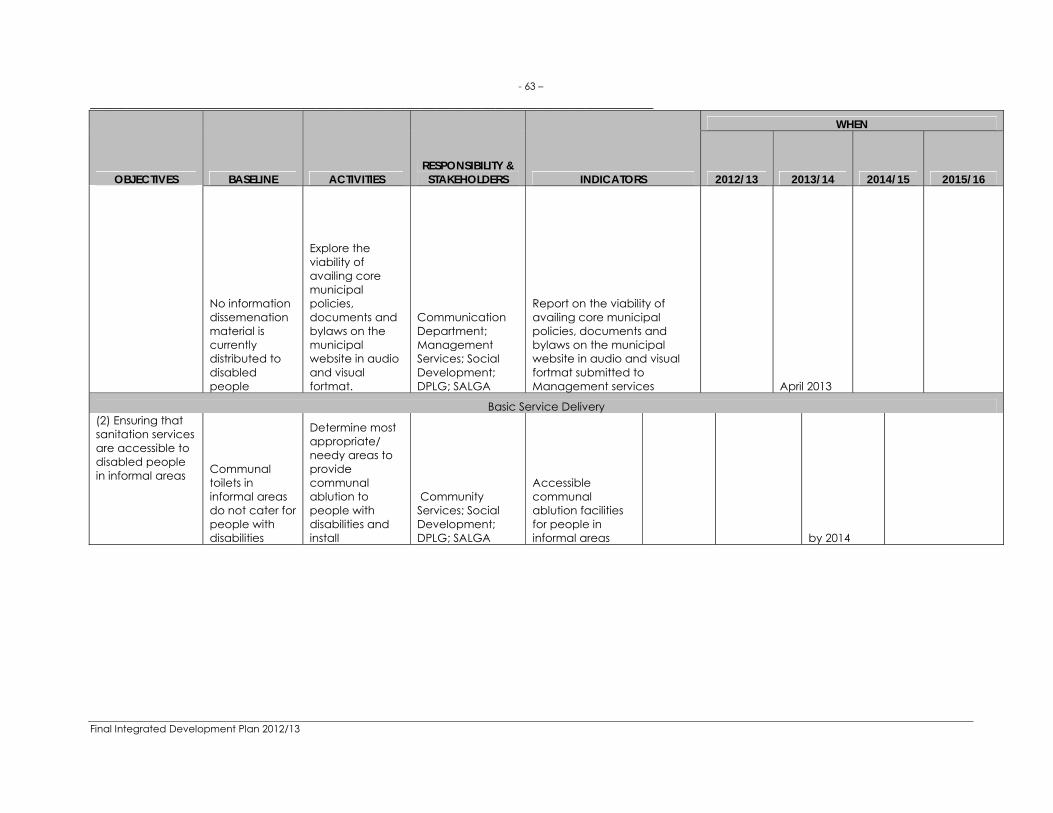
- 63 –
___________________________________________________________________________
Final Integrated Development Plan 2012/13
OBJECTIVES BASELINE ACTIVITIES RESPONSIBILITY & STAKEHOLDERS INDICATORS
WHEN
2012/13 2013/14 2014/15 2015/16
No information dissemenation material is currently distributed to disabled people
Explore the viability of availing core municipal policies, documents and bylaws on the municipal website in audio and visual fortmat.
Communication Department; Management Services; Social Development; DPLG; SALGA
Report on the viability of availing core municipal policies, documents and bylaws on the municipal website in audio and visual fortmat submitted to Management services April 2013
Basic Service Delivery (2) Ensuring that sanitation services are accessible to disabled people in informal areas Communal
toilets in informal areas do not cater for people with disabilities
Determine most appropriate/ needy areas to provide communal ablution to people with disabilities and install
Community Services; Social Development; DPLG; SALGA
Accessible communal ablution facilities for people in informal areas by 2014

- 64 –
___________________________________________________________________________
Final Integrated Development Plan 2012/13
OBJECTIVES BASELINE ACTIVITIES RESPONSIBILITY & STAKEHOLDERS INDICATORS
WHEN
2012/13 2013/14 2014/15 2015/16
Recreational opportunities for disabled people are severely limited
Promote access to recreation and sports for people with disabilities
Community Services; Social Development; DPLG; SALGA; DoSD; Sport & Recreation Officer; Department of Cultural Affairs and Sport; NGO's; NPO's; CBO's
Recreational opportunities available for people with dissabilities in at least two service areas. August 2013
The Youth
- In collaboration with our LED Department and DoSD we hope
to create employment opportunities for the youth in the social sector through the Extended Public Works Programme.
- Youth forums are an important participatory platform for the youth. Child Welfare South Africa Hermanus is planning a youth group for the Zwelihle area. More initiatives of this kind are required and we encourage the youth to create platforms of this kind were they can participate in the developmental processes of local government.
Junior Town Council The development of leadership amongst our youth is of great importance. A special effort is made to engage the school-going youth through the Junior Council, which is fully representative of all Overstrand Communities – demographically as well as geographically. Not only are opportunities created to inform the junior councillors about the Municipality, but they are also granted an opportunity to familiarize them selves with the idea of budgets and budget spending. The junior town councillors from the different wards identify projects in their areas and they then do all the planning with regard to budget for the implementation of that specific project in their ward. The Enlighten Education Trust, an Overstrand based non-governmental organization, is facilitating the Junior Council as an educational project on behalf of the Overstrand Municipality. These learners are also exposed to leadership camps where leadership qualities are strengthened.

65
_______________________________________________________________________ KPA OS 3(a) Effective financial management Sound financial management practices are essential to the long-term sustainability of municipalities. They underpin the process of democratic accountability. Weak or opaque financial management results in the misdirection of resources and increases the risk of corruption. The key objective of the Municipal Finance Management Act (2003) is to modernise municipal financial management in South Africa so as to lay a sound financial base for the sustainable delivery of services. Municipal financial management involves managing a range of interrelated components: planning and budgeting, revenue, cash and expenditure management, procurement, asset management, reporting and oversight. Each component contributes to ensuring that expenditure is developmental, effective and efficient and that municipalities can be held accountable. The management of key financial and governance areas is achieved by focusing on: • reducing the levels of outstanding debt owed to the Municipality,
to assist with service delivery spending and maintaining a healthy cash flow;
• maintaining an unqualified audit for the Municipality by resolving
audit findings and improving financial governance; and • maintaining a good credit rating to ensure favourable lending
rates and terms. Spending budgets to maximise delivery The Municipality’s annual budget comprises an operating budget
and a capital budget. The operating budget funds employee salaries, operating costs, purchases and assistance for the poor, such as free basic water and sanitation. The capital budget is set aside for spending on infrastructure and services, such as roads, water and electricity as well as the many other utilities and services that Overstrand needs in order to function, grow and offer opportunities to its residents. The entire budget amount per annum is based on the income that the Municipality expects to derive from rates, service charges, and grants and subsidies. During the 2010/11 financial year, the Municipality managed to spend 94% of its capital budget and 98% of its operating budget. 102% of revenue was collected as a percentage of the total billed amount. Financial Management Reforms In order to achieve our objectives, the Municipality has implemented the following financial management reforms to ensure that resources are used efficiently: • Efficient costing of services and projects by identifying and
managing the cost drivers. • Active use of forecasts and projections to manage cash flow
efficiently. • Active monitoring of income and expenditure against pre-
determined budget targets/projections. • Set financial benchmarks and monitor performance against
them. • Development of a feasible capital funding strategy. • Development of a feasible cash and investment strategy.

- 66 –
___________________________________________________________________________
Final Integrated Development Plan 2012/13
Exploring additional funding sources. KPA OS 4(a) Effective co-operative government within the Constitutional mandate The Constitution of the Republic of South Africa, 1996 provides that the South African government is constituted as a national, provincial and local sphere of government which are distinctive, interdependent and interrelated. All spheres of government are constitutionally obligated to assist and support one another. Not only is co-operation between local government and other spheres of government and local government between themselves of importance, the Systems Act also emphasizes the importance of organised local government. The Municipality thus will take part in, but not limited to, intergovernmental fora such as the Premier’s Co-ordinating Forum, the MinMay, the MinMay Tech, the District Co-ordinating Forum (DCF), the DCF Tech, the Municipal Managers’ Forum, the Chief Financial Officers’ Forum and, on organised local government level, SALGA Western Cape and its respective working groups. KPA OS 4(b) Effective communication and community development The Municipality publishes a monthly newsletter, the Overstrand Bulletin, to inform residents about important municipal matters, including LED. It is posted with the municipal accounts in the language of the account holder’s choice. Residents not receiving accounts can read these newsletters in a posterized format on public notice boards and strategically placed community information boards The municipality has its own website www.overstrand.gov.za on which news, general information, calls for tenders and quotes, and a lot more are placed.
In its drive to educate its community even at school-going level, the Municipality presents annually a week long exhibition. During the Municipal Showcase held usually in the first week of October achievements are highlighted and a broad overview is given of all municipal activities. Media liaison is an ongoing activity and full use is made of the six community papers in the area, as well as the regional papers to keep the people of Overstrand up to date with the latest developments. Communication in the Overstrand requires specialized skills because of the composition of the population. Although 60 percent or more of the residents are Afrikaans speaking, there is a significant portion of the inhabitants that can only converse in English. A third of the population is Xhosa-speaking. Another factor that must be kept in mind is the literacy level, with about 14 percent of the population regarded as illiterate. Our communication strategies are:
A multi-facetted communication approach that uses all available channels and different ways of communicating - not only information-giving but also motivational in nature.
Developing existing and new communication channels to a sustainable and optimal level, e.g. community information boards, advertising, corporate branding and signage, etc.
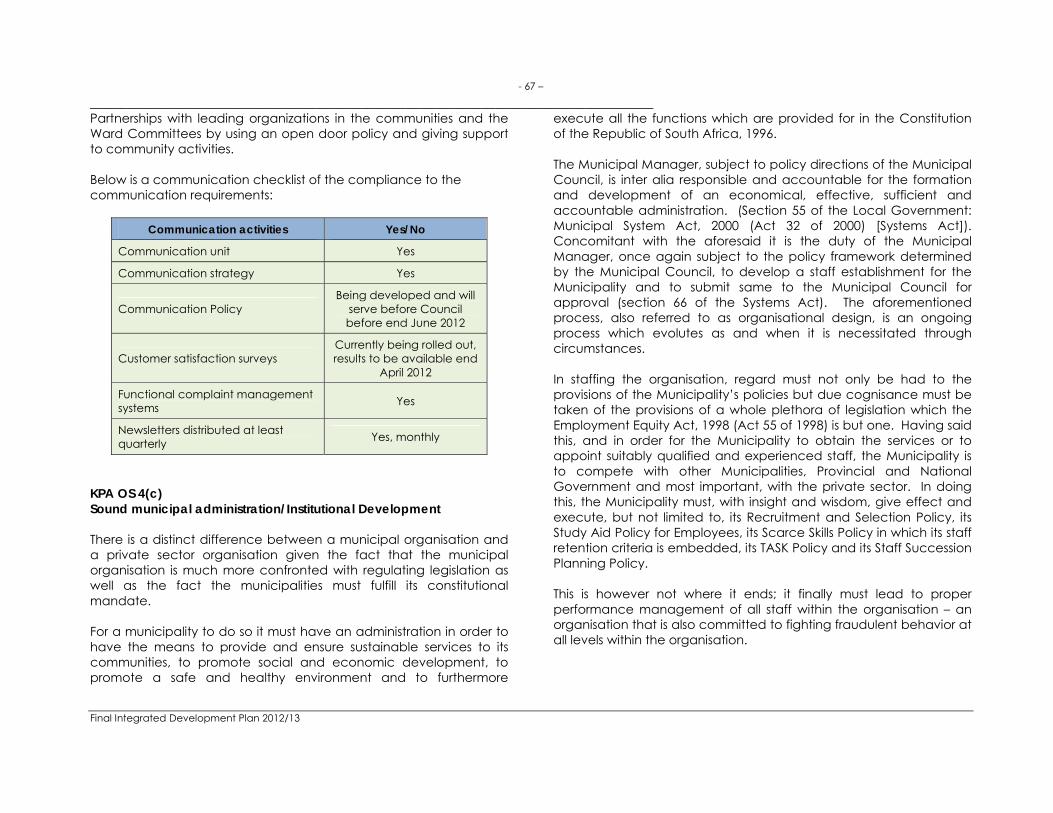
- 67 –
___________________________________________________________________________
Final Integrated Development Plan 2012/13
Partnerships with leading organizations in the communities and the Ward Committees by using an open door policy and giving support to community activities. Below is a communication checklist of the compliance to the communication requirements:
Communication activities Yes/No
Communication unit Yes
Communication strategy Yes
Communication Policy Being developed and will
serve before Council before end June 2012
Customer satisfaction surveys Currently being rolled out, results to be available end
April 2012
Functional complaint management systems Yes
Newsletters distributed at least quarterly Yes, monthly
KPA OS 4(c) Sound municipal administration/Institutional Development There is a distinct difference between a municipal organisation and a private sector organisation given the fact that the municipal organisation is much more confronted with regulating legislation as well as the fact the municipalities must fulfill its constitutional mandate. For a municipality to do so it must have an administration in order to have the means to provide and ensure sustainable services to its communities, to promote social and economic development, to promote a safe and healthy environment and to furthermore
execute all the functions which are provided for in the Constitution of the Republic of South Africa, 1996. The Municipal Manager, subject to policy directions of the Municipal Council, is inter alia responsible and accountable for the formation and development of an economical, effective, sufficient and accountable administration. (Section 55 of the Local Government: Municipal System Act, 2000 (Act 32 of 2000) [Systems Act]). Concomitant with the aforesaid it is the duty of the Municipal Manager, once again subject to the policy framework determined by the Municipal Council, to develop a staff establishment for the Municipality and to submit same to the Municipal Council for approval (section 66 of the Systems Act). The aforementioned process, also referred to as organisational design, is an ongoing process which evolutes as and when it is necessitated through circumstances. In staffing the organisation, regard must not only be had to the provisions of the Municipality’s policies but due cognisance must be taken of the provisions of a whole plethora of legislation which the Employment Equity Act, 1998 (Act 55 of 1998) is but one. Having said this, and in order for the Municipality to obtain the services or to appoint suitably qualified and experienced staff, the Municipality is to compete with other Municipalities, Provincial and National Government and most important, with the private sector. In doing this, the Municipality must, with insight and wisdom, give effect and execute, but not limited to, its Recruitment and Selection Policy, its Study Aid Policy for Employees, its Scarce Skills Policy in which its staff retention criteria is embedded, its TASK Policy and its Staff Succession Planning Policy. This is however not where it ends; it finally must lead to proper performance management of all staff within the organisation – an organisation that is also committed to fighting fraudulent behavior at all levels within the organisation.
- 68 –
___________________________________________________________________________
Final Integrated Development Plan 2012/13
KPA OS 5(a)
Effective public safety and disaster management LAW ENFORCEMENT IN GENERAL The purpose of law and law enforcement is to maintain peace and order in the community and it is only by effectively and justly enforcing the laws and administering justice in a community that peace and order can be maintained. In the modern society in which we live, the duties and responsibilities of SAPS are so numerous that it would in reality be virtually impossible for the members of the SAPS to also study and enforce the provisions contained in the by-laws. Local authorities must therefore appoint officers of its own and trian them so that they may take their place within structure. This has given rise to the posts of building inspectors, health inspectors, sewerage inspectors to name but a few. It is self-evident from the words “law enforcement” that law enforcement is the enforcement of the law. From this it follows that there have to be laws or a legal system, because without laws or a legal system the law can not be enforced. In a modern civilisation, enforcement of the law means the organised enforcement of a rule of law by certain designated officers in a certain prescribed way in certain conditions. The well-known adage “You can not take the law into your own hands: exemplifies the way in which orderly law enforcement is firmly established in our modern society. A Crime Prevention Strategy and a Fire Services Management Plan are currently in place. An annual Safety Plan has been develop to incorporate traffic, law enforcement and fire and was submitted to Department of Community Safety.
MUNICIPAL POUND The Overstrand Municipality is very proud to announce that the Minister of Transport and Public Works designated a portion of Erf 3988 situated at Onrus, Hermanus as a depot for the impoundment of motor vehicles in terms of section 87(4) of the National Land Transport Act 2009 (Act 5 of 2009). The establishment of a registered and promulgated pound will give the municipality more power in terms of the National Transportation Act, to store vehicles used for the illegal transportation of passengers for reward. MUNICIPAL COURT In terms of Section 165 (3) of the Constitution, the judicial authority is vested in the courts. It is evident that the local magistrate court is not coping with case volumes and the Municipality is being given secondary attention. There is however a dire need for a court dedicated to municipal affairs, such as by-law transgressions, traffic offences, transgressing of building- and town planning scheme regulations. The advantages of such a municipal court are: . Easing the burden on the magistrate courts . Prosecution services are faster . Enhanced revenue collection . Specialist knowledge allows for more successful prosecutions . There is better communications between the by-law
prosecutors and enforcers . By-law enforcement can be supported . The court is user friendly . It keeps ordinary people away from hardened criminals The court will restore trust in the criminal justice system and largely contribute to the realisation of the fundamental rights contained in the Constitution. Action against offenders will promote a positive

- 69 –
___________________________________________________________________________
Final Integrated Development Plan 2012/13
and safe environment. The opportunity to take speedy action against non-payment of municipal fines will encourage voluntary co-operation and create a culture of payment. The Municipality has entered into a partnership with the Department of Justice for the roll-out of such a court. An application for the court was submitted to the Department and it is envisaged that a Memorandum of Understanding will be entered in towards the end of June 2012. Fire fighting and Disaster Management Although the fire services utilized by the Overstrand is largely made up of Reservists with a small management core of full-time personnel we strive to expand and upgrade the services as required by risks identification and community needs. The availability of an aerial fire-fighting unit during the summer also improved our capabilities. Ongoing training in first aid, fire fighting and rescue methods are given to staff in order to improve their skill and safety awareness levels. The existing integrated risk profile and fire management plan is in process of being updated in conjunction with other role players. The following aspects of the services are maintained and improved within the budget allocations for these services. • Emergency services delivery • Fire-Prevention and life-safety programs • Supervision, management and training of staff • Community relations • Inter government relations • Administrative structures • Safety and Health program A service delivery agreement for fire brigade services exists between the Municipality and the District Municipality.
Traffic Services The main responsibility of the discipline is to promote effective road traffic management legislation, ensure the safe flow of traffic in the road traffic environment and to ensure compliance at our vehicle testing stations, driver’s licence testing centre, motor vehicle registration and licensing centre and of abnormal loads and vehicles. This discipline also focuses on the exposure of road users to traffic educational programmes, projects and products through awareness involving educationalists, parents and learners. A multi disciplinary approach is adopted whereby different role-players i.e Provincial Traffic, SAPS and the Justice Department work together as a team in a holistic and integrated manner with the common aim to effectively promote orderly traffic flows and traffic safety. The approach also focuses on a number of critical issues that, if successfully addressed, will have a positive impact on road traffic safety in Overstrand. KPA OS 5(b)
Effective Environmental Management (EMS) The function of the Environmental Management Services Section is to promote a sustainable balance between environmental, social and economic development in accordance with Parts B of Schedule 4 and 5 of the Constitution. In essence, this function can be divided into three main tasks as follows: Effective management of Municipal Nature Reserves and
Municipal Open Spaces. Progressive development and implementation of a corporate
Environmental Management System to reduce the environmental footprint of the Municipality.

- 70 –
___________________________________________________________________________
Final Integrated Development Plan 2012/13
Evaluate all developments (development proposals, town planning applications, building plans and infrastructure projects) for environmental sustainability.
In addition, this section is involved with the following projects: Working for Water
The Working for Water Programme is initiated by the Department of Environmental Affairs (DEA) under the sub-directorate called Natural Resource Management Programme (NRM) which mission it is to restore and maintain natural resources and ecosystem services to optimize conservation and natural resource management. Through this the Programme addresses poverty relief and promotes economic empowerment and transformation within a public works framework. The Overstrand Municipality acts as Implementing Agent for the Programme in order to plan, manage, control and implement the three WfW projects on behalf of the Department. The three areas include Kleinmond; Hermanus/Onrus and Kleinriver. The 2012/2013 budget for the Programme is R 6.2 mil. The Programme aims to ensure a total of 20 087 p/days within the financial year, clearing a total of 3426 ha’s of alien plant infested land.
Working for the Coast
The EPWP is one of government’s short-to-medium term programmes aimed at alleviating and reducing unemployment. This aim can only be achieved through the provision of work opportunities coupled with training. Opportunities for implementing the EPWP have been identified in the infrastructure, environmental, social and economic sector. In the environmental sector the emphasis is on creating additional work opportunities through the introduction of labour-intensive practices through the Working on the Coast initiative. The Department of Environmental Affairs has therefore through their commitment to social responsibility projects, committed funding of
R11.2 million phased in during the 2011/12 – 2013/14 MTEF cycle for the Overstrand Municipality.
Estuary Management
Estuaries are defined for their biodiversity and productivity associated with a range of environmental and socio-economic benefits. Challenges to estuarine management include both the need to halt on-going degradation and to rehabilitate where feasible, with the overall goal of achieving ecologically sustainable use of estuarine resources. Management of estuaries is a dynamic process that requires careful planning and implementation of management decisions through development and implementation of Estuary Management Plans. The Overstrand Municipality has employed an Estuary Management Coordinator, funded by the Table Mountain Fund to coordinate stakeholder engagement in order to development Estuary Management Plans for three identified estuaries within the Overstrand Municipal area. The Project is funded for three years and will end by April 2013. Stony Point
The Stony Point Peninsula in Betty’s Bay is an international tourist destination. The African Penguin colony, situated on an untamed coastline adjacent to the Betty’s Bay Marine Protected Area, attracts in excess of 90 000 national and international tourists per annum. Overstrand Municipality initiated a project to upgrade tourism infrastructure and to protect the African Penguins under the sponsorship of the National Department of Environmental Affairs and Tourism in 1999. The development programme, administered by Casidra (Pty) Ltd, will enable the Municipality to provide the public with facilities in the form of a Coffee shop, Eco-centre, ablutions, upgraded parking areas and access to penguin colony and coastal trails by means of this important coastal access point.

- 71 –
___________________________________________________________________________
Final Integrated Development Plan 2012/13
The project will furthermore provide socio-economic benefits for the Mooiuitsig Community Trust, who will receive development training, employment opportunities and the opportunity to manage the Coffee Shop and Eco-centre facility. The Environmental Authorization for this project requires the construction of an upgraded reception area at the entrance to the seabird colony. The building will be constructed as a capital project within the Directorate Infrastructure & Planning budget within the 2012/2013 financial year. The development capital for this project will be sourced from entrance fees that are charged at the colony.
CHAPTER 5
FUNCTIONAL AREAS OF MUNICIPAL ACTIVITIES The following is an analysis of the respective functional areas of the Municipality in relation to the main priorities, constraints faced and functional strategies. The functional areas are grouped under the relevant strategic priority as set out in the vision and mission statement. It has been formulated in this manner to demonstrate the linkage between the strategic priorities and the relevant functional area, which underpins that priority. 5.1 Linkage of strategic priorities/objectives with functional areas/services with a special focus on Service Delivery and Infrastructure Development 5.1.1 PROVISION OF DEMOCRATIC AND ACCOUNTABLE
GOVERNANCE
Strategic Planning Human Resources Communications Gender Equity Internal Audit Legal services Information Communications and Technology Area Management Law Enforcement, Traffic, Fire and Disaster Management Council Support Services

- 72 –
___________________________________________________________________________
Final Integrated Development Plan 2012/13
Maintenance of municipal services (roads, stormwater, water, sanitation, parks, sports grounds and beaches)
Housing and Community Development Solid Waste Fleet Management Electricity distribution and Street lightning Economic Development & Tourism Town Planning/Spatial Development/Property Administration Building Services Infrastructure & Planning Elections Valuations
5.1.2 PROVISION AND MAINTENANCE OF MUNICIPAL SERVICES
Human Resources Communications Information Communications and Technology Area Management Council Support Services Maintenance of municipal services (roads,
stormwater, water, sanitation, parks, sports grounds and beaches)
Solid Waste Fleet Management Electricity distribution and Street lightning Town Planning/Spatial Development/Property
Administration Infrastructure & Planning Corporate Projects
.1.3 THE ENCOURAGEMENT OF STRUCTURED COMMUNITY PARTICIPATION IN THE MATTERS OF THE MUNICIPALITY
Communications Area Management
5.1.4 CREATION AND MAINTENANCE OF A SAFE AND HEALTHY ENVIRONMENT
Human Resources Communications Area Management Law Enforcement, Traffic, Fire and Disaster Management Maintenance of municipal services (roads,
stormwater, water, sanitation, parks, sports grounds and beaches)
Solid Waste Town Planning/Spatial Development/Property
Administration Building Services Infrastructure & Planning Environmental Conservation
5.1.5 PROMOTION OF TOURISM, ECONOMIC AND SOCIAL DEVELOPMENT
Communications Area Management Housing and Community Development Economic Development & Tourism Town Planning/Spatial Development/Property
Administration Building Services

- 73 –
___________________________________________________________________________
Final Integrated Development Plan 2012/13
CHAPTER 6
LOCAL ECONOMIC DEVELOPMENT
STRATEGIC DIRECTION FOR THE NEXT FIVE YEARS 2012 – 2016
1. INTRODUCTION The Overstrand economy has improved over the past last years and has experienced significant growth within specific sectors which was in line with job creation. Tourism growth indicated positive signs with growth in the number of visitors and attendance in locally organized events such as festivals. With this growth in mind it will be important that the focus for the next phase becomes that of building on the existing developments to ensure a continuous and positive contribution to unemployment by creating an environment for new business initiative and those that exist to prosper. The need to work together is increasingly becoming critical and important to building up the economic strength and improves the Overstrand’s economic future including the quality of life of its inhabitants. The municipality realizes and recognizes the importance of putting LED as one of its key strategic objectives thus giving adequate attention to economic development and constantly deal with the impact of the changing economic climate. The collective approach to economic development begins to realize and acknowledges the different roles played by stakeholders in dealing with matters critical to the growth of the Overstrand municipality, these include but not limited to;
- ensuring that the Overstrand is attractive to all investors; - ensuring that economic growth and development is
inclusive by broadening participation, and - identifying key aspects for providing a conducive
environment for businesses to invest in the Overstrand. This approach will take into account that a strong and organized private sector can contribute positively to the creation of wealth, be prosperous as a core to sustainable employment creation and improving the lives of the people. Local economic development can not be defined as a set of projects that are not sustainable and not aimed at contributing positively to economic growth, it should be viewed as a set of actions by all those involved (stakeholders), agreed upon in making the economy grow and create income opportunities for the people. This is but one of the important ways towards decreasing poverty, creation of jobs and making the economy grow. 2. Economy A healthy and vibrant economy is essential for the development of the local community of a particular region. Economic growth Overstrand’s regional gross value added figure (GVA-R)8 amounted to R1.894 billion and accounted for 28.7 per cent of total of the regional economy of R6.579 billion in 2009 making it the second largest economic contributor in the Overberg District

- 74 –
___________________________________________________________________________
Final Integrated Development Plan 2012/13
Figure: Comparison of Overstrand’s economy growth rates to Overberg District growth rates, 2001 – 2009. Source: Western Cape Provincial Treasury calculations based on Global Insight data, 2010. Figure shows the economic growth trends of Overstrand in comparison to the Overberg Regional District growth rate for the period 2001 to 2009. The Overstrand and District economies grew in tandem for the period 2001-2004, thereafter the District economy’s growth exceed that of the Overstrand for the period 2005 to 2008. Over the entire period Overstrand’s economy grew at an annual average rate of 2.0 per cent compared to the District’s annual average growth rate of 2.7 per cent for the same period. The effect of the global recession was more severe in 2009 when the economies of Overberg District and the Overstrand contracted by 1.7 per cent and 2.6 per cent respectively.
2. Strategic choices and direction
The strategies that will be defined hereunder form part of the overall vision outlined in this IDP and takes into account actions taken in analyzing local economic needs, problems and priorities with regard to development projects. Development of communities by just looking at their spatial imperatives can involve developing corridors and linkages between areas, introducing good public transport that supports the local economy. The municipality shall, in its approach to implementing LED approaches integrate and apply the following principles:
3.1 Focus on and prioritise poverty and unemployment as the main challenges facing the Overstrand;
3.2 Allowing full participation in the economic life of the Overstrand by giving opportunities to SMME’s , marginalized communities and emerging service providers;
3.3 That LED is not approached as a one size fits all, each area may develop an approach that is best suited for its environment and context;
3.4 Use of local resources and skills and maximize opportunities for development;
3.5 Implement flexible approaches to respond to changing circumstances in all areas including the integration of diverse economic initiatives inclusively;
3.6 Ensure participation and involvement of other spheres of government national and provincial, creation of partnerships between communities, businesses and government to solving problems, promote the creation
4.0%
1.8%
3.1% 3.0%
0.9%
3.2%3.0%
-2.6%
4.2%
1.9%
3.2% 3.8%
1.7%
4.2%4.4%
-1.7%
-3%
-2%
-1%
0%
1%
2%
3%
4%
5%
2002 2003 2004 2005 2006 2007 2008 2009
WC032: Overstrand Local Municipality Overberg District

- 75 –
___________________________________________________________________________
Final Integrated Development Plan 2012/13
of joint business ventures to gain harmony and shared growth;
In meeting the municipality’s economic development goals, the Overstrand municipality shall put in place the following important programmes;
Develop the infrastructure of the municipality to make it easier for businesses to operate (houses, transport, water, roads, and electricity as defined by other directorates in other parts of this document);
Promoting tourism as one of the biggest growth industries in the Overstrand – this includes developing local tourist sites and facilities, take advantage of the three blue flag facilities for economic benefit, improve product offering and ensure a welcoming environment;
Steering the procurement process to favor emerging service providers. Where contracts are huge for emerging service providers to handle, take steps to get larger companies to enter into joint ventures with smaller partners;
Marketing the municipality, its infrastructure, environment and offerings to local and international businesses through appropriate means and technological advance initiatives;
Develop and implement a marketing strategy; Operate a service centre that provides assistance and
information to businesses and aspiring entrepreneurs coupled with outreach programmes;
Introduce outreach programmes and assess local initiatives;
Provide relevant and useable information to job seekers and entrepreneurs;
Keep a database of all requests and needs;
Deliver capacity building programmes aimed at improving business operations and developing local skills;
Agriculture and aquaculture zones to increase export potential, create and maintain jobs;
4. Combating poverty Poverty in the Overstrand affects many people and this is caused mainly by an increase in low household incomes. Activities should be carried out to ensure that the programmes and projects introduced deal with the root causes of poverty. Unemployment, landlessness confined into low skilled work contributes to people earning low and unsustainable incomes. The problems people face is that there are many people who cannot make ends meet, meet basic needs for housing, water, food, health, education and can not afford municipal services. The municipality through its finance department has in place an indigent policy which covers the majority of people who find themselves in these predicaments and encourages them to register. Other programmes that contribute to combating poverty is running and facilitating an effective EPWP programme with specific focus on the indigents, keeping an up to date job-seekers database 5. Review of the Overstrand local economy Measured in respect of regional gross domestic product or GDPR the Overstrand local economy forms 32% of the broader Overberg district economy, yet only 0,7% of the Western Cape provincial economy. That said, the Overstrand local economy grew at the robust pace of 4,1% a year over the 12-year period 1995 to 2007, with higher average annual growth of

- 76 –
___________________________________________________________________________
Final Integrated Development Plan 2012/13
8,6% a year registered over the last five years from 2003 to 2008. Figure below depicts a broad sectoral mix of Overstrand’s economy. Leading sectors include business services (31,2%); manufacturing (22,4%); wholesale & retail trade, catering and accommodation (15,3%); construction (14,9%) and general government services (5,1%).
Figure: A sectoral view of the Overstrand’s local economy, GDPR, 2008 Local economic growth therefore is firmly based on tertiary services such as wholesale & retail, transport, government services and business services. Significant property development is also highlighted. Tourism resorts primarily in the category for wholesale & retail, catering and accommodation – which is a significant section of the pie at 15, 3%.
The key economic drivers for the Overstrand needing attention and focus to grow the economy provide jobs the creation of opportunities are beneficiation, the green economy and tourism. Infrastructure development as a National priority is necessary to provide new and efficient infrastructure and propel job creation. The Overstrand area is not desirable to hosting huge factories, its main drivers resort on tourism, agriculture/aquaculture, retail and services. 6. Economic share and employment Nodal area Share of econ
activity Greater Hermanus 62.2%
Greater Gansbaai 20.7% Kleinmond 16.6% Stanford 0.4% Table : Share of economic activity per area (Overstrand Tourism Barometer) Of the main towns listed in the Overberg Regional Service Council levy database, Hermanus emerges unsurprisingly as the main economic hub of the Overstrand local economy contributing almost two-thirds (62,2%) of the area’s economic output, supported by Gansbaai (20,7%) and Kleinmond (16,6%). Stanford trails at a mere 0,4% share, and no other town records significant levels of economic activity. Fostering linkages is therefore critical in ensuring that other towns grow equally and in tandem with the rest of the Overstrand. 7. Industry employment Taking a sectoral view of employment performance, the bulk (88,2%) of all employment in the Overstrand is in the formal
Agriculture, forestry and fishing
4.0%Mining and quarrying
0.0%
Manufacturing22.4%
Electricity, gas and water0.3%
Construction14.9%
Wholesale and retail trade, catering and accommodation
15.3%
Communication3.0%
Finance, insurance, real estate and
business services31.2%
Community, social and personal services
3.8%General government
5.1%

- 77 –
___________________________________________________________________________
Final Integrated Development Plan 2012/13
sector, with informal employment comprising 11,8% of total employment in the local area. Disaggregation of formal employment by skills level shows that 86.9% of Overstrand’s formal employment is located at the skilled and semi/ unskilled levels with only 13,1% of workers categorised as highly skilled. Low levels of growth in the highly skilled category (an improved 3,5% a year over the last 5 years) is a further constraint to improving knowledge-intensive activities that drive economic competitiveness over the medium-term. Figure illustrates the contribution of the various sectors to provide employment in 2007.
15.8
14.7
12.6
12.6
11.3
11.0
10.5
8.4
3.0
0.2
0.0
0.0 4.0 8.0 12.0 16.0
Construction
Wholesale and retail trade
Community; social and personal services
Unspecified
Financial; insurance; real estate and business services
Manufacturing
Other and not adequately defined
Agriculture; hunting; forestry and fishing
Transport; storage and communication
Electricity; gas and water supply
Mining and quarrying
Percentage share
Source: Stats SA, Community Survey 2007 The biggest employment contributors were: Construction (15.8 %), Wholesale & Retail Trade (14.7%) and Community; social and personal services (12.6%). The Manufacturing sector provided employment for 11.0 per cent of the employed workers which makes it a significant sector in the municipal
area. This is of particular relevance given its labour absorption implications for the reduction of unemployment. A significant percentage of respondents were recorded as other and not adequately defined (10.5%) or unspecified (12.6%). 8. Unemployment The analysis that follows is based on the official (narrow) unemployment definition. It is important to distinguish between narrow and broad unemployment, as its interpretation and use as an indicator may have differing policy consequences. Narrow unemployment is defined as the number of people who have not worked for two weeks prior to the survey date but have taken active steps to look for work/employment. Broad unemployment is defined as the number of people seeking employment two weeks prior to the survey date and includes persons that did not or cannot take active steps to look for work/employment, for example, discouraged work-seekers. 9. Unemployment by gender Table shows the unemployment rates for males and females in 2007.
Overstrand Local MunicipalityUnemployment rate
within groupPercentage share of the labour force
Percentage share of unemployed
Gender
Male 23.2 52.2 50.1Female 25.2 47.8 49.9 Source: Stats SA, Census 2001 and Community Survey 2007

- 78 –
___________________________________________________________________________
Final Integrated Development Plan 2012/13
Table shows unemployment rates for males and females in 2007. In 2007, the unemployment rate for males was 23.2 per cent with a 50.1 per cent share of the unemployed. The unemployment rate for females was marginally higher at 25.2 per cent but the percentage share of the unemployed lower at 49.9 per cent as females accounted for a smaller portion of the labour force. Although males had a lower unemployment rate than females their share of the total unemployed is higher than females as males’ accounted for 52.2 per cent of the labour force and the females accounted for the remaining 47.8 per cent. 10. Racial profile of unemployment Unemployment in Overstrand is concentrated within the African population and accounted for 59.9 per cent of the unemployed labour force in 2007.
Overstrand Local MunicipalityUnemployment rate
within groupPercentage share of the labour force
Percentage share of unemployed
Population group
African 42.3 34.1 59.9Coloured 22.6 38.3 36.0Indian or Asian 0.0 0.2 0.0White 3.7 27.4 4.1
Source: Stats SA, Census 2001 and Community Survey 2007 The Coloured population has the second biggest share of unemployed in the area accounting for 36.0 per cent of the unemployed population in 2007. Unemployment among the White and Indian/Asian population groups is low or
insignificant at 4.1 per cent and zero per cent in 2007, respectively. Naturally, the African and Coloured race groups account for the dominant share of the labour force with 34.1 per cent and 38.3 per cent respectively. 11. Unemployment by age cohort Table 9 shows the unemployment by age cohorts. The highest unemployment rate in 2007 was amongst those persons aged 15 – 19 years (42.1 %). Table: Unemployment by age cohort in 2007
Overstrand Local MunicipalityUnemployment rate
within groupPercentage share of the labour force
Percentage share of unemployed
Age
15 - 19 42.1 5.7 10.020 - 24 34.7 14.0 20.225 -34 30.3 32.3 40.635 - 44 21.1 23.3 20.345 - 54 11.9 16.8 8.355 - 65 1.9 7.9 0.6
Source: Stats SA, Community Survey 2007 Although the age group 15-19 years recorded the highest unemployment rate, they only form 5.7 per cent of the total labour force and 10 per cent of the unemployed. Contrastingly, those persons aged 25 – 34 which had the third highest unemployment rate (30.3 per cent) makes up the largest portion (32.3%) of the labour force and therefore the largest share (40.6%) of the unemployed.

- 79 –
___________________________________________________________________________
Final Integrated Development Plan 2012/13
12. Formal and informal employment
2008
2008 Share main sector
2008 Share sub sector
Ave growth 1995-2008
Ave growth 2003-2008
Informal employment 2,777 11.8 4.0 0.9 Formal employment 20,808 88.2 3.0 1.0 Highly skilled formal employment 2,716 11.5 13.1 5.3 3.5
Skilled formal employment 8,685 36.8 41.7 4.6 2.5
Semi- and unskilled employment 9,406 39.9 45.2 1.4 -0.9
Total formal and informal employment 23,585 100 3.1 1.0
Table : Overstrand informal and formal employment (by skills level), 2008 Overall, formal employment growth steps slowly at 5,3% a year over the last five years in comparison to the GDPR’s healthier pace of 8,6% a year. The indication is that robust economic growth in the Overstrand area is not translating into equally strong employment performance which, set against high population growth (particularly that of younger work-seekers) that will place further pressure on an already high unemployment rate in the Overstrand area. Many people have resorted to self-employment for a living and this sector has grown significantly and plays an important role in increasing economic performance of the area.
13. APPROACHES TOWARDS GROWING THE LOCAL ECONOMIES 13.1 Promotion of shared values The business community will be urged to communicate more with each other, ensure that it expands beneficiation that can be achieved through business to business dialogue and support. Ensure good quality service at all times and be aware of short comings with regard to staff training, efficiency and productivity. This is aimed at creating a productive town giving visitors an ever lasting impression and looking forward to coming back again. 13.2 Promotion of Cleaner / alternative energies Alternatives for alternative energies should be explored to ease reliability to source. The change of lifestyles and increased consciousness with regard to the impact of global warming will assist in creation of jobs (building and installation of appropriate technology, making use of available subsidies etc.) and the protection of the environment. 13.3 Encouraging business growth
Role clarification is critical here, the Municipality at very best should ensure that the environment for doing business is conducive and not clouded by red tape. Promote productive, innovative and viable entities, creating a productive municipality through creation of opportunities for local enterprises and broaden the economic base with a focus on developing emerging service providers to participate effectively in the economy. Programmes shall include but not limited to:
‐ Entrepreneur support programmes;
- 80 –
___________________________________________________________________________
Final Integrated Development Plan 2012/13
‐ Business retention and Expansion strategies and activities;
‐ Buy local campaigns and focus on competitiveness; ‐ Focus on local service providers through the Preferential
Procurement Policy; 13.4 Servicing new and retaining existing enterprises The Municipality is not in business of blocking and/or deciding on who should or should not invest in the area. The municipality can only make decisions based on legislative matters, environmental concerns and desirability of the development. The economic potential of the Overstrand has to be explored in full and that business to business dialogue could ensure retaining of resources for the benefit of the area. The Directorate shall establish a desk for enterprise support in the municipality and partner with other service providers in the field in meeting people’s expectations with regard to self-employment and access to information. Initiatives for project design be on the lines of…
‐ Providing up to date and relevant economic statistics for decision making;
‐ Setting up an investment desk linked to GIS systems of the Municipality;
‐ Collaborating with relevant partners in providing marketing trends information to promote investment;
‐ Ensuring speedy and efficient response to requests to maintain entrepreneurship;
‐ Increasing co-operation with partners of civil society, NGO’s etc.
13.5. Stakeholder Management and Engagement This process is critical to creating a credible and supported LED process. It notes the fact that for LED processes to work, participation of all stakeholders is important. This process therefore recognises that all stakeholders are important and that they can participate at different levels and some have the ability and capability to participate more than others. The initial point is to determine who the key stakeholders are, what their likely interest is and what best ways to involve there are.
‐ Realise that jobs that can be created from expanding and retaining existing business accounts for about 65% opportunities and new businesses about 35% opportunities;
‐ Identify positive pointers to increase self-employment; ‐ Place emphasis on importance to micro enterprise
development for positive job growth; ‐ Organise feedback sessions at reasonable intervals to
monitor developments; ‐ Communicate successes and failures and work towards
common goals; ‐ Set up an LED forum to promote dialogue amongst
stakeholders 13.6. Promoting economic development
The Overstrand economic growth as supported by an improved Gross Value Add need to continue on a positive drive in the next 5 years in order for the locals to enjoy a higher standard of living, eradicate poverty and ensure sustainable jobs sufficient enough for new entrants into the labour market.

- 81 –
___________________________________________________________________________
Final Integrated Development Plan 2012/13
The focus going forward and emphasised over and over are issues of productivity, manufacturing capabilities, beneficiation, tourism including savings and investment as critical factors that can influence and stimulate continued growth and creation of jobs not to mention infrastructure development.
‐ accommodation of future special economic zones and identified land;
‐ Supporting economic development in and around the harbors;
‐ Permitting and encouraging diverse land uses at appropriate locations;
‐ Development of economic spaces to create opportunities for enterprise development and small emerging enterprises;
‐ Support and boost economic sectors with potential to grow and create employment opportunities;
‐ Promote tourism growth that does not compromise the environment;
‐ Promote public, private partnerships to develop both private and public land;
13.7. Skills and capacity development The Overstrand municipality has the highest skilled people as its residents but at the same time lower skills level within the working class and workforce. The municipality will partner with other spheres of government, relevant service providers and non-governmental organizations in providing skills that can either direct people to job opportunities and/or self-employment.
13.7.1 to increase the levels of investment in education and training in the labour market and to improve the return on that investment;
13.7.2 to encourage employers--
‐ to use the workplace as an active learning environment;
‐ to provide employees with the opportunities to acquire new skills;
‐ to provide opportunities for new entrants to the labour market to gain work experience; and
‐ to employ persons who find it difficult to be employed;
o to encourage people and emerging service providers to participate in learnerships and other training programmes aimed at growing their businesses;
o to improve the employment prospects of persons previously disadvantaged by unfair discrimination and to redress those disadvantages through training and education;
o encouraging partnerships between the public and private sectors of the economy to provide education and training in and for the workplace
- 82 –
___________________________________________________________________________
Final Integrated Development Plan 2012/13
13.8 Sustainable urban development including potential of towns
‐ Participate and inform spatial development plans and
rectify distorted spatial patterns in promoting economic development;
‐ Close the gap between residential and employment areas to avoid long commuting distances;
‐ Formalise informal residential areas;
‐ Investigate the development of CBD’s in line with
economic growth of towns
13.9 Export and Direct Investment The proximity of the Overstrand to the main transport routes and hubs i.e. railway and airport, gives it a strong advantage in boosting its export potential and interest for investment in the economy. The growing aquaculture industry with the availability of potential land to grow is one of the industries to boost and the floral wealth could both potentially grow the economy.
‐ Make land available for aquaculture and sustainable harvesting of flowers;
‐ Partner with National government in the development of harbours;
‐ Investigate and develop a feasibility study in participating in the Special Development Zones (SDZ) initiative focusing on Agriculture/Aquaculture;
14. Business Retention and Expansion Programme (BR&E) This programme is geared at helping existing businesses to survive and grow within the local economy. In practice most BR&E initiatives happen at local level and prevent businesses from shutting down. BR&E uses locally driven approaches that are beneficial in building social capital that assist in building trust and co-operation without which economic development can be very difficult. Year on year SMME’s struggle to survive in the changing economic climate and in many cases given varying reasons which can be avoided. Secondly these businesses disappear without attempt made to rescue them because of non-disclosure and operating in silo. Through this process, it is possible to understand and diagnose the situation early and introduce programmes to rescue such businesses 15. Expanded Public Works Programme (EPWP) EPWP is one of the government’s short- to medium term initiatives which focuses on the use of government expenditure to alleviate poverty and reduce unemployment. The EPWP intended objectives can be attained through provision of work opportunities coupled with training. Training is a key element of the programme not only as an exit strategy but also a way of increasing the future employability of the beneficiaries / participants. EPWP projects and programmes must be identified, using labour-intensive methods with predetermined key deliverables over a given timeframe in the environmental, social and infrastructure sectors. This is to be achieved by channeling a

- 83 –
___________________________________________________________________________
Final Integrated Development Plan 2012/13
substantial amount of the municipal annual budget allocation (both OPEX and CAPEX) towards implementation by;
- Implementing labour-intensive projects that can create short-term jobs for the unemployed within the local communities projects to be identified in the CAPEX and OPEX budget and negotiated with budget holders; - Capacitate SMME’s and emerging contractors within the local communities by facilitating the transfer of skills [managerial, technical and financial] through an appropriate Learnership Programme;
- To optimise the percentage of the Overstrand
Municipality’s annual total budget spend, retained within local communities by promoting the procurement of goods and services from local manufacturers, suppliers and service providers and boost local employment;
16. BUSINESS ADVISE AND SUPPORT The business advice and support centre which is a unit of the Directorate will engage with local communities to ensuring that people have access to information, resources and livelihoods including assistance in business development and management. The office will have in place statistics and keep a database of jobseekers, capacity development needs, emerging contractors and service providers and EPWP statistics for reporting. The model below illustrates a process of engagement with SMME’s in different levels and ensures growth from the second to the first through engagement.
TOURISM GROWTH AND DEVELOPMENT One can reiterate the importance of tourism in the Overstrand economy as one of the most significant and fast growing industries. This comes as no surprise if we look at what this area offers. One of the main tourist attractions of the area is the occurrence of the Southern Right Whale, frequenting Walker Bay between July and December. The Whale Festival, held each year during September in Hermanus, has been planned

- 84 –
___________________________________________________________________________
Final Integrated Development Plan 2012/13
to coincide with the peak season for whale watching – an activity that is offered boat-based as well as land-based. Hermanus is known world-wide for the best land-based whale watching as the high cliffs along the coast provide an elevated view of the giants in the sea. Stanford is a quaint little town that attracts artists and writers to its quiet village atmosphere. The central part of Stanford has been proclaimed a national conservation area and it is one of the few towns in South Africa that has preserved its market square. Gansbaai is known amongst other things for its excellent rock and boat based angling opportunities. Shark cage diving has also increased in popularity in recent years, giving tourists the opportunity to see the great white shark up close and personal in the area near Dyer Island – off the coast at Gansbaai. The Danger Point Light House near Gansbaai can also be visited by the public. De Kelders boasts with the only fresh water cave along the African coast and is also great for land-based whale watching. The Penguin Reserve at Stony Point, Betty’s Bay, is one of only two breeding colonies of the jackass penguin in Africa and a favourite attraction amongst visitors. The area also includes the Kogelberg Biosphere Reserve which is one of only two such international biospheres in South Africa. This status was proclaimed in 1999 by the UN Educational, Scientific and Cultural Organisation. The reserve stretches from Gordon’s Bay to the Bot River Vlei, 2km out to sea and inland to the Groenlandberg Mountains. It is commonly referred to as the heart of the Cape floral
kingdom as roughly one fifth of all known fynbos species occur here. The Overstrand’s coastline includes three beaches with blue flag status: Kleinmond, Hawston and Grotto. Grotto beach has now received this prestigious award for four consecutive years. A wide range of activities are offered in the Overstrand for nature and adventure lovers: hiking in the Harold Porter National Botanical Garden or the Fernkloof Nature Reserve; sea kayaking; canoeing and white water rafting in the Palmiet river near Kleinmond; boating, water skiing and wind surfing on the Klein river lagoon; fishing; bird watching; mountain biking; and golfing at one of the beautiful golf courses in the area. Furthermore, the wines of the Overstrand have become more and more well-known in the last couple of years and provides for wine tasting opportunities in beautiful surrounds. The Hemel-en-Aarde Valley and Stanford wine routes boast with excellent wines due to a combination of good quality soil and a cool maritime climate. Tourism and Local Economic Development According to the World Tourism Organisation tourism contributes 10% to the global gross domestic product, thereby earning the status of being the world’s largest industry. Also being one of the most significant industries in the Overstrand economy, tourism has a vital role to play in terms of local economic development and can contribute significantly towards poverty alleviation in the area. The International Centre for Responsible Tourism advocates “Pro-poor Tourism” – an approach towards tourism which ensures that “local poor people are able to secure economic benefits from tourism in a fair and sustainable manner.”
- 85 –
___________________________________________________________________________
Final Integrated Development Plan 2012/13
(Robson, S and Higton, S, 2004). Pro-poor tourism can benefit local poor people in three ways: It can bring economic gain through employment and micro-enterprise development; infrastructure such as roads, water and electricity supply, telecommunications and waste management can be improved; and poor people can be engaged in decision-making. For the tourism industry to thrive it needs good infrastructure and a well-educated work force, but these things also benefit local communities outside of the industry. Local economic development is therefore in the interest of all. The perception that tourism is an elite industry that only benefits tourism business owners should be changed and awareness should be raised about the indirect impacts thereof. Furthermore, tourism businesses need to align their business strategies to maximise their impact on poverty and development. This can only be done successfully if tourism businesses stand together in their efforts to have a wider impact. Local economic development is realised for instance where the industry makes an effort to employ local labour and source products locally. In the end good community relationships, a concern for the natural and cultural environment and an increased effort to influence poverty and developmental levels all contribute to the industry’s license to operate as good corporate citizen. Possible initiatives / opportunities for Tourism and economic growth The introduction of creative and innovative ideas can contribute positively to propelling the economy towards positive growth. The opportunities though have to be
developed with the private sector but given priority and support from the municipality’s side. The one notable and mentioned opportunity is lack of entertainment facilities in the Overstrand that can accommodate the Youth and/or activities earmarked for family activities, Creative and Cultural Activities The Overstrand attracts visitors for different cultures and background could promote activities of this nature to take advantage of the numerous benefits this could bring to the economy such as foreign exchange, local financial boost into the economy including creation of jobs;
Recreational facilities The need for recreational facilities to accommodate youth and family activities can be achieved through development of harbours and caravan sites with tourism concentration. The introduction of adventure activities in the Hemel and Aarde Valley including temporary events situated along and near the Blue flag facilities (depending on desirability and environmental considerations).
Technology The introduction of advanced technology could lead to introduction of new many smaller companies with vision to for using the bytes and hook-ups to chase the dream of entrepreneurism. This is an opportunity for start-up businesses that are not bothered by space and time – wanting to venture into a more diverse and less vulnerable economic base. Partner with relevant partners in introducing broadband wi-fi zones to facilitate easy communication for visitors and
- 86 –
___________________________________________________________________________
Final Integrated Development Plan 2012/13
residents alike. Continuous upgrade of technological offering for marketing and branding purposes making the Overstrand more appealing to visitors from a touch of a button. Marketing the Overstrand as destination The promotion of the Overstrand as a destination will give it an edge to other outlying towns. This will include promotional packages, local product offering including economic potential of the area. The creation of a tourist hub has to translate into a business hub giving entrepreneurs a list of benefits that encourage them to do business in the area. Marketing of the area has to be complemented with a process of highlighting major achievements that are communicated to stakeholders at all times. Strategies
‐ Supporting the tourism sector through efficient and effective Local Tourism Offices (LTO);
‐ Developing in partnership with the LTO’s a plan of action with achievable outcomes;
‐ Attend and present the municipality in major marketing events in the country and abroad (where necessary and possible);
‐ Collate and provide economic information and statistics on the local economy including visitors statistics and their preferred activities;
‐ Access to shared database on entrepreneurs; ‐ Creation of a supportive environment to encourage
sense of belonging and innovation; ‐ Encourage and support and entrepreneurship network;
Cape Whale Coast The branding of the Overstrand as the Whale Coast is critical in creating a brand name that is appealing to local and international visitors. The integration of other offering within the outlying towns complements the brand and its appeal. The Whale and Wine Route The routes provide an experience for the visitor in the area, the beauty and attractive landscapes giving the visitor ample time to unwind and enjoy the offerings. There are up to standard restaurants, accommodation, attractive landscapes, the sea and mountains and more importantly an abundance of wildlife and flora to boost eco-tourism in the area. Internationally acclaimed wines that can be enjoyed amongst the best landscapes in the country. The Overstrand municipality will support the growth of these to ensure that visitors experience is enhanced for more visits in the area. Overstrand need to live its offering and take advantage in promoting its natural heritage through the development of the two routes. Seasonality To ensure a balanced approach to the spread of marketing efforts, the issue of seasonality must be taken into consideration and special effort put in creating equilibrium between the identified periods.
According to a recent survey conducted in the Overstrand, seasons can be classified under the following months;
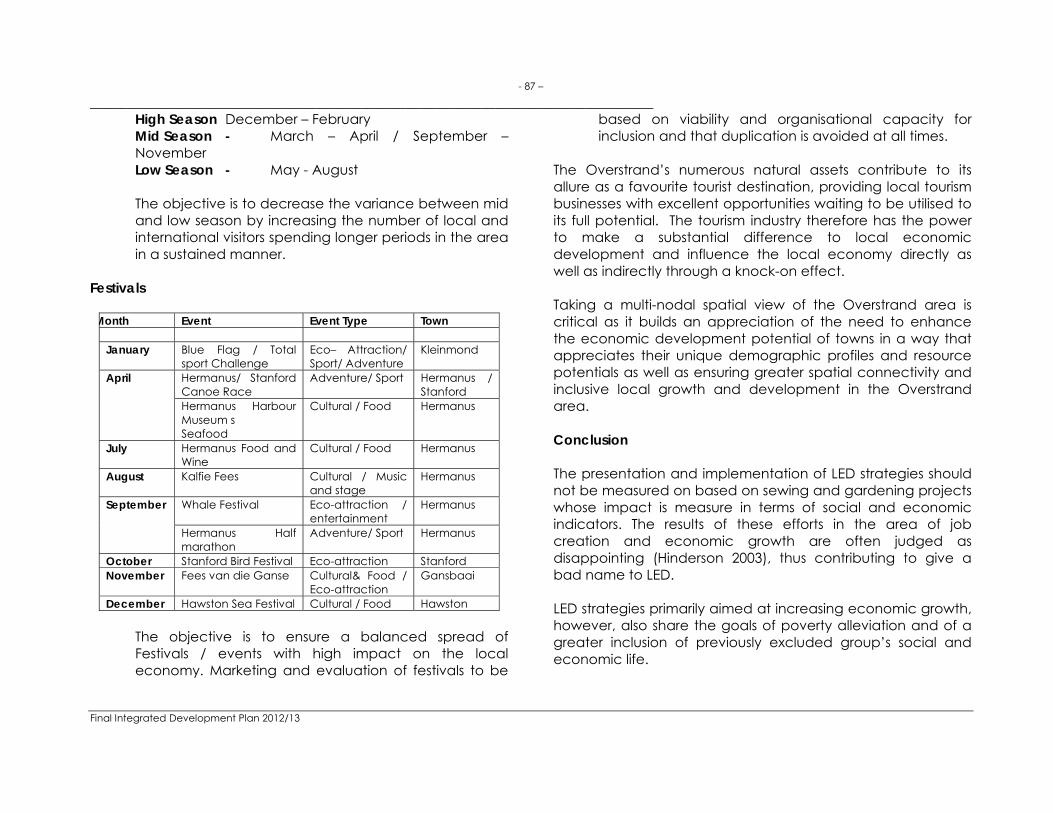
- 87 –
___________________________________________________________________________
Final Integrated Development Plan 2012/13
High Season December – February Mid Season - March – April / September – November Low Season - May - August The objective is to decrease the variance between mid and low season by increasing the number of local and international visitors spending longer periods in the area in a sustained manner.
Festivals Month Event Event Type Town
January Blue Flag / Total
sport Challenge Eco– Attraction/ Sport/ Adventure
Kleinmond
April Hermanus/ Stanford Canoe Race
Adventure/ Sport Hermanus / Stanford
Hermanus Harbour Museum s Seafood
Cultural / Food Hermanus
July Hermanus Food and Wine
Cultural / Food Hermanus
August Kalfie Fees Cultural / Music and stage
Hermanus
September Whale Festival Eco-attraction / entertainment
Hermanus
Hermanus Half marathon
Adventure/ Sport Hermanus
October Stanford Bird Festival Eco-attraction Stanford November Fees van die Ganse Cultural& Food /
Eco-attraction Gansbaai
December Hawston Sea Festival Cultural / Food Hawston
The objective is to ensure a balanced spread of Festivals / events with high impact on the local economy. Marketing and evaluation of festivals to be
based on viability and organisational capacity for inclusion and that duplication is avoided at all times.
The Overstrand’s numerous natural assets contribute to its allure as a favourite tourist destination, providing local tourism businesses with excellent opportunities waiting to be utilised to its full potential. The tourism industry therefore has the power to make a substantial difference to local economic development and influence the local economy directly as well as indirectly through a knock-on effect. Taking a multi-nodal spatial view of the Overstrand area is critical as it builds an appreciation of the need to enhance the economic development potential of towns in a way that appreciates their unique demographic profiles and resource potentials as well as ensuring greater spatial connectivity and inclusive local growth and development in the Overstrand area. Conclusion The presentation and implementation of LED strategies should not be measured on based on sewing and gardening projects whose impact is measure in terms of social and economic indicators. The results of these efforts in the area of job creation and economic growth are often judged as disappointing (Hinderson 2003), thus contributing to give a bad name to LED. LED strategies primarily aimed at increasing economic growth, however, also share the goals of poverty alleviation and of a greater inclusion of previously excluded group’s social and economic life.

- 88 –
___________________________________________________________________________
Final Integrated Development Plan 2012/13
CHAPTER 7 OVERSTRAND TURNAROUND STRATEGY
The Overstrand Municipality has identified the following five areas/priorities as our turn around strategy during 2012/2013: - 7.1 Housing
Housing
Priority Turn Around Focus Area
Providing housing opportunities for people who cannot afford to buy a house on the open market, in other words providing housing for the disadvantaged communities, is identified as one of the priorities of the Turn Around Strategy.
January 2010 (Current Situation) Unpack
Housing was identified as a priority due to the stagnation that crept into the process in the Overstrand in the last few years. This is illustrated by the following statistics: from 1996 to 2004, a total of 4,560 housing units have been provided in the Overstrand Municipal area. Since 2005, only two projects were approved by the Provincial Authorities, namely those at Kleinmond (611 units approved of which only 410 are currently under construction) and Stanford (389 units approved of which only 88 units realised).
These figures must be seen against the current estimated backlog of approximately 7,619 names on the housing waiting list, an estimated 4,900 back-yard dwellers and an undisclosed number of squatters.
Causes
Lack of a Housing Delivery Strategy. Poor planning of housing projects. Poor project management of housing projects. The departure of the Overstrand Municipal Housing Manager.
Target for June 2011 (Changed Situation) Output
Re-organising the Housing function in the Municipality. Developing a Housing Delivery Strategy. Complete the Kleinmond Housing Project.
Municipal Action
The housing function within the
Municipality has been re-organised, by placing the housing delivery process within the Directorate Infrastructure and Planning, whilst retaining housing administration in the Directorate Community Services. This facilitated a more streamlined process.
Outside expertise was con-tracted in to:
o develop an Overstrand Housing
Delivery Strategy, o fast track the implement-tation
of housing projects, o act as project manager in order
to speed up the roll out of these projects.
The compilation of the Housing
Delivery Strategy has begun. This is currently being done in
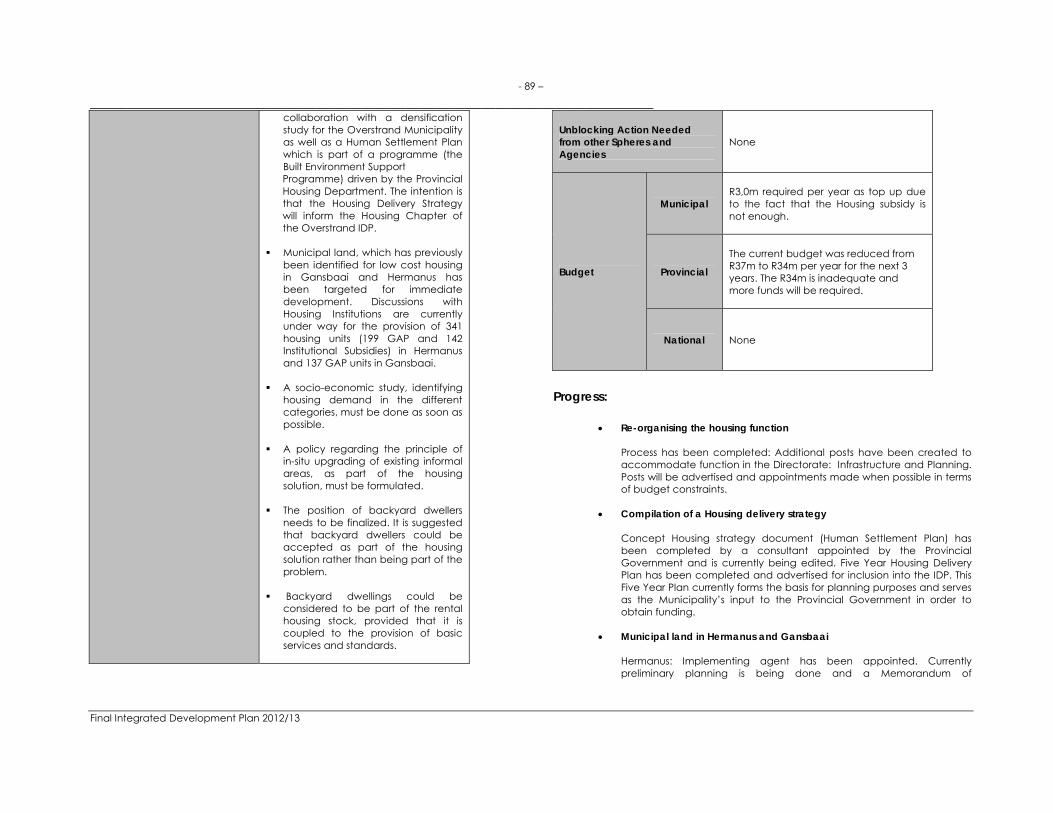
- 89 –
___________________________________________________________________________
Final Integrated Development Plan 2012/13
collaboration with a densification study for the Overstrand Municipality as well as a Human Settlement Plan which is part of a programme (the Built Environment Support Programme) driven by the Provincial Housing Department. The intention is that the Housing Delivery Strategy will inform the Housing Chapter of the Overstrand IDP.
Municipal land, which has previously
been identified for low cost housing in Gansbaai and Hermanus has been targeted for immediate development. Discussions with Housing Institutions are currently under way for the provision of 341 housing units (199 GAP and 142 Institutional Subsidies) in Hermanus and 137 GAP units in Gansbaai.
A socio-economic study, identifying
housing demand in the different categories, must be done as soon as possible.
A policy regarding the principle of
in-situ upgrading of existing informal areas, as part of the housing solution, must be formulated.
The position of backyard dwellers
needs to be finalized. It is suggested that backyard dwellers could be accepted as part of the housing solution rather than being part of the problem.
Backyard dwellings could be
considered to be part of the rental housing stock, provided that it is coupled to the provision of basic services and standards.
Unblocking Action Needed from other Spheres and Agencies
None
Budget
Municipal R3,0m required per year as top up due to the fact that the Housing subsidy is not enough.
Provincial
The current budget was reduced from R37m to R34m per year for the next 3 years. The R34m is inadequate and more funds will be required.
National None
Progress:
Re-organising the housing function
Process has been completed: Additional posts have been created to accommodate function in the Directorate: Infrastructure and Planning. Posts will be advertised and appointments made when possible in terms of budget constraints.
Compilation of a Housing delivery strategy
Concept Housing strategy document (Human Settlement Plan) has been completed by a consultant appointed by the Provincial Government and is currently being edited. Five Year Housing Delivery Plan has been completed and advertised for inclusion into the IDP. This Five Year Plan currently forms the basis for planning purposes and serves as the Municipality’s input to the Provincial Government in order to obtain funding.
Municipal land in Hermanus and Gansbaai
Hermanus: Implementing agent has been appointed. Currently preliminary planning is being done and a Memorandum of

- 90 –
___________________________________________________________________________
Final Integrated Development Plan 2012/13
Understanding will be concluded shortly with the Implementing Agent, which will lead to a Land Availability Agreement. Gansbaai: Awaiting proposals from Implementing Agent. Furthermore, in terms of the Five Year Plan, a total of 7 new projects have been initiated, consultants have been appointed and project applications are currently being prepared. A total of 3 700 houses will be provided with these projects. Implementation period, subject to availability of funds, is three years.
Sosio-economic Study
No real progress to date. Funding could not be obtained from Provincial Government for this purpose. Possibility of utilising the survey from War on Poverty initiative to obtain information needed. The questionnaire is currently being updated to include housing requirements.
In Situ Upgrading of informal settlements
This is now part of the Housing Code and the principle is now being put into practice by the Municipality. Three of the major identified projects mentioned above will be implemented as Upgrading of Informal Settlement Projects (UISP’s).
Backyard Dwellers
This has now also become part of the Rental Strategy, accepted by Provincial Government. The next step would be to develop a set of regulations/rules by which this can be implemented.
7.2 Water Demand Management
Overstrand Municipality is situated in a water scarce area, and experienced below average rainfall over the past two years. This placed great stress on existing water sources. The municipality has identified Water Conservation and Water Demand Management as a key priority. Current Situation: The water demand in some of the Overstrand towns is approaching the sustainable yield of the current water sources. These include Rooi Els, Pringle Bay, Betties Bay, Greater Hermanus, Stanford and Baardskeerdersbos. In parallel with the development of new water
sources, the demand for water, including water losses, must be managed properly and be under control. Causes for abnormal water demand: Wastage Leaks Ageing pipeline infrastructure Unmetered connections High network pressures Defective water meters Alien vegetation infestations in watercourses and catchment
areas. Target to change current situation: To reduce water losses by 50 % over 5 years, i.e. by June 2015 (refer to Water Services Development Plan). Municipal Actions: Implementation of re-use of treated effluent as potable water
source; Continue with pipe replacement in priority areas with old
reticulation networks and record of frequent pipe failures: Implementation of pressure management in specific areas, and
further investigation of potential for pressure management in other areas;
Phased pro-active replacement of water meters; Review and improve efficiency of remote monitoring of minimum
night flows in all zones. Link properties with distribution zones in financial data base to
enable water balance in smaller areas; Perform focused leak detection and repair programs in areas with
highest minimum night flows; Continue with leak repairs at indigent households and installation
of flow limiters; Enhance public awareness on water demand management
issues, e.g. the watering of gardens as determined by the bylaws, rain water harvesting, dam levels, and general water saving tips;

- 91 –
___________________________________________________________________________
Final Integrated Development Plan 2012/13
Identify users on financial data base with regular abnormal high or abnormal low water use, and physically inspect the causes;
Source external funds, e.g. from the DWA Masibambane and ACIP programs;
Tariffs structured to discourage excessive use of water, including implementation of volumetric sewerage tariffs; specific water restriction tariffs implemented for specific dam levels;
Continue with removal of alien vegetation in catchment areas (existing Work for Water program);
Maintain use of treated effluent for irrigation; 7.3 Performance Management
PERFORMANCE MANAGEMENT
Priority Turn Around Focus Area
The Municipal Systems Act requires the municipality to establish a performance management system that is matching with its resources; best suited to its circumstances and in line with the IDP. It is required to create a culture of performance throughout the municipality. The performance management system should contain the following core elements: • Setting of appropriate performance
indicators; • Setting of measurable performance
targets; • Agree on performance measurement; • Performance monitoring, reviewing and
evaluation; • Continuous performance improvement; • Regular performance reporting; and • Intervention where required.
January 2010 (Current Situation) Unpack
The Overstrand Municipality used the SDBIP as its performance management tool. This has been identified as insufficient in terms of its scope and due to the formal audit on Performance Management by 2011/2012.
Causes
Performance Management was never rolled out to the levels below S56 appointees. At present it is too comprehensive and unwieldy.
Target for June 2011 (Changed Situation) Output
The system will be fully implemented between September 2010 and January 2011 and rolled out to all levels of employment. A rewards and incentive policy was adopted and will be implemented once the new system is in place.
Municipal Action
To fully comply with the requirements as per legislation and In order to ensure that the municipality meets its organisational performance indicators, it engaged with a consultant that will set up and introduce a new performance management system The performance management system developed includes the following phases: • Formulation of indicators out of the
municipal strategy; TARGET DATE: Annually - May • Management of organisational and
financial performance; TARGET DATE: Ongoing, monthly 100% • Management of individual
performance; TARGET DATE: Ongoing, monthly 100% • Monitoring and evaluation of
performance; TARGET DATE: Continuous • Reporting on performance; and TARGET DATE: Quarterly • Auditing of performance processes and
information. TARGET DATE: Quarterly by Internal Audit unit and Annually by the AG’s office
Unblocking Action Needed from other Spheres and Agencies (e.g. intervention or technical support)
None
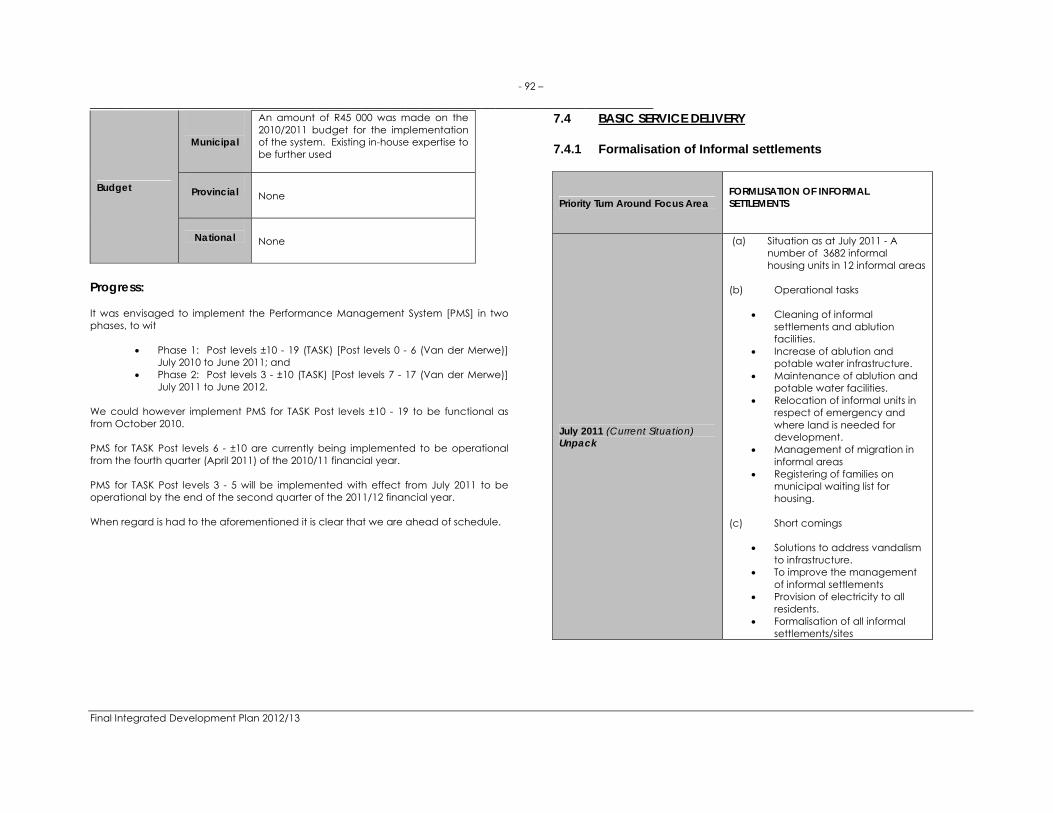
- 92 –
___________________________________________________________________________
Final Integrated Development Plan 2012/13
Budget
Municipal
An amount of R45 000 was made on the 2010/2011 budget for the implementation of the system. Existing in-house expertise to be further used
Provincial None
National None
Progress: It was envisaged to implement the Performance Management System [PMS] in two phases, to wit
Phase 1: Post levels ±10 - 19 (TASK) [Post levels 0 - 6 (Van der Merwe)]
July 2010 to June 2011; and Phase 2: Post levels 3 - ±10 (TASK) [Post levels 7 - 17 (Van der Merwe)]
July 2011 to June 2012. We could however implement PMS for TASK Post levels ±10 - 19 to be functional as from October 2010. PMS for TASK Post levels 6 - ±10 are currently being implemented to be operational from the fourth quarter (April 2011) of the 2010/11 financial year. PMS for TASK Post levels 3 - 5 will be implemented with effect from July 2011 to be operational by the end of the second quarter of the 2011/12 financial year. When regard is had to the aforementioned it is clear that we are ahead of schedule.
7.4 BASIC SERVICE DELIVERY 7.4.1 Formalisation of Informal settlements
Priority Turn Around Focus Area
FORMLISATION OF INFORMAL SETTLEMENTS
July 2011 (Current Situation) Unpack
(a) Situation as at July 2011 - A number of 3682 informal housing units in 12 informal areas
(b) Operational tasks
Cleaning of informal settlements and ablution facilities.
Increase of ablution and potable water infrastructure.
Maintenance of ablution and potable water facilities.
Relocation of informal units in respect of emergency and where land is needed for development.
Management of migration in informal areas
Registering of families on municipal waiting list for housing.
(c) Short comings
Solutions to address vandalism to infrastructure.
To improve the management of informal settlements
Provision of electricity to all residents.
Formalisation of all informal settlements/sites

- 93 –
___________________________________________________________________________
Final Integrated Development Plan 2012/13
Causes
High number of influx
/immigration Shortage of land and funding
Target for June 2012 (Changed Situation) Output
To improve the management of informal settlements.
Formalisation of at least two more informal settlements.
Increase of ablution facilities and potable water
Municipal Action
To formalise informal settlements and the rendering of an informal management service.
Unblocking Action Needed from other Spheres and Agencies (e.g. intervention or technical support)
Provision of allocation to municipalities for formalisation and management of informal settlements.
Budget
Municipal
Operational : R 2,410,000.00
Provincial
MSIG : R90, 000.00
National
None
Progress:
FORMALISATION OF INFORMAL SETTLEMENTS
Appointed a new service provider for management of informal settlements: The appointment was done in May 2010 and service provider commenced with duties on 1 June 2010.
Formalisation of at least two more informal settlements:
o In progress with the process to formalise Mandela Square, Zwelihle, o Awaiting Town Planning’s approval for land availability for the
formalisation of an area of Mashakhane, Gansbaai.
Increase of ablution facilities and potable water: o 4 new toilets were built at Overhills and 4 in Mandela Square. o The total number of toilets is 245 units, with a ratio of one toilet per
15 families. o 115 water taps are installed in the informal settlements.
7.4.2 Access and maintenance of municipal roads
Priority Turn Around Focus Area
Access and maintenance of municipal roads
July 2011 (Current Situation) Unpack
(a) Infrastructure: Tarred Road network:
454km Gravel roads: 161km
(b) Operational tasks
Attending to maintenance requests.
General maintenance on road network eg. potholes and catch pits.
Resealing of tarred roads. Tarring of gravel roads. Maintenance of signage and
road marks. (c) Shortcomings
Shortage of funding to improve tarring and reseal programmes.
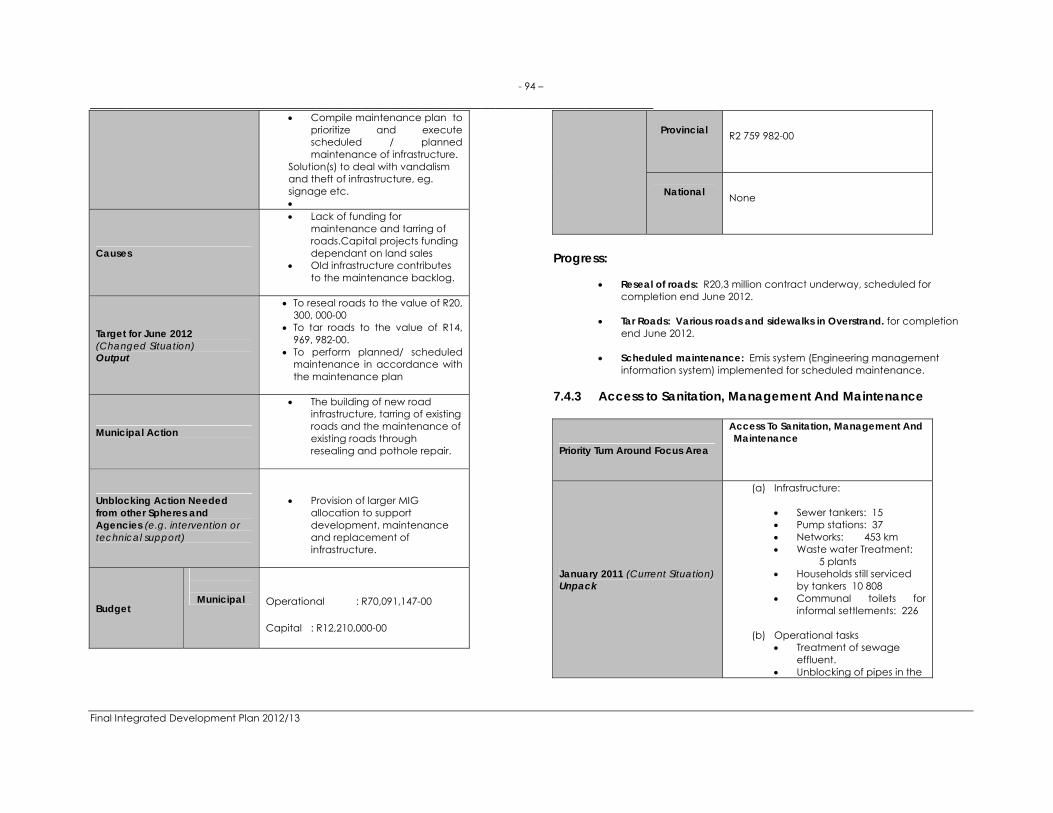
- 94 –
___________________________________________________________________________
Final Integrated Development Plan 2012/13
Compile maintenance plan to prioritize and execute scheduled / planned maintenance of infrastructure.
Solution(s) to deal with vandalism and theft of infrastructure, eg. signage etc.
Causes
Lack of funding for maintenance and tarring of roads.Capital projects funding dependant on land sales
Old infrastructure contributes to the maintenance backlog.
Target for June 2012 (Changed Situation) Output
To reseal roads to the value of R20, 300, 000-00
To tar roads to the value of R14, 969, 982-00.
To perform planned/ scheduled maintenance in accordance with the maintenance plan
Municipal Action
The building of new road infrastructure, tarring of existing roads and the maintenance of existing roads through resealing and pothole repair.
Unblocking Action Needed from other Spheres and Agencies (e.g. intervention or technical support)
Provision of larger MIG
allocation to support development, maintenance and replacement of infrastructure.
Budget
Municipal
Operational : R70,091,147-00
Capital : R12,210,000-00
Provincial R2 759 982-00
National None
Progress:
Reseal of roads: R20,3 million contract underway, scheduled for completion end June 2012.
Tar Roads: Various roads and sidewalks in Overstrand. for completion
end June 2012.
Scheduled maintenance: Emis system (Engineering management information system) implemented for scheduled maintenance.
7.4.3 Access to Sanitation, Management And Maintenance
Priority Turn Around Focus Area
Access To Sanitation, Management And Maintenance
January 2011 (Current Situation) Unpack
(a) Infrastructure:
Sewer tankers: 15 Pump stations: 37 Networks: 453 km Waste water Treatment:
5 plants Households still serviced
by tankers 10 808 Communal toilets for
informal settlements: 226 (b) Operational tasks
Treatment of sewage effluent.
Unblocking of pipes in the

- 95 –
___________________________________________________________________________
Final Integrated Development Plan 2012/13
network as and when they occur.
Rendering of sewer tanker service to test, empty septic and conservancy tanks on request.
Maintenance of infrastructure.
Installing new domestic connections.
The systematic servicing of valves in the network.
(c) Shortcomings
Compile maintenance plan to prioritize and execute scheduled / planned maintenance of infrastructure.
Solution(s) to deal with vandalism and theft of infrastructure
To improve technical capacity.
To expand network/network capacity to phase out tanker service.
Constraint to compensate overtime more than 10 hours per working week.
Causes
Lack of funding for maintenance.
Lack of funding to provide network infrastructure
Old infrastructure contribute to the maintenance backlog.
No system in place to effectively manage scheduled maintenance of infrastructure /assets.
Scarcity of skilled personnel. Management of overtime is a
legal prescription.
Target for June 2012 (Changed Situation) Output
Higher budget priority to maintain and extend infrastructure.
To implement an electronic system to perform planned/ scheduled maintenance
To perform planned/ scheduled maintenance in accordance with the maintenance plan
Municipal Action
To build and maintain the
sanitation services infrastructure to ensure all households including indigents have access to a reliable sanitation service.
Training for operators: 6 Operators undergoing NQF2 & 3 training at Bredasdorp (DWA service provider
Unblocking Action Needed from other Spheres and Agencies (e.g. intervention or technical support)
Provision of larger MIG
allocation to extend the infrastructure.
Budget
Municipal
Operational: R43, 604, 481-00
Capital: R22, 174, 800-00
Provincial R7, 288, 721-00
National None
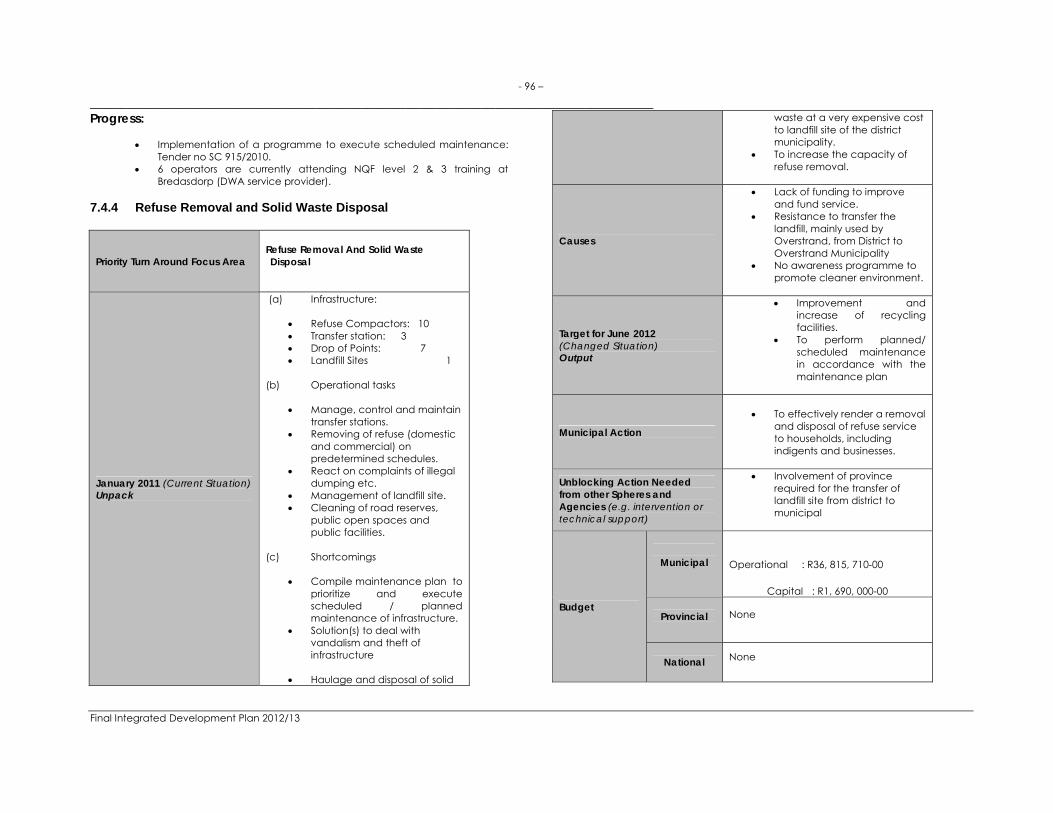
- 96 –
___________________________________________________________________________
Final Integrated Development Plan 2012/13
Progress: Implementation of a programme to execute scheduled maintenance:
Tender no SC 915/2010. 6 operators are currently attending NQF level 2 & 3 training at
Bredasdorp (DWA service provider). 7.4.4 Refuse Removal and Solid Waste Disposal
Priority Turn Around Focus Area
Refuse Removal And Solid Waste Disposal
January 2011 (Current Situation) Unpack
(a) Infrastructure:
Refuse Compactors: 10 Transfer station: 3 Drop of Points: 7 Landfill Sites 1
(b) Operational tasks
Manage, control and maintain transfer stations.
Removing of refuse (domestic and commercial) on predetermined schedules.
React on complaints of illegal dumping etc.
Management of landfill site. Cleaning of road reserves,
public open spaces and public facilities.
(c) Shortcomings
Compile maintenance plan to prioritize and execute scheduled / planned maintenance of infrastructure.
Solution(s) to deal with vandalism and theft of infrastructure
Haulage and disposal of solid
waste at a very expensive cost to landfill site of the district municipality.
To increase the capacity of refuse removal.
Causes
Lack of funding to improve and fund service.
Resistance to transfer the landfill, mainly used by Overstrand, from District to Overstrand Municipality
No awareness programme to promote cleaner environment.
Target for June 2012 (Changed Situation) Output
Improvement and increase of recycling facilities.
To perform planned/ scheduled maintenance in accordance with the maintenance plan
Municipal Action
To effectively render a removal
and disposal of refuse service to households, including indigents and businesses.
Unblocking Action Needed from other Spheres and Agencies (e.g. intervention or technical support)
Involvement of province required for the transfer of landfill site from district to municipal
Budget
Municipal
Operational : R36, 815, 710-00
Capital : R1, 690, 000-00
Provincial None
National None

- 97 –
___________________________________________________________________________
Final Integrated Development Plan 2012/13
Progress:
Improve Recycling facilities: Mechanical material recovery system commissioned in Hermanus.
7.4.5 Access to Water, Management And Maintenance
Priority Turn Around Focus Area
Access to Water, Management And Maintenance
January 2011 (Current Situation) Unpack
(a) Infrastructure:
Reservoirs: 45 Pump stations: 22 Networks: 910 km Water Treatment: 4 plants Boreholes: 11 Connections to formal
households: 26 853 Communal taps for informal
settlements: 178 (b) Operational tasks
Treatment of water for human consumption.
Repairing of burst pipes in the network as and when they occur is critical to avoid water wastage and inconvenience to consumers.
Replacement of defective meters
Installing new domestic and fire service connections.
The systematic servicing of valves in the network.
Respond to poor water pressure complaints.
(c) Short comings
Water loss management in order to minimise losses.
Solution(s) to deal with vandalism
and theft of infrastructure To improve technical
capacity. Compile maintenance plan to
prioritize and execute scheduled / planned maintenance of infrastructure.
Causes
Lack of funding for maintenance.
Old infrastructure contributes to the maintenance backlog.
No system in place to effectively manage scheduled. Maintenance of infrastructure /assets.
Scarcity of skilled personnel.
Target for June 2012 (Changed Situation) Output
Higher budget priority for maintenance of infrastructure.
To perform planned/ scheduled maintenance in accordance with the maintenance plan
To implement the water meter replacement programme.
To replace a portion of the ageing network, prioritised by highest leakage figures.
To source suitably qualified operators
Municipal Action
To build and maintain the water services infrastructure to ensure all households including indigents have access to clean and reliable water supply
Unblocking Action Needed from other Spheres and Agencies (e.g. intervention or technical support)
Provision of larger MIG
allocation to support maintenance and replacement of infrastructure.

- 98 –
___________________________________________________________________________
Final Integrated Development Plan 2012/13
Budget
Municipal
Operational :R 90,087,388-00 Capital :R 57, 610, 200-00
Provincial R1, 822, 326-00
National None
Progress:
Water meter replacement : Appoint contractor to implement SC1024/2011
Training for operators: 6 Operators undergoing NQF2 & 3 training at Bredasdorp (DWA service provider)
7.4.6 Access to electrical, management and maintenance
Priority Turn Around Focus Area
Access to electrical, management and maintenance
January 2010 (Current Situation) Unpack
(a) Infrastructure:
(i) Switching Stations: 8 (ii) MV Cables: 64km (iv) MV Overhead Lines: 65km (v) Mini substations: 134 (vi) Transformers: 81 (vii) Ring Main Units (RMU’s): 9 (viii) Metering Units: 4 (ix) LV Cables: 110km (x) LV Overhead Lines:10km (xi) Distribution kiosks: 1174 (xii) Streetlights: 1244
(b) Operational tasks (i) Supply reliable electricity to
consumers. (ii)React to complaints timeously. (iii) Audit of service connections and meters. (iv)Reduce non technical losses - regular inspections. (v) Install new service connections.
(c) Shortcomings (i) Proper maintenance plan (ii) Maintenance programme (iii) Solution(s) to deal with vandalism and theft of infrastructure (iv) Long Supply Chain process. (v) Shortage - well trained staff.
Causes
Lack of funding for maintenance (i) Insufficient funds for maintenance. (ii)Old infrastructure contributes to the
maintenance backlog. (iii)Lack of maintenance program. (iv)Lack of maintenance plan. (v) Lack of high-tech training. ((vi) Scarcity of well trained
experienced staff.
Target for June 2011 (Changed Situation) Output
(i) Spend allocated capital and operational budget.
(ii) To implement an electronic system to perform planned/scheduled maintenance
(iii) Regular electrical meter audits. (iv) To replace a portion of the
ageing network.
Municipal Action
To supply reliable, affordable and cost effective electricity to all households including indigents

- 99 –
___________________________________________________________________________
Final Integrated Development Plan 2012/13
Unblocking Action Needed from other Spheres and Agencies (e.g. intervention or technical support)
(i) Provision of more MIG and INEP
funding to support maintenance and replacement of infrastructure.
Budget
Municipal
Provincial
National
Progress:
Operations
o The internal municipal electrical network is stable and provides reliable electricity to all consumers.
o Losses in the electrical system are down to 8.3% for the 12 months period to March 2011.
o Customer service: 95% of requests and complaints are dealt with within 48 hours.
Maintenance o The Electrical Maintenance budget for 2010/11 is R47 266 165. o Expenditure on maintenance to 31 March 2011 is R30 489 534
(65% of budget). o A draft Maintenance Plan as well as draft Maintenance
Procedures were compiled and submitted to the Director for comments.
Capital projects o The Electrical Capital budget for 2010/11 is R37 340 000. o Expenditure on the electrical capital budget to 31 March 2011
is R16 574 696 (44% of budget) with another R18 612 683 already committed. In total 94% of the budget is already spent or committed.
o
7.5 Supply Chain Management
SUPPLY CHAIN MANAGEMENT
Priority Turn Around Focal Area Procurement of Goods and Services
January 2010 (Current Situation) Unpack
The Overstrand Municipality currently faces a challenge with regard to the procurement of goods and services. User departments are obtaining quotes for goods/services, taking time away from their core functions, this may ultimately affect service delivery as vital time is lost by functional staff performing administrative tasks.
Causes
Supply Chain Management has been implemented by the Municipality since July 2005. However, there was never sufficient capacity and resources available to deliver an optimal service to the departments in the Municipality.
Target for June 2011 (Changed Situation) Output
A purchasing section will be fully functional between January 2011 and July 2011. This will enable the Supply Chain Management Unit to deliver an efficient service to all departments in the Municipality and minimise the time lost by functional staff in the procurement of goods and services.
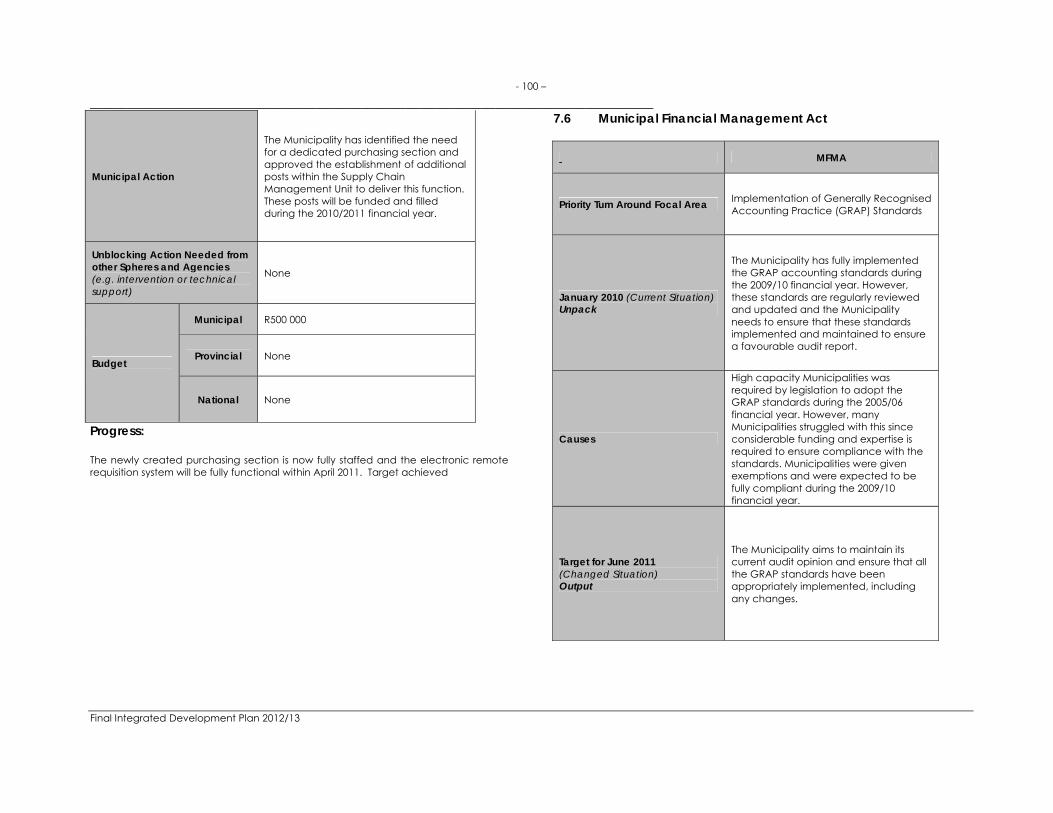
- 100 –
___________________________________________________________________________
Final Integrated Development Plan 2012/13
Municipal Action
The Municipality has identified the need for a dedicated purchasing section and approved the establishment of additional posts within the Supply Chain Management Unit to deliver this function. These posts will be funded and filled during the 2010/2011 financial year.
Unblocking Action Needed from other Spheres and Agencies (e.g. intervention or technical support)
None
Budget
Municipal R500 000
Provincial None
National None
Progress: The newly created purchasing section is now fully staffed and the electronic remote requisition system will be fully functional within April 2011. Target achieved
7.6 Municipal Financial Management Act
MFMA
Priority Turn Around Focal Area Implementation of Generally Recognised Accounting Practice (GRAP) Standards
January 2010 (Current Situation) Unpack
The Municipality has fully implemented the GRAP accounting standards during the 2009/10 financial year. However, these standards are regularly reviewed and updated and the Municipality needs to ensure that these standards implemented and maintained to ensure a favourable audit report.
Causes
High capacity Municipalities was required by legislation to adopt the GRAP standards during the 2005/06 financial year. However, many Municipalities struggled with this since considerable funding and expertise is required to ensure compliance with the standards. Municipalities were given exemptions and were expected to be fully compliant during the 2009/10 financial year.
Target for June 2011 (Changed Situation) Output
The Municipality aims to maintain its current audit opinion and ensure that all the GRAP standards have been appropriately implemented, including any changes.

- 101 –
___________________________________________________________________________
Final Integrated Development Plan 2012/13
Municipal Action
Keeping up to date with changes in accounting standards by attending training and workshops. Transferring knowledge and skills to all staff in the Municipality to ensure that the requirements of the standards are understood and implemented by all the relevant role players.
Unblocking Action Needed from other Spheres and Agencies (e.g. intervention or technical support)
None
Budget
Municipal None
Provincial None
National R1 000 000
Progress:
The relevant staff has kept up to date with GRAP standards through attending training and workshops. The Municipality has maintained its current audit opinion and endeavours to continue to do so.
102
_______________________________________________________________________
CHAPTER 8 Service Level Agreements In line with its Vision - to be a centre of excellence to the community - the Overstrand Municipality has developed a comprehensive customer care strategy. This has now rolled out into consumer services charters for the following departments: electricity, water and sanitation, solid waste management and roads and stormwater. The IDP process will be used as the main consultation mechanism to fine-tune the charters with the communities.
CONSUMER CARE CHARTER
PREAMBLE As it is our vision to be a centre of excellence for the community and our mission to deliver optimal services in support of sustainable economic, social and environmental goals; And in acknowledgement of the legal framework in which we have to operate and comply with, amongst others:
The Constitution of the Republic of South African, 1996; Act 108 of 1996;
The White Paper on Local Government, March 1998;
Local Government: Municipal Structures Act, 1998;
Local Government: Municipal Systems Act, 2000;
Local Government: Municipal Finance Management Act and Regulations, 2003;
The Batho Pele Principles;
Occupational Health and Safety Act 85 , 1993; and
The Protection of Information Act, 1982;
In compliance with various internal policies to enhance service delivery, such as
our Telephone Policy; our policy to respond to written requests, complaints or
queries within 14 working days, and if an investigation is needed to resolve the matter, within 30 working days;
the review of prescribed fees and tariffs at least annually
through a transparent process during which an effort will be made to keep the tariff and fees affordable for our consumers in terms of our Tariff Policy; and
In case of a planned interruption of a service we will give
at least 5 days’ notice of such interruption and will also indicate the anticipated duration of the stoppage
And in anticipation that you as client will
Pay municipal taxes and service accounts in full on the due date as displayed on your bill or let us know as soon as possible should you have any difficulty to pay the account before that date;
Notify us immediately of any change of address and/or ownership of the property for billing purposes.
We have built and will maintain a sound customer management system focused on good customer relations and customer satisfaction and undertake the following with regard to our service delivery in general
103 ____________________________________________________________________________________________________________
Final Integrated Development Plan 2012/13
To have a customer information officer on call 24 hours a day, 7 days a week to handle your complaints and enquiries;
To ensure that 80% of all calls are answered within 20
seconds; To provide the complainant with information regarding
the progress towards the resolution of his or her complaint or enquiry;
To project a positive approach, focus on solutions and
provide a “can do” attitude;
To do the best to provide a resolution that is to the satisfaction of all parties involved, within the bounds of legislative and policy requirements;
To treat your complaint in an open and accountable
manner and use it as an opportunity to learn and improve our service delivery to you; and
To render services to our customers in a cost effective
manner Furthermore we commit ourselves to the following regarding specific services:
ROADS AND STORM WATER INFRASTRUCTURE
Our purpose To provide acceptable and safe roads and storm water infrastructure in accordance with the standards and specifications for municipal authorities. Service quality We commit ourselves to –
Provide an efficient and safe road and storm water network that best meet the needs and priorities of all communities across the municipal area;
Clarify the allocation of responsibility between road
authorities (e.g. the Provincial Government and the Municipality) for managing different sections of road and storm water networks;
Minimise disruptions to traffic and ensure the safety of
road users as a result of service authorities and others undertaking works on roads;
Implement a programme to execute planned
maintenance of road and stormwater infrastructure; and
Ensure that the storm water systems will minimise the effect of periodic floods.
Our service standards We will ensure that –
104 ____________________________________________________________________________________________________________
Final Integrated Development Plan 2012/13
Roads are maintained on a sound technical basis through the use of a Pavement Management System (PMS) in order to identify roads that need to be resealed and/or rehabilitated.
All complaints are recorded and a reference given for
further enquiries
90% of complaints and enquiries are resolved within 30 days
Road signs, street markings and street names are
maintained
In case of emergency flooding, have alternative routes in place so that the public is not disrupted for more than 24 hours.
Repair potholes within 30 working days after they have
been reported.
Storm water drainage structures within and outside the road reserve will be maintained 2 X per year in order to prevent flooding of roads and surrounding properties during downpours.
Our agreement with you
Roads and storm water systems will be upgraded in such a manner that the least inconvenience will be caused during peak traffic periods and adverse weather conditions.
Roads in the central business area will be swept once a
week.
Measures will be taken to minimise disruption during periods of construction or maintenance.
Road surface and storm water systems will be cleared
from any hazardous waste to comply with environmental standards.
At specified time frames annually we will
o reseal and patch roads; o maintain sidewalks; and o maintain gravel roads.
Road markings will be painted at all intersections as well
as centre lines on primary roads;
Notice of planned road closures will be given 24 hours before such closures
As an owner, occupier or consumer we request you to:
Adhere to the relevant acts and regulations when using the road network or disposing of waste water into the storm water system.
Not dispose of any foreign objects or pour oil, grease,
paints, solvents, weed killer, toxic chemicals or garden refuse into the storm water system.
Not obstruct damage or interfere with any road or storm
water system so that is causes inconvenience or danger to any member of the public.
Notify the Municipality of any defect or potential hazard
that may cause damage to property of either the municipality or the public.

105 ____________________________________________________________________________________________________________
Final Integrated Development Plan 2012/13
ELECTRICITY
Our purpose To provide electricity and public lighting that satisfy our consumers and communities whilst operating within sound business principles and required safety standards. Quality of electricity supply We commit ourselves to
Provide electricity of a quality, reliability and safety as
stipulated in national legislation, NERSA licensing conditions including national compulsory standards (NRS 041, - 047, - 048, 057, – 082).
Supply voltage at 230V (+ 10% deviation) between phase
and neutral for single phase connections, and 400V (+ 10% deviation) phase-to-phase on three phase connections.
Limit planned interruptions to not more than twice per
year, with maximum 8 hours interruption per event. Our service standards We will
Install new connections within
- 20 working days of receiving the application, if existing infrastructure is adequate and all requirements are met.
- 30 working days of receiving the application and prescribed fees, or as otherwise agreed, if network extensions/upgrading are required.
Answer customer calls within 20 seconds and on request
provide an enquiry number.
Respond to complaints on faulty streetlights
- 95% of complaints to be resolved within 10 working days
- 100% of complaints to be resolved within 15 working
days.
Respond
- immediately to any reports of unsafe electrical infrastructure or any other urgent unsafe condition;
- within 2 hours to any network faults; and
- within 10 working days of receiving a request for
verification of a meter.
Provide a quotation for services requested within 10 working days of receiving the request, or if an investigation is needed, within 30 days.
Read electricity meters at least once in every 3 month
cycle. Allow at least 14 days after the date for payment
stipulated on the account, before any disconnections are done.

106 ____________________________________________________________________________________________________________
Final Integrated Development Plan 2012/13
Ensure that reconnections are done within one working day after all outstanding amounts and reconnection fees have been paid in full.
Provide easily accessible and vending points for
purchase of pre-payment tokens some of which must be open to the public 24 hours per day, and seven days per week.
Give notice of planned interruptions at least 48 hours in
advance. We are committed to:
Develop and maintain the electrical infrastructure to ensure all households, including indigents, have access to reliable and safe basic electricity supply.
Ensure accurate and reliable metering systems, as well as
an open and transparent approach to the cost of electricity services.
Our agreement with you
Your application for electricity services constitutes an agreement between you and the Municipality in terms of which you pay the prescribed fee to connect to the services and thereafter your monthly invoice based on the tariff charged for the category of service you required.
All aspects of the rendering of electrical services are
governed by the Electricity Services By-law, as promulgated on 19 December 2008 in the Provincial Gazette of the Western Cape (also available on the municipal website).
Consolidated accounts are rendered monthly to the address on record at the Municipality. It is important, however, to note that not receiving your account does not relieve you of the obligation to pay for the services received. It is your responsibility to enquire from the Municipality if you do not receive your account in order to make timely payment.
Where a fixed fee is levied you as the owner or consumer
must pay it irrespective of whether the electricity services are used or not.
If you are not satisfied with your account, you may submit
a reasoned written objection prior to the payment date but you are still liable for the payment until the matter is resolved through a process set out in the by-law.
You may terminate your agreement with 5 working days’
written notice, or the Municipality may terminate it if you have not used the service for a period of 6 months without arranging for its discontinuation, or you fail to pay for the service, or if you in any other way fail to comply with the by-law or compliance notices issued as per the by-law.
Full payment of outstanding fees, including interest, a re-connection fee and other conditions as may be determined by the Municipality, will apply when terminated services are requested to resume.
Entry to your premises
Only authorised officials of the Municipality or its service providers clearly identifiable as such may require entry to your property.
We will give consumers at least two day notice if an
authorised official needs to gain entry to your property to

107 ____________________________________________________________________________________________________________
Final Integrated Development Plan 2012/13
do an inspection or an investigation, unless such person is performing an inspection on unlawful use of electricity, in which case he may enter the premises at any time of the day and unannounced. Such person may request information to perform his duties.
In case of an emergency an authorised official has the
power of entry without prior notice.
Unless found that the consumer contravened the by-law, we will bear the expenses and restore the premises to its former condition if any work was done by us on your premises.
Restrictions and cut-offs
If circumstances so require, we may impose electricity restrictions in the whole or part of the Overstrand supply area.
As part of a load shedding programme in an emergency,
we may interrupt the supply of electricity to any premises without prior notice.
If a consumer is in breach of his agreement or the by-law
we will give 14 days’ written notice and thereafter proceed to cut electricity supply to the premises.
As an owner, occupier or consumer, we request you to
Adhere to relevant acts, regulations, the Electricity Services By-Law and electricity reduction notices.
Ensure your household wiring is properly maintained and
engage an appropriately licensed electrician to carry out any new wiring as per SANS 10142-1.
Let us know promptly of any service difficulties or faults.
Not tamper with the municipal electricity services and meter and to please report illegal tampering.
Take adequate steps to protect your electrical
appliances against damage due to interruptions and fluctuation in the electricity supply.
Not redistribute electricity to any third parties.
Ensure the electricity meter is free from obstruction to
allow easy access for reading and maintenance.
Always treat your electricity supply as alive, even during interruptions.
Let us know as soon as possible should you have any
difficulty to pay your account before the due date.
Conserve electricity and make saving electricity a way of life.

108 ____________________________________________________________________________________________________________
Final Integrated Development Plan 2012/13
WATER AND SANITATION Our purpose To provide consumers with potable water and appropriate sanitation services. Water services quality
We commit ourselves to supply - where the infrastructure
allows - water that meets the standards set out for drinking water (SANS 0241) and treat effluent to a standard prescribed by law before disposal thereof back into our water sources.
We have a water quality programme in terms of which
potable water is frequently sampled at various places and tested by an independent laboratory. The results of our treated water and effluent are reported monthly to the Department of Water Affairs and thus monitored nationally.
We strive to annually obtain Blue Drop status for all our
water purification works and Green Drop for our waste water treatment plants
Our service standards We will
Respond to any reports about poor water quality within 12 business hours;
Ensure that prolonged water supply interruptions (12
hours) are not more than 3 times per annum;
Give 2 days prior notice in case of planned interruptions;
Have an alternative supply of water available to meet basic needs in case of unplanned interruptions that last longer than 24 hours;
Install new connections within 10 working days of
receiving the application and all prescribed requirements have been met;
Clean up sewer overflows due to blockages or our system
failure within 24 hours; Report the spillage of sewerage in a watercourse to the
relevant authorities within 24 hours of such occurrence;
Promote the use of alternative water sources for irrigation and industry. Note that the use of grey water is allowed, but we may inspect such use and impose conditions;
Upgrade telemetry systems, to act as an early warning
system for e.g. pipe failures and reservoir overflows;
Replace old consumer water meters in phases We will not be liable for damage to property caused by fittings left open when water supply is reinstated following an interruption.
We are committed to
Develop and maintain the water services infrastructure to ensure all households, including indigents, have access to clean and reliable basic water supply and appropriate sanitation services.
Ensure accurate and reliable metering systems and an
open and transparent approach to the cost of water services.

109 ____________________________________________________________________________________________________________
Final Integrated Development Plan 2012/13
With regard to entry to your premises:
Only authorised officials of the Municipality or its service providers clearly identifiable as such may require entry to your property, unless it is a case of an emergency
Unless found that the consumer contravened the by-law,
we will bear the expenses and restore the premises to its former condition if any work was done by us on your premises.
Restrictions, cut-offs
If circumstances require it, we may impose water restrictions in the whole or part of the Overstrand.
We may interrupt the supply of water to any premises without prior notice in an emergency or where water losses occur.
If a consumer is in breach of his agreement or the Water
Services By-law, we will give 14 days’ written notice and thereafter proceed to restrict or cut water supply to the premises.
As an owner, occupier, or consumer, we request you to
Adhere to relevant acts, regulations, the Water Services By-law and water restriction notices.
Conserve water and make saving water a way of life.
Ensure the water meter is free from obstruction to allow
easy access for reading and maintenance.
Keep your sewer inspection point free of obstruction and ensure the sewer boundary chamber is always accessible to the Municipality.
Do not drink water clearly marked “not for drinking”.
Ensure your household plumbing is properly maintained
and engage an appropriately licensed plumber to carry out any plumbing tasks.
Let us know promptly of any service difficulties or faults.
Do not tamper with the municipal water services system
and please report illegal tampering.
Maintain pipes and fittings on your side of the meter and report leaks on the municipal side.
Do not flush foreign objects or pour oil, grease, paints,
solvents, weed killer, toxic chemicals or other harmful materials into the sewer system.
110 ____________________________________________________________________________________________________________
Final Integrated Development Plan 2012/13
Solid waste management
Our purpose To provide consumers with appropriate and acceptable solid waste services. Solid waste services quality We commit ourselves to
Provide you with:
o an excellent and efficient door-to-door refuse collection service for formal housing every week on the same day even if that day is a public holiday
o mini disposal sites and communal bins for informal
housing; and
o drop-off points, transfer stations and landfills that are centrally located and licensed under the Waste Act.
Utilise the two bag system (black bag = wet waste, clear
bag = recycling) to promote recycling and minimise waste to landfill.
Give you information and advice on solid waste matters via the municipal newsletter.
Our service standards We will
Respond to complaints within 24 business hours. Keep streets, pavements and central business areas
clean and litter free with the help of street sweepers, private cleaning contractors.
Provide - Service bins on the pavements, public open spaces
and sight-seeing points to prevent littering; - Dedicated bins for the disposal of poisons,
chemicals and electrical waste at the transfer stations; and
- Baboon proof bins in problem animal areas upon
payment.
Chip garden refuse at transfer stations and drop-offs to produce compost and further minimise waste to landfill.
We are committed to
Ensure an efficient waste service to all our customers. Provide good quality solid waste facilities according to
the new Waste Act.
Our agreement with you
The Municipality renders a service for the collection and removal of business and domestic refuse from premises at such charges as it may determine by resolution.

111 ____________________________________________________________________________________________________________
Final Integrated Development Plan 2012/13
No person will be entitled to exemption from or a
reduction in a charge merely on the grounds that he or she makes no or limited use of the service. Availability tariffs are charged on empty plots, as determined by Council resolution from time to time.
If the Municipality is of the opinion that a business creates a nuisance, health risk, odour or a danger to the public due to insufficient removals the Municipality may instruct the owner to make use of additional refuse services at an extra cost.
The number of bags/containers to be removed from each residential plot per collection will be determined by the Municipality.
The occupier of premises on which domestic/business waste is generated or - in the case of premises being occupied by more than one occupier, the owner of such premises - must notify the Municipality in writing within 7 days of the commencement of the generation of such refuse
- that the premises are being occupied
- whether a refuse removal services is required for a private dwelling or a business.
The owner or occupier of business premises must notify
the Municipality in writing when the removal of refuse is no longer required. Prescribed charges are payable until the end of the calendar month following the month in which the notice of cancellation was received.
Entry to your premises
The occupier of premises must grant the Municipality access for collecting and removing refuse and must ensure that nothing obstructs or hinders the refuse collectors in the rendering of their service.
Where, in the opinion of the Municipality, the collection or
removal of refuse is likely to result in damage to the premises or municipal property or injury to refuse collectors or any other person, the Municipality may suspend the service and require the owner or occupier to take measures to rectify the shortcomings where after the service will resume.
Restrictions
Refuse is only allowed to be disposed of at drop-off points, transfer stations or landfills.
All removed refuse and abandoned objects become the
property of the Municipality and no person who is not duly authorised will remove or interfere with it.
Refuse must be placed in front of your premises on the
day of collection.
Refuse must be placed in the prescribed containers in front of your property in baboon affected areas
Wet waste must be disposed of in black bags, and
recycling items in clear bags supplied by the Municipality where a recycling system has been implemented.

112 ____________________________________________________________________________________________________________
Final Integrated Development Plan 2012/13
As an owner, occupier or consumer, we request you to
Practise waste minimisation by recycling more. Use all the waste facilities to the fullest and do not
practise illegal dumping.
Adhere to the call that refuse should be put out only on the day of collection.
Use baboon proof bins in problem animal areas.
Keep the pavements around your property free of refuse.
Ensure that your property is enclosed to prevent dogs
tearing the refuse bags open on the day of collection.
Inform us immediately regarding refuse problems.
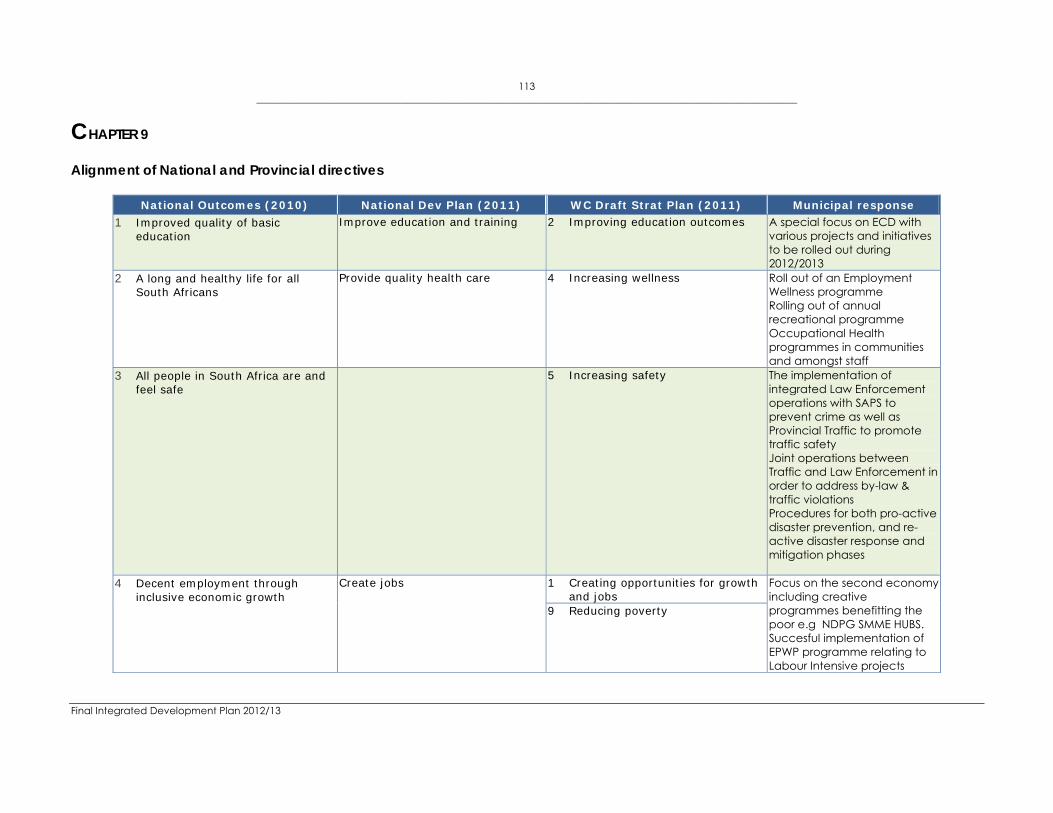
113 ____________________________________________________________________________________________________________
Final Integrated Development Plan 2012/13
CHAPTER 9 Alignment of National and Provincial directives
National Outcomes (2010) National Dev Plan (2011) WC Draft Strat Plan (2011) Municipal response
1 Improved quality of basic education
Improve education and training 2 Improving education outcomes A special focus on ECD with various projects and initiatives to be rolled out during 2012/2013
2 A long and healthy life for all South Africans
Provide quality health care 4 Increasing wellness Roll out of an Employment Wellness programme Rolling out of annual recreational programme Occupational Health programmes in communities and amongst staff
3 All people in South Africa are and feel safe
5 Increasing safety The implementation of integrated Law Enforcement operations with SAPS to prevent crime as well as Provincial Traffic to promote traffic safety Joint operations between Traffic and Law Enforcement in order to address by-law & traffic violations Procedures for both pro-active disaster prevention, and re-active disaster response and mitigation phases
4 Decent employment through inclusive economic growth
Create jobs 1 Creating opportunities for growth and jobs
Focus on the second economy including creative programmes benefitting the poor e.g NDPG SMME HUBS. Succesful implementation of EPWP programme relating to Labour Intensive projects
9 Reducing poverty

114 ____________________________________________________________________________________________________________
Final Integrated Development Plan 2012/13
National Outcomes (2010) National Dev Plan (2011) WC Draft Strat Plan (2011) Municipal response
5 A skilled and capable workforce to support an inclusive growth path
Improve education and training SMME training Contractor development programme in partnership with Department of Public works
6 An efficient, competitive and responsive economic infrastructure network
Expand infrastructure 3 Increasing access to safe and efficient transport
The implementation and roll out of the Integrated Transport Plan and Road maintenance plan
7 Vibrant, equitable and sustainable rural communities with food security for all
Transform urban and rural spaces 11 Creating opportunities for growth and development in rural areas
Sustainable foor security and harvesting projects with skills development through EPWP
8 Sustainable human settlements and improved quality of household life
6 Developing integrated and sustainable human settlements
A well developed 5 year housing plan
9 A responsive, accountable, effective and efficient local government system
Build a capable state 10 Integrating service delivery for maximum impact
Development of maintenance plans and implementation thereof
10 Environmental assets and natural resources that are well protected and continually enhanced
Use resources sustainably (transition to a low-carbon economy)
7 Mainstreaming sustainability and optimising resource use and efficiency
Implementation of the Environmental Management Plan
11 Create a better South Africa and contribute to a better and safer Africa and World
Transform society and unite the nation
8 Increasing social cohesion Integrated ward activities across diversed communities Support to various festivals
12 An efficient, effective and development oriented public service and an empowered, fair and inclusive citizenship
Build a capable state Fight corruption and enhance
accountability
12 Building the best-run regional government in the world
Building a centre of excellence by implementing the Batho Pele principles and adoption of sound policies
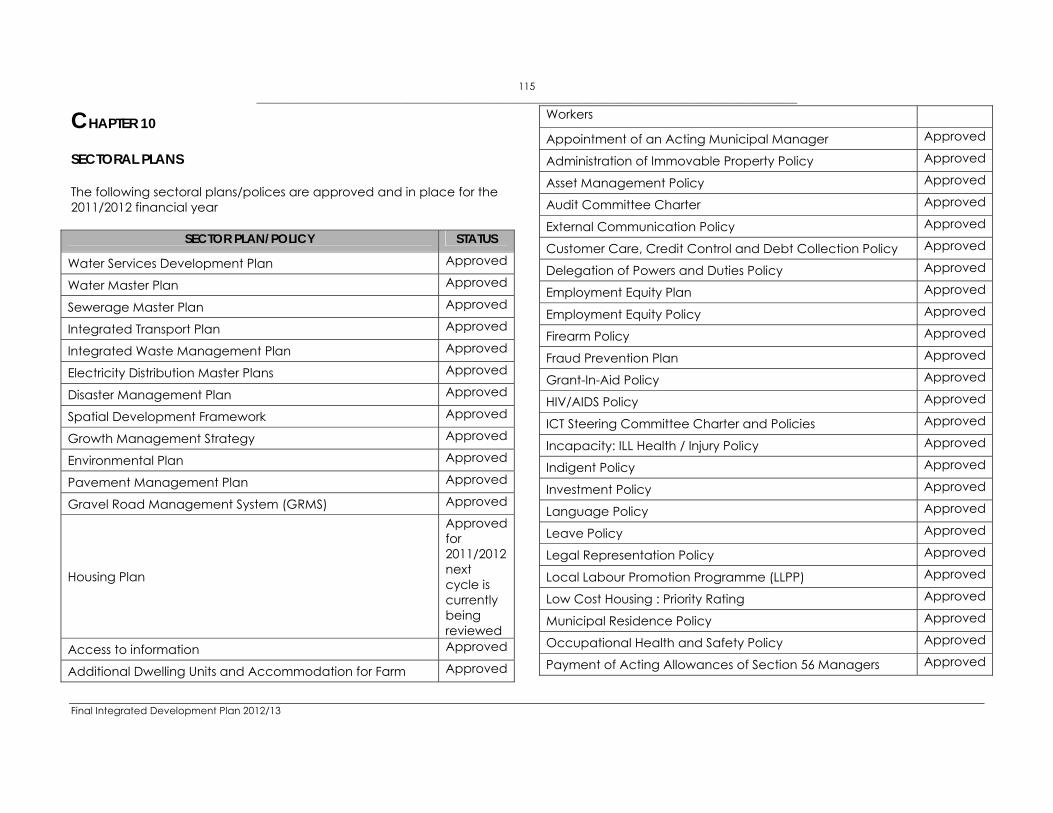
115 ____________________________________________________________________________________________________________
Final Integrated Development Plan 2012/13
CHAPTER 10 SECTORAL PLANS The following sectoral plans/polices are approved and in place for the 2011/2012 financial year
SECTOR PLAN/POLICY STATUS
Water Services Development Plan Approved
Water Master Plan Approved
Sewerage Master Plan Approved
Integrated Transport Plan Approved
Integrated Waste Management Plan Approved
Electricity Distribution Master Plans Approved
Disaster Management Plan Approved
Spatial Development Framework Approved
Growth Management Strategy Approved
Environmental Plan Approved
Pavement Management Plan Approved
Gravel Road Management System (GRMS) Approved
Housing Plan
Approved for 2011/2012 next cycle is currently being reviewed
Access to information Approved
Additional Dwelling Units and Accommodation for Farm Approved
Workers
Appointment of an Acting Municipal Manager Approved
Administration of Immovable Property Policy Approved
Asset Management Policy Approved
Audit Committee Charter Approved
External Communication Policy Approved
Customer Care, Credit Control and Debt Collection Policy Approved
Delegation of Powers and Duties Policy Approved
Employment Equity Plan Approved
Employment Equity Policy Approved
Firearm Policy Approved
Fraud Prevention Plan Approved
Grant-In-Aid Policy Approved
HIV/AIDS Policy Approved
ICT Steering Committee Charter and Policies Approved
Incapacity: ILL Health / Injury Policy Approved
Indigent Policy Approved
Investment Policy Approved
Language Policy Approved
Leave Policy Approved
Legal Representation Policy Approved
Local Labour Promotion Programme (LLPP) Approved
Low Cost Housing : Priority Rating Approved
Municipal Residence Policy Approved
Occupational Health and Safety Policy Approved
Payment of Acting Allowances of Section 56 Managers Approved

116 ____________________________________________________________________________________________________________
Final Integrated Development Plan 2012/13
Payday Policy Approved
Petty Cash Policy Approved
Performance Management System – Implementation Policy Approved
Plot Clearing Policy Approved
Project Grey Power Approved
Rates Policy Approved
Records Management Policy Approved
Recruitment and Selection Policy Approved
Retirement Planning Policy Approved
Rewards and Incentives Policy Approved
Risk Management Policy Approved
Risk Management Strategy Approved
Scarce Skills Policy Approved Section 53 of the Municipal Systems Act (Roles and Responsibilities of each Political Structure, Political Office Bearer and Municipal Manager)
Approved
Sexual Harassment Policy Approved
Smoking Control in the Workplace Policy Approved
Staff Succession Planning Policy Approved
Study Aid Policy for Employees Approved Substance Abuse: Alcohol and Drug Policy and Procedure Policy
Approved
Supply Chain Policy Approved
Task Policy Approved
Tariff Policy Approved
Telephone Policy Approved
Toegang tot Inligting Approved
Travel and Subsistence Policy Approved
Unauthorised Absence Policy Approved
Uniform and Protective Clothing Policy Approved
Virement Policy Approved
Ward Committee Rules Approved
Work Outside the Municipality’s Service Policy Approved

117 ____________________________________________________________________________________________________________
Final Integrated Development Plan 2012/13
CHAPTER 11 Ward Based Profile/ Survey
Maps and graphs attached

118 ____________________________________________________________________________________________________________
Final Integrated Development Plan 2012/13

119 ____________________________________________________________________________________________________________
Final Integrated Development Plan 2012/13
THE 2012 OVERSTRAND WARD BASED SURVEY The Overstrand Ward Based Survey was made possible by the generous support of Statistics South Africa who provided the training for the field workers and who made 56 CN3 devices (handheld GPS devices for data capturing) available for this survey. The data must still go through a evaluation process before Statistics South Africa can declare it as official. The main focus of the project was to collect socio-economic data at household level and individual level. The project is being conducted in two phases. The first phase of the project focused on what has been termed priority wards i.e. Wards: 1, 2, 4, 5, 6, 8 and 12. Ward 11 was not elected as a priority ward, but due to its small size and logistics it is also included in phase 1. The second phase will focus on all the remaining Wards and will probably take place from early July. Each ward is divided into enumeration areas. An enumeration area is made up of approximately 250 households. There are approximately 165 enumeration areas in the Overstrand based on 2001 Census EA’s, which we used. Out of these, we have selected a total of 42 enumeration areas in the selected Wards based on their population density. Based on this selection the survey focused on: Masikhane, Blompark, Mount Pleasant, Westdene, Zwelihle and Hawston as well as a small area in Stanford. The map on the previous page highlights the various surveyed areas in the selected wards. The data for each ward is also preceded with a map of the ward and the area surveyed. Data collection took place from 6 March 2012 – 11 May 2012. With the exception of Wards 2, 5, and 11, where we experienced high staff attrition, the majority of the selected areas was completed. For the purpose of this IDP we have selected some key socio-economic information for inclusion. All the information gathered could not be included to the limited space available in the IDP. We will however compile a comprehensive report on all the data captured. It should be noted that where percentages are reported here, such as in the pie charts, they do not represent population percentages but rather reflect a percentage of the relevant responses. In addition, the various population pyramids bulge in the 19-35 age group. This is normally contributed to immigration, however, the pyramids is constructed in based on the various age groups and not according to the classical 5 year age cohorts.
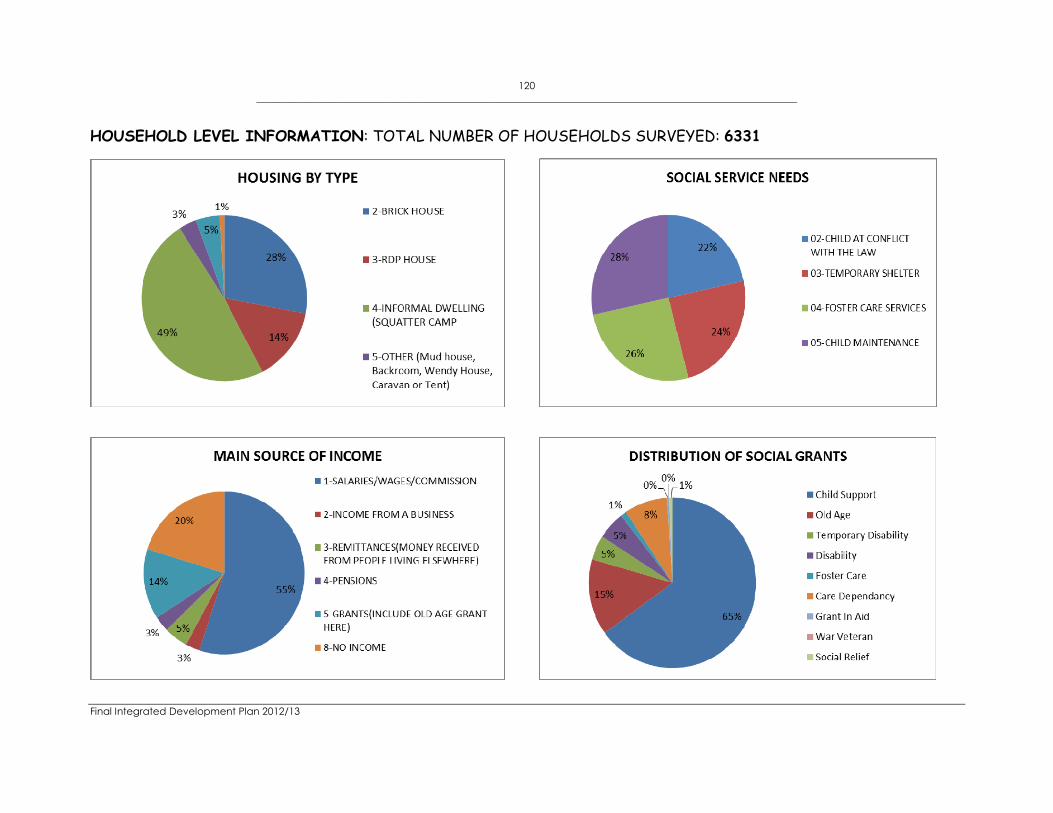
120 ____________________________________________________________________________________________________________
Final Integrated Development Plan 2012/13
HOUSEHOLD LEVEL INFORMATION: TOTAL NUMBER OF HOUSEHOLDS SURVEYED: 6331
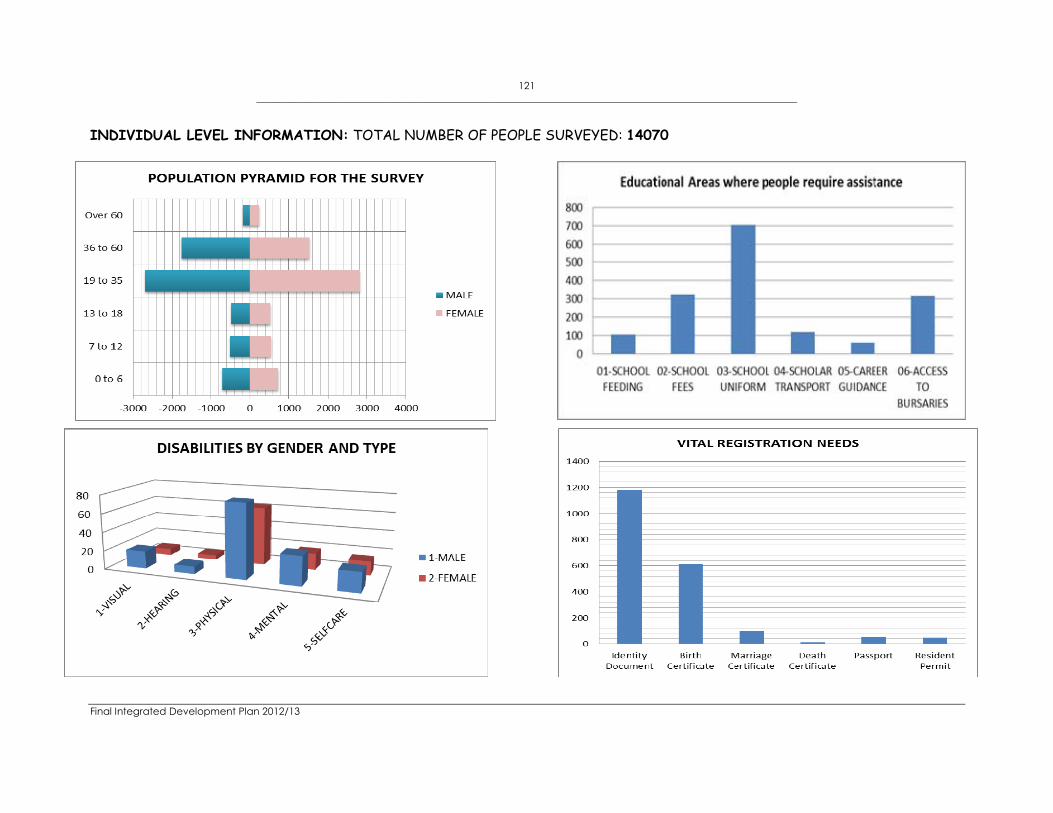
121 ____________________________________________________________________________________________________________
Final Integrated Development Plan 2012/13
INDIVIDUAL LEVEL INFORMATION: TOTAL NUMBER OF PEOPLE SURVEYED: 14070

122 ____________________________________________________________________________________________________________
Final Integrated Development Plan 2012/13
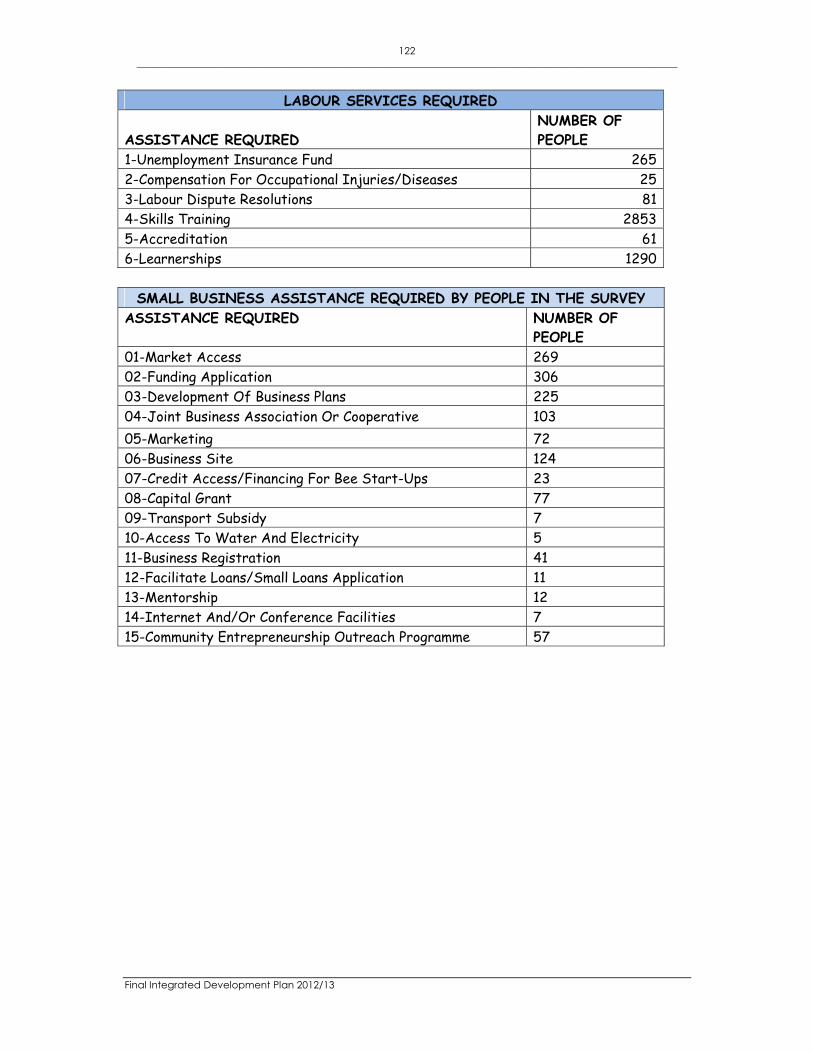
122 ____________________________________________________________________________________________________________
Final Integrated Development Plan 2012/13
LABOUR SERVICES REQUIRED
ASSISTANCE REQUIRED NUMBER OF PEOPLE
1-Unemployment Insurance Fund 265 2-Compensation For Occupational Injuries/Diseases 25 3-Labour Dispute Resolutions 81 4-Skills Training 2853 5-Accreditation 61 6-Learnerships 1290
SMALL BUSINESS ASSISTANCE REQUIRED BY PEOPLE IN THE SURVEY ASSISTANCE REQUIRED NUMBER OF
PEOPLE 01-Market Access 269 02-Funding Application 306 03-Development Of Business Plans 225 04-Joint Business Association Or Cooperative 103 05-Marketing 72 06-Business Site 124 07-Credit Access/Financing For Bee Start-Ups 23 08-Capital Grant 77 09-Transport Subsidy 7 10-Access To Water And Electricity 5 11-Business Registration 41 12-Facilitate Loans/Small Loans Application 11 13-Mentorship 12 14-Internet And/Or Conference Facilities 7 15-Community Entrepreneurship Outreach Programme 57
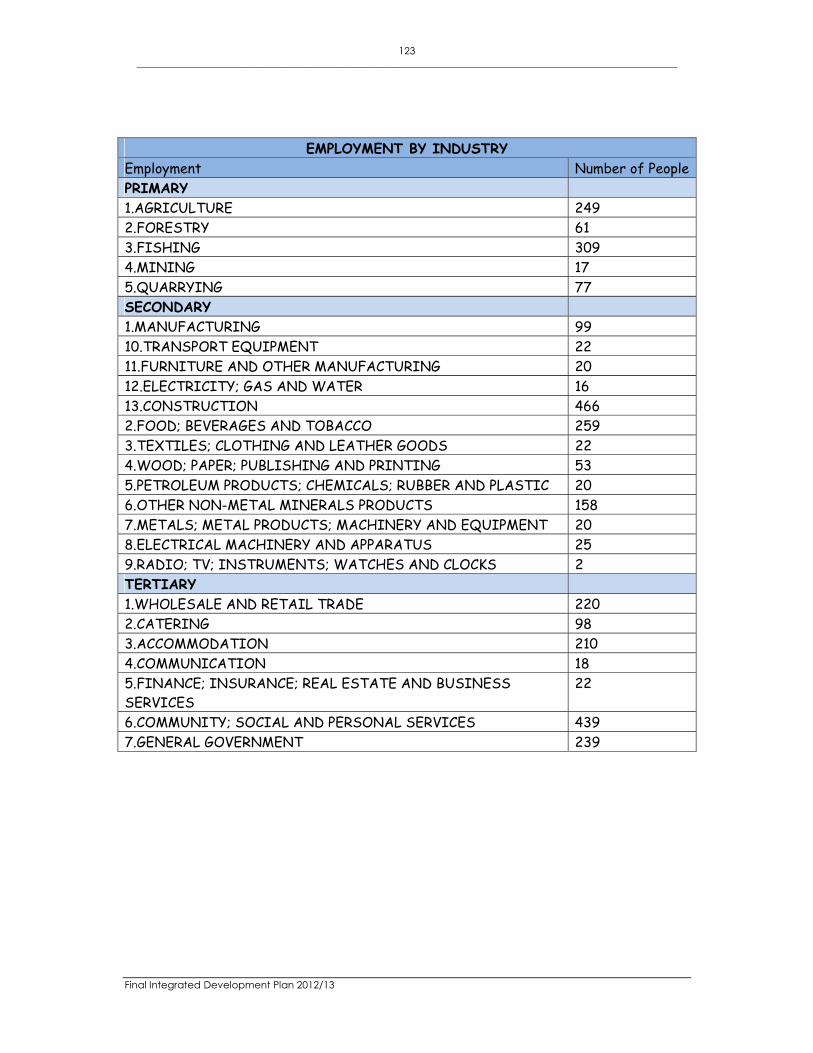
123 ____________________________________________________________________________________________________________
Final Integrated Development Plan 2012/13
EMPLOYMENT BY INDUSTRY Employment Number of People PRIMARY 1.AGRICULTURE 249 2.FORESTRY 61 3.FISHING 309 4.MINING 17 5.QUARRYING 77 SECONDARY 1.MANUFACTURING 99 10.TRANSPORT EQUIPMENT 22 11.FURNITURE AND OTHER MANUFACTURING 20 12.ELECTRICITY; GAS AND WATER 16 13.CONSTRUCTION 466 2.FOOD; BEVERAGES AND TOBACCO 259 3.TEXTILES; CLOTHING AND LEATHER GOODS 22 4.WOOD; PAPER; PUBLISHING AND PRINTING 53 5.PETROLEUM PRODUCTS; CHEMICALS; RUBBER AND PLASTIC 20 6.OTHER NON-METAL MINERALS PRODUCTS 158 7.METALS; METAL PRODUCTS; MACHINERY AND EQUIPMENT 20 8.ELECTRICAL MACHINERY AND APPARATUS 25 9.RADIO; TV; INSTRUMENTS; WATCHES AND CLOCKS 2 TERTIARY 1.WHOLESALE AND RETAIL TRADE 220 2.CATERING 98 3.ACCOMMODATION 210 4.COMMUNICATION 18 5.FINANCE; INSURANCE; REAL ESTATE AND BUSINESS SERVICES
22
6.COMMUNITY; SOCIAL AND PERSONAL SERVICES 439 7.GENERAL GOVERNMENT 239

124 ____________________________________________________________________________________________________________
Final Integrated Development Plan 2012/13
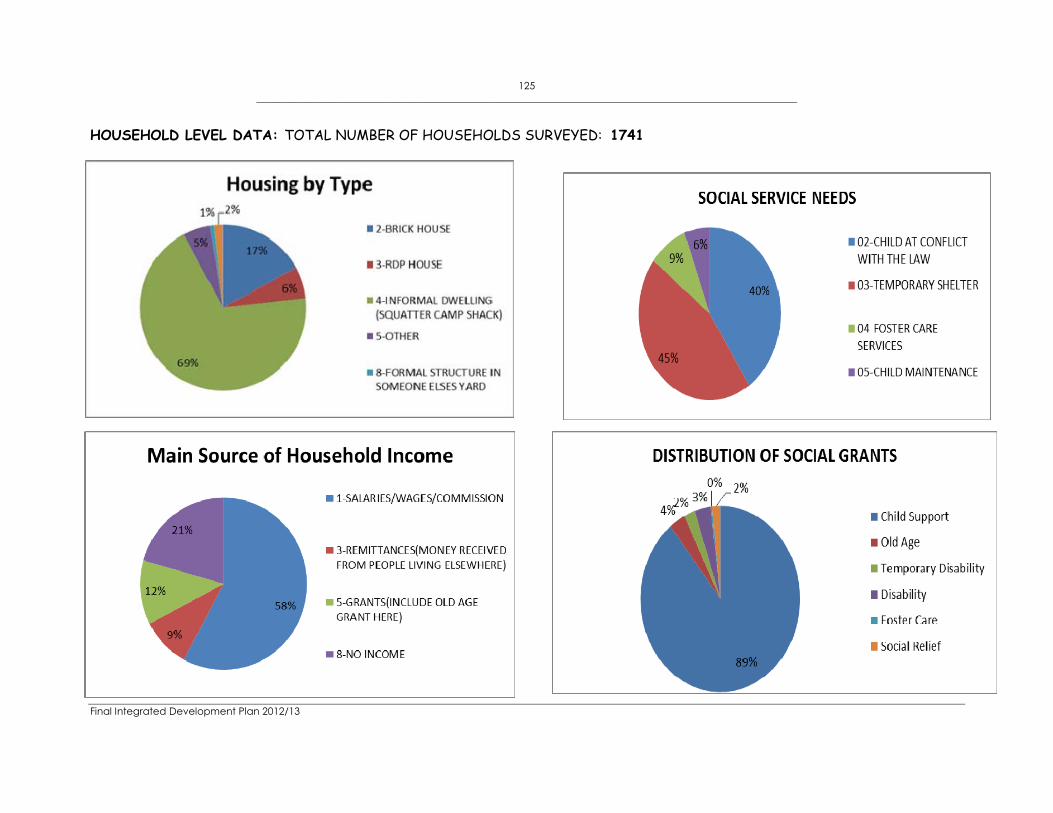
125 ____________________________________________________________________________________________________________
Final Integrated Development Plan 2012/13
HOUSEHOLD LEVEL DATA: TOTAL NUMBER OF HOUSEHOLDS SURVEYED: 1741

126 ____________________________________________________________________________________________________________
Final Integrated Development Plan 2012/13
INDIVIDUAL LEVEL INFORMATION: TOTAL NUMBER OF PEOPLE SURVEYED: 3258

127 ____________________________________________________________________________________________________________
Final Integrated Development Plan 2012/13
LABOUR SERVICES REQUIRED
ASSISTANCE REQUIRED NUMBER OF
PEOPLE 1-Unemployment Insurance Fund 127 2-Compensation For Occupational Injuries/Diseases 13 3-Labour Dispute Resolutions 44 4-Skills Training 1061 5-Accreditation 45 6-Learnerships 273 7-Other 15 8-Dont Know 77
SMALL BUSINESS ASSISTANCE REQUIRED
ASSISTANCE REQUIRED NUMBER OF
PEOPLE
01-Market Access 164
02-Funding Application 184
03-Development Of Business Plans 122
04-Joint Business Association Or Cooperative 58
05-Marketing 13
06-Business Site 66
07-Credit Access/Financing For Bee Start-Ups 19
08-Capital Grant 44
09-Transport Subsidy 1
10-Access To Water And Electricity 2
11-Business Registration 14
12-Facilitate Loans/Small Loans Application 1
13-Mentorship 1
14-Internet And/Or Conference Facilities 0
15-Community Entrepreneurship Outreach Programme 2

128 ____________________________________________________________________________________________________________
Final Integrated Development Plan 2012/13
EMPLOYMENT BY INDUSTRY
EMPLOYMENT NUMBER OF
PEOPLE PRIMARY 1.AGRICULTURE 74 2.FORESTRY 32 3.FISHING 164 4.MINING 3 5.QUARRYING 5 SECONDARY 1.MANUFACTURING 55 10.TRANSPORT EQUIPMENT 9 11.FURNITURE AND OTHER MANUFACTURING 4 12.ELECTRICITY; GAS AND WATER 1 13.CONSTRUCTION 62 2.FOOD; BEVERAGES AND TOBACCO 62 3.TEXTILES; CLOTHING AND LEATHER GOODS 6 4.WOOD; PAPER; PUBLISHING AND PRINTING 4 5.PETROLEUM PRODUCTS; CHEMICALS; RUBBER AND PLASTIC 4 6.OTHER NON-METAL MINERALS PRODUCTS 5 7.METALS; METAL PRODUCTS; MACHINERY AND EQUIPMENT 2 8.ELECTRICAL MACHINERY AND APPARATUS 3 9.RADIO; TV; INSTRUMENTS; WATCHES AND CLOCKS 0 TERTIARY 1.WHOLESALE AND RETAIL TRADE 70 2.CATERING 28 3.ACCOMMODATION 48 4.COMMUNICATION 8 5.FINANCE; INSURANCE; REAL ESTATE AND BUSINESS SERVICES 5 6.COMMUNITY; SOCIAL AND PERSONAL SERVICES 45 7.GENERAL GOVERNMENT 72
129 ____________________________________________________________________________________________________________
Final Integrated Development Plan 2012/13

130 ____________________________________________________________________________________________________________
Final Integrated Development Plan 2012/13
HOUSEHOLD LEVEL DATA: TOTAL NUMBER OF HOUSEHOLDS SURVEYED: 49

131 ____________________________________________________________________________________________________________
Final Integrated Development Plan 2012/13
INDIVIDUAL LEVEL INFORMATION: TOTAL NUMBER OF PEOPLE SURVEYED: 166

132 ____________________________________________________________________________________________________________
Final Integrated Development Plan 2012/13
EMPLOYMENT BY INDUSTRY
EMPLOYMENT NUMBER OF
PEOPLE PRIMARY 1.AGRICULTURE 1 2.FORESTRY 2 3.FISHING 7 5.QUARRYING 1 SECONDARY 1.MANUFACTURING 1 13.CONSTRUCTION 3 2.FOOD; BEVERAGES AND TOBACCO 1 7.METALS; METAL PRODUCTS; MACHINERY AND EQUIPMENT 1 TERTIARY 3.ACCOMMODATION 1 6.COMMUNITY; SOCIAL AND PERSONAL SERVICES 3
LABOUR SERVICES REQUIRED LABOUR SERVICES REQUIRED
Assistance Required Number Of People 1-Unemployment Insurance Fund 1 4-Skills Training 27 5-Accreditation 1 6-Learnerships 4

133 ____________________________________________________________________________________________________________
Final Integrated Development Plan 2012/13
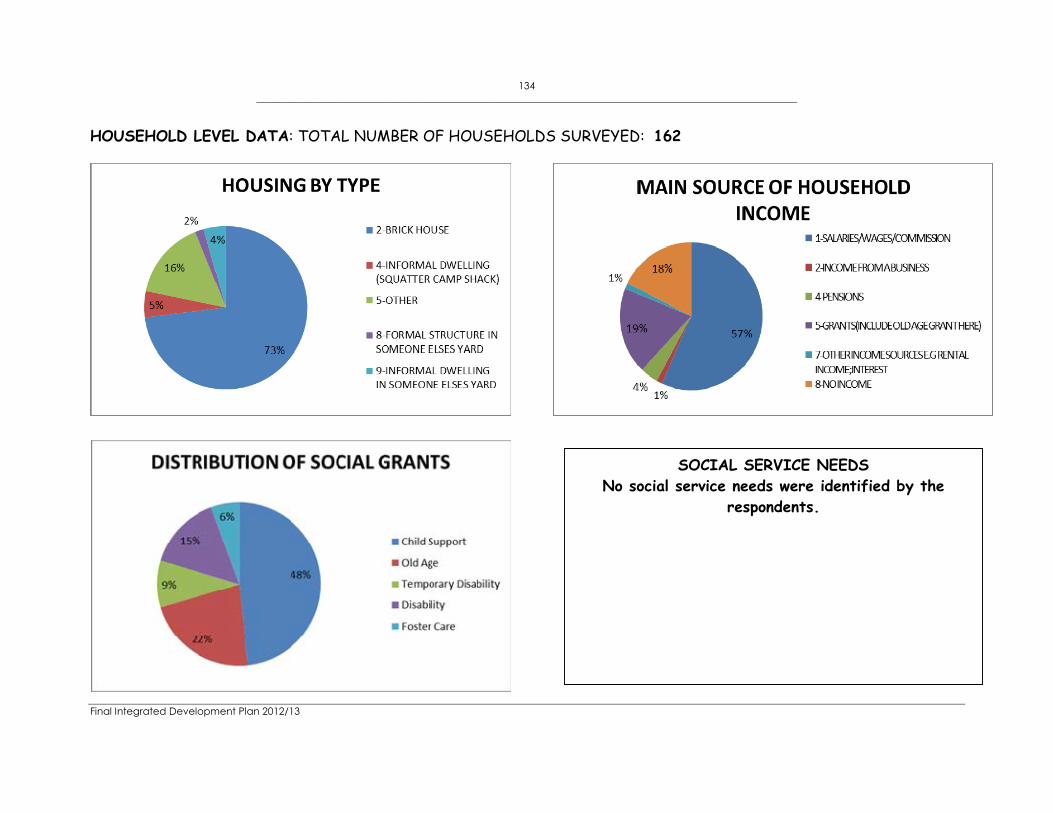
134 ____________________________________________________________________________________________________________
Final Integrated Development Plan 2012/13
HOUSEHOLD LEVEL DATA: TOTAL NUMBER OF HOUSEHOLDS SURVEYED: 162
SOCIAL SERVICE NEEDS No social service needs were identified by the
respondents.

135 ____________________________________________________________________________________________________________
Final Integrated Development Plan 2012/13
INDIVIDUAL LEVEL INFORMATION: TOTAL NUMBER OF PEOPLE SURVEYED: 405
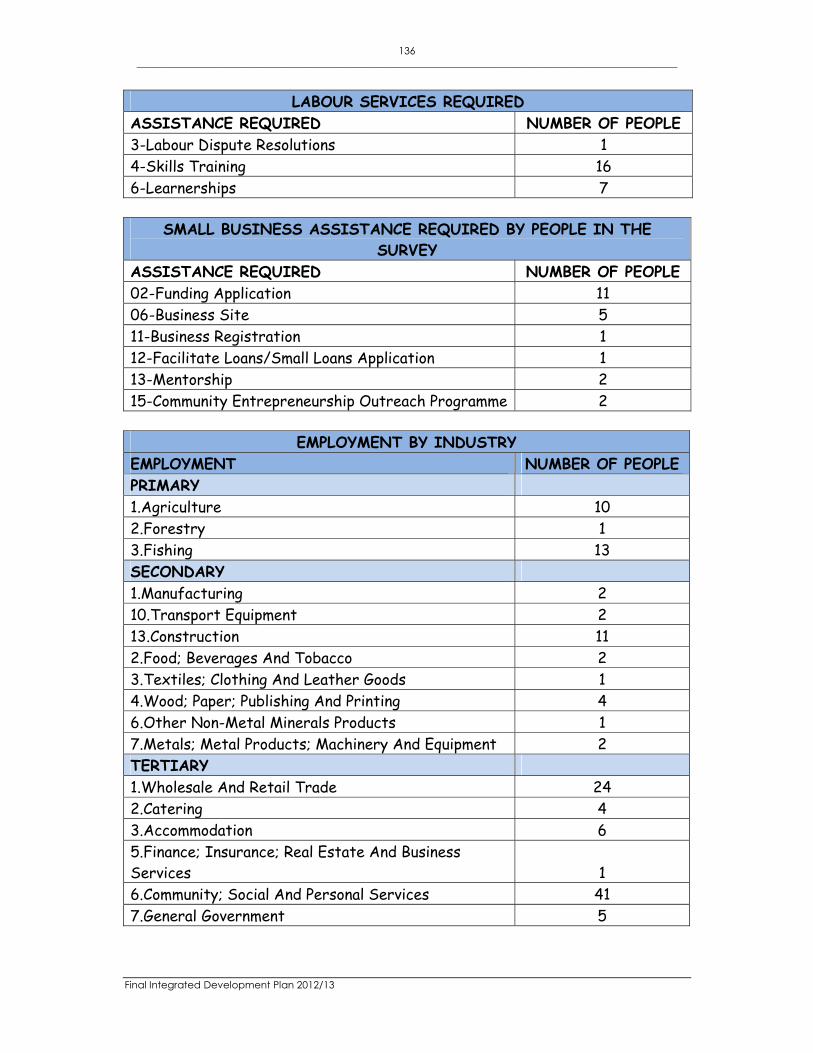
136 ____________________________________________________________________________________________________________
Final Integrated Development Plan 2012/13
LABOUR SERVICES REQUIRED ASSISTANCE REQUIRED NUMBER OF PEOPLE 3-Labour Dispute Resolutions 1 4-Skills Training 16 6-Learnerships 7
SMALL BUSINESS ASSISTANCE REQUIRED BY PEOPLE IN THE
SURVEY ASSISTANCE REQUIRED NUMBER OF PEOPLE 02-Funding Application 11 06-Business Site 5 11-Business Registration 1 12-Facilitate Loans/Small Loans Application 1 13-Mentorship 2 15-Community Entrepreneurship Outreach Programme 2
EMPLOYMENT BY INDUSTRY
EMPLOYMENT NUMBER OF PEOPLE PRIMARY 1.Agriculture 10 2.Forestry 1 3.Fishing 13 SECONDARY 1.Manufacturing 2 10.Transport Equipment 2 13.Construction 11 2.Food; Beverages And Tobacco 2 3.Textiles; Clothing And Leather Goods 1 4.Wood; Paper; Publishing And Printing 4 6.Other Non-Metal Minerals Products 1 7.Metals; Metal Products; Machinery And Equipment 2 TERTIARY 1.Wholesale And Retail Trade 24 2.Catering 4 3.Accommodation 6 5.Finance; Insurance; Real Estate And Business Services 1 6.Community; Social And Personal Services 41 7.General Government 5
137 ____________________________________________________________________________________________________________
Final Integrated Development Plan 2012/13
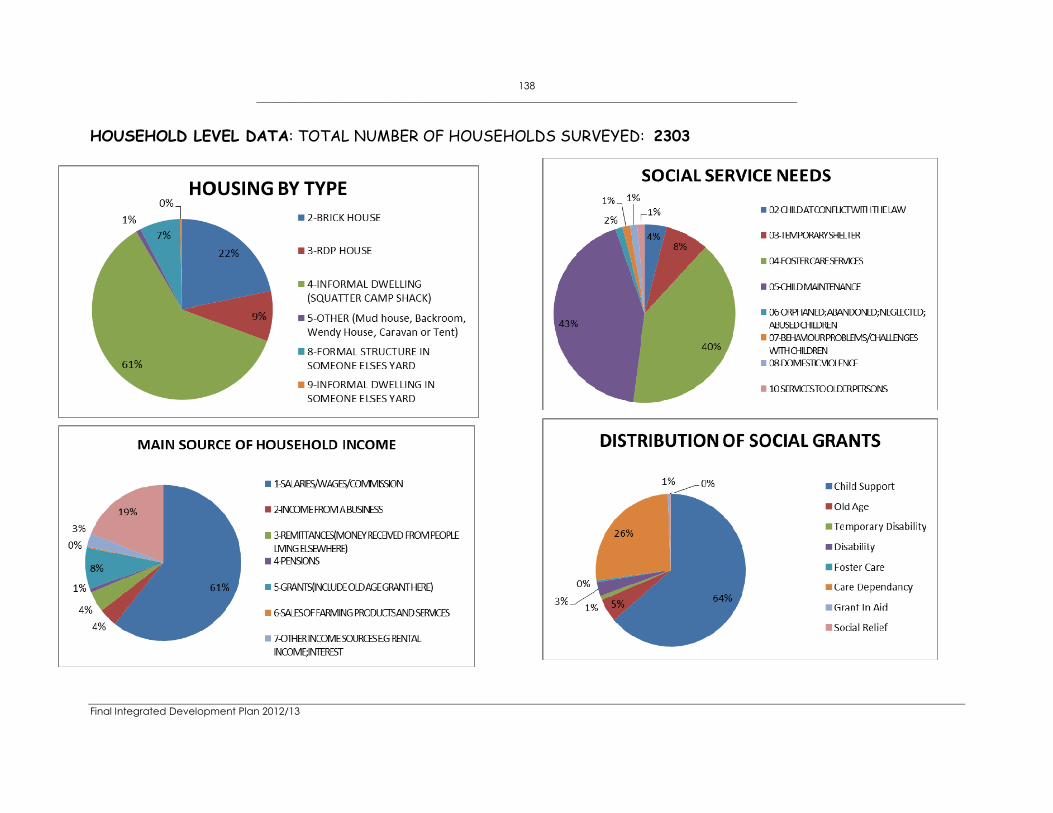
138 ____________________________________________________________________________________________________________
Final Integrated Development Plan 2012/13
HOUSEHOLD LEVEL DATA: TOTAL NUMBER OF HOUSEHOLDS SURVEYED: 2303

139 ____________________________________________________________________________________________________________
Final Integrated Development Plan 2012/13
INDIVIDUAL LEVEL INFORMATION: TOTAL NUMBER OF PEOPLE SURVEYED: 4827
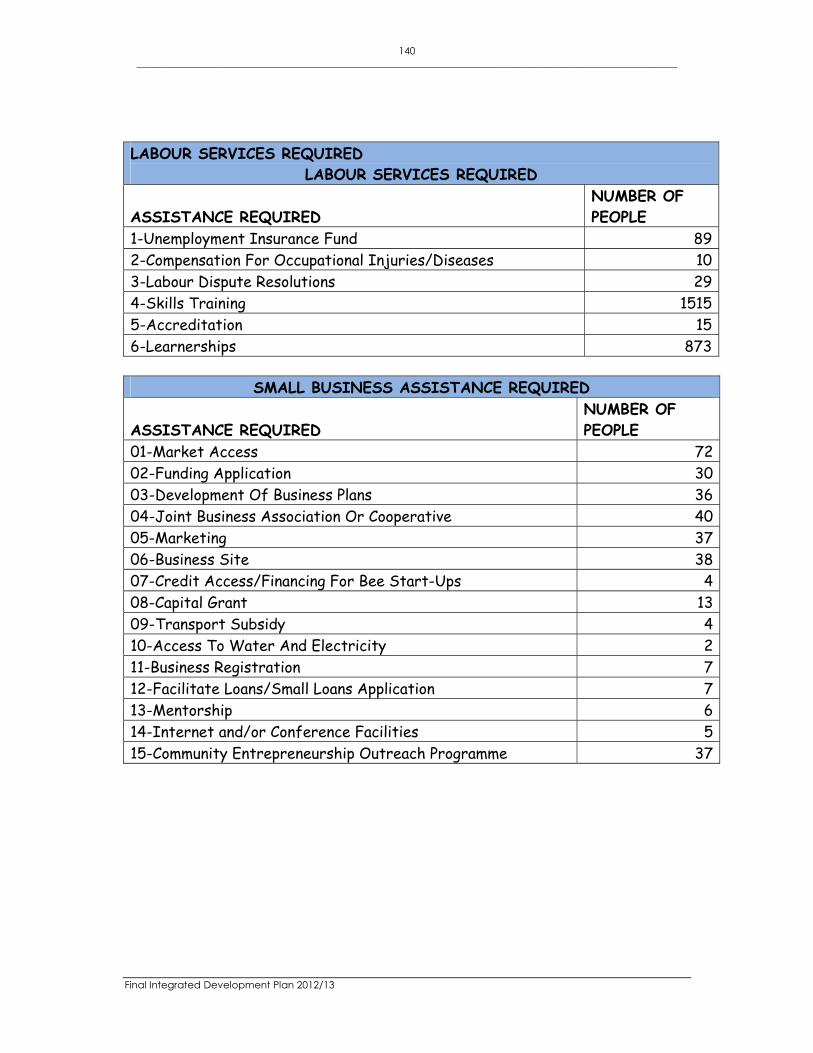
140 ____________________________________________________________________________________________________________
Final Integrated Development Plan 2012/13
LABOUR SERVICES REQUIRED LABOUR SERVICES REQUIRED
ASSISTANCE REQUIRED NUMBER OF PEOPLE
1-Unemployment Insurance Fund 89 2-Compensation For Occupational Injuries/Diseases 10 3-Labour Dispute Resolutions 29 4-Skills Training 1515 5-Accreditation 15 6-Learnerships 873
SMALL BUSINESS ASSISTANCE REQUIRED
ASSISTANCE REQUIRED NUMBER OF PEOPLE
01-Market Access 72 02-Funding Application 30 03-Development Of Business Plans 36 04-Joint Business Association Or Cooperative 40 05-Marketing 37 06-Business Site 38 07-Credit Access/Financing For Bee Start-Ups 4 08-Capital Grant 13 09-Transport Subsidy 4 10-Access To Water And Electricity 2 11-Business Registration 7 12-Facilitate Loans/Small Loans Application 7 13-Mentorship 6 14-Internet and/or Conference Facilities 5 15-Community Entrepreneurship Outreach Programme 37

141 ____________________________________________________________________________________________________________
Final Integrated Development Plan 2012/13
EMPLOYMENT BY INDUSTRY
EMPLOYMENT NUMBER OF PEOPLE
PRIMARY 1.Agriculture 89 2.Forestry 16 3.Fishing 58 4.Mining 3 5.Quarrying 11 SECONDARY 1.Manufacturing 14 10.Transport Equipment 7 11.Furniture And Other Manufacturing 11 12.Electricity; Gas And Water 8 13.Construction 298 2.Food; Beverages And Tobacco 109 3.Textiles; Clothing And Leather Goods 5 4.Wood; Paper; Publishing And Printing 19 5.Petroleum Products; Chemicals; Rubber And Plastic 6 6.Other Non-Metal Minerals Products 121 7.Metals; Metal Products; Machinery And Equipment 5 8.Electrical Machinery And Apparatus 9 TERTIARY 1.Wholesale And Retail Trade 69 2.Catering 47 3.Accommodation 134 4.Communication 8 5.Finance; Insurance; Real Estate And Business Services 5 6.Community; Social And Personal Services 148 7.General Government 60
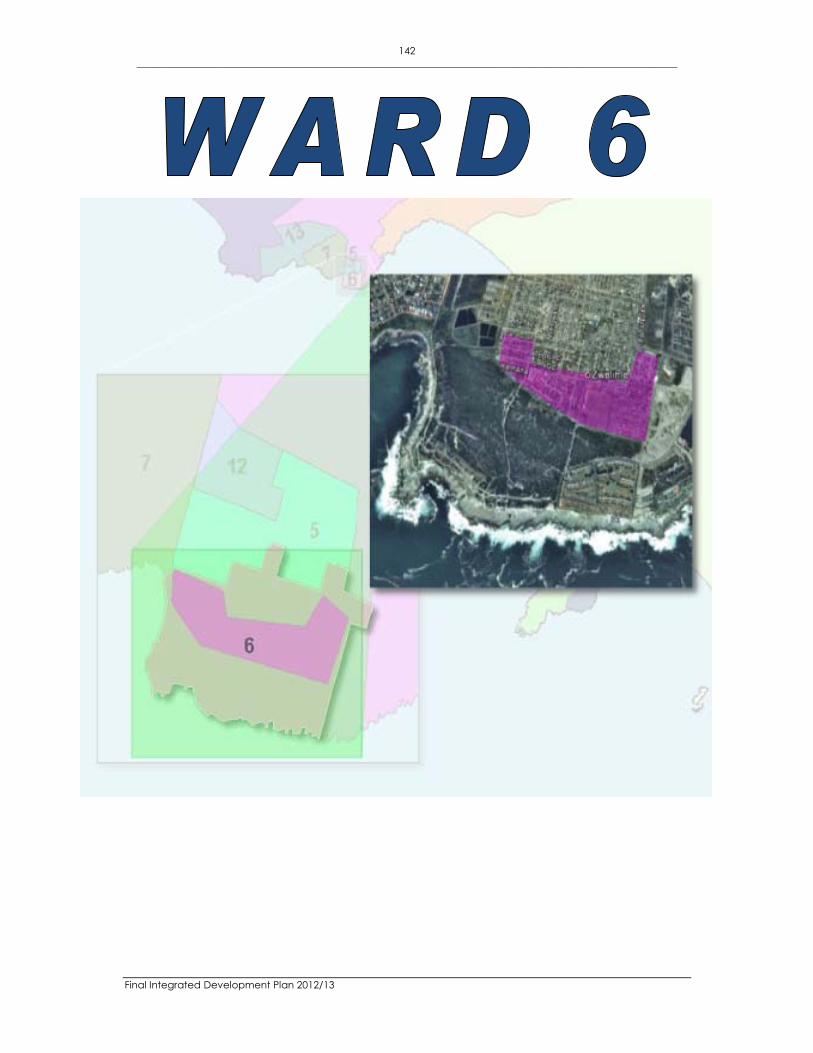
142 ____________________________________________________________________________________________________________
Final Integrated Development Plan 2012/13
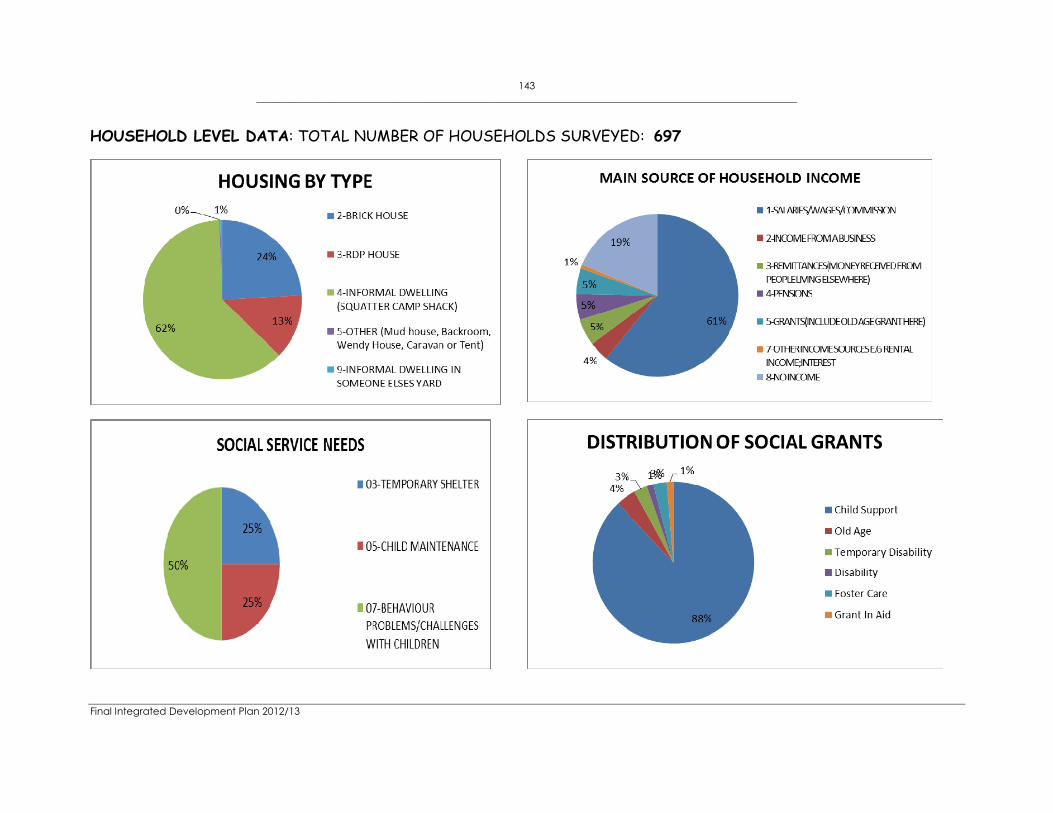
143 ____________________________________________________________________________________________________________
Final Integrated Development Plan 2012/13
HOUSEHOLD LEVEL DATA: TOTAL NUMBER OF HOUSEHOLDS SURVEYED: 697

144 ____________________________________________________________________________________________________________
Final Integrated Development Plan 2012/13
INDIVIDUAL LEVEL INFORMATION: TOTAL NUMBER OF PEOPLE SURVEYED: 1111

145 ____________________________________________________________________________________________________________
Final Integrated Development Plan 2012/13
LABOUR SERVICES REQUIRED
ASSISTANCE REQUIRED NUMBER OF
PEOPLE 1-Unemployment Insurance Fund 31 2-Compensation For Occupational Injuries/Diseases 1 3-Labour Dispute Resolutions 7 4-Skills Training 48 6-Learnerships 28
SMALL BUSINESS ASSISTANCE REQUIRED
ASSISTANCE REQUIRED NUMBER OF
PEOPLE 01-Market Access 12 02-Funding Application 25 03-Development Of Business Plans 7 04-Joint Business Association Or Cooperative 2 05-Marketing 9 06-Business Site 11 08-Capital Grant 1 10-Access To Water And Electricity 1 11-Business Registration 1 12-Facilitate Loans/Small Loans Application 1 13-Mentorship 2 15-Community Entrepreneurship Outreach Programme 1 16-Other 17

146 ____________________________________________________________________________________________________________
Final Integrated Development Plan 2012/13
EMPLOYMENT BY INDUSTRY
EMPLOYMENT NUMBER OF
PEOPLE PRIMARY 1.Agriculture 20 2.Forestry 2 3.Fishing 7 4.Mining 6 5.Quarrying 3 SECONDARY 1.Manufacturing 11 10.Transport Equipment 1 11.Furniture And Other Manufacturing 1 12.Electricity; Gas And Water 5 13.Construction 22 2.Food; Beverages And Tobacco 14 3.Textiles; Clothing And Leather Goods 1 4.Wood; Paper; Publishing And Printing 4 5.Petroleum Products; Chemicals; Rubber And Plastic 2 6.Other Non-Metal Minerals Products 8 7.Metals; Metal Products; Machinery And Equipment 4 8.Electrical Machinery And Apparatus 2 TERTIARY 1.Wholesale And Retail Trade 5 2.Catering 9 3.Accommodation 2 6.Community; Social And Personal Services 16 7.General Government 15

147 ____________________________________________________________________________________________________________
Final Integrated Development Plan 2012/13

148 ____________________________________________________________________________________________________________
Final Integrated Development Plan 2012/13
HOUSEHOLD LEVEL DATA: TOTAL NUMBER OF HOUSEHOLDS SURVEYED: 790

149 ____________________________________________________________________________________________________________
Final Integrated Development Plan 2012/13
INDIVIDUAL LEVEL INFORMATION: TOTAL NUMBER OF PEOPLE SURVEYED: 2353

150 ____________________________________________________________________________________________________________
Final Integrated Development Plan 2012/13
LABOUR SERVICES REQUIRED
ASSISTANCE REQUIRED NUMBER OF
PEOPLE 1-Unemployment Insurance Fund 17 2-Compensation For Occupational Injuries/Diseases 1 3-Labour Dispute Resolutions 0 4-Skills Training 167 6-Learnerships 91
SMALL BUSINESS ASSISTANCE REQUIRED
ASSISTANCE REQUIRED NUMBER OF
PEOPLE 01-Market Access 19 02-Funding Application 44 03-Development Of Business Plans 59 04-Joint Business Association Or Cooperative 1 05-Marketing 13 06-Business Site 2 07-Credit Access/Financing For Bee Start-Ups 0 08-Capital Grant 18 09-Transport Subsidy 2 11-Business Registration 1 12-Facilitate Loans/Small Loans Application 1 13-Mentorship 1 14-Internet and/or Conference Facilities 2 15-Community Entrepreneurship Outreach Programme 13 16-Other 27

151 ____________________________________________________________________________________________________________
Final Integrated Development Plan 2012/13
EMPLOYMENT BY INDUSTRY
EMPLOYMENT NUMBER OF
PEOPLE PRIMARY 1.Agriculture 28 2.Forestry 4 3.Fishing 48 4.Mining 1 5.Quarrying 54 SECONDARY 1.Manufacturing 11 10.Transport Equipment 2 11.Furniture And Other Manufacturing 2 12.Electricity; Gas And Water 2 13.Construction 40 2.Food; Beverages And Tobacco 20 3.Textiles; Clothing And Leather Goods 5 4.Wood; Paper; Publishing And Printing 10 5.Petroleum Products; Chemicals; Rubber And Plastic 2 6.Other Non-Metal Minerals Products 2 7.Metals; Metal Products; Machinery And Equipment 3 8.Electrical Machinery And Apparatus 9 TERTIARY 1.Wholesale And Retail Trade 35 2.Catering 5 3.Accommodation 11 4.Communication 2 5.Finance; Insurance; Real Estate And Business Services 5 6.Community; Social And Personal Services 123 7.General Government 45
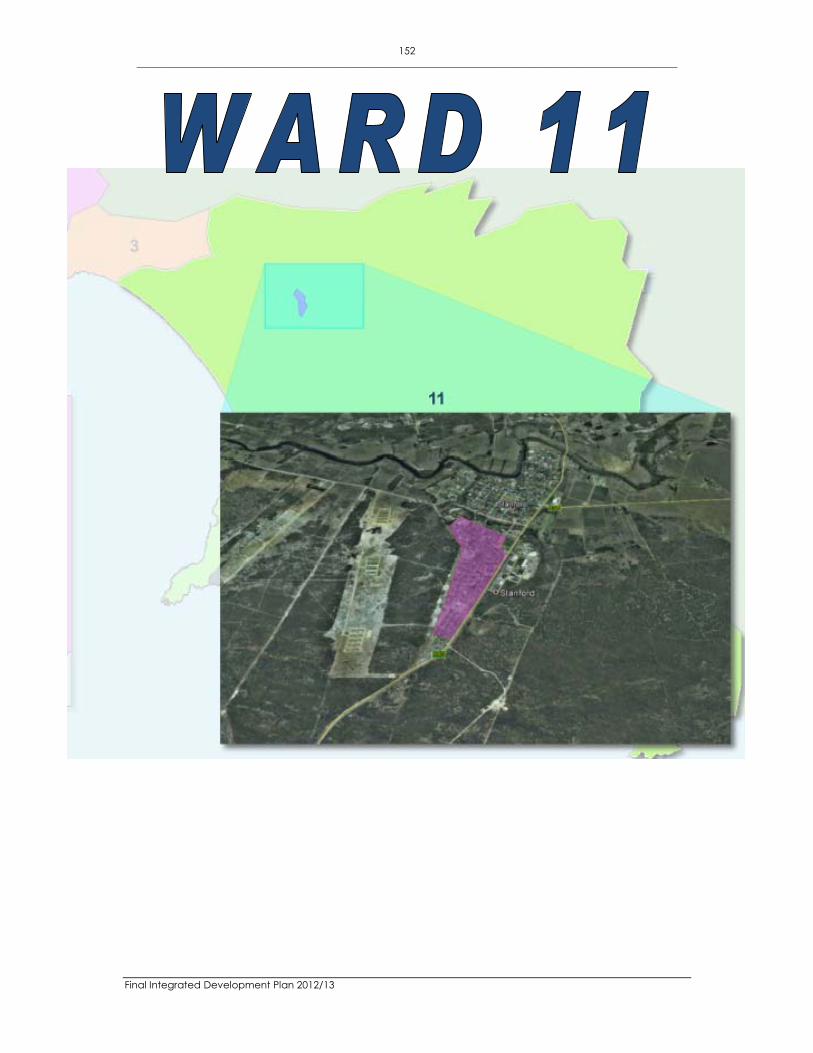
152 ____________________________________________________________________________________________________________
Final Integrated Development Plan 2012/13
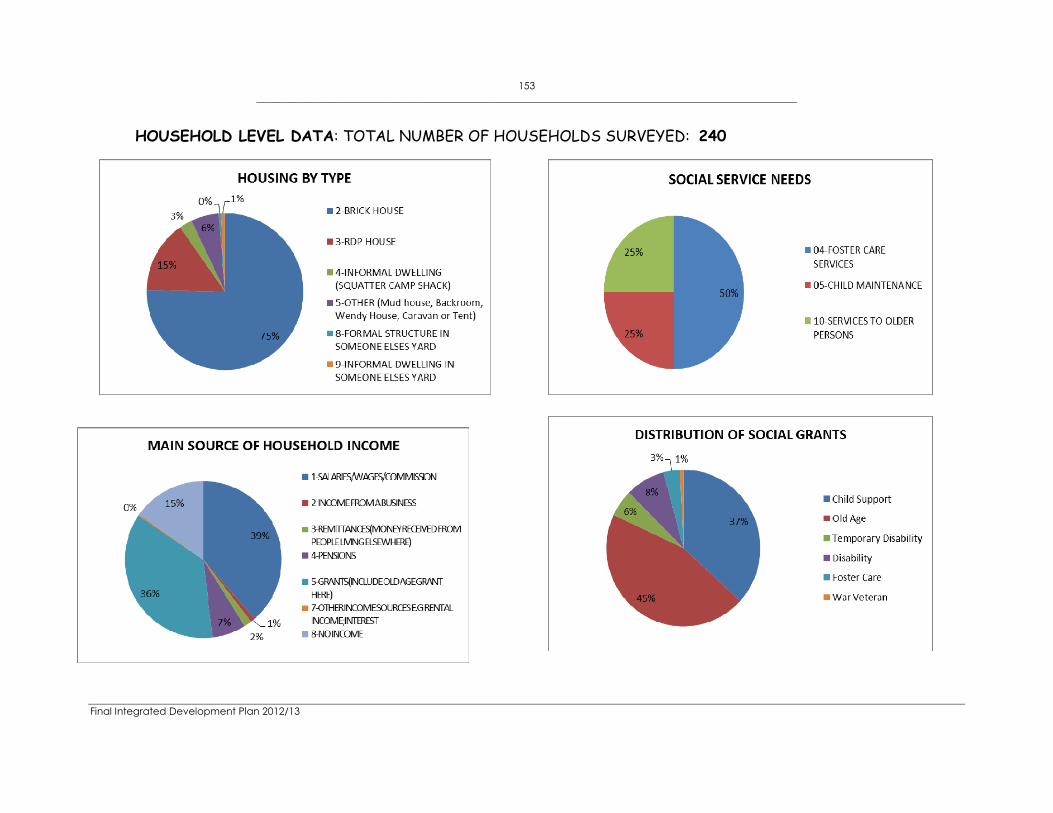
153 ____________________________________________________________________________________________________________
Final Integrated Development Plan 2012/13
HOUSEHOLD LEVEL DATA: TOTAL NUMBER OF HOUSEHOLDS SURVEYED: 240
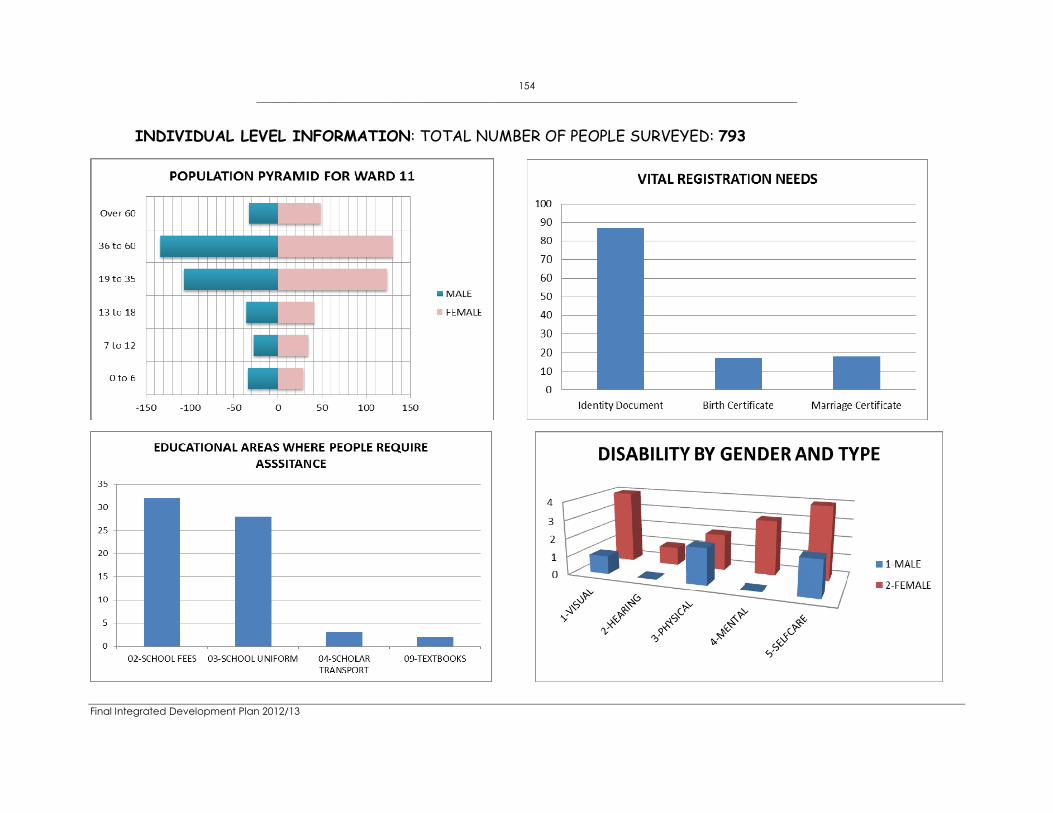
154 ____________________________________________________________________________________________________________
Final Integrated Development Plan 2012/13
INDIVIDUAL LEVEL INFORMATION: TOTAL NUMBER OF PEOPLE SURVEYED: 793
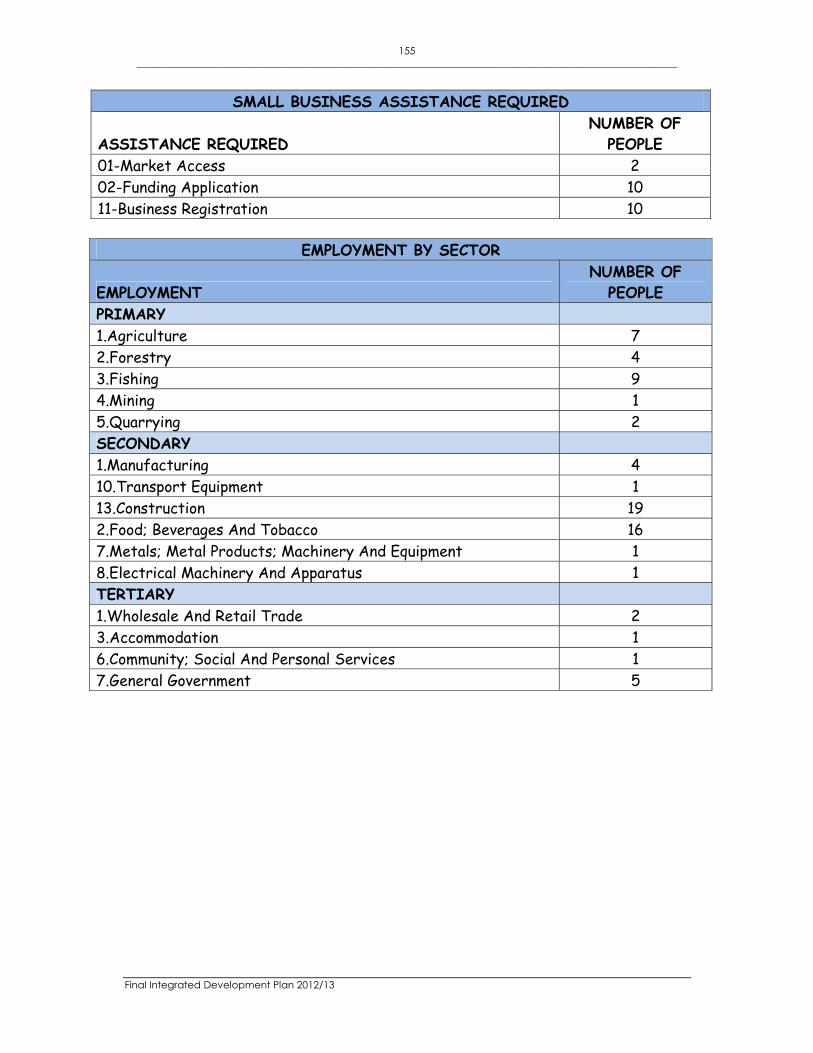
155 ____________________________________________________________________________________________________________
Final Integrated Development Plan 2012/13
SMALL BUSINESS ASSISTANCE REQUIRED
ASSISTANCE REQUIRED NUMBER OF
PEOPLE 01-Market Access 2 02-Funding Application 10 11-Business Registration 10
EMPLOYMENT BY SECTOR
EMPLOYMENT NUMBER OF
PEOPLE PRIMARY 1.Agriculture 7 2.Forestry 4 3.Fishing 9 4.Mining 1 5.Quarrying 2 SECONDARY 1.Manufacturing 4 10.Transport Equipment 1 13.Construction 19 2.Food; Beverages And Tobacco 16 7.Metals; Metal Products; Machinery And Equipment 1 8.Electrical Machinery And Apparatus 1 TERTIARY 1.Wholesale And Retail Trade 2 3.Accommodation 1 6.Community; Social And Personal Services 1 7.General Government 5

156 ____________________________________________________________________________________________________________
Final Integrated Development Plan 2012/13

157 ____________________________________________________________________________________________________________
Final Integrated Development Plan 2012/13
HOUSEHOLD LEVEL DATA: TOTAL NUMBER OF HOUSEHOLDS SURVEYED: 349
SOCIAL SERVICE NEEDS Only 1 respondent indicated a need for Social
Services and that was for a temporary shelter.

158 ____________________________________________________________________________________________________________
Final Integrated Development Plan 2012/13
INDIVIDUAL LEVEL INFORMATION: TOTAL NUMBER OF PEOPLE SURVEYED: 890
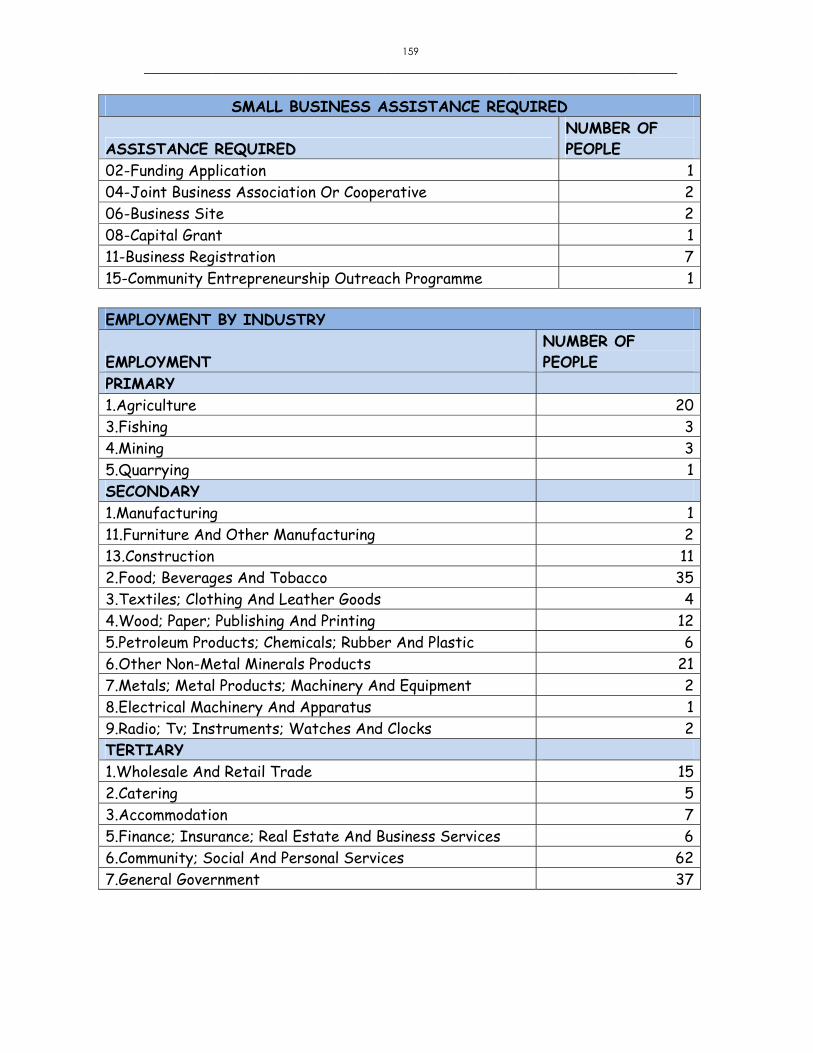
159
_______________________________________________________________________
SMALL BUSINESS ASSISTANCE REQUIRED
ASSISTANCE REQUIRED NUMBER OF PEOPLE
02-Funding Application 1 04-Joint Business Association Or Cooperative 2 06-Business Site 2 08-Capital Grant 1 11-Business Registration 7 15-Community Entrepreneurship Outreach Programme 1 EMPLOYMENT BY INDUSTRY
EMPLOYMENT NUMBER OF PEOPLE
PRIMARY 1.Agriculture 20 3.Fishing 3 4.Mining 3 5.Quarrying 1 SECONDARY 1.Manufacturing 1 11.Furniture And Other Manufacturing 2 13.Construction 11 2.Food; Beverages And Tobacco 35 3.Textiles; Clothing And Leather Goods 4 4.Wood; Paper; Publishing And Printing 12 5.Petroleum Products; Chemicals; Rubber And Plastic 6 6.Other Non-Metal Minerals Products 21 7.Metals; Metal Products; Machinery And Equipment 2 8.Electrical Machinery And Apparatus 1 9.Radio; Tv; Instruments; Watches And Clocks 2 TERTIARY 1.Wholesale And Retail Trade 15 2.Catering 5 3.Accommodation 7 5.Finance; Insurance; Real Estate And Business Services 6 6.Community; Social And Personal Services 62 7.General Government 37

TABLE OF CONTENTS
160
OVERSTRAND MUNICIPALITY
WATER SERVICES DEVELOPMENT PLAN FOR 2012/2013
EXECUTIVE SUMMARY
DRAFT DOCUMENT
14 MARCH 2012
Ref 248650KD0
WorleyParsons RSA (Pty) Ltd Contact person: Jaco Human 31 Allen Drive, Loevenstein 7530 PO Box 398, Bellville 7535 South Africa Telephone: +27 (0)21 912 3000 Facsimile: +27 (0)21 912 3222 email: [email protected] ABN 61 001 279 812
P O Box 20 Hermanus 7200 Tel: +27(28) 313 8000 Fax: +27(28) 3131111

TABLE OF CONTENTS
161
OVERSTRAND MUNICIPALITY
EXECUTIVE SUMMARY
WATER SERVICES DEVELOPMENT PLAN FOR
2012/2013
DESCRIPTION PAGE
Abbreviations and Definitions ............................................................................................................. ii
Key Terms ............................................................................................................................................. iv
Critical developments and associated factors that impacts our area for the immediate future ................................................................................................................................................................ 2
Administration ...................................................................................................................................... 4
Demographics ..................................................................................................................................... 5
Service Levels ....................................................................................................................................... 8
Socio-Economic Background ............................................................................................................ 9
Infrastructure ...................................................................................................................................... 12
Operation and Maintenance .......................................................................................................... 28
Associated Services ........................................................................................................................... 32
Conservation and Demand Management ................................................................................... 34
Water Resources ................................................................................................................................ 38
Financial .............................................................................................................................................. 47
Water Services Institutional Arrangements ..................................................................................... 50
Social and Customer Service Requirements ................................................................................. 51
Needs Development Plan ................................................................................................................ 53
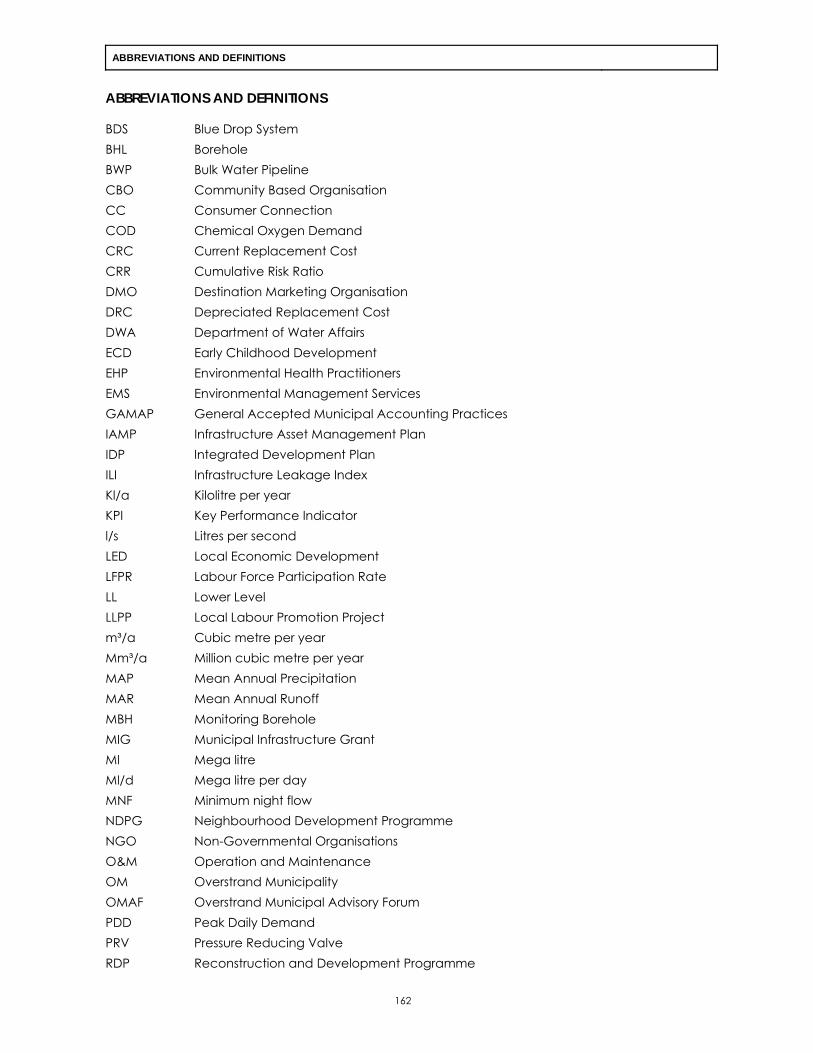
ABBREVIATIONS AND DEFINITIONS
162
ABBREVIATIONS AND DEFINITIONS
BDS Blue Drop System BHL Borehole BWP Bulk Water Pipeline CBO Community Based Organisation CC Consumer Connection COD Chemical Oxygen Demand CRC Current Replacement Cost CRR Cumulative Risk Ratio DMO Destination Marketing Organisation DRC Depreciated Replacement Cost DWA Department of Water Affairs ECD Early Childhood Development EHP Environmental Health Practitioners EMS Environmental Management Services GAMAP General Accepted Municipal Accounting Practices IAMP Infrastructure Asset Management Plan IDP Integrated Development Plan ILI Infrastructure Leakage Index Kl/a Kilolitre per year KPI Key Performance Indicator l/s Litres per second LED Local Economic Development LFPR Labour Force Participation Rate LL Lower Level LLPP Local Labour Promotion Project m³/a Cubic metre per year Mm³/a Million cubic metre per year MAP Mean Annual Precipitation MAR Mean Annual Runoff MBH Monitoring Borehole MIG Municipal Infrastructure Grant Ml Mega litre Ml/d Mega litre per day MNF Minimum night flow NDPG Neighbourhood Development Programme NGO Non-Governmental Organisations O&M Operation and Maintenance OM Overstrand Municipality OMAF Overstrand Municipal Advisory Forum PDD Peak Daily Demand PRV Pressure Reducing Valve RDP Reconstruction and Development Programme

ABBREVIATIONS AND DEFINITIONS
163
RES Reservoir RM Rand Million RPMS Regulatory Performance Management System RUL Remaining Useful Life SANS South African National Standards SDBIP Service Delivery Budget Implementation Plan SDF Spatial Development Framework SMME Small Medium Micro Enterprise SPS Sanitation Pump Station SRP Sewer Reticulation Pipeline STW Sanitation Treatment Works TMG Table Mountain Group TWL Top Water Level WC Western Cape WC/WDM Water Conservation / Water Demand Management WDM Water Demand Management WPS Water Pump Station WRP Water Reticulation Pipeline WSA Water Services Authority WSDP Water Services Development Plan WSP Water Services Provider WTP Water Treatment Plant WTW Water Treatment Works WWTW Waste Water Treatment Works YAC Youth Advisory Centre
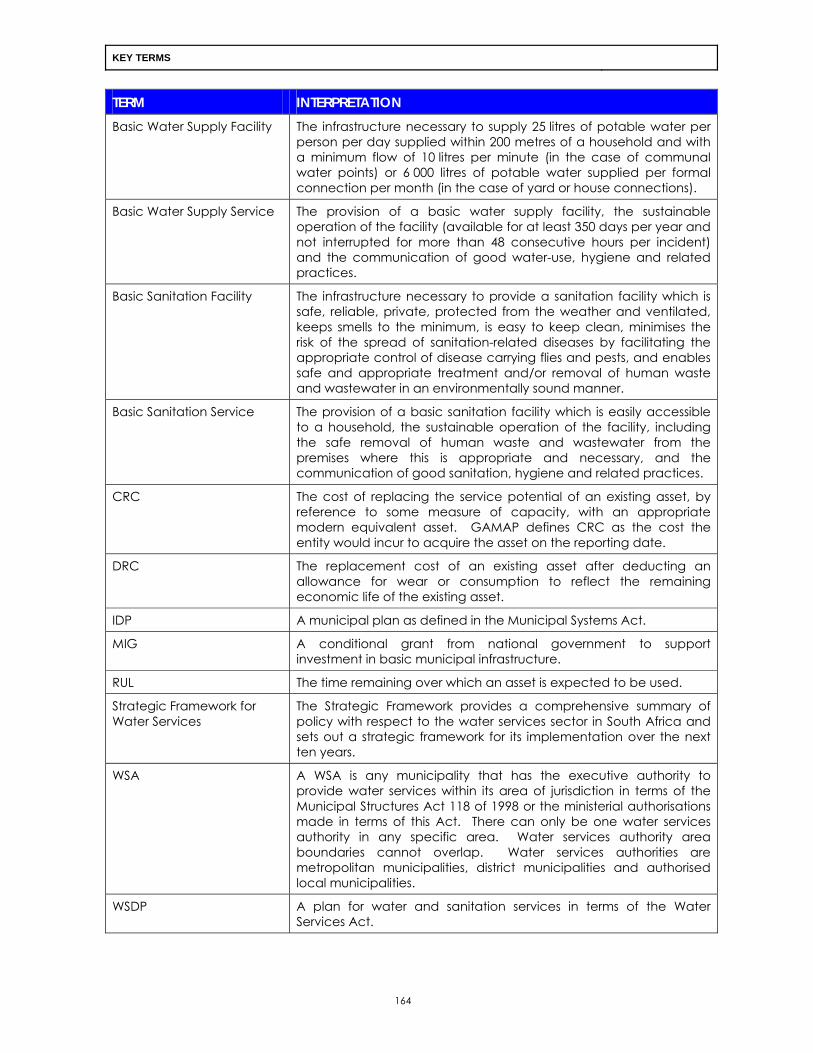
KEY TERMS
164
TERM INTERPRETATION Basic Water Supply Facility The infrastructure necessary to supply 25 litres of potable water per
person per day supplied within 200 metres of a household and with a minimum flow of 10 litres per minute (in the case of communal water points) or 6 000 litres of potable water supplied per formal connection per month (in the case of yard or house connections).
Basic Water Supply Service The provision of a basic water supply facility, the sustainable operation of the facility (available for at least 350 days per year and not interrupted for more than 48 consecutive hours per incident) and the communication of good water-use, hygiene and related practices.
Basic Sanitation Facility The infrastructure necessary to provide a sanitation facility which is safe, reliable, private, protected from the weather and ventilated, keeps smells to the minimum, is easy to keep clean, minimises the risk of the spread of sanitation-related diseases by facilitating the appropriate control of disease carrying flies and pests, and enables safe and appropriate treatment and/or removal of human waste and wastewater in an environmentally sound manner.
Basic Sanitation Service The provision of a basic sanitation facility which is easily accessible to a household, the sustainable operation of the facility, including the safe removal of human waste and wastewater from the premises where this is appropriate and necessary, and the communication of good sanitation, hygiene and related practices.
CRC The cost of replacing the service potential of an existing asset, by reference to some measure of capacity, with an appropriate modern equivalent asset. GAMAP defines CRC as the cost the entity would incur to acquire the asset on the reporting date.
DRC The replacement cost of an existing asset after deducting an allowance for wear or consumption to reflect the remaining economic life of the existing asset.
IDP A municipal plan as defined in the Municipal Systems Act.
MIG A conditional grant from national government to support investment in basic municipal infrastructure.
RUL The time remaining over which an asset is expected to be used.
Strategic Framework for Water Services
The Strategic Framework provides a comprehensive summary of policy with respect to the water services sector in South Africa and sets out a strategic framework for its implementation over the next ten years.
WSA A WSA is any municipality that has the executive authority to provide water services within its area of jurisdiction in terms of the Municipal Structures Act 118 of 1998 or the ministerial authorisations made in terms of this Act. There can only be one water services authority in any specific area. Water services authority area boundaries cannot overlap. Water services authorities are metropolitan municipalities, district municipalities and authorised local municipalities.
WSDP A plan for water and sanitation services in terms of the Water Services Act.

KEY TERMS
165
TERM INTERPRETATION
WSP A Water services provider is
Any person who has a contract with a water services authority or another water services provider to sell water to, and/or accept wastewater for the purpose of treatment from, that authority or provider (bulk water services provider); and / or
Any person who has a contract with a water services authority to assume operational responsibility for providing water services to one or more consumers (end users) within a specific geographic area (retail water services provider); or
A water services authority which provides either or both of the above services itself
WC The minimisation of loss or waste, the care and protection of water resources and the efficient and effective use of water.
WDM The adaptation and implementation of a strategy by a water institution or consumer to influence the water demand and usage of water in order to meet any of the following objectives: economic efficiency, social development, social equity, environmental protection, sustainability of water supply and services, and political acceptability.

166
EXECUTIVE SUMMARY
Every WSA has a duty to all customers or potential customers in its area of jurisdiction to progressively ensure efficient, affordable, economical and sustainable access to water services that promote sustainable livelihoods and economic development.
Sections 12 and 13 of the Water Services Act (Act No 108 of 1997) place a duty on WSAs to prepare and maintain a WSDP. The DWA has developed a new set of WSDP guidelines (October 2010) to assist WSAs with the WSDP process and to provide a framework for the capturing of the data. The business elements included in the guidelines and addressed in detail in the three Modules of OM’s WSDP are as follows:
Administration
Demographics Profile
Service Levels Profile
Socio Economic Background Profile
Water Services Infrastructure Profile
Operation and Maintenance Profile
Associated Services Profile
Water Resources Profile
Conservation and Demand Management Profile
Financial Profile
Institutional Arrangements Profile
Social and Customer Service Requirements Profile
Needs Development Plan
The 2012/2013 WSDP of OM consists of the following documents.
Executive Summary document (For Council approval and Public Participation Process)
Module1: Overview and assessment of the status of information and strategies on a WSA level.
Module 2: Detailed information: Enabling factors compliancy supportive information.
Module 3: Future plans and strategic supportive information.
The primary instrument of planning in the water services sector is the WSDP. The following principles apply to the WSDP:
All WSAs must develop a WSDP.
A new plan must be developed every five years and the plan should be updated as necessary and appropriate in the interim years.
The WSDP must be integrated with the IDP of the municipality, as required in terms of the Municipal Systems Act.
The WSDP must integrate water supply planning with sanitation planning.
The WSDP must integrate technical planning with social, institutional, financial and environmental planning. The planning of capital expenditures must also be integrated with the associated operation and maintenance requirements and expenditures.
The WSDP must be informed by the business plans developed by water services providers and with the plans of any regional water services providers, as relevant.

167
The plan must take into account the impact of HIV/Aids on future water demand.
The WSDP must integrate with the catchment management strategy.
The planning process must take into account the views of all important stakeholders, including communities, through a consultative and participatory process. Every effort must be made to ensure the adequate and meaningful participation of women in consultation forums.
The draft plan must be made available for public and stakeholder comment and all comments made must be considered when preparing the final plan.
The contents of the WSDP must be communicated to all important stakeholders, including DWA.
A WSA must report annually and in a public way on progress in implementing the plan.
CRITICAL DEVELOPMENTS AND ASSOCIATED FACTORS THAT IMPACTS OUR AREA FOR THE IMMEDIATE FUTURE
Urban versus Rural Backlogs:
There is no basic water and sanitation services backlog in the urban areas of OM’s Management Area. It is however estimated that there might still be some households on the farms in the rural areas with existing service levels below RDP standard. OM is however committed to work with the private landowners in order to ensure that basic services are provided to these households by the private landowners.
The Municipality’s biggest challenge is to address the housing backlog in the urban areas and to ensure that the necessary bulk infrastructure is in place in order to meet the future demands. Various bulk infrastructure capital projects are currently being implemented in order to ensure that the bulk water infrastructure can meet the future demands for the various towns.
Adequate funds also need to be allocated to essential rehabilitation and maintenance of the existing infrastructure in addition to the need to extend services to poor communities as both are priorities which need to be addressed. The existing infrastructure is in a relative good state and therefore it is important for the Municipality to maintain the existing public investment. OM is committed to allocate adequate funds for the rehabilitation and maintenance of their existing infrastructure, such maintenance is however in competition with the need to extend services to the poor communities. The Municipality realises that the lack of adequate maintenance of existing assets could result in the total collapse of such service with enormous economic consequences.
Reliance on Water Resources Available and Bulk Infrastructure
OM investigated various augmentation options over the last few years for the various towns in order to meet the projected future water demands. A detail investigation was done of the water resources for the area from Rooi Els to Kleinmond.
The Gateway, Camphill and Volmoed Well fields are being developed by OM as additional groundwater resources for the greater Hermanus Area. A detail feasibility study was also recently completed for the re-use of treated effluent from the Hermanus WWTW. Both the Preekstoel WTW and the Hermanus WWTW are currently being upgraded with funding support from the DWA’s Regional Bulk Infrastructure Grant.
168
The Municipality explored for Stanford the groundwater potential of the Kouevlakte area since 2009, through exploration borehole siting and drilling. Two newly drilled boreholes will be put into operation and the Municipality is currently busy with the construction of the new bulk supply pipelines in order to connect the two newly drilled boreholes to the existing water reticulation network.
A new Nano Filtration WTW was constructed in Gansbaai in order to fully utilise the Klipgat and Grotte resources and improve the quality of the water. A new Pearly Beach WTW was also constructed.
A new borehole will be commissioned in the near future for the augmentation of Baardskeerdersbos existing surface water source.
Links between Water Supply and Sanitation
The Water and Sewer Master Plans are linked to OM’s SDF. The future development areas were identified as part of the SDF. Water supply and water and sanitation services are balanced with land usage and development planning. All service delivery is done in accordance with the availability of water and the capacities of the WTWs and WWTWs that are in place or that will be implemented.
Limited Implementation and Operating Capacity in Some Municipalities
At a technical, operations and management level, municipal staff is continuously exposed to training opportunities, skills development and capacity building in an effort to create a more efficient overall service to the users.
OM will also continue with their mentoring role for operators ensuring and adequately trained and classified workforce with dedicated training programmes for supervisors and operators. Budgets need to be established to address the shortfall of skilled staff, rethink methods to retain qualified personnel and plan for succession and clear career paths for experienced staff. With such a program a source of specific resources of skilled operators, technicians and managers will be established. Available funding The estimated Capital Budget for Water and Sanitation Services are R70.581M for 2012/2013, R36.990M for 2013/2014 and R44.000M for 2014/2015. OM will also continue with the sourcing of all possible external sources of funding for their capital projects. An Asset Management Plan needs to be developed from the available Asset Register, which will indicate the real replacement values and service lives of the assets and the funds required to provide for adequate asset replacement.
Affordability of Service Levels (Operation and Maintenance Costs)
Both Water and Sanitation Services are currently managed by OM in a financial sustainable manner. The Municipality implements a step water tariff system with the sewer tariffs linked to the water consumption.
Growing Backlog in Refurbishment of Existing Infrastructure
OM has been one of the more proactive municipalities in the Western Cape Province in responding to the call from many quarters to improve the management of municipal infrastructure assets. An Infrastructure Asset Register is in place for all water and sanitation infrastructure. The depreciated replacement costs were calculated for the entire infrastructure, which indicated that 74.1% of the value of the water infrastructure has been consumed and 45.3% of the value of the sewage supply network has been consumed.
It is essential for OM to protect their assets by ensuring that an Infrastructure Asset Management Plan is developed and implemented. This plan is based on the principle of preventative maintenance in order to ensure that, as far as this is practical, damage to assets is prevented before it occurs. Assets

169
must be rehabilitated and / or replaced before the end of their economic life and the necessary capital funds must be allocated for this purpose.
Maintenance activities have been increasingly focused on reactive maintenance as a result of the progressive deterioration and failure of old infrastructure. Consequently, there has been dilution of preventative maintenance of other infrastructure. A regime of planned preventative maintenance should be established for all infrastructure assets classified as critical and important in the Asset Register. Consideration should be given to the establishment of a maintenance management system to enable OM to better manage its risks, and more effectively plan and prioritise the wave of renewals that are going to be required over the next 20 years.
Major Economic Development
Investing in infrastructure creates an enabling environment for economic growth and is an important precondition for sustainable growth. Although OM has a potential for growth at much higher rates, failure to ensure adequate rehabilitation and maintenance of the existing infrastructure poses a serious threat to the local economy. The deterioration of water and sewer networks and rapid development, which is not always matched by growing capital expenditure, can further exacerbate the situation. OM therefore needs to continue with the rehabilitation and maintenance of their existing infrastructure in order to ensure the medium to long term sustainability of the existing infrastructure.
Associated Population Growth and Water Demand
The detail future water demand projection models were updated as part of the WSDP process. The Municipality also actively implements their WDM Strategy and various WDM activities in order to reduce their current percentage of non-revenue water as far as possible and to keep the future water demand as low as possible. OM is also currently busy with the implementation of various augmentation options, in order to meet the future demands of the various towns.
ADMINISTRATION
Section 14 of the Water Services Act requires that the WSA must take reasonable steps to bring its draft WSDP to the notice of a number of different stakeholders so that they have the opportunity to comment on it.
The 2012/2013 WSDP will be distributed to the public as part of the IDP public participation process. The draft WSDP will also be distributed to all the neighbouring WSAs for their comments. All relevant comments received on the draft WSDP will be included in the final WSDP.
Community Participation: The Municipality has two district structures through which formalised public participation with its communities takes place i.e.
Ward Committees as well as
The Overstrand Municipal Advisory Forum (OMAF)
The Vision and Mission statements of OM are as follows:
VISION STATEMENT To be a centre of excellence for the community
MISSION STATEMENT
Creation of sustainable communities by delivering optimal services to support economic, social and environmental goals

170
DEMOGRAPHICS
Status Quo:
OM falls within the Breede Management Area and covers areas such as Rooi Els, Pringle Bay, Betty’s Bay, Kleinmond, Greater Hermanus, Stanford, Greater Gansbaai, Pearly Beach, Baardskeerdersbos and Buffeljags Bay. OM, like all other WSAs countrywide, faces a series of challenges namely:
Provision of basic services on a sustainable basis.
Stimulating local economic development.
Sound management of its financial affairs.
Strengthening continued community participation in the affairs of Local Government.
Provision of subsidised / low cost housing.
Development of a social strategy.
Growing population, unemployment and poverty.
Continued reformation in local government.
Backlog in infrastructure.
From a Water Services perspective, the most significant challenges are the augmentation of the existing water sources, the replacement and upgrading of old infrastructure to accommodate development, the provision of sustainable basic services to informal settlements and to ensure the provision of basic services to rural communities located on private farms. Strategies and action plans will need to be developed and implemented, in collaboration with farm owners, in order for the Municipality to fulfil its legal obligations and responsibilities as WSA. Physical Perspective: Climate Change: In terms of adapting for climate change, water systems will need to be more robust and new / alternative sources of supply may need to be found. Increased skills will be required from water managers and long-term water projections are required.
Although an overall decrease in rainfall is generally not forecasted, increased variability in the climate and frequency of extreme events, as well as increased temperature and wind could have an impact on water sources, particularly surface waters.
Due to the uncertainty associated with the impact of climate change on water demand and on water resources, it would be prudent to adopt the precautionary principle. The following scenario is likely:
As a result of decreased rainfall, all resources, especially surface water resources, will be under pressure and will have lower safe yields.
Due to increased heat units water demand from agriculture, as well as from towns (approximately 62% of all water) will rise sharply.
Even in the event that average annual rainfalls would not reduce much, it is anticipated that much greater variability of rainfall will occur within a year and also between years due to more extreme climatic conditions.

171
It is therefore advisable for OM that a conservative approach be followed regarding the management of water sources. It is proposed that the following approach be adopted to mitigate and adapt to the impacts of climate change:
All resources, especially surface water resources, need to be re-evaluated, especially where demand is close to the safe one in twenty year yields. It is therefore important to establish assurance of supply levels of all water sources;
increase assurance of supply of the water resources by ensuring that there is at least 10% additional capacity (headroom), when considering the maximum 24 hour demand on the peak month of the year;
do not undertake new developments unless a proper investigation of the implication on water sources and sustainability in the long term has been undertaken;
vigorously implement WDM measures, especially in terms of the following:
increased water efficiency
frequent monitoring of the water supply system, from the sources to the consumers; and
regular and adequate system maintenance and repairs.
Floods: One of the climate change threats in some parts of the Western Cape is the likelihood of floods with greater intensity and longer term impacts. There is likely to be increases in the severity and unpredictability of weather patterns. Flooding and storms are predicted which could have devastating effects on agricultural production.
Natural Environment:
The stretch of coastline includes three remarkable blue flag beaches, namely Kleinmond, Grotto and Hawston. The Grotto beach also received the prestigious international “Blue Flag” award.
The Management Area also includes the Kogelberg Biosphere Reserve which is only one of two such areas in the Republic. It is commonly referred to as the heart of the Cape floral kingdom as roughly one fifth of all known fynbos species occurs here.
An Environmental Management Services Section (EMS) was created to advise Council on environmental concerns. The EMS section addresses the concerns of environmental management policy, public participation, scientific decision support and compliance with the provisions of Environmental Legislation. This focus will guide and promote continual improvement in the management of the natural environment within the municipal region.
The functional strategies of the EMS Section are as follows:
Biodiversity planning;
Promotion of cooperative governance;
Development of management plans & implementation schedules;
Environmental management auditing;
Promotion of a better understanding of the natural environment;
Initiation of environmental management projects to address threats to the environment.

172
Demographic Perspective:
Economics: Most of the economic activity is presently occurring in Hermanus with Gansbaai showing all the signs of fast growing economic activity. Manufacturing, wholesale and retail trade; catering and accommodation and finance and business services are the most important economic sectors.
The OM’s economy has shown positive growth signs in the past five years. It can be described as healthy and with great economic potential surpassing other municipalities in the region. This growth happened against the backdrop of the economic downturn and does not neglect the act that some sectors suffered in the period.
There are two dominant features of the local economy that merit high level attention. First, the future of the Overstrand economy cannot be separated from the region’s natural heritage. The physical beauty of the area is its single biggest asset, but the natural resource base may also limit growth if resources are not effectively managed. In Overstrand the economy and its ecology are inseparable. OM has a fairly diversified economy and a great potential for tourism.
The second is the highly racialised and geographically concentrated poverty of the area. Economic forces (e.g. the decline in fishing and the seasonality of tourism and agriculture) impact negatively on the semi-skilled and unskilled workforce of Overstrand, while the growth sectors have benefited mainly the wealthy. In migration of poor and unskilled people to the area is associated with rising rates of poverty and inequality. Other than the formal safety nets of grants, the poor depend on informal work (construction) or on the third economy of illegal livelihoods (e.g. abalone poaching).
Social: The key human development issues facing the Municipality include poverty and unemployment. People migrating to the Overstrand have far reaching implications for the Municipality as it has a major effect on the economy. In-migration of people has an impact on the provision of housing and services, unemployment, poverty and the economy in general. Gaps and Strategies:
The six key strategies that should underpin all spatially related decision making in the OM’s Management Area, as included in OM’s Spatial Development Framework, are as follows:
Spatial Development Strategy Strategy
Managing Population Growth and In-migration
Adopt a selective “supply driven” approach by only providing for housing growth and related community facilities in the urban areas where the highest potential for sustained economic growth exists.
Housing Strategy
Eliminate the current subsidised housing backlog through the implementation of a co-ordinated housing supply plan. Ensure that the overall provision of land for housing makes provision for a balanced mix and range of housing types for all income groups.
Bulk Service Infrastructure Provision Compile a co-ordinated bulk infrastructure supply provision policy which prioritises the implementation of bulk infrastructure based on the municipality spatial development concept – Growth Management Framework.
Initiate – Place specific key economic development projects / drivers
Stimulate economic growth and development linked to the comparative locational advantage. Municipality must identify and actively facilitate key catalyst projects in conjunction with strategic partnerships with business / investors.
Priority areas for biodiversity conservation
All public owned land that is of high conservation importance is to be included in a formal municipal reserve network. The mechanism being to establishing contract nature reserves negotiated in conjunction with the WCNCB conservation stewardship programme, providing legally binding guidelines for land-use.
Rural development strategy Demarcate Rural Development Areas (RDAs) to ensure that non-agricultural development outside urban areas is managed and promoted in a sustainable manner.
The concept of using a Growth Management Strategy to promote the longer term sustainability of the municipal area and its sub-region is strongly supported by the OM’s Council. The Growth

173
Management Strategies for the various areas identifies and discusses the factors that affect densification within the context of the OM Area and include the proposed strategies and associated policies. Recommendations were also made in the Growth Management Strategies regarding the proposed densification priority areas for the next five years and the strategic actions required achieving the implementation thereof.
SERVICE LEVELS
Status Quo:
The current residential water and sanitation service levels in OM’s Management Area are as follows (Consumer Units):
Area
Buffe
ls Ri
ver
Klei
nmon
d
Gre
ater
He
rmna
nus
Stan
ford
Gre
ater
G
ansb
aai
Pear
ly
Beac
h
Baar
dske
er-d
ersb
os
Buffe
ljags
Ba
y
Farm
s Total
WATER SERVICE LEVELS Basic Need (RDP) 0 0 0 0 0 0 0 0 199 199 Housing Need (No Services)* 0 0 0 0 0 0 0 0 0 0
Housing Need (Communal Services)*
0 579 1 337 142 1 613 0 0 0 0 3 671
Adequate 3 051 2 971 13 306 1 072 4 175 1 088 57 33 1 542 27 295 Total 3 051 3 550 14 643 1 214 5 788 1 088 57 33 1 741 31 165
SANITATION SERVICE LEVELS Basic Need (RDP) 0 0 0 0 0 0 0 0 389 389 Housing Need (No Services)* 0 0 0 0 0 0 0 0 0 0
Housing Need (Communal Services)*
0 579 1 337 142 1 613 0 0 0 0 3 671
Adequate 3 051 2 971 13 306 1 072 4 175 1 088 57 33 1 352 27 105 Total 3 051 3 550 14 643 1 214 5 788 1 088 57 33 1 741 31 165
Note: * Informal areas with no services or communal services, exclude backyard dwellers on formal erven
Gaps and Strategies:
As a priority it is the responsibility of OM to make sure that adequate and appropriate investments are made to ensure the progressive realisation of the right of all people in its area of jurisdiction to receive at least a basic level of water and sanitation services. Whilst the provision of basic water services is the most important and immediate priority, WSAs are expected to provide intermediate and higher levels of services (for example, water on-site) wherever it is practical and provided it is financially viable and sustainable to do so.
A Water and Sanitation Service Level Policy is not yet in place. The water service levels to be provided by the Municipality to the consumers in their Management Area are however addressed to some extent in the Water Services By-laws. All water and sanitation services provided by OM to consumers within the Municipal Management Area are linked to the Municipality’s Tariff Policy and Rates Policy and poor households are incorporated through OM’s Indigent Policy.
The large number of residents in the lowest income groups (living in informal areas) places a major challenge on OM to provide suitable housing. OM works towards providing all households in the towns with a water connection inside the house and connecting all households to a waterborne sanitation system.
All the formal households in the urban areas of OM’s Management Area are provided with water connections inside the houses (Higher level of service). Communal standpipes and ablution facilities
174
are provided in the informal areas as temporary emergency services. OM takes note of the fact that communal standpipes represent probably the weakest part of a network’s water supply services. Standpipes are often constructed in ways that cannot withstand excessive use (and abuse) and often neglected in terms of operation and maintenance adversely affecting the health of its already vulnerable and poor users. Communal standpipes are also used by poor households who normally don’t pay for water.
OM is committed to support the private landowners as far as possible with regard to addressing the basic water services backlog that might still exist on the farms in the rural areas.
OM is however faced with various challenges with regard to the provision of services on private owned land in a financial sustainable manner (enabling the ongoing operation of services and adequate maintenance and rehabilitation of the assets), which include the following:
Free basic water policy:
The provision of the infrastructure (facilities) necessary to provide access to water to all households in a sustainable and economically viable manner.
The development of subsidy mechanisms which benefit those who most need it.
Free basic sanitation policy:
Provision of the correct sanitation facility to the poor household.
Health and hygiene promotion must be provided in a co-ordinated manner and must be properly managed and adequately funded if free basic sanitation is to become a reality. This requires close collaboration between the EHPs of the Overberg District Municipality responsible for environmental health and OM.
Subsidising the operating and maintenance costs. If the basic service is to be provided free to the poor then OM must ensure that the costs of providing the service are covered by the local government equitable share and / or through cross-subsidies within OM’s Management Area.
The ownership of water services assets may be in the hands of the person owning the land where an “on-site” water or sanitation facility is provided to a household. There is no legal impediment to the use of government grants to fund infrastructure for a poor household on private land not owned by that household, provided that the intermediary (the private land owner) makes a financial contribution (This is because the intermediary becomes the owner of the infrastructure once it is installed). Government is looking at specific policies with regard to the appropriate level of contribution.
The clinics and hospitals in OM’s Management Area have adequate and safe water supply and sanitation services. All the schools in OM’s Management Area also have adequate and safe water supply and sanitation services. It is important for the schools in OM’s Management Area to focus on Water Demand Management activities and for OM to support the schools with a WDM programme.
SOCIO ECONOMIC BACKGROUND
Status Quo:
The 2001 Census recorded the population in the Overstrand. Municipality’s Management Area at 55 770 (19 082 Households) and the 2007 Community Survey recorded the 2007 population at 74 574 (21 953 Households). The population of OM is currently estimated at approximately 92 180 persons for 2011/2012.

175
The projected present population and future population growth rates used for the WSDP are summarised in the table below:
Distribution System
Census 2001 2001 - 2011 Projections for 2011/2012 Number of
Residential Consumer Units
(Detail Water Meter Audit)
Population Number of Households
Persons / Household
Growth %/a Population
Number of Households (Permanent)
Buffels River 1 524 715 2.13 9.0% 3 608 1 693 3 051 Kleinmond 6 400 2 393 2.67 5.5% 10 932 4 088 3 550 Greater Hermanus 30 113 10 086 2.99 4.5% 46 765 15 663 14 643 Stanford 3 463 970 3.57 5.5% 5 915 1 657 1 214 Greater Gansbaai 8 603 2 983 2.88 8.0% 18 573 6 440 5 788 Pearly Beach 485 245 1.98 8.0% 1 047 529 1 088 Baardskeerdersbos
5 182 1 690 3.07 2.0% 488 57 57
Buffeljags Bay 2.0% 170 33 33 Farms 0.3% 4 682 1 741 1 741 TOTALS 55 770 19 082 2.92 5.1% 92 180 31 901 31 165
The number of Residential Consumer Units in the previous table was determined through the detail water meter audit and includes the households in the informal areas, but excludes backyard dwellers on formal erven.
The potentially economically active population in OM’s Management Area increased from 37 525 people in 2001 to 47 561 people in 2007, which means that the potentially economically active population increased with 10 036 new entrants over the six-year period. The labour force increased at an annual average rate of 5.7% over the period 2001 to 2007, with the labour force participation rate (LFPR) increasing from 64.2% to 70.6% from 2001 to 2007.
The number of people employed grew from 18 619 in 2001 to 25 470 in 2007, which represents an average annual increase of 5.4%. The unemployment rate increased from 22.7% to 24.1% over the same period.
The biggest employment contributors were Construction (15.8%), Wholesale and Retail Trade (14.7%) and Community, social and personal services (12.6%). The Manufacturing sector provided employment for 11% of the employed workers which makes it a significant sector in the municipal area.
Gaps and Strategies:
Social: OM plays a key role in the early childhood development of the children through various projects. During the last financial year an audit of ECD services in the Overstrand Municipality’s Management Area was carried out. The audit was developed and initiated by the Municipality while data collection was done by the ECD assistants appointed by the Overberg WCD Service Provider Forum. The audit collected information from 7 ECD centres across Overstrand. The information will be used to inform the Municipality’s ECD policy, which is currently being developed.
Funding proposals were prepared for the Hawston Care Centre (For assistance with the expansion of their facility) and the Poverty Forum (For the construction of a night shelter for the homeless).
The Municipality also acknowledges its role in the lives of the youth and in support of the aged, by supporting projects and capacity building initiatives of various Non-Governmental Organisations (NGO’s) and Community Based Organisations (CBO’s).
The Enlighten Education Trust, an Overstrand based non-governmental organization, is facilitating the Junior Council as an educational project on behalf of the Overstrand Municipality. These learners are also exposed to leadership camps where leadership qualities are strengthened.
The municipality has entered into a partnership with the Fund to establish a Youth Advisory Centre (YAC) to assist young people to gain access to resources including entrepreneurial opportunities.

176
Through this programme the youth will be well prepared to take advantage of services and resources available to them to improve their livelihoods.
The Local Labour Promotion Project (LLPP) of the Overstrand Municipality was initiated with the view to reduce outstanding municipal debt and provides income opportunities to communities with high unemployment and poverty levels. This is achieved by allowing the unemployed, those who are in service payment arrears and other needy groups within the communities to be part of the delivery of municipal services and the construction of new public facilities.
This project was devised as a means of effecting socio-economic upliftment, as part of the local authority’s strategy to bring about poverty alleviation through job creation whilst enhancing the prospects of reducing outstanding municipal consumer debt. This concept embarked on an initiative in terms of which debtors, particularly those who were unemployed, were targeted for participation in a local capital project aimed at addressing a communal back log in terms of facilities. Participants would earn a weekly wage whilst contributing financially towards the reduction of their outstanding municipal debts. The municipality also repairs water leakages on the users side at indigent households to prevent high water accounts and to ensure that the waste of the water resource be limited.
Apart from the challenge to facilitate more housing developments, there is also the challenge to integrate these areas with areas of opportunities to work, facilities and affordable service delivery. Economic: The proposed goals of OM’s economic development strategy are as follows: Increase economic growth to 6% per annum by 2014.
Sustain the natural resource base for future generations
Broaden participation in the economy.
Halve official unemployment and poverty by 2014.
Halve poverty by 2014
Build the human capital of the residents of Overstrand, especially the poor, in line with the changing needs of the economy.
The LED Strategy comprises of the following eight strategic interventions:
Facilitate the development of the priority economic sectors in Overstrand, by utilizing all resources at its disposal including sector development interventions being driven by other spheres of Government to grow the priority sectors identified as tourism, creative industries, fishing and agriculture.
Facilitate connectivity between different types of communities, different interests and the various towns in the Overstrand with a focus on public transport.
Develop the infrastructural capacity of the Overstrand and ensure an enabling spatial framework by utilising inter alia municipality assets.
Develop “and deploy” a marketing strategy for the Overstrand. The Destination Marketing Organisation (DMO) was established during February 2008.
Create an enabling environment for business development and growth with a focus on SMME support.
Manage the natural resources and state assets with the assistance of other spheres of government in a manner that ensures the long-term transformation and sustainability of the economy.
Promote the development of the economies of the poor through job creation programmes.
Assist with developing the human resource and skills base of the people of Overstrand with the creation of training capacity.

177
The proposed interventions to propel Local Economic Development include the following (The interventions are comprehensively discussed in OM’s IDP):
Tourism sector support
Creative industries sector support
Fishing industry sector support
Agriculture
Connectivity (Bridging the divisions between places and people)
Infrastructure development
Marketing
Enabling business environment
Resource and asset management
Economies of the poor
Human resource development
Overstrand Municipality also identified partnership programmes with high potential impact on provision of job opportunities, small enterprise development and skills development, which include the following Special projects:
Poverty alleviation initiatives (Education, sustainable jobs, connecting)
The Neighbourhood Development Programme Grant (NDPG)
Cape Whale Coast (Festivals, Seasonality, Main attractions, Focus Areas)
Youth Advisory Centre (YAC)
Job Creation and Emerging Contractor Empowerment Programme
LED Projects to stimulate economic growth
INFRASTRUCTURE
Status Quo:
OM is responsible for the operation and maintenance of all the water and sewer infrastructure summarised in the table below.
Component Description of the main functional tasks Dams (5) Bulk raw water storage.
Bulk supply pipelines (71 km) Bulk water supply to urban areas.
WTW: Buffels River Chemical dosing (Alum and Soda Ash), flocculation, sedimentation, filtration (Rapidgravity sand filters), stabilization (Soda Ash) and disinfection (Chlorine Gas).
WTW: Disakloof Filtration (Rapid gravity sand filters) and disinfection (Chlorination).
WTW: Kleinmond Chemical dosing (Alum and Lime), flocculation, sedimentation, filtration (Rapid gravitysand filters), stabilization (Soda Ash) and disinfection (Chlorine Gas).
WTW: Preekstoel Chemical dosing (Alum, Poly-electrolyte and Lime), flocculation, sedimentation, filtration(Rapid gravity sand filters), stabilization (Lime) and disinfection (Cl Gas or HTH Granules asback-up).
WTW: Groundwater Pre-oxidation, chemical dosing (Caustic Soda and Potassium Permanganate) anddisinfection (Chlorine Gas).
WTW: Franskraal Chemical dosing (Alum, Poly-electrolyte, Soda-Ash), flocculation, sedimentation, filtration (Rapid gravity sand filters), disinfection (Cl Gas) and stabilization (Soda-Ash).
WTW: De Kelders Nano Filtration Plant and Disinfection (Chlorine Gas). The plant will be commissioned in 2011/2012.
WTW: Pearly Beach Ultra Filtration and disinfection (Cl Gas)
WTW: Baardskeerdersbos Filtration (Pressure sand filters) and disinfection (Cl Gas)
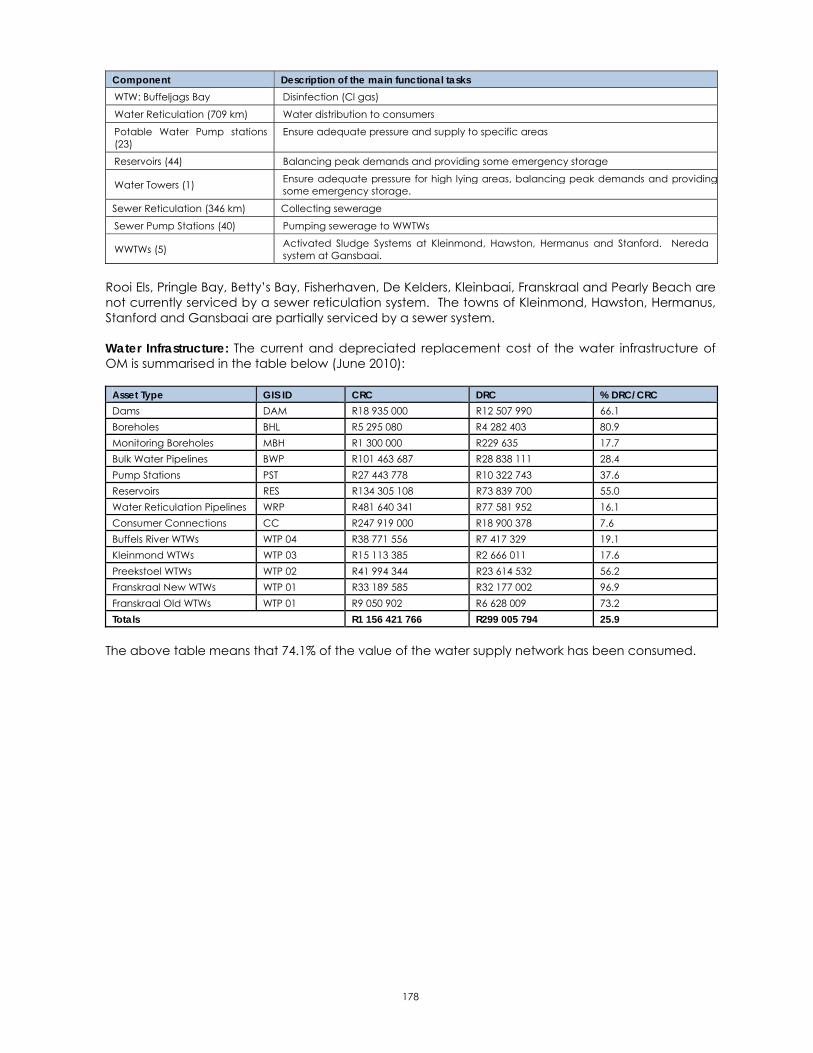
178
Component Description of the main functional tasks WTW: Buffeljags Bay Disinfection (Cl gas)
Water Reticulation (709 km) Water distribution to consumers
Potable Water Pump stations (23)
Ensure adequate pressure and supply to specific areas
Reservoirs (44) Balancing peak demands and providing some emergency storage
Water Towers (1) Ensure adequate pressure for high lying areas, balancing peak demands and providingsome emergency storage.
Sewer Reticulation (346 km) Collecting sewerage
Sewer Pump Stations (40) Pumping sewerage to WWTWs
WWTWs (5) Activated Sludge Systems at Kleinmond, Hawston, Hermanus and Stanford. Nereda system at Gansbaai.
Rooi Els, Pringle Bay, Betty’s Bay, Fisherhaven, De Kelders, Kleinbaai, Franskraal and Pearly Beach are not currently serviced by a sewer reticulation system. The towns of Kleinmond, Hawston, Hermanus, Stanford and Gansbaai are partially serviced by a sewer system.
Water Infrastructure: The current and depreciated replacement cost of the water infrastructure of OM is summarised in the table below (June 2010):
Asset Type GIS ID CRC DRC % DRC/CRC Dams DAM R18 935 000 R12 507 990 66.1 Boreholes BHL R5 295 080 R4 282 403 80.9 Monitoring Boreholes MBH R1 300 000 R229 635 17.7 Bulk Water Pipelines BWP R101 463 687 R28 838 111 28.4 Pump Stations PST R27 443 778 R10 322 743 37.6 Reservoirs RES R134 305 108 R73 839 700 55.0 Water Reticulation Pipelines WRP R481 640 341 R77 581 952 16.1 Consumer Connections CC R247 919 000 R18 900 378 7.6 Buffels River WTWs WTP 04 R38 771 556 R7 417 329 19.1 Kleinmond WTWs WTP 03 R15 113 385 R2 666 011 17.6 Preekstoel WTWs WTP 02 R41 994 344 R23 614 532 56.2 Franskraal New WTWs WTP 01 R33 189 585 R32 177 002 96.9 Franskraal Old WTWs WTP 01 R9 050 902 R6 628 009 73.2 Totals R1 156 421 766 R299 005 794 25.9
The above table means that 74.1% of the value of the water supply network has been consumed.
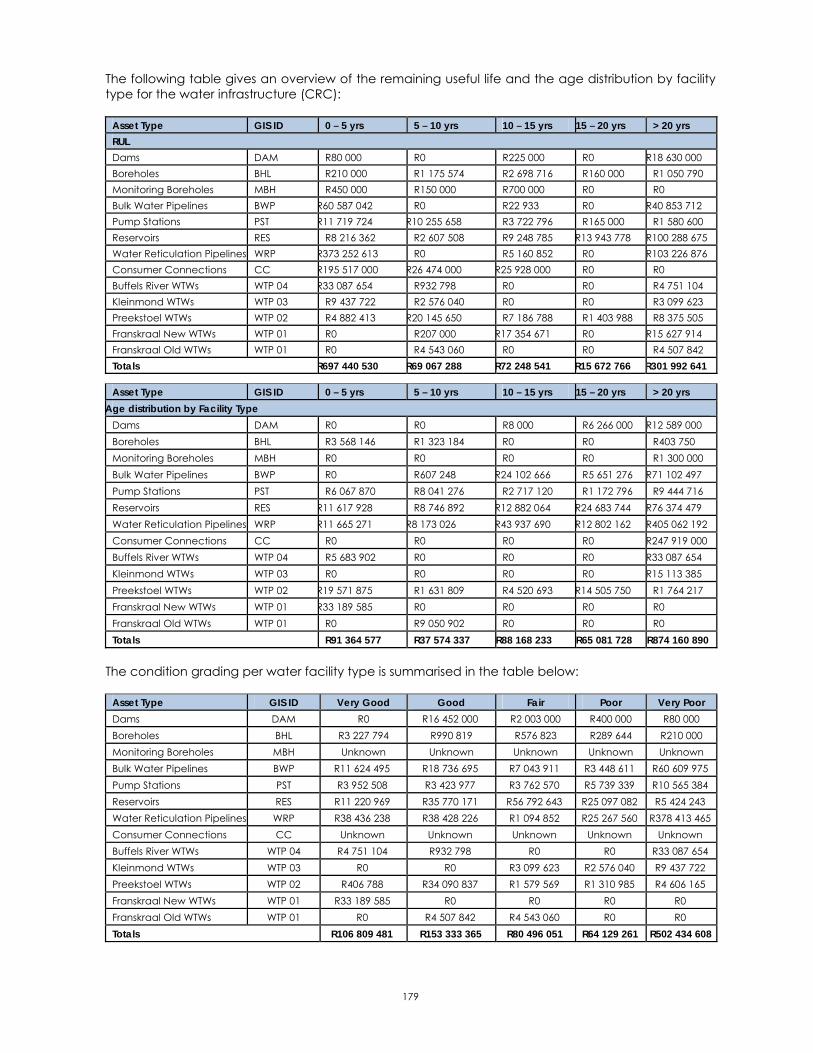
179
The following table gives an overview of the remaining useful life and the age distribution by facility type for the water infrastructure (CRC):
Asset Type GIS ID 0 – 5 yrs 5 – 10 yrs 10 – 15 yrs 15 – 20 yrs > 20 yrs RUL Dams DAM R80 000 R0 R225 000 R0 R18 630 000 Boreholes BHL R210 000 R1 175 574 R2 698 716 R160 000 R1 050 790 Monitoring Boreholes MBH R450 000 R150 000 R700 000 R0 R0 Bulk Water Pipelines BWP R60 587 042 R0 R22 933 R0 R40 853 712 Pump Stations PST R11 719 724 R10 255 658 R3 722 796 R165 000 R1 580 600 Reservoirs RES R8 216 362 R2 607 508 R9 248 785 R13 943 778 R100 288 675 Water Reticulation Pipelines WRP R373 252 613 R0 R5 160 852 R0 R103 226 876 Consumer Connections CC R195 517 000 R26 474 000 R25 928 000 R0 R0 Buffels River WTWs WTP 04 R33 087 654 R932 798 R0 R0 R4 751 104 Kleinmond WTWs WTP 03 R9 437 722 R2 576 040 R0 R0 R3 099 623 Preekstoel WTWs WTP 02 R4 882 413 R20 145 650 R7 186 788 R1 403 988 R8 375 505 Franskraal New WTWs WTP 01 R0 R207 000 R17 354 671 R0 R15 627 914 Franskraal Old WTWs WTP 01 R0 R4 543 060 R0 R0 R4 507 842 Totals R697 440 530 R69 067 288 R72 248 541 R15 672 766 R301 992 641
Asset Type GIS ID 0 – 5 yrs 5 – 10 yrs 10 – 15 yrs 15 – 20 yrs > 20 yrs Age distribution by Facility Type
Dams DAM R0 R0 R8 000 R6 266 000 R12 589 000 Boreholes BHL R3 568 146 R1 323 184 R0 R0 R403 750 Monitoring Boreholes MBH R0 R0 R0 R0 R1 300 000 Bulk Water Pipelines BWP R0 R607 248 R24 102 666 R5 651 276 R71 102 497 Pump Stations PST R6 067 870 R8 041 276 R2 717 120 R1 172 796 R9 444 716 Reservoirs RES R11 617 928 R8 746 892 R12 882 064 R24 683 744 R76 374 479 Water Reticulation Pipelines WRP R11 665 271 R8 173 026 R43 937 690 R12 802 162 R405 062 192 Consumer Connections CC R0 R0 R0 R0 R247 919 000 Buffels River WTWs WTP 04 R5 683 902 R0 R0 R0 R33 087 654 Kleinmond WTWs WTP 03 R0 R0 R0 R0 R15 113 385 Preekstoel WTWs WTP 02 R19 571 875 R1 631 809 R4 520 693 R14 505 750 R1 764 217 Franskraal New WTWs WTP 01 R33 189 585 R0 R0 R0 R0 Franskraal Old WTWs WTP 01 R0 R9 050 902 R0 R0 R0 Totals R91 364 577 R37 574 337 R88 168 233 R65 081 728 R874 160 890
The condition grading per water facility type is summarised in the table below:
Asset Type GIS ID Very Good Good Fair Poor Very Poor Dams DAM R0 R16 452 000 R2 003 000 R400 000 R80 000 Boreholes BHL R3 227 794 R990 819 R576 823 R289 644 R210 000 Monitoring Boreholes MBH Unknown Unknown Unknown Unknown Unknown Bulk Water Pipelines BWP R11 624 495 R18 736 695 R7 043 911 R3 448 611 R60 609 975 Pump Stations PST R3 952 508 R3 423 977 R3 762 570 R5 739 339 R10 565 384 Reservoirs RES R11 220 969 R35 770 171 R56 792 643 R25 097 082 R5 424 243 Water Reticulation Pipelines WRP R38 436 238 R38 428 226 R1 094 852 R25 267 560 R378 413 465 Consumer Connections CC Unknown Unknown Unknown Unknown Unknown Buffels River WTWs WTP 04 R4 751 104 R932 798 R0 R0 R33 087 654 Kleinmond WTWs WTP 03 R0 R0 R3 099 623 R2 576 040 R9 437 722 Preekstoel WTWs WTP 02 R406 788 R34 090 837 R1 579 569 R1 310 985 R4 606 165 Franskraal New WTWs WTP 01 R33 189 585 R0 R0 R0 R0 Franskraal Old WTWs WTP 01 R0 R4 507 842 R4 543 060 R0 R0 Totals R106 809 481 R153 333 365 R80 496 051 R64 129 261 R502 434 608
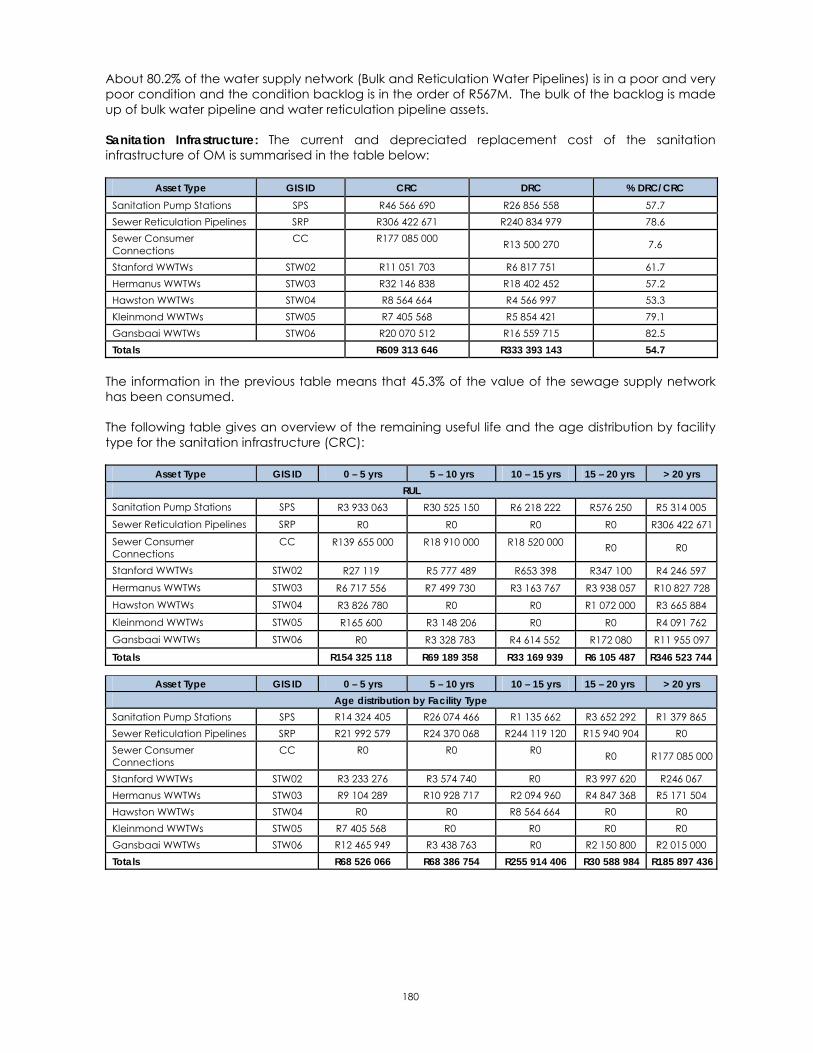
180
About 80.2% of the water supply network (Bulk and Reticulation Water Pipelines) is in a poor and very poor condition and the condition backlog is in the order of R567M. The bulk of the backlog is made up of bulk water pipeline and water reticulation pipeline assets.
Sanitation Infrastructure: The current and depreciated replacement cost of the sanitation infrastructure of OM is summarised in the table below:
Asset Type GIS ID CRC DRC % DRC/CRC Sanitation Pump Stations SPS R46 566 690 R26 856 558 57.7 Sewer Reticulation Pipelines SRP R306 422 671 R240 834 979 78.6 Sewer Consumer Connections
CC R177 085 000 R13 500 270 7.6
Stanford WWTWs STW02 R11 051 703 R6 817 751 61.7 Hermanus WWTWs STW03 R32 146 838 R18 402 452 57.2 Hawston WWTWs STW04 R8 564 664 R4 566 997 53.3 Kleinmond WWTWs STW05 R7 405 568 R5 854 421 79.1 Gansbaai WWTWs STW06 R20 070 512 R16 559 715 82.5 Totals R609 313 646 R333 393 143 54.7
The information in the previous table means that 45.3% of the value of the sewage supply network has been consumed.
The following table gives an overview of the remaining useful life and the age distribution by facility type for the sanitation infrastructure (CRC):
Asset Type GIS ID 0 – 5 yrs 5 – 10 yrs 10 – 15 yrs 15 – 20 yrs > 20 yrs RUL
Sanitation Pump Stations SPS R3 933 063 R30 525 150 R6 218 222 R576 250 R5 314 005 Sewer Reticulation Pipelines SRP R0 R0 R0 R0 R306 422 671 Sewer Consumer Connections
CC R139 655 000 R18 910 000 R18 520 000 R0 R0
Stanford WWTWs STW02 R27 119 R5 777 489 R653 398 R347 100 R4 246 597 Hermanus WWTWs STW03 R6 717 556 R7 499 730 R3 163 767 R3 938 057 R10 827 728 Hawston WWTWs STW04 R3 826 780 R0 R0 R1 072 000 R3 665 884 Kleinmond WWTWs STW05 R165 600 R3 148 206 R0 R0 R4 091 762 Gansbaai WWTWs STW06 R0 R3 328 783 R4 614 552 R172 080 R11 955 097
Totals R154 325 118 R69 189 358 R33 169 939 R6 105 487 R346 523 744
Asset Type GIS ID 0 – 5 yrs 5 – 10 yrs 10 – 15 yrs 15 – 20 yrs > 20 yrs Age distribution by Facility Type
Sanitation Pump Stations SPS R14 324 405 R26 074 466 R1 135 662 R3 652 292 R1 379 865 Sewer Reticulation Pipelines SRP R21 992 579 R24 370 068 R244 119 120 R15 940 904 R0 Sewer Consumer Connections
CC R0 R0 R0 R0 R177 085 000
Stanford WWTWs STW02 R3 233 276 R3 574 740 R0 R3 997 620 R246 067 Hermanus WWTWs STW03 R9 104 289 R10 928 717 R2 094 960 R4 847 368 R5 171 504 Hawston WWTWs STW04 R0 R0 R8 564 664 R0 R0 Kleinmond WWTWs STW05 R7 405 568 R0 R0 R0 R0 Gansbaai WWTWs STW06 R12 465 949 R3 438 763 R0 R2 150 800 R2 015 000 Totals R68 526 066 R68 386 754 R255 914 406 R30 588 984 R185 897 436

181
The condition grading per sanitation facility type is summarised in the table below:
Asset Type GIS ID Very Good Good Fair Poor Very Poor Sanitation Pump Stations SPS R6 859 000 R11 094 810 R23 948 392 R3 187 148 R1 477 340 Sewer Reticulation Pipelines SRP R46 362 647 R260 060 025 R0 R0 R0 Sewer Consumer Connections
CC Unknown Unknown Unknown Unknown Unknown
Stanford WWTWs STW02 R777 808 R6 563 088 R3 582 188 R128 619 R0 Hermanus WWTWs STW03 R6 145 749 R6 580 944 R7 757 733 R8 173 433 R3 488 979 Hawston WWTWs STW04 R86 040 R4 651 844 R0 R3 819 880 R6 900 Kleinmond WWTWs STW05 R4 091 762 R3 148 206 R165 600 R0 R0 Gansbaai WWTWs STW06 R12 403 849 R3 416 939 R4 249 724 R0 R0 Totals R76 726 855 R295 515 856 R39 703 637 R15 309 080 R4 973 219
About 3.4% of the sewage network is in a poor and very poor condition and the condition backlog is in the order of R20.3M. The bulk of the backlog is made up of sewer pump stations and sewage treatment works assets.
Gaps and Strategies:
BULK WATER INFRASTRUCTURE
The Water Master Plan (January 2011) has indicated that based on the most likely land-use development scenario, it will be necessary to upgrade the following bulk water supply systems.
Buffels River: The existing bulk water supply system has insufficient capacity to supply the future water demands for the fully occupied scenario and the additional future development areas.
Upgrading of the 300mm dia bulk pipeline from Buffels River WTW to Betty’s Bay Voorberg reservoir (3 335m x 315mm dia parallel reinforcement of main pipe). The upgrading of this pipeline can be postponed if a booster pump station is constructed on the pipeline before the draw-off point to the Pringle Bay reservoir.
Kleinmond: The existing bulk water supply system has sufficient capacity to supply the future water demands for the fully occupied scenario and the additional future development areas. No future feeder mains are required.
Greater Hermanus: The existing bulk water supply system has insufficient capacity to supply the future water demands for the fully occupied scenario and the additional future development areas. The following upgrades to the existing Coastal bulk pipeline supply system will be required in future to augment bulk water supply through this system.
Replace the existing 300mm dia bulk pipeline with a 500mm dia pipeline when the existing 300 and 400mm dia bulk pipes reaches capacity.
New 200mm dia parallel reinforcement of the existing 160mm dia bulk supply pipeline to the Onrus reservoir in order to augment supply to the reservoir.
Replace the existing 300mm dia bulk pipeline with a 500mm dia pipeline when the existing 300 and 350mm dia bulk pipes reaches capacity.
New 550mm dia parallel reinforcement of the existing 250mm dia pipeline when the existing 250mm dia bulk pipe reaches capacity.
New 500mm dia parallel reinforcement of the existing 150mm dia bulk supply pipeline to the Hawston LL reservoir in order to augment supply to the reservoir.

182
New 200mm dia parallel reinforcement of the existing 250mm dia bulk supply pipeline to the Fisherhaven LL reservoir in order to augment supply to the reservoir.
New 250mm dia parallel reinforcement of the existing 200mm dia bulk supply pipeline to the Fisherhaven LL reservoir in order to augment supply to the reservoir.
The following upgrades to the existing Hermanus bulk pipeline supply system will be required in future to augment bulk water supply through this system.
Replace the existing 225mm dia bulk pipeline with a 400mm dia pipeline when the existing 225 and 300mm dia bulk pipes reaches capacity.
New 315mm dia parallel reinforcement of the existing 400mm dia bulk supply pipeline when the 400mm dia pipeline reaches capacity.
The following new feeder mains will be required in future.
New 335mm dia bulk supply pipeline from the Hawston LL reservoir to the proposed Hawston HL reservoir when it is constructed.
Other future mains that will require upgrading are
New 250mm dia parallel reinforcement of the existing 150mm dia bulk supply pipeline to the Sandbaai reservoir in order to augment supply to the reservoir.
Replace the existing 225mm dia bulk pipeline (from the Preekstoel WTW to the Coastal and Hermanus bulk pipelines) with a 500mm dia pipeline when the existing 225, 400 and 600mm dia bulk pipes from the Preekstoel WTW reaches capacity.
Stanford: The existing bulk water supply system has sufficient capacity to supply the future water demands for the fully occupied scenario and the additional future development areas. No future feeder mains are required.
Greater Gansbaai: The existing Greater Gansbaai bulk supply system was design to supply water to De Kelders, Gansbaai, Kleinbaai and Franskraal from the Klipgat water source. During peak demand periods, zone valves before Gansbaai reservoirs are closed to ensure that Klipgat pump station provides water only to De Kelders and a portion of the Gansbaai consumers whereas the remaining consumers are temporarily provided with water from the Franskraal Pump System.
The existing bulk water supply system has insufficient capacity to supply the future water demands for the fully occupied scenario and the additional future development areas.
For the future scenario the Greater Gansbaai bulk system water designed to supply water from the Franskraal pump system to Franskraal, Kleinbaai and Gansbaai. De Kelders will be supplied with water from the Klipgat system and be supplemented by water from the Franskraal pump system. The following upgrades to the existing Greater Gansbaai bulk supply system will be required in the future:
Replace the existing 200mm dia bulk pipeline with a 315mm dia pipeline when the existing 200mm and 355mm dia bulk pipes reaches capacity.
New 200mm dia parallel reinforcement of the existing 150mm dia bulk supply pipeline to the Kleinbaai reservoir in order to augment supply to the reservoir.
New 315mm dia parallel reinforcement of the existing 250mm dia bulk supply pipeline in order to augment supply to the Gansbaai and De Kelders reservoirs.

183
New 400mm dia bulk supply pipeline to the Gansbaai reservoir. This item is required in order to utilize the existing bulk pipelines between Gansbaai and De Kelders so that bulk water supply to the De Kelders reservoirs can be augmented from Gansbaai.
Dedicate the existing 250mm dia pipeline between the Greater Gansbaai bulk system and the De Kelders reservoirs as a bulk supply pipeline to the De Kelders reservoirs. This item is required to isolate the bulk and distribution systems from each other when the new supply pipeline from the reservoirs to the De Kelders network is implemented.
New 450mm dia bulk supply pipeline from the Franskraal WTW to the Franskraal reservoirs.
Pearly Beach: The existing bulk water supply system has sufficient capacity to supply the future water demands for the fully occupied scenario and the additional future development areas. No future feeder mains are required.
WATER TREATMENT WORKS INFRASTRUCTURE
Buffels River WTW: The plant is operated below its design capacity, and is only in operation for 8 hours per day. There is therefore considerable spare capacity available by operating the plant for longer duration per day, and no capacity increase will be required for the foreseeable future. Overall conclusions / recommendations included in the 2011 Process Audit Report were as follows:
The treatment plant appears to be poorly designed within the building, but is capable of producing a good quality final water that complied with all the quality parameters of SANS 241 during 2011.
Safe access should be provided to all sections in the treatment plant. General housekeeping and safety conditions should be improved.
Plant refurbishments are required as a matter of urgency to address the above shortcomings currently existing on the treatment plant.
The plant is well-managed, with motivated process controllers who appears passionate about their work.
The operational monitoring programme has been extended and improved in November 2011 with the purchase of new measuring instruments (colorimeter, turbidimeter, pH meter).
The plant is currently the holder of a Blue Drop award, but refurbishment and improvements are required, especially to housekeeping and safety matters, to retain this achievement.
Kleinmond WTW: The plant operates well within its design capacity. The Kleinmond WTW is generally operated and maintained satisfactorily, but a number of challenges and shortcomings exist. The most important of these are the occasional high aluminium levels in the final water. Considerable attention is already given to this, and tests are run in order to reduce the occurrence of Al in the final water. Other shortcomings relate to the condition of the chemical dosing facilities, the filtered water acceptance facilities and storage of dry chemicals (lime and sod-ash bags).

184
Overall conclusions / recommendations included in the 2011 Process Audit Report for refurbishment and improvement of these points were as follows:
Provide hoppers at the bottom of the settling tanks to improve sludge disposal.
Improve the installation and arrangement of chemical dosing facilities (to provide facilities similar to that at Preekstoel WTW).
Provide better clarity boxes for the rapid sand filters to replace the redundant existing filter boxes.
Provide a storage building for treatment chemicals to allow safe storage of these chemicals.
Improve the condition of the access road to the plant.
Improve the operational monitoring programme by applying more frequent on-plant sampling and measurements, and using the Operational Information Tool spreadsheets to communicate the results to the Engineering Department.
Preekstoel WTW: The Municipality started with the upgrading of the capacity of the Preekstoel WTW from the current 24 Ml/d to 28 Ml/d through refurbishment. The lime dosing equipment at the WTW was also upgraded recently. A new 10 Ml/d biological WTW for iron and manganese removal will also be constructed at the Preekstoel WTW, in order to treat the newly developed groundwater sources and to increase the overall treatment capacity for the Greater Hermanus to 38 Ml/d.
The overall conclusions / recommendations included in the 2011 Process Audit Report were as follows:
It is recommended that a comprehensive plant audit be carried out when the construction work has been completed and the new filters commissioned.
The existing lay-out cannot be changed and should be accepted as a give; however, it should be assured that all access points, staircases and walkways are kept in a safe condition for the plant personnel, i.e. sufficient lighting, slip-resistant, accessible.
It is recommended that the laboratory equipment suppliers provide comprehensive training to the superintendents on the use, calibration and maintenance of the equipment, so as to ensure optimal use. This should be accompanied by training on water quality control, interpretation and communication of monitoring results.
It is also important that all operational personnel are aware of the procedures contained in the Process Audit Report for the Preekstoel Water Treatment Plant and the incident management protocol, and know how to apply this.
In order to change the mindset of the operating personnel to participate and contribute to this improved maintenance programmes, it is recommended that they receive high-quality training in maintenance of water treatment plant, and in particular on the operation and maintenance on mechanical and electrical equipment. This should include the ever-important aspects of good housekeeping and safety management.
Stanford WTW: A new chlorination facility is currently being provided, which includes telemetry connection to the Franskraal WTW. No specific other recommendations are included in the 2011 Process Audit Report.
Franskraal WTW: The WTW was completely rebuilt a number of years ago and is currently well equipped and well-operated. The plant operates well within its design capacity.
De Kelders WTW: This new Nano filtration WTW was constructed during 2011 at De Kelders.

185
Pearly Beach WTW: The Pearly Beach WTW is a new treatment plant that was recently constructed, and uses state-of-the-art ultrafiltration membrane technology to ensure a high quality final effluent. No specific recommendations were identified in the 2011 Process Audit Report.
Baardskeerdersbos WTW: The plant operates well within its design capacity. The recommendations included in the 2011 Process Audit Report were as follows:
Improve reliability of automated operation (backwashing).
Security fencing and a lockable gate should be provided around the treatment system.
Due to the elevated colour and iron concentrations, an investigation should be done to consider options for upgrading the treatment system to include processes for colour and iron removal (e.g. ultrafiltration).
Contract a local resident on a part time basis to inspect the treatment plant on a daily basis, and to measure free chlorine residual.
Depending on the quality of the raw water, the chlorine dosage rate should be checked and adjusted if necessary to give the desired free chlorine residual at the final water sampling point.
The contracted local resident can also asses the condition of the treatment equipment on a regular basis, thereby improving maintenance efficiency.
Buffeljags Bay WTW: The chlorine installation is new and care was taken to ensure that all the safety requirements are met.
WATER PUMP STATIONS
The Water Master Plan (January 2011) has indicated that based on the most likely land-use development scenario, it will be necessary for the following water pump stations:
Distribution System Recommendations included in the Water Master Plan Capacity
(l/s) Head (m)
Cost (RM)
Buffels River A new booster pump station for the higher lying areas in the Voorberg reservoir zone is proposed. 10 25 0.651
Kleinmond
A new booster pump station for the higher lying areas in future development area KM-1 and the existing Over Hills suburb is proposed. 10 45 0.748
A new booster pump station for the higher lying areas in future development area KM-2 is proposed. 15 30 0.748
A new booster pump station for the higher lying areas in future development area KM-4 is proposed. 10 30 0.748
Greater Hermanus
A new booster pump station to augment water supply through the Coastal bulk pipeline. 140 57 3.317
Upgrading of the existing Fisherhaven HL pump station is proposed 20 50 0.280 New bulk pump station to augment bulk water supply when existing supply reaches capacity 370 25 3.549
Stanford No future pump stations are required - - -
Greater Gansbaai
A new booster pump station to augment water supply through the Franskraal bulk pump system – Phase 1 53 35 1.365
Upgrading of the Franskraal bulk pump system – Phase 2 140 30 0.420 Upgrading of the Franskraal bulk pump system – Phase 3 195 40 0.420 New Gansbaai bulk pump station in order to augment bulk water supply to De Kelders 60 70 2.028
Pearly Beach Upgrade the Pearly Beach pump system 65 45 1.036 Total 15.310

186
RESERVOIR INFRASTRUCTURE
OM’s overall storage factors of the reservoirs for the various towns, based on 1 x PDD (24 hours storage capacity), are 1.09 for Buffels River, 1.70 for Kleinmond, 1.97 for Greater Hermanus, 1.37 for Stanford, 1.73 for Greater Gansbaai, 2.37 for Pearly Beach, 1.52 for Baardskeerdersbos and 3.84 for Buffeljags Bay.
Even though the town’s overall storage capacity might be adequate there might be some distribution zones within the town’s network with inadequate storage capacity, as identified through the Water Master Plan (January 2011) and indicated in the table below:
Distribution System Recommendations included in the Water Master Plan Capacity
(Ml) Cost (RM)
Buffels River
A new reservoir is proposed at the existing Rooi Els reservoir site to augment reservoir storage for Rooi Els (TWL = 65.3m). 0.500 2.033
A new reservoir is proposed at the existing Pringle Bay reservoir site to augment reservoir storage for Pringle Bay (TWL = 66.5m). 2.500 5.915
A new reservoir is proposed at the existing Voorberg reservoir site to augment reservoir storage for Betty’s Bay (TWL = 65.5m). 3.000 6.632
Kleinmond No future reservoirs are required - -
Greater Hermanus
A new reservoir is proposed at the existing Fisherhaven LL reservoir site to augment reservoir storage for the Fisherhaven LL reservoir and PRV zones (TWL = 60m). 4.000 8.848
A new reservoir is proposed at the existing Hawston LL reservoir site to augment reservoir storage in Hawston TWL = 66m). 5.500 10.472
A new reservoir is proposed for the new future development areas in Hawston that cannot be accommodated in the Hawston LL reservoir zone (TWL = 120m). 10.000 15.960
A new reservoir is proposed at the existing Onrus reservoir site to augment reservoir storage in Onrus (TWL = 78m). 1.500 4.767
Additional reservoir storage is proposed for the Kidbrook Place private development (The cost of additional storage is for the account of the private development)
0.300 0.000
A new reservoir is proposed at the existing Sandbaai reservoir site to augment reservoir storage in Sandbaai (TWL = 64.9m). 4.000 8.848
A new reservoir is proposed at the existing Northcliff reservoir site to augment reservoir storage in the Northcliff reservoir zone (TWL = 75m). 0.300 1.475
A new reservoir is proposed at the existing Onrus Manor reservoir site to augment reservoir storage in the Onrus Manor reservoir zone (TWL = 143.8). 1.000 3.178
A new reservoir is proposed at the existing Fisherhaven HL reservoir site to augment reservoir storage in the Fisherhaven HL reservoir zone (TWL = 108m). 1.000 3.178
A new reservoir is proposed at the existing Mount Pleasant reservoir site to augment reservoir storage in the Mount Pleasant reservoir zone (TWL = 87m). 0.600 2.436
Stanford A new reservoir is proposed at the existing Stanford reservoir site to augment reservoir storage for Stanford in order to accommodate anticipated future development areas (TWL = 85.4m)
3.000 6.632
Greater Gansbaai
A new reservoir is proposed at the existing Franskraal reservoir site to augment reservoir storage for Franskraal (TWL = 59.4m) 1.000 3.178
A new reservoir is proposed at the existing Kleinbaai reservoir site to augment reservoir storage for Kleinbaai (TWL = 60.5m) 2.000 5.040
A new reservoir is proposed at the existing Gansbaai reservoir site to augment reservoir storage for Gansbaai (TWL = 62.5m) 5.000 9.520
A new reservoir is proposed at the existing De Kelders reservoir site to augment reservoir storage for De Kelders (TWL = 97.5m) 2.500 6.300
Pearly Beach No new reservoirs are required - - Total 47.700 104.412

187
WATER AND SEWER RETICULATION INFRASTRUCTURE
The Water Master Plan (January 2011) has indicated that based on the most likely land-use development scenario, the following further water reticulation infrastructure components will be necessary.
BUFFELS RIVER Proposed distribution zones The only changes to the existing distribution zones are that the water network of the higher lying erven in the Betty’s Bay
Voorberg reservoir zone is rezoned and incorporated in a new Betty’s Bay booster zone. Proposed future system and required works The existing Buffels River water distribution system has insufficient capacity to supply the future water demands for the fully occupied scenario and the additional future development areas. A few distribution pipelines are required to reinforce water supply within the Pringle Bay reservoir, Voorberg reservoir and
Sunny Seas reservoir distribution networks. A few pipelines and valves are proposed in order to implement the Betty’s Bay booster zone. KLEINMOND Proposed distribution zones The Protearand reservoir zone is increased to accommodate future development areas within the zone. A new PRV zone is proposed in order to reduce the high static pressures of the lower lying erven within the existing
Protearand reservoir zone. Three new booster pumping zones are proposed for higher lying future development areas KM-1, KM-2 and KM-4. The existing Protearand reservoir zone is rezoned in order to accommodate the higher lying erven within the Over Hills
suburb in the proposed booster pumping zone No.3. Proposed future system and required works The existing Kleinmond water distribution system has insufficient capacity to supply the future water demands for the fully occupied scenario and the additional future development areas. A few distribution pipelines are required to reinforce water supply within the Kleinmond distribution networks. New distribution pipelines are proposed for when future development areas KM-2, 3 and 4 develop. A new pipeline and valves are proposed in order to implement the Kleinmond booster zone No.3 GREATER HERMANUS Proposed distribution zones A new Hawston HL reservoir zone is proposed to accommodate future development area GH-5.1 as well as the existing
higher lying erven in Hawston that are currently supplied from the Fisherhave HL reservoir. This zone should be supplied from a new reservoir with a TWL of 120m.
A new Hawston HL PRV zone (supplied from the proposed Hawston HL reservoir zone via a PRV) is proposed to accommodate future development areas GH-6.1 and 6.3. The setting of the PRV should be set at 63m.
The boundaries of the Northcliff reservoir zone are increased to accommodate some of the higher lying erven of the Hermanus reservoir zone.
The boundaries of the Hermanus Heights reservoir zone are increased to accommodate erven that are currently supplied directly from the Hermanus bulk pipeline as well as the higher lying erven in the North Western part of Voëlklip that are currently supplied from the Voëlklip LL reservoir.
The boundaries of the existing reservoir zones are increased to accommodate future development areas in Greater Hermanus.
Proposed future system and required works The existing Greater Hermanus water distribution system has insufficient capacity to supply the future water demands for the fully occupied scenario and the additional future development areas. A few distribution pipelines are required to reinforce water supply within the Greater Hermanus distribution network. New distribution pipelines are proposed to supply future development areas with water when they develop. A new inter-connection pipeline between the Fisherhaven LL reservoir zone and the Hawston LL reservoir is proposed as
an emergency connection when future development area GH-3 develops. A new non-return valve on the 200mm dia supply pipeline from the Fisherhaven HL reservoir to the proposed Hawston HL
reservoir zone is proposed in order to prevent inflow during the night from the Hawston HL reservoir zone into the Fisherhaven HL reservoir.
A new PRV in the future Hawston HL reservoir zone is proposed in order to manage static pressures in this future zone. Rezoning between the Northcliff reservoir and Hermanus reservoir zones and between the Hermanus Heights reservoir,
Direct Feed and Voëlklip LL reservoir zones is proposed.

188
STANFORD Proposed distribution zones The existing Stanford PRV zone is increased to accommodate a larger portion of the existing Stanford reservoir zone. The boundaries of the existing zones are increased to accommodate future development areas in Stanford. Proposed future system and required works A few distribution pipelines are required to reinforce water supply within the Stanford distribution network. New distribution pipelines are proposed for when future development areas SF-1 to 3 and SF-7 to 9 develop. GREATER GANSBAAI Proposed distribution zones A new De Kelders booster zone is proposed to accommodate the higher lying erven of future development area GG-1. The boundaries of the existing reservoir zones are increased to accommodate future development areas in Greater
Gansbaai. Proposed future system and required works The existing Greater Gansbaai water distribution system has insufficient capacity to supply the future water demands for the fully occupied scenario and the additional future development areas. A few distribution pipelines are required to reinforce water supply within the Greater Gansbaai distribution network. New distribution pipelines are proposed to supply future development areas with water when they develop. In De Kelders a dedicated supply pipeline from the reservoirs to the network is proposed. It is proposed that when the Birkenhead area in Kleinbaai is services with a formal water network, a secondary pipeline
between Birkenhead and the existing Kleinbaai network is constructed along the coast line in order to improve network redundancy and conveyance in the area.
PEARLY BEACH Proposed distribution zones The boundaries of the existing distribution zones are increased to accommodate future development areas in Pearly
Beach. Proposed future system and required works The existing Pearly Beach water distribution system has insufficient capacity to supply the future water demands for the fully occupied scenario and the additional future development areas. A few distribution pipelines are required to reinforce water supply within the Pearly Beach distribution network and new
distribution pipelines are proposed to supply water to anticipated future development areas.
The Sewer Master Plan (January 2011) has indicated that based on the most likely land-use development scenario, the following further sewer reticulation infrastructure components will be necessary.
BUFFELS RIVER A new sewer reticulation system is proposed for the towns of Rooi Els, Pringle Bay and Betty’s Bay in the Buffels River area,
which are currently serviced by septic tanks. In Rooi Els four new future pumping station drainage areas are proposed that pumps the sewage of Rooi Els locally and
eventually to a proposed Pringle Bay Main bulk pumping station. In Pringle Bay three new future pumping station drainage areas are proposed that pumps the sewage of Pringle Bay
locally and eventually to a proposed Pringle Bay Main bulk pumping station. In Betty’s Bay eight new future pumping station drainage areas are proposed that pumps the sewage of Betty’s Bay
locally and eventually to three proposed Betty’s Bay Main bulk pumping stations. A new bulk sewage pumping system is proposed for the Buffels River area where sewage from the proposed Rooi Els Main PS is pumped to the Pringle Bay Main PS. From the Pringle Bay Main PS to the Betty’s Bay Main PS No.1, from the Betty’s Bay Main PS No.1 to the Betty’s Bay Main PS No.2 and from the Betty’s Bay Main PS No.2 to the Betty’s Bay Main PS No.3. It is proposed that the sewage of the Buffels River area is then pumped form the Betty’s Bay Main PS No. directly to the existing Kleinmond WWTW. KLEINMOND The boundaries of the existing drainage areas in Kleinmond are increased to accommodate proposed future
development and existing unserviced erven that fall within these drainage areas. A new future pumping station K1 drainage area is proposed for the existing unserviced erven in the south western areas
of Kleinmond areas and future development areas KM-6 and KM-7. A new pumping station and rising main should be constructed for this new drainage area that discharges into the existing Kleinmond PS4 drainage area.
Upgrading of the Kleinmond PS No.4 is proposed when the existing pumping station reaches capacity. A few existing outfall sewers require upgrading by replacement with larger sized future sewers. New outfall sewers are proposed to accommodate future development areas and to service the existing unserviced
erven in Kleinmond.
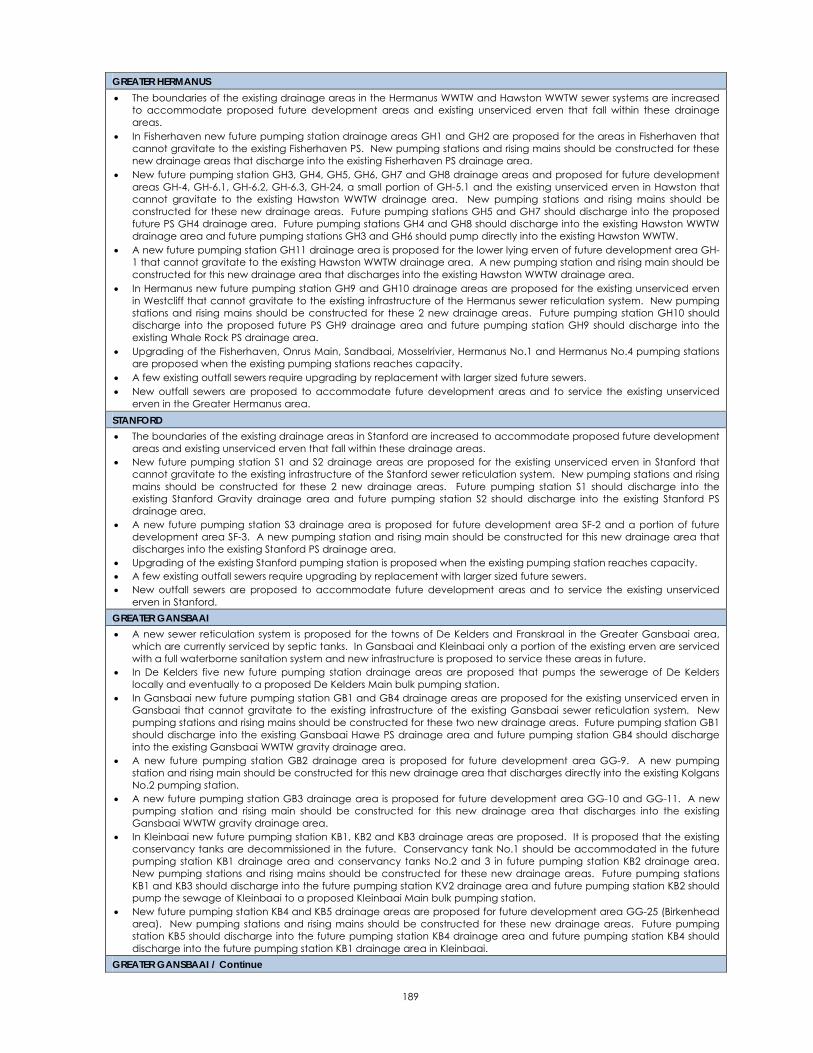
189
GREATER HERMANUS The boundaries of the existing drainage areas in the Hermanus WWTW and Hawston WWTW sewer systems are increased
to accommodate proposed future development areas and existing unserviced erven that fall within these drainage areas.
In Fisherhaven new future pumping station drainage areas GH1 and GH2 are proposed for the areas in Fisherhaven that cannot gravitate to the existing Fisherhaven PS. New pumping stations and rising mains should be constructed for these new drainage areas that discharge into the existing Fisherhaven PS drainage area.
New future pumping station GH3, GH4, GH5, GH6, GH7 and GH8 drainage areas and proposed for future development areas GH-4, GH-6.1, GH-6.2, GH-6.3, GH-24, a small portion of GH-5.1 and the existing unserviced erven in Hawston that cannot gravitate to the existing Hawston WWTW drainage area. New pumping stations and rising mains should be constructed for these new drainage areas. Future pumping stations GH5 and GH7 should discharge into the proposed future PS GH4 drainage area. Future pumping stations GH4 and GH8 should discharge into the existing Hawston WWTW drainage area and future pumping stations GH3 and GH6 should pump directly into the existing Hawston WWTW.
A new future pumping station GH11 drainage area is proposed for the lower lying erven of future development area GH-1 that cannot gravitate to the existing Hawston WWTW drainage area. A new pumping station and rising main should be constructed for this new drainage area that discharges into the existing Hawston WWTW drainage area.
In Hermanus new future pumping station GH9 and GH10 drainage areas are proposed for the existing unserviced erven in Westcliff that cannot gravitate to the existing infrastructure of the Hermanus sewer reticulation system. New pumping stations and rising mains should be constructed for these 2 new drainage areas. Future pumping station GH10 should discharge into the proposed future PS GH9 drainage area and future pumping station GH9 should discharge into the existing Whale Rock PS drainage area.
Upgrading of the Fisherhaven, Onrus Main, Sandbaai, Mosselrivier, Hermanus No.1 and Hermanus No.4 pumping stations are proposed when the existing pumping stations reaches capacity.
A few existing outfall sewers require upgrading by replacement with larger sized future sewers. New outfall sewers are proposed to accommodate future development areas and to service the existing unserviced
erven in the Greater Hermanus area. STANFORD The boundaries of the existing drainage areas in Stanford are increased to accommodate proposed future development
areas and existing unserviced erven that fall within these drainage areas. New future pumping station S1 and S2 drainage areas are proposed for the existing unserviced erven in Stanford that
cannot gravitate to the existing infrastructure of the Stanford sewer reticulation system. New pumping stations and rising mains should be constructed for these 2 new drainage areas. Future pumping station S1 should discharge into the existing Stanford Gravity drainage area and future pumping station S2 should discharge into the existing Stanford PS drainage area.
A new future pumping station S3 drainage area is proposed for future development area SF-2 and a portion of future development area SF-3. A new pumping station and rising main should be constructed for this new drainage area that discharges into the existing Stanford PS drainage area.
Upgrading of the existing Stanford pumping station is proposed when the existing pumping station reaches capacity. A few existing outfall sewers require upgrading by replacement with larger sized future sewers. New outfall sewers are proposed to accommodate future development areas and to service the existing unserviced
erven in Stanford. GREATER GANSBAAI A new sewer reticulation system is proposed for the towns of De Kelders and Franskraal in the Greater Gansbaai area,
which are currently serviced by septic tanks. In Gansbaai and Kleinbaai only a portion of the existing erven are serviced with a full waterborne sanitation system and new infrastructure is proposed to service these areas in future.
In De Kelders five new future pumping station drainage areas are proposed that pumps the sewerage of De Kelders locally and eventually to a proposed De Kelders Main bulk pumping station.
In Gansbaai new future pumping station GB1 and GB4 drainage areas are proposed for the existing unserviced erven in Gansbaai that cannot gravitate to the existing infrastructure of the existing Gansbaai sewer reticulation system. New pumping stations and rising mains should be constructed for these two new drainage areas. Future pumping station GB1 should discharge into the existing Gansbaai Hawe PS drainage area and future pumping station GB4 should discharge into the existing Gansbaai WWTW gravity drainage area.
A new future pumping station GB2 drainage area is proposed for future development area GG-9. A new pumping station and rising main should be constructed for this new drainage area that discharges directly into the existing Kolgans No.2 pumping station.
A new future pumping station GB3 drainage area is proposed for future development area GG-10 and GG-11. A new pumping station and rising main should be constructed for this new drainage area that discharges into the existing Gansbaai WWTW gravity drainage area.
In Kleinbaai new future pumping station KB1, KB2 and KB3 drainage areas are proposed. It is proposed that the existing conservancy tanks are decommissioned in the future. Conservancy tank No.1 should be accommodated in the future pumping station KB1 drainage area and conservancy tanks No.2 and 3 in future pumping station KB2 drainage area. New pumping stations and rising mains should be constructed for these new drainage areas. Future pumping stations KB1 and KB3 should discharge into the future pumping station KV2 drainage area and future pumping station KB2 should pump the sewage of Kleinbaai to a proposed Kleinbaai Main bulk pumping station.
New future pumping station KB4 and KB5 drainage areas are proposed for future development area GG-25 (Birkenhead area). New pumping stations and rising mains should be constructed for these new drainage areas. Future pumping station KB5 should discharge into the future pumping station KB4 drainage area and future pumping station KB4 should discharge into the future pumping station KB1 drainage area in Kleinbaai.
GREATER GANSBAAI / Continue
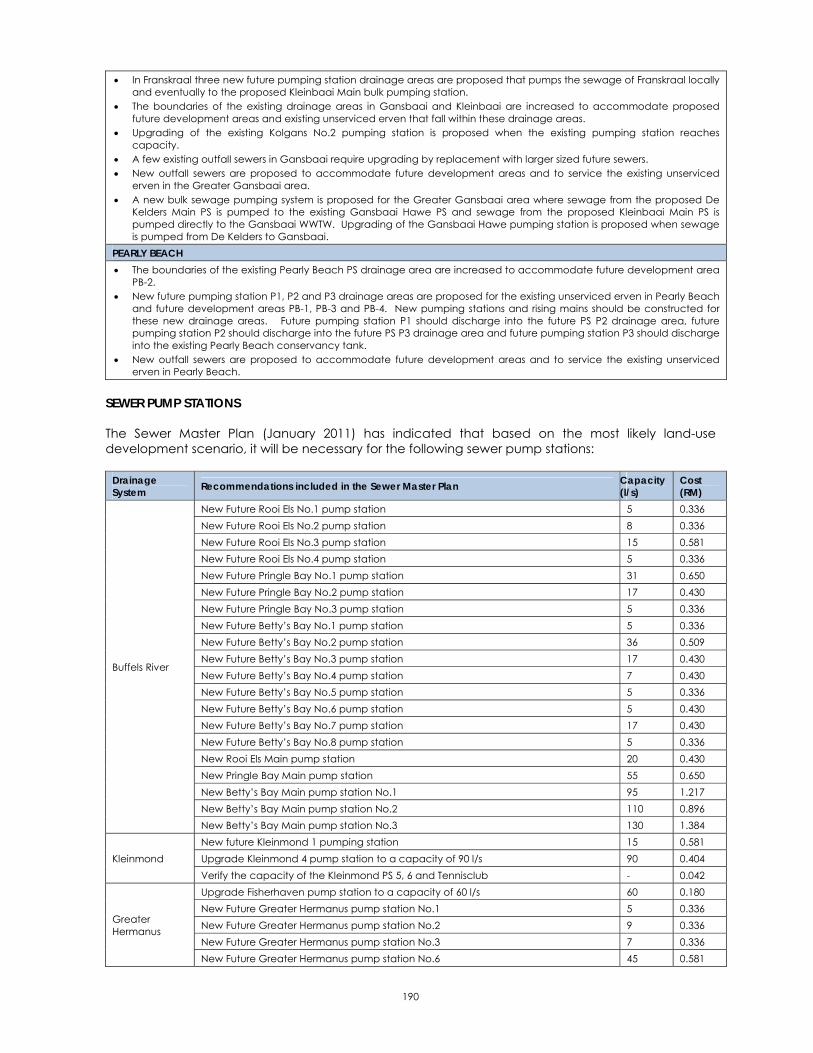
190
In Franskraal three new future pumping station drainage areas are proposed that pumps the sewage of Franskraal locally and eventually to the proposed Kleinbaai Main bulk pumping station.
The boundaries of the existing drainage areas in Gansbaai and Kleinbaai are increased to accommodate proposed future development areas and existing unserviced erven that fall within these drainage areas.
Upgrading of the existing Kolgans No.2 pumping station is proposed when the existing pumping station reaches capacity.
A few existing outfall sewers in Gansbaai require upgrading by replacement with larger sized future sewers. New outfall sewers are proposed to accommodate future development areas and to service the existing unserviced
erven in the Greater Gansbaai area. A new bulk sewage pumping system is proposed for the Greater Gansbaai area where sewage from the proposed De
Kelders Main PS is pumped to the existing Gansbaai Hawe PS and sewage from the proposed Kleinbaai Main PS is pumped directly to the Gansbaai WWTW. Upgrading of the Gansbaai Hawe pumping station is proposed when sewage is pumped from De Kelders to Gansbaai.
PEARLY BEACH The boundaries of the existing Pearly Beach PS drainage area are increased to accommodate future development area
PB-2. New future pumping station P1, P2 and P3 drainage areas are proposed for the existing unserviced erven in Pearly Beach
and future development areas PB-1, PB-3 and PB-4. New pumping stations and rising mains should be constructed for these new drainage areas. Future pumping station P1 should discharge into the future PS P2 drainage area, future pumping station P2 should discharge into the future PS P3 drainage area and future pumping station P3 should discharge into the existing Pearly Beach conservancy tank.
New outfall sewers are proposed to accommodate future development areas and to service the existing unserviced erven in Pearly Beach.
SEWER PUMP STATIONS
The Sewer Master Plan (January 2011) has indicated that based on the most likely land-use development scenario, it will be necessary for the following sewer pump stations:
Drainage System Recommendations included in the Sewer Master Plan Capacity
(l/s) Cost (RM)
Buffels River
New Future Rooi Els No.1 pump station 5 0.336 New Future Rooi Els No.2 pump station 8 0.336 New Future Rooi Els No.3 pump station 15 0.581 New Future Rooi Els No.4 pump station 5 0.336 New Future Pringle Bay No.1 pump station 31 0.650 New Future Pringle Bay No.2 pump station 17 0.430 New Future Pringle Bay No.3 pump station 5 0.336 New Future Betty’s Bay No.1 pump station 5 0.336 New Future Betty’s Bay No.2 pump station 36 0.509 New Future Betty’s Bay No.3 pump station 17 0.430 New Future Betty’s Bay No.4 pump station 7 0.430 New Future Betty’s Bay No.5 pump station 5 0.336 New Future Betty’s Bay No.6 pump station 5 0.430 New Future Betty’s Bay No.7 pump station 17 0.430 New Future Betty’s Bay No.8 pump station 5 0.336 New Rooi Els Main pump station 20 0.430 New Pringle Bay Main pump station 55 0.650 New Betty’s Bay Main pump station No.1 95 1.217 New Betty’s Bay Main pump station No.2 110 0.896 New Betty’s Bay Main pump station No.3 130 1.384
Kleinmond New future Kleinmond 1 pumping station 15 0.581 Upgrade Kleinmond 4 pump station to a capacity of 90 l/s 90 0.404 Verify the capacity of the Kleinmond PS 5, 6 and Tennisclub - 0.042
Greater Hermanus
Upgrade Fisherhaven pump station to a capacity of 60 l/s 60 0.180 New Future Greater Hermanus pump station No.1 5 0.336 New Future Greater Hermanus pump station No.2 9 0.336 New Future Greater Hermanus pump station No.3 7 0.336 New Future Greater Hermanus pump station No.6 45 0.581
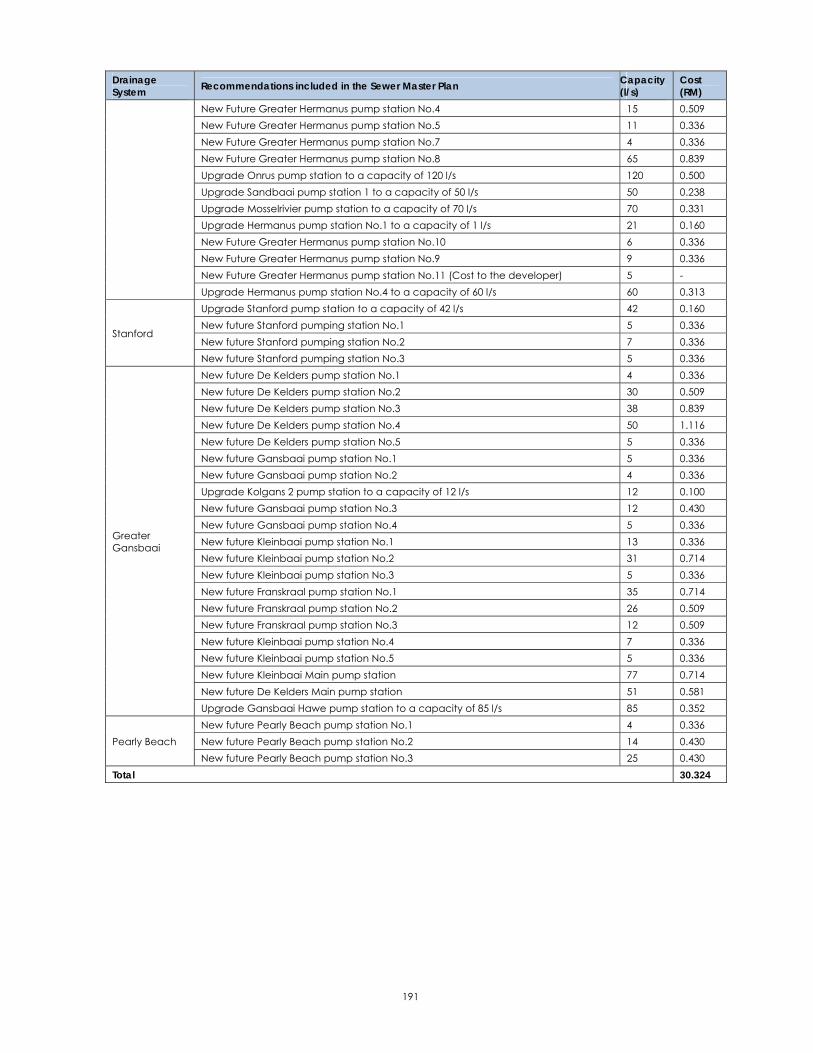
191
Drainage System Recommendations included in the Sewer Master Plan Capacity
(l/s) Cost (RM)
New Future Greater Hermanus pump station No.4 15 0.509 New Future Greater Hermanus pump station No.5 11 0.336 New Future Greater Hermanus pump station No.7 4 0.336 New Future Greater Hermanus pump station No.8 65 0.839 Upgrade Onrus pump station to a capacity of 120 l/s 120 0.500 Upgrade Sandbaai pump station 1 to a capacity of 50 l/s 50 0.238 Upgrade Mosselrivier pump station to a capacity of 70 l/s 70 0.331 Upgrade Hermanus pump station No.1 to a capacity of 1 l/s 21 0.160 New Future Greater Hermanus pump station No.10 6 0.336 New Future Greater Hermanus pump station No.9 9 0.336 New Future Greater Hermanus pump station No.11 (Cost to the developer) 5 - Upgrade Hermanus pump station No.4 to a capacity of 60 l/s 60 0.313
Stanford
Upgrade Stanford pump station to a capacity of 42 l/s 42 0.160 New future Stanford pumping station No.1 5 0.336 New future Stanford pumping station No.2 7 0.336 New future Stanford pumping station No.3 5 0.336
Greater Gansbaai
New future De Kelders pump station No.1 4 0.336 New future De Kelders pump station No.2 30 0.509 New future De Kelders pump station No.3 38 0.839 New future De Kelders pump station No.4 50 1.116 New future De Kelders pump station No.5 5 0.336 New future Gansbaai pump station No.1 5 0.336 New future Gansbaai pump station No.2 4 0.336 Upgrade Kolgans 2 pump station to a capacity of 12 l/s 12 0.100 New future Gansbaai pump station No.3 12 0.430 New future Gansbaai pump station No.4 5 0.336 New future Kleinbaai pump station No.1 13 0.336 New future Kleinbaai pump station No.2 31 0.714 New future Kleinbaai pump station No.3 5 0.336 New future Franskraal pump station No.1 35 0.714 New future Franskraal pump station No.2 26 0.509 New future Franskraal pump station No.3 12 0.509 New future Kleinbaai pump station No.4 7 0.336 New future Kleinbaai pump station No.5 5 0.336 New future Kleinbaai Main pump station 77 0.714 New future De Kelders Main pump station 51 0.581 Upgrade Gansbaai Hawe pump station to a capacity of 85 l/s 85 0.352
Pearly Beach New future Pearly Beach pump station No.1 4 0.336 New future Pearly Beach pump station No.2 14 0.430 New future Pearly Beach pump station No.3 25 0.430
Total 30.324
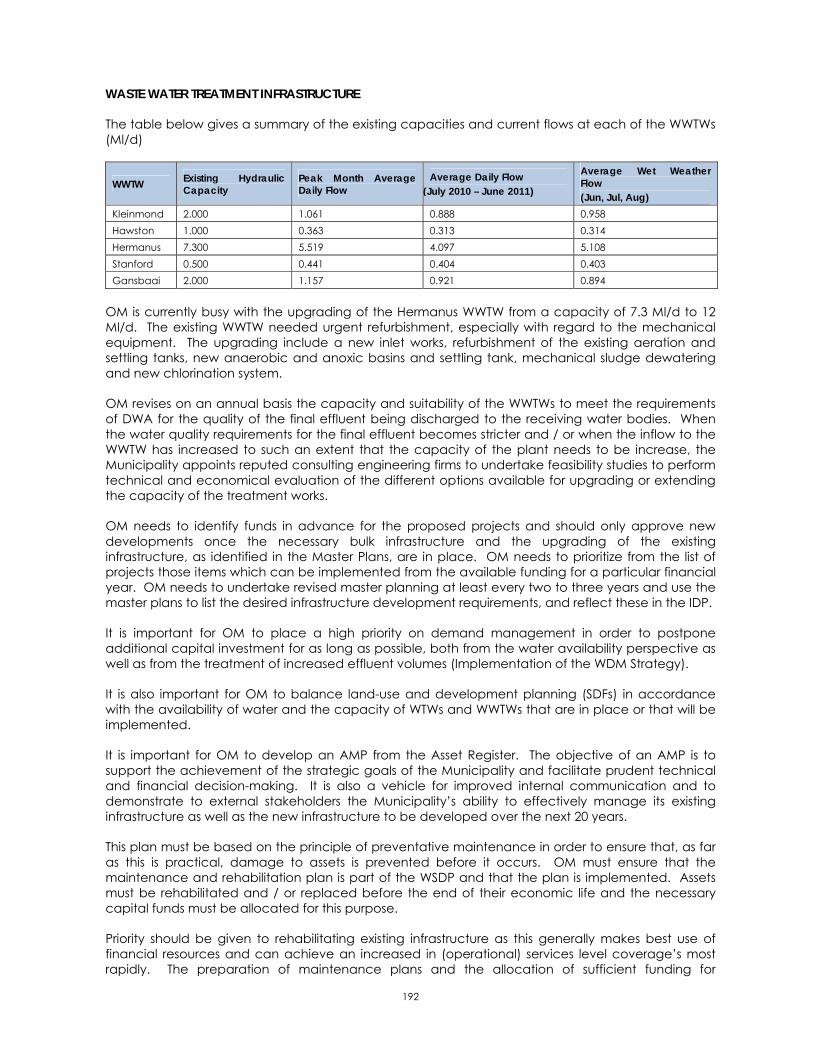
192
WASTE WATER TREATMENT INFRASTRUCTURE
The table below gives a summary of the existing capacities and current flows at each of the WWTWs (Ml/d)
WWTW Existing Hydraulic Capacity
Peak Month Average Daily Flow
Average Daily Flow (July 2010 – June 2011)
Average Wet Weather Flow (Jun, Jul, Aug)
Kleinmond 2.000 1.061 0.888 0.958 Hawston 1.000 0.363 0.313 0.314 Hermanus 7.300 5.519 4.097 5.108 Stanford 0.500 0.441 0.404 0.403 Gansbaai 2.000 1.157 0.921 0.894
OM is currently busy with the upgrading of the Hermanus WWTW from a capacity of 7.3 Ml/d to 12 Ml/d. The existing WWTW needed urgent refurbishment, especially with regard to the mechanical equipment. The upgrading include a new inlet works, refurbishment of the existing aeration and settling tanks, new anaerobic and anoxic basins and settling tank, mechanical sludge dewatering and new chlorination system.
OM revises on an annual basis the capacity and suitability of the WWTWs to meet the requirements of DWA for the quality of the final effluent being discharged to the receiving water bodies. When the water quality requirements for the final effluent becomes stricter and / or when the inflow to the WWTW has increased to such an extent that the capacity of the plant needs to be increase, the Municipality appoints reputed consulting engineering firms to undertake feasibility studies to perform technical and economical evaluation of the different options available for upgrading or extending the capacity of the treatment works.
OM needs to identify funds in advance for the proposed projects and should only approve new developments once the necessary bulk infrastructure and the upgrading of the existing infrastructure, as identified in the Master Plans, are in place. OM needs to prioritize from the list of projects those items which can be implemented from the available funding for a particular financial year. OM needs to undertake revised master planning at least every two to three years and use the master plans to list the desired infrastructure development requirements, and reflect these in the IDP.
It is important for OM to place a high priority on demand management in order to postpone additional capital investment for as long as possible, both from the water availability perspective as well as from the treatment of increased effluent volumes (Implementation of the WDM Strategy).
It is also important for OM to balance land-use and development planning (SDFs) in accordance with the availability of water and the capacity of WTWs and WWTWs that are in place or that will be implemented.
It is important for OM to develop an AMP from the Asset Register. The objective of an AMP is to support the achievement of the strategic goals of the Municipality and facilitate prudent technical and financial decision-making. It is also a vehicle for improved internal communication and to demonstrate to external stakeholders the Municipality’s ability to effectively manage its existing infrastructure as well as the new infrastructure to be developed over the next 20 years.
This plan must be based on the principle of preventative maintenance in order to ensure that, as far as this is practical, damage to assets is prevented before it occurs. OM must ensure that the maintenance and rehabilitation plan is part of the WSDP and that the plan is implemented. Assets must be rehabilitated and / or replaced before the end of their economic life and the necessary capital funds must be allocated for this purpose.
Priority should be given to rehabilitating existing infrastructure as this generally makes best use of financial resources and can achieve an increased in (operational) services level coverage’s most rapidly. The preparation of maintenance plans and the allocation of sufficient funding for

193
maintenance are required to prevent the development of a large condition backlog. The potential renewal projects for water and sanitation infrastructure need to be identified from the Asset Register. All assets with a condition grading of “poor” and “very poor” need to be prioritised.
OPERATION AND MAINTENANCE
Status Quo:
OM drafted their first Water Safety Plan during 2009/2010, which was updated during the 2010/2011 financial year. A qualified, dedicated team was established by OM to compile and update the Water Safety Plan. A detailed risk assessment was executed and the existing control measures implemented by Overstrand Municipality were summarised. An Improvement / Upgrade Plan was also developed with relevant Water and Safety Management Procedures. Each identified improvement was linked to one of the Water Safety Plan Team members to take responsibility for implementation together with an appropriate time frame for implementation of these controls.
An Operational and Compliance Monitoring Programme that meets the requirements of DWA, as stipulated in the Blue Drop Criteria, are implemented by the Municipality. Bacteriological and Chemical samples are taken on a monthly basis.
The DWA launched the blue and green drop certification, with regard to drinking water quality and the quality of treated effluent discharged from WWTWs, at the Municipal Indaba during September 2008. Blue drop status is awarded to those towns that comply with 95% criteria on drinking water quality management. The Blue Drop Certification programme is in its third year of existence and promises to be the catalyst for sustainable improvement of South African drinking water quality management in its entirety.
The blue drop performance of OM is summarised as follows in the DWA’s 2011 Blue Drop Report (May 2011): Municipal Blue Drop Score 90.56%
Regulatory Impression: Overstrand Municipality’s Blue Drop performance is considered remarkable as the Municipality achieved Blue Drop Status for three (3) of their water supply systems which take commendable commitment. This dedication evidently goes beyond the objective of regulatory recognition for excellent drinking water quality management, but has been adopted as the norm for business henceforth. The Department wishes to applaud this approach.
There however remains room for improvement. It is required that attention is given to treatment optimisation in Greater Hermanus and Kleinmond to ensure that the chemical compliance trend improves towards the national standard expectation.
The technical verification (Preekstoel) revealed the following findings:
1. A good logbook system is being implemented but unfortunately selective recordings are made. Equipment failure and other events were not captured. In addition, all readings are not captured for the expensive in-line monitoring devices. No recordings on regular operation such as desludging, which is required to ensure effective treatment.
2. The efficiency of the sand-filtration at the Preekstoel Water Treatment Plant was weighed down by the back-up blowers not working and the filter media not being up to standard.
BLUE DROP REPORT CARD
Criteria Greater Hermanus Buffels River Kleinmond Stanford
Water Safety Planning Process and Incident Response Management 88 90 90 89
Process Control, Maintenance and Management Skills 80 70 80 90
Monitoring Programme 96 93 93 69

194
BLUE DROP REPORT CARD
Criteria Greater Hermanus Buffels River Kleinmond Stanford
Credibility of Sample Analyses 100 100 100 100 Submission of results 100 100 100 100 Drinking Water Quality Compliance 70 100 85 100 Performance Publication 100 100 100 100 Asset Management 67 88 93 93 Bonus Scores 5.5 2.1 3.0 2.1 Penalties 0.3 0 0.2 0 Blue Drop Score (2011) 87.23% 95.07% 93.09% 95.15% Blue Drop Score (2010) 75.31% 63.83% 60.06% NA System Design Supply Capacity (Ml/d) 24 5.5 5.8 1.3 System Operational Capacity 54% 58% 43% 88% Population served by System 42 800 3 000 9 800 5 300 Average daily consumption per capita (l) 302 > 500 254 215
Microbiological Compliance (12 months) 100.00% 100.00% 100.00% 100.00%
Chemical Compliance (12 months) 84.03% 96.91% 91.80% 100.00% BLUE DROP REPORT CARD
Criteria Greater Gansbaai Buffeljags Bay Baardskeerd
ers-bos Pearly Beach
Water Safety Planning Process and Incident Response Management 90 88 90 90
Process Control, Maintenance and Management Skills 89 90 89 90
Monitoring Programme 85 70 70 100 Credibility of Sample Analyses 100 100 100 100 Submission of results 100 100 100 85 Drinking Water Quality Compliance 100 20 100 100 Performance Publication 100 100 100 100 Asset Management 81 85 78 93 Bonus Scores 2.1 7.5 2.7 2.4 Penalties 0 0 0 0.2 Blue Drop Score (2011) 95.10% 75.37% 93.68% 94.31% Blue Drop Score (2010) 63.81% NA NA NA System Design Supply Capacity (Ml/d) 6.5 0.08 0.15 1.5 System Operational Capacity 62% 100% 17% 24% Population served by System 15 900 290 230 900 Average daily consumption per capita (l) 253 275 110 400
Microbiological Compliance (12 months) 99.04% 93.33% 100.00% 100.00%
Chemical Compliance (12 months) 100.00% 100.00% 100.00% 100.00% Notes: * Compliance determined from Municipal Overview

195
All the WWTWs were classified with the DWA. The Process Controllers and Supervisors for the various WWTWs were also registered and classified. The Municipality is currently busy compiling Wastewater Risk Abatement Plans for all the WWTWs.
An Operational and Compliance Effluent Monitoring Programme that meets the requirements of DWA as stipulated in the Green Drop Criteria are implemented by the Municipality. Operational samples are taken on a daily basis at all the WWTWs. The compliance samples that are taken on a monthly basis at all the WWTWs are analysed at an accredited laboratory and monthly monitoring and inspection reports are compiled by an accredited service provider for all the WWTWs.
An incident response protocol is implemented, in which certain reactive procedures are followed when an incident occurs (Normally when a malfunction of the treatment processes occur due to power failures, faulty equipment, adverse weather conditions or human error).
A set of Compliance Alert Levels, corresponding to the requirements of the General Standard (at present) has been drawn up as part of the Operation and Maintenance Manuals and the Wastewater Risk Abatement Plans. For continuously improving the performance of the various WWTWs, a set of operational alert levels has also been drawn up and followed by the Process Controllers.
There are two levels of incident management, firstly when final effluent is discharged that does not meet the requirements of the Water Act, and secondly when an event takes place causing a major pollution event for which emergency response is required. For serious incidents or emergency situations, additional actions and notifications are required, including notification of DWA and the media / public.
The DWA also completed their Second Order Assessment of Municipal Waste Water Treatment Plants, DWA’s Green Drop Report for 2011, which provides a scientific and verifiable status of municipal waste water treatment. Green drop status is awarded to those WSAs that comply with 90% criteria on key selected indicators on waste water quality management.
The green drop performance of OM is summarised as follows in the DWA’s 2011 Green Drop Report: Average Green Drop Score 88.8%
Regulatory Impression: Overstrand Municipality achieved Greed Drop certification for Hermanus and even though the Municipality did not achieve Green Drop certification for the other four (4) wastewater systems, the lowest Green Drop score was 75.8%. The Municipality need to give priority to process optimisation to ensure that effluent quality compliance is improved in order to achieve the expected excellent levels which are an essential requirement that prevented the allocation of Green Drops to the other four (4) systems. In addition, Stanford’s system has reached the design capacity and requires appropriate infrastructure investment. Green Drop Findings: 1. The key area of concern remains the two (2) treatment plants that do not comply with the
specified effluent quality limits. 2. Low effluent compliance is reached although both plants are operated within their design
capacity. This suggests that process control need to be optimised. 3. Kleinmond monitoring regime must be expanded. 4. Asset Management needs to improve in the areas where the municipality could not provide
sufficient evidence. 5. Data credibility needs to be addressed, as the scientific element lag slightly behind the
requirement of the tested criteria.
The site inspection score for Greater Gansbaai was 90%, Stanford 57% and Hermanus 80%.

196
GREEN DROP REPORT CARD
Criteria Hermanus Hawston Stanford Gansbaai Kleinmond
Process Control, Maintenance and Management Skill 100 100 80 100 90
Monitoring Programme 80 80 100 100 80
Credibility of Sample Analysis 83.5 83.5 83.5 83.5 83.5 Submission of results 100 100 100 100 100 Wastewater Quality Compliance 88 75 48 20 48
Failure Response Management 100 100 100 100 100 Bylaws 100 100 100 100 100 Treatment and Collector Capacity 100 100 97 100 100 Asset Management 90 88 87 88 88 Bonus Scores 0 0 3.7 2.4 3.7 Penalties 0 0 0 0 0 Green Drop Score (2011) 92.1% 87.9% 83.0% 75.8% 82.5% Green Drop Score (2009) 66% 57% 61% 66% 66% Treatment Capacity (Ml/d) 13 1 0.5 2 2 Operational % i.t.o. Capacity 56% 45% 100% 43% 50% Cumulative Risk Rating (CRR) 8 6 8 7 8 % i.t.o. Maximum Risk Rating 34.7 33.3 44.4 38.9 44.4

197
Gaps and Strategies:
The Water Safety Plan Team of OM is committed to meet regularly to review all aspects of the Water Safety Plan to ensure that they are still accurate. In addition to the regular three year review, the Water Safety Plan will also be reviewed when, for example, a new water source is developed, major treatment improvements are planned and brought into use, or after a major water quality incident.
The comprehensive O&M Manuals, which were developed for each of the WTWs, will further assist the Municipality to ensure that the necessary control measures for the effective operation of the WTWs are in place.
It is important for OM to classify all treatment works and operators along the lines of the regulations by establishing a programme for certification of works, operators, technicians and managers. The process will include reviewing the skills needed and aligning resources to these needs as well as reviewing total staff numbers necessary to meet all the objectives in the National Water Act.
Establish a mentoring role for operators ensuring an adequately trained and classified workforce with dedicated training programmes for supervisors and operators. Establish budgets to address the shortfall of skilled staff, rethink methods to retain qualified personnel and plan for succession and clear career paths for experienced staff. With such a program a source of specific resources of skilled operators, technicians and managers will be established.
The Occupational Health and Safety Act contain provisions directing employers to maintain a safe workplace and to minimize the exposure of employees and the public to workplace hazards. It is important for OM to compile a Legal Compliance Audit of their WTWs and WWTW, which will provide the management of OM with the necessary information to establish whether the Municipality is in compliance with the legislation or not.
OM is committed to work with the DWA and the other role-players in order to improve on their 2011 Blue Drop Score for the various distribution systems. The Water Safety Plans, Process Audits that were carried out at all the WTWs and Operation and Maintenance Manuals which were compiled for all the WTWs will be used to improve the Municipality’s performance. The Improvement / Upgrade Plan of the Water Safety Plan will also be implemented by the Municipality in order to address the potential risks identified through the Water Safety Plan process.
It is also important for OM to continue with the upgrading of WWTWs when necessary, in order to reduce the risk of source contamination. This is a clear priority in the next few years based on the budget. WWTWs will be managed and operated by OM to comply with the permitted standards and in so doing intends to work towards green drop status for their other WWTWs aswell.
An Incident Response Management Protocol is in place and implemented by OM. The Incident Response Management Protocol was also incorporated into the Wastewater Risk Abatement Plans. The purpose of the Incident Response Management Protocol is to plan for failures at the WWTWs and subsequent methods to address such failures.
A set of Operational and Compliance Alert Levels, corresponding to the requirements of the General Standard (at present), were also drawn up as part of the O&M Manuals for the WWTWs. These operational alert levels will further assist the Municipality with continuous improvement of the performance of the various WWTWs.
The comprehensive O&M Manuals, which were developed for each of the WWTWs, will further assist the Municipality to ensure that the necessary control measures for the effective operation of the WWTWs are in place.

198
OM is committed to work with the DWA and the other role-players in order to improve on their 2011 Green Drop Score for the various WWTWs and to get the Municipality ready for the next round of assessments. OM is currently busy with the finalization of the Wastewater Risk Abatement Plans for all their WWTWs in order to reduce their current CRRs for the various WWTWs. The following will also further assist in the process of reducing the CRRs. Forward planning and upgrading / refurbishment of treatment plants to ensure adequate
capacity for the flows received;
Operate and maintain the WWTWs within design- and equipment specifications;
Have trained, qualified and registered staff in place;
Get mentoring / coaching contracts in place where there is a great demand for adequately skilled process controllers and supervision;
Monitoring of flow to- and from the plants;
Sampling and monitoring of effluent quality;
Appropriate authorisation in accordance with the National Water Act (36 of 1998); and / or
Where plant is overloaded, introduce unorthodox methods to ensure enhancement of effluent quality.
ASSOCIATED SERVICES
Status Quo:
All the schools, hospitals and clinics in OM’s Management Area have adequate water and sanitation services.
Gaps and Strategies:
The environmental health function is currently with the Overberg District Municipality. Typical functions of the Overberg District Municipality, with regard to health services, include the following:
Households to meet the minimal health safety requirements
Monitoring water quality
Waste management
Food control
Schools to meet health requirements
Contagious disease control
Community development: Making communities aware of environmental health issues and communicates with farm workers regarding sanitation services.
The Municipal Health Services of the Overberg District Municipality also report monthly to the Department of Environmental Health on water quality. The quality of life of the people within a Municipality is influenced by the available health care. Various things influence the health conditions of people in any region, for example access to clean water, good sanitation, proper nutrition and adequate housing.
It is important that a co-operative relationship exist between the Overberg District Municipality and OM with regard to environmental health issues and that a proper communication system between the District Municipality and OM be developed.

199
The health profile in relation to treated water is good. Within the urban context, drinking water throughout the municipal area is considered to be of a high quality. Where specific problems are encountered these are prioritised for addressing.
The most vulnerable groups within OM’s Management Area are the persons living in informal areas with shared services. It is therefore of outmost importance that the communal standpipes are properly maintained, to promote better health and hygiene among users. It is necessary to:
keep the standpipe area clean and free from stagnant water;
avoid water spillage by keeping the tap closed when not in use;
report and rectify leakages immediately;
keep straying animals away from standpipe area; and
keep the tap outlet, standpipe slab and soak away clean.
Promote health and hygiene awareness amongst standpipe users by focusing on the following:
users must use the standpipe only for the filling of containers;
no body or clothes washing is allowed at standpipes;
no house pipes or other objects may be attached to the standpipes;
use clean containers and close containers with a suitable lid when transporting water;
disinfect containers when necessary; and
immediately report any irregularities, contamination, tampering or vandalism at standpipes
The rehabilitation and maintenance of the basic services have also had positive results, in that the installations appear neater, a healthier environment has been created and less pollution than previously takes place. It is believed that this played a significant role in reducing disease previously caused by unhygienic conditions and absence of basic services.
The supply of basic sanitation services on the farms needs to be linked to the provision of health and hygiene education. Improved health requires behaviour change, which also cannot be achieved with a single health education talk given by an outside expert. Behaviour change requires sustained monitoring and promotion within the community. This is the key-function of the community health workers employed on sanitation projects.
OM needs to continue to actively engage with service providers and NGO’s in the fight against illnesses such as HIV/Aids and TB. A solution to the sustainability of the community health worker’s position and employment within the community has been to link their position and function to the activities of the Department of Health. In addition support can be provided to the Community Health Workers through local clinics and through the programmes of the EHPs. Education on the HIV/Aids pandemic would play a key role in stemming the spread of the disease.
OM will therefore endeavour to improve their efforts to foster partnership-driven development in planning and implementation where partnerships include community members, CBOs, NGOs, the private sector and other spheres of government. In this regard the Department of Health is considered a particularly important partner whose collaboration is much needed.
200
CONSERVATION AND DEMAND MANAGEMENT
Status Quo:
OM is committed to reduce the current percentage of non revenue water for the various distribution systems as indicated in the WSDP. The Municipality’s WDM Strategy and Action Plan include the following key activities.
Implementation of re-use of treated effluent as potable water source. Pre-feasibility study for the potential re-use of treated wastewater for potable purposes is in progress.
Continue with their pipeline replacement programme for the priority areas with old reticulation networks and frequent pipe failures. The projects in the Hermanus and Rooi-Els areas were completed.
Continue with the identification of specific areas for the implementation of pressure management. Pressures and flows were logged in Kleinmond, Fisherhaven, Vermont and Stanford for the installation of PRVs in the areas with the highest potential during 2011/2012.
A detail water meter audit was carried out in all the towns in OM’s Management Area. The purpose of the audit was to determine the age of the meters and to identify the un-metered erven. The audit also assisted with the identification of un-metered fire water connections which are being used by commercial and other users for non fire-fighting purposes.
Part of the meter audit was also to review and improve the efficiency of bulk and zone metering in all areas and link properties with distribution zones in the financial data base, in order to do water balances for the smaller areas.
A focused leak detection and repair programme was commenced in the Buffels River area.
Started with the process of installing water meters at all the unmetered erven and replacing all the water meters older than eight years, as identified through the detail water meter audit. The Municipality is busy with a phased pro-active replacement of water meters.
Improved public awareness on water demand management issues, e.g. the watering of gardens as determined by the new Water Services Bylaws. Leaflets on rain water harvesting and water wise gardening are made available to the public. Numerous newspaper articles and WC/WDM information are displayed on the Municipality’s website, posters are placed on lamp posts and a new De Bos Dam billboard was put up.
Continue with the upgrading of the telemetry system, to act as an early warning system for e.g. pipe failures and reservoir overflows.
Review and improve efficiency of remote monitoring of minimum night flows in all zones. Focused leak detection and repair programs will be performed in areas with highest minimum night flows.
Identify users on the financial data base with regular abnormal high or abnormal low water use and physically inspect the causes. This activity is implemented by the Finance Department. The owners of high water consumption properties are phoned by the Municipality.
Continue with leak repairs at indigent households and the installation of flow limiters.
Source all potential external sources of funding to assist with the implementation of the WC/WDM measures, for example leak repairs on properties in indigent areas.
The Municipality’s current tariff structure discourages excessive use of water. The Municipality did implement volumetric sewerage tariffs. The Municipality also got separate water restriction tariffs (Two levels).

201
Continue with the removal of alien vegetation in the catchment areas (Working for Water Programme).
Investigate further options for the use of final treated effluent for irrigation purposes and other purposes (e.g. industrial use). The New Curro School will be connected to the treated effluent irrigation systems soon.
Building inspectors include the inspection of the water meter installations during the foundation inspections at construction / building sites. This information is implemented and captured on EMIS from 2010/2011 by the Building Inspectorate.
OM will start the process logging the Minimum Night Flows (MNF) for the implementation of pressure management. Pressures and flows will be logged in Kleinmond, Fisherhaven, Vermont and Stanford. OM is therefore in the process of establishing comprehensive water management zones for the various distribution systems, in order to manage the non revenue water even better.
The Municipality started in 2010 with a detail water meter audit for all the towns in OM’s Management Area. The purpose of the audit was to determine the age of the meters and to identify the un-metered erven. The audit also assisted with the identification of the un-metered fire water connections, which are being used by commercial and other users for non fire-fighting purposes. The table below summarise the results of the meter audit.
Description
Buffe
ls Ri
ver
Klei
nmon
d
Gre
ater
He
rman
us
Stan
ford
Gre
ater
G
ansb
aai
Pear
ly
Beac
h
Baar
dske
er-
ders
bos
Buffe
ljags
Ba
y
Tota
l
Total Erven 5 241 3 602 18 269 1 596 6 172 1 138 155 35 36 208 Erven with meters surveyed 3 126 3 007 13 170 1 108 4 256 634 60 31 25 392 Vacant erven 2 095 555 4 447 475 1 882 481 95 4 10 034 Erven with meters not surveyed (No meter, no access, not found) 20 40 652 13 34 23 0 0 782
Age of meters Meters 0 – 8 years 759 619 3 735 397 1 498 123 60 31 7 222 Meters 9 – 20 years 1 628 1 177 4 997 172 1 723 271 1 1 9 970 Meters 21 – 30 years 481 766 1 683 144 568 134 0 0 3 776 Meters > 30 years 147 224 579 27 90 5 0 0 1 072 No data available 135 284 2 483 381 525 103 0 0 3 911 Leaks and Meters not Working Meters not working 27 22 14 3 4 0 0 0 70 Total leak installations 128 65 240 35 133 13 0 0 614 Leaking meter 111 38 47 17 35 0 0 0 248 Leaking stop-cock 110 38 201 25 103 13 0 0 490 Leaking meter and stop-cock 93 11 8 7 5 0 0 0 124 Meters to be replaced Meters older than 20 years 628 990 2 262 171 658 139 0 0 4 848 Meters not working 27 22 14 3 4 0 0 0 70 Meters leaking 111 38 47 17 35 0 0 0 248 Stop-cocks leaking 110 38 201 25 103 13 0 0 490
The age of the water meters also impact on the accuracy of the meter readings, as can be seen from the table below:
Meter age and accuracy Good Water Quality Poor Water Quality Poor > 10 years 8% 10% Average 5 – 10 years 4% 8% Good < 5 years 2% 4%
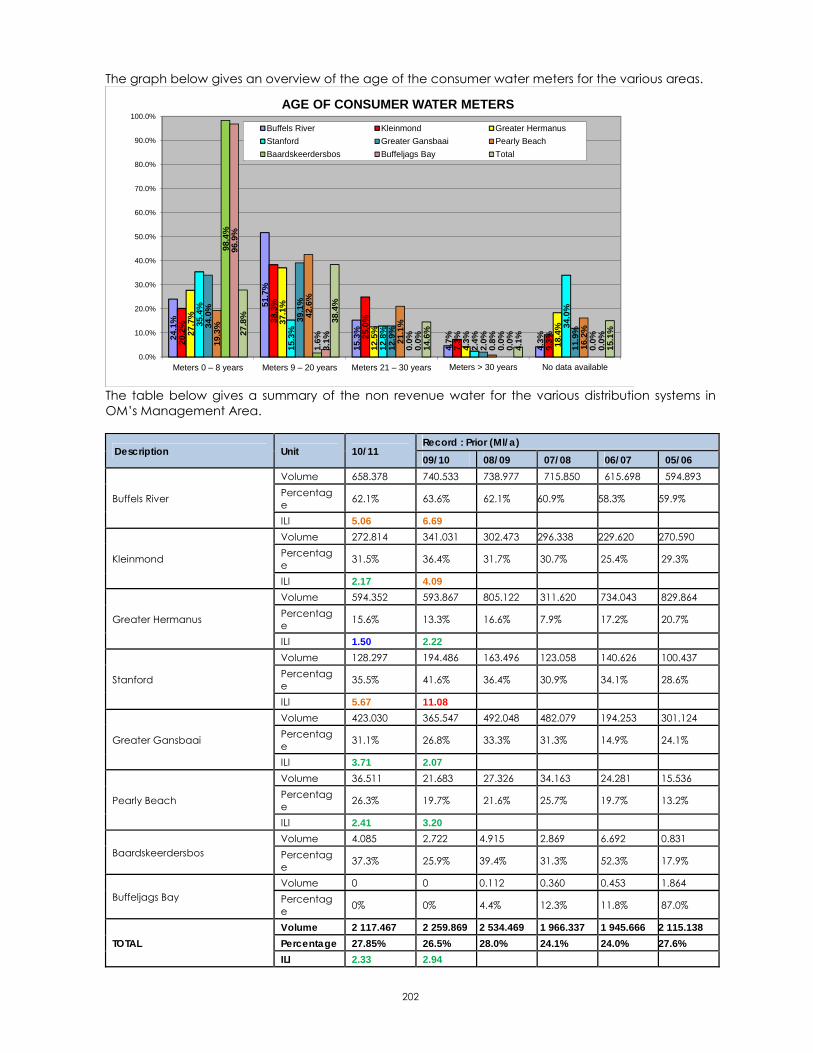
202
The graph below gives an overview of the age of the consumer water meters for the various areas.
24.
1%
51.7
%
15.
3%
4.7
%
4.3
%
20.2
%
38.3
%
25.
0%
7.3
%
9.3
%27.7
%
37.1
%
12.
5%
4.3
%
18.4
%35.4
%
15.
3%
12.
8%
2.4
%
34.
0%
34.0
%
39.1
%
12.
9%
2.0
%
11.
9%
19.3
%
42.
6%
21.1
%
0.8
%
16.
2%
98.4
%
1.6
%
0.0
%
0.0
%
0.0
%
96.
9%
3.1
%
0.0
%
0.0
%
0.0
%27.8
% 38.
4%
14.
6%
4.1
%
15.
1%
0.0%
10.0%
20.0%
30.0%
40.0%
50.0%
60.0%
70.0%
80.0%
90.0%
100.0%
Meters 0 – 8 years Meters 9 – 20 years Meters 21 – 30 years Meters > 30 years No data available
AGE OF CONSUMER WATER METERS
Buffels River Kleinmond Greater Hermanus
Stanford Greater Gansbaai Pearly Beach
Baardskeerdersbos Buffeljags Bay Total
The table below gives a summary of the non revenue water for the various distribution systems in OM’s Management Area.
Description Unit 10/11 Record : Prior (Ml/a) 09/10 08/09 07/08 06/07 05/06
Buffels River
Volume 658.378 740.533 738.977 715.850 615.698 594.893 Percentage 62.1% 63.6% 62.1% 60.9% 58.3% 59.9%
ILI 5.06 6.69
Kleinmond
Volume 272.814 341.031 302.473 296.338 229.620 270.590 Percentage 31.5% 36.4% 31.7% 30.7% 25.4% 29.3%
ILI 2.17 4.09
Greater Hermanus
Volume 594.352 593.867 805.122 311.620 734.043 829.864 Percentage 15.6% 13.3% 16.6% 7.9% 17.2% 20.7%
ILI 1.50 2.22
Stanford
Volume 128.297 194.486 163.496 123.058 140.626 100.437 Percentage 35.5% 41.6% 36.4% 30.9% 34.1% 28.6%
ILI 5.67 11.08
Greater Gansbaai
Volume 423.030 365.547 492.048 482.079 194.253 301.124 Percentage 31.1% 26.8% 33.3% 31.3% 14.9% 24.1%
ILI 3.71 2.07
Pearly Beach
Volume 36.511 21.683 27.326 34.163 24.281 15.536 Percentage 26.3% 19.7% 21.6% 25.7% 19.7% 13.2%
ILI 2.41 3.20
Baardskeerdersbos Volume 4.085 2.722 4.915 2.869 6.692 0.831 Percentage 37.3% 25.9% 39.4% 31.3% 52.3% 17.9%
Buffeljags Bay Volume 0 0 0.112 0.360 0.453 1.864 Percentage 0% 0% 4.4% 12.3% 11.8% 87.0%
TOTAL Volume 2 117.467 2 259.869 2 534.469 1 966.337 1 945.666 2 115.138 Percentage 27.85% 26.5% 28.0% 24.1% 24.0% 27.6% ILI 2.33 2.94

203
Note: Infrastructure Leakage Index (ILI) for Developed Countries = 1 – 2 Excellent (Category A), 2 – 4 Good (Category B), 4 – 8 Poor (Category C) and > 8 – Very Bad (Category D)
Category A = No specific intervention required (Hermanus).
Category B = No urgent action required although should be monitored carefully (Kleinmond, Pearly Beach and Greater Gansbaai).
Category C = Requires attention (Stanford and Buffels River)
Category D = Requires immediate water loss reduction interventions
Gaps and Strategies:
OM is committed to continue with the active implementation of their WDM Strategy in order to reduce the water losses within the various distribution systems as follows:
Distribution System 10/11 (%/a) 2015 (%/a) 2035 (%/a) Buffels River 62.1% 35.0% 25.0% Kleinmond 31.5% 20.0% 15.0% Greater Hermanus 15.6% 15.0% 15.0% Stanford 35.5% 20.0% 15.0% Greater Gansbaai 31.1% 20.0% 15.0% Pearly Beach 26.3% 20.0% 15.0% Baardskeerdersbos 37.3% 20.0% 15.0% Buffeljags Bay 0.0% 15.0% 15.0% Total 27.85% 18.90% 16.48%
OM is busy with the installation of two PRVs in Kleinmond and one in Stanford. A phased approach will be followed for the investigation / implementation of pressure management in selected areas in the OM’s Management Area. The phases that will be implemented are as follows: Investigation and Logging (Desktop Study, Logging of pressures and flows, Analysis of data)
Implementation (Design PRV Chambers, Pressure Management Implementation of new PRVs, Supply and installation of smart electronic pressure controllers for existing PRVs)
Impact Assessment (Post pressure management logging to determine impact of new PRVs and / or installation of smart pressure controllers on existing PRVs)
The proposed areas are Kleinmond, Hermanus (Fisherhaven and Vermont) and Stanford. OM will continue with the repairing of leaks at all the indigent households. The following steps can be implemented by OM to ensure that the project is sustainable. Identify areas with high minimum night flows. Record these flows before the project starts in
order to ensure that the overall savings achieved by the project can be calculated.
Visit properties occupied by indigent households on a priority basis (highest consumption first).
Educate the customer about the project and water saving measures that can be implemented.
Audit properties for any plumbing leaks and repair the leaks that are found.
Charge the owner for the plumbing repairs through the municipal account.
If the consumption is maintained at a reasonable level for a period of six months and the current account is paid monthly and on time, the water arrears would be written off. The charge for the plumbing repair would be paid for by the project.
Meters found to be faulty must be replaced.
Identify where there may be inefficient water usage and water wastage.
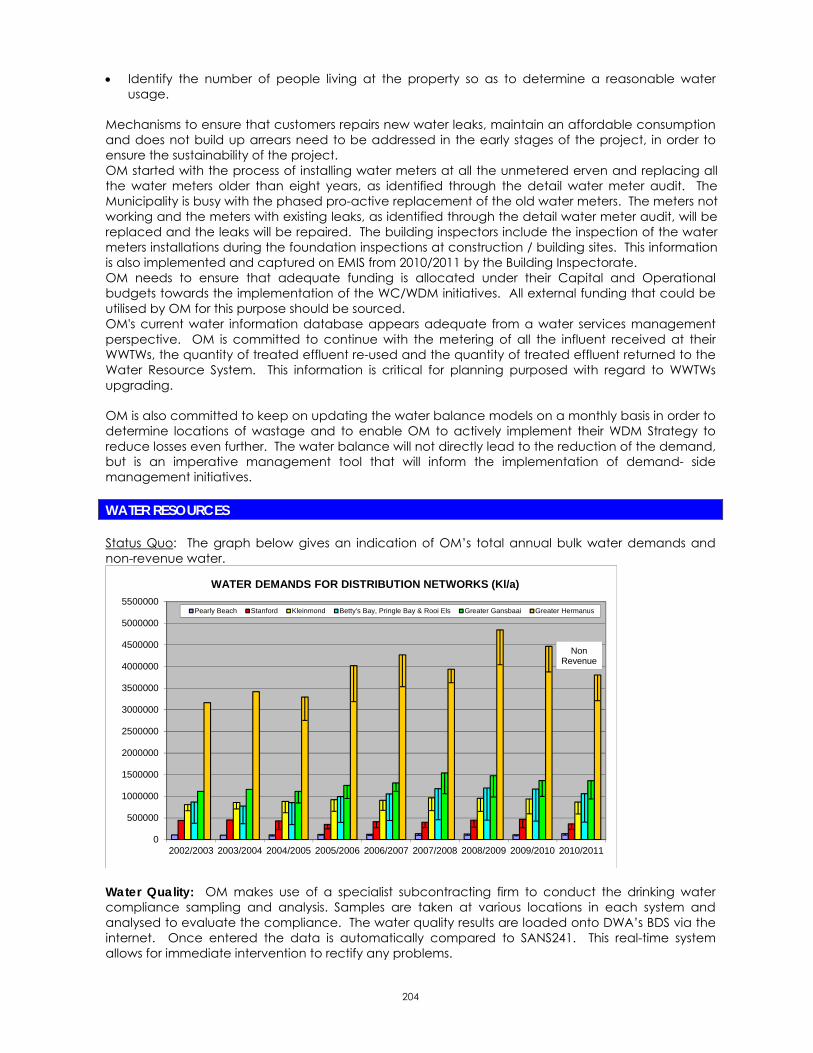
204
Identify the number of people living at the property so as to determine a reasonable water usage.
Mechanisms to ensure that customers repairs new water leaks, maintain an affordable consumption and does not build up arrears need to be addressed in the early stages of the project, in order to ensure the sustainability of the project. OM started with the process of installing water meters at all the unmetered erven and replacing all the water meters older than eight years, as identified through the detail water meter audit. The Municipality is busy with the phased pro-active replacement of the old water meters. The meters not working and the meters with existing leaks, as identified through the detail water meter audit, will be replaced and the leaks will be repaired. The building inspectors include the inspection of the water meters installations during the foundation inspections at construction / building sites. This information is also implemented and captured on EMIS from 2010/2011 by the Building Inspectorate. OM needs to ensure that adequate funding is allocated under their Capital and Operational budgets towards the implementation of the WC/WDM initiatives. All external funding that could be utilised by OM for this purpose should be sourced. OM's current water information database appears adequate from a water services management perspective. OM is committed to continue with the metering of all the influent received at their WWTWs, the quantity of treated effluent re-used and the quantity of treated effluent returned to the Water Resource System. This information is critical for planning purposed with regard to WWTWs upgrading.
OM is also committed to keep on updating the water balance models on a monthly basis in order to determine locations of wastage and to enable OM to actively implement their WDM Strategy to reduce losses even further. The water balance will not directly lead to the reduction of the demand, but is an imperative management tool that will inform the implementation of demand- side management initiatives.
WATER RESOURCES
Status Quo: The graph below gives an indication of OM’s total annual bulk water demands and non-revenue water.
0
500000
1000000
1500000
2000000
2500000
3000000
3500000
4000000
4500000
5000000
5500000
2002/2003 2003/2004 2004/2005 2005/2006 2006/2007 2007/2008 2008/2009 2009/2010 2010/2011
WATER DEMANDS FOR DISTRIBUTION NETWORKS (Kl/a)
Pearly Beach Stanford Kleinmond Betty's Bay, Pringle Bay & Rooi Els Greater Gansbaai Greater Hermanus
Non Revenue
Water Quality: OM makes use of a specialist subcontracting firm to conduct the drinking water compliance sampling and analysis. Samples are taken at various locations in each system and analysed to evaluate the compliance. The water quality results are loaded onto DWA’s BDS via the internet. Once entered the data is automatically compared to SANS241. This real-time system allows for immediate intervention to rectify any problems.
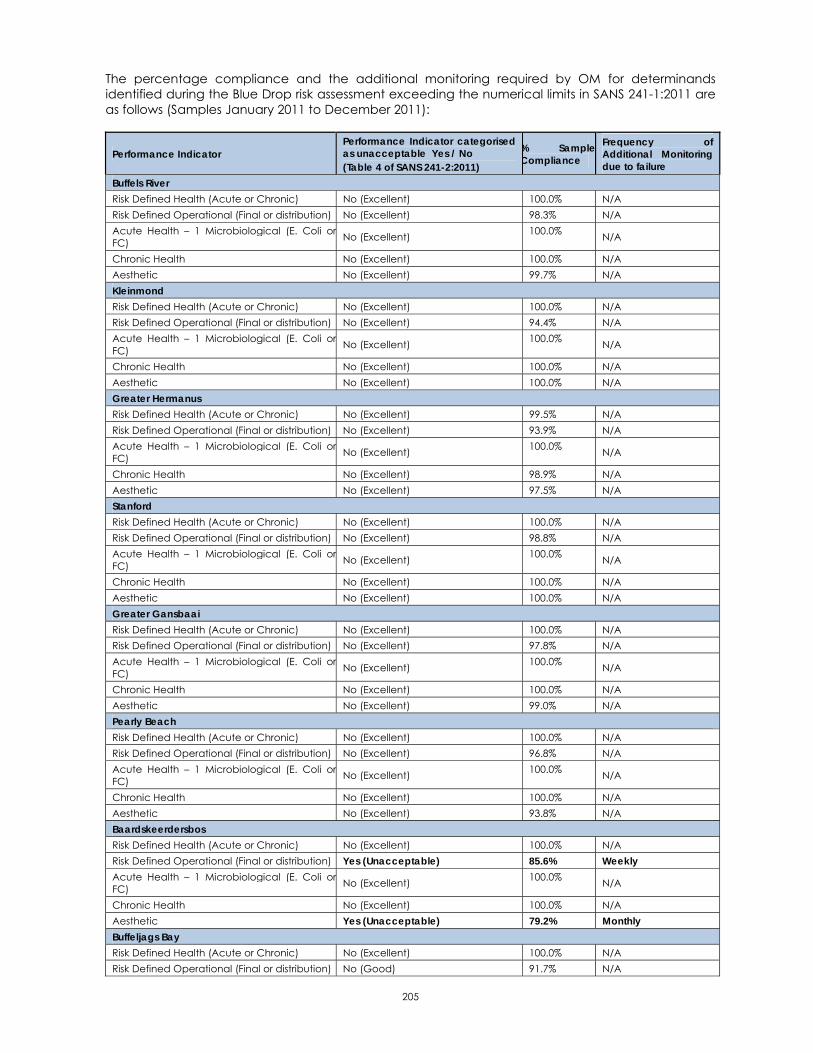
205
The percentage compliance and the additional monitoring required by OM for determinands identified during the Blue Drop risk assessment exceeding the numerical limits in SANS 241-1:2011 are as follows (Samples January 2011 to December 2011):
Performance Indicator Performance Indicator categorised as unacceptable Yes / No (Table 4 of SANS 241-2:2011)
% SampleCompliance
Frequency of Additional Monitoring due to failure
Buffels River Risk Defined Health (Acute or Chronic) No (Excellent) 100.0% N/A Risk Defined Operational (Final or distribution) No (Excellent) 98.3% N/A Acute Health – 1 Microbiological (E. Coli orFC) No (Excellent) 100.0% N/A
Chronic Health No (Excellent) 100.0% N/A Aesthetic No (Excellent) 99.7% N/A Kleinmond Risk Defined Health (Acute or Chronic) No (Excellent) 100.0% N/A Risk Defined Operational (Final or distribution) No (Excellent) 94.4% N/A Acute Health – 1 Microbiological (E. Coli orFC) No (Excellent) 100.0% N/A
Chronic Health No (Excellent) 100.0% N/A Aesthetic No (Excellent) 100.0% N/A Greater Hermanus Risk Defined Health (Acute or Chronic) No (Excellent) 99.5% N/A Risk Defined Operational (Final or distribution) No (Excellent) 93.9% N/A Acute Health – 1 Microbiological (E. Coli orFC) No (Excellent) 100.0% N/A
Chronic Health No (Excellent) 98.9% N/A Aesthetic No (Excellent) 97.5% N/A Stanford Risk Defined Health (Acute or Chronic) No (Excellent) 100.0% N/A Risk Defined Operational (Final or distribution) No (Excellent) 98.8% N/A Acute Health – 1 Microbiological (E. Coli orFC) No (Excellent) 100.0% N/A
Chronic Health No (Excellent) 100.0% N/A Aesthetic No (Excellent) 100.0% N/A Greater Gansbaai Risk Defined Health (Acute or Chronic) No (Excellent) 100.0% N/A Risk Defined Operational (Final or distribution) No (Excellent) 97.8% N/A Acute Health – 1 Microbiological (E. Coli orFC) No (Excellent) 100.0% N/A
Chronic Health No (Excellent) 100.0% N/A Aesthetic No (Excellent) 99.0% N/A Pearly Beach Risk Defined Health (Acute or Chronic) No (Excellent) 100.0% N/A Risk Defined Operational (Final or distribution) No (Excellent) 96.8% N/A Acute Health – 1 Microbiological (E. Coli orFC) No (Excellent) 100.0% N/A
Chronic Health No (Excellent) 100.0% N/A Aesthetic No (Excellent) 93.8% N/A Baardskeerdersbos Risk Defined Health (Acute or Chronic) No (Excellent) 100.0% N/A Risk Defined Operational (Final or distribution) Yes (Unacceptable) 85.6% Weekly Acute Health – 1 Microbiological (E. Coli orFC) No (Excellent) 100.0% N/A
Chronic Health No (Excellent) 100.0% N/A Aesthetic Yes (Unacceptable) 79.2% Monthly Buffeljags Bay Risk Defined Health (Acute or Chronic) No (Excellent) 100.0% N/A Risk Defined Operational (Final or distribution) No (Good) 91.7% N/A
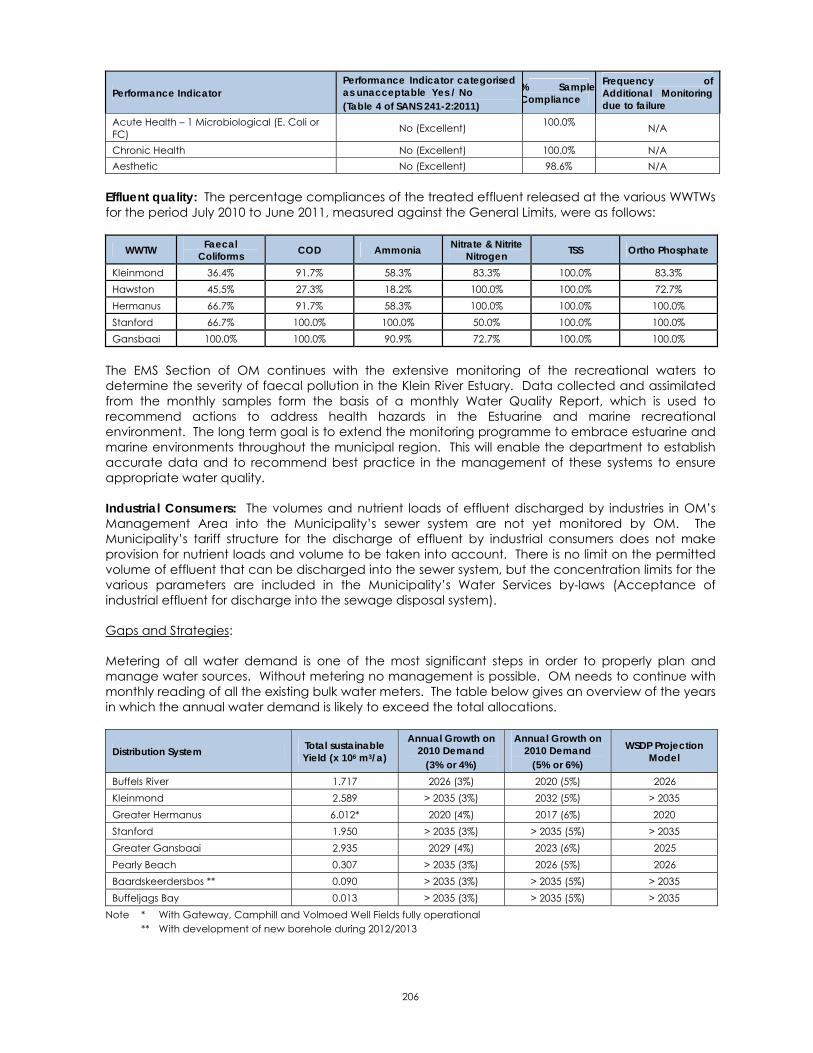
206
Performance Indicator Performance Indicator categorised as unacceptable Yes / No (Table 4 of SANS 241-2:2011)
% SampleCompliance
Frequency of Additional Monitoring due to failure
Acute Health – 1 Microbiological (E. Coli or FC) No (Excellent) 100.0% N/A
Chronic Health No (Excellent) 100.0% N/A Aesthetic No (Excellent) 98.6% N/A
Effluent quality: The percentage compliances of the treated effluent released at the various WWTWs for the period July 2010 to June 2011, measured against the General Limits, were as follows:
WWTW Faecal Coliforms COD Ammonia Nitrate & Nitrite
Nitrogen TSS Ortho Phosphate
Kleinmond 36.4% 91.7% 58.3% 83.3% 100.0% 83.3% Hawston 45.5% 27.3% 18.2% 100.0% 100.0% 72.7% Hermanus 66.7% 91.7% 58.3% 100.0% 100.0% 100.0% Stanford 66.7% 100.0% 100.0% 50.0% 100.0% 100.0% Gansbaai 100.0% 100.0% 90.9% 72.7% 100.0% 100.0%
The EMS Section of OM continues with the extensive monitoring of the recreational waters to determine the severity of faecal pollution in the Klein River Estuary. Data collected and assimilated from the monthly samples form the basis of a monthly Water Quality Report, which is used to recommend actions to address health hazards in the Estuarine and marine recreational environment. The long term goal is to extend the monitoring programme to embrace estuarine and marine environments throughout the municipal region. This will enable the department to establish accurate data and to recommend best practice in the management of these systems to ensure appropriate water quality.
Industrial Consumers: The volumes and nutrient loads of effluent discharged by industries in OM’s Management Area into the Municipality’s sewer system are not yet monitored by OM. The Municipality’s tariff structure for the discharge of effluent by industrial consumers does not make provision for nutrient loads and volume to be taken into account. There is no limit on the permitted volume of effluent that can be discharged into the sewer system, but the concentration limits for the various parameters are included in the Municipality’s Water Services by-laws (Acceptance of industrial effluent for discharge into the sewage disposal system).
Gaps and Strategies:
Metering of all water demand is one of the most significant steps in order to properly plan and manage water sources. Without metering no management is possible. OM needs to continue with monthly reading of all the existing bulk water meters. The table below gives an overview of the years in which the annual water demand is likely to exceed the total allocations.
Distribution System Total sustainable Yield (x 106 m3/a)
Annual Growth on 2010 Demand
(3% or 4%)
Annual Growth on 2010 Demand
(5% or 6%)
WSDP Projection Model
Buffels River 1.717 2026 (3%) 2020 (5%) 2026 Kleinmond 2.589 > 2035 (3%) 2032 (5%) > 2035 Greater Hermanus 6.012* 2020 (4%) 2017 (6%) 2020 Stanford 1.950 > 2035 (3%) > 2035 (5%) > 2035 Greater Gansbaai 2.935 2029 (4%) 2023 (6%) 2025 Pearly Beach 0.307 > 2035 (3%) 2026 (5%) 2026 Baardskeerdersbos ** 0.090 > 2035 (3%) > 2035 (5%) > 2035 Buffeljags Bay 0.013 > 2035 (3%) > 2035 (5%) > 2035
Note * With Gateway, Camphill and Volmoed Well Fields fully operational ** With development of new borehole during 2012/2013

207
The DWA also completed their Reconciliation Strategy during 2010/2011 and the table below gives an overview of the recommended potential future water resources as included in the Strategies (Corrections by Municipality):
Distribution System Option Potential
Betty’s Bay, Rooi Els and Pringle Bay
Re-use of water
The Buffels River area does not have it’s own WWTW and therefore the re-use water is not a feasible option for the area.
Groundwater
Boreholes into the Peninsula Formation north of the Buffels River Dam are likely to yield between 5 – 10 l/s (provided the right structures are targeted), with good water quality (Class 0-1) being present. It is recommended that only 0.5 – 1 M m³/a is abstracted from the Peninsula Formation, in order to prevent any large drawdowns in the environmentally sensitive recharge and discharge areas. Any groundwater use in this area should in turn be carefully managed and monitored. 0.5 – 1 M m³/a will only meet the low-growth scenario shortfalls up to 2035, and other water sources will be required to meet the medium and high-growth scenario future shortfalls.
Surface Water
Betty’s Bay is close to the lower Palmiet River making the river an obvious choice to supply the town when the water requirement exceeds the capacity of the current resources after 2017. Rooi Els River is also another river considered for investigation if the Palmiet River may not be a good choice.
Other Sources Rainwater harvesting is a suitable option for the area, considering the MAP is
acceptable for rainwater harvesting to be deemed feasible. This should be promoted for all new houses being built.
Summary
The current water sources have adequate supply to cater for the medium and longer term future water requirements. The following sources are identified as potential sources to augment the water supply: WC/WDM strategies to reduce water losses Abstraction from the Palmiet River Groundwater development Abstraction from the Rooi Els River Raising of Buffels River dam wall
Kleinmond
Re-use of water
Re-use of water from the WWTW for domestic purposes can only be allowed if the existing works is upgraded to a suitable process technology that can provide a 95% assurance of supply in terms of quality requirements.
Groundwater
Future groundwater targets should include the confined Peninsula Formation to the NE of the golf course along a NE-SW orientated normal fault, where high yields and good quality water (Class 0-1) can be expected. The unconfined Skurweberg Formation can also be targeted in the area, although the yields are likely to be lower and higher iron concentrations might be present.
Surface Water
A study was carried out on the Palmiet River by DWA for further development of the surface water resources with the following recommendations: Transferring water from the Kogelberg Dam to the Steenbras Dams and this was
implemented the same year and provided 22.5 Mm³/a at 1:50 year assurance. Raising of the current Eikenhof Dam to increase its capacity from 22.5 Mm³/a to 30
Mm³/a and this would provide additional yields of 4.5 Mm³/a. The total storage would be only 27% of the MAR of 301.8 Mm³, but the ecological freshwater flow requirements of the Palmiet River would limit further development.
Other Sources Rainwater harvesting can be a suitable option for the area, considering the mean annual precipitation is acceptable for rainwater harvesting.
Summary
The current water sources have adequate supply to cater for the medium and longer term future water requirements. The following sources are identified as potential sources to augment the water supply: WC/WDM strategies to reduce water losses Increase allocation from the Palmiet River Groundwater development
Hermanus Re-use of water
Currently treated water is used for irrigation purposes at the golf course and one school. Direct and indirect potable water re-use is currently not planned.
The cost of utilising treated water has been estimated in Hermanus. A limited cost saving could be obtained should the treated water be incorporated directly in the existing supply system because dormant capacity in the existing system can be used more effectively. The cost of this system will mainly depend on the volume of water supplied.
Selected water users could be supplied with up to 4 Mm³/a by 2030, assuming that 50% of the bulk water consumption is available for re-use.
Groundwater PSPs were appointed to proceed with groundwater investigation and exploration
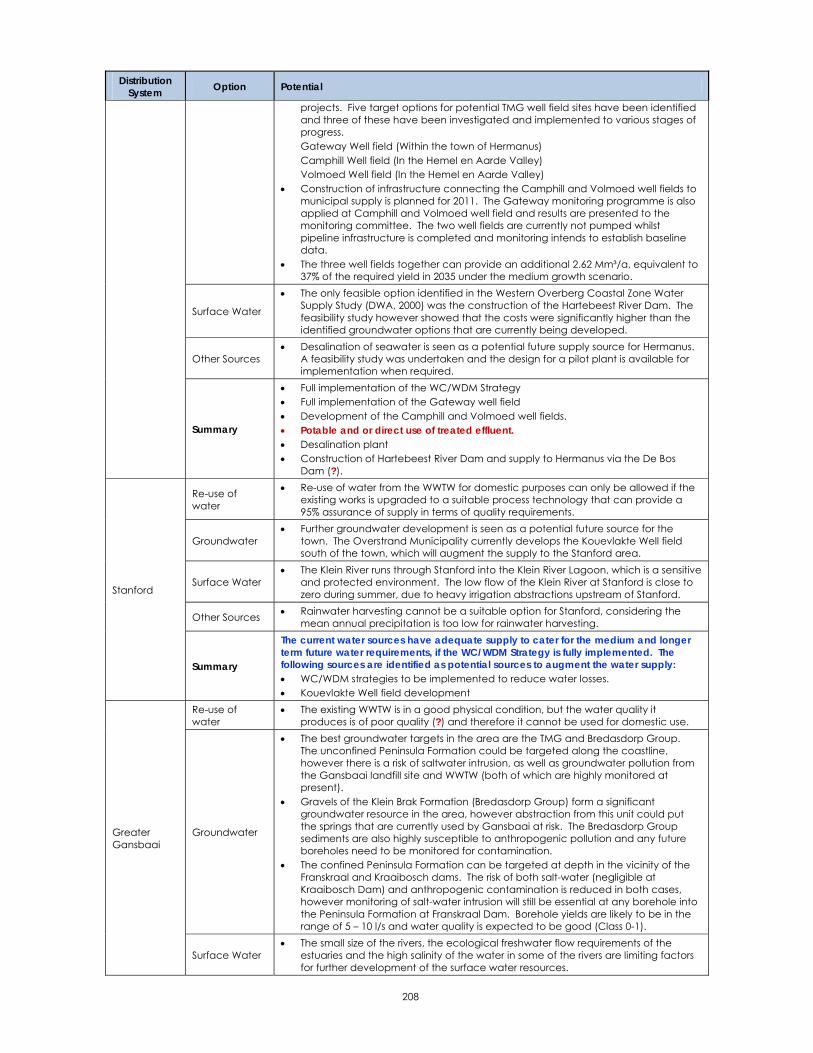
208
Distribution System Option Potential
projects. Five target options for potential TMG well field sites have been identified and three of these have been investigated and implemented to various stages of progress. Gateway Well field (Within the town of Hermanus) Camphill Well field (In the Hemel en Aarde Valley) Volmoed Well field (In the Hemel en Aarde Valley)
Construction of infrastructure connecting the Camphill and Volmoed well fields to municipal supply is planned for 2011. The Gateway monitoring programme is also applied at Camphill and Volmoed well field and results are presented to the monitoring committee. The two well fields are currently not pumped whilst pipeline infrastructure is completed and monitoring intends to establish baseline data.
The three well fields together can provide an additional 2.62 Mm³/a, equivalent to 37% of the required yield in 2035 under the medium growth scenario.
Surface Water
The only feasible option identified in the Western Overberg Coastal Zone Water Supply Study (DWA, 2000) was the construction of the Hartebeest River Dam. The feasibility study however showed that the costs were significantly higher than the identified groundwater options that are currently being developed.
Other Sources Desalination of seawater is seen as a potential future supply source for Hermanus.
A feasibility study was undertaken and the design for a pilot plant is available for implementation when required.
Summary
Full implementation of the WC/WDM Strategy Full implementation of the Gateway well field Development of the Camphill and Volmoed well fields. Potable and or direct use of treated effluent. Desalination plant Construction of Hartebeest River Dam and supply to Hermanus via the De Bos
Dam (?).
Stanford
Re-use of water
Re-use of water from the WWTW for domestic purposes can only be allowed if the existing works is upgraded to a suitable process technology that can provide a 95% assurance of supply in terms of quality requirements.
Groundwater Further groundwater development is seen as a potential future source for the
town. The Overstrand Municipality currently develops the Kouevlakte Well field south of the town, which will augment the supply to the Stanford area.
Surface Water The Klein River runs through Stanford into the Klein River Lagoon, which is a sensitive
and protected environment. The low flow of the Klein River at Stanford is close to zero during summer, due to heavy irrigation abstractions upstream of Stanford.
Other Sources Rainwater harvesting cannot be a suitable option for Stanford, considering the mean annual precipitation is too low for rainwater harvesting.
Summary
The current water sources have adequate supply to cater for the medium and longer term future water requirements, if the WC/WDM Strategy is fully implemented. The following sources are identified as potential sources to augment the water supply: WC/WDM strategies to be implemented to reduce water losses. Kouevlakte Well field development
Greater Gansbaai
Re-use of water
The existing WWTW is in a good physical condition, but the water quality it produces is of poor quality (?) and therefore it cannot be used for domestic use.
Groundwater
The best groundwater targets in the area are the TMG and Bredasdorp Group. The unconfined Peninsula Formation could be targeted along the coastline, however there is a risk of saltwater intrusion, as well as groundwater pollution from the Gansbaai landfill site and WWTW (both of which are highly monitored at present).
Gravels of the Klein Brak Formation (Bredasdorp Group) form a significant groundwater resource in the area, however abstraction from this unit could put the springs that are currently used by Gansbaai at risk. The Bredasdorp Group sediments are also highly susceptible to anthropogenic pollution and any future boreholes need to be monitored for contamination.
The confined Peninsula Formation can be targeted at depth in the vicinity of the Franskraal and Kraaibosch dams. The risk of both salt-water (negligible at Kraaibosch Dam) and anthropogenic contamination is reduced in both cases, however monitoring of salt-water intrusion will still be essential at any borehole into the Peninsula Formation at Franskraal Dam. Borehole yields are likely to be in the range of 5 – 10 l/s and water quality is expected to be good (Class 0-1).
Surface Water The small size of the rivers, the ecological freshwater flow requirements of the
estuaries and the high salinity of the water in some of the rivers are limiting factors for further development of the surface water resources.
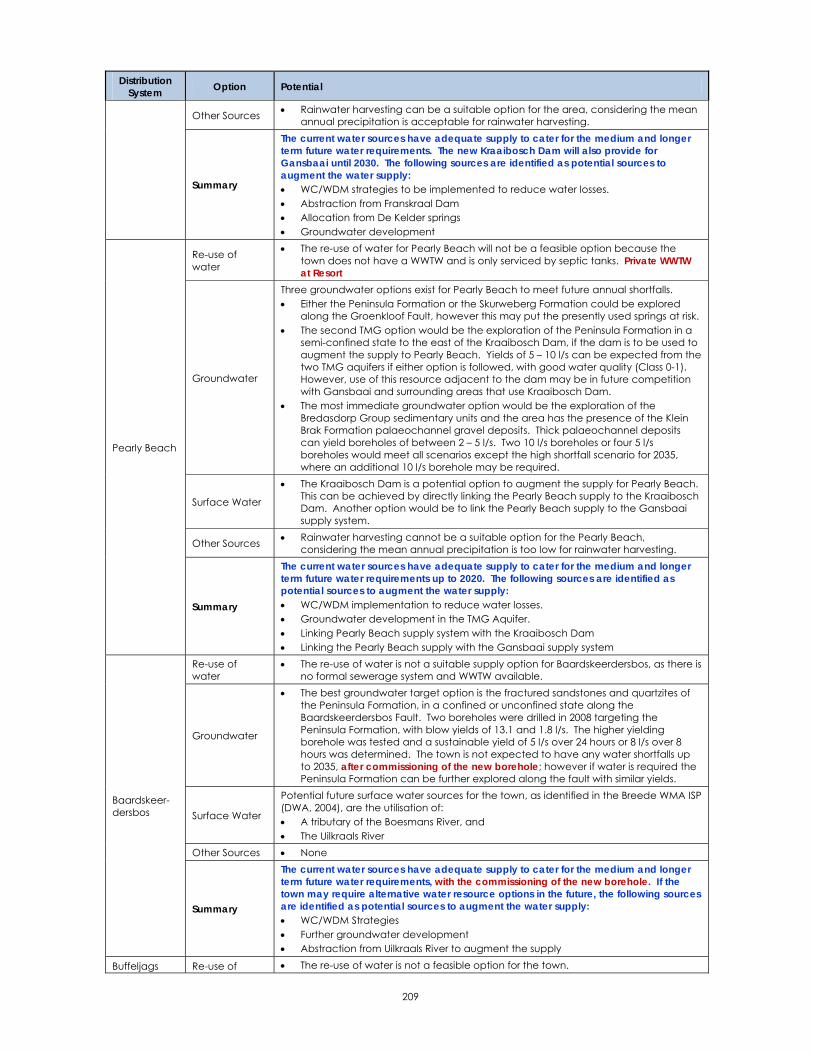
209
Distribution System Option Potential
Other Sources Rainwater harvesting can be a suitable option for the area, considering the mean annual precipitation is acceptable for rainwater harvesting.
Summary
The current water sources have adequate supply to cater for the medium and longer term future water requirements. The new Kraaibosch Dam will also provide for Gansbaai until 2030. The following sources are identified as potential sources to augment the water supply: WC/WDM strategies to be implemented to reduce water losses. Abstraction from Franskraal Dam Allocation from De Kelder springs Groundwater development
Pearly Beach
Re-use of water
The re-use of water for Pearly Beach will not be a feasible option because the town does not have a WWTW and is only serviced by septic tanks. Private WWTW at Resort
Groundwater
Three groundwater options exist for Pearly Beach to meet future annual shortfalls. Either the Peninsula Formation or the Skurweberg Formation could be explored
along the Groenkloof Fault, however this may put the presently used springs at risk. The second TMG option would be the exploration of the Peninsula Formation in a
semi-confined state to the east of the Kraaibosch Dam, if the dam is to be used to augment the supply to Pearly Beach. Yields of 5 – 10 l/s can be expected from the two TMG aquifers if either option is followed, with good water quality (Class 0-1). However, use of this resource adjacent to the dam may be in future competition with Gansbaai and surrounding areas that use Kraaibosch Dam.
The most immediate groundwater option would be the exploration of the Bredasdorp Group sedimentary units and the area has the presence of the Klein Brak Formation palaeochannel gravel deposits. Thick palaeochannel deposits can yield boreholes of between 2 – 5 l/s. Two 10 l/s boreholes or four 5 l/s boreholes would meet all scenarios except the high shortfall scenario for 2035, where an additional 10 l/s borehole may be required.
Surface Water
The Kraaibosch Dam is a potential option to augment the supply for Pearly Beach. This can be achieved by directly linking the Pearly Beach supply to the Kraaibosch Dam. Another option would be to link the Pearly Beach supply to the Gansbaai supply system.
Other Sources Rainwater harvesting cannot be a suitable option for the Pearly Beach, considering the mean annual precipitation is too low for rainwater harvesting.
Summary
The current water sources have adequate supply to cater for the medium and longer term future water requirements up to 2020. The following sources are identified as potential sources to augment the water supply: WC/WDM implementation to reduce water losses. Groundwater development in the TMG Aquifer. Linking Pearly Beach supply system with the Kraaibosch Dam Linking the Pearly Beach supply with the Gansbaai supply system
Baardskeer-dersbos
Re-use of water
The re-use of water is not a suitable supply option for Baardskeerdersbos, as there is no formal sewerage system and WWTW available.
Groundwater
The best groundwater target option is the fractured sandstones and quartzites of the Peninsula Formation, in a confined or unconfined state along the Baardskeerdersbos Fault. Two boreholes were drilled in 2008 targeting the Peninsula Formation, with blow yields of 13.1 and 1.8 l/s. The higher yielding borehole was tested and a sustainable yield of 5 l/s over 24 hours or 8 l/s over 8 hours was determined. The town is not expected to have any water shortfalls up to 2035, after commissioning of the new borehole; however if water is required the Peninsula Formation can be further explored along the fault with similar yields.
Surface Water
Potential future surface water sources for the town, as identified in the Breede WMA ISP (DWA, 2004), are the utilisation of: A tributary of the Boesmans River, and The Uilkraals River
Other Sources None
Summary
The current water sources have adequate supply to cater for the medium and longer term future water requirements, with the commissioning of the new borehole. If the town may require alternative water resource options in the future, the following sources are identified as potential sources to augment the water supply: WC/WDM Strategies Further groundwater development Abstraction from Uilkraals River to augment the supply
Buffeljags Re-use of The re-use of water is not a feasible option for the town.

210
Distribution System Option Potential
Bay water
Groundwater
The town is currently supplied by one borehole, which together can sustainably supply 0.019 Mm³/a. Both have been drilled into the Peninsula Formation near the shoreline and have low sustainable yields of 0.1 and 0.5 l/s.
Two further groundwater target options for the town, if required, could be the shelly gravels of the Klein Brak Formation and the fractured quartzites and sandstones of the Skurweberg Formation in the Buffelsjag Mountains. The Buffeljags Mountains are relatively elevated in comparison to the rest of the region and higher recharge into the unconfined Skurweberg Formation can be expected there in comparison to the deeper confined Peninsula Formation further south-west.
Higher yields of between 2-5 l/s can be expected (with a good water quality of Class 0-1), with a reduced risk of salt-water intrusion. Boreholes into the Klein Brak Formation and overlying Quaternary sediment are likely to have yields of 5 l/s, however Quaternary aquifers can be susceptible to over abstraction and anthropogenic contamination.
Surface Water There is no surface water sources in close proximity to Buffeljags Bay
Other Sources Rainwater harvesting is not a feasible option due to the low annual rainfall. Desalination of seawater could be an option, if no other sources are available.
Summary
The current water sources have adequate supply to cater for the medium and longer term future water requirements. If the town may require alternative water resource options in the future, the following sources are identified as potential sources to augment the water supply: WC/WDM Strategies Further groundwater development (Implemented) Desalination of seawater
Buffels River and Kleinmond Areas: OM completed a detail investigation during 2010/2011 of the water resources for the area from Rooi Els to Kleinmond. The recommendations from the report were as follows:
Further studies and investigations be undertaken to reduce the non revenue water percentages to 20%. Demand management should include the pressure management of the Kleinmond reticulation system and further studies are required to evaluate the feasibility of pressure management of the Betty’s Bay reticulation network. Telemetry should be provided for all reservoirs, WTW’s flow meters, strategic pressure meters and the pressure reducing valve installations to increase efficiency in managing the system and reducing the time of identifying, locating and repairing leaks. Additional meters should be installed to correlate the sales data and identify areas with higher non revenue water (losses) percentages.
Additional Water Resources and future water demand
Environmental studies must be commissioned to further inform the decision on which resources should be further developed and should include the following for the Buffels River supply area:
The raising of the Buffels River dam,
Developing of boreholes; and
Disa Kloof- and Rooi Els Rivers
Desalination and reclamation of WWTW effluent could be considered should the above options prove to be unsuccessful.
Environmental studies should also be commissioned for the Palmiet River to determine the maximum abstraction rate during the low flow periods and also to drill and equip additional boreholes.
Greater Hermanus Area: The Gateway, Camphill and Volmoed Well fields are being developed by OM as additional groundwater resources for the greater Hermanus Area. The Gateway boreholes are in production and the Municipality keep on implementing their Groundwater Monitoring

211
Programme for all the well fields. The Municipality is also planning for the construction of a new pipeline from the Camphill and Volmoed boreholes to the Preekstoel WTWs (Seven boreholes will be put into operation).
A detail feasibility study was also completed during the 2010/2011 financial year for the re-use of treated effluent from the Hermanus WWTWs. The following five re-use schemes were initially considered.
Option Description Conclusion Option A: Indirect re-use via De Bos dam
Polishing at Hermanus WWTW and pump to De Bos dam for dilution and natural polishing. Final treatment at Preekstoel WTW.
Viable option. Options A and C best options. Environmental approval for pipeline may delay implementation by one year.
Option B: Indirect re-use via Preekstoel WTW
Polishing at Hermanus WWTW and pumped to inlet works at Preekstoel WTW for final treatment.
Viable option. Adjudication matrix identified this as the least preferred of the three viable options.
Option C: Direct re-use via Preekstoel Clear Water Well (Polished and treated at Hermanus WWTW)
Complete polishing and treatment at Hermanus WWTW. Re-use water pumped directly into Preekstoel Clear water well
Viable option. Options A and C best options. Technically Option C will be the quickest to implement.
Option D: Direct re-use via Preekstoel Clear Water Well (Polished and treated at Preekstoel WTW)
Complete polishing and treatment on site at Preekstoel WTW. Re-use water pumped directly into Preekstoel Clear water well.
Technical flaw and not considered further. No space available at Preekstoel WTW.
Option E: Direct re-use via Hermanus Reservoir (Polished and treated at Hermanus WWTW)
Complete polishing and treatment at Hermanus WWTW. Re-use water pumped directly into Hermanus Reservoir
Technical flaw and not considered further. Reservoirs are dedicated to specific suburbs. Providing re-use water to specific areas will lead to social objections.
Both options A and C were found to be feasible, but due to the urgency of the augmentation options option C was considered to be the most appropriate re-use solution.
Some of the other bulk water sources that were considered are included in the table below.
Option Description Conclusion Desalination: Side stream polishing of portion of sea water feed to abalone farm.
Desalination of side stream flow at abalone farm. The desal water is then pumped to Preekstoel WTW for blending and stabilisation.
Technically feasible. Cost / m³ compared to other currently available water sources, makes it the most expensive water. The cost of desal water is energy intensive and sensitive to power cost increases. Feasible option in the future, when other sources are completely utilised.
Mossel River Transfer Scheme. Make use of existing water allocation from Mossel River (Fernkloof Dams)
Pump the allocated water from the three dams to Preekstoel WTW for treatment. Allocation of 230 Ml/a, an average of 0.630Ml/d.
Technically feasible. High capital cost of pipeline for relatively small water source yields a high cost / m³. This water would require treatment at Preekstoel WTW. This option has a very low energy consumption.
Fisherhaven Dam Transfer Scheme. Make use of existing water allocation from Fisherhaven Dam (Afdaks River)
Pump the allocated water from Fisherhaven Dam, over the watershed into De Bos dam. Allocation is 240Ml/a, an average of 0.658 Ml/d.
Technically feasible. High capital cost of pipeline for relatively small water source yields a high cost / m³. This water would require treatment at Preekstoel WTW. This option has very low energy consumption.
212
The Municipality will also start investigating various desalination options in the nearby future. The desalination option was however found to be the most expensive scheme to operate, with a Unit Cost approximately 50% more expensive that the re-use schemes considered. It was therefore proposed that a re-use scheme be implemented to address the immediate demand for water.
Stanford: The Municipality explored the groundwater potential of the Kouevlakte area since 2009, through exploration borehole siting and drilling. Two newly drilled boreholes will be put into operation and the Municipality is currently busy with the construction of the new bulk supply pipelines in order to connect the two newly drilled boreholes to the existing water reticulation network.
Greater Gansbaai: A new Nano Filtration Plant was constructed during the 2010/2011 financial year in order to fully utilise the Klipgat and Grotte resources and improve the quality of the water.
Pearly Beach: OM is committed to manage the dam efficiently. Other resource options include the extension of the existing groundwater supply system and the Kraaibosch scheme.
Baardskeerdersbos: A new borehole will be commissioned in the near future and the supply from the stream and the new borehole will be adequate to meet the medium- and long-term future water requirements.
Buffeljags Bay: The current source is adequate to supply the medium- and long-term future water requirements. No further exploration work will be undertaken, as there is now a sufficient source of water to meet the future demand.
Industrial Consumers: A “Form of Application for Permission to Discharge Industrial Effluent into the Municipality’s sewer” is included in OM’s water services by-laws and all industries now need to formally apply for the discharge of industrial effluent into the sewer system.
The following gaps with regard to industrial consumers and their discharge of effluent into OM’s sewer system were identified:
Industrial effluent discharge into the sewer system needs to be quantified.
All industries need to formally apply for the discharge of industrial effluent into the sewer system.
Regular sampling of the quality of industrial effluent discharged into the sewer system is necessary.
Any returns from the industries direct to the Water Resource System needs to be metered.
OM is committed to ensure that all industries apply for the discharge of industrial effluent into the sewer system, to monitor the quality and volume of industrial effluent discharged and to implement the set of by-laws with regard to the discharge of industrial effluent into OM’s sewer system in order to determine whether the quality comply with the standards and criteria
The industrial consumers in OM’s Management Area are not yet monitored, with regard to the quality and volume of effluent discharged by them. OM needs to adopt an approach whereby the various parameters at all the industrial consumers are monitored, as well as volumetric monitoring at the larger users. Adaptation of procedures must be undertaken in accordance with any changes to the wastewater discharge criteria set by DWA. It will also be necessary to consider limits above which volumetric monitoring will be necessary at new industries and existing smaller industries, where expansion is likely to take place.
All current industrial consumers need to apply for discharge permits and they must supply and maintain a flow meter measuring the volume of water that is discharged into OM’s sewerage system. It is also recommended that the accounts generated by the Municipality include for each cycle a
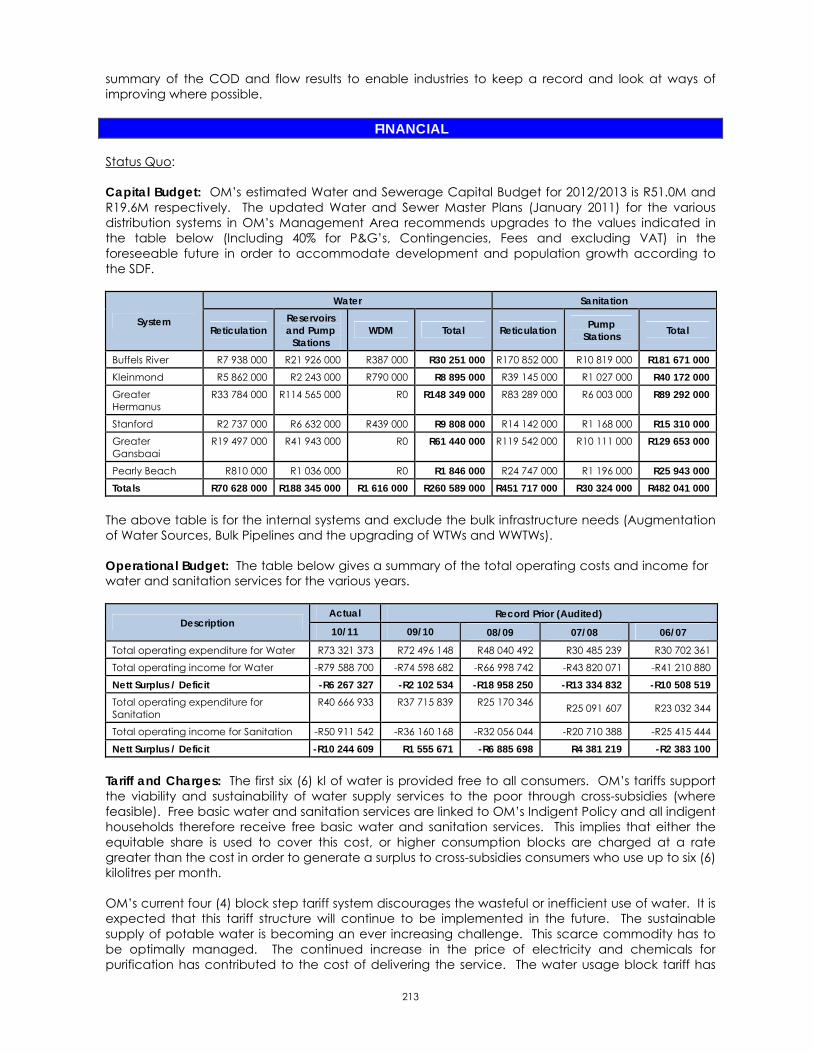
213
summary of the COD and flow results to enable industries to keep a record and look at ways of improving where possible.
FINANCIAL
Status Quo:
Capital Budget: OM’s estimated Water and Sewerage Capital Budget for 2012/2013 is R51.0M and R19.6M respectively. The updated Water and Sewer Master Plans (January 2011) for the various distribution systems in OM’s Management Area recommends upgrades to the values indicated in the table below (Including 40% for P&G’s, Contingencies, Fees and excluding VAT) in the foreseeable future in order to accommodate development and population growth according to the SDF.
System
Water Sanitation
Reticulation Reservoirs and Pump
Stations WDM Total Reticulation Pump
Stations Total
Buffels River R7 938 000 R21 926 000 R387 000 R30 251 000 R170 852 000 R10 819 000 R181 671 000 Kleinmond R5 862 000 R2 243 000 R790 000 R8 895 000 R39 145 000 R1 027 000 R40 172 000 Greater Hermanus
R33 784 000 R114 565 000 R0 R148 349 000 R83 289 000 R6 003 000 R89 292 000
Stanford R2 737 000 R6 632 000 R439 000 R9 808 000 R14 142 000 R1 168 000 R15 310 000 Greater Gansbaai
R19 497 000 R41 943 000 R0 R61 440 000 R119 542 000 R10 111 000 R129 653 000
Pearly Beach R810 000 R1 036 000 R0 R1 846 000 R24 747 000 R1 196 000 R25 943 000 Totals R70 628 000 R188 345 000 R1 616 000 R260 589 000 R451 717 000 R30 324 000 R482 041 000
The above table is for the internal systems and exclude the bulk infrastructure needs (Augmentation of Water Sources, Bulk Pipelines and the upgrading of WTWs and WWTWs).
Operational Budget: The table below gives a summary of the total operating costs and income for water and sanitation services for the various years.
Description Actual Record Prior (Audited)
10/11 09/10 08/09 07/08 06/07
Total operating expenditure for Water R73 321 373 R72 496 148 R48 040 492 R30 485 239 R30 702 361
Total operating income for Water -R79 588 700 -R74 598 682 -R66 998 742 -R43 820 071 -R41 210 880
Nett Surplus / Deficit -R6 267 327 -R2 102 534 -R18 958 250 -R13 334 832 -R10 508 519 Total operating expenditure for Sanitation
R40 666 933 R37 715 839 R25 170 346 R25 091 607 R23 032 344
Total operating income for Sanitation -R50 911 542 -R36 160 168 -R32 056 044 -R20 710 388 -R25 415 444
Nett Surplus / Deficit -R10 244 609 R1 555 671 -R6 885 698 R4 381 219 -R2 383 100
Tariff and Charges: The first six (6) kl of water is provided free to all consumers. OM’s tariffs support the viability and sustainability of water supply services to the poor through cross-subsidies (where feasible). Free basic water and sanitation services are linked to OM’s Indigent Policy and all indigent households therefore receive free basic water and sanitation services. This implies that either the equitable share is used to cover this cost, or higher consumption blocks are charged at a rate greater than the cost in order to generate a surplus to cross-subsidies consumers who use up to six (6) kilolitres per month.
OM’s current four (4) block step tariff system discourages the wasteful or inefficient use of water. It is expected that this tariff structure will continue to be implemented in the future. The sustainable supply of potable water is becoming an ever increasing challenge. This scarce commodity has to be optimally managed. The continued increase in the price of electricity and chemicals for purification has contributed to the cost of delivering the service. The water usage block tariff has

214
been structured for a basic affordable tariff for up to 30 kl per household per month. Punitive tariffs are in place for excessive water consumption.
Gaps and Strategies:
Capital Budget: The water supply systems in most of the Municipalities are under increasing threat of widespread failure, due to inadequate rehabilitation and maintenance of the networks. This is also the case in OM’s Management Area with 83.8% of the water reticulation network and 63.1% of the bulk water pipelines that are in a poor or very poor condition (As taken from the Asset Register). This is placing considerable strain on OM’s maintenance operations. The real solution is for the Municipality to continue with their current commitment towards a substantial and sustained programme of capital renewal works. The problem is not restricted to the reticulation and also includes the water pump stations.
The replacement value of the water infrastructure that is expected to come to the end of its useful life over the next 20 years is around R854.4M (an average of R42.7M per year) and for sanitation infrastructure the value is R262.7M (an average of R13.1M per year). The renewals burden is set to continue to increase sharply over the next 15 years, as is currently the case. Water and sanitation infrastructure assets with a total current replacement value of about R766.5M and R223.5M will be reaching the end of their useful life over the next 10 years and will need to be replaced, rehabilitated or reconstructed.
It is therefore important for the Council to continue with their current committed capital renewal programme and to increase the budgets allocated towards the maintenance and rehabilitation of the existing infrastructure. The extent to which each type of water and sanitation asset has been consumed was previously summarised. The Municipality’s dedicated renewal programmes need to target the poor and very poor assets. If this is not done, there is a risk that the ongoing deterioration will escalate to uncontrollable proportions, with considerable impact on customers, the economy of the area and the image of OM.
OM’s implementation strategies with regard to capital funds are as follows:
To focus strongly on revenue collection, because most of the funds for water and sanitation capital projects are form OM’s own funding sources. Actively implement the Customer Care, Credit Control and Debt Collection Policy in order to minimize the percentage of non-payment of municipal services.
To identify all possible sources of external funding over the next three years to assist OM to address the huge capital infrastructure backlogs that exist in the various towns.
Develop IAMPs for all water and sanitation infrastructure, which will indicate the real replacement values, the service life of the assets and the funds required to provide for adequate asset replacement.
OM will start with the investigation of alternative ways of providing the services. Business Process Re-engineering reviews will be undertaken to identify both more efficient and cost-effective ways of delivering services.
Operational Budget: Maintenance activities have been increasingly focused on reactive maintenance as a result of the progressive deterioration and failure of old infrastructure. Consequently, there has been dilution of preventative maintenance of other infrastructure.
An IAMP is necessary that optimises maintenance activities, appropriate to its specific needs and the local environment, and identifies the systems and resources required to support this. A regime of planned preventative maintenance should be established for all infrastructure assets classified as critical and important in the Asset Register. Consideration should be given to the establishment of a maintenance management system to enable OM to better manage its risks, and more effectively plan and prioritise the wave of renewals that are going to be required over the next 20 years.
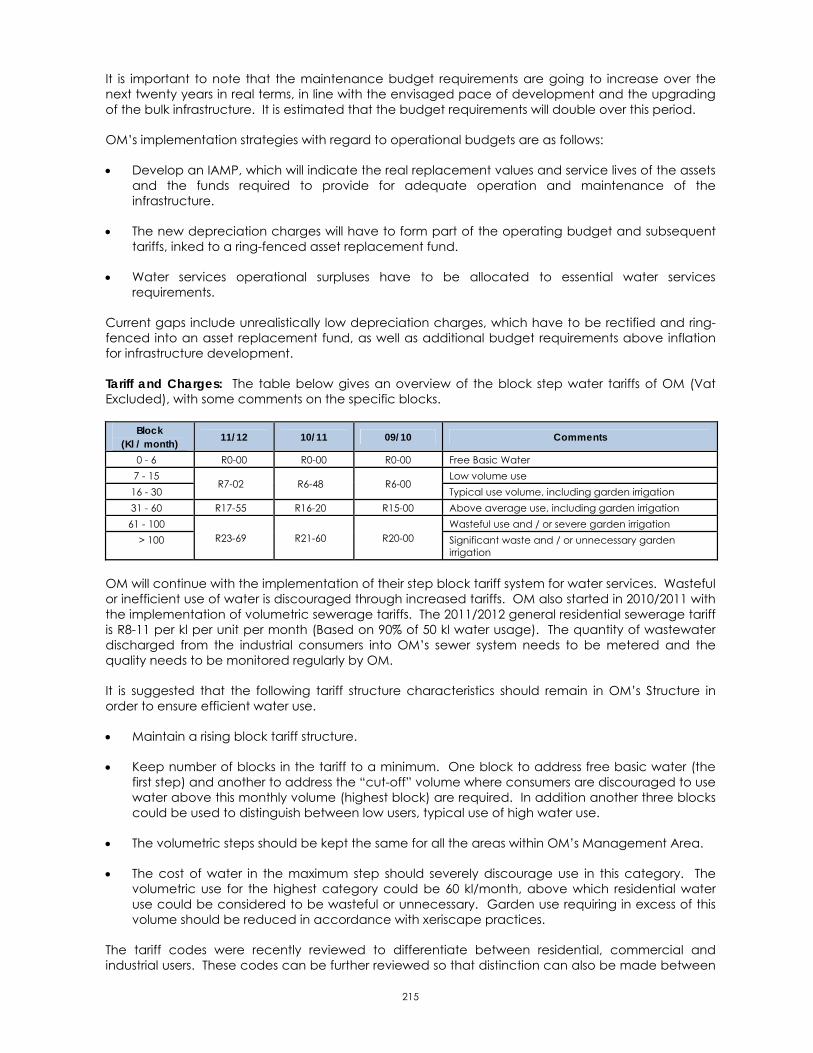
215
It is important to note that the maintenance budget requirements are going to increase over the next twenty years in real terms, in line with the envisaged pace of development and the upgrading of the bulk infrastructure. It is estimated that the budget requirements will double over this period.
OM’s implementation strategies with regard to operational budgets are as follows:
Develop an IAMP, which will indicate the real replacement values and service lives of the assets and the funds required to provide for adequate operation and maintenance of the infrastructure.
The new depreciation charges will have to form part of the operating budget and subsequent tariffs, inked to a ring-fenced asset replacement fund.
Water services operational surpluses have to be allocated to essential water services requirements.
Current gaps include unrealistically low depreciation charges, which have to be rectified and ring-fenced into an asset replacement fund, as well as additional budget requirements above inflation for infrastructure development.
Tariff and Charges: The table below gives an overview of the block step water tariffs of OM (Vat Excluded), with some comments on the specific blocks.
Block (Kl / month) 11/12 10/11 09/10 Comments
0 - 6 R0-00 R0-00 R0-00 Free Basic Water 7 - 15
R7-02 R6-48 R6-00 Low volume use
16 - 30 Typical use volume, including garden irrigation 31 - 60 R17-55 R16-20 R15-00 Above average use, including garden irrigation
61 - 100 R23-69 R21-60 R20-00
Wasteful use and / or severe garden irrigation > 100 Significant waste and / or unnecessary garden
irrigation
OM will continue with the implementation of their step block tariff system for water services. Wasteful or inefficient use of water is discouraged through increased tariffs. OM also started in 2010/2011 with the implementation of volumetric sewerage tariffs. The 2011/2012 general residential sewerage tariff is R8-11 per kl per unit per month (Based on 90% of 50 kl water usage). The quantity of wastewater discharged from the industrial consumers into OM’s sewer system needs to be metered and the quality needs to be monitored regularly by OM.
It is suggested that the following tariff structure characteristics should remain in OM’s Structure in order to ensure efficient water use.
Maintain a rising block tariff structure.
Keep number of blocks in the tariff to a minimum. One block to address free basic water (the first step) and another to address the “cut-off” volume where consumers are discouraged to use water above this monthly volume (highest block) are required. In addition another three blocks could be used to distinguish between low users, typical use of high water use.
The volumetric steps should be kept the same for all the areas within OM’s Management Area.
The cost of water in the maximum step should severely discourage use in this category. The volumetric use for the highest category could be 60 kl/month, above which residential water use could be considered to be wasteful or unnecessary. Garden use requiring in excess of this volume should be reduced in accordance with xeriscape practices.
The tariff codes were recently reviewed to differentiate between residential, commercial and industrial users. These codes can be further reviewed so that distinction can also be made between

216
user types for Municipal Usage (e.g. parks, sports, fire fighting, etc.). A code should also be used to uniquely describe the water usage by schools.
WATER SERVICES INSTITUTIONAL ARRANGEMENTS
Status Quo:
OM acts as both WSA and WSP to the consumers in their Municipal Management Area and therefore does not manage other WSPs. A comprehensive set of Water Services By-laws are in place for OM’s Management Area. The By-laws cover the provision of services for water supply, sanitation and industrial effluent.
OM got a comprehensive Performance Management System in place. The SDBIP is the process plan and performance indicator / evaluation for the execution of the budget. The SDBIP is being used as a management, implementation and monitoring tool that assists and guide the Executive Mayor, Councillors, Municipal Manager, Senior Managers and the community. The plan serves as an input to the performance agreements of the Municipal Manager and Directors. It also forms the basis for the monthly, quarterly, mid-year and the annual assessment report and performance assessments of the Municipal Manager and Directors.
At a technical, operations and management level, municipal staff is continuously exposed to training opportunities, skills development and capacity building in an effort to create a more efficient overall service to the users.
Submissions were also made to the DWA for the classification and registration of all the WTWs and WWTWs and the Process Controllers and Supervisors responsible for the management of these plants. A skill audit is conducted during each year which leads to various training programmes in order to wipe out skills shortages and to provide employees with the necessary capacity. A Workplace Skills Plan for 2011/2012 is in place.
Gaps and Strategies:
OM is committed to develop a new WSDP every five years and to update the WSDP as necessary and appropriate in the interim years. The Municipality will also report annually and in a public way on progress in implementing the plan (Water Services Audit).
The Municipality will continue to report to the DWA on the KPIs for water and sewerage services through DWA’s Regulatory Performance Management System (RPMS).
OM continues to undertake basic public awareness programmes. The education of users where sanitation facilities are upgraded to waterborne systems is ongoing. This is primarily focussed at informing users of the appropriate use of and routine maintenance of such facilities.
OM needs to focus strongly on the rehabilitation and the maintenance of the existing infrastructure, augmentation of their existing water sources and all planning for new services should be guided by the Water and Sewer Master Plans. Water and sanitation services are currently effectively managed by OM.
OM will also continue with their mentoring role for operators ensuring and adequately trained and classified workforce with dedicated training programmes for supervisors and operators. Budgets need to be established to address the shortfall of skilled staff, rethink methods to retain qualified personnel and plan for succession and clear career paths for experienced staff. With such a program a source of specific resources of skilled operators, technicians and managers will be established.

217
SOCIAL AND CUSTOMER SERVICE REQUIREMENTS
Status Quo:
A comprehensive Customer Services and Complaints system is in place at OM and the Municipality has maintained a high and a very consistent level of service to its urban water consumers. Help-desks were developed at all the municipal administrations with the objective to assist customers. Disabled people are supported to do business from the help-desks. Requests by the illiterate are being captured and forwarded to the relevant official / section. All municipal buildings are accessible and wheel-chair friendly.
After hour emergency requests are being dealt with by the control room on a twenty four hour basis. Requests are furthermore captured on an electronic mail or works-order system to ensure execution thereof. All help desks were equipped with Batho Pele picture signage. The Municipality has maintained a high and a very consistent level of service to its urban water consumers. A Draft Consumer Care Charter is in place.

218
The table below gives a summary of the records that are kept by OM and the maintenance work that was carried out over the last three financial year. Service Definition
Gansbaai Hermanus Kleinmond Stanford Total 10/11 09/10 08/09 10/11 09/10 08/09 10/11 09/10 08/09 10/11 09/10 08/09 10/11 09/10 08/09
Sewerage connection Provision of connection or inspection of existing connections 25 65 13 63 71 124 3 3 2 3 1 2 94 140 141
Sewer blockages Repair blockages on main sewer pipelines up to connection points 65 13 46 1 332 526 1249 127 62 74 35 33 25 1 559 634 1394
Investigate sewer reticulation network Investigate network 19 0 2 11 10 10 2 1 0 1 0 0 33 11 12
Manholes sewer reticulation Inspection and installation of manholes 6 0 0 1 1 0 7 2 0 - 0 0 14 3 0
Other sewer reticulation Any other sewer reticulation inspections 28 3 0 16 4 0 5 0 0 4 0 0 53 7 0
PDA toilets repairs Previously disadvantaged toilets repaired 102
Community members were appointed to
carry out the repairs 1
Community members were appointed to carry out the repairs
- Community members
were appointed to carry out the repairs
2 Community members
were appointed to carry out the repairs
105 Community members
were appointed to carry out the repairs
Pipeline sewer Installation of sewer pipelines or repair of pipelines 2 1 0 10 1 0 6 0 0 1 1 0 19 3 0
Investigate sewer reticulation pump stations
Work carried out at sewer pump stations 3 1 0 42 12 21 2 2 11 - 2 0 47 17 32
Test water meter Testing of water meter for accuracy 4 0 29 1 - 10 2 - 1 1 44 4
Disconnect water connection Disconnect supply 3 Managed Externally (Debt Pack) 6 Managed Externally
(Debt Pack) 6 Managed Externally (Debt Pack) 4 Managed Externally
(Debt Pack) 19 Managed Externally (Debt Pack)
Install drip system Installation and inspection of drip systems - Managed Externally
(Debt Pack) 2 Managed Externally (Debt Pack) 1 Managed Externally
(Debt Pack) 1 Managed Externally (Debt Pack) 4 Managed Externally
(Debt Pack) Inspect water connections Inspect connections 71 27 659 184 114 467 154 17 323 77 27 112 486 185 1 561
Other water connections Inspections and work carried out at water connections 68 44 69 23 27 167 38 20 35 13 23 93 142 114 364
Pipelines water Installation or repair of water pipelines 5 3 1 5 6 11 11 4 1 13 18 1 34 31 14
Pressure Complaints with regard to pressure in the system 28 8 26 44 78 80 18 18 15 - 7 5 90 11 126
Water Pump Stations Inspections and work carried out at water pump stations. - 1 0 4 4 21 31 1 11 - 0 0 35 6 32
Repair pipe bursts Repair of burst water pipelines 61 35 60 151 91 243 255 104 49 13 12 14 480 242 366
Reservoirs Inspection of reservoirs and work carried out at reservoirs 1 2 2 18 40 47 2 50 5 - 1 2 21 93 56
Water Routine Inspections Any water related inspections 92 0 1 13 2 5 7 0 2 1 3 10 113 5 18
Water Valves Inspection of valves and work carried out on valves 7 5 2 3 9 21 12 2 12 1 2 2 23 18 37

219
Gaps and Strategies:
Access to safe drinking water is essential to health and is human right. Safe drinking water that complies with the SANS:241 Drinking Water specifications do not pose a significant risk to health over a lifetime of consumption, including different sensitivities that may occur between life stages. OM is therefore committed to ensure that their water quality always complies with national safety standards.
The Water Safety Plan of OM includes an Improvement / Upgrade Plan. The purpose of the Improvement / Upgrade Plan is to address the existing significant risks where the existing controls were not effective or absent. Barriers implemented by OM against contamination and deteriorating water quality include the following:
Participate in Catchment management and water source protection initiatives.
Protection at points of abstraction such as river intakes and dams (Abstraction Management).
Correct operation and maintenance of WTWs (Coagulation, flocculation, sedimentation and filtration). A new Nano Filtration Plant was constructed at De Kelders Grotte.
Protection and maintenance of the distribution system. This includes ensuring an adequate disinfectant residual at all times, rapid response to pipe bursts and other leaks, regular cleaning of reservoirs, keeping all delivery points tidy and clean, etc.
Three other important barriers implemented by OM against poor quality drinking water that are a prerequisite to those listed above are as follows:
A well informed Council and municipal managers that understand the extreme importance of and are committed to providing adequate resources for continuous professional operation and maintenance of the water supply system.
Competent managers and supervisors in the technical department who are responsible for water supply services lead by example and are passionate about monitoring and safeguarding drinking water quality.
Well informed community members and other consumers of water supply services that have respect for water as a precious resource.
NEEDS DEVELOPMENT PLAN
Status Quo:
The identification of projects necessary to ensure the provision of adequate levels of water and sanitation services is based primarily on the findings of the Water and Sewer Master Plans, in consultation with the Municipality’s town planning consultants. Master Planning is typically based on a forward planning horizon of 20 years, but is usually updated every three to five years, taking into account improved water demand estimates and subsequent infrastructure developments which may have taken place. The existing Water and Sewer Master Plans of OM were last updated during January
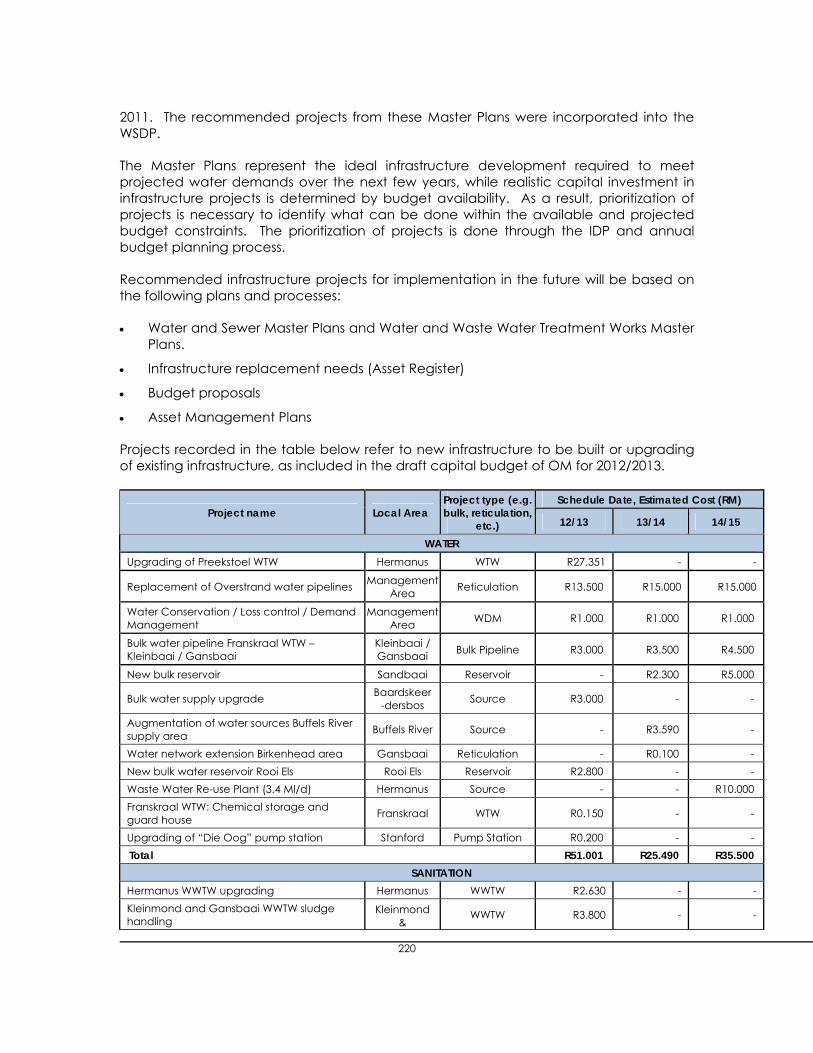
220
2011. The recommended projects from these Master Plans were incorporated into the WSDP.
The Master Plans represent the ideal infrastructure development required to meet projected water demands over the next few years, while realistic capital investment in infrastructure projects is determined by budget availability. As a result, prioritization of projects is necessary to identify what can be done within the available and projected budget constraints. The prioritization of projects is done through the IDP and annual budget planning process.
Recommended infrastructure projects for implementation in the future will be based on the following plans and processes:
Water and Sewer Master Plans and Water and Waste Water Treatment Works Master Plans.
Infrastructure replacement needs (Asset Register)
Budget proposals
Asset Management Plans
Projects recorded in the table below refer to new infrastructure to be built or upgrading of existing infrastructure, as included in the draft capital budget of OM for 2012/2013.
Project name Local Area Project type (e.g. bulk, reticulation,
etc.)
Schedule Date, Estimated Cost (RM)
12/13 13/14 14/15
WATER Upgrading of Preekstoel WTW Hermanus WTW R27.351 - -
Replacement of Overstrand water pipelines Management Area Reticulation R13.500 R15.000 R15.000
Water Conservation / Loss control / Demand Management
Management Area WDM R1.000 R1.000 R1.000
Bulk water pipeline Franskraal WTW – Kleinbaai / Gansbaai
Kleinbaai / Gansbaai Bulk Pipeline R3.000 R3.500 R4.500
New bulk reservoir Sandbaai Reservoir - R2.300 R5.000
Bulk water supply upgrade Baardskeer-dersbos Source R3.000 - -
Augmentation of water sources Buffels River supply area Buffels River Source - R3.590 -
Water network extension Birkenhead area Gansbaai Reticulation - R0.100 - New bulk water reservoir Rooi Els Rooi Els Reservoir R2.800 - - Waste Water Re-use Plant (3.4 Ml/d) Hermanus Source - - R10.000 Franskraal WTW: Chemical storage and guard house Franskraal WTW R0.150 - -
Upgrading of “Die Oog” pump station Stanford Pump Station R0.200 - - Total R51.001 R25.490 R35.500
SANITATION Hermanus WWTW upgrading Hermanus WWTW R2.630 - - Kleinmond and Gansbaai WWTW sludge handling
Kleinmond &
WWTW R3.800 - -

221
Project name Local Area Project type (e.g. bulk, reticulation,
etc.)
Schedule Date, Estimated Cost (RM)
12/13 13/14 14/15
Gansbaai Sewer network extension Stanford Reticulation R2.000 - - Sewer network extension Kleinmond Reticulation R2.000 R3.000 - Sewer network extension Gansbaai Reticulation - R2.500 R3.000 Stanford WWTW upgrade Stanford WWTW R0.250 R4.500 R4.500 Emergency power generator for Gansbaai WWTW Gansbaai WWTW R0.650 - -
Gansbaai WWTW: Tarring of access road Gansbaai WWTW R0.150 - - Electrical supply and pump to bulk sewerage tank Gansbaai WWTW R0.150 - -
Sewer pump stations upgrading Hermanus Pump Stations R1.500 R1.500 R1.000 Reroute sewer pipe: Abagold Hermanus Reticulation R0.600 - - Hermanus sewer network extension - Fernkloof Hermanus Reticulation R0.500 - -
Hermanus sewer network extension - Fernkloof Hermanus Reticulation R2.550
New sewer line Beachclub Area Hermanus Reticulation R1.000 - -
Upgrading of pump stations Management Area Pump Stations R1.800 - -
Total R19.580 R11.500 R8.500
Gaps and Strategies:
OM’s key capital infrastructure projects for the next three years are as follows:
Upgrading of the Preekstoel WTW.
Continue with the implementation of WDM measures (Meter replacements, pipeline replacements, pressure management, etc.)
Additional reservoir storage capacity for Sandbaai and Rooi Els.
Construction of a new Waste Water Re-use Plant in Hermanus.
Augmentation of the existing water sources for the Buffels River and Baardskeerdersbos systems.
Upgrading of the bulk water supply pipeline from Franskraal WTW to Kleinbaai / Gansbaai.
Upgrading of the Hermanus and Stanford WWTWs and the sludge handling at the Kleinmond and Gansbaai WWTW.
Upgrading of the sewer pump stations and the sewer reticulation networks.
OM’s implementation strategies, with regard to new water and sanitation infrastructure, are as follows:
222
Take the recommended projects, as identified through the Water and Sewer Master Plans and the WSDP, into account during the planning and prioritization process for new infrastructure. Prioritize from the desired list, those items which can be implemented from available funding in the particular financial year.
To update the existing Water Master Plans and to undertake revised master planning at least every two to three years and to use the Master Plans to list the desired infrastructure development requirements and reflect these in the IDP.
Assign a high priority to the provision of basic water and sanitation services in the rural areas.
Assign a high priority to the implementation of OM’s WDM Strategy (Demand Management) in order to postpone additional capital investment for as long as possible, both from the water availability perspective as well as from the treatment of increased effluent volumes.
Balance land-use and development planning (SDFs and Growth Management Strategy) in accordance with the availability of water and the capacity of WTWs and WWTWs that are in place or that will be implemented.
223
Annexure 2
INTEGRATED WASTE MANAGEMENT PLAN (IMP) EXECUTIVE SUMMARY GENERAL DESCRIPTION The third version of the Integrated Waste Management Plan (IWMP) has been formulated by JPCE on behalf of Overstrand Municipality to address the challenge of waste management in Overstrand, home to some 85 000 people. The IWMP is a statutory requirement of the new National Environmental Management: Waste Act, 2008 (Act No. 59 of 2008) that has been promulgated and came into effect on 1 July 2009 and that has as its goal the transformation of the current methodology of waste management, i.e. collection and disposal, to a sustainable practice focussing on waste avoidance and environmental sustainability. Implementation of this IWMP will be through municipal by-laws and in accordance with an implementation schedule. POLICY AND LEGISLATION Existing legislation on waste management in South Africa is generally fragmented, diverse and ineffectively administered. The environment is a cross-sectional matter and it is therefore important that co-operation between government of all levels is necessary. The Constitution of South Africa (Act 109 of 1996) protects everyone’s right to an environment that is not harmful to a person’s health and well-being. Furthermore, the constitution also describes the role and responsibilities of Local Government which involve the objectives in Section 152, namely: • to promote social and economic development. • to promote a safe and healthy environment. The Constitution further stipulates under the powers and functions of Municipalities, specifically Part B of Schedule 5 relating to Solid Waste Management: • Refuse removal • Refuse dumps • Solid waste disposal The Waste Act prescribes the following responsibilities to Municipalities: • the minimisation of the consumption of natural resources; • the avoidance and minimisation of the generation of waste; • the recovery, re-use and recycling of waste; • the treatment and safe disposal of waste as a last resort; • ensuring that people are aware of the impacts of waste on health and the enivronment.
224
The Plan also stipulated the various applicable sections of the National Environmental Management Act, National Water Act, Atmospheric Pollution Prevention Act, National Waste Management Strategy and the Waste Act. It is recommended that the Overstrand’s By-laws are updated to include the new content of the Waste Act. EXISTING WASTE MANAGEMENT METHODOLOGY AND CURRENT STATUS The methodology of General Waste data collection is based on actual weighbridge data received from the Overstrand Municipality. Weighbridge data since April 2010 is available. However, information on specific waste streams such as electronic waste, used tyres, batteries, etc are generally not recorded. WASTE AVOIDANCE Currently waste avoidance is not being practiced to any significance. COLLECTION The different levels of collection service are currently being investigated and the whole of the Municipality will receive weekly collection from 1 July 2012. All towns located in the Overstrand service areas also receive a weekly collection service for source-separated recyclables. WASTE REDUCTION Waste reduction in Overstrand is currently practised by participating residents and a small number of private companies of which Walker Bay Recycling is the most prominent. Material recovery also takes place at the Hermanus Transfer Station and Gansbaai MRF. The collected recovery data from these facilities with the inclusion of Walker Bay Recycling’s efforts show that currently 6% of the total generated waste stream is being recovered for recycling. The chipping of garden waste contributes to a further 11% diversion from landfill. WASTE DISPOSAL Disposal of municipal solid waste in Overstrand is practiced at the Gansbaai Landfill, as the existing cells at the regional Karwyderskraal Landfill have reached capacity. Karwyderskraal will receive waste again when the construction of cell 3 is completed. A number of closed waste sites are still to be rehabilitated when sufficient capital has been sourced and allocated. Public Drop-off facilities have to date been provided in Hawston/Fishershaven (S34 22 38.36 E19 07 41.00), Voëlklip (S34 24 44.9 E19 18 20.7), Stanford (S34 26 50.41 E 19 27 23.59), Pearly Beach (S34 39 53.20 E19 30 12.84) and Kleinmond (S 34 20 11.96 E19 00 16.31). All these facilities are equipped with 30m3 skips. These facilities provide the residents the

225
convenient opportunity to dispose waste that they have not put out for collection, into containers for later removal by the municipality or its agent. At Rooi-Els (S34 18 06.8 E18 49 10.3), Pringle Bay (S34 20 33.6 E18 50 38.5) and Betty’s Bay (S34 21 20.7 E18 51 44.5) Public Drop-off facilities are provided in the form of caged trailers. COSTS OF EXISTING WASTE MANAGEMENT The 2010/11 financial year indicates a waste management operating cost of R36,728,654 against an operating income of R37,234,513. The estimated 2011/2012 costs are budgeted at R39,528,427 against an estimated R40,454,000 income. STAFF RESOURCES The Cleansing Department of Overstrand currently has only one vacant post. Although municipal waste management in the Overstrand appears to be well managed, the main focus still appears to be collection and disposal, rather than waste avoidance and waste reduction. Although Overstrand Municipality has taken a leading role in the country with regard to source separation of recyclable materials, the participation rate is low and the resulting success rate with source separation also low. This Plan has as its goal the transformation of the current waste management system towards a system whereby an atmosphere is created that will conserve and protect the environment and natural resources. An outcome of this Plan will be the development of a communication/information/education strategy that will help to ensure public acceptance or ownership of the strategic objectives and to promote co-operative community action. The Plan will also provide a framework to address the municipality’s growing waste management problem in accordance with the best prevailing norms, financial capacity and best environmental practice. Finally the Plan will also attempt to address the three main objectives of the National Waste Management Strategy, i.e. waste avoidance, waste reduction and waste disposal. With the Waste Act coming into effect on 1 July 2009, every Municipality is now responsible, by law, to minimise waste volumes. Where waste reduction or minimisation has never been a municipal function, through the Waste Act, it now is. To achieve the above, this Plan aims to ensure that waste management in the Overstrand complies with South African and International environmental standards so that it is beneficial to industrial and agricultural growth and the public’s right to a clean and healthy environment. In short, this implies that it is the aim of the Overstrand Municipality to minimise the entrance of material into the waste stream and to reduce all waste of which the generation cannot be avoided so that no material of value or anything that can decompose, gets disposed. Furthermore will it be the aim of Overstrand Municipality to dispose the waste that cannot be avoided or reduced, at licensed facilities in accordance with regulatory requirements and with regular operational and environmental monitoring. The Overstrand Municipality therefore accepts its legal obligation regarding waste management.
226
IMPLEMENTATION INSTRUMENTS Waste Avoidance is the primary focus of the National Waste Management Strategy and as such must be the priority of any Integrated Waste Management Plan. Waste Avoidance is defined as the action that avoids the entry of material into the waste stream that is when the generator of the potentially waste material exercises the decision to do something else with that material rather than to put it out for waste collection. The following are examples of waste avoidance: • Composting of the organic/green waste at home • Self-delivery of glass/cardboard/newspaper/PET to recycling bins or school recycling projects • Re-use of empty jars as storage containers at home • Reclamation of drum containers • Recovery of fruit and food solid waste component as animal feed • Recovery of chemicals (such as caustic soda) from industries • Recovery of electronic equipment • Changing raw materials of industrial processes to produce recoverable industrial waste From the above it is clear that waste avoidance will result not only in less material to be disposed but also in less material to be collected by the waste collection system. The following are Overstrand Municipality’s plans for the promotion of waste avoidance in its area: • The creation of Public Awareness and Education, • Prevention Quantification through the setting of goals. Waste Reduction will be achieved through the recovery and/or composting of waste after collection. For this purpose the municipality will establish strategically located material recovery facilities and composting facilities (Hermanus and Gansbaai already have a MRF each), or fully support existing infrastructure, in order to reduce the volume of waste destined for landfilling. In order to make waste reduction sustainable, the quality of the recovered material must be as uncontaminated as possible and to ensure this, the Municipality will expand the current source separation initiative. The Municipality will also expand on its current practice to provide the public the opportunity to separate their household hazardous wastes, electronic wastes and household healthcare wastes and delivered it to waste facilities for safe disposal or treatment at other facilities in order to divert these special wastes from the General Waste landfills. Sustainable waste disposal, although it is considered to be the least desirable option in the waste hierarchy, will be achieved through properly engineered waste disposal facilities and the frequent monitoring thereof. The municipality is currently operating a licensed waste disposal site near Gansbaai and will make use again of the regional licensed landfill at Karwyderskraal when cell 3 has been completed. Continuous extension of these facilities within sufficient time-frames will be required to maintain sufficient airspace for waste disposal. Even though the main focus of waste management must shift towards waste minimisation and the reduction of waste that requires disposal, waste disposal will still be required. The closed small waste disposal sites near the smaller towns shall also be rehabilitated within the next five years. Other waste management objectives to be met by the municipality are a review of its waste collection service to ensure an affordable and similar service to all, a proper waste

227
data collection and capturing system and an appropriate waste cleansing system. The waste collection service is currently under review. Since the Integrated Waste Management Plan as specified and required by the National Waste Management Strategy (and the Waste Act) is a strategic framework, the implementation of its instruments is flexible and will require regular re-evaluation and modification, as required. In order to accommodate the municipal budgeting process, it would be appropriate to implement the instruments over a number of financial years, focusing on the critical aspects first.

228
Annexure 3
LLOOCCAALL IINNTTEEGGRRAATTEEDD TTRRAANNSSPPOORRTT PPLLAANN
MARCH 2012

229
Executive Summary
The Overstrand Local Municipality stretches along the South African coast from Rooi Els in
the west to Quoin Point in the east, a coastline of approximately 230km. There are many
towns and villages situated in the Municipal area including Rooi Els, Pringle Bay, Betty’s
Bay, Kleinmond, Hermanus, Stanford, Gansbaai, Pearly Beach, Baardskeerdersbos,
Buffeljagsbaai and Viljoenshof. Hermanus is the administrative and economic centre of
the area. The area is known world wide for its natural beauty and excellent whale
watching and shark diving facilities.
The Municipality covers a land area of approximately 2,125km2 with a total population
(2008 estimate) of 79,000 people. This equates to a population density of 37 people per
square kilometre. The population of the urban areas of the Overstrand Local Municipality
is given below.
Town/Areas 2008 Population
Greater Hermanus 40 980 Greater Gansbaai 14 744 Kleinmond 9 310 Stanford 5 038 Hangklip Area 2 786 Pearly Beach 831
Total 73 689
The economy of the region is primarily agricultural but with tourism also being an
important factor. Both have seasonal implications from the perspective of transport
system utilisation, the result of which is a transport system that has adequate capacity
most of the time, but which is placed under stress at a few peak times of the year.
The agricultural nature of the region also means that the transport network is relatively
sparse except in the towns. The main road system in the Overstrand Municipality consists
of National Road N2 which runs east to west in the vicinity of Botriver along the Northern
boundary of the Municipality for a length of 7.63 km. SANRAL is responsible for the
maintenance and rehabilitation of national roads. The total length of Provincial roads in
the area is 573km (230km surfaced and 343km gravel). The Municipality is responsible for

230
the local municipal roads with a total length of 609km (431km surfaced and 178km
gravel). The average condition for municipal roads is good to very good.
The exclusively road based freight transport in the region is almost entirely related to
agricultural activity, with considerable seasonality. The impact of this freight movement
on the transport system is limited and not a matter of concern at present.
The other seasonal transport in the region is that related to tourism, which has an impact
on specific areas, especially those in the coastal towns, where whale watching and
other holiday activities can sometimes lead to congestion and parking problems that
detract from the tourist experience.
Arising from the foregoing, the transport needs for the Overstrand Municipality include:
o Increase of capacity for main transport routes into, through and around
towns and villages;
o Provision of regular and safe public transport on all the routes, including
upgraded public transport facilities for commuters;
o A solution to seasonal problems of congestion and parking at popular
local tourist destinations;
o Provision of facilities for non-motorised transport and the disabled;
o Increased road rehabilitation and maintenance.
The Vision of the Overstrand Municipality is:
“To be a centre of excellence for the community”
The Mission of the Overstrand Municipality is:
“Creation of sustainable communities by delivering optimal services to support
economic, social and environmental goals”
The Strategic Objects of the Overstrand Municipality is:
The provision of democratic and accountable governance
The provision and maintenance of municipal services
231
The encouragement of structured community participation in the matters of the
Municipality
The creation and maintenance of a safe and healthy environment
The promotion of tourism, economic and social development
The OLM response to the transport needs is aligned with the strategic objects of the
Transportation and road projects are included under the “municipal services” strategy.
The recruitment and training of staff to enhance the OLM transport department’s
capacity to effectively execute transport projects is in line with the strategy of Human
Resource Development. A well planned and maintained transport system enhances
economic development for the area. The OLM’s use of prioritised lists of transport projects
results in better financial management of its resources.
The preparation of the Overstrand Local Integrated Transport Plan is a statutory
requirement in terms of both the National Land Transport Transition Act (NLTTA), (Act 22 of
2000), sections 19 and 27, and the replacing Act, the National Land Transport Act (NLTA),
(Act 5 of 2009), sections 32 and 36. As well as fulfilling this requirement the LITP addresses
the various transport needs of the OLM taking into consideration the financial, social and
environmental impact on the area. This ITP also feeds into the Overberg District ITP.
A total proposed budget for road maintenance (resealing, rehabilitation, kerbing and
sidewalks) over the next five years amounts to R 173 million. The prioritised list of
rehabilitation and maintenance of roads from the pavement management system is
attached.
The total proposed budget (provincial and municipal) for capital projects for the next
five years is R 430 million. A list of proposed capital projects is attached.

232
Abbreviations and Acronyms
ITP............................................………………………… Integrated Transport Plan LITP……………….....…………............………..… Local Integrated Transport Plan NLTA........................................................................... National Land Transport Act NLTTA........................................................ National Land Transport Transition Act ODM......................................................................... Overberg District Municipality OLM.......................................................................... Overstrand Local Municipality SANRAL.............................................. South Africa National Road Agency Limited
233
Introduction
Overview
The geographical position of the Overstrand Local Municipality is shown in Figure 1. It is a
coastal LM and stretches from Rooi Els in the west to Quoin Point in the east, and from
along the coast to the first mountain range to the north. There are many towns and
villages situated in the Municipal area including Rooi Els, Pringle Bay, Betty’s Bay,
Kleinmond, Hermanus, Stanford, Gansbaai, Pearly Beach, Baardskeerdersbos,
Buffeljagsbaai and Viljoenshof. The municipal area is approximately 2125 km² with a
coastline of ±230 km. The main routes into the area are the R43, R44, R320 and R326
routes, all of which connect to the N2.
One of the most outstanding features of this area is its breathtaking natural beauty. The
area includes the Kogelberg Biosphere Reserve which is one of only two such areas
currently in South Africa. This is regarded as the heart of the Cape floral kingdom as
approximately one fifth of all known fynbos species occur here. Hermanus is the
administrative and economic centre of the area. The rest of the Municipal area is rural
with some fishing and service industries. Error! Reference source not found. shows the
location of the Overstrand Local Municipality in relation to the District Municipality.

234
Figure 1: Location of Overstrand Municipality in Relation to the District Municipality
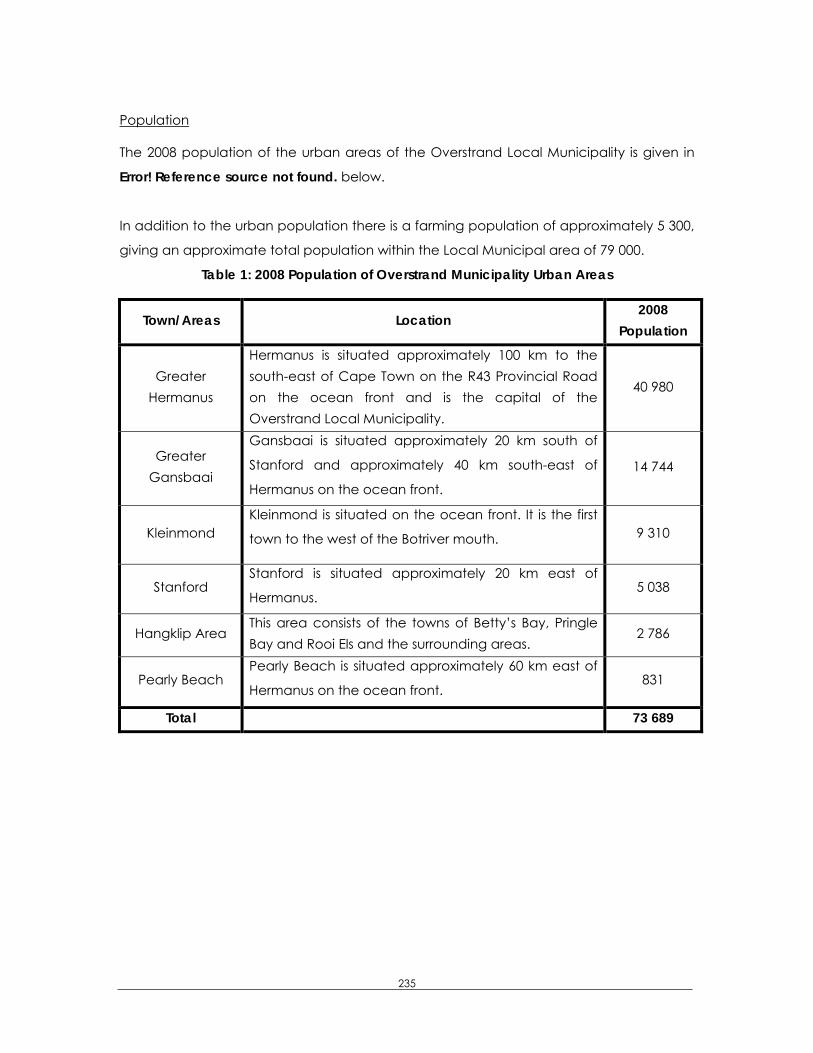
235
Population
The 2008 population of the urban areas of the Overstrand Local Municipality is given in
Error! Reference source not found. below.
In addition to the urban population there is a farming population of approximately 5 300,
giving an approximate total population within the Local Municipal area of 79 000.
Table 1: 2008 Population of Overstrand Municipality Urban Areas
Town/Areas Location 2008
Population
Greater Hermanus
Hermanus is situated approximately 100 km to the south-east of Cape Town on the R43 Provincial Road on the ocean front and is the capital of the Overstrand Local Municipality.
40 980
Greater Gansbaai
Gansbaai is situated approximately 20 km south of
Stanford and approximately 40 km south-east of
Hermanus on the ocean front.
14 744
Kleinmond Kleinmond is situated on the ocean front. It is the first
town to the west of the Botriver mouth. 9 310
Stanford Stanford is situated approximately 20 km east of
Hermanus. 5 038
Hangklip Area This area consists of the towns of Betty’s Bay, Pringle Bay and Rooi Els and the surrounding areas.
2 786
Pearly Beach Pearly Beach is situated approximately 60 km east of
Hermanus on the ocean front. 831
Total 73 689
236
Vision
The vision of the Overstrand Local Municipality is:
“To be a centre of excellence for the community”
Mission
The mission of the Overstrand Local Municipality is:
“Creation of sustainable communities by delivering optimal services to support
economic, social and environmental goals”
Strategic Objectives
The Strategic Objectives of the Municipality which form the basis of the IDP and relates to
transport goals are:
The provision and maintenance of municipal services
The creation and maintenance of a safe and healthy environment
The promotion of tourism, economic and social development
The Preparation of the Local Integrated Transport Plan
The preparation of the Overstrand Local Integrated Transport Plan is a statutory
requirement in terms of both the National Land Transport Transition Act (NLTTA), (Act 22 of
2000), sections 19 and 27, and the replacing Act, the National Land Transport Act (NLTA),
(Act 5 of 2009), sections 32 and 36.
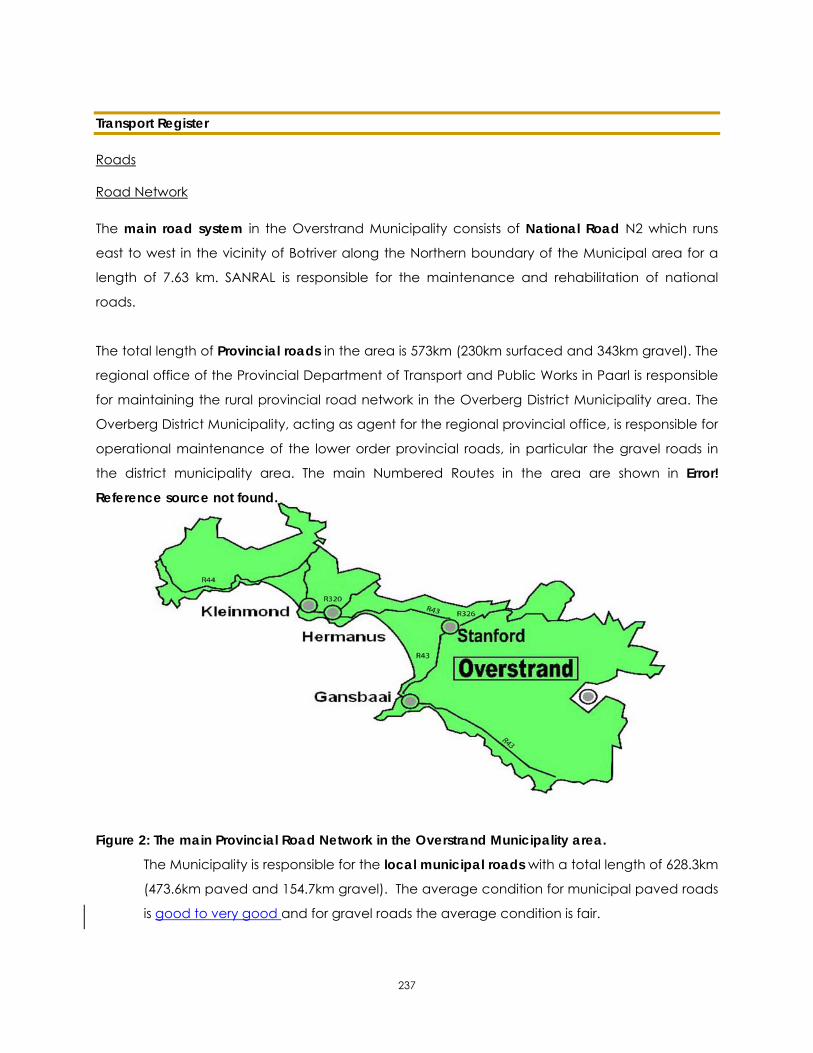
237
Transport Register
Roads
Road Network The main road system in the Overstrand Municipality consists of National Road N2 which runs
east to west in the vicinity of Botriver along the Northern boundary of the Municipal area for a
length of 7.63 km. SANRAL is responsible for the maintenance and rehabilitation of national
roads.
The total length of Provincial roads in the area is 573km (230km surfaced and 343km gravel). The
regional office of the Provincial Department of Transport and Public Works in Paarl is responsible
for maintaining the rural provincial road network in the Overberg District Municipality area. The
Overberg District Municipality, acting as agent for the regional provincial office, is responsible for
operational maintenance of the lower order provincial roads, in particular the gravel roads in
the district municipality area. The main Numbered Routes in the area are shown in Error!
Reference source not found.
Figure 2: The main Provincial Road Network in the Overstrand Municipality area.
The Municipality is responsible for the local municipal roads with a total length of 628.3km
(473.6km paved and 154.7km gravel). The average condition for municipal paved roads
is good to very good and for gravel roads the average condition is fair.
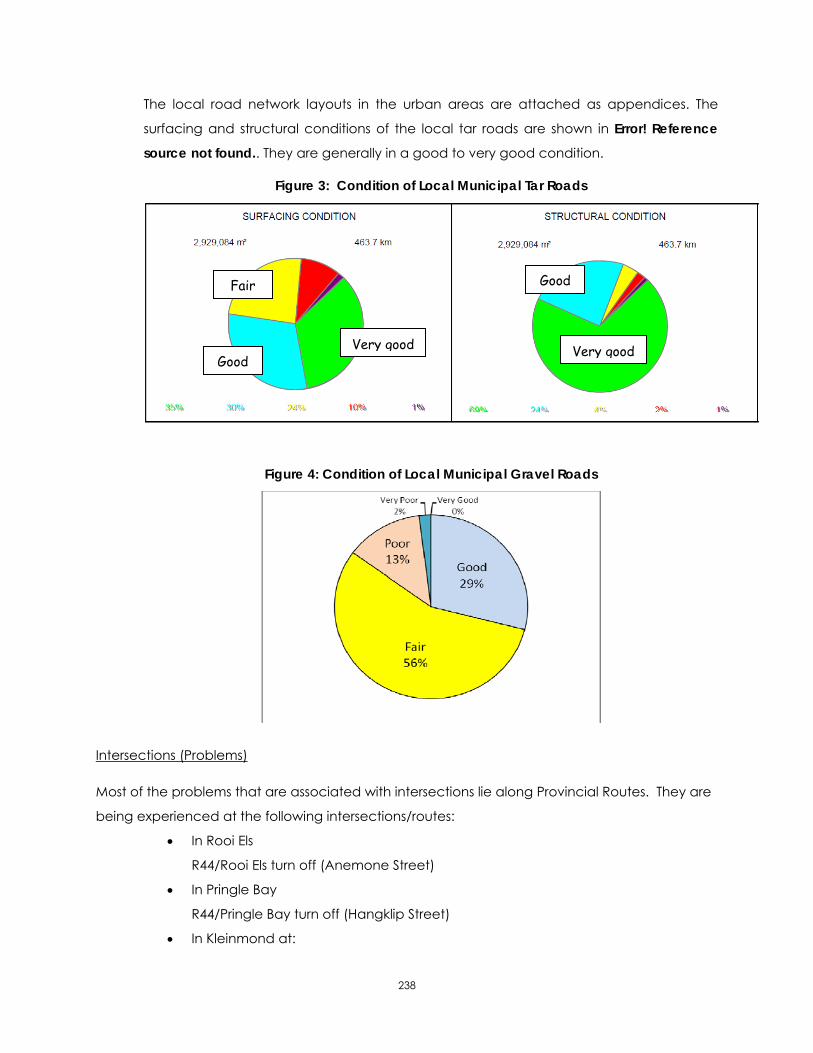
238
The local road network layouts in the urban areas are attached as appendices. The
surfacing and structural conditions of the local tar roads are shown in Error! Reference
source not found.. They are generally in a good to very good condition.
Figure 3: Condition of Local Municipal Tar Roads
Figure 4: Condition of Local Municipal Gravel Roads
Intersections (Problems) Most of the problems that are associated with intersections lie along Provincial Routes. They are
being experienced at the following intersections/routes:
In Rooi Els
R44/Rooi Els turn off (Anemone Street)
In Pringle Bay
R44/Pringle Bay turn off (Hangklip Street)
In Kleinmond at:
Very good Very good Good
Good Fair
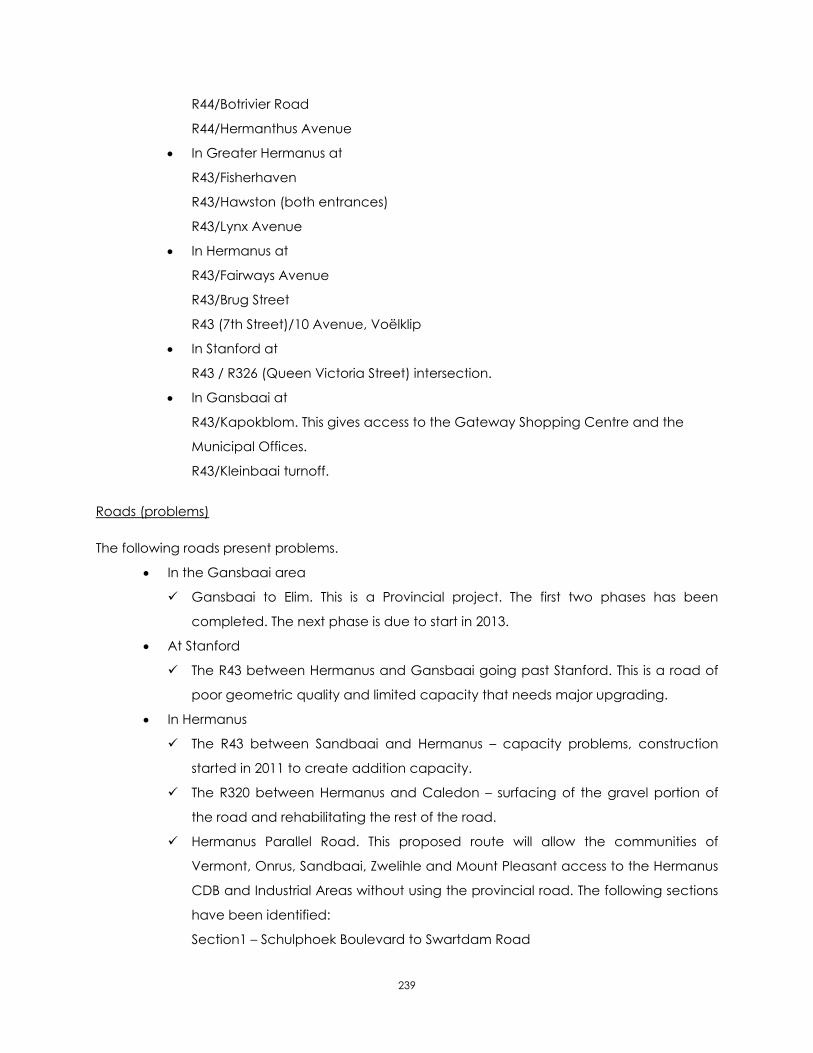
239
R44/Botrivier Road
R44/Hermanthus Avenue
In Greater Hermanus at
R43/Fisherhaven
R43/Hawston (both entrances)
R43/Lynx Avenue
In Hermanus at
R43/Fairways Avenue
R43/Brug Street
R43 (7th Street)/10 Avenue, Voëlklip
In Stanford at
R43 / R326 (Queen Victoria Street) intersection.
In Gansbaai at
R43/Kapokblom. This gives access to the Gateway Shopping Centre and the
Municipal Offices.
R43/Kleinbaai turnoff.
Roads (problems) The following roads present problems.
In the Gansbaai area
Gansbaai to Elim. This is a Provincial project. The first two phases has been
completed. The next phase is due to start in 2013.
At Stanford
The R43 between Hermanus and Gansbaai going past Stanford. This is a road of
poor geometric quality and limited capacity that needs major upgrading.
In Hermanus
The R43 between Sandbaai and Hermanus – capacity problems, construction
started in 2011 to create addition capacity.
The R320 between Hermanus and Caledon – surfacing of the gravel portion of
the road and rehabilitating the rest of the road.
Hermanus Parallel Road. This proposed route will allow the communities of
Vermont, Onrus, Sandbaai, Zwelihle and Mount Pleasant access to the Hermanus
CDB and Industrial Areas without using the provincial road. The following sections
have been identified:
Section1 – Schulphoek Boulevard to Swartdam Road

240
Section 2 – Swartdam Road to CBD
Section 3 - Schulphoek Boulevard
Section 4 – CBD to Zwelihle
Section 5 – Zwelihle to Sandbaai
Section 6 – Bergsig Street
Section 7 – Sandbaai commonage
Section 8 – Onrus River Bridge and Onrus access road
Hermanus by-pass road. This a long term Provincial project to create a by-pass
road around Hermanus.
Parking Parking is a major problem in the Hermanus area. A five year programme has been developed
to address this situation. Phase 1 of the programme starts with providing 650 parking bays at the
station site development. Further phases will include 300 parking bays at the Station Site Phase 2
development and 300 bays in a multi level parking garage in the CBD (behind Woolworths).
Traffic Volume The distribution of traffic on surfaced and unsurfaced roads is such that the majority of vehicle
kilometres are travelled on surfaced roads. The Western Cape Provincial Government maintains
a traffic count programme, with a combination of temporary and permanent count stations.
Traffic counts can be accessed on the following internet web site:
http://rnis.wcape.gov.za/pls/rnis/webreports.main.
Congestion has been noted along the R43 Provincial road in Greater Hermanus. It causes major problems during the morning and evening peak periods and all day during the tourist periods.
Other areas that have congestion problems during the tourist season are:
Gansbaai
Kleinmond
Stanford
Parking is a problem in all the CBD areas and at some tourist facilities (beaches, view points,
etc.).

241
Road Safety Accident statistics according to the 2007 Western Cape Provincial Road Traffic Accident report
are only available in a combined format for Cape Agulhas and Overstrand Local Municipalities.
These accident rates are shown in Error! Reference source not found.. Due to the fact that
transport and traffic related characteristics have been observed to be consistent and
continuous across the two combined municipal areas, it can be accepted that the combined
trend shown in Table 2 mirror the trend of the individual LM.
The trend indicates a relatively low rate in Cape Agulhas and Overstrand due to the rural nature
of the area. The report highlights a relatively high fatality rate in rural areas compared to
urbanised areas this is probably due to the high speeds on rural roads. The accident data is
tabulated according to existing traffic control areas which does not exactly map onto existing
municipal boundaries. There is a black spot at R43/Vermont Avenue intersection.
Table 2: Road accident statistics
Accidents People Fatal 28 Fatal 35 Injury 353 Serious 142 Damage 1782 Slight 469 No Injury 3339
Total 2163 Total 3985 (Source of data has Cape Agulhas and Overstrand accident records combined)
Freight There are two forms of freight transported in the area, namely those that are associated with
deliveries to shops, and those associated with agriculture. Due to many narrow roads in the
urban areas the movement of freight contributes greatly to the congestion in the area.
Maintenance There is a 5 year programme for the rehabilitation and maintenance of roads although this
programme is dependent on funding. Maintenance for local roads in the 2012 budget is
estimated at R35 million. A table reflecting the budget is attached in chapter 5.

242
Public Transport
The Overstrand Municipality has no subsidised public transport services and public transport is
provided by privately operated minibus taxis. A number of school bus contracts are in operation
in the region. Details of the operations are presented in the 2009 Current Public Transport
Record, which forms part of the Overberg District Municipality Integrated Transport Plan.
Operations in the towns of the area are discussed below.
Pringle Bay Pringle Bay is situated 10 km west of Betty’s Bay on the ocean front. There are no official taxi
ranks but three taxis operate within the town. Workers and children are picked up and dropped
off at the Pringle Bay Mini Market.
Betty’s Bay Betty’s Bay is approximately 10 km west of Kleinmond on the ocean front. Mooiuitsig is a
neighbourhood of Betty’s Bay. There are no taxi ranks in this area. People are transported along
the R44 where there are no formal taxi facilities. Private transportation is used to carry school
children to and from Kleinmond.
Kleinmond High School busses pick up children in Kleinmond and transport them to the schools in Hermanus
or Caledon. There are 6 legal taxis registered under Caledon Taxi Association and provided by
MK Tours and Koti Taxis. There are 4 taxis from Arrabella which pick up contract workers in the
Kleinmond area on a daily basis. There is only one taxi rank at Overhills residential area. It is
situated on the right side of the R44 in the direction of Betty’s Bay.
Fisherhaven Fisherhaven is situated approximately 15 km to the north-west of Hermanus on the ocean front.
There is no transport service for people living in Fisherhaven. Domestic workers have to use the
public transport on the R43 walking to and from home to the pick up points on the main road.
Hawston Hawston is situated 10 km to the west of Hermanus on the ocean front. A total of fifteen taxis
operate in Hawston. Hawston’s largest taxi rank is in Kerkstraat. The passengers are mainly
domestic workers who are transported to and from Hermanus and the towns in between. Four

243
taxis transport school children to and from the school in Hermanus. The Lusitania Bus Service in
Hermanus transports workers to and from Hermanus on a daily basis.
Vermont Vermont is an area situated to the west of Onrusrivier on the ocean front. It has a small
permanent population. There are no other public transport facilities apart from one school bus
which provides transport to Hermanus from the corner of Kandelaar and Petrel Streets.
Onrusrivier Onrusrivier is situated to the west of Sandbaai and is separated from Sandbaai by a small river
estuary. Four taxis from the Zwelihle and Mount Pleasant neighbourhoods operate within
Onrusrivier town, stopping in the Old Main Road. There are no public transport facilities in town
except on the R43 at Onrusrivier where there are two taxi ranks with shelters. The taxis stop on
different street corners in a random fashion.
Sandbaai Sandbaai is situated on the ocean front to the west of Mount Pleasant. It forms part of Greater
Hermanus. There is no official public transport in Sandbaai, but domestic and other workers are
transported by an unregistered mini bus taxi from the R43 opposite the Engen Filling Station on a
daily basis.
Mount Pleasant Mount Pleasant is situated directly next to Hermanus on the western side. The R43 Main Road
passes through the town. There are various taxi shelters in the area. They cater for services that
pass Mount Pleasant to the surrounding areas. Taxis from the surrounding towns pass through the
area and provide a transport service for the local people.
Hermanus Cata is the only taxi union in Hermanus and has 40 legal taxis in operation. There is no long
distance bus service. The private bus service of Hannekom Bus Service transports school children
in the area. Tony van Dyk and Hein Engelbrecht Bus Services transport workers to and from the
Hermanus area. Hermanus High School has three buses and three taxis that are used to transport
children to and from school. Hermanus has only one official taxi rank in Spence Street.

244
Stanford There are eight different taxi stops at various locations in town. A private bus contractor
transports children to school. There are four taxis that transport workers to Hermanus.
Gansbaai The main taxi rank in Gansbaai is situated in the Masakhane neighbourhood. There are two taxi
shelters that are no longer used. A private bus service is being used to transport school children
from Baardskeerdersbos through Buffelsjagsbaai, Pearly Beach and Uilkraalsmond to Gansbaai
and two private buses transport school children from Masakhane to schools in Hermanus.
Non Motorised Transport
Pedestrian and Bicycle There is a cycle lane in both directions along R43 (Main Road) from Voëlklip to Eastcliff and also
along the Onrus Main Road from Kidbrooke to Onrus CBD. There are no facilities on rural roads
for non motorised transport. People mainly use the road shoulders and this poses a danger as
speeds on these roads are relatively high.
Rail
There is a railway station in Hermanus but there are no railway lines in the area.
Air
Although there is not a public airport, helicopters land in the Hermanus area for law
enforcement purposes, medical emergencies, fire fighting and sea rescue services. It is
proposed that in the future these services will be consolidated into a single landing facility.
Harbours
There are two large harbours at Hermanus and Gansbaai. These are the responsibility of the
National Department of Transport and Public Works. There are two medium sized harbours at
Kleinmond and Kleinbaai and there are 20 slipways in the area. These facilities, as well as
providing facilities for whale watching and sightseeing, are an attraction in their own right with
museums and numerous restaurants.

245
Transport needs assessment
Assessment
An outcome of the LITP update process, which included a public consultation process, is a
needs assessment which should guide the development of projects, programmes and priorities.
A summary of the needs is reflected in Error! Reference source not found.. The detailed list of
projects is shown in Table 4.
Table 3: Analysis of Status Quo
Needs Strategy Project
Road improvement and maintenance
Development and proper maintenance of the road network Rehabilitation and
maintenance of urban streets
Need to provide non-motorised transport facilities
Effective and efficient planning for and management of funding for infrastructure development in the Overstrand Area
Need to provide adequate parking facilities
Provision of economical, safe and affordable public transport facilities
Promotion of public transport
Provide an Integrated Public Transport Network Rehabilitation and maintenance of public transport facilities
Management of public and tourist transport services
Planning and coordination of public transport service with Overberg Tourism: Tourism Development Strategy and Overstrand Destination Marketing Organisation
Provision of transport to basic facilities like police, hospital and schools
Effective and efficient planning for and management of funding for infrastructure development in the Overstrand Area
Public Participation
The Integrated Transport Plan (ITP) is a Sectoral Plan of the Integrated Development Plan (IDP).
The draft ITP will be tabled with the draft IDP at the Municipal Council meeting on 28 March
2012. Thereafter it will be advertised for 30 days for public comment. Comments received during
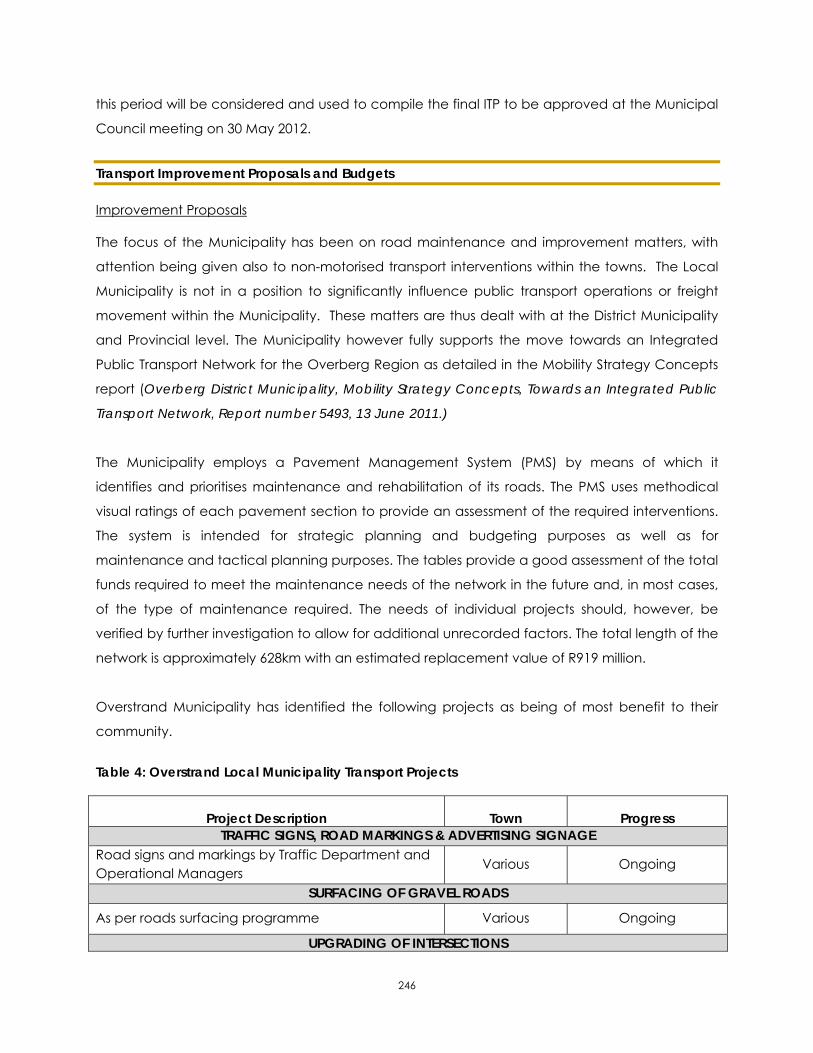
246
this period will be considered and used to compile the final ITP to be approved at the Municipal
Council meeting on 30 May 2012.
Transport Improvement Proposals and Budgets
Improvement Proposals
The focus of the Municipality has been on road maintenance and improvement matters, with
attention being given also to non-motorised transport interventions within the towns. The Local
Municipality is not in a position to significantly influence public transport operations or freight
movement within the Municipality. These matters are thus dealt with at the District Municipality
and Provincial level. The Municipality however fully supports the move towards an Integrated
Public Transport Network for the Overberg Region as detailed in the Mobility Strategy Concepts
report (Overberg District Municipality, Mobility Strategy Concepts, Towards an Integrated Public
Transport Network, Report number 5493, 13 June 2011.)
The Municipality employs a Pavement Management System (PMS) by means of which it
identifies and prioritises maintenance and rehabilitation of its roads. The PMS uses methodical
visual ratings of each pavement section to provide an assessment of the required interventions.
The system is intended for strategic planning and budgeting purposes as well as for
maintenance and tactical planning purposes. The tables provide a good assessment of the total
funds required to meet the maintenance needs of the network in the future and, in most cases,
of the type of maintenance required. The needs of individual projects should, however, be
verified by further investigation to allow for additional unrecorded factors. The total length of the
network is approximately 628km with an estimated replacement value of R919 million.
Overstrand Municipality has identified the following projects as being of most benefit to their
community.
Table 4: Overstrand Local Municipality Transport Projects
Project Description Town Progress TRAFFIC SIGNS, ROAD MARKINGS & ADVERTISING SIGNAGE
Road signs and markings by Traffic Department and Operational Managers
Various Ongoing
SURFACING OF GRAVEL ROADS
As per roads surfacing programme Various Ongoing
UPGRADING OF INTERSECTIONS

247
Project Description Town Progress R43/Vermont Ave. For safety reasons. Provincial project. Construction started August 2011 – May 2013.
Hermanus Under Construction
R43/Kidbrooke. For safety and capacity reasons. Provincial project. Construction started August 2011 – May 2013
Hermanus Under Construction
UPGRADING OF ROADS & STORMWATER SYSTEMS
Sandbaai upgrading gravel to surfaced roads Sandbaai Construction started. More phases to follow.
Hangklip upgrading gravel to surfaced roads Betty’s Bay and Pringle Bay
Construction started. More phases to follow.
Gansbaai upgrading gravel to surfaced roads Greater Gansbaai Area
Construction started. More phases to follow.
Maskahane main Storm water system via Proposed detention pond to the sea Masakhane
Planning phase. Construction will start
in Aug 2012
Master planning of Storm water systems in all towns All Gansbaai / Hermanus by 2015
PARKING
Hermanus Station site phase I, 650 parking bays Hermanus Station Completed
Hermanus Station site phase II, 300 parking bays Hermanus Station Under construction
Hermanus CBD, 300 bays in multi storey parking garage Hermanus Planning
FACILITIES FOR THE DISABLED Ensure that all road traffic signs along routes have a minimum clearance height of 2.1 metres
All Ongoing
Reserve adequate disabled parking bays in areas with high economic or tourist activity All Ongoing
Disabled friendly access to transport infrastructure All Ongoing
PUBLIC TRANSPORT
Redevelop Zwelihle Public Transport Facility Hermanus Completed
Redevelop Hermanus CBD Public Transport Facility Hermanus Planned for 2013/14
Shelters on Sandbaai/Hermanus Link Road Hermanus To be done with the road upgrade
TRAFFIC CALMING & PEDESTRIAN SAFETY
Experimental speed humps at stop streets Kleinmond Implemented, to be monitored
NON-MOTORISED TRANSPORT
Expansion of cycle lanes Hermanus First phase start in 2012
MAINTENANCE
As per Road Maintenance Programme All Ongoing
ROAD CONSTRUCTION

248
Project Description Town Progress C0527.04: Upgrade TR28/1 – Mount Pleasant/Hermanus Hermanus Under Construction
Gansbaai to Elim (DR 1205), provincial project. Road upgrade from gravel to surfaced standard Gansbaai Construction to start
2013
C0838.01 Upgrade DR1214 – Franskraal Gansbaai Construction to start in 2012
C0838.03 Regravel DR1264 – Kleinmond Kleinmond Construction to start in 2014
C0838.04: Upgrade MR269 – Hemel-en-Aarde (Upgrading and safely improvments to the MR269 Hemel-en-Aarde road)
Hermanus Construction Started February 2012
C0986: Reseal sections of TR02701 from i/s with TR02801 to Rooi Els Rooil-Els Construction to start in
2013
Hermanus Parallel Road Hermanus 2010 to 2016
Hermanus By-Pass. Provincial Project. Hermanus Long Term
Proposed Rehabilitation
The proposed rehabilitation programme of projects in priority order with a total estimated
costing of R22.25m is shown in Appendix D.
Proposed Maintenance
The proposed Maintenance Programme of projects in priority order with a total estimated cost of
R22.9m is shown in Appendix E. The table provides a good assessment of the total funds
required.
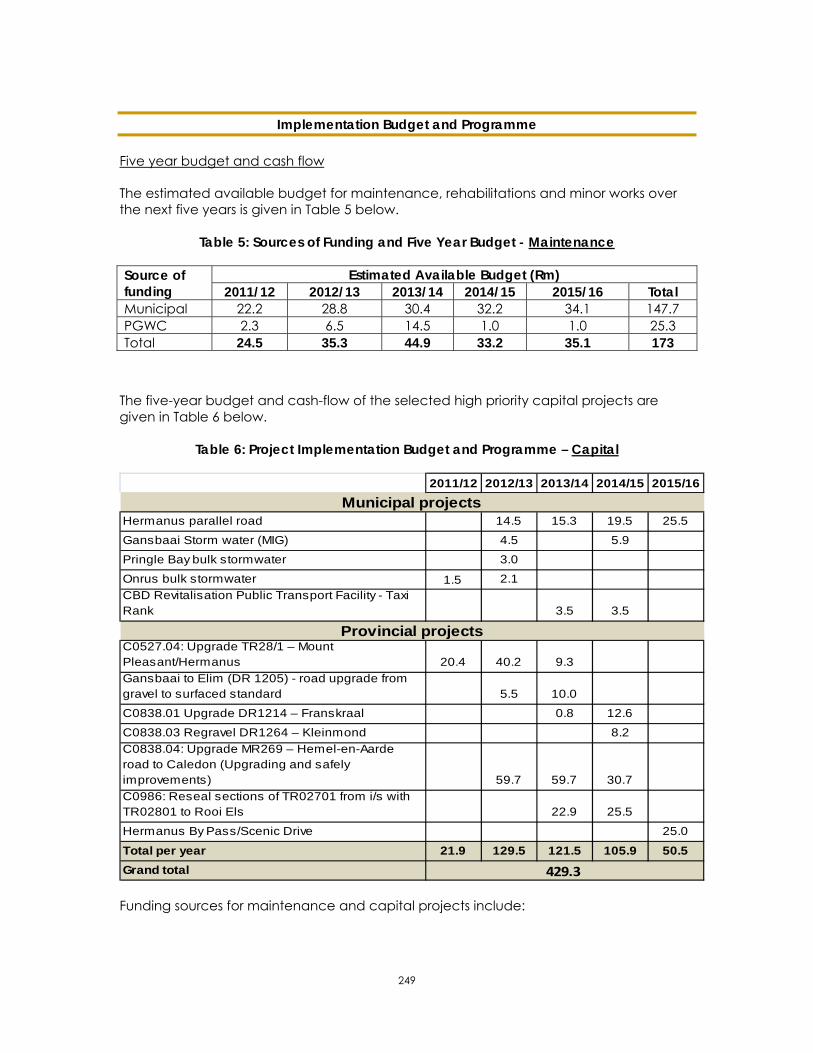
249
Implementation Budget and Programme
Five year budget and cash flow
The estimated available budget for maintenance, rehabilitations and minor works over the next five years is given in Table 5 below.
Table 5: Sources of Funding and Five Year Budget - Maintenance
Source of funding
Estimated Available Budget (Rm) 2011/12 2012/13 2013/14 2014/15 2015/16 Total
Municipal 22.2 28.8 30.4 32.2 34.1 147.7 PGWC 2.3 6.5 14.5 1.0 1.0 25.3 Total 24.5 35.3 44.9 33.2 35.1 173
The five-year budget and cash-flow of the selected high priority capital projects are given in Table 6 below.
Table 6: Project Implementation Budget and Programme – Capital
2011/12 2012/13 2013/14 2014/15 2015/16
Hermanus parallel road 14.5 15.3 19.5 25.5
Gansbaai Storm water (MIG) 4.5 5.9
Pringle Bay bulk stormwater 3.0
Onrus bulk stormwater 1.5 2.1
CBD Revitalisation Public Transport Facility - Taxi Rank 3.5 3.5
C0527.04: Upgrade TR28/1 – Mount Pleasant/Hermanus 20.4 40.2 9.3
Gansbaai to Elim (DR 1205) - road upgrade from gravel to surfaced standard 5.5 10.0
C0838.01 Upgrade DR1214 – Franskraal 0.8 12.6
C0838.03 Regravel DR1264 – Kleinmond 8.2
C0838.04: Upgrade MR269 – Hemel-en-Aarde road to Caledon (Upgrading and safely improvements) 59.7 59.7 30.7
C0986: Reseal sections of TR02701 from i/s with TR02801 to Rooi Els 22.9 25.5
Hermanus By Pass/Scenic Drive 25.0
Total per year 21.9 129.5 121.5 105.9 50.5
Grand total
Municipal projects
Provincial projects
429.3 Funding sources for maintenance and capital projects include:

250
Municipal budgets based on revenue generated within municipal area,
Municipal Infrastructure Grants,
Grants from the National Department of Transport,
Grants from the Provincial Department of Transport.
This report has not addressed the financial implications of individual projects, but has aimed to link costs to the overarching needs stipulated in this plan. Costs can only be linked to individual projects listed in IDP’s and transport plans after preliminary designs have been done, and this does not fall within the scope of the LITP.

251
Appendix A
Maps of Urban Areas in Overstrand

252
Kleinmond
Hermanus

253
Stanford
Gansbaai

254
Appendix B
PAVED ROAD MANAGEMENT SYSTEM REPORT

255
Appendix c
GRAVEL ROAD MANAGEMENT SYSTEM REPORT

256
Appendix D
DETAILED LIST OF REHABILITATION PRIORITIES

257
Appendix E
DETAILED LIST OF MAINTENANCE PRIORITIES

258
Annexure 4 SPATIAL DEVELOPMENT PLAN BACKGROUND In terms of the Systems Act every new Local Municipality must prepare its own Integrated Development Plan (IDP) to guide development planning and management for the next five year period. As the IDP is a legislative requirement, it has a legal status and therefore supersedes all other plans that guide development at local government level. The core components of an IDP are as follows: Analysis
A sectoral assessment of the existing level of development
Development Strategies The municipality’s vision The Council’s development priorities and objectives The Council’s development strategies
Projects Integration (sectoral plans)
A Spatial Development Framework A Disaster Management Plan Integrated Financial Plan Other Integrated Programmes Key performance indicators and performance targets
Approval Council adopts its IDP and links it to the Municipal budget.
EXECUTIVE SUMMARY The total review of the SDF is to be a credible document as defined by the Department of Environmental Affairs and Development Planning and all aspects is addressed as indicated in the BESP process. The document will encompass the Agenda 21 Principles applicable in local context. The strategic aspects to be addressed. Environmental Management Framework including critical biodiversity areas, conservation areas, coastal processes and human development. Housing Strategy (Human Settlement) Urban Development Rural Development Economic Trends Social Development Trends Environmental management plans including estuaries, nature reserves and biospheres Engineering and Transport aspects Spatial development All the abovementioned aspects will be addressed in the REVIEWED SDF to be completed during the 2012/2013 financial year. This executive summary briefly outlines the key elements of the Overstrand Spatial Development Framework
259
Due to the increasing development pressure and population growth in the Overstrand Municipal area, it has become necessary to undertake new and appropriate spatial planning for the entire area. Although a number of structure plans had been previously compiled for different areas in the Overstrand Municipal area, there is no overall co-ordinating spatial policy plan. These Structure Plans are outdated and therefore a total review of the SDF is underway. Urban Dynamics, Town and Regional Planning Consultants are in the process of compiling the spatial sectoral input, this being the Spatial Development Framework (SDF), as an integral input into the IDP process. This SDF review will comply into two phases. The specific terms of reference for Phase I being to provide a spatial development perspective/ analysis of the existing status quo of the municipal area as an integral spatial sectoral input into the ongoing IDP Process. The specific terms of reference for Phase II being to on the basis of the ongoing IDP process, compile an integrated review and consolidation of all existing planning into one consolidated SDF plan as a spatial sectoral input to the IDP that includes the following: A strategic review, and integration of all existing relevant spatial planning frameworks into one consolidated spatial development framework for the entire municipal area; The objective of the project therefore being largely to consolidate existing spatial policy and plans, undertaking a strategic review of policies based on existing data and the strategies/ priorities forthcoming from the IDP;
The project utilises existing available data bases, with the public consultation process being undertaken as an integral part of the IDP’s public consultation processes; This information would then be utilised on an integrated basis to compile a strategic Spatial Development Framework (SDF) for the total municipal area as per the directives of the National Department of Constitutional Development. Objective of the study A Spatial Development Framework (SDF) is one of the Sectoral Plans of an IDP. According to the Systems Act, the purpose of an SDF is to provide general direction to guide decision making on an ongoing basis, aiming at the creation of integrated, sustainable and habitable regions, cities, towns and residential areas. Included in a SDF are: A Spatial Analysis of the Municipality (trends and issues); Localised spatial development principles, and maps that indicate the spatial objectives and strategies that are sufficiently specific to inform land management and investment decisions. The incorporation of the mentioned policy and strategies into the SDF, and sectoral which are
- Overstrand Municipal Spatial Growth Management Strategy - Housing Strategy : 5 Year Plan - Environmental Management Framework - Coastal Setback Lines
The objective of the Spatial Development Framework is to, together with the involvement of communities and authorities create a spatially based policy framework whereby changes, needs and growth in the Overstrand Municipal area can be managed positively to the benefit of everyone. It focuses on how land is to be used within the broader context of protecting the value of the Overstrand Municipal area as a natural resource and enhancing the sub-region as a popular eco-tourist destination. In particular, it strives to improve the functioning of
260
the local urban and natural environmental systems. It further identifies local opportunities for future local urban development and conservation and make recommendations as to where and how development or conservation should be managed. In doing so, the plan makes policies for specific land portions and issues to assist decision making with regard to spatially related matters for the next 5 to 20 years. Approach, process and methodology followed
In the past, planning was seen as a technical exercise concerned with preparing a set of plans and supporting documentation for a future desired end state of urban development. This approach ignored the fact that planning is concerned with all of man’s activities and the changing systems in which these activities take place. It is now recognized that planning is a continual and incremental process linked to the dynamics of economics, social values, lifestyle patterns, technology, legislation and the availability and management of environmental resources. Acceptance of this fact demands that planning be viewed as a fundamentally cyclical process and not a single act. An important objective of the Integrated Development Planning process is to involve the communities and authorities of the area in the formulation of integrated multi-sectoral based policy guidelines, ensuring that future planning and development in the Overstrand Municipal Area is managed in a sustainable manner. “Sustainable development is generally defined as ‘development that meets the needs of the present generation without compromising the ability of future generations to meet their own needs’.” (Moss, 2000:33). Within this context sustainable development relates to balancing three interlinked factors, namely human well-being, economic efficiency and environmental integrity. The process includes extensive public participation ensuring that the document reflects the peoples’ input. Further to this, the SDF is underpinned by the concept of Bioregional Planning. This being a process whereby bio-diversity conservation is viewed as a prerequisite for sustainable development. In the review process of the SDF, this aspect will further be strengthening with the
compilation of an Environmental Management Framework. The latter will be part and parcel of the reviewed Integrated SDF. This plan, once finalised and approved, will not affect any existing property rights. Further to this, no guideline policy contained in this Plan, or any proposal regarding land uses, which may arise from it, creates any rights or exempts any person from his obligation under any other law. The Overstrand Spatial Development Framework has been prepared in accordance with the Integrated Development planning process, which identifies relevant concerns, problems, issues and opportunities through public participation, surveys and analysis. This process is aimed at identifying the opportunities inherent to the area and formulating multi-sectoral strategies as to how these can be utilised and expanded to address the area’s weaknesses.
The SDF process, which is a core component of the overarching IDP, involves the following three phases:
Phase I: Development Perspective (Spatial Analysis):
Collation of relevant information Identification of issues and opportunities
Phase II: Development Strategy (Spatial Development Principles):
Determination of the vision / mission for the area and the formulation of strategies and policies
Phase III: Implementation:
Prioritisation of projects, linked to budgets and implementation planning.
In order to achieve an effective implementation of the planning process, it is critical that the methodology of the process ensures that the product (policies / plans):
is focused on strategic issues; is action orientated; is integrated with other aspects of administration and environmental
261
management; is capable of implementation; reflects the need and opinions of stakeholders, and upholds the interests of the community as a whole.
To ensure an effective planning methodology, it was critical that the process encompassed two fundamentally interlinked processes, the one being a technical planning process (information collection and synthesis) and the other a participatory/consulting process (identifying problems and issues, scoping workshops, input from stakeholders, interest groups etc.). This methodology will ensure that the process and its products are focused on the relevant strategic issues. In order to ensure the realisation of a plan that is truly representative of community aspirations, the working process must acknowledge the importance of the interrelationship of these two elements (technical and consultative processes). The methodology agreed to, in consultation with the relevant councillors, officials, key stakeholders and consultants, ensured the balanced integration of these two processes. The methodology is based on the formulation of a representative IDP steering committee (Overstrand Municipality Advisory Forum - OMAF) and a technical working group for the whole municipal area. The process was informed by public scoping meetings undertaken in conjunction with the stakeholders of the specific area. These meetings highlighted problems and issues relating to the study area that in turn enables the planners and technical team to use this input to formulate policies and strategies. The public scoping meetings therefore formed a critical component in the formulation of an understanding of the study area. CONTEXT AND ANALYSIS (VOLUME I: DEVELOPMENT PERSPECTIVE) In order to obtain a perspective of the study area, a critical understanding of the Overstrand Municipal area was gleaned through a strategic analysis of the current:
policy context and role of the sub-region; existing concerns, issues and opportunities the natural, built and socio-economic characteristics of the area Volume I: Development Perspective provides the necessary baseline information to enable the informed compilation of a relevant policy framework. Planning Policy Context An understanding of existing planning policy, within which this planning initiative for the Overstrand Municipal area will take place, is important. It was considered critical to adopt a broader view and not to focus solely on the study area in isolation of the numerous social, economic and other spatially related inter-relationships that are taking place between the towns and their surrounding area. The review study therefore will strife to display an active consistency with the many part planning initiatives in the Overstrand and identified key policy issues. Thirty-three such studies were examined and integrated into the SDF. Due to the varying attributes of the different areas within the Overstrand Municipal area, thorough scoping exercises were undertaken in Rooi Els, Pringle Bay, Betty’s Bay, Hangklip/Kleinmond, Fisherhaven, Hawston, Greater Hermanus, Stanford, Greater Gansbaai, Pearly Beach, Baardskeerdersbos, Buffeljags and Viljoenshof. The advantage was that local area specific issues and concerns were identified for each area by the local residents, interested and affected parties and community based organisations. The information forthcoming from the scoping meetings was used to identify and focus the critical issues facing the study area. Analysis of Natural and Urban Environment Bio-physical environment

262
The Overstrand Municipal area will analyse in terms of its climate, topography, drainage, fauna, flora, the impact of the Cape Action Plan for the Environment (C.A.P.E) Project, soil types and agricultural potential, heritage resources and conservation areas, especially the Critical Biodiversity Areas. The urban environment This section will analyse of the current urban environment of the Overstrand Municipal area. The analysis will be based on the findings of detailed surveys and public meetings / workshops. It will focus on the areas of Rooi Els, Pringle Bay, Betty’s Bay, Hangklip/Kleinmond, Fisherhaven, Hawston, Greater Hermanus, Stanford, Greater Gansbaai, Pearly Beach, Baardskeerdersbos, Buffeljags and Viljoenshof. The Growth Management Study will play a critical role in the aspect of the study. POLICY FRAMEWORK (VOLUME II: SPATIAL DEVELOPMENT STRATEGY) The most important challenge facing the Overstrand Municipal area is to ensure that the local community and its urban managers have a realistic vision of the future and a strategy that will ensure a pragmatic approach to future opportunities and challenges. In recognition of this, the point of departure of the policy formulation process has been to review what the interested and affected parties have said about the problems and issues relating to the study area. On the basis of the analysis and through an appraisal of the identified issues and opportunities, a vision, goals and objectives were articulated which were used to underpin the formulation of a policy framework, policy proposals and action programmes / implementation priorities which would ultimately inform decision-making. In order to achieve this vision for the Overstrand Municipal area, the following goals for this planning initiative were identified: To implement an effective management system for the protection of biological diversity and ecosystems through the co-operation of all concerned;
To develop and maintain a strong local economic base in rural areas, through the promotion of non-consumptive tourism and the role of agriculture in the municipal economy; To protect and conserve the heritage resources of the area; To provide an environmentally and economically sustainable bulk service infrastructure and road transport network; To address the social needs and expectations of all sections of the community; To promote the conservation and sustainable use of natural resources in the Overstrand Municipality, and To ensure that ongoing pressure and its spatial implications are managed in a sustainable manner that protects the unique character of the existing cultural landscape and the place-specific character and form of the existing settlement pattern. POLICY FORMULATION AND PROPOSALS (VOLUME II: SPATIAL DEVELOPMENT STRATEGY) The objective of this section of the study was to, on a strategic basis, define Spatial Planning Categories in terms of the principles of Bio-regional Planning and formulates spatial policies that will define how the identified IDP related goals and objectives are to be met. To meet the identified goals and objectives, a policy framework was compiled which will form the context within which the Overstrand Municipal area is to be managed. A policy framework and action area proposals were compiled for the following nine strategic areas of concern: Environment Framework Nature Conservation / Bio-regional Planning Spatial Management Agricultural Land Use Rural Land Use Development Pattern / Spatial Management Urban Land Use Management Transportation and Traffic

263
Bulk Service Infrastructure Heritage / Landscape Conservation Housing Strategy Spatial Implication and proposals Based on the aforegoing policies, area specific spatial proposals were compiled for each of the following areas:
Rooi Els Pringle Bay Betty’s Bay Hangklip/Kleinmond Fisherhaven Hawston Greater Hermanus Stanford Greater Gansbaai Pearly Beach Baardskeerdersbos Buffeljags Viljoenshof
Further to the above, proposals will also compiled for:
Conservation areas Agricultural areas Industrial areas Coastal Areas
DEVELOPMENT AND UPDATING OF THE SDF This Overstrand Municipal Spatial Development Plan should provide status quo information on the current land use, transport routes, location of resources, data from relevant planning initiatives, SPC’s, identified goals and objectives as well as a depiction of policies and strategies with spatial implications; It identifies development constraints and opportunities; It provide a spatial policy framework at a Municipal wide level of
planning; It propose desired spatial growth patterns illustrated on maps, and It identify the location of IDP strategies and projects illustrated on maps It should further be noted that every effort has been made to ensure that this SDF is compiled in accordance with the strategies and objectives as reflected in the SDF’s and the IDP’s of National, Provincial, District and Local municipalities. It is also consistent with applicable national, provincial legislation on environmental management, agriculture, water and gives effect to national and provincial plans and planning legislation. It furthermore includes up-to date planning concepts regarding socio-economic development, bio-regional planning and sustainable development. The Overstrand Municipal SDF complies with the principles of equality, efficiency, integration, environmental sustainability, dignified spatial environments and fair and good governance. This document is a dynamic document, which in terms of legislation has to be reviewed annually. Currently the Municipality is undertaking several sectoral plans, which would be incorporated into the SDF. Council is also part of the Provincial’s Built Environment Support Program. The program sets out to establish and refine Strategic Housing Framework and to further refine the Overstrand Spatial Development Framework. The four Sectoral Plans are the following:
264
Strandveld Agricultural Plan This plan was compiled by Nietvoorbij Agricultural reserved that in conjunction with the University of Stellenbosch. The outset of this study was the following:
- To investigate the soil potential of the agricultural area - To identify alternative crop possibilities - To investigate the tourism potential of agricultural land with
low soil potential Currently the comments of the Department of Agriculture and Department of Environmental Affairs and Development Planning are sought. As soon as this are received the report to be tabled before Council for final approval. Kleinriver and Botriver Estuary Management Plan These studies were undertaken in conjunction with Cape Nature, and are in final stages of refinement. As soon as these are finalized, it will be submitted for approval and implementation. Overstrand Growth Management Strategy Forthcoming from the PSDF, the IDP and the Overstrand SDF critical spatial issues relating to the future municipal growth and development have been identified which involves principles regarding the containment of: Urban Sprawl relative to the urban edge designations for the various towns; The need for the intensification of development and increase in densities ; The improvement of social and economic integration of existing urban areas.
Urban Dynamics Town and Regional Planners in association with ACG Architects and Nicolas Baumann Heritage Consultants have completed a Growth Management Strategy for all towns and settlements within the Overstrand municipal area. The local municipal engineers (Water, Sewerage, Electrical, Solid Waste and Roads) have also integrally been involved in the compilation of this growth management strategy. The overall objective of such a Densification Strategy, as part of the municipality’s overall Growth Management plan, will be to provide a set of appropriate area specific policy guidelines which can be used by the Council to proactively direct and manage the implementation of urban densification / growth measures in a manner that is sensitive to the character of the various towns and settlements. Such a Growth Management Densification Strategy plan will inter alia: Protect sensitive natural and heritage environments and resources within and outside the urban edge; Promote a more compact, denser, efficient and environmentally sustainable urban form; Rationalise the supply of bulk infrastructure and service capacity to ensure that the bulk capacity is provided in the urban areas where growth and development is considered desirable. The implementation of a densification strategy/growth management plan is recognized as being essential in meeting the challenges facing the Overstrand Municipal Area and will contribute to the Economic Efficiency, Human Wellbeing and Environmental Integrity of the area. The successful implementation thereof will give measurable results and afford a new sense of direction in terms of spatial and infrastructural planning within the Overstrand Municipal area. The methodology/process followed to compile the study included the following distinctive steps: A Contextual Analysis of the existing features/elements that determines the function, character, growth and development pattern of each of

265
the towns and settlements. The product of this phase is annotated plans, sketches, photographs and associated text clearly setting out the findings of this contextual analysis, The Synthesis phase where the impact of all the above elements are combined to provide a clear understanding of how the current physical and functional features (urban and natural) respond towards each other. This synthesis ultimately provides a clear and robust urban assessment in a legible user friendly annotated plan and text format which forms the basis of the next phase. Strategy and Plan Phase: In this phase urban design proposals/interventions are made per demarcated geographical area to improve the efficiency (social, economic, convenience) of the urban environs by using densification intervention and housing typologies that are sensitive to the existing character of the various specific areas and taking into account the civil service and community facility requirements for each area. The deliverables of this Overstrand Growth Management Strategy initiative is a comprehensive document which leads the densification concept through an overall set of densification principles and guidelines to facilitate improved wellbeing, environmental integrity and economic efficiency. At local planning unit level a set of text guidelines and annotated spatial plans which demonstrates all interventions including civil services and community facilities for the overall area per planning unit, on block/street scale, site planning scale and building scale is provided. Furthermore, it will provide urban design guidelines and representative examples of how the interventions should be structured / informed by more specific guidelines with regards to built form options and urban design criteria. In the table below specific areas of interventions per town/settlement are inter alia indicated. Please note that these specific interventions forms part of a more comprehensive growth management strategy per town/settlement and should be read in context thereof. Town/Settlement Area Specific Densification Interventions Rooi-Els No specific areas of densification.
Pringle Bay Area in close vicinity of the existing business node.
Betty’s Bay No specific areas of densification. Kleinmond The harbour Road corridor, Intensification of
existing residential areas, The Heuningklip north area.
Fisherhaven The vacant areas south and east of the settlement.
Hawston The vacant areas north west and east of the settlement.
Hermaus West area (Vermont, Onrus)
Various infill areas and intensification especially along collector roads, The Habonim area.
Hermanus Central Various infill areas especially along collector roads, Infill areas in vicinity of Zwelihle.
Hermanus East Intensification along main road, Vacant section east of Voëlklip.
Stanford Vacant land southeast of Stanford. De Kelders Vacant portions of land between current town
and R43 Provincial Road. Gansbaai Vacant portions surrounding town, Harbour
area. Kleinbaai area Vacant portions north and west of current town. Pearly Beach Area between current Eluxolweni and Pearly
Beach area. Further input will still be gained on the strategy through a planned Public Consultation process. The proposals will be made public using posters and presentations to which all residents of the respective areas will have the opportunity to comment on these policy and intervention proposals. Only in the final phase, the plans will be revised/amended/refined, based on the stakeholders’ input, where after it will be finalised and packaged for final submission to Council for their final approval. The Overstrand Growth Management Strategy has been approved by Council at its meeting held in January 2011. The Growth Management Strategy as approved forms a part of the Overstrand SDF and must be

266
read in conjunction with the SDF. Where the SDF and the Growth Management Strategy differs the Growth Management Strategy would prevail. Built Environment Support Program (BESP) Overstrand Municipality in conjunction with the Provincial Administration is undertaking two studies eg. Housing Settlement Plan and Updating and Amendment of the Overstrand Spatial Development Framework. These two projects have been completed during 2010. The BESP was brought to a closure during February 2011. However, the intended goals were not reached and the final product delivered is not in accordance with the Memorandum of Agreement and therefore could not be adopted. The BESP has highlighted problem areas in the 2006 SDF, which will be adhered in the review. CONCLUSION The integration of all documents and sectoral plans need to be done in order to create an integrated and user friendly SDF. It is also foreseen that delegation would be sought in terms of Environmental and Planning decision making.

Final Integrated Development Plan 2012/13
267
ANNEXURE 5 ENVIRONMENTAL MANAGEMENT SERVICES (EMS) Vision The Environmental Management Services Section strives towards sustainable environmental management by means of environmental best practice. Accordingly, the section strives to coordinate, plan and manage all human activities in a defined environmental system to accommodate the broadest possible range of sustainable short and long term environmental, social and economic development objectives. Mission The mission of the section is to promote the use of sound environmental management principles to ensure a healthy environment within the Overstrand Municipality. These principles constitute:
A sustainable balance between Environmental, Social and Economic Development;
Compliance with Legislative Requirements; The Precautionary Principle; The Polluter Pays Principle; Continual Improvement; Shared responsibility towards Sustainable Development.
The EMS Section has used the principles of Environmental Management to set the following objectives:
To advise on environmental considerations in development planning;
To ensure that developmental activities respect and promote human health, safety and well being;
To co-operate with other departments that pollution prevention and waste management measures are practised throughout the Municipality;
To promote the deployment of appropriate measures to guard against land degradation and biodiversity loss;
To promote and regulate the responsible and effective utilization of natural resources;
To conserve the Overstrand’s natural heritage; To adopt appropriate management, environmental
governance, auditing and reporting systems; To promote public participation, education and
empowerment of communities.
The Section has defined the following major goals to be achieved and tasks to be completed within the current IDP cycle:
Evaluate and comment on the environmental
sustainability of Development Schemes as proposed by the various role players. This includes comments on Development Proposals, Town Planning Applications, Building Plans and Infrastructure projects. Attention should be directed at strategies to promote economic growth without it being detrimental to the environment.
Development of an Environmental Management Framework in order to manage and monitor conservation threats and matters of environmental concern.
Development and Implementation of Reserve Management Plans to effectively manage and promote Municipal Nature Reserves and Municipal Open Spaces.
Final Integrated Development Plan 2012/13
268
Develop, implement and monitor a corporate Environmental Management System (EMS) that could ultimately be extended into an ISO 14001 accredited system. The EMS will identify environmental concerns and help orientate the various management plans within different municipal departments towards sustainable economic growth and protection of the natural environment within the guidelines of government.
Advise the Municipal Council and Municipal officials on Environmental matters.
Facilitate public participation in environmental programmes.
Facilitate & co-ordinate environmental education programmes in collaboration with Environmental Education NGO’s as necessary;
Liaise and engage with stakeholders concerning environmental matters.
The revision of the Plot Clearing Policy in coordination with the relevant role-players to ensure the development of an integrated process that is acceptable to the environmental priorities and biodiversity conservation.
The development of a Baboon Protocol for the Overstrand area, in collaboration with other conservation authorities in order to improve the understanding and management of the of the human-baboon conflict in the area.
The development and implementation of an Integrated Invasive Alien Clearing Plan in order to prevent biodiversity loss and minimise fire frequency and intensity in the Overstrand area.
To enhance the value of the natural and rural environment and green spaces for the people of the Overstrand region. For social, economic and environmental reasons it is critical that Overstrand’s
valuable natural resources and green spaces are defined, protected, enhanced and that access to them is improved. The sustainability of these natural resources also depends on the protection and enhancement of natural ecosystems.
To develop more “people places” in the Overstrand area for people to enjoy. Some of the current destination places are of high conservation, cultural and heritage value e.g. Fernkloof Nature Reserve; Stony Point; Milkwood Forests and the Klein and Botriver Estuaries. Other attractive public places and activities include; The Coastal Paths; Grootbos Private Nature Reserve; Vogelgat Nature Reserve and Kogelberg Biosfeer Reserve. These attractive destinations need to be consolidated into a network of destination places and access to them need to be improved.
To monitor and support the conservation efforts of estuaries by means of active involvement with the establishment of Estuary Management Plans and provision of administrative support to the Estuary Coordinator and liaison with other relevant stakeholders.
Coordination with DEA&P and other role-players to develop and implement a Setback-line strategy for the Overberg Coastal Region.
As a coastal region the Overstrand is particularly vulnerable to the projected impacts of sea level rise and an increase in extreme weather and storms. The unpredictable effects of climate change, and the potential for dramatic changes to the natural environment in the future, makes it essential to plan for possibility of water scarcity, extreme weather events, sea level rise, and other impacts, well in advance of these changes taking place.
Final Integrated Development Plan 2012/13
269
In addition to the above, this section will keep up to date with the latest information regarding Global Warming and the expected impacts on our area. At present the following impacts are expected:
Rising sea level - 30cm over the next 50 years, with associated impacts along the coast,
Less rainfall events resulting in a dryer climate, and More intense rainfall events resulting in more flooding
and stormwater management problems. The section will advise Council on mitigation and adaptation measures related to global warming. The section will also participate in programmes and campaigns related to Global Warming presented by stakeholders and other organisations. One such a programme is the “Making cities resilient” campaign initiated by the United Nations International Strategy for Disaster Reduction (UN/ISDR). The campaign flows from the “Hyogo Framework for Action 2005-2015: Building the resilience of communities and nations to disasters.” One of the elements of the programme is “Adaptation to Climate Change by Reducing Disaster Risk”. The Municipality has been involved with this programme since 2008 and participated in the building of the world wide “Local Government Alliance for Disaster Risk Reduction (LGA/DRR)”. Invasive Alien Clearing Strategy: Alien invasive species pose the major threat to the exceptional indigenous biodiversity in the Overstrand. While the Municipality is deeply involved in Working for Water initiatives on invasive alien control, it also has a dedicated budget of its
own for control on municipal nature reserves and public open spaces. NGO initiatives such as those of botanical societies with their hack groups and the targeted contributions of the Overstrand Conservation Foundation provides combined effort to the management and control of invasive alien plants in the area. The Working for Water Programme has brought a further R6 million funding opportunity for invasive alien clearing and biodiversity security in the area for the 2011/2012 financial year alone. Protected Area Management: The extension of protected areas in collaboration with conservation groups is promoted by the municipality. Conservation-worthy municipal land has been, and will continue to be transferred to agencies such as the National Biodiversity Institute to provide better ecological gradients promoting ecosystem integrally. The promotion of Marine Protected Areas, especially in the buffer areas of the Kogelberg biosphere is one such area receiving attention. While supporting the initiatives of NGO’s and other levels of government the Municipality cannot accept a primary responsibility for conservation if other levels of Government cannot service them. While environmental bodies are organized under an umbrella organization better integrated approaches to issues and a more pragmatic approach to the integration of environmental needs and development demands of economic and social progress are needed. A dialogue between environmental groups and those involved in

Final Integrated Development Plan 2012/13
270
development initiatives is essential if outcomes acceptable to all sectors of the community are arrived at. Special Projects / Partnerships: The municipality has identified partnership programmes with high potential impact on provision of job opportunities, small enterprise development and skills development. This is meant to capitalise on growth, focus on drivers and linking skills transfer with what underpins the growth rate in the area. Extended Public Works Programme (EPWP) The EPWP is one of government’s short-to-medium term programmes aimed at alleviating and reducing unemployment. This aim can only be achieved through the provision of work opportunities coupled with training. Opportunities for implementing the EPWP have been identified in the infrastructure, environmental, social and economic sector. In the environmental sector the emphasis is on creating additional work opportunities through the introduction of labour-intensive practices through the Working on the Coast initiative. The Department of Environmental Affairs has therefore through their commitment to social responsibility projects, committed funding of R11.2 million phased in during the 2011/12 – 2013/14 MTEF cycle for the Overstrand. Municipality. The Municipality is committed to support this initiative by government.
Annexure 6
DISASTER MANAGEMENT
1. LEGAL FRAME WORK
1.1 The Disaster Management Act (sec 53) stipulates that each Municipality must prepare a Disaster Management Plan/Framework for its area according to the circumstances prevailing in the area, after consulting with the District Municipality and other Local Municipalities within the area of the district Municipality.
1.2 The formulation and implementation of a Disaster Management Plan forms part of the IDP process for the Overstrand Municipality. The purpose of this Disaster Management Plan [Disaster Management Act 57 Sect 53 (2) ] is to ensure that there is Disaster Management at all times, enhancing the Overstrand’s Municipality’s ability to prevent and to deal with disasters and to avoid development that is considered high risk in terms of the potential for disasters.
1.3 Disaster Management Plan for any Municipality must: a. Form an integral part of the Municipality’s IDP
(chapter 3 of 2010/2011); b. Anticipate the types of disaster that are likely to
occur in the municipal area as well as their possible effects;
1.4 Place emphasis on measures that reduce the vulnerability of disaster-prone areas, communities and households;
1.5 Seek to develop a system of incentives that will promote disaster management in the Municipality; a. Identify the areas, communities and households
that are at risk; b. Take into account indigenous knowledge relating
to disaster management;
Final Integrated Development Plan 2012/13
271
c. Promote disaster management research; d. Identify and address weaknesses in the capacity
to deal with possible disasters; e. Provide for approximate prevention and
mitigation strategies; f. Facilitate maximum emergency preparedness;
and g. Contain contingency plans and emergency
procedures in the event of disaster, providing for: i. The allocation of responsibilities to the
various role-players and co-ordination in the execution of those responsibilities;
ii. Prompt disaster response and relief; iii. Procurement of essential goods, equipment
and services; iv. Establishment of strategic communication
links; and v. Dissemination of information.
1.6 The Overstrand Municipal must establish and implement a policy framework for Disaster Management in the municipality which is aimed at : a. risk identification b. risk assessment c. risk response d. risk response development
1.7 Overstrand Disaster Management framework will be – (a) Consistent with the provisions of the Disaster
Management Act 2002; (b) Consistent with the disaster management policy
framework of the Overberg District, Provincial Government and National Government.
1.8 It should be noted that Disaster Management is not only reactive, but also involves actions aimed at preventing disasters, or mitigating the impact of disasters. Different line functions and departments must
contribute in varying degrees to Disaster Management in the various phases of the Disaster Management.
1.9 Disaster management plans cover the whole disaster management area, and must address actions before, during and after disasters.
1.10 Disaster management plans are compiled on the basis of a generic plan including standard operating procedures and best practice, and then expanded with risk-specific plans that address disaster management for special circumstances where the generic plan needs to be adapted.
2. INTRODUCTION
2.1 Disaster Management Act 57 0f 2002 is a legal
instrument that provides coherent and transparent information with an aim of reducing, minimizing and preventing disaster through risk assessment and mitigation strategies. This can be achieved by excellent communication and acknowledgement expertise of different services, access of funds and access to sufficient resources.
2.2 Priority will be given to development measures that reduce the vulnerability of disaster prone areas; communities, agriculture and infrastructure within each line function.
2.3 Disaster Management is also responsible to promote disaster management training and community awareness to reduce vulnerability to communities most at risk.
3. PURPOSE
3.1 To establish a disaster management strategy guiding
the disaster managing plans of the various departments and roll players. It is critical that an
Final Integrated Development Plan 2012/13
272
efficient and effective disaster response can be mobilized. Response is a collective responsibility. In a major emergency or disaster, people need to know what to do, who will do it and how it will be done.
3.2 The ability to respond quickly and effectively will depend on good preparation. If a response plan has been developed thoughtfully, included the community’s views, been communicated clearly and has been based on a realistic availability of resources, it is likely to succeed.
3.3 Emergency Preparedness: This plan is designed to establish the framework for implementation of the provisions of the future.
3.4 The purpose of this plan is to outline policy and procedures for both the pro-active disaster prevention and the reactive disaster response and mitigation phases of Disaster Management.
3.5 It is intended to facilitate multi-agency & multi-jurisdictional coordination in both pro-active and reactive programmes.
4. ROLL OF DISASTER MANAGEMENT UNIT
4.1 To Compile and adopt a disaster management policy 4.2 �Compile and maintain disaster management plans/
framework 4.3 The Municipal Manager may establish a disaster
management committee 4.4 Establish community partnerships that combine the
access and attributes of everyone with a stake in disaster resistance
5. RISK IDENTIFICATION (MAN MADE & NATURAL)
5.1 Fires (see attached annexure A) 5.2 Floods (see attached annexure B)
5.3 Xenophobia (see attached annexure C)
6. RISK REDUCTION 6.1 Risk awareness programs 6.2 Risk prevention programs 6.3 Formal and informal training wrt emergency services
and disaster relief 6.4 Research in formal and informal settlements wrt
location, growth and development 6.5 Upgrading of vehicles, equipment and protective
clothing.
7. INTEGRATED DEVELOPMENT PLAN
The 2 diagrams below illustrate how the Corporate Disaster Plan and the IDP interact.
Section 53, Section 26, Disaster Management Act Municipal Systems Act
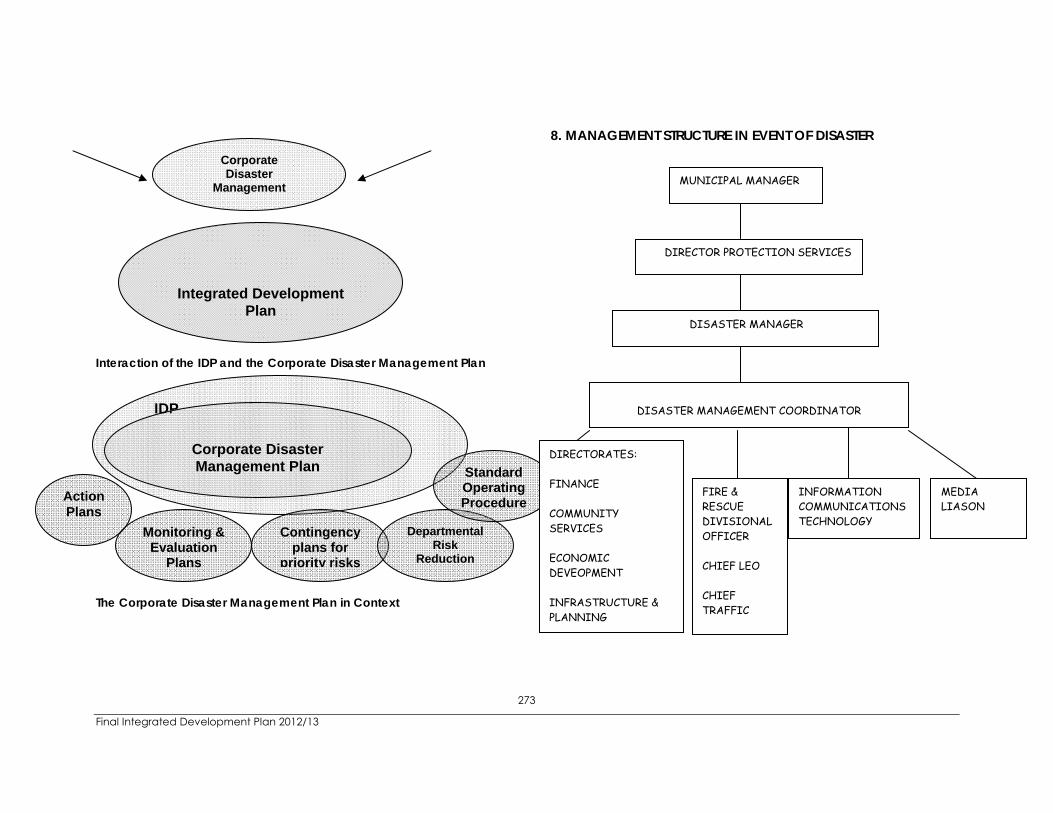
Final Integrated Development Plan 2012/13
273
Interaction of the IDP and the Corporate Disaster Management Plan The Corporate Disaster Management Plan in Context
8. MANAGEMENT STRUCTURE IN EVENT OF DISASTER
Integrated Development Plan
Corporate Disaster
Management
IDP
Corporate Disaster Management Plan
Contingency plans for
priority risks
Monitoring & Evaluation
Plans
Action Plans
Departmental Risk
Reduction
Standard Operating Procedure
MUNICIPAL MANAGER
DIRECTOR PROTECTION SERVICES
DISASTER MANAGER
FIRE & RESCUE DIVISIONAL OFFICER CHIEF LEO CHIEF TRAFFIC
INFORMATION COMMUNICATIONS TECHNOLOGY
MEDIA LIASON
DISASTER MANAGEMENT COORDINATOR
DIRECTORATES: FINANCE COMMUNITY SERVICES ECONOMIC DEVEOPMENT INFRASTRUCTURE & PLANNING

Final Integrated Development Plan 2012/13
274
9. RESPONSIBILITIES
9.1 MUNICIPAL MANAGER: Must ensure that disaster plans are compiled and maintained in his/her service, with specific reference to the following: a. Compilation of pro-active departmental disaster
management programmes to support risk reduction or elimination.
b. Compilation of reactive departmental disaster management plan to ensure service continuity during emergency/disaster situations.
9.2 The Municipal Manager as head of the administration is responsible and accountable for tasks and functions as provided for in Section 55 of the Systems Act, other functions/tasks as provided for in legislation, as well as functions delegated by the Executive Mayor and Council.
9.3 THE JOC (JOINED OPERATIONS CENTRE) will be responsible to assess, evaluate and co-ordinate all actions in all the phases of the incident. Each line function will be responsible for the implementation of its own departmental disaster plan but the JOC will ensure co-ordination and support between departments and external bodies and will consist of the following members:
9.4 DIRECTOR PROTECTION SERVICES:
a. Compilation of pro-active divisional disaster
management programmes to support risk reduction or elimination.
b. Compilation of reactive divisional disaster management plans to ensure service continuation during emergency/disaster situations.
c. Protecting the safety of emergency responders, evacuated areas, affected communities and damaged or threatened property,
d. Controlling and dispersing crowds, e. Controlling access to and egress from emergency
area(s), f. Protecting private and public property, g. Managing and controlling traffic in and around
emergency area(s) on evacuation routes and on emergency vehicle routes,
h. Identifying persons/organizations to contribute to post-emergency reports/debriefings,
i. Protecting essential service facilities.
9.5 CHIEF FIRE SERVICES/ HEAD DISASTER MANAGEMENT:
a. He/she must ensure that disaster plans are compiled and maintained in his/her division, with specific reference to the following; i. Compilation of pro-active divisional disaster
management programmes to support risk reduction or elimination.
ii. Compilation of reactive divisional disaster management plans to ensure service continuation during emergency/disaster situations. Coordinating response and mutual aid agreements with adjacent municipalities
iv Protecting health and safety of emergency responders,
vi Identifying persons/organizations to contribute to post-emergency reports/debriefings,
vii. Supplying resources for disaster management purposes,

Final Integrated Development Plan 2012/13
275
viii. Establishing and maintaining a resources database
9.6 DISASTER MANAGEMENT COORDINATOR:
a. Establish and maintain required telecommunications links
b. Identify available resources for disaster management purposes,
c. Establish and maintain a resources database. d. Ensure effective media liaison. e. Coordinate all communication to and from
incident. f. Compilation of pro-active departmental disaster
management programmes to support risk reduction or elimination.
g. Rendering support and advice throughout all phases of disaster management planning activities,
h. Disaster Management Plan forms an integral part of the IDP,
9.7 DIRECTOR FINANCE: Must ensure that disaster plans are
compiled and maintained in his/her service, with specific reference to the following: a. Compilation of pro-active departmental disaster
management programmes to support risk reduction or elimination.
b. Compilation of reactive departmental disaster management plan to ensure service continuity during emergency/disaster situations.
c. Facilitating emergency procurement d. Initiating and facilitating efforts to make funds
available for disaster management in the municipal area.
e. Documenting information for potential municipal insurance claim.
f. Supplying resources for disaster management purposes as requested by the Disaster Management Unit.
9.8 DIRECTOR COMMUNITY SERVICES: Must ensure that
disaster plans are compiled and maintained in his/her service, with specific reference to the following: a. Compilation of pro-active departmental disaster
management programmes to support risk reduction or elimination.
b. Compilation of reactive departmental disaster management plan to ensure service continuity during emergency/disaster situations.
c. Maintain flood warning systems throughout its area.
d. Providing alternate water supplies e. Controlling the consumption of public water
supply. f. Supplying resources for disaster management
purpose as requested by the Disaster Management Unit.
9.9 DIRECTOR ECONOMIC DEVELOPMENT: Must ensure that
disaster plans are compiled and maintained in his/her service, with specific reference to the following: a. Compilation of pro-active departmental disaster
management programmes to support risk reduction or elimination.
b. Compilation of reactive departmental disaster management plan to ensure service continuity during emergency/disaster situations.

Final Integrated Development Plan 2012/13
276
9.10 DIRECTOR INFRASTRUCTURE AND PLANNING: Must ensure that disaster plans are compiled and maintained in his/her service, with specific reference to the following: a. Compilation of pro-active departmental disaster
management programmes to support risk reduction or elimination.
b. Compilation of reactive departmental disaster management plan to ensure service continuity during emergency/disaster situations.
c. Removing debris from transportation routes and other sites as required.
d. Identifying and prioritising essential services that may require restoration as result of an emergency/disaster situation.
e. Providing technical advice in preventing or reducing the effect of flooding.
f. Supplying resources for disaster management purposes as requested by the Disaster Management Unit.
9.11 CHIEF TRAFFIC SERVICES: Must ensure that disaster plans
are compiled and maintained in his/her service, with specific reference to the following: a. Compilation of pro-active departmental disaster
management programmes to support risk reduction or elimination.
b. Compilation of reactive departmental disaster management plan to ensure service continuity during emergency/disaster situations.
c. Identifying evacuation routes in and around emergency area(s).
d. Managing and controlling traffic in and around emergency area(s) on evacuation routes and on emergency vehicle routes.
9.12 CHIEF LAW ENFORCEMENT: Must ensure that disaster plans are compiled and maintained in his/her service, with specific reference to the following: a. Compilation of pro-active departmental disaster
management programmes to support risk reduction or elimination.
b. Compilation of reactive departmental disaster management plan to ensure service continuity during emergency/disaster situations.
c. Coordinate response with the South African Police Services and national security forces or departments.
d. Controlling and dispersing crowds e. Evacuating designated area(s) of both persons
and livestock f. Protect private and public property.
9.13 MANAGEMENT SERVICES: Must ensure that disaster plans are compiled and maintained in his/her service, with specific reference to the following: a. Compilation of pro-active departmental disaster
management programmes to support risk reduction or elimination.
b. Compilation of reactive departmental disaster management plan to ensure service continuity during emergency/disaster situations.
c. Monitoring compliance with relevant legislation. Regulations, licenses and by-laws
d. Identifying information to be documented for inquests or investigations under applicable laws.
e. Providing information to municipal staff and their families.
f. Ensure that the Corporate Disaster Management Plan forms integral part of the IDP.

Final Integrated Development Plan 2012/13
277
9.14 INFORMATION COMMUNICATION TEGNOLOGY: Must ensure that disaster plans are compiled and maintained in his/her service, with specific reference to the following: a. Compilation of pro-active departmental disaster
management programmes to support risk reduction or elimination.
b. Compilation of reactive departmental disaster management plan to ensure service continuity during emergency/disaster situations.
c. Compiling, exercising and carrying out adequate disaster recovery procedures for IT infrastructure and information management,
d. Supplying resources for disaster management purposes on request,
e. Establishing and maintaining required informatics links,
f. Establishing and maintaining a resources database,
g. Supplying IT Infrastructure and assets to host and maintain.
9.15 MEDIA LIASON:
a. Providing information to persons at emergency facilities (e.g. Assembly points / evacuation centres / mass care facilities),
b. Providing information to persons at special incident-related meetings,
c. Providing information to employees and their families who are affected by emergencies / disasters,
d. Arranging site visits for persons affected by the emergency, e.g. families of deceased persons,
e. Arranging anniversary events of disasters for affected persons in support of efforts to facilitate psychosocial coping mechanisms.
f. Providing information to the media.
10. RISK MITIGATION 10.1 JOC (JOINED OPERATIONS CENTRE) can be convened
to address specific risk-mitigation issues during the post-disaster recovery and rehabilitation phase or the pre-disaster risk reduction and preparedness phase.
10.2 The Disaster Management will ensure that the JOC are convened and maintained to address risk-specific disaster management plans, such as plans for aircraft emergencies, flooding, large fires in informal settlements and other transport disasters, hazardous materials incidents or mass events. Policies, plans and procedures that address efficient incident-management and inter-disciplinary cooperation during incidents are included in this category of plans. The input of specialist advisers in the various fields must be obtained on an ongoing basis.
10.3 In the recovery and rehabilitation phase, the head of disaster management and disaster management coordinator will take over responsibility once the JOC is demobilized and / or in cases where recovery and rehabilitation takes place over extended periods.
10.4 The disaster management coordinator under a line function can be convened to take responsibility for activities that address the causal factors of a disaster / incident.
11. DEFINITIONS, TERMINOLOGY AND ABBREVIATIONS
11.1 Abbreviations JOC Joint Operations Centre IDP Integrated Development
Program NGO Non-government Organization
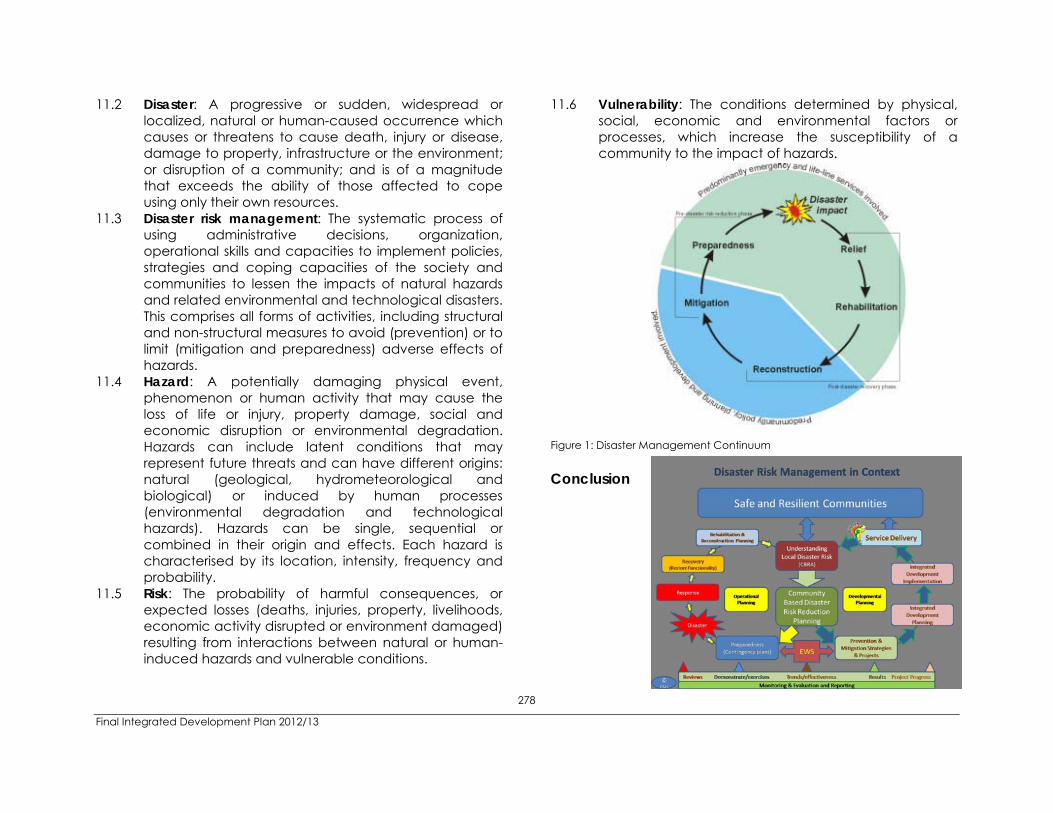
Final Integrated Development Plan 2012/13
278
11.2 Disaster: A progressive or sudden, widespread or localized, natural or human-caused occurrence which causes or threatens to cause death, injury or disease, damage to property, infrastructure or the environment; or disruption of a community; and is of a magnitude that exceeds the ability of those affected to cope using only their own resources.
11.3 Disaster risk management: The systematic process of using administrative decisions, organization, operational skills and capacities to implement policies, strategies and coping capacities of the society and communities to lessen the impacts of natural hazards and related environmental and technological disasters. This comprises all forms of activities, including structural and non-structural measures to avoid (prevention) or to limit (mitigation and preparedness) adverse effects of hazards.
11.4 Hazard: A potentially damaging physical event, phenomenon or human activity that may cause the loss of life or injury, property damage, social and economic disruption or environmental degradation. Hazards can include latent conditions that may represent future threats and can have different origins: natural (geological, hydrometeorological and biological) or induced by human processes (environmental degradation and technological hazards). Hazards can be single, sequential or combined in their origin and effects. Each hazard is characterised by its location, intensity, frequency and probability.
11.5 Risk: The probability of harmful consequences, or expected losses (deaths, injuries, property, livelihoods, economic activity disrupted or environment damaged) resulting from interactions between natural or human-induced hazards and vulnerable conditions.
11.6 Vulnerability: The conditions determined by physical, social, economic and environmental factors or processes, which increase the susceptibility of a community to the impact of hazards.
Figure 1: Disaster Management Continuum Conclusion
Final Integrated Development Plan 2012/13
279
ANNEXURE A FIRE MANAGEMENT PLANS FOR OPEN SPACES
CHAPTER 1: INTRODUCTION The purpose of this plan is to minimize the fire risks for Overstrand Area. This operational manual was set up using known best practices to help Overstrand Municipality and private property owners/managers and lessee's of property to best manage their property within the laws regulating fire on properties (non-structural fires), set norms and standards for the management of fires and fire prevention in the best interest of biodiversity management and public safety. What we have tried to do is to simplify the subject so that persons that are not normally acquainted with the subject, or who do not perform this function as part of their normal work function, would be able to initiate and complete Fire management program. CHAPTER 2: BACKGROUND In order to ensure that both the fire-dependent vegetation and private property are managed correctly during a fire, it is imperative to have a Fire Management Plan from which the property owner, manager or the lessee of the property can gain the required information to manage their property. It is the objective of this guideline document to provide brief but essential user-friendly information for the site manager to have in place preventative measures in the event of a fire occurring on their property.
FIRE DEPENDENT ECOSYSTEMS A great deal has been written about the vegetation of the Western Cape and the extraordinarily rich variety of plant species that occur there, many of them being found nowhere else. Ecological principles of fynbos management using fire The application of fire is the major management practice in fynbos ecosystems. Fynbos requires fire to maintain its diversity, to maintain
ecosystem processes and to maintain its plant and animal communities in a healthy condition.
If fynbos is left unburnt for too long, typically 25 or more years, it will become moribund. There is a tendency to believe that there is an "ideal" time to burn, and that all fires should occur at this time, but this is not so.
Fynbos ecosystems require variation between successive fires in order to maintain the diversity of species because different fires favour different species.
These species have survived and coexisted because they are adapted to a particular fire regime.
Key components of a fire regime involve at least the following: Fire frequency – a probability distribution of the intervals
between successive fires; Fire season – a probability distribution of fires in each month
of the year; and Fire intensity – a range of fire intensities. If the natural fire regime in an area is well understood, then management actions that mimic this regime are highly likely to result in the maintenance of the biodiversity of plant communities.
Final Integrated Development Plan 2012/13
280
ANNEXURE B Flood Contingency Plan
Read in conjunction with Overstrand Disaster Management Plan Emergency Flood Plan Flood plans can enable a flexible response to problems caused by flooding. Although barriers may protect potential flood areas from predictable tidal or storm surges, flooding can occur at any time due to:
Prolonged or intensive rainfall Abnormally high river levels Major storms, tidal waves or tsunami
Flood Warnings Overstrand Head of Fire & Disaster Management is kept informed by District Municipality Head of Disaster Management as well as City Cape Town Head of Disaster Management. A typical flood warning time is around 30 to 60 minutes. Overstrand Head of Fire & Disaster Management has the capability to issue flood warnings via sms, radio or public address systems. Sample flood warning messages are:
Flood Alert – Flooding is possible Flood Warning – Flooding of homes, businesses and
main roads is expected Severe Flood Warning – Severe flooding may cause
Imminent danger All Clear – No Flood Alerts or Warnings are in force
ROLES AND RESPONSIBILITIES
When a flood warning message is received, Overstrand Disaster Management will alert relevant agencies/ departments. Depending upon the scale of potential flooding, the main difficulties are:
Care of evacuated, hurt or homeless people Protecting of utilities Availability of transport Flood alleviation e.g. clearing blocked culverts and
drains Providing emergency health advice Providing road barriers and signs Coordinating emergency support
Local Authorities (SAPS, Law Enforcement and Traffic) Primary responsibilities:
Assist evacuation Provisionally identify deceased victims (SAPS) Restore normality
Fire & Rescue Services Primary fire service responsibilities:
Rescue trapped casualties Control fires, released chemicals and other hazards Assess hazards concerning evacuation Ensure safety of rescue personnel Minimize environmental dangers Recover dead in conjunction with the police Stand by during recovery Deploy sandbags for flood
defences
Final Integrated Development Plan 2012/13
281
Ambulance Services Primary ambulance service responsibilities:
Save life in conjunction with other emergency services Extricate, assist and stabilize injured people Provide ambulances, medical staff, equipment and
resources Establish effective triage points and systems Provide a central point for medical resources Alert receiving hospitals Provide transport for medical teams and their
equipment Arrange transport for injured people Maintain emergency cover
Disaster Management Primary Disaster Management responsibilities:
Coordinate local resources and use of equipment Liaison with relevant emergency services Provide communication facilities Advise residents of flood prone areas to obtain
sandbags Advise on weather, water flow, warnings and
evacuation Issuing warning messages to local authorities A single point of contact for information Issue media statements Issue situation updates
Advice for Public
1. FLOOD WARNING: 'GO IN, STAY IN, TUNE IN' 2. Stay calm
3. Ensure that neighbours know of the warning, and be prepared to help them
4. Keep a list of useful telephone numbers 5. Monitor local radio 6. Make a flood kit: medications, warm clothing, sealed
food, blankets, matches, candles, flashlights, portable radio, spare batteries, rubber gloves, personal documents
Personal Flood Plans Discuss a plan with family members, friends and neighbours Know how to disconnect gas, electricity and water supplies Know where to move vehicles in an emergency. Store valuable property in a raised secure location Fill containers with clean water (Avoid using flood waters or local water) Care for the needs of pets and domestic animals Remember If you live in a flood risk area, have: Sufficient sandbags or other devices to block doors, ventilators and openings Appropriate insurance cover Essential sealed foods, as food supplies may become limited If evacuated, you may be unable to return to your property for some time If Flooding is Imminent Turn off electricity and gas Move family members, pets and supplies upstairs
Final Integrated Development Plan 2012/13
282
Sandbags Fill sandbags not more that ¾ full Lay them in layers with each row tight to each other, end to end Stamp them down before laying another row on top If a wall is more than two sandbags high, place a double line of bottom sandbags, followed by a second double line, then a single line on top. Make sandbags with compost bags, carrier bags or pillowcases filled with sand or earth Put a plastic sheet down first to act as an extra seal Protect all water entry points including air bricks, air vents and utility openings If gas vents are sealed, disconnect any gas supply Seals around doors and windows should be made watertight It can take 60 sandbags to correctly seal an external door General Health and Safety Do not walk, drive or swim through floods. Be aware of hidden dips in a road Floods often contain sewage - avoid food that may have been contaminated by floodwater Avoid wet electrical equipment Ventilate your property as much as possible, while maintaining security If evacuation is necessary, follow police advice
ANNEXURE C Conflict Contingency Plan Read in conjunction with Overstrand Disaster Management Plan PURPOSE The objective of the plan is as follows:
The regulate the Disaster Response to the benefit of all Communities and Visitors
To respond effectively to the requirements of individuals
towards the protection of life and property.
To establish those most vulnerable and at risk.
To provide temporary shelter accommodation, clothing and feeding arrangements for persons evacuated or made temporarily homeless.
To restore normality to the affected community within a
reasonable timescale, dependent on the seriousness of the incident.
RESPONSE AND RELIEF ACTIVITIES Action Steps
Activate JOC Establish needs Monitor safety (establish are of impact) Ensure communication (Liaison Officer)
Final Integrated Development Plan 2012/13
283
Establish safe location pro-active identification
Activate relevant role players Plan for feeding Admin System (Record keeping) Security (Mobilization of Law Enforcement) Storage facilities Request SAPS support Implement access Control – Support at site Activate responsible services.
Take Note
Ensure correct info Ensure health standards Ensure adequate ablution facilities Identify social problems Avoid over crowding Observe special population (religion) groups Control public donation
Primary Role Players * SAPS - Illegal or violent action * Municipal Disaster management * Overberg District Municipality Disaster Management * Municipal Law Enforcement * National Intelligence Agency * Social Development * Dept Community Safety * Municipal Solid Waste * Media * Municipal Engineering * Municipal Water * Emergency Medical Services
Supporting Role Players
Red Cross Municipal Fire Services SANDF Private Companies Provincial Social Security Agency Provincial Dept of Safety & Security World Food Bank
‘Displaced Persons’ Temporary Place of Safety 1. Hermanus (Auditorium) 2. Hawston (Thusong Centre) 3. Zwelhle Community Hall 4. Mount Pleasant (Moffat Hall) 5. Hermanus (De Wet Hall) 6. Gansbaai (Buffeljachts Hall) 7. Gansbaai (Eluxolweni Hall) 8. Gansbaai (Masakhane Hall) 9. Gansbaai (Blompark Hall) 10. Gansbaai (Baardskeerdersbos Hall) 11. Pringlebaai Hall 12. Stanford Hall 13. Kleinmond Town Hall 14. Kleinmond Proteadorp Hall 15. Kleinmond Over the Hills Hall 16. Bettiesbaai Mooiuitsig Hall 17. Bettiesbaai Cassula Hall 18. Pringlebaai Hall
Final Integrated Development Plan 2012/13
284
Displaced Persons’ Temporary Place of Safety Inspection Guidelines Important because
Prevent disease Ensures a safe well run camp and reduces
the risk of problems Identify problems Opportunity to chat and meet displaced
people, answer questions and provide information
Who should do the inspection – daily senior persons
Municipality Red Cross Health Inspectors Church groups/other groups
What to inspect
Water Toilets/drains/portaloos Rubbish Fires/cooking fires Security Too crowded Cold children, mothers First Aid kits available Kitchen condition, enough food Clinic services Sick people/children Personal security
(guards)Special diet needs i.e. Halaal, etc\
SAFETY MANAGEMENT PLAN REQUIREMENT
Venue Structures Capacity, Duration Food Toilets Fire precautions Emergency Medical Care Access and exits
Xenophobia Specific Contact Numbers: Designation Name Telephone Cell Disaster Manager A.E.
Jacobs
0283848300
0823738270
Disaster Management Coordinator
M.D. Rust
0282718400
0827769287
Housing/Emergency Shelter
B. Fortuin
0283138000
0823724450
Final Integrated Development Plan 2012/13
285
Annexure D1 Review and assessment of existing Corporate Disaster Management Plan A review of the Corporate Disaster Management Plan was conducted during Augustus 2011. The following challenges have been identified. 1. Departmental/ Directorate Disaster Management Plans Emanating from the review, the need was identified for the development of Departmental Disaster Management plans. All directorates and departments must develop their own Disaster Management Plan. A template (as attached Annexure D2) was initiated and distributed to all Directors to ensure completion thereof by their departments and submit it to the Director: Protection Services by no later than 13 April 2012. These Departmental / Directorate Disaster Management Plans will form part of the existing Corporate Disaster Management Plan. These plans will be included in the 2012/2013 financial year and will be reviewed annually. 2. Declaration of Disaster (Overstrand municipal area)
A policy need to be developed for a declaration of disaster situations within the Overstrand municipal area of jurisdiction.
The reason for this policy is to clarify the roles and responsibilities of the politicians, officials, civil society and neighboring municipalities in a disaster situation. The draft policy will be submitted to council for approval during the 2012/2013 financial year.
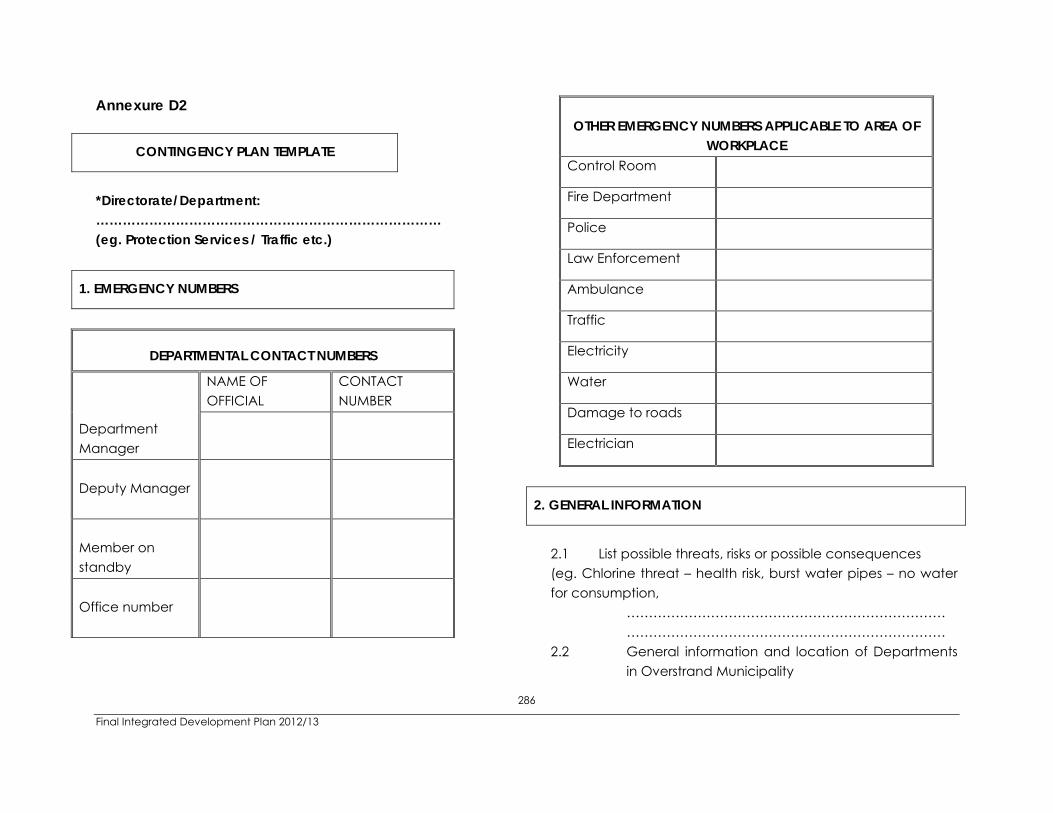
Final Integrated Development Plan 2012/13
286
Annexure D2
CONTINGENCY PLAN TEMPLATE
*Directorate/Department: …………………………………………………………………… (eg. Protection Services / Traffic etc.)
1. EMERGENCY NUMBERS
DEPARTMENTAL CONTACT NUMBERS
Department Manager
NAME OF OFFICIAL
CONTACT NUMBER
Deputy Manager
Member on standby
Office number
OTHER EMERGENCY NUMBERS APPLICABLE TO AREA OF
WORKPLACE Control Room
Fire Department
Police
Law Enforcement
Ambulance
Traffic
Electricity
Water
Damage to roads
Electrician
2. GENERAL INFORMATION
2.1 List possible threats, risks or possible consequences (eg. Chlorine threat – health risk, burst water pipes – no water for consumption,
………………………………………………………………………………………………………………………………
2.2 General information and location of Departments in Overstrand Municipality

Final Integrated Development Plan 2012/13
287
2.2.1 Function/nature of department: ……………………………………………………………… ………………………………………………………………
2.2.2 Department structure according to organogram 2.3 History of incidents
……………………………………………………………….. ………………………………………………………………
2.4 Measures in place to reduce possible threats, risks
or possible consequences ……………………………………………………………… ………………………………………………………………
2.5 List of resources/equipment(eg. diggers, brush
cutters, water tankers)
Item Location

288
ANNEXURE A
SPATIAL MAPPING OF R500 00 WARD PROJECTS

289
290
ANNEXURE B
PROJECTS DELAYED
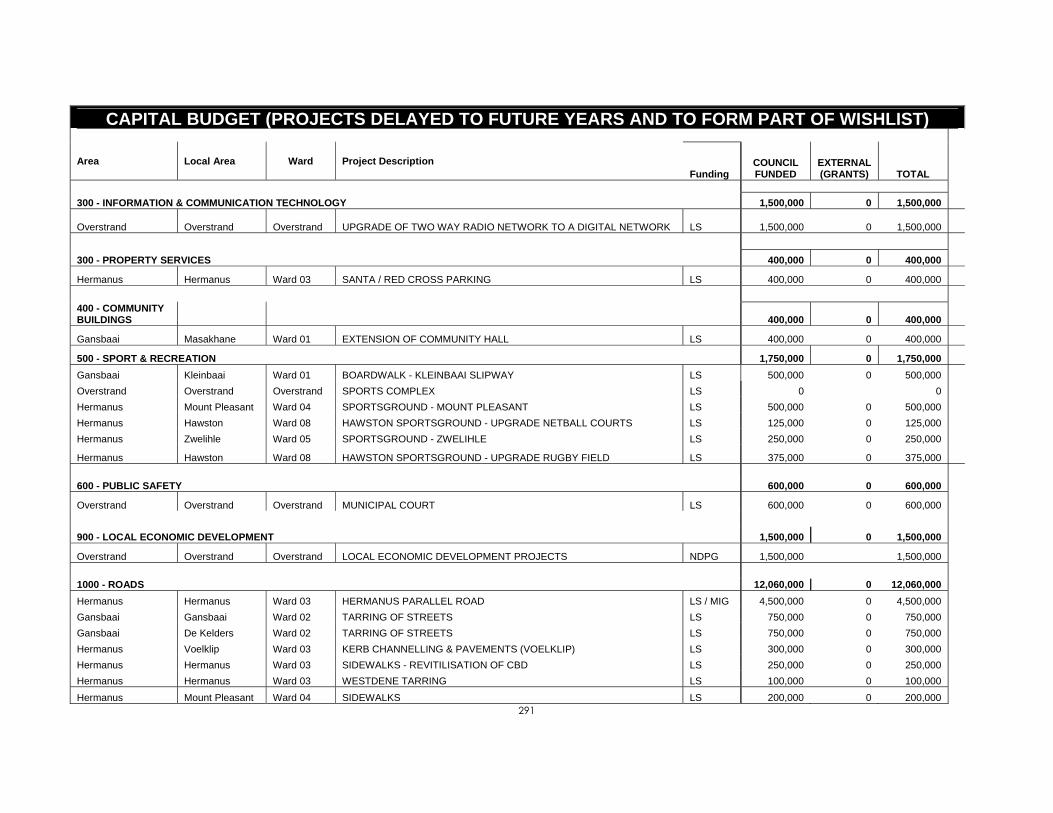
291
CAPITAL BUDGET (PROJECTS DELAYED TO FUTURE YEARS AND TO FORM PART OF WISHLIST)
Area Local Area Ward Project Description Funding
COUNCIL FUNDED
EXTERNAL (GRANTS) TOTAL
300 - INFORMATION & COMMUNICATION TECHNOLOGY 1,500,000 0 1,500,000
Overstrand Overstrand Overstrand UPGRADE OF TWO WAY RADIO NETWORK TO A DIGITAL NETWORK LS 1,500,000 0 1,500,000
300 - PROPERTY SERVICES 400,000 0 400,000
Hermanus Hermanus Ward 03 SANTA / RED CROSS PARKING LS 400,000 0 400,000
400 - COMMUNITY BUILDINGS 400,000 0 400,000
Gansbaai Masakhane Ward 01 EXTENSION OF COMMUNITY HALL LS 400,000 0 400,000
500 - SPORT & RECREATION 1,750,000 0 1,750,000
Gansbaai Kleinbaai Ward 01 BOARDWALK - KLEINBAAI SLIPWAY LS 500,000 0 500,000
Overstrand Overstrand Overstrand SPORTS COMPLEX LS 0 0
Hermanus Mount Pleasant Ward 04 SPORTSGROUND - MOUNT PLEASANT LS 500,000 0 500,000
Hermanus Hawston Ward 08 HAWSTON SPORTSGROUND - UPGRADE NETBALL COURTS LS 125,000 0 125,000
Hermanus Zwelihle Ward 05 SPORTSGROUND - ZWELIHLE LS 250,000 0 250,000
Hermanus Hawston Ward 08 HAWSTON SPORTSGROUND - UPGRADE RUGBY FIELD LS 375,000 0 375,000
600 - PUBLIC SAFETY 600,000 0 600,000
Overstrand Overstrand Overstrand MUNICIPAL COURT LS 600,000 0 600,000
900 - LOCAL ECONOMIC DEVELOPMENT 1,500,000 0 1,500,000
Overstrand Overstrand Overstrand LOCAL ECONOMIC DEVELOPMENT PROJECTS NDPG 1,500,000 1,500,000
1000 - ROADS 12,060,000 0 12,060,000
Hermanus Hermanus Ward 03 HERMANUS PARALLEL ROAD LS / MIG 4,500,000 0 4,500,000
Gansbaai Gansbaai Ward 02 TARRING OF STREETS LS 750,000 0 750,000
Gansbaai De Kelders Ward 02 TARRING OF STREETS LS 750,000 0 750,000
Hermanus Voelklip Ward 03 KERB CHANNELLING & PAVEMENTS (VOELKLIP) LS 300,000 0 300,000
Hermanus Hermanus Ward 03 SIDEWALKS - REVITILISATION OF CBD LS 250,000 0 250,000
Hermanus Hermanus Ward 03 WESTDENE TARRING LS 100,000 0 100,000
Hermanus Mount Pleasant Ward 04 SIDEWALKS LS 200,000 0 200,000

292
Hermanus Zwelihle Ward 05 SIDEWALK -TAMBO SQUARE LS 300,000 0 300,000
Hermanus Zwelihle Ward 06 WALDORF RAISED CROSSING LS 190,000 0 190,000
Hermanus Sandbaai Ward 07 SANDBAAI TARRING LS 1,000,000 0 1,000,000
Hermanus Hawston Ward 08 TARRING/STORM WATER - MOUNTAIN VIEW AVENUE LS 570,000 0 570,000
Hermanus Hawston Ward 08 TARRING SIDEWALKS - KERK STREET LS 350,000 0 350,000
Hermanus Fisherhaven Ward 08 SIDEWALKS LS 250,000 0 250,000
Kleinmond Pringle Bay Ward 10 TARRING OF ROADS - PROBLEMATIC STORM WATER DAMAGE AREAS LS 250,000 0 250,000
Pringle Bay Pringle Bay Ward 10 WALKWAY EXTENSION - HANGKLIP RD TOWARDS R44 LS 250,000 0 250,000
Hermanus Onrus Ward 13 ATLANTIC AVENUE GABIONS LS 300,000 0 300,000
Pringle Bay Pringle Bay Ward 10 EXTENSION OF PAVED PARKING – COMMUNITY HALL LS 350,000 0 350,000
Hermanus Vermont Ward 13 PAVEMENT &REPLACEMENT STORM WATER CHANNEL IN SHEARWATER LS 400,000 0 400,000
Hermanus Fisherhaven Ward 08 TARRING OF ROADS - BOUNDARY ROAD LS 500,000 0 500,000
Kleinmond Kleinmond Ward 09 UPGRADING/REPLACEMENT OF PEDESTRIAN BRIDGE - KLEINMOND LAGOON LS 500,000 0 500,000
1200 - ELECTRICITY 3,000,000 0 3,000,000
Hermanus Hermanus Ward 03 SWARTDAM RD. ELECTRIFICATION -HOUSING PROJECT LS 3,000,000 3,000,000
1300 - WATER 100,000 0 100,000
Overstrand Overstrand Overstrand FIRE HYDRANTS LS 100,000 0 100,000
1400 - STORM WATER 3,663,500 0 3,663,500
Gansbaai Masakhane, Blompark Ward 01 IMPLEMENTATION OF STORM WATER MASTER PLAN LS 1,000,000 0 1,000,000
Kleinmond Betty's Bay Ward 10 BETTY'S BAY-SWATER(OTTER CLOSE 763,500 0 763,500
Hermanus Hermanus Ward 03 STORM WATER AT HIGH SCHOOL LS 100,000 0 100,000
Hermanus Hermanus Ward 03 EASTCLIFF - MOSSELRIVIER 57, STORM WATER LS 60,000 0 60,000
Hermanus Zwelihle Ward 06 STORM WATER - ZWELIHLE LS 500,000 0 500,000
Hermanus Sandbaai Ward 07 STORM WATER - LONG STREET LS 1,200,000 0 1,200,000
Hermanus Hawston Ward 08 DUKE ROAD 17A - STORM WATER LS 40,000 0 40,000
1500- WASTE MANAGEMENT 1,650,000 0 1,650,000
Hermanus Hermanus Ward 03 HERMANUS MRF CONCRETE SLAB LS 900,000 0 900,000
Hermanus Hermanus Ward 03 HERMANUS TRANSFER STATION STAFF FACILITIES LS 600,000 0 600,000
Kleinmond Betty's Bay Ward 10 BETTY'S BAY DROP OFF OFFICE LS 150,000 0 150,000
GRAND TOTAL 26,623,500 26,623,500
293
ANNEXURE C
IDP PROJECT WISHLIST

294
APPROVED CAPITAL BUDGET 2012-2015 MTREF & FUTURE CAPITAL PROJECT PROPOSALS CAPITAL
2012/13 2013/14 2014/15 PROJECTS
Ward Project Description Project Manager
COUNCIL FUNDED
EXTERNAL (GRANTS) TOTAL COUNCIL
FUNDED EXTERNAL (GRANTS) TOTAL COUNCIL
FUNDED EXTERNAL (GRANTS) TOTAL
WISHLIST
300 - INFORMATION & COMMUNICATION TECHNOLOGY 0 0 0 0 0 0 0 0 0
Overstrand Upgrade of two way radio network to a digital network E Muller 1,500,000
Overstrand Intangible Assets - EMIS DB4 Interface E Muller 200,000
Overstrand NEW GIS SERVER E Muller 150,000
Overstrand RF NETWORK UPGRADE E Muller 3,000,000
Overstrand SIP Telefoon 50 x R2000.00 E Muller 100,000
Overstrand UPGRADE OF TWO WAY RADIO NETWORK TO A DIGITAL NETWORK E Muller 1,500,000
Overstrand CCTV Project Phase 1: H.O. Hermanus E Muller 700,000
Overstrand WHISPER SYSTEM Interpretation System 40 x user compliant E Muller 250,000
Overstrand HP SCANJET N8460 6 X R 19594.00 E Muller 118,000
Overstrand 10 x Purchase of new Hand held Radios E Muller 240,000
Overstrand PAYDAY TIME & ATTENDANCE SYSTEM E Muller 600,000
Overstrand DELL/EMC CX4 DAE DISK SPACE FOR SAN 4.5TB E Muller 750,000
Overstrand GWAVA Licenses - INTANGIBLE ASSETS E Muller 120,000
Overstrand
Novell Sentinel Log Manager 1.2 500 EPS 1-Instance License + 1-Year Standard Maintenance (AG Requirement) - INTANGIBLE ASSETS E Muller
160,000
Overstrand 4 Radix FW950 Handheld Computers
E Hooneberg 125,000
Overstrand 24 Battery Refurbishment for existing FW900 Series @ R650.00 pu
E Hooneberg 15,600

295
Overstrand 4 Optional GPS & Top Box for FW900 Series Device
E Hooneberg 30,000
300 - PROPERTY SERVICES 0 6,600,000 6,600,000 0 0 0 0 0 0
Ward 09 KM Harbour Development R Kuchar 6,600,000 6,600,000 0
Overstrand Auditorium extension J Simson 600,000
Ward 02 Purchasing of Erf 385, Gansbaai R Kuchar 600,000
Ward 02 Gansbaai Carports F Myburgh 100,000
Ward 02 Guard House at WTW D Crafford 50,000
Ward 05 Green belt P Burger 350,000
Overstrand Walkway ext - Civic centre entrance J Simson 1,100,000
Ward 02 New shade covered parking F Myburgh 80,000
Ward 09 Additional buildings Kleinmond Yard (traffic dept, etc) J Simson 2,500,000
Ward 09 Extension of municipal offices – Admin C Jonkheid 200,000
Ward 09 New carports at offices C Jonkheid 40,000
Ward 10 Convert portion of Betty's Bay offices to clinic C Jonkheid 180,000
Ward 13 Purchasing of Ptn 363/581 - property for road R Kuchar 2,500,000
Ward 3 Relocate vehicle testing ground and municipal store R Kuchar 20,000,000
Ward 3 CBD revitallisation R Kuchar 3,000,000
Ward 11 Stanford market square development R Kuchar 2,000,000
Ward 3 De Mond caravan park R Kuchar 5,000,000
Overstrand Auditorium extension to stage area J Simson 800,000
Overstrand Building 1 - new library (basement plus 3 storey building = 3,500m2) J Simson 3,000,000
Overstrand Furniture & office equipment (new library) J Simson 300,000
Overstrand Conversion of Library into new council chambers J Simson 5,000,000
Overstrand Building 2 - new offices (basement plus 3 storey building = 3,500m2) J Simson 3,000,000
Overstrand Extention of Building Control J Simson 300,000

296
Department (safe storage for building plans- As per fire regulations and archives
Overstrand Extention of Town Plannings offices J Simson 350,000
Ward 8 Nuwe Heining om Rioolwerke P Burger 70,000
Ward 3 Nuwe Heining om Scout Kampterein P Burger 100,000
Ward 3 Install gabions P Burger 50,000 Ward 3 Install gabions P Burger 50,000
Ward 3 Bou van muur - Village square playpark P Burger 40,000
Ward 3 Nuwe opleidingslokaal L Bucchianeri 650,000
Ward 2 Safekeeping Storage Area for SCRAP materials D Crafford 20,000
Ward 2 Addition to Water Section Shed (Materials & Equipment) D Crafford 100,000
Ward 2 Superintendants Office at WTW Franskraal D Crafford 60,000
Ward 2 Vibrocrete wall around Pearly Beach Tower D Crafford 80,000
Ward 2 Ablution Facilities for Sewerage Tankers (WWTW offload) D Crafford 65,000
Ward 9 New ablution facilities at Kleinmond Yard
D van Rhodie 300,000
Ward 3 Omheining van HR geboue L Bucchianeri 80,000
Ward 3 Upgrade of municipal work depot 600,000
Ward 3 Community Health Centre F Myburgh 9.000.000
400 - COMMUNITY BUILDINGS 1,300,000 0 1,300,000 0 0 0 0 0 0
Overstrand Karwyderskraal Cemetry R Kuchar 1,300,000 1,300,000 0 0
Ward 1 Extension of community hall F Myburgh 100,000
Ward 1 Additional ablution facilities F Myburgh 50,000
Ward 1 Cemetry D Crafford 50,000
Ward 7 Sandbaai hall & grounds upgrading P Burger 350,000
Ward 8 Thusong Centre Parking P Burger 250,000
Ward 8 Improvement to car park (Public toilets) P Burger 50,000

297
Ward 1 Extend wall to curb vandalism - Cemetry D Crafford 60,000
Ward 4 Building 1 - New library J Simson 2,000,000
Ward 4 Ablution facilities P Burger 50,000
Ward 8 Thusong Centre Cloakrooms P Burger 150,000
Ward 9 Extension to library C Jonkheid 300,000
Ward 10 Extension of parking and toilet block - Ann RD. C Harding 450,000
500 - SPORT & RECREATION 0 2,639,973 2,639,973 0 2,243,750 2,243,750 0 0 0
Ward 1 Boardwalk - Kleinbaai Slipway F Myburgh 500,000
Ward 1 Parking area - S4S F Myburgh 200,000
Ward 4 Sportsground - Mount Pleasant P Burger 500,000
Ward 8 Hawston sportsground - Upgrade netball courts P Burger 125,000
Ward 5 Sportsground - Zwelihle P Burger 250,000
Ward 8 Hawston sportsground - Upgrade rugby field P Burger 375,000
Ward 5 Upgarde of sport facilities Zwelihle B Louw 1,442,000 1,442,000 2,243,750 2,243,750
Ward 6 Swimming Pool Zwelihle/Mount Pleasant (MIG) D Hendriks 1,197,973 1,197,973
Ward 1 Caretakers residence: Soccerfield F Myburgh 150,000
Ward 1 Screens - Cricket Pitch (Spaces for Sport) F Myburgh 50,000
Ward 4 Play ground equipment P Burger 50,000
Ward 5 Playparks Ward 5 P Burger 300,000
Ward 1 Improve irrigation systems power supply at Sportsfields D Crafford 50,000
Overstrand Sports Complex R Kuchar 6,500,000
Ward 5 Swimming Pool Zwelihle/Mount Pleasant (MIG) D Hendriks 1,197,973
Ward 3 Upgrading Swallow park - Hermanus CBD P Burger 120,000
Ward 4 Soccer poles X2 (Confirm with asset dept if capex or opex ) P Burger 30,000
Ward 5 Soccer poles X2 (Confirm with asset dept if capex or opex ) P Burger 30,000

298
Ward 8 Soccer poles X2 (Confirm with asset dept if capex or opex )
P Burger 30,000
Ward 8 Hawston Sport Stadium P Burger 10,000,000
600 - PUBLIC SAFETY 0 0 0 0 0 0 0 0 0
Overstrand Municipal Court N Micheals 600,000
Overstrand Upgrading of existing training facilities R Jacobs 200,000
Ward 09 Fire brigade services R Jacobs 200,000
Ward 10 Opgradering van brandweerwa motorhuis R Jacobs 500,000
Ward 02 Upgrading Gansbaai Fire Station R Jacobs 125,000
Ward 03 Upgrading Hermanus Fire Station R Jacobs 125,000
Ward 2 Upgrading Training facilities Gansbaai R Jacobs 75,000
Ward 3 Upgrading Hermanus Offices M Hendriks 120,000
Ward 9 Kleinmond Offices M Hendriks 80,000
Overstrand 4x Roller doors for testing station building R Fraser 150,000
Overstrand 1x Genarator R Fraser 300,000
700 - HOUSING 0 9,138,000 9,138,000 0 23,999,250 23,999,250 0 30,705,000 30,705,000
Ward 11 Eluxolweni- 211 sites - USIP(Pearly Beach) 7,308,000 7,308,000 0 2,755,000 2,755,000
Ward 03 Swartdamweg project - IS & GAP 1,830,000 1,830,000 3,036,750 3,036,750 0
Ward 08 Hawston project - IRDP 4,243,750 4,243,750 7,150,000 7,150,000
Ward 02 Gansbaai project -IRDP/GAP 5,743,750 5,743,750 7,150,000 7,150,000
Ward 06 Zwelihle project -UISP 5,243,750 5,243,750 5,150,000 5,150,000
Ward 01 Masakhane project -UIPS 4,043,750 4,043,750 3,150,000 3,150,000
Ward 02 Beverly Hills project -UISP 1,687,500 1,687,500 1,550,000 1,550,000
Ward 11 Stanford project - IRDP 0 2,150,000 2,150,000
Ward 09 Kleinmond project -.IRDP 0 1,650,000 1,650,000

299
900 - LOCAL ECONOMIC DEVELOPMENT 0 2,418,000 2,418,000 0 0 0 0 0 0
Overstrand Local Economic Development Projects
S Madikane 2,418,000 2,418,000 1,500,000
1000 - ROADS 0 10,784,157 10,784,157 0 0 0 0 3,500,000 3,500,000
Overstrand Hermanus parallel road D Hendriks 0 10,784,157 10,784,157 0 0 0 0 4,500,000
Ward 8 Hawston: 227 RDP Erven rehabilitategravel roads D Hendriks 0 3,500,000 3,500,000
Ward 1 Tarring of streets D Crafford 200,000
Ward 2 Tarring of streets D Crafford 100,000
Ward 4 Kerb channelling & pavements (Voelklip) P Burger 200,000
Ward 4 Sidewalks - Revitilisation of CBD P Burger 50,000
Ward 4 Westdene tarring P Burger 150,000
Ward 4 Sidewalks P Burger 200,000
Ward 5 Sidewalk -Tambo square P Burger 500,000
Ward 6 Waldorf raised crossing P Burger 500,000
Ward 7 Sandbaai tarring P Burger 1,500,000
Ward 8 Tarring/Storm water - Mountain View Avenue P Burger 200,000
Ward 8 Tarring sidewalks - Kerk street P Burger 215,000
Ward 3 Pavements in Queen Victoria Street J Nel 300,000
Ward 8 Sidewalks P Burger 250,000
Ward 10 Tarring of Roads - Problematic storm water damage areas C Harding 100,000
Ward 10 Walkway extension - Hangklip rd towards R44 C Harding 520,000
Ward 7 Atlantic Avenue Gabions P Burger 215,000
Ward 10 Extension of paved parking – Community hall C Jonkheid 100,000
Ward 7 Pavement &replacement storm water channel in Shearwater P Burger 150,000
Ward 8 Tarring of roads - Boundary road P Burger 500,000
Ward 9
Upgrading/Replacement of Pedestrian bridge - Kleinmond Lagoon C Harding 200,000
Ward 8 Hawston: 227 RDP Erven Rehabilitate Gravel Roads (MIG) D Hendricks 175,000

300
Ward 2 Widening of Park-, Melton- and Main Streets D Crafford 750,000
Ward 2 Enlargement of turning circle - York Street D Crafford 150,000
Ward 1 Tarring or surfacing of roads at WTW D Crafford 100,000
Ward 1 Tarring of roads D Crafford 50,000
Ward 9 Paving of Parking - Fairy Glen C Harding 350,000
Ward 10 Upgrading of sidewalks C Harding 300,000
Ward 10
Traffic circles – juction central/pass and stream/buffels/gulley D Hendricks 800,000
Ward 2 Upgrade of dirt roads D Crafford 200,000
Ward 1 Tarring of gravel parking area D Crafford 100,000
Ward 4 CBD Revitalisation Public Transport Facility - Taxi Rank D Hendriks 230,000
Ward 3 Tarring - Fernkloof Drive P Burger 600,000 Ward 8 Tarring - Kerk Straat P Burger 150,000 Ward 3 Tarring - Flat Straat P Burger 50,000 Ward 13 Tarring - Periwinkle P Burger 35,000
Ward 5 Kerbing & Chip & Spray - Kwasa-Kwasa Area P Burger 566,000
Ward 3 Sidewalks - Berg & See P Burger 50,000 Ward 3 Upgrading of circle P Burger 100,000 Ward 3 Kerb channelling & Pavements P Burger 150,000
Ward 9 Tarring of Roads - Kleinmond D van Rhodie 800,000
Ward 10 Tarring of Roads - Pringle Bay D van Rhodie 1,000,000
Ward 10 Tarring of Roads - Betty's Bay D van Rhodie 1,000,000
Ward 10 Tarring of Roads - Rooi Els D van Rhodie 1,000,000
Ward 9
Upgrading of sidewalks - Beach Road
D van Rhodie 450,000
1200 - ELECTRICITY 47,400,000 0 47,400,000 14,500,000 0 14,500,000 15,000,000 0 15,000,000
Overstrand New 66kVA S/S K d Plessis 34,000,000 34,000,000 0
Overstrand Buying back spare capacity K d Plessis 500,000

301
Ward 1 FK Upgrading of MV Networks D Maree 1,700,000
Ward 1 Streetlights -Sonneblom street D Maree 100,000
Ward 1 Apie Le Roux -Franskraal upgrade D Maree 2,500,000 2,500,000 0
Ward 1 GB Upgrading of De Wet 11 kV Switching Station D Maree 4,010,000 4,010,000
Ward 1 FK Upgrading of LV network Meyerstreet D Maree 850,000 850,000 0
Ward 1 KB Upgrading of Medium voltage dist.network D Maree 400,000 400,000
Ward 1 BP Upgrading of Low voltage network D Maree 1,400,000 1,400,000
Ward 1
Kleinbaai: New MV feeder from Apie Le Roux to Bester/Van Dyk streets D Maree 900,000 900,000
Ward 1 Franskraal: LV Upgrading in Sea View Drive and surrounding areas D Maree 950,000 950,000
Ward 1 Low Voltage upgrading in Meyer Street D Maree 850,000
Ward 1 Upgrading of Birkenhead Overhead line D Maree 2,800,000
Ward 1 Miniature substation upgrading in Kleinbaai D Maree 1,000,000
Ward 1 Miniature substation upgrading in Franskraal D Maree 1,000,000 1,000,000 0
Ward 1 New MV feeder from Apie Le Roux to Steenbok Street D Maree 1,400,000 1,400,000 0
Ward 1 Apie Le Roux switchgear upgrading D Maree 2,500,000 2,500,000 0
Ward 1 New 70mm2 MV cable in Nissen Street, Masakhane D Maree 480,000
Ward 10 Emergency generator for pressure pump at reservoir K d Plessis 50,000 50,000 0
Ward 11 Stanford: MV and LV upgrading in Industrial area D Maree 1,950,000 1,950,000 1,800,000 1,800,000
Ward 11
Stanford: Upgrading of Eskom feeder and relocation of meter point D Maree
Ward 11 Eluxolweni: Electrical Services for low cost housing D Maree 2,544,000
Ward 11 New 70mm2 MV cable in Moore Street D Maree 600,000
Ward 11 New 11kV feeder to Industrial area D Maree 2,000,000
Ward 11 New 70mm2 MV cable in Langmark Street D Maree 600,000 600,000 0
Ward 11 Miniature substation upgrading in Pearly Beach D Maree 1,000,000
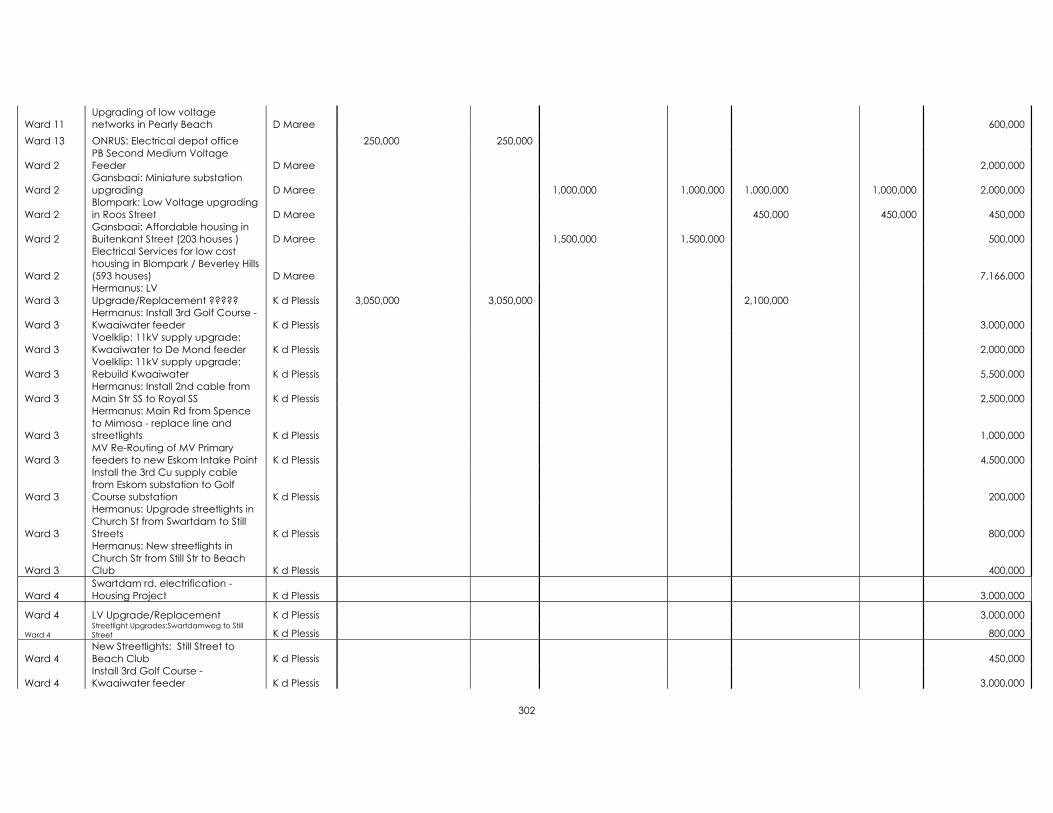
302
Ward 11 Upgrading of low voltage networks in Pearly Beach D Maree 600,000
Ward 13 ONRUS: Electrical depot office 250,000 250,000
Ward 2 PB Second Medium Voltage Feeder D Maree 2,000,000
Ward 2 Gansbaai: Miniature substation upgrading D Maree 1,000,000 1,000,000 1,000,000 1,000,000 2,000,000
Ward 2 Blompark: Low Voltage upgrading in Roos Street D Maree 450,000 450,000 450,000
Ward 2 Gansbaai: Affordable housing in Buitenkant Street (203 houses ) D Maree 1,500,000 1,500,000 500,000
Ward 2
Electrical Services for low cost housing in Blompark / Beverley Hills (593 houses) D Maree 7,166,000
Ward 3 Hermanus: LV Upgrade/Replacement ????? K d Plessis 3,050,000 3,050,000 2,100,000
Ward 3 Hermanus: Install 3rd Golf Course - Kwaaiwater feeder K d Plessis 3,000,000
Ward 3 Voelklip: 11kV supply upgrade: Kwaaiwater to De Mond feeder K d Plessis 2,000,000
Ward 3 Voelklip: 11kV supply upgrade: Rebuild Kwaaiwater K d Plessis 5,500,000
Ward 3 Hermanus: Install 2nd cable from Main Str SS to Royal SS K d Plessis 2,500,000
Ward 3
Hermanus: Main Rd from Spence to Mimosa - replace line and streetlights K d Plessis 1,000,000
Ward 3 MV Re-Routing of MV Primary feeders to new Eskom Intake Point K d Plessis 4,500,000
Ward 3
Install the 3rd Cu supply cable from Eskom substation to Golf Course substation K d Plessis 200,000
Ward 3
Hermanus: Upgrade streetlights in Church St from Swartdam to Still Streets K d Plessis 800,000
Ward 3
Hermanus: New streetlights in Church Str from Still Str to Beach Club K d Plessis 400,000
Ward 4 Swartdam rd. electrification -Housing Project K d Plessis 3,000,000
Ward 4 LV Upgrade/Replacement K d Plessis 3,000,000
Ward 4 Streetlight Upgrades:Swartdamweg to Still Street K d Plessis 800,000
Ward 4 New Streetlights: Still Street to Beach Club K d Plessis 450,000
Ward 4 Install 3rd Golf Course - Kwaaiwater feeder K d Plessis 3,000,000
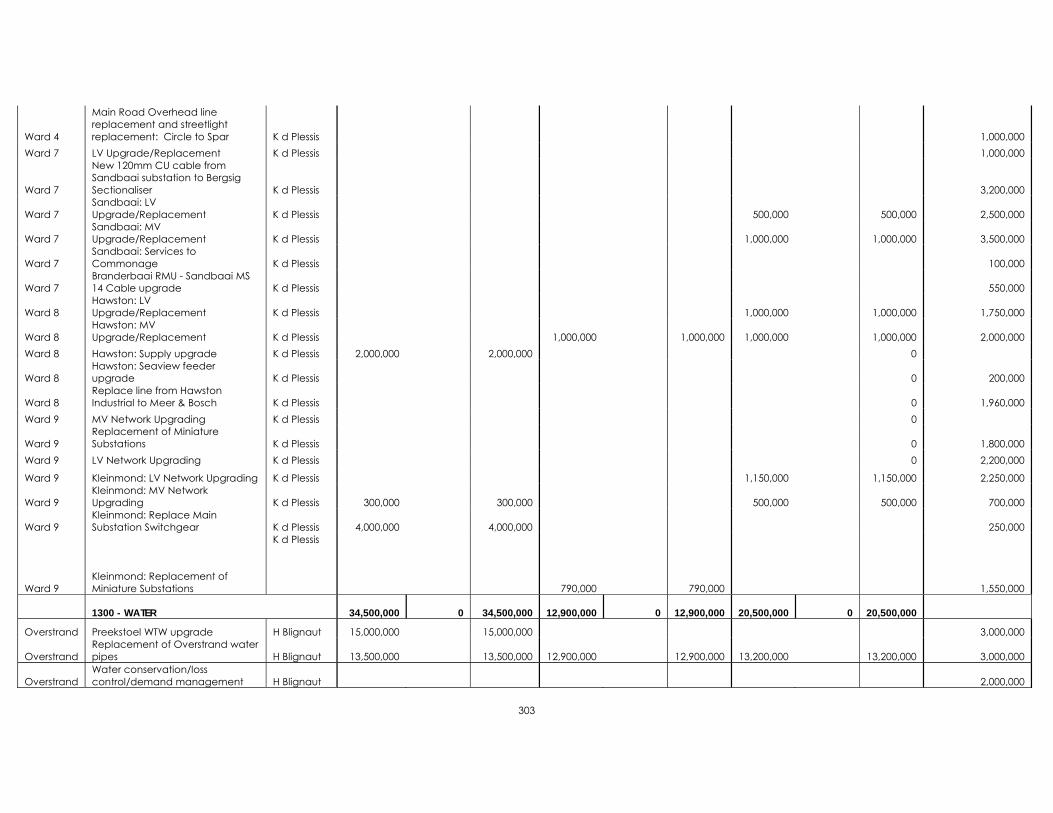
303
Ward 4
Main Road Overhead line replacement and streetlight replacement: Circle to Spar K d Plessis 1,000,000
Ward 7 LV Upgrade/Replacement K d Plessis 1,000,000
Ward 7
New 120mm CU cable from Sandbaai substation to Bergsig Sectionaliser K d Plessis 3,200,000
Ward 7 Sandbaai: LV Upgrade/Replacement K d Plessis 500,000 500,000 2,500,000
Ward 7 Sandbaai: MV Upgrade/Replacement K d Plessis 1,000,000 1,000,000 3,500,000
Ward 7 Sandbaai: Services to Commonage K d Plessis 100,000
Ward 7 Branderbaai RMU - Sandbaai MS 14 Cable upgrade K d Plessis 550,000
Ward 8 Hawston: LV Upgrade/Replacement K d Plessis 1,000,000 1,000,000 1,750,000
Ward 8 Hawston: MV Upgrade/Replacement K d Plessis 1,000,000 1,000,000 1,000,000 1,000,000 2,000,000
Ward 8 Hawston: Supply upgrade K d Plessis 2,000,000 2,000,000 0
Ward 8 Hawston: Seaview feeder upgrade K d Plessis 0 200,000
Ward 8 Replace line from Hawston Industrial to Meer & Bosch K d Plessis 0 1,960,000
Ward 9 MV Network Upgrading K d Plessis 0
Ward 9 Replacement of Miniature Substations K d Plessis 0 1,800,000
Ward 9 LV Network Upgrading K d Plessis 0 2,200,000
Ward 9 Kleinmond: LV Network Upgrading K d Plessis 1,150,000 1,150,000 2,250,000
Ward 9 Kleinmond: MV Network Upgrading K d Plessis 300,000 300,000 500,000 500,000 700,000
Ward 9 Kleinmond: Replace Main Substation Switchgear K d Plessis 4,000,000 4,000,000 250,000
Ward 9 Kleinmond: Replacement of Miniature Substations
K d Plessis 790,000 790,000 1,550,000
1300 - WATER 34,500,000 0 34,500,000 12,900,000 0 12,900,000 20,500,000 0 20,500,000
Overstrand Preekstoel WTW upgrade H Blignaut 15,000,000 15,000,000 3,000,000
Overstrand Replacement of Overstrand water pipes H Blignaut 13,500,000 13,500,000 12,900,000 12,900,000 13,200,000 13,200,000 3,000,000
Overstrand Water conservation/loss control/demand management H Blignaut 2,000,000

304
Ward 02 Nano Filtration Plant Klipgat & Grotte H Blignaut 1,500,000
Ward 11 Stanford Groundwater Pipeline H Blignaut 2,000,000
Overstrand Upgrading of disinfection systems for legislative compliance H Blignaut 200,000
Overstrand Fire hydrants R Jacobs 100,000
Ward 11 Pump Station Upgrade H Blignaut 1,000,000
Ward 02 Bulk Water Pipeline Franskraal WTW - Kleinbaai/Gansbaai H Blignaut 6,500,000
Ward 07 New Hermanus Bulk Reservoir H Blignaut 7,300,000
Ward 11 Baardskeerdersbos Bulk water supply upgrade H Blignaut 3,000,000 3,000,000 0
Ward 09 Augmentation of Water Sources Buffels River Supply Area H Blignaut 3,590,000
Ward 02 Water Network Extension Birkenhead area H Blignaut 100,000
Ward 11 Bulk water Supply Upgrade (borehole, reservoir & WTW) H Blignaut 7,500,000
Ward 1 Bulk Water Pipeline Franskraal WTW - Kleinbaai/Gansbaai ??? H Blignaut 11,800,000
Ward 10 New Bulk Water Reservoir -Rooi Els H Blignaut 2,800,000 2,800,000
Ward 7 New Bulk Water Reservoir -Sandbaai H Blignaut 7,300,000 7,300,000
Ward 9 Augmentation of Water Sources Buffels River Supply Area ???? H Blignaut 2,300,000
Ward 3 Waste Water Re-use Plant (3.4Ml/day) H Blignaut
Ward 3 Desalination Plant Phase 1 (1.5Ml/day) H Blignaut
Ward 1 Franskraal WTW: Chemical Store and Guard House D Crafford 150,000
Ward 11 Upgrading of "Die Oog" pump station D Crafford 200,000 200,000
Ward 1 Water Network Extension Birkenhead area H Blignaut 3,500,000
1400 - SEWERAGE 6,800,000 0 6,800,000 8,500,000 0 8,500,000 4,500,000 5,000,000 9,500,000
Overstrand Hermanus WWTW Upgrading H Blignaut 1,000,000
Ward 9 Kleinmond WWTW Sludge Handling H Blignaut 2,000,000
Ward 3 Sewer Network Extension H Blignaut 2,000,000
Ward 1 Build drainage areas around stand pipes & toilets D Crafford 200,000
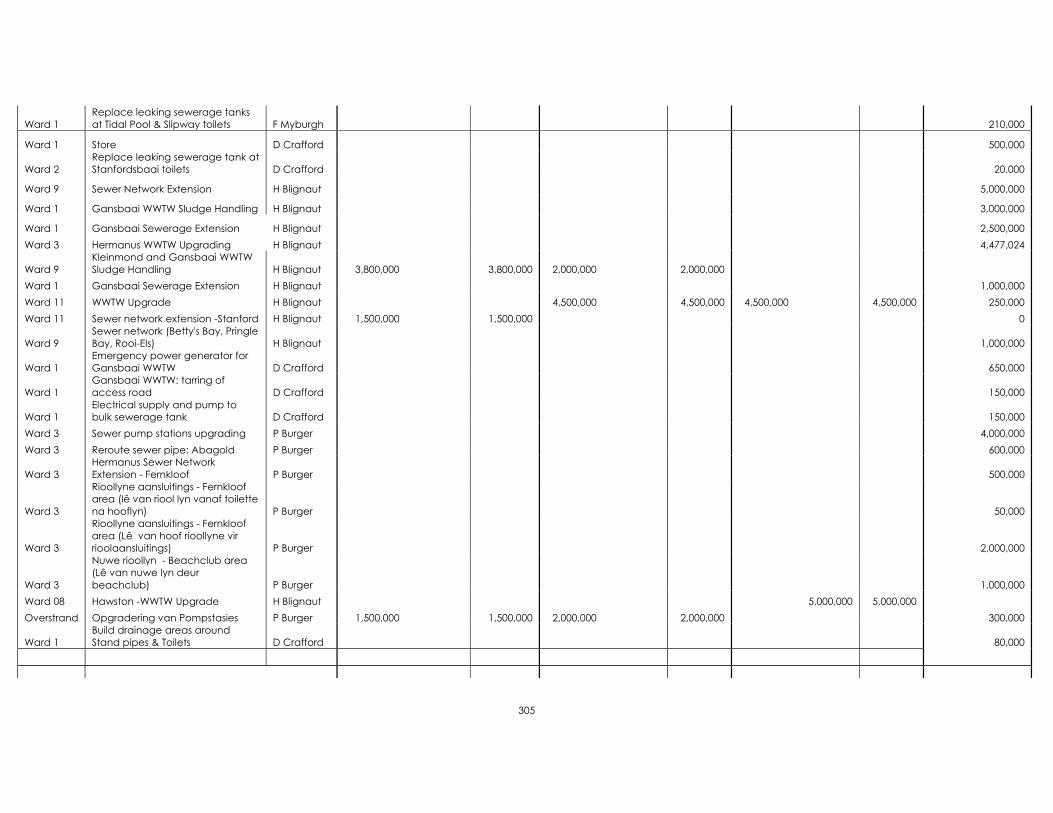
305
Ward 1 Replace leaking sewerage tanks at Tidal Pool & Slipway toilets F Myburgh 210,000
Ward 1 Store D Crafford 500,000
Ward 2 Replace leaking sewerage tank at Stanfordsbaai toilets D Crafford 20,000
Ward 9 Sewer Network Extension H Blignaut 5,000,000
Ward 1 Gansbaai WWTW Sludge Handling H Blignaut 3,000,000
Ward 1 Gansbaai Sewerage Extension H Blignaut 2,500,000 Ward 3 Hermanus WWTW Upgrading H Blignaut 4,477,024
Ward 9 Kleinmond and Gansbaai WWTW Sludge Handling H Blignaut 3,800,000 3,800,000 2,000,000 2,000,000
Ward 1 Gansbaai Sewerage Extension H Blignaut 1,000,000 Ward 11 WWTW Upgrade H Blignaut 4,500,000 4,500,000 4,500,000 4,500,000 250,000 Ward 11 Sewer network extension -Stanford H Blignaut 1,500,000 1,500,000 0
Ward 9 Sewer network (Betty's Bay, Pringle Bay, Rooi-Els) H Blignaut 1,000,000
Ward 1 Emergency power generator for Gansbaai WWTW D Crafford 650,000
Ward 1 Gansbaai WWTW: tarring of access road D Crafford 150,000
Ward 1 Electrical supply and pump to bulk sewerage tank D Crafford 150,000
Ward 3 Sewer pump stations upgrading P Burger 4,000,000 Ward 3 Reroute sewer pipe: Abagold P Burger 600,000
Ward 3 Hermanus Sewer Network Extension - Fernkloof P Burger 500,000
Ward 3
Rioollyne aansluitings - Fernkloof area (lê van riool lyn vanaf toilette na hooflyn) P Burger 50,000
Ward 3
Rioollyne aansluitings - Fernkloof area (Lê van hoof rioollyne vir rioolaansluitings) P Burger 2,000,000
Ward 3
Nuwe rioollyn - Beachclub area (Lê van nuwe lyn deur beachclub) P Burger 1,000,000
Ward 08 Hawston -WWTW Upgrade H Blignaut 5,000,000 5,000,000 Overstrand Opgradering van Pompstasies P Burger 1,500,000 1,500,000 2,000,000 2,000,000 300,000
Ward 1 Build drainage areas around Stand pipes & Toilets D Crafford 80,000

306
1400 - STORM WATER 0 0 0 0 0 0 0 0 0
Ward 1 Implementation of Storm water Master Plan D Hendirks 1,000,000
All Storm water D Crafford 200,000
Overstrand Storm water problem areas - Greater Hermanus Area P Burger 500,000
Ward 4 S/W Kerk street P Burger 100,000
Ward 4 Storm water at High School P Burger 100,000
Ward 4 Eastcliff - Mosselrivier 57, Storm water P Burger 60,000
Ward 6 Storm water - Zwelihle P Burger 500,000
Ward 7 Storm water - Long street P Burger 1,200,000
Ward 7 Myrtle street 4 - Storm water P Burger 200,000
Ward 8 Storm water P Burger 200,000
Ward 8 Storm water upgrade - Kerk street P Burger 100,000
Ward 8 Duke Road 17a - Storm water P Burger 40,000
Ward 7 Chiappini street - Storm water P Burger 150,000
Ward 10 Betty's bay - Storm water (0tter close) C Harding 763,500
Ward 2 Underground storm water pipes D Crafford 1,000,000
Ward 4 Storm water - Steenbok Street P Burger 100,000
Ward 10 Storm water – phase 3 : stream – Buffels road C Harding 3,934,734
Ward 7 Onrus storm water (Main road) - Kidbrook P Burger 500,000
Ward 7 Rheezicht close - Storm water P Burger 500,000
Ward 10 Storm water drainage- Silver sands area C Harding 1,000,000
Ward 8 Stormwaterpype - Essex Weg Sirkel P Burger 150,000 Ward 3 Stormwaterpype - Flat Str P Burger 50,000 Ward 3 Stormwaterpype - Hope Str P Burger 50,000
Ward 9 Upgrade stormwater channels to stormwater pipes - Kleinmond
D van Rhodie 500,000
Ward 10 Storm water drainage- Silver sands area
D van Rhodie 500,000
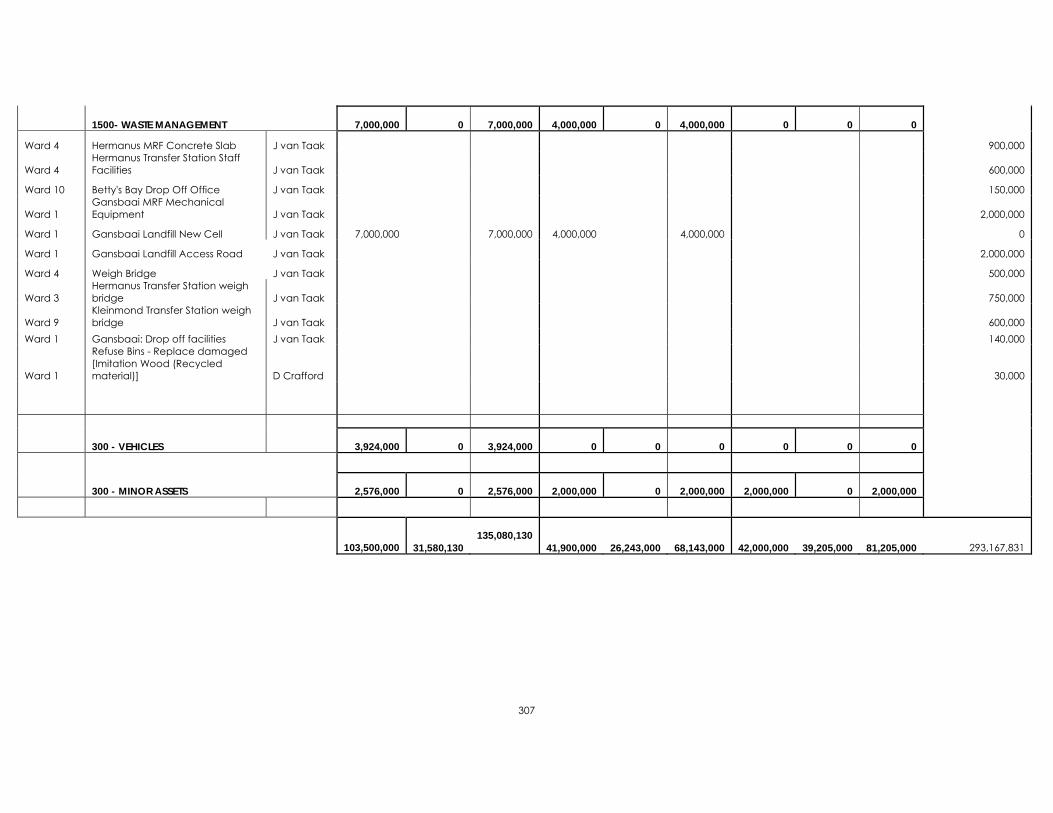
307
1500- WASTE MANAGEMENT 7,000,000 0 7,000,000 4,000,000 0 4,000,000 0 0 0
Ward 4 Hermanus MRF Concrete Slab J van Taak 900,000
Ward 4 Hermanus Transfer Station Staff Facilities J van Taak 600,000
Ward 10 Betty's Bay Drop Off Office J van Taak 150,000
Ward 1 Gansbaai MRF Mechanical Equipment J van Taak 2,000,000
Ward 1 Gansbaai Landfill New Cell J van Taak 7,000,000 7,000,000 4,000,000 4,000,000 0
Ward 1 Gansbaai Landfill Access Road J van Taak 2,000,000
Ward 4 Weigh Bridge J van Taak 500,000
Ward 3 Hermanus Transfer Station weigh bridge J van Taak 750,000
Ward 9 Kleinmond Transfer Station weigh bridge J van Taak 600,000
Ward 1 Gansbaai: Drop off facilities J van Taak 140,000
Ward 1
Refuse Bins - Replace damaged [Imitation Wood (Recycled material)] D Crafford 30,000
300 - VEHICLES 3,924,000 0 3,924,000 0 0 0 0 0 0
300 - MINOR ASSETS 2,576,000 0 2,576,000 2,000,000 0 2,000,000 2,000,000 0 2,000,000
103,500,000 31,580,130
135,080,130
41,900,000 26,243,000 68,143,000 42,000,000 39,205,000 81,205,000 293,167,831

308
Reconciliation of IDP strategic objectives and budget (revenue)
Strategic Objective Goal Goal Code
Ref 2008/9 2009/10 2010/11 Current Year 2011/12 2012/13 Medium Term Revenue &
Expenditure Framework
R thousand Audited
Outcome Audited
Outcome Audited
Outcome Original Budget
Adjusted Budget
Full Year Forecast
Budget Year
2012/13
Budget Year +1 2013/14
Budget Year +2 2014/15
Provision of democratic and accountable governance Corporate Governance
169,121
219,230
280,927
238,944
244,356
244,356
215,953
218,783
234,518
Provison and maintenance of municipal services Municipal Services
251,010
309,363
365,413
438,250
422,439
422,439
494,466
519,946
566,345
Encouragement of structure community participation in the matters of the municipality
Community Participation
40,194 43,073 46,596
Creation and maintenance of a safe and healthy environment Environmental Conservation & Public Safety
7,898
6,558
9,666
9,826
12,003 12,003 11,351 11,713 12,411
Promotion of tourism, economic and social develeopment Local Economic Development & Tourism
118
2,264
7,520
4,200
6,539 6,539 4,105
Allocations to other priorities 2 Total Revenue (excluding capital transfers and contributions) 1
428,146
537,414
663,526
691,220
685,337
685,337
766,069
793,515
859,869
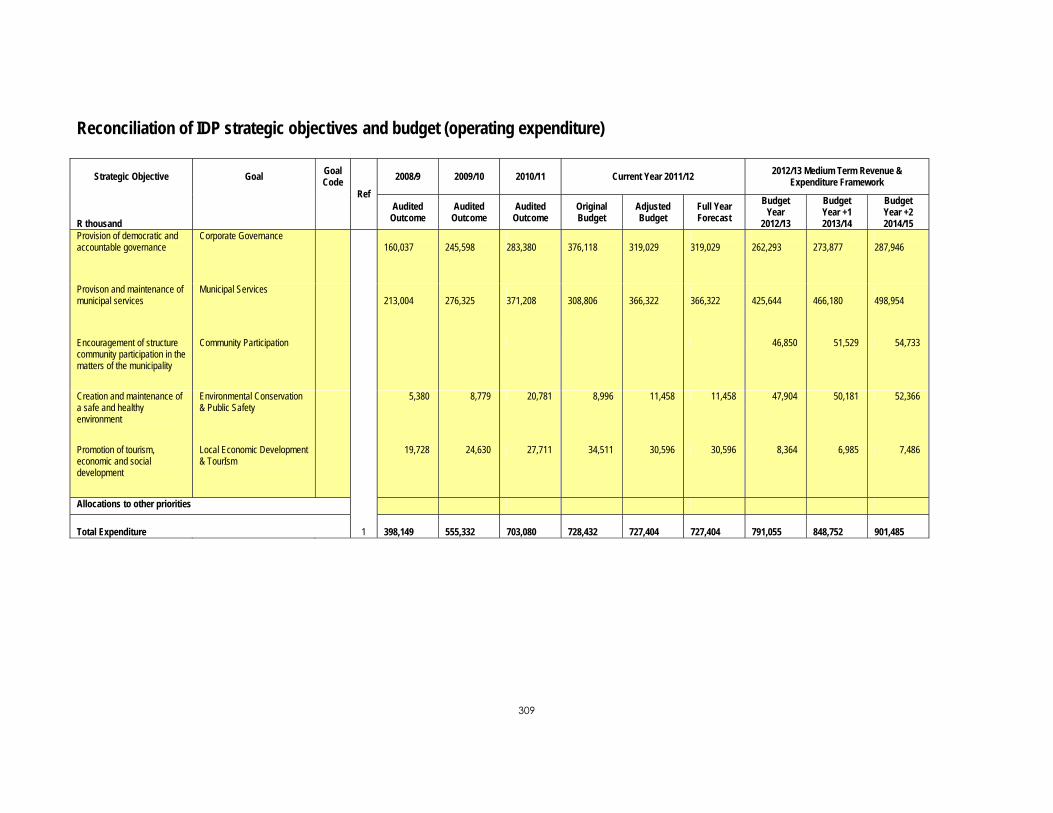
309
Reconciliation of IDP strategic objectives and budget (operating expenditure)
Strategic Objective Goal Goal Code
Ref 2008/9 2009/10 2010/11 Current Year 2011/12 2012/13 Medium Term Revenue &
Expenditure Framework
R thousand Audited
Outcome Audited
Outcome Audited
Outcome Original Budget
Adjusted Budget
Full Year Forecast
Budget Year
2012/13
Budget Year +1 2013/14
Budget Year +2 2014/15
Provision of democratic and accountable governance
Corporate Governance 160,037
245,598
283,380
376,118
319,029
319,029
262,293
273,877
287,946
Provison and maintenance of municipal services
Municipal Services 213,004
276,325
371,208
308,806
366,322
366,322
425,644
466,180
498,954
Encouragement of structure community participation in the matters of the municipality
Community Participation 46,850 51,529 54,733
Creation and maintenance of a safe and healthy environment
Environmental Conservation & Public Safety
5,380 8,779 20,781 8,996 11,458 11,458 47,904 50,181 52,366
Promotion of tourism, economic and social development
Local Economic Development & TourIsm
19,728 24,630 27,711 34,511 30,596 30,596 8,364 6,985 7,486
Allocations to other priorities
Total Expenditure 1 398,149
555,332
703,080
728,432
727,404
727,404
791,055
848,752
901,485

310
Reconciliation of IDP strategic objectives and budget (capital expenditure)
Strategic Objective Goal Goal Code
Ref 2008/9 2009/10 2010/11 Current Year 2011/12 2012/13 Medium Term Revenue &
Expenditure Framework
R thousand Audited
Outcome Audited
Outcome Audited
Outcome Original Budget
Adjusted Budget
Full Year Forecast
Budget Year
2012/13
Budget Year +1 2013/14
Budget Year +2 2014/15
Provision of democratic and accountable governance
Corporate Governance A 16,100 2,050 2,000
Provison and maintenance of municipal services
Municipal Services B 1,892 200 296 790 1,111 1,111 150,228
87,070 92,616
Encouragement of structure community participation in the matters of the municipality
Community Participation C 5,700 5,942 5,942
Creation and maintenance of a safe and healthy environment
Environmental Conservation & Public Safety
D 14,181 23,671 53,668 28,965 48,985 48,985 297
Promotion of tourism, economic and social development
Local Economic Development & TourIsm
E 158,136
91,500 100,154
178,516
130,151
130,151
2,418
Allocations to other priorities 3
Total Capital Expenditure 1 174,209
115,371
154,117
213,971
186,189
186,189
169,043 89,120 94,616

311
Mapping of Sector Projects for the 2012/2013

312


![TEASER PORTFOLIO [MAY2012]](https://img.pdfslide.us/doc/110x75/568c0f391a28ab955a9354e5/teaser-portfolio-may2012.jpg)

