Embed Size (px)
Citation preview


June 2005 05/21/WQPC-WWF
EPA 600/R-05/085
Environmental Technology Verification Report
Stormwater Source Area Treatment Device
Practical Best Management of Georgia, Inc. CrystalStream™ Water Quality Vault Model 1056
Prepared by
NSF International
Under a Cooperative Agreement with U.S. Environmental Protection Agency

Environmental Technology Verification Report
Stormwater Source Area Treatment Device
Practical Best Management of Georgia, Inc. CrystalStream™ Water Quality Vault, Model 1056
Prepared by: NSF International
Ann Arbor, Michigan 48105
Under a cooperative agreement with the U.S. Environmental Protection Agency
Raymond Frederick, Project Officer ETV Water Quality Protection Center
National Risk Management Research Laboratory Water Supply and Water Resources Division
U.S. Environmental Protection Agency Edison, New Jersey
June 2005

THE ENVIRONMENTAL TECHNOLOGY VERIFICATION PROGRAM
U.S. Environmental Protection Agency NSF International
ETV Joint Verification Statement
TECHNOLOGY TYPE: STORMWATER TREATMENT TECHNOLOGY
APPLICATION: SUSPENDED SOLIDS AND ROADWAY POLLUTANT TREATMENT
TECHNOLOGY NAME: CRYSTALSTREAM™ WATER QUALITY VAULT MODEL 1056
TEST LOCATION: GRIFFIN, GEORGIA
COMPANY: PRACTICAL BEST MANAGEMENT OF GEORGIA, INC.
ADDRESS: 1960-C Parker Court PHONE: (800) 748-6945 Stone Mountain, Georgia 30087 FAX: (770) 979-6954
WEB SITE: http://www.crystalstream.com
EMAIL: [email protected]
NSF International (NSF), in cooperation with the U.S. Environmental Protection Agency (EPA), operates the Water Quality Protection Center (WQPC), one of six centers under Environmental Technology Verification (ETV) Program. The WQPC recently evaluated the performance of the CrystalStream™ Water Quality Vault, Model 1056 (CrystalStream) distributed by Practical Best Management of Georgia, Inc. (PBM). The system was installed in a city-owned right-of-way near downtown Griffin, Georgia. The testing organization (TO) was Paragon Consulting Group (PCG) of Griffin, Georgia.
EPA created ETV to facilitate the deployment of innovative or improved environmental technologies through performance verification and dissemination of information. The goal of the ETV program is to further environmental protection by accelerating the acceptance and use of improved and more costeffective technologies. ETV seeks to achieve this goal by providing high quality, peer-reviewed data on technology performance to those involved in the design, distribution, permitting, purchase, and use of environmental technologies.
ETV works in partnership with recognized standards and testing organizations; stakeholder groups, which consist of buyers, vendor organizations, and permitters; and with the full participation of individual technology developers. The program evaluates the performance of innovative technologies by developing test plans that are responsive to the needs of stakeholders, conducting field or laboratory tests (as appropriate), collecting and analyzing data, and preparing peer-reviewed reports. All evaluations are conducted in accordance with rigorous quality assurance protocols to ensure that data of known and adequate quality are generated and that the results are defensible.
05/25/WQPC-WWF The accompanying notice is an integral part of this verification statement. June 2005
VS-i

TECHNOLOGY DESCRIPTION
The following description of the CrystalStream was provided by the vendor and does not represent verified information.
The CrystalStream is a device that removes trash, debris, and larger particulates from stormwater. The device consists of a reservoir, trash basket, oil collection buckets, baffles, and adsorbents, enclosed in a pre-cast concrete vault.
The CrystalStream works on the principle that things less dense than water float and things more dense than water sink. The device remains full of water at all times. A reservoir spans the device from side to side and nearly to the bottom, blocking flow from going directly to the outlet. Incoming storm water flows through a fine mesh in the trash basket, capturing floating debris and vegetative matter. The bottom of the trash basket lies above the standing water elevation in the CrystalStream, preventing the debris from becoming waterlogged, decomposing, and sinking to the bottom of the tank. The water passes around baffles, slowing and spreading the flow, allowing sediments to settle and hydrocarbons to float on the water surface and into a hydrocarbon reservoir. As the water rises out of the unit in the outlet chamber it passes through a 3/4-inch thick coconut fiber filter, designed to remove smaller floating or suspended materials.
The vendor claims that the CrystalStream installed at the Griffin, Georgia site was designed to receive runoff from the drainage area up to a flow rate of 17.5 cfs (7,850 gpm), and can collect as much as 800 lb of material per acre of drainage basin every year.
VERIFICATION TESTING DESCRIPTION
Methods and Procedures
The test methods and procedures used during the study are described in the Environmental Technology Verification Test Plan For Practical Best Management CrystalStream™ Water Quality Vault, TEA-21 Project Area, City of Griffin, Spalding County, Georgia, (NSF, June 2003). The CrystalStream treats runoff collected from a drainage basin slightly larger than four acres.
Verification testing consisted of collecting data during a minimum of 15 qualified events that met the following criteria:
• The total rainfall depth for the event, measured at the site, was 0.2 in. (5 mm) or greater; • Flow through the treatment device was successfully measured and recorded over the duration of
the runoff period; • A flow-proportional composite sample was successfully collected for both the influent and
effluent over the duration of the runoff event; • Each composite sample was comprised of a minimum of five aliquots, including at least two
aliquots on the rising limb of the runoff hydrograph, at least one aliquot near the peak, and at least two aliquots on the falling limb of the runoff hydrograph; and
• There was a minimum of six hours between qualified sampling events.
Automated sample monitoring and collection devices were installed and programmed to collect composite samples from the influent, the treated effluent, and the untreated bypass during qualified flow events. In addition to the flow and analytical data, operation and maintenance (O&M) data were recorded. Samples were analyzed for sediments (total suspended solids [TSS] and suspended solids concentration [SSC]) and nutrients (total nitrate, total nitrite, total Kjeldahl nitrogen [TKN], and total phosphorus). The SSC analysis included a “sand-silt” split which quantified the percentage of the sample’s sediment particles greater than and less than 62.5 µm.
05/25/WQPC-WWF The accompanying notice is an integral part of this verification statement. June 2005
VS-ii

VERIFICATION OF PERFORMANCE
A total of 15 qualified storm events were sampled over a 17-month time period.
Test Results
The precipitation data for the qualified storm events are summarized in Table 1.
Table 1. Rainfall Data Summary
Rainfall Rainfall Runoff Event Start Start Amount Duration Volume
Number Date Time (inches) (hr:min) (gal)1
1 3/26/03 19:55 0.36 2:40 13,800 2 5/5/03 0:45 0.49 1:15 32,900 3 1/25/04 1:25 0.25 4:15 2,890 4 4/13/04 19:25 0.89 9:25 20,240 5 4/26/04 11:15 0.21 3:50 10,600 6 4/30/04 21:05 0.78 8:15 16,600 7 6/25/04 13:25 0.27 6:20 4,265 8 6/28/04 22:40 0.45 2:25 9,730 9 6/30/04 19:25 1.12 3:05 44,800
10 7/12/04 14:45 0.34 0:30 9,040 11 7/17/04 15:00 0.27 0:20 9,700 12 7/25/04 21:40 0.77 4:25 22,400 13 8/5/04 18:55 0.63 0:50 15,400 14 8/12/04 1:20 0.49 2:50 17,100 15 8/21/04 15:40 0.23 1:15 5,870
1 Runoff volume was measured at the outlet monitoring point. Refer to the verification report for an explanation of the rationale for utilizing the volume data from the outlet monitoring point
The monitoring results were evaluated using event mean concentration (EMC) and sum of loads (SOL) comparisons. The EMC or efficiency ratio comparison evaluates treatment efficiency on a percentage basis by dividing the effluent concentration by the influent concentration and multiplying the quotient by 100. The efficiency ratio was calculated for each analytical parameter and each individual storm event. The SOL comparison evaluates the treatment efficiency on a percentage basis by comparing the sum of the influent and effluent loads (the product of multiplying the parameter concentration by the precipitation volume) for all 15 storm events. The calculation is made by subtracting the quotient of the total effluent load divided by the total influent load from one, and multiplying by 100. SOL results can be summarized on an overall basis since the loading calculation takes into account both the concentration and volume of runoff from each event. The analytical data ranges, EMC range, and SOL reduction values are shown in Table 2.
05/25/WQPC-WWF The accompanying notice is an integral part of this verification statement. June 2005
VS-iii

Table 2. Analytical Data, EMC Range, and SOL Reduction Results
EMC SOL
Parameter Units Inlet
Range Outlet Range
Range (%)
Reduction (%)1
TSS mg/L 12 – 190 12 – 140 -120 – 68 21 SSC mg/L 38 – 4,400 33 – 200 -41 – 98 89 Total nitrite2 mg/L as N <0.01 – 0.03 <0.01 – 0.02 -100 – 83 50 Total nitrate mg/L as N 0.09 – 0.66 0.07 – 0.7 -90 – 50 25 TKN mg/L as N 0.6 – 2.4 0.5 – 2.0 -14 – 44 13 Total phosphorus mg/L as P 0.02 – 0.58 0.08 – 0.3 -600 – 76 40
1. SOL reductions were calculated using outlet flow volumes for inlet and outlet flow data. 2. Total nitrite inlet and outlet concentrations were close to or below method detection limits, so the EMC and
SOL reduction may not be indicative of the actual CrystalStream nitrite treatment capabilities.
A “sand-silt split” analysis on samples submitted for SSC analysis when adequate sample volume was collected. The analysis identified that the runoff entering the CrystalStream contained a proportion of coarse sediment ranging from 17.8 to 93.9%, while the outlet contained a proportion of coarse sediment ranging from 6.20 to 33.1%. The sand-silt split and SSC concentration data were used to recalculate the SOL, which showed that the CrystalStream achieved a 98% SOL reduction of sand and a 34% SOL reduction of silt.
System Operation
The device was delivered and placed by PBM into an excavation prepared by a site contractor. A PBM employee was on site to supervise the installation. According to the vendor, it is PBM policy to provide delivery and crane services, and to provide a PBM representative on site to assure proper installation. The device was shipped fully assembled and operational. The site contractor attached the pipes and backfilled the installation site.
Debris accumulated in the CrystalStream’s trash basket to the point where it caused water to back up to a level of 16 to 20 in. in the 24-in. inlet pipe during ten of the eleven qualified events in which it was installed. The basket was removed by the TO during events 3 through 6, and during these events, the backup did not occur. The debris accumulating in the trash basket restricted flow into the vault. Inspections conducted by the TO and vendor identified items such as roofing shingles, leaves, twigs, trash, rocks, concrete, and sediment in the trash basket. The CrystalStream can operate without the trash basket in place, but the vendor notes this could decrease removal efficiencies.
PBM recommends that the CrystalStream be inspected every 90 days, and maintained every 180 days or as site conditions warrant. PBM offers inspection and maintenance as part of its service. PBM conducted the inspection and maintenance of the CrystalStream installed at Griffin, and computed the mass of material retained in the vault per acre of drainage basin per year. Their findings are summarized in the vendor comments section of the verification report.
A sample of the retained solids was collected and analyzed for toxicity characteristic leachate procedure (TCLP) metals and was determined to be non-hazardous.
05/25/WQPC-WWF The accompanying notice is an integral part of this verification statement. June 2005
VS-iv

Quality Assurance/Quality Control
NSF personnel completed a technical systems audit during testing to ensure that the testing was in compliance with the test plan. NSF also completed a data quality audit of at least 10% of the test data to ensure that the reported data represented the data generated during testing. In addition to QA/QC audits performed by NSF, EPA personnel conducted an audit of NSF's QA Management Program.
Original signed by Original signed by Sally Gutierrez September 2, 2005 Thomas Stevens September 7, 2005 Sally Gutierrez Date Thomas G. Stevens, P.E. Date Acting Director Project Manager National Risk Management Laboratory Water Quality Protection Center Office of Research and Development NSF International United States Environmental Protection Agency
NOTICE: Verifications are based on an evaluation of technology performance under specific, predetermined criteria and the appropriate quality assurance procedures. EPA and NSF make no expressed or implied warranties as to the performance of the technology and do not certify that a technology will always operate as verified. The end user is solely responsible for complying with any and all applicable federal, state, and local requirements. Mention of corporate names, trade names, or commercial products does not constitute endorsement or recommendation for use of specific products. This report is not an NSF Certification of the specific product mentioned herein.
Availability of Supporting Documents Copies of the ETV Verification Protocol, Stormwater Source Area Treatment Technologies Draft 4.1, March 2002, the verification statement, and the verification report (NSF Report Number 05/25/WQPC-WWF) are available from:
ETV Water Quality Protection Center Program Manager (hard copy) NSF International
P.O. Box 130140 Ann Arbor, Michigan 48113-0140
NSF website: http://www.nsf.org/etv (electronic copy) EPA website: http://www.epa.gov/etv (electronic copy) Appendices are not included in the verification report, but are available from NSF upon request.
05/25/WQPC-WWF The accompanying notice is an integral part of this verification statement. June 2005
VS-v

Notice
The U.S. Environmental Protection Agency (EPA) through its Office of Research and Development has financially supported and collaborated with NSF International (NSF) under a Cooperative Agreement. The Water Quality Protection Center (WQPC), operating under the Environmental Technology Verification (ETV) Program, supported this verification effort. This document has been peer reviewed and reviewed by NSF and EPA and recommended for public release. Mention of trade names or commercial products does not constitute endorsement or recommendation by the EPA for use, nor does it constitute certification by NSF.
i

Foreword
The following is the final report on an Environmental Technology Verification (ETV) test performed for NSF International (NSF) and the United States Environmental Protection Agency (EPA). The verification test for the Practical Best Management of Georgia, Inc. CrystalStream™ Model 1056 Water Quality Vault was conducted at a testing site in Griffin, Georgia, maintained by the City of Griffin Public Works and Stormwater Department.
The EPA is charged by Congress with protecting the Nation’s land, air, and water resources. Under a mandate of national environmental laws, the Agency strives to formulate and implement actions leading to a compatible balance between human activities and the ability of natural systems to support and nurture life. To meet this mandate, EPA’s research program is providing data and technical support for solving environmental problems today and building a science knowledge base necessary to manage our ecological resources wisely, understand how pollutants affect our health, and prevent or reduce environmental risks in the future.
The National Risk Management Research Laboratory (NRMRL) is the Agency’s center for investigation of technological and management approaches for preventing and reducing risks from pollution that threaten human health and the environment. The focus of the Laboratory’s research program is on methods and their cost-effectiveness for prevention and control of pollution to air, land, water, and subsurface resources; protection of water quality in public water systems; remediation of contaminated sites, sediments and ground water; prevention and control of indoor air pollution; and restoration of ecosystems. NRMRL collaborates with both public and private sector partners to foster technologies that reduce the cost of compliance and to anticipate emerging problems. NRMRL’s research provides solutions to environmental problems by: developing and promoting technologies that protect and improve the environment; advancing scientific and engineering information to support regulatory and policy decisions; and providing the technical support and information transfer to ensure implementation of environmental regulations and strategies at the national, state, and community levels.
This publication has been produced as part of the Laboratory’s strategic long-term research plan. It is published and made available by EPA’s Office of Research and Development to assist the user community and to link researchers with their clients.
ii

Contents
Verification Statement ...............................................................................................................VS-i Notice............................................................................................................................................... i Foreword ......................................................................................................................................... ii Contents ......................................................................................................................................... iii Figures............................................................................................................................................ iv Tables............................................................................................................................................. iv Abbreviations and Acronyms ..........................................................................................................v Chapter 1 Introduction .....................................................................................................................1
1.1 ETV Purpose and Program Operation.............................................................................. 1 1.2 Testing Participants and Responsibilities......................................................................... 1
1.2.1 U.S. Environmental Protection Agency ......................................................... 2 1.2.2 Verification Organization................................................................................ 2 1.2.3 Testing Organization ....................................................................................... 3 1.2.4 Analytical Laboratories ................................................................................... 4 1.2.5 Vendor............................................................................................................. 5 1.2.6 Verification Testing Site ................................................................................. 5
Chapter 2 Technology Description ..................................................................................................6 2.1 Treatment System Description ......................................................................................... 6 2.2 Product Specifications...................................................................................................... 72.3 Operation and Maintenance ............................................................................................. 7 2.4 Technology Application and Limitations......................................................................... 7 2.5 Performance Claim........................................................................................................... 8
Chapter 3 Test Site Description .......................................................................................................9 3.1 Location and Land Use .................................................................................................... 9 3.2 Contaminant Sources and Site Maintenance.................................................................... 9 3.3 Stormwater Conveyance System and Receiving Water................................................. 10 3.4 Rainfall and Peak Flow Calculations ............................................................................. 11 3.5 CrystalStream Installation .............................................................................................. 12
Chapter 4 Sampling Procedures and Analytical Methods .............................................................13 4.1 Sampling Locations........................................................................................................ 13
4.1.1 Inlet................................................................................................................ 13 4.1.2 Outlet............................................................................................................. 13 4.1.3 Rain Gauge.................................................................................................... 13
4.2 Monitoring Equipment ................................................................................................... 13 4.3 Constituents Analyzed.................................................................................................... 144.4 Sampling Schedule......................................................................................................... 14 4.5 Field Procedures for Sample Handling and Preservation............................................... 15
Chapter 5 Monitoring Results and Discussion...............................................................................16 5.1 Rainfall Data .................................................................................................................. 16 5.2 Monitoring Results: Performance Parameters............................................................... 17
5.2.1 Concentration Efficiency Ratio..................................................................... 17 5.2.2 Sum of Loads ................................................................................................ 20
5.3 Particle Size Distribution ............................................................................................... 24Chapter 6 QA/QC Results and Summary ......................................................................................25
6.1 Laboratory/Analytical Data QA/QC .............................................................................. 25
iii

6.1.1 Bias (Field Blanks)........................................................................................ 25 6.1.2 Replicates (Precision).................................................................................... 25 6.1.3 Accuracy........................................................................................................ 27 6.1.4 Representativeness ........................................................................................ 28 6.1.5 Completeness ................................................................................................ 29
Chapter 7 Operations and Maintenance Activities ........................................................................30 7.1 System Operation ........................................................................................................... 30 7.2 System Maintenance ...................................................................................................... 30
7.2.1 Waste Characterization ................................................................................. 30 Chapter 8 References .....................................................................................................................33 Appendices.....................................................................................................................................34
A CrystalStream Design and O&M Guidelines..................................................................... 34 B Verification Test Plan ........................................................................................................ 34 C Event Hydrographs and Rain Distribution......................................................................... 34 D Analytical Data Reports with QC ...................................................................................... 34
Figures
Figure 2-1. Schematic drawing of the CrystalStream.................................................................... 6 Figure 3-1. As-built drawing for the CrystalStream installation. ................................................ 10 Figure 3-2. Drainage basin map for the CrystalStream installation............................................. 11
Tables
Table 4-1. Constituent List for Water Quality Monitoring.......................................................... 14 Table 5-1. Summary of Events Monitored for Verification Testing ........................................... 17 Table 5-2. Monitoring Results and Efficiency Ratios for Sediment Parameters......................... 18 Table 5-3. Monitoring Results and Efficiency Ratios for Nutrients............................................ 19 Table 5-4. Sum of Loads Results Calculated Using Various Flow Volumes.............................. 21 Table 5-5. Sediment Sum of Loads Results (Using Outlet Flow Data)....................................... 21 Table 5-6. Nutrients Sum of Loads Results ................................................................................. 23 Table 5-7. Particle Size Distribution Analysis Results................................................................ 24 Table 6-1. Field Blank Analytical Data Summary....................................................................... 25 Table 6-2. Field Duplicate Sample Relative% Difference Data Summary ................................. 26 Table 6-3. Laboratory Duplicate Sample Relative% Difference Data Summary........................ 27 Table 6-4. Laboratory MS/MSD Data Summary......................................................................... 28 Table 6-5. Laboratory Control Sample Data Summary ............................................................... 28 Table 7-1. Operation and Maintenance During Verification Testing .......................................... 32 Table 7-2. TCLP Results for Cleanout Solids ............................................................................. 30
iv

Abbreviations and Acronyms
ASI Analytical Services, Inc. BMP Best management practice cfs Cubic feet per second EPA U.S. Environmental Protection Agency ETV Environmental Technology Verification ft2 Square feet ft3 Cubic feet gal Gallon gpm Gallon per minute hr Hour in. Inch kg Kilogram L Liters lb Pound NRMRL National Risk Management Research Laboratory mg/L Milligram per liter mm millimeters min minute N Nitrogen NSF NSF International O&M Operations and maintenance P Phosphorus PBM Practical Best Management of Georgia, Inc. PCG Paragon Consulting Group psi Pounds per square inch QA Quality assurance QC Quality control SOL Sum of loads SOP Standard Operating Procedure SSC Suspended solids concentration TCLP Toxicity Characteristic Leaching Procedure TKN Total Kjeldahl nitrogen TO Testing Organization (Paragon Consulting Group) TSS Total suspended solids USGS United States Geological Survey VO Verification Organization (NSF) WQPC Water Quality Protection Center yr year
v

Chapter 1Introduction
1.1 ETV Purpose and Program Operation
The U.S. Environmental Protection Agency (EPA) has created the Environmental Technology Verification (ETV) Program to facilitate the deployment of innovative or improved environmental technologies through performance verification and dissemination of information. The goal of the ETV program is to further environmental protection by substantially accelerating the acceptance and use of improved and more cost-effective technologies. ETV seeks to achieve this goal by providing high quality, peer reviewed data on technology performance to those involved in the design, distribution, permitting, purchase, and use of environmental technologies.
ETV works in partnership with recognized standards and testing organizations; stakeholder groups, which consist of buyers, vendor organizations, and permitters; and with the full participation of individual technology developers. The program evaluates the performance of innovative technologies by developing test plans that are responsive to the needs of stakeholders, conducting field or laboratory (as appropriate) testing, collecting and analyzing data, and preparing peer reviewed reports. All evaluations are conducted in accordance with rigorous quality assurance protocols to ensure that data of known and adequate quality are generated and that the results are defensible.
NSF International (NSF), in cooperation with the EPA, operates the Water Quality Protection Center (WQPC). The WQPC evaluated the performance of the Practical Best Management of Georgia, Inc. CrystalStream™ Model 1056 Water Quality Vault (CrystalStream), a stormwater treatment device designed to remove trash, debris, and large particulate from wet weather runoff.
It is important to note that verification of the equipment does not mean that the equipment is “certified” by NSF or “accepted” by EPA. Rather, it recognizes that the performance of the equipment has been determined and verified by these organizations for those conditions tested by the Testing Organization (TO).
1.2 Testing Participants and Responsibilities
The ETV testing of the CrystalStream was a cooperative effort among the following participants:
• U.S. Environmental Protection Agency • NSF International • Paragon Consulting Group, Inc. (PCG) • Analytical Services, Inc. (ASI) • United States Geological Survey (USGS) Sediment Laboratory • Practical Best Management of Georgia, Inc. (PBM)
The following is a brief description of each ETV participant and their roles and responsibilities.
1
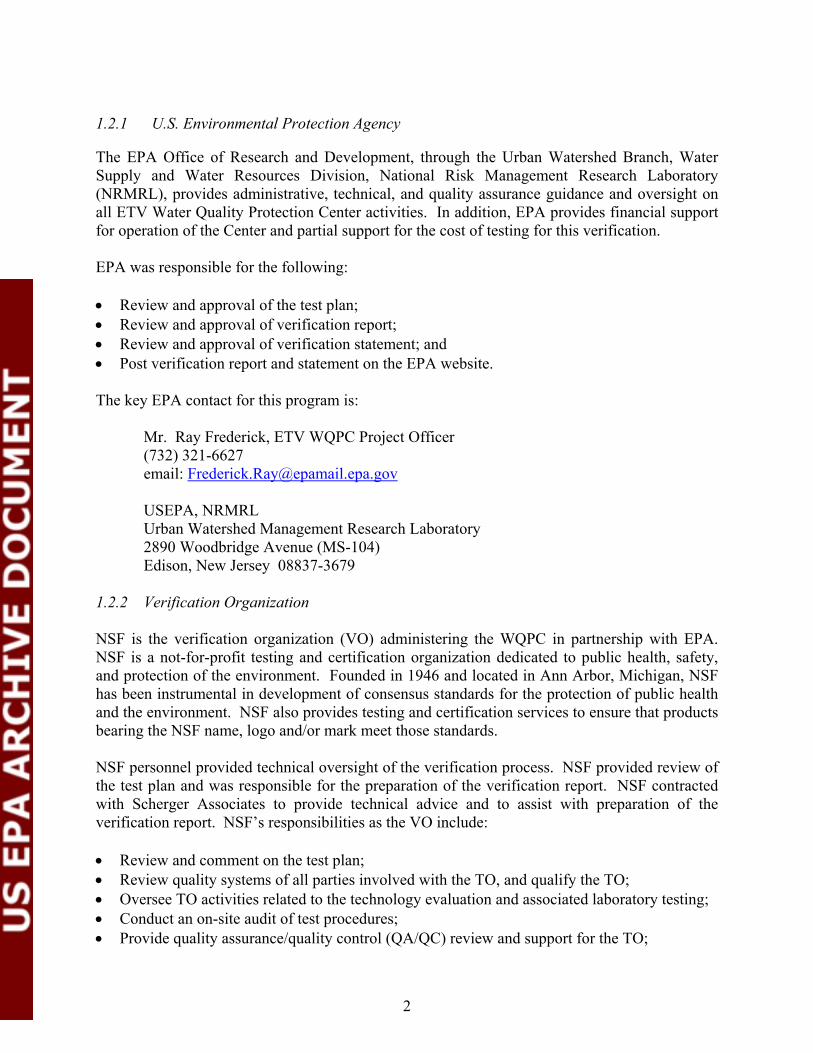
1.2.1 U.S. Environmental Protection Agency
The EPA Office of Research and Development, through the Urban Watershed Branch, Water Supply and Water Resources Division, National Risk Management Research Laboratory (NRMRL), provides administrative, technical, and quality assurance guidance and oversight on all ETV Water Quality Protection Center activities. In addition, EPA provides financial support for operation of the Center and partial support for the cost of testing for this verification.
EPA was responsible for the following:
• Review and approval of the test plan; • Review and approval of verification report; • Review and approval of verification statement; and • Post verification report and statement on the EPA website.
The key EPA contact for this program is:
Mr. Ray Frederick, ETV WQPC Project Officer (732) 321-6627 email: [email protected]
USEPA, NRMRL Urban Watershed Management Research Laboratory 2890 Woodbridge Avenue (MS-104) Edison, New Jersey 08837-3679
1.2.2 Verification Organization
NSF is the verification organization (VO) administering the WQPC in partnership with EPA. NSF is a not-for-profit testing and certification organization dedicated to public health, safety, and protection of the environment. Founded in 1946 and located in Ann Arbor, Michigan, NSF has been instrumental in development of consensus standards for the protection of public health and the environment. NSF also provides testing and certification services to ensure that products bearing the NSF name, logo and/or mark meet those standards.
NSF personnel provided technical oversight of the verification process. NSF provided review of the test plan and was responsible for the preparation of the verification report. NSF contracted with Scherger Associates to provide technical advice and to assist with preparation of the verification report. NSF’s responsibilities as the VO include:
• Review and comment on the test plan; • Review quality systems of all parties involved with the TO, and qualify the TO; • Oversee TO activities related to the technology evaluation and associated laboratory testing; • Conduct an on-site audit of test procedures; • Provide quality assurance/quality control (QA/QC) review and support for the TO;
2

• Oversee the development of the verification report and verification statement; and, • Coordinate with EPA to approve the verification report and verification statement.
Key contacts at NSF are:
Mr. Thomas Stevens, P.E. Mr. Patrick Davison Program Manager Project Coordinator
(734) 769-5347 (734) 913-5719 email: [email protected] email: [email protected]
NSF International 789 North Dixboro Road Ann Arbor, Michigan 48105 (734) 769-8010
Mr. Dale A. Scherger, P.E., Technical Consultant (734) 213-8150
email: [email protected]
Scherger Associates 3017 Rumsey Drive Ann Arbor, Michigan 48105
1.2.3 Testing Organization
The TO for the verification testing was Paragon Consulting Group, Inc. (PCG) of Griffin, Georgia (PCG). The TO was responsible for ensuring that the testing location and conditions allowed for the verification testing to meet its stated objectives. The TO prepared the test plan; oversaw the testing; and managed the data generated by the testing. TO employees set test conditions, and measured and recorded data during the testing. The TO’s Project Manager provided project oversight.
PCG had primary responsibility for all verification testing, including:
• Coordinate all testing and observations of the CrystalStream in accordance with the test plan; • Contract with the analytical laboratory, contractors and any other sub-contractors necessary
for implementation of the test plan; • Provide needed logistical support to the sub-consultants, as well as establishing a
communication network, and scheduling and coordinating the activities for the verification testing; and
• Manage data generated during the verification testing.
3

The key personnel and contacts for the TO are:
Ms. Courtney J. Nolan, P.E., Project Manager (770) 412-7700 email: [email protected]
Mr. Brian DeLony, Project Engineer (770) 412-7700
email: [email protected]
Paragon Consulting Group 118 North Expressway Griffin, Georgia 30223
1.2.4 Analytical Laboratories
Analytical Services, Inc. (ASI), located in Norcross, Georgia, analyzed the samples collected during the verification test.
The key ASI contact is:
Ms. Christin Ford (770) 734-4200 email: [email protected]
Analytical Services, Inc.110 Technology Parkway Norcross, Georgia 30092
USGS Kentucky District Sediment Laboratory analyzed the suspended sediment concentration (SSC) samples.
The key USGS laboratory contact is:
Ms. Elizabeth A. Shreve, Laboratory Chief (502) 493-1916 email: [email protected]
United States Geological Survey, Water Resources Division Northeastern Region, Kentucky District Sediment Laboratory 9818 Bluegrass Parkway Louisville, Kentucky 40299
4

1.2.5 Vendor
Practical Best Management of Georgia, Inc. (PBM) of Stone Mountain, Georgia, is the vendor of the CrystalStream, and was responsible for supplying a field-ready system. Vendor responsibilities include:
• Provide the technology and ancillary equipment required for the verification testing; • Provide technical support during the installation and operation of the technology; • Provide descriptive details about the capabilities and intended function of the technology; • Review and approve the test plan; and • Review and comment on the draft verification report and draft verification statement.
The key contact for PBM is:
Mr. John Moll, Design Engineering Chief (770) 979-6516 email: [email protected]
Practical Best Management of Georgia, Inc. 1960-C Parker Court Stone Mountain, Georgia 30087
1.2.6 Verification Testing Site
The CrystalStream was located within right-of-way on the west side of Fifth Street in Griffin, Georgia. A private contractor, Site Engineering, Inc, installed the system.
The key contact for City of Griffin Public Works and Stormwater Department is:
Mr. Brant Keller, Ph.D., Director (770) 229-6424 email: [email protected]
Public Works and Stormwater Department City of Griffin 134 North Hill Street Griffin, Georgia 30224
5

Chapter 2Technology Description
The following technology description was supplied by the vendor and does not represent verified information.
2.1 Treatment System Description
The CrystalStream is a device that removes trash, debris, and larger particulates from stormwater. The device consists of a reservoir, trash basket, oil collection buckets, baffles, and adsorbents, enclosed in a pre-cast concrete vault. A schematic of the CrystalStream is in Figure 2-1.
TRASH BASKET
BAFFLES
OIL A ND HYDROCARBON RESERVOIR
SEDIMENT CHAM BER
FIBER M ESH FILTER
Figure 2-1. Schematic drawing of the CrystalStream.
The CrystalStream works on the principle that objects less dense than water float and objects more dense than water sink. The device remains full of water at all times. A reservoir spans the device from side to side and nearly to the bottom, blocking flow from going directly to the outlet. Incoming storm water flows through a fine mesh in the trash basket, capturing floating debris and vegetative matter. The bottom of the trash basket lies above the standing water elevation in the CrystalStream, preventing the debris from becoming waterlogged, decomposing, and sinking. The water passes around baffles, slowing and spreading the flow and allowing hydrocarbons present in stormwater to float on the water surface. As the water level rises, the hydrocarbon sheen flows over the edge of the hydrocarbon reservoir and the water flows under the reservoir to the outflow pipe. The hydrocarbon reservoir provides 625 gal of emergency spill protection. As the water rises out of the unit in the outlet chamber it passes through a 3/4-in. thick coconut fiber filter, designed to remove smaller floating or suspended materials.
6

2.2 Product Specifications
CrystalStream Model 1056:
• Housing – Pre-cast concrete vault • Dimensions – 10 ft long, 5 ft wide, 7 ft deep (vault retains water at a depth of 3.9 ft) • Peak Hydraulic Treatment Capacity – 17.5 cfs • Sediment Storage – 2.0 yd3
2.3 Operation and Maintenance
According to PBM, the device is inspected every 90 days, and maintenance is performed on an as-needed basis (typically every six months). Maintenance consists of dewatering the reservoir and removing solids from the trash basket and reservoir, either by hand or by using a pump. The cleaning frequency may be increased or decreased according to demand. The device is accessed through a locked steel diamond-tread plate in three hinged pieces. The centerpiece is two feet wide, and the two hinged lid sections are 4.5 ft wide. Each lid section lifts from the piped side of the device, allowing complete access to the CrystalStream for maintenance.
2.4 Technology Application and Limitations
The CrystalStream is flexible in terms of the flow it can treat. By varying the holding the tank, trash basket, and hydrocarbon reservoir size, the treatment capacity can be modified to accommodate runoff from various size watersheds. The CrystalStream can be used to treat stormwater runoff in a wide variety of sites throughout the United States. For jurisdictional authorities, the system offers high levels of solids and debris removal and improved water quality. The CrystalStream may be used for development, roadways, ultra urban sites, and specialized applications. Typical development applications include parking lots, commercial and industrial sites, and high-density and single-family housing. Typical development applications also include maintenance, transportation and port facilities. Because the device typically has 0.1 to 0.2 ft of fall across the vault, it is ideal for retrofits.
The CrystalStream is a gross pollutant trap. Gross pollutant traps are utilized for the control of litter, trash, debris, coarse sediments and some oils. These gross pollutants are removed by physical separation and are transported by conveyance systems as bed load, suspended load, or floatables. Screening systems are not recommended for removal of fine sediments, although finer particles attached to larger particles would be removed. Additionally, absorbent inserts should be considered to capture entrained petroleum hydrocarbons.
7

2.5 Performance Claim
The CrystalStream’s performance for pollutant removal is dependent upon site conditions, sediment loading, particle size distribution, and environmental variables. PBM claims a unit with a screen will collect paper goods, metals and plastics. The CrystalStream installed at the Griffin, Georgia site was designed to receive runoff from the drainage area up to a flow rate of 17.5 cfs (7,850 gpm), and can collect as much as 200 lb of material per acre of drainage basin every 90 days.
8

Chapter 3Test Site Description
3.1 Location and Land Use
The CrystalStream is located at 84° 15' 16.8480" latitude 33° 14' 47.4360" longitude. These coordinates are based on Arcview’s Geographic Information System (GIS) utilizing state plane coordinates. Figure 3-1 is an as-built schematic of the test site and stormwater conveyance system. The stormwater enters the existing catch basin and flows via pipe approximately 110 ft east to the CrystalStream. The stormwater exits the CrystalStream and flows via pipe approximately 85 ft to Grape Creek. The property where the device is installed is located within the Taylor Street right-of-way at the Oak Hill Cemetery, which is owned by the City of Griffin.
Figure 3-2 identifies the drainage basin, the location of the unit, and the contours of the area. The drainage basin consists of approximately 4.05 acres, based on Arcview GIS coordinates. The basin consists of a storm sewer system with catch basins. No detention ponds are located upstream of the CrystalStream. None of the stormwater runoff from the drainage basin was pretreated prior to entering the CrystalStream.
The majority of the drainage basin consists of the cemetery property, paved roadways and parking areas. The drainage basin and surrounding area’s land use is mixed, with residential, commercial, and light industrial development. No major storage or use of hazardous materials or chemicals exists in the drainage basin. Moderate to heavy traffic volume runs along Taylor Street.
The nearest receiving water is Grape Creek, which is located approximately 85 ft east of the CrystalStream outlet. All stormwater generated from Highway 16 is carried via pipe flow to Grape Creek.
Griffin has many local ordinances to aide in stormwater management improvement and implementation of pollution control measures. Ordinances include establishment of the Stormwater Utility, Soil Erosion and Sediment Control, buffer width, and land disturbance requirements. The ordinances are included in Attachment D of the test plan.
3.2 Contaminant Sources and Site Maintenance
The main pollutant sources within the drainage basin are created by vehicular traffic, typical urban land use, and atmospheric deposition. Trash and debris accumulate on the surface and enter the stormwater system through large openings in the street inlets, sized to accommodate the large storm flows that can occur in this part of Georgia. The storm sewer catch basins do not have sumps. There are no other stormwater best management practices (BMPs) within the drainage area.
9

Figure 3-1. As-built drawing for the CrystalStream installation.
No maintenance activities, such as street sweeping or catch basin cleaning, were conducted in the area of the installation. Because Taylor Street is a State Highway, the Georgia Department of Transportation is responsible for maintenance activities along the road. According to Griffin Public Works Department personnel, if such activities were performed, Griffin would either be involved with the actions, or at least informed that the activities are to take place. Such maintenance activities are typically only performed during emergencies.
3.3 Stormwater Conveyance System and Receiving Water
As previously discussed, the nearest receiving water is Grape Creek, which is located approximately 85 ft east of the outlet location. All stormwater generated from Highway 16 is carried via pipe flow to Grape Creek. The CrystalStream was installed in this pipe, upstream of the discharge to Grape Creek.
10

Figure 3-2. Drainage basin map for the CrystalStream installation.
3.4 Rainfall and Peak Flow Calculations
The rainfall amounts for the one-, two-, ten-, and twenty-five year storms for the drainage basin are presented in Table 3-1. Table 3-2 presents the intensities in inches per hour calculated for the given rainfall depths. These data were utilized to generate the peak flows shown in Table 3-3. Table 3-4 presents the peak flow calculated using the time of concentration for the drainage basin.
Griffin requires that all storm drain systems be designed to accommodate the 25-yr storm. A 7.38-min time of concentration was determined for the basin, generating a peak runoff of 21.68 cfs for the 25-yr storm event. The rational method was used to calculate the peak flows for the device, since the drainage basin is just over four acres. The rationale for these calculations was discussed in the test plan.
11

Table 3-1. Rainfall Depth (in.)
Duration 1-yr 2-yr 10-yr 25-yr 30 min 0.53 1.19 1.81 2.10 1 hr 0.72 1.61 2.40 2.77 2 hr 1.00 2.00 2.98 3.46 12 hr 1.80 3.12 4.44 5.16 24 hr 1.68 3.36 4.80 5.52
Source: NOAA, 2000
Table 3-2. Intensities (inches/hour)
Duration 1-yr 2-yr 10-yr 25-yr 30 min. 1.05 2.38 3.61 4.20 1 hr 0.72 1.61 2.40 2.77 2 hr 0.50 1.00 1.49 1.73 12 hr 0.15 0.26 0.37 0.43 24 hr 0.07 0.14 0.20 0.23
Table 3-3. Peak Flow Calculations (cfs)
Duration 1-yr 2-yr 10-yr 25-yr 30 min 2.84 6.44 9.77 11.37 1 hr 2.00 4.36 6.49 7.50 2 hr 1.35 2.71 4.03 4.68 12 hr 0.30 0.70 1.00 1.16 24 hr 0.19 0.38 0.54 0.62
Table 3-4. Peak Flow Calculations (cfs) Using Time of Concentration
Duration 1-yr 2-yr 10-yr 25-yr 7.38 min 8.39 12.20 18.67 21.68
3.5 CrystalStream Installation
The device was delivered and placed by PBM into an excavation prepared by a site contractor. A PBM employee was on site to supervise the installation. PBM’s policy is to provide delivery and crane services, to provide a representative on site to assure safe installation, and to ensure that the device is properly leveled. The device was shipped fully assembled and operational. The site contractor attached the pipes, and back-filled the installation site.
12

Chapter 4Sampling Procedures and Analytical Methods
Descriptions of the sampling locations and methods used during verification testing are summarized in this section. The test plan presents the details on the approach used to verify the CrystalStream. This plan, Environmental Technology Verification Test Plan For Practical Best Management CrystalStream™ Water Quality Vault, TEA-21 Project Area, City of Griffin, Spalding County, Georgia, NSF, June 2003, is presented in Appendix B with all attachments. An overview of the key procedures used for this verification is presented below.
4.1 Sampling Locations
Two locations in the test site storm sewer system were selected as sampling and monitoring sites to determine the treatment capability of the CrystalStream.
4.1.1 Inlet
This sampling and monitoring site was selected to characterize the untreated stormwater from the drainage basin. A velocity/stage meter and sampler suction tubing were located in the inlet pipe, upstream from the CrystalStream so that potential backwater effects of the treatment device would not affect the velocity measurements.
4.1.2 Outlet
This sampling and monitoring site was selected to characterize the stormwater treated by the CrystalStream. A velocity/stage meter and sampler suction tubing, connected to the automated sampling equipment, were located in the pipe downstream from the CrystalStream.
4.1.3 Rain Gauge
A rain gauge was located adjacent to the drainage area at the inlet sampling station to monitor the amount of precipitation from storm events. The data were also used to characterize the events to determine if they met the requirements for a qualified storm event.
4.2 Monitoring Equipment
The specific equipment used for monitoring flow, sampling water quality, and measuring rainfall for the upstream and downstream monitoring points is listed below:
• Sampler: American Sigma 900MAX automatic sampler with DTU II data logger; • Sample Containers: Eight 1.9-L polyethylene bottles; • Flow Monitors: American Sigma Area/Velocity Flow Monitors; and • Rain Gauge: American Sigma Tipping Bucket Model 2149.
13

4.3 Constituents Analyzed
The list of constituents analyzed in the stormwater samples is shown in Table 4-1.
Table 4-1. Constituent List for Water Quality Monitoring
Method Reporting Detection
Parameter Units Limit Method1
Total suspended solids (TSS) mg/L 5 EPA 160.2 Suspended sediment concentration (SSC) mg/L 0.5 ASTM D3977-97
Total phosphorus mg/L as P 0.016 SM 4500-P B, E Total Kjeldahl nitrogen (TKN) mg/L as N 0.10 EPA 351.3 Nitrate and nitrite nitrogen mg/L as N 0.02 EPA 9056 Sand-silt split NA NA Fishman et al
1 EPA: EPA Methods and Guidance for the Analysis of Water procedures; ASTM: American Society of Testing and Materials procedures; SM: Standard Methods for the Examination of Water and Wastewater procedures; Fishman et al.: Approved Inorganic and Organic Methods for the Analysis of Water and Fluvial Sediment procedures; NA: Not applicable.
4.4 Sampling Schedule
The monitoring equipment was installed in August 2002. From September 2002 through March 2003, several trial events were monitored and the equipment tested and calibrated. Verification testing began in March 2003, and ended in August 2004. As defined in the test plan, “qualified” storm events met the following criteria:
• The total rainfall depth for the event, measured at the site rain gauge, was 0.2 in. (5 mm) or greater.
• Flow through the treatment device was successfully measured and recorded over the duration of the runoff period.
• A flow-proportional composite sample was successfully collected for both the influent and outlet over the duration of the runoff event.
• Each composite sample collected was comprised of a minimum of five aliquots, including at least two aliquots on the rising limb of the runoff hydrograph, at least one aliquot near the peak, and at least two aliquots on the falling limb.
• There was a minimum of six hours between qualified sampling events.
14

4.5 Field Procedures for Sample Handling and Preservation
Water samples were collected with Sigma automatic samplers programmed to collect aliquots during each sample cycle. A peristaltic pump on the sampler pumped water from the sampling location through Teflon™-lined sample tubing to the pump head where water passed through silicone tubing and into the sample collection bottles. Samples were split and capped and removed from the sampler after the event by PCG personnel. Samples were preserved per method requirements and analyzed within the holding times allowed by the methods. Particle size and SSC samples were shipped to the USGS sediment laboratory for analysis. All other samples were shipped to ASI for analysis. Custody was maintained according to the laboratory’s sample handling procedures. To establish the necessary documentation to trace sample possession from the time of collection, field forms and lab forms (see Attachment G of the test plan) were completed and accompanied each sample.
15

Chapter 5Monitoring Results and Discussion
Precipitation and stormwater flow records were evaluated to verify that the storm events met the qualified event requirements. The qualified event data is summarized in this chapter. The monitoring results related to contaminant reduction for the qualified events are reported in two formats:
1. Efficiency ratio comparison, which evaluates the effectiveness of the system on an event mean concentration (EMC) basis.
2. Sum of loads (SOL) comparison, which evaluates the effectiveness of the system on a constituent mass (concentration times volume) basis.
5.1 Rainfall Data
Detailed information on each storm’s runoff hydrograph and the rain depth distribution over the event period are included in Appendix C. The sample collection starting times for the inlet and outlet samples, as well as the number of sample aliquots collected, varied from event to event. The samplers were activated when the respective velocity meters sensed flow in the pipes.
Table 5-1 summarizes the storm data for the qualified events. The CrystalStream has no bypasses or overflow, so the measured inlet and outlet volumes should be the same. Both the inlet and outlet flow monitors were calibrated regularly, and both appeared to be functioning properly throughout the testing.
However, a significant discrepancy was observed between the inlet and outlet flows during most storm events. During the first six events, the trash basket located at the head of the CrystalStream was not installed in the system. For these events, there were three where the inlet meter recorded higher flows and three where the outlet recorded higher flows. Over the remaining nine events, the inlet consistently recorded higher flows. The installation of the trash basket (see Section 7.1 for additional information) on June 10, 2004 may have contributed to this, as water levels in the 24-inch inlet pipe were recorded as high as 16 to 20 in. during the final nine events. Such depths are much higher than would be expected in a 24-inch sewer pipe containing rainfall from a drainage basin of this size. Prior to the trash basket installation the maximum water level in the inlet pipe was 1.6 to 4.1 in. This supports the conclusion that a backwater condition was being created in the later events, likely due to the presence of the trash basket. The flow monitor manufacturer advises installing monitors in locations with backwater, turbulent, or surcharge conditions may result in erroneous readings. Backwater conditions were not observed in the outlet pipe, therefore, the outlet runoff volume was considered to be more accurate than the inlet flow volume.
16
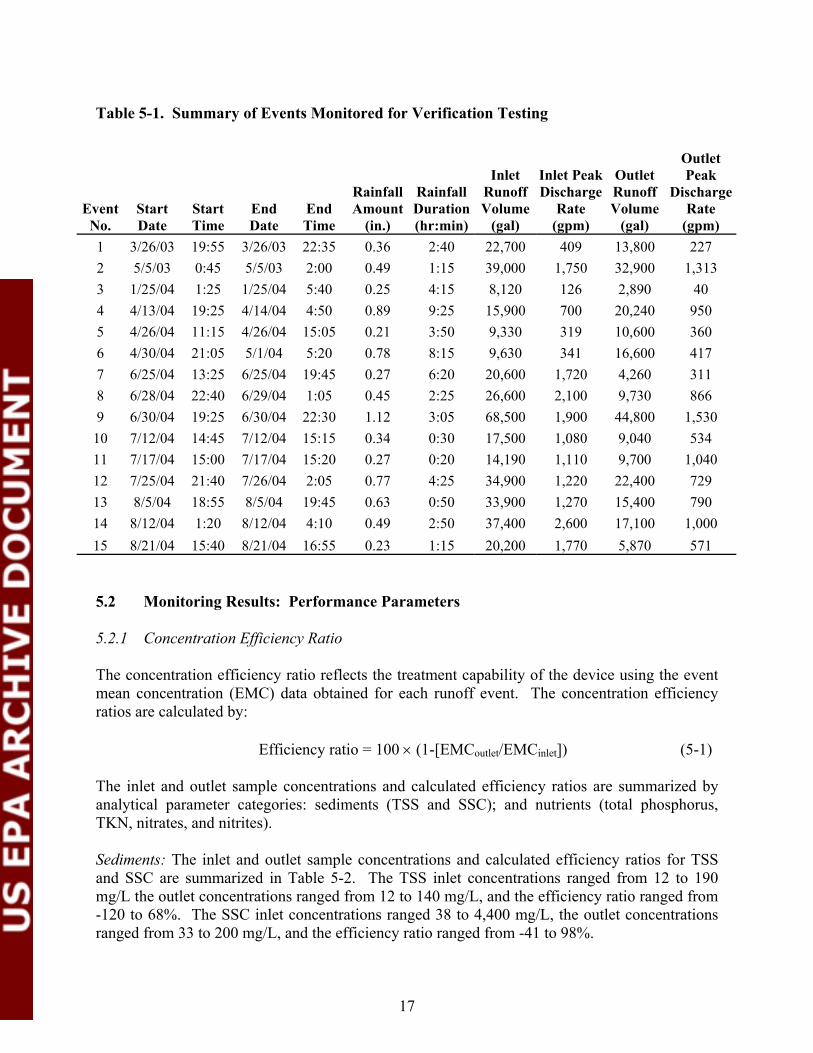
Table 5-1. Summary of Events Monitored for Verification Testing
Outlet Inlet Inlet Peak Outlet Peak
Rainfall Rainfall Runoff Discharge Runoff Discharge Event Start Start End End Amount Duration Volume Rate Volume Rate
No. Date Time Date Time (in.) (hr:min) (gal) (gpm) (gal) (gpm) 1 3/26/03 19:55 3/26/03 22:35 0.36 2:40 22,700 409 13,800 227 2 5/5/03 0:45 5/5/03 2:00 0.49 1:15 39,000 1,750 32,900 1,313 3 1/25/04 1:25 1/25/04 5:40 0.25 4:15 8,120 126 2,890 40 4 4/13/04 19:25 4/14/04 4:50 0.89 9:25 15,900 700 20,240 950 5 4/26/04 11:15 4/26/04 15:05 0.21 3:50 9,330 319 10,600 360 6 4/30/04 21:05 5/1/04 5:20 0.78 8:15 9,630 341 16,600 417 7 6/25/04 13:25 6/25/04 19:45 0.27 6:20 20,600 1,720 4,260 311 8 6/28/04 22:40 6/29/04 1:05 0.45 2:25 26,600 2,100 9,730 866 9 6/30/04 19:25 6/30/04 22:30 1.12 3:05 68,500 1,900 44,800 1,530
10 7/12/04 14:45 7/12/04 15:15 0.34 0:30 17,500 1,080 9,040 534 11 7/17/04 15:00 7/17/04 15:20 0.27 0:20 14,190 1,110 9,700 1,040 12 7/25/04 21:40 7/26/04 2:05 0.77 4:25 34,900 1,220 22,400 729 13 8/5/04 18:55 8/5/04 19:45 0.63 0:50 33,900 1,270 15,400 790 14 8/12/04 1:20 8/12/04 4:10 0.49 2:50 37,400 2,600 17,100 1,000 15 8/21/04 15:40 8/21/04 16:55 0.23 1:15 20,200 1,770 5,870 571
5.2 Monitoring Results: Performance Parameters
5.2.1 Concentration Efficiency Ratio
The concentration efficiency ratio reflects the treatment capability of the device using the event mean concentration (EMC) data obtained for each runoff event. The concentration efficiency ratios are calculated by:
Efficiency ratio = 100 × (1-[EMCoutlet/EMCinlet]) (5-1)
The inlet and outlet sample concentrations and calculated efficiency ratios are summarized by analytical parameter categories: sediments (TSS and SSC); and nutrients (total phosphorus, TKN, nitrates, and nitrites).
Sediments: The inlet and outlet sample concentrations and calculated efficiency ratios for TSS and SSC are summarized in Table 5-2. The TSS inlet concentrations ranged from 12 to 190 mg/L the outlet concentrations ranged from 12 to 140 mg/L, and the efficiency ratio ranged from -120 to 68%. The SSC inlet concentrations ranged 38 to 4,400 mg/L, the outlet concentrations ranged from 33 to 200 mg/L, and the efficiency ratio ranged from -41 to 98%.
17

Table 5-2. Monitoring Results and Efficiency Ratios for Sediment Parameters
TSS SSC Event Inlet Outlet Removal Inlet Outlet Removal
No. Date (mg/L) (mg/L) (%) (mg/L) (mg/L) (%) 1 3/26/03 12 12 0 140 200 -41 2 5/5/03 30 36 -20 4,400 100 98 3 1/25/04 32 29 9.4 97 NA1 ND 4 4/13/04 190 140 26 160 120 24 5 4/26/04 34 61 -79 240 140 42 6 4/30/04 46 30 35 160 91 41 7 6/25/04 99 92 7.1 140 110 24 8 6/28/04 59 50 15 210 55 73 9 6/30/04 16 14 13 38 34 11
10 7/12/04 56 64 -14 220 82 63 11 7/17/04 64 70 -9.4 110 78 31 12 7/25/04 100 54 48 180 52 71 13 8/5/04 60 22 63 1,200 33 97 14 8/12/04 24 52 -120 320 74 77 15 8/21/04 50 16 68 240 61 74
NA1: Not analyzed; sample integrity compromised during transit. ND: Not determined.
The results show a large difference between inlet TSS and SSC concentrations. In many events where both parameters are analyzed, inlet SSC concentrations were higher than the equivalent TSS concentration. Both the TSS and SSC analytical parameters measure sediment concentrations in water; however, the TSS analytical procedure requires the analyst to draw an aliquot from the sample container, while the SSC procedure requires use of the entire contents of the sample container. If a sample contains a high concentration of settleable (large particle size) solids, acquiring a representative aliquot from the sample container is very difficult. Therefore a disproportionate amount of the settled solids may be left in the container, and the reported TSS concentration would be lower than SSC. Particle size distribution is discussed further in Section 5.3.
Nutrients: The inlet and outlet sample concentrations and calculated efficiency ratios are summarized in Table 5-3. The TKN inlet concentration ranged from 0.6 to 2.4 mg/L (as N), and the EMC ranged from –14 to 44%. The total phosphorus inlet concentration ranged from 0.02 to 0.58 mg/L (as P), and the EMC ranged from –600 to 76%. Total nitrate inlet concentrations ranged from 0.09 to 0.66 mg/L (as N), and the EMC ranged from –90 to 50%. Total nitrite inlet and outlet concentrations were near or below method detection limits, such that a minor difference in concentration could result in a very significant calculated percent removal difference. This should be taken into consideration if using the EMC data to project the CrystalStream’s actual nitrite treatment capability.
18
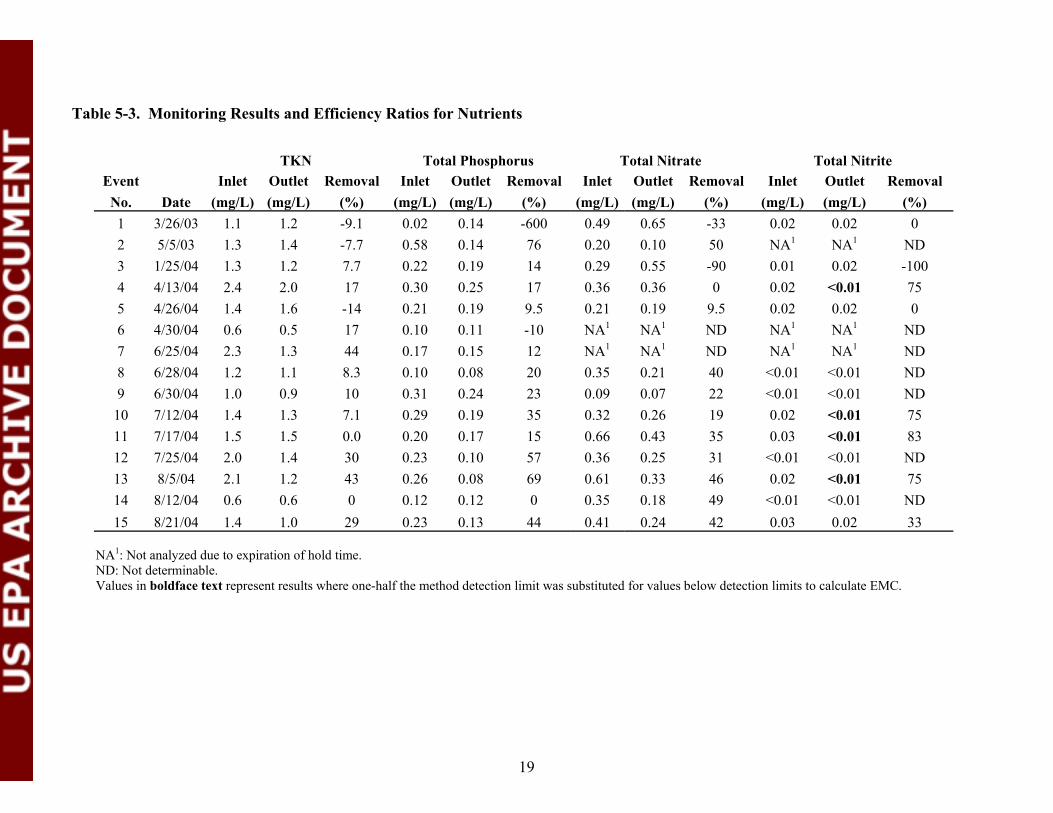
Table 5-3. Monitoring Results and Efficiency Ratios for Nutrients
TKN Total Phosphorus Total Nitrate Total Nitrite Event Inlet Outlet Removal Inlet Outlet Removal Inlet Outlet Removal Inlet Outlet Removal
No. Date (mg/L) (mg/L) (%) (mg/L) (mg/L) (%) (mg/L) (mg/L) (%) (mg/L) (mg/L) (%) 1 3/26/03 1.1 1.2 -9.1 0.02 0.14 -600 0.49 0.65 -33 0.02 0.02 0 2 5/5/03 1.3 1.4 -7.7 0.58 0.14 76 0.20 0.10 50 NA1 NA1 ND 3 1/25/04 1.3 1.2 7.7 0.22 0.19 14 0.29 0.55 -90 0.01 0.02 -100 4 4/13/04 2.4 2.0 17 0.30 0.25 17 0.36 0.36 0 0.02 <0.01 75 5 4/26/04 1.4 1.6 -14 0.21 0.19 9.5 0.21 0.19 9.5 0.02 0.02 0 6 4/30/04 0.6 0.5 17 0.10 0.11 -10 NA1 NA1 ND NA1 NA1 ND 7 6/25/04 2.3 1.3 44 0.17 0.15 12 NA1 NA1 ND NA1 NA1 ND 8 6/28/04 1.2 1.1 8.3 0.10 0.08 20 0.35 0.21 40 <0.01 <0.01 ND 9 6/30/04 1.0 0.9 10 0.31 0.24 23 0.09 0.07 22 <0.01 <0.01 ND
10 7/12/04 1.4 1.3 7.1 0.29 0.19 35 0.32 0.26 19 0.02 <0.01 75 11 7/17/04 1.5 1.5 0.0 0.20 0.17 15 0.66 0.43 35 0.03 <0.01 83 12 7/25/04 2.0 1.4 30 0.23 0.10 57 0.36 0.25 31 <0.01 <0.01 ND 13 8/5/04 2.1 1.2 43 0.26 0.08 69 0.61 0.33 46 0.02 <0.01 75 14 8/12/04 0.6 0.6 0 0.12 0.12 0 0.35 0.18 49 <0.01 <0.01 ND 15 8/21/04 1.4 1.0 29 0.23 0.13 44 0.41 0.24 42 0.03 0.02 33
NA1: Not analyzed due to expiration of hold time. ND: Not determinable. Values in boldface text represent results where one-half the method detection limit was substituted for values below detection limits to calculate EMC.
19

5.2.2 Sum of Loads
The sum of loads (SOL) is the sum of the% load reduction efficiencies for all the events, and provides a measure of the overall performance efficiency for the events sampled during the monitoring period. The load reduction efficiency is calculated using the following equation:
% Load Reduction Efficiency = 100 × (1 - (A/B)) (5-2)
where:
A = Sum of Outlet Load = (Outlet EMC1)(Flow Volume1) + (Outlet EMC2)(Flow Volume2) + (Outlet EMCn)(Flow Volumen)
B = Sum of Inlet Load = (Inlet EMC1)(Flow Volume1) + (Inlet EMC2)(Flow Volume2) + (Inlet EMCn)(Flow Volumen)
n = number of qualified sampling events
As shown in Equation 5-2, the sum of loads (SOL) is calculated using flow volume data. Ideally, the SOL would be calculated by multiplying the inlet EMC by the inlet volume and the outlet EMC by the outlet volume. As discussed in Section 5.1, a large discrepancy was observed in the inlet and outlet flow volume, such that use of both the inlet and outlet volume data in the SOL calculations would skew the results. To demonstrate the impact of using different volume calculations at each location, three possible combinations of the SOL results are presented in Table 5-4:
• using inlet volumes to calculate both inlet and outlet loads; • using outlet volumes to calculate inlet and outlet loads; and • using inlet volumes for inlet SOL and outlet volumes for outlet SOL.
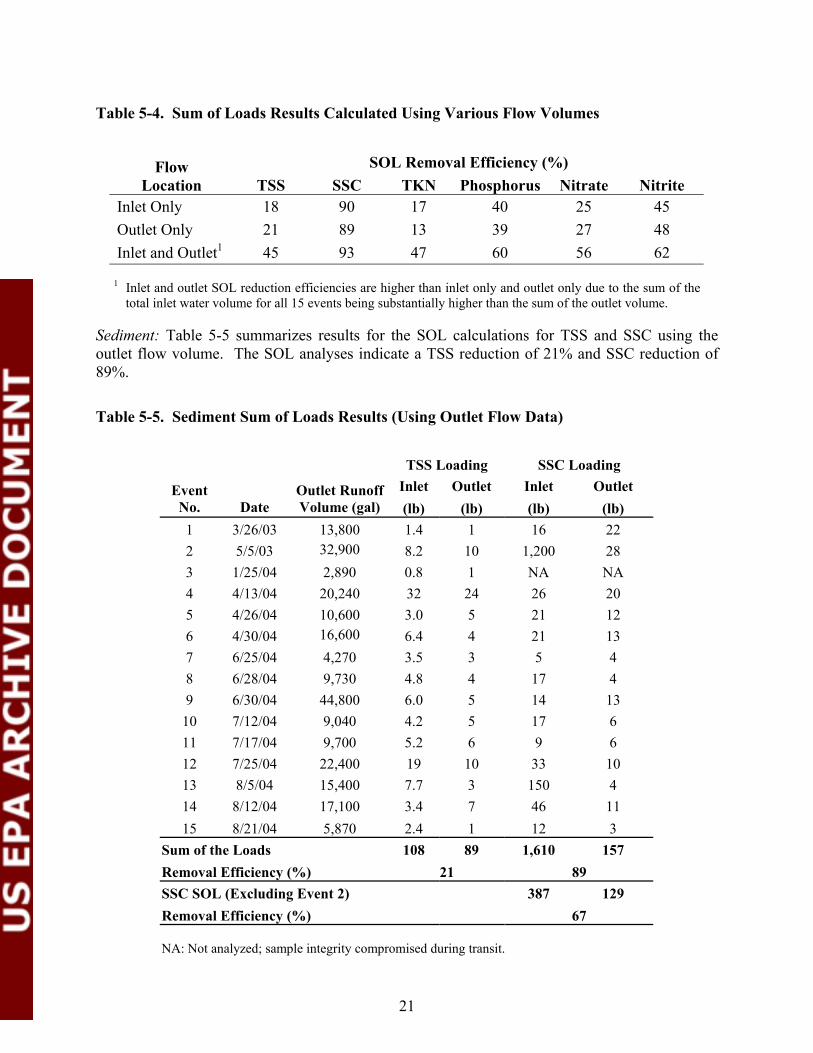
The data demonstrate that using either the inlet or outlet volume as representative of the total flow through the CrystalStream had little impact on the resulting SOL calculations. Using inlet volumes for inlet SOL and outlet volumes for outlet SOL resulted in a greater SOL removal efficiency, but the increased removal efficiency percentage is based on the total inlet volume (for all 15 events) being 61% greater than the total outlet volume.
As indicated in Section 5.1, the inlet flow monitoring station was impacted by backwater conditions. Therefore, the outlet flow rates and calculated volumes were considered to be more representative of the actual flow through the system than the inlet volume. Subsequently, the calculation of the SOL for the CrystalStream uses the outlet volumes.
20
1
Table 5-4. Sum of Loads Results Calculated Using Various Flow Volumes
Flow Location
Inlet Only Outlet Only Inlet and Outlet1
TSS 18 21 45
SOL Removal Efficiency (%) SSC TKN Phosphorus Nitrate 90 17 40 25 89 13 39 27 93 47 60 56
Nitrite 45 48 62
Inlet and outlet SOL reduction efficiencies are higher than inlet only and outlet only due to the sum of the total inlet water volume for all 15 events being substantially higher than the sum of the outlet volume.
Sediment: Table 5-5 summarizes results for the SOL calculations for TSS and SSC using the outlet flow volume. The SOL analyses indicate a TSS reduction of 21% and SSC reduction of 89%.
Table 5-5. Sediment Sum of Loads Results (Using Outlet Flow Data)
TSS Loading SSC Loading
Event Outlet Runoff Inlet Outlet Inlet Outlet No. Date Volume (gal) (lb) (lb) (lb) (lb) 1 3/26/03 13,800 1.4 1 16 22 2 5/5/03 32,900 8.2 10 1,200 28 3 1/25/04 2,890 0.8 1 NA NA 4 4/13/04 20,240 32 24 26 20 5 4/26/04 10,600 3.0 5 21 12 6 4/30/04 16,600 6.4 4 21 13 7 6/25/04 4,270 3.5 3 5 4 8 6/28/04 9,730 4.8 4 17 4 9 6/30/04 44,800 6.0 5 14 13
10 7/12/04 9,040 4.2 5 17 6 11 7/17/04 9,700 5.2 6 9 6 12 7/25/04 22,400 19 10 33 10 13 8/5/04 15,400 7.7 3 150 4 14 8/12/04 17,100 3.4 7 46 11 15 8/21/04 5,870 2.4 1 12 3
Sum of the Loads 108 89 1,610 157 Removal Efficiency (%) 21 89 SSC SOL (Excluding Event 2) 387
Removal Efficiency (%) 67
NA: Not analyzed; sample integrity compromised during transit.
21
129

The SSC data are heavily influenced by one event (event 2), when the inlet SSC concentration (4,400 mg/L) was significantly higher than the typical inlet SSC concentration range for the other events (38 – 1,200 mg/L) and the outlet SSC concentration (103 mg/L). The sample collection and handling procedures were consistently followed throughout the duration of the project. There is no valid reason to reject these data other than the data not following a trend established by the other events. When the SOL is recalculated eliminating this event, the SSC reduction decreases from 89 to 67%.
Nutrients: The SOL data for nutrients are summarized in Table 5-6. The total phosphorus load was reduced by 40%, nitrate was reduced by 25%, TKN was reduced by 13%. The calculated nitrite SOL is 50%; however, as discussed in Section 5.2.1, the nitrite inlet and outlet concentrations being near or below the method detection limits should be taken into consideration in projecting the CrystalStream’s actual nitrite treatment capability.
22

Table 5-6. Nutrients Sum of Loads Results
TKN LoadingOutlet Runoff Phosphorus Loading Nitrate Loading Nitrite Loading
Event Volume Inlet Outlet Inlet Outlet Inlet Outlet Inlet Outlet No. Date (gal) (lb) (lb) (lb) (lb) (lb) (lb) (lb) (lb) 1 3/26/03 13,800 0.13 0.14 0.002 0.016 0.06 0.07 0.0023 0.0023 2 5/5/03 32,900 0.36 0.38 0.16 0.038 0.05 0.03 NA NA 3 1/25/04 2,890 0.03 0.03 0.005 0.005 0.01 0.01 0.0002 0.0005 4 4/13/04 20,240 0.40 0.34 0.051 0.042 0.06 0.06 0.0034 0.0008 5 4/26/04 10,600 0.12 0.14 0.019 0.017 0.02 0.02 0.0018 0.0018 6 4/30/04 16,600 0.08 0.07 0.014 0.015 NA NA NA NA 7 6/25/04 4,270 0.08 0.05 0.006 0.005 NA NA NA NA 8 6/28/04 9,730 0.10 0.09 0.008 0.006 0.03 0.02 ND ND 9 6/30/04 44,800 0.37 0.34 0.12 0.090 0.03 0.03 ND ND
10 7/12/04 9,040 0.11 0.10 0.022 0.014 0.02 0.02 0.0015 0.0004 11 7/17/04 9,700 0.12 0.12 0.016 0.014 0.05 0.03 0.0024 0.0004 12 7/25/04 22,400 0.37 0.26 0.043 0.019 0.07 0.05 ND ND 13 8/5/04 15,400 0.27 0.15 0.033 0.010 0.08 0.04 0.0026 0.0006 14 8/12/04 17,100 0.09 0.09 0.017 0.017 0.05 0.03 ND ND 15 8/21/04 5,870 0.07 0.05 0.011 0.006 0.02 0.01 0.0015 0.0010
Sum of the Loads 2.7 2.3 0.52 0.32 0.55 0.42 0.016 0.009 Removal Efficiency (%) 13 40 25 45
NA: Not analyzed due to expiration of hold time. ND: Not determined because both inlet and outlet samples were below detection limits. Values in boldface text represent results where one-half the method detection limit was substituted for values below detection limits.
23

5.3 Particle Size Distribution
Particle size distribution analysis was conducted as part of the SSC analysis by the USGS laboratory. The SSC method includes a “sand/silt split” analysis determining the percentage of sediment (by weight) larger than 62.5 µm (defined as sand) and less than 62 µm (defined as silt). The particle size distribution results are summarized in Table 5-7. In each event where particle size analysis was conducted, the outlet samples had a higher percentage of particles in the silt category (<62.5 µm) than the equivalent inlet sample, indicating that the CrystalStream removed a higher proportion of larger particles.
The SOL can be recalculated for SSC concentrations and “sand/silt split” data to determine the proportion of sand and silt removed during treatment. This evaluation shows that the majority of the sediment removed by the CrystalStream was of the larger particle size.
Table 5-7. Particle Size Distribution Analysis Results
Sand (>62.5 µm) Silt (<62.5 µm) Sand SOL Silt SOL Event Inlet Outlet Inlet Outlet Inlet Outlet Inlet Outlet
No. Date (%) (%) (%) (%) (lb) (lb) (lb) (lb) 1 3/26/03 47.7 6.8 52.3 93.2 7.6 1.5 8.3 21 2 5/5/03 93.9 33.1 6.1 66.9 1,140 9.4 74 19 3 1/25/04 32.9 NA 67.1 NA NA NA NA NA 4 4/13/04 17.8 7.1 82.2 92.9 4.7 1.4 22 19 5 4/26/04 22.3 10.7 77.7 89.3 4.7 1.3 17 11 6 4/30/04 39.1 9.5 60.9 90.5 8.4 1.2 13 11 7 6/25/04 28 6.2 72.0 93.8 1.4 0.2 3.7 3.6 8 6/28/04 60.8 6.8 39.2 93.2 10.1 0.3 6.5 4.2 9 6/30/04 38.5 21.9 61.5 78.1 5.5 2.8 8.7 9.9
10 7/12/04 68.6 19.7 31.4 80.3 11.4 1.2 5.2 5.0 11 7/17/04 33.7 11.0 66.3 89.0 3.1 0.7 6.1 5.6 12 7/25/04 74.1 23.8 25.9 76.2 24.5 2.3 8.6 7.4 13 8/5/04 90.7 9.1 9.3 90.9 136.5 0.4 14 3.9 14 8/12/04 77.6 9.2 22.4 90.8 35.4 1.0 10 9.6 15 8/21/04 72.6 7.4 27.4 92.6 8.3 0.2 3.2 2.8
Sum of the loads 1,400 24 200 133 Removal efficiency (%) 98 34
NA: Not analyzed; sample integrity compromised during transit.
24

Chapter 6 QA/QC Results and Summary
The Quality Assurance Project Plan (QAPP) in the test plan identified critical measurements and established several QA/QC objectives. The verification test procedures and data collection followed the QAPP. QA/QC summary results are reported in this chapter, and the full laboratory QA/QC results and supporting documents are presented in Appendix D.
6.1 Laboratory/Analytical Data QA/QC
6.1.1 Bias (Field Blanks)
Field blanks were collected at both the inlet and outlet samplers to evaluate the potential for sample contamination through the automatic sampler, sample collection bottles, splitters, and filtering devices. The field blank was collected on May 9, 2003, allowing PCG to review the results early in the monitoring schedule.
Results for the field blanks are shown in Table 6-1. The data identified detectable concentrations of TKN in the inlet sample, and TKN and phosphorus in the outlet sample. TSS and nitratenitrite nitrogen concentrations were below detection limits in both the inlet and outlet samples.
After reviewing the analytical data, the TO hypothesized that the TKN and phosphorous contribution could have resulted from incomplete rinsing of the sample containers. On July 25, 2003, the TO repeated decontamination procedures and collected additional samples to analyze for those constituents identified during the May sampling event. The data showed that the decontamination procedures were successful in reducing TKN and phosphorus concentrations to below detectable limits. These results show a good level of contaminant control in the field procedures was achieved.
Table 6-1. Field Blank Analytical Data Summary
May 9, 2003 July 25, 2003 Parameter Units Inlet Outlet Inlet Outlet
Nitrate-nitrite nitrogen mg/L as N <0.1 <0.1 NA NA Phosphorus mg/L as P <0.02 0.5 NA <0.02 TKN mg/L as N 1.4 0.17 <0.4 <0.4 TSS mg/L <5 <5 NA NA
NA: Not analyzed
6.1.2 Replicates (Precision)
Precision measurements were performed by the collection and analysis of duplicate samples. The relative percent difference (RPD) recorded from the sample analyses was calculated to evaluate precision. RPD is calculated using the following formula:
25

x1 − x2 (6-1)% RPD = × 100% x
where:
x1 = Concentration of compound in samplex2 = Concentration of compound in duplicatex = Mean value of x1 and x2
Field precision: Field duplicates were collected to monitor the overall precision of the sample collection procedures. Duplicate inlet and outlet samples were collected during three different storm events to evaluate precision in the sampling process and analysis. The duplicate samples were processed, delivered to the laboratory, and analyzed in the same manner as the regular samples. Summaries of the field duplicate data are presented in Table 6-2.
Table 6-2. Field Duplicate Sample Relative Percent Difference Data Summary
Event 1 (3/26/03) Event 7 (6/25/04) Event 12 (7/25/04) Parameter Units Rep 1a Rep 1b RPD Rep 2a Rep 2b RPD Rep 3a Rep 3b RPD Nitrite mg/L as N Inlet 0.02 0.02 0 NA NA ND <0.01 <0.01 0
Outlet 0.02 0.03 40 NA NA ND <0.01 <0.01 0 Nitrate mg/L as N Inlet 0.49 0.49 0 NA NA ND 0.36 0.36 0
Outlet 0.65 0.65 0 NA NA ND 0.25 0.28 11 Phosphorus mg/L as P Inlet 0.02 0.03 40 0.17 0.17 0 0.23 0.21 9
Outlet 0.14 0.03 129 0.15 0.15 0 0.1 0.09 11 TKN mg/L as N Inlet NA NA ND 2.3 1.5 42 2 1.9 5
Outlet NA NA ND 1.3 1.2 8 1.4 1.3 7 TSS mg/L Inlet 12 59 132 99 101 2 104 48 74
Outlet 12 82 149 92 93 1 54 40 30 SSC mg/L Inlet NA NA ND 143 185 26 NA NA ND
Outlet NA NA ND 109 103 6 NA NA ND
NA: Not analyzed ND: Not determinable
Nitrate and Nitrite: The outlet RPD nitrite result for event 1 is outside the target limit, but the values are low and close to the detection limit. All other samples showed good precision.
TSS and SSC: The SSC RPD result was within targeted limits. Three of the six TSS samples were within the target limits. The large differences in TSS RPD results were attributed to the inherent variability of stormwater sampling and the propensity of larger sediment particles to rapidly fall out of suspension. This makes it difficult for the analyst to collect two representative sample aliquots from a sample container.
26

Phosphorus: Similar to the outlet RPD nitrite result, the inlet phosphorus RPD for event 1 is outside the target limit, but the values are low and close to the detection limit. The outlet phosphorus RPD result exceeded the 30% limit. Phosphorus compounds tend to attach to sediment particles, resulting in a difficulty similar to TSS.
Laboratory precision: ASI analyzed duplicate samples from aliquots drawn from the same sample container as part of their QA/QC program. Summaries of the laboratory duplicate data are presented in Table 6-3.
Table 6-3. Laboratory Duplicate Sample Relative% Difference Data Summary
Average Maximum Minimum Standard Objective Parameter Count (%) (%) (%) Deviation (%)
Nitrite 26 4 67 0 13 25 Nitrate 26 8 172 0 34 25 Phosphorus 30 3 12 0 4 25 TKN 30 9 18 0 6 25 TSS 30 20 96 0 28 30
The data show that laboratory precision was generally maintained throughout the course of the verification project, with the exception of one nitrate sample and TSS samples.
The TSS data showed lower precision, with some of the precision data outside the RPD limits established in the test plan. For many TSS samples, the data were skewed by low and nondetected concentrations. In addition to sample duplicates, the laboratories analyzed laboratory control samples as part of the ongoing analysis process. The laboratory control samples were reviewed, and all methods were found to be in control (within established laboratory precision limits). Laboratory procedures, calibrations, and data were audited and found to be in accordance with the published methods and good laboratory practice.
The field and analytical precision data combined suggest that the solids load and larger particle sizes in the inlet samples are the likely cause of poor precision, and apart from the field sample splitting procedures for inlet samples, the verification program maintained high precision. The inlet samples tended to have higher sediment concentrations, and sediments have a tendency to rapidly settle out of suspension, which contributed to the inlet sample precision issue.
6.1.3 Accuracy
Method accuracy was determined and monitored using a combination of matrix spike/matrix spike duplicates (MS/MSD) and laboratory control samples (known concentration in blank water). The MS/MSD data are evaluated by calculating the deviation from perfect recovery (100%), while laboratory control data are evaluated by calculating the absolute value of deviation from the laboratory control concentration. Accuracy was in control throughout the
27

verification test. Tables 6-4 and 6-5 summarize the matrix spikes and lab control sample recovery data, respectively.
Table 6-4. Laboratory MS/MSD Data Summary
Target Average Maximum Minimum Standard Range
Parameter Count (%) (%) (%) Deviation (%) Nitrite 26 103 108 93 3.7 75 - 125 Nitrate 26 100 112 91 5.6 75 - 125 Phosphorus 30 105 111 95 4.3 80 - 120 TKN 30 89 108 65 10 75 - 125 TSS 30 96 118 52 13 75 - 125
The balance used for TSS analyses was calibrated routinely with weights that were NIST traceable. The laboratory maintained calibration records. The temperature of the drying oven was also monitored using a thermometer that was calibrated with an NIST traceable thermometer.
Table 6-5. Laboratory Control Sample Data Summary
Target Average Maximum Minimum Standard Range
Parameter Count (%) (%) (%) Deviation (%) Nitrite 26 103 109 97 3.7 97 - 112 Nitrate 26 98 106 93 3.7 88 - 107 Phosphorus 30 106 108 100 2.2 91 - 115 TKN 30 92 110 77 8.2 67 - 126 TSS 30 95 121 0 19 89 - 109
6.1.4 Representativeness
The field procedures were designed to ensure that representative samples were collected of both inlet and outlet stormwater. Field duplicate samples and supervisor oversight provided assurance that procedures were being followed. The challenge in sampling stormwater is obtaining representative samples. The data indicated that while individual sample variability might occur, the long-term trend in the data was representative of the concentrations in the stormwater, and redundant methods of evaluating key constituent loadings in the stormwater were utilized to compensate for the variability of the laboratory data.
28

The laboratories used standard analytical methods, with written SOPs for each method, to provide a consistent approach to all analyses. Sample handling, storage, and analytical methodology were reviewed to verify that standard procedures were being followed. The use of standard methodology, supported by proper quality control information and audits, ensured that the analytical data were representative of actual stormwater conditions.
6.1.5 Completeness
Completeness is a measure of the number of valid samples and measurements that are obtained during a test period. Completeness will be measured by tracking the number of valid data results against the specified requirements of the test plan.
Completeness will be calculated by the following equation:
Percent Completeness = (V / T) x 100% (6-3)
where:
V = Number of measurements that are valid. T = Total number of measurements planned in the test.
The goal for this data quality objective was to achieve minimum 80% completeness for flow and analytical data. The data quality objective was exceeded, with discrepancies noted below:
• The flow data is 100% complete for all of the monitored events.
• Two sets of nitrate and nitrite samples (from events 6 and 7) were not analyzed by the analytical laboratory because the 48-hr hold times had been exceeded.
• The outlet SSC sample from event 3 was not analyzed because the sample integrity was compromised during transit.
These issues are appropriately flagged in the analytical reports and the data used in the final evaluation of the CrystalStream.
29
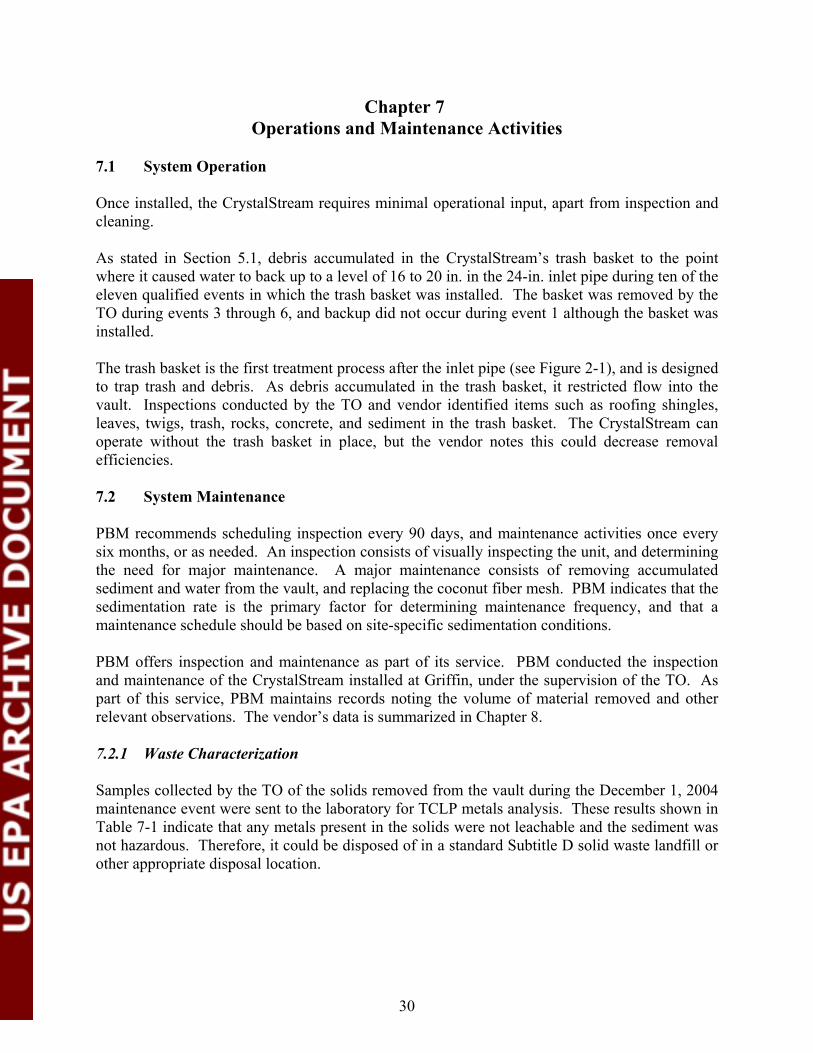
Chapter 7Operations and Maintenance Activities
7.1 System Operation
Once installed, the CrystalStream requires minimal operational input, apart from inspection and cleaning.
As stated in Section 5.1, debris accumulated in the CrystalStream’s trash basket to the point where it caused water to back up to a level of 16 to 20 in. in the 24-in. inlet pipe during ten of the eleven qualified events in which the trash basket was installed. The basket was removed by the TO during events 3 through 6, and backup did not occur during event 1 although the basket was installed.
The trash basket is the first treatment process after the inlet pipe (see Figure 2-1), and is designed to trap trash and debris. As debris accumulated in the trash basket, it restricted flow into the vault. Inspections conducted by the TO and vendor identified items such as roofing shingles, leaves, twigs, trash, rocks, concrete, and sediment in the trash basket. The CrystalStream can operate without the trash basket in place, but the vendor notes this could decrease removal efficiencies.
7.2 System Maintenance
PBM recommends scheduling inspection every 90 days, and maintenance activities once every six months, or as needed. An inspection consists of visually inspecting the unit, and determining the need for major maintenance. A major maintenance consists of removing accumulated sediment and water from the vault, and replacing the coconut fiber mesh. PBM indicates that the sedimentation rate is the primary factor for determining maintenance frequency, and that a maintenance schedule should be based on site-specific sedimentation conditions.
PBM offers inspection and maintenance as part of its service. PBM conducted the inspection and maintenance of the CrystalStream installed at Griffin, under the supervision of the TO. As part of this service, PBM maintains records noting the volume of material removed and other relevant observations. The vendor’s data is summarized in Chapter 8.
7.2.1 Waste Characterization
Samples collected by the TO of the solids removed from the vault during the December 1, 2004 maintenance event were sent to the laboratory for TCLP metals analysis. These results shown in Table 7-1 indicate that any metals present in the solids were not leachable and the sediment was not hazardous. Therefore, it could be disposed of in a standard Subtitle D solid waste landfill or other appropriate disposal location.
30

Table 7-1. TCLP Results for Cleanout Solids
Regulatory Hazardous Parameter TCLP Result (mg/L) Waste Limit (mg/L)
Arsenic <0.2 5.0 Barium 0.5 100 Cadmium <0.01 1.0 Chromium <0.01 5.0 Copper 0.04 NA Lead 0.6 5.0 Mercury <0.002 0.2 Nickel 0.05 NA Selenium <0.2 1.0
NA: Not applicable
31

Chapter 8Vendor-Supplied Information
The information and data contained in this section of the report is provided by the technology vendor, PBM, and has not verified by the Testing Organization or the Verification Organization.
As stated in Section 7.2, PBM recommends scheduling inspection every 90 days, and maintenance activities once every six months, or as needed. PBM offers inspection and maintenance as part of its service. PBM conducted the inspection and maintenance of the CrystalStream installed at Griffin, under the supervision of the TO. As part of this service, PBM maintains records noting the volume of material removed and other relevant observations. Table 8-1 summarizes PBM cleaning and inspection observations during the verification study.
Table 8-1. Operation and Maintenance During Verification Testing
Actual Sediment Trash Coconut Total Service Service Sediment Estimate Trash Sediment Weight2 Fiber3 Weight
Date Type Depth (in) (in) (ft3) Weight1 (lb) (lb) (lb) (lb) 6/15/02 Cleaning 5 -- 24 2,290 240 42 2,570 7/15/02 Inspection -- 6 0 -- 0 0 --7/28/02 Cleaning 6 -- 25 2,750 250 48 3,050 9/23/02 Inspection -- 6 0 -- 0 -- --9/29/02 Cleaning 5 -- 15 2,290 150 36 2,480
12/14/02 Inspection -- 13 10 -- 100 -- --1/4/03 Cleaning 12 -- 12 5,500 120 40 5,660 4/12/03 Cleaning 5 -- 10 2,290 100 32 2,420 8/19/03 Cleaning 8 -- 8 3,700 80 40 3,790
11/11/03 Inspection -- 1 6 -- 60 -- --12/23/03 Cleaning 4 -- 11 1,800 110 40 1,980 4/1/04 Inspection -- 5 8 -- 80 -- --6/2/04 Cleaning 6 6 2,800 60 40 2,850 6/10/04 Repair (re-install trash basket) -- -- -- -- --
11/30/04 Cleaning 7 -- 14 3,200 140 40 3,390 Total: 26,620 1,490 358 28,200
Total (lb/acre/yr): 2,590 145 35 2,750
1. Sediment dry weight was determined by measuring 30 pound wet samples for wet volume and weight, and for dry volume and weight, then establishing an adjustment ratio. For this site, the dry weight was estimated at 110 pounds per cubic foot measured in situ.
2. Trash volumes were estimated in the field, and three complete samples were collected, stored, and examined. The average dry weight was computed for typical trash. Two samples had large quantities rocks, glass bottles, and metal from cars. This material was discarded and not weighed. The intent was to try and include only “normal” trash and debris.
3. After the 4/12/2003 cleaning, the fiber filter was no longer kept for weighing at PBM. The final four weights were estimates.
32

Chapter 9References
1. APHA, AWWA, and WEF. Standard Methods for the Examination of Water and Wastewater, 19th ed. Washington, DC, 1995.
2. Fishman, M. J., Raese, J. W., Gerlitz, C. N., Husband, R. A., U.S. Geological Survey. Approved Inorganic and Organic Methods for the Analysis of Water and Fluvial Sediment, 1954-94, USGS OFR 94-351, 1994.
3. NOAA (2000) Technical Paper No. 40 Rainfall Frequency Atlas of the United States.
4. National Oceanic and Atmospheric Administration (NOAA). Technical Paper No. 40 Rainfall Frequency Atlas of the United States. Washington, DC, 2000.
5. NSF International and Paragon Consulting Group. Environmental Technology Verification Test Plan for Practical Best Management CrystalStream™ Oil/Grit Separator, Model 1056, TEA-21 Project AreaCity of Griffin, Spalding County, Georgia. June 2003.
6. NSF International. ETV Verification Protocol Stormwater Source Area Treatment Technologies. U.S. EPA Environmental Technology Verification Program; EPA/NSF Wetweather Flow Technologies Pilot. March 2002 (v. 4.1).
7. United States Environmental Protection Agency. Methods and Guidance for Analysis of Water, EPA 821-C-99-008, Office of Water, Washington, DC, 1999.
33

Appendices
A CrystalStream Design and O&M Guidelines B Verification Test Plan C Event Hydrographs and Rain Distribution D Analytical Data Reports with QC
34