Embed Size (px)
Citation preview

SLAC-376 UC-414
(A/I)
FINAL .FOCUS TEST BEAM
PROJECT DESIGN REPORT
Stanford Linear Accelerator Center
Stanford University
Stanford, California 94309
March 1991
Prepared for the Department of Energy
under contract number DE-AC03-76SF00515
Printed in the United States of America. Available from the National Techni- cal Information Service, U.S. Department of Commerce, 5285 Port Royal Road, Springfield, Virginia 22161.

Table of Contents
I. The Final Focus Test Beam Project - -
II. Optical Design
III. Magnets
- IV. Instrumentation
V. Magnetic Measurement and BPM Calibration
VI. Mechanical Alignment and Stabilization
VII. Vacuum System
VIII. Power Supplies
IX. Control System
X. Radiation Shielding and Personnel Protection
XI. Infrastructure
I-2
II-2
III-2
IV-2
v-2
VI-2
VII-2
VIII-2
IX-2
x-2
x1-2
XII. Administration x11-2

a-
-
I. T h e F ina l Focus Tes t B e a m P roject

I. The Final Focus Test Beam Project
One of the greatest challenges we face on the road to the Next Linear Collider (NLC)
is to male particle beams with extremely small sizes. Whereas the particle bunches in
the SLC are millimeter-long needles 4 to 5 microns across, those in the NLC will have to
be- ten times shorter and up to a thousand times narrower. Such tiny beams are needed
to produce luminosities of 1O33 to 1O34 cmm2 s- ’ that will be necessary to generate
sufficient numbers of events as the center-of-mass energy climbs toward 1 TeV-and the
cross sections for interesting physical processes drop to the level of about 1O-37 cmA2.
- Other ways to increase the luminosity-e.g., by raising the number of particles per
bunch and the machine repetition rate-are limited by the available AC power and
by interactions of the bunches with each other and with the accelerating structure.
Therefore, achieving spot sizes that are a hundred times smaller than the wavelength of
visible light will be one of the chief goals in the development of the NLC.
The part of a linear e+e- collider that reduces the beam sizes and maintains the
beams in collision is called the final focus. Its magnetic elements act much like the lenses
of a fine optical telescope to collect the particles produced by the linear accelerator and
focus them to a spot with small cross-sectional area. To produce tightly focussed beams
and maintain them in collision requires careful control and stabilization of these mag-
nets, and places considerable emphasis on accurate measurement of the properties of
the beam itself. We have learned a great deal from operation of the SLC, but successful
implementation of future machines at higher energies will demand that even tighter me-
chanical and electrical tolerances be respected. It will also require greater measurement
precision and the development of tuning mechanisms and techniques considerably more
powerful than those presently in use.
In collaboration with teams of physicists and engineers from the Soviet Union,
Germany, France, and Japan, we have recently begun to build and instrument a proto-
.L. - _ type magnetic system capable of producing the small beam spots required for the NLC.
This Final Focus Test Beam (FFTB) will occupy some 185 meters in the straight-ahea,d
channel at the end of the SLAC linac with the final elements extending onto the concrete
I-2

surface of the Research Yard. (Figure 1.1) As input it will use the unique SLC electron
(or positron) beam with its very small emittance. The optics of this beam will be cor-
rected to third order for geometric and chromatic aberrations to produce a focal point
at which the beam height will be demagnified by a factor of 300-to a size smaller than
100 nanometers. Just such a compression factor will be required for the final focus of a -- TeV-scale linear collider. To attain it we will have to address most of the critical issues
inherent in their design, construction and implementation.
The FFTB is truly an international effort. The optical design principles were devel-
oped by accelerator physicists from around the world, and have been reviewed at major
- international workshops on linear colliders. Detailed design, error analysis, and devel-
opment of precise tuning procedures for these optics have been carried out by a group
consisting of physicists from KEK (Tsukuba), LAL (Orsay), and SLAC. The magnets
were designed and are being fabricated at the Institute for Nuclear Physics (Novosi-
birsk) in the Soviet Union, and those for the final lens pair are being designed there and
in Japan. State-of-the-art mechanical stabilization of these critical components will be
done by the group at KEK.
Precise mechanical alignment and stabilization are necessary also for the remainder
of the magnetic elements and electronic monitors. They must be aligned to better than
30 microns along the entire test beam, and their position must be stable to 1 to 2 microns
in order to maintain the final spot size. Groups from DESY (Hamburg) and SLAC are
designing and constructing hardware to achieve these goals.
Improvements, and in some cases completely new directions, in beam diagnostic
instrumentation are needed to measure the properties of the beam accurately throughout
the system. Measurement of the final spot size is a particularly challenging problem, as
the tightly-focused beam will destroy any material in its path. Physicists and engineers
at Orsay and SLAC are currently attacking these problems. Beam position monitors
and associated electronics are being designed to provide resolutions of 1 to 2 microns.
Wire scanners will be used to measure beam profiles at locations other than the focal
point of the system, and techniques are being developed to measure the focused spot by
observing the interaction of the beam with gas-jet or renewable-solid targets.
I-3

The Final Focus Test Beam is well underway. Completion of construction is ex-
pected in late 1992, and successful commissioning of the test beam will be a major step
in the worldwide effort to design and build a TeV-scale linear collider.
14

SLC
Figure 1.1. The Final Focus Test Beam.
I-5

--
-
II . Optical Design

II. Optical Design
1I.A Introduction
The Final Focus Test Beam is intended to be a facility to be used for the development
and study of the optical systems, instrumentation, and techniques needed to produce
the small beam spots required for future eSe- linear colliders; A brief description of
the parameters and optical design of the FFTB is given in this section of this report.
A detailed account of the optical properties and tuning strategies for the beam line can
be found in the Final Focus Test Beam Optical Handbook.
The parameters of the FFTB have been chosen to match as closely as possible
those of a future linear collider. Table II.1 contains a summary of these parameters, and
compares them with those of the SLC Final Focus as well as those used in a typical NLC
design. The FFTB will use as input the 50 GeV SLC e- beam from the SLAC linac.
The SLC damping ring can produce an invariant emittance of ye, = 7 x 10e7 rad . m at
quantum mechanical equilibrium when operated with the horizontal and vertical phase
space components decoupled from each other (decoupled tunes). The optics of the
FFTB, shown schematically in Figure II.A.l, would theoretically be able to reduce the
beam to a spot with vertical height 27 nm, but the invariant emittance of the beam will
surely be enlarged as the beam is accelerated in the linac. It is expected that, for beam
intensities up to lOlo particles per pulse, this growth can be controlled well enough to
deliver yey = 3 x low6 rad+m to the entrance of the FFTB. This is sufficiently small that
the FFTB will be able to achieve a vertical spot dimension of 60 nm while maintaining
a horizontal size of 1 micron.
The FFTB contains five optical sections. (See Figure II.A.l.) The beam that ap-
pears at the end of the linac is first matched to the lattice of the FFTB beam line. The
matching section controls the launch of the beam orbit into the FFTB, and contains
lenses to match the betatron space of the beam to the FFTB lattice at the entrance to
the chromatic correction section. Chromatic correction is done separately in the hori-
zontal and vertical planes. A second P-matching section lies between the two chromatic
correction sections. The overall demagnifica.tion of the system is controlled by the focal
lengths of the initial betatron match a,nd of the final telescopic section.
II-2

A round spot (lp x lp) can also be made at the focal point of the system by coupling
the damping ring optics and adjusting the strengths of the matching quadrupoles at the
entrance of the FFTB. This configuration will be especially useful in the early tuning
stages, and later for testing new instrumentation and new focusing elements.
IIJ3 - Telescopes
The basic optical system used to demagnify the transverse dimensions of a beam is a
telescope. (See Figure II.B.l.) A simple telescope produces point-to-point and parallel- p l/2 to-parallel imaging together with a geometric demagnification & = -$ = ($) . In
this expression, the parameters ,& and p* are the values of the betatron function at
- the entrance and the focal point of the telescopic system. The one-dimensional matrix
representation of such a module is:
Rx= (T l/Lx). (II.B.l)
Although the FFTB is not built with strictly telescopic blocks, the first order trans-
formation matrix between the end of the linac and the focal point has this form with
l/MX M 70 and l/MY M 3S0. The design allows a reduction in the overall length of
the system compared to a rigorously telescope-based final focus, but contains only one
image point of the focal point for diagnostic and measurement purposes.
1I.C Chroinaticity
For a monoenergetic beam with emittance E, the optimized beam size at the focal
point is given by,
c7 %.2
= E p*. (II.C.1)
Unlike this ideal case, however, the beam produced by a linear accelerator contains par-
ticles with a finite spread in their energy distribution. Since particles with different
energies are focused to different points along the beam line, there are chromatic aberra-
tions in the final spot that must be compensated by additional elements in the magnetic
lattice.
II-3

For the simple telescope shown in Fig. II.B.l, the spot size isl,
*2 t7 = d*(S) (II.C.2)
with 62
,0*( 6) = ,/3*(O) + C’s p*(o) + higher order terms. (II.C.3) --
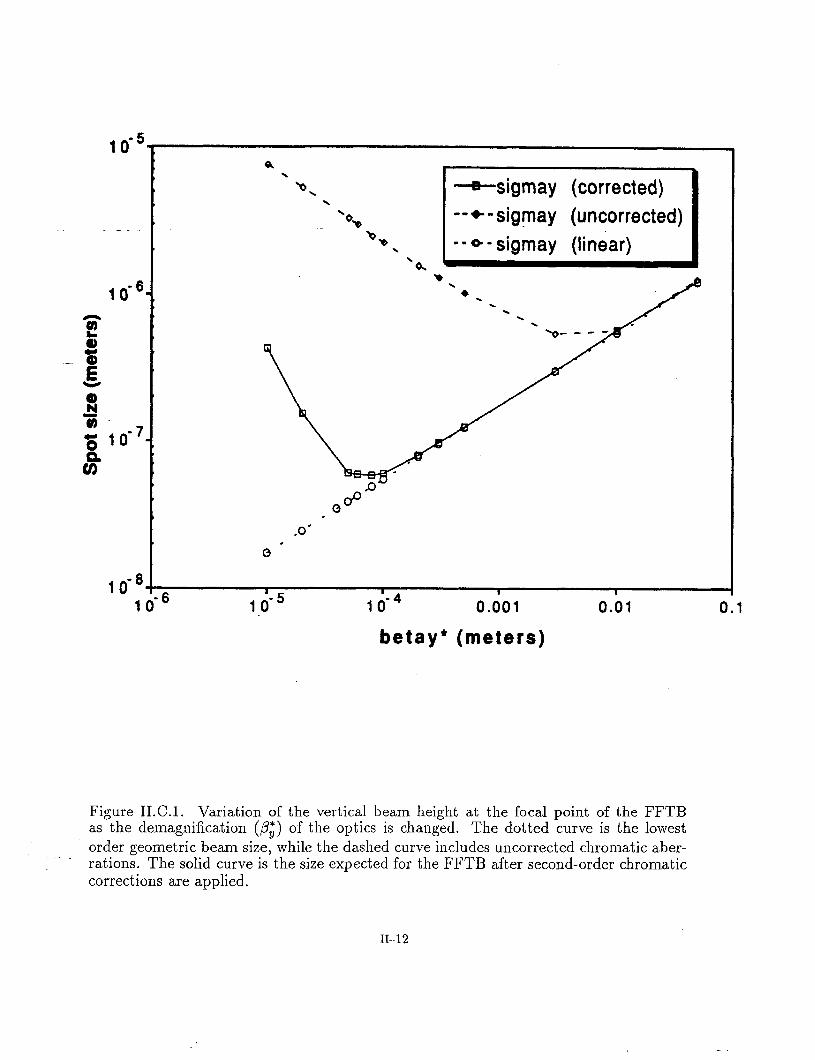
As the focusing strength of the system is increased (p*(O) decreased), the spot size
passes through a minimum after which the chromatic aberrations dominate. (See
Figure II.C.1.)
The chromaticity of a beam line is defined as -. tx,y = pw * ~x,y(s)ds, (II.C.4)
SO
where I< = ‘O ~BP) is the strength of the quadrupoles in the lattice. The parameter t is
a measure of the severity of the chromatic aberrations introduced by the segment of the
beam line between so and ~1. The most important contribution to the chromaticity is
created in the final doublet where the ,&functions are very large (M 20,000~~) and the
fields are very strong. (Pole-tip fields are as large as 1.4 Tesla in the final quads of the
FFTB.) This results in an increase of the spot size unless the total chromaticity of the
line, or the coefficient C2 in Eq. II.C.3, can be reduced to nearly zero.
1I.D Chromatic Correction
To correct the chromaticity of the optics at the final focus, sextupole magnets are
introduced in a region where there is transverse horizontal dispersion. A sextupole is a
magnet whose focusing strength is not uniform but varies linearly with the horizontal
distance to the axis. Therefore placing a sextupole in a dispersive region will give the
particles a kick proportional to their horizontal distance to the axis which in turn is
proportional to their energy. The net effect is to create energy-dependent focusing in
the lattice that can be controlled. The sextupole strength, along with the dispersion
and ,&function at the sextupole, are to be adjusted to bring the overall chromaticity of . . the beam line to zero. Because it is necessary to cancel very large chromaticities, such a
system will be quite sensitive to errors and optical tolerances must be held very tightly.
114

A sextupole is also known to introduce strong second order geometric aberrations
which could dominate the spot size.The cancellation of these is done2 by placing the
sextupoles in pairs separated by a -1 transformation (a 7r phase advance module with
magnification equal to 1). Th e second-order geometric aberrations then cancel while
the chromaticity of the sextupoles can be made to add by manipulating the dispersion
fun&ion in the -I transform. .-
Because of the need to control the aspect ratio of the beam at the focal point, and
because the horizontal spot size is small enough to be aberration sensitive, we must
correct the chromaticity in the horizontal plane as well. The FFTB design has two
chromatic correction sections, one for each plane so the chromaticities can be tuned -.
separately and the sextupoles are always at their optimal location (N.R phase advance
to the focal point with N integer). The lattice includes a “P-exchanger” to match the
p-function from one section to the other. It is also a 7r phase advance module. Note
that this two-plane correction scheme increases the total length of the system and the
number of components required.
This scheme is the basis for chromaticity correction for all magnetic focusing sys-
tems, has already been successfully used at the SLC. It requires the introduction of sex-
tupoles and bending magnets which in turn create third and higher order aberrations.
1I.E Residual Aberrations and Limits on the Spot Size
There are two major third-order aberrations that remain in the spot produced by
the above chromatic correction procedure. The first is created by the finite thickness
of the sextupole magnets which generates third order geometric aberrations (octupole-
like). The fractional increase in the spot size at the focal point is,
(II.E.l)
where L, is the integrated strength of the sextupole. For the FFTB, E, M 20 rnm2, 1, =
.25 m, and & = 12,000 m at the sextupole in the vertical chromatic correction section:
A; = 0.08.
This corresponds to an increase of the spot size of the order of 4%.
II-5

The second effect that limits the spot size is more subtle, but just as significant.
As particles pass through the bend magnets that create the dispersion necessary for the
chromatic correction to occur, they lose some energy through synchrotron radiation. The
cancellation between the chromaticity introduced by the sextupoles and that introduced
by the final quad can no longer be rigorous. There is an increase of the spot size given by, --
(II.E.2)
From the sextupole setting, Ey = 21c977J?9 z 2 x 10⁴. In the case of the FFTB, -.
A; = 0.13 ,
This corresponds to an increase of the spot size of 7%.
The optimal design3 that minimizes the spot dilution from these two effects occurs
with the parameters !b = 5.5 m, 6b = 7.8 mrad, but constraints imposed by saturation
of the steel material in the sextupoles, and the desire to place the entire chromatic
correction system inside the BSY (without extending onto the Research Yard), result in
a compromise solution with 1, = 25 cm and Zb = 5.25 m. The bend angle for the beam
line becomes 0b = 7.4 mrad, and the spot dilution is
A; 3 A; + A; = 0.21 .
A similar optimization, that includes the emittance growth due to synchrotron
radiation in the bend magnets, is done for the horizontal plane. Synchrotron radiation
in the bends will increase the horizontal emittance of the beam, but will not affect the
vertical emittance as long as there is no coupling introduced by the lattice.
Synchrotron radiation in the final quadrupole lenses will ultimately place an in-
escapable limit on the final spot size. This effect, known as the Oide limit, sets an upper
II-6

bound on the focusing of an electron beam that depends primarily on the normalized
emittance ycY:
u; = (II.E.3)
. - - ._
The function F is a dimensionless function of the length and strength of the final
quadrupole and the focal length of the system. This is not a limitation for the FFTB,
but becomes significant for future linear collider final focus systems.
II-7

II. References
1. Karl Brown, SLAC-PUB-4159, (1987).
2. Karl Brown and Roger Servranckx, SLAC-PUB-3381, (1954).
3: I<. Oide, SLAC-PUB-4953,-( 1989).
II-8

Table 11.1. Parameters of the Final Focus Test Beam
Parameter NLC SLC FFTB
Beam energy: (TeV) --
Emittance: YEY bad-4
Focusing: ,0y* (pm)
-. Demagnification:
Beam height: cry (nm)
Aspect ratio:
Bunch length: a, (pm)
Bandwidth: Sp/p (%)
Bunch population ( lOlo)
0.25 to 0.75
3 x 10⁻⁸
100
300
3 to 5
100 to 200
50 to 100
f0.3
1 to 2
0.05
3 x 10⁻⁵
7000
30
2000
1
500
f0.3
3 to 5
0.05
3 x 10⁻⁶
100
380
60
15
500
f0.3
1 to 2
II-9

p - matching f
Q5 Q6 QAB QAl QA2
< ccs x *
BOl BOl ^ -
QN2 QN3 QN3 QN2 QNl SF1 I SF1
I-- l
-1
-
P- exchanger w-
QTl QT2 QT3 QT4
I- x - Module
4 ccs Y >
B02
QM3 QNI QN2 QM3 QNI SD1 SD1
I
-1
4 Final Transformer B02 Softbend
OS.1 QC5 QC4 QS2 QC3 QC2 QXl QCl
9-90 6722A3
Figure II.A.l. Schematic representation of the optics of the FFTB magnetic lattice.
II-10

--
-
Q-90 6722Al
Figure II.B.l. A simple two-lens optical telescope.
II-11
lo-" Q Q . .
40. 40. +sigmay (corrected) +sigmay (corrected) \ \ _ ‘Ov _ ‘Ov --+-sigmay (uncorrected) --+-sigmay (uncorrected)
h h . . - - 0 - sigmay - - 0 - sigmay (linear) (linear) ‘A ’ ‘A ’
. . .
1 o-= 1 o-’ 0.001
betay* (meters) 0.01 0.1
Figure II.C.l. Variation of the vertical beam height at the focal point of the FFTB as the demagnification (&) of the optics is changed. The dotted curve is the lowest order geometric beam size, while the dashed curve includes uncorrected chromatic aber- -_ rations. The solid curve is the size expected for the FFTB after second-order chromatic corrections are applied.
II-12

- -
-
III. Magnets

III. Magnets
1II.A Magnet Specifications
The FFTB beam line consists of discrete dipole, quadrupole, and sextupole magnetic
elements . A detailed list of these elements and typical operating points for them (at _ -
50 GeV beam energy) are given in Table III. 1.
A summary of the number of each magnet type required for the system is given
in Table 111.2. Specifications for the apertures and harmonic content of each magnet
type are also included in Table 111.2. Tl re apertures have been defined to assure at
-. least lOa clearance between the pole-tips of the elements and the nominally P-matched
beam with design emittance. Tolerances on the harmonic content of the fields have been
calculated by placing a limit of 2% on the dilution (per magnet) of the final spot size
due to imperfections in the fields.
1II.B Magnet Design and Fabrication
Designs for all magnet types have been created by the group at the Institute for
Nuclear Physics in Novosibirsk in cooperation with engineers and physicists at SLAC.
The designs are based on parameters common to existing SLC magnets, but some mod-
ifications have been made to provide a better fit to the needs of the FFTB. Some of the
features are taken from the design of the VEPP4 magnets. All of these magnets will be
fabricated in the Soviet Union, tested there, and then shipped to SLAC. Further testing
and calibration will be done at SLAC before the magnets are installed on the beam line.
The group at KEK will design and fabricate a version of the quadrupoles that make
up the final lens doublet (QC2/QXl/QCl), and will provide a mechanically stabilized
support structure for them.
Quadrupoles
The optical design of the FFTB has been tailored so that 28 of the 39 quadrupoles
required for the system can be constructed from a single mechanical design-the so- i - _
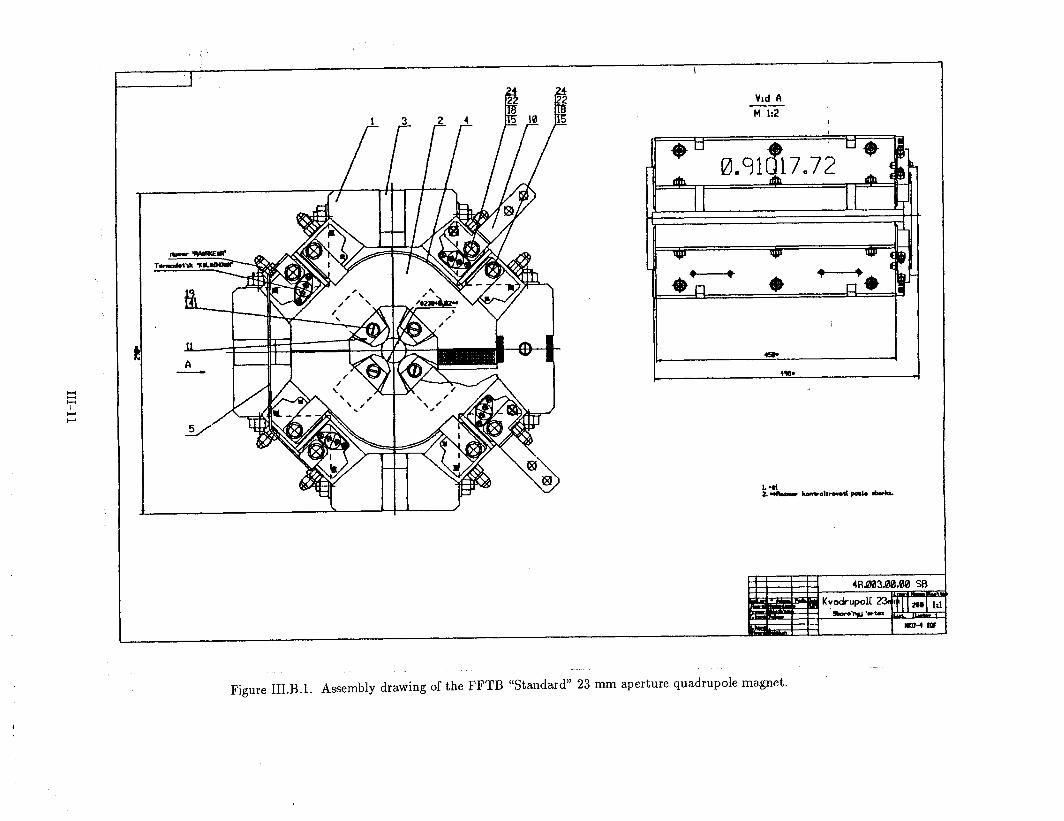
called “Standard Quadrupole”. An assembly drawing of this magnet is shown in Figure
III.B.l. It is a solid core magnet with an effective magnetic length of 46.1 cm and bore
III-2

diameter of 2.3 cm that will be operated with pole-tip fields below 10 kG in all cases. The
harmonic content of this magnet has been analysed with the program POISSON. With
reasonable construction tolerances, this design will easily achieve the 0.1% restriction on
all nonquadrupole fields given in Table 111.2.
-T-he coils for the Standard Quadrupole will be wound from preinsulated 4.8 mm
square copper conductor cooled by water flow in a passage through its center. The design
is shown in Figure III.B.2. The-coils will be vac,uum impregnated with epoxy to provide a
watertight seal. Trim coils will be wound on the four back legs of the quadrupole profile.
These can be powered independently to simultaneously provide up to f10 pm motion
of the magnetic center of the field and f4% adjustment of the quadrupole strength.
A second quadrupole design is used for one of the large-aperture magnets in the final
telescope of the system (QC3) and for several of the lenses in the dump line downstream
of the focal point. This design is a scaled version of the Standard Quadrupole.
The lenses of the final doublet (QXl/QCl) are more difficult to design and fabricate
than the remainder of the quadrupole elements. The restrictions on their harmonic
content are somewhat tight, and in some cases, these magnets must operate with pole-
tip fields that are as large as 14 kG. The alignment tolerances for these elements are such
that they are best designed and fabricated as a complete set, and that they be supported
by a common mounting structure. The group at KEK will design and fabricate a version
of these magnets along with their supports. A prototype magnet with pole-tips made
from the composite material Permendur is presently being fabricated, and is expected to lead to a successful design of a full scale set of lenses.
Dipoles
The dipole bending magnets for the FFTB are all of a single design-the so-called
“Standard Dipole”. This is a solid-core “H”-type magnet with relatively modest field
strengths and tolerances. An assembly drawing of the Novosibirsk design is shown in
Figure III.B.3. Each magnet is 2.8 meters long with 2.3 cm gap spacing. In several
locations along the beam line, for example at the soft bends near the focal point, it is necessary to insert an iron spacer in the back legs of these magnets to increase the
III-3

pole-tip aperture. This is easily done with negligible loss in field quality in the region of
interest.
The coils are wound from water-cooled preinsulated 8.6 mm square copper conduc-
tor, and will be vacuum impregnated with epoxy. Trim windings provide f3% range in
the strength of the individual coils. . - -
These magnets are used in pairs spaced slightly apart to create the bends in the
beam line. This provides access to the center of each bend, or hinge, point in the lattice.
Sextupoles
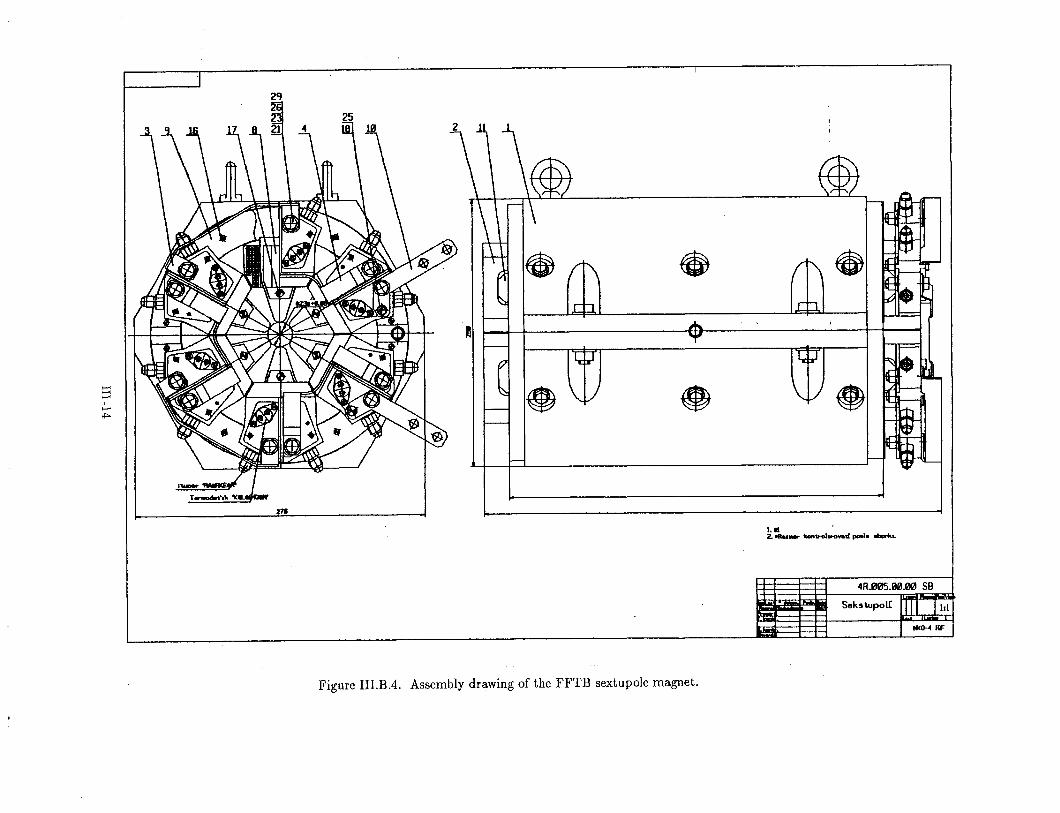
-. All sextupole magnets in the FFTB are of a single design, and will be fabricated
in the Soviet Union. The assembly drawing is shown in Figure III.B.4. The harmonic
content of these magnets is easily within the design criteria, but to avoid severe satura-
tion of the magnetic field in the pole-tip, it has been necessary to reduce the aperture of
these magnets to 2.065 cm and set their overall length to 25 cm. The magnet steel will
remain slightly saturated (E 5%) at 50 GeV beam energy, and there is some dilution of
the performance of the system due to the length of the ma,gnets. The effect on the spot
size of the thick-lens sextupole has been discussed in Section II of this report.
III. c Testing and Operation
Before the magnets are shipped to SLAC from the Soviet Union, the magnetic field
of each unit will be measured to assure that the desired tolerances have been met. The
magnets will be recalibrated at SLAC. In the case of the quadrupole magnets, this will
occur after the Beam Position Monitors have been inserted through the pole tips. Section
V of this report provide further details of the magnetic measurement procedures to be
used at this step.
A series of tests will be performed on the coils prior to their assembly into the
magnets in the Soviet Union. This will include a check of the resistance and a high-pot
test of each coil. The integrity of the cooling circuit will be checked with water at high
pressure, and measurements will be made of the water flow rate through the coil at the
normal operating pressure differential.
1114

To protect the coils against possible failure during normal service, thermal switches
are mounted directly onto the copper conductor at the outlet of the cooling circuit, and
flow switches will be used to verify the supply of cooling water.
III-5

Table III.lA FFTB Quadrupole Magnets
ID
Q5
Q6
&A0 &Al QA2 QN2 QN3 QN3 QN2 QN1 QN2 QN3
QTl QT2 QT2 QT3 QT4
log, 10ay
cm cm
0.51 0.16
0.55 0.16
0.16 0.31
0.14 0.07
0.23 0.01
0.41 0.20
0.95 0.12
0.95 0.12
0.32 0.20
0.18 0.007
0.32 0.20
0.95 0.12
0.94 0.13
0.22 0.23
0.12 0.23
0.78 0.09
0.40 0.60
Min. Bore
cm
1.02
1.10
0.62
0.28
0.46
0.82
1.90
1.90
0.64
0.36
0.64
1.90
1.88
0.46
0.46
1.56
1.20
Selected Bore
cm
2.30
2.30
2.30
2.30
2.30
2.30
2.30
2.30
2.30
2.30
2.30
2.30
2.30
2.30
2.30
2.30
2.30
inch
0.906
0.906
0.906
0.906
0.906
0.906
0.906
0.906
0.906
0.906
0.906
0.906
0.906
0.906
0.906
0.906
0.906
Selected Magnet
Type
0.91Q17.7
0.91Q17.7
0.91Q17.7
0.91Q17.7
0.91Q17.7
0.91Q17.7
0.91Q17.7
0.91Q17.7
0.91Q17.7
0.91Q17.7
0.91Q17.7
0.91Q17.7
0.91Q17.7
0.91Q17.7
0.91Q17.7
0.91Q17.7
0.91Q17.7
Leff cm
46.1
46.1
46.1
46.1
46.1
46.1
46.1
46.1
46.1
46.1
46.1
46.1
46.1
46.1
46.1
46.1
46.1
FFTBSOI G
kG/cm
0.38
2.47
2.84
8.32
4.23
7.68
4.02
4.02
7.68
7.68
7.68
4.02
6.26
5.31
5.31
8.00
3.72
s Gdl
kG
17.60
113.7
131.1
383.7
194.9
354.0
185.4
185.4
354.0
354.0
354.0
185.4
288.4
244.7
244.7
368.8
171.6
Pole Tip
kG
0.44
2.84
3.27
9.57
4.86
8.83
4.62
4.62
8.83
8.83
8.83
4.62
7.20
6.11
6.11
9.20
4.28
Approx. Current
A
10
66
76
220
112
205
107
107
205
205
205
107
166
141
141
212
100
Magnet Voltage
v
1.3
8
9,
27
14
25
13
13
25
25
25’
13
21
17
17
26
12
Power Supply 1 A
250
250
250
250
250
400
400
400
400
400
400
400
250
250
250
250
250
h.ltp1
V
40
40
40
40
40
125
125
125
125
125
125
125
40
40
40
40
40
+
*
*
+
+
+
*

Table III.lB FFTB Quadrupole Magnets (Continued) ’
T T Selected E ,e
cm inch
2.30 0.906
2.30 0.906
2.30 0.906
2.30 0.906
2.30 0.906
2.30 0.906
2.30 0.906
2.30 0.906
2.30 0.906
3.50 1.375
5.40 2.125
2.00 0.79
1.27 0.500
2.30 0.813
2.30 0.813
3.50 1.375
3.50 1.375
5.40 2.125
5.40 2.125
5.40 2.125
5.40 2.125
Magnet Voltage
V
Power Supply Pole Tip kG
4.62
8.83
8.83
8.83
4.62
4.62
8.83
7.61
0.44
7.98
10.94
13.90
11.14
8.80
8.80
10.0
10.0
10.50
10.50
4.08
9.97
Approx. Current
A
107
205
205
205
107
107
205
175
10
280
13
25
25
25
? 13
25
21
1.3
25
A
400
400
400
400
400
400
400
250
250
250
hltp1
V
125
125
125
125
125
125
125
40
40
40
205 25 500 SO 205 25 500 SO
220 20 800 50
220 20 800 50
385 34 500 80 385 34 500 SO
150 14 250 40
365 32 800 50
FFTBSO G
kG/cm
4.02
7.68
7.68
7.68
4.02
4.02
7.68
6.62
0.38
4.56
4.05
13.90
17.55
7.66
7.66
5.71
5.71
3.89
3.89
1.51
3.69
Selected Magnet
Type 0.91Q17.7
0.91Q17.7
0.91Q17.7
0.91Q17.7
0.91Q17.7
0.91Q17.7
0.91Q17.7
0.91Q17.7
0.91Q17.7
1.3SQ17.7
2.05Q77.72
0.SQ11.4
0.5Q39.1
0.91Q17.7
0.91Q17.7
1.3SQ17.7
1.3SQ17.7
2.13Q38.31
2.13Q38.31
2.13Q38.31
2.13Q38.31
Min. Bore cm
1.20
1.22
0.06
1.18
1.20
1.20
1.90
0.94
1.62
3.04
5.22
2.00
1.28
1.80
2.14
2.40
3.36
5.1s
5.64
5.50
4.18
s Gdl kG
Leff cm
ID -
QM3 QNl QN2 QNl QM3 QM3 QNl QC5
QC4
QC3
QC2 QXl
QCl QPlA
QPlB
QP2A
QPSB
QPSA
QPSB
QP4
QP5
lOa, lo+ cm cm
0.39 0.60
0.61 0.20
0.03 0.006
0.59 0.20
0.39 0.60
0.40 0.60
0.95 0.13
0.47 0.43
0.81 0.66
1.52 0.87
2.61 0.45
1.00 0.58
0.64 0.58
0.56 0.90
0.83 1.07
1.20 1.12
1.68 1.12
2.59 1.03
2.82 1.12
2.75 1.51
1.97 2.09
46.1
46.1
46.1
46.1
46.1
46.1
46.1
185.4
354.0
354.0
354.0
185.4
185.4
354.0
46.1
46.1
46.7
305.1
17.4
213.0
810.5
417.0
1930.4
200.0
30.0
110.0
46.1
46.1
46.7
46.7
100.0
100.0
100.0
100.0
352.9
352.9
266.9
266.9
388.9
388.9
151.1
369.3

Table III.lC FFTB Dipole Magnets
BOlD 0.19
BOlE 0.19
BOlF 0.28
B02A 0.57
B02B 0.31
B02C 0.29
B02D 0.55
B02E 0.20
B02F 0.38
Min. Selected Selected Effective FFTBSOE , Approx. Magnet Power Supply 10ay Gap Gap Magnet Length s Bdl Gap Flux Current Voltage output
cm cm cm inch Type m kGm kG A V A V
0.09 0.17 2.30 0.9 3.94D102.4 2.62 6.171 2.353 365 9.0 400 125 *
0.17 0.34 2.30 0.9 3.94D102.4 2.62 6.171 2.353 365 9.0 400 125 *
0.18 0.36 2.30 0.9 3.94D102.4 2.62 6.171 2.353 365 9.0 400 125 *
0.10 0.20 2.30 0.9 3.94D102.4 2.62 6.171 2.353 365 9.0 400 125 *
0.10 0.20 2.30 0.9 3.94D102.4 2.62 6.171 2.353 365 9.0 400 125 *
0.18 0.86 2.30 0.9 3.94D102.4 2.62 6.171 , 2.353 365 9.0 400 125 *
0.17 0.34 2.30 0.9 3.94D102.4 2.62 6.171 2.353 365 9.0 400 125 + 0.09 0.18 2.30 0.9 3.94D102.4 2.62 6.171 2.353 365 9.0 400 125 +
0.09 0.18 2.30 0.9 3.94D102.4 2.62 6.171 2.353 365 9.0 400 125 +
0.17 0.34 2.30 0.9 3.94D102.4 2.62 6.171 2.353 365 9.0 400 125 +
0.54 1.08 2.30 0.9 3.94D102.4 2.62 6.171 2.353 365 9.0 400 125 +
0.57 1.14 2.30 0.9 3.94D102.4 2.62 6.171 2.353 365 9.0 400 125 +
0.61 1.22 ,3.50 i.38 3.94D102.4 2.64 0.806 0.305 215 1.3 250 40 n
0.64 1.28 3.50 1.38 3.94D102.4 2.64 0.806 0.305 215 1.3 ” ” n
2.07 3.44 3.50 1.38 3.94D102.4 2.64 0.835 0.316 222 1.4 250 40 v 1.92 3.20 3.50 1.38 3.94D102.4 2.64 0.835 0.316 222 1.4 ” ” v
1.76 2.92 3.50 1.38 3.94D102.4 2.64 8.349 3.183 740 18 800 50 0
~ 1.61 2.60 3.50 1.38 3.94D102.4 2.64 8.349 3.183 740 18 ” ” 0

Table III. 1D FFTB Sextupole Magnets
Min. Selected Selected Effective FFTBSOE Approx. Magnet Power Supply
Magnet 10~~ 10ay Bore Bore Magnet Length Strength Pole Tip B G’ 1
Current Voltage output
ID cm cm cm cm inch Type cm kG/cm kG kc/cm2 A V A V
SFlA 0.95 0.12 1.90 2.06 0.813 O.SlS9.44 25.00 307.6 6.558 12.30 160 10 250 40
SFlB 0.95 0.12 1.90 2.06 0.813 0.8159.44 25.00 307.6 6.558 12.30 160 10 ” ”
SDlA 0.38 0.60 1.20 2.06 0.813 0.8189.44 25.00 325.1 6.931 13.00 170 10 250 40
SDlB 0.39 0.60 1.20 2.06 0.813 O.SlS9.44 25.00 325.1 6.931 13.00 170 10 n n

Table 111.2. Large Magnet Types for the Final Focus Test Beam
Magnet Type Aperture Length
(mm> (cm>
Number Harmonic Toleranceca)
(%o)
Standard Quad
1.38Q17.7 (QC3)
2.05Q77.7 (QC2)
0.8OQ11.4 (QXl)
0.5OQ39.1 (QCl) - 2.13Q38.3 (QP)+)
Standard Dipole
23 - 46.1 29(b) 0.1
35 46.1 3 0.05
54 200.0 1 0.03
20 30.0 1 0.03
13 110.0 1 0.03
54 100.0 6 0.03
23 262.3 18 0.03
Sextupoles 20.7 25.0 4 1.0
(a) Maximum nonprinciple field at 70% of full aperture.
(b) Includes one complete spare magnet.
(c) Two of this type may be used in place of QC2.
III-10
-T 1
I c
III-1 1

El -I-
F
P 1 3-
c-----x J
-
J
III-12

III-13
-- @

--
IV . Instrumentation
-

Iv. Instrumentation
The beam-diagnostic instruments that will be used in the FFTB will be derived
from devices already functioning in the SLC. This will include beam position monitors
(BPMs), wire scanners, profile monitors, and toroids, and a proposed beam size monitor.
Beam-Position Monitors -
The beam position monitors used in the FFTB will be copies of either the stripline
monitors developed for the SLC’Linac and Arcs, or will be based on the exposed-coax
type used in the SLC Final Focus. Drawings of these devices are shown in Figure IV.l. A
BPM will be inserted into the aperture of each quadrupole magnet. In order to maintain
- the inner diameter of the BPMs at more than ten times the expected beam size, the
“strips” need to be moved into the space between the pole tips of the magnets. This
is done by extruding the beam pipe into a four-leaf-clover cross section such that each
BPM strip becomes the center conductor of a coaxial transmission line. Approximately
25% of the coax is exposed to the beam, so a sizable image charge flows on the center
conductor. This generates a bipolar pulse at the end of the conductor whose amplitude is
directly related to the intensity and position of the beam. The sum of all four amplitudes
is proportional to the intensity alone, and is reasonably independent of position of the
beam when it is within a few millimeters of the center of the device.
The signal-processing electronics is similar to that used for the SLC ARC BPMs.
A block diagram is show in Figure IV.2. The signal which emerges from the strips
consists of two very narrow pulses of opposite polarity separated by twice the time it
takes the beam to traverse the length of the strips-approximately 3 ns. The signals
are substantially widened by the time they pass through 200 ft of coax with 2 Ghz
bandwidth. The first stage of the electronics is a low-pass filter which broadens the pulse
to 10 ns or so. The signals are then digitized by a 14-bit ADC (13 bits per polarity).
This compares to the 12-bit ADC used in SLC. Th e circuitry is being designed with
a signal-to-noise specification of 4000:1, so the ADC granularity will not dominate the
resolution of the system. The processing electronics resides in CAMAC accessible to
the FFTB data-acquisition network. See Section IX of this report for a discussion
of the Control System for the FFTB.
IV-2

The arithmetic for calculating the beam
planes is given by:
centroid in the horizontal and vertical
I beam = T + B tN-tS (IV.1)
x = k * (T - B, + Xoffset Ibeam
Y=k*(N-S)+Yff 1 Ibeam
0 se
(IV.2)
(IV.3)
- where, T, B, N, and S identify the pulse height (less electronic pedestal) measured on
the top, bottom, north and south strips of the BPM. The parameters Xoffset and Yoffset
are systematic offsets created by the mechanical and electrical properties of the BPM
and cabling hardware. The constant k converts the dimensionless ratio to displacement,
typically millimeters. The value of Ic can be derived analytically with reasonable accu-
racy. It is approximately equal to the radius of the strip from the centerline, and is a
weak function of the displacement from the centerline. A constant value is sufficiently
accurate for the purposes of the FFTB. The calibration fixture described in Section V
of this report allows k to be directly measured for each device.
There are two types of error involved in measurements of the beam position. The
systematic errors dominate and are generated by electrical imbalances caused by the
mechanical construction of the devices, attenuation differences between the four cables
that bring the signals to the electronics, errors in the calibration of the signal-processing
module, and mechanical offset errors of the whole device. The sum of these errors will
be held to less than 30 microns on the average.
The second level of error is the pulse-to-pulse consistency of the measurement.
These errors are dependent only on the noise in the signal-processing electronics and the
least count of the ADC. Experience with the Final Focus BPMs in SLC has shown that
this pulse-to-pulse error can be below 2 microns. This will allow short term tracking of
well-tuned beams.
IV-3

Experience with the SLC has also shown that the pulse-to-pulse relative resolution
can be used to maintain good beam parameters on an hour-by-hour basis. The correla-
tion plot in Figure IV.3 shows the horizontal coordinates from two neighboring BPMs in
the SLC Final Focus. The range of the numbers demonstrates beam jitter and the nar-
rowness of the plot shows the relative resolution of the two BPM -in this case less than
2 microns. Improved signal-to-noise, additional ADC bits, and smaller BPMs (smaller
k) will yield even better relative resolution in the FFTB.
The calibration of BPMs used in the SLC has been done by measuring the electrical
center of the BPM (i.e., where T = B and N = S) relative to the mechanical center de-
termined with a tooling surface. A new philosophy is being adopted for the FFTB. Since
the BPMs are placed inside the quadrupoles and it is ultimately desired to know where
the beam is relative to the magnetic axis of the quadrupole it makes sense to measure
BPM response when the beam is on the magnetic axis. Toward this end we have devel-
oped a fixture which measures the axis of the field of the magnet, and simultaneously
calibrates the response of the BPM. This is done by stretching a taut wire through the
BPM after it is mounted in the quadrupole. If the wire is vibrated, then an emf will
be induced across the ends of the wire if there is a net integral magnetic field along its
length. The symmetry axis of the magnet can be found by moving the end of the wire
in micron steps until the signal is minimized. The vibration can then be stopped and a
voltage pulsed sent down the wire to simulate the passage of the beam. This provides a
measure of the response of the BPM to a beam that passes at that wire position. The
software can then use this BPM response as its reference for locating the beam rela-
tive to the axis of the magnet. An additional benefit of this method is that the BPM
is calibrated in the quadrupole where it will stay when installed. This eliminates the
added uncertainty introduced if a tooling fixture is used in intermediate calibration steps.
The calibration facility is further discussed in Section V of this report.
IV-4

Wire Scanners
Wire scanners used in FFTB will be of the same design used in SLC. These consist
of a 45-degree actuator capable of being moved in sub-micron steps across the beam.
By moving one of three wires across the beam one can measure the horizontal and - -
vertical profiles of the beam as well as a 45-degree projection. The apparatus is shown
in Figure IV.4.
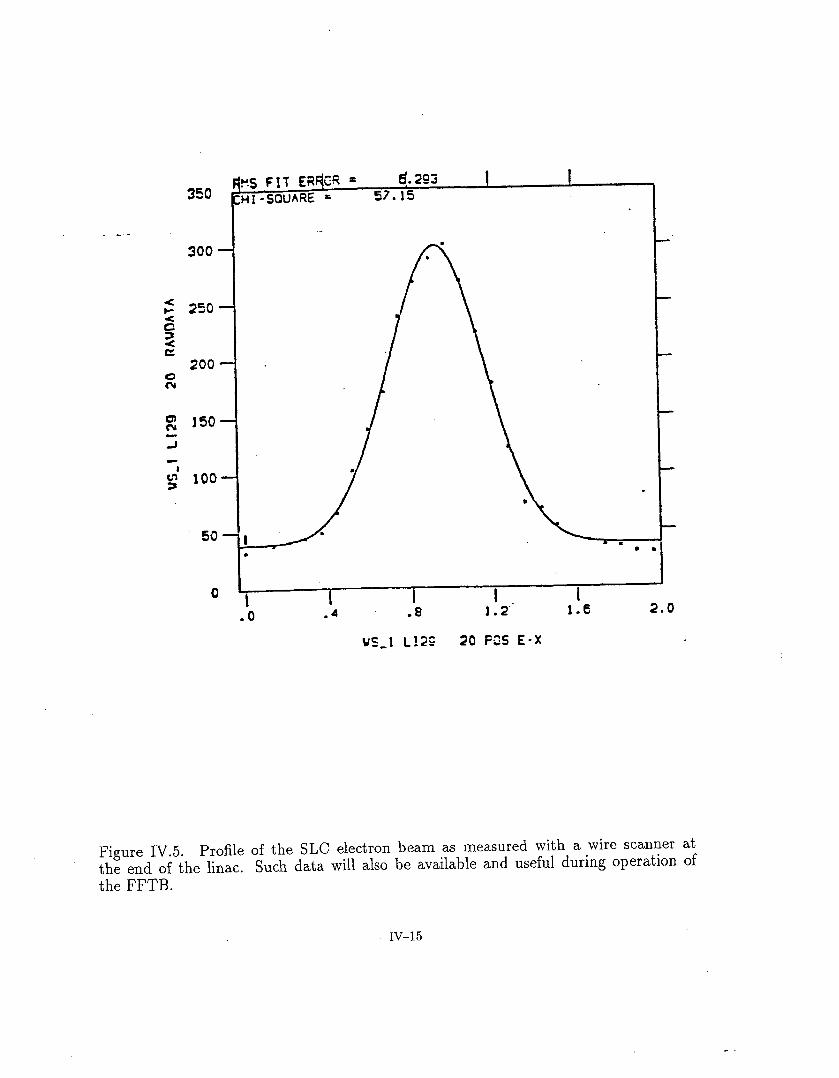
The intensity of the beam striking the wire is observed with a phototube detector
placed at 90 degrees from the beam. The signal amplitude is digitized by an ADC in -
CAMAC attached to a MICRO. A typical sweep of the SLC beam is show in Figure IV.5.
Profile Monitors
Profile monitors based on luminescent screens have been in use at SLAC for many
years. They are useful for getting a visual reading on the profile of the beam. They are,
however, only useful at places in the optics where the beam is larger than 0.5 mm or so,
as their resolution is limited by the grain size of the screen.
The devices consist of an insertable screen and a vacuum window observed by a well-
shielded video camera. The video image can also be digitized for computer processing.
There has been limited success with emittance measurements of beams in the SLC using
digitized images. The primary benefit has come from the realtime visualization of the
beam and its background tails.
Toroids
Toroids used in the Personnel Protection System (Section X of this report) will also
be used as beam transmission monitors. These are useful for monitoring beam loss and
to provide a calibration of the overall gains of the BPM electronics.
IV-5

Stoppers and Beam Dump
Stoppers will be utilized for both personnel protection and machine protection dur-
ing parameter studies. A beam stop placed just downstream of the initial ,&matching
section of the FFTB, for example, will allow the incoming beam phase space to be
matched to the remainder of the lattice before it is permitted to pass through the -- chromatic-correction sections and on to the focal point.
The final beam dump is made of aluminum and is water cooled. The dump is
capable of absorbing 70 kW for a short period without suffering mechanical damage.
Under normal operating conditions the beam power is limited to 1 kW, but this dump - will be capable of handling the full power of a single SLC beam in the case that such a
beam is accidentally transmitted through the FFTB.
Beam Size Monitors
Conventional profile monitors would not work to measure the transverse bunch di-
mensions at the focus where they range from 1 pm down to 60 nm. A detailed description
of the monitor to be built for the FFTB is given in Ref. 2.
Ions are created by the passage of an electron bunch in a pulsed gas target at the
focus. Essentially, the information on the transverse dimensions is obtained through the
kick given to the ions by the space charge electric field of the bunch. After passage of the
bunch, the ions are emitted in the transverse plane and are collected by an ion detector.
In the case of heavy argon ions that move only slightly during the bunch passage,
their maximum velocity is proportional to the maximum electric field. The latter is
inversely proportional to the largest transverse beam dimension, namely the horizontal
dimension. The measurement of the minimum time-of-flight of the ions from the focus
to the detector will give this horizontal dimension (see Figure IV.6).
In the case of light helium ions that are trapped by the electron bunch and oscil-
late in its potential well, their oscillation amplitude depends on their initial position.
In a horizontally flat bunch, the horizontal amplitude and the final horizontal ion veloc-
ity are, on an average, larger than the vertical ones. The angular distribution is peaked
IV-6

along the horizontal direction of the transverse plane (see Figure IV.7). On the con-
trary, the angular distribution is isotropic for a round beam. The measurement of the
angular distribution will give the bunch aspect ratio. It will also be used to correct the
measurement of the horizontal dimension with heavy ions that have a relatively weak
dependence on the aspect ratio. This measurement requires the FFTB to be operated
wiih-electrons only.
It is worth noting that these measurements are not biased by any beam jitter. This
also means that they cannot give any useful information on the beam position.
The proposed setup of the Beam Size Monitor is made of a pulsed gas target and
an array of ion detectors. Only the principle of the experimental setup is given here.
To inject a pulse of gas (about 100 CLS long), a small hole (0.4 mm in diameter) in
the wall of the pipe is opened by a shutter just before the bunch passage. In a molecular
regime, the structure of the gas jet is rapidly destroyed by reflections on the walls of the
beam pipe (4 cm in diameter). One has more a gas target-filling the pipe section and
extending a few centimeters longitudinally-than a gas jet.
A simulation, assuming diffusive reflection and negligible attachment on the walls,
shows that the gas density at the focus is maximum 25 p”s after the shutter closing. It
reaches 2 x 101" argon atoms per cm3 for an inlet pressure of 2 Torr. The gas target
extends longitudinally over 2.5 cm FWHM and over f4.5 cm total at that time.
A second hole allows injection of pulses of helium. As the latter has a larger mean
velocity, it diffuses through the hole faster than argon does. A larger gas density at the
focus (4 x 10’2) can be reached with the same inlet pressure and hole cross section. The
maximum density is reached at the closing of the shutter and extends longitudinally over
3 cm FWHM and over f74 cm total.
The pulse of gas is pumped before the passage of the next bunch (100 ms later)
through the beam pipe, by two pumps (50 l/s at low6 Torr) connected to 25 cm upstream
and downstream of the focus. The level of the residual pressure will be reached in a few
milliseconds.
IV-7

The ion detector consists of an arra,y of eight pairs of microchannel plates (MCP)
surrounding the beam focus at a distance of 6 cm (see Figure IV.7). Before reaching the
MCPs, the ions will pass through a narrow slit in a Wolfram shielding 2 cm thick.
A small potential difference (= 100 V) across the slit in its second part gives a
longitudinal kick to the argon ions. The longitudinal displacement z (a few millimeters)
of -&e-i& impact on a MCP is pr&portional to its charge 2 and inversely proportional
to its kinetic energy. The simultaneous measurement of z and of the time-of-flight for
each ion allows us to discriminate between argon ions of different charges.
The MCPs have a rectangular shape, 40 x 50 x 0.5 mm, with a hole diameter of
12 pm. The gain reaches about 3 x lo3 at 1 kV. A pair of MCP insures an overall gain
of 10’.
Each pair of MCPs is read by nine parallel collectors (anode strips), as shown in
Figure IV.9. The relatively large number of strips (72) is chosen to reduce the pileup of
signals, allowing fast measurements of the beam size. They give an angular resolution
of 87 mrad. The number of strips is increased near the horizontal direction, where the
counting rate is peaked for flat beams and where one needs higher angular resolution.
To measure the longitudinal position of the ion impact, each anode strip is of a
resistive type (1 kn), 11 a owing a charge division for this measurement. A resolution of
0.4 mm is expected.
Signals collected on each side of the strips are amplified and analyzed in time and
amplitude by Time Digital Converters (TDC) and fast Amplitude Digital Converters
(ADC), respectively. Th e comparison in amplitude of the two signals from one strip will
determine the charge division between them, and will give the longitudinal position z of
the ion impact.
The ion counting rate can be estimated from the gas target density and the
ionization cross section. For a gas density of 1Ol2 atoms per cm3 (i.e., a pressure
P = 6.3 10m4 Torr) and a 2.0 Mb cross section, 2000 Ar+ ions are created per millimeter
along the beam. Considering a f200 pm target length and a 20% detection efficiency,
about 150 ions would be detected per burst, enough to mea,sure the beam radius with
less than ten bursts.
IV-8

Figure IV.10 shows the time-of-flight spectrum that can be obtained with 500 ions
according to a simulation code.
The helium ionization cross section is about 7.5 times smaller than the argon cross
section. One would need to increase the gas density for a measurement in a few bursts.
The production of He2+ is negligible and there is no need to separate it out. --
Finally, the He+ time-of-flight is much smaller than the Ar+ one, as its mass is ten
times smaller. The fastest He+ will arrive GO ns after the bunch passage for a 6 cm flight
path, and in the case of flat beam, R = 16.
The mode of operation could be first a few electron bursts with a pulse of argon
gas, followed by several others with pulses of helium gas.
IV-9

IV. References
1. J. C. Denard, G. Oxoby, J. L. Pellegrin, and S. Williams, “Monitoring of the Stanford Linac Microbunches,” SLAC-PUB-305s (1983), Proceedings of the
Particle Accelerator Conference, Santa Fe, New Mexico, 1983.
2, J. Buon et al., “A Beam -Size Monitor for the Final MFocus Test. Beam,”
LAL/RT/90-14 (1990).
IV-10

TIGHT FURNACE BRAZE VAC TIGHT WESCO 50/50.975’c
FURNACE BRAZE VAC WESGO 35/65,10lB’c
VAC
--
BEAM DIRECTION I
BEAM POSITION MONITOR OIJADRUPDLE MAGNET FFTB MECHANICAL
Figure IV.l. (a) A ssembly drawing of a stripline BPM used in the SLC. (b) Assembly drawing of an exposed-coax BPM for the FFTB.
IV-11

Self Triggered Track-and-Hold
Head Amplifier 1 iampltng Brtdges
s
I I , I I Pedestal Trlggcr b A + I Attenuators Set
0-9 e-
p/4 I Attenuator Callbratton Level
e- Avalanche -I-PC -TMgger
Test Pulse Generator
Figure IV.2. Schematic of the signal-processing electronics used to make beam position measurements.

BOO
600 -
400 -
200
I I I I I I I I I I I I I I
.-
.‘2 .h .6 .kl ll0
BPMS FB69 235 X (IP,2BEAM)
Figure IV.3. Correlation plot of measurements of the horizontal beam position made by two different exposed-coax BPMs in the SLC Final Focus quadrupole triplet.
IV-13

Direction of motion
/
Figure IV.4. Schematic drawing of a wire scanner used in the SLC.
IV-14
350
^ - 300
f 250
2 2
200 z
g 150
5 C $ 100
50
C
f$2a3 I I HI-SQUARE. f 57.15
‘I I I 1 . I- .O .4 .8 1.2' 1-E
e-1 L!2G 20 F3S E-X
2.0
Figure IV.5. Profile of the SLC electron beam as measured with a wire scanner at the end of the linac. Such data will also be available and useful during operation of the FFTB.
IV-15

^ -
3
%- 2
5 - .- E
v
0
3-91
I I I I
R=l
0 1 2 3 4 5
q( (Pm) 6632Al
Figure 1V.G. Variation of the minimum ArS time-of-flight Tmin for a 6 cm flight path as a function of the horizontal bunch dimension cs for different aspect ratios R = ~~/cr, (gz = 0.5 mm and Ne = lOlo).
IV-16
-

600
- -
400
2 E 21
200
0
3-91
R=16
1
-1.2 -0.8 -0.4 0 0.4 0.8 1.2
RADIANS 6832A2
Figure IV.7. A simulated distribution of He+ ions for three different beam aspect rations R (athef angle 0 corresponds to the hoizontal direction). The beam dime&ions are: gZ = 1 pm, a, = 0.5 mm, and Ne = lOlo).
IV-17

(b) Beam Line 4
Figure IV.& Schematic view of the ion detector: (a) Transverse section at the FFTB focus. (b) Longitudinal section along the beam line.
IV-18

-- _ Beam A
RF?~ mrt
Resistive Anode Strips
Amplifiers
pamnlifinr
> Amplitude
Lin
Time of t
Flight
” Accelerating
Electrode 3-91 6632A4
Figure IV.9. electronics.
Schematic view of an MCP pair with the anode strips and the associated
IV-19
.-

w
cb
EVEN
TS
a
0 P
al
i3
0 0 in
I I
I I
I
--..z
F
----
L--
1 ---
m--m
--. --
m-J
--
J
----
---
@--
----
----
J -
L=y=
,==
- -
--I
------
- ---
-v
-w---
,--
------
-
F
-em
- ---
t ---
-r--
-1,,
I ---
--
I I
I I
I

--.
V . Magnetic Measurement
and BPM Calibration

V. Magnetic Measurement and BPM Calibration
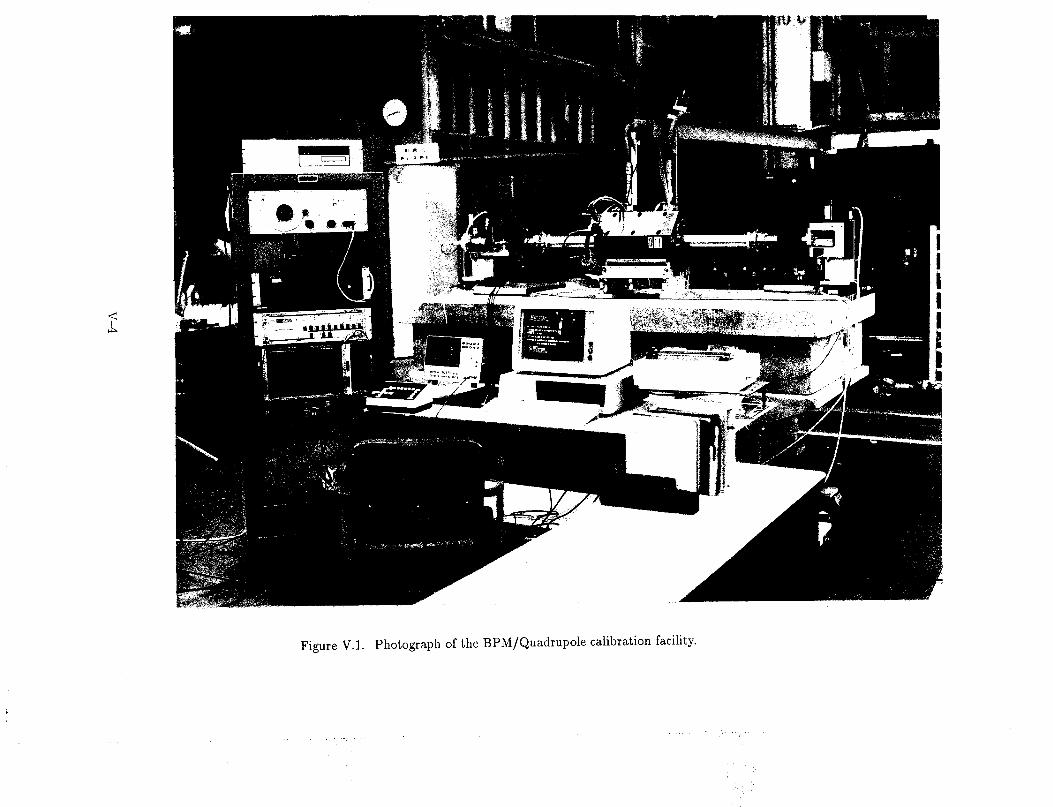
An entirely new calibration facility has been developed for FFTB magnet and BPM
calibration and is shown in Figure V.l. In the past, magnetic fields were measured
independently of BPM calibration-and in separate fixtures which-necessitate disassembly
of the quadrupole and insertion of the BPM AFTER each was separately calibrated.
These measurements were made with respect to the mechanical axis of the devices. We
now have developed a method to make the measurements with respect to the magnetic
axis, which is the important axis for beam optics. This new fixture enables us to measure
both the magnetic axis of the field and the BPM response in a single fixture in such
a way that it is no longer necessary to disassemble them before final installation.
The calibration fixture is mounted on a seismically isolated table. The method
is accomplished by stretching a taut wire through the assembled quad and BPM. The
lightweight wire is tensioned with about 100 grams and made to vibrate at a frequency
in the range of 50 Hz. The ends of the wire are held by two precision stages which can
be moved in two dimensions in sub-micron steps. In order to locate the magnetic axis of
the energized quadrupole the wire is vibrated by an audio speaker’s voice coil which is
mechanically attached to the wire. The emf generated across the wire can be measured
and minimized by moving the stages holding the ends of the wires. Figure V.2 shows
the generated emf as a function of the displacement of one end of the wire.
The vacuum flanges on each end of the BPM will be the tooling surfaces to which
the wire location will be referenced. This is accomplished by the device shown in
Figure V.3. A ring gauge is mounted on the BPM fiducial flange located by three pads
(one is spring loaded). It can be rotated in a plane perpendicular to the quadrupole’s
axis. A micrometer is mounted on the ring gauge and run in until it barely touches
{he wire; this can be detected electrically. This is repeated after rotating the gauge
180 degrees. The average of the two positions gives the location of the wire relative to
the flange tooling surfaces.
v-2

Once the magnetic axis is found with the vibrating wire, the vibrations are stopped
and a voltage pulse that simulates the beam is sent down the wire from the upstream
side. Average voltages are read out from the track-and-hold circuitry applied to each
strip-of the BPM. One set of electr-onics will be switched from one strip to the next using
a coaxial switch. This will eliminate need to calibrate four sets of electronics. These four
voltage readings will be used in the FFTB feedback system to relate beam positions to
the magnetic axis measured in this apparatus.
The effects of wire sag will be minimal. A 2-meter wire stretched with 100 grams will
sag about 25 microns from center to end. However, the ring gauge will locate the wire at
either end of the BPM/quad-a distance of about 0.5 meter. Over this distance the sag
is about 5 microns. Further, since the sag affects both the magnetic axis measurement
and the BPM measurement, the effect of sag tends to cancel.
We expect to calibrate the BPMS used in the FFTB quadrupoles, and to determine
the null axis of the quadrupole fields well enough to center the two to within 30 microns
of each other. In addition, we also will use the apparatus to measure the excitation
functions of all magnets used in the beamline, and to check the harmonic properties of
their fields.
v-3
c b
Figure V.l. Photograph of the BPM/&uadrupole calibration facility.

20
15
10
5
0
-5
-10
-15
-20
50.5 HZ DB 2249 B/27/90
22-q j&O 14.0 10.0 6.0 2.0 -2.0 -6.0 -10.0 -14.0 -18.0 ,-22.0
WIRE DISPLACEMENT OF ONE END (MICRONS) D DATA POINTS - y=.31+/-.52+.8897*x
. ._ I Figure V.2. Example of the enzf induced on the vibrating wire as the position of the wire is scanned through the a.perture of a quaclrupole magnet.
v-5

-
_- - .
r, -- a -? -__:
Figure V.3. Conceptual schematic of the tooling fixture used to locate the position of the vibrating wire.
V-6

- VI . Mechanical Alignment
. . and Stabilization

VI. Mechanical Alignment and Stabilization
-
VI.A Introduction
Errors in the positioning or orientation of the magnetic elements of the FFTB (with
respect to the ideal beam line coprdinates) degrade the performance of the system by ^ - introducing anomalous dispersion and/or coupling into the beam phase space. These
errors can occur as misplacements in the initial settings of the beam line elements, or as
motions of the elements after their installation. Detection and correction of alignment
errors must be done either by additional alignment hardware designed specifically for
this purpose,‘or by deduction from on-line measurements of the beam orbit and phase
space at various points along the beam line. I
._ The relative alignment of the beam line will suffer from finite motions that occur
with a range of frequencies from M 100 Hz down to the static limit. Alignment errors
that are within certain tolerances (typically a few tens of microns for the FFTB) can,
in principle, be compensated by tuning the parameters of the lattice. This method will
be successful if the errors are static, or at least develop slowly compared to the time
required to accomplish the tuning. To completely tune the lattice may require several
hours. Motions of beam line elements that produce microns of displacement in shorter
times must be monitored and eliminated by additional hardware. With a few exceptions,
‘kibrations” that occur at frequencies above the bandpass of the alignment hardware
can not be corrected in any fashion. In some cases it may be possible to observe and - _ accurately determine motions from measurement of beam parameters. These can be
corrected electrically by adjusting the strengths of trim magnets, but this technique will
fail at frequencies above one sixth of the repetition rate of the machine. Fortunately,
propagation of acoustical waves with frequencies above a few tens of Hertz is significantly
damped in materials such as concrete and earth. With proper care in design, it is possible
to isolate the beam line elements so that motions at these frequencies are negligible.
. . -‘-
., -A wi. ; In this section of this report, we discuss the hardware and techniques that will be
used to align and monitor the positions of the elements of the FFTB. Data will also be
presented from studies of the stability of the ground and structures on which the FFTB
VI-2

will be constructed. Tuning and alignment strategies that are based on measurements
of the beam properties are discussed in the FFTB Optical Handbook.
V1.B Alignment Philosophy and Tolerances
The FFTB may be con&derecJ to be composed of five straight segments as shown in -- Figure VI.B.l. These sections are defined by the bend magnets that create the dispersion
used in the chromatic correction of the beam line. Each of the sections, except region 1,
is between 30 meters and 50 meters in length. The first segment lies along the SLAC
linac axis. We define hinge points to be at the intersections of these straight segments.
As we see below, the absolute positioning of the elements of the beam line need not be - extremely accurate, but the elements must be held in fixed locations to within a few
microns to allow tuning of the beam line optics and to maintain the spot size at the
focal point.
Initial Alignment Tolerances
If the positions of the magnets of the FFTB are assumed to be stable, then sim-
ulations of the optical tuning have shown that the spot size at the foci1 point can be
reduced to differ from its design value by only several per cent as long as the magnetic
centers (nodal points) of the quadrupole and sextupole magnets are initially displaced
from the local straight line along which they lie by amounts
- SX rms < 100 pm and Syrlns < 30 pm.
Each local line segment must intersect the adjoining segments with a distance of closest
approach no greater than 30pm (i.e., the beam line must be locally smooth through the
hinge points), but the hinge points need only be within
Ax < 2 mm and Ay < 0.2 mm
of the design trajectory. Bending magnet power supplies can be adjusted to compensate
for errors in geometric angles.
VI-3

Stability During Tuning
Shown in Figure VI.B.2 is the contribution that would be made to the vertical
height of the spot at the focal point of the FFTB if any given single quadrupole magnet
in the system where moved vertically by 10 microns from its ideal position. As indicated
in..the previous section, adjustments can be made to correct or compensate for each
of these errors, but to do so, the position of the magnets must not change during the
tuning procedure. If we demand that the magnet positions be sufficiently stable that
no individual motion change the spot size by more than 2% (either larger or smaller),
then we must maintain the position of each magnet to within f2 microns of a location
- set with respect to the remainder of the magnets in the beam line. Similar calculations
show that the roll angles of several elements about their magnetic centers need to be
maintained to within 0.2 milliradian. There is one lens (QN2) that may require feedback
from measured properties of the beam if it cannot be passively stabilized to - 0.3 micron.
The stretched-wire alignment hardware, described in Section V1.D below, is de-
signed to monitor changes in the positions of the elements of the beam line with accu-
racy f2 microns with respect to a line between the hinge points. The system is being
designed with overlap between the wires of neighboring straight sections so that the
relative motions of the ends of the wires can similarly be determined. Data from this
system can be acquired continuously on a minute-to-minute basis.
Long Term Stability - .
_ - We anticipate that during periods of use, the optical tuning procedure will yield
. configurations of magnet positions that produce small spots. We would like to be able to
return the magnets to positions that are close to one of these configurations after periods
of extended interruption of the operation of the beam line. Our philosophy is that,
on these occasions, the calibration of the stretched-wire system may drift substantially,
or be compromised by work on the beam line. We ade also concerned about the stability _.,.I -- ,“3 ’ --7--.-Y of the foundation of the structures that house the beam line. This is particularly true
of that part of the line that extends onto the concrete surface of the Research Yard.
(See Section V1.F below.)
VI-4

We have chosen to provide an “absolute” reference for the FFTB by extending
the 3 km long Fresnel-lens system used to monitor alignment of the SLAC Linac/BSY.
The positions of the wires that define the last straight section of the beam line will be
monitored with respect to this reference line. Changes in the wire positions need to be
determined with accuracies that are substantially smaller than the tolerances on their --
initial absolute positions. Our goal is to be able to stabilize the wire system to remain
within 10 microns of its initial horizontal position and within 5 microns of its initial
vertical position.
Magnet Movers
- Each of the quadrupole and sextupole magnets will be placed on remotely-
controllable supports that are capable of translating their lateral (horizontal and verti-
Cal) positions over a range of fl mm in steps of 0.3 micron. Trim coils on thelbackleg
flux return of each quadrupole may also be used to move the magnet centers of the fo-
cusing elements by small amounts (up to 10 microns). Control of the magnet positions
will be done by human operators at the outset of FFTB operation, but as we gain con-
fidence in the alignment system, this operation may be transferred to a microprocessor
that will run without human oversight.
Vibration Tolerances
The alignment system for the FFTB is not intended to be able to correct movements
of beam line components that occur faster than can be followed with mechanical magnet
movers controlled by a microprocessor-i.e., vibration at frequencies above M 0.01 Hz.
To avoid dilution of the final spot size, the critical beam line components will have to
be isolated from high-frequency mechanical vibrations with amplitudes larger than a
micron.
v1.c Alignment Techniques
In this section we present a sequenced approach to achieving the initial placement
j_ ‘:-:*’ -- tolerances for the beam line components and their subsequent maintenance. This ap- II._ ; preach recognizes the fact that, for radiation shielding considerations during the con-
struction period, it will not be possible to bring a laser alignment path through the iron
VI-5

muon shielding block in the BSY and out onto the research yard pad before all construc-
tion activities are complete.
STEP 1: Extend a conventional network of temporary monuments through the
downstream part of the BSY,-and onto the Research Yard pad. Locations are indi- - - cated on the layout (Figure VI.B.lb) by the symbol A. Since neither the emerging
electron beam direction nor the path of the BSY laser light axis is in a horizontal
plane, (they dip about 5 rnrad), it is important at the outset to establish the longi-
tudinal coordinates to better than 0.5 mm over the 300-meter length of the system.
- To accomplish this task, a modern Mekon1eter.l is the instrument of choice
STEP 2: Install Fresnel target stations to form a network that will define the
- “absolute” reference for the beam line. The Fresnel network is indicated by the
symbol @ in Figure VI.B.lb. One target station will be installed in the vicinity of
each “hinge point” to monitor relative motions of the stretched wires with respect
the laser reference line. Additional target stations will be installed to complete the
network necessary for initial alignment of the beam line. A given target station
will provide useful constraints on the alignment of any component if the distance
between the two is no greater than ten meters. Each Fresnel station has reference
tooling outside its vacuum enclosure, and is equipped with fine adjustment screws
that allow final positioning when the laser system is evacuated and activated.
STEP 9: Align by conventional techniques all elements and Fresnel stations within
the monument network -established in STEP I.
STEP 4: Install the stretched-wire system. Two wires will be stretched along each
segment of the beam line, and at least three read-out sensors will be placed on each
quadrupole and sextupole magnet. This will be sufficient to determine changes in
the horizontal and vertical positions of each magnet as well as possible changes in
the pitch and roll of the magnet orient&ion.
VI-6

A laser-tracker2 is an instrument that combines a theodolite system to measure
angles (60 M 2 arcseconds) with an interferometer-retroreflector system to provide
range information. We will use such a device to align the beam line elements well
enough that the stretched-wire system can be installed. The laser-tracker is capable
of measuring linear distances-with resolutions of 5 to 10 pm, and we estimate that
its use at this step will align the elements along each segment of the beam line to
x 50 microns of a straight line in three dimensions.
If the initial network were good enough and stable enough, then the ends of
- the straight segments would be within specifications, and in the absence of daily
ground motions and thermal deformations, the FFTB Fresnel system would not
._ be necessary. However, we believe that the conventional network will not be good
enough to meet the initial alignment specifications of 30 pm in the vertical plane.
Therefore we must wait until Fresnel targets in the Linac can be used in conjunction
with the FFTB targets before we perform this alignment.
--
STEP 5: The wires serve to detect changes in the alignments of the beam line
elements with respect to the wire positions. To fully stabilize the beam line, it is
necessary to also monitor movements of the wires themselves. This is to be done
in two ways. Each wire pair is to be extended so as to overlap with its neighboring
wires. Sensors mounted to fixtures in the overlap regions will monitor the relative
displacements of the neighboring wires. This is not, of itself, sufficient to guarantee
that the overall layout of the beam line remains fixed, but will provide an internal
constraint and monitor. The wire sensors can be read-out continuously minute-
by-minute.
We will use the Fresnel system to keep track of “absolute” motions of the
beam line. Movements of the wires with respect to the Fresnel network will be
VI-7

monitored with wire-position sensors mounted on small invar platforms similar to
the tooling frames used on the beam line magnets. A Fresnel target station will be
located near to each wire-position platform. It is assumed that deep within the BSY
channel conditions will be stable enough that the positions of beam line components
with respect to nearby _
Fresnel targets will not change by more than 10 microns on a daily basis and not
more than 20 microns on a monthly basis. Measurements indicate that distortions of the
Linac housing are within these bounds. On the other hand, we know that the concrete
pads that make up the surface of the Research Yard move with respect their surround- - ings by considerably greater amounts. (See Section V1.F below.) A schematic’plan of
the system that will be installed to monitor the alignment of the last straight*section ._ of the beam line is shown in Figure VI.C.l. “Bridges” will be used to track the motion
of each wire-position platform with respect to an adjacent Fresnel target station. The
Bridge hardware is described below. The Fresnel system can be read-out only slowly
since only one lens at a time can be inserted into the laser beam. A complete survey
requires an hour or more to acquire, although partial surveys can be obtained
more rapidly.
_
STEP 6: Once all parts of the FFTB including the shielding are in place, and the
plugs in the iron wall removed, Fresnel targets in the linac can be used to define the
reference for the FFTB. The Fresnel stations are then to be used as a network for
_. -.,i._ _
the “absolute” alignment of the beam line. We will use the laser-tracker to measure
and correct the locations and orientations of all elements along the beam line. The
locations of the wires can also be recorded at this point for future reference. This
process is shown in Figure VI.C.2. The errors that we expect to incur in this
process are summarized in Table VI.C.l. Tl le elements of the beam line should be
easily within the required positioning accuracies of 30 1-1 m in the vertical plane and
100 p m in the horizontal plane.
VI-8

STEP 7: The stretched-wire system is activated by nulling all wire sensor readings
and beginning to track magnet and wire positions. The accuracy with which on-
line monitoring and reconfiguration of the beam line can be done is summarized in
Tables VI.C.2-4.
^ - V1.D Alignment Hardware -
The Magnet Reference Tooling- Frame
The effective magnetic center of a focussing element, or the electrical center of a
beam position monitor, is not a physical location that can be touched with alignment -
tools. Some form of practical reference tooling has to be provided. Traditionally this
has been in the form of tooling balls mounted in some convenient place on the object
-with the traditional confusion of just where these balls are relative to where the beam
thinks the center of the object is. Moreover, thermal expansion of the object changes the
location of these tooling balls. The frame, shown sketched in Figure VI.D.l overcomes
some of these problems. The legs are brought to bear on the split planes of the magnet,
which being symmetry planes, should not change their location with expansion. The
legs are made of invar or other material of very low expansion coefficient.
The Stretched Wire System
Stretched wires have been used since Egyptian times to align large structure.3 De-
velopment of high precision wires for this application has been undertaken by the DESY
_ - laboratory.4 -
A spring steel wire of 0.5 mm diameter has been stretched over a distance of 45 me-
ters using 42 Kilogram tension. The observed sagitta was an acceptable 6 mm. Interest-
ingly it was found that the wire sag was better fit with a parabolic function than with
the theoretically predicted catenary. Most importantly, the wire’s natural oscillations
(frequency 6 Hz) are damped with a time constant of 16 seconds. An amplitude-vs-time ,/.._, s *--- L display lasting 2.5 minutes is shown in Figure VI.D.2. The residual motion due to nat-
ural microseismic motion of the supports and/or air drafts is shown in Figure VI.D.3.
Long term measurements of the vertical and horizontal positions of the wires showed
VI-9

very slow drifts of less than 20 microns over days. These drifts are thought to be more
indicative of the tunnel stability and its environment than of the wires themselves. All
measurements were carried out using shadows of the wires cast on CCD arrays.
A sensor for the wire, based on BPM-style electrical pickups, is being designed.
These devices will have physical apertures of at least 3 mm to all.ow reasonable clearance . ^ - about the fl mm range of the magnet movers. Either short current pulses or continuous
rf waves will be sent along the wire to induce signals in the monitor electrodes. Electrical
read-out and digitization with 12-bit ADCs will provide a least-count no larger than
0.5 micron, a full range of fl mm, and a range over which the system is linear to
within one least-count of greater than flO0 micron. The wire, detection elements, - and electronics in this alignment system should be free of internal drifts of magnitudes
comparable to the resolution of the system over the period of a day. J _, -.
The Fresnel Target Laser System
An exploded view of an existing laser station showing its saddle, vacuum housing,
leveling plate and actuator assembly is shown in Figure VI.D.4. The laser itself and its
mount will be mounted in the research yard outside the new housing so that, in contrast
to its previous location, it could be manipulated during beam operation. We intend to
maintain the existing geometry in which the light enters the housing at right angles to
the linac axis and note that since this location is likely to move about during operation,
we will employ readings from Fresnel lenses chosen from each end of the linac to define
the reference line for the FFTB. -
_ - On April 25, 1990, it was possible to reactivate the original BSY laser system and
- to take data with it, as well as with the main Linac Laser Alignment system. The
positions of images were marked on a ground glass screen, rather than with the usual
trolley, because they were much displaced with respect to preliminary observations taken
in February 1989. The analyzed data (corrected for station pedigree only in the linac)
and referring to a straight line with the laser itself on one end and the center of the glass
. ~. .--- ._ port in the detector room as the other end, is shown in Figure VI.D.5. .: .;.;. ;
Figure VI.D.6 displays a ma.gnified view of the switchyard data. Ignoring the points
from the monument (which was never used for BSY alignment) and station 11 (which
VI-10

was moved during SLC construction) the horizontal readings average to -1 mils and have
an rms spread of 10 mils. The vertical readings cluster around -57 mils and have a spread
of 17 mils. Our recollection from February 1989 is that the vertical data was tighter
then but it should be mentioned that the new data was not only post earthquake but
also after many tons of iron shielding were rearranged in the switchyard. These results - -
are very encouraging with respect to the stability of the old BSY tunnel floor.
The Bridge
The purpose of the “Bridge” is to reference the ends of the wires to the absolute
coordinates of the laser stations. A cross section depicting this function is shown in
- Figure VI.D.7 Since the coordinates of these locations are vastly different in both the
horizontal and vertical planes, it is important to maintain the local coordinate frame
plumb. Other parts of the bridge include the extensometer, mercury height itransfer
liquid levels and tiltmeters.
For the past year we have been attempting to develop a precision mercury level
to measure height differences in the micron range. The principle requirements on the
device are that it provide reproducible results over long periods without drift and be
reasonably radiation hard. When it was pointed out to us that oxygen, a constituent of
air, attacks the mercury surface, thereby altering surface tension and hence changing the
meniscus determined height of the liquid, we returned to an all metal (stainless steel)
system that can be evacuated and backfilled with dry nitrogen. Various height sensors
were examined. The one used in the current version is a capacitance sensor’ which is - _ housed outside the cell volume and which measures the liquid level by sensing through
a thin plastic window (polycarbonate): The assembly is shown in Figure VI.D.8. For
these tests the usable range had been set to f0.5 mm per cell. The height of the mercury
pool is 12 mm. No attempt has yet been made to compensate for height changes due
to cell temperature variations. These are expected to be 0.5 microns/deg.C. The free
period of the instrument is expected to be about 120 seconds.
_,, - , ..-- --*-:--. 1 A one week portion of a two month trial of two cells (connected 2 meters apart)
resting on the concrete floor of the Central Laboratory Annex basement are shown in
Figure VI.D.9. Data was logged every ten minutes. A tilt of I microradian represents
VI-11

one cell rising, the other falling by 1 micron. The data shown in this figure was taken
after covering the cells with thermal insulation and shows that after several days the
cell temperature stabilized at the ground temperature. The other temperature trace
represents the air temperature in the room near its east wall. A check made with
the aid of a third sensor measuring a fixed distance showed that the signal processing
electronics was insensitive to ambient changes, varying no more than one digitizer count
for the ambient changes observed. One digitizer count is 179 microvolts and represents
an 18 nanometer liquid height difference.
Our current interpretation of the data is as follows. Since ambient temperature
- changes of the instrument cannot eATlain the apparent tilt of the floor, we will assume
that it is real. The measured period of the oscillation is much closer to 24 hrs than
24.8 hrs (the period of the moon) and we therefore ascribe the motion to thermal effects . .
outside the experiment rather than to the earth tides. The ambient air temperature
in the room follows the temperature outside of the building. We therefore speculate
that the sun heats the East wall of the building preferentially and thereby tilts the
basement floor. (The south wall of the basement is underground.) One notices that the
swings of temperature and motion are smaller on cooler days which have overcast skies.
Recent tests conducted in the sector 10 test bench show similar daily fluctuation in tilt.
(See Figure VI.D.lO.)
We are encouraged and work of this kind continues on smaller more practical cells,
differential eddy current sensors,’ other liquids for the level and temperature compen- -
sated mountings.
1ncEinometer.s and Rotation Tables
Using a high resolution tilt sensor mounted on a rotation table, it is possible to
compute the absolute, gravity relative, tilt of a platform or tooling frame upon which wire
position monitors and/or proximity sensors are mounted. The Final Focus Test Beam
alignment system will use wire position monitors and proximity gauges to track motions . ?. -* ..
c --. 1 of the magnetic centers of focusing magnets at the micron level with respect to an
absolute reference frame. The “tracking” measurements are performed at some distance,
tens of centimeters, from the points being tracked. Assuming that the distance between
VI-12

the points being tracked and measurement devices is constant, or can be computed,
one must nevertheless know the angular orientation between the measurement devices
and the points being tracked. The inclinometer system provides this information. The
rotation tables allow to balance systematic errors (bias, zero offset).
The planned for resolution of-the sensors is 1 arc seconds (4.85 microradians).
Controls
The style and architecture of the controls system is constrained by the fact that
FFTB operation is part of a much larger accelerator system, namely the SLC whose
controls are CAMAC based and VAX driven. The very complexity of SLC also imposes
- certain uniformity standards on hardware and particularly software issues. In order to
be operationally compatible with SLC the designs of magnet controllers, beam position
and profile monitors, magnet mover controls and the like, are carried over directly to the
new’system; their overhead has already been accounted for. Less clear have been the
issues connected with devices that have no clear precedence such as the readout of the
laser alignment system images, wire position monitors, proximity sensors tiltmeters and
the like. The first cut on their integration is shown in Figure VI.D.ll. Those systems
requiring local processing are provided with micros that then communicate with the
VAX employing standard protocol.
V1.E Magnet Movers
All magnetic lenses will be equipped with “magnet movers” to mechanically trans-
late them back into line when their position has drifted by unacceptable amounts. It
-- is important that mechanical translatioi-is can be carried out on-line, that is while the
beam is in operation. While it is relatively easy to move objects as heavy as magnets
horizontally on precision slides, vertical motion is harder to achieve.
An elegant system of “cam actuators” has been developed to position the final
lenses of the SLC final focus7 A sketch of the original device, providing two translations _~j ..-..
y-~ : and three rotations of a rigid body is shown in Figure VI.E.1. A new design, suitable
for most FFTB components but having only three degrees of freedom 2, y, Or has been
completed. It is shown in Figure VI.E.2. Interesting features include a “harmonic drive”
VI-13

for the gear reducer box and precision (< 1 p) LVDT b ased coordinate readout. Coarse
adjustment of its base is provided for at the f5 mm level. We assume that the final
triplet assembly and the four quad-sextupole-quad packages will be mounted on the five
degree of freedom type mover. The group at KEK will design and fabricate the mounts
for the magnets that make up the final lens doublet. -- .-
V1.F Some Recent Measurements on the Research Yard Site
In contrast to the heretofore mentioned stability of the C line under the mountain
of shielding that covers the BSY, the research yard is in the open and subject to the
_ effects of the weather.
Pier Thermal Motion ._ - An experiment to determine the thermal stability of the research yard base,‘carried
out in the summer of 1989, concluded that portions of the concrete pad moved with
respect to the base of End Station A by as much as 0.6 mm on a daily basis as a result
of pad heating by the sun. It was therefore recommended that concrete piers be sunk
into the bedrock which were to be suitably decoupled from the surface of the concrete
pad and therefore immune to surface temperature effects.
Three piers, each 3 ft in diameter and 11 ft deep were subsequently poured in
November 1989. They were designed to simulate the supports of the final focus test
beam final quads. Measurements on their lateral position (ie., w.r.t. End Station A) -
were begun March 24, following a four month waiting period-long enough after pouring
-. to ensure that the concrete had fully cured.
In contrast to the earlier experiment in which a Kern Mekometer was used at the
limits of its stability, changes in length of the 33 meter distance were now measured
using a Hewlett-Packard interferometer. As before, the flight path was evacuated by
means a 4-inch diameter tube to make the readings insensitive to changes in atmospheric I. -. -7 7 .- I temperature and pressure. The piers in the yard were shielded from the sun by a large
tin roof, its sides were loosely covered with a tarpaulin. The wind could blow through
the structure freely.
VI-14

Figure VI.F.l shows results of the first data set. The data is smooth (in comparison
to that taken with the Mekometer) but shows ahnost as much motion as the previous
experiment. Although the figure shows a complete daily cycle it is stitched together from
three separate days because the interferometer would on occasion “loose count” when
something caused the laser beam to become misaligned. The total amplitude of motion - -
is 300 microns (as opposed to 600-in summer 1989) h owever the tempera&e swings in
March were not as extreme as last July.
A series of experiments were conducted next to ascertain whether the results were
real or instrumental. Even though both mekometer and interferometer results are very
- similar, one might suspect that the interferometer head is sensitive to temperature
changes. For this reason the apparatus was moved further away from the door sill of
and into ESA by extending the vacuum pipe another 15 ft. The fixed retrofeflector ._ on the pier (insulated against temperature changes) was replaced by one mounted on a
servo-controlled frame which could track minute changes in laser direction so that the
instrument would not loose count for days at a time. The tilt of the door sill was moni-
tored with a resolution of a milligon. The results are displayed in Figures VI.F.2. They
are not easy to interpret. As before the motion lags the temperature of the concrete by
about three hours when the temperature rises. However, just prior to the rise, the mo-
tion is reversed as if the floor of ESA suffers a hysteretic excitation. The data clearly
shows that when the sky is overcast and lesser concrete heating occurs, the motion can
be as low as 50 microns.
The notion that the evacuated pipe had a leak (in both experiments) and that
temperature changes of the residual gas were responsible for the observations was checked
by shielding the pipe from the sun. The results were unaffected by the shielding. Changes
in temperature of the port windows also cannot explain the observation. At that moment
we did not know what moved, the pier or the end-station but it became clear that our
simple notion of decoupling the two by pouring a pier into the miocene bedrock was not
yet a satisfactory answer. A: * ._. _
The next experiment in this series was to measure variations in the distance between
the piers and End Station B. The walls of the building face in the opposite direction to
VI-15

the sun from those of End Station A. The results are shown in Figure VI.F.3. As the
temperature climbs with the rising sun the distance between ESB and the pier becomes
smaller and one notes by a similar amount that the distance to ESA gets larger. This
fact leads one to the interpretation depicted in Figure VI.F.4. The changing azimuth of
the sun causes differential heating of the surface and some small fraction of the resulting -- .-
motion is transmitted to distort the miocene below.
Recent Measurements of Vibration Levels on Central Beam Piers
In order to ascertain whether or not an active vibration isolation system’ would
be required for use in stabilizing the last lenses of the FFTB, a series of vibration level
- measurements were carried out.
Vertical and Horizontal velocity transducers were placed on the outer piers. A
typical vertical velocity spectrum is shown in Figure VI.F.5. The most prominent peak
occurs at 29.875 Hz. This frequency is known to be related to LCW cooling water
pumps. The minor .peaks at 11.6, 12.25 and 13 are believed to be associated with
machinery in the nearby cryogenics facility. With a sensitivity of 1 cm/set +=+ 1 volt,
the 55 microvolt rms signal translates to a rms coherent amplitude of 0.003 microns.
The lower frequency peaks contribute comparable amounts. The rest of the spectrum
is barely above the noise of the analyser. These measurements must be repeated when
the new rapid cycling injector synchrotron for SSRL operations of the SPEAR storage
ring becomes operational.
Figure IV.F.G.depicts a real time trace of a time integrated signal proportional to
real time amplitude. With an integrator gain and time constant yielding 0.8 microns/volt
calibration we see peak to peak East W&t amplitudes up to 0.5 volts, i.e., 0.4 microns.
The period of these oscillations is very long (about 3 seconds) and therefore not con-
sidered particularly dangerous. (For discussion see below) Note: The roof and wall of
the shed covering the apparatus was subjected to a fair amount of wind while this mea-
surement was made. Figure VI.F.7 depicts the Probability Density Function of this real
time horizontal motion to be equivalent to about 0.1 microns. By 17:55 hours the wind
had died down and the EW motion had fallen a factor of two. The vertical motion
(See Figure VI.F.8) remained equivalent to about 0.05 microns rms.
VI-16

A measurement of the shear wave velocity in the bedrock is afforded by dropping
a lead brick and measuring the time of arrival at vertical sensors mounted on the outer
piers as shown in Figure VI.F.9. The distance between the piers is 5.5 meters and
the arrival time difference which can be read from Figure VI.F.10 is 14 milliseconds
yielding a not unreasonable shear wave velocity, for this material at this depth, of about
40b &ters/second. Since all dist&bances with wavelengths greater than say’75 interpier
distances will be 92% coherent (sin2r/75 M .OS) frequencies below 1 Hz will not be
dangerous to this extent. However larger distances require the absence of disturbances
above still lower frequencies. Generally speaking, the larger amplitudes (up to 1 micron)
due to ocean wave activity on the Pacific rim occur only during heavy winter storms at -
sea and have periods in the many seconds.
VI-17

VI. References
1. For example, the ME5000 made by Kern, Switzerland.
2. For example, Chesapeake Laser Systems, Inc., 4473 Forbes Blvd., Lanham, MD
20706. -- .-
3. Some more recent applications may be found in “Alignment and Vibration Issues
in Te V Linear Collider Design, ” G.E. Fischer, Particle Accelerators 1990, Vol. 31,
p. 47-55.
4. “Wire Measurements for the Transversal Control of the FFTB-Magnets,”
- W. Schwarz, Paper D4, Second International Workshop on Accelerator Alignment
DESY, Hamburg, Germany, September 10-12, 1990. r
5. Model HPT-375G-A-12-100-B-D, Capacitec, P.O. Box 819, 87 Fitchburg Rd.,
Ayer, Mass 01432, (508) 772-603, with series 4000 signal processing.
6. Kaman Instrumentation Corporation, 1500 Garden of the Gods Rd., P.O. Box
7463, Colorado Springs, CO 80933, Model KD-5100 Series, used to steer telescope
mirrors in the microradian range.
7. Final Focus Memo “A Positioning Mechanism for the Final Quadrupole Triplet,”
G. Bowden, G. Putallaz, March 10, 1985.
8. See for example, N.Ishihara et al., Particle Accelerators 1990, Vol. 31, p. 57-62.
VI-18

Table VI.C.l Accuracy of the Laser-Tracker Alignment of the FFTB
Item Error (microns) -- .-
Change in position of magnetic center:
Node-finding wire to magnetic’center:
Fiducial flange to node-finding wire:
Tooling frame to fiducial flange:
- Tooling frame to actuator:
Tilt of actuator:
Actuator tooling surface to mechanical center of grating:
Mechanical vs optical center of diffraction grating:
Center of diffraction image:
Actuator nonrepeatability:
Z position of lens stations:
Movement of laser over one cycle:
Quadrature Sum: 18.9
5
2
3
7
10
3
7
5
3
5
2
7
VI-19

Table VI.C.2 Accuracy of the Stretched-Wire System (Short Term)
Error (microns)
Change in position of magnetic center:
Nonsystematic motion or distortion of wires:
Wire position sensor resolution:
Thermal gradients in tooling frame:
Response time of the control system:
(Motion which is too fast to be corrected)
- Quadrature sum: 2.8
*
Table VI.C.3 Accuracy of Daily Alignment of the FFTB
Error (microns)
Tilt of beam pipe platform (20 min): <l
Drift of bridge sensors (20 min): <l
Tilt of actuator (20 min): <1
Center of diffraction image: 3
Actuator nonrepeatability: 5 -.
Movement of laser over one cycle: 7
Quadrature sum: 9.1
VI-20

Table VI.C.4 Accuracy of Weekly Reconfiguration of the FFTB
Item Error (microns) --
Change in position of magnetic center:
Change in position of tooling frame (weekly):
Wire position monitor drift (weekly):
Nonsystematic motion / distortion of wires (weekly):
Tilt of beam pipe platform (weekly): - Drift of bridge sensors (weekly):
Tilt of actuator (weekly):
Center of diffraction image:
Actuator nonrepeatability:
Movement of the laser over one cycle:
5
3
10
3
3
5
3
3
5
7
Quadrature sum:
VI-21

( > a . - -
2 Hinge Pt -
Monument for Conventional Network
A A A
-- - Figure VI.B.1. (b) Layout of th
(a) Equivalent FFTB Geometry in terms of straight line segments. e conventional alignment and Fresnel target networks for the FFTB.
VI-22
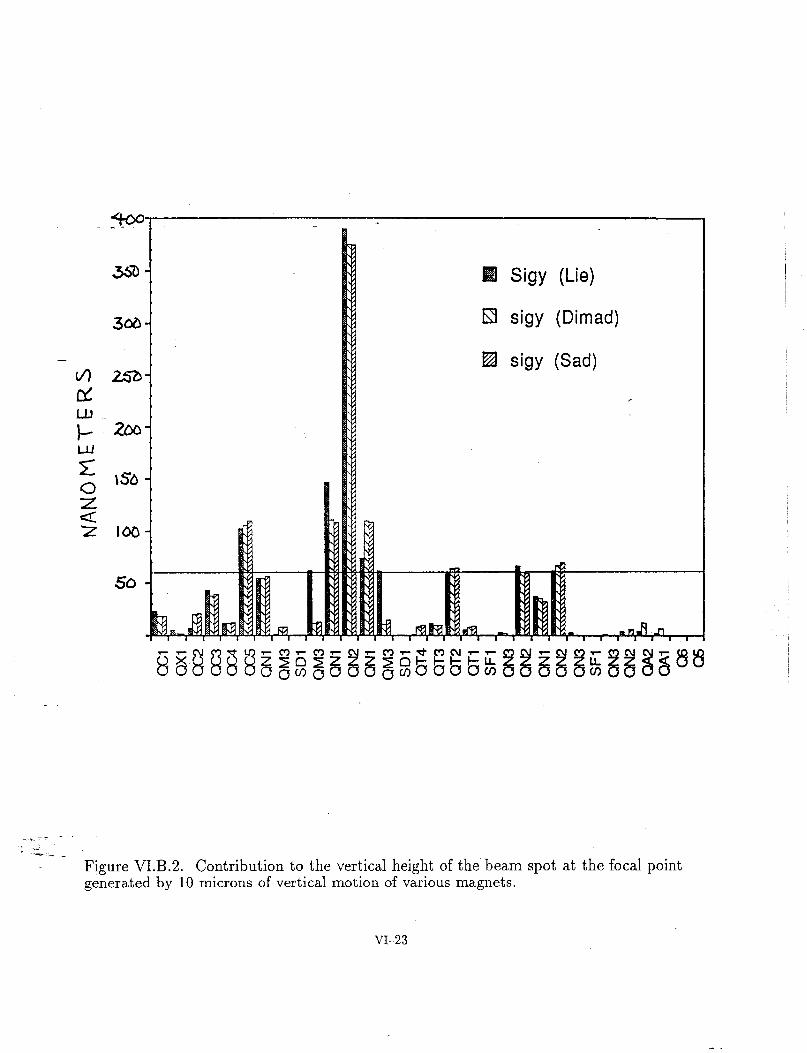
- cn ti LLI I- “s z z Ioc
50
Sigy (Lie)
E9 sigy (Dimad)
/Z! sigy (Sad)
1: “w- -.- _
Figure VI.B.2. Contribution to the vertical height of the beam spot at the focal point generated by 10 microns of vertical motion of various magnets.
VI-23

Beam
tine
m
Y 1
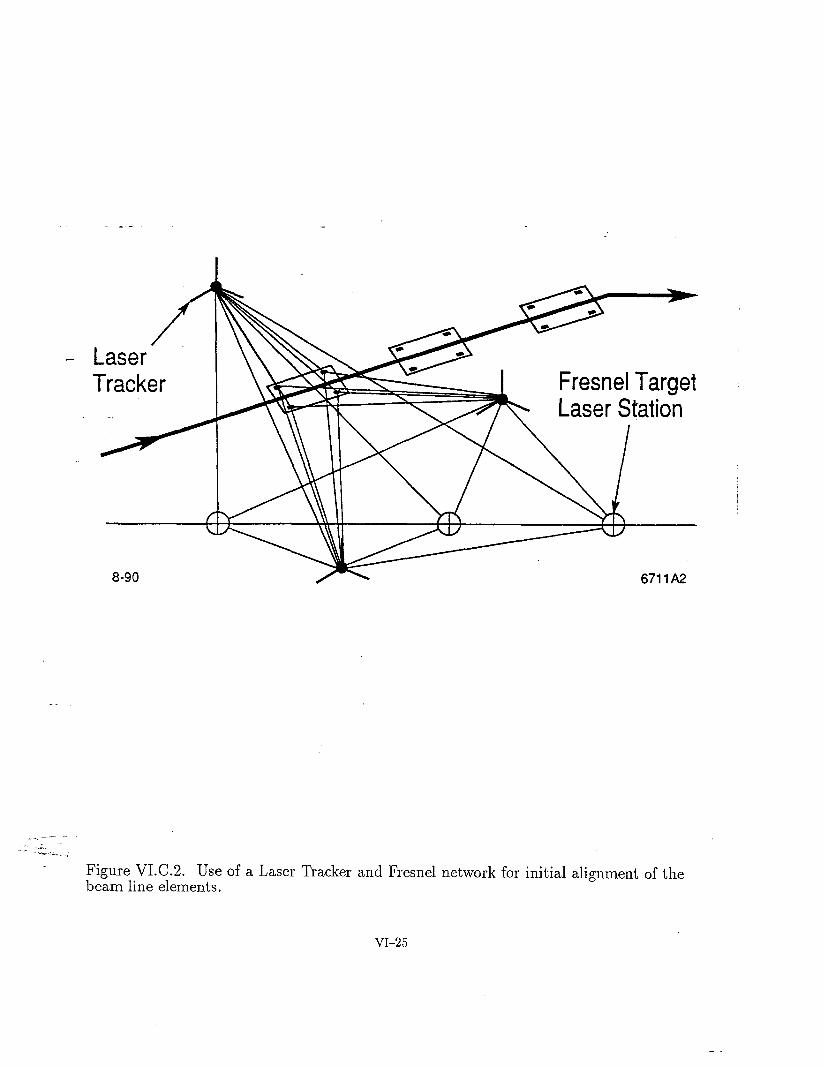
-?.I-- --
- -2: -‘-L- ;
Figure VI.C.2. Use of a Laser Tracker and Fresnel network for initial alignment of the beam line elements.
VI-25
-

-
- - ii .-
VI-26

-
’ .
I _:
_..
u-l Pi
0 c-4
LD -
. 7 0
_ .
- I.0 _
. 0 0 d
c .- FL! .- !-
UJU
J u!
s6ujpoaa
VI-27

t s .- z .- -z a, I,
. 0 c3

-
I
Figure VI.D.4. Exploded view of a BSY laser station.
VI-29

VI-30

_-
BSY LASER ALIGNMENT DATA APRIL 25TH 1990
50 - I I I I I I I I I I
- z n .- mm
15
O a
n -5 o,
‘I- -50 - 5 CP O 0 w
> 0
T -100 -
ii! n Horizontal c/) -150 - 0 Vertical E 0
-250 I I I I I I I I I 9800 10000 10200 10400 10600 10800
STATION COORDINATE (feet)
Figure V1.D.G. Magnifikd view of laser lens positions in the beam switchyard.
VI-31

~‘&re VI.D.7. \ \ Th
e c
Oordinate Tr b e earn direction).
- _ ------ - ~- ------- . . ‘. .--.._.
. ----.-_:- --.i- _i.~. ----. __ _
~---.a+ .- i.. ; ---=-- ____ _.
----- _ __

Figure VI.D.8.
Assembly
of precision m
ercury level
cell.
VI-33
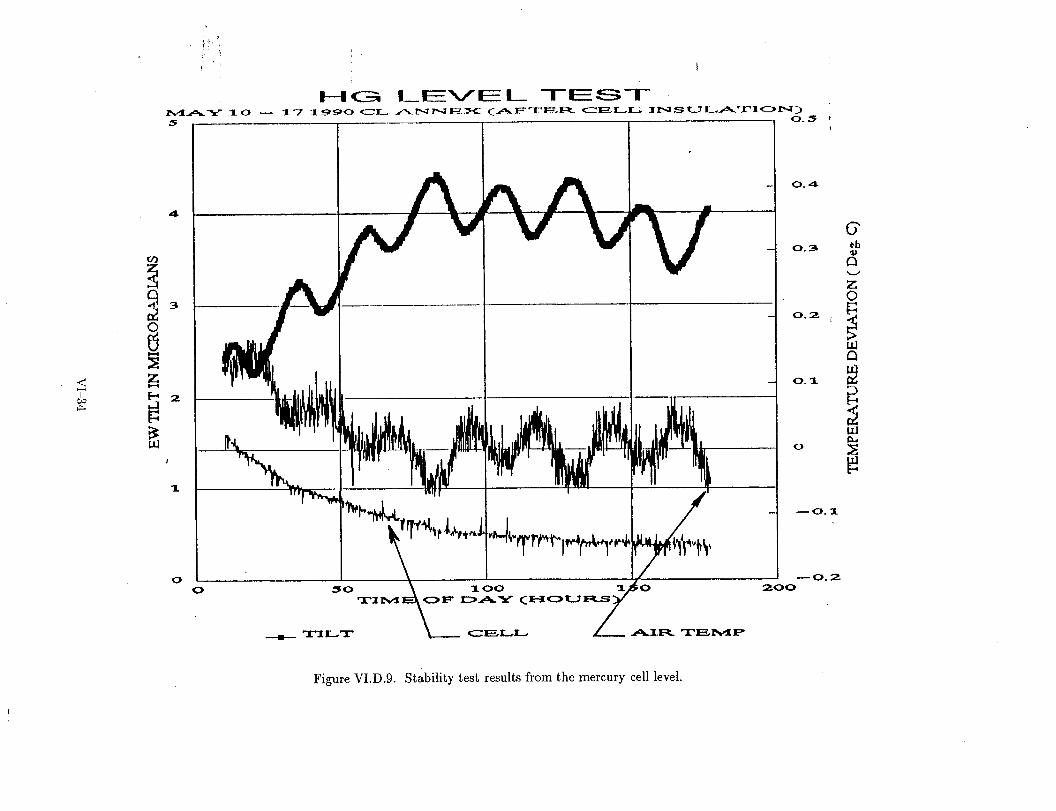
(3 t -E I c t ?
i I
- ! 1 I
b =
-
d- d I
VI-34

-..
12180 - v) -is g 12140
5 .- -g 12100 .- cl
?! 12060
12020
I 22.8
s 0 -
I
22.6 a 5
10-90
242 244 246 248 250 252 254 Time (Julian days) 6711AlO
Figure VI.D.lO. Sector 10 tilt stability results.
VI-35

- c C -
r
VI-36
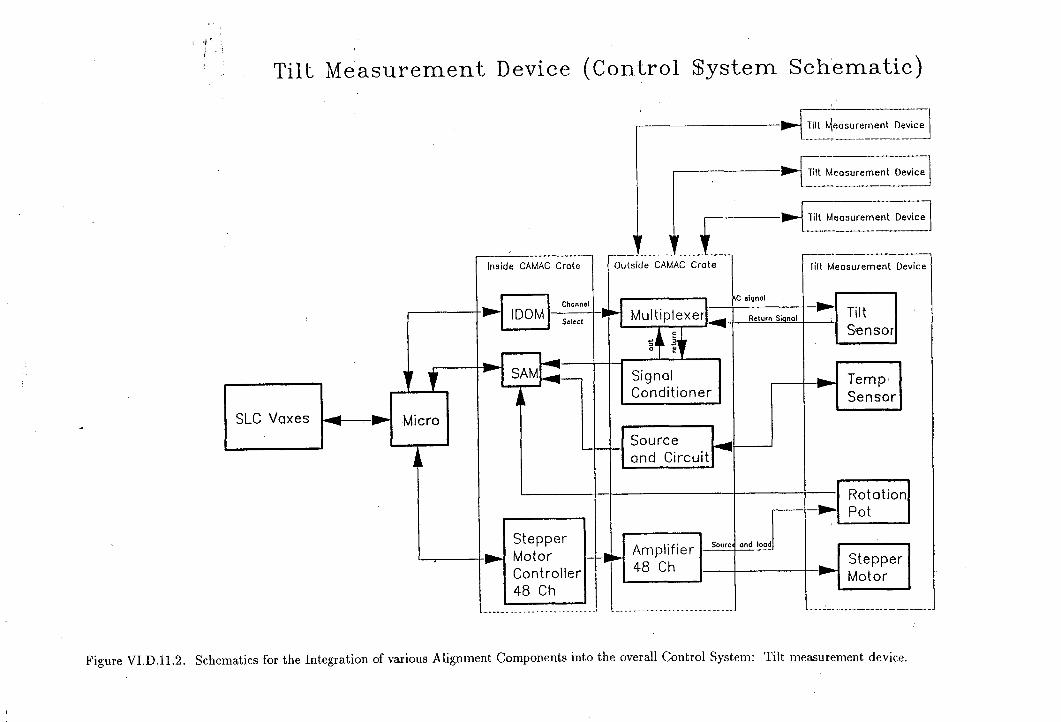
4,’
!
Tilt Measurement Device (Control System Schematic)
SLC Vaxes rt---) M icro
- ’ __--
Inside CAMAC Crate
SAM
Tl
Tilt Measurement Device
Outside CAMAC Crate
Amplifier 48 Ch
Sour I= -r ond load
iilt Measurement Oevice
Figure VI.D.11.2. Schematics for the Integration of various Alignment Components into the overall Control System: Tilt measurement device.

Figure VI.D.11.2 goes here
,___,
_. c *-.- _.
VI-37
- .
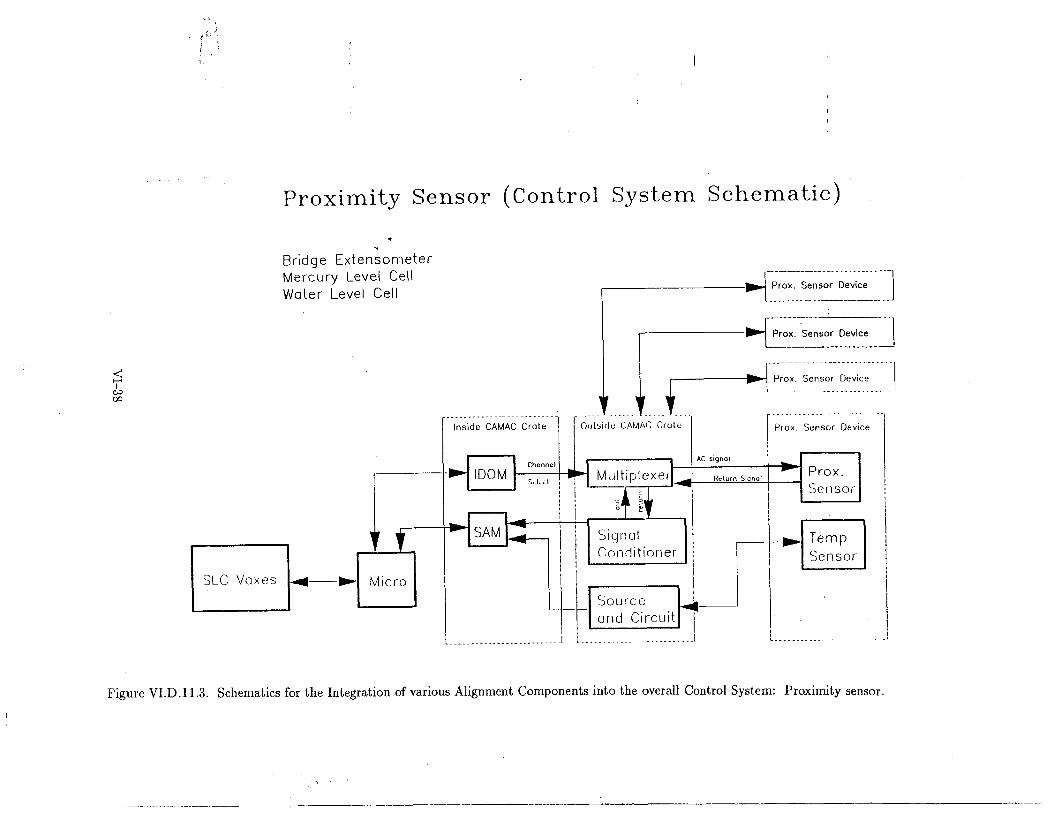
I
Proximity Sensor (Control System Schematic)
. .a Bridge Extensometer Mercury Level Cell Water Level Cell
Prox. Sensor Device ________---___
L.......... . . . . . . . .
._________......._-.--.-- Inside CAMAC Crate +0x. Sensor Device
! I i’
iC signal
I
1 1 Micro
1 Signal Conditioner !r r-b SLC Vaxes -t
i. __._._.._._.......
Figure VI.D.11.3. Schematics for the Integration of various Alignment Components into the overall Control System: Proximity sensor.
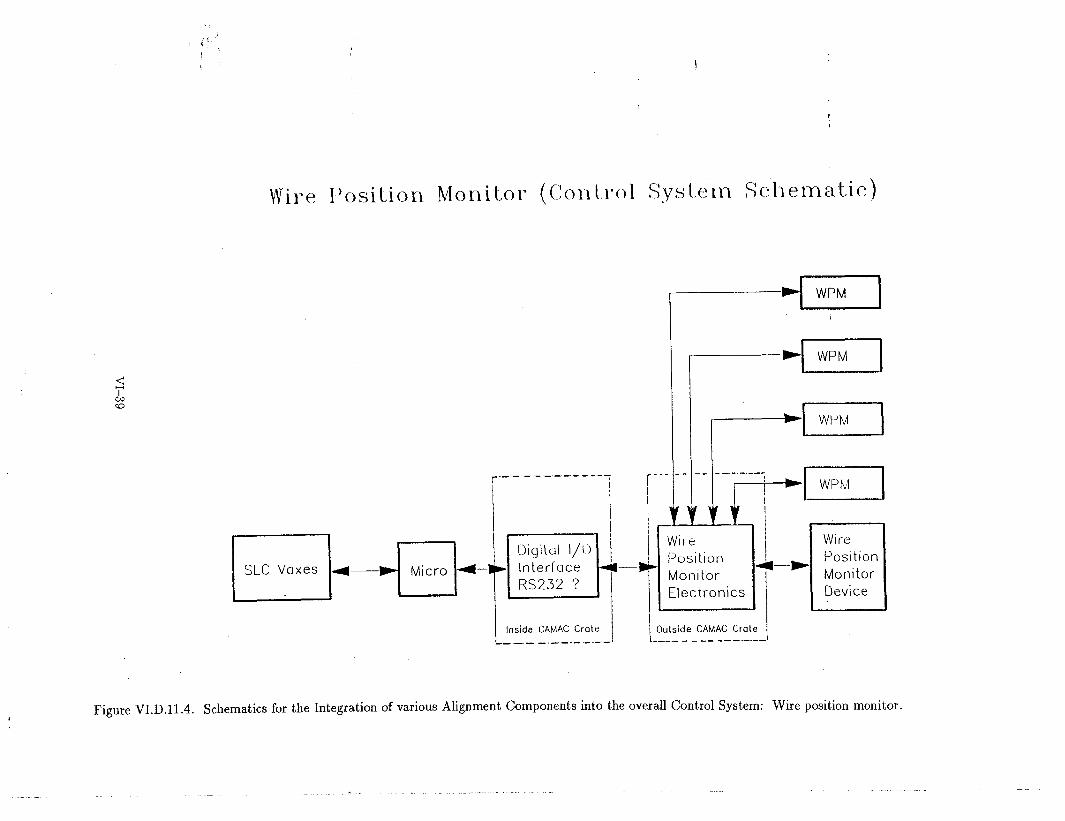
i-
r !
1 Inside CAMAC Crate _______ _._.-. -- l \
_.- I-_ I--.-.-.--i tpE--W-‘hi
Outside CAMAC Crate ____ -._.--.--------
Wi ie Position Monitor Device
Figure VI.D.ll.4. Schematics for the Integration of various Alignment Components into the overall Control System: Wire position monitor.
..__ .-.
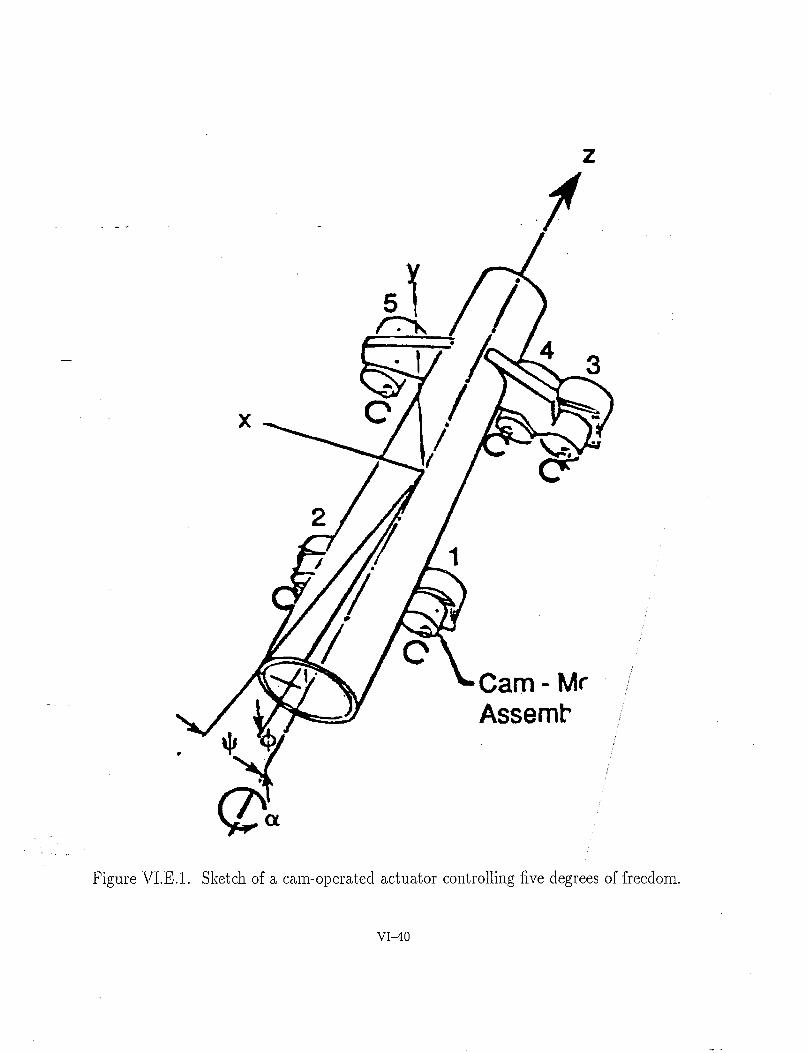
Z
-,P
AssemP :
Figure VI.E.l. Sketch of a cam-operated actuator controlling five degrees of freedom.
VI-40

..a c W.” .-.--
i
ycc Ic-‘C T LI-.-
Figure VI.E.2. Assembly drawing of a cam-actuated magnet mover with three degrees of freedom.

Pier to ESA (horizontal)
3 s .-
& 2
5
0.3
0.2
0.1
0
-0.1
Research Yard Mar 24-26,199O (Data 2 PRN) I
0 5 IO 15 20 25 30 a-90 TIME OF DAY (overlaid) 6711A15
Figure VI.F.l. Change in the 33 meter distance between ESA and Pier A as a function of time of day.
VI-42

--
-
r i
VI-4 3
-

DATA ESI33. MAY’ 24 --2s 3.990 , 0.15
0.1
0.05
0
-oo.os
-O--l
-oo.13 5 3.0 1s 20 25 30
TIME OF DAY (HOURS)
Figure VI.F.3. Variation in the distance from End Station B to Pier A
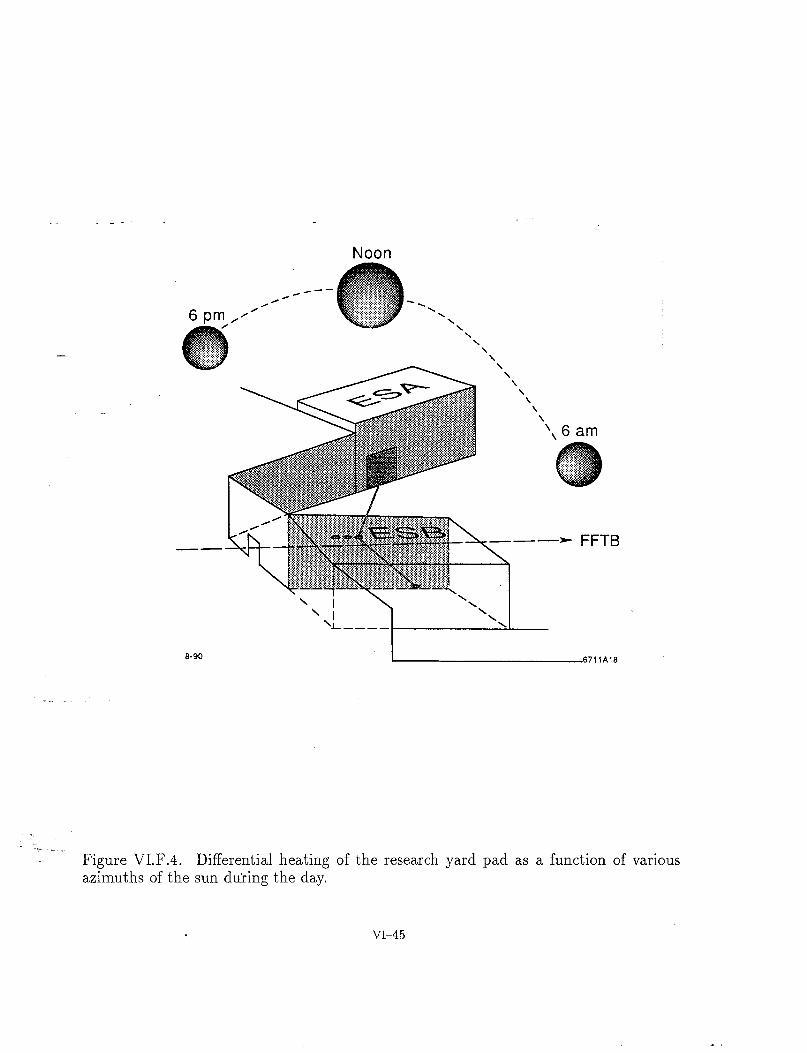

-
2: .- tz >”
- 18 x IO+
- - - - 12.25 Hz - I
29.875 Hz -
-
-
- -
50 db
Pier A
0 db
Pier B Near Linac
0 40 50 Hz 6711AlS
Figure VI.F.5. Spectrum of vertical ground motion velocity on Pier A and B of the research yard taken on May 9th 1990 9:30 am.
VI-46
-

--
0.826pN
/225 mV
May 9th 17:4l
8 set * .L
f
-285 mV
E-W Amplitude Real Time
r 0.5 v
I
--0.5 v 8-90
6711A20
Figure VI.F.6. Real time trace of E-W Horizontal amplitude.
VI47

-
Central Pier Horizdntal EW Mark II Integrator I I unction
0.826 /UVoIt - - Probability Density FI
48 x 8 set Samples (
J -141 mV L
May 9th 13:53
1 120 mV
-. 8-90 6711A21
I -
’ -.* . . -~
Figure VI.F.7. Probability Density Function of Horizontal Motion (Windy).
VI-48

--
- LL cl CL
Pier A Vertical Integrated = Amplitude May 9th 1990 1350 Probability Density Function 48 Samples a<8 Seconds Each DC Coupled
P(0) = 6.8 v-’ 1
=@zP(*) = 58mV x 46 nanometers
-56 mV/--I-\- 43 mV -O.O3+&ms)
-i
-0 2 . 0 02 . 8-90 Volts 6711A22
Figure VI.F.8. Probability density function of Vertical amplitude on Pier A.
VI-49

--
Geometry for Measurement of Ground Velocity
-
,Sensor B Concrete
1 h \‘; \ \I ’ V,zs”360 m/s
I 1
B-90 :5 m 6711A23
b16.5’ -
Figure VI.F.9. Geometry of the piers used to make ground velocity measurement.
VI-50

0.02047 set
0.00617 set 125 mV
4 L I I I I
Pier B
Pier A
0
8-90
0.02 0.04 0.06 0.08 t (seconds) 6711 A24
Figure VI.F.lO. Display of time of arrival of sound on Piers A and C.
VI-5 1

_-
VII. Vacuum Systern

VII. Vacuum Systeln
V1I.A Specifications
Since the FFTB is not intended to produce beams for particle physics use, the
vacuum requirements are not very severe. It is necessary to maintain sufficiently low _ - vacuum to allow the clean transport of the beam and to avoid interference with the diag-
nostic instrumentation used to.measure the properties of the beam itself. The principle
specifications are:
- pressure of 10m6 Torr or less.
- - all metal, unbaked, 25 mm 304 stainless steel beam line using knife-edge type
flanges.
- ion pumps and hot filament gauge tubes used throughout.
- all controls in one location.
VI1.B Design
The beam line is planned to be divided into five regions. Each region will be 30
to 60 meters in length; small enough that vacuum leaks can be quickly isolated and
repaired, and also minimizing the impact of vents and pump downs. Regions will be
isolated by pneumatic gate valves which will be remotely operated but will have local
over rides. These valves will be interlocked to the vacuum gauge controllers and also
fast sensors or McClure switches. Sensors will be located downstream from each valve.
In the first, or switchyard region of beam line, a 1400 ii/s diffusion pump will be used
to pump both the FFTB beam line and the End Station A beam line. Actual pumping
speeds will be conductance limited by the 50 mm aperture size of the switchyard beam
line and thus smaller by a factor of 15 from the speed at the pump. Pressure requirements
I. - in this area are only 10V4 Torr so this speed will be adequate. :
All subsequent regions will be pumped with 20 ii/s sputter ion pumps distributed
discreetly along the 25 mm beam line. As in the switchyard, the pumping speed of this
VII-2

line will also be limited by conductance and beam line pressure will make a transition
from switchyard vacuum to the design value of 10m6 Torr in the second region. Lower
pressure in the interaction region will be achieved by reducing the distance between
pumps.
-All instrumentation and all controls will be located in a single rack at one location.
Each region will have a junction box for gauge tubes and a second junction box for
pumps. This allows the option of adding more of either at a later date should vacuum
requirements change.
-
VII-3

Beam Direction
All vacuum controls 406
. L- ------ -----, r ____-----
i ---_-----------_---- -------------------------- 1 T- ------.------ B-se-7
r------+---- 1------------‘r-- I
I I ---+‘-----T-----
I 2 i L
1 3 i I .
I
I I j 4 5 t
J J I
I I I J I I
1 I
IV3 pq -J --1 I --I
----e--w 1
---_---_
F4’ Ips31 + EJGI L ‘. ‘Eda a
I L-- & $J L-,----L-,-
L,---------,------,,------~- ---T-----J
--------------------------------~-------------------------~ .
I I t I ; Dump I
Region 1 BSY Region 2 Transition Region 3 Region 4 IP Region 5 Dump
Figure VII.B.l. Schematic representation of the vacuum system.
El+ 0 kFwF
pump :
valve

-- .-
-
VIII. Power Supplies

VIII. Power Supplies
VII1.A Specifications and Designs
The total DC power requirements for the FFTB magnets, less than 500 kW, is not
large, but the need to control the strength of individual magnetic elements along the -- beam line dictates that there be a relatively large number of power supplies. A total of
32 large supplies and 64 bipolar corrector supplies will be required to provide sufficient
control to operate and tune the lattice optics.
The power supplies are grouped into four categories:
- 1. High power (greater than 1.0 kW) , conventional SCR controlled, with stability of
0.01% of full scale (lOE-4).
2. High power (greater than 10 kW), high performance switcher supplies, with sta-
bility of 0.001% of full scale (lOE-5).
3. Medium power (10 kW) switcher supplies, with stability of 0.001% of full scale
(lOE-5).
4. Bipolar corrector power supplies (200 Watt), with stability of 0.005% of full scale
(5*10E-5).
We will discuss each of these in turn.
High Power Conventional SCR Supplies
These supplies will be used with five magnet groups, all downstream of the Focal
Point where the accuracy requirements are not too stringent. These magnet groups are
listed in Table VIII.l.
Each power supply will deliver 40 kW at either 500 or 800 amperes. Input power
is 480 Volts AC. Output is controlled by means of SCRs, and the DC output is filtered.
Units are air cooled, and are built in self-contained floor-mounted enclosures.
^ .L. .._ _ The installation of these supplies will be similar to that of existing supplies on the
SLC. SLAC designed magnetic amplifier type transductors will be used to measure the
DC current, and regulator/controller chassis for each supply will be mounted in racks.
VIII-2

Long-term stability in the current of 0.01% of full scale should be adequate for these
magnets. Power line fluctuations will cause occasional short-term transient excursions
as large as O.2%, but will not affect long-term stability. All five power supplies will be
located in Bldg. 406.
High_ Power Switchers
There are five magnet groups (Table VIII.2), all upstream from the Focal Point,
that have very stringent requirements, for which conventional SCR controlled supplies
would be inadequate. In these instances the plan is to use commercially available high-
frequency and high-power switchers to regulate magnet currents. -
Each supply will deliver 50 kW at 125 volts and 400 amperes DC. Each switcher
will require a separate source of DC power, which will be a 60 kW/150V/400A DC
SCR controlled power supply, of a type similar to that described in the previous section.
The switcher assemblies will be purchased to performance specifications from outside
vendors, and will be installed in racks. Magnet current will be measured by means of
two zero-flux DC transformers (DCCT). Tl lere will be a regulator/controller chassis for
each circuit. All five power supply systems will be located in MCC.
Details that explain the choice of these high power switchers are covered in a later
section. The goal will be to obtain both long-term and short-term stability in the output
current of 0.001% (lOE-5).
Trim windings on each of the four poles of magnets that are ganged with other
magnets will be brought out separately. These can be connected in various configurations
to corrector supplies to permit trimming of individual magnets.
Medium Power Switcher Supplies
There are a total of 18 magnet groups, mostly quadrupoles, where this type of power
supply will be used. Table VIII.3 lists these magnet groups along with the location of
the corresponding power supply.
Although the required currents differ considerably between magnets, one common
power supply size was chosen to provide savings in operation and maintenance. For
the same reason QC3, rather than having a single large power supply unlike any other
VIII-3

will be operated from two switcher supplies connected in parallel. QP4 and B4A/B will
also use this type power supply, even though they are downstream of the Focal Point
and thus have less stringent stability requirements.
Details that explain the choice of switchers are covered in a later section. The goal
will be to obtain both long-term and short-term stability in the output current of 0.001%
(lOE-5).
Bipolar Corrector Power Supplies
This group includes all the power supplies that are required to feed steering magnets,
- quadrupole trim and/or steering windings, and small magnets that are part of the beam
launch group. Steering and corrector magnets generally must be controlled around and
through the zero point, hence they require bipolar power supplies.
There will be a total of 64 corrector supplies, 48 in MCC and 16 in Building 406.
Each corrector supply will be rated 200 Watts, &20 volts DC, HO amperes DC.
A design developed by CEBAF and also used on the SSRL 3-Gev Synchrotron
will be followed for the corrector power supply system. In this approach the individual
correctors are designed as plug-in modules, with eight modules to a crate. Three such
crates will be mounted in a single rack, together with distribution panels, individual
circuit isolating fuses, and two 24VDC/250ADC/6kW p ower supplies that provide plus
and minus power to all the correctors in a rack. There will be two such racks in MCC,
and one in Bldg. 406, with the latter having expansion capabilities for adding eight more
corrector channels at a later date, if needed. The bipolar supplies are linear regulators,
hence dissipate considerable power. With as much as 60 Watts per unit, the worst case
dissipation in a rack could reach 1.5 kW. Since the modules are air cooled, as are the
DC bulk power supplies, it will be necessary to force ventilate each rack.
Current measurement and current regulation is done by means of current measuring
resistors installed in each crate. With this method, and in an air conditioned environ- -c ._ __ ment, it should be possible to achieve stable operating conditions to within 0.05% of
maximum current rating (5 milliamperes).
VIII4

Control and readout of the correctors will be by means of DA and SAM (sample and
hold) modules in a CAMAC crate. An alternative being considered is the addition of
power supply controller modules as part of each corrector plugin unit. These controller
modules perform the necessary DA and AD functions, and link to the CAMAC crate
via a serial link. This latter technique was developed for CEBAF by an outside vendor, -- and eliminates sending analog signals over long distances, as well as simplifying cable
interconnections.
VII1.B Comments About Switcher Supplies
Measurement and control of current to an absolute accuracy better than 0.01% is -
extremely hard to achieve and to prove. On the other hand, obtaining currents that are
stable, and being able to return to a desired setpoint with a precision of O.OOl%, is a
realistic goal, though difficult and expensive. It should be achievable with the type of
equipment that will be used for the power supplies that feed magnets upstream of the
Focal Point.
The first requirement is the ability to measure the current with the desired precision
and reproducibility. Zero-flux DC Current Transformers (DCCT), though three times
more expensive than the traditional magnetic amplifier transductors used at SLAC thus
far, will be used for the FFTB. A number of DCCTs are now being evaluated at SLAC,
and have been used extensively at CERN and DESY in the recent past. DCCTs have
the advantage over shunts in that they provide a galvanically isolated large signal (up
to 10 volts) without dissipating a large amount of power. Zero-flux DCCTs have the
further advantage over the magnetic amplifier type in that they are linear and relatively
insensitive to line voltage fluctuations.
Two DCCTs will be installed in all switcher power supplies where stability and
precision of 0.001% is required. This redundant current monitoring, though expensive,
will provide a means for checking DCCT performance, and for monitoring ground leakage ,1 currents, since the two DCCTs will be placed one on the positive, the other on the *.- ._
negative feeder lines to a magnet. Any discrepancy will be indication of either DCCT
malfunction or of ground current.
VIII-5

The second requirement is for a fast power controlling device. Phase controlled
SCRs that rectify 60 Hz AC power are the traditional workhorse for large power supplies
because of their reliability and efficiency. Unfortunately it is practically impossible to
build SCR supplies that will not undergo a temporary excursion in the output when
there is a transient change in the line voltage. Although long-term stability of 0.001% -- is achievable for SCR supplies, short-term excursions that exceed this value are bound
to occur in all practical installations, except for magnets with extremely long L/R time
constants. The FFTB quadrupole magnets are relatively small and operate at room
temperature, hence will probably have time constants of less than 0.5 seconds. This is
too short to meet the stringent requirements using SCR controlled supplies. For this - reason switcher supplies will be used.
~. Switcher technology has come into its own the last five years, and power supplies
rated 10 kW are now commercially available. Switcher supplies rely on rather high
frequency operation (up to 80 KHz) of power switches in which the average output is
controlled by means of pulse width modulation (PWM). The output of the supplies is
filtered to prevent rfinterference. The advantage of switchers is speed of response, thus
permitting the design of a regulator in which the effect of transients can be minimized.
Switcher supplies, just as SCR supplies, but unlike power supplies that use series tran-
sistor banks for controlling the current, are efficient devices. Hence it will be possible to
air cool, rather than having to water cool, the supplies.
Switcher power supplies will be purchased to performance specifications from out-
side vendors. The internal circuits of these power supplies will not be used for current -_
regulation. Instead, the supplies will be used as high speed power amplifiers that will
respond to an amplified error signal that will be generated in a separate SLAC designed
regulator/controller chassis, in which the signal from a DCCT will be compared with a
reference signal generated by a 16-bit DA converter. For this reference a digital rather
than analog link to the remote input from a CAMAC crate should avoid thermal emf’s . . .s- .” _ and noise pickup. The regulator/controller chassis will also contain the necessary magnet
interlock supervisory circuits, on-off control, computer link, and will generate warning
and PPS signals.
VIII-G

VIII. c Support Facilities
The power supplies will be installed in two locations. (See also Section XI of this
report.) Building 5, the Accelerator Main Control Center (MCC), will house all the
supplies that feed power to the magnets inside the Beam Switchyard. Room for this
equipment and 480 volts AC and-208 volts AC power will be made available with the
removal of the SPEAR transport power supplies and other equipment that is no longer
in use. The East end of the building, where this equipment will be located, will have to
be air conditioned to within 5’ in order to help meet stringent stability requirements,
and to remove the heat generated by the air cooled power supplies. Building 406 in the
_ Research Yard will be moved to a new location next to the beam line, and will house all
power supplies that feed magnets outside the Beam Switchyard. This building also will
have to be air conditioned to within 5”.
Power supplies for the magnets of the final lens doublet (QC2, QXl, and &Cl) will
be designed and fabricated at ICEK. The power supply for QC2 is rated 150 kW, and will
be the largest power supply in the entire FFTB complex. These three are the only power
supplies that will require water cooling. These supplies will be installed in Bldg. 406.
Typical magnet currents are on the order of a few hundred amperes for the large
magnets, and less than 10 amperes for trim and steering windings. Insulated air cooled
cables installed in trays will be used to connect power supply DC output to the magnets.
Magnet protection, interlock and warning circuits will be similar to the type now
in use in the switchyard. In this scheme all exposed magnet terminals are covered, and
individual magnets are provided with a safety box that is provided with a “Run-Safe”
switch that can turn off the power supply, and a red flashing light that warns anyone
in the vicinity when that magnet is energized. The flashing lights will be turned off
whenever the switchyard or tunnel are locked and in the “No Access” mode, to prevent
interference from the flashers. The magnet safety boxes will also serve as the junction
points to which magnet temperature and water flow switches are connected for hookup . -
J i. ._ _, to the power supply interlock systems.
VIII-7

- Table VIII. 1 Magnet Groups With Large Conveiltional Supplies
QPlA and QPlB
QP2A and QP2B
QP3A and QP3B
- QP5 B05A and B05B
Table VIII.2 Magnet Groups With Large Switcher Supplies
Bl and B2 string of 12 magnets
QNl and QN2 Group 1 string of 4 magnets
QN3 Group string of 4 magnets
QNl and QN2 Group 2
QM3 Group
string of 4 magnets
string of 3 magnets
“.. -
.U -- _.
VIII-8

Table VIII.3 Magnet Groups With Medium Size Switcher Supplies
MCC Building 406
-
Q5
Q6 &A0 &Al QA2 QT1 QT2A
QT2B
QT3
QT4 QC5
QC4
QP4 B3A and B3B.
B4A and B4B
SFlA and SFlB
SDlA and SDlB
QC3 (2 supplies)
VIII-9

IX . Control System
Ix. Control System
Operation of the FFTB beam line and detectors will be done from the SLC Main
Control Center (MCC) h w ere it will be possible to monitor and control the upstream
portions of the machine as well as the FFTB itself. Touch-panel consoles located in
MCC provide the human interface to the machine hardware. For commissioning and
maintenance purposes, additional control terminals will be built into the electronics racks
in the FFTB support buildings. These local terminals provide control of the hardware,
but lack the graphics capabilities of the MCC consoles. -
Control of the FFTB hardware, and acquisition of data from the sensors and in-
strumentation in the beam line, will be done by a CAMAC-based system that is an
extension of the existing SLC control structure. The FFTB hardware is designed to be
compatible with the SLC database and protocols, and will require little new software
to operate. The full compliment of on-line analysis and modelling programs that have
been developed for the SLC will be available for use by physicists and operators working
with the FFTB.
IX.A Data Acquisition
The FFTB will be controlled by the VAX 8800 that operates the SLC. The VAX
mainframe is linked to a network of distributed microprocessors through a frequency-
modulated broadband communications cable. Each node of the network consists of
_ a multibus crate that contains a single Intel 8036 microprocessor with local memory.
CAMAC is driven by a Multibus CAMAC Driver (MBCD) that provides direct-memory
access through a high-speed serial link. Up to fifteen CAMAC crates can be driven from
one MBCD. The CAMAC system conforms to IEEE 583-1982 specifications, and all
of the modules used in the FFTB are either commercially available, or have previously ,_ -
: .: been developed and used at SLAC. Two microprocessors will be used for the FFTB. The -t- - _
CAMAC structure for the FFTB is shown in Figures IX.1 and 2, and detailed rack and
crate profiles are available.
IX-2

1X.B Software
The software facilities and applications programs that have been written for the
SLC will all be available for use with the FFTB. The VAX programming language ’
is FORTRAN. We do not anticipate that any new software will be required for the
microprocessors during the initial commissioning of the beam line, but new code may
be developed during later use of the facility. In particular, new fast feedback algorithms
may be desired to control the beam or lattice parameters.
Data structures for the FFTB will be incorporated into those already created for
the SLC. There are three interrelated structures of imp0rtanc.e. The database contains - static information necessary for the operation of the beam line components; e.g., device
characteristics, CAMAC addresses, functions, etc. Configuration files are used to store
particular states of machine parameters. These files save directly controllable param-
eters, such as power supply settings, mover positions, etc. The T-matrix contains all
timing information for the machine. Additions to these structures to accommodate the
FFTB will be made by members of the SLC Software group.
1x.c Machine Protection
A control system exists to protect machine components from damage due to errant
steering of the beam or hardware failures. Temperature sensors and water flow switches
are used to insure that magnets and collimators are sufficiently cooled, and current
monitors are used to insure that power is supplied to each magnet. Ionization chambers,
capable of detecting average radiation levels as well as pulse-to-pulse beam losses, will
be installed along the beam line. Signals from these monitors are processed by electronic
discriminators to generate logic signals when radiation levels or beam losses become too
high. When the average rate of beam loss is found to be sufficient to threaten machine
components the beam repetition rate is automatically reduced. Single-pulse losses that
;- . . _ are extreme will result in a trip of the electron gun that must be reset by an operator. The
Personnel Protection System, that is described in Section X of this report, uses special
monitors to guard against excessive radiation in areas that are accessible to personnel.
IX-3

1X.D Special Purpose Control Hardware
Much of the control hardware for the FFTB, and essentially all of the electronics,
will be replicated from existing SLC devices or designs. There are several cases, however,
in which new designs are being created.
Mugaet Mover Control
A description of the hardware to be used to provide movement of the FFTB magnets
is given in Section V1.E of this report. The system has been developed from a similar
one used in the SLC to control the alignment of the final triplet of magnets on each side
of the interaction point. The design uses three stepping motors per magnet to generate
- translations in the transverse plane, and roll about the longitudinal axis of each magnet.
The transverse movement covers a full range of zt2 mm in step sizes of 0.4 pm. There
is an option to run the system in “half-step” mode to provide 0.25 pm per step. A
thousand of these motors are in use in the SLC ARC s w h ere they have performed well.
Read-out of the position of the magnets is done in two ways, by cermet rotary
potentiometers mounted directly on the stepping-motor drive shafts to verify the number
of steps taken, and precision LVDTs to read directly the position of the magnet with
respect to its fixed mount. The read-out electronics, which is dispersed among three
support buildings to keep the LVDT cables under 250 ft in length, is identical to that
used to control movements of collimators and magnets in the Linac, ARCS, and Final
Focus of the SLC.
Alignment Control
Control of the alignment system has been described in Section V1.D of this report.
IX-4

------------------------ I
MICRO I I CBOO I
J30 I J29 dr-’
1 I
I
I I I
i - - I
I ----------------------,
I I
I I I C cc I I BPM I I V I I I
o-- ’ I
I I
I
I
I
-- r- I I I I I I I I I I I I I I
I I I I I
I
I
I I
I I
C C FUTURE FUTURE cc cc V V
w- w- 12 12 0 0
BW BW
C BPM cc V
o-- 05 o--
C MM cc V
o-- 06 o-
I :,,,,~,~~,,~~~~~~~~~__;
I MICRO CBOO is located in MCC P.S. Room. I Beam line components controlled from this 1 are down stream from DlO (natural Micro ; for FFTBIBSY) and controls ail components I which is the geographical end of BSY.
----------------- I I
c FUTURE cc I V I
,I.
I
07 0 I 1 I I
-,,,,---------------,,,,,,-,,------,,,,,-I
BOO5 I
C Utilities cc
~
V Crate
01
c P.S. cc V
~
02
c P.S. cc V
~ 03
C cc V
BPM
a
09
C C BPM BPM cc cc V V
o-- o-- 10 10 CL- CL-
C MM C MM cc cc V V
o-- o-- 11 11 o-- o--
MICRO boundry up to QC5,
Figure 1X.1. Schematic representation of Microprocessor CBOO.
IX-5

-
-- p-q, ~
C Utilities CC V Crate
a
01
J
C BPM cc I MICRO CBOl is located in B406 in the Research Yard.
V Beam line components controlled from this MICRO are down stream from QC5, which Is the geographical end of BSY.
05 0 B02 string crossing the boundry is however controlled from MICRO CBOO.
Figure 1X.2. Schematic representation of Microprocessor CBOl.
IX-6

- -x. Radiation Shielding and
Personnel Protection

X. Radiation Shielding and Personnel Protection
The FFTB will be housed in a shielded enclosure located inside the SLAC radiation
security fence where it will be accessible only to authorized personnel. A plan view of
the FFTB beam line is given in Figure X.1. Approximately 150 meters of the FFTB
enclosure will be located within the confines of the Beam Switch Yard (BSY). Concrete
shielding blocks will cover the beam line in this area, as shown in Figure X.2, and a thick
iron shield will be installed in .the C-Line channel at the front of the FFTB (between
Stations 105 and 106 in Figure X.1). This will be sufhciently thick to isolate the beam
line from the remainder of the accelerator environment. Another 100 meters of the FFTB
- will be housed in a structure of blocks that will be erected on the concrete surface of
the Research Yard.
The FFTB will use a low power beam that we anticipate operating 2 to 3 months
a year. The SLC and PEP injection lines that share the BSY will run during most of
the rest of the year. The shielding for the FFTB is designed to allow access to the beam
line while other beams are passing through the BSY. The Personnel Protection System
(PPS-Section X.B below) will enforce three levels of access to the FFTB beam line:
No Access Beam can be brought into the FFTB beam line.
Restricted Access Beam can be in the BSY, but not the FFTB.
Unrestricted Access No beams can reach the BSY.
The End Station A beam may run for short periods in the future. It may not be possible
to maintain access to the FFTB during these times
Sources of radiation have been identified by personnel familiar with the operation of
the SLAC linac and facilities that receive beams that pass through the BSY. Calculations
of the expected radiation levels in the FFTB beam line, and design and modeling of the
shielding for the FFTB, have been done by members of the SLAC Radiation Physics ,. ’ ..- ,_ _ group. These designs have been reviewed by the Safety Committee at SLAC, and the
Health Physics group will monitor the levels of radiation that appear in the beam line
area during periods of actual operation.
x-2

Restricted Access
The most energetic beams at SLAC are produced for the SLC. The FFTB shielding
is designed to allow limited access to the beam line during periods of extended SLC
operation. The following assumptions and parameters have been used in the design
process:
1. Maximum SLC power = 150 kW (two beams).
2. Beam loss of 30 kW (20%) at eight collimators located between Sectors 28
and 30 in the linac.
- 3. Beam loss of 7.5 kW on each of the BSY slits 51SLl/SL2 and 52SLl/SL2
(i.e., 10% total).
4. Occasional loss of 10 kW on the D2 dump in the C-Line.
5. Full beam loss on the BSY dumps (51/52 Dl) for an indeterminate period of
time.
6. Use factor of 0.7 during periods of scheduled SLC operation.
7. Occupancy of workers limited to lower level of C-line from station 105+78 to
the Research Yard.
8. Maximum occupancy time of 2000 hr/year for workers during scheduled SLC
running.
With these assumptions, the shielding is designed to limit the radiation dose in the
FFTB beam line as follows:
1. The dose equivalent at the surface of the shield, integrated over the working
year (2000 hr), must be <l rem.
2. In a worst case (accident), the dose equivalent rate must be less than
. . .~ 25 rem/year. ; ,. .L. ._ _
With the use factor of 0.7, this results in a dose equivalent rate below 1 mrem/hr at the
surface of the shielding in the BSY.
s-3

No Access
The Beam Containment System (BCS-Section X.C below) will limit the FFTB
beam to a maximum of 1 kW average power. This corresponds to 1 x 1Oro 50 GeV
electrons per pulse at 10 pulses per second. No access to the beam line can be made
while this beam can reach the FFTB. An active bend magnet. and three independent
beam stoppers must be inserted into the beam line up beam of the FFTB area before
this restriction can be removed.
The following parameters and beam losses have been assumed for the operation of
the FFTB,
- 1. Maximum FFTB Power = 1 kW.
2. Ten Watts (ly ) o continuous loss at BOlA bending magnet.
3. One Watt (0.1%) continuous loss along the beam line.
4. Operation of the FFTB for 600 hours/year.
5. One-hundred percent occupancy of the Research Yard during FFTB operation.
The shielding in the Research Yard is designed to reduce the radiation levels to less than
1 mrem/hr at the outside surface of the shielding blocks.
X.A Radiation Shielding Design
Distributions of muons, gamma rays, and neutrons that are produced in electro-
magnetic showers generated by 50 GeV electrons (or positrons) have been calculated
using standard techniques. 2 Combinations of ray-tracing and ducting models have then
been used to estimate the radiation that reaches a.reas that are accessible to personnel.
The shielding is then specified to reduce the dose rates to the levels given above.
BS Y Shielding
Nineteen meters of iron is required to shield the FFTB channel from muons created
in collimators at the end of the linac. Sixteen meters will be installed as a single wall
r- “_ _” covering the entire lower level of the channel (i.e., 12 ft wide and 9.5 ft high) up beam of
Station 105+78. The accelerator waveguide structure and iron of the magnets up beam
of the FFTB account for the remainder of the muon shielding.
x-4

Concrete blocks will be used to shield against gamma rays and neutrons. These
blocks will cover the beam line components from the beginning of the BSY to the ESC
wall at a height of 8 ft to 9.5 ft. The th ictness of the roof blocks in the BSY varies 1
between 1 to 2 ft.
1: Source-shield roof blocks (ui beam of p-shield):
One-foot thick concrete slabs will be placed along the BSY channel ledge,
starting as close to Station 102+20 as possible and running the entire length
to the start of the muon shield. This is to attenuate radiation from SLl/SL2,
DlO, and D2, as well as any additional sources that have yet to be identified. -
2. FFTB channel roof blocks (down beam of p-shield):
Two-foot thick concrete slabs should be placed along the BSY channel ledge,
starting near Station 105 + 78 and running the entire length to where the BSY
narrows (Station 107+75). One-foot tl lit v concrete roof blocks will cover the 1,
remaining FFTB channel from Station 107+75 to the BSY egress. No gaps
are allowed in the FFTB channel roof shield, which also acts as a personnel
barrier for the BSY.
3. BSY (upper) egress shield:
A nine-ft thick wall will be stacked at the end of the BSY and above the exit of
the FFTB channel to prevent radiation from escaping into the Research Yard.
Research Yard Shielding
The shielding in the Research Yard will be constructed from shielding blocks that
will be removed from the SLC Collider Hall once the SLD replaces the Mark II. The sides
c _ 1 of the FFTB shielding will be 4 ft-1 inch thick and the roof will be 3 ft-3 inches thick.
-s- .._ _ This structure ends in a beam plug composed of iron and concrete that will surround
the FFTB beam dump.
x-5

Unrestricted Access
Unrestricted access to the FFTB will be allowed during periods of time when no
beams can be transported to the BSY area. A special case of unrestricted access to the
beam line will be established during the construction of the FFTB by initially plugging
the holes in the front steel shield.-that would normally be open for the betqm pipe and
laser alignment pipe. This will allow the construction of nearly all of the FFTB during
periods when the SLC and PEP are running.
X.B Personnel Protection System (PPS)
The PPS system will be installed in two phases. It will first be necessary to install - sufficient controls to assure that the FFTB area is safe during the construction of the
new beam line. The second phase consists of the construction and installation of security
gatks and monitors to allow the beam line to be used by experimenters.
During the first phase extraneous equipment will be removed from the old C-Beam
and End Station C PPS gate. These will be stored for later use. New components will be
installed to insure the radiation safety of the FFTB area. The D2 dump, two stoppers
ST60 and ST61, and a disaster monitor will be installed up beam of the muon shield,
and two BSOICs will be installed down beam of the muon shield in the FFTB area
itself. This will be sufficient to prevent beam from striking the muon shield, and will
shutoff the beam if the radiation levels in the FFTB channel should exceed the limits
prescribed above.
For the second phase, a PPS system compatible with existing equipment and safety
standards will be installed, tested and certified. The system will protect the entire length
of the FFTB. One entry module will be installed midway along the extension of the beam
line onto the Research Yard. Emergency-Off buttons, Search-Reset buttons, audible and
visible warning systems, electrical hazard protection, and interlocks on movable shielding
blocks will be installed. A disaster monitor will be placed behind the FFTB dump, and _
‘L ._ _ two additional BSOICs will be mounted in strategic locations to monitor radiation levels
outside of the FFTB shielding. The local electronics for the PPS system will reside in
the 406 support building away from high radiation and adverse temperature conditions.
X-G

This complete system will be integrated into the SLAC-wide PPS system, and will be
controlled from the SLAC Main Control Center.
x.c Beam Containment System (BCS)
The BCS system for the FFTB must protect the dump D2 when beams are stopped
up-- b-earn of -th e muon shield, and must assure that beams in the FFTB are properly
transported to, and stopped by, the FFTB dump or ST62 stopper.
The beam power on the D2 dump will be limited to 15 kW by two toriods, I3
and 14, and ion chambers IC104A and IC104B. The toroid signals will be processed
by electronics capable of detecting both electron and positron bunches even if they are -
produced on the same machine pulse. The beam stoppers ST60 and ST61 that are up
beam of the muon steel will be protected by ion chambers IC65 and IC66.
Additional toroids in the FFTB beam line will limit the power delivered to the
FFTB dump to 1 kW. Ion chambers will also be used to protect the dump and the
intermediate stopper ST62 located down beam of the muon steel in the FFTB.
x-7

X. References
1. We thank E. Benson and R. Nelson for their calculation of these radiations and
help with the design of the shielding for the FFTB.
2. National Council on Radiation Protection and Measurements, NCRP-Report
- No. 51, March 1, 1977; -
T. M. Jenkins, Nucl. Instr. Meth. 159 (1979) 265;
W. R. Nelson and I<. R. Kase, Nucl. Instr. Meth. 120 (1974) 401;
H. DeStaebler, T. M. Jenkins and W. R. Nelson, “Shielding and Dosimetry,” in
The Stanford Two Mile Accelerator,” R. B. Neal, editor (Benjamin, 1968).
X-8

s t
i I
I

-
R
h\\\U
- - I” _
Figure X.2. Shielding of the beam line in the Bea.m Switch Yard area.
x-10

- -
-
XI. Infrastruct we
- .

XI. Infrastructure
The infrastructure associated with the FFTB is described in this section. The
support buildings, utilities, cable plant, and installation fixtures needed for the FFTB
are similar to those for other lines that have been constructed in the Research Yard in
the past. In some cases, structures must be removed to make way for the FFTB, and in
other cases, structures will be reused as part of the new beam line.
What is left of the old C-Beam that has existed in the channel to be occupied by
the FFTB must removed, as must parts of the SPEAR injection line (which has been
replaced by the new SSRL dedicated injector). Buildings 109 and 110 in the Research
- Yard must be modified, and Bldg. 406 will be moved and refurbished to house some of
the FFTB power supplies and electronics. A section at the back of the Main Control
Center must be cleaned out to make room for the remainder of the FFTB power supplies.
Two additional support shelters must be established on top of the linac berm to house
electronics racks for the FFTB instrumentation. These structures and the pattern of
cable raceways to be installed for the FFTB are shown in Figures X1.1-3.
X1.A Beam line Utilities and Structures
The radiation shielding for the FFTB has been discussed in Section X. Electrical
AC power for outlets and lighting within the shielded area will be supplied from the
electrical vaults near End Stations A and B. The FFTB magnets represent a total power
load of less than 500 kW.
Care will be taken to control the infiltration of air into the beam line area to
minimize diurnal temperature cycling. Ventilation will be provided during periods of
personnel access to the beam line. A low level of air flow will be provided to meet health
requirements for workers in the area, and a system capable of purging the area of smoke
in an emergency will also be installed. Smoke detectors and a wet-pipe sprinkler system
will provide additional protection against damage or injury due to fire.
_I. __ _ Several of the blocks that make up the roof of the shielding in the Research Yard
will be removable to facilitate installation of the beam line components. A light crane
(1 ton) will be hung f rom railings attached to beams that straddle the ledge of the
x1-2

beam line channel. This will be sufficient to lift all of the ma,gnets, vacuum pipes, and
instruments that will be installed along the beam.
The support structures for the magnets will be mounted on iron plates grouted to
the concrete floor. The supports for the quadrupole and sextupole magnets will be made
of.aq.uartz-epoxy aggregate (trade name Anocast from the Anorad Corporation), and
the dipole magnets will be mounted on iron stands that were removed from the C-Beam.
These are shown in Figures XI.4 and X1.5.
The low-conductivity cooling water (LCW) for the magnets will be fed from the
existing system in the Research Yard. The total LCW requirement for the FFTB is
- 200 gpm, to be delivered at a pressure differential across the magnets of 100 psi. The
LCW will be supplied with a manifold discharge pressure of 260 psi, with valves set
to produce the required differential pressure. The piping in the tunnel is designed to
provide a nearly constant differential by “crossing” the supply and return. The manifolds
are equipped with welded, threaded attach points for individual isolation valves, and all
piping is stainless steel. The supply and return headers will be installed the length of
the the FFTB, and will be connected to the magnets through low-conductivity flexible
hoses.
X1-B Support Buildings
The layout of the racks and floor-mounted power supplies for the FFTB are shown in
Figures XI.2 and 3. Rack and CAMAC crate profiles for the system are available. Each
of the support buildings and areas is serviced by AC power with separate transformers for
the DC power supplies and electronics racks. Heating, ventilation, and air conditioning
is provided for the support buildings to balance the heat load from the power supplies
and electronics racks.
x1.c Cable Plant
Cables will be run in 4-inch deep ladder-type steel cable trays or other raceways
from point of origin to termination. Barriers in the cable trays or separate cable trays .I __ _ will be utilized to carry conductors for different functions; e.g., DC, instrumentation,
AC power, etc.
XI-3

To minimize cable lengths for the Beam Position Monitor circuits and other sys-
tems, some of the electronics will be located in the two shelters on the surface of the
berm above the BSY. A 27-inch diameter vertical penetration adjacent to each of the
support buildings will carry cables to cable trays in the interior of the BSY and to beam
line equipment. Inside the vertical penetrations, conduits will separate conductors for -- different functions. Kellem, or similar cable grips will support the vertical’ load of the
cables. Provisions will be made at the surface in the vicinity of the penetrations for
shielding of the penetrations since they represent a straight path to the interior of the
BSY.
- Existing cable trays between the Main Control Building (MCC) and the BSY will
be utilized for cables between those two locations.
Large DC Cables
DC cables will be compact-sector aluminum, with XHHW insulation. Connections
to the magnets will be made utilizing short jumpers from terminal cabinets immediately
adjacent to the magnets to minimize the weight of cables on the magnet terminals. Ter-
minal cabinets will be provided at the power supply end for installation of transductors
on the DC circuits prior to connections to the Power Supplies. See Table XI.1 for a
listing of the sizes of these cables.
Trim and Steering Magnet Cables
To aid in the problem of maintaining proper voltage levels for the trim and steering
magnet cables, trunk cables of number-6 conductors will be run from terminal cabinets
near the power supplies to terminal cabinets in central locations near the magnets. From
the terminal cabinets to the power supplies and to the magnets, smaller sized conductors
will be installed. The terminal cabinets will also be helpful when isolating circuits and
for trouble-shooting shorts, or other cable problems. Spare circuits will be included in
_ the trunks. . ..- - _
Wiring for the trim and steering magnet trunks and jumpers will be copper with
XHHW insulation.
XI-4

Instrumentation and Control Cables
A wide variety of cable types will be utilized for the instrumentation and control
systems. Where practical, cables will be preassembled with connectors, as complete
units. In many cases cable connectors will be installed in the field.
Cables for the Beam Position Monitors and possibly the Wire Position Monitors
will be phase-matched in the SLAC shops and installed as completed assemblies.
Multi-conductor instrumentation and control cables will be type TC (tray cable),
with overall shield.
-
XI-5
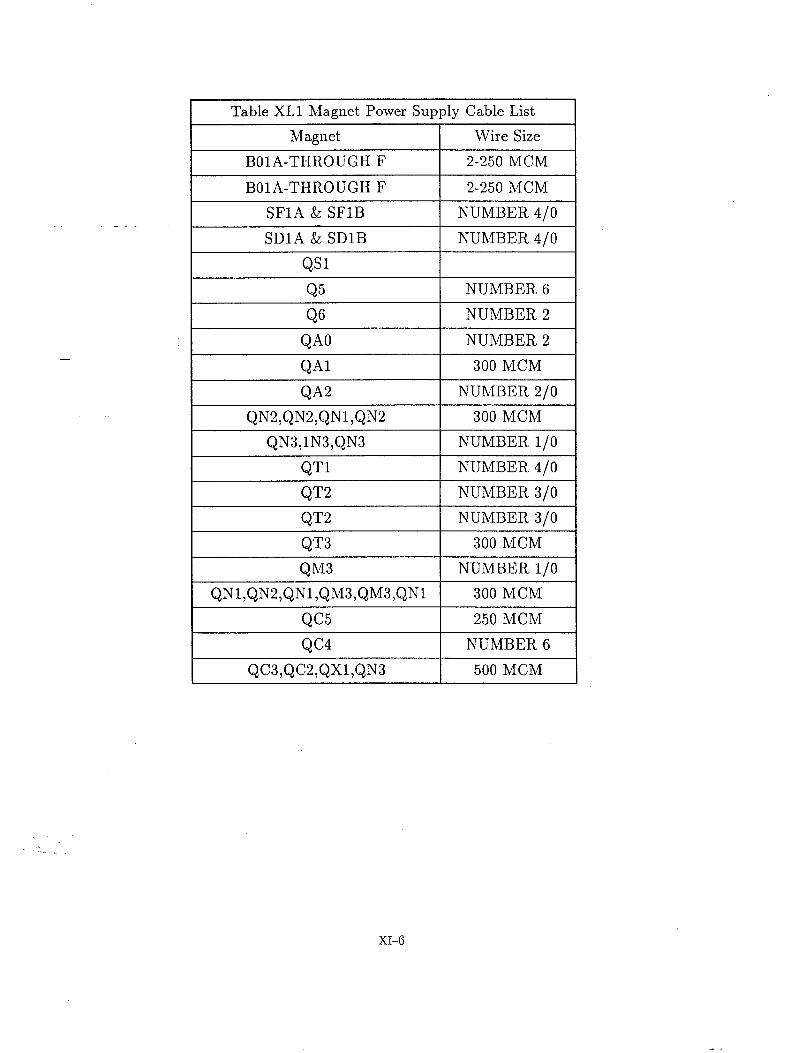
-
I Table XI.1 Ma,gnet Power Supply Cable List
Magnet Wire Size
BOlA-THROUGH F 2-250 MCM
I--- BOlA-THROUGH F I 2-250 MCM
SFlA & SFlB NUMBER 4/O ^ - SDlA & SDlB NUMBER 4/O
1 NUMBER6
I NUMBER 2 Q6 &A0 I NUMBER 2
1 300 MCM
1 NUMBER 2/O
I I
QN2,QN2,QNl,QN2 300 MCM
QN3,1N3,QN3 1 NUMBER l/O
1 NUMBER 4/O
1 NUMBER 3/O
1 NUMBER 3/O
I 300 MCM
QTl QT2 QT2 QT3 QM3
QNLQWQNl ,QM%QWQNl QC5
QC4 QC3,QCil,QXl,QN3
NUMBER l/O
300 MCM
250 MCM
NUMBER 6
500 MCM
XI-6
-

Table XI.1 Magnet Power Supply Cable List Continued
Magnet Wire Size
1 QPlA,QPlB 1 300 MCM
300 MCM
- - QP3A,QP3B 2-250 MCM
QP4 NUMBER 4/O
QP5 1 2-250 MCM
1 B03A,B03B 1 300 MCM
1 B04A,B04B 1 300 MCM
- B05A,B05B 3-350 MCM
QS2
XI-7
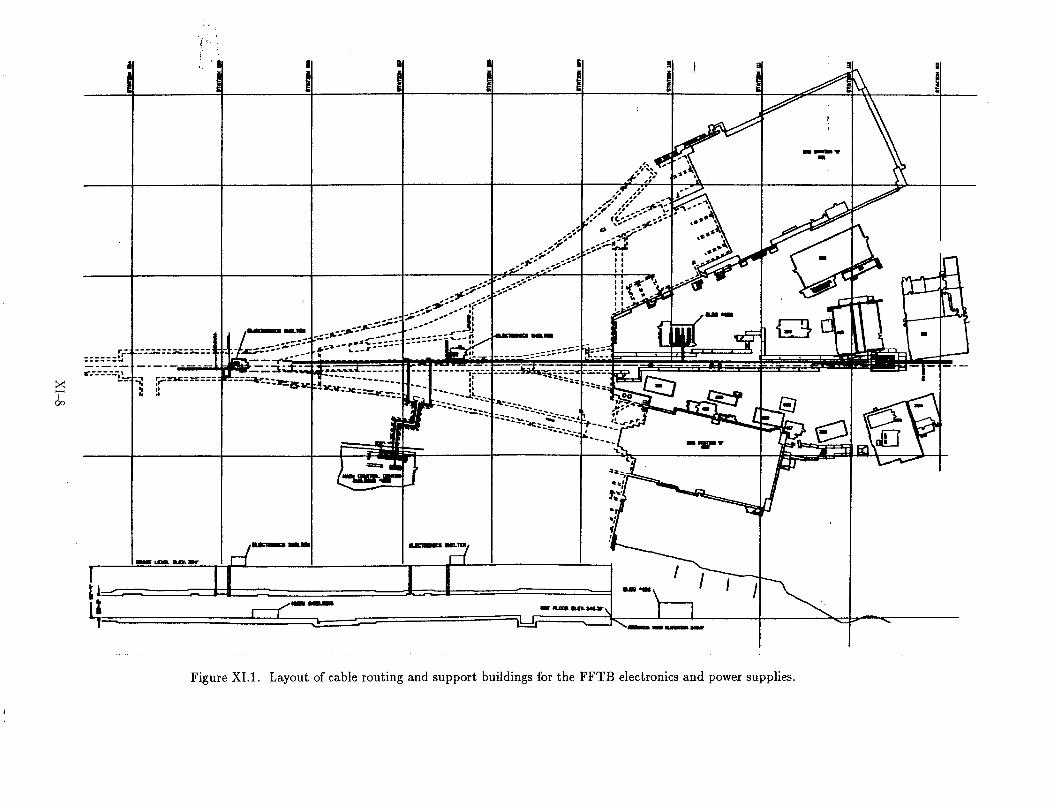
I \\.
I -
m-l,,
7, 1
. .
lMLl
I I
I 4 0 1

M7EWDWS 1
\ I --s------s , ,m-----,,J I I
- MCC - BUILDING l 005
I
@
a s-8 h
BUILDING '406
Figure X1.2. Layout of power supplies and racks in the FFTB area of h/ICC and Building 406.
x1-9

-
BUILDING AT STA. 105+0B (TDP OF BEAM SWITCHYARD)
BUILDING AT STA. 107+50 (TOP OF BEAM SWITCHYARD)
.u _ _
Figure X1.3. Layout of electronics racks in the support buildings on top of the Switchyard berm.
x1-10

--
-
I I I
F i i i i i I i 1 I i i i i I
QUAD MAGNET
-----,-----
ANOGAST
POSITIONER
CABLE TRAY I
CABLE TRAY
/-
GROUT
Figure X1.4. Plan drawing of FFTB quadrupole mounts and movers.
, x1-11
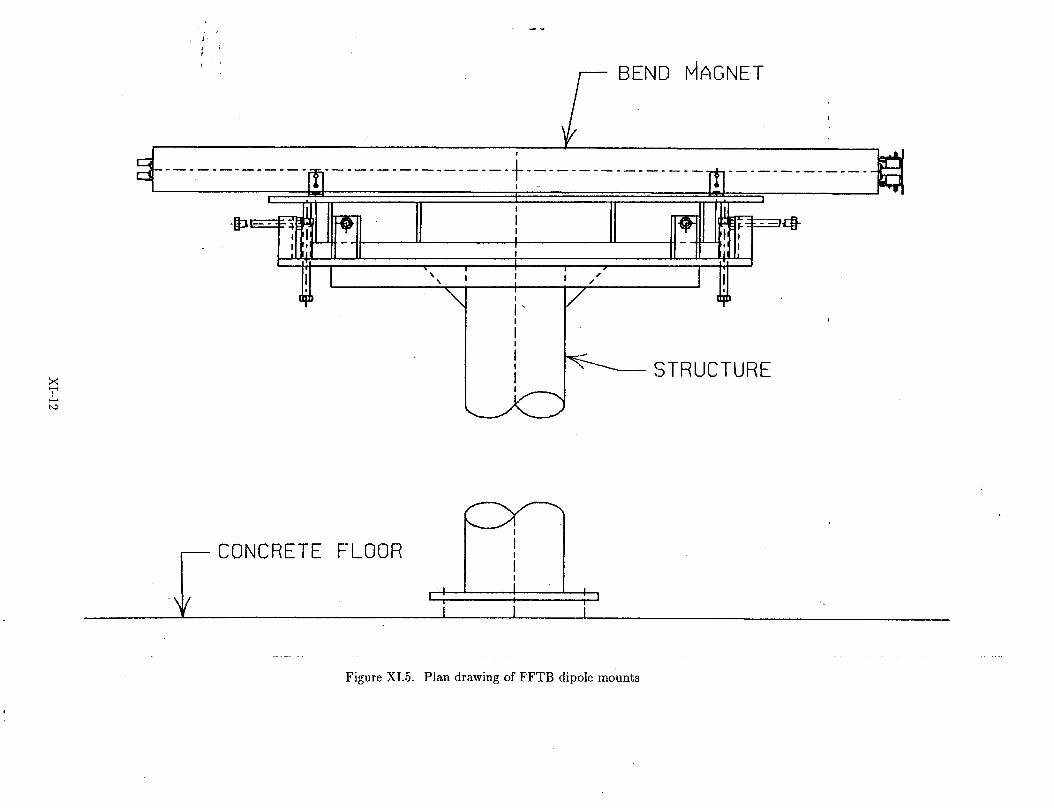
-- *‘.
1
4
BEND P~AGNET
1’ ” I II II 111 II I I’I I II, \ \ i I I ; /’ \ I
i< i i
STRUCTURE
CONCRETE FLOOR i I I
1 ; I I I I
Figure X1.5. Plan drawing of FFTB dipole mounts

-.-
XII. Administration

XII. Administration
The FFTB is being constructed by an international collaboration of engineers and
physicists. The members of this collaboration are given in Table X11.1. The spokesper-
sons for the Collaboration are D. Burke and E. Paterson of- SLAC. Memoranda of -- .- Understanding have been signed that describe each institution’s participation in the
FFTB Collaboration.
The FFTB Collaboration is responsible for the construction and installation of the
FFTB. The Project Manager and Project Engineer for the FFTB are D. Burke and
- B. Denton. The FFTB Collaboration will commission the FFTB and retain initial
use of the beam line for a time after its construction to conduct various experimental
investigations. It is expected that the FFTB will then become a facility for use by the
scientific community.
XI1.A Budget
Each institution participating in the FFTB Collaboration will fund all normal op-
erating expenses (such as salaries, administrative support, and travel) of its personnel.
For reasons of standardization and system integration, some material or instrumen-
tation may be supplied by SLAC, otherwise ea.& institution will furnish all material
necessary for the fabrication and testing of components as agreed in the Memoranda of
Understanding and described in this report.
The funds required from the U.S. DOE to support the responsibilities of SLAC in
the FFTB Collaboration are summarized in Table XII.2. Costs being borne by other
participating institutions represent approximately $4.2M (USFY 1990 dollars with no
contingency).
XI1.B Schedule
. . -, 4 ._ It is the intention of the FFTB Collaboration to complete the fabrication, instal- I- _
lation, and inspection of the FFTB components by the Fall of calender year 1992.
The “Level 3” schedule for completion of the project is shown in Table X11.3.
x11-2

Table XII.1 The FFTB Collaboration
M.Berndt, V.Bressler, KBrown, F.Bulos, KBunnel,
D.Burke, J.Cobb, B.Denton, G.Fischer, F.I-Ialbo, R.Helm,
P.Holik, J.Irwin, I<.Johnson, A.Odian, E.Paterson,
D.Plouffe, SXokni, R.Ruland, R.Ruth, F.Villa,
S.Wagner, D.Walz, H.Walz, S.Williams
Stanford Linear Accelerator Center
Stanford, California, USA
H.Haysno, N.Ishihara, T.Matsui, H.Nakayama,
I<.Oide, N.Yamamoto
National Laboratory for High Energy Physics
Tsukuba, Ibaraki-ken, Japan
J.Buon, R.Couchot, J.Coulon, J.Jeanjean, F.Lediberder,
V.Lepeltier, H.Ngoc, J.Perez-y-Jorba, P.Puzo, G.Roy
Laboratoire de E’Accelerateur Lineaire
Orsay, France
F.Loeffler, F.Peters, W.Schwarz, G.Voss
Deutsches Elektronen-Synchrotron DESY
Hamburg, Germany
R.Richter, R.Settles, U.Stierlin, J.Thomas
Max-Planck-Institute fiir Physik
Munich, Germany
V.Aleksandrov, V.Balakin, Yu.Koisin, V. Medjidzade,
A.Mikhailichenko, Yu.Valiaev
Institute for Nuclear Physics, Siberian Division
Novosibirsk, USSR
XII-3
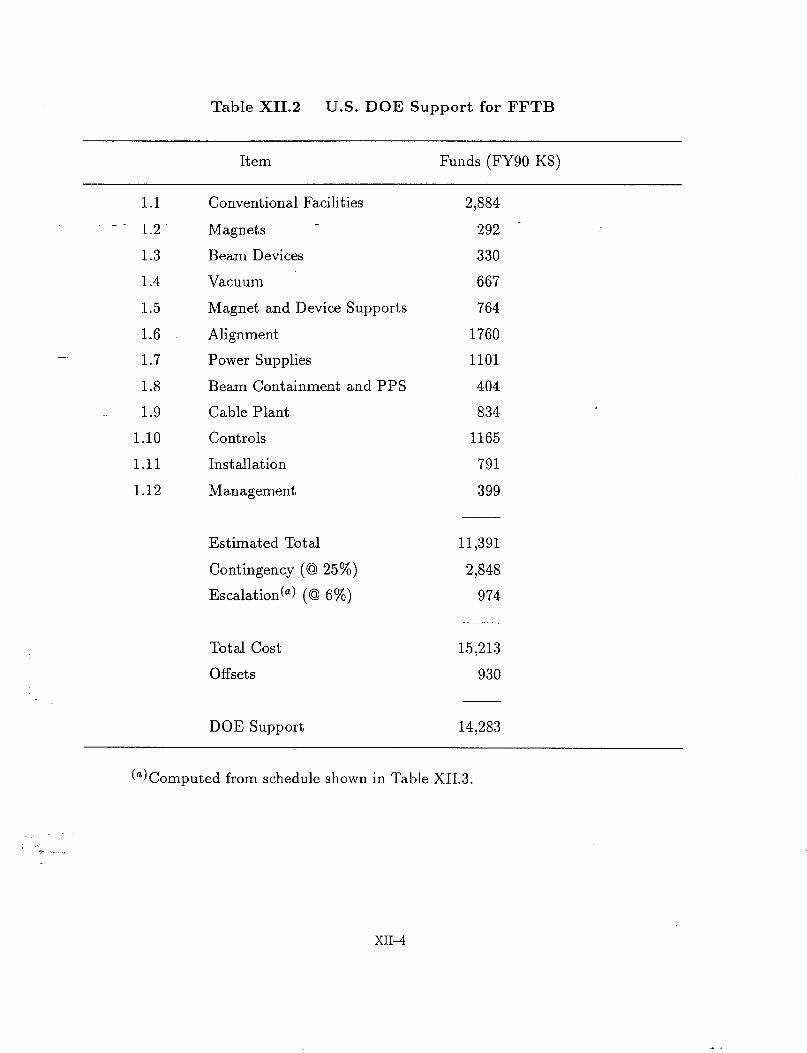
Table XII. 2 U.S. DOE Support for FFTB
Item Funds (FY90 I-($)
1.1 Conventional Facilities 2,884
-- 1.2. Magnets 292 -
1.3 Beam Devices 330
1.4 Vacuum 667
1.5 Magnet and Device Supports 764
1.6 Alignment 1760 - 1.7 Power Supplies 1101
1.8 Beam Containment and PPS 404
1.9 Cable Plant 834
1.10 Controls 1165
1.11 Installation 791
1.12 Management 399
Estimated Total 11,391
Contingency (@ 25%) 2,848
Escalation(‘) (Q 6%) 974
Total Cost 15,213
Offsets 930
DOE Support 14,283
(‘)Computed from schedule shown in Table X11.3.
XII4

TABLE XII.3 FFTB ACTIVITY DURATIONS
FY 1090..--+c-..-- FY 1991 ACTIVITY
..-m-,<...m. Fy ,902 1 1 .“‘.>
CONVENTIONAL FAClLllYES AjMlJlJlAlS OlNlD JlFIYIAIM J JlAlS OlNlD JIFIMIAIMIJIJJAIs
I I I I I I I I I I I I I I I I I I I I I I 1 -- .___._ _ ._._ _- ___-.-___-- IBSY & Site Prep
--_. . . . . . . . .._ . . . . . . . . . . . . . . . . . . . . . . . . . . . . . . . . . . . . . . . . . . *.............. . . . . . .A . i . . . .._ .A.....,..
(Magnet Movers - .:.:.:.:.:.:.:.:.:.:::.:.:~:.:.:.:::. .:::.:.:,:.:.:::.:,:.: . . . . . . . ..A.... “.‘..c.‘:.:.:.:.: ~...:...:...:.:..:.:‘.L’. . . . . . . :::::::::::::::::j:::
ISupports I I I I : :::;,;~;,:,:,:,‘,~,‘,‘,~,‘:.‘. . . . . . . . . . . . ..(.(. ._: ::::::::*.:.:.:.:.:.:.:.:.:.:.:.:.:. “‘....‘........,.....,.... ,...,,,,,......_,_.,,,,,,~,,, ,:: ‘;,:.:‘:‘:“:.:‘(::: :: :::. ,,.,.,.,. ;.;.:.:.:.:.:.)~~:,:,;,:.:,;, :~:::~:.:.:.:.:.:.:.:.:.:.:.~:.:.:.:.:.:.:.:.~.:.:.:.:.:.:.:.:.:.:.:,: ,,.,,,.,, ALfGNMEI
ED&l Wire System [DESY Support]l
. ,Liauid Level Svstem
ii i i ii i-1
IINSTALLATION
XII-5