Embed Size (px)
Citation preview
The Islamic University of Gaza
Faculty of Commerce
Department of Economics and Political Sciences
An Introduction to Statistics Course (ECOE 1302)
Spring Semester 2009-2010
Final Examination
17/6/2010
Name:_____________________________________________ ID:_____________
Instructor: □ Dr. Samir Safi □ Mr. Ibrahim Abed
INSTRUCTIONS:
1. Write your name and student ID.
2. You have 2 hours
3. This exam must be your own work entirely. You cannot talk to or share information with
anyone.
4. Show all your work. Partial credit will only be given where sufficient understanding of the
problem has been demonstrated and work is shown.
DON'T WRITE ON THIS TABLE
UESTIONQ #1 #2 #3 #4 #5 BONUS TOTAL
OINTSP
1
Question #1: [24 Points]
For each question in this section, circle the correct answer. Each problem is worth 2 points.
1. The null and alternative hypotheses to determine if the number of tissues used during a cold is less
than 60. a) H0 : µ ≤ 60 and H1 : µ > 60.
b) H0 : µ ≥ 60 and H1 : µ < 60.
c) H0 : X ≥ 60 and H1 : X < 60.
d) H0 : X = 52 and H1 : X ≠ 52.
2. When extreme values are present in a set of data, which of the following descriptive summary measures are most appropriate:
a. CV and range. b. arithmetic mean and standard deviation. c. interquartile range and median. d. variance and interquartile range.
3. The Y-intercept (b0) represents the a) estimated average Y when X = 0. b) change in estimated average Y per unit change in X. c) predicted value of Y. d) variation around the sample regression line.
4. The t distribution a) assumes the population is normally distributed. b) approaches the normal distribution as the sample size increases. c) has more area in the tails than does the normal distribution. d) All of the above.
5. An economist is interested in studying the incomes of consumers in a particular region. The population standard deviation is known to be $1,000. A random sample of 50 individuals resulted in an average income of $15,000. What total sample size would the economist need to use for a 95% confidence interval if the width of the interval should not be more than $100?
a) n = 1537 b) n = 385 c) n = 40 d) n = 20
6. The width of a confidence interval estimate for a proportion will be a) narrower for 99% confidence than for 95% confidence. b) wider for a sample size of 100 than for a sample size of 50. c) narrower for 90% confidence than for 95% confidence. d) narrower when the sample proportion is 0.50 than when the sample proportion is 0.20.
2
7. Which of the following would be an appropriate alternative hypothesis?
a) The mean of a population is equal to 55. b) The mean of a sample is equal to 55. c) The mean of a population is greater than 55. d) The mean of a sample is greater than 55.
8. A Type I error is committed when a) we reject a null hypothesis that is true. b) we don't reject a null hypothesis that is true. c) we reject a null hypothesis that is false. d) we don't reject a null hypothesis that is false.
9. If an economist wishes to determine whether there is evidence that average family income in a community exceeds $25,000
a) either a one-tailed or two-tailed test could be used with equivalent results. b) a one-tailed test should be utilized. c) a two-tailed test should be utilized. d) None of the above.
10. It is possible to directly compare the results of a confidence interval estimate to the results obtained by testing a null hypothesis if
a) a two-tailed test for µ is used.
b) a one-tailed test for µ is used.
c) Both of the previous statements are true. d) None of the previous statements is true.
11. We have created a 95% confidence interval for µ with the result (10, 15). What decision will we
make if we test H0 : µ =16 versus H1 : µ ≠ 16 at α = 0.05?
a) Reject H0 in favor of H1. b) Accept H0 in favor of H1. c) Fail to reject H0 in favor of H1. d) We cannot tell what our decision will be from the information given.
12. Suppose a 95% confidence interval for µ turns out to be (1,000, 2,100). Give a definition of what it
means to be “95% confident” as an inference. a) In repeated sampling, the population parameter would fall in the given interval 95% of the
time. b) In repeated sampling, 95% of the intervals constructed would contain the population mean. c) 95% of the observations in the entire population fall in the given interval. d) 95% of the observations in the sample fall in the given interval.
3
Question #2: [21 Points] For each question in this section, indicate whether the sentence is TRUE or False. Each problem
is worth 121 points.
1. ( ) When we test for differences between the means of 2 independent populations, we can only use a two-tailed test.
2. ( ) Repeated measurements from the same individuals is an example of data collected
from 2 related populations. 3. ( ) The statement of the null hypothesis always contains an equality. 4. ( ) The smaller is the p-value, the stronger is the evidence against the null hypothesis. 5. ( ) The t distribution is used to construct confidence intervals for the population mean
when the population standard deviation is unknown. 6. ( ) Given a sample mean of 2.1 and a population standard deviation of 0.7 from a
sample of 10 data points, a 90% confidence interval will have a width of 2.36. 7. ( ) The sample mean is a point estimate of the population mean. 8. ( ) A point estimate consists of a single sample statistic that is used to estimate the true
population parameter. 9. ( ) In a set of numerical data, the value for Q2 is always halfway between Q1 and Q3. 10. ( ) The coefficient of variation is a measure of relative variation. 11. ( ) The t distribution approaches the standardized normal distribution when the number
of degrees of freedom increases. 12. ( ) For a given data set, the confidence interval will be wider for 95% confidence than
for 90% confidence.
13. ( ) A sampling distribution is a distribution for a statistic. 14. ( ) The type of TV one owns is an example of an ordinal scaled variable.
4
Question #3: [16 Points] To test the effectiveness of a business school preparation course, 8 students took a general business test before and after the course. Denote X1: Before Course (1), X2: After Course (2):X2, Difference Di= X1i- X2i
Suppose DD 50, S 65.03= − =
a. (2 Points) State the null and alternative hypotheses to determine the effectiveness of a business school preparation course.
� Ho: � Ha: b. (6 Points) Using the sample information provided, calculate the value of the test statistic. c. (4 Points) Compute the P- value.
d. (2 Points) State your decision at level of significance .05α = e. (2 Points) State carefully your conclusion
5
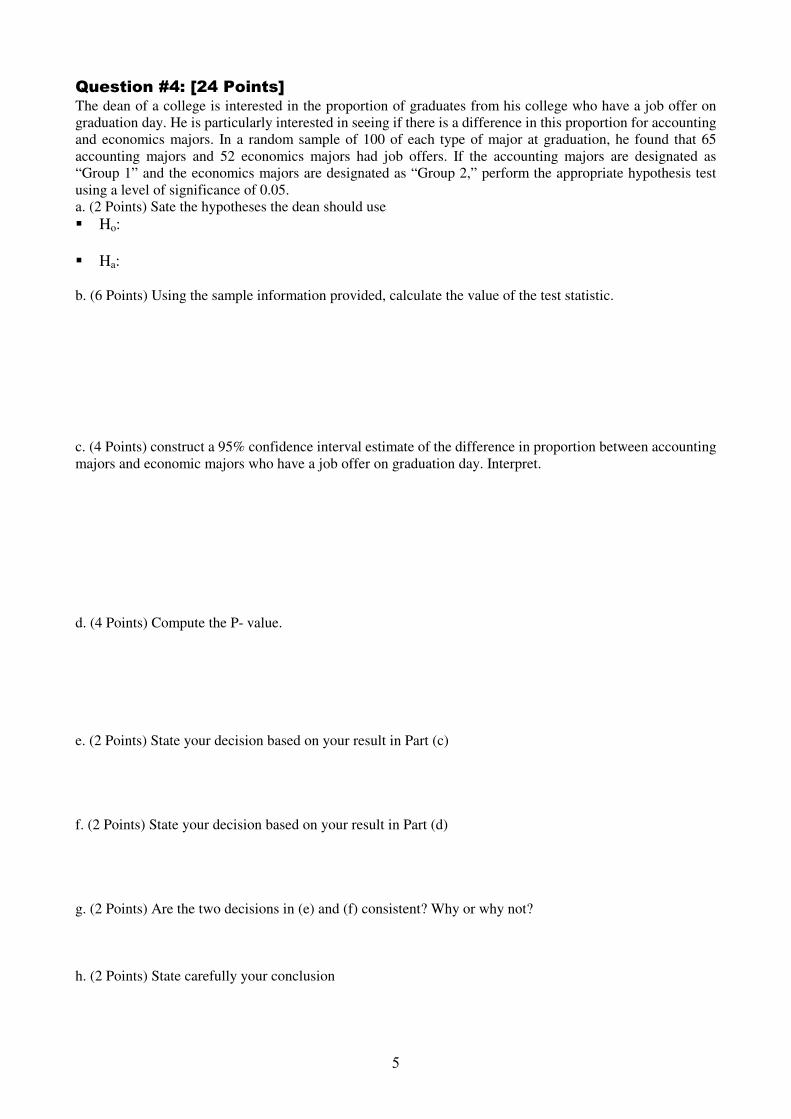
Question #4: [24 Points] The dean of a college is interested in the proportion of graduates from his college who have a job offer on graduation day. He is particularly interested in seeing if there is a difference in this proportion for accounting and economics majors. In a random sample of 100 of each type of major at graduation, he found that 65 accounting majors and 52 economics majors had job offers. If the accounting majors are designated as “Group 1” and the economics majors are designated as “Group 2,” perform the appropriate hypothesis test using a level of significance of 0.05. a. (2 Points) Sate the hypotheses the dean should use
� Ho: � Ha: b. (6 Points) Using the sample information provided, calculate the value of the test statistic. c. (4 Points) construct a 95% confidence interval estimate of the difference in proportion between accounting majors and economic majors who have a job offer on graduation day. Interpret.
d. (4 Points) Compute the P- value. e. (2 Points) State your decision based on your result in Part (c) f. (2 Points) State your decision based on your result in Part (d) g. (2 Points) Are the two decisions in (e) and (f) consistent? Why or why not? h. (2 Points) State carefully your conclusion
6
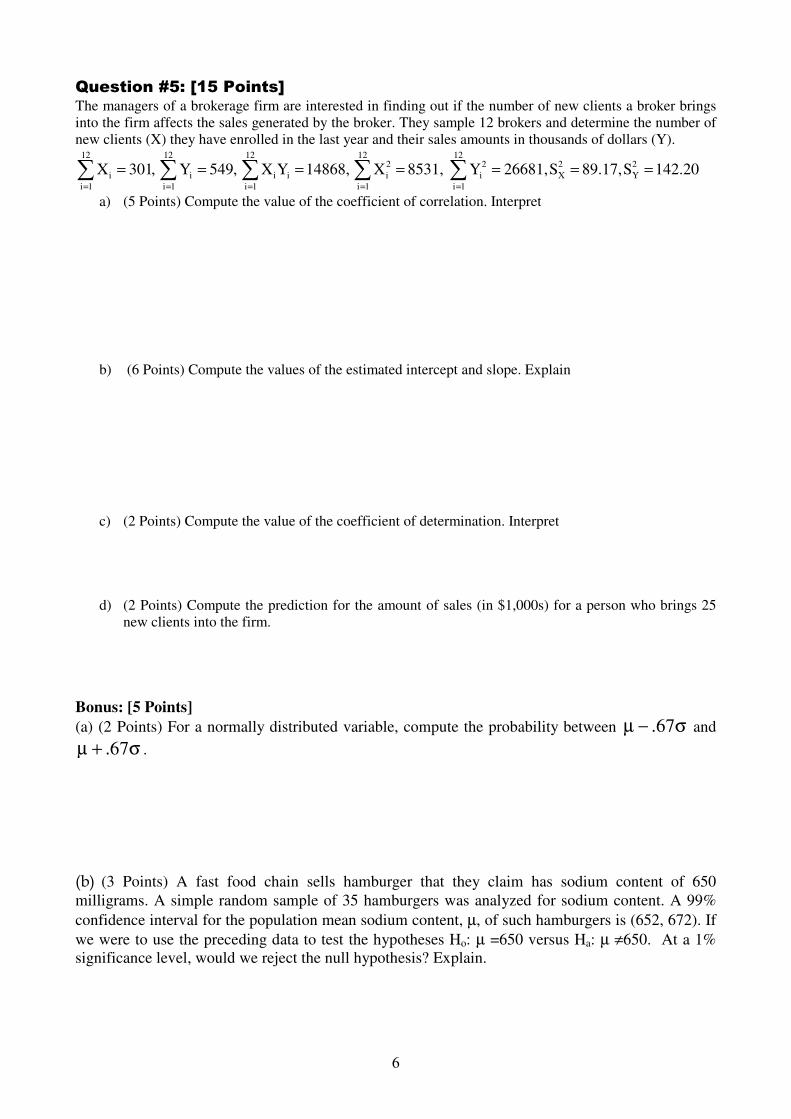
Question #5: [15 Points] The managers of a brokerage firm are interested in finding out if the number of new clients a broker brings into the firm affects the sales generated by the broker. They sample 12 brokers and determine the number of new clients (X) they have enrolled in the last year and their sales amounts in thousands of dollars (Y).
12 12 12 12 122 2 2 2
i i i i i i X Y
i 1 i 1 i 1 i 1 i 1
X 301, Y 549, X Y 14868, X 8531, Y 26681,S 89.17,S 142.20= = = = =
= = = = = = =∑ ∑ ∑ ∑ ∑
a) (5 Points) Compute the value of the coefficient of correlation. Interpret b) (6 Points) Compute the values of the estimated intercept and slope. Explain
c) (2 Points) Compute the value of the coefficient of determination. Interpret d) (2 Points) Compute the prediction for the amount of sales (in $1,000s) for a person who brings 25
new clients into the firm.
Bonus: [5 Points]
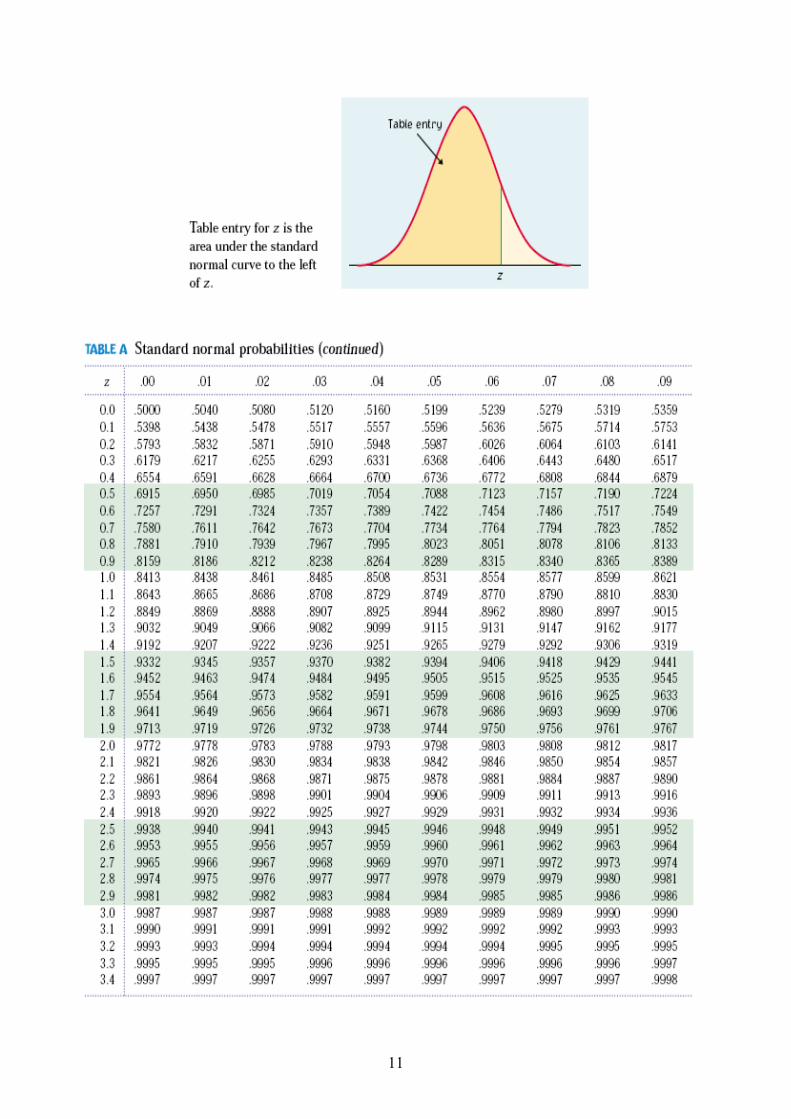
(a) (2 Points) For a normally distributed variable, compute the probability between σ−µ 67. and
σ+µ 67. .
(b) (3 Points) A fast food chain sells hamburger that they claim has sodium content of 650
milligrams. A simple random sample of 35 hamburgers was analyzed for sodium content. A 99%
confidence interval for the population mean sodium content, µ, of such hamburgers is (652, 672). If
we were to use the preceding data to test the hypotheses Ho: µ =650 versus Ha: µ ≠650. At a 1% significance level, would we reject the null hypothesis? Explain.

7
Scratch Paper #1

8
Scratch Paper #2
9
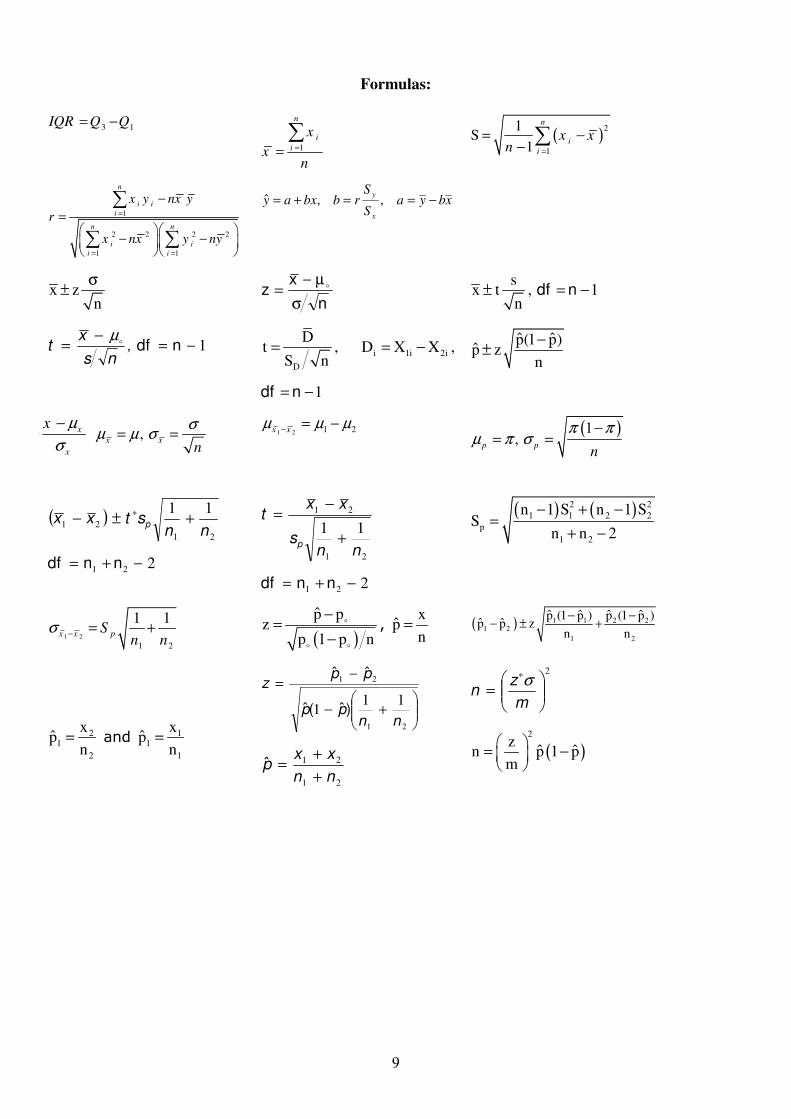
Formulas:
3 1= −IQR Q Q
1 ==∑
n
i
i
x
xn
( )
2
1
1S
1 =
= −−∑
n
i
i
x xn
1
2 2 2 2
1 1
n
i i
i
n n
i i
i i
x y nx y
r
x nx y ny
=
= =
−
=
− −
∑
∑ ∑
xbya
S
Srbbxay
x
y−==+= ,,ˆ
x zn
σ±
n
xz
σ
µ−= �
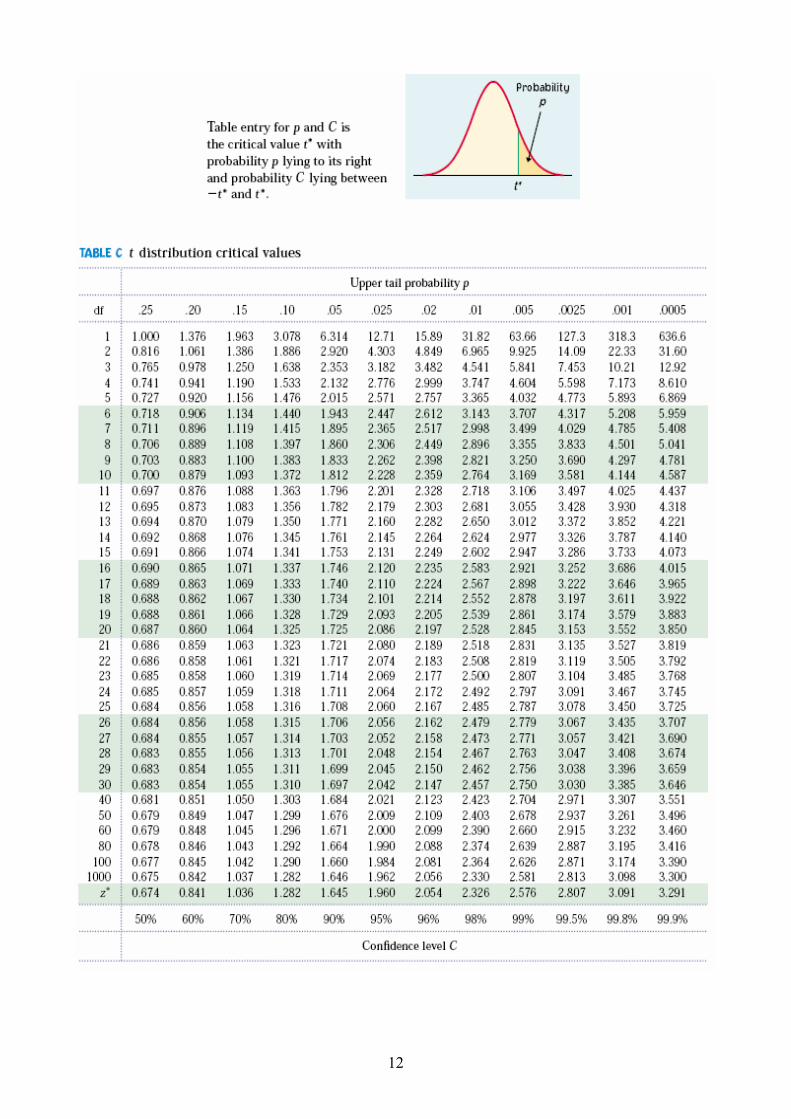
sx t
n± , 1−= ndf
ns
xt �
µ−= , 1−= ndf
D
Dt
S n= , i 1i 2iD X X= − ,
1−= ndf
ˆ ˆp(1 p)p̂ z
n
−±
−= x
x
x µ
σ
,= =x x
n
σµ µ σ
1 2 1 2− = −x x
µ µ µ ( )1,
−= =p p
n
π πµ π σ
( )21
21
11
nnstxx p +±−
∗
221 −+= nndf 21
21
11
nns
xxt
p +
−=
221 −+= nndf
( ) ( )2 2
1 1 2 2
p
1 2
n 1 S n 1 SS
n n 2
− + −=
+ −
1 2
1 2
1 1− = +
x x pS
n nσ
( )
p̂ pz
p 1 p n
−=
−
�
� �
, x
p̂n
= ( ) 1 1 2 21 2
1 2
ˆ ˆ ˆ ˆp (1 p ) p (1 p )ˆ ˆp p z
n n
− −− ± +
21
2
xp̂
n= and 1
1
1
xp̂
n=
+−
−=
21
21
111
nnpp
ppz
)ˆ(ˆ
ˆˆ
21
21
nn
xxp
+
+=ˆ
2
=
∗
m
zn
σ
( )2
zˆ ˆn p 1 p
m
= −
10
11
12