Embed Size (px)
Citation preview

Sí Texas: Social Innovation for a Healthy South Texas
#MHMSíTexas
Final Evaluation Report:
Tropical Texas Behavioral Health
Submitted Date: May 4, 2018
Prepared by: Evaluator: Health Resources in Action, Inc.

SIF Final Evaluation Report
Subgrantee: Tropical Texas Behavioral Health
Project Title: Improving Access to Integrated Care for Rio Grande Valley Residents with Severe & Persistent Mental Illness
Submitted by:
SIF Grantee: Methodist Healthcare Ministries of South Texas, Inc.
Program Name: Sí Texas: Social Innovation for a Healthy South Texas
Prepared by:
Evaluator: Health Resources in Action, Inc.
May 2018
Methodist Healthcare Ministries’ Sí Texas program is a proud recipient of the Social Innovation Fund (SIF) program.
The Social Innovation Fund (SIF) was a program that received funding from 2010 to 2016 from the Corporation for National and Community Service, a federal agency that engages millions of Americans in service through its AmeriCorps, Senior Corps, and Volunteer Generation Fund programs, and leads the nation’s volunteer and service efforts. Using public and private resources to find and grow community-based nonprofits with evidence of results, SIF intermediaries received funding to award subgrants that focus on overcoming challenges in economic opportunity, healthy futures, and youth development.

Sí Texas Subgrantee: Tropical Texas Behavioral Health Program Title: Improving Access to Integrated Care for Rio Grande Valley Residents with Severe & Persistent Mental Illness
TABLE OF CONTENTS EXECUTIVE SUMMARY ................................................................................................................................... i
INTRODUCTION ............................................................................................................................................. 1
Program Definition and Background ........................................................................................................ 1
Overview of Prior Research ...................................................................................................................... 2
Program Components ............................................................................................................................... 3
Overview of Impact Study ......................................................................................................................... 4
Contribution of the Study ......................................................................................................................... 6
SIF Evaluation Plan Updates...................................................................................................................... 6
IMPLEMENTATION STUDY: STUDY APPROACH, METHODS, AND FINDINGS ................................................ 7
Implementation Study Design .................................................................................................................. 7
Implementation Study Findings .............................................................................................................. 10
Additional Implementation Findings ...................................................................................................... 26
IMPACT STUDY – APPROACH AND METHODS ............................................................................................ 31
Overview of Impact Study Design ........................................................................................................... 31
Impact Study Design and Methods ......................................................................................................... 31
Study Sample .......................................................................................................................................... 35
Study Sample Composition .................................................................................................................. 35
Patient Flow Description...................................................................................................................... 38
Sample Recruitment, Retention and Attrition ..................................................................................... 41
Non-Response Bias and Missing Data ................................................................................................. 45
Measures ................................................................................................................................................. 45
Data Collection Activities ........................................................................................................................ 49
IMPACT STUDY – ANALYSIS AND RESULTS .................................................................................................. 51
Unit of Analysis and Overview of Analyses Performed........................................................................... 51
Blood Pressure ........................................................................................................................................ 53
HbA1C Level ............................................................................................................................................ 57
Body Mass Index ..................................................................................................................................... 65
Hypercholesterolemia ............................................................................................................................. 68
Depressive Symptoms ............................................................................................................................. 73
Functioning and Quality of Life ............................................................................................................... 76
CONCLUSION – SUMMARY OF FINDINGS, LESSONS LEARNED, AND NEXT STEPS ...................................... 82
Summary of Findings............................................................................................................................... 82

Sí Texas Subgrantee: Tropical Texas Behavioral Health Program Title: Improving Access to Integrated Care for Rio Grande Valley Residents with Severe & Persistent Mental Illness
Summary of Implementation Findings ................................................................................................ 83
Summary of Impact Findings ............................................................................................................... 83
Lessons Learned, Study Limitations, and Next Steps .............................................................................. 84
Lessons Learned ................................................................................................................................... 84
Operational Facilitators ....................................................................................................................... 84
Sustainability Planning ......................................................................................................................... 85
Evaluation Lessons ............................................................................................................................... 85
Next Steps ............................................................................................................................................... 86
OTHER ASPECTS OF STUDY LOGISTICS AND FEASIBILITY ............................................................................ 87
Human Subjects Protection .................................................................................................................... 87
Timeline................................................................................................................................................... 87
Evaluator/Subgrantee Role and Involvement ......................................................................................... 87
Budget ..................................................................................................................................................... 87
REFERENCES ................................................................................................................................................ 88
APPENDICES ................................................................................................................................................ 91
Appendix A: TTBH Revised Timeline ....................................................................................................... 92
Appendix B: Program Logic Model .......................................................................................................... 93
Appendix C: Sí Texas Mid-Point Implementation Evaluation: Key Informant Interview General Guide 94
Appendix D: Sí Texas Summative Implementation Evaluation: Key Informant Interview General Guide ................................................................................................................................................................ 98
Appendix E: Sí Texas Summative Implementation Evaluation: Focus Group Guide- SPMI Population 102
Appendix F: Implementation Evaluation Measures .............................................................................. 107
Appendix G: Loss to Follow-Up/Attrition Tables .................................................................................. 119
Appendix H: Patient Characteristics Form ............................................................................................ 128
Appendix I: Patient-Centered Integrated Behavioral Health Care Checklist ........................................ 132
Appendix J: Patient Health Questionnaire – 9 (PHQ-9) ........................................................................ 134
Appendix K: Adult Needs and Strengths Assessment (ANSA) ............................................................... 135

Sí Texas Subgrantee: Tropical Texas Behavioral Health Program Title: Improving Access to Integrated Care for Rio Grande Valley Residents with Severe & Persistent Mental Illness
i
EXECUTIVE SUMMARY This final report describes the methods and findings for the evaluation of the program, Improving Access to Integrated Care for Rio Grande Valley Residents with Severe & Persistent Mental Illness, at Tropical Texas Behavioral Health (TTBH), a subgrantee of the Social Innovation Fund (SIF) Grantee Methodist Healthcare Ministries (MHM) of South Texas, Inc. MHM is a member of the 2014 SIF cohort. The evaluation was conducted by the external evaluation contractor, Health Resources in Action (HRiA), at the TTBH clinic site in Brownsville. Program Background TTBH is the local mental health authority for the more than 1.2 million residents of Hidalgo, Cameron, and Willacy counties in Texas. In December 2015, TTBH implemented its program, Improving Access to Integrated Care for Rio Grande Valley Residents with Severe & Persistent Mental Illness, which is a reverse co-location integrated behavioral health model (IBH) in their Brownsville, Texas clinic to expand primary care services delivered to adults receiving behavioral health services in the region. At its core, the proposed intervention featured a team of medical professionals consisting of 1 full-time equivalent (FTE) primary care physician (PCP), physician assistant or nurse practitioner, 1 FTE licensed vocational nurse, 1 FTE registered dietician, 1 FTE care coordinator, and other medical support staff. Together, this team delivered co-located, preventative primary care to TTBH clients with co-morbid severe and persistent mental illness (SPMI) and chronic disease (specifically obesity, diabetes, or hypertension) within a community-based outpatient behavioral health setting. The study hypothesis is that a reverse co-located model of integrated care (i.e., primary care within a behavioral health care setting) will improve control of chronic disease (hypertension, diabetes, obesity, and hypercholesterolemia), reduce depression, increase access to primary care services, and improve adult functioning and quality of life among patients with SPMI. Prior Research TTBH’s intervention aimed to accomplish the key elements of Wagner’s model for effective chronic illness care, namely, an organized delivery system linked with complementary community resources, sustained by productive interactions between multidisciplinary care teams and “activated” or educated patients and their families (Wagner, 1998). The evaluation targeted a moderate level of evidence, based on the incoming level of preliminary evidence supporting the benefit of integrated behavioral health among the SPMI population. Prior evidence includes randomized control trials (RCTs) by Druss et al. (2010; 2011) and the Boardman (2006) quasi-experimental design (QED) study. The study will expand the level of evidence related to co-located integrated care models, assess its program efficacy, and generate moderate evidence for the IBH model. Evaluation Design The impact evaluation study used a randomized control trial (RCT) design to compare intervention participants receiving the delivery of integrated behavioral health with comparison participants receiving the usual care provided within a behavioral health clinic for patients with SPMI. The evaluation plan included a primary study, the RCT, and a secondary companion study of a quasi-experimental design (QED) using comparison group from a nearby clinic in case randomization was not
Sí Texas Subgrantee: Tropical Texas Behavioral Health Program Title: Improving Access to Integrated Care for Rio Grande Valley Residents with Severe & Persistent Mental Illness
ii
conducted successfully in the RCT. Given that randomization was successful in the RCT, the QED companion study was eliminated and is not presented in this report. Based on sample size calculations, TTBH’s recruitment target was 182 participants in each of the two study groups (intervention group and control group at Brownsville) totaling 364 participants. TTBH’s program model enrolled a total of 416 participants, 249 in the intervention group and 167 in the control group. TTBH’s 12-month retention target was 290 participants, with 145 in each study arm. The final 12-month sample totaled 271 participants, 155 in the intervention group and 116 in the control group. The implementation evaluation focused on measuring the level of program services provided and quality of services program participants received relative to what was proposed. In addition, the implementation evaluation assessed the extent to which the comparison group received similar program services. Description of Measures and Instruments TTBH collected data for the Sí Texas shared impact measures: BMI (height/weight), HbA1C (obtained via blood test), blood pressure (taken by provider), depression (using the Patient Health Questionnaire (PHQ-9)), and quality of life (as measured by the Adult Needs and Strengths Assessment instrument (ANSA)). An additional outcome measure, total cholesterol, was specifically collected for TTBH’s study participants. The primary impact measure for the Improving Access to Integrated Care for Rio Grande Valley Residents with Severe & Persistent Mental Illness program was blood pressure. Research Questions Below are the confirmatory and exploratory research questions.
1) Are SPMI patients who receive coordinated co-located services more likely to reduce their blood pressure after 12 months compared to SPMI patients who receive only behavioral health care services? This question is confirmatory.
2) Are SPMI patients with a history or diagnosis of diabetes who receive coordinated co-located services more likely to reduce their HbA1c level after 12 months compared to SPMI patients who receive only behavioral health care services? This question is exploratory.
3) Are SPMI patients who receive coordinated co-located services more likely to reduce their BMI after 12 months compared to patients who receive only behavioral health care services? This question is exploratory.
4) Are SPMI patients with hypercholesterolemia who receive coordinated co-located services more likely to reduce their total cholesterol after 12 months compared to SPMI patients with hypercholesterolemia who receive only behavioral health care services? This question is exploratory.
5) Are SPMI patients who receive coordinated co-located services more likely to reduce their depressive symptoms—as measured by the PHQ-9—after 12 months compared to SPMI patients who receive only behavioral health care services? This question is exploratory.
6) Are SPMI patients who receive coordinated co-located services more likely to improve their functioning and quality of life—as measured by improvement in 1 or more of the functioning domains assessed by the ANSA—after 12 months compared to SPMI patients who receive only behavioral health care services? This question is exploratory.
Sí Texas Subgrantee: Tropical Texas Behavioral Health Program Title: Improving Access to Integrated Care for Rio Grande Valley Residents with Severe & Persistent Mental Illness
iii
Implementation Questions The following evaluation questions examined program implementation.
1) Did the TTBH program reach its intended target population? 2) What are the components of TTBH’s reverse co-location program and how do these
components work “on the ground” at 6 and 12 months? a. Are these components different than what was planned, and why are they different?
3) What level of Integrated Behavioral Health did TTBH achieve as a result of implementing the reverse co-location program?
a. To what extent have providers and program staff adopted the components of TTBH’s reverse co-location program at 6 and 12 months? What are the facilitators and barriers to adoption?
b. To what extent do providers and staff buy in to the program, and how has buy in affected implementation?
4) To what extent did the comparison groups receive program-like components? 5) To what extent did the TTBH implement the reverse co-location model with fidelity?
Additional implementation evaluation questions include the following:
6) How many visits, and what type of visits, do program participants receive? 7) What are the components of usual care received by comparison group participants?
Impact Evaluation This report presents descriptive statistics, analysis of baseline equivalence, and analyses of impact across the study groups. All analyses were conducted based on an intention-to-treat approach. The unit of analysis is at the individual patient level. Impact measures are treated as continuous. Generalized regression analysis results are presented as the final results of the modeling sequence starting with bivariate models and ending with multiple regression models. These multiple regression models are adjusted for covariates and baseline impact measures identified as relevant via review of the scientific literature or were found non-equivalent at baseline. The possibility of effect modification of the intervention-outcome relationship by patients’ characteristics was also explored. Specifically, interaction terms of study group and baseline impact measures as well as age were included to understand whether there were differences in intervention effect by these characteristics. Stratified linear regression models were subsequently performed for any model that found statistically significant effect modification. Program implementation was assessed by reviewing collected measures at the pre-determined time points to identify any opportunities to improve implementation fidelity or need for statistical adjustments in impact analysis due to problems with implementation fidelity. Key Findings Evaluation of the implementation of TTBH’s program shows that the program was implemented in alignment with their program logic model and that there was strong fidelity in implementation. Findings from the implementation evaluation reveal there were several facilitators and challenges to implementation. Major facilitators to implementation and lessons learned from the program include: considering dedicated clinic space conducive to IBH services, employing a single electronic medical record (EMR) system for primary care and behavioral health data on which all staff are trained, communicating in multiple formats about the services and study to garner staff support and awareness,

Sí Texas Subgrantee: Tropical Texas Behavioral Health Program Title: Improving Access to Integrated Care for Rio Grande Valley Residents with Severe & Persistent Mental Illness
iv
identifying and addressing patient barriers to care quickly, and engaging staff across multiple levels to build support for being part of the research process. In addition, qualitative findings indicate TTBH is adapting its model to keep current with the regulatory landscape of the state of Texas. For the impact evaluation, the TTBH RCT utilized a robust design that produced strong internal validity. After 12 months in the program, intervention participants were more likely than control participants to see significant improvements in their blood pressure and HbA1c levels, when controlling for age, sex, and baseline measures. In addition to participants’ HbA1c levels having been reduced in the full study population, significant effect modification was detected. When the model for HbA1c was stratified by those with and without a baseline diagnosis of diabetes, the effect was mainly significant among those who had a diagnosis of diabetes at baseline. Additional stratified analyses were performed looking at HbA1c for participants 40 years of age or older and those under 40 years separately. These analyses showed that the effect on HbA1c was significant among those 40 years of age or older. The exploration of effect modification and subsequent stratified analyses provided further insight into the statistically significant intervention effect on HbA1c in that it was primarily driven by the effect among the older participants who had a diagnosis of diabetes at baseline. Given the strength of the study design, there is considerable evidence that the intervention contributed to the positive changes in health outcomes among participants, even though we did not see any statistically significant change in cholesterol, obesity, depression, or life function. Conclusion - Updates, Summary of Findings, Lessons Learned, and Next Steps The evaluation was implemented as intended except for a deviation to the original timeline. TTBH conducted enrollment on a rolling basis between November 2015 and June 2016. Six-month follow-up began in May 2016 and ended in January 2017. Twelve-month follow-up began in November 2016 and ended in June 2017. This timeline represents a slightly elongated timeline for enrollment and data collection than what was discussed in the SEP. A detailed timeline of the study can be found in Appendix A. TTBH did not have any changes to the budget or to their program team. This evaluation study achieves a moderate level of evidence given that an evidence-based intervention was adapted and evaluated using a study design with strong internal validity. This evaluation study uses an RCT design and has mitigated major threats to internal validity such as selection bias. The program was implemented to fidelity, and the evaluation was conducted as intended. The study also meets the criteria for effective evidence for the following reasons. The study demonstrates a positive, significant finding for a confirmatory outcome (systolic blood pressure) and a positive, significant finding for an exploratory outcome (HbA1c). The study showed that, when controlling for baseline measures and other covariates, the intervention participants had significantly greater improvements in the confirmatory outcome (reduced systolic blood pressure, β=-3.86, p=0.04) and an additional outcome identified in the logic model (reduced HbA1c, β=-0.36, p=0.001) at 12 months compared to the control participants, consistent with prior research. All statistically significant outcomes achieved small effect sizes (Cohen’s d > 0.2). There were no negative intervention effects on confirmatory or exploratory outcomes. Given the strong internal validity of this study, the fidelity to which the evaluation and program were implemented, the significant results, and the unique and important contribution to the field, this study achieves a moderate level of evidence to improve our understanding of the impact of a reverse co-location integrated care model. This evaluation contributes to our understanding of the impact of the integration of primary care services within a behavioral health service context on the health status of individuals with SPMI. To our knowledge, the TTBH Sí Texas evaluation is not only the first RCT for the institution, but also the first RCT

Sí Texas Subgrantee: Tropical Texas Behavioral Health Program Title: Improving Access to Integrated Care for Rio Grande Valley Residents with Severe & Persistent Mental Illness
v
examining reverse co-location integrated behavioral health care approach in a predominately Hispanic SPMI population. Lessons learned include: operational facilitators such as leadership support, strong communication, and training were critical for program implementation, while strong planning, data collection practices, and frequent communication with participants were important facilitators for implementing the evaluation. Looking ahead, there are challenges to program sustainability in the current policy and reimbursement environment. Fragmented funding for behavioral health can undermine the replication of integrated care programs, and there is a need to explore different revenue streams for services that are not currently reimbursable in the state of Texas. These findings are consistent with other studies (Meadows, 2016). As TTBH moves forward in its service implementation after the study, it is planning to continue the primary care model in its facility and is examining these findings and their operational plans to determine how to modify the model so that it is financially sustainable.

Sí Texas Subgrantee: Tropical Texas Behavioral Health Program Title: Improving Access to Integrated Care for Rio Grande Valley Residents with Severe & Persistent Mental Illness
1
INTRODUCTION This final report describes the methods and findings for the evaluation of the program, Improving Access to Integrated Care for Rio Grande Valley Residents with Severe & Persistent Mental Illness, at Tropical Texas Behavioral Health (TTBH), a subgrantee of the Social Innovation Fund (SIF) Grantee Methodist Healthcare Ministries (MHM) of South Texas, Inc. MHM is a member of the 2014 SIF cohort. The evaluation was conducted by the external evaluation contractor, Health Resources in Action (HRiA), at the TTBH clinic site in Brownsville. The intended audience of this report is the Social Innovation Fund, although excerpts will also be used by Methodist Healthcare Ministries program staff and leadership and internal leadership at TTBH.
Program Definition and Background Individuals with severe and persistent mental illness (SPMI)—including schizophrenia, psychotic disorders, and mood disorders such as major depression and bipolar disorders—are among the most vulnerable populations in the United States. Individuals with SPMI have a higher risk of premature death compared to individuals without SPMI (Brown, 1997; Harris & Barraclough, 1998; Saha, Chant, & McGrath, 2007). A review study on the lifespan of people with severe mental illness shows that individuals with SPMI die an average of one to ten years earlier than persons diagnosed with a “non-major” mental illness (De Hert et al., 2011). Studies attribute disparities in mortality rates among those with SPMI to a high prevalence of preventable conditions. These conditions include cardiovascular disease (Scott et al., 2013), diabetes and its complications, respiratory disease such as pneumonia or influenza (Chwastiak et al., 2014), and infectious diseases such as HIV/AIDS (De Hert et al., 2011). Tropical Texas Behavioral Health (TTBH) is the local mental health authority for the more than 1.2 million residents of Hidalgo, Cameron, and Willacy counties in Texas, a 3,100-square mile area along the Gulf-coast and South Texas border with Mexico. Nearly all residents in this region are of Hispanic ethnicity (95%) which is reflected in TTBH’s patient population. The SPMI population in the Rio Grande Valley (RGV) faces many challenges in obtaining primary care due in large part to the nature of their mental illness. Barriers to health care among persons with SPMI include lack of motivation, fearfulness, and social instability. The literature also indicates that SPMI individuals use a disproportionally high amount of emergency medical services (Galon & Graor, 2012). The lack of primary care services in the RGV exacerbates these disparities. The disparate impact of chronic physical illnesses in the general population of the RGV is compounded for those with SPMI due to an even greater likelihood of being poor and/or under-/uninsured, and the functional impairments caused by their mental illness. In the context of an increasingly fragmented behavioral and primary health care system, individuals with SPMI are in need of specialized support to access health care services. The TTBH Improving Access to Integrated Care for Rio Grande Valley Residents with Severe & Persistent Mental Illness initiative aimed to remove barriers between behavioral and primary care by implementing reverse co-location of these services supported by care coordination. Without effective intervention, it is likely SPMI individuals would not receive timely integrated care due to regional health care disparities, barriers to care due to the symptoms of their mental illness, the reluctance of many physicians to treat people with mental illness, and provider resource limitations. TTBH began implementing a reverse co-located integrated health care program model in November 2015. A reverse IBH model is one where primary care and preventive services are embedded within a behavioral health service setting. TTBH’s experimental model of IBH is delivered by a collaborative team

Sí Texas Subgrantee: Tropical Texas Behavioral Health Program Title: Improving Access to Integrated Care for Rio Grande Valley Residents with Severe & Persistent Mental Illness
2
of health care providers including a primary care physician, licensed vocational nurses, a registered dietician, a chronic care nurse, and medical support staff, and coordinated by care coordinators at TTBH’s Brownsville clinic. Each participant enrolled in TTBH’s intervention has an individualized care plan that may differ in terms of treatment and recommended services from other participants in the program. In addition to the collaborative health care team and behavioral health services, program participants are referred to specialists in the community as needed. TTBH’s electronic medical record system is integrated across behavioral and primary care services. Primary care and behavioral health teams meet periodically to discuss cases, share notes through the medical record, and refer patients as needed to primary care from behavioral health (and vice versa). Control group participants are seen at TTBH’s Brownsville clinic for behavioral health services, but they do not receive primary care services there. The program has not deviated from the program logic model as presented in the June 2016 SIF evaluation plan (SEP). A more detailed description of the program is discussed in the Program Components section on the following page. TTBH’s recruitment target was 182 participants in each of the two study groups (intervention group and control group at Brownsville) totaling 364 participants. TTBH’s program enrolled a total of 416 participants, including 249 in the intervention group and 167 participants in the control group.
Overview of Prior Research There is a preliminary level of evidence supporting the effectiveness of integrating primary care into outpatient behavioral health settings for improved patient health outcomes and cost effectiveness, although the evidence is more limited for the SPMI population. As such, TTBH’s program model was assessed as having an incoming preliminary level of evidence. The intervention aims to accomplish the key elements of the validated Wagner model for effective chronic illness care by adapting it to the SPMI population. The Wagner model features an organized delivery system linked with complementary community resources, sustained by productive interactions between multidisciplinary care teams and “activated” or educated patients and their families (Wagner, 1998). A 2001 study involving the integration of primary care services within a mental health clinic treating veterans with mental illness reported that “enrollment in a co-located, integrated clinic was associated with increased primary care use and improved attainment of some cardiovascular risk goals” (Druss et al., 2001). The study found that the veterans who received primary care services co-located within the mental health setting realized “significantly improved goal attainment for blood pressure, low-density lipoprotein cholesterol, triglycerides, and BMI” (Druss et al., 2001). For persons served in community mental health centers, research has indicated that care management delivered in an integrated primary care setting can result in sustainable improvements in physical health outcomes, patient and provider satisfaction, as well as potential cost savings to health care systems relative to care as usual (i.e., simple referral to a primary care provider) (Druss et al., 2001; Shackelford et al., 2013). Co-location and integration of primary care services within behavioral health settings improves access to routine primary care for persons with SPMI given that their “primary point of contact with the health care system is through public-sector mental health programs rather than primary medical care” (Druss et al., 2001). Co-location also reduces the cost and inconvenience of traveling to multiple locations in order to receive behavioral and physical healthcare (Boardman, 2006; Druss et al., 2001; Shackelford et al., 2013).
Sí Texas Subgrantee: Tropical Texas Behavioral Health Program Title: Improving Access to Integrated Care for Rio Grande Valley Residents with Severe & Persistent Mental Illness
3
Program Components TTBH’s program theory of change is that integrated primary care services, delivered to adult clients with SPMI and co-morbid chronic illness, from a clinic co-located within the outpatient behavioral health clinic where they receive community-based behavioral health services, will lead to improved physical and mental health for an increasing proportion of clients served. The logic model in Appendix B visually diagrams the inputs, activities, outputs, and outcomes for the TTBH program, while these elements are discussed in the narrative below. The activities of the TTBH approach mirror those elements present in the Wagner model (1998) that have been linked to improved health outcomes in the evidence base. Inputs: The TTBH logic model has six inputs which include:
• Collaborative treatment team: TTBH has assembled a collaborative team of providers with expertise across primary care and patient education.
• Behavioral health staff: TTBH has an experienced team of behavioral health providers, including psychiatrists, counselors, social workers, and behavioral health specialists.
• Care coordinators: The role of the care coordinator is to coordinate and monitor patient health, as well as improve preventative care through health promotion and risk reduction training.
• Dieticians: TTBH has a health promotion program focused on healthy eating that is run by dieticians.
• Electronic medical records: TTBH has a robust electronic health record system with data entry and analytic capabilities.
• Community specialty care: TTBH has relationships in the community with providers of specialty care, including specialists in pain management, physical therapy, ophthalmology, gastroenterology and others.
Activities: The activities section of the logic model provides an overview of TTBH programmatic activities at the individual, provider, clinic, and health system levels.
• Individual Level: Care plans are tailored and revised to individual participant needs.
• Provider Level: Licensed behavioral health professionals screen for the need for primary care during the behavioral health intake or update assessment.
• Operational Level: The clinic workflow, which includes behavioral health staff interviewing patients and determining the level of care needed by the patient (e.g., primary care and/or behavioral health), emphasizes integration and increased communication/collaboration between providers at TTBH and in the community.
• Health System Level: Patient data are monitored and tracked through streamlined electronic medical record.
Outputs: In the course of program activities being fulfilled, outputs that were expected include:
• Recruit 182 participants into each arm of the study
• Written patient care plans that cross primary and behavioral health care service boundaries
• Coordinated primary and behavioral health services
• Scheduling of follow-up appointments for primary and behavioral health
• Provider collaboration and communication about patients receiving both primary and behavioral health care services
Short-Term Outcomes: Short-term outcomes are the changes that are expected to occur after 6 months of the participant’s enrollment in TTBH’s program model. In the course of enrollment, patients are expected to improve knowledge of self-management and disease prevention. Through participation, it is

Sí Texas Subgrantee: Tropical Texas Behavioral Health Program Title: Improving Access to Integrated Care for Rio Grande Valley Residents with Severe & Persistent Mental Illness
4
also expected that patients will progressively improve their habits, become more self-actualized, and thereby establish habits, routines, and schedules for healthy living. The expected short-term outcomes are outlined below. These are assessed qualitatively in the study via focus groups and interviews.
• Individual Level: improved patient knowledge; adherence to therapy
• Provider Level: improved communication across providers; awareness of IBH best care practices
• Operational Level: closer collaboration between providers; workflow alignment across primary and behavioral health
• Health System Level: higher degree of fidelity with program model; policy and procedural alignment
Intermediate Outcomes: Intermediate outcomes are the changes that are expected to occur after 12 months of the participant’s enrollment in program. Intermediate outcome goals are outlined below. All intermediate outcomes were measured and reported on during the study.
• Risk factor reduction through lifestyle modification and clinical intervention
• Reduced systolic blood pressure, body mass index, cholesterol, plasma glucose, or depressive symptoms
• Increased control of blood pressure, body mass, cholesterol, or plasma glucose; reduced depression
• Increased functioning and quality of life Long-Term Impact: Long-term outcomes are the changes that are expected to occur after 18 months of the participant’s enrollment and are beyond the scope of the planned intervention and evaluation. Long-term outcomes are outlined below. Long-term measures were not collected in the study or reported on in the final report due to the 12-month study timeline. This is a change from the SEP which stated that these outcomes would be reported during the study.
• Reduced morbidity and mortality due to chronic health conditions among individuals with SPMI
• Reduced chronic disease health disparities among individuals with SPMI living in the RGV
Overview of Impact Study TTBH conducted a randomized control trial (RCT) with two groups. The study is targeting a moderate level of evidence based on work supporting the benefit of integrated behavioral health among the SPMI population. Prior evidence includes randomized control trials (RCTs) by Druss et al. (2010; 2011) and the Boardman (2006) quasi-experimental design (QED) study, which found positive results of integrating primary care into the behavioral health setting. The RCT design of the current study provides strong rigor to support moderate level of evidence resulting from the study. TTBH selected an RCT design because its organization had the experience and operational workflows to randomly assign patients into intervention and comparison groups with minimal contamination—making implementation of a randomized control trial feasible. The study will expand the level of evidence related to co-located integrated care models, assess its program efficacy, and generate moderate evidence for the IBH model. Research Questions TTBH’s SEP included both implementation and impact research questions, as stated below. These questions have not changed since the approval of the SEP.

Sí Texas Subgrantee: Tropical Texas Behavioral Health Program Title: Improving Access to Integrated Care for Rio Grande Valley Residents with Severe & Persistent Mental Illness
5
Implementation Questions The following evaluation questions examined program implementation as presented in the SEP. The final implementation evaluation included focus groups as well as interviews and assessment of quantitative implementation data.
1. Did the TTBH program reach its intended target population? 2. What are the components of TTBH’s reverse co-location program and how do these
components work “on the ground” at 6 and 12 months? a. Are these components different than what was planned, and why are they different?
3. What level of Integrated Behavioral Health did TTBH achieve as a result of implementing the reverse co-location program?
a. To what extent have providers and program staff adopted the components of TTBH’s reverse co-location program at 6 and 12 months? What are the facilitators and barriers to adoption?
b. b. To what extent do providers and staff buy in to the program, and how has buy in affected implementation?
4. To what extent did the comparison groups receive program-like components? 5. To what extent did the TTBH implement the reverse co-location model with fidelity? 6. How many visits, and what type of visits, do program participants receive? 7. What are the components of usual care received by comparison group participants?
Impact Questions The primary impact measure for the TTBH intervention was blood pressure. Below are the confirmatory and exploratory research questions as presented in the SEP. This final report presents findings labeled by Impact Question.
1) Are SPMI patients who receive coordinated co-located services more likely to reduce their blood pressure after 12 months compared to SPMI patients who receive only behavioral health care services? This question is confirmatory.
2) Are SPMI patients with a history or diagnosis of diabetes who receive coordinated co-located services more likely to reduce their HbA1c level after 12 months compared to SPMI patients who receive only behavioral health care services? This question is exploratory.
3) Are SPMI patients who receive coordinated co-located services more likely to reduce their BMI after 12 months compared to patients who receive only behavioral health care services? This question is exploratory.
4) Are SPMI patients with hypercholesterolemia who receive coordinated co-located services more likely to reduce their total cholesterol after 12 months compared to SPMI patients with hypercholesterolemia who receive only behavioral health care services? This question is exploratory.
5) Are SPMI patients who receive coordinated co-located services more likely to reduce their depressive symptoms, as measured by the PHQ-9, after 12 months compared to SPMI patients who receive only behavioral health care services? This question is exploratory.
6) Are SPMI patients who receive coordinated co-located services more likely to improve their functioning and quality of life, as measured by improvement in 1 or more of the functioning domains assessed by the ANSA, after 12 months compared to SPMI patients who receive only behavioral health care services? This question is exploratory.

Sí Texas Subgrantee: Tropical Texas Behavioral Health Program Title: Improving Access to Integrated Care for Rio Grande Valley Residents with Severe & Persistent Mental Illness
6
Contribution of the Study This evaluation contributes to our understanding of the impact of the integration of primary care services within a behavioral health service context on the health status of individuals with SPMI. Prior evidence for this intervention includes RCTs by Druss et al. (2010; 2011) and the Boardman (2006) QED study, which found positive results of integrating primary care into the behavioral health setting. This study builds on this previous work by examining the impact of a reverse co-location model with an SPMI population and particularly among a population that is predominantly Hispanic and low-income, which is also a gap in the literature. This evaluation study achieves a moderate level of evidence given that an evidence-based intervention was adapted and was evaluated using a method with strong internal validity. This evaluation study uses an RCT design and has mitigated major threats to internal validity. The program was implemented to fidelity, and the evaluation was conducted as intended. As discussed in the Impact Study section of this report, positive significant results were identified among the confirmatory outcome (systolic blood pressure) and an additional outcome identified in the logic model (HbA1c). The study meets the criteria for effective evidence because it (1) demonstrates a positive, significant finding for a confirmatory outcome (systolic blood pressure) and a positive, significant finding for an exploratory outcome (HbA1c); 2) there were no negative intervention effects on confirmatory or exploratory outcomes; and 3) the confirmatory outcome systolic blood pressure achieved a small effect size of 0.22 (using Cohen’s d). Therefore, this study and its related findings are compelling and contribute to the field in our understanding of the impact of a reverse co-location model.
SIF Evaluation Plan Updates The TTBH SEP included a primary study, the RCT, and a secondary companion study of a QED using a comparison group from a nearby clinic in case randomization was not successful in the RCT. Given that randomization was successful in the RCT, the QED companion study was eliminated, and its methods and findings are not presented in this report. At the time of the interim report review, SIF requested a modified SEP in the event the companion study was dropped. However, by the time the companion study was eliminated, SIF had ceased reviewing any additional SEP modifications. Therefore, a SEP modification was not submitted.

Sí Texas Subgrantee: Tropical Texas Behavioral Health Program Title: Improving Access to Integrated Care for Rio Grande Valley Residents with Severe & Persistent Mental Illness
7
IMPLEMENTATION STUDY: STUDY APPROACH, METHODS, AND FINDINGS
Implementation Study Design The implementation study aimed to understand how TTBH’s program was implemented. As described in the SEP, two main methods were used: 1) qualitative data collection via key informant interviews and focus groups, and 2) analysis of quantitative implementation data (e.g., patient visits, administrative data). Qualitative Data Collection Methods and Analysis The program’s evaluator, Health Resources in Action (HRiA), conducted qualitative data collection at two time points for the implementation study. Across the two time points, a total of 30 staff members were interviewed, and 51 participants were involved in focus groups. For the mid-point interviews (October-December 2016), a total of 17 staff interviews were conducted by telephone. Mid-point interviews were intended to be conducted approximately 6 months after initial study enrollment. Given logistics challenges, these interviews instead were conducted approximately 10 months after initial study enrollment, a deviation from the SEP. After the study concluded, 10 interviews with 13 individuals were conducted (in late November 2017, approximately 4 months after the study ended). Interview participants included clinical providers (both primary and behavioral care) and other relevant clinical and nonclinical personnel. Personnel involved in the interviews represented a range of positions, ranging from a case manager to a medical director. The goal of the interviews was to assess program fidelity and understand in greater depth the context, facilitators, and challenges to program implementation. Program fidelity was assessed with clinic personnel interviewees by asking questions about program implementation from a clinical staff, program and organizational level:
• Clinical staff level: The implementation evaluation measures programmatic implementation including clinical staff perceptions, attitudes, and perceived barriers in care delivery for the target population. Clinical staff members were asked about their perceptions regarding the degree to which integration of primary care and behavioral health services has or has not been achieved at the mid- and end-point of the program, and their engagement with each other and aspects of the program.
• Program and organizational level: Interviews were conducted with program managers and staff to obtain information about the operational level workflow and adherence to the original design of the program, and facilitators and barriers to implementation.
The interviews also aimed to capture information on clinical and administrative staff members’ perceptions of barriers and facilitators to the program adoption, perceptions of program successes, challenges, and opportunities for improvement, and perceived staff and patient satisfaction. Staff members were asked about their experiences with the program and perceptions of patient satisfaction both with the process of participating in the program as well as the outcomes. Appendix C and Appendix D presents the semi-structured interview guides used to conduct the interviews at the mid-point and final data collection periods.

Sí Texas Subgrantee: Tropical Texas Behavioral Health Program Title: Improving Access to Integrated Care for Rio Grande Valley Residents with Severe & Persistent Mental Illness
8
In addition to these semi-structured interviews, HRiA conducted four focus groups – two focus groups with intervention participants and family members and one focus group with control participants and family members – after study implementation concluded (in late November 2017, approximately 4 months after the study ended). One focus group was also conducted with comparison participants from the companion QED study, however findings are not included in this report since that study was only implemented in case randomization was not successful in the RCT. The goal of the focus groups was to better understand the influence the program has had on participant’s health and wellbeing. Appendix E presents the semi-structured focus group guide used to conduct the focus groups at the final data collection period. Appendix F presents all implementation program components/activities, outputs, and outcomes that were measured using the qualitative data collection. There were 40 focus group participants in the three focus groups. On average, there were approximately 7 patients and 6 caregivers per group. Table 1 describes participant demographics for the two intervention focus groups and the Brownsville control group (n=40). All participants resided in Cameron County. The majority of participants were female (55.0%) and between the ages of 35 and 54 (47.5%). All participants were Hispanic or Latino, and White. Most participants spoke Spanish as their primary language (57.5%), had less than a high school diploma (59.0%), and did not have health insurance (50.0%). Table 1. TTBH Pre-Focus Group Demographics Survey
TTBH (n=40)
Measure n %
County
Cameron 40 100.0 Missing -- --
Sex
Male 18 45.0 Female 22 55.0 Missing -- --
Age
≤ 34 9 22.5 35-44 10 25.0 45-54 9 22.5 55-64 9 22.5 65+ 3 7.5 Missing -- --
Ethnicity
Hispanic/Latino 40 100.0 Non-Hispanic/Non-Latino 0 0.0 Missing -- --
Race
White (Caucasian) 40 100.0 Missing -- --
Primary Language
Sí Texas Subgrantee: Tropical Texas Behavioral Health Program Title: Improving Access to Integrated Care for Rio Grande Valley Residents with Severe & Persistent Mental Illness
9
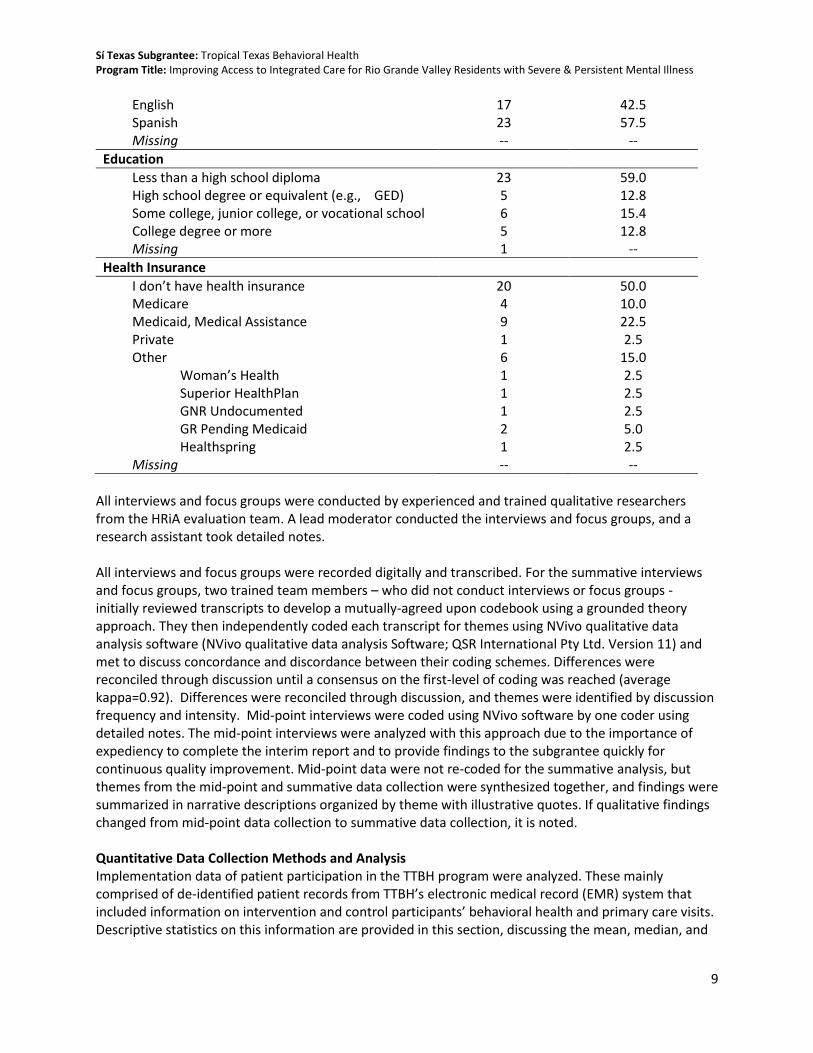
English 17 42.5 Spanish 23 57.5 Missing -- --
Education
Less than a high school diploma 23 59.0 High school degree or equivalent (e.g., GED) 5 12.8 Some college, junior college, or vocational school 6 15.4 College degree or more 5 12.8 Missing 1 --
Health Insurance
I don’t have health insurance 20 50.0 Medicare 4 10.0 Medicaid, Medical Assistance 9 22.5 Private 1 2.5 Other 6 15.0
Woman’s Health 1 2.5 Superior HealthPlan 1 2.5 GNR Undocumented 1 2.5 GR Pending Medicaid 2 5.0 Healthspring 1 2.5
Missing -- --
All interviews and focus groups were conducted by experienced and trained qualitative researchers from the HRiA evaluation team. A lead moderator conducted the interviews and focus groups, and a research assistant took detailed notes. All interviews and focus groups were recorded digitally and transcribed. For the summative interviews and focus groups, two trained team members – who did not conduct interviews or focus groups - initially reviewed transcripts to develop a mutually-agreed upon codebook using a grounded theory approach. They then independently coded each transcript for themes using NVivo qualitative data analysis software (NVivo qualitative data analysis Software; QSR International Pty Ltd. Version 11) and met to discuss concordance and discordance between their coding schemes. Differences were reconciled through discussion until a consensus on the first-level of coding was reached (average kappa=0.92). Differences were reconciled through discussion, and themes were identified by discussion frequency and intensity. Mid-point interviews were coded using NVivo software by one coder using detailed notes. The mid-point interviews were analyzed with this approach due to the importance of expediency to complete the interim report and to provide findings to the subgrantee quickly for continuous quality improvement. Mid-point data were not re-coded for the summative analysis, but themes from the mid-point and summative data collection were synthesized together, and findings were summarized in narrative descriptions organized by theme with illustrative quotes. If qualitative findings changed from mid-point data collection to summative data collection, it is noted. Quantitative Data Collection Methods and Analysis Implementation data of patient participation in the TTBH program were analyzed. These mainly comprised of de-identified patient records from TTBH’s electronic medical record (EMR) system that included information on intervention and control participants’ behavioral health and primary care visits. Descriptive statistics on this information are provided in this section, discussing the mean, median, and

Sí Texas Subgrantee: Tropical Texas Behavioral Health Program Title: Improving Access to Integrated Care for Rio Grande Valley Residents with Severe & Persistent Mental Illness
10
range of number of completed and missed visits related to behavioral health and primary care for both groups. This information provides insight into fidelity and dose of the intervention.
Implementation Study Findings
The following section discusses the implementation study findings by research question as presented in the SEP. Question 1. Did the TTBH program reach its intended target population? All of the TTBH study participants met the eligibility criteria for the study. TTBH’s potential participants were asked a series of eligibility questions to determine if they met the program’s target population. In order to qualify, participants had to meet the following criteria:
• Reside in Cameron, Hidalgo, or Willacy County
• Have a severe, persistent mental illness as diagnosed by a licensed behavioral health care provider
• Be eligible to receive behavioral health services from TTBH
• Must not be receiving any primary care outside of TTBH (as ascertained via patient self-report)
• Have a diagnosis of one or more chronic conditions: o Hypertension (blood pressure of 140/90 mmHg or higher) o Obesity (body mass index of 30.0 or higher) o Poorly controlled diabetes (HbA1c over 8.5%) o Hypercholesterolemia (Total cholesterol level above 200)
Aggregate demographic data were provided by TTBH to explore whether the study population at baseline was representative of those who met the study eligibility criteria within the total population at the Brownsville clinic. The study population was representative of the overall Brownsville clinic population with a couple of exceptions as noted in Table 2 below. Participants enrolled in the study were more likely to be from Cameron County and had less representation of Hidalgo County than the total clinic population. There was a statistically significant difference between the SPMI diagnoses of study participants at baseline and the diagnoses among the total Brownsville clinic population. Table 2. Comparison of Study Participants and Clinic-Wide Demographics
Brownsville Clinic
(n=502) Sí Texas Study
(n=416)
p-value
Measure N % N %
Sex
Male 223 44.4 186 44.7 0.93 Female 279 55.6 230 55.3
Missing -- -- -- --
Race
White 463 92.2 389 93.5
0.54 Other 30 6.0 23 5.5 Unknown 9 1.8 4 1.0 Missing -- -- -- --

Sí Texas Subgrantee: Tropical Texas Behavioral Health Program Title: Improving Access to Integrated Care for Rio Grande Valley Residents with Severe & Persistent Mental Illness
11
Brownsville Clinic
(n=502) Sí Texas Study
(n=416)
p-value
Measure N % N %
Ethnicity
Hispanic 477 95.0 385 92.6 0.12 Non-Hispanic 25 5.0 31 7.5
Missing -- -- -- --
Age
Mean 40.7 -- 40.9 -- 0.89
(SD) 12.8 -- 12.9 -- 18-24 60 12.0 48 11.5
0.99
25-34 113 22.5 94 22.6 35-44 137 27.3 112 26.9 45-54 113 22.5 95 22.8 55-64 66 13.2 54 13.0 65+ 13 2.6 13 3.1 Missing -- -- -- --
Education
Below High School 94 19.3 77 19.1
0.91
Some High School 183 333 158 39.1 GED/HS Grad/Some College 172 34.3 141 34.9 Associates/Bachelor Degree 26 5.2 23 5.7 Special Education 11 2.2 5 1.2 Missing 16 -- 12 --
Primary Languagea
English 355 70.9 284 68.4 0.72 Spanish 146 31.1 131 31.6
Missing 1 -- 1 --
County of Residencea
Cameron County 404 80.5 410 98.6 <0.001 Hidalgo County 98 19.5 6 1.4
Missing -- -- -- --
SPMI Diagnosis
Bipolar Disorder 149 29.7 129 31.2
0.01
Major Depression 225 44.8 191 46.1 Schizophrenia 98 19.5 81 19.5 Schizophrenia and Major Depression 15 3.0 15 3.6 Other 15 3.0 0 -- Missing -- -- -- -- Note: Bold denotes statistical significance of p-value < 0.05 aFisher’s Exact test was used due to cells having expected count less than 5
TTBH reached its intended target population as presented below in Table 3 which describes the demographic characteristics and diagnosis of severe, persistent mental illness and is also presented in the Impact Study section. Baseline health outcomes are also presented in the Impact Study section. In summary, the majority of participants in both the intervention and control groups lived almost

Sí Texas Subgrantee: Tropical Texas Behavioral Health Program Title: Improving Access to Integrated Care for Rio Grande Valley Residents with Severe & Persistent Mental Illness
12
exclusively in Cameron County. Each participant was reported as having one of the qualifying SPMI diagnoses: major depression, bipolar disorder, schizophrenia, or a dual diagnosis of schizophrenia and major depression. Significance testing to examine baseline equivalence indicates that the intervention and control group participants are not statistically significantly different in their demographic characteristics. Table 3. Participant Descriptives
Full Sample
(n=416) Brownsville Intervention
(n=249)
Brownsville Control (n=167)
p-value
Measure N % N % N %
Sex
Male 186 44.7 112 45.0 74 44.3 0.89 Female 230 55.3 137 55.0 93 55.7
Missing -- -- -- -- -- --
Racea
White 389 93.5 231 92.8 158 94.6
0.35
Native Hawaiian/Pacific Islander
1 0.2 0 0.0 1 0.6
Other 22 5.3 16 6.4 6 3.6 Unknown 4 1.0 2 0.8 2 1.2 Missing -- -- -- -- -- --
Ethnicity
Hispanic 385 92.5 226 90.8 159 95.2
0.21 White 13 3.1 9 3.6 4 2.4 Non-Hispanic 18 4.3 14 5.6 4 2.4 Missing -- -- -- -- -- --
Age
Mean 40.9 -- 41.0 -- 40.7 -- 0.82
(SD) (12.9) -- (12.5) -- (13.4) -- 18-24 48 11.5 30 12.0 18 10.8
0.27
25-34 94 22.6 49 19.7 45 26.9 35-44 112 26.9 69 27.7 43 25.7 45-54 95 22.8 61 24.5 34 20.4 55-64 54 13.0 35 14.1 19 11.4 65+ 13 3.1 5 2.0 8 4.8 Missing -- -- -- -- -- --
Educationa
Below High School 77 19.1 41 16.9 36 22.2
0.53
Some High School 158 39.1 100 41.3 58 35.8 GED/HS Grad/Some College 141 34.9 86 35.5 55 34.0 Associates/Bachelor Degree 23 5.7 13 5.4 10 6.2 Special Education 5 1.2 2 0.8 3 1.9 Missing 12 -- 7 -- 5 --
Employment Status
No Evidence of Problems 52 12.5 32 12.9 20 12.0

Sí Texas Subgrantee: Tropical Texas Behavioral Health Program Title: Improving Access to Integrated Care for Rio Grande Valley Residents with Severe & Persistent Mental Illness
13
Full Sample
(n=416) Brownsville Intervention
(n=249)
Brownsville Control (n=167)
p-value
Measure N % N % N % History of Problems, Mild 11 2.7 6 2.4 5 3.0 0.58
Moderate Problems 14 3.4 11 4.4 3 1.8 Severe Problems 243 58.6 146 58.9 97 58.1 N/A 95 22.9 53 21.4 42 25.1 Missing 1 -- 1 -- -- --
Primary Languagea
English 284 68.4 173 69.8 111 66.5 0.71 Spanish 131 31.6 75 30.2 56 33.5
Missing 1 -- 1 -- -- --
County of Residencea
Cameron County 410 98.6 245 98.4 165 98.8 0.99
Hidalgo County 6 1.4 4 1.6 2 1.2 Missing -- -- -- -- -- --
SPMI Diagnosis
Bipolar Disorder 129 31.0 78 31.3 51 30.5
0.30
Major Depression 191 45.9 112 45.0 79 47.3 Schizophrenia 81 19.5 53 21.3 28 16.8 Schizophrenia and Major Depression
15 3.6 6 2.4 9 5.4
Missing -- -- -- -- -- -- aFisher’s Exact test was used due to cells having expected count less than 5
Question 2. What are the components of TTBH’s reverse co-location program and how do these components work “on the ground” at 6 and 12 months? Question 2a. Are these components different than what was planned, and why are they different? TTBH program is a reverse co-location model. Its specific components are described in the logic model in Appendix B and in the Program Definition section. In summary, a reverse co-location model is one where primary care and preventive services are embedded within a behavioral health service setting. TTBH’s experimental model is delivered by a collaborative team of health care providers including a primary care physician, licensed vocational nurses, a registered dietician, a chronic care nurse, and medical support staff, and coordinated by care coordinators at TTBH’s Brownsville clinic. Each participant enrolled in TTBH’s intervention has an individualized care plan that may differ in terms of treatment and recommended services from other participants in the program. In addition to the collaborative health care team and behavioral health services, program participants are referred to specialists in the community as needed. TTBH’s electronic medical record system is integrated across behavioral and primary care services. Primary care and behavioral health teams meet periodically to discuss cases, share notes through the medical record, and refer patients as needed to primary care from behavioral health (and vice versa). The co-location program is reliant on enhanced communication, data systems, and workflow for it to be successful.

Sí Texas Subgrantee: Tropical Texas Behavioral Health Program Title: Improving Access to Integrated Care for Rio Grande Valley Residents with Severe & Persistent Mental Illness
14
How Components Work “On the Ground” Interviews explored how the program was implemented. When asked about how behavioral health and primary care services were coordinated and connected, interview participants highlighted communication practices, workflows, data systems, and the clinic space as the key components of TTBH’s integrated model. These were also mentioned at the mid-point, with the addition of staffing to support integration. Specifically, the addition of a full-time primary care clinical staff person at the Brownsville clinic was viewed by mid-point interviewees as making a difference in implementation of the program and in improving communication between patients and behavioral health clinical staff. Clinic or Physical Space for Co-Location According to interview and focus group participants, the physical integration of the IBH program was accomplished by the existing co-location of the primary and behavioral health clinics. As one clinical staff interviewee described, “We’re connected. The buildings are connected to each other. If there’s a problem that I’m seeing with a patient, then I’ll go talk to one of the doctors. We’re all in the same space.” Given TTBH’s SPMI patient population and perceived barriers to accessing care outside of TTBH, having co-located services has been central to providing integrated, comprehensive care, according to both interviewees and focus group participants. Communication According to interviewees, communication was the core component of TTBH’s integration strategy. Both in-person and electronic communication strategies were mentioned as essential components of clinic integration. Weekly integrated workgroup meetings, monthly leadership meetings, and clinical staffing between behavioral health and primary care clinical personnel were noted as key facilitators that improved interdisciplinary interaction and collaboration. These meetings, explained interviewees, allowed the two disciplines space and time to discuss patients as well as the clinic’s integrated systems. Additionally, group texts, emails, and instant messages were noted as helping staff from both disciplines connect about patient visits, medications, and care plans. “Overall, I think there’s very good communication,” said one clinical staff interviewee. “I know that I personally feel very comfortable in being able to approach the staff. Everyone’s very accessible.” Data Systems In addition to communication practices discussed above, the primary form of electronic communication for TTBH’s IBH model was its data system. Interview participants noted that, as part of its integration efforts, TTBH updated its electronic medical record (EMR) to better integrate physical and behavioral health data. For example, interviewees described how the EMR allows for programming of alerts to notify clinical staff if a patient comes into the clinic. As a result, “They started to really use the integrated record, and they started to really talk to each other and understand that they could communicate with each other twenty-four hours a day if they needed to,” summarized one administrative staff interviewee. According to interviewees, this access to data and other providers helped improve integration and coordination of care. One clinical staff interviewee shared how patients could then have multiple appointments scheduled during the same visit: “When we open a client’s profile we can see when they’re coming, when they’ve been there to behavioral, so we can work along with them [behavioral health clinical staff].” Workflow Workflow, or how patients and clinical staff move within the clinical space, was seen as a key component of integration and closely tied to TTBH’s communication practices. In terms of patient

Sí Texas Subgrantee: Tropical Texas Behavioral Health Program Title: Improving Access to Integrated Care for Rio Grande Valley Residents with Severe & Persistent Mental Illness
15
workflow, interview and focus group participants perceived the number of warm hand-offs had increased due to the enhanced clinic communication. As one focus group participant noted, “They come and they take you [to the appointment] and they take you back.” From the clinical staff perspective, clinical operations adapted in order to implement the IBH model. Interviewees described how workflows were modified for new data collection and referral needs and to enhance clinical staff communication. For example, an administrative staff interviewee shared, “We put alerts in [the EMR] and they’ll reroute and say, ‘I’ve got a client that you’ll want to see,’ and then they’ll come get him or we’ll bring him over. I think that interaction is really good.” Implementation as Planned Except for some staff turnover and delays in hiring, the TTBH program was implemented as planned. According to interviewees during the mid-point and summative evaluations, TTBH implemented their IBH program with strong fidelity. Summarizing, an administrative staff interviewee said, “I would say the integration of care has been at a pretty high level.” Participants during the mid-point interviews described early challenges related to staffing such as being unable to fill the vacant Primary Care Director position for the first 6 months of the study, as well as numerous other staff (e.g. care coordinators, advanced nurse practitioner) who left TTBH or moved to another internal position during the Sí Texas program; yet these challenges were seen as having small effects on the model’s overall fidelity. Interviewees shared how administrative staff worked diligently to facilitate communication systems, workflows, and data systems to support integration. Question 3. What level of Integrated Behavioral Health did TTBH achieve as a result of implementing the reverse co-location program? Question 3a. To what extent have providers and program staff adopted the components of TTBH’s reverse co-location program at 6 and 12 months? What are the facilitators and barriers to adoption? Implementation of Integrated Behavioral Health According to the World Health Organization (2008), behavioral health integration encompasses the management and delivery of health services so that individuals receive a continuum of preventive and restorative mental health and addiction services, according to their needs over time, and across different levels of the health system. Quality integrated care requires a well-functioning, well-organized primary care practice as well as key behaviors at the organizational, practice, interpersonal, and individual clinician levels (Cohen et al. 2015). There are many ways to assess how components of IBH are practiced in different settings. The Advancing Integrated Mental Health Solutions (AIMS) IBH checklist was developed by IBH experts to assess five core principles of collaborative care. These principles include: (1) patient-centered care, (2) population-based care, (3) measurement-based treatment to target, (4) evidence-based care, and (5) accountable care. The checklist details core components and tasks for each of these principles that are self-assessed on a scale of “None,” “Some,” or “Most/all.” Appendix I presents the core descriptions of the Patient-Centered Integrated Behavioral Health Care Principles and Tasks Checklist as defined by the AIMS Center, 2011. TTBH completed the AIMS IBH checklist in November 2015 and completed the assessment was again in March 2018. Table 4 and Table 5 present the data from TTBH’s completed March 2018 self-assessment from the AIMS IBH checklist. Results were the same at both time points except for the items asking about a population-based registry, where TTBH selected “most/all” at baseline and “none” at follow-up.

Sí Texas Subgrantee: Tropical Texas Behavioral Health Program Title: Improving Access to Integrated Care for Rio Grande Valley Residents with Severe & Persistent Mental Illness
16
This was not the result of practice changes, but of misinterpretation of the question at baseline. TTBH had never instituted a population-based registry given that TTBH’s EMR is not designed to track community-based referrals, and they do not have the capacity to do so in the clinic. Of the five core principles, TTBH applies three of them (patient-centered care, measurement-based treatment to target, and evidence-based care) to most or all their patients. In addition to the population-based care principle not applying to TTBH, TTBH also indicated “none” on the accountable care principle of the checklist, given that TTBH receives primarily Medicaid-based funds and that determines the reimbursement structure in their clinic. TTBH implements the majority of tasks under each of the seven core components to most or all of their patients (76%). Two tasks having to do with population-based registries and tracking are not applied to their population (8%). Table 4. TTBH IBH Checklist at 12-Months: Core Principles
We apply this principle in the care of (none, some, most/all) of our patients.
None Some Most/All
Patient-Centered Care Primary care and behavioral health providers collaborate effectively using shared care plans.
X
Population-Based Care Care team shares a defined group of patients tracked in a registry. Practices track and reach out to patients who are not improving and mental health specialists provide caseload-focused consultation, not just ad-hoc advice.
X
Measurement-Based Treatment to Target Each patient’s treatment plan clearly articulates personal goals and clinical outcomes that are routinely measured. Treatments are adjusted if patients are not improving as expected.
X
Evidence-Based Care Patients are offered treatments for which there is credible research evidence to support their efficacy in treating the target condition.
X
Accountable Care Providers are accountable and reimbursed for quality care and outcomes.
X
Table 5. TTBH IBH Checklist at 12-Months: Core Components and Tasks
We apply this principle in the care of (none, some, most/all) our patients.
None Some Most/All
Patient Identification and Diagnosis
Screen for behavioral health problems using valid instruments
X
Diagnose behavioral health problems and related conditions
X
Use valid measurement tools to assess and document baseline symptom severity
X

Sí Texas Subgrantee: Tropical Texas Behavioral Health Program Title: Improving Access to Integrated Care for Rio Grande Valley Residents with Severe & Persistent Mental Illness
17
We apply this principle in the care of (none, some, most/all) our patients.
None Some Most/All
Engagement in Integrated Care Program
Introduce collaborative care team and engage patient in integrated care program
X
Initiate patient tracking in population-based registry X
Evidence-Based Treatment
Develop and regularly update a biopsychosocial treatment plan
X
Provide patient and family education about symptoms, treatments, and self-management skills
X
Provide evidence-based counseling (e.g., Motivational Interviewing, Behavioral Activation)
X
Provide evidence-based psychotherapy (e.g., Problem Solving Treatment, Cognitive Behavior Therapy, Interpersonal Therapy)
X
Prescribe and manage psychotropic medications as clinically indicated
X
Change or adjust treatments if patients do not meet treatment targets
X
Systematic Follow-up, Treatment Adjustment, and Relapse Prevention
Use population-based registry to systematically follow all patients
X
Proactively reach out to patients who do not follow-up
X
Monitor treatment response at each contact with valid outcome measures
X
Monitor treatment side effects and complications X
Identify patients who are not improving to target them for psychiatric consultation and treatment adjustment
X
Create and support relapse prevention plan when patients are substantially improved
X
Communication and Care Coordination
Coordinate and facilitate effective communication among providers
X
Engage and support family and significant others as clinically appropriate
X
Facilitate and track referrals to specialty care, social services, and community-based resources
X
Systematic Psychiatric Case Review and Consultation
Conduct regular (e.g., weekly) psychiatric caseload review on patients who are not improving
X
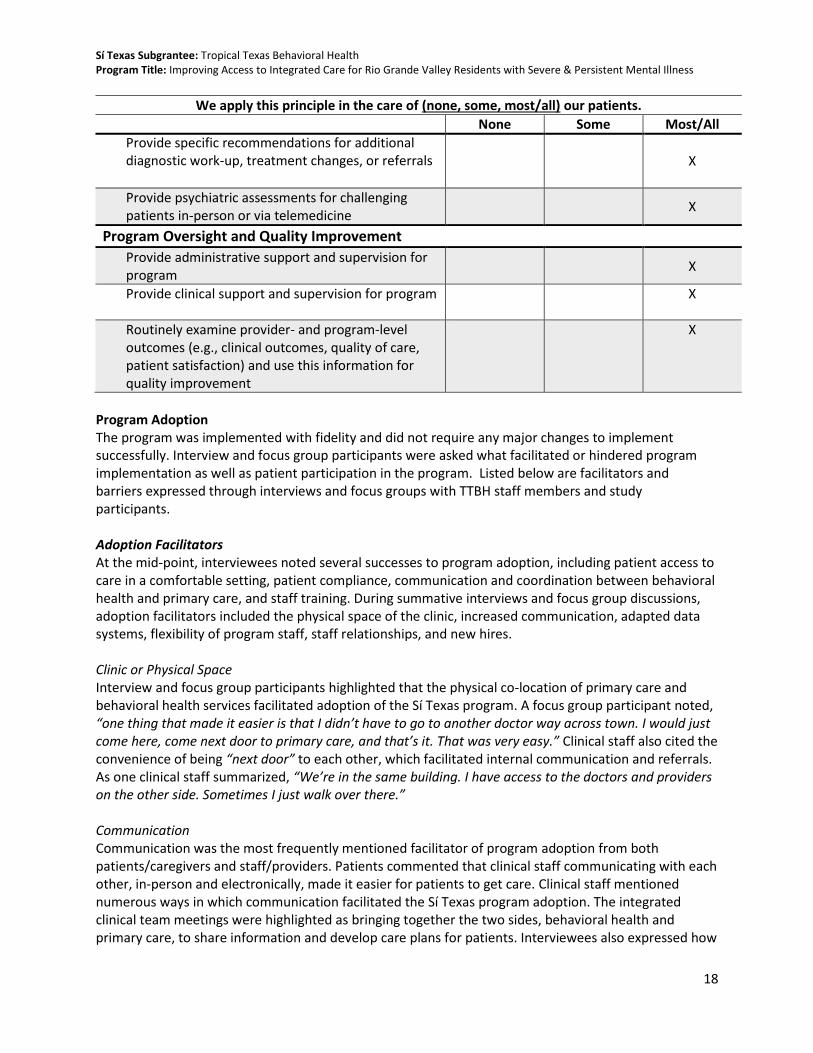
Sí Texas Subgrantee: Tropical Texas Behavioral Health Program Title: Improving Access to Integrated Care for Rio Grande Valley Residents with Severe & Persistent Mental Illness
18
We apply this principle in the care of (none, some, most/all) our patients.
None Some Most/All
Provide specific recommendations for additional diagnostic work-up, treatment changes, or referrals
X
Provide psychiatric assessments for challenging patients in-person or via telemedicine
X
Program Oversight and Quality Improvement
Provide administrative support and supervision for program
X
Provide clinical support and supervision for program X
Routinely examine provider- and program-level outcomes (e.g., clinical outcomes, quality of care, patient satisfaction) and use this information for quality improvement
X
Program Adoption The program was implemented with fidelity and did not require any major changes to implement successfully. Interview and focus group participants were asked what facilitated or hindered program implementation as well as patient participation in the program. Listed below are facilitators and barriers expressed through interviews and focus groups with TTBH staff members and study participants. Adoption Facilitators At the mid-point, interviewees noted several successes to program adoption, including patient access to care in a comfortable setting, patient compliance, communication and coordination between behavioral health and primary care, and staff training. During summative interviews and focus group discussions, adoption facilitators included the physical space of the clinic, increased communication, adapted data systems, flexibility of program staff, staff relationships, and new hires. Clinic or Physical Space Interview and focus group participants highlighted that the physical co-location of primary care and behavioral health services facilitated adoption of the Sí Texas program. A focus group participant noted, “one thing that made it easier is that I didn’t have to go to another doctor way across town. I would just come here, come next door to primary care, and that’s it. That was very easy.” Clinical staff also cited the convenience of being “next door” to each other, which facilitated internal communication and referrals. As one clinical staff summarized, “We’re in the same building. I have access to the doctors and providers on the other side. Sometimes I just walk over there.”
Communication Communication was the most frequently mentioned facilitator of program adoption from both patients/caregivers and staff/providers. Patients commented that clinical staff communicating with each other, in-person and electronically, made it easier for patients to get care. Clinical staff mentioned numerous ways in which communication facilitated the Sí Texas program adoption. The integrated clinical team meetings were highlighted as bringing together the two sides, behavioral health and primary care, to share information and develop care plans for patients. Interviewees also expressed how

Sí Texas Subgrantee: Tropical Texas Behavioral Health Program Title: Improving Access to Integrated Care for Rio Grande Valley Residents with Severe & Persistent Mental Illness
19
instant messaging and group text messages provided easy, quick ways to touch base with other staff, allowing them to make efficient adjustments to program implementation.
Data Systems Interviewees highlighted how TTBH’s integrated data system facilitated program adoption. According to staff, using one data system streamlined a process that was previously cumbersome and involved accessing multiple patient records. Interviewees described how a unified data system gave providers on both sides access to patient data, medication lists, and provider notes across, which “has been a key factor in us doing our jobs.” Flexibility The flexibility of administrative and clinical staff was noted as assisting with program adoption, especially as staff learned how to implement new integrated practices. For example, one administrative staff interviewee stated, “[Program leaders] allowed us a lot of flexibility to be available to attend conferences, learning collaboratives … a lot of latitude in terms of being in discussions with other entities throughout the state of Texas that were considering integrating care.”
Staff Relationships Relationships among clinical staff were seen as critical to program adoption. According to interviewees, through the communication and coordination that comprises integration, clinical staff developed relationships with each other, giving them the knowledge and comfort to work together to provide integrated patient care. As one clinical staff interviewee shared, “He [clinical staff] always makes it a point to walk over there, to be seen, to say hi to everybody. He’s very approachable, so I think that helps us work together.” Patients in the focus groups also recognized that relationships between staff enabled program adoption. As one focus group participant described, “Here there’s someone who is concerned about you from the social worker up. They all help you. You just call them and they’re there with you, and it’s like a little chain, really. They’re connected with each other”
Staffing Interviewees identified staff hiring as integral to adopting TTBH’s Sí Texas program. Despite some early retention challenges identified in the mid-point interviews, the additions of a dietician, a grants evaluator, a full-time primary care clinical staff, a primary care supervisor, and a director of integrated care, were viewed as key to implementation of the program. Interviewees shared that as implementation progressed there was “great cooperation by the entire staff to make the project a success” (administrative staff interviewee). Adoption Barriers At the mid-point, interviewees noted several challenges to program adoption, including meeting enrollment targets, breaking down walls of a siloed clinic culture, as well as program hiring and retention. During summative interviews and focus group discussions, barriers to adoption mentioned were the physical space of the clinic, data systems, and hiring and staffing. Clinic or Physical Space While most interviewees noted that having primary care and behavioral health located in the same building facilitated adoption of integrated care, several mentioned that the Brownsville clinic space presented challenges in terms of layout and amount of space. Interviewees noted that it would have been helpful to have more space that allowed for closer interaction of behavioral health and primary care, rather than having to walk across the building to find members of the other discipline. According to

Sí Texas Subgrantee: Tropical Texas Behavioral Health Program Title: Improving Access to Integrated Care for Rio Grande Valley Residents with Severe & Persistent Mental Illness
20
one administrative staff interviewee, “One very concrete thing that we learned from the implementation of this is how much more clinical and office space was needed for these services than we had originally estimated. Looking back, we would have considered allocating a lot more space.” Data Systems TTBH’s EMR was both a facilitator and barrier to adoption. While the system provided a communication mechanism for behavioral health and primary care, several administrative staff interviewees shared that “it isn’t designed as an integrated product” and “it isn’t as amenable to primary care as other software systems are.” Thus, interviewees expressed that the EMR had limited functionality. Despite these challenges, an administrative staff shared that they found “workarounds so that we had a single repository of information.”
Hiring and Staffing Although focus group and interview participants emphasized the quality of the staff that TTBH was able to hire, the hiring process was lengthy and retention of some staff posed challenges to adoption. Additionally, interviewees shared that given the short timeline for implementing the Sí Texas program, staffing challenges were magnified as positions needed to be filled immediately to keep the program moving forward. According to mid-point interviewees, initial challenges focused on retention of enrollment clerks and the hiring of a director of primary care services. As program implementation moved forward, summative interviewees noted that the challenge shifted to finding a dietician and a full-time primary care physician, and retaining staff hired during early implementation. As one administrative staff interviewee summarized, “It [hiring and retention] was a huge challenge, a barrier. It’s something that we have faced as a local [mental health] authority, but we handled it every time that we needed to.” Participant Facilitators In addition to facilitators experienced by staff adopting the Sí Texas program, focus group and interview participants were also asked to reflect specifically on facilitators that patients faced while participating in the program. Facilitators mentioned included cost, family support, housing support, patient relationships, addressing stigma, transportation services, and program staff flexibility. Cost Patients complimented the Sí Texas program for being very affordable, reportedly costing little to no money for both behavioral health and primary care services. According to focus group participants, this low cost ($5 copay) allows patients to seek and receive care more readily than they were able to outside of TTBH. For example, one patient shared, “I don’t have insurance and I can’t pay for it. There are times that he [primary care physician] charges us $5 and $5 is nothing.” Additionally, several patients spoke of receiving free medications and screenings, for example mammograms. When asked which services at TTBH were most helpful, one focus group participant responded that the financial support was most helpful, with agreement from others in the room. Family Support Family and friends were also described as providing support to loved ones who were patients at TTBH, which facilitated patients’ participation in the program. Focus group participants – patients and their caregivers – spoke of the benefits of having support not only in the clinic during appointments but also at home to encourage healthy behaviors. One clinical staff interviewee also suggested that caregivers who attended appointments also received health information (e.g., nutrition education) that was helpful for themselves.

Sí Texas Subgrantee: Tropical Texas Behavioral Health Program Title: Improving Access to Integrated Care for Rio Grande Valley Residents with Severe & Persistent Mental Illness
21
Housing Several patients also shared that TTBH provides housing assistance and the drop-in center as part of its standard of care, which brings stability to patients, allowing them to participate in other services at TTBH. As one focus group participant stated, “I was walking the streets and all and Tropical picked me up and rented an apartment for me and helped me with clothing, the first month’s rent until my check came.” Many focus group patients also highlighted the drop-in center as a place to relax and meet basic needs, such as taking a shower or washing clothes. Relationships In addition to bolstering patient-staff relationships, the program also helped patients strengthen their relationships with each other. Focus group participants identified this improvement as contributing to their participation in the program. As one focus group participant explained, “People like to come to Tropical because here you feel like you’re with family.” Stigma According to patients and staff, TTBH understands and addresses the stigmas around mental health. Patients spoke of accessing behavioral health and primary care in a comfortable setting: “Here I have seen that they have treated me well, they have respected who I am. We are all human. Sometimes many people see you as your disease, they snub you in other places" shared one focus group participant. Staff concurred, with one administrative staff stating, “We’ve gotten a lot of positive feedback about this being a place where they feel comfortable, and their appreciation for access to primary care in the same place that they’ve come for years to get behavioral health services.” Transportation While transportation was a barrier discussed in the mid-point interviews, TTBH’s transportation services, provided as part of TTBH’s standard of care, were generally seen as facilitating patient participation in the program. One patient explained, “So, they pick you up in the morning at whatever time, a half hour before your appointment.” And another followed up, “And they come with us, the van, and they leave us. Before, where I live, I had to get four buses to come here.” Patients discussed how TTBH’s transportation services not only allowed them to get to the clinic in a timely and inexpensive way, but also reduced the “stress of not knowing how to get to my appointment tomorrow.” Flexibility The flexibility of TTBH staff was noted as assisting with patient participation in the program. According to focus group participants, this flexibility was most pronounced in terms of advanced and on-the-spot scheduling, specifically for primary care. As one patient commented, “What I like about primary care is that they call you the day before to remind you about your appointment the next day. And if you miss it, they call you and ask if you want to reschedule.” Given patients’ barriers to accessing care, such as transportation and stigma, the flexibility they were shown was key to bringing them into the clinic. As one focus group participant shared, “They work with your schedule, so if you can’t make it in the morning they will schedule you in the afternoon. They want us to feel comfortable.” Participant Barriers In addition to barriers experienced by staff and providers adopting the Sí Texas program, focus group and interview participants were also asked to reflect on barriers that patients faced while participating in the program. Barriers discussed included cost, insurance, patient health, stigma, transportation, and wait times.

Sí Texas Subgrantee: Tropical Texas Behavioral Health Program Title: Improving Access to Integrated Care for Rio Grande Valley Residents with Severe & Persistent Mental Illness
22
Cost While most focus group participants spoke of the minimal costs to participate in the Sí Texas program at TTBH, they noted cost as a barrier to care outside of TTBH. Specialty services to which patients are referred were specifically highlighted as being prohibitively expensive. Additionally, patients noted that it is expensive to maintain healthy behaviors outside of the clinic, for example, to purchase healthy foods that the dietician recommended they cook at home. “It’s quite expensive to eat healthy,” a focus group participant shared. “The chicken breast, the fish. It’s expensive nowadays.” Insurance Several patients and staff mentioned that having insurance was a barrier to participating in the program, since patients were required to pay higher copays at TTBH if they had insurance for which TTBH was out of network. For example, one interviewee shared, “Some clients that did have insurance came in, and they were part of the intervention. They were pretty happy about it, until they found out that their copay, with the insurance, was going to be higher with us [at TTBH] than with somebody else. So that was a disappointment for us because we did lose a few clients because of that.” Patient Health Patients’ health sometimes represented a barrier to participation, according to both patients and staff. As one focus group participant explained, “If I missed or changed an appointment, it was because sometimes I was sick.” Similarly, interviewees shared that patients’ physical or mental health prevented them from coming to the clinic or from engaging with clinical staff during the clinical visit. Stigma Patients suggested that community stigma around mental health was a barrier for patients coming to TTBH. One patient shared that, because of the perceived stigma regarding TTBH and its services, he did not want to come to the clinic to receive services. A focus group participant explained, “The problem with behavioral health and with Tropical in general is that there is a misconception. Before, Tropical was Tropical Texas Mental Health, Mental Retardation. Now it’s Tropical Texas Behavioral Health. And still there is that misconception that only crazy people come here. And that is a misconception; we’re not crazy, we have emotional and mental illnesses.” Transportation While patients generally reported that TTBH’s transportation services facilitated participation, there were some patients who did not qualify for these services. According to focus group and interview participants, if transportation is not included in a patient’s treatment plan and or if they are covered by private insurance, then they cannot receive transportation assistance from TTBH. Wait Times Participants expressed that wait times while at the clinic can be a disincentive to participation. “You have to wait to see the doctor. Your appointment can be at two in the afternoon and its four, five in the afternoon and you haven’t seen him. You’ll get here before two and sometimes you leave around five in the afternoon, five thirty,” one patient shared with regards to behavioral health care at TTBH. Focus group participants agreed that wait times were longer for behavioral health visits than for primary care. Further, patients mentioned that there were sometimes long waits of several weeks or months to be seen by a case worker or behavioral health clinical staff.

Sí Texas Subgrantee: Tropical Texas Behavioral Health Program Title: Improving Access to Integrated Care for Rio Grande Valley Residents with Severe & Persistent Mental Illness
23
Question 3b. To what extent do providers and staff buy into the program, and how has buy in affected implementation?
Clinical and administrative staff members were asked about their support and buy-in for the Sí Texas program as well as their perceptions of their colleagues’ buy-in. Interviewees spoke about the culture of the clinic, as well as buy-in and satisfaction of both frontline clinical staff as well as leadership and administration. Clinic Culture In general, interviewees perceived the clinic culture to be a supportive environment for adoption of the Sí Texas program. “We’ve worked everything out and really do feel like we’re one organization now, not an organization with two separate programs” shared one administrative staff member. While a few interview participants spoke of working through some initial tension around roles, responsibilities and expectations for integration, program leaders and integrated team meetings “helped to develop a culture that was collaborative and collegial” highlighted another administrative staff interviewee. The small size of the Brownsville clinic was also seen as contributing to the successful development of a culture of integration. Frontline Clinical Staff Frontline clinical staff expressed overall satisfaction with the program, citing increased access to care for their patients as well as initial positive health outcomes. According to several interviewees, however, there was some dissatisfaction among both behavioral health and primary care clinical staff with the study design because the control group of patients did not receive primary care services. As one clinical staff interviewee shared, “There was a lot of frustration on both sides that staff couldn’t get clients who weren’t part of the study [intervention group] into primary care services.” Additionally, a few staff interviewees reported slight dissatisfaction with the increased workload as they implemented new data collection and communication practices. Despite these concerns, the overall sentiment among staff was one of pride and satisfaction as the study concluded. Leadership and Administration Given that TTBH has implemented integrated care previously at two of its other clinics and has made financial investments to move forward with integrated care, TTBH’s executive leadership and board were seen as being very supportive of integrated care, according to interviewees. For example, one administrative staff interviewee stated, “I don’t think any of us who are managing the project have felt like they [executive leadership] have been an obstacle to us. They’ve been very supportive.” Question 4. To what extent did the comparison groups receive program-like components? The control group was assigned to receive usual care within TTBH, which is behavioral health services without primary care. This includes access to case management, behavioral health services, drop-in center. Throughout the study, control group participants were referred to community-based primary care clinics if they needed primary care services. Systematic tracking of these external referrals to primary care was not possible and therefore those data are not presented here or considered in these final analyses. Internal primary care services received were able to be tracked by TTBH. As discussed in Question 6 in this section, no control group participants received primary care services from within TTBH, including dietician or chronic care nurse services.

Sí Texas Subgrantee: Tropical Texas Behavioral Health Program Title: Improving Access to Integrated Care for Rio Grande Valley Residents with Severe & Persistent Mental Illness
24
Question 5. To what extent did the TTBH implement the reverse co-location model with fidelity? TTBH implemented the co-location model with high fidelity. All components were implemented as planned, except for some delays in hiring and challenges with staff retention. As discussed in the next section, all intervention participants received the minimum dose of the intervention (one primary care visit following their initial enrollment visit plus one visit with either a chronic care provider or registered dietician.) According to interviewees during the mid-point and summative evaluations, TTBH implemented their IBH program with strong fidelity. Summarizing, an administrative staff interviewee said, “I would say the integration of care has been at a pretty high level.” Participants during the mid-point interviews described early challenges such as being unable to fill the vacant Primary Care Director position for the first six months of the study; yet these challenges were seen as having small effects on the model’s overall fidelity. Interviewees shared how program staff worked diligently to facilitate communication systems, workflows, and data systems to support integration. Question 6. How many visits, and what type of visits, do program participants receive? As shown in Table 6, the intervention participants completed 2,083 primary care visits. This ranged from a minimum of 1 primary care visit to a maximum of 35 visits, with the mean number of 12.2 visits per intervention participants and median of 11. Intervention participants missed a total of 558 primary care visits during the study. This ranged from a minimum of 1 to a maximum of 12 missed visits with a mean of 3.7 missed appointments per intervention participant. Among intervention participants, 4,195 behavioral health visits were completed during the study. This ranged from a minimum of 3 behavioral health visits to a maximum of 164, with a mean of 24.1 behavioral health visits per intervention participant and median of 14 visits. Intervention participants missed a total of 721 behavioral health appointments during the study. This ranged from a minimum of 1 to a maximum of 22 missed behavioral health appointments, with the mean being 4.7 per intervention participant and median of 4. As designed in the study, control participants did not receive any primary care visits during the length of the study and thus did not miss any primary care visits. Among control participants, 2,797 behavioral health visits were completed during the study. This ranged from a minimum of 1 visit to a maximum of 246 visits with an average of 21.4 behavioral health visits per control participant and with a median of 11 visits. Control participants missed a total of 453 behavioral health appointments during the study. This ranged from a minimum of 1 to a maximum of 14 missed behavioral health visits with an average of 3.9 visits per control participant.
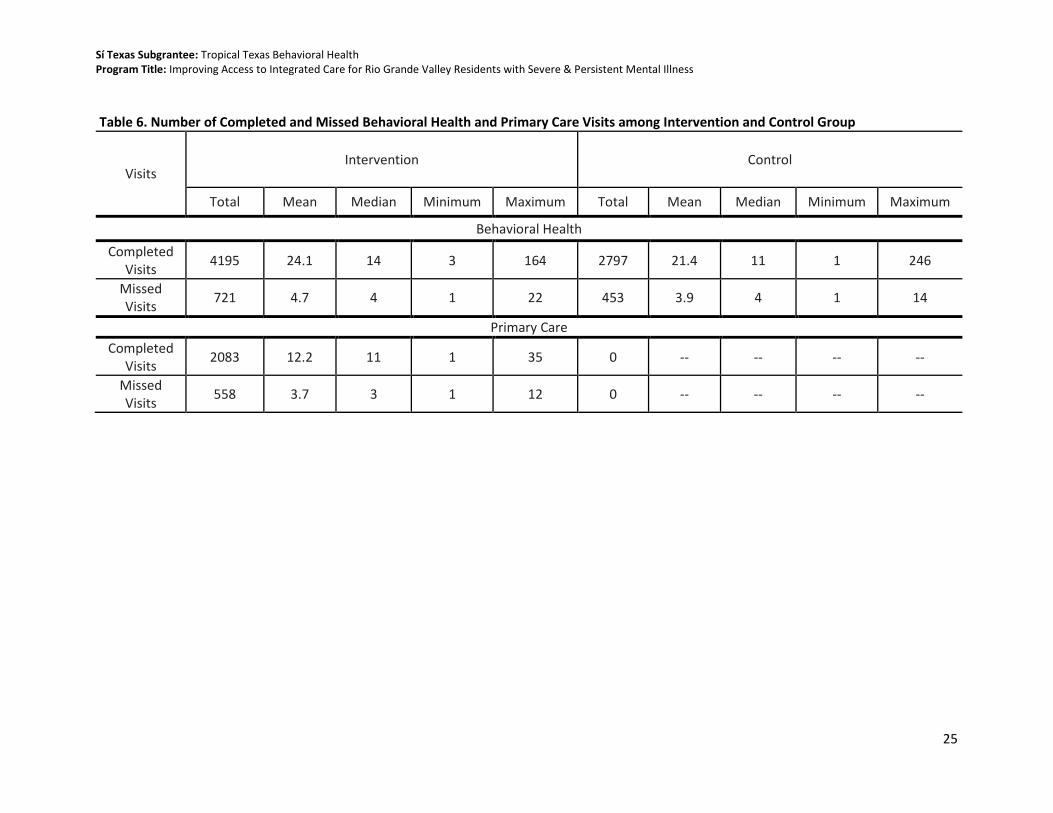
Sí Texas Subgrantee: Tropical Texas Behavioral Health Program Title: Improving Access to Integrated Care for Rio Grande Valley Residents with Severe & Persistent Mental Illness
25
Table 6. Number of Completed and Missed Behavioral Health and Primary Care Visits among Intervention and Control Group
Visits Intervention Control
Total Mean Median Minimum Maximum Total Mean Median Minimum Maximum
Behavioral Health
Completed Visits
4195 24.1 14 3 164 2797 21.4 11 1 246
Missed Visits
721 4.7 4 1 22 453 3.9 4 1 14
Primary Care
Completed Visits
2083 12.2 11 1 35 0 -- -- -- --
Missed Visits
558 3.7 3 1 12 0 -- -- -- --

Sí Texas Subgrantee: Tropical Texas Behavioral Health Program Title: Improving Access to Integrated Care for Rio Grande Valley Residents with Severe & Persistent Mental Illness
26
Question 7. What are the components of usual care received by comparison group participants? Participants randomized to the usual care group (control group) in the primary study RCT were referred to the nearest federally qualified health center (FQHC) or county health department for their primary care needs. Each control group participant was assigned a behavioral health case manager that kept in touch with them and refer them to primary care services as needed. TTBH made all reasonable efforts to ensure that clients keep referral appointments with primary care providers at the FQHC or county health department.
Additional Implementation Findings In addition to data to answer the a priori implementation questions presented in the SEP, the qualitative implementation evaluation also yielded additional findings related to participant satisfaction, perceived success and impacts, sustainability, policy implications, program replication/scalability, and staffing. Presented here are key themes that emerged during the key information interviews and focus groups not directly asked by the implementation research questions outlined above but that are still valuable to provide context for TTBH’s program. Participant Satisfaction Patient and caregiver participants in focus groups were overwhelmingly satisfied with the Sí Texas program, citing improvements in services, health literacy, relationships and ultimately health outcomes as reasons for being satisfied. All quotes in this section are from intervention group participants. Services Provided Patients spoke highly about the quantity and quality of services received as part of the Sí Texas program, including nutrition and diabetes education services as well as primary care. “They have given me more services than I expected, many more services than any community clinic,” explained one patient. Several other focus group participants emphasized the quality of the Sí Texas services: “The services they offer, I mean they’re excellent.” It should be noted that control group participants also expressed satisfaction with the standard of care at TTBH. Relationships In addition to the services provided as part of the Sí Texas program, participants spoke about the relationships they developed with TTBH staff and other patients. “I liked it very much because we started to know the people well,” one patient shared. According to focus group participants, these relationships made them happy to come to the clinic and more receptive to care. For example, one patient said, “I liked it because it’s like our home, we feel like our home… in our illness many people don’t understand us and we were there [Tropical] getting to know each other, what happened to us, how we can get better, with someone we can talk to. I liked it very much.” Patients noted that TTBH staff seemed to have a passion for their work and really get to know the patients well. As one patient shared, “It’s like everywhere else is like there’s a job, and you have a job because it’s a paycheck. And then here you have a job because you love what you’re doing and you care about the people that you’re serving.” As a result of these relationships, patients felt like they could “share anything with them [staff] and they wouldn’t judge.” Health Literacy Program services, specifically the nutrition and diabetes education, were seen as increasing health literacy and were cited as a significant reason why patients were satisfied with the program. As one
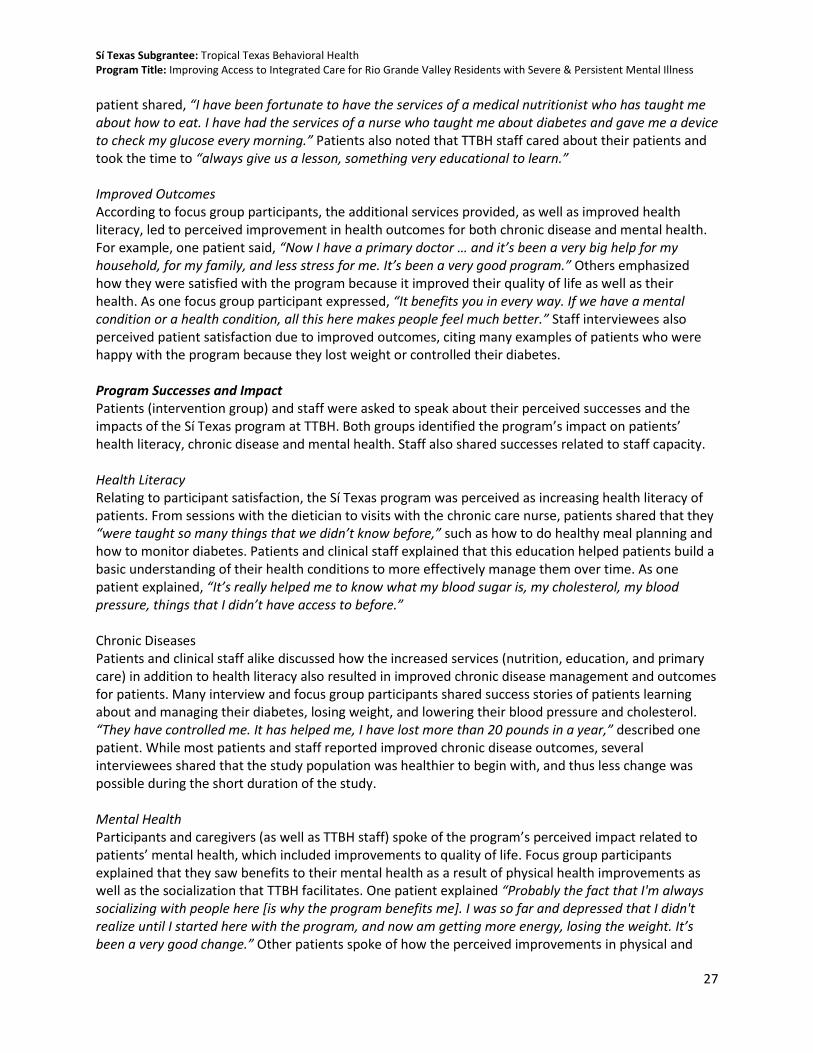
Sí Texas Subgrantee: Tropical Texas Behavioral Health Program Title: Improving Access to Integrated Care for Rio Grande Valley Residents with Severe & Persistent Mental Illness
27
patient shared, “I have been fortunate to have the services of a medical nutritionist who has taught me about how to eat. I have had the services of a nurse who taught me about diabetes and gave me a device to check my glucose every morning.” Patients also noted that TTBH staff cared about their patients and took the time to “always give us a lesson, something very educational to learn.” Improved Outcomes According to focus group participants, the additional services provided, as well as improved health literacy, led to perceived improvement in health outcomes for both chronic disease and mental health. For example, one patient said, “Now I have a primary doctor … and it’s been a very big help for my household, for my family, and less stress for me. It’s been a very good program.” Others emphasized how they were satisfied with the program because it improved their quality of life as well as their health. As one focus group participant expressed, “It benefits you in every way. If we have a mental condition or a health condition, all this here makes people feel much better.” Staff interviewees also perceived patient satisfaction due to improved outcomes, citing many examples of patients who were happy with the program because they lost weight or controlled their diabetes. Program Successes and Impact Patients (intervention group) and staff were asked to speak about their perceived successes and the impacts of the Sí Texas program at TTBH. Both groups identified the program’s impact on patients’ health literacy, chronic disease and mental health. Staff also shared successes related to staff capacity. Health Literacy Relating to participant satisfaction, the Sí Texas program was perceived as increasing health literacy of patients. From sessions with the dietician to visits with the chronic care nurse, patients shared that they “were taught so many things that we didn’t know before,” such as how to do healthy meal planning and how to monitor diabetes. Patients and clinical staff explained that this education helped patients build a basic understanding of their health conditions to more effectively manage them over time. As one patient explained, “It’s really helped me to know what my blood sugar is, my cholesterol, my blood pressure, things that I didn’t have access to before.” Chronic Diseases Patients and clinical staff alike discussed how the increased services (nutrition, education, and primary care) in addition to health literacy also resulted in improved chronic disease management and outcomes for patients. Many interview and focus group participants shared success stories of patients learning about and managing their diabetes, losing weight, and lowering their blood pressure and cholesterol. “They have controlled me. It has helped me, I have lost more than 20 pounds in a year,” described one patient. While most patients and staff reported improved chronic disease outcomes, several interviewees shared that the study population was healthier to begin with, and thus less change was possible during the short duration of the study. Mental Health Participants and caregivers (as well as TTBH staff) spoke of the program’s perceived impact related to patients’ mental health, which included improvements to quality of life. Focus group participants explained that they saw benefits to their mental health as a result of physical health improvements as well as the socialization that TTBH facilitates. One patient explained “Probably the fact that I'm always socializing with people here [is why the program benefits me]. I was so far and depressed that I didn't realize until I started here with the program, and now am getting more energy, losing the weight. It’s been a very good change.” Other patients spoke of how the perceived improvements in physical and

Sí Texas Subgrantee: Tropical Texas Behavioral Health Program Title: Improving Access to Integrated Care for Rio Grande Valley Residents with Severe & Persistent Mental Illness
28
mental health have led to better quality of life. For example, one patient shared, “Well, basically my general health has improved, and because of that I have a better quality of life. I have better relationships with my friends and family.” Clinical staff also noted changes in patients’ mental health as a result of physical health improvements: “I did see a lot of improvements in my clients, with their psychiatric symptoms, as well as them being able to better manage their chronic health diseases.” Staff Capacity According to interviewees, one of the successes of the Sí Texas program was that it built capacity among TTBH staff to implement integrated behavioral health as well as engage in rigorous research studies. Interviewees shared that staff learned new information and skills, such as behavioral health providers gaining insights about physical health. One clinical staff interviewee explained, “I knew nothing about cholesterol. Now I make sure I always incorporate that into my sessions, especially for clients that I know have any chronic health diseases, because now I understand the importance of it. Before, I mean I would only stick to the depression and the mood swings, but now I incorporate their health [physical health conditions] as well.” Several interview participants also spoke about increased staff capacity to do research, sharing that they learned about the evaluation design and data systems. For example, an administrative staff interviewee said, “I would say that in terms of the objective of the project to not just affect these clinical outcomes but to also impact the competencies of the subgrantees, the skillsets, the capacity of the subgrantees going forward to continue to do this research work, it’s been very, very effective.” Sustainability and Lessons Learned Overall, interviews with TTBH staff as well as focus groups with patients and caregivers indicated that implementation of TTBH’s Sí Texas program has been successful. Several lessons learned and opportunities for improvement emerged. At the mid-point, lessons learned related to clinic space, data systems/evaluation, communication, patient barriers to care, and IBH research. During the summative interviews and focus groups, lessons learned and opportunities for improvement focused on additional activities, funding, information-sharing, the policy environment, program replication and scalability, and staffing. Additional or Complementary Activities Patients had several suggestions for complementary services that TTBH could offer to their patient population and the community at large. Some patients spoke knowingly about the drop-in center, but others appeared to learn about it for the first time at the focus groups. All agreed the drop-in center was a wonderful service and recommended that it be expanded to offer additional nutrition and exercise classes. After the Sí Texas study ended, the nutritionist and chronic care nurse services were cut back due to challenges with billing. For patients in focus groups whose visits with the nutritionist and chronic care nurse had ended, they suggested that the group setting of the drop-in center would keep them accountable for the positive changes they have made through the Sí Texas program. Funding During the mid-point and summative interviews, several TTBH staff suggested that a primary goal of TTBH’s IBH program is to contribute to the research on reverse co-location. Most interviewees acknowledged that providing evidence on the health effects of reverse co-location is valuable to TTBH and the public health field overall. “We are really looking at the Sí Texas program for improved outcomes and research to show effectiveness to funders,” an administrative staff interviewee shared in a mid-point interview. Interviewees highlighted the realities of needing funding to sustain IBH implementation, and reported that the Sí Texas evaluation is a vehicle to demonstrate the value of their program to local
Sí Texas Subgrantee: Tropical Texas Behavioral Health Program Title: Improving Access to Integrated Care for Rio Grande Valley Residents with Severe & Persistent Mental Illness
29
stakeholders who can assist with sustaining future IBH work at TTBH. Funding from medical billing was also highlighted as part of the strategy to sustain an integrated model of care. Interviewees shared that the TTBH patient population is largely low-income and uninsured. Thus, as the Sí Texas project ended, TTBH has had to change the mix of patients they can accept for primary care services, cut some clinical staff, and think strategically about funding sources going forward. Explaining these changes one interviewee stated, “We have made a shift in our perspective on who we can serve, who we can afford to serve. So, we’ve done some analysis of the financial payer mix that we need in order to keep it [integrated care] sustainable” within the current insurance market and considering Medicaid rates. Looking back, several staff recommended that it would have been beneficial to bring in a financial consultant earlier in the process to think about sustainability at the start of the Sí Texas program. Information-sharing Focus group and interview participants also offered lessons learned and suggestions related to sharing information. From the patient perspective, information about TTBH and the services it provides should be shared with the community so “they can be informed about all the services that are offered here and who can qualify,” according to one patient. Patients also emphasized that there is work to be done in how TTBH is portrayed to the general community so as to address stigma and misperceptions of TTBH’s services and patient population. TTBH staff also recommended information-sharing, but specified connecting with other organizations implementing integrated care. According to one administrative staff interviewee, “The first piece of advice would just be to connect with an entity that’s already doing this. That is similar to yours operationally and ideally, in terms of the population served, sort of demographically, but certainly operationally. And, spend as much time as possible learning from their experiences, in terms of how you set up your clinic and how you operate your clinic, and the kinds of fiscal and operational and administrative things you need to prioritize.” Interview participants noted that TTBH has shared information with other local mental health authorities in addition to other Sí Texas subgrantees, and look forward to engaging with these groups when thinking about sustainability moving ahead. Policy Environment The policy environment is closely tied to funding, as interviewees explained. According to interviewees, because Texas did not expand Medicaid, many of TTBH’s clients were without a funding source, which challenges TTBH’s ability to sustain integrated services for these patients. To address this, an administrative staff interviewee shared, “We’ve been doing so much work at the state level and trying to get the Health and Human Services Commission to recognize the need for changes in rates to help fund it, whether it’s through some kind of Medicaid expansion to the SPMI population that might help, or changing the Medicaid rates, or adding procedure codes specific to integrated care. We’re really trying to work on some of that.” However, one interviewee indicated that some aspects of the policy environment have facilitated sustainability for integrated behavioral health: “The state and the national focus on the integration of care, and moving away from a siloed, fragmented system of care, has been a huge plus and a huge support in our efforts to effect that within our agency for our clients. And I think that agenda at the national and state level has also been a catalyst for private entities and foundations to also invest in the integration of care for folks with comorbid illnesses.” Program Replication and Scalability While the Sí Texas program at the Brownsville clinic represents an expansion of TTBH’s integrated care already in place at two other clinics, interviewees and focus group participants shared hopes for additional program scale-up and replication. As the Sí Texas study ended, “We’re still struggling with making integrated care available to as many of our clients who are in need of that care as we had hoped

Sí Texas Subgrantee: Tropical Texas Behavioral Health Program Title: Improving Access to Integrated Care for Rio Grande Valley Residents with Severe & Persistent Mental Illness
30
to be able to do,” shared one administrative staff interviewee. According to TTBH staff, they’d like to see integrated care expanded to serve family members (including children) of existing patients, and potentially the general community. It was also suggested that they could scale up primary care services and offer those to patients who do not have behavioral health needs. This expansion, if it includes a sustainable payer mix, may offer the funding TTBH needs to scale up its integrated care, according to several program staff. Additionally, TTBH will soon (spring 2018) open a new outpatient clinic in Weslaco, in which primary care and behavioral health will be fully integrated. Staffing There were numerous lessons learned and opportunities for improvement around staffing, according to interview and focus group participants. The general suggestion from patients was that the nutritionist and chronic care nurse were integral to patient success in the program, and they would like to find a way to sustain those positions moving forward so that other patients can also access those important services. From the staff perspective, challenges with changing job roles and staff retention, such as enrollment clerks and primary care staff leaving, necessitated conversations about supporting remaining staff as well as program sustainability. Looking back, staff recommended that TTBH hire a primary care consultant to provide some technical expertise on staffing structure and financial sustainability before implementation began to navigate the current complex policy and reimbursement environment. Two concrete recommendations for moving forward were to hire a medical office manager with experience in a primary care setting, and to consider the role of lower-credentialed staff (e.g. low to mid-level providers) for chronic care coordination.

Sí Texas Subgrantee: Tropical Texas Behavioral Health Program Title: Improving Access to Integrated Care for Rio Grande Valley Residents with Severe & Persistent Mental Illness
31
IMPACT STUDY – APPROACH AND METHODS
Overview of Impact Study Design Originally, TTBH conducted two concurrent studies: 1) a randomized control trial design (the primary study), and 2) a quasi-experimental design (the companion study). The companion study was discontinued per direction from SIF in their review of the interim report because the randomization was successful in balancing the baseline characteristics between the intervention group and control group in the primary study; the SEP indicated the companion study was conducted in case the primary study was unsuccessful in its randomization of study subjects. MHM and HRiA did not submit a modified SEP as SIF is no longer reviewing modification submissions. This final report only reports the results from the primary study, which will be referred to as “the study” for the remainder of the report. The study targets a moderate level of evidence. Prior evidence includes RCTs by Druss et al. ( 2010; 2011) and the Boardman (2006) QED study, which found positive results of integrating primary care into the behavioral health setting. As previously noted, TTBH selected a randomized control trial design because their organization had the experience and operational workflows to randomly assign patients into intervention and comparison groups with minimal contamination, making implementation of a randomized experiment feasible. The study aimed to expand the level of evidence related to reverse co-located integrated care models, assess its program efficacy, and generate moderate evidence for the reverse co-location IBH model. Use of an RCT design is preferred because it minimizes threats to internal validity by better controlling for patient level characteristics. The RCT design optimizes the external validity of the study; however, results may have limited external validity due to the setting of the study and the specific patient population being studied. Results may be generalized to other border communities but may have limited generalizability in settings outside of Southern Texas and/or other border communities in the United States.
Impact Study Design and Methods
Study Design The study employed an RCT design to compare intervention participants receiving the delivery of integrated behavioral health with comparison participants receiving the usual care provided within a behavioral health clinic for patients with SPMI. Participants enrolled in the study were followed for approximately 12 months. Quantitative program implementation data related to participation in intervention components is also reported in this report (see Implementation Evaluation section). This study did not deviate from the SEP in its methodology or design.
Randomization Procedure The unit of randomization was individual patients. After a patient provided voluntary consent at the Brownsville clinic, he or she was entered into the randomization process. The assistant who assessed eligibility and obtained informed consent used a random number generator to determine the participant’s assignment to either the intervention or control group. Once random numbers were generated, clinic staff placed the randomly-generated numbers in a box, and participants were asked to choose an assignment after consenting to the process. Patients randomized to the intervention group in this study received integrated care, and those patients randomized to the control group received TTBH’s usual care services. While there appears to be an imbalance in the number of participants assigned to the intervention and control groups, the randomization procedure was conducted to fidelity. TTBH

Sí Texas Subgrantee: Tropical Texas Behavioral Health Program Title: Improving Access to Integrated Care for Rio Grande Valley Residents with Severe & Persistent Mental Illness
32
printed a large pool of randomly generated numbers that exceeded its target recruitment number. A larger number of intervention group assignments were drawn at random than control group assignments. Baseline equivalence is assessed below.
Assessment of Baseline Equivalence At baseline, sociodemographic characteristic frequencies were analyzed for both intervention and control groups using a standardized set of questions developed by TTBH (see Appendix F). To assess baseline equivalence between groups, the following sociodemographic characteristics were analyzed: age, gender, ethnicity, race, primary language, county of residence, problems with employment, and education level. Baseline sociodemographic data are captured for all program participants. These sociodemographic characteristics were selected because they were routinely collected by TTBH and available in their EMR. TTBH also included a subject’s primary condition (schizophrenia, major depressive disorder, or bipolar disorder) as a covariate.1 Baseline equivalence was also assessed for chronic disease status using the study impact measures (systolic blood pressure, diastolic blood pressure, HbA1c, BMI, total cholesterol, PHQ-9, and ANSA). Equivalence was assessed using T-tests for continuous variables and chi-square tests for categorical variables. For HbA1c and ANSA measures, non-parametric tests were employed due to non-normal distributions. Examining equivalence can determine whether the two groups are statistically different. In an RCT, it would be expected that groups would be similar at baseline given that they were randomly assigned, and participants had an equal chance of being assigned to either group. This analysis also assesses the success of random assignment, identifying any need for adjustments in the final analysis due to the observed imbalance between the two study arms. Among many patient-level demographic characteristics and the seven health outcome variables in this study, the intervention and control groups are statistically equivalent except for systolic blood pressure (Table 7). The control group had a significantly higher mean systolic blood pressure (129.6 mmHg) than the intervention group (125.6 mmHg) at baseline. Taking chance findings into account, we determined based on the between-group differences of baseline variables that the randomization has resulted in an adequate balance of the observed variables between the two groups. There is no evidence that randomization was done improperly as all procedures were followed and documented. If there were problems with the randomization, we would expect to find imbalance in more patient level variables, which was not the case in our assessment.
1 Data that were missing at the time of the interim report have since been collected.

Sí Texas Subgrantee: Tropical Texas Behavioral Health Program Title: Improving Access to Integrated Care for Rio Grande Valley Residents with Severe & Persistent Mental Illness
33
Table 7. Tests of Baseline Equivalence for Impact Measures
Full Sample Brownsville Intervention v. Brownsville Control
Mean (SD) Mean (SD) Mean (SD) p-value
Systolic Blood Pressure 127.2 (18.3) 125.6 (18.6) 129.6 (17.5) 0.03 Diastolic Blood Pressure 79.0 (10.3) 78.8 (10.2) 79.3 (10.4) 0.60 BMI 33.8 (8.3) 33.7 (7.6) 34.0 (9.3) 0.71 Cholesterol 187.0 (44.9) 188.5 (46.1) 184.9 (42.9) 0.43 PHQ-9 11.7 (6.6) 11.4 (6.4) 12.2 (7.0) 0.26
Non-Parametric Testsa Median (SD) Median (SD) Median (SD)
HbA1c 5.7 (1.7) 5.6 (1.9) 5.7 (1.3) 0.88 ANSA 2.0 (2.3) 2.0 (2.4) 2.0 (2.1) 0.81 Note: Bold denotes statistical significance of p-value < 0.05 a The Wilcoxon Signed Rank test was used to examine non-normally distributed data
The intervention and control groups were statistically equivalent for the nine key demographic variables (Table 8). Table 8. Tests of Baseline Equivalence for Demographic Measures
Full Sample
(n=416)
Brownsville Intervention
(n=249)
Brownsville Control (n=167)
p-value
Measure N % N % N %
Sex
Male 186 44.7 112 45.0 74 44.3 0.89 Female 230 55.3 137 55.0 93 55.7
Missing -- -- -- -- -- --
Racea
White 389 93.5 231 92.8 158 94.6
0.35 Native Hawaiian/Pacific Islander 1 0.2 0 0.0 1 0.6 Other 22 5.3 16 6.4 6 3.6 Unknown 4 1.0 2 0.8 2 1.2 Missing -- -- -- -- -- --
Ethnicity
Hispanic 385 92.5 226 90.8 159 95.2
0.21 White 13 3.1 9 3.6 4 2.4 Non-Hispanic 18 4.3 14 5.6 4 2.4 Missing -- -- -- -- -- --
Age
Mean 40.9 -- 41.0 -- 40.7 -- 0.82
(SD) (12.9) -- (12.5) -- (13.4) -- 18-24 48 11.5 30 12.0 18 10.8
0.27
25-34 94 22.6 49 19.7 45 26.9 35-44 112 26.9 69 27.7 43 25.7 45-54 95 22.8 61 24.5 34 20.4 55-64 54 13.0 35 14.1 19 11.4 65+ 13 3.1 5 2.0 8 4.8

Sí Texas Subgrantee: Tropical Texas Behavioral Health Program Title: Improving Access to Integrated Care for Rio Grande Valley Residents with Severe & Persistent Mental Illness
34
Full Sample
(n=416)
Brownsville Intervention
(n=249)
Brownsville Control (n=167)
p-value
Measure N % N % N % Missing -- -- -- -- -- --
Educationa
Below High School 77 19.1 41 16.9 36 22.2
0.66
Some High School 158 39.1 100 41.3 58 35.8 GED/HS Grad/Some College 141 34.9 86 35.5 55 34.0 Associates/Bachelor Degree 23 5.7 13 5.4 10 6.2 Special Education 5 1.2 2 0.8 3 1.9 Missing 12 -- 7 -- 5 --
Employment Status
No Evidence of Problems 52 12.5 32 12.9 20 12.0
0.58
History of Problems, Mild 11 2.7 6 2.4 5 3.0 Moderate Problems 14 3.4 11 4.4 3 1.8 Severe Problems 243 58.6 146 58.9 97 58.1 N/A 95 22.9 53 21.4 42 25.1 Missing 1 -- 1 -- -- --
Primary Languagea
English 284 68.4 173 69.8 111 66.5 0.71 Spanish 131 31.6 75 30.2 56 33.5
Missing 1 -- 1 -- -- --
County of Residencea
Cameron County 410 98.6 245 98.4 165 98.8 0.99 Hidalgo County 6 1.4 4 1.6 2 1.2
Missing -- -- -- -- -- --
SPMI Diagnosis
Bipolar Disorder 129 31.0 78 31.3 51 30.5
0.30
Major Depression 191 45.9 112 45.0 79 47.3
Schizophrenia 81 19.5 53 21.3 28 16.8
Schizophrenia and Major Depression
15 3.6 6 2.4 9 5.4
Missing -- -- -- -- -- -- aFisher’s Exact test was used due to cells having expected count less than 5
Propensity score matching was considered as an option in the analytic phase for this final report in case baseline equivalence was not established. However, since randomization resulted in equivalent groups, propensity score matching was determined to be unnecessary for these analyses.
Intervention and Control Group Conditions Patients randomized to the study intervention group received the integrated primary care program. As part of the intervention group, patients were initially seen at the TTBH program for a physical assessment. If the client had diabetes, heart disease, hypertension, obesity, or hypercholesterolemia, the program provider gave appropriate treatment and referred patients to see the care coordinator and chronic care nurse/registered dietician as appropriate within seven days of the initial program visit. A

Sí Texas Subgrantee: Tropical Texas Behavioral Health Program Title: Improving Access to Integrated Care for Rio Grande Valley Residents with Severe & Persistent Mental Illness
35
care coordinator then made a follow-up appointment for the patient depending on the participant’s care plan. For patients assigned to the intervention group, this process was repeated at every visit. Patients randomized to the usual care group (control group) were referred to the nearest federally qualified health center (FQHC) or county health department for their primary care needs. For each control patient, TTBH planned to query the patient about where they received primary care services and note it in the EMR if a response was provided by the patient. However, deviating from the SEP, this step was not able to be implemented due to clinic capacity. Each control group participant was assigned a behavioral health case manager that kept in touch with them and referred them to external primary care services as needed.
Study Sample The following section describes the final data on the composition, eligibility, recruitment, enrollment, retention, and attrition of the study sample. Except where explicitly noted in subsections below, there were no deviations from the SEP in the Study Sample section, including no deviations from the SEP related to sample recruitment and retention, assessment and adjustment for non-response bias, or missing data.
Study Sample Composition As described earlier in the report, Table 9 describes and compares the overall TTBH clinic population and the study population. Participants enrolled in the study were more likely to be from Cameron County and had less representation of Hidalgo County than the total clinic population. There was a statistically significant difference between the SPMI diagnoses of study participants at baseline and the diagnoses among the total Brownsville clinic population. Table 9. Comparison of Study Participants and Clinic-Wide Demographics
Brownsville Clinic
(n=502) Sí Texas Study
(n=416) p-value
Measure N % N %
Sex
Male 223 44.4 186 44.7 0.93 Female 279 55.6 230 55.3
Missing -- -- -- --
Race
White 463 92.2 389 93.5
0.54 Other 30 6.0 23 5.5 Unknown 9 1.8 4 1.0 Missing -- -- -- --
Ethnicity
Hispanic 477 95.0 385 92.6 0.12 Non-Hispanic 25 5.0 31 7.5
Missing -- -- -- --
Age
Mean 40.7 -- 40.9 -- 0.89
(SD) 12.8 -- 12.9 --
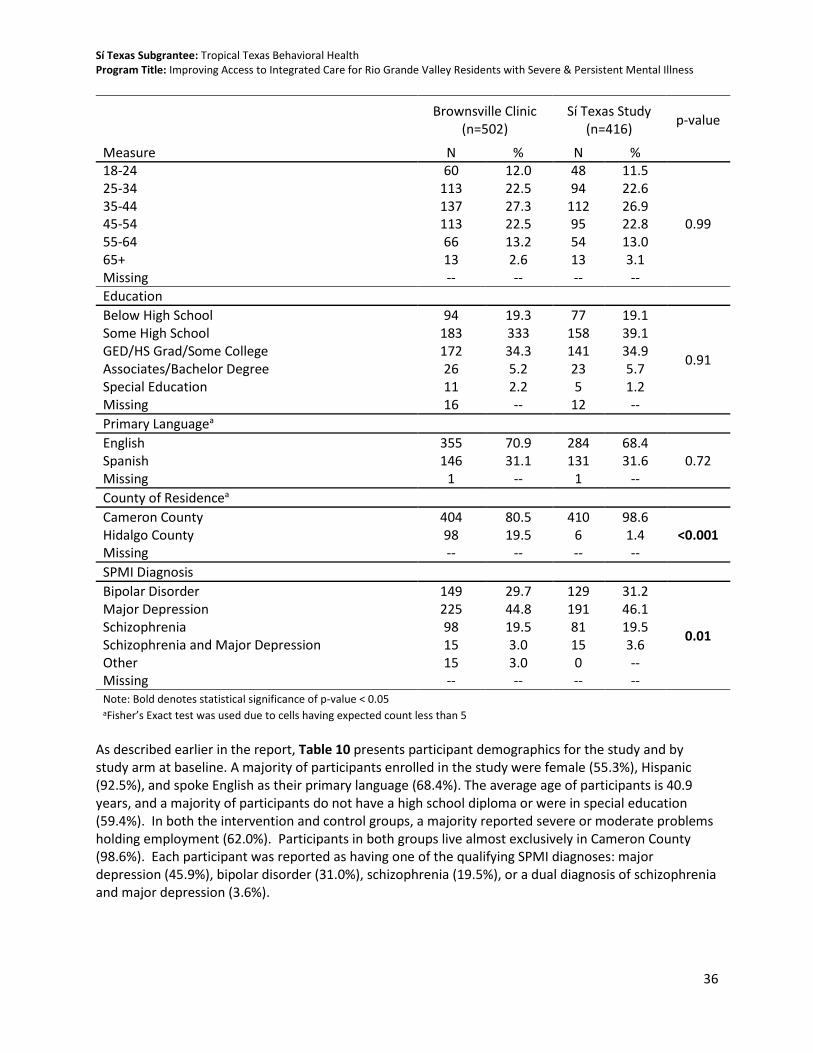
Sí Texas Subgrantee: Tropical Texas Behavioral Health Program Title: Improving Access to Integrated Care for Rio Grande Valley Residents with Severe & Persistent Mental Illness
36
Brownsville Clinic
(n=502) Sí Texas Study
(n=416) p-value
Measure N % N % 18-24 60 12.0 48 11.5
0.99
25-34 113 22.5 94 22.6 35-44 137 27.3 112 26.9 45-54 113 22.5 95 22.8 55-64 66 13.2 54 13.0 65+ 13 2.6 13 3.1 Missing -- -- -- --
Education
Below High School 94 19.3 77 19.1
0.91
Some High School 183 333 158 39.1 GED/HS Grad/Some College 172 34.3 141 34.9 Associates/Bachelor Degree 26 5.2 23 5.7 Special Education 11 2.2 5 1.2 Missing 16 -- 12 --
Primary Languagea
English 355 70.9 284 68.4 0.72 Spanish 146 31.1 131 31.6
Missing 1 -- 1 --
County of Residencea
Cameron County 404 80.5 410 98.6 <0.001 Hidalgo County 98 19.5 6 1.4
Missing -- -- -- --
SPMI Diagnosis
Bipolar Disorder 149 29.7 129 31.2
0.01
Major Depression 225 44.8 191 46.1 Schizophrenia 98 19.5 81 19.5 Schizophrenia and Major Depression 15 3.0 15 3.6 Other 15 3.0 0 -- Missing -- -- -- -- Note: Bold denotes statistical significance of p-value < 0.05 aFisher’s Exact test was used due to cells having expected count less than 5
As described earlier in the report, Table 10 presents participant demographics for the study and by study arm at baseline. A majority of participants enrolled in the study were female (55.3%), Hispanic (92.5%), and spoke English as their primary language (68.4%). The average age of participants is 40.9 years, and a majority of participants do not have a high school diploma or were in special education (59.4%). In both the intervention and control groups, a majority reported severe or moderate problems holding employment (62.0%). Participants in both groups live almost exclusively in Cameron County (98.6%). Each participant was reported as having one of the qualifying SPMI diagnoses: major depression (45.9%), bipolar disorder (31.0%), schizophrenia (19.5%), or a dual diagnosis of schizophrenia and major depression (3.6%).

Sí Texas Subgrantee: Tropical Texas Behavioral Health Program Title: Improving Access to Integrated Care for Rio Grande Valley Residents with Severe & Persistent Mental Illness
37
Table 10. Participant Demographic Measures
Full Sample
(n=416)
Brownsville Intervention
(n=249)
Brownsville Control (n=167)
p-value Measure N % N % N %
Sex
Male 186 44.7 112 45.0 74 44.3 0.89 Female 230 55.3 137 55.0 93 55.7
Missing -- -- -- -- -- --
Racea
White 389 93.5 231 92.8 158 94.6
0.35
Native Hawaiian/Pacific Islander
1 0.2 0 0.0 1 0.6
Other 22 5.3 16 6.4 6 3.6 Unknown 4 1.0 2 0.8 2 1.2 Missing -- -- -- -- -- --
Ethnicity
Hispanic 385 92.5 226 90.8 159 95.2
0.21 White 13 3.1 9 3.6 4 2.4 Non-Hispanic 18 4.3 14 5.6 4 2.4 Missing -- -- -- -- -- --
Age
Mean 40.9 -- 41.0 -- 40.7 -- 0.82
(SD) (12.9) -- (12.5) -- (13.4) -- 18-24 48 11.5 30 12.0 18 10.8
0.27
25-34 94 22.6 49 19.7 45 26.9 35-44 112 26.9 69 27.7 43 25.7 45-54 95 22.8 61 24.5 34 20.4 55-64 54 13.0 35 14.1 19 11.4 65+ 13 3.1 5 2.0 8 4.8 Missing -- -- -- -- -- --
Educationa
Below High School 77 19.1 41 16.9 36 22.2
0.66
Some High School 158 39.1 100 41.3 58 35.8 GED/HS Grad/Some College
141 34.9 86 35.5 55 34.0
Associates/Bachelor Degree
23 5.7 13 5.4 10 6.2
Special Education 5 1.2 2 0.8 3 1.9 Missing 12 -- 7 -- 5 --
Employment Status
No Evidence of Problems 52 12.5 32 12.9 20 12.0
0.58
History of Problems, Mild 11 2.7 6 2.4 5 3.0 Moderate Problems 14 3.4 11 4.4 3 1.8 Severe Problems 243 58.6 146 58.9 97 58.1 N/A 95 22.9 53 21.4 42 25.1 Missing 1 -- 1 -- -- --

Sí Texas Subgrantee: Tropical Texas Behavioral Health Program Title: Improving Access to Integrated Care for Rio Grande Valley Residents with Severe & Persistent Mental Illness
38
Full Sample
(n=416)
Brownsville Intervention
(n=249)
Brownsville Control (n=167)
p-value Measure N % N % N %
Primary Languagea
English 284 68.4 173 69.8 111 66.5 0.71 Spanish 131 31.6 75 30.2 56 33.5
Missing 1 -- 1 -- -- --
County of Residencea
Cameron County 410 98.6 245 98.4 165 98.8 0.99 Hidalgo County 6 1.4 4 1.6 2 1.2
Missing -- -- -- -- -- --
SPMI Diagnosis
Bipolar Disorder 129 31.0 78 31.3 51 30.5
0.30
Major Depression 191 45.9 112 45.0 79 47.3 Schizophrenia 81 19.5 53 21.3 28 16.8 Schizophrenia and Major Depression
15 3.6 6 2.4 9 5.4
Missing -- -- -- -- -- -- aFisher’s Exact test was used due to cells having expected count less than 5
Table 11 describes participant impact measures at baseline. For most of the impact measures, the control group started the study with higher measurements. The exception is the intervention group began with a higher mean total cholesterol than the control group. As previously mentioned, in the assessment of baseline equivalence, there is a statistically significant difference between the study groups for systolic blood pressure.
Table 11. Descriptive Statistics for Baseline Impact Measures
Full Sample Brownsville Intervention v. Brownsville Control
Mean (SD) Mean (SD) Mean (SD) p-value
Systolic Blood Pressure 127.2 (18.3) 125.6 (18.6) 129.6 (17.5) 0.03 Diastolic Blood Pressure 79.0 (10.3) 78.8 (10.2) 79.3 (10.4) 0.60 BMI 33.8 (8.3) 33.7 (7.6) 34.0 (9.3) 0.71 Cholesterol 187.0 (44.9) 188.5 (46.1) 184.9 (42.9) 0.43 PHQ-9 11.7 (6.6) 11.4 (6.4) 12.2 (7.0) 0.26
Non-Parametric Testsa Median (SD) Median (SD) Median (SD)
HbA1c 5.7 (1.7) 5.6 (1.9) 5.7 (1.3) 0.88 ANSA 2.0 (2.3) 2.0 (2.4) 2.0 (2.1) 0.81 Note: Bold denotes statistical significance of p-value < 0.05 a The Wilcoxon Signed Rank test was used to examine non-normally distributed data
Patient Flow Description A patient flow diagram, following the CONSORT structure, is presented in Figure 1 (Schulz et al., 2010). This diagram depicts the study process from assessment of eligibility, to enrollment and randomization, ending with retention and analysis. Sample sizes are provided throughout to show where there was participant attrition. Qualitative reasons for any ineligibility, withdrawal, or lost-to-follow-up are provided where applicable. In the “enrollment” stage, the 41 participants who were excluded did not

Sí Texas Subgrantee: Tropical Texas Behavioral Health Program Title: Improving Access to Integrated Care for Rio Grande Valley Residents with Severe & Persistent Mental Illness
39
meet one or more of the eligibility criteria and could not be allowed to participate. In the “follow-up” stage, those participants categorized as “lost to follow-up” did not complete an assessment at that time point, but did not withdraw from the study. Due to the lack of official withdrawal from the study, those who were lost to follow-up at 6 months remained in the study and were still eligible to complete a 12-month assessment. The patient flow diagram is presented on the following page.

Sí Texas Subgrantee: Tropical Texas Behavioral Health Program Title: Improving Access to Integrated Care for Rio Grande Valley Residents with Severe & Persistent Mental Illness
40
Figure 1. Patient Flow Description
•
ENR
OLL
MEN
T Assessed for eligibility (n=457)
Excluded (n=41) Reason #1: Client had their own Primary Care provider Reason #2: Client had no verifiable chronic condition Reason #3: Client did not agree to return to Behavioral Health services for an ANSA/PHQ9 assessment
ALL
OC
ATI
ON
Randomized (n=416)
Allocated to intervention group (n=249)
Allocated to the control group (n=167)
FOLL
OW
-UP
➢ Completed 6-month follow-up (n=175) Lost to follow-up (n=48)
• Client has their own PC provider • Unable to contact client • Moved outside service area
Withdrawn from study (n=26) • Client has their own PC provider • Refused services & study due to
long wait times • Refused PC services due to
higher co-pay ➢ Completed 12-month follow-up (n=155)
Lost to follow-up (n=62) • Moved outside our service area • Unable to contact client
Withdrawn from study (n=6) • Client has their own PC provider • Client passed away • Client has new insurance & TTBH
not in the network • Withdrew due to job schedule
➢ Completed 6-month follow-up (n=120) Lost to follow-up (n=44)
• Unable to contact client • No-show to appointments • Non-compliant; dropped from
BH services Withdrawn from study (n=3)
• Refused to return to BH services • Client is in jail • No answer from client
➢ Completed 12-month follow-up (n=116) Lost to follow-up (n=46)
• Client was deported • Client was discharged BH
services • Non-compliant; dropped from
BH services Withdrawn from study (n=2)
• Moved outside our service area • Client is in jail
AN
ALY
SIS
Analyzed (n=155) Analyzed (n=116)

Sí Texas Subgrantee: Tropical Texas Behavioral Health Program Title: Improving Access to Integrated Care for Rio Grande Valley Residents with Severe & Persistent Mental Illness
41
Sample Recruitment, Retention and Attrition
Participant Eligibility and Recruitment TTBH recruited existing patients who presented at the Brownsville clinic for scheduled behavioral health services. When a patient potentially eligible for the study entered the clinic, he or she was required to complete a behavioral health care service eligibility screening and assessment. The assessment was performed by a behavioral health care assistant. Potential participants were asked a series of eligibility questions. Eligibility criteria, which did not deviate from the SEP, included:
• Reside in Cameron, Hidalgo, or Willacy County
• Have a severe, persistent mental illness as diagnosed by a licensed behavioral health care provider
• Be eligible to receive behavioral health services from TTBH
• Must not be receiving any primary care outside of TTBH (as ascertained via patient self-report)
• Have a diagnosis of one or more chronic conditions: o Hypertension (blood pressure of 140/90 mmHg or higher) o Obesity (body mass index of 30.0 or higher) o Poorly controlled diabetes (HbA1c over 8.5%) o Hypercholesterolemia (Total cholesterol level above 200)
If the patient qualified for the study, the patient was then asked to review and voluntarily sign the informed consent. This included consenting to the randomization process, volunteering to take all baseline and follow-up surveys, volunteering to have vitals (e.g., blood pressure, height, weight) and blood work (to assess HbA1c and total cholesterol) taken during the study, and understanding that they were part of a research study. Those participants who did not consent to the study or who were unable to consent to the study were referred to other TTBH usual care behavioral health services. Enrollment was conducted on a rolling basis between November 2015 and June 2016. Sample Enrollment and Retention Participant enrollment began in November 2015 and continued through June 2016. This was a deviation from the planned timeline in the SEP, which presented an initial enrollment timeline of December 2015-May 2016. Enrollment started one month earlier—in November 2015—with only five participants to ensure the enrollment process ran smoothly. Enrollment concluded in June 2016 instead of May 2016 to provide additional time to achieve initial targets. The final timeline is presented in Appendix A. The enrollment target was 364 participants total across the two groups. TTBH successfully met—and went beyond—the enrollment target by enrolling 416 into their study sample combined (see Figure 2). In terms of baseline study group enrollment, TTBH met their target enrollment for the intervention group (249 were randomized into the intervention group) and achieved 92% target enrollment for the control group (167 were randomized into the control group).

Sí Texas Subgrantee: Tropical Texas Behavioral Health Program Title: Improving Access to Integrated Care for Rio Grande Valley Residents with Severe & Persistent Mental Illness
42
Figure 2. Cumulative Baseline Enrollment
84 132 176 216 237 249
51
82
113
144 160 167
135
214
289
360
397416
0
50
100
150
200
250
300
350
400
450
0
50
100
150
200
250
300
350
400
450
Jan-16 Feb-16 Mar-16 Apr-16 May-16 Jun-16
Intervention Control100% Target 80% Enrollment TargetMonthly Cumulative Total
For 6-month follow-up data collection, TTBH collected data starting from 60 days before a participant’s 6-month enrollment anniversary date up through 30 days after the anniversary date. A similar follow-up window was implemented for 12-month data collection. TTBH began assessing participants for their 6-month follow-ups in May 2016 and completed follow-ups in January 2017. Twelve-month follow-ups began in November 2016 and concluded in June 2017. Table 12 presents subgrantee reported information on the number of participants who returned for 6-month and 12-month follow-up January and June 2017 respectively, by study arm. TTBH exceeded their retention goal by 7% for the intervention group (175 out of 249 returned for a 6-month follow-up assessment, 164 needed to maintain power). The control group was slightly behind its retention targets at 6 months, retaining 73% of the sample retention target. Retention trends were similar at 12 months with the intervention group exceeding its target by 6% (155 of 249 returning for a 12-month follow-up, 145 needed). The control group ended the study retaining 69% of their target (116 of 167 returning for a 12-month assessment, 145 needed). In the end, the final sample was 271 participants, slightly shy of the 290 that was expected for sufficient power.

Sí Texas Subgrantee: Tropical Texas Behavioral Health Program Title: Improving Access to Integrated Care for Rio Grande Valley Residents with Severe & Persistent Mental Illness
43
Table 12. Final Assessment of Follow-up Retention at 6 and 12 Months
Group Number Enrolled
Retention Target (assumes 10-20% attrition from enrollment)
Number Retained (i.e., completed assessment at 6 months)
Percent of Retention of the Enrolled Sample
Percent of Retention Target
6-month Retention
Intervention Group
249 164 175 70% 107%
Control Group 167 164 120 72% 73%
Total Sample 416 328 295 71% 90%
12-month Retention
Intervention Group
249 145 155 62% 106%
Control Group 167 145 116 69% 80%
Total Sample 416 290 271 65% 93%
TTBH reported to HRiA via conference calls that their incentive program was instrumental in ensuring participants return for their reassessments at 6- and 12-month assessments. Other factors attributed to retention success were quality in implementing recruitment strategies, effective follow-up with patients to schedule assessments, scheduling patients to return when other appointments (e.g., behavioral health care) are already planned, and a high level of staffing at the Brownsville clinic dedicated to retention. TTBH also reported their regular meetings and discussions with their team to improve study processes helped their retention efforts. The implementation evaluation section of this report describes these strategies and observations in more detail. Sample Attrition Analyses While the intervention group target was met, the attrition for both the intervention and control groups was slightly larger than anticipated, although this is not surprising given the additional challenges the SPMI population faces. The study anticipated 80% retention of the sample at 12 months. At 12 months, the overall study sample had 65% retention, with 62% retention in the intervention group and 69% retention in the control group. To examine whether this 7% difference was statistically significant, a chi-square test was performed comparing the proportion of participants who were lost to follow-up in the intervention to those who were lost to follow-up in the control group. The results of this analysis were not statistically significant at the 0.05 level. Given these results, the two study groups did not have significantly differing attrition rates after 12 months of follow-up. Although differential attrition between groups is not a concern for the end-point analyses, the overall attrition rate was higher than anticipated. To explore the potential influence this may have had on results, bivariate analyses were conducted to examine whether participants who were lost to follow-up were significantly different than those who remained in the study, for the entire sample and within each study arm across demographic characteristics and baseline health measures. T-tests were used for continuous measures and chi-square tests for categorical data. Fisher’s Exact Test was utilized if the expected cell counts were less than 5 and non-parametric tests were performed on non-normally distributed data. Appendix G presents all of the results from these analyses.

Sí Texas Subgrantee: Tropical Texas Behavioral Health Program Title: Improving Access to Integrated Care for Rio Grande Valley Residents with Severe & Persistent Mental Illness
44
There were no statistically significant differences in health measures at baseline between those who were lost to follow-up and those who remained in the study at 12 months in either intervention or control group. There were some statistically significant differences by demographics. Overall, those who were lost to follow-up were more likely to be male and English-speaking than those who remained in the study. A logistic regression model was then utilized to understand the influence of these differences in predicting a participant’s likelihood to drop out of the study. In this model, intervention status did not have a statistically significant influence on the likelihood of being lost to follow-up. Aligning with previous results, only sex and language spoken significantly predicted the likelihood of being lost to follow-up. Because the attrition differences were not significant between groups and these two characteristics were balanced at both baseline and end-point, attrition bias is not of concern in interpreting the results of the study. Sample Retention Strategies Loss of participants during a research trial follow-up can introduce bias and reduce power which affects the internal validity and generalizability of study results. TTBH’s study design called for baseline and two follow-ups at 6 and 12 months. The study’s goal was that sample attrition was less than 20% over the 12-month period. However, the SPMI population, due to the nature of the mental health conditions involved, is an elusive population to retain in a health care setting, much less a research study. Studies have demonstrated that SPMI patients are frequently lost to follow-up in studies without strategies to address attrition (Kim et al., 2014). Sample losses of over 20% among severely mentally ill study participants are not uncommon, even with appropriate planning to retain participants. Given this challenge to reach the study population, TTBH employed several strategies to retain study participants:
1. TTBH countered sample attrition by collecting as many contact methods as possible from the study participant during the enrollment process. Study participants were asked to provide their current contact information.
2. To minimize attrition, TTBH oversaw follow-up via care management. The care manager kept in touch with study participants, aiming for a monthly basis using the participant’s preferred mode of communication. The care management staff exhausted all means of communication to reach the participant, including telephone, voicemail, or mail. Email was excluded as a mode of patient communication to prevent disclosure of the participant’s participation in the study. Care managers utilized their relationships with participants and their family and friends to locate and remind participants of their follow-up appointments. Appointments for study follow-up were made for the same day as scheduled primary care or behavioral health care appointments to minimize the number of return trips to the clinic for study participants.
3. Finally, TTBH offered financial incentives to study participants for the intervention and control group. The scientific literature provides evidence that financial incentives improve adherence to medication among the severely mentally ill during clinical trials (Priebe et al., 2013). All study subjects were offered a progressive incentive for completing each of the three assessments. Study subjects received a $10 Walmart or HEB gift card for completing the baseline assessment, a $20 Walmart or HEB gift card for completing the 6-month assessment, and a $30 Walmart or HEB gift card for completing the 12-month assessment. As an update to the SEP, TTBH did not routinely offer transportation vouchers to patients. Some TTBH clients were eligible for transportation services, which was determined through the behavioral health assessment process and had to be included in a patient's approved care plan. This process was similar for

Sí Texas Subgrantee: Tropical Texas Behavioral Health Program Title: Improving Access to Integrated Care for Rio Grande Valley Residents with Severe & Persistent Mental Illness
45
both intervention and control group participants. Among study participants, 6.4% of intervention group and 6.6% of control group participants received transportation services.
Non-Response Bias and Missing Data All data collected for the TTBH evaluation were recorded in TTBH’s Cerner/Anasazi electronic medical record system, including data from the PHQ-9 and ANSA. Both the PHQ-9 and the ANSA have been integrated within the TTBH EMR for several years. To minimize missing and inaccurate data in the TTBH EMR, TTBH provided ongoing training and technical support for all staff members who perform data entry, and conducted regular audits of the data to ensure the completeness. There was a challenge in exporting data on SPMI diagnosis from the EMR which explains why there was a substantial portion of missing data on that variable for the interim report. TTBH resolved this challenge and was able to identify primary diagnosis for all study subjects. All participants recruited for the study met the SPMI diagnosis criteria for eligibility. Missing data on covariates is a potential issue that could lead to biased results. The data collection team made all efforts to minimize missing data through training and use of standard practice measures within the clinic settings captured by the EMR. However, where there were missing data on important covariates, we used imputation approaches (Rubin, 1996). Specifically, multiple imputation approach was used to fill in the missing data in this final analysis and generate imputed complete data sets when needed. These sets were then analyzed using standard procedures. SAS PROC MIANALYZE was used to analyze the imputed datasets and reduced potential bias in effect estimates that can arise when incomplete cases differ systematically from the rest (Little and Rubin, 1987; Rubin, 1996). Regarding the seven study impact measures for the primary end-point analysis, complete baseline data were collected for all participants for each measure. Complete 12-month data were collected for systolic and diastolic blood pressure, HbA1c, total cholesterol, and BMI. There were missing data at 12 months for PHQ-9 and ANSA scores, for 66 and 65 participants respectively. These data are missing because the time of their collection was outside the allowable follow-up window for 12-month data collection. Multiple imputation method was utilized for the primary models of the intervention effect on both these behavioral measures. Results of those imputations and models are presented under the appropriate research questions. There was minimal missing data for demographic variables. All but two impact measures had complete data collected at baseline. Only 10 participants who were missing any demographic data at baseline continued through to the 12-month follow-up. There was one participant with language and 9 participants with education noted as “unknown” which were recoded to missing. As these were used as predictors in the multiple imputations, these were estimated for the PHQ-9 and ANSA score models. In the case of the other five outcomes, since language and education were input as possible predictors for selection, those participants who were missing these baseline data were not included in the models (this is noted under the appropriate research questions). Six-month data were not imputed as the primary impact was focused on an end-point analysis using the 12-month data as the primary end-point, and 6-month models were not performed.
Measures The measures for the impact analysis aligned with the measures presented in the logic model depicted in Appendix B. The impact measures assessed for the TTBH program are HbA1c, blood pressure, Body Mass Index (BMI), depression, total cholesterol, and quality of life. There were no changes to the measures described in TTBH’s SEP and interim report. Information on the number of respondents and tests of normality are provided here (see Table 13). PROC UNIVARIATE in SAS was used to understand

Sí Texas Subgrantee: Tropical Texas Behavioral Health Program Title: Improving Access to Integrated Care for Rio Grande Valley Residents with Severe & Persistent Mental Illness
46
the distributions of these measures at baseline. Both QQ plots and histograms were used to determine if the measure should be treated as normal, be transformed, or treated as non-normal data. Descriptive statistics for each of these measures, including number of participants with or without the impact measures, are included in this final report. Table 13. Impact Measure Sample Size by Follow-up
Measure Sample Size
Baseline 6-month 12-month
Systolic Blood Pressure 416 295 271
Diastolic Blood Pressure 416 295 271
HbA1c 416 295 271
Total Cholesterol 414 295 271
BMI 416 295 271
PHQ-9 416 265 205
ANSA 415 265 206
Five clinical impact measures were measured during this study:
Blood Pressure: Blood pressure is the confirmatory outcome in this study. Blood pressure is usually expressed in terms of the systolic pressure over diastolic pressure and is measured in millimeters of mercury (mmHg). Blood pressure varies depending on situation, activity, and disease states. Blood pressure that is low due to a disease state is called hypotension, and pressure that is consistently high is hypertension. Both have many causes which can range from mild to severe (American Heart Association, 2015). For the TTBH study, blood pressure was measured by the primary care provider for all intervention subjects, manually using a manometer and following clinically-established practice guidelines (National Guidelines Clearinghouse, 2011). Patients with a blood pressure greater than or equal to 140/90 mmHg are considered hypertensive. In addition, the primary care provider determined the need and/or appropriateness of medication. For blood pressure, there were 416 respondents with completed data at baseline, 295 respondents at 6 months, and 271 respondents at 12 months. The distribution of responses for systolic and diastolic at baseline were determined to both be normally distributed. HbA1c: HbA1c levels are routinely measured in the monitoring of people with diabetes. HbA1c levels depend on the blood glucose concentration and are a percentage of total hemoglobin. That is, the higher the glucose concentration in blood, the higher the percentage of HbA1c. Levels of HbA1c are not influenced by daily fluctuations in the blood glucose concentration but reflect the average glucose levels over the prior 6 to 8 weeks. Therefore, HbA1c is a useful indicator of how well the blood glucose level has been controlled in the recent past (over two to three months) and may be used to monitor the effects of diet, exercise, and drug therapy on blood glucose in people with diabetes (American Diabetes Association, 2014). HbA1c is measured by the primary care provider for patients suspected to be diabetic based on: (1) known/self-reported to be diabetic, (2) have an elevated blood glucose at time of clinic visit or are suspected to be diabetic. The primary care provider may suspect a patient to be diabetic based on body weight and/or acanthosis nigricans. Patients with an HbA1c greater than or equal to 8.5% are considered

Sí Texas Subgrantee: Tropical Texas Behavioral Health Program Title: Improving Access to Integrated Care for Rio Grande Valley Residents with Severe & Persistent Mental Illness
47
as eligible for the study based on local clinical procedures in identifying poorly controlled diabetes. In addition, the primary care provider determined the need/appropriateness of medication. For HbA1c, there were 416 respondents with completed data at baseline, 295 respondents at 6 months, and 271 respondents at 12 months. The distribution of responses for HbA1c at baseline was determined to be non-normally distributed. The log transformation was examined, but did not normalize the distribution of HbA1c. Therefore, non-parametric tests were used in bivariate analyses. For linear regression models, the non-normality of the outcome data did not skew the results.
Total Cholesterol: Cholesterol is a fatty substance that is present in all the cells in the body. Total cholesterol is measured through a blood test called lipid profile or panel and is typically expressed in milligrams per deciliter (mg/dL) (Birtcher & Ballantyne, 2004). Total cholesterol is made up of LDL cholesterol, HDL cholesterol, and VLDL cholesterol. A desirable level of total cholesterol is less than 200. The scientific literature shows that elevated levels of LDL cholesterol are associated with an increased risk of developing blockages in the coronary arteries, whereas elevated levels of HDL cholesterol reduce that risk. Total cholesterol will be measured following clinically-established practice guidelines. Patients with an elevated total cholesterol reading are considered to have hypercholesterolemia. The primary care provider determined the need and/or appropriateness of medication. For total cholesterol, there were 414 respondents with completed data at baseline, 295 respondents at 6 months, and 271 respondents at 12 months. The distribution of responses for total cholesterol at baseline was determined to be normally distributed. Body Mass Index (BMI): BMI is generally used as an indicator of body fat. Specific ranges of BMI are accepted in the literature to indicate overweight and obesity, conditions that may lead to health problems. However, BMI itself is not diagnostic of the body fat or health of an individual (National Guideline Clearinghouse, 2014). For the TTBH study, the primary care provider calculated BMI using a clinical weight scale and height measurement instrument following clinically-established practice guidelines (National Guideline Clearinghouse, 2014). Patients in the intervention group with a BMI greater than or equal to 30 are referred to the health educator, dietician, and physical activity coach. For BMI, there were 416 respondents with completed data at baseline, 295 respondents at 6 months, and 271 respondents at 12 months. The distribution of responses for BMI at baseline was determined to be slightly skewed. Using the log transformation of the BMI data for bivariate analyses led to a more normal distribution and therefore the parametric test was used. For linear regression models, the non-normality of the outcome data did not skew the results. Depression: Depression is characterized by depressed or sad mood, diminished interest in activities which used to be pleasurable, weight gain or loss, psychomotor agitation or retardation, fatigue, inappropriate guilt, difficulties concentrating, as well as recurrent thoughts of death. Diagnostic criteria established by the American Psychiatric Association dictate that five or more of the above symptoms must be present for a continuous period of at least two weeks. In addition to being a chronic disease in its own right, the burden of depression is further increased as depression appears to be associated with behaviors linked to other chronic diseases. In most studies, it is difficult to determine whether depression is the result of an unhealthy behavior or whether depression causes the behavior (American Psychiatric Association, 1994).

Sí Texas Subgrantee: Tropical Texas Behavioral Health Program Title: Improving Access to Integrated Care for Rio Grande Valley Residents with Severe & Persistent Mental Illness
48
• Administration method: Depression is measured via provider interview using the PHQ-9 assessment tool. The PHQ-9 is a multipurpose instrument for screening, diagnosing, monitoring and measuring the severity of depression.
• Administration time: The assessment is completed with participants as part of their intake process and at 6 and 12 months by interview.
• Intended respondent: The PHQ-9 is completed with participants.
• Potential score/response range: The PHQ-9 total possible score of 27. The PHQ-9 scoring criteria is categorized as minimal (0-4), mild (5-9), moderate (10-14), moderately severe (15-19) and severe (20-27) depression (Kroenke & Spitzer, 2002). Patients with a score of 5 or higher are referred for behavioral health services.
For PHQ-9 score, there were 416 respondents with completed data at baseline, 265 respondents at 6 months, and 205 respondents at 12 months. The distribution of responses for PHQ-9 score at baseline was determined to be normally distributed. Life functioning: Life functioning is defined as the ability to function physically well in daily life is a key aspect of health. Limitations in physical functioning can lead to reduced quality of life, disability, and increased health costs.
• Administration method: Life functioning is measured via interview by a provider of the ANSA tool. The ANSA is a multi-purpose tool developed to support care planning and level of care decision-making, to facilitate quality improvement initiatives, and to allow for the monitoring of services.
• Administration time: The assessment is completed with participants as part of their intake process and at 6 and 12 months.
• Intended respondent: The ANSA is administered to all participants.
• Potential score/response range: Items that are initially rated a ‘2’ or ‘3’ within an ANSA domain are monitored over time to determine the percent of individuals who move to a rating of ‘0’ or ‘1’ (resolved need, built strength). This move from 2 or 3 to 0 or 1 on either the life functioning or strengths domains will be considered improvement in life functioning.
The life functioning domain of the ANSA tool was used to assess participants’ quality of life and overall physical functioning. This domain is measured by 14 domain constructs. These constructs are scored as either no evidence of problem (0), history/mild (1), moderate (2), or severe (3). For this measure, a functioning score was created as a way of counting the number of moderate or severe scores each participant had for this domain. To create this ANSA functioning score, the construct scores were re-categorized as either no evidence or problem/history/mild (0) and moderate/severe (1). Next, the domain scores (either 0 or 1) were summed and a functioning index value generated for each participant. The total functioning ANSA score could range from 0 to 14, with 0 meaning the participant had no evidence of a problem for any of the domain constructs and 14 meaning the participant had moderate or severe problems for all the domain constructs. For ANSA score, there were 415 respondents with completed data at baseline, 265 respondents at 6 months, and 206 respondents at 12 months. The distribution of responses for ANSA at baseline were determined to be non-normally distributed. The log transformation was examined, but did not normalize the distribution of ANSA score. Therefore, non-parametric tests were used for bivariate analyses. For linear regression models, the non-normality of the outcome data did not skew the results.

Sí Texas Subgrantee: Tropical Texas Behavioral Health Program Title: Improving Access to Integrated Care for Rio Grande Valley Residents with Severe & Persistent Mental Illness
49
Data Collection Activities
Planned data collection activities were executed as described in the SEP without deviation. Clinical data taken during the vitalization process (e.g., blood pressure, height, weight) were entered by a nurse into a laptop computer directly into the patient’s health record. Blood tests for HbA1c and total cholesterol were done on-site, and results were input to the EMR by technicians with roles to run blood tests. The ANSA and PHQ-9 questionnaires were completed via clinician interview and input into TTBH’s EMR system. The clinician conducting the interview for ANSA and PHQ-9 directly entered participant responses into the data entry form in the EMR. The data entry form had built-in validation checks for out-of-range answers. Clinic staff asked participants in which language they would prefer to complete the surveys. Figure 3 depicts the data collection timeline and analyses completed for this study. The data collection time period was elongated slightly from the SEP to provide additional opportunities to meet enrollment and retention targets. The SEP indicated an enrollment period of December 2015-May 2016; a six-month follow-up period of data collection of May 2016-October 2016, and a 12-month follow-up period of October 2016-April 2017. Instead, the study had an enrollment period of November 2015-June 2016; a six-month follow-up period of data collection of May 2016-January 2017, and a 12-month follow-up period of November 2016-June 2017. Data from the study were submitted on a quarterly basis to HRiA by TTBH and then cleaned and assessed for quality. Data cleaning was a lengthy process because of challenges exporting data from TTBH’s EMR. All problems that occurred on export were resolved for this final report. Randomization occurred on the date of enrollment prior to participant assessment of baseline measures, in accordance with the SEP. The elongation of data collection also resulted in a deviation of the SEP in the timeline of final report development. The SEP proposed a final report submittal date of February 2018. To allow for greater engagement in final analyses between TTBH, MHM, and the external evaluator, the final report was completed in May 2018.

Sí Texas Subgrantee: Tropical Texas Behavioral Health Program Title: Improving Access to Integrated Care for Rio Grande Valley Residents with Severe & Persistent Mental Illness
50
Figure 3. Timeline for Data Collection and Analyses for the Final Report
The project coordinator and data manager, who did not have responsibilities for delivering the TTBH intervention, were responsible for monitoring the collection of data at the Brownsville clinic. Program impact measures (both clinic and self-reported) were captured for all intervention and control participants. Data collection procedures for the two study groups were assessed by HRiA to be consistent based on program documentation review. As mentioned earlier in this report, data collected by TTBH was transmitted to HRiA for analysis. HRiA set up a data sharing protocol which included the execution of a Data Use Agreement between TTBH and HRiA, the data sharing procedure, and data sharing timeline. TTBH was part of Cohort 1 and sent their first quarterly data to HRiA in October 2016. Data were shared with HRiA via a secured email account using ProtonMail. Once data were sent, they were reviewed by an HRiA research assistant. TTBH responded to questions about each quarterly data set to ensure quality of the data and effective data cleaning. HRiA and TTBH reviewed a report about the data quality of each quarterly submission collaboratively and worked together to ensure a complete and accurate final data set for the analyses presented in this report.
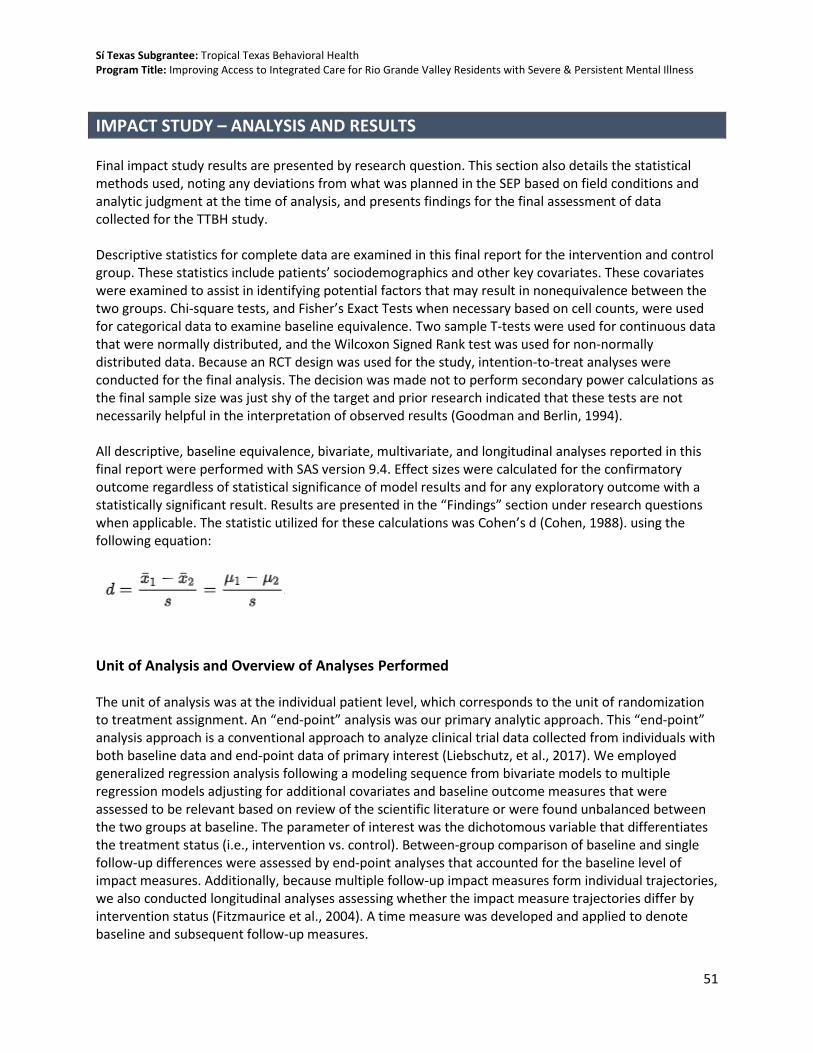
Sí Texas Subgrantee: Tropical Texas Behavioral Health Program Title: Improving Access to Integrated Care for Rio Grande Valley Residents with Severe & Persistent Mental Illness
51
IMPACT STUDY – ANALYSIS AND RESULTS Final impact study results are presented by research question. This section also details the statistical methods used, noting any deviations from what was planned in the SEP based on field conditions and analytic judgment at the time of analysis, and presents findings for the final assessment of data collected for the TTBH study. Descriptive statistics for complete data are examined in this final report for the intervention and control group. These statistics include patients’ sociodemographics and other key covariates. These covariates were examined to assist in identifying potential factors that may result in nonequivalence between the two groups. Chi-square tests, and Fisher’s Exact Tests when necessary based on cell counts, were used for categorical data to examine baseline equivalence. Two sample T-tests were used for continuous data that were normally distributed, and the Wilcoxon Signed Rank test was used for non-normally distributed data. Because an RCT design was used for the study, intention-to-treat analyses were conducted for the final analysis. The decision was made not to perform secondary power calculations as the final sample size was just shy of the target and prior research indicated that these tests are not necessarily helpful in the interpretation of observed results (Goodman and Berlin, 1994). All descriptive, baseline equivalence, bivariate, multivariate, and longitudinal analyses reported in this final report were performed with SAS version 9.4. Effect sizes were calculated for the confirmatory outcome regardless of statistical significance of model results and for any exploratory outcome with a statistically significant result. Results are presented in the “Findings” section under research questions when applicable. The statistic utilized for these calculations was Cohen’s d (Cohen, 1988). using the following equation:
Unit of Analysis and Overview of Analyses Performed The unit of analysis was at the individual patient level, which corresponds to the unit of randomization to treatment assignment. An “end-point” analysis was our primary analytic approach. This “end-point” analysis approach is a conventional approach to analyze clinical trial data collected from individuals with both baseline data and end-point data of primary interest (Liebschutz, et al., 2017). We employed generalized regression analysis following a modeling sequence from bivariate models to multiple regression models adjusting for additional covariates and baseline outcome measures that were assessed to be relevant based on review of the scientific literature or were found unbalanced between the two groups at baseline. The parameter of interest was the dichotomous variable that differentiates the treatment status (i.e., intervention vs. control). Between-group comparison of baseline and single follow-up differences were assessed by end-point analyses that accounted for the baseline level of impact measures. Additionally, because multiple follow-up impact measures form individual trajectories, we also conducted longitudinal analyses assessing whether the impact measure trajectories differ by intervention status (Fitzmaurice et al., 2004). A time measure was developed and applied to denote baseline and subsequent follow-up measures.

Sí Texas Subgrantee: Tropical Texas Behavioral Health Program Title: Improving Access to Integrated Care for Rio Grande Valley Residents with Severe & Persistent Mental Illness
52
In addition to adjusting for key covariates, we also assessed potential collinearity and their impact of the standard error estimates for the covariates in the model by examining variance inflation factor when necessary. Although we stated in the SEP that in areas where multiple comparisons are necessary, we would employ adjustment of the p-value to account for multiple comparisons, such as the Bonferroni correction. This step was ultimately unnecessary for the executed analyses since we did not need to account for multiple comparisons. To evaluate the intervention effect, a multiple linear regression model approach was used following a sequence of models. The analysis sequence began by developing a bivariate model regressing the follow-up outcome measure on intervention status (intervention vs. control) followed by the creation of an adjusted model accounting for the baseline blood pressure level and further adjustment for key covariates. Parametric two sample T-tests were used for bivariate analysis of the confirmatory impact measure as well as some of the exploratory study outcomes. Two exploratory outcomes, ANSA and HbA1c, were found to be non-normally distributed. In bivariate analyses, non-parametric Wilcoxon Rank Sum tests were conducted due to the increased sensitivity to detect a difference in non-normally distributed data. The non-parametric results are presented throughout this report; however, additional parametric T-tests were performed for these measures to align with linear regression methods for the final analyses. Though the parametric results are not presented, both the non-parametric and parametric bivariate analyses detected no differences in these measures by study group. Following bivariate comparisons, multivariate and longitudinal analyses were performed separately to answer each research question: the primary adjusted multivariate analysis modeling the outcome of interest on intervention status with relevant covariates included and a longitudinal analysis to evaluate whether the impact measure trajectories differ by intervention status. Effect modification of the intervention-outcome relationship was also examined. Based on TTBH’s knowledge of their clinic population, the study population ultimately was healthier and younger than anticipated. To understand if this caused any influence on the resulting impact measures, each baseline comorbidity (hypertension, obesity, hypercholesterolemia, diabetes, and major depression) as well as age were considered as potential effect modifiers to be evaluated for each of the 12-month impact measures. Age was dichotomized (40 years and older/under 40 years old) when considered as an effect modifier. This decision was based on the average age of the overall study population of 40.9 years. The SEP indicated a set of planned covariates for adjustment in the models. Of those listed, age (continuous and categorical), gender, physical morbidities, and time were included in one or more of the analyses. Categorical age was operationally defined by the following categories: 18-24-year-olds, 25-34 year-olds, 35-44-year-olds, 45-54 year-olds, 55-64 year-olds, and those who are 65 years or older. There were deviations from the SEP regarding the final definition of covariates that were included in the models as adjustments. Race is listed in the SEP as a covariate; however, an ethnicity variable was used in the final models, dichotomized into “Hispanic” and “non-Hispanic” categories due to field conditions and how the data collection procedures at the clinic were applied. Additional variables were also adjusted for in all models, including “education” and “language spoken.” Education was dichotomized into “less than high school” and “high school or more.” Language was treated as a categorical variable grouped as “English-speaking” or “Spanish-speaking.” An “end-point” analysis was our primary analytic approach. To derive a more parsimonious model, we employed backward elimination modeling selection where covariates with p-value larger than 0.15 were excluded from the final model. We mentioned in the SEP that there was the potential for clustering of patients nested within the same provider and that we would employ generalized estimating equations

Sí Texas Subgrantee: Tropical Texas Behavioral Health Program Title: Improving Access to Integrated Care for Rio Grande Valley Residents with Severe & Persistent Mental Illness
53
method to adjust for the clustering and evaluate the design-corrected standard error. However, this adjustment was not necessary for the final analyses. Though this is a deviation from the SEP, the lack of this adjustment is not statistically concerning. At any time, there was only one provider that was part of the intervention. Because there was no choice regarding what provider a participant could see, clustering by providers is not applicable.
Blood Pressure Question 1. Are SPMI patients who receive coordinated co-located services more likely to reduce their blood pressure after 12 months compared to SPMI patients who receive only behavioral health care services? This question is confirmatory. Overview of Analysis To examine this question, both systolic and diastolic blood pressures were evaluated. To understand if there was any change in blood pressure due to the intervention, both measures were analyzed separately; however, as per the SEP, systolic blood pressure is the representative measure of change in blood pressure in the study sample. While systematic checks for outliers were performed and questions sent to study site staff for verification on a quarterly basis, there were no unique data cleaning processes needed for systolic or diastolic blood pressures. For bivariate analyses, the total sample size for these two measures was 271 participants. For the primary end-point models for systolic and diastolic blood pressure, the total sample was 261 participants each. This is ten fewer than the total 12-month sample (n=271) due to missing language or education data. For the longitudinal analysis, the sample size is 324 participants. These are participants who had a baseline visit and at least one follow-up assessment (at either 6 or 12 months) at which blood pressure data were collected. Descriptive Statistics and Bivariate Comparisons At the end of this section, Table 36 presents the mean systolic and diastolic blood pressure data in each study period for the overall sample as well as the intervention and control groups. The overall sample had a mean blood pressure of 127.2/79.0 mmHg at baseline. This decreased to 118.2/73.0 mmHg at 6-month follow-up and remained relatively stable through 12-month follow-up (118.6/73.9 mmHg). The intervention group began the study with a lower mean blood pressure, 125.6/78.8 mmHg at baseline while the control group had a higher mean blood pressure of 129.6/79.3 mmHg at baseline. As with the overall sample trend, each group’s mean blood pressure decreased at 6 months and remained relatively stable through 12-month follow-up. In the intervention group, the mean blood pressure at 6 months was 116.9/72.5 mmHg and 117.3/73.4 mmHg at 12 months; in the control group, the 6-month mean blood pressure was 120.1/73.6 mmHg and 120.3/74.6 mmHg at the 12-month follow-up. As previously noted in Table 7, there was a statistically significant difference between the intervention and control group at baseline for systolic blood pressure even though the groups were balanced at baseline for diastolic blood pressure. Bivariate analyses were performed within each study group, testing the statistical significance of the change in impact measures from baseline to 12-month follow-up. These bivariate analyses did not control for any additional covariates. The decreases from baseline to 12-month follow-up within each study group for systolic and diastolic blood pressure were statistically significant. The decrease was greater within the intervention than within the control group. Bivariate analyses were also performed between the intervention and control groups comparing mean impact measures at 12-month follow-up. Based on p values greater than 0.05 for both systolic and
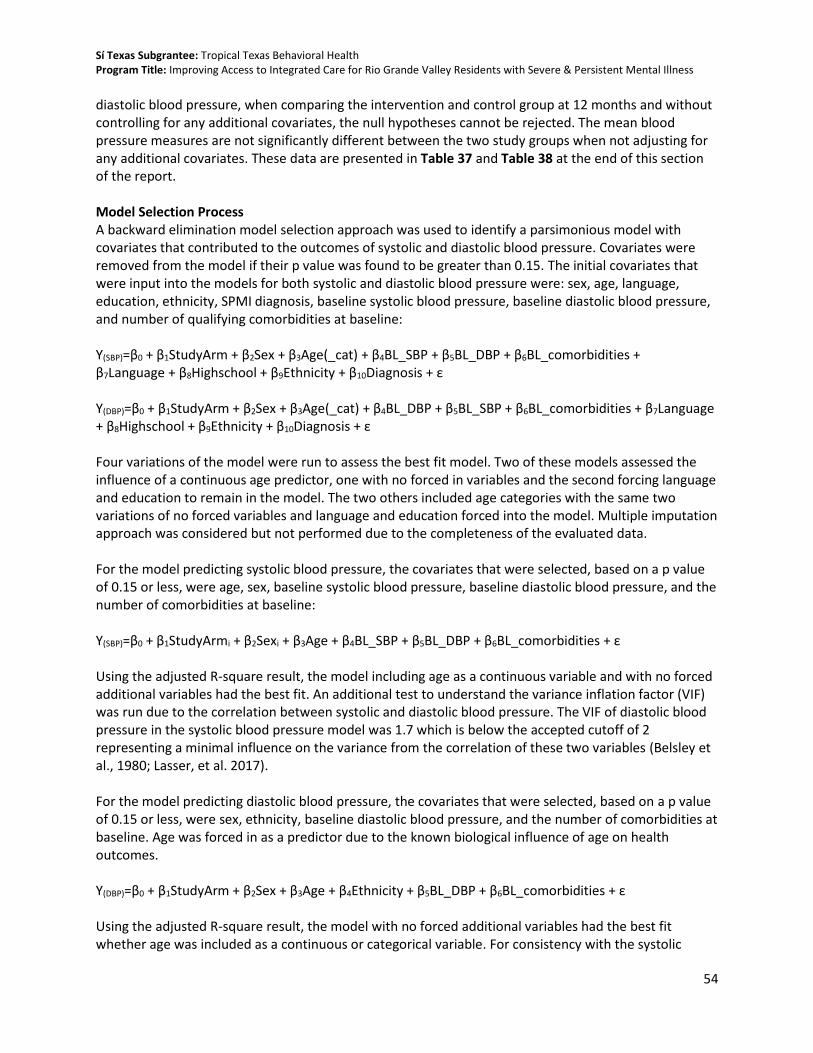
Sí Texas Subgrantee: Tropical Texas Behavioral Health Program Title: Improving Access to Integrated Care for Rio Grande Valley Residents with Severe & Persistent Mental Illness
54
diastolic blood pressure, when comparing the intervention and control group at 12 months and without controlling for any additional covariates, the null hypotheses cannot be rejected. The mean blood pressure measures are not significantly different between the two study groups when not adjusting for any additional covariates. These data are presented in Table 37 and Table 38 at the end of this section of the report. Model Selection Process A backward elimination model selection approach was used to identify a parsimonious model with covariates that contributed to the outcomes of systolic and diastolic blood pressure. Covariates were removed from the model if their p value was found to be greater than 0.15. The initial covariates that were input into the models for both systolic and diastolic blood pressure were: sex, age, language, education, ethnicity, SPMI diagnosis, baseline systolic blood pressure, baseline diastolic blood pressure, and number of qualifying comorbidities at baseline: Y(SBP)=β0 + β1StudyArm + β2Sex + β3Age(_cat) + β4BL_SBP + β5BL_DBP + β6BL_comorbidities + β7Language + β8Highschool + β9Ethnicity + β10Diagnosis + ε Y(DBP)=β0 + β1StudyArm + β2Sex + β3Age(_cat) + β4BL_DBP + β5BL_SBP + β6BL_comorbidities + β7Language + β8Highschool + β9Ethnicity + β10Diagnosis + ε
Four variations of the model were run to assess the best fit model. Two of these models assessed the influence of a continuous age predictor, one with no forced in variables and the second forcing language and education to remain in the model. The two others included age categories with the same two variations of no forced variables and language and education forced into the model. Multiple imputation approach was considered but not performed due to the completeness of the evaluated data. For the model predicting systolic blood pressure, the covariates that were selected, based on a p value of 0.15 or less, were age, sex, baseline systolic blood pressure, baseline diastolic blood pressure, and the number of comorbidities at baseline: Y(SBP)=β0 + β1StudyArmi + β2Sexi + β3Age + β4BL_SBP + β5BL_DBP + β6BL_comorbidities + ε Using the adjusted R-square result, the model including age as a continuous variable and with no forced additional variables had the best fit. An additional test to understand the variance inflation factor (VIF) was run due to the correlation between systolic and diastolic blood pressure. The VIF of diastolic blood pressure in the systolic blood pressure model was 1.7 which is below the accepted cutoff of 2 representing a minimal influence on the variance from the correlation of these two variables (Belsley et al., 1980; Lasser, et al. 2017). For the model predicting diastolic blood pressure, the covariates that were selected, based on a p value of 0.15 or less, were sex, ethnicity, baseline diastolic blood pressure, and the number of comorbidities at baseline. Age was forced in as a predictor due to the known biological influence of age on health outcomes. Y(DBP)=β0 + β1StudyArm + β2Sex + β3Age + β4Ethnicity + β5BL_DBP + β6BL_comorbidities + ε Using the adjusted R-square result, the model with no forced additional variables had the best fit whether age was included as a continuous or categorical variable. For consistency with the systolic

Sí Texas Subgrantee: Tropical Texas Behavioral Health Program Title: Improving Access to Integrated Care for Rio Grande Valley Residents with Severe & Persistent Mental Illness
55
blood pressure model, the diastolic model with age as a continuous variable was selected. An additional test to understand the variance inflation factor (VIF) was run due to the documented correlation between systolic and diastolic blood pressure. The VIF of systolic blood pressure in the diastolic blood pressure model was 1.9 which is below the commonly accepted cutoff of 2 representing a minimal influence on the variance from the correlation of these two variables (Belsley et al., 1980; Lasser, et al. 2017). Findings Estimates for the final models of systolic and diastolic blood pressure are presented in Table 14. On average, for participants in the intervention group, there is a 3.86 mmHg decrease in systolic blood pressure at 12 months holding all other variables in the selected model constant compared to participants in the control group. This result is statistically significant with a p value of 0.04; the effect size (using Cohen’s d) is 0.22. Below is the selected model with each covariate’s effect estimate included. Y(SBP)=54.12 + -3.86(Intervention) + 7.37(Male) + 0.14(Age) + 0.15(BL_SBP) + 0.42(BL_DBP) + 2.73(BL_comorbidities) + ε On average, for participants in the intervention group, there is a 2.05 mmHg decrease in diastolic blood pressure at 12 months holding all other variables in the selected model constant compared to participants in the control group. Unlike with systolic blood pressure, this result is not statistically significant with a p value of 0.08; the effect size (using Cohen’s d) is 0.19. Below is the final selected model with each covariate’s effect estimate. Y(DBP)=39.71 + -2.05(Intervention) + 4.29(Male) + 0.02(Age) + -4.55(non-Hispanic) + 0.36(BL_DBP) + 2.39(BL_comorbidities) + ε Table 14. Twelve-Month Blood Pressure Primary Model Effects for Full TTBH Sample
Variable Selected Systolic Blood Pressure (n=261)
Estimate (β) Standard Error p-value Intervention -3.86 1.89 0.04
Control 0 -- --
Male 7.37 1.94 <0.001 Female 0 -- --
Age (continuous) 0.14 0.07 0.07 Baseline SBP 0.15 0.07 0.03 Baseline DBP 0.42 0.12 <0.001 # Comorbidities at Baseline 2.73 1.18 0.02
Variable Selected Diastolic Blood Pressure (n=261)
Estimate (β) Standard Error p-value
Intervention -2.05 1.15 0.08
Control 0 -- --
Male 4.29 1.20 <0.001

Sí Texas Subgrantee: Tropical Texas Behavioral Health Program Title: Improving Access to Integrated Care for Rio Grande Valley Residents with Severe & Persistent Mental Illness
56
Female 0 -- --
Age (continuous)a 0.02 0.05 0.73
Non-Hispanic -4.55 2.63 0.08
Hispanic 0 -- --
Baseline DBP 0.36 0.06 <0.001
# Comorbidities at Baseline
2.39 0.69 <0.001
Note: Bold denotes statistical significance of p-value < 0.05 a Forced back into the model
There were no statistically significant effect modifications for systolic or diastolic blood pressure. The models considered included interaction terms of study group and baseline hypertension, diabetes, obesity, hypercholesterolemia, major depression, and age (under forty compared to forty and over). Additional Analyses We conducted longitudinal analyses to examine time as an independent variable and whether the outcome trajectories differ by intervention status. In the model, we utilized the PROC MIXED procedure in SAS. For systolic blood pressure, only adjusting for intervention status and time, there was no significant time/group interaction with a p value of 0.98, indicating that the trajectories from baseline to 6 months, and then to 12 months were not different between the two study arms for systolic blood pressure (see Table 15). Adjusting for the covariates that were selected in the primary model—baseline diastolic blood pressure, baseline number of comorbidities, age, and sex—did not alter these results. For diastolic blood pressure, only adjusting for intervention status and time, there was no significant time/group interaction with a p value of 0.23, indicating that the trajectories from baseline to 6 months, and then to 12 months were not different between the two study arms for diastolic blood pressure (see Table 15). Adjusting for the covariates that were selected in the primary model—baseline systolic blood pressure, baseline number of comorbidities, age, and sex—did not alter these results. Table 15. Blood Pressure Longitudinal Model Effects for Full TTBH Sample
Variable Systolic Blood Pressure (n=324)
Estimate (β) Standard Error p-value Time*Intervention 0.05 2.19 0.98
Time*Control 0 -- --
Time -9.39 1.66 <0.001
Intervention -3.54 1.68 0.04
Control 0 -- --
Variable Selected Diastolic Blood Pressure (n=324)
Estimate (β) Standard Error p-value
Time*Intervention -1.55 1.28 0.23
Time*Control 0 -- --
Time -4.54 0.97 <0.001
Intervention -0.47 0.96 0.62
Control 0 -- --

Sí Texas Subgrantee: Tropical Texas Behavioral Health Program Title: Improving Access to Integrated Care for Rio Grande Valley Residents with Severe & Persistent Mental Illness
57
Limitations The slightly lower than expected sample size of the control group might have contributed to the inability to detect a significant difference in diastolic blood pressure. However, while the power might be lower than anticipated for systolic blood pressure, a statistically significant difference was still detected. With an RCT design, concerns about internal validity are not as relevant due to the randomization procedure; however, a limitation of these results is that their external validity is dependent on to what extent the population in question resembles the final study sample.
HbA1C Level Question 2. Are SPMI patients with a history or diagnosis of diabetes who receive coordinated co-located services more likely to reduce their HbA1c level after 12 months compared to SPMI patients who receive only behavioral health care services? This question is exploratory. Overview of Analysis To examine this question, HbA1c was evaluated. A subpopulation of those with a diabetes diagnosis or history of diabetes is specifically identified as the population of interest. Data were not collected on whether participants had a history of diabetes, but a variable was created indicating whether a participant had diabetes at baseline. Because of the small sample size of the subpopulation, analyses were run on both the subpopulation and the full study sample. While systematic checks for outliers were performed and questions sent to study site staff for verification on a quarterly basis, there were no unique data cleaning processes needed for HbA1c. For bivariate analyses, the total sample size for this measure was 271 participants. The total sample for the primary model in the full study sample was 261 participants. This is ten fewer than the total 12-month sample (n=271) due to missing language or education data. For the longitudinal analysis, the sample size is 324 participants. These are participants who had a baseline visit and at least one follow-up assessment (at either 6 or 12 months) at which HbA1c data were collected. Descriptive Statistics and Bivariate Comparisons A total of 73 participants had diabetes at baseline, 45 in the intervention group and 28 in the control. At 6-month follow-up, there were 53 participants with diabetes at baseline remaining in the study, 30 in the intervention and 23 in the control. At 12-month follow-up, 49 participants with diabetes at baseline completed their last follow-up assessment, 26 in the intervention and 23 in the control (see Table 16). The baseline mean HbA1c for those participants with a diabetes diagnosis at baseline was 9.2%. For those in the intervention group with a diabetes diagnosis at baseline, the baseline mean HbA1c was 9.7% while those in the control group in this subpopulation had a baseline HbA1c of 8.4%. During follow-up, the mean HbA1c in the full subpopulation decreased to 8.0% at 6-months and remained relatively stable through 12-month (8.1%). Those in the intervention group with a diabetes diagnosis at baseline also had a decrease in mean HbA1c at 6-month follow-up to 8.0% which further decreased to 7.3% at 12 months. The decrease in the subpopulation control participants was smaller at 6 months with a mean HbA1c of 8.1% which ultimately increased to 9.0% at 12 months, an average higher than when this group originally began the study. Table 16. HbA1c in Diabetic Subpopulation by Study Arm and Follow-up Period
HbA1c Subpopulation Full Sample Subpopulation Intervention Subpopulation Control
Baseline n=73
6-Mo n=53
12-Mo n=49
Baseline n=45
6-Mo n=30
12-Mo n=26
Baseline n=28
6-Mo n=23
12-Mo n=23
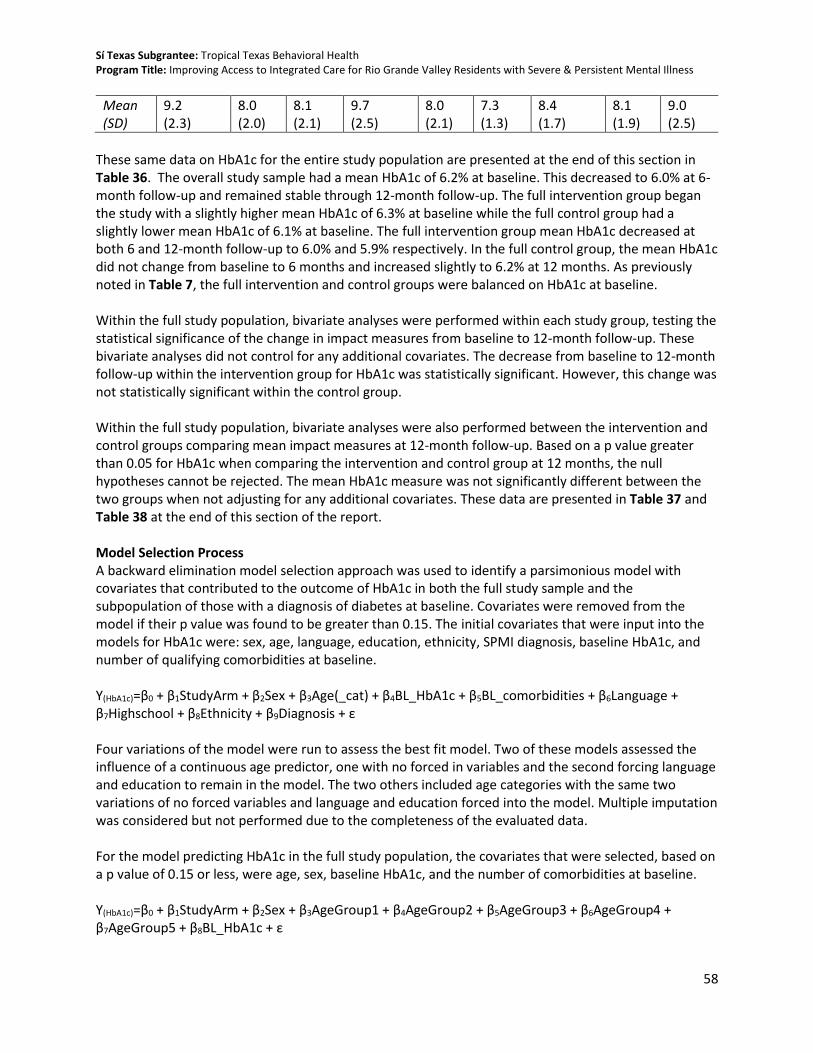
Sí Texas Subgrantee: Tropical Texas Behavioral Health Program Title: Improving Access to Integrated Care for Rio Grande Valley Residents with Severe & Persistent Mental Illness
58
Mean (SD)
9.2 (2.3)
8.0 (2.0)
8.1 (2.1)
9.7 (2.5)
8.0 (2.1)
7.3 (1.3)
8.4 (1.7)
8.1 (1.9)
9.0 (2.5)
These same data on HbA1c for the entire study population are presented at the end of this section in Table 36. The overall study sample had a mean HbA1c of 6.2% at baseline. This decreased to 6.0% at 6-month follow-up and remained stable through 12-month follow-up. The full intervention group began the study with a slightly higher mean HbA1c of 6.3% at baseline while the full control group had a slightly lower mean HbA1c of 6.1% at baseline. The full intervention group mean HbA1c decreased at both 6 and 12-month follow-up to 6.0% and 5.9% respectively. In the full control group, the mean HbA1c did not change from baseline to 6 months and increased slightly to 6.2% at 12 months. As previously noted in Table 7, the full intervention and control groups were balanced on HbA1c at baseline. Within the full study population, bivariate analyses were performed within each study group, testing the statistical significance of the change in impact measures from baseline to 12-month follow-up. These bivariate analyses did not control for any additional covariates. The decrease from baseline to 12-month follow-up within the intervention group for HbA1c was statistically significant. However, this change was not statistically significant within the control group. Within the full study population, bivariate analyses were also performed between the intervention and control groups comparing mean impact measures at 12-month follow-up. Based on a p value greater than 0.05 for HbA1c when comparing the intervention and control group at 12 months, the null hypotheses cannot be rejected. The mean HbA1c measure was not significantly different between the two groups when not adjusting for any additional covariates. These data are presented in Table 37 and Table 38 at the end of this section of the report. Model Selection Process A backward elimination model selection approach was used to identify a parsimonious model with covariates that contributed to the outcome of HbA1c in both the full study sample and the subpopulation of those with a diagnosis of diabetes at baseline. Covariates were removed from the model if their p value was found to be greater than 0.15. The initial covariates that were input into the models for HbA1c were: sex, age, language, education, ethnicity, SPMI diagnosis, baseline HbA1c, and number of qualifying comorbidities at baseline. Y(HbA1c)=β0 + β1StudyArm + β2Sex + β3Age(_cat) + β4BL_HbA1c + β5BL_comorbidities + β6Language + β7Highschool + β8Ethnicity + β9Diagnosis + ε Four variations of the model were run to assess the best fit model. Two of these models assessed the influence of a continuous age predictor, one with no forced in variables and the second forcing language and education to remain in the model. The two others included age categories with the same two variations of no forced variables and language and education forced into the model. Multiple imputation was considered but not performed due to the completeness of the evaluated data. For the model predicting HbA1c in the full study population, the covariates that were selected, based on a p value of 0.15 or less, were age, sex, baseline HbA1c, and the number of comorbidities at baseline. Y(HbA1c)=β0 + β1StudyArm + β2Sex + β3AgeGroup1 + β4AgeGroup2 + β5AgeGroup3 + β6AgeGroup4 + β7AgeGroup5 + β8BL_HbA1c + ε

Sí Texas Subgrantee: Tropical Texas Behavioral Health Program Title: Improving Access to Integrated Care for Rio Grande Valley Residents with Severe & Persistent Mental Illness
59
Using the adjusted R-square result, the model including age as a categorical variable and with no forced additional variables had the best fit. For the model predicting HbA1c in the subpopulation with a baseline diabetes diagnosis, the covariates that were selected, based on a p value of 0.15 or less, were education, baseline HbA1c, and the number of comorbidities at baseline. Age and sex were forced into the model due to their known biological influence on health outcomes. Y(HbA1c)=β0 + β1StudyArm + β2Sex + β3Education + β4AgeGroup1 + β5AgeGroup2 + β6AgeGroup3 + β7AgeGroup4 + β8AgeGroup5 + β9BL_HbA1c + ε Using the adjusted R-square result, the model with age as a categorical variable and sex forced in had the best fit. Findings Estimates by covariate for the final model of HbA1c in the full sample are presented in Table 17. The model among the entire study population indicates that, on average, for participants in the intervention group, there is a 0.36 decrease in HbA1c as a percent of total hemoglobin at 12 months holding all other variables in the selected model constant compared to participants in the control group. This result is statistically significant with a p value of 0.001; the effect size (using Cohen’s d) is 0.26. Below is the selected model with each covariates’ effect estimate included. Y(HbA1c)=2.98 + -0.36(Intervention) + 0.17(Male) + -0.41 (18-24yrs)+ -0.60(25-34yrs) + -0.50(35-44yrs) + -0.10(45-54yrs) + -0.48(55-64yrs) + 0.58(BL_HbA1c) + ε Table 17. Twelve-Month HbA1c Primary Model Effects for Full TTBH Sample
Variable Selected HbA1c (n=261)
Estimate (β) Standard Error p-value
Intervention -0.36 0.11 0.001
Control 0 -- --
Male 0.17 0.11 0.13
Female 0 -- --
18-24 years -0.41 0.37 0.26
25-34 years -0.60 0.34 0.08
35-44 years -0.50 0.33 0.14
45-54 years -0.10 0.34 0.76
55-64 years -0.48 0.35 0.17
65+ years 0 -- --
Baseline HbA1c 0.58 0.04 <0.001 Note: Bold denotes statistical significance of p-value < 0.05
Effect modification was explored with HbA1c as an outcome since the study sample was slightly healthier at baseline than expected. To examine whether there was a differential intervention effect on outcomes among specific groups, effect modification using interaction terms was tested separately for diabetic status, obesity, age, hypertension status, hypercholesterolemia, and major depression status.

Sí Texas Subgrantee: Tropical Texas Behavioral Health Program Title: Improving Access to Integrated Care for Rio Grande Valley Residents with Severe & Persistent Mental Illness
60
The interaction terms that had a significant effect were study group and baseline diabetes status, obesity, and age (under forty compared to forty and over). There was no statistically significant effect modification of HbA1c by baseline hypertension, hypercholesterolemia, or major depression. Below is the model selected when including an interaction term of the intervention by baseline diabetes diagnosis (see Table 18). Y(HbA1c)= 4.54 + -0.02(Intervention) + 3.18(BL_diabetes) + -1.46(BL_diabetes*intervention) + 0.18(Male) + 0.86(18-24yrs)+ 0.71(25-34yrs) + 0.94(35-44yrs) + 1.13(45-54yrs) + 0.88(55-64yrs) + 0.17(<HS) + ε Table 18. Twelve-Month HbA1c Effect Modification Model of Study Group by Baseline Diabetes
Variable Selected HbA1c (n=261)
Estimate (β) Standard Error p-value
Intervention -0.02 0.13 0.84
Control 0 -- --
Baseline diabetes 3.18 0.23 <0.001
Baseline diabetes*intervention -1.46 0.29 <0.001
Baseline diabetes*control 0 -- --
Male 0.18 0.12 0.13
Female 0 -- --
18-24 years 0.86 0.40 0.03
25-34 years 0.71 0.37 0.06
35-44 years 0.94 0.36 0.01
45-54 years 1.13 0.35 0.002
55-64 years 0.88 0.37 0.02
65+ years 0 -- --
Less than high school 0.17 0.12 0.15
High school or more 0 -- -- Note: Bold denotes statistical significance of p-value < 0.05
Stratified linear regression models were then performed by diabetes status. When the HbA1c model is stratified by diabetes status, the intervention effect is only statistically significant in the diabetic participants (see Table 19). Among the subpopulation of participants with a baseline diagnosis of diabetes, on average, for participants in the intervention group, there is a 1.90 decrease in HbA1c as a percent of total hemoglobin at 12 months holding all other variables in the selected model constant compared to participants in the control group. This result is statistically significant with a p value of 0.001. Below are the results and selected model with each covariate’s effect estimate included. Diabetes diagnosis at baseline: Y(HbA1c)= 4.29 + -1.90(Intervention) + -0.25(Male) + 4.17(18-24yrs)+ -0.26(25-34yrs) + 0.82(35-44yrs) + 1.33(45-54yrs) + 0.37(55-64yrs) + 0.84(<HS) + 0.39(BL_HbA1c) + ε No diabetes diagnosis at baseline: Y(HbA1c)= -0.20 + 0.04(Intervention) + 0.15(Male) + 0.06(BL_comorbidities) + -0.07(18-24yrs) + -0.10(25-34yrs) + -0.08(35-44yrs) + -0.03(45-54yrs) + -0.15(55-64yrs) + 1.02(BL_HbA1c) + ε

Sí Texas Subgrantee: Tropical Texas Behavioral Health Program Title: Improving Access to Integrated Care for Rio Grande Valley Residents with Severe & Persistent Mental Illness
61
Table 19. Twelve-Month Stratified Analyses HbA1c Results: Diabetic vs. Non-Diabetic
Diabetic Participants Non-diabetic Participants
Variable Selected HbA1c (n=49)
HbA1c (n=213)
Estimate (β) Standard
Error p-value Estimate (β)
Standard Error
p-value
Intervention -1.90 0.50 <0.001 0.04 0.06 0.45
Control 0 -- -- 0 -- --
Maleb -0.25 0.48 0.61 0.15 0.06 0.01
Femaleb 0 -- -- 0 -- --
18-24 yearsa 4.17 1.82 0.03 -0.07 0.29 0.82
25-34 yearsa -0.26 1.29 0.84 -0.10 0.29 0.72
35-44 yearsa 0.82 0.90 0.37 -0.08 0.29 0.79
45-54 yearsa 1.33 0.78 0.10 -0.03 0.29 0.91
55-64 yearsa 0.37 0.93 0.69 -0.15 0.29 0.61
65+ yearsa 0 -- -- 0 -- --
Less than high school 0.84 0.49 0.09 -- -- --
High school or more 0 -- -- -- -- --
# Comorbidities at Baseline -- -- -- 0.06 0.03 0.07
Baseline HbA1c 0.39 0.12 0.002 1.02 0.09 <0.001 Note: Bold denotes statistical significance of p-value < 0.05 a Forced back into both models b Forced back into the model for diabetic participants
Below is the model selected when including an interaction term of the intervention by age categorized as under 40 years and 40 years and older (see Table 20). Y(HbA1c)= 2.26 + -0.12(Intervention) + 0.47(40 years and older) + 0.60(BL_HbA1c) + -0.47(Age40*intervention) + 0.13(Male) + ε Table 20. Twelve-Month HbA1c Effect Modification Model of Study Group by Age 40 and over
Variable Selected HbA1c (n=261)
Estimate (β) Standard Error p-value
Intervention -0.12 0.17 0.46
Control 0 -- --
40 years and older 0.47 0.17 0.01
Under 40 years 0 -- --
Age40*intervention -0.47 0.22 0.04
Age40*control 0 -- --
Malea 0.13 0.11 0.24
Femalea 0 -- --
Baseline HbA1c 0.60 0.04 <0.001 Note: Bold denotes statistical significance of p-value < 0.05 a Forced back into model
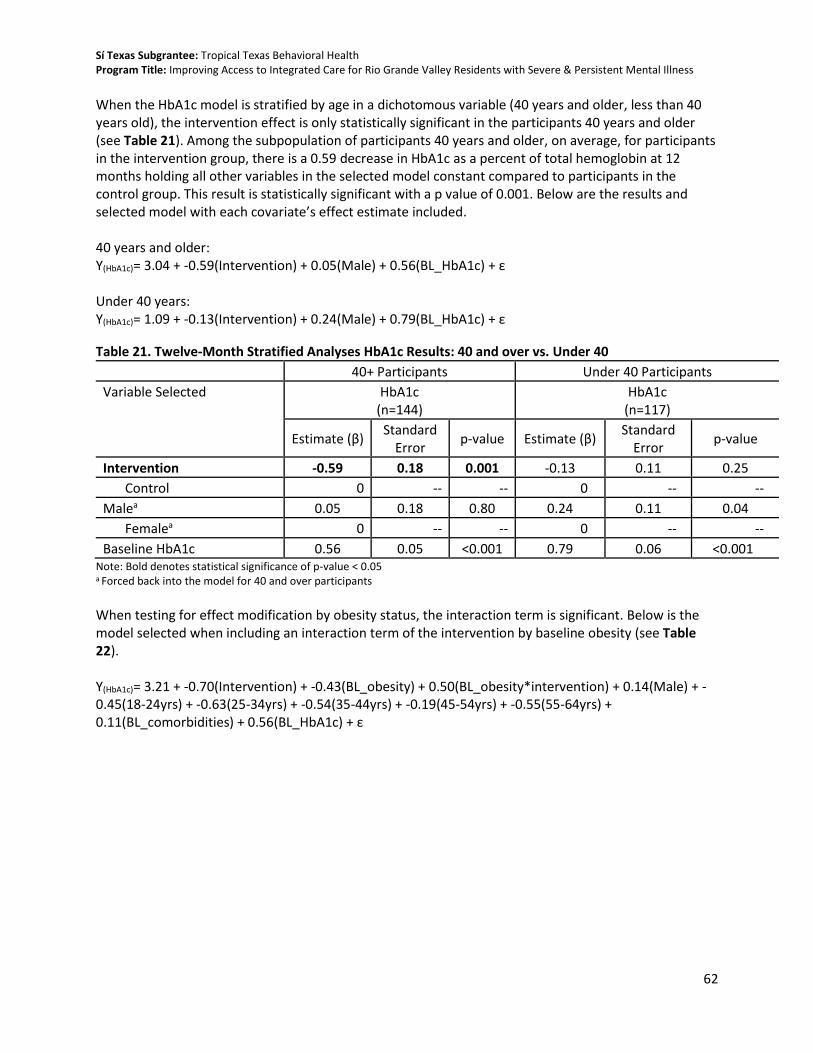
Sí Texas Subgrantee: Tropical Texas Behavioral Health Program Title: Improving Access to Integrated Care for Rio Grande Valley Residents with Severe & Persistent Mental Illness
62
When the HbA1c model is stratified by age in a dichotomous variable (40 years and older, less than 40 years old), the intervention effect is only statistically significant in the participants 40 years and older (see Table 21). Among the subpopulation of participants 40 years and older, on average, for participants in the intervention group, there is a 0.59 decrease in HbA1c as a percent of total hemoglobin at 12 months holding all other variables in the selected model constant compared to participants in the control group. This result is statistically significant with a p value of 0.001. Below are the results and selected model with each covariate’s effect estimate included. 40 years and older: Y(HbA1c)= 3.04 + -0.59(Intervention) + 0.05(Male) + 0.56(BL_HbA1c) + ε Under 40 years: Y(HbA1c)= 1.09 + -0.13(Intervention) + 0.24(Male) + 0.79(BL_HbA1c) + ε
Table 21. Twelve-Month Stratified Analyses HbA1c Results: 40 and over vs. Under 40
40+ Participants Under 40 Participants
Variable Selected HbA1c (n=144)
HbA1c (n=117)
Estimate (β) Standard
Error p-value Estimate (β)
Standard Error
p-value
Intervention -0.59 0.18 0.001 -0.13 0.11 0.25
Control 0 -- -- 0 -- --
Malea 0.05 0.18 0.80 0.24 0.11 0.04
Femalea 0 -- -- 0 -- --
Baseline HbA1c 0.56 0.05 <0.001 0.79 0.06 <0.001 Note: Bold denotes statistical significance of p-value < 0.05 a Forced back into the model for 40 and over participants
When testing for effect modification by obesity status, the interaction term is significant. Below is the model selected when including an interaction term of the intervention by baseline obesity (see Table 22). Y(HbA1c)= 3.21 + -0.70(Intervention) + -0.43(BL_obesity) + 0.50(BL_obesity*intervention) + 0.14(Male) + -0.45(18-24yrs) + -0.63(25-34yrs) + -0.54(35-44yrs) + -0.19(45-54yrs) + -0.55(55-64yrs) + 0.11(BL_comorbidities) + 0.56(BL_HbA1c) + ε

Sí Texas Subgrantee: Tropical Texas Behavioral Health Program Title: Improving Access to Integrated Care for Rio Grande Valley Residents with Severe & Persistent Mental Illness
63
Table 22. Twelve-Month HbA1c Effect Modification Model of Study Group by Baseline Obesity
Variable Selected HbA1c (n=261)
Estimate (β) Standard Error p-value
Intervention -0.70 0.19 <0.001
Control 0 -- --
Baseline obesity -0.43 0.19 0.03
Baseline obesity*intervention 0.50 0.23 0.03
Baseline obesity*control 0 -- --
Malea 0.14 0.11 0.23
Femalea 0 -- --
18-24 years -0.45 0.37 0.22
25-34 years -0.63 0.34 0.06
35-44 years -0.54 0.33 0.11
45-54 years -0.19 0.34 0.58
55-64 years -0.55 0.35 0.12
65+ years 0 -- --
# comorbidities at baseline 0.11 0.07 0.14
Baseline HbA1c 0.56 0.04 <0.001 Note: Bold denotes statistical significance of p-value < 0.05 a Forced back into model
When the HbA1c model is stratified by baseline obesity, the intervention effect remains statistically significant in both groups (see Table 23). Among the subpopulation of participants who were obese at baseline, on average, for participants in the intervention group, there is a 0.25 decrease in HbA1c as a percent of total hemoglobin at 12 months holding all other variables in the selected model constant compared to participants in the control group. This result is statistically significant with a p value of 0.02. Among the subpopulation of participants who were not obese at baseline, on average, for participants in the intervention group, there is a 0.69 decrease in HbA1c as a percent of total hemoglobin at 12 months holding all other variables constant in the selected model compared to participants in the control group. This result is statistically significant with a p value of 0.01. Below are the results and selected model with each covariate’s effect estimate included: Obese at baseline: Y(HbA1c)= 2.17 + -0.25(Intervention) + 0.22(Male) + 0.30 (18-24yrs) + 0.21(25-34yrs) + 0.40(35-44yrs) + 0.73(45-54yrs) + 0.28(55-64yrs) + 0.57(BL_HbA1c) + ε Non-obese at baseline: Y(HbA1c)= 3.95 + -0.69(Intervention) + -0.01Male) + -1.01(18-24yrs)+ -1.39(25-34yrs) + -1.53(35-44yrs) + -0.96(45-54yrs) + -1.20(55-64yrs) + 0.60(BL_HbA1c) + ε

Sí Texas Subgrantee: Tropical Texas Behavioral Health Program Title: Improving Access to Integrated Care for Rio Grande Valley Residents with Severe & Persistent Mental Illness
64
Table 23. Twelve-Month Stratified Analyses HbA1c Results: Obese vs. Non-Obese
Obese Participants Non-obese Participants
Variable Selected HbA1c (n=175)
HbA1c (n=86)
Estimate (β)
Standard Error
p-value Estimate
(β) Standard
Error p-value
Intervention -0.25 0.11 0.02 -0.69 0.26 0.01
Control 0 -- -- 0 -- --
Malea 0.22 0.11 0.04 -0.01 0.26 0.97
Femalea 0 -- -- 0 -- --
18-24 yearsa 0.30 0.39 0.44 -1.01 0.75 0.18
25-34 yearsa 0.21 0.37 0.57 -1.39 0.67 0.04
35-44 yearsa 0.40 0.37 0.27 -1.53 0.65 0.02
45-54 yearsa 0.73 0.37 0.05 -0.96 0.64 0.14
55-64 yearsa 0.28 0.38 0.45 -1.20 0.69 0.08
65+ yearsa 0 -- -- 0 -- --
Baseline HbA1c 0.57 0.04 <0.001 0.60 0.07 <0.001 Note: Bold denotes statistical significance of p-value < 0.05 a Forced back into the model for non-obese participants
Additional Analyses We conducted longitudinal analyses examining time as an independent variable and whether the outcome trajectories differ by intervention status. This analysis was only performed using the entire study population rather than the diabetic subpopulation. In the model, we utilized the PROC MIXED in SAS. For HbA1c, only adjusting for intervention status and time, there was a significant time/group interaction with a p value of 0.0001, indicating that the trajectories from baseline to 6 months, and then to 12 months were different between the two study arms for HbA1c (see Table 24.) Based on these results, the decreasing trajectory of HbA1c is more evident among the intervention group. Adjusting for the covariates that were selected in the primary model, age and sex did not alter these results. Table 24. HbA1c Longitudinal Model Effects for Full TTBH Sample
Variable HbA1c (n=324)
Estimate (β) Standard Error p-value
Time*Intervention -0.48 0.13 <0.001
Time*Control 0 -- --
Time 0.13 0.10 0.16
Intervention 0.27 0.16 0.09
Control 0 -- -- Note: Bold denotes statistical significance of p-value < 0.05
Using PROC SGPANEL, a two-panel spaghetti plot was produced to visualize the longitudinal effect on HbA1c. In Figure 4, the control group trajectory appears in the left panel and the intervention group trajectory appears in the right panel. The x-axis of the graph shows the study follow-up points with 1.0 representing baseline, 2.0 is the 6-month point, and 3.0 is the 12-month end-point. Looking at the

Sí Texas Subgrantee: Tropical Texas Behavioral Health Program Title: Improving Access to Integrated Care for Rio Grande Valley Residents with Severe & Persistent Mental Illness
65
trajectories, the two groups clearly differ from one another. The intervention group’s HbA1c measurements start higher than in the control group. The general shape of the control group’s path from baseline 12 months is a steady flat line, with a slight increase. For the intervention, the participant’s paths generally show a starker decrease from baseline to 12 months. Figure 4. Spaghetti Plot of HbA1c Over Study Period
Limitations With an RCT design, concerns about internal validity are not as relevant due to the randomization procedure; however, a limitation of these results is that their external validity is dependent on to what extent the population in question resembles the final study sample.
Body Mass Index Question 3. Are SPMI patients who receive coordinated co-located services more likely to reduce their BMI after 12 months compared to patients who receive only behavioral health care services? This question is exploratory. Overview of Analysis To examine this question, data collected on patient BMI were evaluated. While systematic checks for outliers were performed and questions sent to study site staff for verification on a quarterly basis, there were no unique data cleaning processes needed for BMI. For bivariate analyses, the total sample size for this measure was 271 participants. The total sample for this primary model was 261 participants. This is ten less than the total 12-month sample (n=271) due to missing language or education data. For the

Sí Texas Subgrantee: Tropical Texas Behavioral Health Program Title: Improving Access to Integrated Care for Rio Grande Valley Residents with Severe & Persistent Mental Illness
66
longitudinal analysis, the sample size is 324 participants. These are participants who had a baseline visit and at least one follow-up assessment (at either 6 or 12 months) at which BMI data were collected. Descriptive Statistics and Bivariate Comparisons At the end of this section, Table 36 presents the mean BMI data in each study period for the overall sample as well as the intervention and control groups. The overall sample had a mean BMI of 33.8 kg/m2 at baseline. This increased to 34.0 kg/m2 at 6-month follow-up and remained relatively stable through 12-month follow-up (34.1 kg/m2). The intervention group began the study with a similar mean BMI of 33.7 kg/m2 at baseline while the control group had a higher mean BMI of 34.0 kg/m2 at baseline. Aligning with the overall sample trend, the intervention group mean BMI increased to 34.0 kg/m2 at 6-month follow-up and again to 34.1 kg/m2 at 12 months. In the control group, the mean BMI increased from baseline to 6 months to 34.1 kg/m2 and again at 12 months to 34.2 kg/m2. As previously noted in Table 7, the intervention and control groups were balanced on BMI at baseline. Bivariate analyses were performed within each study group, testing the statistical significance of the change in impact measures from baseline to 12-month follow-up. These bivariate analyses did not control for any additional covariates. The changes from baseline to 12-month follow-up within both the intervention and control groups for BMI were not statistically significant. Bivariate analyses were also performed between the intervention and control groups comparing mean impact measures at 12-month follow-up. Based on a p value greater than 0.05 for BMI when comparing the intervention and control group at 12 months, the null hypotheses cannot be rejected. The mean BMI measure was not significantly different between the two groups when not adjusting for any additional covariates. These data are presented in Table 37 and Table 38 at the end of this section of the report. Model Selection Process A backward elimination model selection approach was used to assess covariates that contributed to the outcome BMI. Covariates were removed from the model if their p value was found to be greater than 0.15. The initial covariates that were input into the models for BMI were: sex, age, language, education, ethnicity, SPMI diagnosis, baseline BMI, and number of qualifying comorbidities at baseline. Y(BMI)=β0 + β1StudyArm + β2Sex + β3Age(_cat) + β4BL_BMI + β5BL_comorbidities + β6Language + β7Highschool + β8Ethnicity + β9Diagnosis + ε Four variations of the model were run to assess the best fit model. Two of these models assessed the influence of a continuous age predictor, one with age and sex forced into the model and the second forcing age, sex, language, and education to remain in the model. The two others included age categories with the same two variations. Multiple imputation approach was considered but not performed due to the completeness of the evaluated data. The covariate that was selected, based on a p value of 0.15 or less, was baseline BMI. We chose to force age and sex into the model due to the known effects on BMI of these two characteristics. Y(BMI)=β0 + β1StudyArm + β2Sex + β3Age + β4BL_BMI+ ε Using the adjusted R-square result, the model including age as a continuous variable had the best fit. Forcing age and sex into the model did not change the adjusted R-square statistic, further supporting their inclusion in the model.
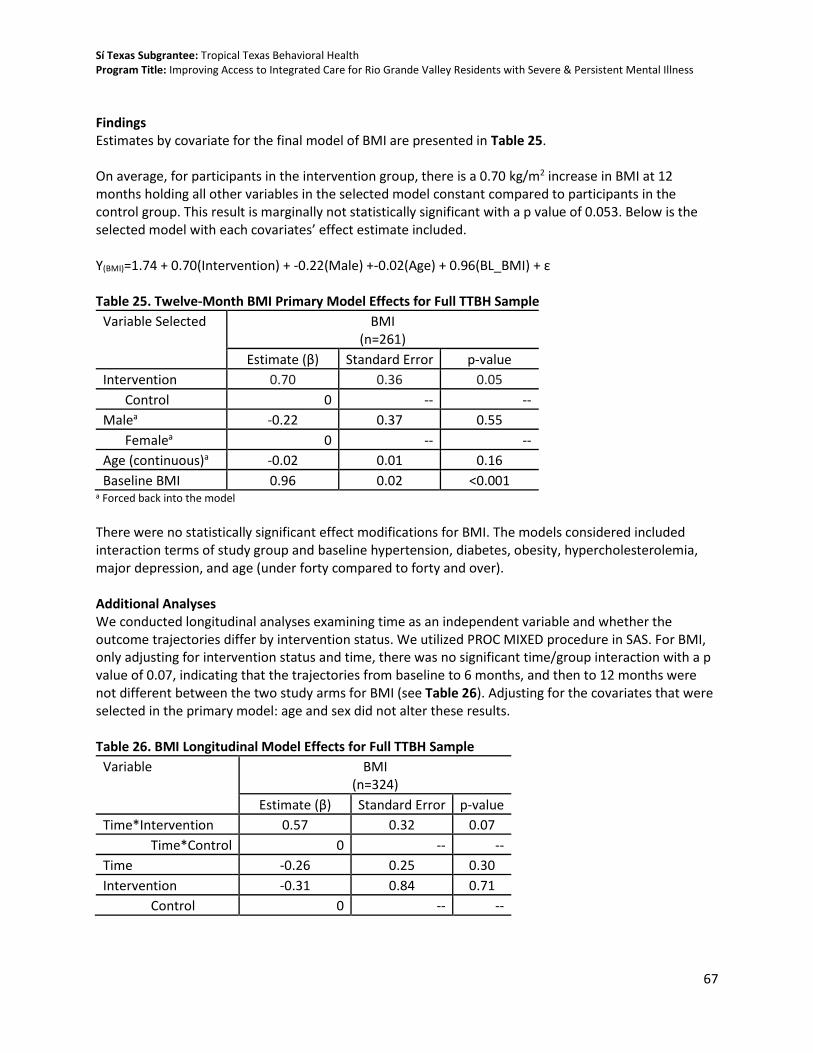
Sí Texas Subgrantee: Tropical Texas Behavioral Health Program Title: Improving Access to Integrated Care for Rio Grande Valley Residents with Severe & Persistent Mental Illness
67
Findings Estimates by covariate for the final model of BMI are presented in Table 25. On average, for participants in the intervention group, there is a 0.70 kg/m2 increase in BMI at 12 months holding all other variables in the selected model constant compared to participants in the control group. This result is marginally not statistically significant with a p value of 0.053. Below is the selected model with each covariates’ effect estimate included. Y(BMI)=1.74 + 0.70(Intervention) + -0.22(Male) +-0.02(Age) + 0.96(BL_BMI) + ε Table 25. Twelve-Month BMI Primary Model Effects for Full TTBH Sample
Variable Selected BMI (n=261)
Estimate (β) Standard Error p-value
Intervention 0.70 0.36 0.05
Control 0 -- --
Malea -0.22 0.37 0.55
Femalea 0 -- --
Age (continuous)a -0.02 0.01 0.16
Baseline BMI 0.96 0.02 <0.001 a Forced back into the model
There were no statistically significant effect modifications for BMI. The models considered included interaction terms of study group and baseline hypertension, diabetes, obesity, hypercholesterolemia, major depression, and age (under forty compared to forty and over). Additional Analyses We conducted longitudinal analyses examining time as an independent variable and whether the outcome trajectories differ by intervention status. We utilized PROC MIXED procedure in SAS. For BMI, only adjusting for intervention status and time, there was no significant time/group interaction with a p value of 0.07, indicating that the trajectories from baseline to 6 months, and then to 12 months were not different between the two study arms for BMI (see Table 26). Adjusting for the covariates that were selected in the primary model: age and sex did not alter these results. Table 26. BMI Longitudinal Model Effects for Full TTBH Sample
Variable BMI (n=324)
Estimate (β) Standard Error p-value
Time*Intervention 0.57 0.32 0.07
Time*Control 0 -- --
Time -0.26 0.25 0.30
Intervention -0.31 0.84 0.71
Control 0 -- --

Sí Texas Subgrantee: Tropical Texas Behavioral Health Program Title: Improving Access to Integrated Care for Rio Grande Valley Residents with Severe & Persistent Mental Illness
68
Limitations With an RCT design, concerns about internal validity are not as relevant due to the randomization procedure; however, a limitation of these results is that their external validity is dependent on to what extent the population in question resembles the final study sample.
Hypercholesterolemia Question 4. Are SPMI patients with hypercholesterolemia who receive coordinated co-located services more likely to reduce their total cholesterol after 12 months compared to SPMI patients with hypercholesterolemia who receive only behavioral health care services? This question is exploratory. Overview of Analysis To examine this question, total cholesterol was evaluated. A subpopulation of those with a diagnosis of hypercholesterolemia is specifically identified as the population of interest. A variable was created indicating whether a participant had hypercholesterolemia at baseline. Because of the small sample size of the subpopulation, analyses were run on both the subpopulation and the full study sample. While systematic checks for outliers were performed and questions sent to study site staff for verification on a quarterly basis, there were no unique data cleaning processes needed total cholesterol. For bivariate analyses, the total sample size for this measure was 271 participants. The total sample for the primary model with the full study sample was 261 participants. This is ten fewer than the total 12-month sample (n=271) due to missing language or education data. For the longitudinal analysis, the sample size is 324 participants. These are participants who had a baseline visit and at least one follow-up assessment (at either 6 or 12 months) at which total cholesterol data were collected. Descriptive Statistics and Bivariate Comparisons There were 138 participants with hypercholesterolemia at baseline, 88 in the intervention and 50 in the control. At 6 months, 102 participants completed their mid-point follow-up, 67 in the intervention and 35 in the control. At 12 months, 93 participants completed an end-point assessment, 59 in the intervention and 34 in the control (see Table 27). The baseline mean total cholesterol in the group of participants with a diagnosis of hypercholesterolemia at baseline was 236.0 mg/dL. For those in the intervention group with this diagnosis at baseline, the baseline mean total cholesterol was 235.9 mg/dL while those in the control group in this subpopulation had a baseline total cholesterol of 236.1 mg/dL. During follow-up, the mean total cholesterol in the full subpopulation decreased to 212.7 mg/dL at 6 months and increased at 12 months with a mean total cholesterol of 216.7 mg/dL. Those in the intervention group with a hypercholesterolemia diagnosis at baseline also had a decrease in mean total cholesterol at 6-month follow-up to 208.8 mg/dL and remained relatively stable through 12 months (209.6 mg/dL). The decrease in the subpopulation control participants was smaller at 6 months with a mean total cholesterol of 220.1 mg/dL, which ultimately increased to 229.0 mg/dL at 12 months. Table 27. Total Cholesterol of Hypercholesterolemia Subpopulation by Study Arm and Follow-up Period
Total Cholesterol
Subpopulation Full Sample Subpopulation Intervention Subpopulation Control
Baseline n=138
6-Mo n=102
12-Mo n=93
Baseline n=88
6-Mo n=67
12-Mo n=59
Baseline n=50
6-Mo n=35
12-Mo n=34
Mean (SD)
236.0 (36.0)
212.7 (36.9)
216.7 (38.7)
235.9 (38.1)
208.8 (36.5)
209.6 (35.1)
236.1 (32.4)
220.1 (37.0)
229.0 (42.1)
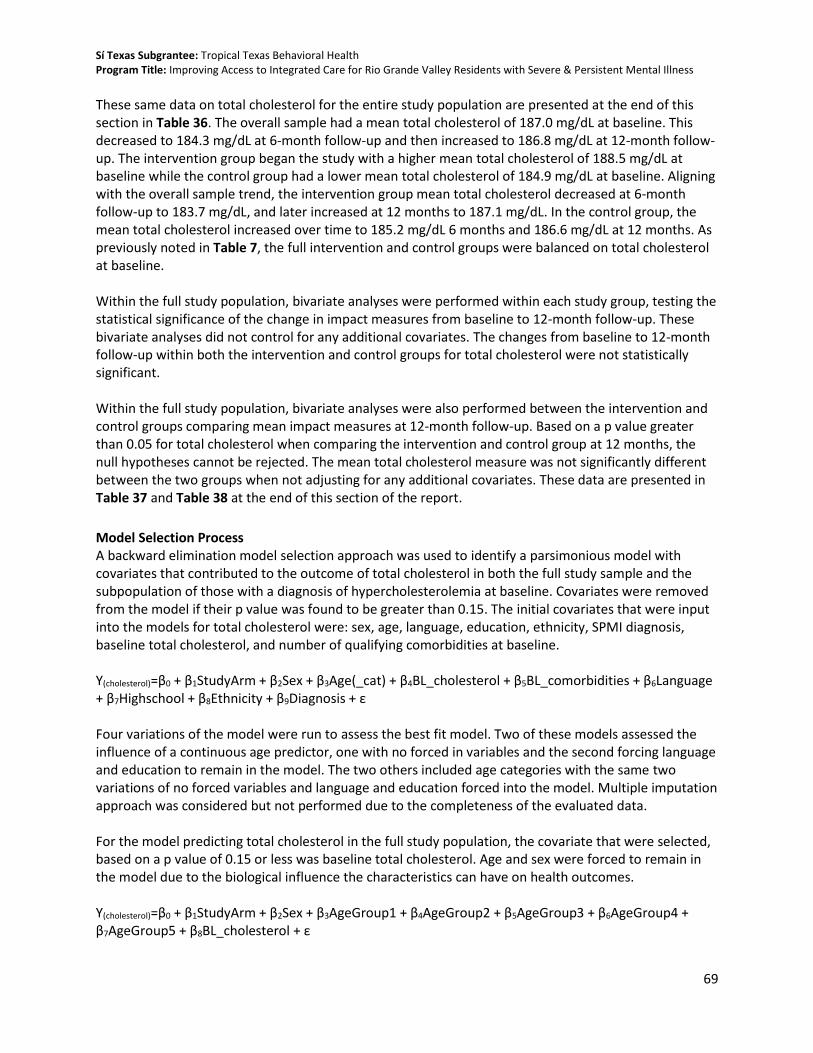
Sí Texas Subgrantee: Tropical Texas Behavioral Health Program Title: Improving Access to Integrated Care for Rio Grande Valley Residents with Severe & Persistent Mental Illness
69
These same data on total cholesterol for the entire study population are presented at the end of this section in Table 36. The overall sample had a mean total cholesterol of 187.0 mg/dL at baseline. This decreased to 184.3 mg/dL at 6-month follow-up and then increased to 186.8 mg/dL at 12-month follow-up. The intervention group began the study with a higher mean total cholesterol of 188.5 mg/dL at baseline while the control group had a lower mean total cholesterol of 184.9 mg/dL at baseline. Aligning with the overall sample trend, the intervention group mean total cholesterol decreased at 6-month follow-up to 183.7 mg/dL, and later increased at 12 months to 187.1 mg/dL. In the control group, the mean total cholesterol increased over time to 185.2 mg/dL 6 months and 186.6 mg/dL at 12 months. As previously noted in Table 7, the full intervention and control groups were balanced on total cholesterol at baseline. Within the full study population, bivariate analyses were performed within each study group, testing the statistical significance of the change in impact measures from baseline to 12-month follow-up. These bivariate analyses did not control for any additional covariates. The changes from baseline to 12-month follow-up within both the intervention and control groups for total cholesterol were not statistically significant. Within the full study population, bivariate analyses were also performed between the intervention and control groups comparing mean impact measures at 12-month follow-up. Based on a p value greater than 0.05 for total cholesterol when comparing the intervention and control group at 12 months, the null hypotheses cannot be rejected. The mean total cholesterol measure was not significantly different between the two groups when not adjusting for any additional covariates. These data are presented in Table 37 and Table 38 at the end of this section of the report.
Model Selection Process A backward elimination model selection approach was used to identify a parsimonious model with covariates that contributed to the outcome of total cholesterol in both the full study sample and the subpopulation of those with a diagnosis of hypercholesterolemia at baseline. Covariates were removed from the model if their p value was found to be greater than 0.15. The initial covariates that were input into the models for total cholesterol were: sex, age, language, education, ethnicity, SPMI diagnosis, baseline total cholesterol, and number of qualifying comorbidities at baseline. Y(cholesterol)=β0 + β1StudyArm + β2Sex + β3Age(_cat) + β4BL_cholesterol + β5BL_comorbidities + β6Language + β7Highschool + β8Ethnicity + β9Diagnosis + ε Four variations of the model were run to assess the best fit model. Two of these models assessed the influence of a continuous age predictor, one with no forced in variables and the second forcing language and education to remain in the model. The two others included age categories with the same two variations of no forced variables and language and education forced into the model. Multiple imputation approach was considered but not performed due to the completeness of the evaluated data. For the model predicting total cholesterol in the full study population, the covariate that were selected, based on a p value of 0.15 or less was baseline total cholesterol. Age and sex were forced to remain in the model due to the biological influence the characteristics can have on health outcomes. Y(cholesterol)=β0 + β1StudyArm + β2Sex + β3AgeGroup1 + β4AgeGroup2 + β5AgeGroup3 + β6AgeGroup4 + β7AgeGroup5 + β8BL_cholesterol + ε

Sí Texas Subgrantee: Tropical Texas Behavioral Health Program Title: Improving Access to Integrated Care for Rio Grande Valley Residents with Severe & Persistent Mental Illness
70
Using the adjusted R-square result, the model including age as a categorical variable and sex forced into the model had the best fit. As with the whole study population, for the model predicting total cholesterol in the subpopulation with a baseline hypercholesterolemia diagnosis, the covariate that was selected, based on a p value of 0.15 or less, was baseline total cholesterol. Age and sex were again forced into the model due to their known biological influence on health outcomes. Y(cholesterol)=β0 + β1StudyArm + β2Sex + β3AgeGroup1 + β4AgeGroup2 + β5AgeGroup3 + β6AgeGroup4 + β7AgeGroup5 + β8BL_cholesterol + ε Using the adjusted R-square result, the model including age as a categorical variable and sex forced into the model had the best fit. Findings Estimates by covariate for the final model of total cholesterol in the full sample are presented in Table 28. Among the entire study population, on average, for participants in the intervention group, there is a 1.36 mg/dL decrease in total cholesterol at 12 months holding all other variables in the selected model constant compared to participants in the control group. This result is not statistically significant with a p value of 0.73. Below is the selected model with each covariates’ effect estimate included. Y(cholesterol)=63.0 + -1.36(Intervention) + -2.94(Male) + 9.98(18-24yrs) + 21.56(25-34yrs) + 23.86(35-44yrs) + 21.16(45-54yrs) + 21.99(55-64yrs) + 0.57(BL_cholesterol) + ε Table 28. Twelve-Month Total Cholesterol Primary Model Effects for Full TTBH Sample
Variable Selected Total Cholesterol (n=261)
Estimate (β) Standard Error p-value
Intervention -1.36 3.99 0.73
Control 0 -- --
Malea -2.94 4.02 0.46
Femalea 0 -- --
18-24 yearsa 9.98 12.97 0.44
25-34 yearsa 21.56 12.00 0.07
35-44 yearsa 23.86 11.97 0.05
45-54 yearsa 21.16 11.99 0.08
55-64 yearsa 21.99 12.53 0.08
65+ yearsa 0 -- --
Baseline Total Cholesterol 0.57 0.05 <0.001
a Forced back into the model
Effect modification was explored to identify whether there was a differential effect of the intervention on total cholesterol as an outcome among different subpopulation groups. The interaction term that had a significant effect was between study group and hypercholesterolemia. There was no statistically

Sí Texas Subgrantee: Tropical Texas Behavioral Health Program Title: Improving Access to Integrated Care for Rio Grande Valley Residents with Severe & Persistent Mental Illness
71
significant effect modification of total cholesterol by baseline hypertension, diabetes, obesity, major depression, or age. Below is the model selected when including an interaction term of the intervention by baseline diabetes diagnosis (see Table 29): Y(cholesterol)= 149.57 + 1.48(Intervention) + 56.67(BL_hypercholesterolemia) + -21.49(BL_hypercholesterolemia *intervention) + -1.70(Male) + 9.52(18-24yrs) + 21.11(25-34yrs) + 30.39(35-44yrs) + 21.22(45-54yrs) + 29.96(55-64yrs) + ε Table 29. Twelve-Month Total Cholesterol Effect Modification Model of Study Group by Hypercholesterolemia
Variable Selected Total Cholesterol (n=261)
Estimate (β) Standard Error p-value
Intervention 1.48 5.21 0.78
Control 0 -- --
Baseline hypercholesterolemia 56.67 7.10 <0.001
Baseline hypercholesterolemia*intervention -21.49 9.0 0.01
Baseline hypercholesterolemia*control 0 -- --
Malea -1.70 4.26 0.69
Femalea 0 -- --
18-24 years 9.52 13.79 0.49
25-34 years 21.11 12.81 0.10
35-44 years 30.39 12.70 0.02
45-54 years 21.22 12.80 0.10
55-64 years 29.96 13.25 0.02
65+ years 0 -- -- Note: Bold denotes statistical significance of p-value < 0.05 a Forced back into the model
When the cholesterol model is stratified by hypercholesterolemia status, the intervention effect was not statistically significant in either stratified population (see Table 30.) Among the subpopulation of participants with a baseline diagnosis of hypercholesterolemia, on average, for participants in the intervention group, there is a 14.41 mg/dL decrease in total cholesterol at 12 months holding all other variables in the selected model constant compared to participants in the control group. This result is not statistically significant with a p value of 0.09. Among the subpopulation of participants without a baseline diagnosis of hypercholesterolemia, on average, for participants in the intervention group, there is a 5.16 mg/dL decrease in total cholesterol at 12 months holding all other variables in the selected model constant compared to participants in the control group. This result is not statistically significant with a p value of 0.22. Below are the results and selected model with each covariates’ effect estimate included. Hypercholesterolemia diagnosis at baseline: Y(cholesterol)=147.37 + -14.41(Intervention) + 0.21(Male) + -7.88(18-24yrs) + 33.32(25-34yrs) + 39.56(35-44yrs) + 33.52(45-54yrs) + 28.56(55-64yrs) + 0.20(BL_cholesterol) + ε

Sí Texas Subgrantee: Tropical Texas Behavioral Health Program Title: Improving Access to Integrated Care for Rio Grande Valley Residents with Severe & Persistent Mental Illness
72
No hypercholesterolemia diagnosis at baseline: Y(cholesterol)= 40.08 + 5.16(Intervention) + -3.74(Male) + 12.17(18-24yrs)+ 14.81(25-34yrs) + 14.80(35-44yrs) + 12.60(45-54yrs) + 20.26(55-64yrs) + 0.72(BL_cholesterol) + ε Table 30. Twelve-Month Stratified Analyses Total Cholesterol Results: Hypercholesterolemia vs. No Hypercholesterolemia
Hypercholesterolemia No Hypercholesterolemia
Variable Selected Total Cholesterol (n=91)
Total Cholesterol (n=170)
Estimate (β) Standard
Error p-value Estimate (β)
Standard Error
p-value
Intervention -14.41 8.52 0.09 5.16 4.15 0.22
Control 0 -- -- 0 -- --
Malea 0.21 8.23 0.98 -3.74 4.20 0.37
Femalea 0 -- -- 0 -- --
18-24 yearsa -7.88 42.03 0.85 12.17 11.71 0.30
25-34 yearsa 33.32 39.07 0.40 14.81 10.90 0.18
35-44 yearsa 39.56 38.31 0.30 14.80 11.00 0.18
45-54 yearsa 33.52 38.04 0.38 12.60 11.16 0.26
55-64 yearsa 28.56 38.47 0.46 20.26 11.89 0.09
65+ yearsa 0 -- -- 0 -- --
Baseline Total Cholesterol 0.20 0.13 0.13 0.72 0.09 <0.001
a Forced back into the models
Additional Analyses We conducted longitudinal analyses examining time as an independent variable and whether the outcome trajectories differ by intervention status. This analysis was only performed using the entire study population rather than the subpopulation with hypercholesterolemia. In the model, we utilized the PROC MIXED procedure in SAS. For total cholesterol, only adjusting for intervention status and time, there was no significant time/group interaction with a p value of 0.55, indicating that the trajectories from baseline to 6 months, and then to 12 months were not different between the two study arms for total cholesterol (see Table 31). Adjusting for the covariates that were selected in the primary model – age and sex – did not alter these results. Table 31. Total Cholesterol Longitudinal Model Effects for Full TTBH Sample
Variable Total Cholesterol (n=324)
Estimate (β) Standard Error p-value
Time*Intervention -2.55 4.22 0.55
Time*Control 0 -- --
Time 1.03 3.21 0.75
Intervention 2.14 4.32 0.62
Control 0 -- --
Sí Texas Subgrantee: Tropical Texas Behavioral Health Program Title: Improving Access to Integrated Care for Rio Grande Valley Residents with Severe & Persistent Mental Illness
73
Limitations The slightly lower than expected sample size of the control group might have contributed to the inability to detect a significant difference in total cholesterol. Additionally, with a RCT design, concerns about internal validity are not as relevant due to the randomization procedure; however, a limitation of these results is that their external validity is dependent on to what extent the population in question resembles the final study sample.
Depressive Symptoms Question 5. Are SPMI patients who receive coordinated co-located services more likely to reduce their depressive symptoms, as measured by the PHQ-9, after 12 months compared to SPMI patients who receive only behavioral health care services? This question is exploratory. Overview of Analysis To answer this question about depression symptoms, data were collected from the PHQ-9 assessment tool. There were missing data for the PHQ-9 score at 12 months, therefore multiple imputation methods were utilized as planned in the SEP using PROC MI and PROC MIANALYZE in SAS. In addition to the systematic data checks and questions sent to clinic staff and multiple imputation procedures, there were unique data cleaning processes necessary to merge the PHQ-9 score data with the other data submitted. All PHQ-9 data were submitted in a separate file from the enrollment data. Many times, visits when the PHQ-9 assessment was completed were different than the study visits where data were collected on other outcome variables. Therefore, it was important to determine how PHQ-9 visits aligned with the study visit timeframe. The below steps were taken to prepare the PHQ-9 data:
1. We created a dataset with PHQ-9 data and participant enrollment date. 2. We then created “true” 6-month and 12-month dates for follow-up visits based on the
enrollment date. “True” was defined as the literal anniversary of 6 and 12 months from baseline enrollment date.
3. Next, we created a variable for the number of days from date of enrollment to the date of a visit where a PHQ-9 was collected.
4. Then, we created variables with the numbers of days from the date of a visit to the “true” 6-and-12-month dates respectively.
5. Baseline PHQ-9 visits were permitted to fall 6 months prior to enrollment date and up to 60 days after enrollment date
6. Six-month PHQ-9 visits were permitted to fall within 60 days before or 90 days after the “true” 6-month date based on enrollment date.
7. Twelve-month PHQ-9 visits were permitted to fall within 60 days before or after the “true” 12-month date based on enrollment date.
8. In cases where there were multiple visits that would meet the requirements in steps 5-7, we selected the visit closest to enrollment date, the “true” 6-month date, and the “true” 12-month date for baseline, 6-month, and 12-month PHQ-9 values respectively.
This process was also completed for the ANSA data prior to being performed on the PHQ-9 data. For PHQ-9 data, visits closest to the selected ANSA visit (selected through steps 1-8) were selected to ensure the behavioral health outcomes were collected at the same time or at two times as close together as possible. In cases where there was a PHQ-9 visit within the 60-day window, but not an ANSA visit, the PHQ-9 visit closest to the “true” date was selected. The total sample size for the bivariate analyses was
Sí Texas Subgrantee: Tropical Texas Behavioral Health Program Title: Improving Access to Integrated Care for Rio Grande Valley Residents with Severe & Persistent Mental Illness
74
205 due to missing data. With the use of multiple imputation, the total sample size for this primary model was 271 participants. For the longitudinal analysis, the sample size is 291 participants. These are participants who had a baseline visit and at least one follow-up assessment (at either 6 or 12 months) at which PHQ-9 data were collected. Descriptive Statistics and Bivariate Comparisons At the end of this section, Table 36 presents the mean PHQ-9 score data in each study period for the overall sample as well as the intervention and control groups. The overall sample had a mean PHQ-9 score of 11.7 at baseline. This decreased to 10.5 at 6-month follow-up and again to 9.5 at 12-month follow-up. The intervention group began the study with a lower mean PHQ-9 score of 11.4 at baseline while the control group had a higher mean PHQ-9 score of 12.2 at baseline. Aligning with the overall sample trend, the intervention group mean PHQ-9 score decreased at both 6 and 12-month follow-up to 10.7 and 9.5 respectively. The control group also followed this trend with the mean PHQ-9 score decreasing overtime to 10.2 at 6 months and 9.6 at 12 months. As previously noted in Table 7, the intervention and control groups were balanced on PHQ-9 score at baseline. Bivariate analyses were performed within each study group, testing the statistical significance of the change in impact measures from baseline to 12-month follow-up. These bivariate analyses did not control for any additional covariates. The decreases from baseline to 12-month follow-up within both the intervention and control groups for PHQ-9 score were statistically significant. Bivariate analyses were also performed between the intervention and control groups comparing mean impact measures at 12-month follow-up. Based on a p value greater than 0.05 for PHQ-9 score when comparing the intervention and control group at 12 months, the null hypotheses cannot be rejected. The mean PHQ-9 score was not significantly different between the two groups when not adjusting for any additional covariates. These data are presented in Table 37 and Table 38 at the end of this section of the report. Model Selection Process A backward elimination model selection approach was used to identify a parsimonious model with covariates that contributed to the outcome, PHQ-9 score. However, due to the need for multiple imputations due to missing data, the process for this outcome varied slightly. Covariates were removed from the model if their p values were found to be greater than 0.15 for each imputed dataset. The initial covariates that were input into the models for PHQ-9 score were: sex, age, language, education, ethnicity, baseline PHQ-9 score, baseline ANSA score, SPMI diagnosis, and number of qualifying comorbidities at baseline. Y(PHQ9)=β0 + β1StudyArm + β2Sex + β3Age(_cat) + β4BL_PHQ9 + β5BL_lifefunction+ β6Language + β7Highschool + β8Ethnicity + β9Diagnosis + β10BL_comorbidities + ε Inclusion in the final model was based on the number of times a covariate was selected across the ten imputations (Wood et al., 2008). The covariates that were included in a majority of the ten models were number of baseline comorbidities (selected in 6 imputations), diagnosis of major depression (selected in 7 imputations), baseline PHQ-9 score (selected in 10 imputations), and baseline ANSA score (selected in 10 imputations). Age and sex were also forced into the model based on the biological influence both characteristics have on health outcomes.
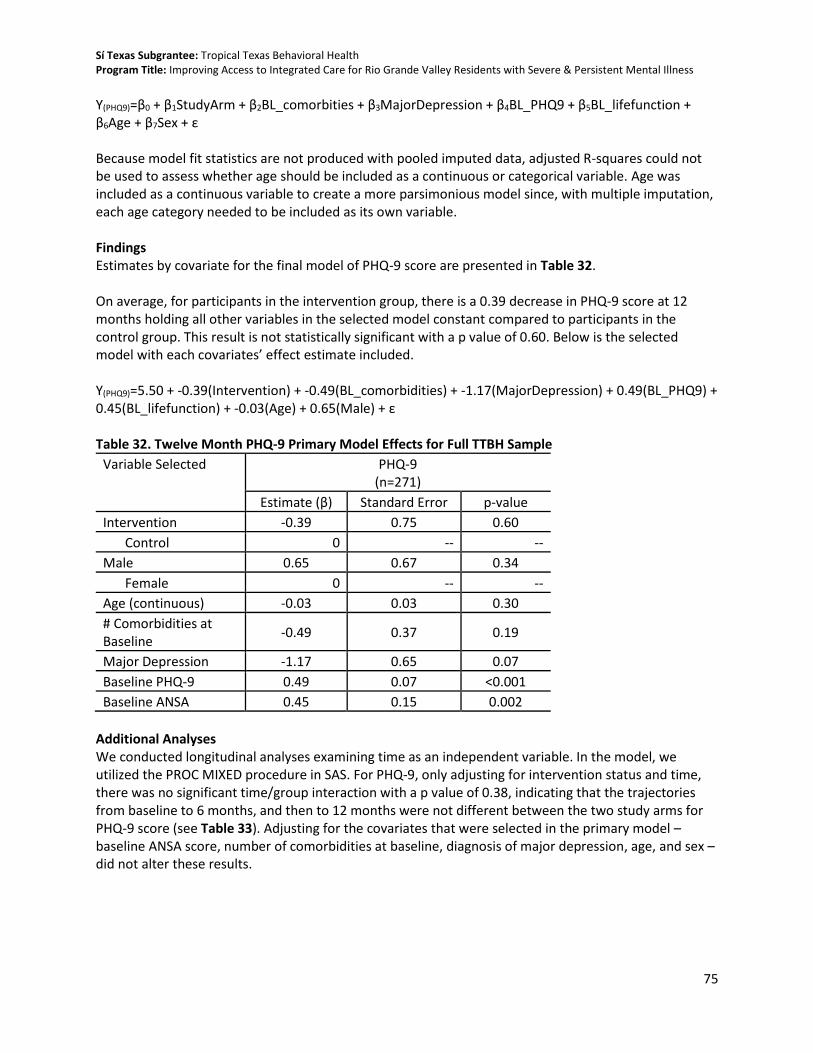
Sí Texas Subgrantee: Tropical Texas Behavioral Health Program Title: Improving Access to Integrated Care for Rio Grande Valley Residents with Severe & Persistent Mental Illness
75
Y(PHQ9)=β0 + β1StudyArm + β2BL_comorbities + β3MajorDepression + β4BL_PHQ9 + β5BL_lifefunction + β6Age + β7Sex + ε Because model fit statistics are not produced with pooled imputed data, adjusted R-squares could not be used to assess whether age should be included as a continuous or categorical variable. Age was included as a continuous variable to create a more parsimonious model since, with multiple imputation, each age category needed to be included as its own variable. Findings Estimates by covariate for the final model of PHQ-9 score are presented in Table 32. On average, for participants in the intervention group, there is a 0.39 decrease in PHQ-9 score at 12 months holding all other variables in the selected model constant compared to participants in the control group. This result is not statistically significant with a p value of 0.60. Below is the selected model with each covariates’ effect estimate included. Y(PHQ9)=5.50 + -0.39(Intervention) + -0.49(BL_comorbidities) + -1.17(MajorDepression) + 0.49(BL_PHQ9) + 0.45(BL_lifefunction) + -0.03(Age) + 0.65(Male) + ε Table 32. Twelve Month PHQ-9 Primary Model Effects for Full TTBH Sample
Variable Selected PHQ-9 (n=271)
Estimate (β) Standard Error p-value
Intervention -0.39 0.75 0.60
Control 0 -- --
Male 0.65 0.67 0.34
Female 0 -- --
Age (continuous) -0.03 0.03 0.30
# Comorbidities at Baseline
-0.49 0.37 0.19
Major Depression -1.17 0.65 0.07
Baseline PHQ-9 0.49 0.07 <0.001
Baseline ANSA 0.45 0.15 0.002
Additional Analyses We conducted longitudinal analyses examining time as an independent variable. In the model, we utilized the PROC MIXED procedure in SAS. For PHQ-9, only adjusting for intervention status and time, there was no significant time/group interaction with a p value of 0.38, indicating that the trajectories from baseline to 6 months, and then to 12 months were not different between the two study arms for PHQ-9 score (see Table 33). Adjusting for the covariates that were selected in the primary model – baseline ANSA score, number of comorbidities at baseline, diagnosis of major depression, age, and sex – did not alter these results.
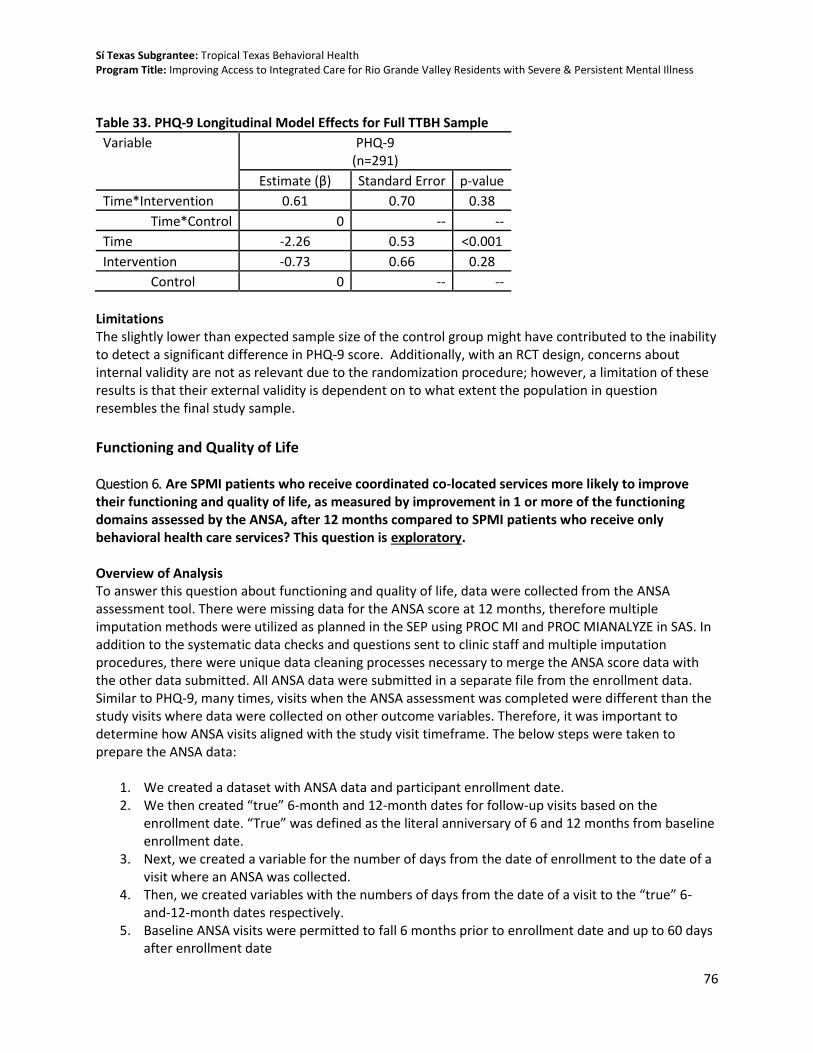
Sí Texas Subgrantee: Tropical Texas Behavioral Health Program Title: Improving Access to Integrated Care for Rio Grande Valley Residents with Severe & Persistent Mental Illness
76
Table 33. PHQ-9 Longitudinal Model Effects for Full TTBH Sample
Variable PHQ-9 (n=291)
Estimate (β) Standard Error p-value
Time*Intervention 0.61 0.70 0.38
Time*Control 0 -- --
Time -2.26 0.53 <0.001
Intervention -0.73 0.66 0.28
Control 0 -- --
Limitations The slightly lower than expected sample size of the control group might have contributed to the inability to detect a significant difference in PHQ-9 score. Additionally, with an RCT design, concerns about internal validity are not as relevant due to the randomization procedure; however, a limitation of these results is that their external validity is dependent on to what extent the population in question resembles the final study sample.
Functioning and Quality of Life Question 6. Are SPMI patients who receive coordinated co-located services more likely to improve their functioning and quality of life, as measured by improvement in 1 or more of the functioning domains assessed by the ANSA, after 12 months compared to SPMI patients who receive only behavioral health care services? This question is exploratory. Overview of Analysis To answer this question about functioning and quality of life, data were collected from the ANSA assessment tool. There were missing data for the ANSA score at 12 months, therefore multiple imputation methods were utilized as planned in the SEP using PROC MI and PROC MIANALYZE in SAS. In addition to the systematic data checks and questions sent to clinic staff and multiple imputation procedures, there were unique data cleaning processes necessary to merge the ANSA score data with the other data submitted. All ANSA data were submitted in a separate file from the enrollment data. Similar to PHQ-9, many times, visits when the ANSA assessment was completed were different than the study visits where data were collected on other outcome variables. Therefore, it was important to determine how ANSA visits aligned with the study visit timeframe. The below steps were taken to prepare the ANSA data:
1. We created a dataset with ANSA data and participant enrollment date. 2. We then created “true” 6-month and 12-month dates for follow-up visits based on the
enrollment date. “True” was defined as the literal anniversary of 6 and 12 months from baseline enrollment date.
3. Next, we created a variable for the number of days from the date of enrollment to the date of a visit where an ANSA was collected.
4. Then, we created variables with the numbers of days from the date of a visit to the “true” 6-and-12-month dates respectively.
5. Baseline ANSA visits were permitted to fall 6 months prior to enrollment date and up to 60 days after enrollment date

Sí Texas Subgrantee: Tropical Texas Behavioral Health Program Title: Improving Access to Integrated Care for Rio Grande Valley Residents with Severe & Persistent Mental Illness
77
6. Six-month ANSA visits were permitted to fall within 60 days before or 90 days after the “true” 6-month date based on enrollment date.
7. Twelve-month ANSA visits were permitted to fall within 60 days before or after the “true” 12-month date based on enrollment date.
8. In cases where there were multiple visits that would meet the requirements in steps 5-7, we selected the visit closest to enrollment date, the “true” 6-month date, and the “true” 12-month date for baseline, 6-month, and 12-month ANSA values respectively.
As previously noted, this process was completed for the ANSA data prior to being performed on the PHQ-9 data and the selected ANSA visits were used to guide the PHQ-9 visit selection. For the bivariate analyses, the total sample size was 206 due to missing data. With the use of multiple imputation, the total sample size for this model was 271 participants. For the longitudinal analysis, the sample size is 294 participants. These are participants who had a baseline visit and at least one follow-up assessment (at either 6 or 12 months) at which quality of life data were collected. Descriptive Statistics and Bivariate Comparisons Table 36 presents data collected through the ANSA assessment tool in each study period for the overall sample as well as the intervention and control groups. Of the 14 domains assessed, the overall sample had an average of 2.9 domains with a moderate or severe score at baseline. This decreased to 2.7 domains at 6-month follow-up and again to 2.5 domains at 12-month follow-up. The intervention group also began the study with an average of 2.9 domains with a moderate or severe score at baseline while the control group had an average of 2.8 domains at baseline. The number of domains with a moderate or severe score did not change in the intervention group between baseline and 6 months, but did decrease from 2.9 domains to 2.6 domains with a moderate to severe score between 6 and 12-month follow-up. There was a decrease to 2.5 domains with a moderate or severe score for the control group at 6 months which then decreased again to 2.3 domains at the 12-month follow-up. As previously noted in Table 7, the intervention and control groups were balanced across the Life Domain Function categories of the ANSA assessment at baseline. Bivariate analyses were performed within each study group, testing the statistical significance of the change in impact measures from baseline to 12-month follow-up. These bivariate analyses did not control for any additional covariates. The decreases from baseline to 12-month follow-up within both the intervention and control groups for ANSA score were not statistically significant. Bivariate analyses were also performed between the intervention and control groups comparing mean impact measures at 12-month follow-up. Based on a p value greater than 0.05 for ANSA score when comparing the intervention and control group at 12 months, the null hypotheses cannot be rejected. The mean ANSA score was not significantly different between the two groups when not adjusting for any additional covariates. These data are presented in Table 37 and Table 38 at the end of this section of the report. Model Selection Process A backward elimination model selection approach was used to identify a parsimonious model with covariates that contributed to the outcome, ANSA score. However, due to the need for multiple imputation of data, the process for this outcome varied slightly. Covariates were removed from the model if their p value was found to be greater than 0.15 for each imputed dataset. The initial covariates that were input into the models for ANSA score were: sex, age, language, education, ethnicity, SPMI

Sí Texas Subgrantee: Tropical Texas Behavioral Health Program Title: Improving Access to Integrated Care for Rio Grande Valley Residents with Severe & Persistent Mental Illness
78
diagnosis, baseline PHQ-9 score, baseline ANSA score, and number of qualifying comorbidities at baseline. Y(ANSA)=β0 + β1StudyArm + β2Sex + β3Age(_cat) + β4BL_PHQ9 + β5BL_lifefunction+ β6Language + β7Highschool + β8Ethnicity + β9Diagnosis + β10BL_comorbidities + ε Inclusion in the final model was based on the number of times a covariate was selected across the ten imputations (Wood et al., 2008). The covariates that were included in all ten imputation models were diagnosis of major depression, baseline PHQ-9 score, and baseline ANSA score. Language was selected in 6 models, and sex was selected in 8. Age was also forced into the model based on the biological influence it is known to have on health outcomes. Y(ANSA)=β0 + β1StudyArm + β2Sex + β3Age + β4BL_PHQ9 + β5BL_lifefunction + β6Language + β7MajorDepression + ε Because model fit statistics are not produced with pooled imputed data, adjusted R-squares could not be used to assess whether age should be included as a continuous or categorical variable. We decided to include it as a continuous variable to create a more parsimonious model since, with multiple imputation, each age category needed to be included as its own variable. Findings Estimates by covariate for the final model of ANSA score are presented in Table 34. On average, for participants in the intervention group, there is a 0.19 increase in ANSA score at 12 months holding all other variables in the selected model constant compared to participants in the control group. This result is not statistically significant with a p value of 0.44. Below is the selected model with each covariates’ effect estimate included: Y(ANSA)=1.10 + 0.19(Intervention) + -0.45(Male) + 0.002(Age) + 0.07(BL_PHQ9) + 0.41(BL_lifefunction) + -0.38(Spanish) + -0.58(MajorDepression) + ε Table 34. Twelve Month ANSA Primary Model Effects for Full TTBH Sample
Variable Selected ANSA Score (n=271)
Estimate (β) Standard Error p-value
Intervention 0.19 0.24 0.44
Control 0 -- --
Male -0.45 0.29 0.13
Female 0 -- --
Age (continuous) 0.002 0.01 0.88
Spanish -0.38 0.28 0.17
English 0 -- --
Major Depression -0.58 0.24 0.02
Baseline PHQ-9 0.07 0.02 0.001
Baseline ANSA 0.41 0.06 <0.001
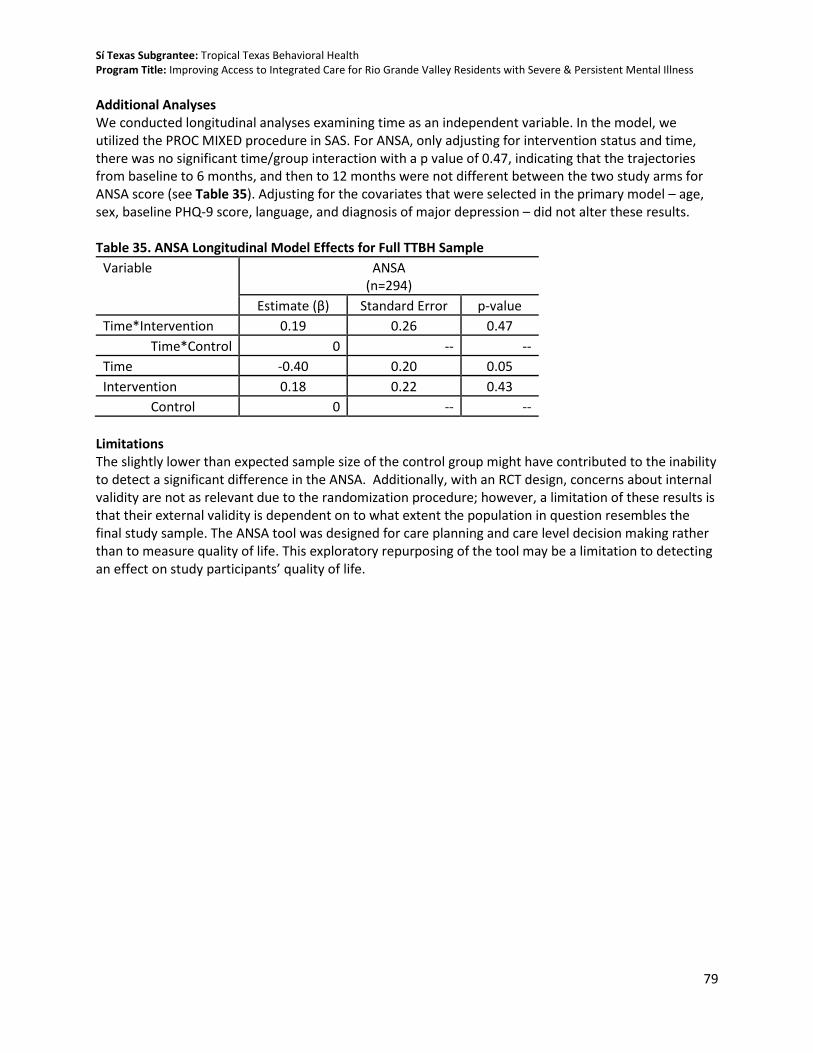
Sí Texas Subgrantee: Tropical Texas Behavioral Health Program Title: Improving Access to Integrated Care for Rio Grande Valley Residents with Severe & Persistent Mental Illness
79
Additional Analyses We conducted longitudinal analyses examining time as an independent variable. In the model, we utilized the PROC MIXED procedure in SAS. For ANSA, only adjusting for intervention status and time, there was no significant time/group interaction with a p value of 0.47, indicating that the trajectories from baseline to 6 months, and then to 12 months were not different between the two study arms for ANSA score (see Table 35). Adjusting for the covariates that were selected in the primary model – age, sex, baseline PHQ-9 score, language, and diagnosis of major depression – did not alter these results. Table 35. ANSA Longitudinal Model Effects for Full TTBH Sample
Variable ANSA (n=294)
Estimate (β) Standard Error p-value
Time*Intervention 0.19 0.26 0.47
Time*Control 0 -- --
Time -0.40 0.20 0.05
Intervention 0.18 0.22 0.43
Control 0 -- --
Limitations The slightly lower than expected sample size of the control group might have contributed to the inability to detect a significant difference in the ANSA. Additionally, with an RCT design, concerns about internal validity are not as relevant due to the randomization procedure; however, a limitation of these results is that their external validity is dependent on to what extent the population in question resembles the final study sample. The ANSA tool was designed for care planning and care level decision making rather than to measure quality of life. This exploratory repurposing of the tool may be a limitation to detecting an effect on study participants’ quality of life.

80
Table 36. Health Impact Measures by Study Arm and Follow-up Period
Full Sample Intervention Control Baseline 6-Mo 12-Mo Baseline 6-Mo 12-Mo Baseline 6-Mo 12-Mo n=416 n=295 n=271 n=249 n=175 n=155 n=167 n=120 n=116
Measure Mean (SD) Mean (SD) Mean (SD)
Blood pressure
Systolic 127.2 (18.3)
118.2 (16.0)
118.6 (17.6)
125.6 (18.6)
116.9 (14.6)
117.3 (17.7)
129.6 (17.5)
120.1 (17.9)
120.3 (17.5)
Diastolic 79.0
(10.3) 73.0 (9.6)
73.9 (10.7)
78.8 (10.2)
72.5 (8.8)
73.4 (10.9)
79.3 (10.4)
73.6 (10.8)
74.6 (10.5)
Missing -- -- -- -- -- -- -- -- --
HbA1c
HbA1c 6.2 (1.7) 6.0 (1.3) 6.0 (1.4) 6.3 (1.9) 6.0 (1.3) 5.9 (1.0) 6.1 (1.3) 6.1 (1.3) 6.2 (1.8) Missing -- -- -- -- -- -- -- -- --
BMI
BMI 33.8 (8.3) 34.0 (8.1) 34.1 (8.9) 33.7 (7.6) 34.0 (7.6) 34.1 (8.2) 34.0 (9.3) 34.1 (8.7) 34.2 (9.7) Missing -- -- -- -- -- -- -- -- --
Total Cholesterol
Total Cholesterol 187.0 (44.9)
184.3 (39.9)
186.8 (40.5)
188.5 (46.1)
183.7 (39.6)
187.1 (39.4)
184.9 (42.9)
185.2 (40.5)
186.6 (42.2)
Missing 2 -- -- 0 -- -- 2 -- --
PHQ-9
PHQ-9 Score 11.7 (6.6) 10.5 (6.2) 9.5 (5.8) 11.4 (6.4) 10.7 (6.1) 9.5 (5.9) 12.2 (7.0) 10.2 (6.4) 9.6 (5.8) Missing -- 30 66 -- 13 39 -- 17 27
Life Domain Functioning
Number Severe/Moderate 2.9 (2.3) 2.7 (2.2) 2.5 (2.1) 2.9 (2.4) 2.9 (2.2) 2.6 (2.2) 2.8 (2.1) 2.5 (2.2) 2.3 (2.0) Missing 1 30 65 1 13 39 0 17 26
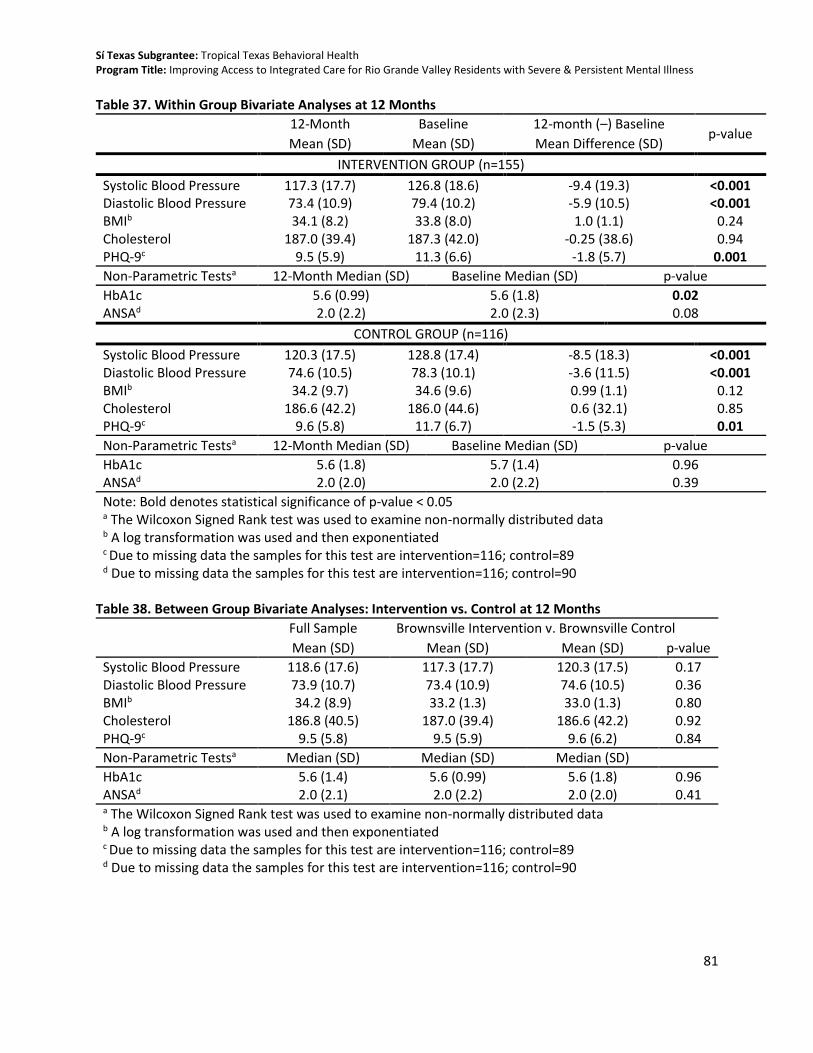
Sí Texas Subgrantee: Tropical Texas Behavioral Health Program Title: Improving Access to Integrated Care for Rio Grande Valley Residents with Severe & Persistent Mental Illness
81
Table 37. Within Group Bivariate Analyses at 12 Months
12-Month Baseline 12-month (–) Baseline p-value
Mean (SD) Mean (SD) Mean Difference (SD)
INTERVENTION GROUP (n=155) Systolic Blood Pressure 117.3 (17.7) 126.8 (18.6) -9.4 (19.3) <0.001 Diastolic Blood Pressure 73.4 (10.9) 79.4 (10.2) -5.9 (10.5) <0.001 BMIb 34.1 (8.2) 33.8 (8.0) 1.0 (1.1) 0.24 Cholesterol 187.0 (39.4) 187.3 (42.0) -0.25 (38.6) 0.94 PHQ-9c 9.5 (5.9) 11.3 (6.6) -1.8 (5.7) 0.001 Non-Parametric Testsa 12-Month Median (SD) Baseline Median (SD) p-value
HbA1c 5.6 (0.99) 5.6 (1.8) 0.02 ANSAd 2.0 (2.2) 2.0 (2.3) 0.08
CONTROL GROUP (n=116) Systolic Blood Pressure 120.3 (17.5) 128.8 (17.4) -8.5 (18.3) <0.001 Diastolic Blood Pressure 74.6 (10.5) 78.3 (10.1) -3.6 (11.5) <0.001 BMIb 34.2 (9.7) 34.6 (9.6) 0.99 (1.1) 0.12 Cholesterol 186.6 (42.2) 186.0 (44.6) 0.6 (32.1) 0.85 PHQ-9c 9.6 (5.8) 11.7 (6.7) -1.5 (5.3) 0.01
Non-Parametric Testsa 12-Month Median (SD) Baseline Median (SD) p-value
HbA1c 5.6 (1.8) 5.7 (1.4) 0.96 ANSAd 2.0 (2.0) 2.0 (2.2) 0.39
Note: Bold denotes statistical significance of p-value < 0.05 a The Wilcoxon Signed Rank test was used to examine non-normally distributed data b A log transformation was used and then exponentiated c Due to missing data the samples for this test are intervention=116; control=89 d Due to missing data the samples for this test are intervention=116; control=90
Table 38. Between Group Bivariate Analyses: Intervention vs. Control at 12 Months
Full Sample Brownsville Intervention v. Brownsville Control
Mean (SD) Mean (SD) Mean (SD) p-value
Systolic Blood Pressure 118.6 (17.6) 117.3 (17.7) 120.3 (17.5) 0.17 Diastolic Blood Pressure 73.9 (10.7) 73.4 (10.9) 74.6 (10.5) 0.36 BMIb 34.2 (8.9) 33.2 (1.3) 33.0 (1.3) 0.80 Cholesterol 186.8 (40.5) 187.0 (39.4) 186.6 (42.2) 0.92 PHQ-9c 9.5 (5.8) 9.5 (5.9) 9.6 (6.2) 0.84
Non-Parametric Testsa Median (SD) Median (SD) Median (SD)
HbA1c 5.6 (1.4) 5.6 (0.99) 5.6 (1.8) 0.96 ANSAd 2.0 (2.1) 2.0 (2.2) 2.0 (2.0) 0.41 a The Wilcoxon Signed Rank test was used to examine non-normally distributed data b A log transformation was used and then exponentiated c Due to missing data the samples for this test are intervention=116; control=89 d Due to missing data the samples for this test are intervention=116; control=90

Sí Texas Subgrantee: Tropical Texas Behavioral Health Program Title: Improving Access to Integrated Care for Rio Grande Valley Residents with Severe & Persistent Mental Illness
82
CONCLUSION – SUMMARY OF FINDINGS, LESSONS LEARNED, AND NEXT STEPS
Summary of Findings
This final report provides an overview of findings for the evaluation of the TTBH program. As the local mental health authority serving Hidalgo, Cameron, and Willacy Counties in TX, TTBH implemented a reverse co-location IBH model in their Brownsville, TX clinic to expand primary care services delivered to adults receiving behavioral health services in the region. TTBH conducted an RCT to compare intervention participants receiving the delivery of integrated behavioral health with comparison participants receiving the usual care provided within a behavioral health clinic for patients with severe persistent mental illness (SPMI). This evaluation study achieves a moderate level of evidence given that an evidence-based intervention was adapted and was evaluated using a method with strong internal validity. This evaluation study uses an RCT design and has mitigated major threats to internal validity such as selection bias. The program was implemented to fidelity, and the evaluation was conducted as intended. The most significant threat to internal validity was differential attrition, but analyses of participants in the study compared to those lost to follow-up revealed that there were no significant differences in health measures among these participants. There is no evidence that other threats to internal validity—history, instrumentation, etc.—were challenges in this study. The study also meets the criteria for effective evidence for the following reasons. First, the study demonstrates a positive, significant finding for a confirmatory outcome (systolic blood pressure) and a positive, significant finding for an exploratory outcome (HbA1c). Second, there were no negative intervention effects on confirmatory or exploratory outcomes. Finally, the confirmatory outcome systolic blood pressure achieved a effect size of 0.22 (using Cohen’s d). This value may be interpreted as “small” based on Cohen’s rule of thumb for interpretation of effect sizes which states that d values around 0.2 are considered to be a small effect (Cohen, 1988). The study showed that, when controlling for baseline measures and other covariates, the intervention participants had significantly greater improvements in the confirmatory outcome (reduced systolic blood pressure, β=-3.86, p=0.04) and an additional outcome identified in the logic model (reduced HbA1c, β=-0.36, p=0.001) at 12 months compared to the control participants. This is consistent with the only other randomized control trial on integrated care programs with the severely mentally ill population which found similar significant improvements in diastolic blood pressure among intervention participants (Scharf, 2014). TTBH is the local mental health authority for the more than 1.2 million residents in the Rio Grande Valley. This study’s sample represents the SPMI population of this region who are affected by mental health and chronic conditions. This is one of the first SPMI studies examining the impact of an integrated care model that has been conducted with a primarily Hispanic population. Given these characteristics, external validity of this study could be a limitation. However, findings can inform other mental health agencies interested in reverse co-location models who serve a primarily Hispanic population, currently a gap in the literature. Given the strong internal validity of this study, the fidelity to which the evaluation and program were implemented, the significant results, and the unique and important contribution to the field, this study

Sí Texas Subgrantee: Tropical Texas Behavioral Health Program Title: Improving Access to Integrated Care for Rio Grande Valley Residents with Severe & Persistent Mental Illness
83
achieves a moderate level of evidence to improve our understanding of the impact of a reverse co-location integrated care model.
Summary of Implementation Findings
The implementation evaluation examined fidelity to TTBH’s program by conducting focus groups and interviews and examining patient visit data. A slightly delayed timeline in data collection was the main deviation from the SEP; mid-point interviews were conducted 10 months post-enrollment rather than 6 months, and final interviews and focus groups were conducted 4 months after study conclusion rather than immediately after. Additionally, it was not possible to systematically track external referrals to primary care for control group participants. Evaluation of the implementation of TTBH’s program shows that the program was implemented in alignment with their program logic model and that there was strong fidelity in implementation. All participants enrolled in the intervention met study eligibility criteria, and all who remained in the study for the 12 months received a minimum dose of the intervention (at least one primary care visit). TTBH exceeded their enrollment target for the study and was slightly shy of their overall 12-month retention target (final sample was 271 total participants compared to a target of 290 participants.) Intervention participants completed 2,083 primary care visits and 4,195 behavioral health visits, while control participants did not receive any primary care visits during the length of the study, evidence of no study contamination. Of the five core principles in the AIMS IBH checklist (patient-centered care, population-based care, measurement-based treatment to target, evidence-based care, and accountable care), TTBH applies three of them (patient-centered care, measurement-based treatment to target, and evidence-based care) to most or all of their patients. While fidelity to the program was strong, findings from the focus groups and interviews in the implementation study revealed facilitators and challenges to implementation. Major facilitators to implementation and lessons learned from the program include: considering dedicated clinic space conducive to IBH services, employing a single electronic medical record (EMR) system for primary care and behavioral health data on which all staff are trained on, communicating in multiple formats about the services and study to garner staff support and awareness, identifying and addressing patient barriers to care quickly, and engaging staff across multiple levels to build support for being part of the research process. In addition, qualitative findings indicate TTBH is adapting its model to keep current with the regulatory landscape of the state of Texas.
Summary of Impact Findings The main impact study and its related analyses were conducted as proposed in the SEP. The SEP also discussed a companion QED study at a nearby clinic if the RCT randomization was not successful. Since the RCT study was implemented as intended, the QED study was not included in this final report, a deviation from the SEP. This RCT impact study showed that the reverse co-location model at TTBH had a significant association with physical health improvements among intervention participants. After 12 months in the program, intervention participants were more likely than control participants to see significant improvements in their blood pressure and HbA1c levels, when controlling for age, sex, and baseline characteristics. In addition to participants’ HbA1c levels having been reduced in the full study population, significant effect modification of this model was detected. When the model for HbA1c was stratified by those with and without a baseline diagnosis of diabetes, the effect was mainly significant among those who had a

Sí Texas Subgrantee: Tropical Texas Behavioral Health Program Title: Improving Access to Integrated Care for Rio Grande Valley Residents with Severe & Persistent Mental Illness
84
diagnosis of diabetes at baseline. Additional stratified analyses were performed looking at HbA1c for participants 40 years of age or older and those under 40 years separately. These analyses showed that the effect on HbA1c was significant among those 40 years of age or older. The exploration of effect modification and subsequent stratified analyses provided further insight into the statistically significant intervention effect on HbA1c in that it was primarily driven by the effect among the older study participants who had a diagnosis of diabetes at baseline. Given the strength of the study design, there is considerable evidence that the intervention contributed to the positive changes in health outcomes among participants. However, we did not see any change in cholesterol, obesity, depression, or life function.
Lessons Learned, Study Limitations, and Next Steps This evaluation contributes to our understanding of the impact of the integration of primary care services within a behavioral health service context on the health status of individuals with SPMI. Prior evidence for this intervention includes RCTs by Druss et al. (2010; 2011) and the Boardman (2006) QED study, which found positive results of integrating primary care into the behavioral health setting. This study builds on this previous work by examining the impact of a reverse co-location model with an SPMI population and particularly among a population that is predominantly Hispanic and low-income. There is limited evidence regarding the effectiveness of integrated care programs implemented in the severe persistent mentally ill population, with only one randomized control trial having been published to-date (Scharf et al., 2014). To our knowledge, the TTBH Sí Texas evaluation is not only the first randomized control trial for the institution, but also the first RCT examining reverse co-location integrated behavioral health care approach in a predominately Hispanic SPMI population in the scientific literature. Findings from this evaluation corroborate the Scharf et al. (2014) results that found that consumers in integrated care showed improvement on some (hypertension, total cholesterol) but not all health indicators studied (e.g., obesity, depression, or life function). More importantly, it builds the knowledge-base of integrated care in predominantly low-income, Hispanic communities. The following summary outlines key lessons learned, study limitations, and next steps.
Lessons Learned While the intervention and evaluation were implemented with strong fidelity, many lessons emerged that could inform other organizations interested in implementing a reverse co-location model.
Operational Facilitators As detailed in findings from the implementation evaluation, there were a number of critical elements from an operational perspective that facilitated TTBH’s success. First, TTBH leadership noted that a fundamental requirement for successful integration was having staff with the appropriate skills and experience to deliver those services. This was especially true for frontline providers and a project manager, who were described as essential personnel “on the ground” that contributed to overall staff morale and a strong organizational culture. Organizational culture can be easily overlooked in discussions focusing on implementation strategy (Meadows, 2016), but findings from this evaluation validate the importance of investing time and resources that support ongoing learning and teamwork. Strong leadership support was also critical to the implementation of this program and explicitly demonstrating to staff at all levels that this was an important operational change to the facility. Lastly, staff turnover/retention was a challenge for TTBH. However, strong training and communication procedures across staff involved in the program helped minimize the effects of staff turnover.

Sí Texas Subgrantee: Tropical Texas Behavioral Health Program Title: Improving Access to Integrated Care for Rio Grande Valley Residents with Severe & Persistent Mental Illness
85
Sustainability Planning Despite the effectiveness IBH can have on patient health, a number of persistent challenges continue to create barriers to IBH implementation. At the forefront of these concerns is deciding how to best support consumers with complex, co-morbid needs to address patient health and be financially sustainable. This program was underwritten by a grant from Methodist Healthcare Ministries through the Social Innovation Fund and matching funds from Valley Baptist Legacy Foundation. In applying for the multi-year grant, program planning focused on a model that would be most effective to improve health within the SPMI population. TTBH is currently considering challenges with financial sustainability of the model given the policy and reimbursement environment. According to findings from similar analyses in identifying the potential for cost savings from integrated care (Cohen et al., 2015, Scharf et al., 2014, Meadows, 2016), future research should consider how the distribution of costs varies between behavioral and physical health costs, how the combined costs vary among individuals, and how these can be financially sustained within current reimbursement processes. Further, integrating care requires a close examination of types of insurance coverage connected to the patient population in order to identify revenue streams and ideal partners, such as FQHCs and accountable care organizations (Meadows, 2016). TTBH is in the process of engaging managed care organizations (MCOs) across the state of Texas, which deliver almost all community-based Medicaid services.
Evaluation Lessons TTBH implemented an RCT study for this evaluation. While TTBH has a long history of conducting quality improvement work, it has never undertaken a study of this level of rigor previously. Careful planning was important in this process. Prior to the launch of the study, TTBH conducted several mock data collection sessions for initial baseline assessment to ensure that the flow of enrollment was smooth and that staff involved understood their roles and responsibilities in data collection. TTBH started data collection one month earlier than expected, with only five participants to further pilot and refine their enrollment and data collection procedures. This was an important facilitator to successful study implementation. Given the anticipated challenges of enrolling and retaining the SPMI population for a study, TTBH exceeded their enrollment targets at baseline. Even so, they did not meet their retention target, although still achieved a strong retention level at 12 months. To achieve this, TTBH employed several retention strategies included identifying several methods of contact for study participants, keeping close and frequent communication with study participants, and providing incentives. While there were challenges along the way in study implementation, one of the main reasons that these challenges were mitigated was because of the strong project management at TTBH and frequent and clear communication processes at TTBH. Study Limitations and Implications for Future Research It is important to note the limitations of this study. TTBH evaluation findings show that intervention participants were more likely than control participants to see significant improvements in their blood pressure and HbA1c levels, but there were not any statistically significant improvements in cholesterol, obesity, depression, or life function. It is possible that these other physical and mental health outcomes require a longer term (e.g., more than a year) to manifest into meaningful changes, and observing these outcomes with a longer follow-up period may yield different results. Additionally, this study did not assess medication as a covariate or effect modifier. For example, we were unable to account for medications that can cause weight gain (e.g. lithium based). The sample also was relatively young, and

Sí Texas Subgrantee: Tropical Texas Behavioral Health Program Title: Improving Access to Integrated Care for Rio Grande Valley Residents with Severe & Persistent Mental Illness
86
in turn possibly healthier than anticipated, and therefore the effectiveness of the program could have been influenced by the age range. As seen in the results, stratified analyses indicated that the intervention has a much stronger effect on HbA1C among diabetics and those 40 years old and older on HbA1C. This study showed no significant changes in mental health outcomes, which were measured using tools for self-report (ANSA, PHQ-9). These tools each measure function in different ways, and each have unique contributions and limitations. The sample was comprised of participants already receiving mental health services at TTBH. It is possible that TTBH patients purposely did not indicate that their mental health was improving for concern that they would no longer be eligible for services. In addition to potential measurement issues, this study also did not examine any differences by mental health diagnosis. This study was focused on all SPMI patients who met study eligibility criteria; it did not focus on one particular diagnosis, which could be affected by the program. This study was not powered to examine intervention impact by diagnosis; for example, it is possible that the intervention might work differently among those with major depressive disorder compared to those with schizophrenia. One area for future research would be to examine whether there is a differential impact of the intervention by SPMI diagnoses, specifically on mental health outcomes. Lastly, while there is considerable evidence that the overall intervention contributes to the positive changes in physical health outcomes among participants, more information is needed to identify the specific components of integration that were most effective. This study examined the intervention as a whole and was not designed to evaluate each specific component of the intervention. Future research might want to consider examining the effect of primary care visits only in a reverse co-location model vs. adding other services such as a nutritionist or diabetes educator. Given the sustainability challenges ahead, future research may also want to examine different doses of the intervention to identify what is the minimum amount that achieves impact across the study population.
Next Steps TTBH noted that fragmented funding for behavioral health can undermine the replication of integrated care programs, and there is a need to explore different revenue streams for services that are not currently reimbursable in the state of Texas. These findings are consistent with other studies (Meadows, 2016) and implies that policy change is needed to support integrated care in a way that is financially viable. As detailed in the implementation qualitative findings, as TTBH moves forward in its service implementation after the study, it has had to change the mix of patients they can accept for primary care services, reduce the number of clinical staff, and think strategically about accessing additional funding sources going forward. TTBH is planning to continue the primary care model in its facility but is examining these findings and their operational plans to determine how to modify the model so it is financially sustainable.

Sí Texas Subgrantee: Tropical Texas Behavioral Health Program Title: Improving Access to Integrated Care for Rio Grande Valley Residents with Severe & Persistent Mental Illness
87
OTHER ASPECTS OF STUDY LOGISTICS AND FEASIBILITY
Human Subjects Protection
Tropical Texas Behavioral Health submitted its initial research protocol in late September 2015 to the New England Independent Review Board (NEIRB) for their determination of risk and approval of study procedures. NEIRB approved TTBH’s initial research protocol on November 12, 2015 (protocol reference number 15-401). TTBH submitted an amendment in early December 2015 and received approval for that amendment on December 29, 2015. No enrollment took place while the amendment was being reviewed by NEIRB. TTBH did not encounter any problems securing approval from NEIRB and received approval according to the planned study timeline. In accordance with NEIRB procedures, TTBH submitted a continuing review report to NEIRB which was approved in November 2016. No deviations in research protocol have occurred to-date.
Timeline
SIF conditional approval to begin data collection was received in November 2015. The evaluation was implemented as intended except for a deviation to the original timeline. TTBH conducted enrollment on a rolling basis between November 2015 and June 2016. Six-month follow-up began in May 2016 and ended in January 2017. Twelve-month follow-up began in November 2016 and ended in June 2017. This timeline represents a change from the SEP and is reflected in Appendix A. TTBH did not have any changes to the budget or to their program team.
Evaluator/Subgrantee Role and Involvement
No deviations from the SEP were made to the principal leads from the evaluator or subgrantee. The only personnel change was Rebecca Adeigbe, MS, who served as HRiA’s project manager for the overall Sí Texas project, and left the organization in March 2017. Edlín Maldonado-Fuller, MBA, was hired in August 2017 for this position. No other staff changes occurred. The Principal Investigator of record for the study under the IRB protocol is Dr. Karen Errichetti.
Budget
No changes were made to the budget during the project period to-date.

Sí Texas Subgrantee: Tropical Texas Behavioral Health Program Title: Improving Access to Integrated Care for Rio Grande Valley Residents with Severe & Persistent Mental Illness
88
REFERENCES Advancing Integrated Mental Health Solutions Center (AIMS), University of Washington (2011).
Retrieved. http://aims.uw.edu/resource-library/checklist-collaborative-care-principles-and-components
American Diabetes Association. (2014). Standards of medical care in diabetes--2014. Diabetes Care, 37 Suppl 1, S14–80. http://doi.org/10.2337/dc14-S014
American Heart Association. (2015). Understanding Blood Pressure Readings. Retrieved July 22, 2015, from http://www.heart.org/HEARTORG/Conditions/HighBloodPressure/AboutHighBloodPressure/Understanding-Blood-Pressure-Readings_UCM_301764_Article.jsp
American Psychiatric Association. (1994). Quick Reference to the Diagnostic Criteria from DSM-IV. Washington, DC: Press, Inc.
Belsley, D. A., Kuh, E. & Welsch, R. E. (1980). Regression Diagnostics: Identifying Influential Data and Sources of Collinearity. New York: Wiley.
Birtcher, K. K., & Ballantyne, C. M. (2004). Cardiology patient page. Measurement of cholesterol: a patient perspective. Circulation, 110(11), e296–7. http://doi.org/10.1161/01.CIR.0000141564.89465.4E
Boardman, J. B. (2006). Health access and integration for adults with serious and persistent mental illness.
Brown, S. (1997). Excess mortality of schizophrenia. A meta-analysis. The British Journal of Psychiatry, 171(6), 502–508. http://doi.org/10.1192/bjp.171.6.502
Chwastiak, L. A., Davydow, D. S., McKibbin, C. L., Schur, E., Burley, M., McDonell, M. G., … Daratha, K. B. (2014). The Impact of Serious Mental Illness on the Risk of Re-hospitalization among Patients with Diabetes. Psychosomatics, 55(2), 134–143. http://doi.org/10.1016/j.psym.2013.08.012
De Hert, M., Correll, C. U., Bobes, J., Cetkovich-Bakmas, M., Cohen, D., Asai, I., … Leucht, S. (2011). Physical illness in patients with severe mental disorders. I. Prevalence, impact of medications and disparities in health care. World Psychiatry : Official Journal of the World Psychiatric Association (WPA), 10(1), 52. Retrieved from http://utsa.summon.serialssolutions.com/2.0.0/link/0/eLvHCXMw1V1Lb5wwELY2qVRVqqqmD_qUfN-CwBjbe-ghTVIlag8rdaP2Fhljq6vswjZLr_3tHTNgaKL8gB7QigUDsj_PjMcz3xCSsySNb8mEQkvlHGOl40IzLgrJDVjehhfMaVFWQ2mCjsNmNhvqqN7itfnPB3459Px6s-nk2Mie2qeygTK0N3be0_pXPf_mPplfJD4kAz
Denzin, N. K., & Lincoln, Y. S. (2000). Handbook of qualitative research. Thousand Oaks, Calif.: Sage Publications.
Druss, B. G., Rohrbaugh, R. M., Levinson, C. M., & Rosenheck, R. A. (2001). Integrated medical care for patients with serious psychiatric illness: a randomized trial. Archives of General Psychiatry, 58(9), 861–8. Retrieved from http://www.ncbi.nlm.nih.gov/pubmed/11545670
Druss, B. G., von Esenwein, S. A., Compton, M. T., Rask, K. J., Zhao, L., & Parker, R. M. (2010). A Randomized Trial of Medical Care Management for Community Mental Health Settings: The Primary Care Access, Referral, and Evaluation (PCARE) Study. The American Journal of Psychiatry, 167(2), 151–159. http://doi.org/10.1176/appi.ajp.2009.09050691
Fitzmaurice, G. M., Laird, N. M., & Ware, J. H. (2004). Applied longitudinal analysis. Hoboken, N.J: Wiley-Interscience.
Galon, P., & Graor, C. H. (2012). Engagement in primary care treatment by persons with severe and persistent mental illness. Archives of Psychiatric Nursing, 26(4), 272.
Goodman, S.N., & Berlin, J.A. (1994). The Use of Predicted Confidence Intervals When Planning
Sí Texas Subgrantee: Tropical Texas Behavioral Health Program Title: Improving Access to Integrated Care for Rio Grande Valley Residents with Severe & Persistent Mental Illness
89
Experiments and the Misuse of Power When Interpreting Results. Ann Intern Med, 121, 200-206. Retrieved from: https://dirnagl.files.wordpress.com/2014/07/goodman-the-use-of-predicted-confidence-intervals-when-planning-experiments-and-the-misuse-of-power-when-interpreting-results-ann-intmed-1994.pdf
Harris, E. C., & Barraclough, B. (1998). Excess mortality of mental disorder. The British Journal of Psychiatry : The Journal of Mental Science, 173, 11–53. Retrieved from http://www.ncbi.nlm.nih.gov/pubmed/9850203
Himelhoch, S., McCarthy, J. F., Ganoczy, D., Medoff, D., Kilbourne, A., Goldberg, R., … Blow, F. C. (2009). Understanding associations between serious mental illness and hepatitis C virus among veterans: a national multivariate analysis. Psychosomatics, 50(1), 30–37. http://doi.org/10.1176/appi.psy.50.1.30
Kim, R., Hickman, N., Gali, K., Orozco, N., & Prochaska, J. J. (2014). Maximizing retention with high risk participants in a clinical trial. American Journal of Health Promotion : AJHP, 28(4), 268. Retrieved from http://utsa.summon.serialssolutions.com/2.0.0/link/0/eLvHCXMw1V1ZS8NAEF48QAQRz3jC_oGU7maz2Tz4UFq1eD14QN_KZg8I0qTWKuKvd48kjQV_gE9hCYFkv8lk5svMfABEuNMNl3xCzBOmNcaZJpRjQuOECBN5CxJjzWkma2kCN8NmIee5NNfmnwN_z7_ySf5tKYCZjYgdwI5utaOJfS35lFfV1LYIJi_aHZJOxqMdsjb_dF
Kroenke, K., & Spitzer, R. L. (2002). The PHQ-9: A New Depression Diagnostic and Severity Measure. Psychiatric Annals, 32(9), 509–515. http://doi.org/10.3928/0048-5713-20020901-06
Lasser KE, Quintiliani LM, Truong V, Xuan Z, Murillo J, Jean C, Pbert L. Effect of Patient Navigation and Financial Incentives on Smoking Cessation Among Primary Care Patients at an Urban Safety-Net Hospital: A Randomized Clinical Trial. JAMA Intern Med. 2017 Dec 01; 177(12):1798-1807.
Liebschutz JM, Xuan Z, Shanahan CW, LaRochelle M, Keosaian J, Beers D, Guara G, O''Connor K, Alford DP, Parker V, Weiss RD, Samet JH, Crosson J, Cushman PA, Lasser KE. Improving Adherence to Long-term Opioid Therapy Guidelines to Reduce Opioid Misuse in Primary Care: A Cluster-Randomized Clinical Trial. JAMA Intern Med. 2017 Sep 01; 177(9):1265-1272.
Little, R.J.A. and Rubin, D.B. (1987) Statistical Analysis with Missing Data. John Wiley & Sons, New York. Meadows Mental Health Policy Institute (2016). Best Practices in Integrated Behavioral Health:
Identifying and Implementing Core Components. Retrieved http://texasstateofmind.org/wp-content/uploads/2016/09/Meadows_IBHreport_FINAL_9.8.16.pdf
National Guideline Clearinghouse. (2014). Obesity: identification, assessment and management of overweight and obesity in children, young people and adults. Rockville MD: Agency for Healthcare Research and Quality (AHRQ). Retrieved from http://www.guideline.gov/content.aspx?id=48872&search=waist+circumference
National Guidelines Clearinghouse. (2011). Hypertension. Clinical management of primary hypertension in adults. Rockville MD: Agency for Healthcare Research and Quality (AHRQ). Retrieved from http://www.guideline.gov/content.aspx?id=34824
Priebe, S., Yeeles, K., Bremner, S., Lauber, C., Eldridge, S., Ashby, D., … Burns, T. (2013). Effectiveness of financial incentives to improve adherence to maintenance treatment with antipsychotics: cluster randomised controlled trial. BMJ, 347.
Qualitative Data Analysis. (2013). Sage Pubns. Rubin DB. Multiple imputation after 18+ years. Journal of the American Statistical Association.
1996;91:473–489. Saha, S., Chant, D., & McGrath, J. (2007). A systematic review of mortality in schizophrenia: is the
differential mortality gap worsening over time? Archives of General Psychiatry, 64(10), 1123–31. http://doi.org/10.1001/archpsyc.64.10.1123

Sí Texas Subgrantee: Tropical Texas Behavioral Health Program Title: Improving Access to Integrated Care for Rio Grande Valley Residents with Severe & Persistent Mental Illness
90
Scott, K. M., de Jonge, P., Alonso, J., Viana, M. C., Liu, Z., O’Neill, S., … Kessler, R. C. (2013). Associations between DSM-IV mental disorders and subsequent heart disease onset: beyond depression. International Journal of Cardiology, 168(6), 5293–5299. http://doi.org/10.1016/j.ijcard.2013.08.012
Schaps, M., Post., S. Health and Medicine Policy Research Group. Best Practices in Behavioral-Physical Health Integration. Retrieved http://www.hmprg.org/assets/root/PDFs/2015/Behavioral%20health%20integration%20working%20paper.pdf
Scharf, Deborah M., Nicole K. Eberhart, Nicole Schmidt Hackbarth, Marcela Horvitz-Lennon, Robin Beckman, Bing Han, Susan L. Lovejoy, Harold Alan Pincus and M. Audrey Burnam. Evaluation of the SAMHSA Primary and Behavioral Health Care Integration (PBHCI) Grant Program: Final Report. Santa Monica, CA: RAND Corporation, 2014. http://www.rand.org/pubs/research_reports/RR546.
Schulz KF, Altman DG, Moher D, for the CONSORT Group. CONSORT 2010 Statement: updated guidelines for reporting parallel group randomised trials. Ann Int Med 2010;152. Epub 24 March.
Shackelford, J. R., Sirna, M., Mangurian, C., Dilley, J. W., & Shumway, M. (2013). Descriptive analysis of a novel health care approach: reverse colocation-primary care in a community mental health “home”. The Primary Care Companion for CNS Disorders, 15(5). http://doi.org/10.4088/PCC.13m01530
Wagner, E. H. (1998). Chronic disease management: what will it take to improve care for chronic illness? Effective Clinical Practice : ECP, 1(1), 2–4. Retrieved from http://www.ncbi.nlm.nih.gov/pubmed/10345255
Wood AM, White, IR, Royston P. How should variable selection be performed with multiply imputed data? Statist. Med. 2008; 27:3227–3246
World Health Organization definition of integrated care. (2008). Retrieved http://www.who.int/healthsystems/service_delivery_techbrief1.pdf

Sí Texas Subgrantee: Tropical Texas Behavioral Health Program Title: Improving Access to Integrated Care for Rio Grande Valley Residents with Severe & Persistent Mental Illness
91
APPENDICES
Appendix A TTBH Revised Project Timeline
Appendix B Program Logic Model
Appendix C Sí Texas Mid-Point Implementation Evaluation: Key Informant Interview General Guide
Appendix D Sí Texas Summative Implementation Evaluation: Key Informant Interview General Guide
Appendix E Sí Texas Summative Implementation Evaluation: Focus Group Guide- SPMI Population
Appendix F Implementation Evaluation Measures
Appendix G Loss to Follow-Up/Attrition Tables
Appendix H Patient Characteristics Form
Appendix I Patient-Centered Integrated Behavioral Health Care Checklist
Appendix J Patient Health Questionnaire – 9 (PHQ-9)
Appendix K Adult Needs and Strengths Assessment (ANSA)
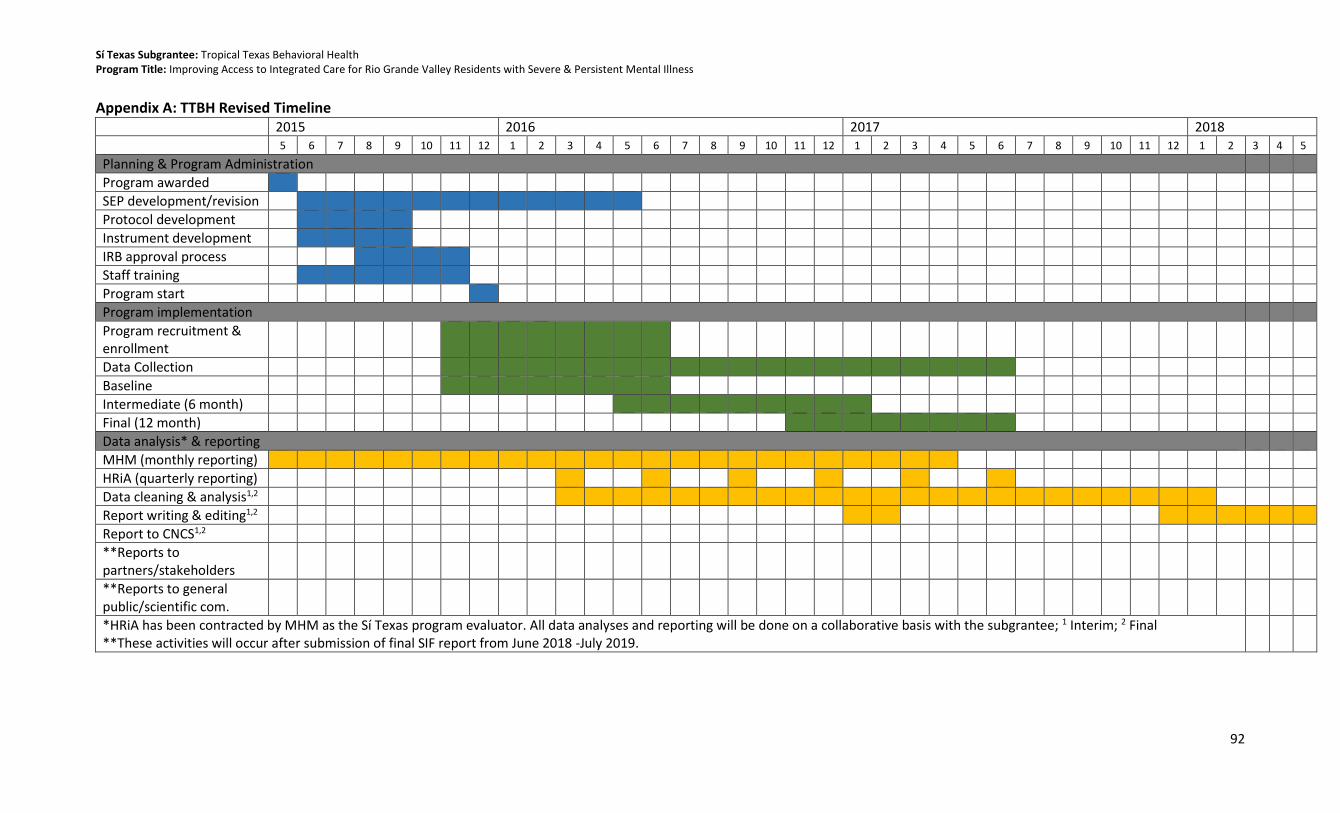
Sí Texas Subgrantee: Tropical Texas Behavioral Health Program Title: Improving Access to Integrated Care for Rio Grande Valley Residents with Severe & Persistent Mental Illness
92
Appendix A: TTBH Revised Timeline 2015 2016 2017 2018
5 6 7 8 9 10 11 12 1 2 3 4 5 6 7 8 9 10 11 12 1 2 3 4 5 6 7 8 9 10 11 12 1 2 3 4 5
Planning & Program Administration
Program awarded
SEP development/revision
Protocol development
Instrument development
IRB approval process
Staff training
Program start
Program implementation
Program recruitment & enrollment
Data Collection
Baseline
Intermediate (6 month)
Final (12 month)
Data analysis* & reporting
MHM (monthly reporting)
HRiA (quarterly reporting)
Data cleaning & analysis1,2
Report writing & editing1,2
Report to CNCS1,2
**Reports to partners/stakeholders
**Reports to general public/scientific com.
*HRiA has been contracted by MHM as the Sí Texas program evaluator. All data analyses and reporting will be done on a collaborative basis with the subgrantee; 1 Interim; 2 Final **These activities will occur after submission of final SIF report from June 2018 -July 2019.

Sí Texas Subgrantee: Tropical Texas Behavioral Health Program Title: Improving Access to Integrated Care for Rio Grande Valley Residents with Severe & Persistent Mental Illness
93
Appendix B: Program Logic Model
Inputs
Collaborative treatment team
Behavioral Health staff
Care coordinators
Dieticians
Electronic medical records
Activities
Diagnosis of mental health and co-morbid illness
Care planning
Care coordination between primary/preventative and behavioral health care services
Health promotion and risk reduction training
Monitoring patient health
Communication about and coordination of internal and external components of client’s behavioral and physical health
Outputs
Written person-centered care plans that cross primary and behavioral health care service boundaries
Coordinated primary and behavioral health services
Scheduling of follow up appointments for primary and behavioral health
Provider collaboration and communication about patients receiving both primary and behavioral health care services
Short
Individual
Improved knowledge of self- management/skills
Provider
Awareness of best-care practices
Improved
Clinic operations
Closer collaboration between providers
Workflow alignment across primary care
Healthcare system
Adherence to new model policies & procedures
Intermediate
Risk factor reduction through lifestyle modifications & clinical intervention
Reduced blood pressure, BMI, total cholesterol, plasma glucose or depressive symptoms
Increased control of blood pressure, body mass, total cholesterol, or plasma glucose, reduced depressive symptoms
Increased functioning and quality of life
Long
Reduced morbidly and mortality due to chronic health conditions among individuals with SPMI
Reduced chronic disease health disparities among individuals with SPMI
External Factors/Context: Transportation, cultural stigma, incarceration, loss to follow up, changes in eligibility for behavioral health services
Outcomes
Community specialty care
Recruit 182 participants into each study arm

Sí Texas Subgrantee: Tropical Texas Behavioral Health Program Title: Improving Access to Integrated Care for Rio Grande Valley Residents with Severe & Persistent Mental Illness
94
Appendix C: Sí Texas Mid-Point Implementation Evaluation: Key Informant Interview General Guide INTERVIEW GOALS • To collect qualitative information about the implementation of the Sí Texas initiative • To understand whether the intended target population has been reached at each subgrantee site • To learn whether what was planned for implementation was actually implemented, and to identify facilitators and barriers of adoption • To learn what has gone well during the initial phase of the Sí Texas project at the subgrantee level and what needs improvement, and to understand plans for making improvements in the future INTRODUCTION/INFORMED CONSENT
• Thank you for taking the time out of your day to meet with us. My name is [name] I am a researcher at Health Resources in Action, and today I am joined by my colleague [name] who will assist me during our interview.
• Our goal today is to collect perspectives about the implementation of your Sí Texas project. We hope to learn what has gone well during this initial phase of the project. We are also interested in learning about any challenges that may have been encountered during this period, and your perspectives about what’s ahead for the program.
• The interview should last approximately 45 minutes to one hour. I want to remind you that this interview is voluntary and confidential. What we talk about in this space stays in this space so feel free to share your opinion openly and honestly without worrying that it will be repeated. You may choose not to answer any questions during the interview and we can stop at any time. Your interview answers will be summarized in a report along with the interviews from other interview participants.
• I will not identify [name of subgrantee], your name, or your organization’s name with your responses in any publication. At the end of the study, we will return to many of our interviewees and ask to re-interview them after the program period has ended. However, participating in this interview does not mean you have to participate in a subsequent interview. The final interview is also voluntary.
• Do you have any questions about the study or how your responses will be used? I would also like to record our session today to make sure our notes are complete and correct, but we will delete the recording after we verify and save our notes. We won’t use names in our notes. Are you okay with me recording our discussion?
• As a reminder, when you answer a question, please do not use client’s/patient’s names. We would appreciate you provide more general examples if you would like to describe a specific situation.

Sí Texas Subgrantee: Tropical Texas Behavioral Health Program Title: Improving Access to Integrated Care for Rio Grande Valley Residents with Severe & Persistent Mental Illness
95
INTERVIEW QUESTIONS 1. Key Informant Background
• What is your current role, and how long have you served in this role? How long have you been with your organization?
• What are your responsibilities at [subgrantee/organization]?
• Do you have any responsibilities for running the [name of subgrantee Sí Texas program]? If so, would you tell us about those responsibilities?
• What was your involvement in the [name of subgrantee Sí Texas program] planning process? What was that process like?
For the remaining questions, the interviewer will select questions to ask based on the person being interviewed and the subgrantee’s specific needs/implementation questions. It is recommended that those questions be selected prior to interview.
2. Level of Integrated Behavioral Health
• What do you understand the goals of the Sí Texas project to be?
• Prior to the program’s implementation, did your program offer both primary care and behavioral health services?
o What did that look like? To what extent were primary care and behavioral health services connected/coordinated/combined, if at all?
o [For programs with other integration goals]: To what extent are [services] integrated? ▪ Probes: in what way are services integrated? Coordinated? (e.g., IT, workflow)
• Now that the [name of subgrantee Sí Texas program] has been implemented, to what extent are primary care and behavioral health services connected/coordinated/combined, if at all?
o How feasible has it been to integrate these services? (If applicable)
3. Program Components and Population
• How are participants identified for the program? What is/was the enrollment process like? o How were participants assigned to the intervention or control group? (For randomized
control trials, ask the participant to describe the randomization process.) o When a participant enrolls in the program, what happens to them next? Take me
through the services and activities that an enrollee receives in the program. ▪ Probe: Are warm hand offs between providers a component of the services
participants receive? How do those hand offs work? (If applicable) o How are behavioral health/health coaches accessed or how do they become involved in
patient care?
• Since beginning enrollment, to what extent has the program been able to deliver all the program services that had been planned as part of the program intervention? (Ask those who had a role in planning the program)
• Since the program started, has anything changed about the services that intervention group participants received or activities they have access to at your clinic? In what way?
• To what extent/Have any adjustments been made to program operations or offerings based on your early experience implementing the program?
• How would you describe the population that your program is serving?

Sí Texas Subgrantee: Tropical Texas Behavioral Health Program Title: Improving Access to Integrated Care for Rio Grande Valley Residents with Severe & Persistent Mental Illness
96
o What are they like in terms of demographics generally? Is this the population it intended to serve?
4. Adoption
• To-date, what have been the most successful parts of the program? Why?
• To-date, what have been the least successful parts of the program? Why?
• Please describe any barriers you or your organization has experienced in implementing the program.
o In what ways did these barriers affect program implementation? In what ways have you been able to address these barriers?
• Please describe anything that has helped your organization implement the program. o Probes: Is the staff, the facilities, the data systems, outside partners, or other things?
• What kind of training did you develop/participate in as part of the program? o Did this training prepare you for your responsibilities in the program? If not, what was
missing from the training?
• What, if any, concerns have program staff raised about the program? How about non-program staff (if relevant)?
o What has been the response, if any, to those concerns?
5. Control Group Program-Like Components (if applicable)
• When a participant is randomized/enrolled in the control/comparison group of your program, what can they expect to receive or participate in terms of services or activities?
• Since the program started, has anything changed about the services that control group participants received or activities they have access to at your clinic? In what way?
o Have those changes been experienced by the intervention group? If no, why not?
6. Operations (Choose Clinic or Community as appropriate) Clinic-based Operations
o In what ways have clinic operation workflow changed due to implementation of your project?
o What do you see as the impact of this workflow change, if any? ▪ Have these changes had any effects on patient care for those participants not
enrolled in the study? In what way? o To what extent have information/data systems/your EMR been changed to support the
program? Have you added any information/data systems for the project? Community-based Operations
• How, if at all, has your agency operation workflow changed due to implementation of your project?
• What do you see as the impact of this workflow change, if any? o How, if at all have these workflow changes affected client care for those participants
not enrolled in the study? In what way?
• To what extent have information/data systems been changed to support the community program? Have you added any information/data systems for the project?
7. Patient and Provider Satisfaction
[Remind respondent not to identify participants by name or to use any identifying information when giving examples]
Sí Texas Subgrantee: Tropical Texas Behavioral Health Program Title: Improving Access to Integrated Care for Rio Grande Valley Residents with Severe & Persistent Mental Illness
97
• What do you think participants in general would say about the program? Would you mind sharing any general themes from feedback you have heard from participants about the program?
• Have you heard any feedback from providers about program implementation? What are some of the general themes from their feedback been?
• To what extent have there been challenges to retaining primary care, behavioral health, or community-based staff during the course of the [name of subgrantee program]? Why do you think there have been challenges, and what has been done to address those challenges?
8. External Partnerships (if applicable)
• How would you describe your partnership(s) with external organizations related to this program? What role have these partnerships played in early implementation?
• How has the partnership been helpful in promoting implementation of program activities?
• To what extent have there been challenges in building and maintaining productive partnerships to-date?
• Are there any gaps in program activities that were the responsibility or role of a partner? Would you share with me any steps your organization has taken (or will take) to overcome this gap?
9. Sustainability and Lessons Learned
• If you could go back in time and change anything about getting the program started, what would that change be? Why?
• What changes, if any, would you want to make at this point in the program?
• What lesson have you learned to-date from the early experiences of your program that you would want to share with other organizations thinking of implementing your program in their setting?
10. Closing Thank you so much for your time. That’s it for my questions. Is there anything else that you would like to mention that we didn’t discuss today?

Sí Texas Subgrantee: Tropical Texas Behavioral Health Program Title: Improving Access to Integrated Care for Rio Grande Valley Residents with Severe & Persistent Mental Illness
98
Appendix D: Sí Texas Summative Implementation Evaluation: Key Informant Interview General Guide
Sí Texas Summative Implementation Evaluation: Key Informant Interview General Guide
CORE INTERVIEW GOALS • To understand how primary care and behavioral health services are integrated (in various settings) from the perspective of staff (clinic and non-clinic) • To identify perceived facilitators and barriers to adoption of the IBH model, including external factors • To identify program successes, challenges, opportunities for improvement, and lessons learned for sustainability • To better understand the perceived impact of the program on participants’ health and wellbeing.
INTRODUCTION/INFORMED CONSENT (2 MIN)
• Hi, my name is [name] and I am a researcher at Health Resources in Action. I am also joined by my colleague [name] who will assist me during our interview. Thank you for taking the time to speak with us today.
• We are speaking with a variety of people to better understand the implementation of [name of subgrantee Sí Texas program]. We are interested in learning what has worked well, challenges that may have been encountered, and any advice or lessons learned that could inform future planning or sustainability of programs like [name of subgrantee Sí Texas program].
• The interview should last approximately [INSERT TIME: 30-60 minutes]. I want to remind you that this interview is voluntary and confidential. What we talk about in this space stays in this space so please feel free to share your opinions openly and honestly. You may choose not to answer any questions during the interview and we can stop at any time. We are conducting several interviews such as this one and will be writing a summary report that pulls out common themes. We will not identify you in our report or any future publication.
• Do you have any questions about the study or how your responses will be used? I would also like to record our session today to make sure our notes are complete and correct, but we will delete the recording after we verify and save our notes. We won’t use names in our notes. Are you okay with me recording our discussion?
• As a reminder, when you answer a question, please do not use client’s/patient’s names. We would appreciate you provide more general examples if you would like to describe a specific situation.

Sí Texas Subgrantee: Tropical Texas Behavioral Health Program Title: Improving Access to Integrated Care for Rio Grande Valley Residents with Severe & Persistent Mental Illness
99
INTERVIEW QUESTIONS [NOTE: IF INTERVIEWEE PARTICIPATED IN MID-POINT DATA COLLECTION, PLEASE FRAME CONVERSATION AS NEEDED TO ACKNOWLEDGE PREVIOUS DISCUSSION (E.G., since we last interviewed you, what additional changes were made to better connect or coordinate services?)] Key Informant Background (3 MIN)
1. I’d like to start by asking you a few questions about yourself. Can you tell me about your role in [name of subgrantee Sí Texas program]?
a. How long have you been involved with the [name of subgrantee Sí Texas program]? i. Has anything about your role in the project changed since you started working
with [name of subgrantee Sí Texas program]?
Integrated Behavioral Health Program Goals and Activities (10-15 MIN)
2. Now I’d like to talk about the program’s goals and its specific activities. What do you see as the goals of [name of subgrantee Sí Texas program]? What were you hoping to achieve for participants?
a. [SUBGRANTEE SPECIFIC PROBES: How about goals or desired outcomes for the wider community—for example, family members or care givers? Operational goals for [name of subgrantee Sí Texas program] (e.g., improving show rates to appointments, reducing wait times, etc.)]?
3. Can you walk me through the program: after a participant enrolled in the intervention group, what services or activities did they receive?
a. After a participant enrolled in the control/comparison group, what services or activities did they receive?
b. What changes, if any, were made to the services or activities offered to intervention participants? How about comparison/control group participants? Why?
i. How did these changes affect the program?
4. Since implementing the [name of subgrantee Sí Texas program], to what extent have primary care and behavioral health services been connected or coordinated? How have these services been connected or coordinated?
a. How easy or hard has it been to connect or coordinate these services? Why? (If applicable)
i. What has made services more or less connected or coordinated? ii. What changes were made to better connect or coordinate services?
b. [SUBGRANTEE SPECIFIC PROBE: How are primary care providers involved in patient care? [OR] How are behavioral health providers/health coaches involved in patient care?]
c. [SUBGRANTEE SPECIFIC PROBE: Do warm handoffs occur between primary care and behavioral health? How do warm hand offs work? Since the program started, have any changes been made to how warm hand offs work?]

Sí Texas Subgrantee: Tropical Texas Behavioral Health Program Title: Improving Access to Integrated Care for Rio Grande Valley Residents with Severe & Persistent Mental Illness
100
Adoption Facilitators and Barriers (15 MIN) [NOTE TO INTERVIEWER: FOCUS ON FACILITATORS/BARRIERS TO IMPLEMENTATION NOT OUTCOMES]
5. Next I’d like to talk about your experience with implementing the program or putting it into practice. What worked well about putting the program into practice? Why? [PROBE ON ALL: LEADERSHIP, STAFF, COMMUNICATION, DATA SYSTEMS, EMR, PARTNERSHIPS, TRAINING, AND OTHER SUBGRANTEE SPECIFIC AREAS ]
a. What helped you/your organization implement the program?
6. On the flip side, what has not worked well about putting the program into practice? Why? [PROBE ON ALL: LEADERSHIP, STAFF, COMMUNICATION, DATA SYSTEMS, EMR, PARTNERSHIPS, TRAINING, AND OTHER SUBGRANTEE SPECIFIC AREAS ]
a. What barriers or challenges did you/your organization experience in implementing the program? [PROBE ON EXTERNAL FACTORS (e.g., natural disasters, legislation, funding shifts, political events, etc.)]
i. In what ways have you been able to address these barriers?
7. [IF NOT YET MENTIONED:] Since the start of the [name of subgrantee Sí Texas program], what changes were made to how the program was implemented? Why? [PROBE ON: WORKFLOW, STAFFING, DATA SYSTEMS/EMR, POLICY, OTHER SUBGRANTEE SPECIFIC AREAS]
a. How did these changes affect the program?
Provider and Patient Satisfaction (5 MIN)
8. [IF NOT YET MENTIONED:] I’m also interested in your perspective on others’ experiences with implementing the program. What feedback have you heard from providers or staff about the process of implementing the program?
a. How satisfied were providers or staff with the program? b. [SPECIFIC SUBGRANTEE PROBE: To what extent did providers or staff buy in to the
program? How did this affect implementation?]
9. What feedback have you heard from participants about the process of participating in the program?
a. [SPECIFIC SUBGRANTEE PROBE: How satisfied were participants with the program?]
Program Impact (5 MIN)
10. In your opinion, how effective was the program at achieving its goals? a. How do you think the program affected participants’ health? b. To what extent do you think the program made an impact on participants’ health?
i. What was the program’s impact on participant…? [PROBE ON SPECIFIC IMPACT MEASURES (e.g., diabetes, depression, BMI, etc.)]
11. What events or trends did you see as affecting program impact? (e.g., natural disasters, legislation, funding shifts, political events, etc.)

Sí Texas Subgrantee: Tropical Texas Behavioral Health Program Title: Improving Access to Integrated Care for Rio Grande Valley Residents with Severe & Persistent Mental Illness
101
Sustainability and Lessons Learned (10 MIN)
12. Lastly, I’d like to talk about the future of [name of subgrantee Sí Texas program]. As the Sí Texas project draws to a close, what is the plan for [name of subgrantee Sí Texas program]?[PROBE ON PROGRAM CONTINUATION, REPLICATION, SCALING UP]
a. Moving forward, how does [subgrantee] plan to improve or enhance the integration of primary care and behavioral health services?
13. If you could start over and implement this program from the very beginning, what changes would you make for the program to be more successful? Why? [PROBE ON DATA SYSTEMS, STAFFING, TRAINING, CLINIC SPACE, FUNDING]
a. If a similar organization were planning to implement your program from the ground up, what advice would you give them?
14. What suggestions/recommendations do you have to help continue/sustain the positive efforts of [name of subgrantee Sí Texas program]? [PROBE ON PROGRAM REPLICATION, SCALING UP, FUNDING, POLICY CHANGE]
Closing (2 MIN) Thank you so much for your time. That’s it for my questions. Is there anything else that you would like to mention that we didn’t discuss today?

Sí Texas Subgrantee: Tropical Texas Behavioral Health Program Title: Improving Access to Integrated Care for Rio Grande Valley Residents with Severe & Persistent Mental Illness
102
Appendix E: Sí Texas Summative Implementation Evaluation: Focus Group Guide- SPMI Population
Sí Texas Summative Implementation Evaluation: SPMI Participant Focus Group Guide
October 11, 2017
FOCUS GROUP GOALS • To better understand the perceived impact of the program on participants’ health and wellbeing. • To assess how satisfied participants are with the services they have received (Note: Included in most but not all subgrantee SEPs) • To identify perceived facilitators and barriers to participating in the program, including external factors • To identify participant perceptions of program successes, challenges, and opportunities for improvement
[PLEASE NOTE: This focus group guide is for participants with Severe Persistent Mental Illness (SPMI) and their caregivers/guardians. Informed consent will be obtained prior to the focus group, and all participants will be reminded of consent guidelines in the group setting to reinforce consent.] INTRODUCTION SCRIPT (5 MIN)
• Hi everyone. My name is [name] and this is [name]. We are from a company called Health Resources in Action, a nonprofit that does research about health and health care. [OPTIONAL IF BEHAVIORAL HEALTH COUNSELOR/SPECIALIST IS CO-FACILITATING: I am also joined by [name] from [name of organization] who will be helping me with our discussion today.]
• I want to take a few moments to remind everyone about the informed consent form you all signed prior to our group. You should all have a copy of that consent form in front of you.
• We are working with [subgrantee name] [name of program/service/study] to understand how the [name of program/services/study] worked and your experience in the [name of Sí Texas program].
• We also want to ask you about your ideas to make the [program/services/study] better in the future. I want everyone to know there are no right or wrong answers to our questions. We want to know your opinions, and those opinions might not all be the same in the group. This is fine. Please feel free to share your opinions, the good and the bad.
• I want to remind you that talking with us in this group is voluntary. You can leave anytime
or choose not to answer any question we ask. Even if you signed the consent form before
coming here today, you can still decide not to participate in the group. If you decide to
leave, this decision will not affect your relationship with us, the [name of subgrantee], or
any services that the [name of subgrantee] provides to you. We may also ask participants to
leave the room if we feel the conversation is upsetting.
NEIRB 120170278 #96105.0

Sí Texas Subgrantee: Tropical Texas Behavioral Health Program Title: Improving Access to Integrated Care for Rio Grande Valley Residents with Severe & Persistent Mental Illness
103
• We are not asking questions today about your health conditions or diagnoses, and there is
no reason for anyone here to feel like you have to share that information in the group. We
ask that you not share any private information about yourself, your family members, or
other people in this group. If you want to share an example, please share that information in
a general way without using names.
• We also want to do everything we can to make sure what we talk about in the group stays
private, so we are asking everyone not to share anything you hear today with anyone
outside of the group. We are asking everyone to do this to make sure everyone feels
comfortable sharing their opinions. We will definitely not share anything we hear today with
anyone outside the group, but I want you all to know that we cannot guarantee privacy for
the entire group.
• We want everyone to be aware there are certain kinds of information that we are required
by law to report to authorities such as statements about assault, abuse, or neglect.
• We will be writing up a report of the general ideas we hear today from your group and other
groups we talk with, but no one’s name will be used in our summary. No one will be able to
tell it was you who said something in our report.
• We expect our time together will be about an hour and a half. Again, you can leave anytime for any reason. If you need to go to the restroom, please feel free to leave, but we’d appreciate it if you would go one at a time.
• If you feel upset at any time today during our group conversation, it is okay to leave the room and meet with one of the counselors. [Name of behavioral health support person] is sitting just outside our session today and is available to you if you would like to talk to someone.
• [IF INCENTIVE IS OFFERED, OTHERWISE OMIT: Each of you will receive a [$amount] gift card for completing today’s group conversation. To receive the gift card, you will need to put your initials on a receipt for our records and we will give you a copy of that receipt. Our copy of the receipt will be kept private.]
• We would also like to audio record our session today to make sure our notes are complete and correct, but we will delete the recording after we verify and save our notes. We won’t use names in our notes. Is everyone okay with me recording our conversation?
• Does anyone have a cell phone? If you have a cell phone or any technology that makes noise, would you please turn off it off or use vibrate mode. Thank you!
• Do you have any questions before we introduce ourselves and get started?

Sí Texas Subgrantee: Tropical Texas Behavioral Health Program Title: Improving Access to Integrated Care for Rio Grande Valley Residents with Severe & Persistent Mental Illness
104
INTRODUCTION AND WARM-UP (5 MIN)
1. First let’s spend a little time getting to know one another. Let’s go around the table and
introduce ourselves. Please tell me: 1) Your first name and 2) something about yourself – such
as what you like to do for fun. [AFTER ALL PARTICIPANTS INTRODUCE THEMSELVES,
MODERATOR TO ANSWER QUESTIONS]
CAREGIVER NOTE Thanks everyone. It sounds like we have a pretty diverse group! I just want to note that some of our group participants today are here in support of their family member or friend. I want to encourage all those here as support persons to share, even if a question is directed at a [name of program/service/study] participant. Any feedback about [name of program/service/study] is very welcome! Thanks! PROGRAM RECRUITMENT (10 MIN)
2. Let’s get started by talking about how you first found out about the [name of subgrantee
program/service/study]. Tell me a little bit about how you were introduced to this
[program/service/study].
a. From what you can remember, how did you hear about the [program/service/study]?
b. Who talked to you about it?
c. Did you have an opportunity to ask questions about the [program/service/study]?
d. How easy or hard was it to understand the information provided to you about the
[program/service/study]?
3. For those who participated in the [name of subgrantee program/service/study], why did you
join the [program/service/study]?
a. What concerns, if any, did you have about joining the program/service/study?
4. For those of you who are family members or are here supporting a program participant, what
concerns, if any, did you have about the program/service/study when you learned about it?
PARTICIPANT EXPERIENCE: INTERVENTION/CONTROL GROUP (20-30 MIN)
5. I’d now like you to think about your experience as a participant of [name of
program/service/study]. If you had to describe the [program/service/study] to another patient
receiving services here at [name of subgrantee] what would you say? How would you describe
the [name of program/service/study]?
a. In your own words, what is the purpose/goal of the [name of program/service/study]? b. Who is the program/service for (e.g., for people who have diabetes or want to lose
weight)?
c. What services did you receive? What activities did you participate in? [ADD
SUBGRANTEE SPECIFIC PROBES HERE]
i. How often?
d. How was this program/service/study similar or different to health services you received
before the program/service/study?

Sí Texas Subgrantee: Tropical Texas Behavioral Health Program Title: Improving Access to Integrated Care for Rio Grande Valley Residents with Severe & Persistent Mental Illness
105
i. Support persons: how was this program/service/study similar or different to
health services your family member or friend received before the
program/service/study?
6. What did you think about the program/service/study? On a scale of 1-10 [USE VISUAL SCALE],
how would you rate your experience with the program/service/study? Why? [ADD PROBES ON
INTERVENTION/CONTROL COMPONENTS HERE (E.G., CLINIC/COMMUNITY SERVICES, REFERALLS,
CARE COORDINATION, COMMUNICATION BETWEEN PROVIDERS, ETC.]
a. What did you like best about the program/service/study? Why?
i. In what ways has the program/service/study met your needs or the needs of
your family member or friend?
ii. What was helpful to you or your family member or friend?
b. What did you not like about the program/service/study?
c. What could have made your experience or the experience of your family member or
friend better?
7. What did you think about the program/clinic staff (e.g., how they treated you, how comfortable
you felt around them, etc.)?
8. How easy or hard was it to participate in the program/service/study?
a. What made it easier to participate in the program/service/study?
i. What helped you participate in the program/service/study? [PROBE: COST,
SCHEDULE, LANGUAGE, TRANSPORTATION, INCENTIVES, ETC.]
ii. Support persons, what has helped you serve your family member or friend as
they have participated in the [name of program/service/study]?
b. What made it harder to participate in the program/service/study? [PROBE: COST,
SCHEDULE, LANGUAGE, TRANSPORTATION, POLITICAL EVENTS, HURRICANE HARVEY,
ETC.]
i. What got in the way of you participating in the program/service/study? [PROBE:
COST, SCHEDULE, LANGUAGE, TRANSPORTATION, INCENTIVES, ETC.]
ii. Support persons, what has not helped you serve your family member or friend
as they have participated in the [name of program/service/study]?
PROGRAM VALUE/IMPACT (10-15 MIN)
9. How did participating in [name of program/service/study] affect you/your health?
a. How about other parts of your life? [PROBE ON: WORK, RELATIONSHIPS WITH FAMILY,
STRESS, SLEEP, ETC.]
b. Support persons, how has your family member or friend’s participation in [name of
program/service/study] affected you or your ability to them?
10. How can the program/service/study be improved?
a. What else could the program/service/study do to improve participants’ health or how
support persons are able to help participants?
b. What could have improved your experience in the [name of program/service/study]?

Sí Texas Subgrantee: Tropical Texas Behavioral Health Program Title: Improving Access to Integrated Care for Rio Grande Valley Residents with Severe & Persistent Mental Illness
106
c. What’s missing? What kinds of services or activities would you want to see offered by
the program/service/study?
11. Thinking about your experience in the [name of program/service/study], would you sign up for
the program/service again? Why or why not?
a. Would you recommend this [name of program/service/study] to someone else? Why or
why not?
CLOSING/INCENTIVE DISTRIBUTION (2 MIN) Thank you so much for your time. That’s it for my questions. Is there anything else that you would like to mention that we didn’t discuss today? [OPTIONAL: OMIT THE FOLLOWING SECTION IF INCENTIVES NOT BEING USED: I want to thank you again for your time. To express our thanks to you, we have [$amount] gift cards from [name of vendor, e.g., H-E-B]. [Name of HRiA staff person] has a receipt for you to initial and then he/she will give you your gift card. [DISTRIBUTE INCENTIVES AND HAVE RECEIPT FORMS SIGNED].] Thank you again. Your feedback is very helpful, and we greatly appreciate your time and for sharing your opinion.
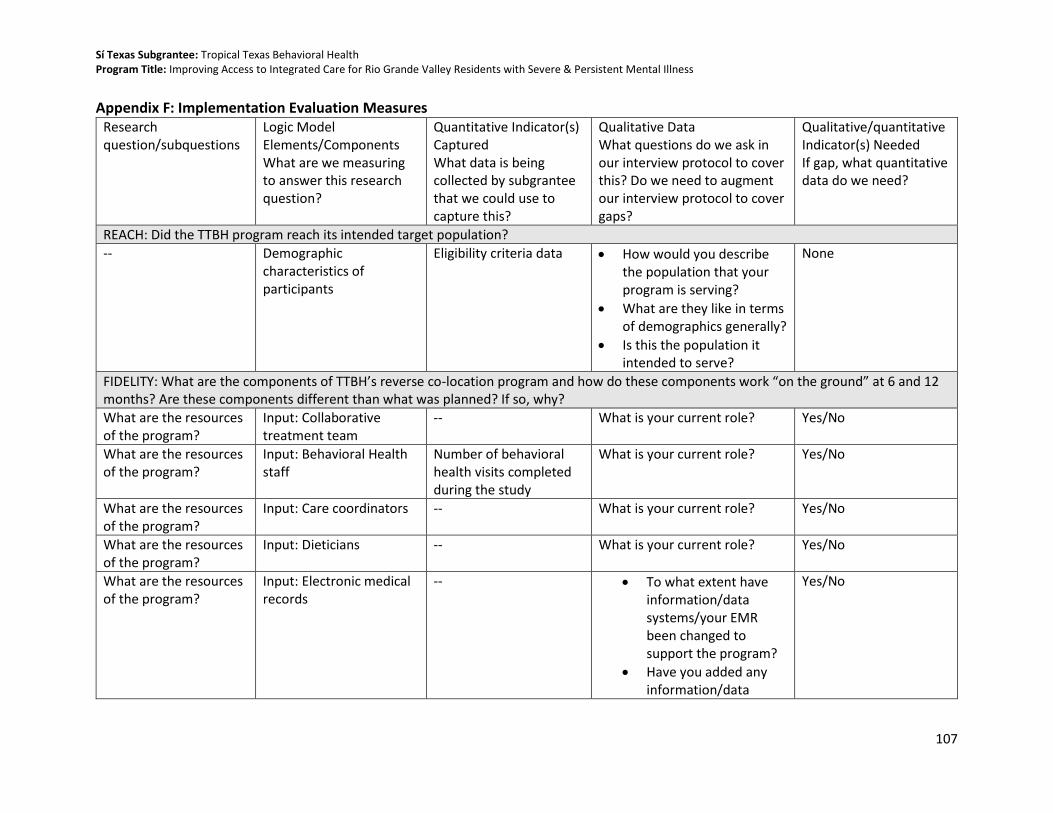
Sí Texas Subgrantee: Tropical Texas Behavioral Health Program Title: Improving Access to Integrated Care for Rio Grande Valley Residents with Severe & Persistent Mental Illness
107
Appendix F: Implementation Evaluation Measures Research question/subquestions
Logic Model Elements/Components What are we measuring to answer this research question?
Quantitative Indicator(s) Captured What data is being collected by subgrantee that we could use to capture this?
Qualitative Data What questions do we ask in our interview protocol to cover this? Do we need to augment our interview protocol to cover gaps?
Qualitative/quantitative Indicator(s) Needed If gap, what quantitative data do we need?
REACH: Did the TTBH program reach its intended target population?
-- Demographic characteristics of participants
Eligibility criteria data • How would you describe the population that your program is serving?
• What are they like in terms of demographics generally?
• Is this the population it intended to serve?
None
FIDELITY: What are the components of TTBH’s reverse co-location program and how do these components work “on the ground” at 6 and 12 months? Are these components different than what was planned? If so, why?
What are the resources of the program?
Input: Collaborative treatment team
-- What is your current role? Yes/No
What are the resources of the program?
Input: Behavioral Health staff
Number of behavioral health visits completed during the study
What is your current role? Yes/No
What are the resources of the program?
Input: Care coordinators -- What is your current role? Yes/No
What are the resources of the program?
Input: Dieticians -- What is your current role? Yes/No
What are the resources of the program?
Input: Electronic medical records
-- • To what extent have information/data systems/your EMR been changed to support the program?
• Have you added any information/data
Yes/No

Sí Texas Subgrantee: Tropical Texas Behavioral Health Program Title: Improving Access to Integrated Care for Rio Grande Valley Residents with Severe & Persistent Mental Illness
108
systems for the project?
What are the resources of the program?
Input: Community specialty care
-- Since beginning enrollment, to what extent has the program been able to deliver all the program services that had been planned as part of the program intervention?
Yes/No
What are the program activities and how have they been operationalized?
Activity: Diagnosis of mental health and co-morbid illness
-- When a participant enrolls in the program, what happens to them next? Take me through the services and activities that an enrollee receives in the program.
Yes/No
What are the program activities and how have they been operationalized?
Activity: Care planning -- When a participant enrolls in the program, what happens to them next? Take me through the services and activities that an enrollee receives in the program.
Yes/No
What are the program activities and how have they been operationalized?
Activity: Care coordination between primary/preventative and behavioral health care services
• Date of initial primary care referral for control participants (referrals to the FQHC or health department clinics)
• Optional: name of clinic referred to or indicated by patient he or she would use
• Dates of clinic or follow-up visits and missed visits
• Probe: Are warm hand offs between providers a component of the services participants receive? How do those hand offs work?
• Now that the program has been implemented, to what extent are primary care and behavioral health services connected, coordinated, combined, if at all?
None

Sí Texas Subgrantee: Tropical Texas Behavioral Health Program Title: Improving Access to Integrated Care for Rio Grande Valley Residents with Severe & Persistent Mental Illness
109
(categorized only by primary care or behavioral health care) so that we can calculate:
• Number of primary care visits completed during the study. (visit dates and sum)
• Number of behavioral health visits completed during the study.
• Number of missed appointments for primary care during the study. (visit dates and sum)
• Number of missed appointments for behavioral health care during the study.
What are the program activities and how have they been operationalized?
Activity: Health promotion and risk reduction training
-- Since beginning enrollment, to what extent has the program been able to deliver all the program services that had been planned as part of the program intervention?
Yes/No
What are the program activities and how have they been operationalized?
Activity: Monitoring patient health
• Date of six month assessment
When a participant enrolls in the program, what happens to them next? Take me through the services and activities that
None
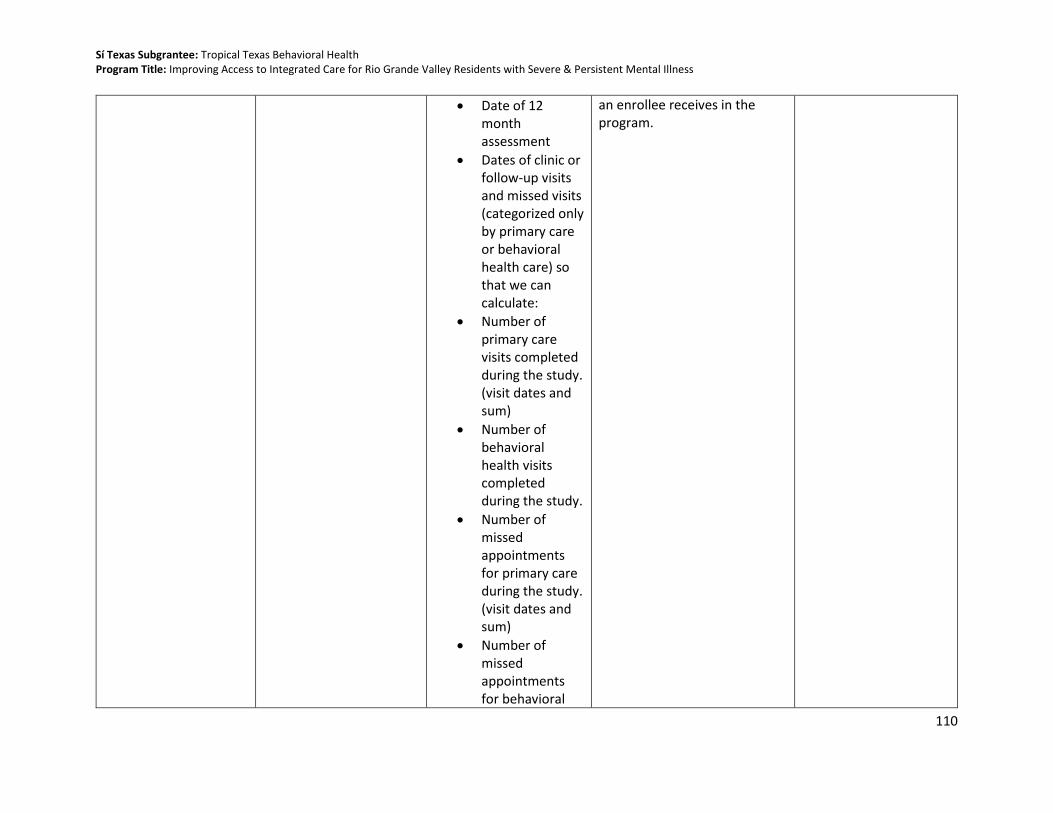
Sí Texas Subgrantee: Tropical Texas Behavioral Health Program Title: Improving Access to Integrated Care for Rio Grande Valley Residents with Severe & Persistent Mental Illness
110
• Date of 12 month assessment
• Dates of clinic or follow-up visits and missed visits (categorized only by primary care or behavioral health care) so that we can calculate:
• Number of primary care visits completed during the study. (visit dates and sum)
• Number of behavioral health visits completed during the study.
• Number of missed appointments for primary care during the study. (visit dates and sum)
• Number of missed appointments for behavioral
an enrollee receives in the program.

Sí Texas Subgrantee: Tropical Texas Behavioral Health Program Title: Improving Access to Integrated Care for Rio Grande Valley Residents with Severe & Persistent Mental Illness
111
health care during the study.
• Dates of vitalization of blood pressure, height (baseline only), weight and dates of blood test results for HbA1c and total cholesterol
• Dates of ANSA and PHQ-9 administration
What are the program activities and how have they been operationalized?
Activity: Communication about and coordination of internal and external components of client’s behavioral and physical health
• Date of initial primary care referral for control participants (referrals to the FQHC or health department clinics)
• Optional: name of clinic referred to or indicated by patient he or she would use
When a participant enrolls in the program, what happens to them next? Take me through the services and activities that an enrollee receives in the program.
Evidence of communication
Are the components different than what was planned? If so, why?
Output: Recruit 182 participants into each study arm
• Group assignment (Brownsville control, Brownsville intervention, Weslaco comparison)
• Date of withdrawal (if applicable)
-- None

Sí Texas Subgrantee: Tropical Texas Behavioral Health Program Title: Improving Access to Integrated Care for Rio Grande Valley Residents with Severe & Persistent Mental Illness
112
• Reason for withdrawal (if available)
Are the components different than what was planned? If so, why?
Output: Written person-centered care plans that cross primary and behavioral health care service boundaries
-- When a participant enrolls in the program, what happens to them next? Take me through the services and activities that an enrollee receives in the program.
Yes/No
Are the components different than what was planned? If so, why?
Output: Coordinated primary and behavioral health services
• Date of initial primary care referral for control participants (referrals to the FQHC or health department clinics)
• Optional: name of clinic referred to or indicated by patient he or she would use
• Dates of clinic or follow-up visits and missed visits (categorized only by primary care or behavioral health care) so that we can calculate:
• Number of primary care visits completed during the study. (visit dates and sum)
• Number of behavioral health visits completed during the study.
Now that the program has been implemented, to what extent are primary care and behavioral health services connected, coordinated, combined, if at all?
None
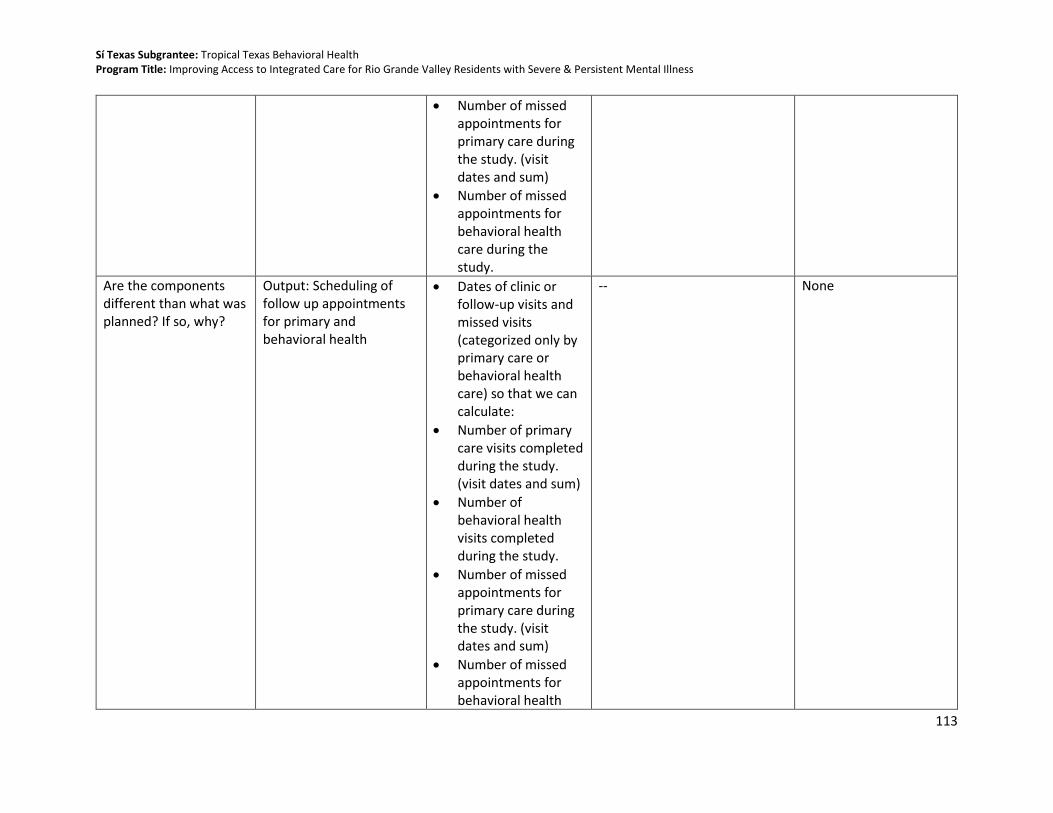
Sí Texas Subgrantee: Tropical Texas Behavioral Health Program Title: Improving Access to Integrated Care for Rio Grande Valley Residents with Severe & Persistent Mental Illness
113
• Number of missed appointments for primary care during the study. (visit dates and sum)
• Number of missed appointments for behavioral health care during the study.
Are the components different than what was planned? If so, why?
Output: Scheduling of follow up appointments for primary and behavioral health
• Dates of clinic or follow-up visits and missed visits (categorized only by primary care or behavioral health care) so that we can calculate:
• Number of primary care visits completed during the study. (visit dates and sum)
• Number of behavioral health visits completed during the study.
• Number of missed appointments for primary care during the study. (visit dates and sum)
• Number of missed appointments for behavioral health
-- None

Sí Texas Subgrantee: Tropical Texas Behavioral Health Program Title: Improving Access to Integrated Care for Rio Grande Valley Residents with Severe & Persistent Mental Illness
114
care during the study.
Are the components different than what was planned? If so, why?
Output: Provider collaboration and communication about patients receiving both primary and behavioral health care
• Date of initial primary care referral for control participants (referrals to the FQHC or health department clinics)
• Optional: name of clinic referred to or indicated by patient he or she would use
• Probe: Are warm hand offs between providers a component of the services participants receive? How do those hand offs work?
• Now that the program has been implemented, to what extent are primary care and behavioral health services connected, coordinated, combined, if at all?
Evidence of other communication
INTEGRATION: What level of Integrated Behavioral Health did TTBH achieve as a result of implementing the program?
What level of Integrated Behavioral Health did TTBH achieve as a result of implementing the reverse co-location program?
IBH Level Score (measured by IBH Checklist)
-- None
To what extent have providers and program staff adopted the components of TTBH’s reverse co-location program at 6 and 12 months? What are the facilitators and barriers to adoption?
-- -- • Please describe any barriers you or your organization has experienced in implementing the program.
• In what ways did these barriers affect program implementation? In what ways have you
Staff satisfaction/knowledge survey

Sí Texas Subgrantee: Tropical Texas Behavioral Health Program Title: Improving Access to Integrated Care for Rio Grande Valley Residents with Severe & Persistent Mental Illness
115
been able to address these barriers?
• Please describe anything that has helped your organization implement the program.
• Probes: Is the staff, the facilities, the data systems, outside partners, or other things?
• Now that the program has been implemented, to what extent are primary care and behavioral health services connected, coordinated, combined, if at all?
To what extent do providers and staff buy in to the program, and how has buy in affected implementation?
-- -- • Have you heard any feedback from providers about program implementation?
• What are some of the general themes from their feedback been?
Staff/Administration satisfaction surveys
To what extent did the comparison groups received program-like components?
-- -- -- • When a participant is randomized/enrolled in the control/comparison
• Number of patients in internal comparison

Sí Texas Subgrantee: Tropical Texas Behavioral Health Program Title: Improving Access to Integrated Care for Rio Grande Valley Residents with Severe & Persistent Mental Illness
116
group of your program, what can they expect to receive or participate in terms of services or activities?
• Since the program started, has anything changed about the services that control group participants received or activities they have access to at your clinic? In what way?
• What do you see as the impact of this workflow change, if any?
• Have these changes had any effects on patient care for those participants not enrolled in the study? In what way?
group that receive 1 program-like component
• Number of patients in internal comparison group that receive more than 1 program-like component
How many visits, and what type of visits, do program participants receive?
-- -- • Dates of clinic or follow-up visits and missed visits (categorized only by primary care or behavioral health care) so that we can calculate:
-- None

Sí Texas Subgrantee: Tropical Texas Behavioral Health Program Title: Improving Access to Integrated Care for Rio Grande Valley Residents with Severe & Persistent Mental Illness
117
• Number of primary care visits completed during the study. (visit dates and sum)
• Number of behavioral health visits completed during the study.
• Number of missed appointments for primary care during the study. (visit dates and sum)
• Number of missed appointments for behavioral health care during the study.
What are the components of usual care received by comparison group participants?
-- -- • Dates of clinic or follow-up visits and missed visits (categorized only by primary care or behavioral health care)
• When a participant is randomized/enrolled in the control/comparison group of your program, what can they expect to receive or participate in terms of services or activities?
Counts of usual care elements received

Sí Texas Subgrantee: Tropical Texas Behavioral Health Program Title: Improving Access to Integrated Care for Rio Grande Valley Residents with Severe & Persistent Mental Illness
118
so that we can calculate:
• Number of behavioral health visits completed during the study.
• Number of missed appointments for behavioral health care during the study.
• Since the program started, has anything changed about the services that control group participants received or activities they have access to at your clinic? In what way?
• Have those changes been experienced by the intervention group? If no, why not?

Sí Texas Subgrantee: Tropical Texas Behavioral Health Program Title: Improving Access to Integrated Care for Rio Grande Valley Residents with Severe & Persistent Mental Illness
119
Appendix G: Loss to Follow-Up/Attrition Tables Table 39. Analysis of Participants Who Completed the Study Compared to Lost to Follow-up on Demographic Characteristics among the Full Sample
FULL STUDY SAMPLE: DEMOGRAPHICS
Total
(n=416) Completed Study
(n=271) Lost to Follow-up
(n=145)
p-value
Measure N % N % N %
Sex
Male 186 44.7 104 38.4 82 56.6 <0.001 Female 230 55.3 167 61.6 63 43.4
Missing -- -- -- -- -- --
Racea
White 389 93.5 255 94.1 134 92.4
0.18
Native Hawaiian/Pacific Islander
1 0.2 1 0.4 0 0.0
Other 22 5.3 11 4.1 11 7.6 Unknown 4 1.0 4 1.5 0 0.0 Missing -- -- -- -- -- --
Ethnicitya
Hispanic 385 92.5 258 95.2 127 87.6
0.02 White 13 3.1 5 1.9 8 5.5 Non-Hispanic 18 4.3 8 3.0 10 6.9 Missing -- -- -- -- -- --
Age
Mean 40.9 -- 41.9 -- 38.9 -- 0.027
(SD) (12.9) -- (12.7) -- (12.9) --
18-24 years 48 11.5 26 9.6 22 15.2
0.26
25-34 years 94 22.6 56 20.7 38 26.2 35-44 years 37 26.9 75 27.7 37 25.5 45-54 years 28 22.8 67 24.7 28 19.3 55-64 years 15 13.0 39 14.4 15 10.3 65+ years 13 3.1 8 3.0 5 3.5 Missing -- -- -- -- -- --
Educationa
Below High School 77 18.5 51 19.5 26 18.3
0.89
Some High School 158 38.0 105 40.1 53 37.3 GED/HS Grad/Some College
141 33.9 87 33.2 54 38.0
Associates/Bachelor Degree
23 5.5 16 6.1 7 54.9
Special Education 5 1.2 3 1.2 2 1.4 Missing 12 -- 9 -- 3 --

Sí Texas Subgrantee: Tropical Texas Behavioral Health Program Title: Improving Access to Integrated Care for Rio Grande Valley Residents with Severe & Persistent Mental Illness
120
FULL STUDY SAMPLE: DEMOGRAPHICS
Total
(n=416) Completed Study
(n=271) Lost to Follow-up
(n=145)
p-value
Measure N % N % N %
Employment Status
No Evidence of Problems
52 12.5 40 17.8 12 8.3
0.38
History of Problems, Mild
11 2.7 8 3.0 3 2.0
Moderate Problems 14 3.4 8 3.0 6 4.2 Severe Problems 243 58.6 155 57.2 88 61.1 N/A 95 22.9 60 22.1 35 24.3 Missing 1 -- 0 -- 1 --
Primary Languagea
English 284 68.3 169 62.4 115 79.3
0.001 Spanish 131 31.5 101 37.3 30 20.7 Unknown 1 0.2 1 0.4 0 0.0 Missing -- -- -- -- -- --
County of Residencea
Cameron County 409 98.3 270 99.6 139 95.9
0.008 Hidalgo or Anderson County
7 1.7 1 0.4 6 4.1
Missing -- -- -- -- -- --
SPMI Diagnosis
Bipolar Disorder 129 31.0 82 30.3 47 32.4
0.73
Major Depression 191 45.9 128 47.2 63 43.5 Schizophrenia 81 19.5 50 18.5 31 21.2 Schizophrenia and Major Depression
15 3.6 11 4.1 4 2.8
Missing -- -- -- -- -- --
Note: Bold denotes statistical significance of p-value < 0.05 a Fisher’s Exact Test was used due to cells have expected count less than 5.

Sí Texas Subgrantee: Tropical Texas Behavioral Health Program Title: Improving Access to Integrated Care for Rio Grande Valley Residents with Severe & Persistent Mental Illness
121
Table 40. Analysis of Participants Who Completed the Study Compared to Lost to Follow-up on Health Impact Measures among the Full Sample
FULL STUDY SAMPLE: IMPACT MEASURES
Total
(n=416) Completed Study
(n=271) Lost to Follow-up
(n=145)
p-value Measure Mean (SD) Mean (SD) Mean (SD) Blood pressure Systolic 127.2 (18.3) 127.6 (18.1) 126.4 (18.7) 0.50 Diastolic 79.0 (10.3) 78.8 (10.2) 79.1 (10.5) 0.81 Missing -- -- -- -- BMIa BMI 33.8 (8.3) 33.2 (1.3) 32.4 (1.2) 0.31 Missing -- -- -- -- Total Cholesterol Total Cholesterol 187.0 (44.9) 186.7 (43.1) 187.6 (48.2) 0.84 Missing 2 0 2 -- PHQ-9 PHQ-9 Score 11.7 (6.6) 11.5 (6.6) 12.3 (6.7) 0.22 Missing -- -- -- -- HbA1cb Median (SD) Median (SD) Median (SD) HbA1c 5.7 (1.7 5.7 (1.6) 5.6 (1.9) 0.86 Missing -- -- -- -- Life Domain Functioningb
Median (SD) Median (SD) Median (SD)
Number Severe/Moderate
2.0 (2.3) 2.0 (2.3) 3.0 (2.3) 0.31
Missing 1 0 1 a A log transformation was used and then exponentiated b The Wilcoxon Signed Rank Sum test was used to examine non-normally distributed data

Sí Texas Subgrantee: Tropical Texas Behavioral Health Program Title: Improving Access to Integrated Care for Rio Grande Valley Residents with Severe & Persistent Mental Illness
122
Table 41. Analysis of Participants Who Completed the Study Compared to Lost to Follow-up on Demographic Characteristics among the Intervention Group
INTERVENTION GROUP: DEMOGRAPHICS
Total
(n=249) Completed Study
(n=155) Lost to Follow-up
(n=94)
p-value
Measure N % N % N %
Sex
Male 112 45.0 61 39.4 51 54.3 0.02 Female 137 55.0 94 60.7 43 45.7
Missing -- -- -- -- -- --
Racea
White 231 92.8 145 93.6 86 91.5
0.39 Other 16 6.4 8 5.2 8 8.5 Unknown 2 0.8 2 1.3 0 0.0 Missing -- -- -- -- -- --
Ethnicity
Hispanic 226 90.8 146 94.2 80 85.1
0.05 White 9 3.6 4 2.6 5 5.3 Non-Hispanic 14 5.6 5 3.2 9 9.6 Missing -- -- -- -- -- --
Age
Mean 41.0 -- 42.1 -- 39.1 -- 0.06
(SD) (12.5) -- 12.0 -- 13.1 --
18-24 30 12.0 15 9.7 15 16.0
0.29
25-34 49 19.7 27 17.4 22 23.4 35-44 69 27.7 46 25.8 23 24.5 45-54 61 24.5 40 25.8 21 22.3 55-64 35 14.1 25 16.1 10 10.6 65+ 5 2.0 2 1.3 3 3.2 Missing -- -- -- -- -- --
Educationa
Below High School 41 16.5
0.26
Some High School 100 40.2 62 41.1 38 41.8 GED/HS Grad/Some College
86 34.5 48 31.8 38 41.8
Associates/Bachelor Degree
13 5.2 10 6.6 3 3.3
Special Education 2 0.8 1 0.7 1 1.1 Missing 7 -- 4 -- 3 --
Employment Statusa
No Evidence of Problems
32 12.9 25 78.1 7 7.5
0.32
History of Problems, Mild
6 2.4 4 2.6 2 2.2
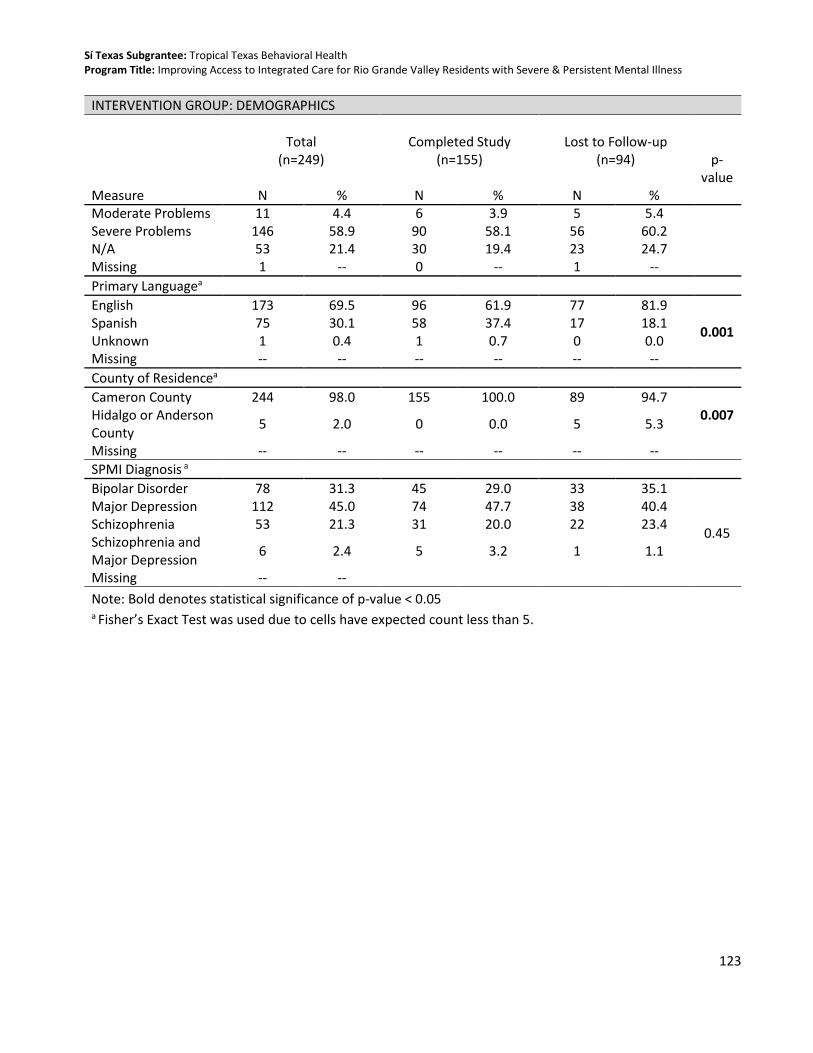
Sí Texas Subgrantee: Tropical Texas Behavioral Health Program Title: Improving Access to Integrated Care for Rio Grande Valley Residents with Severe & Persistent Mental Illness
123
INTERVENTION GROUP: DEMOGRAPHICS
Total
(n=249) Completed Study
(n=155) Lost to Follow-up
(n=94)
p-value
Measure N % N % N % Moderate Problems 11 4.4 6 3.9 5 5.4 Severe Problems 146 58.9 90 58.1 56 60.2 N/A 53 21.4 30 19.4 23 24.7 Missing 1 -- 0 -- 1 --
Primary Languagea
English 173 69.5 96 61.9 77 81.9
0.001 Spanish 75 30.1 58 37.4 17 18.1 Unknown 1 0.4 1 0.7 0 0.0 Missing -- -- -- -- -- --
County of Residencea
Cameron County 244 98.0 155 100.0 89 94.7 0.007 Hidalgo or Anderson
County 5 2.0 0 0.0 5 5.3
Missing -- -- -- -- -- --
SPMI Diagnosis a
Bipolar Disorder 78 31.3 45 29.0 33 35.1
0.45
Major Depression 112 45.0 74 47.7 38 40.4 Schizophrenia 53 21.3 31 20.0 22 23.4 Schizophrenia and Major Depression
6 2.4 5 3.2 1 1.1
Missing -- --
Note: Bold denotes statistical significance of p-value < 0.05 a Fisher’s Exact Test was used due to cells have expected count less than 5.

Sí Texas Subgrantee: Tropical Texas Behavioral Health Program Title: Improving Access to Integrated Care for Rio Grande Valley Residents with Severe & Persistent Mental Illness
124
Table 42. Analysis of Participants Who Completed the Study Compared to Lost to Follow-up on Health Impact Measures among the Intervention Group
INTERVENTION GROUP: IMPACT MEASURES
Total
(n=249) Completed Study
(n=155) Lost to Follow-up
(n=94)
p-value Measure Mean (SD) Mean (SD) Mean (SD) Blood pressure Systolic 125.6 (18.6) 126.8 (18.6) 123.7 (18.7) 0.20 Diastolic 78.8 (10.2) 79.4 (10.2) 77.8 (10.2) 0.23 Missing -- -- -- BMIa BMI 33.7 (7.6) 33.8 (8.0) 33.4 (6.9) 0.82 Missing -- -- -- Total Cholesterol Total Cholesterol 188.5 (46.1) 187.3 (42.0) 190.4 (52.4) 0.63 Missing -- -- -- PHQ-9 PHQ-9 Score 11.4 (6.4) 11.3 (6.6) 11.7 (6.2) 0.65 Missing -- -- -- HbA1cb Median (SD) Median (SD) Median (SD) HbA1c 5.6 (1.9) 5.6 (1.8) 5.6 (2.2) 0.63 Missing -- -- -- Life Domain Functioningb
Median (SD) Median (SD) Median (SD)
Number Severe/Moderate
2.0 (2.4) 2.0 (2.3) 2.0 (2.5) 0.52
Missing 1 0 1 a A log transformation was used and then exponentiated b The Wilcoxon Signed Rank Sum test was used to examine non-normally distributed data

Sí Texas Subgrantee: Tropical Texas Behavioral Health Program Title: Improving Access to Integrated Care for Rio Grande Valley Residents with Severe & Persistent Mental Illness
125
Table 43. Analysis of Participants Who Completed the Study Compared to Lost to Follow-up on Demographic Characteristics among the Control Group
CONTROL GROUP: DEMOGRAPHICS
Total
(n=167) Completed Study
(n=116) Lost to Follow-up
(n=51)
p-value
Measure N % N % N %
Sex
Male 74 44.3 43 37.1 31 60.8 0.006 Female 93 55.7 73 62.9 20 39.2
Missing -- -- -- -- -- --
Racea
White 158 94.6 110 94.8 48 94.1
0.61
Native Hawaiian/Pacific Islander
1 0.6 1 0.9 0 0.0
Other 6 3.6 3 2.6 3 5.9 Unknown 2 1.2 2 1.7 0 0.0 Missing -- -- -- -- -- --
Ethnicitya
Hispanic 159 95.2 112 96.6 47 92.2
0.16 White 4 2.4 1 0.9 3 5.9 Non-Hispanic 4 2.4 3 2.6 1 2.0 Missing -- -- -- -- -- --
Age
Mean 40.7 -- 41.6 -- 38.6 -- 0.18
(SD) (13.4) -- 13.7 -- 12.8 --
18-24 18 10.8 11 9.5 7 13.7
0.69
25-34 45 26.9 29 25.0 16 31.4 35-44 43 25.7 29 25.0 14 27.5 45-54 34 20.4 27 23.3 7 13.7 55-64 19 11.4 14 12.1 5 9.8 65+ 8 4.8 6 5.2 2 3.9 Missing -- -- -- -- -- --
Educationa
Below High School 36 22.2 21 18.9 15 29.4
0.48
Some High School 58 35.8 43 38.7 15 29.4 GED/HS Grad/Some College
55 34.0 39 35.1 16 31.4
Associates/Bachelor Degree
10 6.2 6 5.4 4 7.8
Special Education 3 1.8 2 1.8 1 2.0 Missing 5 -- 5 -- 0 --
Employment Statusa

Sí Texas Subgrantee: Tropical Texas Behavioral Health Program Title: Improving Access to Integrated Care for Rio Grande Valley Residents with Severe & Persistent Mental Illness
126
CONTROL GROUP: DEMOGRAPHICS
Total
(n=167) Completed Study
(n=116) Lost to Follow-up
(n=51)
p-value
Measure N % N % N %
No Evidence of Problems
20 12.0 15 12.9 5 9.8
0.95
History of Problems, Mild
5 3.0 4 3.5 1 2.0
Moderate Problems 3 1.8 2 1.7 1 2.0 Severe Problems 97 58.1 65 56.0 32 62.8 N/A 42 25.1 30 25.9 12 23.5 Missing -- --
Primary Language
English 111 66.5 73 62.9 38 74.5 0.14 Spanish 56 33.5 43 37.1 13 25.5
Missing -- -- -- -- -- --
County of Residencea
Cameron County 165 98.8 115 99.1 50 98.0 0.52 Hidalgo or Anderson
County 2 1.2 1 0.9 1 2.0
Missing -- -- -- -- -- --
SPMI Diagnosis
Bipolar Disorder 51 30.5 37 31.9 14 27.5
0.95
Major Depression 79 47.3 54 46.6 25 49.0 Schizophrenia 28 16.8 19 16.4 9 17.7 Schizophrenia and Major Depression
9 5.4 6 5.2 3 5.9
Missing -- --
Note: Bold denotes statistical significance of p-value < 0.05 a Fisher’s Exact Test was used due to cells have expected count less than 5.

Sí Texas Subgrantee: Tropical Texas Behavioral Health Program Title: Improving Access to Integrated Care for Rio Grande Valley Residents with Severe & Persistent Mental Illness
127
Table 44. Analysis of Participants Who Completed the Study Compared to Lost to Follow-up on Health Impact Measures among the Control Group
CONTROL GROUP: IMPACT MEASURES
Total
(n=167) Completed Study
(n=116) Lost to Follow-up
(n=51)
p-value Measure Mean (SD) Mean (SD) Mean (SD) Blood pressure Systolic 129.6 (17.5) 128.8 (17.4) 131.4 (17.7) 0.39 Diastolic 79.3 (10.4) 78.3 (10.1) 81.7 (10.6) 0.05 Missing -- -- -- BMI a BMI 34.0 (9.3) 34.6 (9.6) 32.6 (8.7) 0.21 Missing -- -- -- Total Cholesterol Total Cholesterol 184.9 (42.9) 186.0 (44.6) 182.4 (38.9) 0.63 Missing -- -- -- PHQ-9 PHQ-9 Score 12.2 (7.0) 11.7 (6.7) 13.4 (7.5) 0.14 Missing -- -- -- HbA1c b Median (SD) Median (SD) Median (SD) HbA1c 5.7 (1.3) 5.7 (1.4) 5.6 (1.0) 0.33 Missing -- -- -- Life Domain Functioning b
Median (SD) Median (SD) Median (SD)
Number Severe/Moderate
2.0 (2.1) 2.0 (2.2) 3.0 (1.9) 0.39
Missing -- -- -- a A log transformation was used and then exponentiated b The Wilcoxon Signed Rank Sum test was used to examine non-normally distributed data

Sí Texas Subgrantee: Tropical Texas Behavioral Health Program Title: Improving Access to Integrated Care for Rio Grande Valley Residents with Severe & Persistent Mental Illness
128
Appendix H: Patient Characteristics Form
Name: Type:
0, Jose Case#: Page: 1 of 4 Demographic Date: 07/13/2015
Printed on 07/13/2015 at 05:14 PM (Draft)
Tropical Texas Behavioral Health
DEMOGRAPHICS
Admission Status Pre-registered Registered Admit
Date voter registration offered to client:
Special Population, if any
Is client related to any current TTBH employee? Yes No Unknown
Employee name:
CLIENT IDENTIFYING INFORMATION
Alias:
Mailing Address Home Phone
Physical Address Work Phone
City YAKIMA WA Cell Phone
Email Address Does client have regular internet access? Yes No
Client's preference for communication of confidential information:
Directions to client's home:
County Anderson County (of residence) Day Program Phone
Race Gender DOB 02/12/1942 Actual Estimated
Ethnicity
Soc Sec #
Mar Stat
Emp Stat Sect 8 Housing? Living Arrange
Comm Meth
Prim Lang Education
Need for Translation Service: Not Needed Need sign language translator Need language translator
Ref Source
School District Enrolled Name of School EMERGENCY NOTIFICATION INFORMATION
Name Relationship
Address Phone
City Cell Phone: LEGAL INFORMATION
Legal Status Date of Current Court Order for Guardianship
Sí Texas Subgrantee: Tropical Texas Behavioral Health Program Title: Improving Access to Integrated Care for Rio Grande Valley Residents with Severe & Persistent Mental Illness
129
Name: Type:
0, Jose Case#: Page: 2 of 4 Demographic Date: 07/13/2015
Printed on 07/13/2015 at 05:14 PM (Draft)
Responsible Person Relationship
Address Phone
City
Name of Child's parents if different than responsible person:
Phone
If Yes, List Allergies and/or Special Precautions
MEDICAL INFORMATION
Personal Physician
Street Address
City
Any Allergies or Special Precautions?
Yes
No

Sí Texas Subgrantee: Tropical Texas Behavioral Health Program Title: Improving Access to Integrated Care for Rio Grande Valley Residents with Severe & Persistent Mental Illness
130
Name: Type:
0, Jose Case#: Page: 3 of 4 Demographic Date: 07/13/2015
Printed on 07/13/2015 at 05:14 PM (Draft)
Tropical Texas Behavioral Health
MILITARY HISTORY
Have you or a member of your immediate household ever served in the military? Yes No If yes, relationship:
None Self Aunt/Uncle
Mother Father Grandparent
Spouse Child
Stepmother Other
Stepfather Sibling
Last Name of Person who Served (if not client): First Name:
Dates of Service (From - Thru):
Which Branch? Army Navy Marines
Air Force
Coast Guard National Guard
Unknown
Still Active? Active Reserve Discharged Retired Unknown
Did you (client) ever serve in any of the following theaters? If yes, most recent service: No WW II (1941-1946) Korean Conflict (1950-1955) Vietnam Era (1964-1975) Persian Gulf (
If Persian Gulf, where (most recent)? Iraq (OIF) Afganistan (OEF)
Do you (client) have a service connected disability? Yes No
Unknown
If yes, percentage
disability:

Sí Texas Subgrantee: Tropical Texas Behavioral Health Program Title: Improving Access to Integrated Care for Rio Grande Valley Residents with Severe & Persistent Mental Illness
131
Name: Type:
0, Jose Case#: Page: 4 of 4 Demographic Date: 07/13/2015
Printed on 07/13/2015 at 05:14 PM (Draft)
Signatures
(Text Printing Suppressed)
Signature OBC E Signature Line Heading Name Date Time
Pending S Staff
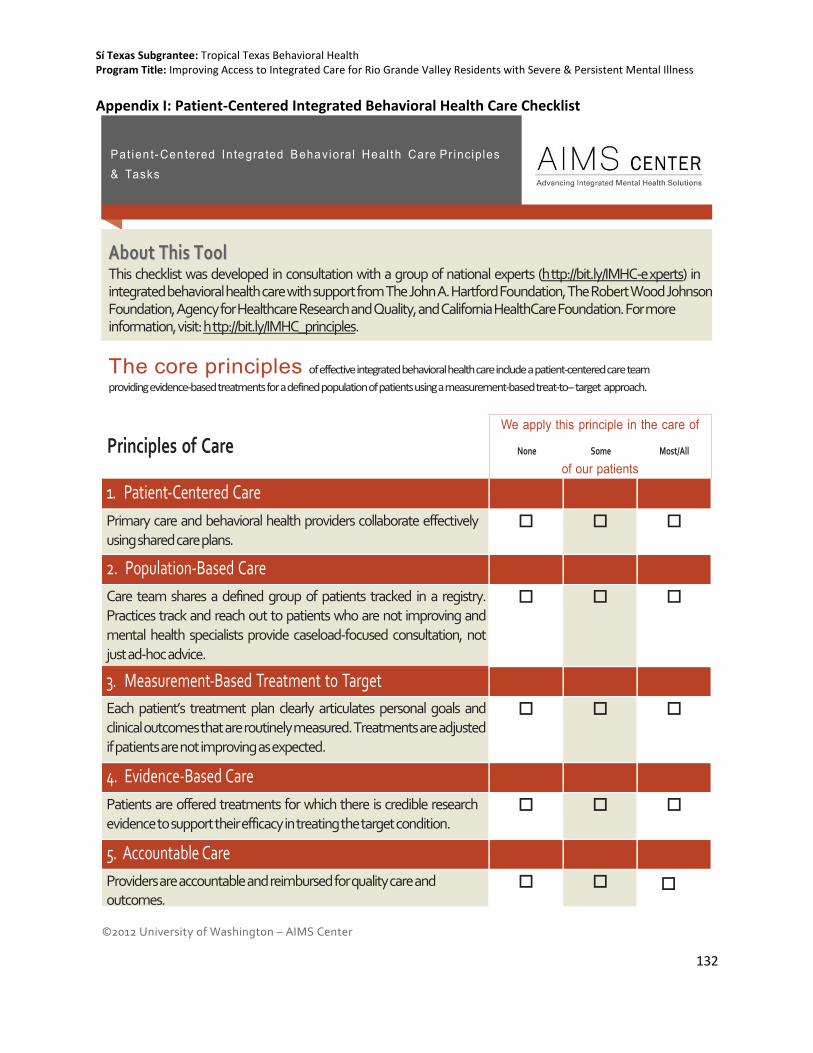
Sí Texas Subgrantee: Tropical Texas Behavioral Health Program Title: Improving Access to Integrated Care for Rio Grande Valley Residents with Severe & Persistent Mental Illness
132
Appendix I: Patient-Centered Integrated Behavioral Health Care Checklist
©2012 University of Washington – AIMS Center http://uwaims.org
We apply this principle in the care of
None Some Most/All
of our patients
1. Patient-Centered Care
Primary care and behavioral health providers collaborate effectively using shared care plans.
2. Population-Based Care
Care team shares a defined group of patients tracked in a registry. Practices track and reach out to patients who are not improving and mental health specialists provide caseload-focused consultation, not just ad-hoc advice.
3. Measurement-Based Treatment to Target
Each patient’s treatment plan clearly articulates personal goals and clinical outcomes that are routinely measured. Treatments are adjusted if patients are not improving as expected.
4. Evidence-Based Care
Patients are offered treatments for which there is credible research evidence to support their efficacy in treating the target condition.
5. Accountable Care
Providers are accountable and reimbursed for quality care and outcomes.
Pa t i e n t - C e n t e r e d I n t e g r a t e d B e h a v i o r a l H e a l t h C a r e P r i n c i p l e s & Ta s k s
AAbboouutt TThhiiss TTooooll This checklist was developed in consultation with a group of national experts (h ttp://bit.ly/IMHC-e xperts) in integrated behavioral health care with support from The John A. Hartford Foundation, The Robert Wood Johnson Foundation, Agency for Healthcare Research and Quality, and California HealthCare Foundation. For more information, visit: h ttp://bit.ly/IMHC_principles.
The core principles of effective integrated behavioral health care include a patient-centered care team
providing evidence-based treatments for a defined population of patients using a measurement-based treat-to- target approach.
Principles of Care
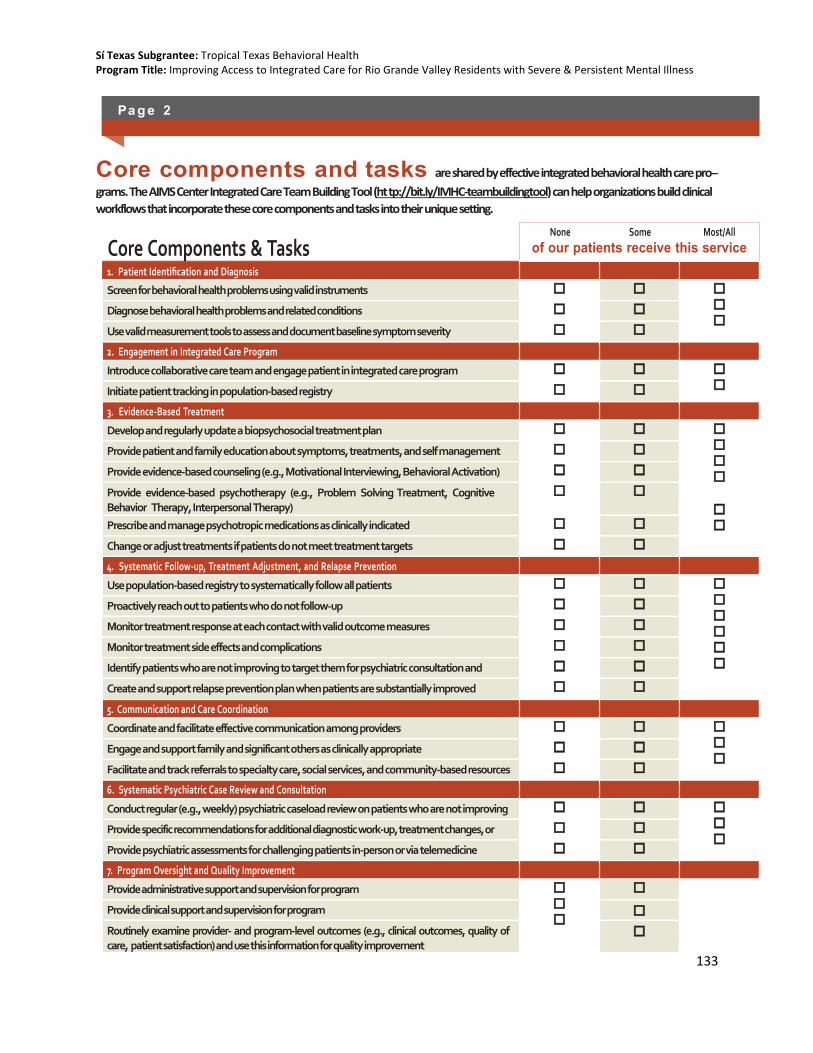
Sí Texas Subgrantee: Tropical Texas Behavioral Health Program Title: Improving Access to Integrated Care for Rio Grande Valley Residents with Severe & Persistent Mental Illness
133
None Some Most/All
of our patients receive this service 1. Patient Identification and Diagnosis
Screen for behavioral health problems using valid instruments
Diagnose behavioral health problems and related conditions
Use valid measurement tools to assess and document baseline symptom severity
2. Engagement in Integrated Care Program
Introduce collaborative care team and engage patient in integrated care program
Initiate patient tracking in population-based registry
3. Evidence-Based Treatment
Develop and regularly update a biopsychosocial treatment plan
Provide patient and family education about symptoms, treatments, and self management skills
Provide evidence-based counseling (e.g., Motivational Interviewing, Behavioral Activation)
Provide evidence-based psychotherapy (e.g., Problem Solving Treatment, Cognitive Behavior Therapy, Interpersonal Therapy)
Prescribe and manage psychotropic medications as clinically indicated
Change or adjust treatments if patients do not meet treatment targets
4. Systematic Follow-up, Treatment Adjustment, and Relapse Prevention
Use population-based registry to systematically follow all patients
Proactively reach out to patients who do not follow-up
Monitor treatment response at each contact with valid outcome measures
Monitor treatment side effects and complications
Identify patients who are not improving to target them for psychiatric consultation and treatment adjustment
Create and support relapse prevention plan when patients are substantially improved
5. Communication and Care Coordination
Coordinate and facilitate effective communication among providers
Engage and support family and significant others as clinically appropriate
Facilitate and track referrals to specialty care, social services, and community-based resources
6. Systematic Psychiatric Case Review and Consultation
Conduct regular (e.g., weekly) psychiatric caseload review on patients who are not improving
Provide specific recommendations for additional diagnostic work-up, treatment changes, or referrals
Provide psychiatric assessments for challenging patients in-person or via telemedicine
7. Program Oversight and Quality Improvement
Provide administrative support and supervision for program
Provide clinical support and supervision for program
Routinely examine provider- and program-level outcomes (e.g., clinical outcomes, quality of care, patient satisfaction) and use this information for quality improvement
Pa g e 2
Core components and tasks are shared by effective integrated behavioral health care pro-
grams. The AIMS Center Integrated Care Team Building Tool (ht tp://bit.ly/IMHC-teambuildingtool) can help organizations build clinical
workflows that incorporate these core components and tasks into their unique setting.
Core Components & Tasks

Sí Texas Subgrantee: Tropical Texas Behavioral Health Program Title: Improving Access to Integrated Care for Rio Grande Valley Residents with Severe & Persistent Mental Illness
134
Appendix J: Patient Health Questionnaire – 9 (PHQ-9)
P A T I E N T H E A L T H Q U E S T I O N N A I R E - 9 ( P H Q - 9 )
Over the last 2 weeks, how often have you been bothered by any of the following problems? (Use “✔” to indicate your answer)
Not at all
Several days
More
than half the days
Nearly every day
1. Little interest or pleasure in doing things
0
1
2
3
2. Feeling down, depressed, or hopeless
0
1
2
3
3. Trouble falling or staying asleep, or sleeping too much
0
1
2
3
4. Feeling tired or having little energy
0
1
2
3
5. Poor appetite or overeating
0
1
2
3
6. Feeling bad about yourself — or that you are a failure or have let yourself or your family down
0
1
2
3
7. Trouble concentrating on things, such as reading the newspaper or watching television
0
1
2
3
8. Moving or speaking so slowly that other people could have noticed? Or the opposite — being so fidgety or restless
0
1
2
3
that you have been moving around a lot more than usual
9. Thoughts that you would be better off dead or of hurting yourself in some way
0
1
2
3
FOR OFFICE CODING 0 + + + =Total Score:
If you checked off any problems, how difficult have these problems made it for you to do your work, take care of things at home, or get along with other people?
Not difficult at all
D
Somewhat difficult
D
Very difficult D
Extremely difficult D
Developed by Drs. Robert L. Spitzer, Janet B.W. Williams, Kurt Kroenke and colleagues, with an educational grant from Pfizer Inc. No permission required to reproduce, translate, display or distribute.

Sí Texas Subgrantee: Tropical Texas Behavioral Health Program Title: Improving Access to Integrated Care for Rio Grande Valley Residents with Severe & Persistent Mental Illness
135
Appendix K: Adult Needs and Strengths Assessment (ANSA)
M M D D Y Y
MENTAL HEALTH NEEDS 0 = no evidence 1 = history or sub-threshold, watch/prevent 2 = causing problems, consistent with diagnosable disorder 3 = causing severe/dangerous problems
0 1 2 3 Psychosis
Impulse Control
Depression
Anxiety
Interpersonal Problems
Antisocial Behavior
Adjustment to Trauma
Anger Control
Substance Use
Eating Disturbance
RISK BEHAVIORS 0 = no evidence 1 = history, watch/prevent 2 = recent, act 3 = acute, act immediately
0 1 2 3 Suicide Risk
Self Injurious
Other Self Harm
Gambling
Exploitation
Danger to Others
Sexual Aggression
Criminal Behavior
Optional CAREGIVER STRENGTHS & NEEDS
Not applicable – no caregiver identified 0 = no evidence 1 = minimal needs 2 = moderate needs 3 = severe needs
0 1 2 3 Physical/Behavioral
Involvement
Knowledge
Social Resources
Family Stress
Safety
m m d d y y M F DOB Gender Race/Ethnicity
ADULT NEEDS AND STRENGTHS ASSESSMENT (ANSA) VERSION 2.0
Please √ appropriate use: Initial Reassessment Date: Transition/Discharge
Name
Current Living Situation:
Assessor (Print Name): Signature Caregiver Name: Relation
LIFE DOMAIN FUNCTIONING 0 = no evidence of problems 1 = history, mild 2 = moderate 3 = severe
NA 0 1 2 3 Physical/Medical
Family
Employment
Social Functioning
Recreational
Intellectual
Sexuality
Living Skills
Residential Stability
Legal
Sleep
Self Care
Medication Compliance
Transportation
STRENGTHS 0 = centerpiece 1 = useful 2 = identified 3 = not yet identified
NA 0 1 2 3 Family
Social Connectedness
Optimism
Educational
Job History
Talents / Interests
Spiritual / Religious
Community Connection
Natural Supports
Resiliency
Resourcefulness
Volunteering
ACCULTURATION 0 = no evidence 1 = minimal needs 2 = moderate needs 3 = severe needs
0 1 2 3 Language
Identity
Ritual
Cultural Stress