Embed Size (px)
Citation preview
I:\17\17160\PROD\Reports\Hydrology\17160-
Hydrology.doc
FINAL ENGINEERING
DRAINAGE STUDY
FOR
EXETER
1925, 2005 HARMONY GROVE ROAD
ESCONDIDO, CALIFORNIA
OWNER:
Exeter Property Group
2001 Broadway, Suite 150
Oakland, CA 94612
Tel: 209-915-7783 (m)
ENGINEER:
MASSON & ASSOCIATES, INC.
200 E. Washington Ave. Suite 200
Escondido, CA 92025
(760) 741-3570
BY:
_______________________________________
Bruce A. Tait, RCE 32247
PN: 17160
Date: September 5, 2017
I:\17\17160\PROD\Reports\Hydrology\17160-
Hydrology.doc
TABLE OF CONTENTS
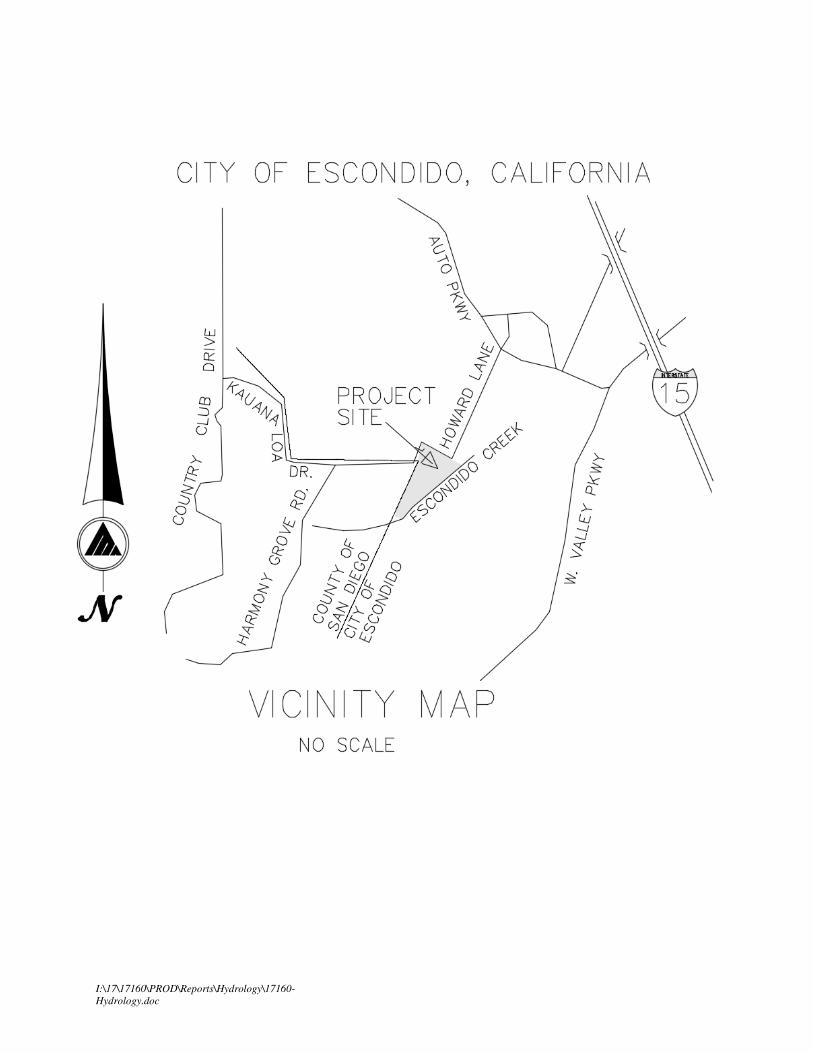
VICINITY MAP
METHODOLOGY
EXISTING CONDITIONS
PROPOSED CONDITIONS
CONCLUSION
APPENDICES
Appendix A – Previous Development Calculations
Appendix B – Post-Development Calculations
Appendix C – Reference Charts
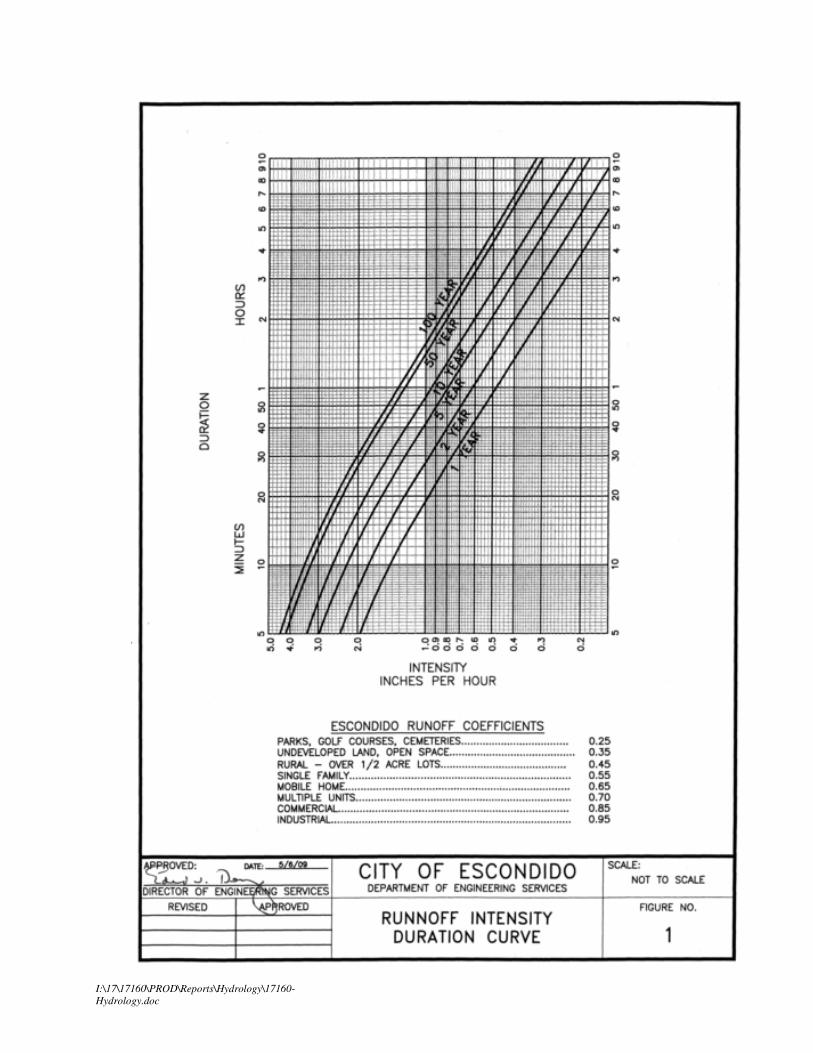
Figure No .1 Runoff Intensity Duration Curve
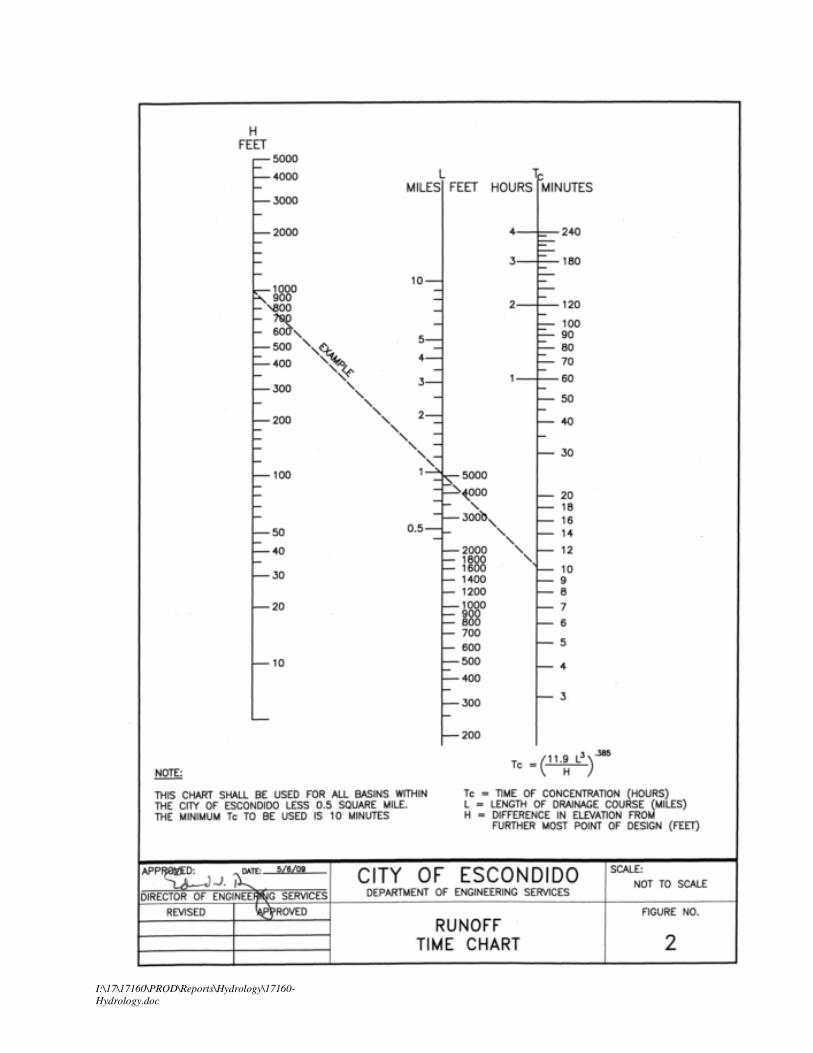
Figure No. 2 Runoff Time Chart
Appendix D – Detention Calculation (To Reduce Post Development Flows to the Pre Development
Flows), Bypass pipe for offsite drainage
Appendix E – NRCS Hydrologic Soil Group Data
EXHIBITS:
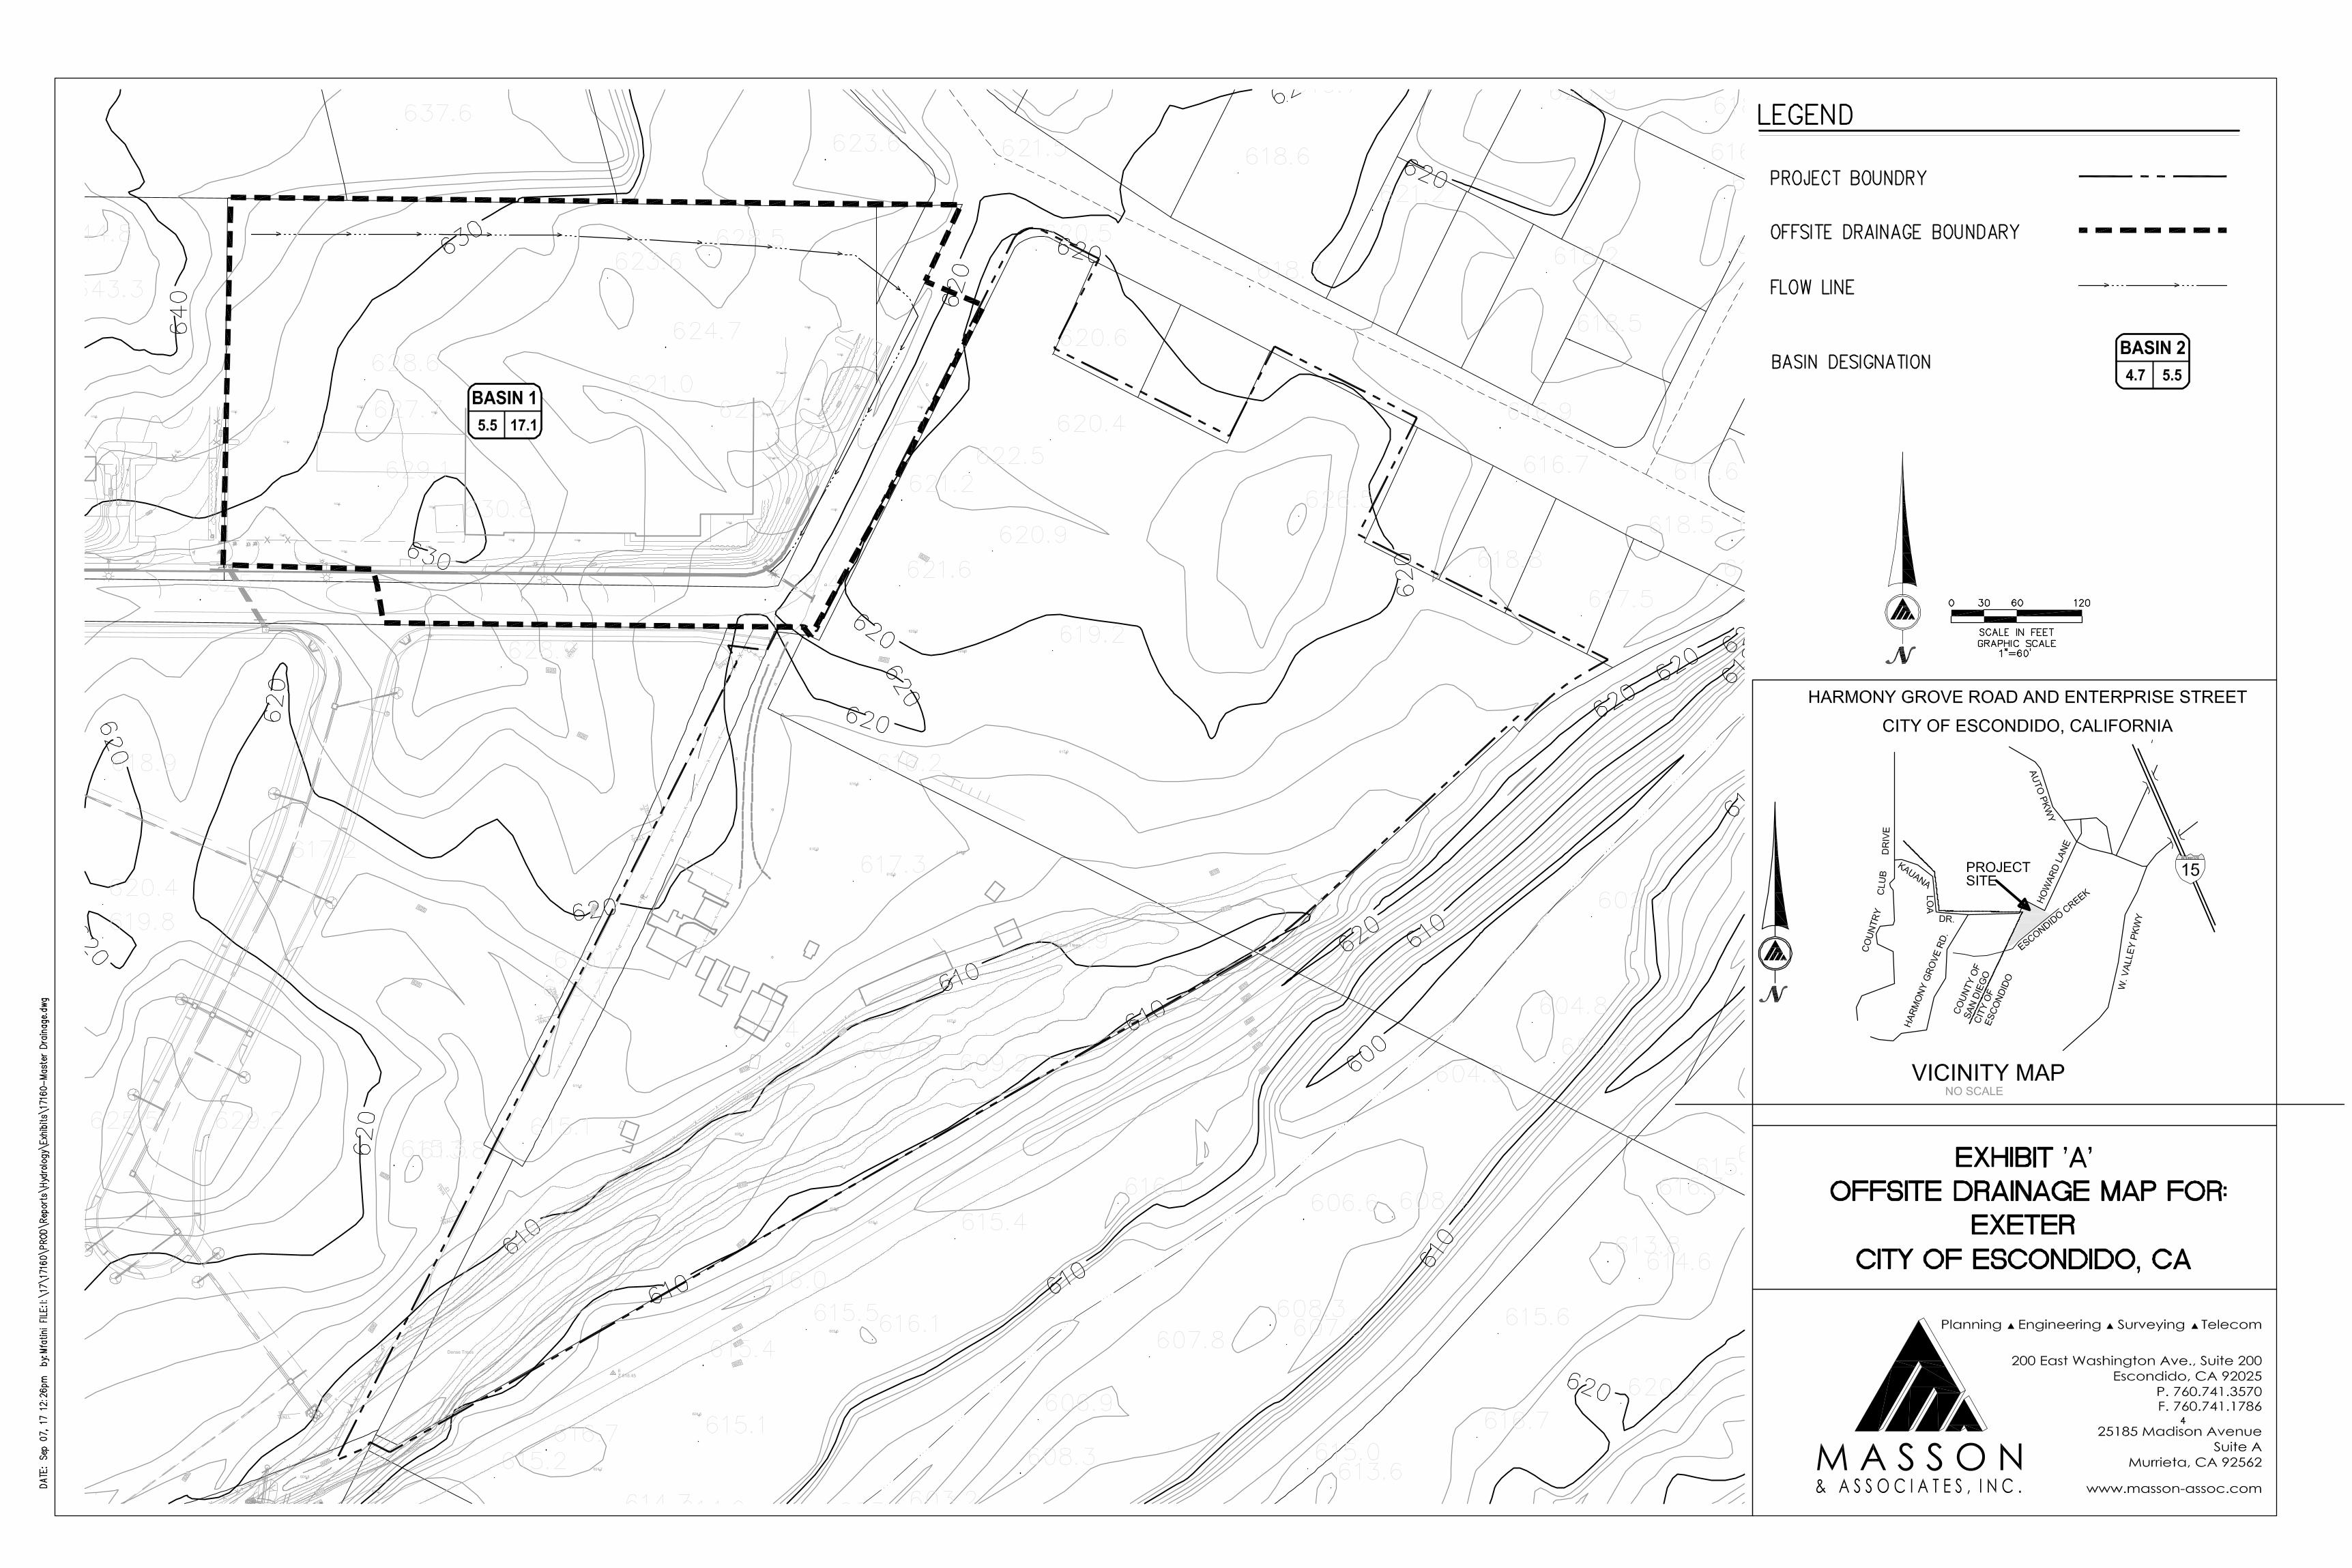
Exhibit A – Offsite Drainage Hydrology Map
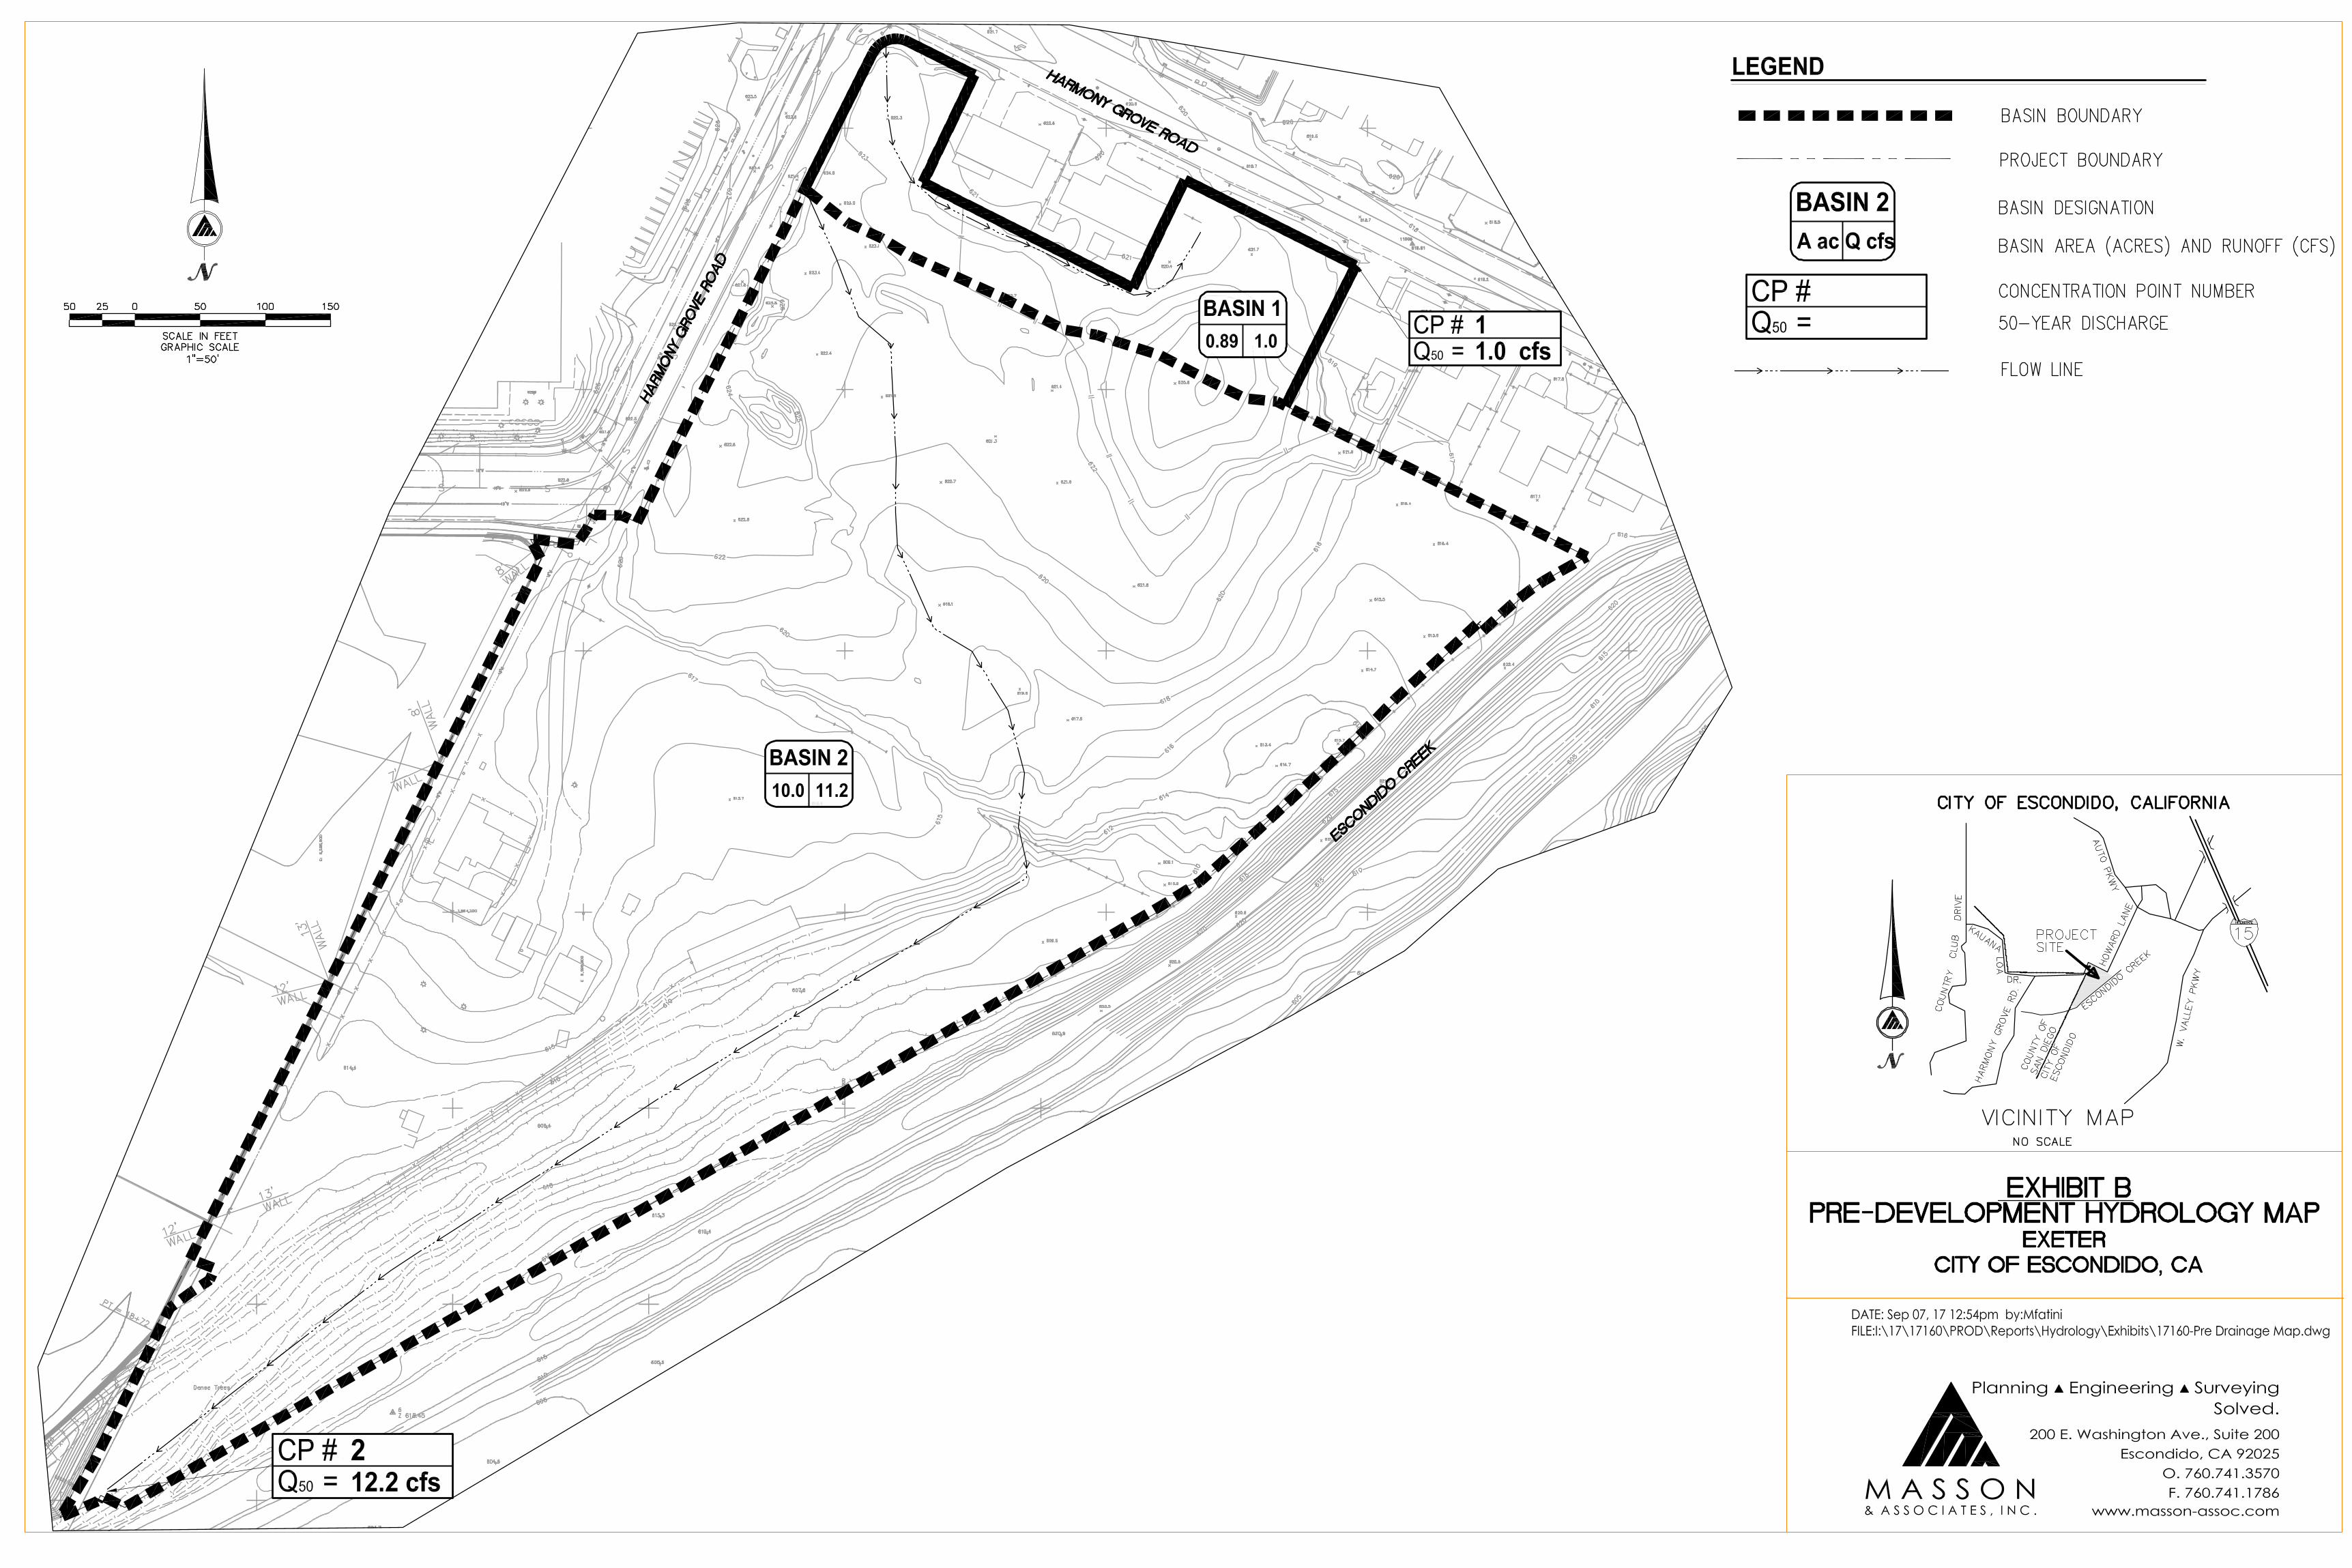
Exhibit B – Pre-Development Hydrology Map
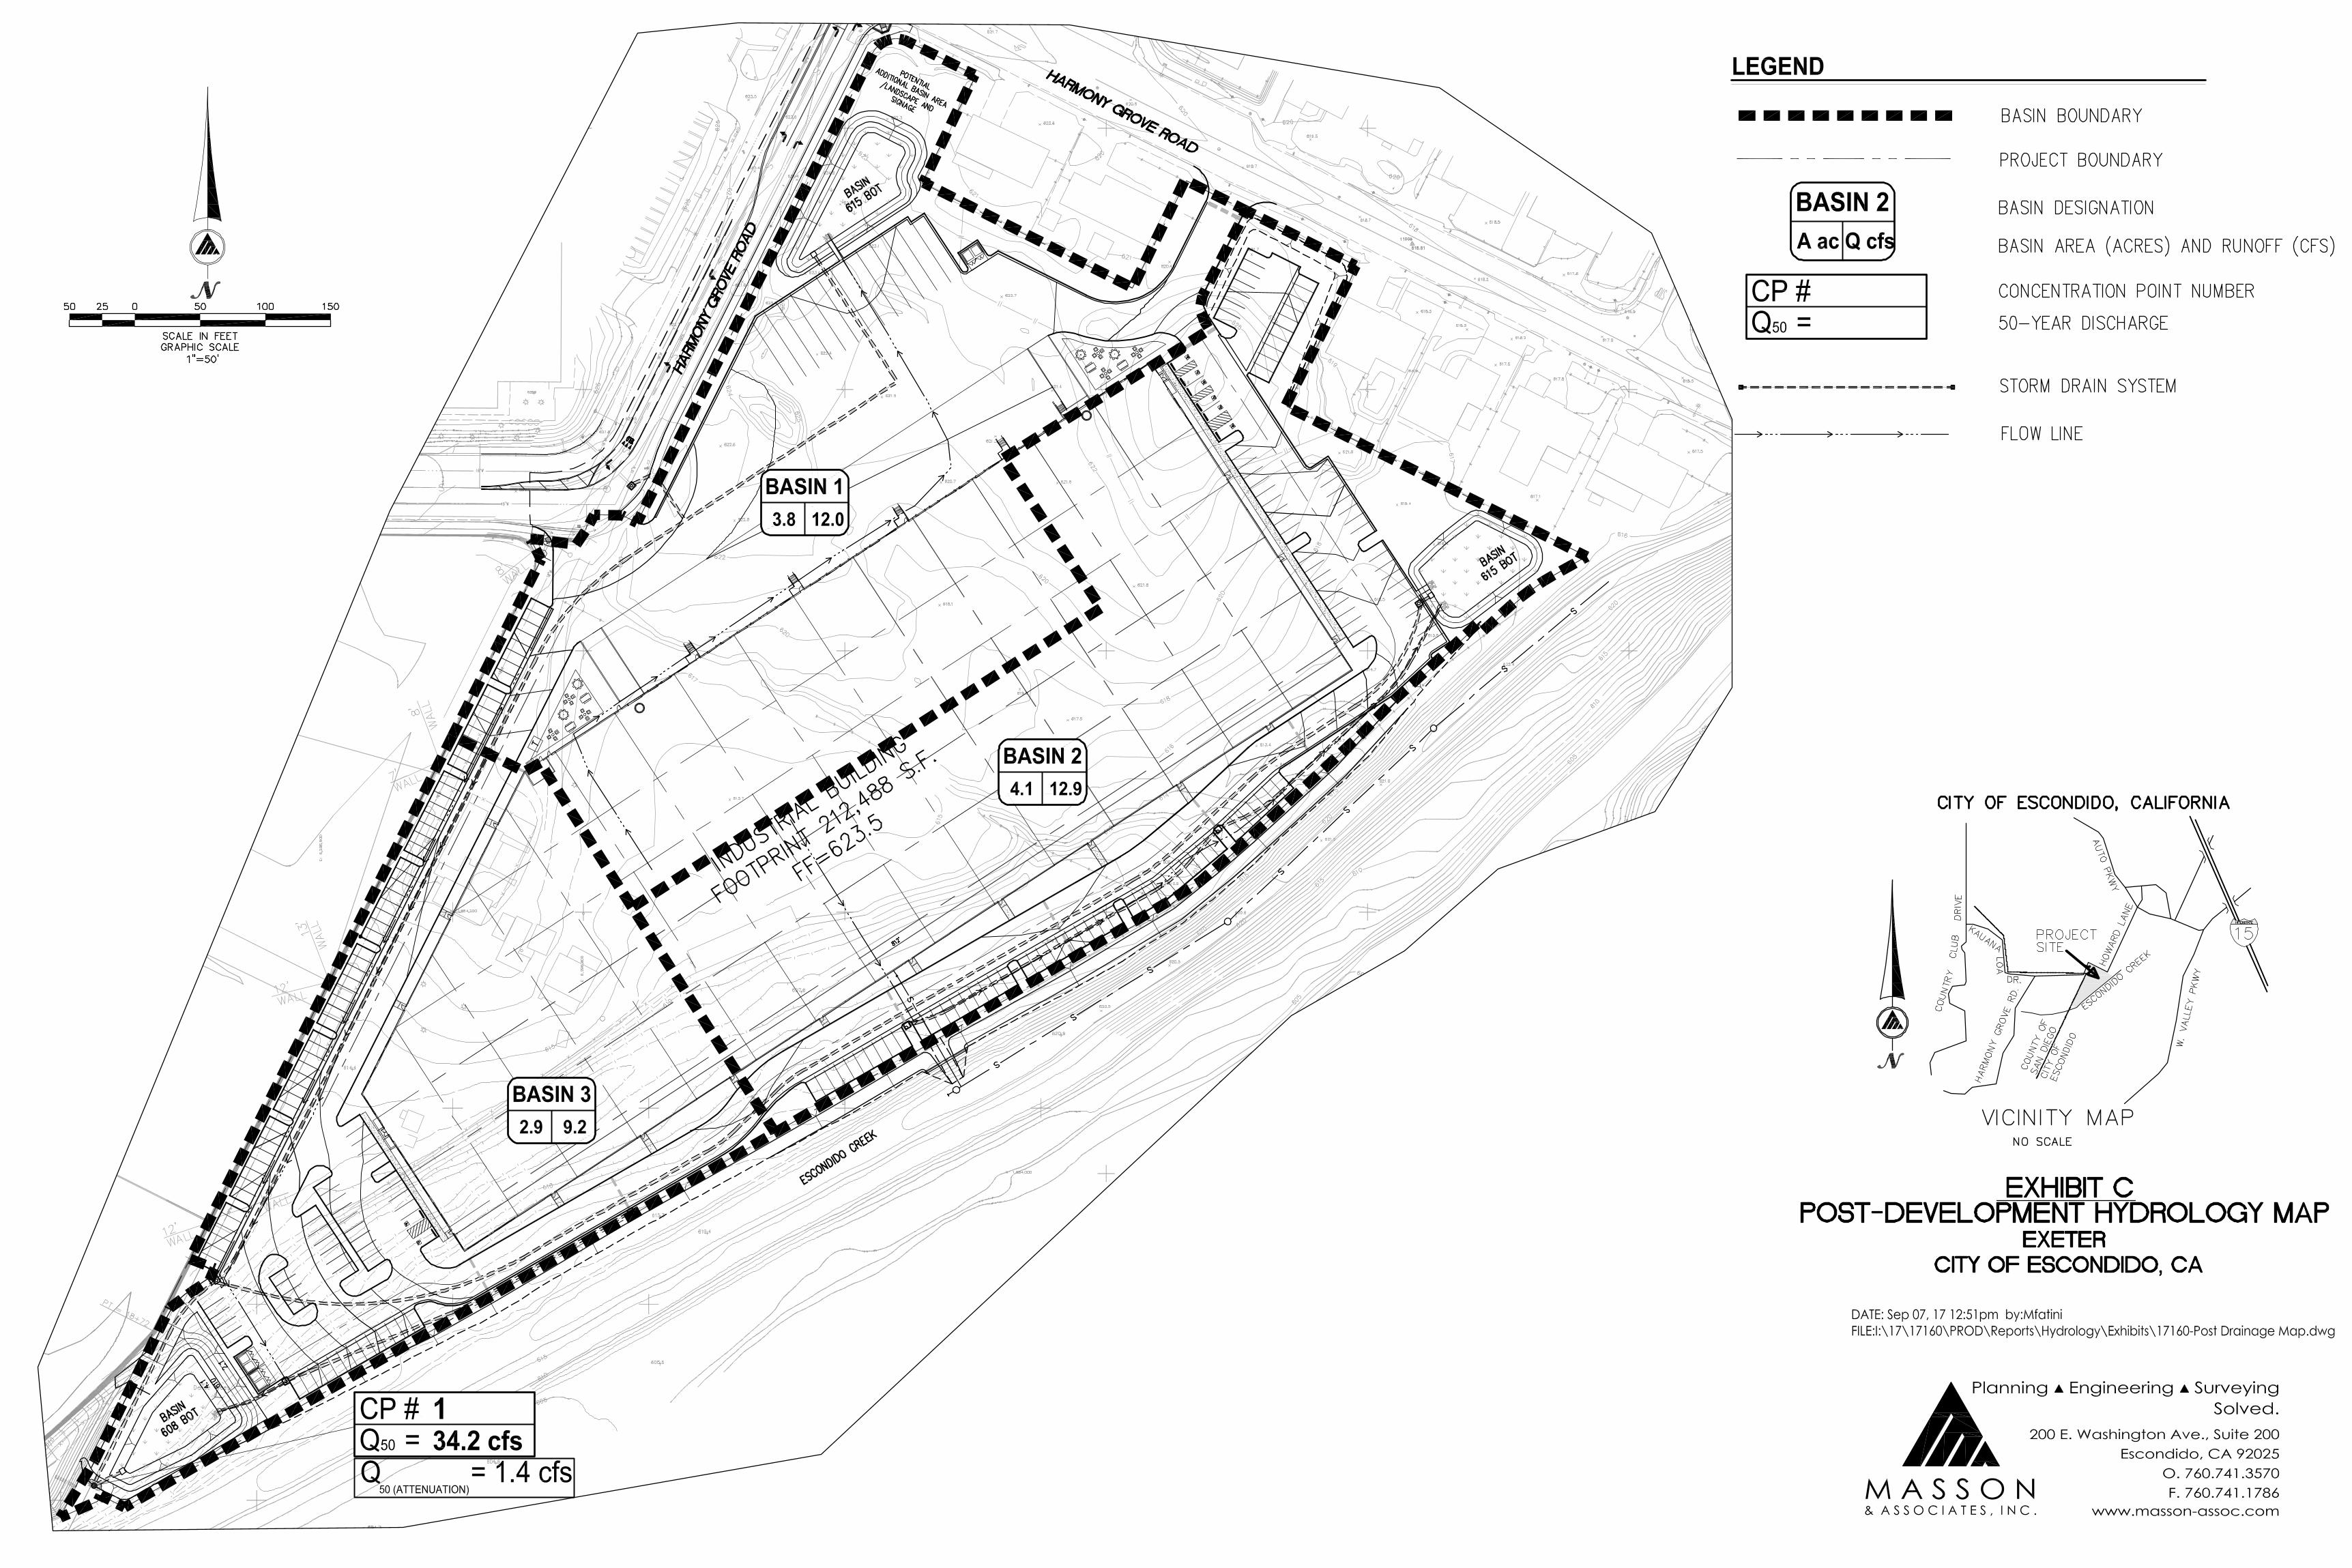
Exhibit C – Post-Development Hydrology Map
I:\17\17160\PROD\Reports\Hydrology\17160-
Hydrology.doc
I:\17\17160\PROD\Reports\Hydrology\17160-
Hydrology.doc
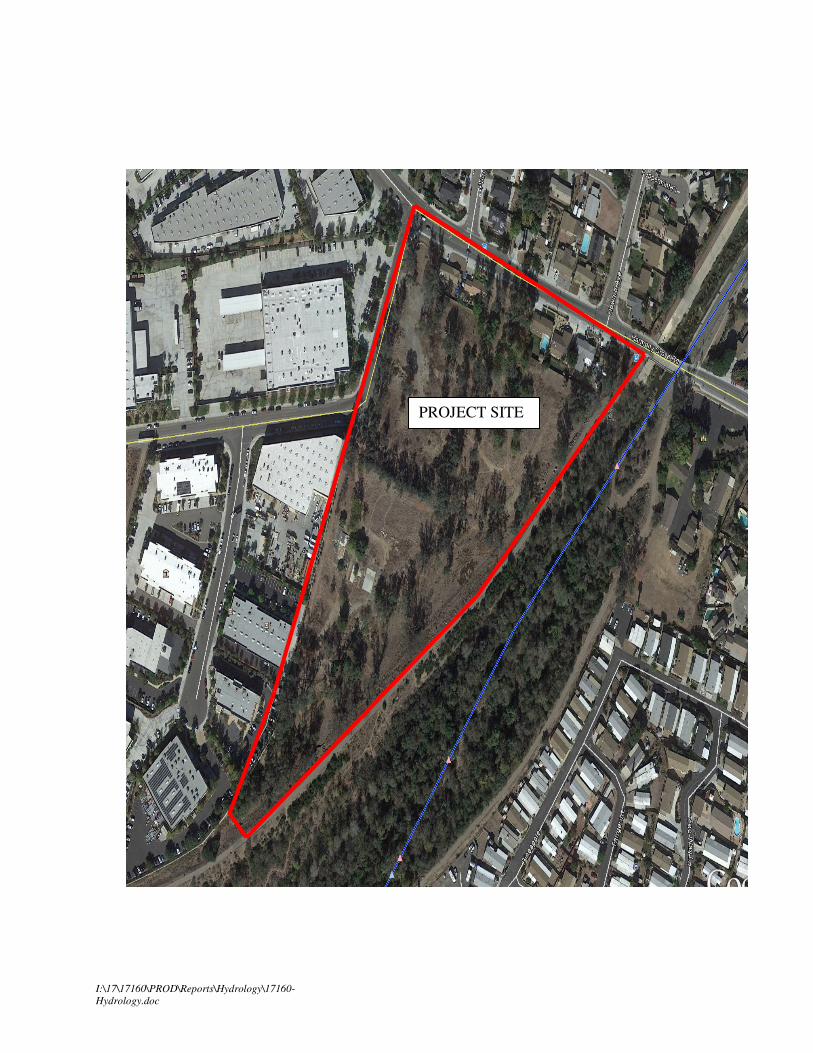
PROJECT SITE
I:\17\17160\PROD\Reports\Hydrology\17160-
Hydrology.doc
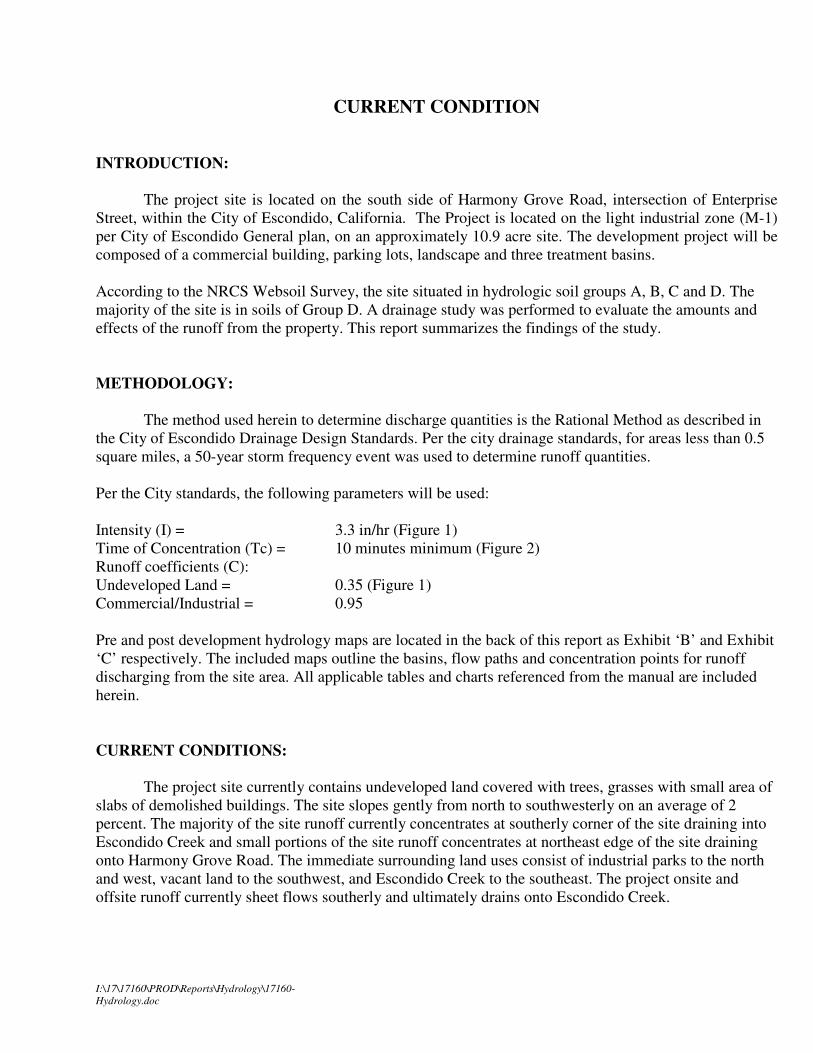
CURRENT CONDITION
INTRODUCTION:
The project site is located on the south side of Harmony Grove Road, intersection of Enterprise
Street, within the City of Escondido, California. The Project is located on the light industrial zone (M-1)
per City of Escondido General plan, on an approximately 10.9 acre site. The development project will be
composed of a commercial building, parking lots, landscape and three treatment basins.
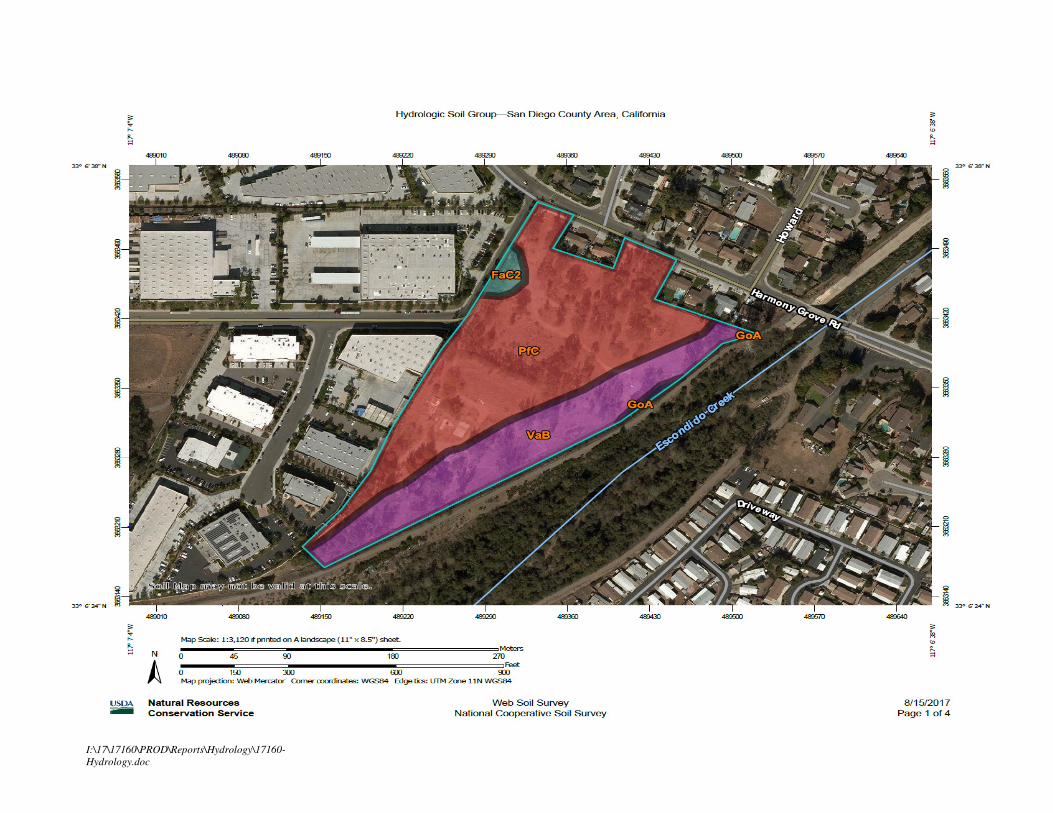
According to the NRCS Websoil Survey, the site situated in hydrologic soil groups A, B, C and D. The
majority of the site is in soils of Group D. A drainage study was performed to evaluate the amounts and
effects of the runoff from the property. This report summarizes the findings of the study.
METHODOLOGY:
The method used herein to determine discharge quantities is the Rational Method as described in
the City of Escondido Drainage Design Standards. Per the city drainage standards, for areas less than 0.5
square miles, a 50-year storm frequency event was used to determine runoff quantities.
Per the City standards, the following parameters will be used:
Intensity (I) = 3.3 in/hr (Figure 1)
Time of Concentration (Tc) = 10 minutes minimum (Figure 2)
Runoff coefficients (C):
Undeveloped Land = 0.35 (Figure 1)
Commercial/Industrial = 0.95
Pre and post development hydrology maps are located in the back of this report as Exhibit ‘B’ and Exhibit
‘C’ respectively. The included maps outline the basins, flow paths and concentration points for runoff
discharging from the site area. All applicable tables and charts referenced from the manual are included
herein.
CURRENT CONDITIONS:
The project site currently contains undeveloped land covered with trees, grasses with small area of
slabs of demolished buildings. The site slopes gently from north to southwesterly on an average of 2
percent. The majority of the site runoff currently concentrates at southerly corner of the site draining into
Escondido Creek and small portions of the site runoff concentrates at northeast edge of the site draining
onto Harmony Grove Road. The immediate surrounding land uses consist of industrial parks to the north
and west, vacant land to the southwest, and Escondido Creek to the southeast. The project onsite and
offsite runoff currently sheet flows southerly and ultimately drains onto Escondido Creek.
I:\17\17160\PROD\Reports\Hydrology\17160-
Hydrology.doc
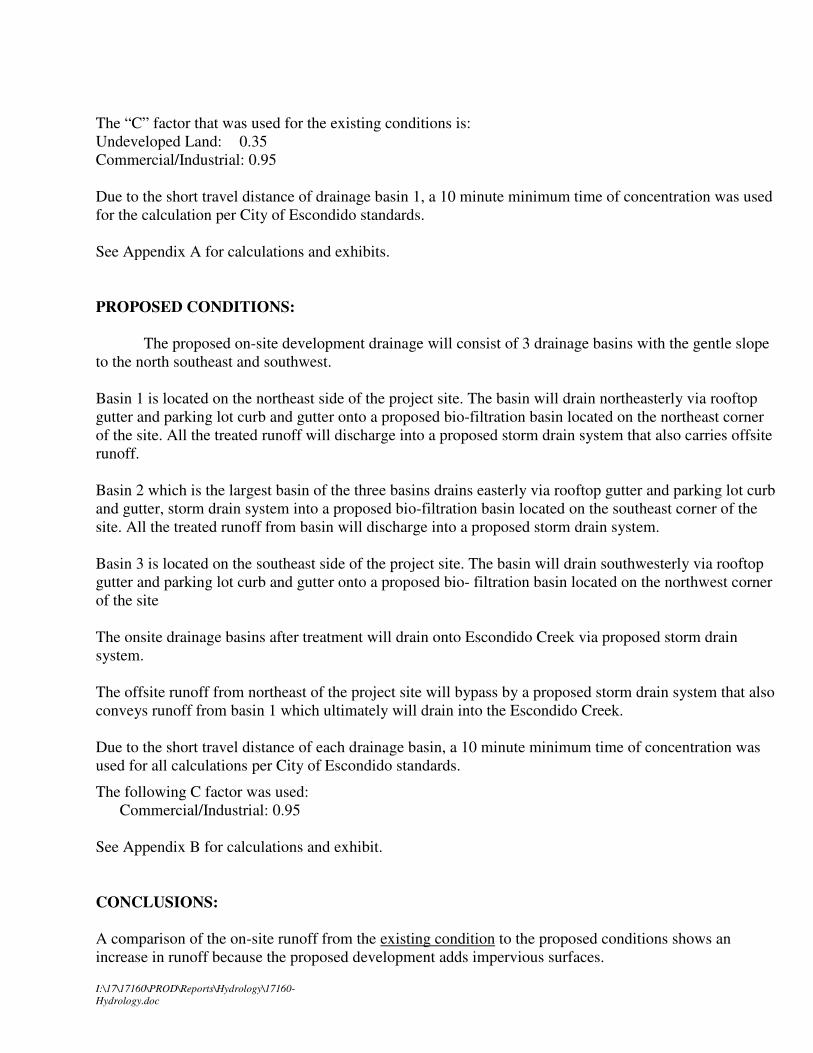
The “C” factor that was used for the existing conditions is:
Undeveloped Land: 0.35
Commercial/Industrial: 0.95
Due to the short travel distance of drainage basin 1, a 10 minute minimum time of concentration was used
for the calculation per City of Escondido standards.
See Appendix A for calculations and exhibits.
PROPOSED CONDITIONS:
The proposed on-site development drainage will consist of 3 drainage basins with the gentle slope
to the north southeast and southwest.
Basin 1 is located on the northeast side of the project site. The basin will drain northeasterly via rooftop
gutter and parking lot curb and gutter onto a proposed bio-filtration basin located on the northeast corner
of the site. All the treated runoff will discharge into a proposed storm drain system that also carries offsite
runoff.
Basin 2 which is the largest basin of the three basins drains easterly via rooftop gutter and parking lot curb
and gutter, storm drain system into a proposed bio-filtration basin located on the southeast corner of the
site. All the treated runoff from basin will discharge into a proposed storm drain system.
Basin 3 is located on the southeast side of the project site. The basin will drain southwesterly via rooftop
gutter and parking lot curb and gutter onto a proposed bio- filtration basin located on the northwest corner
of the site
The onsite drainage basins after treatment will drain onto Escondido Creek via proposed storm drain
system.
The offsite runoff from northeast of the project site will bypass by a proposed storm drain system that also
conveys runoff from basin 1 which ultimately will drain into the Escondido Creek.
Due to the short travel distance of each drainage basin, a 10 minute minimum time of concentration was
used for all calculations per City of Escondido standards.
The following C factor was used:
Commercial/Industrial: 0.95
See Appendix B for calculations and exhibit.
CONCLUSIONS:
A comparison of the on-site runoff from the existing condition to the proposed conditions shows an
increase in runoff because the proposed development adds impervious surfaces.
I:\17\17160\PROD\Reports\Hydrology\17160-
Hydrology.doc
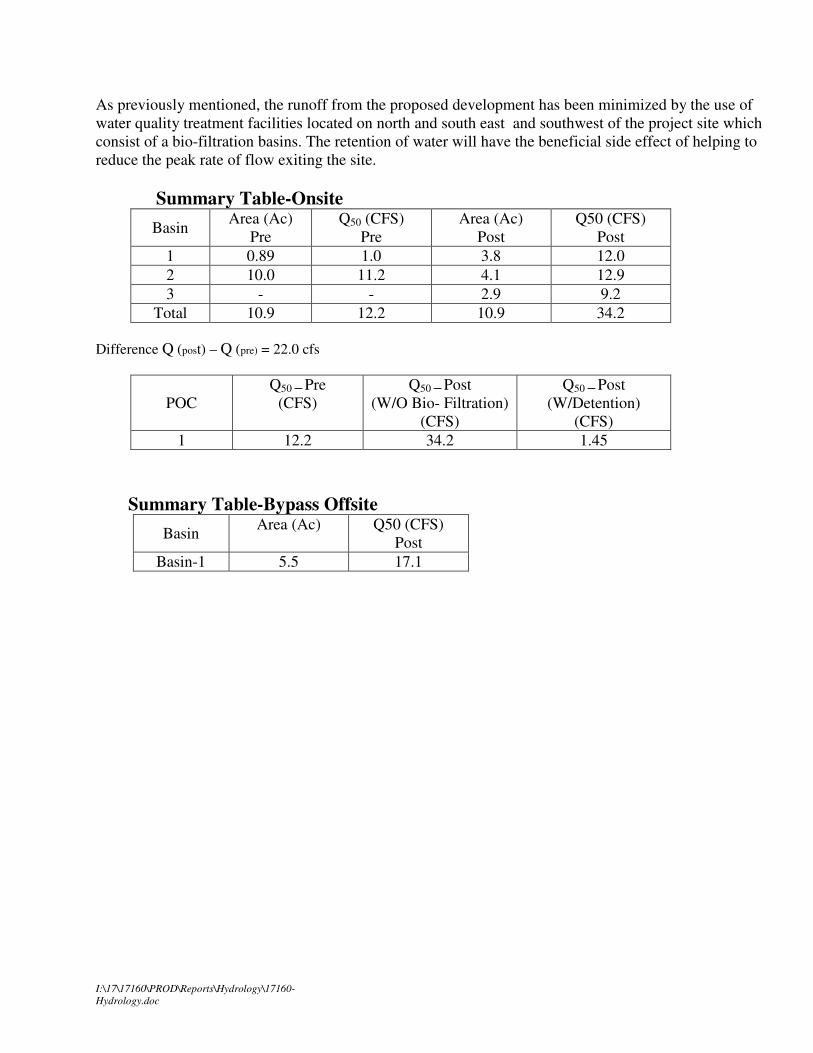
As previously mentioned, the runoff from the proposed development has been minimized by the use of
water quality treatment facilities located on north and south east and southwest of the project site which
consist of a bio-filtration basins. The retention of water will have the beneficial side effect of helping to
reduce the peak rate of flow exiting the site.
Summary Table-Onsite
Basin Area (Ac)
Pre
Q50 (CFS)
Pre
Area (Ac)
Post
Q50 (CFS)
Post
1 0.89 1.0 3.8 12.0
2 10.0 11.2 4.1 12.9
3 - - 2.9 9.2
Total 10.9 12.2 10.9 34.2
Difference Q (post) – Q (pre) = 22.0 cfs
POC
Q50 ─ Pre
(CFS)
Q50 ─ Post
(W/O Bio- Filtration)
(CFS)
Q50 ─ Post
(W/Detention)
(CFS)
1 12.2 34.2 1.45
Summary Table-Bypass Offsite
Basin Area (Ac)
Q50 (CFS)
Post
Basin-1 5.5 17.1
I:\17\17160\PROD\Reports\Hydrology\17160-
Hydrology.doc
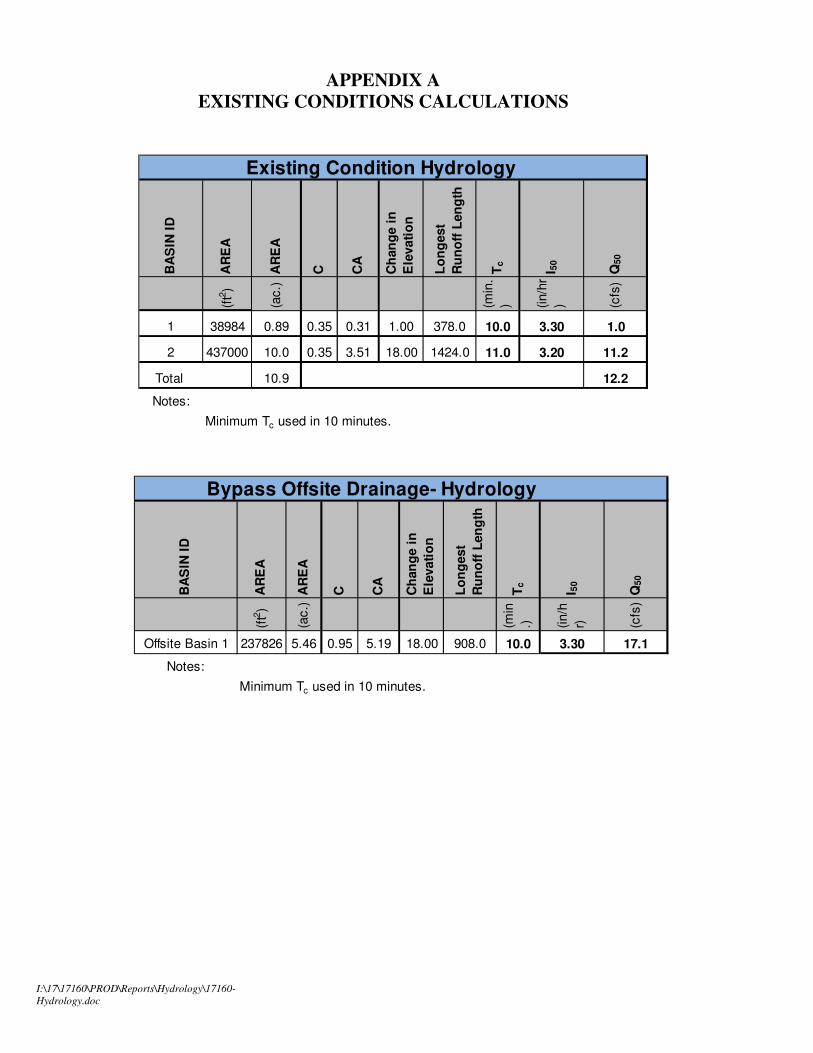
APPENDIX A
EXISTING CONDITIONS CALCULATIONS
BA
SIN
ID
AR
EA
AR
EA
C CA
Ch
an
ge i
n
Ele
vati
on
Lo
ng
est
Ru
no
ff L
en
gth
Tc
I 50
Q50
(ft2
)
(ac.)
(min
.
) (in/h
r
) (cfs
)
1 38984 0.89 0.35 0.31 1.00 378.0 10.0 3.30 1.0
2 437000 10.0 0.35 3.51 18.00 1424.0 11.0 3.20 11.2
Total 10.9 12.2
Notes:
Minimum Tc used in 10 minutes.
Existing Condition Hydrology
BA
SIN
ID
AR
EA
AR
EA
C CA
Ch
an
ge i
n
Ele
vati
on
Lo
ng
est
Ru
no
ff L
en
gth
Tc
I 50
Q50
(ft2
)
(ac.)
(min
.) (in/h
r) (cfs
)Offsite Basin 1 237826 5.46 0.95 5.19 18.00 908.0 10.0 3.30 17.1
Notes:
Minimum Tc used in 10 minutes.
Bypass Offsite Drainage- Hydrology
I:\17\17160\PROD\Reports\Hydrology\17160-
Hydrology.doc
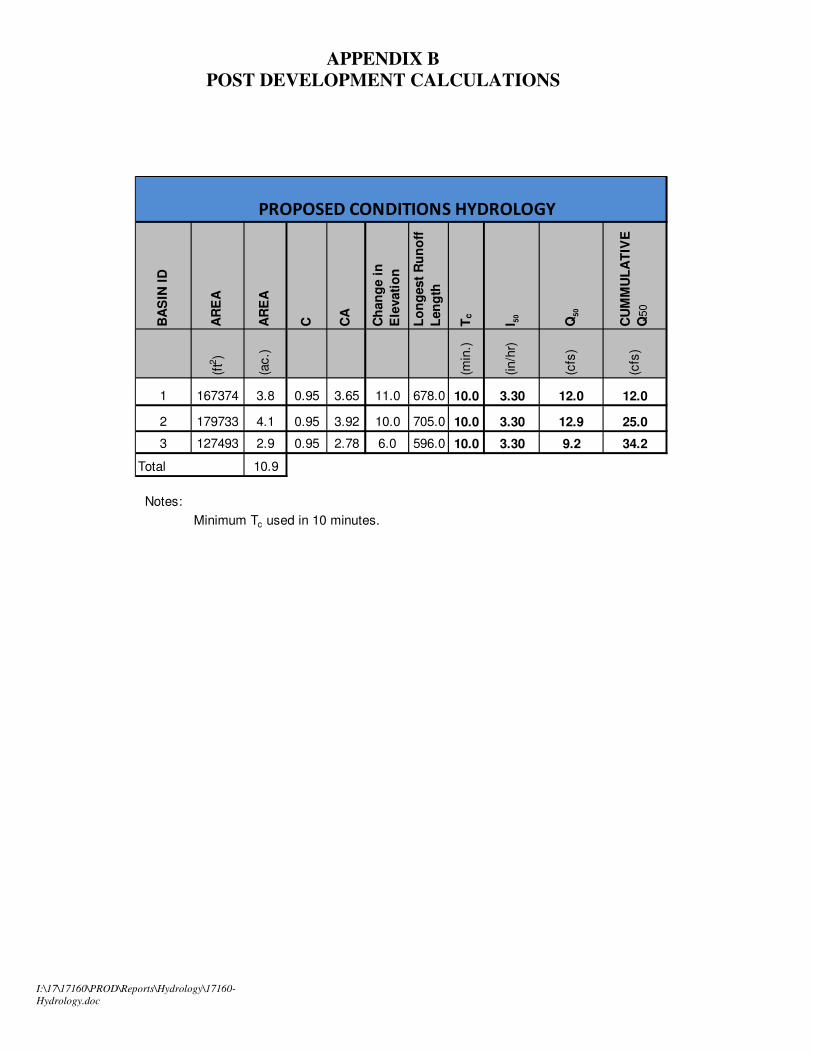
APPENDIX B
POST DEVELOPMENT CALCULATIONS
PROPOSED CONDITIONS HYDROLOGY
BA
SIN
ID
AR
EA
AR
EA
C CA
Ch
an
ge i
n
Ele
vati
on
Lo
ng
est
Ru
no
ff
Len
gth
Tc
I 50
Q5
0
CU
MM
UL
AT
IVE
Q50
(ft2
)
(ac.)
(min
.)
(in/h
r)
(cfs
)
(cfs
)
1 167374 3.8 0.95 3.65 11.0 678.0 10.0 3.30 12.0 12.0
2 179733 4.1 0.95 3.92 10.0 705.0 10.0 3.30 12.9 25.0
3 127493 2.9 0.95 2.78 6.0 596.0 10.0 3.30 9.2 34.2
Total 10.9
Notes:
Minimum Tc used in 10 minutes.

I:\17\17160\PROD\Reports\Hydrology\17160-
Hydrology.doc
APPENDIX C
TABLES AND FIGURES FROM CITY OF ESCONDIDO DRAINAGE
STANDARDS
I:\17\17160\PROD\Reports\Hydrology\17160-
Hydrology.doc
I:\17\17160\PROD\Reports\Hydrology\17160-
Hydrology.doc

I:\17\17160\PROD\Reports\Hydrology\17160-
Hydrology.doc
APPENDIX D DETENTION CALCULATION
(To Reduce Post Development Flows to the Pre Development
Flows)
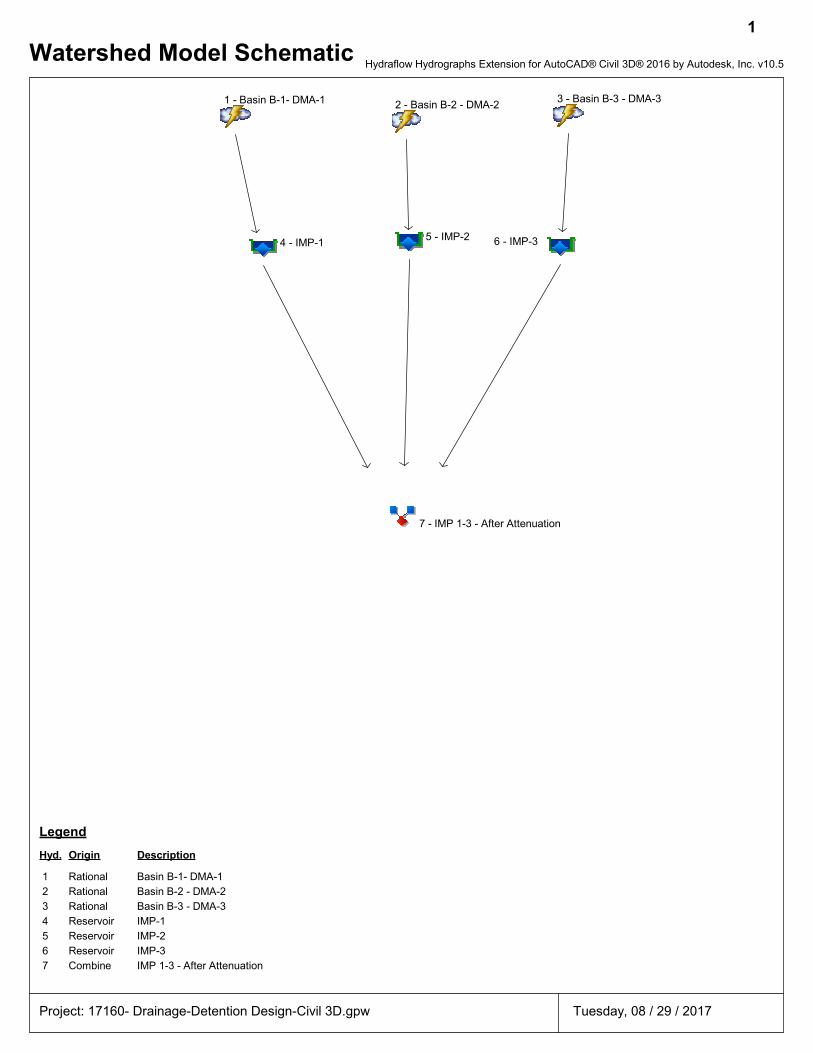
1 - Basin B-1- DMA-1 2 - Basin B-2 - DMA-23 - Basin B-3 - DMA-3
4 - IMP-15 - IMP-2 6 - IMP-3
7 - IMP 1-3 - After Attenuation
1
Watershed Model SchematicHydraflow Hydrographs Extension for AutoCAD® Civil 3D® 2016 by Autodesk, Inc. v10.5
Project: 17160- Drainage-Detention Design-Civil 3D.gpw Tuesday, 08 / 29 / 2017
Hyd. Origin Description
Legend
1 Rational Basin B-1- DMA-1
2 Rational Basin B-2 - DMA-2
3 Rational Basin B-3 - DMA-3
4 Reservoir IMP-1
5 Reservoir IMP-2
6 Reservoir IMP-3
7 Combine IMP 1-3 - After Attenuation
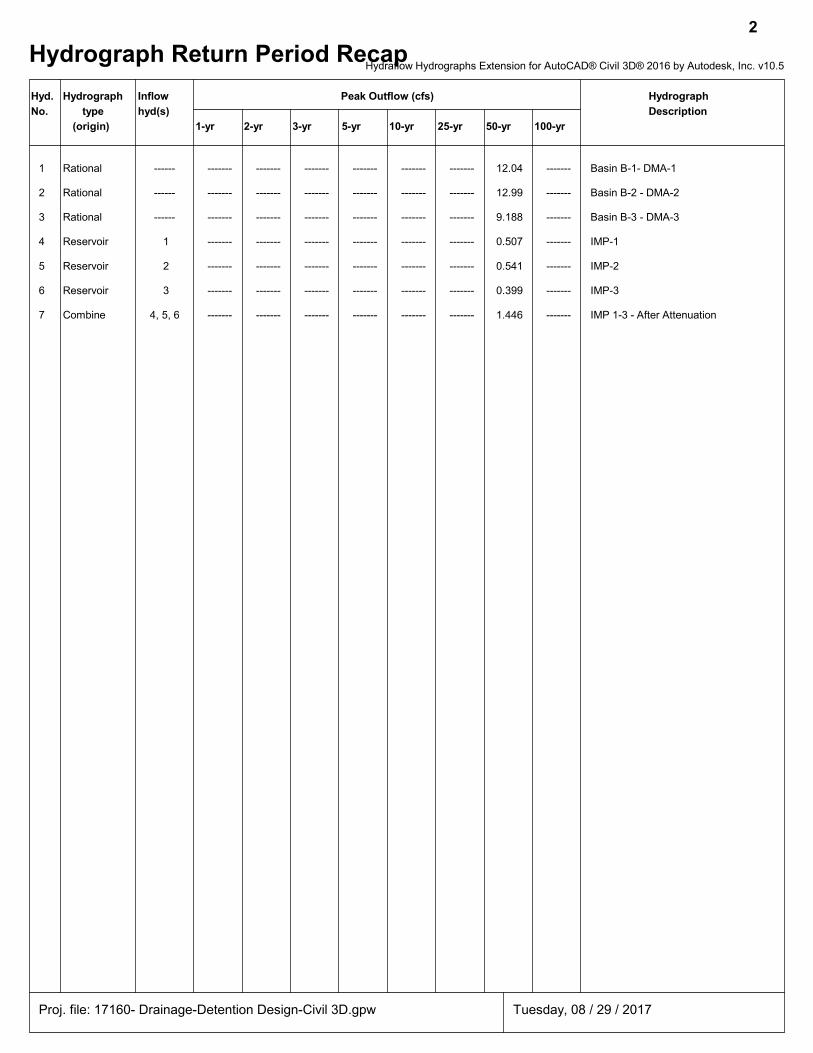
Hydrograph Return Period Recap
2
Hyd. Hydrograph Inflow Peak Outflow (cfs) Hydrograph
No. type hyd(s) Description
(origin) 1-yr 2-yr 3-yr 5-yr 10-yr 25-yr 50-yr 100-yr
1 Rational ------ ------- ------- ------- ------- ------- ------- 12.04 ------- Basin B-1- DMA-1
2 Rational ------ ------- ------- ------- ------- ------- ------- 12.99 ------- Basin B-2 - DMA-2
3 Rational ------ ------- ------- ------- ------- ------- ------- 9.188 ------- Basin B-3 - DMA-3
4 Reservoir 1 ------- ------- ------- ------- ------- ------- 0.507 ------- IMP-1
5 Reservoir 2 ------- ------- ------- ------- ------- ------- 0.541 ------- IMP-2
6 Reservoir 3 ------- ------- ------- ------- ------- ------- 0.399 ------- IMP-3
7 Combine 4, 5, 6 ------- ------- ------- ------- ------- ------- 1.446 ------- IMP 1-3 - After Attenuation
Proj. file: 17160- Drainage-Detention Design-Civil 3D.gpw Tuesday, 08 / 29 / 2017
Hydraflow Hydrographs Extension for AutoCAD® Civil 3D® 2016 by Autodesk, Inc. v10.5
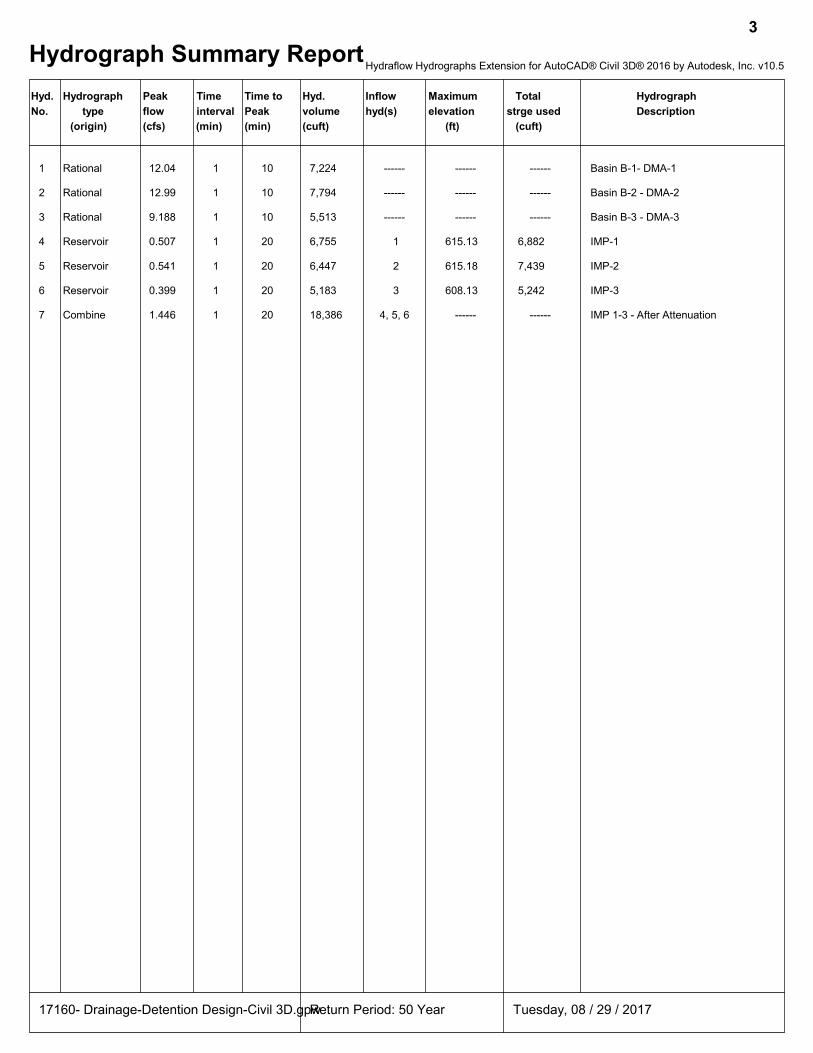
Hydrograph Summary Report
3
Hyd. Hydrograph Peak Time Time to Hyd. Inflow Maximum Total Hydrograph
No. type flow interval Peak volume hyd(s) elevation strge used Description
(origin) (cfs) (min) (min) (cuft) (ft) (cuft)
1 Rational 12.04 1 10 7,224 ------ ------ ------ Basin B-1- DMA-1
2 Rational 12.99 1 10 7,794 ------ ------ ------ Basin B-2 - DMA-2
3 Rational 9.188 1 10 5,513 ------ ------ ------ Basin B-3 - DMA-3
4 Reservoir 0.507 1 20 6,755 1 615.13 6,882 IMP-1
5 Reservoir 0.541 1 20 6,447 2 615.18 7,439 IMP-2
6 Reservoir 0.399 1 20 5,183 3 608.13 5,242 IMP-3
7 Combine 1.446 1 20 18,386 4, 5, 6 ------ ------ IMP 1-3 - After Attenuation
17160- Drainage-Detention Design-Civil 3D.gpwReturn Period: 50 Year Tuesday, 08 / 29 / 2017
Hydraflow Hydrographs Extension for AutoCAD® Civil 3D® 2016 by Autodesk, Inc. v10.5
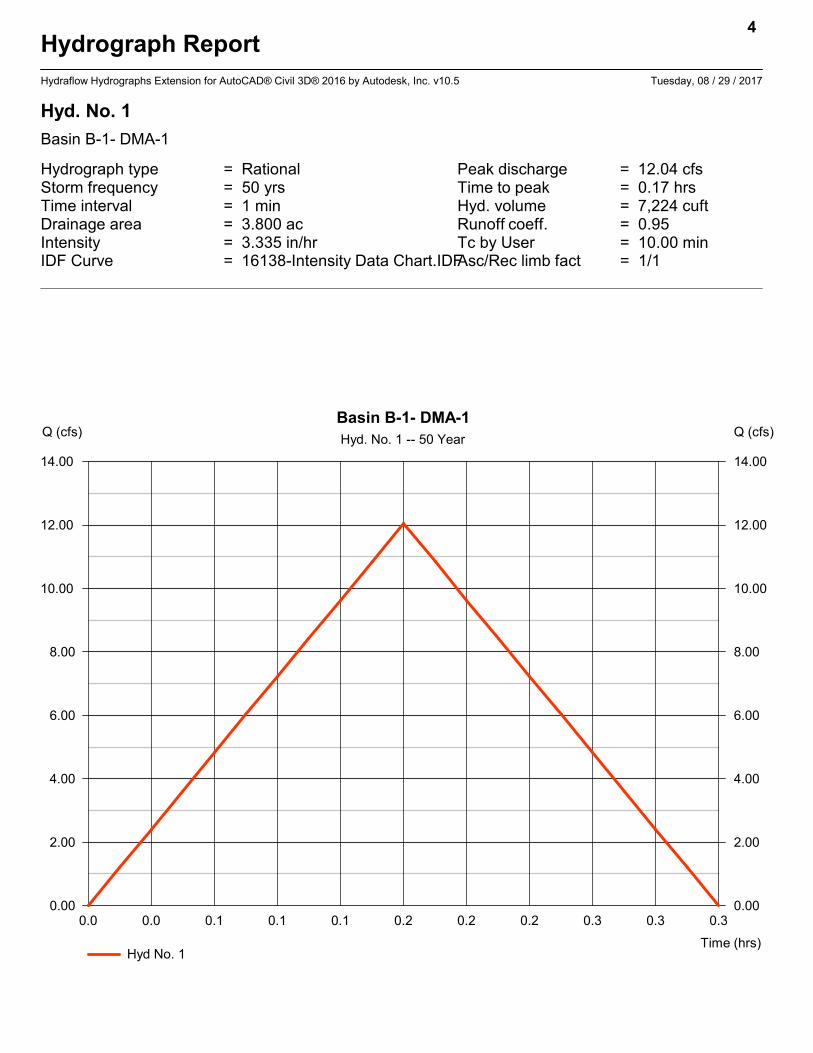
Hydrograph Report
Hydraflow Hydrographs Extension for AutoCAD® Civil 3D® 2016 by Autodesk, Inc. v10.5 Tuesday, 08 / 29 / 2017
Hyd. No. 1
Basin B-1- DMA-1
Hydrograph type = Rational Peak discharge = 12.04 cfsStorm frequency = 50 yrs Time to peak = 0.17 hrsTime interval = 1 min Hyd. volume = 7,224 cuftDrainage area = 3.800 ac Runoff coeff. = 0.95Intensity = 3.335 in/hr Tc by User = 10.00 minIDF Curve = 16138-Intensity Data Chart.IDFAsc/Rec limb fact = 1/1
4
0.0 0.0 0.1 0.1 0.1 0.2 0.2 0.2 0.3 0.3 0.3
Q (cfs)
0.00 0.00
2.00 2.00
4.00 4.00
6.00 6.00
8.00 8.00
10.00 10.00
12.00 12.00
14.00 14.00
Q (cfs)
Time (hrs)
Basin B-1- DMA-1
Hyd. No. 1 -- 50 Year
Hyd No. 1
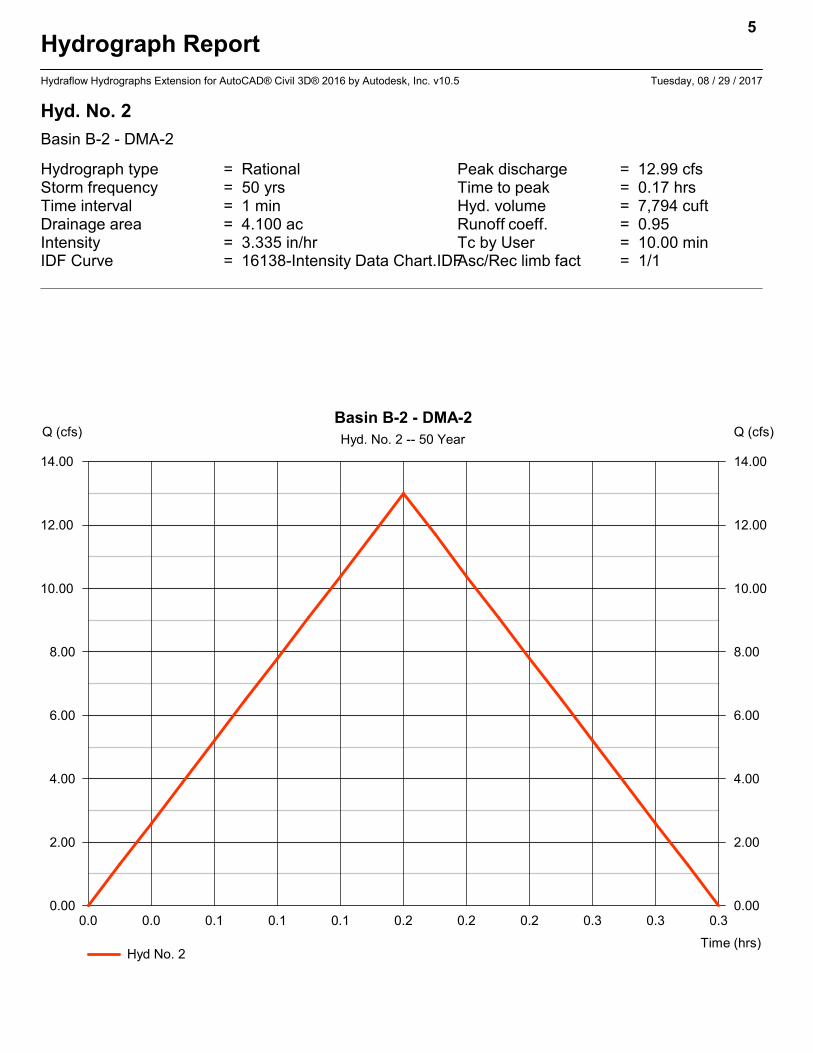
Hydrograph Report
Hydraflow Hydrographs Extension for AutoCAD® Civil 3D® 2016 by Autodesk, Inc. v10.5 Tuesday, 08 / 29 / 2017
Hyd. No. 2
Basin B-2 - DMA-2
Hydrograph type = Rational Peak discharge = 12.99 cfsStorm frequency = 50 yrs Time to peak = 0.17 hrsTime interval = 1 min Hyd. volume = 7,794 cuftDrainage area = 4.100 ac Runoff coeff. = 0.95Intensity = 3.335 in/hr Tc by User = 10.00 minIDF Curve = 16138-Intensity Data Chart.IDFAsc/Rec limb fact = 1/1
5
0.0 0.0 0.1 0.1 0.1 0.2 0.2 0.2 0.3 0.3 0.3
Q (cfs)
0.00 0.00
2.00 2.00
4.00 4.00
6.00 6.00
8.00 8.00
10.00 10.00
12.00 12.00
14.00 14.00
Q (cfs)
Time (hrs)
Basin B-2 - DMA-2
Hyd. No. 2 -- 50 Year
Hyd No. 2
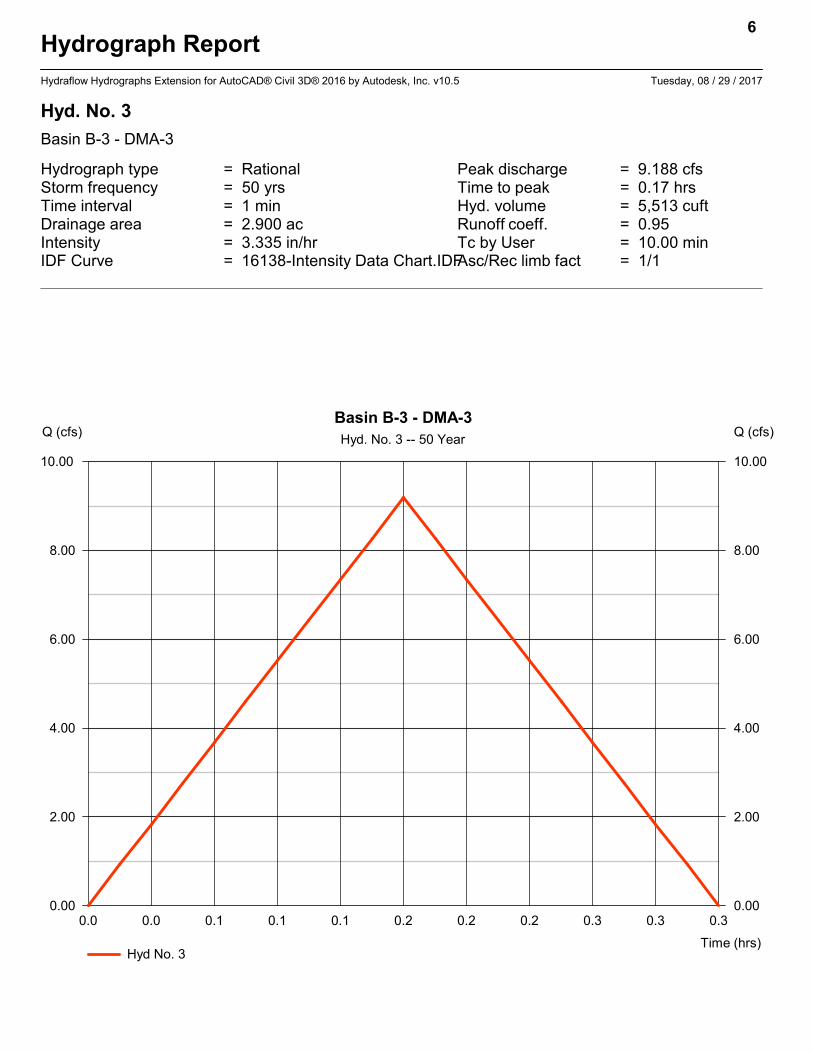
Hydrograph Report
Hydraflow Hydrographs Extension for AutoCAD® Civil 3D® 2016 by Autodesk, Inc. v10.5 Tuesday, 08 / 29 / 2017
Hyd. No. 3
Basin B-3 - DMA-3
Hydrograph type = Rational Peak discharge = 9.188 cfsStorm frequency = 50 yrs Time to peak = 0.17 hrsTime interval = 1 min Hyd. volume = 5,513 cuftDrainage area = 2.900 ac Runoff coeff. = 0.95Intensity = 3.335 in/hr Tc by User = 10.00 minIDF Curve = 16138-Intensity Data Chart.IDFAsc/Rec limb fact = 1/1
6
0.0 0.0 0.1 0.1 0.1 0.2 0.2 0.2 0.3 0.3 0.3
Q (cfs)
0.00 0.00
2.00 2.00
4.00 4.00
6.00 6.00
8.00 8.00
10.00 10.00
Q (cfs)
Time (hrs)
Basin B-3 - DMA-3
Hyd. No. 3 -- 50 Year
Hyd No. 3
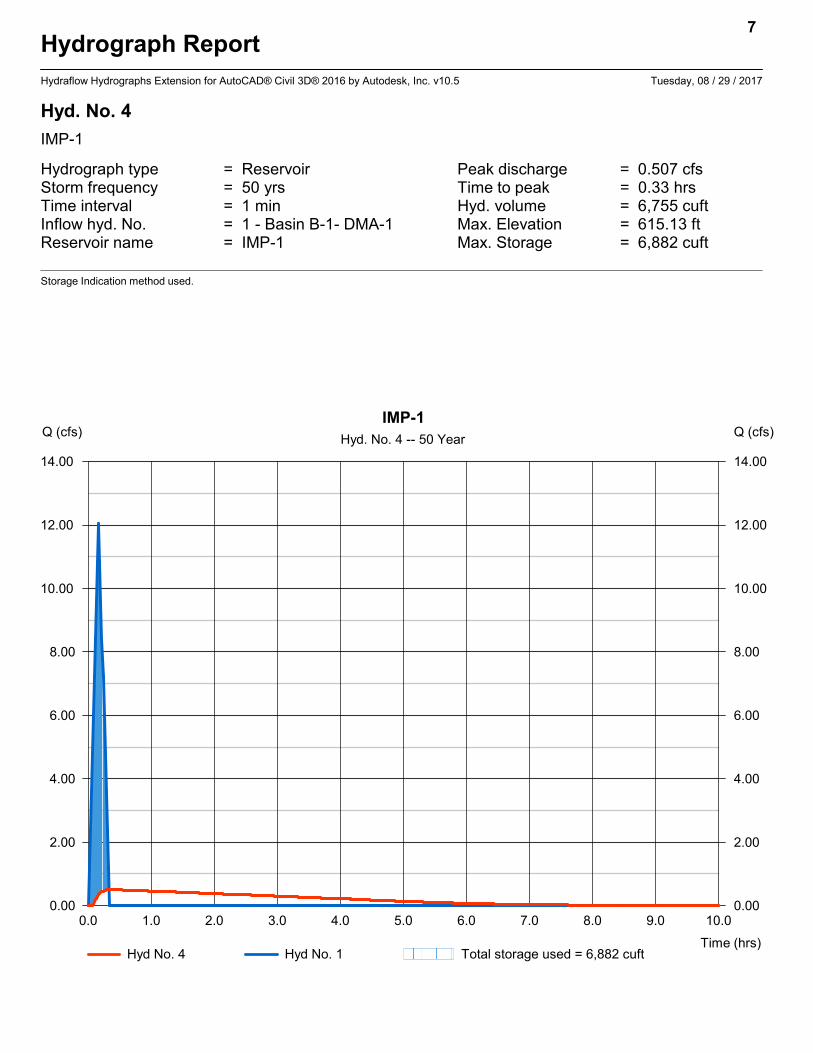
Hydrograph Report
Hydraflow Hydrographs Extension for AutoCAD® Civil 3D® 2016 by Autodesk, Inc. v10.5 Tuesday, 08 / 29 / 2017
Hyd. No. 4
IMP-1
Hydrograph type = Reservoir Peak discharge = 0.507 cfsStorm frequency = 50 yrs Time to peak = 0.33 hrsTime interval = 1 min Hyd. volume = 6,755 cuftInflow hyd. No. = 1 - Basin B-1- DMA-1 Max. Elevation = 615.13 ftReservoir name = IMP-1 Max. Storage = 6,882 cuft
Storage Indication method used.
7
0.0 1.0 2.0 3.0 4.0 5.0 6.0 7.0 8.0 9.0 10.0
Q (cfs)
0.00 0.00
2.00 2.00
4.00 4.00
6.00 6.00
8.00 8.00
10.00 10.00
12.00 12.00
14.00 14.00
Q (cfs)
Time (hrs)
IMP-1
Hyd. No. 4 -- 50 Year
Hyd No. 4 Hyd No. 1 Total storage used = 6,882 cuft
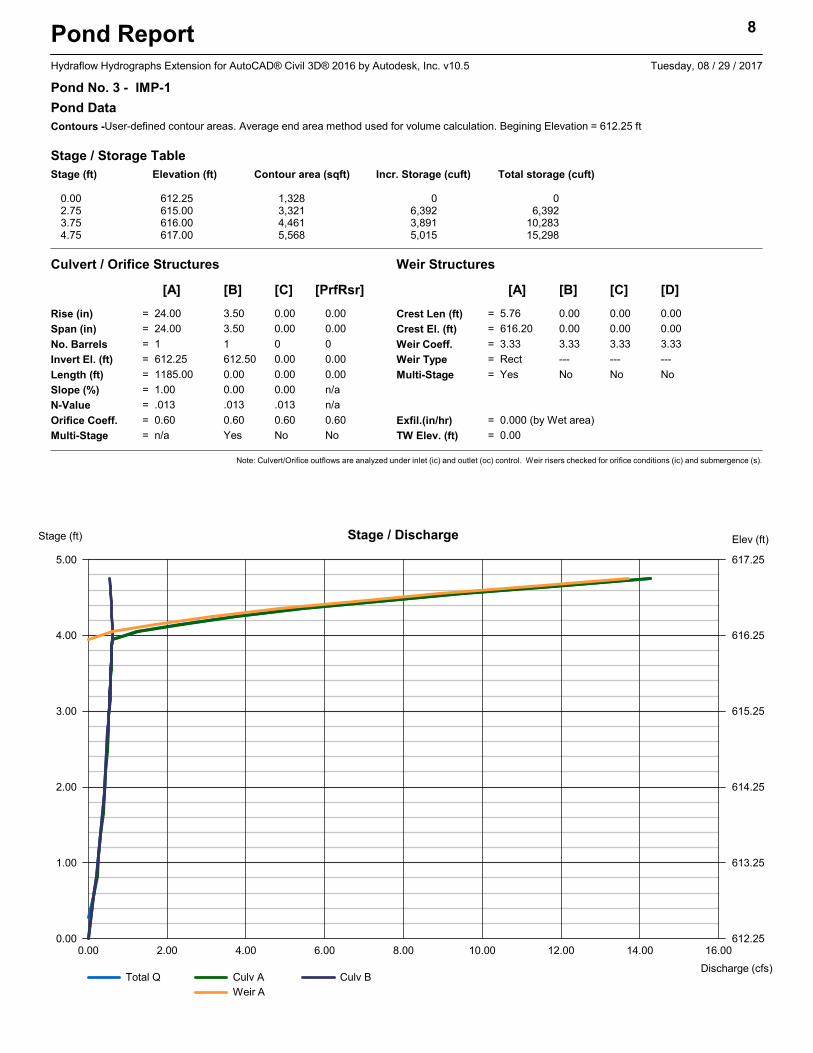
Pond Report 8
Hydraflow Hydrographs Extension for AutoCAD® Civil 3D® 2016 by Autodesk, Inc. v10.5 Tuesday, 08 / 29 / 2017
Pond No. 3 - IMP-1
Pond Data
Contours -User-defined contour areas. Average end area method used for volume calculation. Begining Elevation = 612.25 ft
Stage / Storage Table
Stage (ft) Elevation (ft) Contour area (sqft) Incr. Storage (cuft) Total storage (cuft)
0.00 612.25 1,328 0 02.75 615.00 3,321 6,392 6,3923.75 616.00 4,461 3,891 10,2834.75 617.00 5,568 5,015 15,298
Culvert / Orifice Structures Weir Structures
[A] [B] [C] [PrfRsr] [A] [B] [C] [D]
Rise (in) = 24.00 3.50 0.00 0.00
Span (in) = 24.00 3.50 0.00 0.00
No. Barrels = 1 1 0 0
Invert El. (ft) = 612.25 612.50 0.00 0.00
Length (ft) = 1185.00 0.00 0.00 0.00
Slope (%) = 1.00 0.00 0.00 n/a
N-Value = .013 .013 .013 n/a
Orifice Coeff. = 0.60 0.60 0.60 0.60
Multi-Stage = n/a Yes No No
Crest Len (ft) = 5.76 0.00 0.00 0.00
Crest El. (ft) = 616.20 0.00 0.00 0.00
Weir Coeff. = 3.33 3.33 3.33 3.33
Weir Type = Rect --- --- ---
Multi-Stage = Yes No No No
Exfil.(in/hr) = 0.000 (by Wet area)
TW Elev. (ft) = 0.00
Note: Culvert/Orifice outflows are analyzed under inlet (ic) and outlet (oc) control. Weir risers checked for orifice conditions (ic) and submergence (s).
0.00 2.00 4.00 6.00 8.00 10.00 12.00 14.00 16.00
Stage (ft)
0.00 612.25
1.00 613.25
2.00 614.25
3.00 615.25
4.00 616.25
5.00 617.25
Elev (ft)
Discharge (cfs)
Stage / Discharge
Total Q Culv A Culv B
Weir A
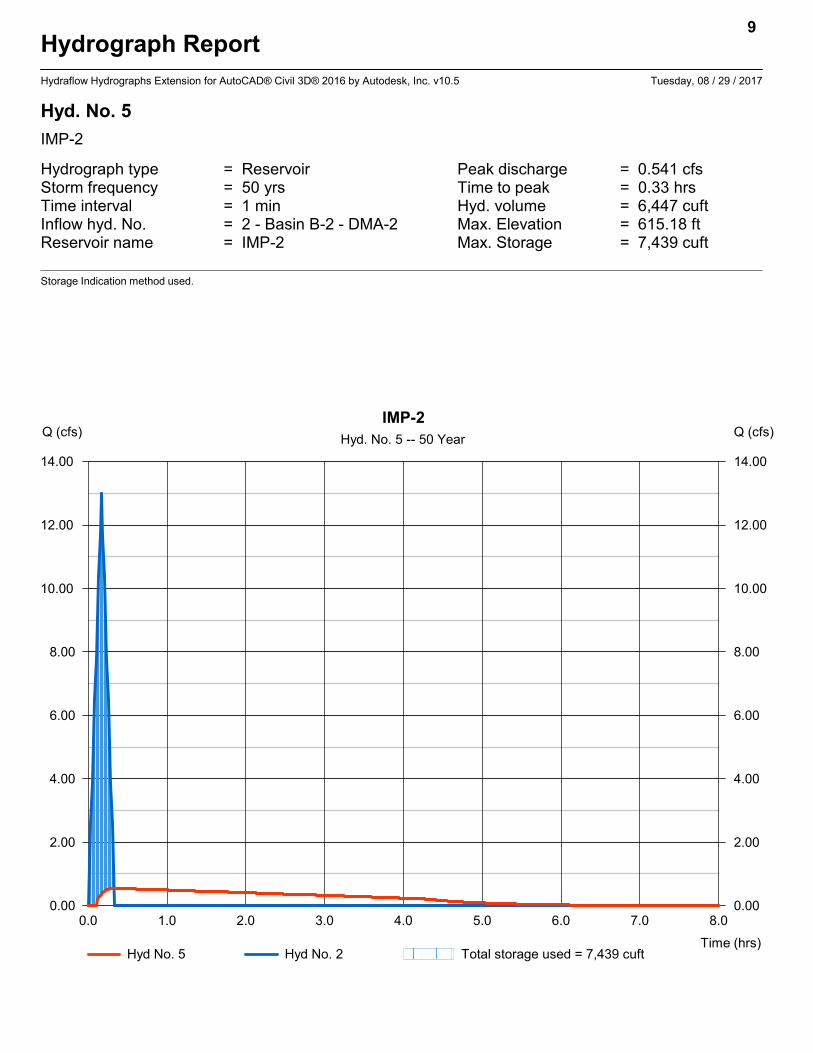
Hydrograph Report
Hydraflow Hydrographs Extension for AutoCAD® Civil 3D® 2016 by Autodesk, Inc. v10.5 Tuesday, 08 / 29 / 2017
Hyd. No. 5
IMP-2
Hydrograph type = Reservoir Peak discharge = 0.541 cfsStorm frequency = 50 yrs Time to peak = 0.33 hrsTime interval = 1 min Hyd. volume = 6,447 cuftInflow hyd. No. = 2 - Basin B-2 - DMA-2 Max. Elevation = 615.18 ftReservoir name = IMP-2 Max. Storage = 7,439 cuft
Storage Indication method used.
9
0.0 1.0 2.0 3.0 4.0 5.0 6.0 7.0 8.0
Q (cfs)
0.00 0.00
2.00 2.00
4.00 4.00
6.00 6.00
8.00 8.00
10.00 10.00
12.00 12.00
14.00 14.00
Q (cfs)
Time (hrs)
IMP-2
Hyd. No. 5 -- 50 Year
Hyd No. 5 Hyd No. 2 Total storage used = 7,439 cuft
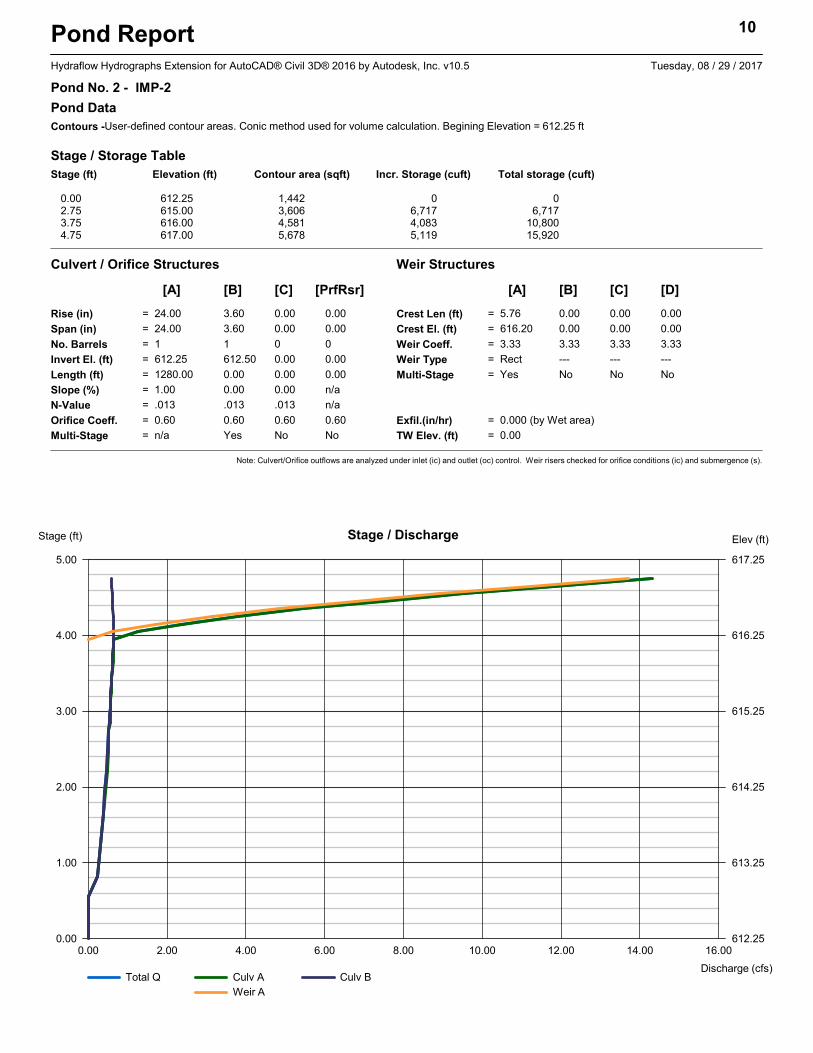
Pond Report 10
Hydraflow Hydrographs Extension for AutoCAD® Civil 3D® 2016 by Autodesk, Inc. v10.5 Tuesday, 08 / 29 / 2017
Pond No. 2 - IMP-2
Pond Data
Contours -User-defined contour areas. Conic method used for volume calculation. Begining Elevation = 612.25 ft
Stage / Storage Table
Stage (ft) Elevation (ft) Contour area (sqft) Incr. Storage (cuft) Total storage (cuft)
0.00 612.25 1,442 0 02.75 615.00 3,606 6,717 6,7173.75 616.00 4,581 4,083 10,8004.75 617.00 5,678 5,119 15,920
Culvert / Orifice Structures Weir Structures
[A] [B] [C] [PrfRsr] [A] [B] [C] [D]
Rise (in) = 24.00 3.60 0.00 0.00
Span (in) = 24.00 3.60 0.00 0.00
No. Barrels = 1 1 0 0
Invert El. (ft) = 612.25 612.50 0.00 0.00
Length (ft) = 1280.00 0.00 0.00 0.00
Slope (%) = 1.00 0.00 0.00 n/a
N-Value = .013 .013 .013 n/a
Orifice Coeff. = 0.60 0.60 0.60 0.60
Multi-Stage = n/a Yes No No
Crest Len (ft) = 5.76 0.00 0.00 0.00
Crest El. (ft) = 616.20 0.00 0.00 0.00
Weir Coeff. = 3.33 3.33 3.33 3.33
Weir Type = Rect --- --- ---
Multi-Stage = Yes No No No
Exfil.(in/hr) = 0.000 (by Wet area)
TW Elev. (ft) = 0.00
Note: Culvert/Orifice outflows are analyzed under inlet (ic) and outlet (oc) control. Weir risers checked for orifice conditions (ic) and submergence (s).
0.00 2.00 4.00 6.00 8.00 10.00 12.00 14.00 16.00
Stage (ft)
0.00 612.25
1.00 613.25
2.00 614.25
3.00 615.25
4.00 616.25
5.00 617.25
Elev (ft)
Discharge (cfs)
Stage / Discharge
Total Q Culv A Culv B
Weir A
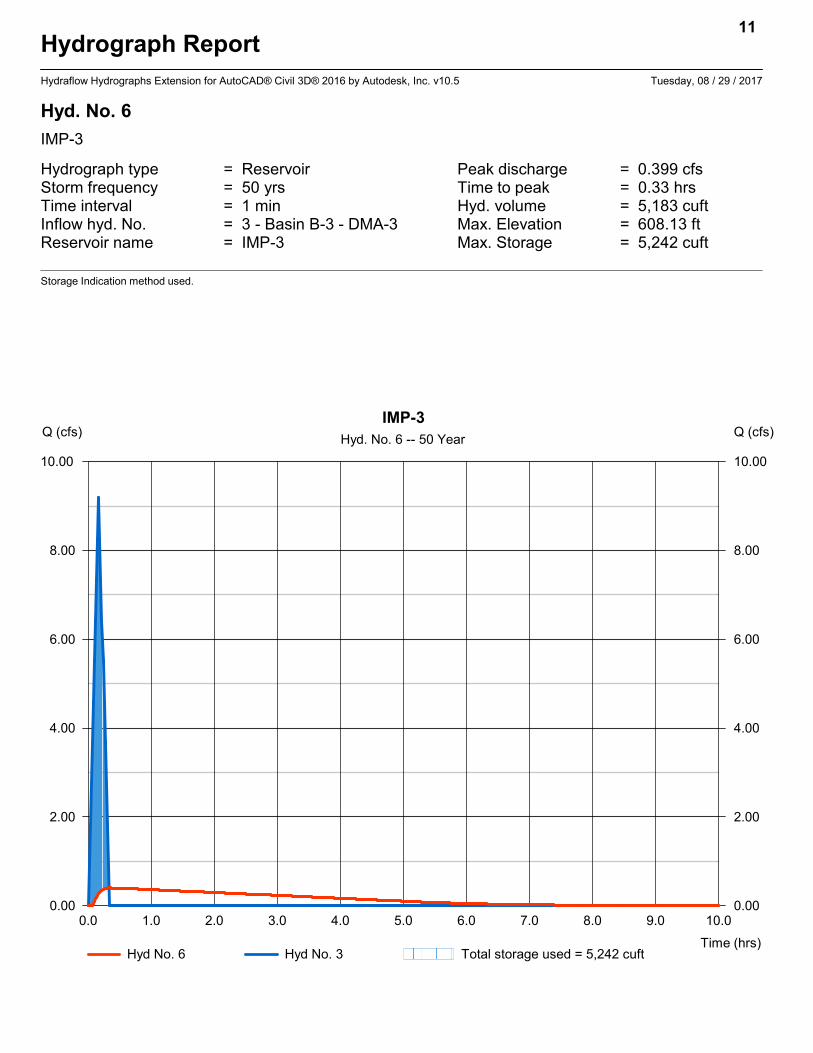
Hydrograph Report
Hydraflow Hydrographs Extension for AutoCAD® Civil 3D® 2016 by Autodesk, Inc. v10.5 Tuesday, 08 / 29 / 2017
Hyd. No. 6
IMP-3
Hydrograph type = Reservoir Peak discharge = 0.399 cfsStorm frequency = 50 yrs Time to peak = 0.33 hrsTime interval = 1 min Hyd. volume = 5,183 cuftInflow hyd. No. = 3 - Basin B-3 - DMA-3 Max. Elevation = 608.13 ftReservoir name = IMP-3 Max. Storage = 5,242 cuft
Storage Indication method used.
11
0.0 1.0 2.0 3.0 4.0 5.0 6.0 7.0 8.0 9.0 10.0
Q (cfs)
0.00 0.00
2.00 2.00
4.00 4.00
6.00 6.00
8.00 8.00
10.00 10.00
Q (cfs)
Time (hrs)
IMP-3
Hyd. No. 6 -- 50 Year
Hyd No. 6 Hyd No. 3 Total storage used = 5,242 cuft
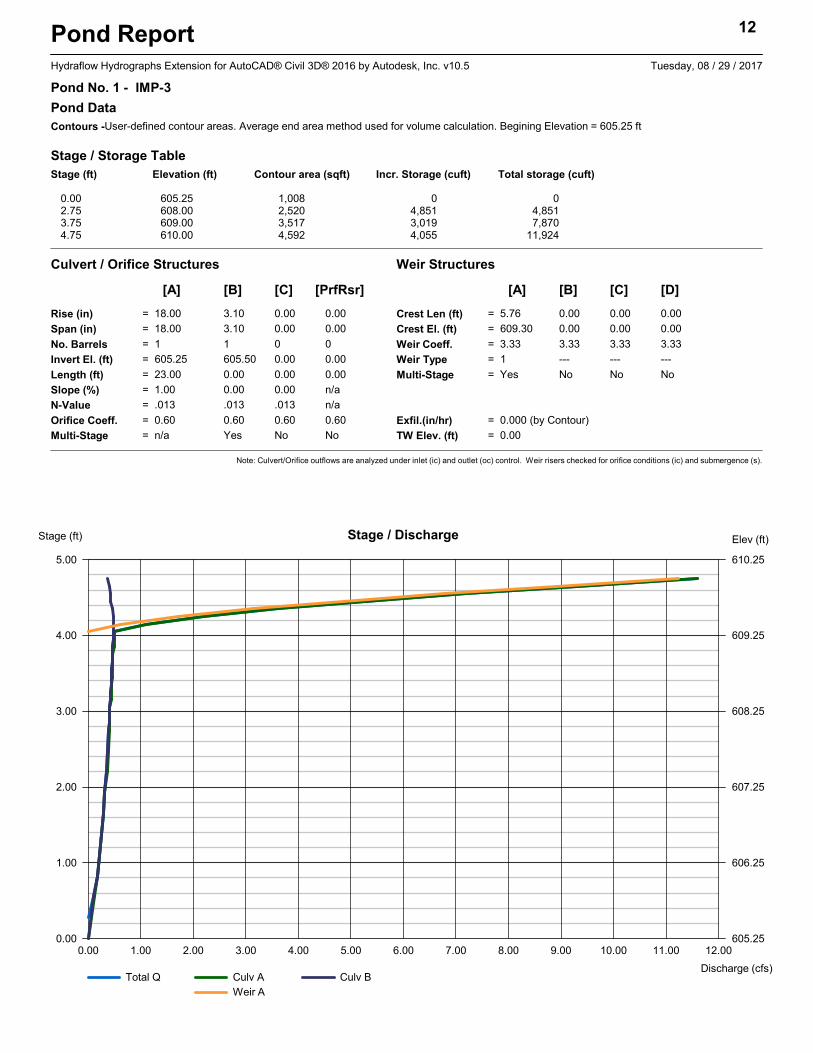
Pond Report 12
Hydraflow Hydrographs Extension for AutoCAD® Civil 3D® 2016 by Autodesk, Inc. v10.5 Tuesday, 08 / 29 / 2017
Pond No. 1 - IMP-3
Pond Data
Contours -User-defined contour areas. Average end area method used for volume calculation. Begining Elevation = 605.25 ft
Stage / Storage Table
Stage (ft) Elevation (ft) Contour area (sqft) Incr. Storage (cuft) Total storage (cuft)
0.00 605.25 1,008 0 02.75 608.00 2,520 4,851 4,8513.75 609.00 3,517 3,019 7,8704.75 610.00 4,592 4,055 11,924
Culvert / Orifice Structures Weir Structures
[A] [B] [C] [PrfRsr] [A] [B] [C] [D]
Rise (in) = 18.00 3.10 0.00 0.00
Span (in) = 18.00 3.10 0.00 0.00
No. Barrels = 1 1 0 0
Invert El. (ft) = 605.25 605.50 0.00 0.00
Length (ft) = 23.00 0.00 0.00 0.00
Slope (%) = 1.00 0.00 0.00 n/a
N-Value = .013 .013 .013 n/a
Orifice Coeff. = 0.60 0.60 0.60 0.60
Multi-Stage = n/a Yes No No
Crest Len (ft) = 5.76 0.00 0.00 0.00
Crest El. (ft) = 609.30 0.00 0.00 0.00
Weir Coeff. = 3.33 3.33 3.33 3.33
Weir Type = 1 --- --- ---
Multi-Stage = Yes No No No
Exfil.(in/hr) = 0.000 (by Contour)
TW Elev. (ft) = 0.00
Note: Culvert/Orifice outflows are analyzed under inlet (ic) and outlet (oc) control. Weir risers checked for orifice conditions (ic) and submergence (s).
0.00 1.00 2.00 3.00 4.00 5.00 6.00 7.00 8.00 9.00 10.00 11.00 12.00
Stage (ft)
0.00 605.25
1.00 606.25
2.00 607.25
3.00 608.25
4.00 609.25
5.00 610.25
Elev (ft)
Discharge (cfs)
Stage / Discharge
Total Q Culv A Culv B
Weir A
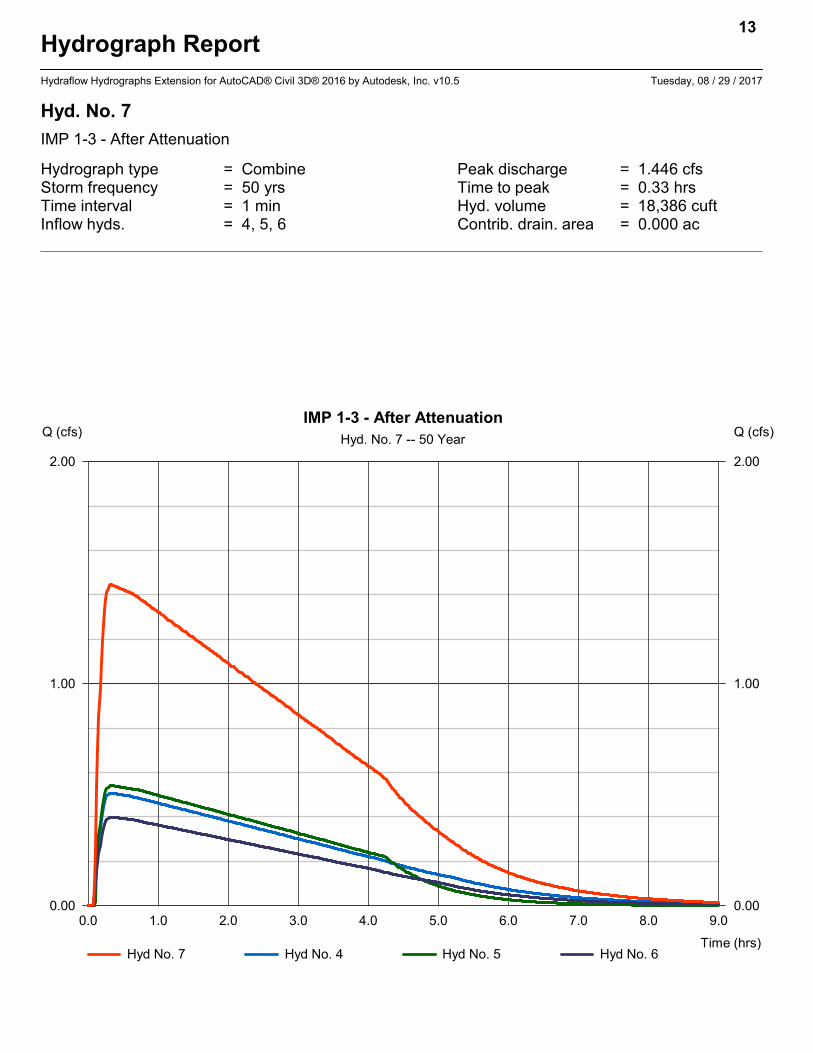
Hydrograph Report
Hydraflow Hydrographs Extension for AutoCAD® Civil 3D® 2016 by Autodesk, Inc. v10.5 Tuesday, 08 / 29 / 2017
Hyd. No. 7
IMP 1-3 - After Attenuation
Hydrograph type = Combine Peak discharge = 1.446 cfsStorm frequency = 50 yrs Time to peak = 0.33 hrsTime interval = 1 min Hyd. volume = 18,386 cuftInflow hyds. = 4, 5, 6 Contrib. drain. area = 0.000 ac
13
0.0 1.0 2.0 3.0 4.0 5.0 6.0 7.0 8.0 9.0
Q (cfs)
0.00 0.00
1.00 1.00
2.00 2.00
Q (cfs)
Time (hrs)
IMP 1-3 - After Attenuation
Hyd. No. 7 -- 50 Year
Hyd No. 7 Hyd No. 4 Hyd No. 5 Hyd No. 6
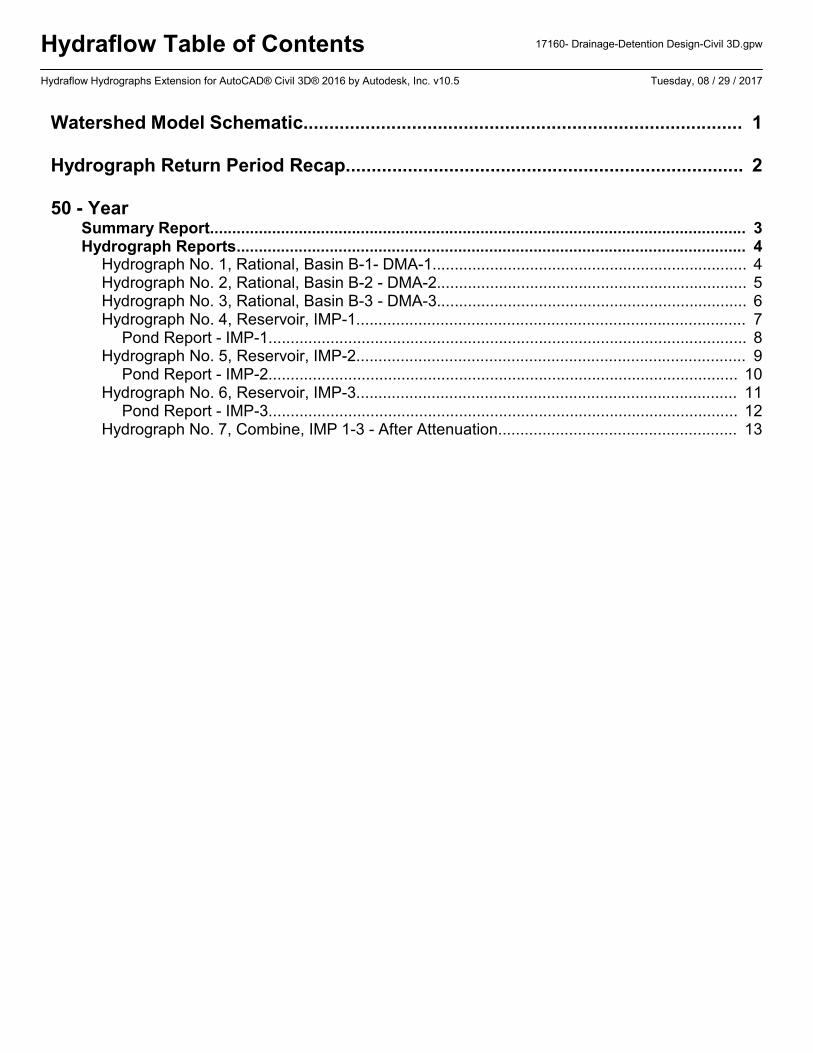
Hydraflow Table of Contents 17160- Drainage-Detention Design-Civil 3D.gpw
Hydraflow Hydrographs Extension for AutoCAD® Civil 3D® 2016 by Autodesk, Inc. v10.5 Tuesday, 08 / 29 / 2017
Watershed Model Schematic..................................................................................... 1
Hydrograph Return Period Recap............................................................................. 2
50 - YearSummary Report......................................................................................................................... 3Hydrograph Reports................................................................................................................... 4
Hydrograph No. 1, Rational, Basin B-1- DMA-1....................................................................... 4Hydrograph No. 2, Rational, Basin B-2 - DMA-2...................................................................... 5Hydrograph No. 3, Rational, Basin B-3 - DMA-3...................................................................... 6Hydrograph No. 4, Reservoir, IMP-1........................................................................................ 7
Pond Report - IMP-1............................................................................................................ 8Hydrograph No. 5, Reservoir, IMP-2........................................................................................ 9
Pond Report - IMP-2.......................................................................................................... 10Hydrograph No. 6, Reservoir, IMP-3...................................................................................... 11
Pond Report - IMP-3.......................................................................................................... 12Hydrograph No. 7, Combine, IMP 1-3 - After Attenuation...................................................... 13

I:\17\17160\PROD\Reports\Hydrology\17160-
Hydrology.doc
APPENDIX E
NRCS HYDROLOGIC SOILS GROUP DATA
I:\17\17160\PROD\Reports\Hydrology\17160-
Hydrology.doc
I:\17\17160\PROD\Reports\Hydrology\17160-
Hydrology.doc
I:\17\17160\PROD\Reports\Hydrology\17160-
Hydrology.doc
I:\17\17160\PROD\Reports\Hydrology\17160-
Hydrology.doc

I:\17\17160\PROD\Reports\Hydrology\17160-
Hydrology.doc
EXHIBIT A

I:\17\17160\PROD\Reports\Hydrology\17160-
Hydrology.doc
EXHIBIT B

I:\17\17160\PROD\Reports\Hydrology\17160-
Hydrology.doc
EXHIBIT C