Embed Size (px)
Citation preview
Final Energy Consumption and
Greenhouse Gas Emissions in Tokyo
(FY 2014)
March 2017
Bureau of Environment
Tokyo Metropolitan Government
Contents
1 Tokyo in the World .................................................................................................. 1
2 Final Energy Consumption ....................................................................................... 2
2.1 Concepts for Calculation ................................................................................................................ 2
2.2 Final Energy Consumption ............................................................................................................. 3
2.2.1 Entire Tokyo ........................................................................................................................... 3
2.2.2 Industrial Sector ...................................................................................................................... 6
2.2.3 Commercial Sector .................................................................................................................. 9
2.2.4 Residential Sector ................................................................................................................. 12
2.2.5 Transport Sector .................................................................................................................... 17
3 Total Greenhouse Gas Emissions ............................................................................. 20
3.1 Concepts for Calculation .............................................................................................................. 20
3.1.1 Basic Matters ........................................................................................................................ 20
3.1.2 Categorization of GHGs ........................................................................................................ 20
3.1.3 CO2 Emission Factor for Electricity ........................................................................................ 21
3.1.4 Scope of Calculation.............................................................................................................. 21
3.2 Total Greenhouse Gas Emissions .................................................................................................. 22
3.2.1 Entire Tokyo ......................................................................................................................... 22
3.3 CO2 Emissions (Variable Cases) ................................................................................................... 24
3.3.1 Entire Tokyo ......................................................................................................................... 24
3.4 CO2 Emissions (Fixed Cases) ....................................................................................................... 28
3.4.1 Entire Tokyo ......................................................................................................................... 28
3.4.2 [Reference] Trends in Each Sector .......................................................................................... 31
3.5 Other GHG Emissions ................................................................................................................. 33
3.5.1 Overview .............................................................................................................................. 33
3.5.2 CH4 ...................................................................................................................................... 35
3.5.3 N2O ..................................................................................................................................... 35
3.5.4 HFCs and Three Other Types ................................................................................................. 36
4 Reference Materials ............................................................................................... 37
[Material 1] Calculation Methods for Final Energy Consumption and GHG Emissions (Overview) ......... 37
[Material 2] Trends in Final Energy Consumption in Tokyo and Gross Domestic Product(GDP) in Tokyo ...... 40
[Material 3] Greenhouse Gas Reduction Target and Energy Reduction Target in Tokyo .......................... 41
5 Figures and Tables ................................................................................................. 42
Note: Values in this report have been rounded, and the sum of indicated values may not agree with the indicated total.
1 Tokyo in the World
1
9,135
5,176
2,020
1,468
1,189
723
568
556
555
507
476
437
437
431
408
374
320
307
286
279
250
244
232
221
148
143
97
96
87
68
66
61
45
45
43
40
38
37
35
35
China
USA
India
Russia
Japan
Germany
South Korea
Iran
Canada
Saudi Arabia
Brazil
South Africa
Indonesia
Mexico
UK
Australia
Italy
Turkey
France
Poland
Taiwan
Thailand
Spain
Malaysia
Netherlands
Vietnam
Czech
Philippines
Belgium
Romania
Greece
Austria
Singapore
Finland
Portugal
Hungary
Switzerland
Sweden
Norway
Denmark
Unit: M tons
1 Tokyo in the World
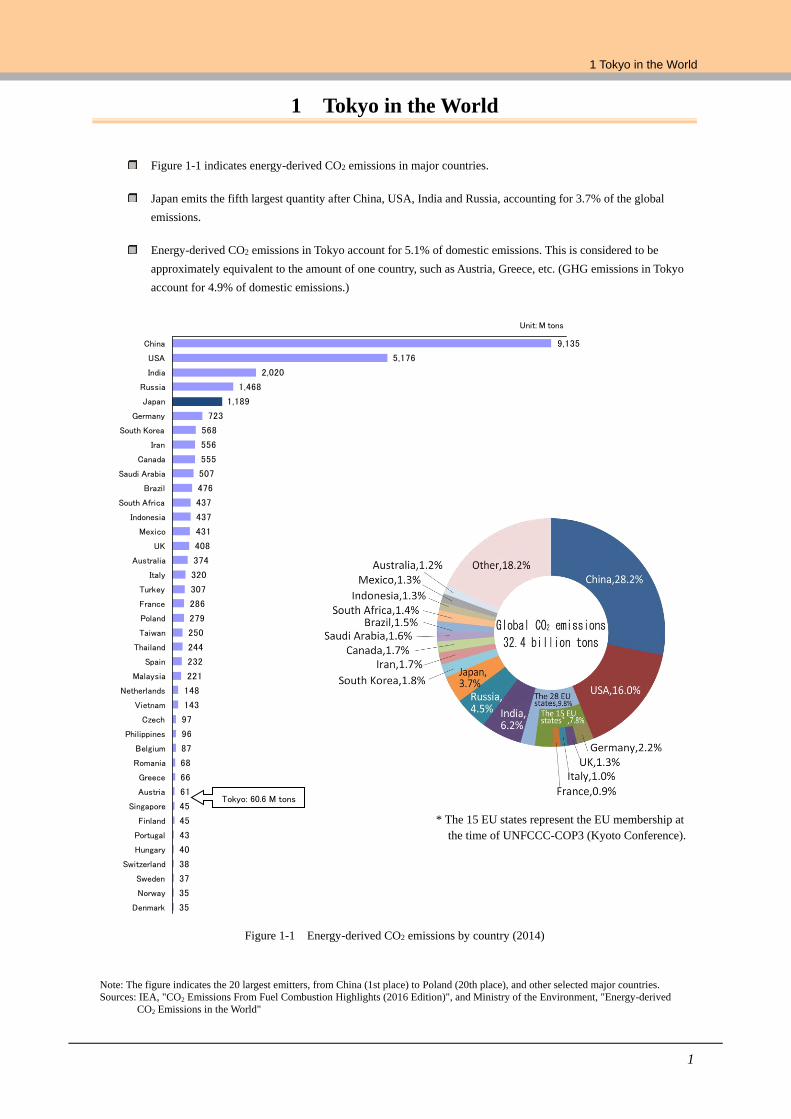
Figure 1-1 indicates energy-derived CO2 emissions in major countries.
Japan emits the fifth largest quantity after China, USA, India and Russia, accounting for 3.7% of the global
emissions.
Energy-derived CO2 emissions in Tokyo account for 5.1% of domestic emissions. This is considered to be
approximately equivalent to the amount of one country, such as Austria, Greece, etc. (GHG emissions in Tokyo
account for 4.9% of domestic emissions.)
Figure 1-1 Energy-derived CO2 emissions by country (2014)
Note: The figure indicates the 20 largest emitters, from China (1st place) to Poland (20th place), and other selected major countries.
Sources: IEA, "CO2 Emissions From Fuel Combustion Highlights (2016 Edition)", and Ministry of the Environment, "Energy-derived
CO2 Emissions in the World"
Tokyo: 60.6 M tons
* The 15 EU states represent the EU membership at
the time of UNFCCC-COP3 (Kyoto Conference).
Final Energy Consumption and Greenhouse Gas Emissions in Tokyo
2
2 Final Energy Consumption
2.1 Concepts for Calculation
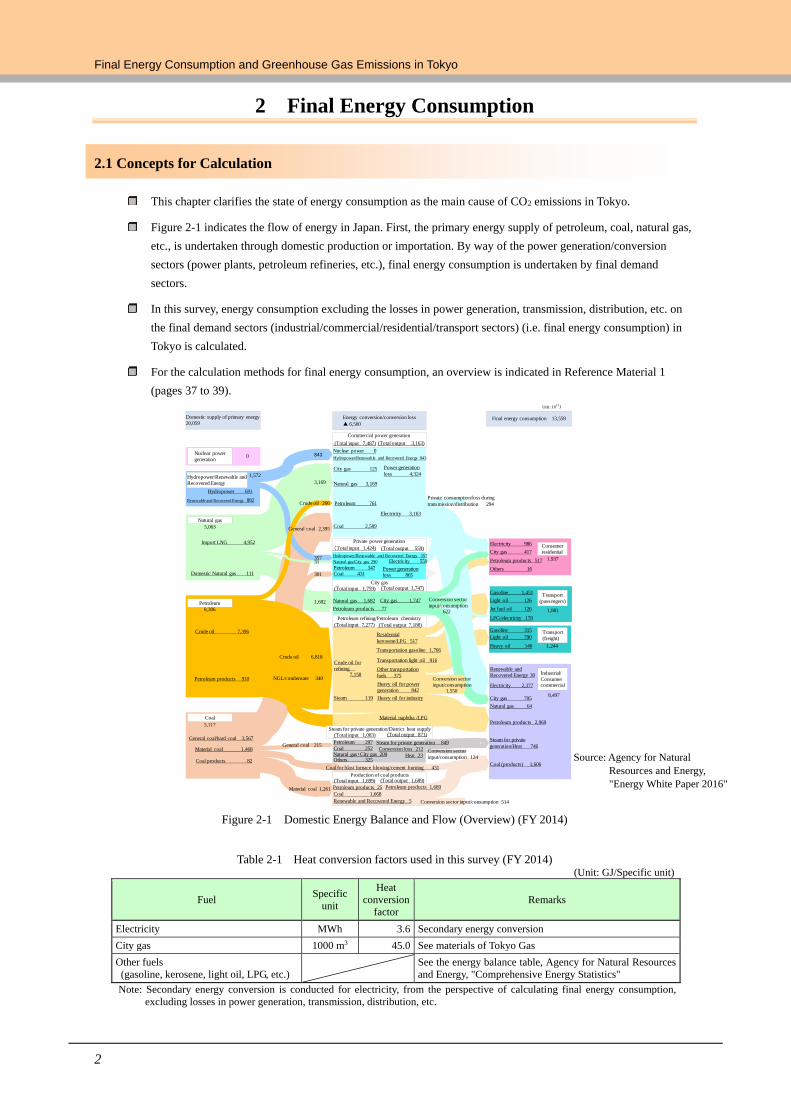
This chapter clarifies the state of energy consumption as the main cause of CO2 emissions in Tokyo.
Figure 2-1 indicates the flow of energy in Japan. First, the primary energy supply of petroleum, coal, natural gas,
etc., is undertaken through domestic production or importation. By way of the power generation/conversion
sectors (power plants, petroleum refineries, etc.), final energy consumption is undertaken by final demand
sectors.
In this survey, energy consumption excluding the losses in power generation, transmission, distribution, etc. on
the final demand sectors (industrial/commercial/residential/transport sectors) (i.e. final energy consumption) in
Tokyo is calculated.
For the calculation methods for final energy consumption, an overview is indicated in Reference Material 1
(pages 37 to 39).
Figure 2-1 Domestic Energy Balance and Flow (Overview) (FY 2014)
Table 2-1 Heat conversion factors used in this survey (FY 2014) (Unit: GJ/Specific unit)
Fuel Specific
unit
Heat
conversion
factor
Remarks
Electricity MWh 3.6 Secondary energy conversion
City gas 1000 m3 45.0 See materials of Tokyo Gas
Other fuels
(gasoline, kerosene, light oil, LPG, etc.)
See the energy balance table, Agency for Natural Resources
and Energy, "Comprehensive Energy Statistics"
Note: Secondary energy conversion is conducted for electricity, from the perspective of calculating final energy consumption,
excluding losses in power generation, transmission, distribution, etc.
Unit:1015
J
Domestic supply of primary energy
20,059
Nuclear power
generation
Hydropower/Renewable and
Recovered Energy
0
1,572
Natural gas
5,063
Petroleum
8,306
Coal
5,117
Crude oil 7,396
357
301
Crude oil 6,818
General coal 215
Energy conversion/conversion loss
▲ 6,500
Coal for blast furnace blowing/cement burning 431
Petroleum products 25
Coal 1,668
Renewable and Recovered Energy 5
Final energy consumption 13,558
Private consumption/loss during
transmission/distribution 294
Electricity 986
1,937
City gas 417
Petroleum products 517
Others 16
Consumer
residential
Gasoline 1,451
1,881
Light oil 126
Jet fuel oil 126
LPG/electricity 178
Transport
(passengers)
Gasoline 315
1,244
Light oil 790
Heavy oil 140
Transport
(freight)
8,497
Industrial/
Consumer commercial
Renewable and
Recovered Energy 30
Electricity 2,377
City gas 705
Natural gas 64
Petroleum products 2,969
Steam for private
generation/Heat 746
Coal (products) 1,606
Production of coal products
Petroleum products 1,689
Conversion sector
input/consumption 124
Conversion sector input/consumption 514
Nuclear power 0
Hydropower/Renewable and Recovered Energy 843
City gas 125
Natural gas 3,169
Petroleum 761
Coal 2,589
Commercial power generation
Power generation
loss 4,324
Electricity 3,163
Hydropower/Renewable and Recovered Energy 357
Natural gas/City gas 290
Petroleum 347 Coal 431
Electricity 559
Power generation
loss 865
Private power generation
Natural gas 1,682
Petroleum products 77
City gas
City gas 1,747
Crude oil for
refining7,158
Steam 119
Residential
kerosene/LPG 517
Transportation gasoline 1,766
Transportation light oil 916
Other transportation
fuels 375
Heavy oil for industry
Steam for private generation/District heat supply
Steam for private generation 849
Heat 23
Conversion loss 212
Hydropower 691
Renewable and Recovered Energy 882
Import LNG 4,952
Domestic Natural gas 111
Material naphtha /LPG
Petroleum 297
Coal 252Natural gas・City gas 209 Others 325
(Total input 7,487) (Total output 3,163)
(Total input 1,424) (Total output 559)
(Total input 1,759) (Total output 1,747)
(Total input 1,083) (Total output 871)
(Total input 1,699) (Total output 1,689)
Petroleum refining/Petroleum chemistry
(Total input 7,277) (Total output 7,188)
843
3,169
NGL/condensate 340 Conversion sector
input/consumption1,550
Material coal 1,261
1,682
Crude oil 266
31
Material coal 1,468
Coal products 82
Heavy oil for power
generation 842
Petroleum products 910
Conversion sector
input/consumption 622
General coal/hard coal 3,567
General coal 2,395
Source: Agency for Natural
Resources and Energy,
"Energy White Paper 2016"
2.Final Energy Consumption
3
2.2 Final Energy Consumption
2.2.1 Entire Tokyo
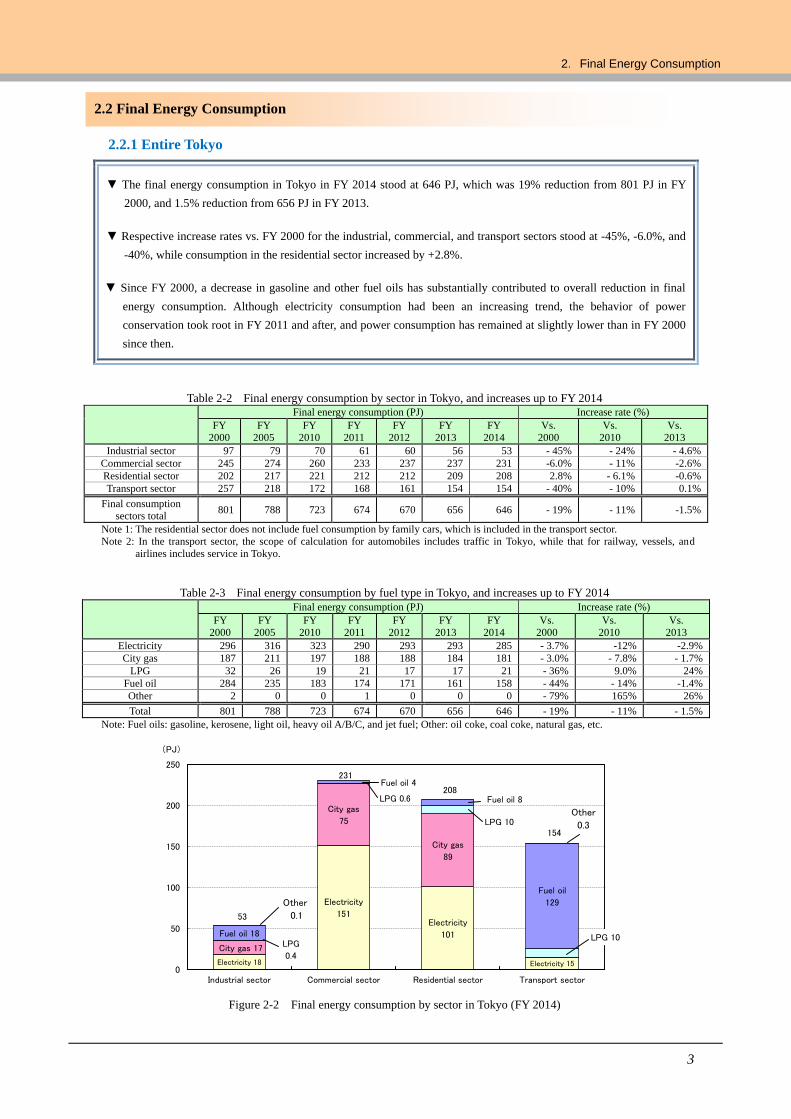
▼ The final energy consumption in Tokyo in FY 2014 stood at 646 PJ, which was 19% reduction from 801 PJ in FY
2000, and 1.5% reduction from 656 PJ in FY 2013.
▼ Respective increase rates vs. FY 2000 for the industrial, commercial, and transport sectors stood at -45%, -6.0%, and
-40%, while consumption in the residential sector increased by +2.8%.
▼ Since FY 2000, a decrease in gasoline and other fuel oils has substantially contributed to overall reduction in final
energy consumption. Although electricity consumption had been an increasing trend, the behavior of power
conservation took root in FY 2011 and after, and power consumption has remained at slightly lower than in FY 2000
since then.
Table 2-2 Final energy consumption by sector in Tokyo, and increases up to FY 2014 Final energy consumption (PJ) Increase rate (%)
FY
2000
FY
2005
FY
2010
FY
2011
FY
2012
FY
2013
FY
2014
Vs.
2000
Vs.
2010
Vs.
2013
Industrial sector 97 79 70 61 60 56 53 - 45% - 24% - 4.6%
Commercial sector 245 274 260 233 237 237 231 -6.0% - 11% -2.6%
Residential sector 202 217 221 212 212 209 208 2.8% - 6.1% -0.6%
Transport sector 257 218 172 168 161 154 154 - 40% - 10% 0.1%
Final consumption
sectors total 801 788 723 674 670 656 646 - 19% - 11% -1.5%
Note 1: The residential sector does not include fuel consumption by family cars, which is included in the transport sector.
Note 2: In the transport sector, the scope of calculation for automobiles includes traffic in Tokyo, while that for railway, vessels, and
airlines includes service in Tokyo.
Table 2-3 Final energy consumption by fuel type in Tokyo, and increases up to FY 2014
Final energy consumption (PJ) Increase rate (%)
FY
2000
FY
2005
FY
2010
FY
2011
FY
2012
FY
2013
FY
2014
Vs.
2000
Vs.
2010
Vs.
2013
Electricity 296 316 323 290 293 293 285 - 3.7% -12% -2.9%
City gas 187 211 197 188 188 184 181 - 3.0% - 7.8% - 1.7%
LPG 32 26 19 21 17 17 21 - 36% 9.0% 24%
Fuel oil 284 235 183 174 171 161 158 - 44% - 14% -1.4%
Other 2 0 0 1 0 0 0 - 79% 165% 26%
Total 801 788 723 674 670 656 646 - 19% - 11% - 1.5%
Note: Fuel oils: gasoline, kerosene, light oil, heavy oil A/B/C, and jet fuel; Other: oil coke, coal coke, natural gas, etc.
Figure 2-2 Final energy consumption by sector in Tokyo (FY 2014)
Electricity 18
Electricity
151Electricity
101
Electricity 15
City gas 17
City gas
75
City gas
89
LPG 0.6
LPG 10
LPG 10Fuel oil 18
Fuel oil 4
Fuel oil 8
Fuel oil
129Other
0.1
Other
0.3
53
231
208
154
0
50
100
150
200
250
Industrial sector Commercial sector Residential sector Transport sector
(PJ)
LPG
0.4
Final Energy Consumption and Greenhouse Gas Emissions in Tokyo
4
2.2.1-1 Final Energy Consumption by Sector in Entire Tokyo
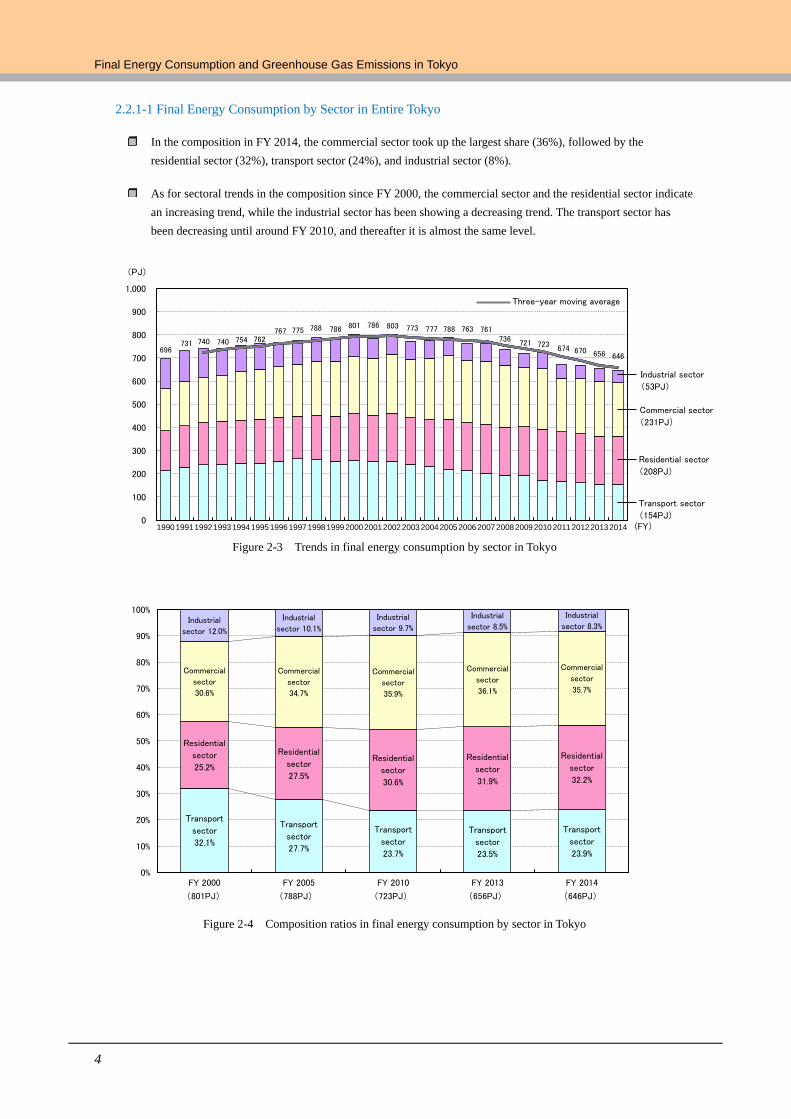
In the composition in FY 2014, the commercial sector took up the largest share (36%), followed by the
residential sector (32%), transport sector (24%), and industrial sector (8%).
As for sectoral trends in the composition since FY 2000, the commercial sector and the residential sector indicate
an increasing trend, while the industrial sector has been showing a decreasing trend. The transport sector has
been decreasing until around FY 2010, and thereafter it is almost the same level.
Figure 2-3 Trends in final energy consumption by sector in Tokyo
Figure 2-4 Composition ratios in final energy consumption by sector in Tokyo
Transport
sector
32.1%
Transport
sector
27.7%
Transport
sector
23.7%
Transport
sector
23.5%
Transport
sector
23.9%
Residential
sector
25.2%
Residential
sector
27.5%
Residential
sector
30.6%
Residential
sector
31.9%
Residential
sector
32.2%
Commercial
sector
30.6%
Commercial
sector
34.7%
Commercial
sector
35.9%
Commercial
sector
36.1%
Commercial
sector
35.7%
Industrial
sector 12.0%
Industrial
sector 10.1%
Industrial
sector 9.7%
Industrial
sector 8.5%
Industrial
sector 8.3%
0%
10%
20%
30%
40%
50%
60%
70%
80%
90%
100%
FY 2000 FY 2005 FY 2010 FY 2013 FY 2014
(801PJ) (656PJ) (646PJ)(788PJ) (723PJ)
696 731 740 740 754 762
767 775 788 786 801 786 803 773 777 788 763 761 736 721 723
674 670 656 646
0
100
200
300
400
500
600
700
800
900
1,000
1990199119921993199419951996199719981999200020012002200320042005200620072008200920102011201220132014
(PJ)
(FY)
Transport sector
(154PJ)
Residential sector
(208PJ)
Commercial sector
(231PJ)
Industrial sector
(53PJ)
Three-year moving average
2.Final Energy Consumption
5
2.2.1-2 Final Energy Consumption by Fuel Type in Entire Tokyo
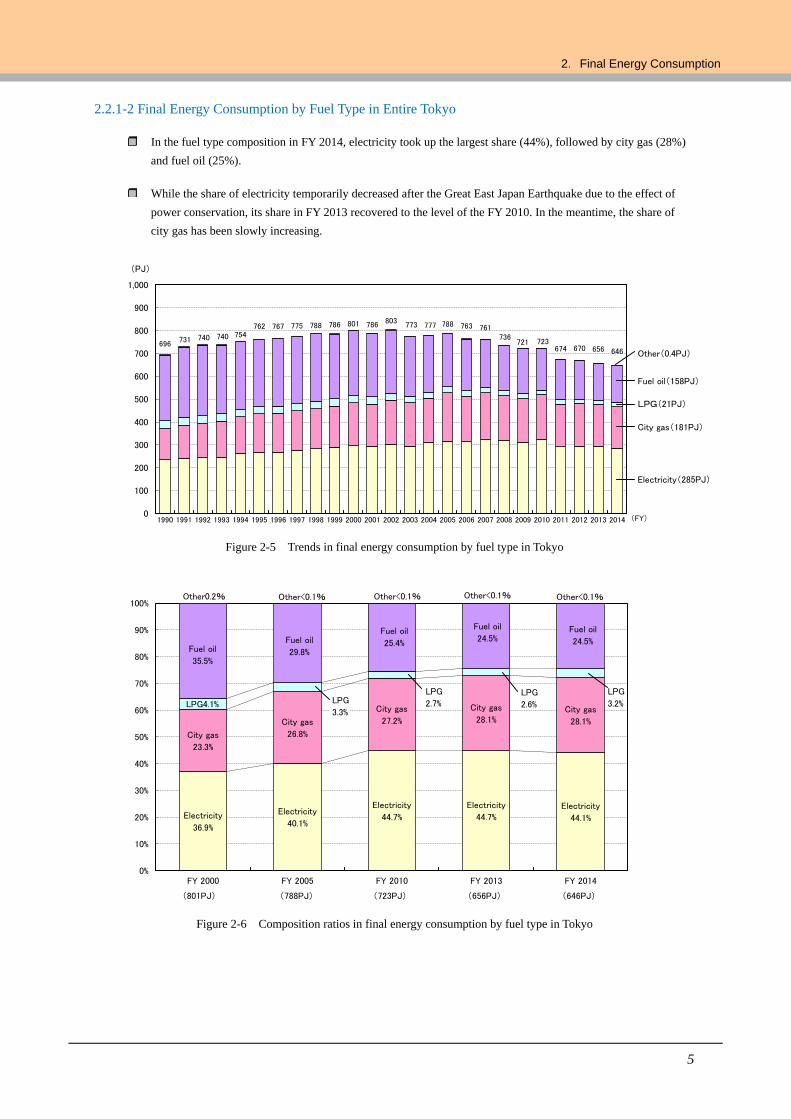
In the fuel type composition in FY 2014, electricity took up the largest share (44%), followed by city gas (28%)
and fuel oil (25%).
While the share of electricity temporarily decreased after the Great East Japan Earthquake due to the effect of
power conservation, its share in FY 2013 recovered to the level of the FY 2010. In the meantime, the share of
city gas has been slowly increasing.
Figure 2-5 Trends in final energy consumption by fuel type in Tokyo
Figure 2-6 Composition ratios in final energy consumption by fuel type in Tokyo
696 731 740 740 754
762 767 775 788 786 801 786 803 773 777 788 763 761
736 721 723
674 670 656 646
0
100
200
300
400
500
600
700
800
900
1,000
1990 1991 1992 1993 1994 1995 1996 1997 1998 1999 2000 2001 2002 2003 2004 2005 2006 2007 2008 2009 2010 2011 2012 2013 2014
(PJ)
(FY)
Other(0.4PJ)
Fuel oil(158PJ)
LPG(21PJ)
City gas(181PJ)
Electricity(285PJ)
Electricity
36.9%
Electricity
40.1%
Electricity
44.7%
Electricity
44.7%Electricity
44.1%
City gas
23.3%
City gas
26.8%
City gas
27.2%
City gas
28.1%City gas
28.1%
Fuel oil
35.5%
Fuel oil
29.8%
Fuel oil
25.4%
Fuel oil
24.5%Fuel oil
24.5%
0%
10%
20%
30%
40%
50%
60%
70%
80%
90%
100%
FY 2000 FY 2005 FY 2010 FY 2013 FY 2014
(801PJ) (656PJ) (646PJ)
LPG
3.2%
Other<0.1%
LPG4.1%
LPG
2.6%
Other<0.1%Other0.2%
(788PJ)
Other<0.1%
LPG
3.3%
LPG
2.7%
Other<0.1%
(723PJ)
Final Energy Consumption and Greenhouse Gas Emissions in Tokyo
6
2.2.2 Industrial Sector
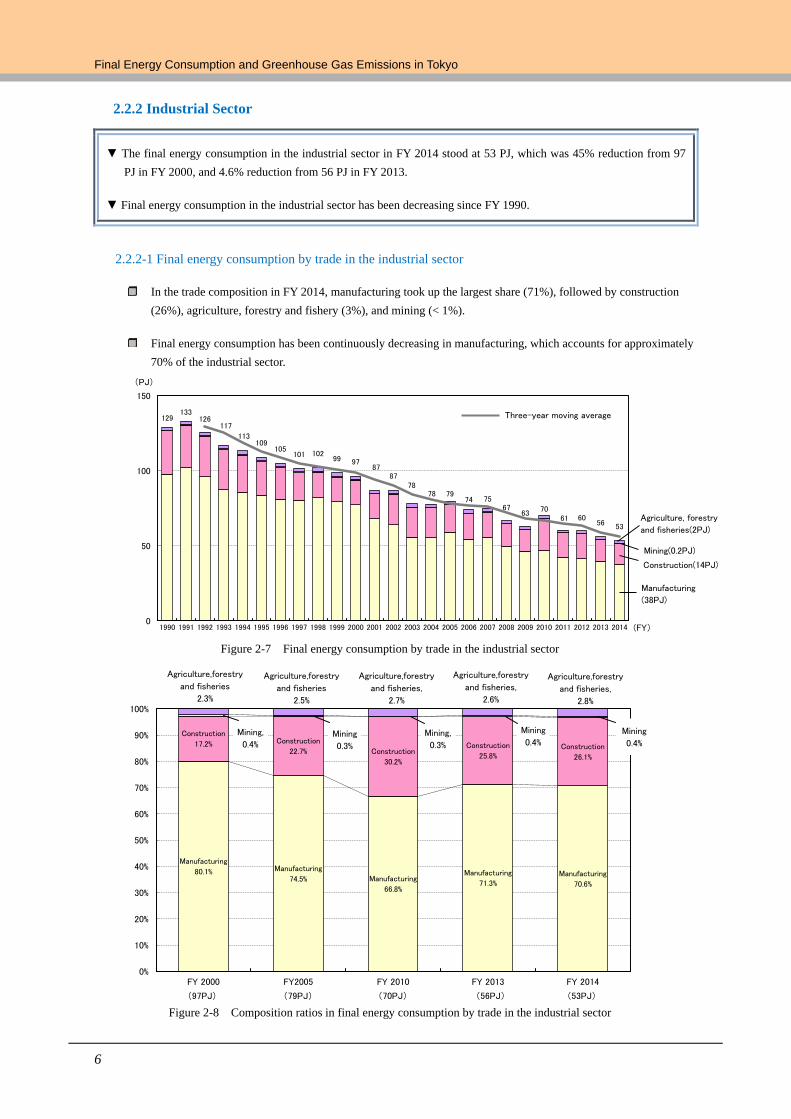
▼ The final energy consumption in the industrial sector in FY 2014 stood at 53 PJ, which was 45% reduction from 97
PJ in FY 2000, and 4.6% reduction from 56 PJ in FY 2013.
▼ Final energy consumption in the industrial sector has been decreasing since FY 1990.
2.2.2-1 Final energy consumption by trade in the industrial sector
In the trade composition in FY 2014, manufacturing took up the largest share (71%), followed by construction
(26%), agriculture, forestry and fishery (3%), and mining (< 1%).
Final energy consumption has been continuously decreasing in manufacturing, which accounts for approximately
70% of the industrial sector.
Figure 2-7 Final energy consumption by trade in the industrial sector
Figure 2-8 Composition ratios in final energy consumption by trade in the industrial sector
Manufacturing
80.1% Manufacturing
74.5% Manufacturing
66.8%
Manufacturing
71.3%Manufacturing
70.6%
Construction
17.2% Construction
22.7% Construction
30.2%
Construction
25.8%Construction
26.1%
Mining,
0.4%Mining
0.3%
Mining,
0.3%
Mining
0.4%Mining
0.4%
Agriculture,forestry
and fisheries
2.3%
Agriculture,forestry
and fisheries
2.5%
Agriculture,forestry
and fisheries,
2.7%
Agriculture,forestry
and fisheries,
2.6%
Agriculture,forestry
and fisheries,
2.8%
0%
10%
20%
30%
40%
50%
60%
70%
80%
90%
100%
FY 2000 FY2005 FY 2010 FY 2013 FY 2014
(97PJ) (56PJ) (53PJ)(79PJ) (70PJ)
Manufacturing
(38PJ)
Construction(14PJ)
Mining(0.2PJ)
Agriculture, forestry
and fisheries(2PJ)
129 133
126 117
113 109
105 101 102
99 97 87
87 78
78 79 74 75
67 63
70 61 60
56 53
0
50
100
150
1990 1991 1992 1993 1994 1995 1996 1997 1998 1999 2000 2001 2002 2003 2004 2005 2006 2007 2008 2009 2010 2011 2012 2013 2014
(PJ)
(FY)
Three-year moving average
2.Final Energy Consumption
7
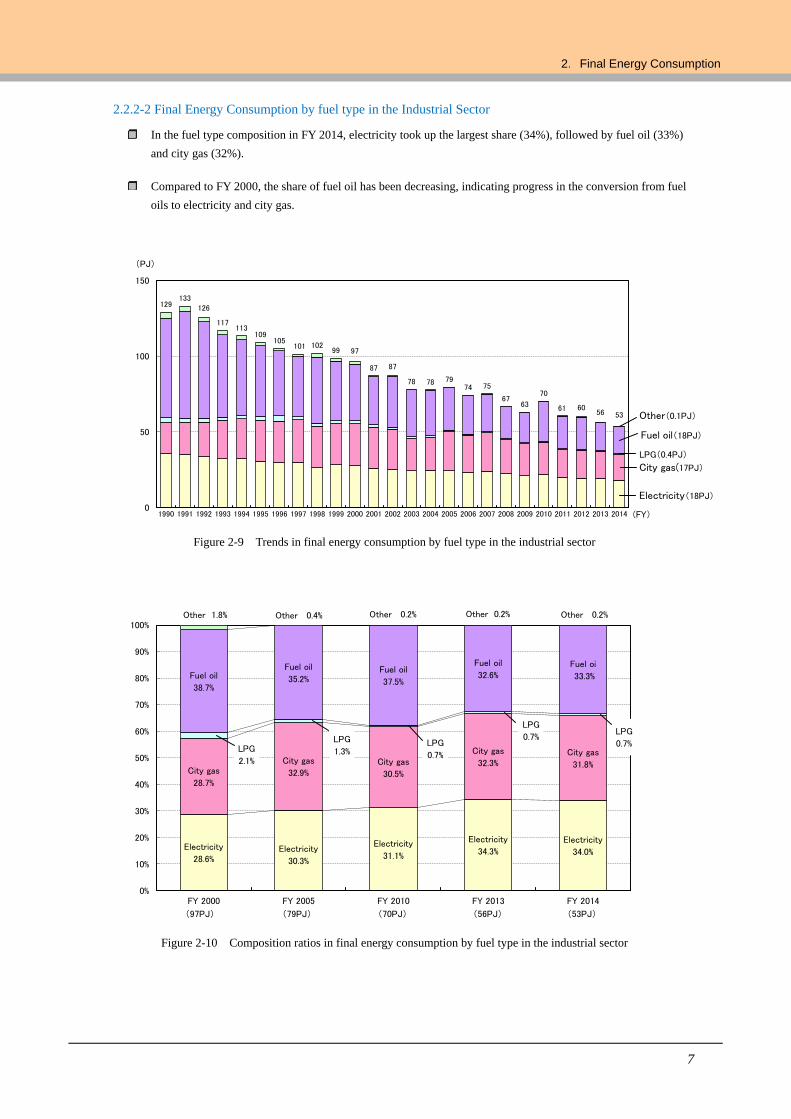
2.2.2-2 Final Energy Consumption by fuel type in the Industrial Sector
In the fuel type composition in FY 2014, electricity took up the largest share (34%), followed by fuel oil (33%)
and city gas (32%).
Compared to FY 2000, the share of fuel oil has been decreasing, indicating progress in the conversion from fuel
oils to electricity and city gas.
Figure 2-9 Trends in final energy consumption by fuel type in the industrial sector
Figure 2-10 Composition ratios in final energy consumption by fuel type in the industrial sector
129 133
126
117 113
109 105
101 102 99 97
87 87
78 78 79 74 75
67 63
70
61 60 56 53
0
50
100
150
1990 1991 1992 1993 1994 1995 1996 1997 1998 1999 2000 2001 2002 2003 2004 2005 2006 2007 2008 2009 2010 2011 2012 2013 2014
(PJ)
(FY)
Fuel oil(18PJ)
City gas(17PJ)
Electricity(18PJ)
LPG(0.4PJ)
Other(0.1PJ)
Electricity
28.6%Electricity
30.3%
Electricity
31.1%
Electricity
34.3%
Electricity
34.0%
City gas
28.7%
City gas
32.9%City gas
30.5%
City gas
32.3%City gas
31.8%
LPG
2.1%
LPG
1.3%LPG
0.7%
LPG
0.7%LPG
0.7%
Fuel oil
38.7%
Fuel oil
35.2%Fuel oil
37.5%
Fuel oil
32.6%Fuel oi
33.3%
Other 1.8% Other 0.4% Other 0.2%Other 0.2% Other 0.2%
0%
10%
20%
30%
40%
50%
60%
70%
80%
90%
100%
FY 2000 FY 2005 FY 2010 FY 2013 FY 2014
(97PJ) (56PJ) (53PJ)(79PJ) (70PJ)
Final Energy Consumption and Greenhouse Gas Emissions in Tokyo
8
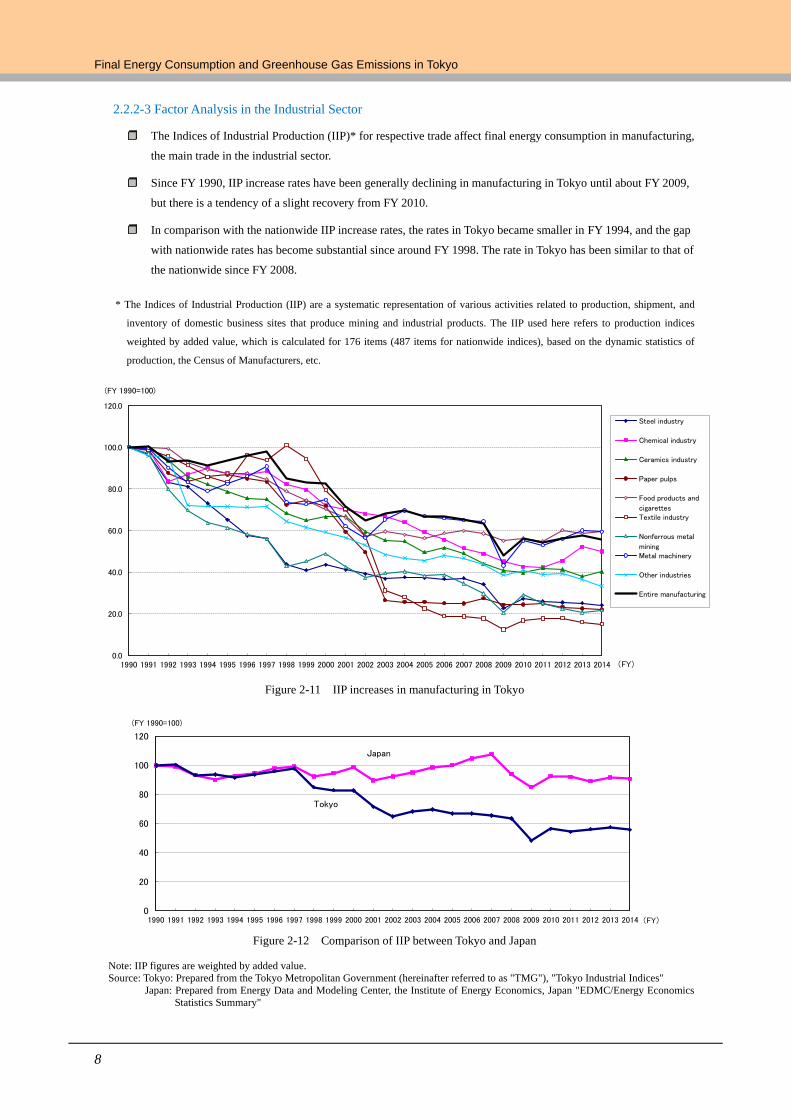
2.2.2-3 Factor Analysis in the Industrial Sector
The Indices of Industrial Production (IIP)* for respective trade affect final energy consumption in manufacturing,
the main trade in the industrial sector.
Since FY 1990, IIP increase rates have been generally declining in manufacturing in Tokyo until about FY 2009,
but there is a tendency of a slight recovery from FY 2010.
In comparison with the nationwide IIP increase rates, the rates in Tokyo became smaller in FY 1994, and the gap
with nationwide rates has become substantial since around FY 1998. The rate in Tokyo has been similar to that of
the nationwide since FY 2008.
* The Indices of Industrial Production (IIP) are a systematic representation of various activities related to production, shipment, and
inventory of domestic business sites that produce mining and industrial products. The IIP used here refers to production indices
weighted by added value, which is calculated for 176 items (487 items for nationwide indices), based on the dynamic statistics of
production, the Census of Manufacturers, etc.
Figure 2-11 IIP increases in manufacturing in Tokyo
Figure 2-12 Comparison of IIP between Tokyo and Japan
Note: IIP figures are weighted by added value.
Source: Tokyo: Prepared from the Tokyo Metropolitan Government (hereinafter referred to as "TMG"), "Tokyo Industrial Indices"
Japan: Prepared from Energy Data and Modeling Center, the Institute of Energy Economics, Japan "EDMC/Energy Economics
Statistics Summary"
Japan
Tokyo
0
20
40
60
80
100
120
1990 1991 1992 1993 1994 1995 1996 1997 1998 1999 2000 2001 2002 2003 2004 2005 2006 2007 2008 2009 2010 2011 2012 2013 2014
(FY 1990=100)
(FY)
0.0
20.0
40.0
60.0
80.0
100.0
120.0
1990 1991 1992 1993 1994 1995 1996 1997 1998 1999 2000 2001 2002 2003 2004 2005 2006 2007 2008 2009 2010 2011 2012 2013 2014 (FY)
Steel industry
Chemical industry
Ceramics industry
Paper pulps
Food products and
cigarettesTextile industry
Nonferrous metal
miningMetal machinery
Other industries
Entire manufacturing
(FY 1990=100)
2.Final Energy Consumption
9
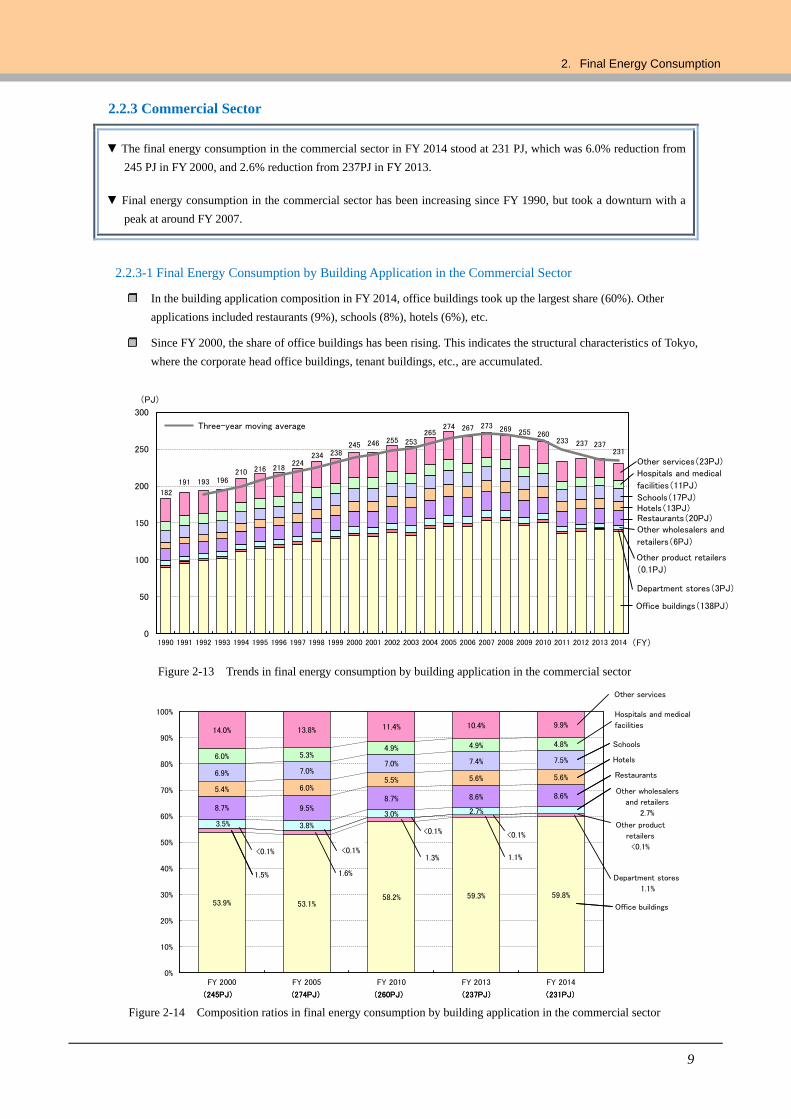
2.2.3 Commercial Sector
▼ The final energy consumption in the commercial sector in FY 2014 stood at 231 PJ, which was 6.0% reduction from
245 PJ in FY 2000, and 2.6% reduction from 237PJ in FY 2013.
▼ Final energy consumption in the commercial sector has been increasing since FY 1990, but took a downturn with a
peak at around FY 2007.
2.2.3-1 Final Energy Consumption by Building Application in the Commercial Sector
In the building application composition in FY 2014, office buildings took up the largest share (60%). Other
applications included restaurants (9%), schools (8%), hotels (6%), etc.
Since FY 2000, the share of office buildings has been rising. This indicates the structural characteristics of Tokyo,
where the corporate head office buildings, tenant buildings, etc., are accumulated.
Figure 2-13 Trends in final energy consumption by building application in the commercial sector
Figure 2-14 Composition ratios in final energy consumption by building application in the commercial sector
53.9% 53.1%58.2% 59.3% 59.8%
1.5% 1.6%
1.3% 1.1%
Department stores
1.1%
<0.1% <0.1%
<0.1%
Other wholesalers
and retailers
2.7%
<0.1%
3.5% 3.8%
3.0% 2.7%
Other product
retailers
<0.1%
8.7% 9.5%8.7% 8.6% 8.6%
5.4% 6.0%5.5% 5.6% 5.6%
6.9% 7.0%7.0% 7.4% 7.5%6.0% 5.3%4.9% 4.9% 4.8%
14.0% 13.8% 11.4% 10.4% 9.9%
0%
10%
20%
30%
40%
50%
60%
70%
80%
90%
100%
FY 2000 FY 2005 FY 2010 FY 2013 FY 2014
Hotels
Restaurants
Schools
Hospitals and medical
facilities
(245PJ) (260PJ) (231PJ)(274PJ) (237PJ)
Other services
(245PJ) (260PJ) (231PJ)(274PJ) (237PJ)
Office buildings
182
191 193 196210 216 218
224234 238
245 246 255 253265
274 267 273 269 255 260233 237 237
231
0
50
100
150
200
250
300
1990 1991 1992 1993 1994 1995 1996 1997 1998 1999 2000 2001 2002 2003 2004 2005 2006 2007 2008 2009 2010 2011 2012 2013 2014
(PJ)
(FY)
Other services(23PJ)
Hotels(13PJ)Restaurants(20PJ)Other wholesalers and
retailers(6PJ)
Other product retailers
(0.1PJ)
Department stores(3PJ)
Office buildings(138PJ)
Schools(17PJ)
Hospitals and medical
facilities(11PJ)
Three-year moving average
Final Energy Consumption and Greenhouse Gas Emissions in Tokyo
10
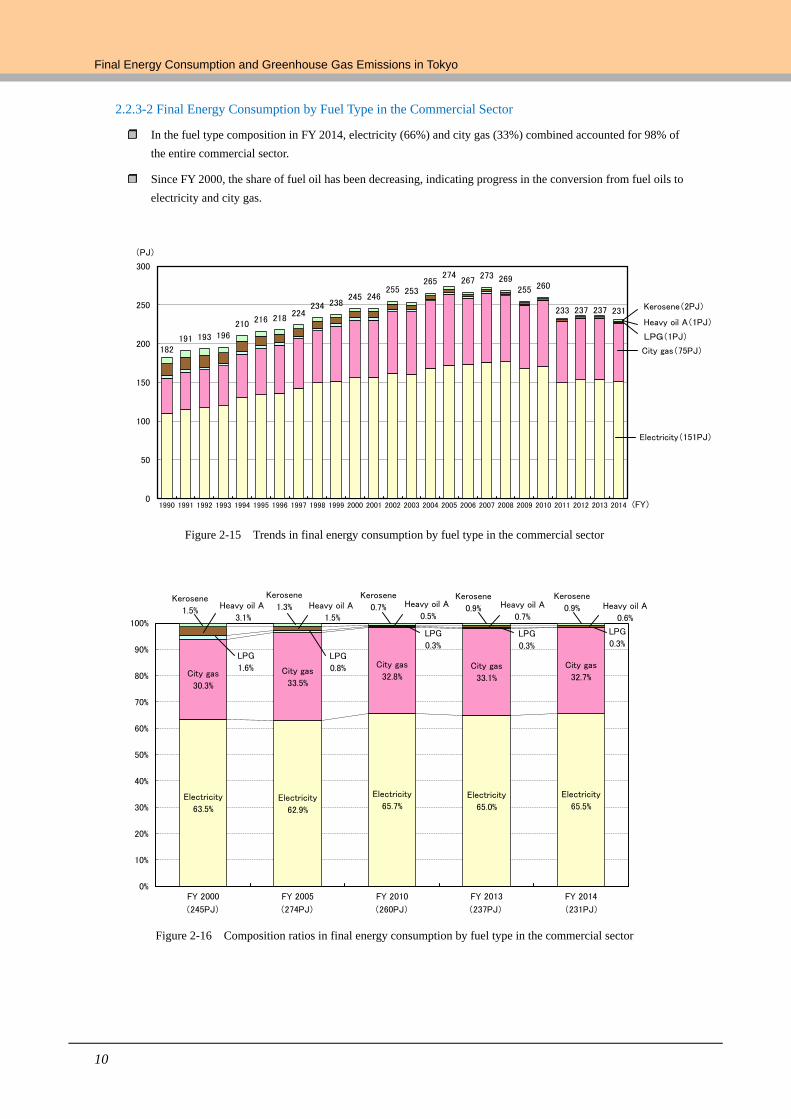
2.2.3-2 Final Energy Consumption by Fuel Type in the Commercial Sector
In the fuel type composition in FY 2014, electricity (66%) and city gas (33%) combined accounted for 98% of
the entire commercial sector.
Since FY 2000, the share of fuel oil has been decreasing, indicating progress in the conversion from fuel oils to
electricity and city gas.
Figure 2-15 Trends in final energy consumption by fuel type in the commercial sector
Figure 2-16 Composition ratios in final energy consumption by fuel type in the commercial sector
182191 193 196
210 216 218224
234 238245 246
255 253265
274267
273 269255 260
233 237 237 231
0
50
100
150
200
250
300
1990 1991 1992 1993 1994 1995 1996 1997 1998 1999 2000 2001 2002 2003 2004 2005 2006 2007 2008 2009 2010 2011 2012 2013 2014
(PJ)
(FY)
Kerosene(2PJ)
LPG(1PJ)
City gas(75PJ)
Electricity(151PJ)
Heavy oil A(1PJ)
Electricity
63.5%Electricity
62.9%
Electricity
65.7%Electricity
65.0%
Electricity
65.5%
City gas
30.3%
City gas
33.5%
City gas
32.8%City gas
33.1%
City gas
32.7%
LPG
1.6%
LPG
0.8%
LPG
0.3%
LPG
0.3%
LPG
0.3%
Heavy oil A
3.1%
Heavy oil A
1.5%
Heavy oil A
0.5%Heavy oil A
0.7%Heavy oil A
0.6%
Kerosene
1.5%
Kerosene
1.3%
Kerosene
0.7%Kerosene
0.9%
Kerosene
0.9%
0%
10%
20%
30%
40%
50%
60%
70%
80%
90%
100%
FY 2000 FY 2005 FY 2010 FY 2013 FY 2014
(245PJ) (237PJ) (231PJ)(274PJ) (260PJ)
2.Final Energy Consumption
11
2.2.3-3 Factor Analysis in the Commercial Sector
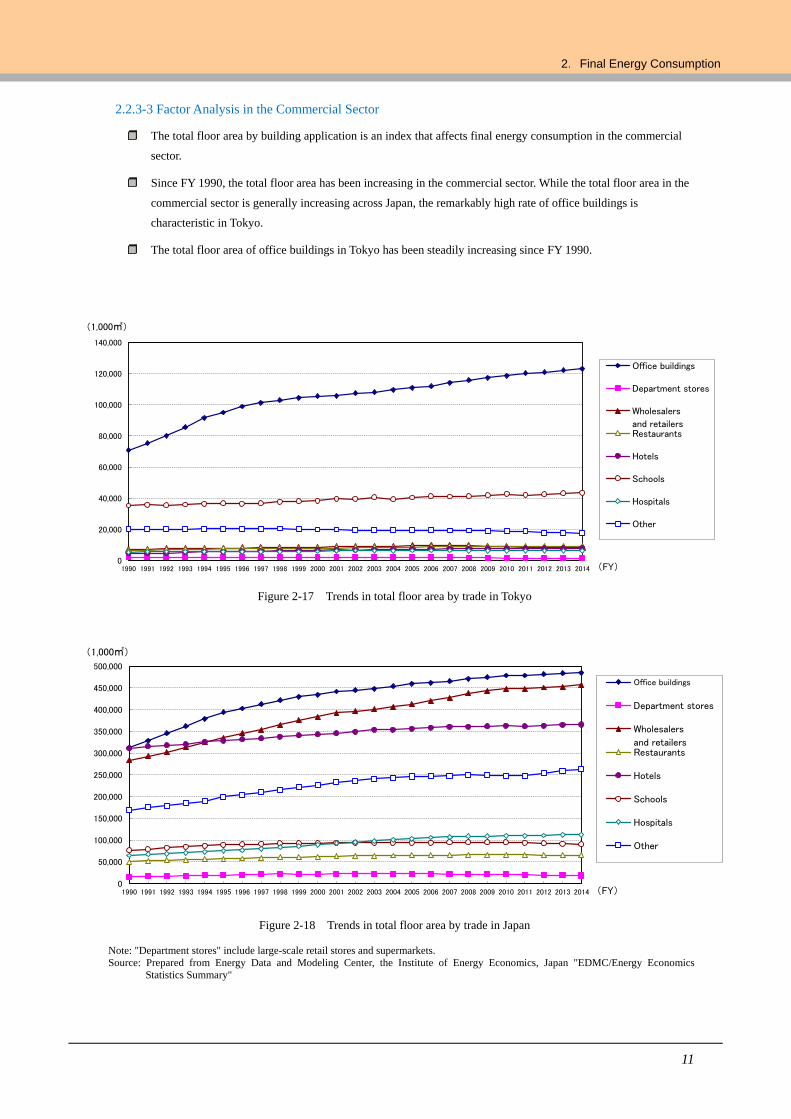
The total floor area by building application is an index that affects final energy consumption in the commercial
sector.
Since FY 1990, the total floor area has been increasing in the commercial sector. While the total floor area in the
commercial sector is generally increasing across Japan, the remarkably high rate of office buildings is
characteristic in Tokyo.
The total floor area of office buildings in Tokyo has been steadily increasing since FY 1990.
Figure 2-17 Trends in total floor area by trade in Tokyo
Figure 2-18 Trends in total floor area by trade in Japan
Note: "Department stores" include large-scale retail stores and supermarkets.
Source: Prepared from Energy Data and Modeling Center, the Institute of Energy Economics, Japan "EDMC/Energy Economics
Statistics Summary"
0
50,000
100,000
150,000
200,000
250,000
300,000
350,000
400,000
450,000
500,000
1990 1991 1992 1993 1994 1995 1996 1997 1998 1999 2000 2001 2002 2003 2004 2005 2006 2007 2008 2009 2010 2011 2012 2013 2014
(1,000㎡)
(FY)
Office buildings
Department stores
Wholesalers
and retailersRestaurants
Hotels
Schools
Hospitals
Other
0
20,000
40,000
60,000
80,000
100,000
120,000
140,000
1990 1991 1992 1993 1994 1995 1996 1997 1998 1999 2000 2001 2002 2003 2004 2005 2006 2007 2008 2009 2010 2011 2012 2013 2014
(1,000㎡)
(FY)
Office buildings
Department stores
Wholesalers
and retailersRestaurants
Hotels
Schools
Hospitals
Other
Final Energy Consumption and Greenhouse Gas Emissions in Tokyo
12
2.2.4 Residential Sector
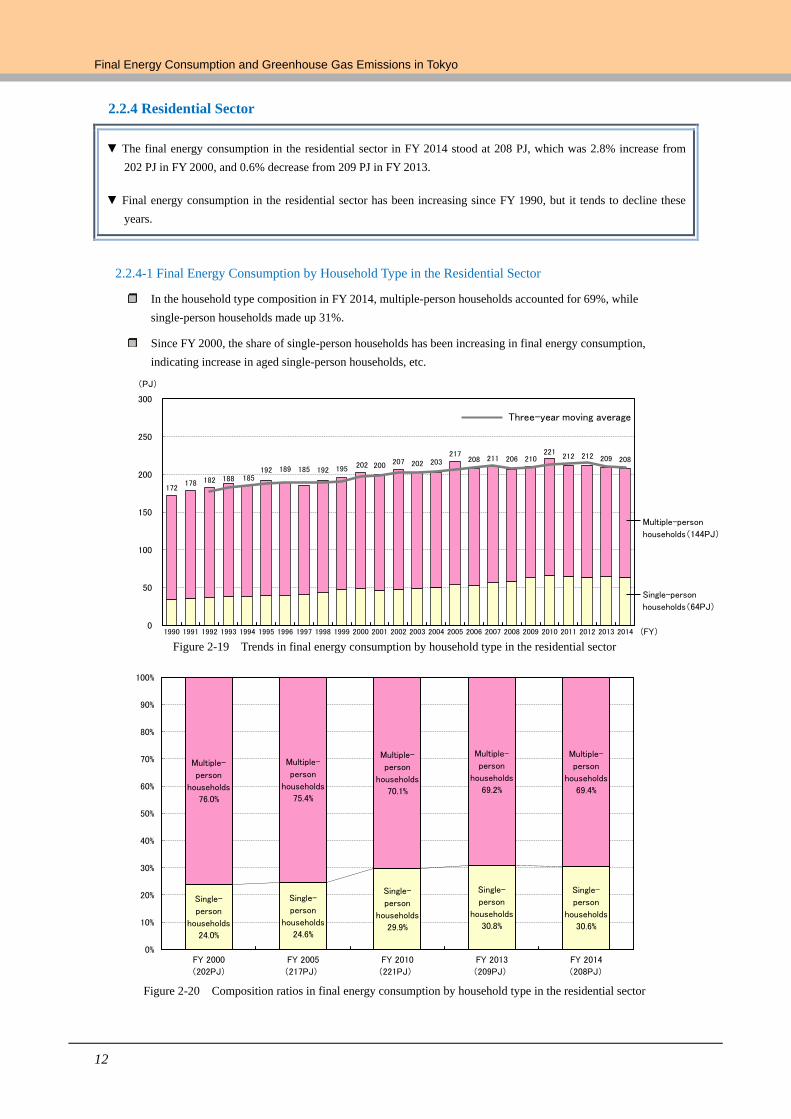
▼ The final energy consumption in the residential sector in FY 2014 stood at 208 PJ, which was 2.8% increase from
202 PJ in FY 2000, and 0.6% decrease from 209 PJ in FY 2013.
▼ Final energy consumption in the residential sector has been increasing since FY 1990, but it tends to decline these
years.
2.2.4-1 Final Energy Consumption by Household Type in the Residential Sector
In the household type composition in FY 2014, multiple-person households accounted for 69%, while
single-person households made up 31%.
Since FY 2000, the share of single-person households has been increasing in final energy consumption,
indicating increase in aged single-person households, etc.
Figure 2-19 Trends in final energy consumption by household type in the residential sector
Figure 2-20 Composition ratios in final energy consumption by household type in the residential sector
Single-
person
households
24.0%
Single-
person
households
24.6%
Single-
person
households
29.9%
Single-
person
households
30.8%
Single-
person
households
30.6%
Multiple-
person
households
76.0%
Multiple-
person
households
75.4%
Multiple-
person
households
70.1%
Multiple-
person
households
69.2%
Multiple-
person
households
69.4%
0%
10%
20%
30%
40%
50%
60%
70%
80%
90%
100%
FY 2000 FY 2005 FY 2010 FY 2013 FY 2014
(202PJ) (209PJ) (208PJ)(217PJ) (221PJ)
172178 182 188 185
192 189 185 192 195 202 200 207 202 203217
208 211 206 210221
212 212 209 208
0
50
100
150
200
250
300
1990 1991 1992 1993 1994 1995 1996 1997 1998 1999 2000 2001 2002 2003 2004 2005 2006 2007 2008 2009 2010 2011 2012 2013 2014
(PJ)
(FY)
Three-year moving average
Multiple-person
households(144PJ)
Single-person
households(64PJ)
2.Final Energy Consumption
13
2.2.4-2 Final Energy Consumption by Fuel Type in the Residential Sector
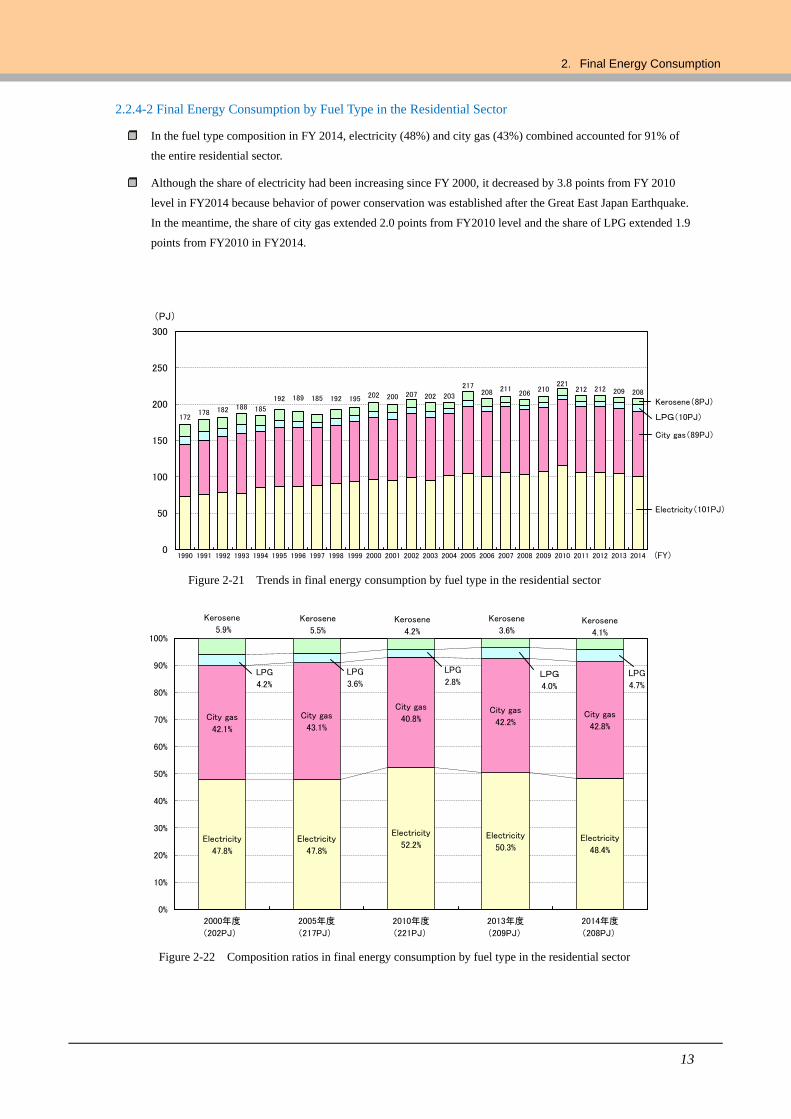
In the fuel type composition in FY 2014, electricity (48%) and city gas (43%) combined accounted for 91% of
the entire residential sector.
Although the share of electricity had been increasing since FY 2000, it decreased by 3.8 points from FY 2010
level in FY2014 because behavior of power conservation was established after the Great East Japan Earthquake.
In the meantime, the share of city gas extended 2.0 points from FY2010 level and the share of LPG extended 1.9
points from FY2010 in FY2014.
Figure 2-21 Trends in final energy consumption by fuel type in the residential sector
Figure 2-22 Composition ratios in final energy consumption by fuel type in the residential sector
Electricity
47.8%
Electricity
47.8%
Electricity
52.2%Electricity
50.3%Electricity
48.4%
City gas
42.1%
City gas
43.1%
City gas
40.8%City gas
42.2%City gas
42.8%
LPG
4.2%
LPG
3.6%
LPG
2.8%LPG
4.0%
LPG
4.7%
Kerosene
5.9%Kerosene
5.5%Kerosene
4.2%
Kerosene
3.6%Kerosene
4.1%
0%
10%
20%
30%
40%
50%
60%
70%
80%
90%
100%
2000年度 2005年度 2010年度 2013年度 2014年度
(202PJ) (209PJ) (208PJ)(217PJ) (221PJ)
172178 182 188 185
192 189 185 192 195 202 200 207 202 203
217208 211
206210
221212 212 209 208
0
50
100
150
200
250
300
1990 1991 1992 1993 1994 1995 1996 1997 1998 1999 2000 2001 2002 2003 2004 2005 2006 2007 2008 2009 2010 2011 2012 2013 2014
(PJ)
(FY)
Kerosene(8PJ)
LPG(10PJ)
City gas(89PJ)
Electricity(101PJ)
Final Energy Consumption and Greenhouse Gas Emissions in Tokyo
14
2.2.4-3 Factor Analysis in the Residential Sector
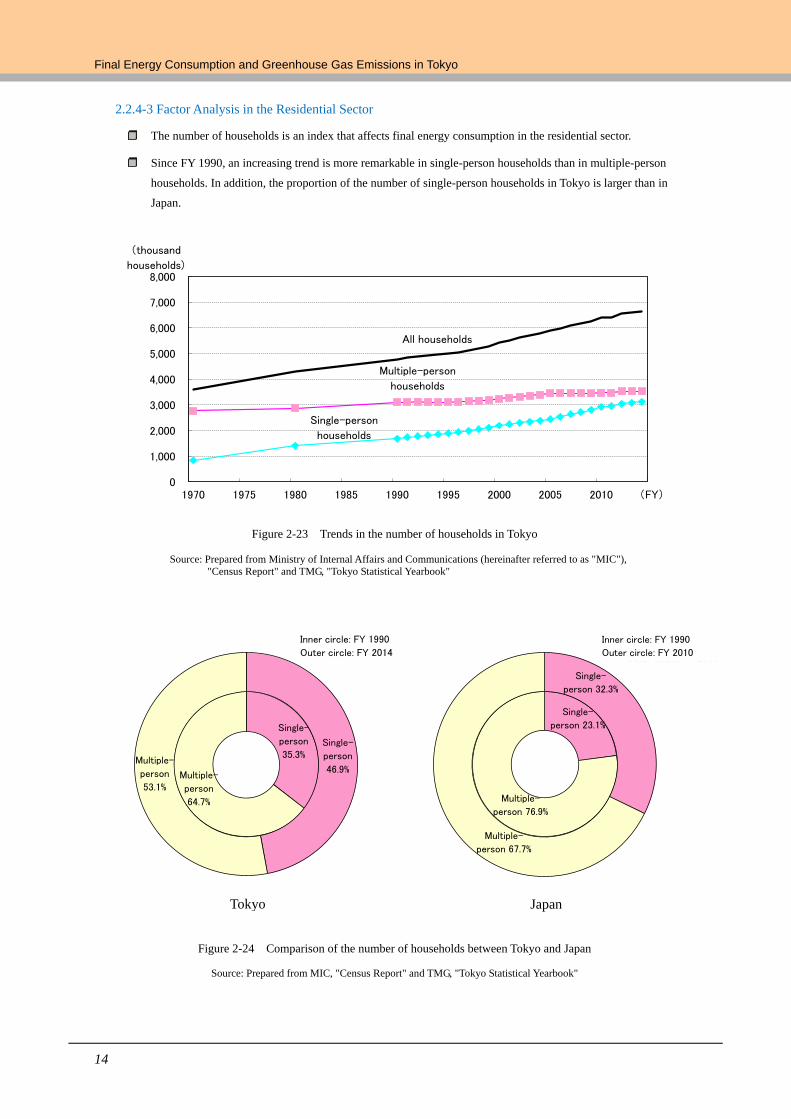
The number of households is an index that affects final energy consumption in the residential sector.
Since FY 1990, an increasing trend is more remarkable in single-person households than in multiple-person
households. In addition, the proportion of the number of single-person households in Tokyo is larger than in
Japan.
Figure 2-23 Trends in the number of households in Tokyo
Source: Prepared from Ministry of Internal Affairs and Communications (hereinafter referred to as "MIC"),
"Census Report" and TMG, "Tokyo Statistical Yearbook"
Figure 2-24 Comparison of the number of households between Tokyo and Japan
Source: Prepared from MIC, "Census Report" and TMG, "Tokyo Statistical Yearbook"
Single-
person
35.3%
Multiple-
person
64.7%
Single-
person
46.9%Multiple-
person
53.1%
Inner circle: FY 1990
Outer circle: FY 2014
Tokyo Japan
Single-person
households
Multiple-person
households
All households
0
1,000
2,000
3,000
4,000
5,000
6,000
7,000
8,000
1970 1975 1980 1985 1990 1995 2000 2005 2010
(thousand
households)
(FY)
Single-
person 23.1%
Multiple-
person 76.9%
Single-
person 32.3%
Multiple-
person 67.7%
Inner circle: FY 1990
Outer circle: FY 2010
Inner circle: FY 1990
Outer circle: FY 2010
2.Final Energy Consumption
15
36.2 36.8 35.5 35.1
36.8
34.7 34.6 33.4 33.6
34.6
33.0 32.3
31.7
42.9 43.8
42.0 42.0 43.1
41.1 41.2
39.3 38.6
40.4
38.4 37.2
36.0
20.0
30.0
40.0
50.0
2000 2001 2002 2003 2004 2005 2006 2007 2008 2009 2010 2011 2012 2013 2014
(GJ/household)
(FY)
44.6 GJ/household
34.3 GJ/household
31.3 GJ/household
37.3 GJ/household
Japan
Tokyo
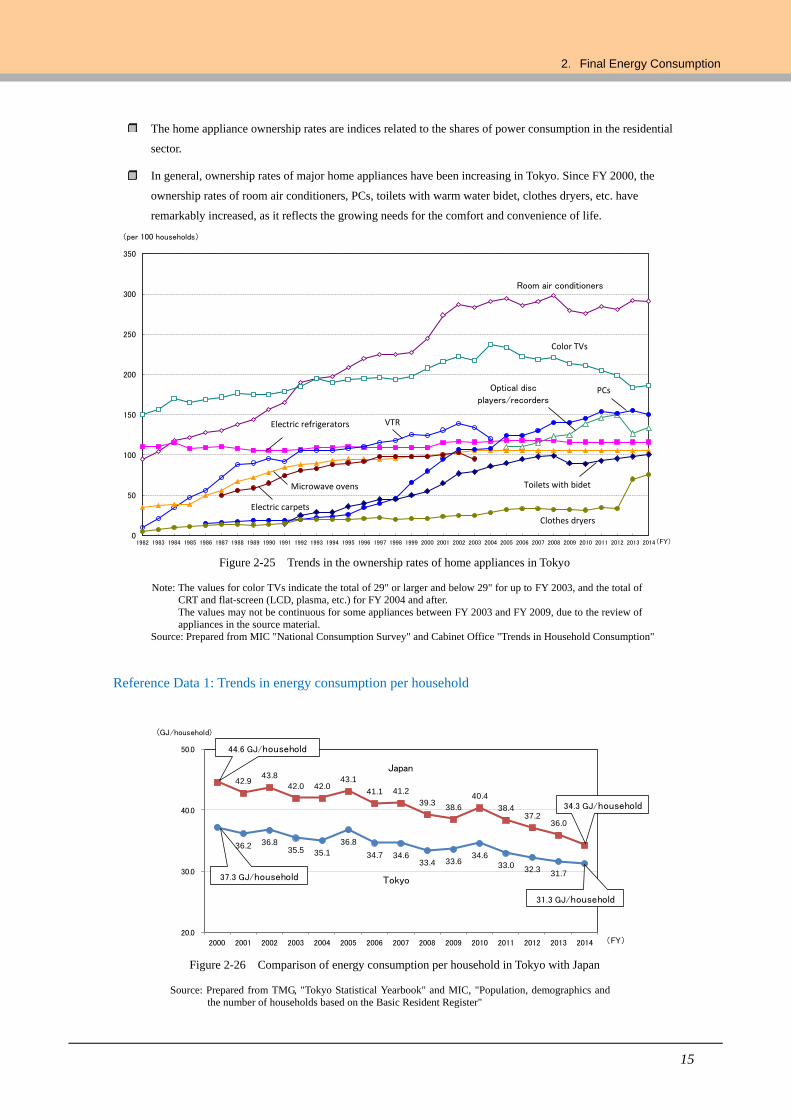
The home appliance ownership rates are indices related to the shares of power consumption in the residential
sector.
In general, ownership rates of major home appliances have been increasing in Tokyo. Since FY 2000, the
ownership rates of room air conditioners, PCs, toilets with warm water bidet, clothes dryers, etc. have
remarkably increased, as it reflects the growing needs for the comfort and convenience of life.
Figure 2-25 Trends in the ownership rates of home appliances in Tokyo
Note: The values for color TVs indicate the total of 29" or larger and below 29" for up to FY 2003, and the total of
CRT and flat-screen (LCD, plasma, etc.) for FY 2004 and after.
The values may not be continuous for some appliances between FY 2003 and FY 2009, due to the review of
appliances in the source material.
Source: Prepared from MIC "National Consumption Survey" and Cabinet Office "Trends in Household Consumption"
Reference Data 1: Trends in energy consumption per household
Figure 2-26 Comparison of energy consumption per household in Tokyo with Japan
Source: Prepared from TMG, "Tokyo Statistical Yearbook" and MIC, "Population, demographics and
the number of households based on the Basic Resident Register"
0
50
100
150
200
250
300
350
1982 1983 1984 1985 1986 1987 1988 1989 1990 1991 1992 1993 1994 1995 1996 1997 1998 1999 2000 2001 2002 2003 2004 2005 2006 2007 2008 2009 2010 2011 2012 2013 2014
Room air conditioners
Color TVs
Electric refrigerators VTR
Clothes dryers
Microwave ovens
PCsOptical disc
players/recorders
Toilets with bidet
Electric carpets
(per 100 households)
(FY)
Final Energy Consumption and Greenhouse Gas Emissions in Tokyo
16
1,492
1,302
1,2011,159
1,0681,017
990947 963 945
919882 865 858 849
872845 846 844 837
600
700
800
900
1,000
1,100
1,200
1,300
1,400
1,500
1,600
1995 1996 1997 1998 1999 2000 2001 2002 2003 2004 2005 2006 2007 2008 2009 2010 2011 2012 2013 2014
(kWh/in cooling and
heating season)
(FY)
Power consumption in cooling
and heating season
0.00
0.50
1.00
1.50
2.00
2.50
3.00
1991 1992 1993 1994 1995 1996 1997 1998 1999 2000 2001 2002 2003 2004 2005 2006 2007 2008 2009 2010 2011 2012 2013 2014
(kWh/L)
(YR)
After JIS Revision
Annual power
consumption per
1liter (rated Capacity)
(kWh/L)
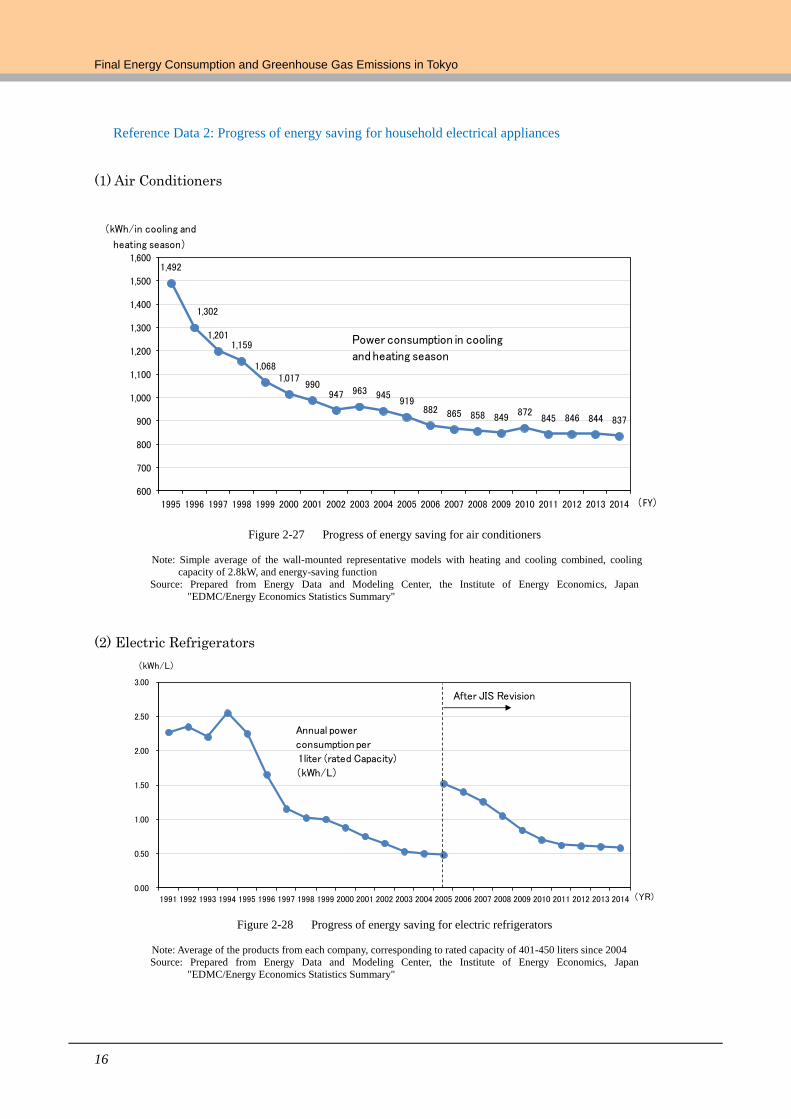
Reference Data 2: Progress of energy saving for household electrical appliances
(1) Air Conditioners
Figure 2-27 Progress of energy saving for air conditioners
Note: Simple average of the wall-mounted representative models with heating and cooling combined, cooling
capacity of 2.8kW, and energy-saving function
Source: Prepared from Energy Data and Modeling Center, the Institute of Energy Economics, Japan
"EDMC/Energy Economics Statistics Summary"
(2) Electric Refrigerators
Figure 2-28 Progress of energy saving for electric refrigerators
Note: Average of the products from each company, corresponding to rated capacity of 401-450 liters since 2004
Source: Prepared from Energy Data and Modeling Center, the Institute of Energy Economics, Japan
"EDMC/Energy Economics Statistics Summary"
2.Final Energy Consumption
17
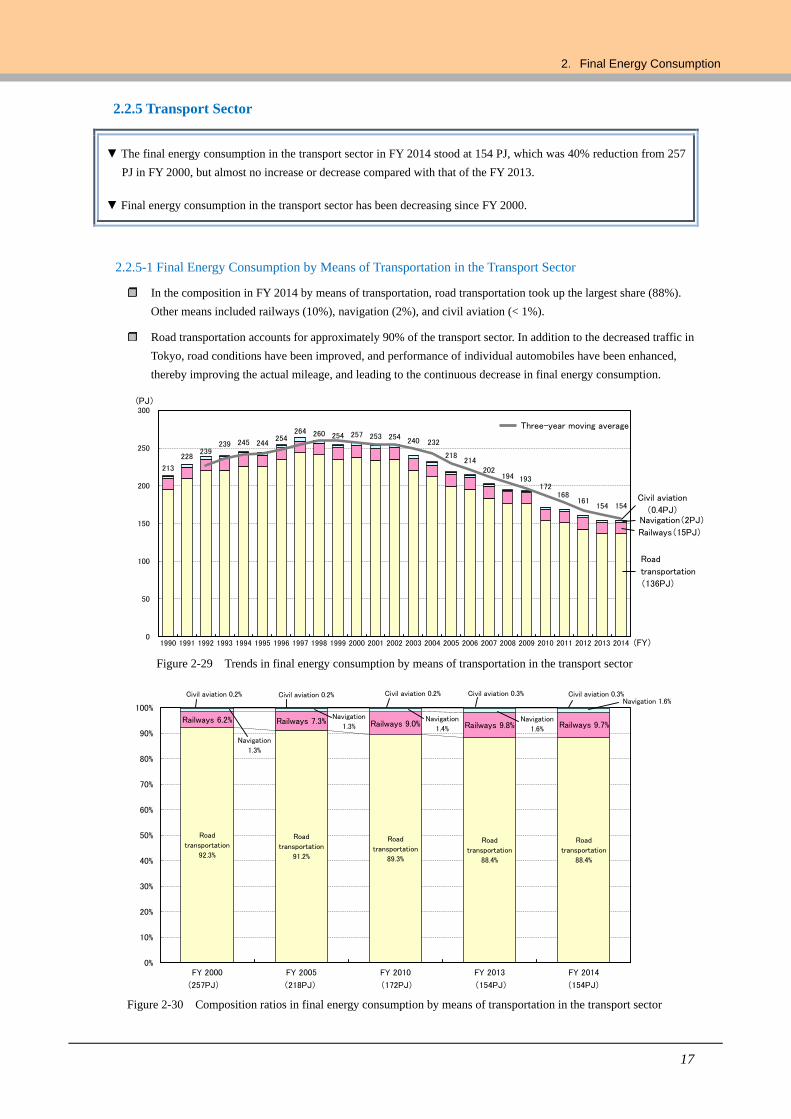
2.2.5 Transport Sector
▼ The final energy consumption in the transport sector in FY 2014 stood at 154 PJ, which was 40% reduction from 257
PJ in FY 2000, but almost no increase or decrease compared with that of the FY 2013.
▼ Final energy consumption in the transport sector has been decreasing since FY 2000.
2.2.5-1 Final Energy Consumption by Means of Transportation in the Transport Sector
In the composition in FY 2014 by means of transportation, road transportation took up the largest share (88%).
Other means included railways (10%), navigation (2%), and civil aviation (< 1%).
Road transportation accounts for approximately 90% of the transport sector. In addition to the decreased traffic in
Tokyo, road conditions have been improved, and performance of individual automobiles have been enhanced,
thereby improving the actual mileage, and leading to the continuous decrease in final energy consumption.
Figure 2-29 Trends in final energy consumption by means of transportation in the transport sector
Figure 2-30 Composition ratios in final energy consumption by means of transportation in the transport sector
Road
transportation
92.3%
Road
transportation
91.2%
Road
transportation
89.3%
Road
transportation
88.4%
Road
transportation
88.4%
Railways 6.2% Railways 7.3% Railways 9.0% Railways 9.8% Railways 9.7%
Navigation
1.3%
Navigation
1.3%Navigation
1.4%
Navigation
1.6%
Navigation 1.6%Civil aviation 0.2% Civil aviation 0.2% Civil aviation 0.2% Civil aviation 0.3% Civil aviation 0.3%
0%
10%
20%
30%
40%
50%
60%
70%
80%
90%
100%
FY 2000 FY 2005 FY 2010 FY 2013 FY 2014
(257PJ) (154PJ) (154PJ)(218PJ) (172PJ)
Road
transportation
(136PJ)
Railways(15PJ)
Navigation(2PJ)
Civil aviation
(0.4PJ)
213
228239
239 245 244254
264 260 254 257 253 254 240 232
218214
202194 193
172168
161154 154
0
50
100
150
200
250
300
1990 1991 1992 1993 1994 1995 1996 1997 1998 1999 2000 2001 2002 2003 2004 2005 2006 2007 2008 2009 2010 2011 2012 2013 2014
(PJ)
(FY)
Three-year moving average
Final Energy Consumption and Greenhouse Gas Emissions in Tokyo
18
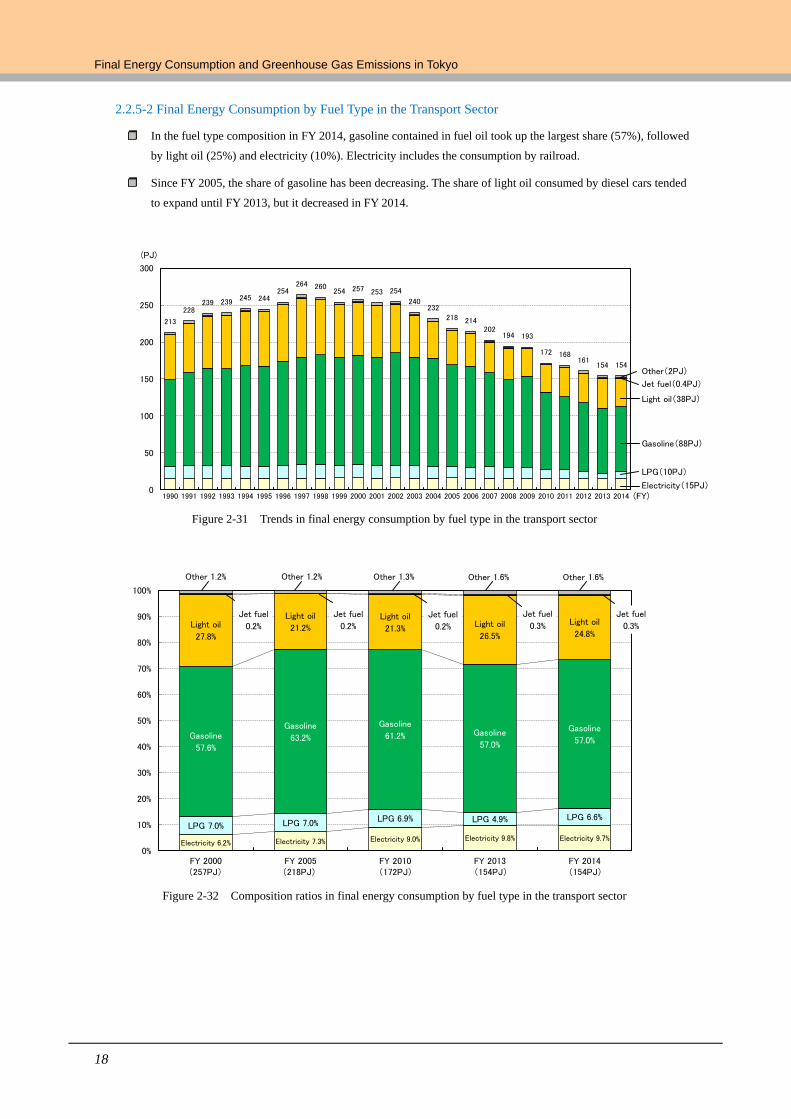
2.2.5-2 Final Energy Consumption by Fuel Type in the Transport Sector
In the fuel type composition in FY 2014, gasoline contained in fuel oil took up the largest share (57%), followed
by light oil (25%) and electricity (10%). Electricity includes the consumption by railroad.
Since FY 2005, the share of gasoline has been decreasing. The share of light oil consumed by diesel cars tended
to expand until FY 2013, but it decreased in FY 2014.
Figure 2-31 Trends in final energy consumption by fuel type in the transport sector
Figure 2-32 Composition ratios in final energy consumption by fuel type in the transport sector
Electricity 6.2% Electricity 7.3% Electricity 9.0% Electricity 9.8% Electricity 9.7%
LPG 7.0% LPG 7.0% LPG 6.9% LPG 4.9% LPG 6.6%
Gasoline
57.6%
Gasoline
63.2%
Gasoline
61.2% Gasoline
57.0%
Gasoline
57.0%
Light oil
27.8%
Light oil
21.2%
Light oil
21.3% Light oil
26.5%
Light oil
24.8%
Jet fuel
0.2%
Jet fuel
0.2%
Jet fuel
0.2%
Jet fuel
0.3%
Jet fuel
0.3%
Other 1.2% Other 1.2% Other 1.3% Other 1.6% Other 1.6%
0%
10%
20%
30%
40%
50%
60%
70%
80%
90%
100%
FY 2000 FY 2005 FY 2010 FY 2013 FY 2014(154PJ)(257PJ) (218PJ) (154PJ)(172PJ)
213
228239 239
245 244254
264 260254 257 253 254
240232
218 214202
194 193
172 168161
154 154
0
50
100
150
200
250
300
1990 1991 1992 1993 1994 1995 1996 1997 1998 1999 2000 2001 2002 2003 2004 2005 2006 2007 2008 2009 2010 2011 2012 2013 2014
(PJ)
(FY)
Gasoline(88PJ)
Light oil(38PJ)
Electricity(15PJ)
Jet fuel(0.4PJ)
Other(2PJ)
LPG(10PJ)
2.Final Energy Consumption
19
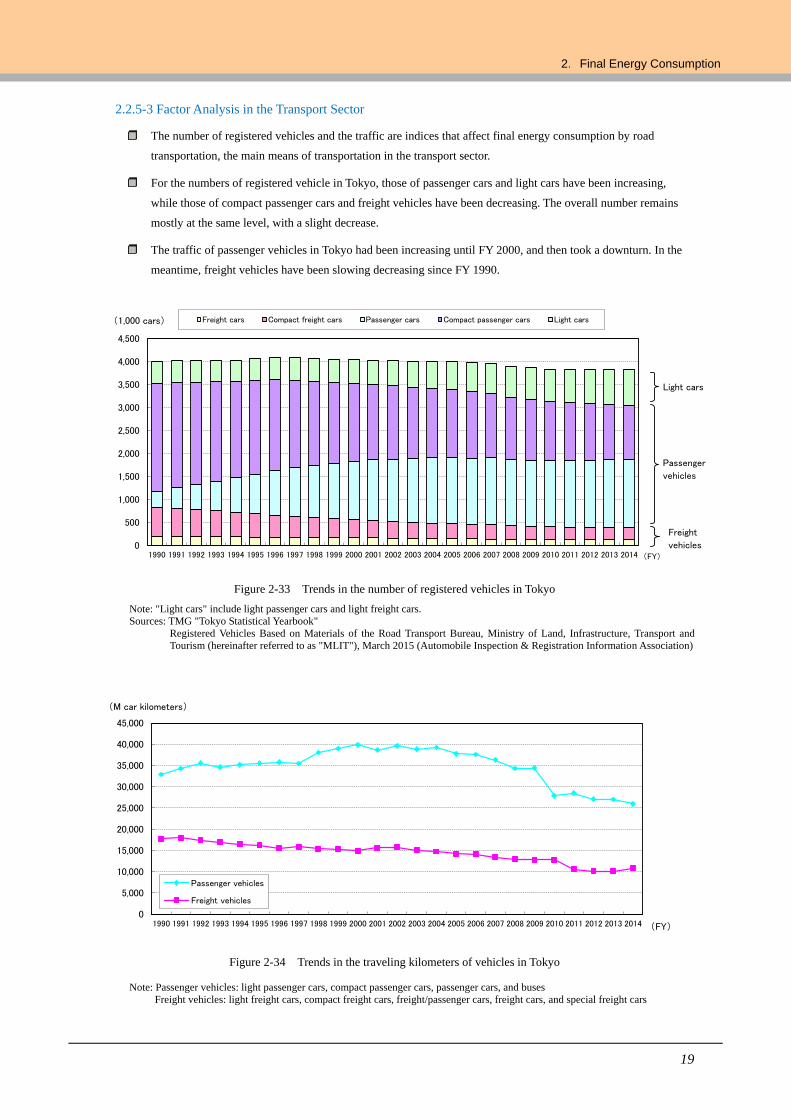
2.2.5-3 Factor Analysis in the Transport Sector
The number of registered vehicles and the traffic are indices that affect final energy consumption by road
transportation, the main means of transportation in the transport sector.
For the numbers of registered vehicle in Tokyo, those of passenger cars and light cars have been increasing,
while those of compact passenger cars and freight vehicles have been decreasing. The overall number remains
mostly at the same level, with a slight decrease.
The traffic of passenger vehicles in Tokyo had been increasing until FY 2000, and then took a downturn. In the
meantime, freight vehicles have been slowing decreasing since FY 1990.
Figure 2-33 Trends in the number of registered vehicles in Tokyo
Note: "Light cars" include light passenger cars and light freight cars.
Sources: TMG "Tokyo Statistical Yearbook"
Registered Vehicles Based on Materials of the Road Transport Bureau, Ministry of Land, Infrastructure, Transport and
Tourism (hereinafter referred to as "MLIT"), March 2015 (Automobile Inspection & Registration Information Association)
Figure 2-34 Trends in the traveling kilometers of vehicles in Tokyo
Note: Passenger vehicles: light passenger cars, compact passenger cars, passenger cars, and buses
Freight vehicles: light freight cars, compact freight cars, freight/passenger cars, freight cars, and special freight cars
0
5,000
10,000
15,000
20,000
25,000
30,000
35,000
40,000
45,000
1990 1991 1992 1993 1994 1995 1996 1997 1998 1999 2000 2001 2002 2003 2004 2005 2006 2007 2008 2009 2010 2011 2012 2013 2014
(M car kilometers)
Passenger vehicles
Freight vehicles
(FY)
0
500
1,000
1,500
2,000
2,500
3,000
3,500
4,000
4,500
1990 1991 1992 1993 1994 1995 1996 1997 1998 1999 2000 2001 2002 2003 2004 2005 2006 2007 2008 2009 2010 2011 2012 2013 2014
(1,000 cars)
(FY)
Freight cars Compact freight cars Passenger cars Compact passenger cars Light cars
Freight
vehicles
Passenger
vehicles
Light cars
Final Energy Consumption and Greenhouse Gas Emissions in Tokyo
20
3 Total Greenhouse Gas Emissions
3.1 Concepts for Calculation
3.1.1 Basic Matters
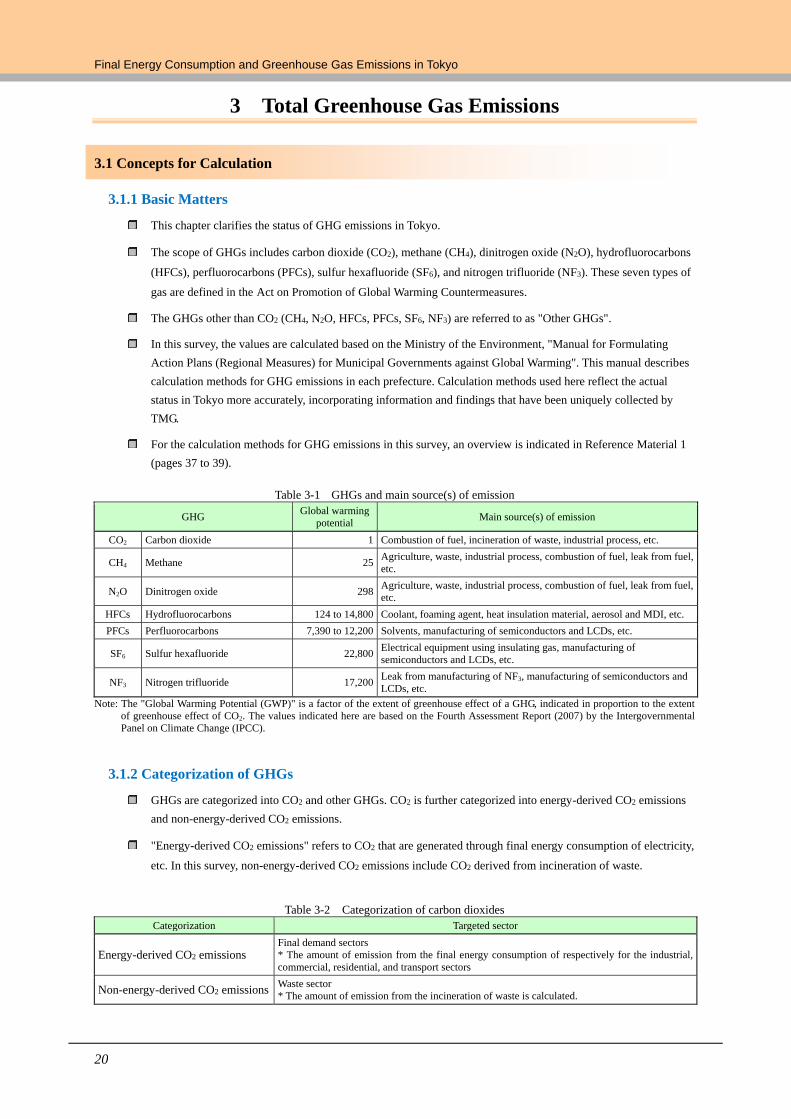
This chapter clarifies the status of GHG emissions in Tokyo.
The scope of GHGs includes carbon dioxide (CO2), methane (CH4), dinitrogen oxide (N2O), hydrofluorocarbons
(HFCs), perfluorocarbons (PFCs), sulfur hexafluoride (SF6), and nitrogen trifluoride (NF3). These seven types of
gas are defined in the Act on Promotion of Global Warming Countermeasures.
The GHGs other than CO2 (CH4, N2O, HFCs, PFCs, SF6, NF3) are referred to as "Other GHGs".
In this survey, the values are calculated based on the Ministry of the Environment, "Manual for Formulating
Action Plans (Regional Measures) for Municipal Governments against Global Warming". This manual describes
calculation methods for GHG emissions in each prefecture. Calculation methods used here reflect the actual
status in Tokyo more accurately, incorporating information and findings that have been uniquely collected by
TMG.
For the calculation methods for GHG emissions in this survey, an overview is indicated in Reference Material 1
(pages 37 to 39).
Table 3-1 GHGs and main source(s) of emission
GHG Global warming
potential Main source(s) of emission
CO2 Carbon dioxide 1 Combustion of fuel, incineration of waste, industrial process, etc.
CH4 Methane 25 Agriculture, waste, industrial process, combustion of fuel, leak from fuel, etc.
N2O Dinitrogen oxide 298 Agriculture, waste, industrial process, combustion of fuel, leak from fuel, etc.
HFCs Hydrofluorocarbons 124 to 14,800 Coolant, foaming agent, heat insulation material, aerosol and MDI, etc.
PFCs Perfluorocarbons 7,390 to 12,200 Solvents, manufacturing of semiconductors and LCDs, etc.
SF6 Sulfur hexafluoride 22,800 Electrical equipment using insulating gas, manufacturing of
semiconductors and LCDs, etc.
NF3 Nitrogen trifluoride 17,200 Leak from manufacturing of NF3, manufacturing of semiconductors and
LCDs, etc.
Note: The "Global Warming Potential (GWP)" is a factor of the extent of greenhouse effect of a GHG, indicated in proportion to the extent
of greenhouse effect of CO2. The values indicated here are based on the Fourth Assessment Report (2007) by the Intergovernmental
Panel on Climate Change (IPCC).
3.1.2 Categorization of GHGs
GHGs are categorized into CO2 and other GHGs. CO2 is further categorized into energy-derived CO2 emissions
and non-energy-derived CO2 emissions.
"Energy-derived CO2 emissions" refers to CO2 that are generated through final energy consumption of electricity,
etc. In this survey, non-energy-derived CO2 emissions include CO2 derived from incineration of waste.
Table 3-2 Categorization of carbon dioxides
Categorization Targeted sector
Energy-derived CO2 emissions
Final demand sectors * The amount of emission from the final energy consumption of respectively for the industrial,
commercial, residential, and transport sectors
Non-energy-derived CO2 emissions Waste sector * The amount of emission from the incineration of waste is calculated.
3 Total Greenhouse Gas Emissions
21
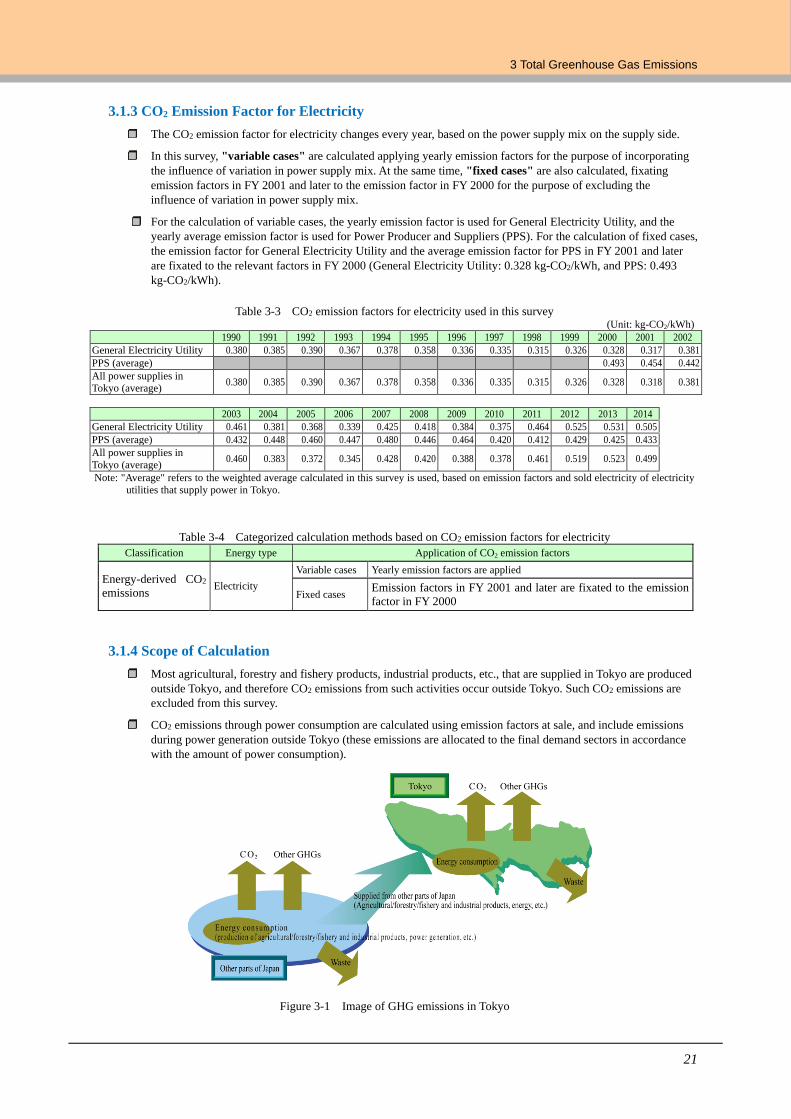
3.1.3 CO2 Emission Factor for Electricity
The CO2 emission factor for electricity changes every year, based on the power supply mix on the supply side.
In this survey, "variable cases" are calculated applying yearly emission factors for the purpose of incorporating
the influence of variation in power supply mix. At the same time, "fixed cases" are also calculated, fixating
emission factors in FY 2001 and later to the emission factor in FY 2000 for the purpose of excluding the
influence of variation in power supply mix.
For the calculation of variable cases, the yearly emission factor is used for General Electricity Utility, and the
yearly average emission factor is used for Power Producer and Suppliers (PPS). For the calculation of fixed cases,
the emission factor for General Electricity Utility and the average emission factor for PPS in FY 2001 and later
are fixated to the relevant factors in FY 2000 (General Electricity Utility: 0.328 kg-CO2/kWh, and PPS: 0.493
kg-CO2/kWh).
Table 3-3 CO2 emission factors for electricity used in this survey (Unit: kg-CO2/kWh)
1990 1991 1992 1993 1994 1995 1996 1997 1998 1999 2000 2001 2002 General Electricity Utility 0.380 0.385 0.390 0.367 0.378 0.358 0.336 0.335 0.315 0.326 0.328 0.317 0.381 PPS (average) 0.493 0.454 0.442 All power supplies in
Tokyo (average) 0.380 0.385 0.390 0.367 0.378 0.358 0.336 0.335 0.315 0.326 0.328 0.318 0.381
2003 2004 2005 2006 2007 2008 2009 2010 2011 2012 2013 2014
General Electricity Utility 0.461 0.381 0.368 0.339 0.425 0.418 0.384 0.375 0.464 0.525 0.531 0.505
PPS (average) 0.432 0.448 0.460 0.447 0.480 0.446 0.464 0.420 0.412 0.429 0.425 0.433
All power supplies in
Tokyo (average) 0.460 0.383 0.372 0.345 0.428 0.420 0.388 0.378 0.461 0.519 0.523 0.499
Note: "Average" refers to the weighted average calculated in this survey is used, based on emission factors and sold electricity of electricity
utilities that supply power in Tokyo.
Table 3-4 Categorized calculation methods based on CO2 emission factors for electricity
Classification Energy type Application of CO2 emission factors
Energy-derived CO2
emissions Electricity
Variable cases Yearly emission factors are applied
Fixed cases Emission factors in FY 2001 and later are fixated to the emission
factor in FY 2000
3.1.4 Scope of Calculation
Most agricultural, forestry and fishery products, industrial products, etc., that are supplied in Tokyo are produced
outside Tokyo, and therefore CO2 emissions from such activities occur outside Tokyo. Such CO2 emissions are
excluded from this survey.
CO2 emissions through power consumption are calculated using emission factors at sale, and include emissions
during power generation outside Tokyo (these emissions are allocated to the final demand sectors in accordance
with the amount of power consumption).
Figure 3-1 Image of GHG emissions in Tokyo
Final Energy Consumption and Greenhouse Gas Emissions in Tokyo
22
3.2 Total Greenhouse Gas Emissions
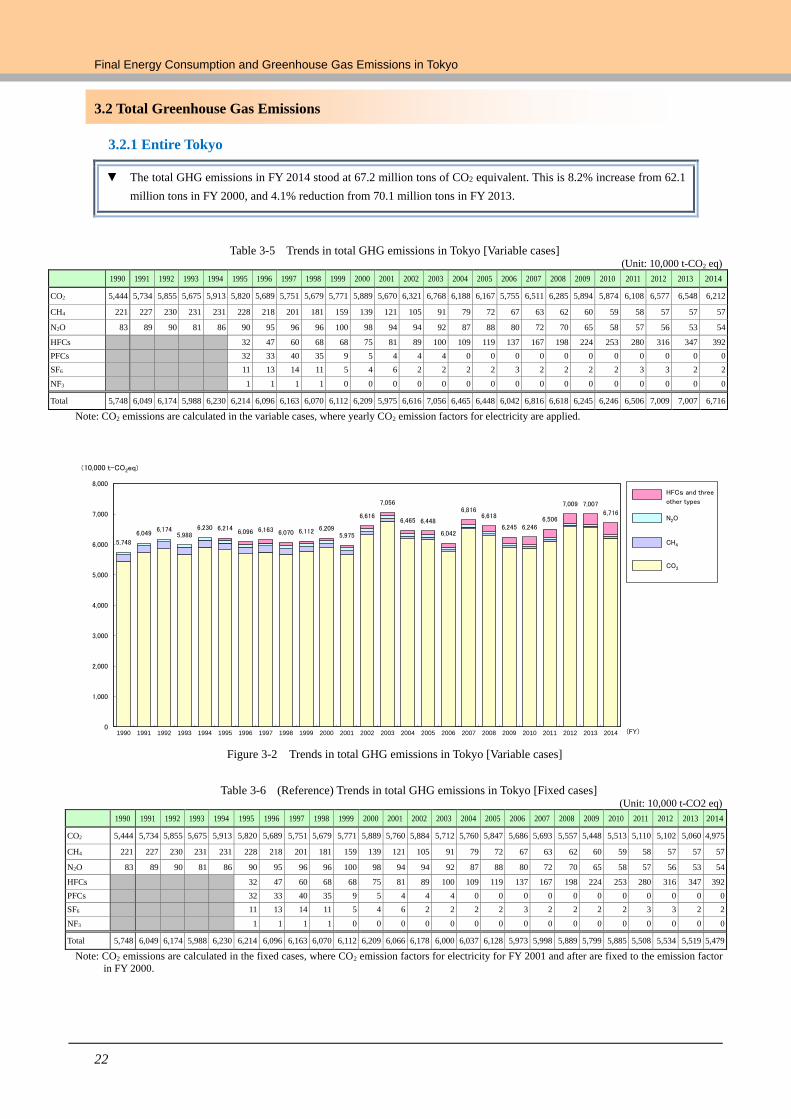
3.2.1 Entire Tokyo
▼ The total GHG emissions in FY 2014 stood at 67.2 million tons of CO2 equivalent. This is 8.2% increase from 62.1
million tons in FY 2000, and 4.1% reduction from 70.1 million tons in FY 2013.
Table 3-5 Trends in total GHG emissions in Tokyo [Variable cases] (Unit: 10,000 t-CO2 eq)
1990 1991 1992 1993 1994 1995 1996 1997 1998 1999 2000 2001 2002 2003 2004 2005 2006 2007 2008 2009 2010 2011 2012 2013 2014
CO2 5,444 5,734 5,855 5,675 5,913 5,820 5,689 5,751 5,679 5,771 5,889 5,670 6,321 6,768 6,188 6,167 5,755 6,511 6,285 5,894 5,874 6,108 6,577 6,548 6,212
CH4 221 227 230 231 231 228 218 201 181 159 139 121 105 91 79 72 67 63 62 60 59 58 57 57 57
N2O 83 89 90 81 86 90 95 96 96 100 98 94 94 92 87 88 80 72 70 65 58 57 56 53 54
HFCs 32 47 60 68 68 75 81 89 100 109 119 137 167 198 224 253 280 316 347 392
PFCs 32 33 40 35 9 5 4 4 4 0 0 0 0 0 0 0 0 0 0 0
SF6 11 13 14 11 5 4 6 2 2 2 2 3 2 2 2 2 3 3 2 2
NF3 1 1 1 1 0 0 0 0 0 0 0 0 0 0 0 0 0 0 0 0
Total 5,748 6,049 6,174 5,988 6,230 6,214 6,096 6,163 6,070 6,112 6,209 5,975 6,616 7,056 6,465 6,448 6,042 6,816 6,618 6,245 6,246 6,506 7,009 7,007 6,716
Note: CO2 emissions are calculated in the variable cases, where yearly CO2 emission factors for electricity are applied.
Figure 3-2 Trends in total GHG emissions in Tokyo [Variable cases]
Table 3-6 (Reference) Trends in total GHG emissions in Tokyo [Fixed cases] (Unit: 10,000 t-CO2 eq)
1990 1991 1992 1993 1994 1995 1996 1997 1998 1999 2000 2001 2002 2003 2004 2005 2006 2007 2008 2009 2010 2011 2012 2013 2014
CO2 5,444 5,734 5,855 5,675 5,913 5,820 5,689 5,751 5,679 5,771 5,889 5,760 5,884 5,712 5,760 5,847 5,686 5,693 5,557 5,448 5,513 5,110 5,102 5,060 4,975
CH4 221 227 230 231 231 228 218 201 181 159 139 121 105 91 79 72 67 63 62 60 59 58 57 57 57
N2O 83 89 90 81 86 90 95 96 96 100 98 94 94 92 87 88 80 72 70 65 58 57 56 53 54
HFCs 32 47 60 68 68 75 81 89 100 109 119 137 167 198 224 253 280 316 347 392
PFCs 32 33 40 35 9 5 4 4 4 0 0 0 0 0 0 0 0 0 0 0
SF6 11 13 14 11 5 4 6 2 2 2 2 3 2 2 2 2 3 3 2 2
NF3 1 1 1 1 0 0 0 0 0 0 0 0 0 0 0 0 0 0 0 0
Total 5,748 6,049 6,174 5,988 6,230 6,214 6,096 6,163 6,070 6,112 6,209 6,066 6,178 6,000 6,037 6,128 5,973 5,998 5,889 5,799 5,885 5,508 5,534 5,519 5,479
Note: CO2 emissions are calculated in the fixed cases, where CO2 emission factors for electricity for FY 2001 and after are fixed to the emission factor
in FY 2000.
5,748
6,0496,174
5,9886,230 6,214
6,096 6,163 6,070 6,112 6,2095,975
6,616
7,056
6,465 6,448
6,042
6,8166,618
6,245 6,2466,506
7,009 7,007
6,716
0
1,000
2,000
3,000
4,000
5,000
6,000
7,000
8,000
1990 1991 1992 1993 1994 1995 1996 1997 1998 1999 2000 2001 2002 2003 2004 2005 2006 2007 2008 2009 2010 2011 2012 2013 2014 (FY)
HFCs and three
other types
N2O
CH4
CO2
(10,000 t-CO2eq)
3 Total Greenhouse Gas Emissions
23
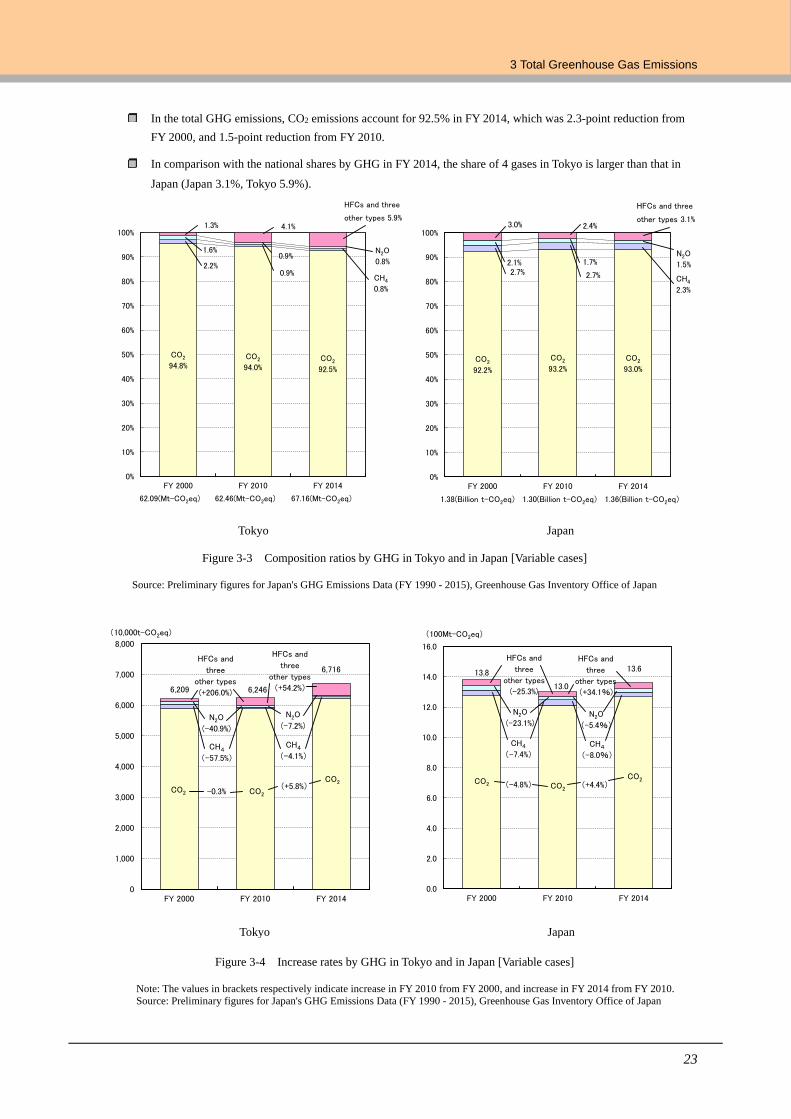
In the total GHG emissions, CO2 emissions account for 92.5% in FY 2014, which was 2.3-point reduction from
FY 2000, and 1.5-point reduction from FY 2010.
In comparison with the national shares by GHG in FY 2014, the share of 4 gases in Tokyo is larger than that in
Japan (Japan 3.1%, Tokyo 5.9%).
Tokyo Japan
Figure 3-3 Composition ratios by GHG in Tokyo and in Japan [Variable cases]
Source: Preliminary figures for Japan's GHG Emissions Data (FY 1990 - 2015), Greenhouse Gas Inventory Office of Japan
Tokyo Japan
Figure 3-4 Increase rates by GHG in Tokyo and in Japan [Variable cases]
Note: The values in brackets respectively indicate increase in FY 2010 from FY 2000, and increase in FY 2014 from FY 2010.
Source: Preliminary figures for Japan's GHG Emissions Data (FY 1990 - 2015), Greenhouse Gas Inventory Office of Japan
CO2
94.8%CO2
94.0%CO2
92.5%
2.2%0.9%
1.6%
0.9%
1.3% 4.1%
0%
10%
20%
30%
40%
50%
60%
70%
80%
90%
100%
FY 2000 FY 2010 FY 2014
HFCs and three
other types 5.9%
N2O
0.8%
CH4
0.8%
67.16(Mt-CO2eq)62.46(Mt-CO2eq)62.09(Mt-CO2eq)
CO2
92.2%
CO2
93.2%
CO2
93.0%
2.7% 2.7%
0%
10%
20%
30%
40%
50%
60%
70%
80%
90%
100%
FY 2000 FY 2010 FY 2014
HFCs and three
other types 3.1%2.4%
1.7%
3.0%
2.1%N2O
1.5%
CH4
2.3%
1.30(Billion t-CO2eq) 1.36(Billion t-CO2eq)1.38(Billion t-CO2eq)
(+5.8%)-0.3%
CH4
(-4.1%)CH4
(-57.5%)
N2O
(-7.2%)N2O
(-40.9%)
HFCs and
three
other types
(+54.2%)
HFCs and
three
other types
(+206.0%)
0
1,000
2,000
3,000
4,000
5,000
6,000
7,000
8,000
FY 2000 FY 2010 FY 2014
CO2
6,209
6,716
6,246
CO2
CO2
(10,000t-CO2eq)
(-4.8%) (+4.4%)
CH4
(-7.4%)CH4
(-8.0%)
N2O
(-23.1%)N2O
(-5.4%)
HFCs and
three
other types
(-25.3%)
HFCs and
three
other types
(+34.1%)
0.0
2.0
4.0
6.0
8.0
10.0
12.0
14.0
16.0
FY 2000 FY 2010 FY 2014
13.8
13.0
13.6
CO2 CO2
CO2
(100Mt-CO2eq)
Final Energy Consumption and Greenhouse Gas Emissions in Tokyo
24
3.3 CO2 Emissions (Variable Cases)
Variable cases: yearly CO2 emission factors for electricity are applied, for the purpose of incorporating the influence
of variation in power supply mix
3.3.1 Entire Tokyo
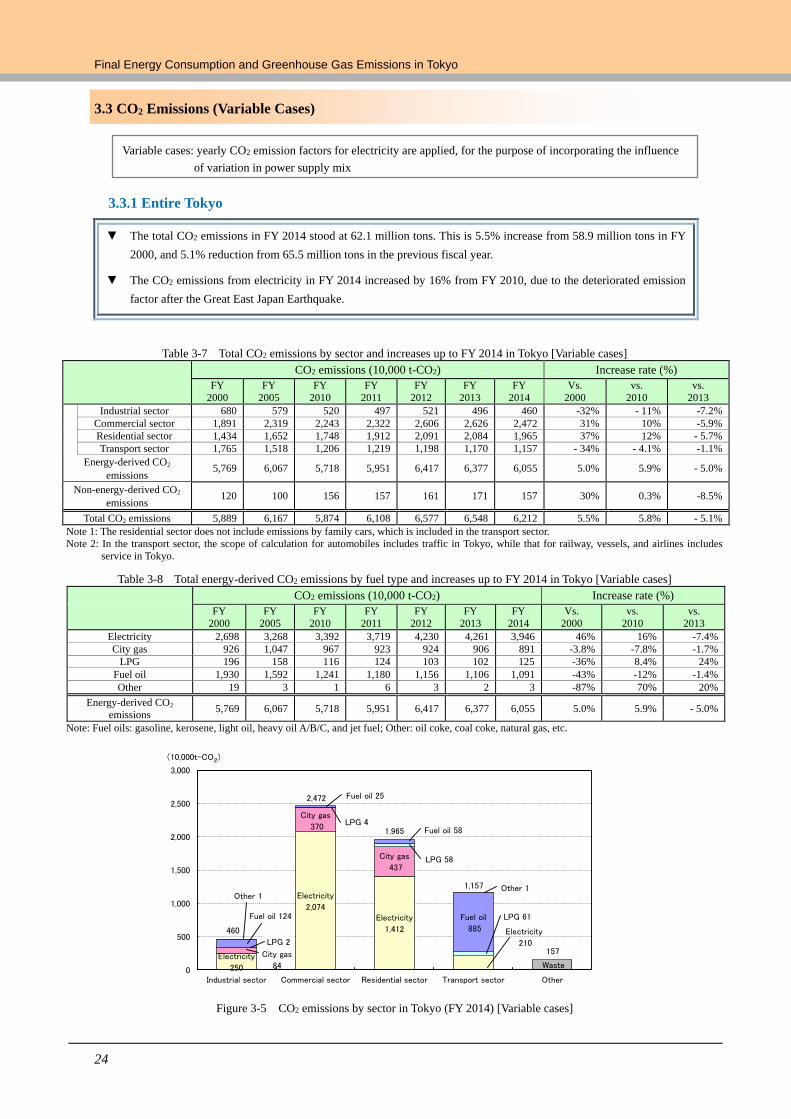
▼ The total CO2 emissions in FY 2014 stood at 62.1 million tons. This is 5.5% increase from 58.9 million tons in FY
2000, and 5.1% reduction from 65.5 million tons in the previous fiscal year.
▼ The CO2 emissions from electricity in FY 2014 increased by 16% from FY 2010, due to the deteriorated emission
factor after the Great East Japan Earthquake.
Table 3-7 Total CO2 emissions by sector and increases up to FY 2014 in Tokyo [Variable cases] CO2 emissions (10,000 t-CO2) Increase rate (%)
FY
2000
FY
2005
FY
2010
FY
2011
FY
2012
FY
2013
FY
2014
Vs.
2000
vs.
2010
vs.
2013
Industrial sector 680 579 520 497 521 496 460 -32% - 11% -7.2%
Commercial sector 1,891 2,319 2,243 2,322 2,606 2,626 2,472 31% 10% -5.9%
Residential sector 1,434 1,652 1,748 1,912 2,091 2,084 1,965 37% 12% - 5.7%
Transport sector 1,765 1,518 1,206 1,219 1,198 1,170 1,157 - 34% - 4.1% -1.1%
Energy-derived CO2
emissions 5,769 6,067 5,718 5,951 6,417 6,377 6,055 5.0% 5.9% - 5.0%
Non-energy-derived CO2
emissions 120 100 156 157 161 171 157 30% 0.3% -8.5%
Total CO2 emissions 5,889 6,167 5,874 6,108 6,577 6,548 6,212 5.5% 5.8% - 5.1%
Note 1: The residential sector does not include emissions by family cars, which is included in the transport sector.
Note 2: In the transport sector, the scope of calculation for automobiles includes traffic in Tokyo, while that for railway, vessels, and airlines includes
service in Tokyo.
Table 3-8 Total energy-derived CO2 emissions by fuel type and increases up to FY 2014 in Tokyo [Variable cases]
CO2 emissions (10,000 t-CO2) Increase rate (%)
FY
2000
FY
2005
FY
2010
FY
2011
FY
2012
FY
2013
FY
2014
Vs.
2000
vs.
2010
vs.
2013
Electricity 2,698 3,268 3,392 3,719 4,230 4,261 3,946 46% 16% -7.4%
City gas 926 1,047 967 923 924 906 891 -3.8% -7.8% -1.7%
LPG 196 158 116 124 103 102 125 -36% 8.4% 24%
Fuel oil 1,930 1,592 1,241 1,180 1,156 1,106 1,091 -43% -12% -1.4%
Other 19 3 1 6 3 2 3 -87% 70% 20%
Energy-derived CO2
emissions 5,769 6,067 5,718 5,951 6,417 6,377 6,055 5.0% 5.9% - 5.0%
Note: Fuel oils: gasoline, kerosene, light oil, heavy oil A/B/C, and jet fuel; Other: oil coke, coal coke, natural gas, etc.
Figure 3-5 CO2 emissions by sector in Tokyo (FY 2014) [Variable cases]
Electricity
250
Electricity
2,074Electricity
1,412 Electricity
210
City gas
84
City gas
370
City gas
437
LPG 2
LPG 4
LPG 58
LPG 61Fuel oil 124
Fuel oil 25
Fuel oil 58
Fuel oil
885
Other 1Other 1
Waste
460
2,472
1,965
1,157
157
0
500
1,000
1,500
2,000
2,500
3,000
Industrial sector Commercial sector Residential sector Transport sector Other
(10,000t-CO2)
3 Total Greenhouse Gas Emissions
25
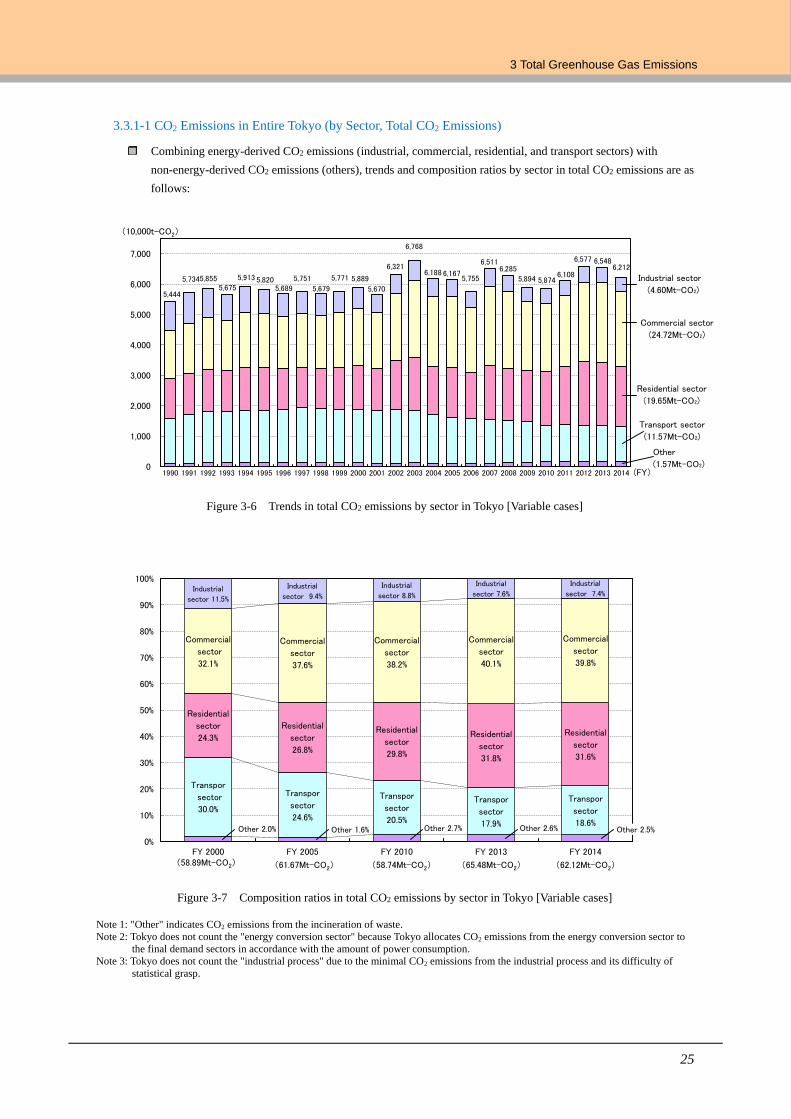
3.3.1-1 CO2 Emissions in Entire Tokyo (by Sector, Total CO2 Emissions)
Combining energy-derived CO2 emissions (industrial, commercial, residential, and transport sectors) with
non-energy-derived CO2 emissions (others), trends and composition ratios by sector in total CO2 emissions are as
follows:
Figure 3-6 Trends in total CO2 emissions by sector in Tokyo [Variable cases]
Figure 3-7 Composition ratios in total CO2 emissions by sector in Tokyo [Variable cases]
Note 1: "Other" indicates CO2 emissions from the incineration of waste.
Note 2: Tokyo does not count the "energy conversion sector" because Tokyo allocates CO2 emissions from the energy conversion sector to
the final demand sectors in accordance with the amount of power consumption.
Note 3: Tokyo does not count the "industrial process" due to the minimal CO2 emissions from the industrial process and its difficulty of
statistical grasp.
Other 2.0% Other 1.6% Other 2.7% Other 2.6% Other 2.5%
Transpor
sector
30.0%
Transpor
sector
24.6%
Transpor
sector
20.5%
Transpor
sector
17.9%
Transpor
sector
18.6%
Residential
sector
24.3%
Residential
sector
26.8%
Residential
sector
29.8%
Residential
sector
31.8%
Residential
sector
31.6%
Commercial
sector
32.1%
Commercial
sector
37.6%
Commercial
sector
38.2%
Commercial
sector
40.1%
Commercial
sector
39.8%
Industrial
sector 11.5%
Industrial
sector 9.4%
Industrial
sector 8.8%
Industrial
sector 7.6%
Industrial
sector 7.4%
0%
10%
20%
30%
40%
50%
60%
70%
80%
90%
100%
FY 2000 FY 2005 FY 2010 FY 2013 FY 2014(58.89Mt-CO2) (65.48Mt-CO2) (62.12Mt-CO2)(61.67Mt-CO2) (58.74Mt-CO2)
Other
(1.57Mt-CO2)
Transport sector
(11.57Mt-CO2)
Residential sector
(19.65Mt-CO2)
Commercial sector
(24.72Mt-CO2)
Industrial sector
(4.60Mt-CO2)5,444
5,734 5,855 5,675
5,913 5,820 5,689
5,751
5,679
5,771 5,889
5,670
6,321
6,768
6,188 6,167 5,755
6,511 6,285
5,894 5,874 6,108
6,577 6,548 6,212
0
1,000
2,000
3,000
4,000
5,000
6,000
7,000
1990 1991 1992 1993 1994 1995 1996 1997 1998 1999 2000 2001 2002 2003 2004 2005 2006 2007 2008 2009 2010 2011 2012 2013 2014 (FY)
(10,000t-CO2)
Final Energy Consumption and Greenhouse Gas Emissions in Tokyo
26
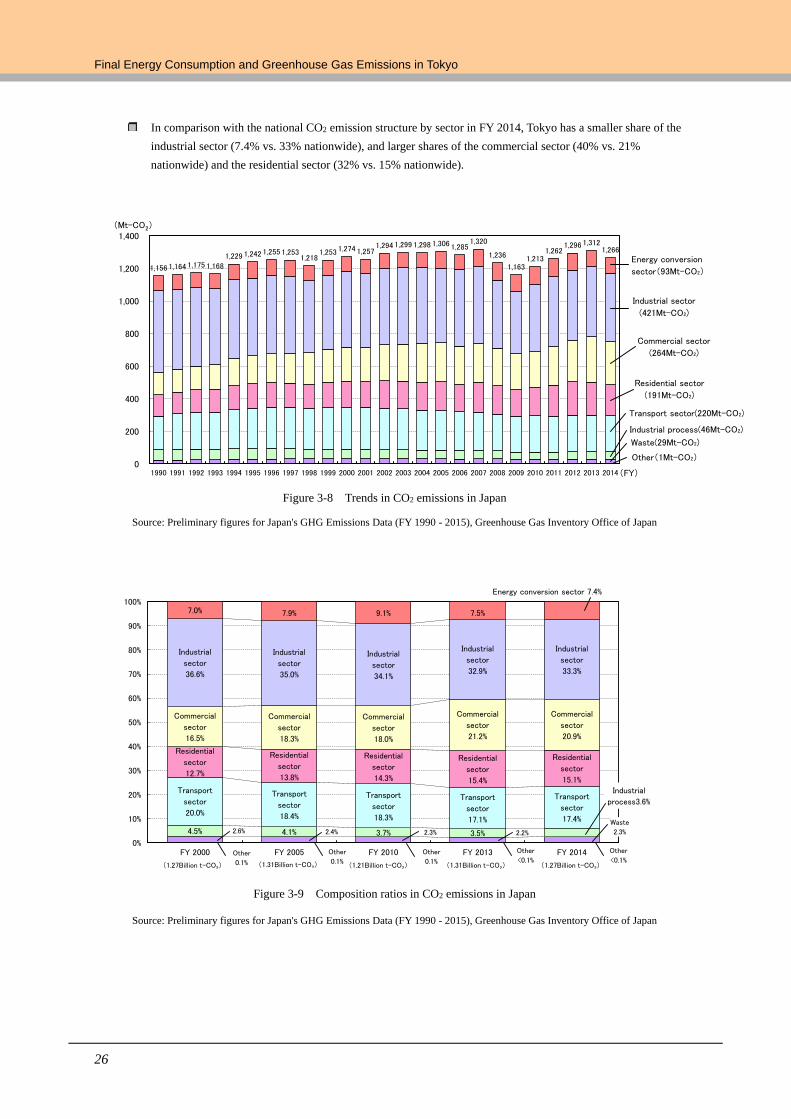
In comparison with the national CO2 emission structure by sector in FY 2014, Tokyo has a smaller share of the
industrial sector (7.4% vs. 33% nationwide), and larger shares of the commercial sector (40% vs. 21%
nationwide) and the residential sector (32% vs. 15% nationwide).
Figure 3-8 Trends in CO2 emissions in Japan
Source: Preliminary figures for Japan's GHG Emissions Data (FY 1990 - 2015), Greenhouse Gas Inventory Office of Japan
Figure 3-9 Composition ratios in CO2 emissions in Japan
Source: Preliminary figures for Japan's GHG Emissions Data (FY 1990 - 2015), Greenhouse Gas Inventory Office of Japan
Other
0.1%
Other
0.1%
Other
0.1%
Other
<0.1%
Other
<0.1%
2.6% 2.4% 2.3% 2.2%
Waste
2.3%4.5% 4.1% 3.7% 3.5%
Industrial
process3.6%
Transport
sector
20.0%
Transport
sector
18.4%
Transport
sector
18.3%
Transport
sector
17.1%
Transport
sector
17.4%
Residential
sector
12.7%
Residential
sector
13.8%
Residential
sector
14.3%
Residential
sector
15.4%
Residential
sector
15.1%
Commercial
sector
16.5%
Commercial
sector
18.3%
Commercial
sector
18.0%
Commercial
sector
21.2%
Commercial
sector
20.9%
Industrial
sector
36.6%
Industrial
sector
35.0%
Industrial
sector
34.1%
Industrial
sector
32.9%
Industrial
sector
33.3%
7.0% 7.9% 9.1% 7.5%
Energy conversion sector 7.4%
0%
10%
20%
30%
40%
50%
60%
70%
80%
90%
100%
FY 2000 FY 2005 FY 2010 FY 2013 FY 2014
(1.27Billion t-CO2) (1.31Billion t-CO2)(1.31Billion t-CO2) (1.27Billion t-CO2)(1.21Billion t-CO2)
Waste(29Mt-CO2)
Industrial process(46Mt-CO2)
Transport sector(220Mt-CO2)
Residential sector
(191Mt-CO2)
Commercial sector
(264Mt-CO2)
Industrial sector
(421Mt-CO2)
Energy conversion
sector(93Mt-CO2)1,156 1,164 1,175 1,168
1,229 1,242 1,255 1,253 1,218
1,253 1,274 1,257 1,294 1,299 1,298 1,306 1,285
1,320
1,236
1,163 1,213
1,262 1,296 1,312
1,266
Other(1Mt-CO2)0
200
400
600
800
1,000
1,200
1,400
1990 1991 1992 1993 1994 1995 1996 1997 1998 1999 2000 2001 2002 2003 2004 2005 2006 2007 2008 2009 2010 2011 2012 2013 2014
(Mt-CO2)
(FY)
3 Total Greenhouse Gas Emissions
27
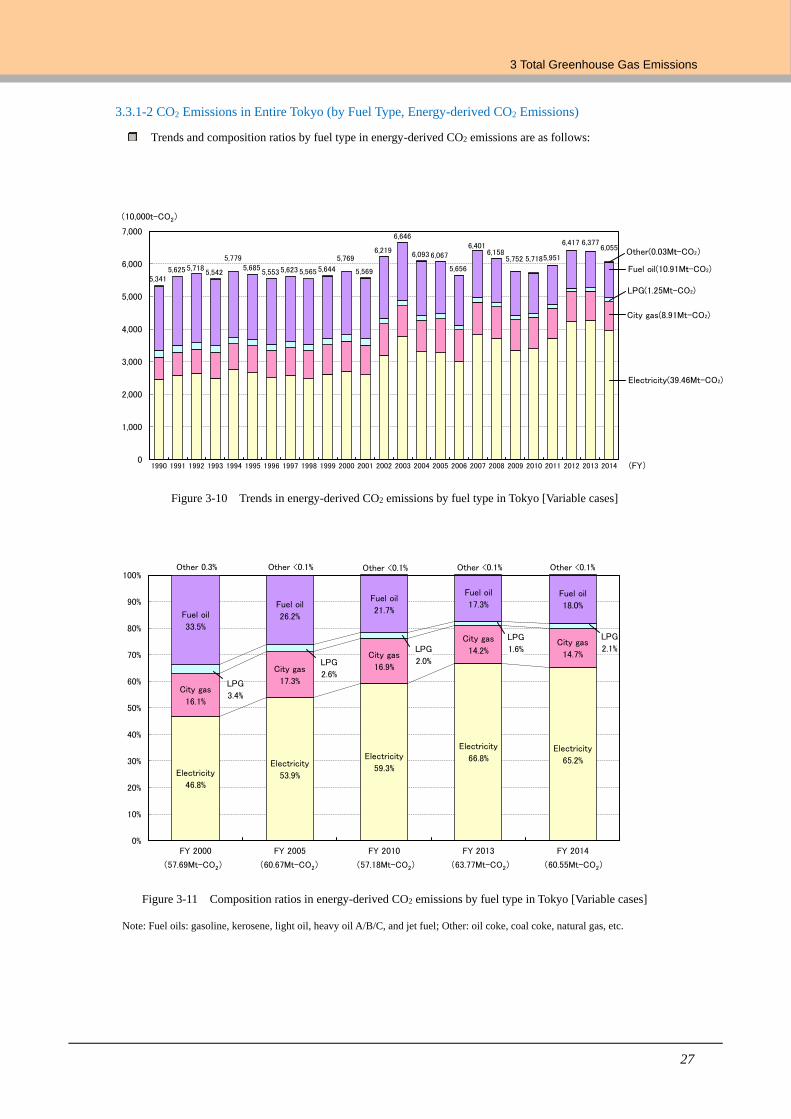
3.3.1-2 CO2 Emissions in Entire Tokyo (by Fuel Type, Energy-derived CO2 Emissions)
Trends and composition ratios by fuel type in energy-derived CO2 emissions are as follows:
Figure 3-10 Trends in energy-derived CO2 emissions by fuel type in Tokyo [Variable cases]
Figure 3-11 Composition ratios in energy-derived CO2 emissions by fuel type in Tokyo [Variable cases]
Note: Fuel oils: gasoline, kerosene, light oil, heavy oil A/B/C, and jet fuel; Other: oil coke, coal coke, natural gas, etc.
Electricity
46.8%
Electricity
53.9%
Electricity
59.3%
Electricity
66.8%Electricity
65.2%
City gas
16.1%
City gas
17.3%
City gas
16.9%
City gas
14.2%City gas
14.7%
LPG
3.4%
LPG
2.6%
LPG
2.0%
LPG
1.6%
LPG
2.1%
Fuel oil
33.5%
Fuel oil
26.2%
Fuel oil
21.7%
Fuel oil
17.3%Fuel oil
18.0%
Other 0.3% Other <0.1% Other <0.1% Other <0.1% Other <0.1%
0%
10%
20%
30%
40%
50%
60%
70%
80%
90%
100%
FY 2000 FY 2005 FY 2010 FY 2013 FY 2014
(57.69Mt-CO2) (60.67Mt-CO2) (63.77Mt-CO2) (60.55Mt-CO2)(57.18Mt-CO2)
Electricity(39.46Mt-CO2)
City gas(8.91Mt-CO2)
LPG(1.25Mt-CO2)
Fuel oil(10.91Mt-CO2)
Other(0.03Mt-CO2)
5,3415,625 5,718
5,542
5,7795,685
5,553 5,623 5,565 5,644
5,769
5,569
6,219
6,646
6,093 6,067
5,656
6,4016,158
5,752 5,7185,951
6,417 6,3776,055
0
1,000
2,000
3,000
4,000
5,000
6,000
7,000
1990 1991 1992 1993 1994 1995 1996 1997 1998 1999 2000 2001 2002 2003 2004 2005 2006 2007 2008 2009 2010 2011 2012 2013 2014 (FY)
(10,000t-CO2)
Final Energy Consumption and Greenhouse Gas Emissions in Tokyo
28
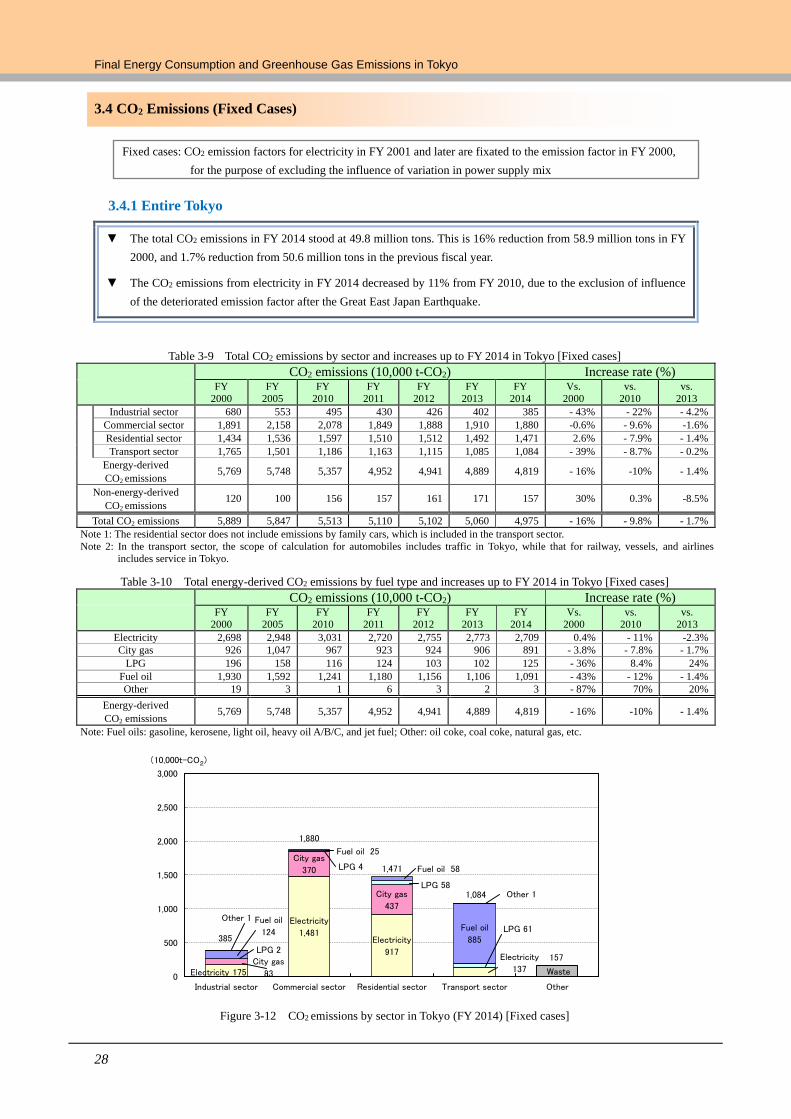
3.4 CO2 Emissions (Fixed Cases)
Fixed cases: CO2 emission factors for electricity in FY 2001 and later are fixated to the emission factor in FY 2000,
for the purpose of excluding the influence of variation in power supply mix
3.4.1 Entire Tokyo
▼ The total CO2 emissions in FY 2014 stood at 49.8 million tons. This is 16% reduction from 58.9 million tons in FY
2000, and 1.7% reduction from 50.6 million tons in the previous fiscal year.
▼ The CO2 emissions from electricity in FY 2014 decreased by 11% from FY 2010, due to the exclusion of influence
of the deteriorated emission factor after the Great East Japan Earthquake.
Table 3-9 Total CO2 emissions by sector and increases up to FY 2014 in Tokyo [Fixed cases] CO2 emissions (10,000 t-CO2) Increase rate (%) FY
2000
FY
2005
FY
2010
FY
2011
FY
2012
FY
2013
FY
2014
Vs.
2000
vs.
2010
vs.
2013
Industrial sector 680 553 495 430 426 402 385 - 43% - 22% - 4.2%
Commercial sector 1,891 2,158 2,078 1,849 1,888 1,910 1,880 -0.6% - 9.6% -1.6%
Residential sector 1,434 1,536 1,597 1,510 1,512 1,492 1,471 2.6% - 7.9% - 1.4%
Transport sector 1,765 1,501 1,186 1,163 1,115 1,085 1,084 - 39% - 8.7% - 0.2%
Energy-derived
CO2 emissions 5,769 5,748 5,357 4,952 4,941 4,889 4,819 - 16% -10% - 1.4%
Non-energy-derived
CO2 emissions 120 100 156 157 161 171 157 30% 0.3% -8.5%
Total CO2 emissions 5,889 5,847 5,513 5,110 5,102 5,060 4,975 - 16% - 9.8% - 1.7%
Note 1: The residential sector does not include emissions by family cars, which is included in the transport sector.
Note 2: In the transport sector, the scope of calculation for automobiles includes traffic in Tokyo, while that for railway, vessels, and airlines
includes service in Tokyo.
Table 3-10 Total energy-derived CO2 emissions by fuel type and increases up to FY 2014 in Tokyo [Fixed cases]
CO2 emissions (10,000 t-CO2) Increase rate (%)
FY
2000
FY
2005
FY
2010
FY
2011
FY
2012
FY
2013
FY
2014
Vs.
2000
vs.
2010
vs.
2013
Electricity 2,698 2,948 3,031 2,720 2,755 2,773 2,709 0.4% - 11% -2.3%
City gas 926 1,047 967 923 924 906 891 - 3.8% - 7.8% - 1.7%
LPG 196 158 116 124 103 102 125 - 36% 8.4% 24%
Fuel oil 1,930 1,592 1,241 1,180 1,156 1,106 1,091 - 43% - 12% - 1.4%
Other 19 3 1 6 3 2 3 - 87% 70% 20%
Energy-derived
CO2 emissions 5,769 5,748 5,357 4,952 4,941 4,889 4,819 - 16% -10% - 1.4%
Note: Fuel oils: gasoline, kerosene, light oil, heavy oil A/B/C, and jet fuel; Other: oil coke, coal coke, natural gas, etc.
Figure 3-12 CO2 emissions by sector in Tokyo (FY 2014) [Fixed cases]
Electricity 175
Electricity
1,481Electricity
917Electricity
137City gas
83
City gas
370
City gas
437
LPG 2
LPG 4
LPG 58
LPG 61Fuel oil
124
Fuel oil 25
Fuel oil 58
Fuel oil
885
Other 1
Other 1
Waste
385
1,880
1,471
1,084
157
0
500
1,000
1,500
2,000
2,500
3,000
Industrial sector Commercial sector Residential sector Transport sector Other
(10,000t-CO2)
3 Total Greenhouse Gas Emissions
29
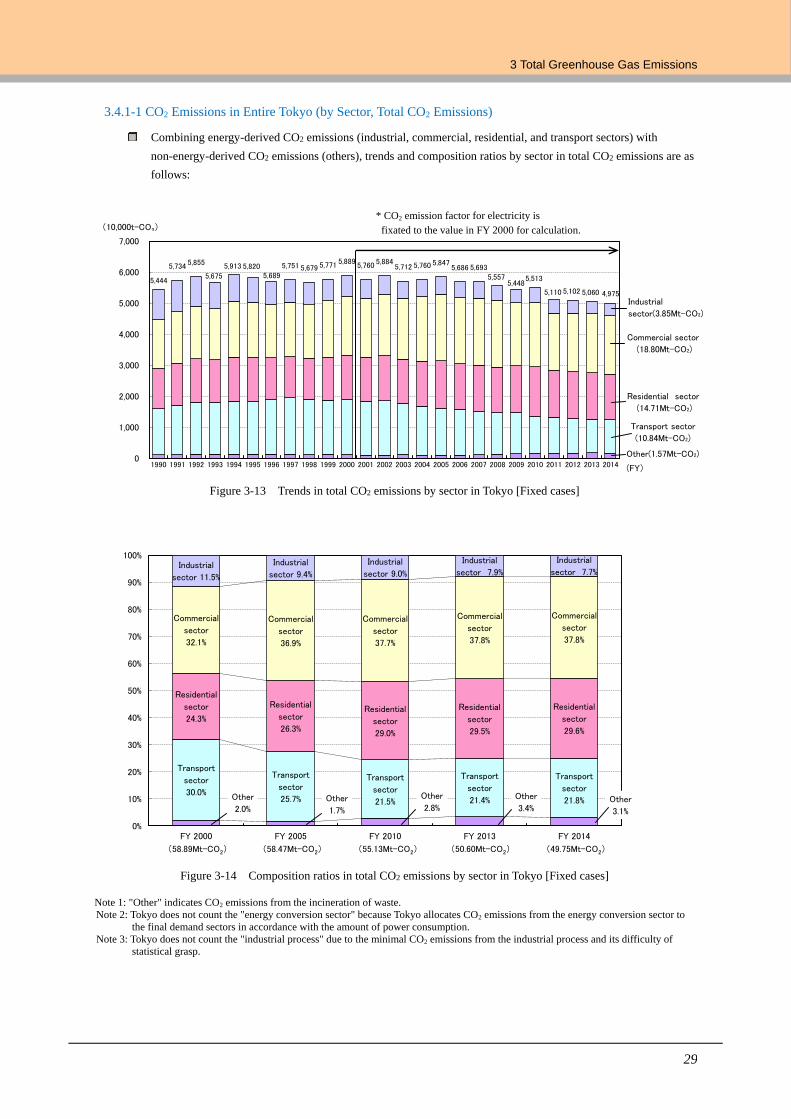
3.4.1-1 CO2 Emissions in Entire Tokyo (by Sector, Total CO2 Emissions)
Combining energy-derived CO2 emissions (industrial, commercial, residential, and transport sectors) with
non-energy-derived CO2 emissions (others), trends and composition ratios by sector in total CO2 emissions are as
follows:
Figure 3-13 Trends in total CO2 emissions by sector in Tokyo [Fixed cases]
Figure 3-14 Composition ratios in total CO2 emissions by sector in Tokyo [Fixed cases]
Note 1: "Other" indicates CO2 emissions from the incineration of waste.
Note 2: Tokyo does not count the "energy conversion sector" because Tokyo allocates CO2 emissions from the energy conversion sector to
the final demand sectors in accordance with the amount of power consumption.
Note 3: Tokyo does not count the "industrial process" due to the minimal CO2 emissions from the industrial process and its difficulty of
statistical grasp.
Other
2.0%Other
1.7%
Other
2.8%
Other
3.4%Other
3.1%
Transport
sector
30.0%
Transport
sector
25.7%
Transport
sector
21.5%
Transport
sector
21.4%
Transport
sector
21.8%
Residential
sector
24.3%
Residential
sector
26.3%
Residential
sector
29.0%
Residential
sector
29.5%
Residential
sector
29.6%
Commercial
sector
32.1%
Commercial
sector
36.9%
Commercial
sector
37.7%
Commercial
sector
37.8%
Commercial
sector
37.8%
Industrial
sector 11.5%
Industrial
sector 9.4%
Industrial
sector 9.0%
Industrial
sector 7.9%
Industrial
sector 7.7%
0%
10%
20%
30%
40%
50%
60%
70%
80%
90%
100%
FY 2000 FY 2005 FY 2010 FY 2013 FY 2014
(58.89Mt-CO2) (50.60Mt-CO2) (49.75Mt-CO2)(58.47Mt-CO2) (55.13Mt-CO2)
Other(1.57Mt-CO2)
Transport sector
(10.84Mt-CO2)
Residential sector
(14.71Mt-CO2)
Commercial sector
(18.80Mt-CO2)
Industrial
sector(3.85Mt-CO2)
5,444
5,734 5,855
5,675
5,913 5,820 5,689
5,751 5,679 5,771 5,889 5,760 5,884
5,712 5,760 5,847 5,686 5,693
5,557 5,448
5,513
5,110 5,102 5,060 4,975
0
1,000
2,000
3,000
4,000
5,000
6,000
7,000
1990 1991 1992 1993 1994 1995 1996 1997 1998 1999 2000 2001 2002 2003 2004 2005 2006 2007 2008 2009 2010 2011 2012 2013 2014 (FY)
(10,000t-CO2)* CO2 emission factor for electricity is
fixated to the value in FY 2000 for calculation.
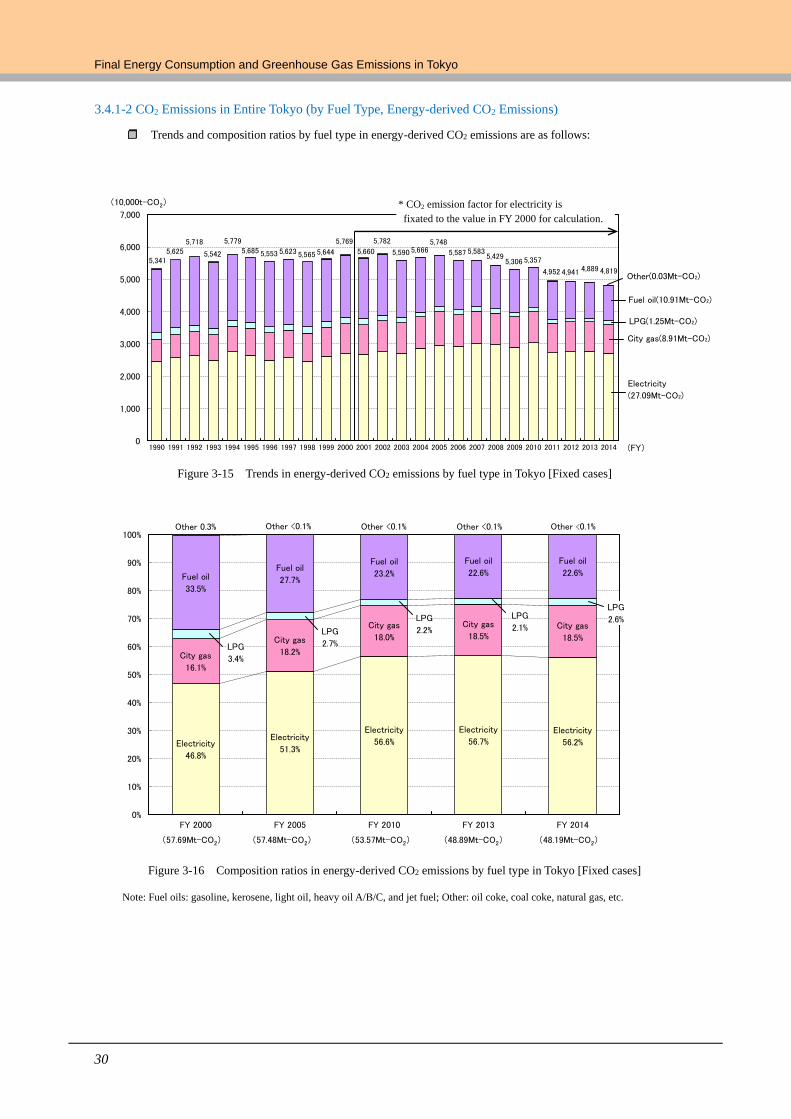
Final Energy Consumption and Greenhouse Gas Emissions in Tokyo
30
3.4.1-2 CO2 Emissions in Entire Tokyo (by Fuel Type, Energy-derived CO2 Emissions)
Trends and composition ratios by fuel type in energy-derived CO2 emissions are as follows:
Figure 3-15 Trends in energy-derived CO2 emissions by fuel type in Tokyo [Fixed cases]
Figure 3-16 Composition ratios in energy-derived CO2 emissions by fuel type in Tokyo [Fixed cases]
Note: Fuel oils: gasoline, kerosene, light oil, heavy oil A/B/C, and jet fuel; Other: oil coke, coal coke, natural gas, etc.
Electricity
46.8%
Electricity
51.3%
Electricity
56.6%
Electricity
56.7%Electricity
56.2%
City gas
16.1%
City gas
18.2%
City gas
18.0%
City gas
18.5%City gas
18.5%LPG
3.4%
LPG
2.7%
LPG
2.2%
LPG
2.1%
LPG
2.6%
Fuel oil
33.5%
Fuel oil
27.7%
Fuel oil
23.2%
Fuel oil
22.6%
Fuel oil
22.6%
Other 0.3% Other <0.1% Other <0.1% Other <0.1% Other <0.1%
0%
10%
20%
30%
40%
50%
60%
70%
80%
90%
100%
FY 2000 FY 2005 FY 2010 FY 2013 FY 2014
(57.69Mt-CO2) (48.89Mt-CO2) (48.19Mt-CO2)(57.48Mt-CO2) (53.57Mt-CO2)
Electricity
(27.09Mt-CO2)
City gas(8.91Mt-CO2)
LPG(1.25Mt-CO2)
Fuel oil(10.91Mt-CO2)
Other(0.03Mt-CO2)
5,3415,625
5,718
5,542
5,7795,685 5,553 5,623 5,565 5,644
5,769
5,660
5,782
5,590 5,6665,748
5,587 5,5835,429
5,306 5,357
4,952 4,941 4,889 4,819
0
1,000
2,000
3,000
4,000
5,000
6,000
7,000
1990 1991 1992 1993 1994 1995 1996 1997 1998 1999 2000 2001 2002 2003 2004 2005 2006 2007 2008 2009 2010 2011 2012 2013 2014 (FY)
(10,000t-CO2) * CO2 emission factor for electricity is
fixated to the value in FY 2000 for calculation.
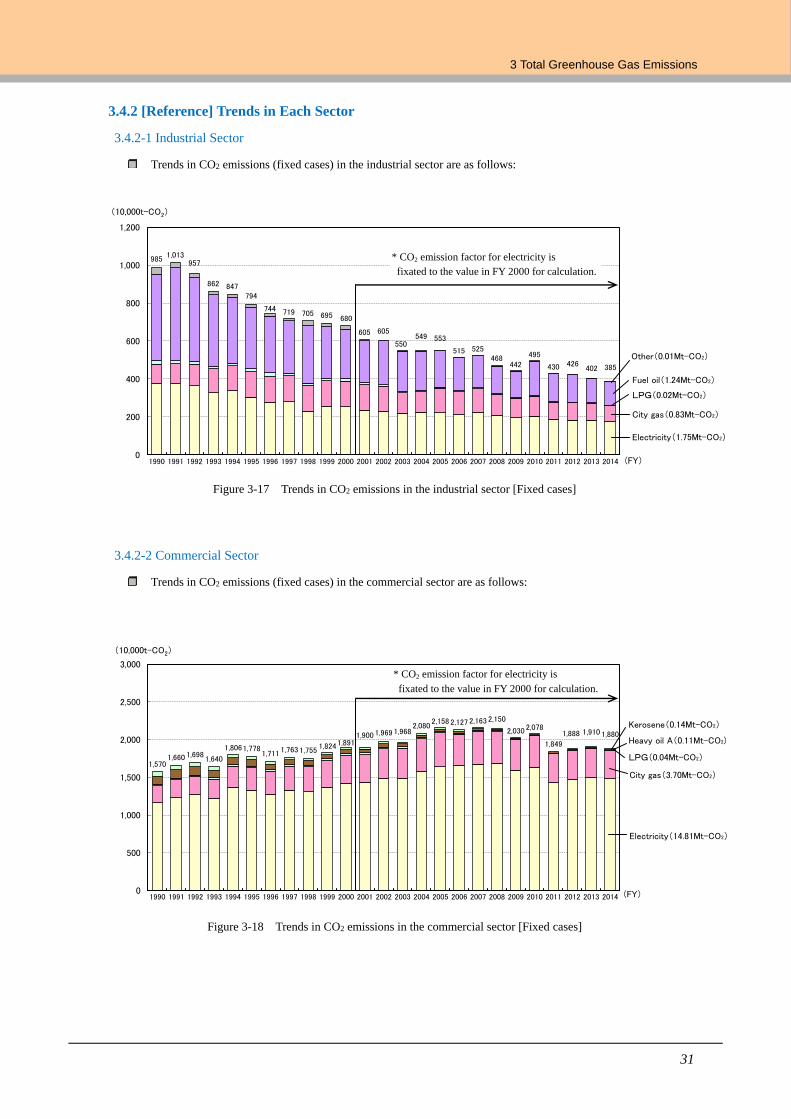
3 Total Greenhouse Gas Emissions
31
3.4.2 [Reference] Trends in Each Sector
3.4.2-1 Industrial Sector
Trends in CO2 emissions (fixed cases) in the industrial sector are as follows:
Figure 3-17 Trends in CO2 emissions in the industrial sector [Fixed cases]
3.4.2-2 Commercial Sector
Trends in CO2 emissions (fixed cases) in the commercial sector are as follows:
Figure 3-18 Trends in CO2 emissions in the commercial sector [Fixed cases]
985 1,013
957
862 847 794
744 719 705 695 680
605 605
550 549 553
515 525 468
442
495
430 426 402 385
0
200
400
600
800
1,000
1,200
1990 1991 1992 1993 1994 1995 1996 1997 1998 1999 2000 2001 2002 2003 2004 2005 2006 2007 2008 2009 2010 2011 2012 2013 2014 (FY)
Other(0.01Mt-CO2)
Fuel oil(1.24Mt-CO2)
LPG(0.02Mt-CO2)
City gas(0.83Mt-CO2)
Electricity(1.75Mt-CO2)
(10,000t-CO2)
1,5701,660 1,698
1,640
1,8061,7781,711 1,763 1,755
1,8241,8911,900 1,969 1,968
2,0802,158 2,127 2,163 2,150
2,030 2,078
1,849
1,888 1,910 1,880
0
500
1,000
1,500
2,000
2,500
3,000
1990 1991 1992 1993 1994 1995 1996 1997 1998 1999 2000 2001 2002 2003 2004 2005 2006 2007 2008 2009 2010 2011 2012 2013 2014 (FY)
Kerosene(0.14Mt-CO2)
Heavy oil A(0.11Mt-CO2)
LPG(0.04Mt-CO2)
City gas(3.70Mt-CO2)
Electricity(14.81Mt-CO2)
(10,000t-CO2)
* CO2 emission factor for electricity is
fixated to the value in FY 2000 for calculation.
* CO2 emission factor for electricity is
fixated to the value in FY 2000 for calculation.
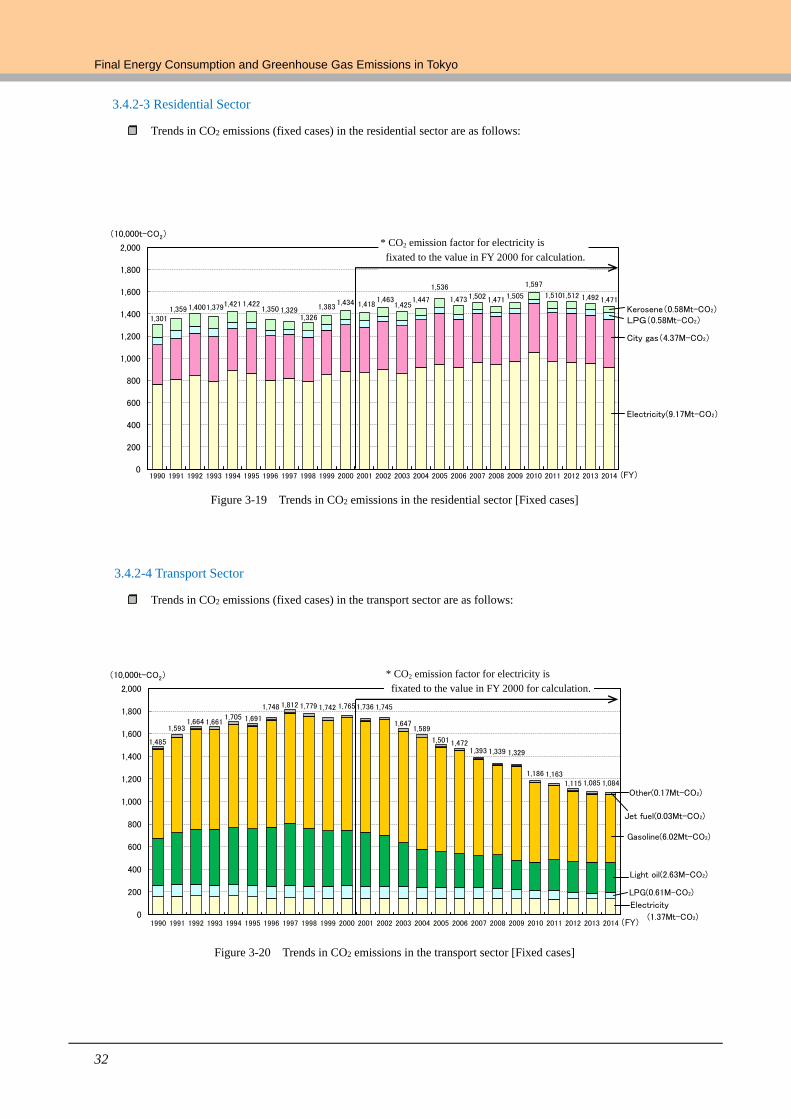
Final Energy Consumption and Greenhouse Gas Emissions in Tokyo
32
3.4.2-3 Residential Sector
Trends in CO2 emissions (fixed cases) in the residential sector are as follows:
Figure 3-19 Trends in CO2 emissions in the residential sector [Fixed cases]
3.4.2-4 Transport Sector
Trends in CO2 emissions (fixed cases) in the transport sector are as follows:
Figure 3-20 Trends in CO2 emissions in the transport sector [Fixed cases]
1,485
1,5931,664 1,661
1,705 1,691
1,748 1,812 1,779 1,742 1,7651,736 1,745
1,6471,589
1,501 1,4721,393 1,339 1,329
1,186 1,1631,115 1,085 1,084
0
200
400
600
800
1,000
1,200
1,400
1,600
1,800
2,000
1990 1991 1992 1993 1994 1995 1996 1997 1998 1999 2000 2001 2002 2003 2004 2005 2006 2007 2008 2009 2010 2011 2012 2013 2014
(10,000t-CO2)
(FY)
Electricity
(1.37Mt-CO2)
LPG(0.61M-CO2)
Light oil(2.63M-CO2)
Gasoline(6.02Mt-CO2)
Jet fuel(0.03Mt-CO2)
Other(0.17Mt-CO2)
1,3011,359 1,4001,3791,421 1,422
1,350 1,3291,326
1,3831,434 1,418
1,4631,425
1,447
1,536
1,473 1,502 1,471 1,505
1,597
1,5101,512 1,492 1,471
0
200
400
600
800
1,000
1,200
1,400
1,600
1,800
2,000
1990 1991 1992 1993 1994 1995 1996 1997 1998 1999 2000 2001 2002 2003 2004 2005 2006 2007 2008 2009 2010 2011 2012 2013 2014
(10,000t-CO2)
(FY)
Kerosene(0.58Mt-CO2)LPG(0.58Mt-CO2)
City gas(4.37M-CO2)
Electricity(9.17Mt-CO2)
* CO2 emission factor for electricity is
fixated to the value in FY 2000 for calculation.
* CO2 emission factor for electricity is
fixated to the value in FY 2000 for calculation.
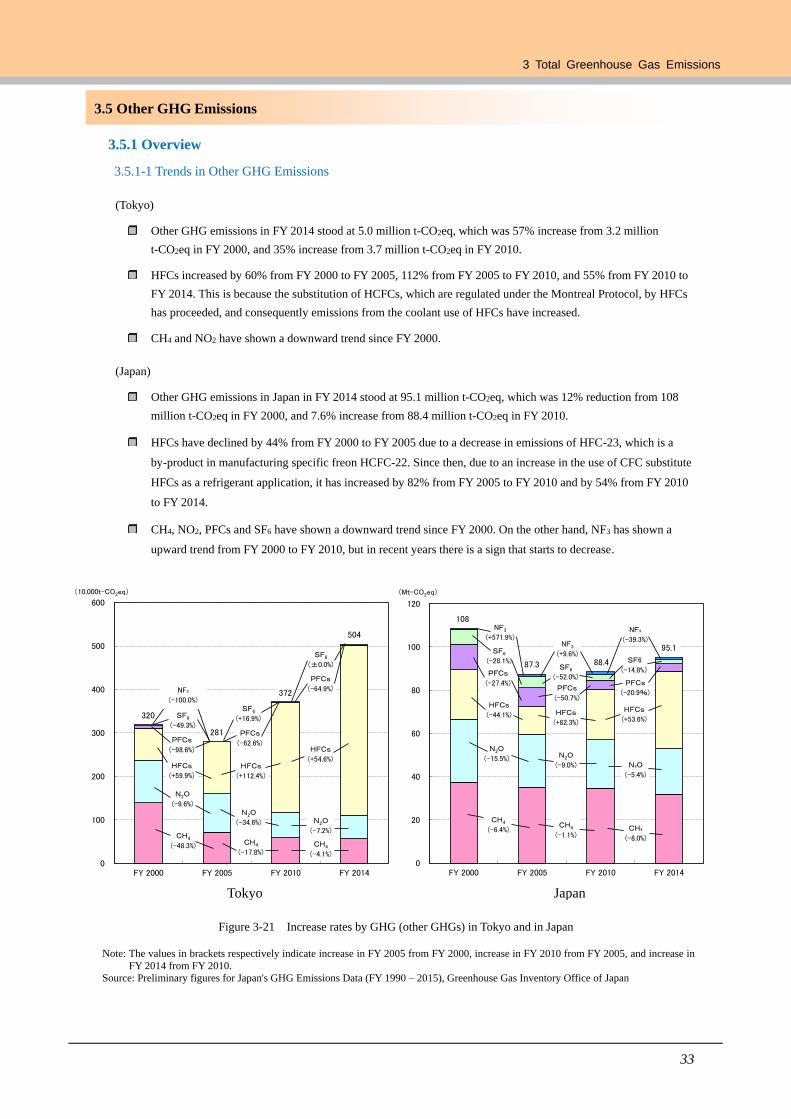
3 Total Greenhouse Gas Emissions
33
3.5 Other GHG Emissions
3.5.1 Overview
3.5.1-1 Trends in Other GHG Emissions
(Tokyo)
Other GHG emissions in FY 2014 stood at 5.0 million t-CO2eq, which was 57% increase from 3.2 million
t-CO2eq in FY 2000, and 35% increase from 3.7 million t-CO2eq in FY 2010.
HFCs increased by 60% from FY 2000 to FY 2005, 112% from FY 2005 to FY 2010, and 55% from FY 2010 to
FY 2014. This is because the substitution of HCFCs, which are regulated under the Montreal Protocol, by HFCs
has proceeded, and consequently emissions from the coolant use of HFCs have increased.
CH4 and NO2 have shown a downward trend since FY 2000.
(Japan)
Other GHG emissions in Japan in FY 2014 stood at 95.1 million t-CO2eq, which was 12% reduction from 108
million t-CO2eq in FY 2000, and 7.6% increase from 88.4 million t-CO2eq in FY 2010.
HFCs have declined by 44% from FY 2000 to FY 2005 due to a decrease in emissions of HFC-23, which is a
by-product in manufacturing specific freon HCFC-22. Since then, due to an increase in the use of CFC substitute
HFCs as a refrigerant application, it has increased by 82% from FY 2005 to FY 2010 and by 54% from FY 2010
to FY 2014.
CH4, NO2, PFCs and SF6 have shown a downward trend since FY 2000. On the other hand, NF3 has shown a
upward trend from FY 2000 to FY 2010, but in recent years there is a sign that starts to decrease.
Tokyo Japan
Figure 3-21 Increase rates by GHG (other GHGs) in Tokyo and in Japan
Note: The values in brackets respectively indicate increase in FY 2005 from FY 2000, increase in FY 2010 from FY 2005, and increase in
FY 2014 from FY 2010.
Source: Preliminary figures for Japan's GHG Emissions Data (FY 1990 – 2015), Greenhouse Gas Inventory Office of Japan
CH4
(-6.4%)CH4
(-1.1%)CH₄
(-8.0%)
N2O
(-15.5%) N2O
(-9.0%) N₂O
(-5.4%)
HFCs
(-44.1%) HFCs
(+82.3%)
HFCs
(+53.6%)
PFCs
(-27.4%)PFCs
(-50.7%)
PFCs
(-20.9%)
SF6
(-28.1%)SF6
(-52.0%)
SF6
(-14.8%)
NF3
(+571.9%)NF3
(+9.6%)
NF₃
(-39.3%)
108
87.3 88.4
95.1
0
20
40
60
80
100
120
FY 2000 FY 2005 FY 2010 FY 2014
(Mt-CO2eq)
CH4
(-48.3%) CH4
(-17.8%)CH4
(-4.1%)
N2O
(-9.6%)N2O
(-34.6%) N2O
(-7.2%)
HFCs
(+59.9%)
HFCs
(+112.4%)
HFCs
(+54.6%)
PFCs
(-98.6%)
PFCs
(-62.6%)
PFCs
(-64.9%)
SF6
(-49.3%)
SF6
(+16.9%)
SF6
(±0.0%)
320
281
372
504
0
100
200
300
400
500
600
FY 2000 FY 2005 FY 2010 FY 2014
(10,000t-CO2eq)
NF₃
(-100.0%)
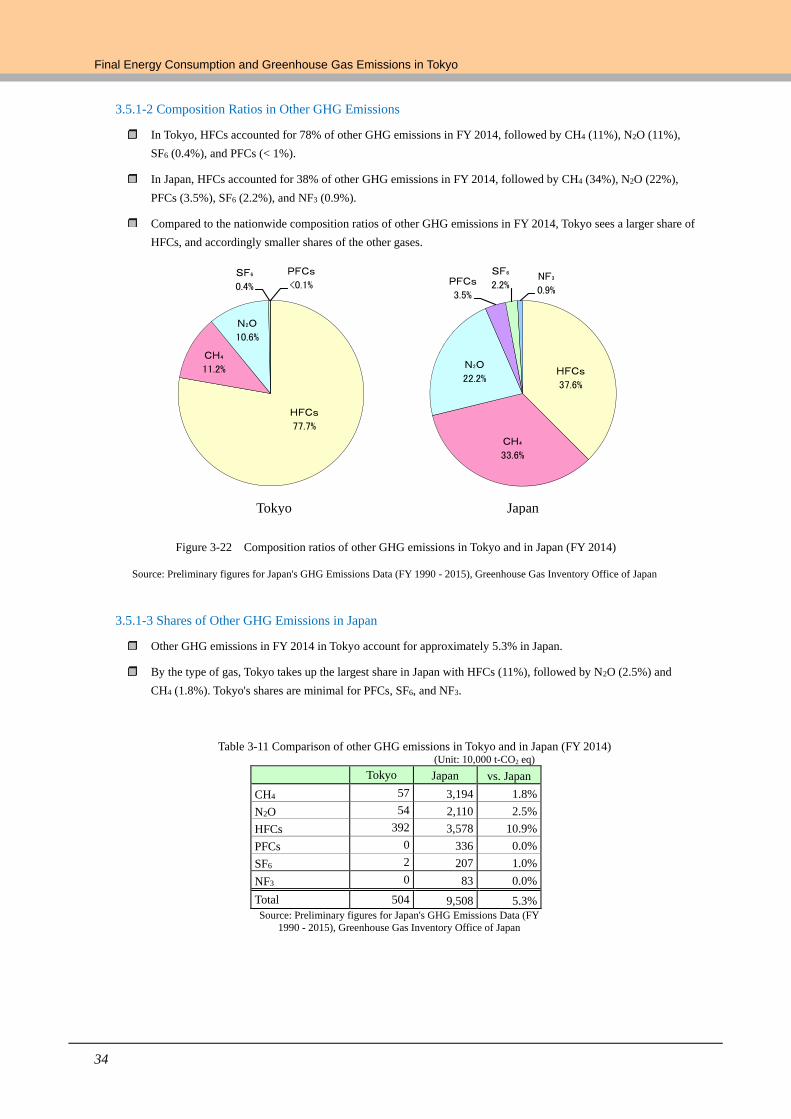
Final Energy Consumption and Greenhouse Gas Emissions in Tokyo
34
3.5.1-2 Composition Ratios in Other GHG Emissions
In Tokyo, HFCs accounted for 78% of other GHG emissions in FY 2014, followed by CH4 (11%), N2O (11%),
SF6 (0.4%), and PFCs (< 1%).
In Japan, HFCs accounted for 38% of other GHG emissions in FY 2014, followed by CH4 (34%), N2O (22%),
PFCs (3.5%), SF6 (2.2%), and NF3 (0.9%).
Compared to the nationwide composition ratios of other GHG emissions in FY 2014, Tokyo sees a larger share of
HFCs, and accordingly smaller shares of the other gases.
Tokyo Japan
Figure 3-22 Composition ratios of other GHG emissions in Tokyo and in Japan (FY 2014)
Source: Preliminary figures for Japan's GHG Emissions Data (FY 1990 - 2015), Greenhouse Gas Inventory Office of Japan
3.5.1-3 Shares of Other GHG Emissions in Japan
Other GHG emissions in FY 2014 in Tokyo account for approximately 5.3% in Japan.
By the type of gas, Tokyo takes up the largest share in Japan with HFCs (11%), followed by N2O (2.5%) and
CH4 (1.8%). Tokyo's shares are minimal for PFCs, SF6, and NF3.
Table 3-11 Comparison of other GHG emissions in Tokyo and in Japan (FY 2014) (Unit: 10,000 t-CO2 eq)
Tokyo Japan vs. Japan
CH4 57 3,194 1.8%
N2O 54 2,110 2.5%
HFCs 392 3,578 10.9%
PFCs 0 336 0.0%
SF6 2 207 1.0%
NF3 0 83 0.0%
Total 504 9,508 5.3%
Source: Preliminary figures for Japan's GHG Emissions Data (FY
1990 - 2015), Greenhouse Gas Inventory Office of Japan
HFCs
37.6%
CH₄
33.6%
N₂O
22.2%
PFCs
3.5%
SF₆
2.2%NF₃
0.9%
HFCs
77.7%
CH₄
11.2%
N₂O
10.6%
SF₆
0.4%
PFCs
<0.1%
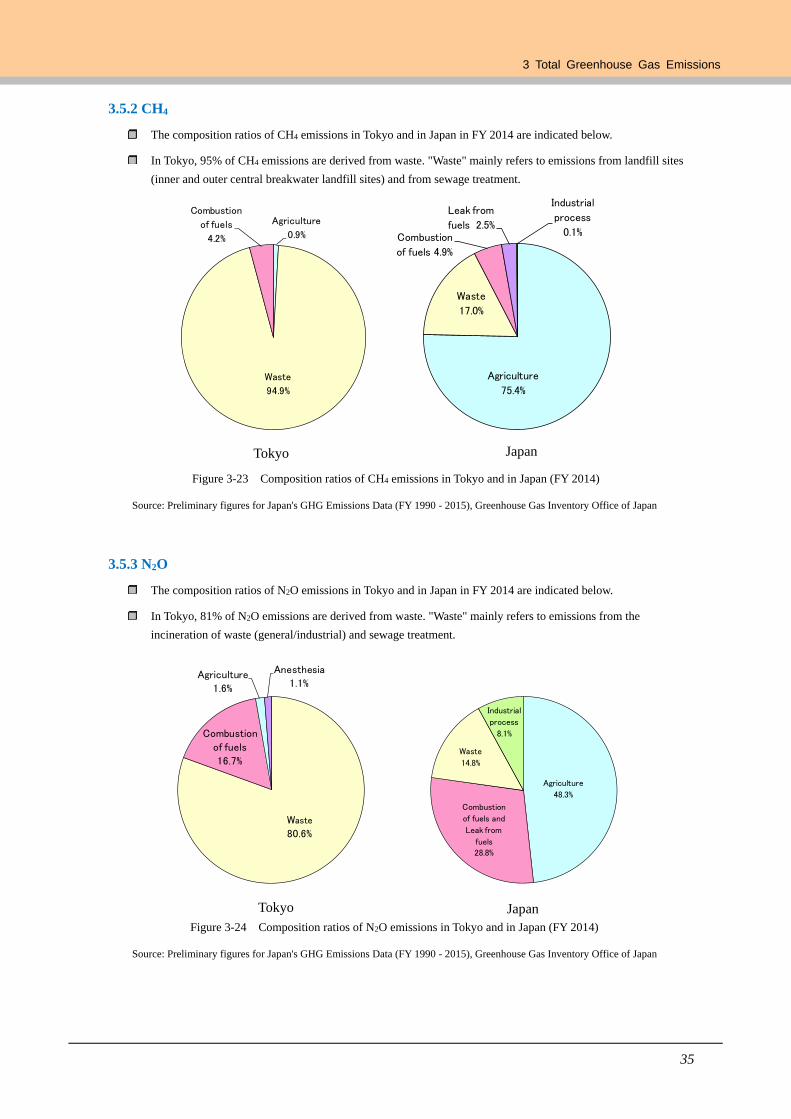
3 Total Greenhouse Gas Emissions
35
Agriculture
75.4%
Waste
17.0%
Combustion
of fuels 4.9%
Leak from
fuels 2.5%
Industrial
process
0.1%
3.5.2 CH4
The composition ratios of CH4 emissions in Tokyo and in Japan in FY 2014 are indicated below.
In Tokyo, 95% of CH4 emissions are derived from waste. "Waste" mainly refers to emissions from landfill sites
(inner and outer central breakwater landfill sites) and from sewage treatment.
Figure 3-23 Composition ratios of CH4 emissions in Tokyo and in Japan (FY 2014)
Source: Preliminary figures for Japan's GHG Emissions Data (FY 1990 - 2015), Greenhouse Gas Inventory Office of Japan
3.5.3 N2O
The composition ratios of N2O emissions in Tokyo and in Japan in FY 2014 are indicated below.
In Tokyo, 81% of N2O emissions are derived from waste. "Waste" mainly refers to emissions from the
incineration of waste (general/industrial) and sewage treatment.
Source: Preliminary figures for Japan's GHG Emissions Data (FY 1990 - 2015), Greenhouse Gas Inventory Office of Japan
Figure 3-24 Composition ratios of N2O emissions in Tokyo and in Japan (FY 2014)
Tokyo Japan
Japan Tokyo
Agriculture
0.9%
Waste
94.9%
Combustion
of fuels
4.2%
Waste
80.6%
Combustion
of fuels
16.7%
Agriculture
1.6%
Anesthesia
1.1%
Agriculture
48.3%
Combustion
of fuels and
Leak from
fuels
28.8%
Waste
14.8%
Industrial
process
8.1%
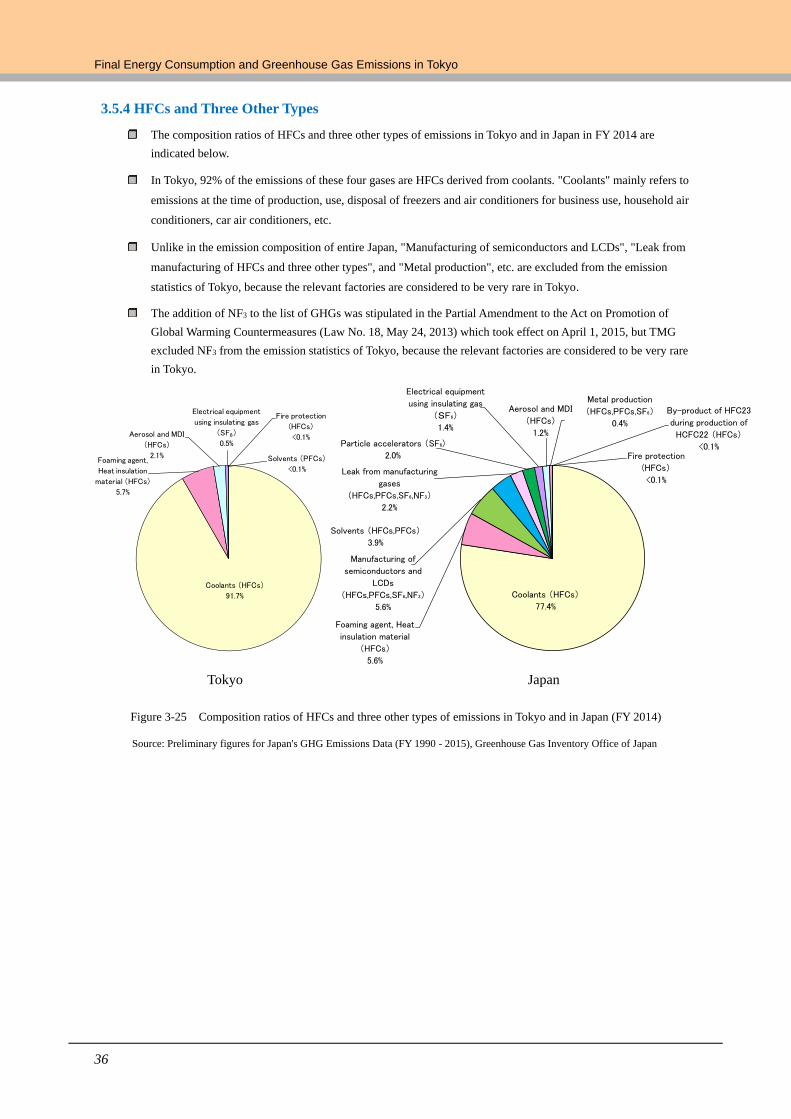
Final Energy Consumption and Greenhouse Gas Emissions in Tokyo
36
3.5.4 HFCs and Three Other Types
The composition ratios of HFCs and three other types of emissions in Tokyo and in Japan in FY 2014 are
indicated below.
In Tokyo, 92% of the emissions of these four gases are HFCs derived from coolants. "Coolants" mainly refers to
emissions at the time of production, use, disposal of freezers and air conditioners for business use, household air
conditioners, car air conditioners, etc.
Unlike in the emission composition of entire Japan, "Manufacturing of semiconductors and LCDs", "Leak from
manufacturing of HFCs and three other types", and "Metal production", etc. are excluded from the emission
statistics of Tokyo, because the relevant factories are considered to be very rare in Tokyo.
The addition of NF3 to the list of GHGs was stipulated in the Partial Amendment to the Act on Promotion of
Global Warming Countermeasures (Law No. 18, May 24, 2013) which took effect on April 1, 2015, but TMG
excluded NF3 from the emission statistics of Tokyo, because the relevant factories are considered to be very rare
in Tokyo.
Tokyo Japan
Figure 3-25 Composition ratios of HFCs and three other types of emissions in Tokyo and in Japan (FY 2014)
Source: Preliminary figures for Japan's GHG Emissions Data (FY 1990 - 2015), Greenhouse Gas Inventory Office of Japan
Coolants (HFCs)
77.4%
Foaming agent, Heat
insulation material
(HFCs)
5.6%
Manufacturing of
semiconductors and
LCDs
(HFCs,PFCs,SF₆,NF₃)
5.6%
Solvents (HFCs,PFCs)
3.9%
Leak from manufacturing
gases
(HFCs,PFCs,SF₆,NF₃)
2.2%
Particle accelerators (SF₆)
2.0%
Electrical equipment
using insulating gas
(SF₆)
1.4%
Aerosol and MDI
(HFCs)
1.2%
Metal production
(HFCs,PFCs,SF₆)
0.4%
By-product of HFC23
during production of
HCFC22 (HFCs)
<0.1%Fire protection
(HFCs)
<0.1%
Coolants (HFCs)
91.7%
Foaming agent,
Heat insulation
material (HFCs)
5.7%
Aerosol and MDI
(HFCs)
2.1%
Electrical equipment
using insulating gas
(SF6)
0.5%
Fire protection
(HFCs)
<0.1%
Solvents (PFCs)
<0.1%
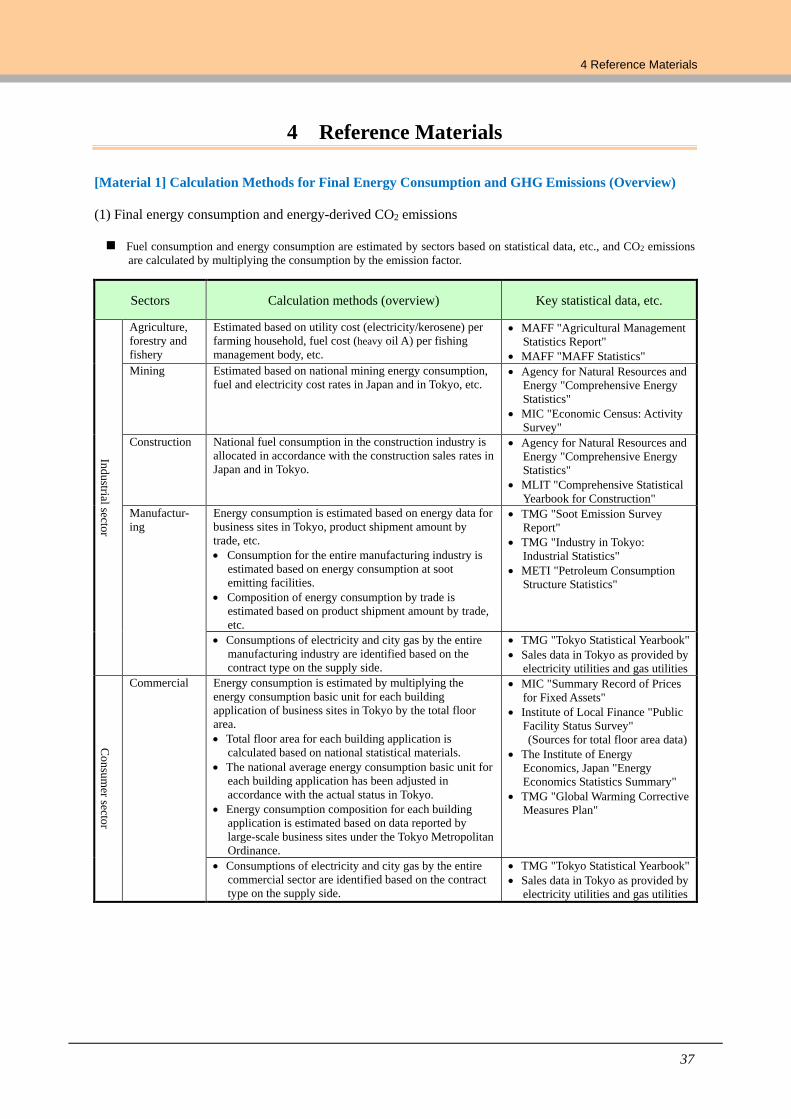
4 Reference Materials
37
4 Reference Materials
[Material 1] Calculation Methods for Final Energy Consumption and GHG Emissions (Overview)
(1) Final energy consumption and energy-derived CO2 emissions
Fuel consumption and energy consumption are estimated by sectors based on statistical data, etc., and CO2 emissions
are calculated by multiplying the consumption by the emission factor.
Sectors Calculation methods (overview) Key statistical data, etc.
Industrial secto
r
Agriculture,
forestry and
fishery
Estimated based on utility cost (electricity/kerosene) per
farming household, fuel cost (heavy oil A) per fishing
management body, etc.
MAFF "Agricultural Management
Statistics Report"
MAFF "MAFF Statistics"
Mining Estimated based on national mining energy consumption,
fuel and electricity cost rates in Japan and in Tokyo, etc. Agency for Natural Resources and
Energy "Comprehensive Energy
Statistics"
MIC "Economic Census: Activity
Survey"
Construction National fuel consumption in the construction industry is
allocated in accordance with the construction sales rates in
Japan and in Tokyo.
Agency for Natural Resources and
Energy "Comprehensive Energy
Statistics"
MLIT "Comprehensive Statistical
Yearbook for Construction"
Manufactur-
ing
Energy consumption is estimated based on energy data for
business sites in Tokyo, product shipment amount by
trade, etc.
Consumption for the entire manufacturing industry is
estimated based on energy consumption at soot
emitting facilities.
Composition of energy consumption by trade is
estimated based on product shipment amount by trade,
etc.
TMG "Soot Emission Survey
Report"
TMG "Industry in Tokyo:
Industrial Statistics"
METI "Petroleum Consumption
Structure Statistics"
Consumptions of electricity and city gas by the entire
manufacturing industry are identified based on the
contract type on the supply side.
TMG "Tokyo Statistical Yearbook"
Sales data in Tokyo as provided by
electricity utilities and gas utilities
Consu
mer secto
r Commercial Energy consumption is estimated by multiplying the
energy consumption basic unit for each building
application of business sites in Tokyo by the total floor
area.
Total floor area for each building application is
calculated based on national statistical materials.
The national average energy consumption basic unit for
each building application has been adjusted in
accordance with the actual status in Tokyo.
Energy consumption composition for each building
application is estimated based on data reported by
large-scale business sites under the Tokyo Metropolitan
Ordinance.
MIC "Summary Record of Prices
for Fixed Assets"
Institute of Local Finance "Public
Facility Status Survey"
(Sources for total floor area data)
The Institute of Energy
Economics, Japan "Energy
Economics Statistics Summary"
TMG "Global Warming Corrective
Measures Plan"
Consumptions of electricity and city gas by the entire
commercial sector are identified based on the contract
type on the supply side.
TMG "Tokyo Statistical Yearbook"
Sales data in Tokyo as provided by
electricity utilities and gas utilities
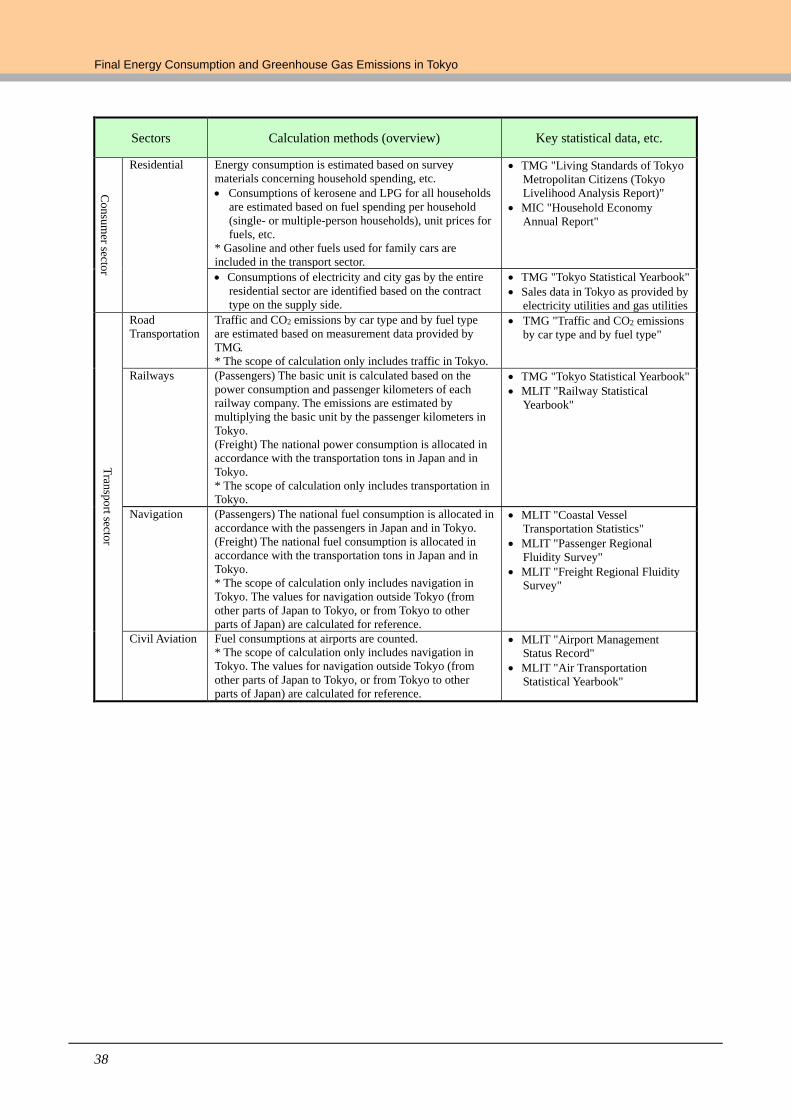
Final Energy Consumption and Greenhouse Gas Emissions in Tokyo
38
Sectors Calculation methods (overview) Key statistical data, etc.
Consu
mer secto
r
Residential Energy consumption is estimated based on survey
materials concerning household spending, etc.
Consumptions of kerosene and LPG for all households
are estimated based on fuel spending per household
(single- or multiple-person households), unit prices for
fuels, etc.
* Gasoline and other fuels used for family cars are
included in the transport sector.
TMG "Living Standards of Tokyo
Metropolitan Citizens (Tokyo
Livelihood Analysis Report)"
MIC "Household Economy
Annual Report"
Consumptions of electricity and city gas by the entire
residential sector are identified based on the contract
type on the supply side.
TMG "Tokyo Statistical Yearbook"
Sales data in Tokyo as provided by
electricity utilities and gas utilities
Tran
sport secto
r
Road
Transportation
Traffic and CO2 emissions by car type and by fuel type
are estimated based on measurement data provided by
TMG.
* The scope of calculation only includes traffic in Tokyo.
TMG "Traffic and CO2 emissions
by car type and by fuel type"
Railways (Passengers) The basic unit is calculated based on the
power consumption and passenger kilometers of each
railway company. The emissions are estimated by
multiplying the basic unit by the passenger kilometers in
Tokyo.
(Freight) The national power consumption is allocated in
accordance with the transportation tons in Japan and in
Tokyo.
* The scope of calculation only includes transportation in
Tokyo.
TMG "Tokyo Statistical Yearbook"
MLIT "Railway Statistical
Yearbook"
Navigation (Passengers) The national fuel consumption is allocated in
accordance with the passengers in Japan and in Tokyo.
(Freight) The national fuel consumption is allocated in
accordance with the transportation tons in Japan and in
Tokyo.
* The scope of calculation only includes navigation in
Tokyo. The values for navigation outside Tokyo (from
other parts of Japan to Tokyo, or from Tokyo to other
parts of Japan) are calculated for reference.
MLIT "Coastal Vessel
Transportation Statistics"
MLIT "Passenger Regional
Fluidity Survey"
MLIT "Freight Regional Fluidity
Survey"
Civil Aviation Fuel consumptions at airports are counted.
* The scope of calculation only includes navigation in
Tokyo. The values for navigation outside Tokyo (from
other parts of Japan to Tokyo, or from Tokyo to other
parts of Japan) are calculated for reference.
MLIT "Airport Management
Status Record"
MLIT "Air Transportation
Statistical Yearbook"
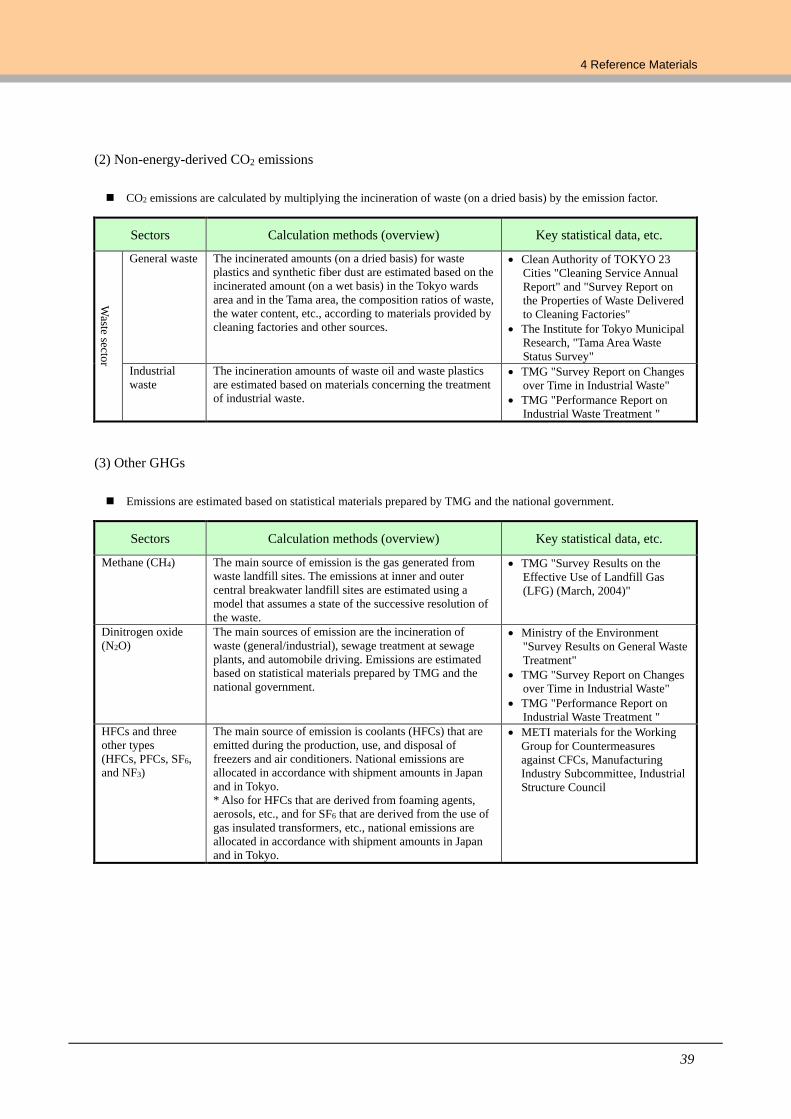
4 Reference Materials
39
(2) Non-energy-derived CO2 emissions
CO2 emissions are calculated by multiplying the incineration of waste (on a dried basis) by the emission factor.
Sectors Calculation methods (overview) Key statistical data, etc.
Waste secto
r
General waste The incinerated amounts (on a dried basis) for waste
plastics and synthetic fiber dust are estimated based on the
incinerated amount (on a wet basis) in the Tokyo wards
area and in the Tama area, the composition ratios of waste,
the water content, etc., according to materials provided by
cleaning factories and other sources.
Clean Authority of TOKYO 23
Cities "Cleaning Service Annual
Report" and "Survey Report on
the Properties of Waste Delivered
to Cleaning Factories"
The Institute for Tokyo Municipal
Research, "Tama Area Waste
Status Survey"
Industrial
waste
The incineration amounts of waste oil and waste plastics
are estimated based on materials concerning the treatment
of industrial waste.
TMG "Survey Report on Changes
over Time in Industrial Waste"
TMG "Performance Report on
Industrial Waste Treatment "
(3) Other GHGs
Emissions are estimated based on statistical materials prepared by TMG and the national government.
Sectors Calculation methods (overview) Key statistical data, etc.
Methane (CH4) The main source of emission is the gas generated from
waste landfill sites. The emissions at inner and outer
central breakwater landfill sites are estimated using a
model that assumes a state of the successive resolution of
the waste.
TMG "Survey Results on the
Effective Use of Landfill Gas
(LFG) (March, 2004)"
Dinitrogen oxide
(N2O)
The main sources of emission are the incineration of
waste (general/industrial), sewage treatment at sewage
plants, and automobile driving. Emissions are estimated
based on statistical materials prepared by TMG and the
national government.
Ministry of the Environment
"Survey Results on General Waste
Treatment"
TMG "Survey Report on Changes
over Time in Industrial Waste"
TMG "Performance Report on
Industrial Waste Treatment "
HFCs and three
other types
(HFCs, PFCs, SF6,
and NF3)
The main source of emission is coolants (HFCs) that are
emitted during the production, use, and disposal of
freezers and air conditioners. National emissions are
allocated in accordance with shipment amounts in Japan
and in Tokyo.
* Also for HFCs that are derived from foaming agents,
aerosols, etc., and for SF6 that are derived from the use of
gas insulated transformers, etc., national emissions are
allocated in accordance with shipment amounts in Japan
and in Tokyo.
METI materials for the Working
Group for Countermeasures
against CFCs, Manufacturing
Industry Subcommittee, Industrial
Structure Council
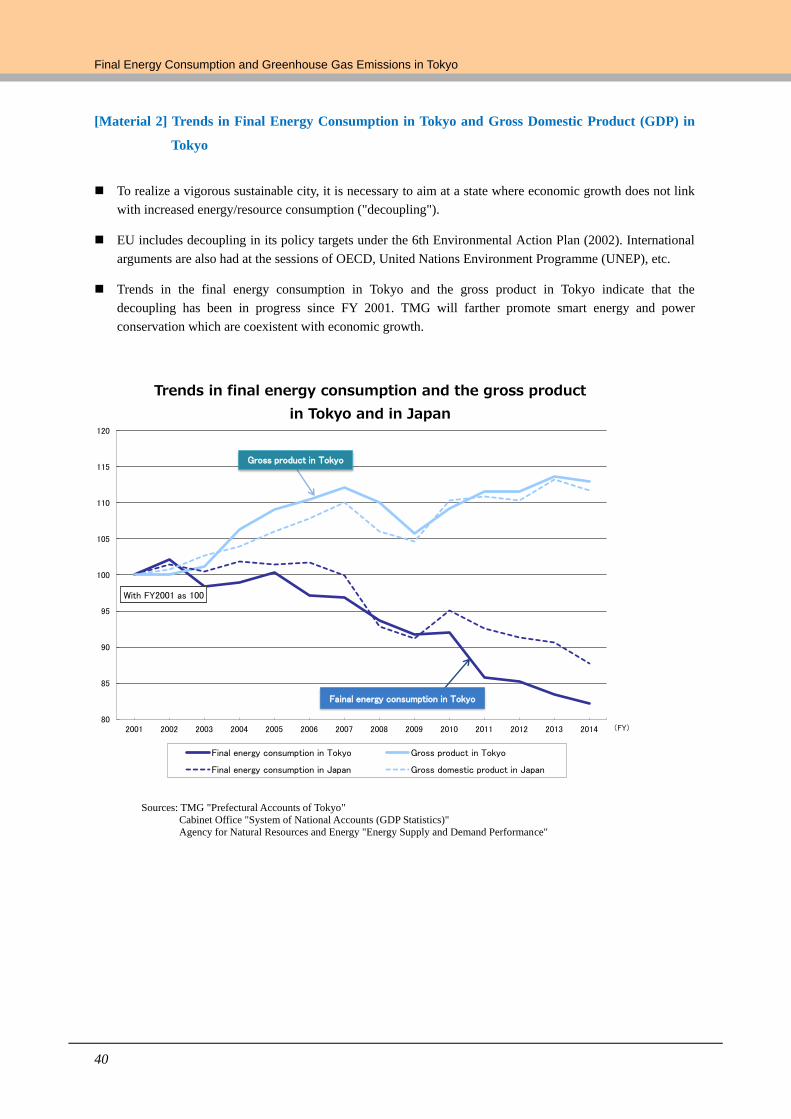
Final Energy Consumption and Greenhouse Gas Emissions in Tokyo
40
[Material 2] Trends in Final Energy Consumption in Tokyo and Gross Domestic Product (GDP) in
Tokyo
To realize a vigorous sustainable city, it is necessary to aim at a state where economic growth does not link
with increased energy/resource consumption ("decoupling").
EU includes decoupling in its policy targets under the 6th Environmental Action Plan (2002). International
arguments are also had at the sessions of OECD, United Nations Environment Programme (UNEP), etc.
Trends in the final energy consumption in Tokyo and the gross product in Tokyo indicate that the
decoupling has been in progress since FY 2001. TMG will farther promote smart energy and power
conservation which are coexistent with economic growth.
Sources: TMG "Prefectural Accounts of Tokyo"
Cabinet Office "System of National Accounts (GDP Statistics)"
Agency for Natural Resources and Energy "Energy Supply and Demand Performance"
80
85
90
95
100
105
110
115
120
2001 2002 2003 2004 2005 2006 2007 2008 2009 2010 2011 2012 2013 2014
Trends in final energy consumption and the gross product
in Tokyo and in Japan
Final energy consumption in Tokyo Gross product in Tokyo
Final energy consumption in Japan Gross domestic product in Japan
With FY2001 as 100
Gross product in Tokyo
Fainal energy consumption in Tokyo
(FY)
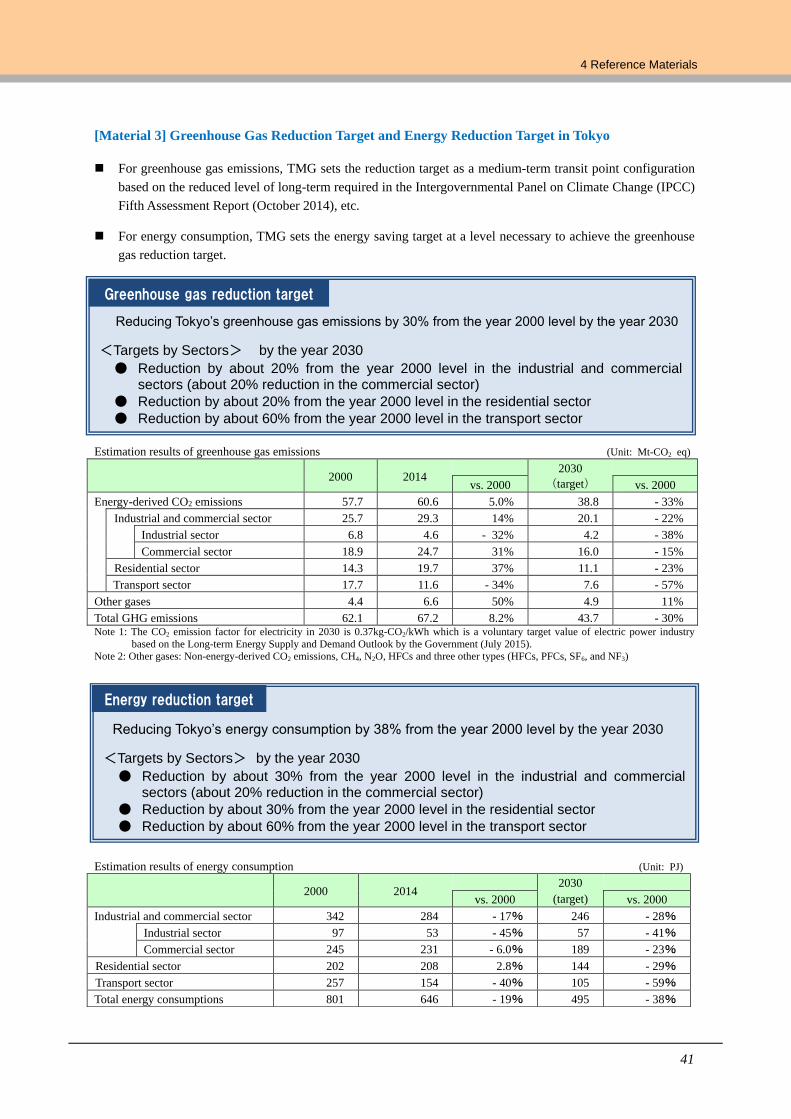
4 Reference Materials
41
[Material 3] Greenhouse Gas Reduction Target and Energy Reduction Target in Tokyo
For greenhouse gas emissions, TMG sets the reduction target as a medium-term transit point configuration
based on the reduced level of long-term required in the Intergovernmental Panel on Climate Change (IPCC)
Fifth Assessment Report (October 2014), etc.
For energy consumption, TMG sets the energy saving target at a level necessary to achieve the greenhouse
gas reduction target.
Estimation results of greenhouse gas emissions (Unit: Mt-CO2 eq)
2000 2014
2030
(target)
vs. 2000 vs. 2000
Energy-derived CO2 emissions 57.7 60.6 5.0% 38.8 - 33%
Industrial and commercial sector 25.7 29.3 14% 20.1 - 22%
Industrial sector 6.8 4.6 - 32% 4.2 - 38%
Commercial sector 18.9 24.7 31% 16.0 - 15%
Residential sector 14.3 19.7 37% 11.1 - 23%
Transport sector 17.7 11.6 - 34% 7.6 - 57%
Other gases 4.4 6.6 50% 4.9 11%
Total GHG emissions 62.1 67.2 8.2% 43.7 - 30% Note 1: The CO2 emission factor for electricity in 2030 is 0.37kg-CO2/kWh which is a voluntary target value of electric power industry
based on the Long-term Energy Supply and Demand Outlook by the Government (July 2015).
Note 2: Other gases: Non-energy-derived CO2 emissions, CH4, N2O, HFCs and three other types (HFCs, PFCs, SF6, and NF3)
Estimation results of energy consumption (Unit: PJ)
2000 2014
2030
(target)
vs. 2000 vs. 2000
Industrial and commercial sector 342 284 - 17% 246 - 28%
Industrial sector 97 53 - 45% 57 - 41%
Commercial sector 245 231 - 6.0% 189 - 23%
Residential sector 202 208 2.8% 144 - 29%
Transport sector 257 154 - 40% 105 - 59%
Total energy consumptions 801 646 - 19% 495 - 38%
Reducing Tokyo’s greenhouse gas emissions by 30% from the year 2000 level by the year 2030
<Targets by Sectors> by the year 2030
● Reduction by about 20% from the year 2000 level in the industrial and commercial sectors (about 20% reduction in the commercial sector)
● Reduction by about 20% from the year 2000 level in the residential sector
● Reduction by about 60% from the year 2000 level in the transport sector
Greenhouse gas reduction target
Reducing Tokyo’s energy consumption by 38% from the year 2000 level by the year 2030
<Targets by Sectors> by the year 2030
● Reduction by about 30% from the year 2000 level in the industrial and commercial sectors (about 20% reduction in the commercial sector)
● Reduction by about 30% from the year 2000 level in the residential sector
● Reduction by about 60% from the year 2000 level in the transport sector
Energy reduction target
Final Energy Consumption and Greenhouse Gas Emissions in Tokyo
42
5 Figures and Tables
― Contents for Tables ―
Table 2-1 Heat conversion factors used in this survey (FY 2014) ............................................................................. 2
Table 2-2 Final energy consumption by sector in Tokyo, and increases up to FY 2014 ............................................... 3
Table 2-3 Final energy consumption by fuel type in Tokyo, and increases up to FY 2014 ........................................... 3
Table 3-1 GHGs and main source(s) of emission ................................................................................................. 20
Table 3-2 Categorization of carbon dioxides .................................................................................................... 20
Table 3-3 CO2 emission factors for electricity used in this survey .......................................................................... 21
Table 3-4 Categorized calculation methods based on CO2 emission factors for electricity ........................................ 21
Table 3-5 Trends in total GHG emissions in Tokyo [Variable cases] ...................................................................... 22
Table 3-6 (Reference) Trends in total GHG emissions in Tokyo [Fixed cases] ........................................................ 22
Table 3-7 Total CO2 emissions by sector and increases up to FY 2014 in Tokyo [Variable cases] .............................. 24
Table 3-8 Total energy-derived CO2 emissions by fuel type and increases up to FY 2014 in Tokyo [Variable cases] ... 24
Table 3-9 Total CO2 emissions by sector and increases up to FY 2014 in Tokyo [Fixed cases] .................................. 28
Table 3-10 Total energy-derived CO2 emissions by fuel type and increases up to FY 2014 in Tokyo [Fixed cases]... 28
Table 3-11 Comparison of other GHG emissions in Tokyo and in Japan (FY 2014) ................................................. 34
5 Figures and Tables
43
― Figures ―
Figure 1-1 Energy-derived CO2 emissions by country (2014) ............................................................................... 1
Figure 2-1 Domestic Energy Balance and Flow (Overview) (FY 2014) ................................................................. 2
Figure 2-2 Final energy consumption by sector in Tokyo (FY 2014) ..................................................................... 3
Figure 2-3 Trends in final energy consumption by sector in Tokyo ....................................................................... 4
Figure 2-4 Composition ratios in final energy consumption by sector in Tokyo ...................................................... 4
Figure 2-5 Trends in final energy consumption by fuel type in Tokyo ................................................................... 5
Figure 2-6 Composition ratios in final energy consumption by fuel type in Tokyo .................................................. 5
Figure 2-7 Final energy consumption by trade in the industrial sector ................................................................... 6
Figure 2-8 Composition ratios in final energy consumption by trade in the industrial sector .................................... 6
Figure 2-9 Trends in final energy consumption by fuel type in the industrial sector ................................................ 7
Figure 2-10 Composition ratios in final energy consumption by fuel type in the industrial sector ............................. 7
Figure 2-11 IIP increases in manufacturing in Tokyo ........................................................................................... 8
Figure 2-12 Comparison of IIP between Tokyo and Japan ................................................................................... 8
Figure 2-13 Trends in final energy consumption by building application in the commercial sector ........................... 9
Figure 2-14 Composition ratios in final energy consumption by building application in the commercial sector ......... 9
Figure 2-15 Trends in final energy consumption by fuel type in the commercial sector ......................................... 10
Figure 2-16 Composition ratios in final energy consumption by fuel type in the commercial sector ....................... 10
Figure 2-17 Trends in total floor area by trade in Tokyo ..................................................................................... 11
Figure 2-18 Trends in total floor area by trade in Japan ...................................................................................... 11
Figure 2-19 Trends in final energy consumption by household type in the residential sector .................................. 12
Figure 2-20 Composition ratios in final energy consumption by household type in the residential sector ................ 12
Figure 2-21 Trends in final energy consumption by fuel type in the residential sector ........................................... 13
Figure 2-22 Composition ratios in final energy consumption by fuel type in the residential sector ......................... 13
Figure 2-23 Trends in the number of households in Tokyo ................................................................................. 14
Figure 2-24 Comparison of the number of households between Tokyo and Japan ................................................. 14
Figure 2-25 Trends in the ownership rates of home appliances in Tokyo ............................................................. 15
Figure 2-26 Comparison of energy consumption per household in Tokyo with Japan ............................................ 15
Figure 2-27 Progress of energy saving for air conditioners ............................................................................... 16
Figure 2-28 Progress of energy saving for electric refrigerators ........................................................................ 16
Figure 2-29 Trends in final energy consumption by means of transportation in the transport sector ........................ 17
Figure 2-30 Composition ratios in final energy consumption by means of transportation in the transport sector ...... 17
Figure 2-31 Trends in final energy consumption by fuel type in the transport sector ............................................. 18
Figure 2-32 Composition ratios in final energy consumption by fuel type in the transport sector ............................ 18
Figure 2-33 Trends in the number of registered vehicles in Tokyo ...................................................................... 19
Figure 2-34 Trends in the traveling kilometers of vehicles in Tokyo ................................................................... 19
Final Energy Consumption and Greenhouse Gas Emissions in Tokyo
44
Figure 3-1 Image of GHG emissions in Tokyo.................................................................................................. 21
Figure 3-2 Trends in total GHG emissions in Tokyo [Variable cases] .................................................................. 22
Figure 3-3 Composition ratios by GHG in Tokyo and in Japan [Variable cases] ................................................... 23
Figure 3-4 Increase rates by GHG in Tokyo and in Japan [Variable cases] ........................................................... 23
Figure 3-5 CO2 emissions by sector in Tokyo (FY 2014) [Variable cases] ............................................................ 24
Figure 3-6 Trends in total CO2 emissions by sector in Tokyo [Variable cases] ...................................................... 25
Figure 3-7 Composition ratios in total CO2 emissions by sector in Tokyo [Variable cases] .................................... 25
Figure 3-8 Trends in CO2 emissions in Japan ................................................................................................... 26
Figure 3-9 Composition ratios in CO2 emissions in Japan .................................................................................. 26
Figure 3-10 Trends in energy-derived CO2 emissions by fuel type in Tokyo [Variable cases] ................................. 27
Figure 3-11 Composition ratios in energy-derived CO2 emissions by fuel type in Tokyo [Variable cases] ............... 27
Figure 3-12 CO2 emissions by sector in Tokyo (FY 2014) [Fixed cases] .............................................................. 28
Figure 3-13 Trends in total CO2 emissions by sector in Tokyo [Fixed cases] ........................................................ 29
Figure 3-14 Composition ratios in total CO2 emissions by sector in Tokyo [Fixed cases] ...................................... 29
Figure 3-15 Trends in energy-derived CO2 emissions by fuel type in Tokyo [Fixed cases] .................................... 30
Figure 3-16 Composition ratios in energy-derived CO2 emissions by fuel type in Tokyo [Fixed cases] ................... 30
Figure 3-17 Trends in CO2 emissions in the industrial sector [Fixed cases] .......................................................... 31
Figure 3-18 Trends in CO2 emissions in the commercial sector [Fixed cases] ...................................................... 31
Figure 3-19 Trends in CO2 emissions in the residential sector [Fixed cases] ........................................................ 32
Figure 3-20 Trends in CO2 emissions in the transport sector [Fixed cases] .......................................................... 32
Figure 3-21 Increase rates by GHG (other GHGs) in Tokyo and in Japan ............................................................ 33
Figure 3-22 Composition ratios of other GHG emissions in Tokyo and in Japan (FY 2014) ................................... 34
Figure 3-23 Composition ratios of CH4 emissions in Tokyo and in Japan (FY 2014) ............................................ 35
Figure 3-24 Composition ratios of N2O emissions in Tokyo and in Japan (FY 2014) ............................................ 35
Figure 3-25 Composition ratios of HFCs and three other types of emissions in Tokyo and in Japan (FY 2014) ........ 36
Final Energy Consumption and Greenhouse Gas Emissions in Tokyo
(FY 2014)
Issued in March, 2017
Edited/issued by: Planning Section, Climate Change and Energy Division,
Bureau of Environment, Tokyo Metropolitan Government
2-8-1 Nishi-Shinjuku, Shinjuku-ku, Tokyo, JAPAN
163-8001
Tel: +81-3-5388-3486
Entrusted with: Sogo Environment Planning Co., Ltd.
KDX Monzen-nakacho Building, 1-14-1 Botan, Koto-ku,
Tokyo, JAPAN 135-0046
Tel: +81-3-5639-1951

For more details,
please visit the website of the Bureau of Environment
Tokyo Metropolitan Government at:
http://www.kankyo.metro.tokyo.jp/en/climate/index.html
(Comprehensive website on countermeasures against climate change, Tokyo)


![Energy Consumption and Greenhouse Gas Emissions 1998_ifa_marrakech_kongshaug[1]](https://img.pdfslide.us/doc/110x75/577d1e951a28ab4e1e8ecdc9/energy-consumption-and-greenhouse-gas-emissions-1998ifamarrakechkongshaug1.jpg)
