Embed Size (px)
Citation preview
The Big BOP-PER An Analysis of America’s Balance of Payments and Strategy for Political and Economic Realignment
A thesis submitted to the Center for Global Affairs at New York University in partial fulfillment of
the requirements for the degree of Master of Science in Global Affairs
By: Steven L. Avary Concentration: Private Sector
Thesis Advisor: Carolyn Kissane, Ph.D. New York, NY
Fall, 2014
Abstract: An opportunity has arisen that has the potential to reshape international relations and
global economics significantly. The key driver for this opportunity is the resurgence of the
American Energy Industry. This analysis argues that with changes to three key areas: foreign
policy as executed by the Executive Branch, rescinding mandates and more prudent fiscal
policies alleviating market distortions in the energy sector by the Legislative Branch and
promoting bills that facilitates energy sector growth, and illuminating a narrative and modifying
Central Bank interest rate policy as it relates to energy price inflation, should provide wide
spread benefits to the U.S. Implications are incorporated into Game Theoretic permutations,
with anticipated outcomes for America of greater leverage globally, resulting in reduced
commitment of blood and treasure to hazardous regions, risk mitigation, a reduction in its twin
deficits -- trade and budget, and enhancements in its energy and transportation infrastructure,
while also enhancing America’s aggregate economic base.
1
Table of Contents
INTRODUCTION ............................................................................................................................................. 3
AGNOSTICS AND EVANGELISTS ................................................................................................................... 10
EXTERNALITIES ........................................................................................................................................ 10
LEVELIZED COST OF ENERGY ................................................................................................................... 12
TRADEOFFS ............................................................................................................................................. 13
POLICY SHIFTS ............................................................................................................................................. 15
EXECUTIVE BRANCH ................................................................................................................................ 15
International Relations Theory ........................................................................................................... 16
Hegemonic Stability Theory ............................................................................................................ 16
Realists ............................................................................................................................................ 17
Liberals ............................................................................................................................................ 18
Central Limit Theorem .................................................................................................................... 20
LEGISLATIVE BRANCH .............................................................................................................................. 21
Fiscal .................................................................................................................................................... 21
Expenditures ................................................................................................................................... 24
Reallocation ................................................................................................................................ 27
Taxes ............................................................................................................................................... 29
Carbon ......................................................................................................................................... 29
Cap & Trade................................................................................................................................. 29
Renewable Externality ................................................................................................................ 30
Tax credits and DD&A ................................................................................................................. 31
LIFO ............................................................................................................................................. 32
Legislation ........................................................................................................................................... 34
Law .................................................................................................................................................. 34
Energy Policy and Conservation Act of 1975 .............................................................................. 34
Energy Policy Act of 2005 ............................................................................................................ 35
Energy Independence and Security Act of 2007 ......................................................................... 36
2
Bills .................................................................................................................................................. 37
North American Energy Infrastructure Act ................................................................................. 37
Keystone XL ................................................................................................................................. 38
North Atlantic Energy Security Act ............................................................................................. 39
CENTRAL BANK ........................................................................................................................................ 40
Picturesque ......................................................................................................................................... 42
The Push-Pull Dilemma ....................................................................................................................... 44
Secrets of the Temple ......................................................................................................................... 45
Minute Minutiae ................................................................................................................................. 46
Of The Core, and The Core, and The Core ...................................................................................... 46
Collide-a-scope ................................................................................................................................ 47
50 shades of grey ............................................................................................................................ 48
ECONOMIC FUNDAMENTALS ...................................................................................................................... 49
TIME SERIES ANALYSIS ............................................................................................................................ 51
CAPITAL DISCIPLINE ................................................................................................................................ 55
PRICES ..................................................................................................................................................... 56
SUPPLY AND DEMAND ............................................................................................................................ 56
IMPLICATIONS ............................................................................................................................................. 57
FISCAL PHYSICAL ..................................................................................................................................... 58
BALANCE OF PAYMENTS ......................................................................................................................... 60
CENTRAL BANK ........................................................................................................................................ 61
Taylor Made ........................................................................................................................................ 61
Deriving the Derivative ....................................................................................................................... 61
GAME THEORY ........................................................................................................................................ 62
Players ................................................................................................................................................. 62
Plays .................................................................................................................................................... 68
Payoffs ................................................................................................................................................. 71
CONCLUSION ............................................................................................................................................... 73
BIBLIOGRAPHY ............................................................................................................................................ 75
ACKNOWLEDGMENTS ................................................................................................................................. 81
3
INTRODUCTION
Politics is what drives the process in the establishment of policy parameters and culminates in
economic outcomes. Yet, due to various special interests, personal agendas, or
misunderstanding of cause and effect of market dynamics, both government and central bank
policies are interjected into the energy sector that distorts the market away from the optimal
position, its natural equilibrium; thus, leading to unintended consequences and suboptimal
outcomes. While American energy policy is often advertised as comprehensive in nature or
taking an “Agnostic” position showing no preferential treatment, in reality it is driven by
“Evangelists,” individuals that promote one form of energy over the other and subordinate
other forms in the belief they have the one true gospel. Given its innate attributes, proponents
of the competing energy sources need to be sensitive to stakeholders’ concerns and take a
more holistic perspective that of striking a proper balance with the triple bottom line of people,
planet and profit.
Much of the focus over the last decade has been greater government support for alternative
energy sources. In certain cases, some of these energy sources do not have strong enough
economic fundamentals currently without government intervention. An argument can be
made to provide government support to infant industries while they are getting established.
However, much of the industries supported by the government, such as solar and wind power,
has been around for many years. As such, the self-sufficiency of such sources over the long-
term comes into question. If so, I make the claim that it is inappropriate to continue
4
government support in its current form, and limited resources should be released and
reallocated for more viable projects.
The objective of this paper is to argue that with a more accommodative policy for the domestic
energy sector, that there may be an improvement in the United States’ Balance of Payment
(BOP) position, and more productive and beneficial political and economic relationships
through realignment (PER). Greater accommodation refers to reducing or eliminating
encumbrances (e.g., mandates) and market frictions (e.g., subsidies) imposed by the federal
government. It also means that Central Bank (i.e., the Federal Reserve (Fed)) policy will be
appropriate with respect to addressing energy price inflation pressures. Political and economic
relationships need reassessment and a more robust foreign policy posture should be taken by
incorporating certain tenets of the main schools of international relations theory, Realists and
Liberals, without strict adherence to a specific philosophy. Indeed, I provide my own personal
philosophy, the Central Limit Theorem, a hybrid approach. In essence, much of my argument is
to allow for more optionality into the system, which provides more flexibility to maneuver as
the situation dictates rather than to be constrained by a silo oriented mentality.
I preface my comments that this thesis will be examined from the perspective of the
advancement of America’s position of the interrelated areas of international relations and
economics. I believe the United States should seize this opportunity through leveraging its
energy assets via revisiting its energy policies, with government remaining Agnostic amongst
5
the various energy sources. I will accede at first glance it might appear that I am an Evangelist
for hydrocarbon-based sources. I am a proponent of American Energy in all its forms. With this
understanding, the majority of the focus will be on hydrocarbon sources as a function of my
greater familiarity with the source, its predominance in the marketplace, and its ability for
greater scalability over a shorter timeframe. In addition, there are greater gaps in technology
necessary to make other forms more economically viable at this time, although there have
been tremendous strides over the last few years (See Levelized Cost of Energy). The greater
focus on hydrocarbons initially is given its “lower hanging fruit” position and in general more
competitive cost structure that is to be complemented by alternative energy sources. In
aggregate, I am encouraging rapid expansion of an “All the Above” energy policy within the
context of a holistic cost/benefit and strategic perspective.
I begin the analysis by introducing the ideological personalities that drive the energy debate,
Evangelists, and layout a key area, Externalities, which are major drivers in supporting an
energy source over another. Then I introduce a metric, Levelized Cost of Energy (LCOE), which
helps provide an assessment of energy sources. Finally, I incorporate into the discussion a
resolution to the differences by suggesting a holistic approach, that it comes down to a series of
Tradeoffs.
Next, I transition to highlighting certain Policy Shifts recommended for the Executive Branch,
the Legislative Branch, and the Central Bank. For the Executive Branch, I suggest in making
6
changes to foreign policy with adoption of more clear guidelines using templates from
international relations theory, Hegemonic Stability Theory, the Realist and Liberal schools, and
my personal default position, the Central Limit Theorem. Other than commodity price risk,
geopolitical issues are arguably the most prominent risk of energy, the most consequential
industry across the globe, and it is essential that the proper approach is implemented in
navigating the obstacles.
In general, I recommend that the policy shifts from the political branches, the Executive and
Legislative, rescind policies I believe are detrimental, and facilitate various bills or other policy
instruments that encourage growth. The prudence of a diverse energy strategy is best captured
by Winston Churchill in a speech to Parliament, “On no one quality, on no one process, on no
one country, on no one route, and no one field must we be dependent. Safety and certainty in
oil lie in variety and variety alone.” Critical to America’s energy security is to follow such a
strategy, updated to include an All the Above approach to energy sources and technology,
within resource constraints and parameters aforementioned, that should be maximized.
I then turn to the other political entity, the Legislative Branch. I argue for changes in Fiscal
Policy and Legislation. I suggest the American people and economy would be better served by
eliminating distortions the Legislature causes in the market by misallocating resources, by
allowing taxpayer money to be made in investments in general, and to favored energy sources
specifically. Furthermore, I discuss distortions and shortcomings of Taxes dealing with
7
externalities. Other tax issues include policy changes proposed by the Obama Administration
that would result in an undue burden on hydrocarbon sources while supporting renewables in
the Tax Credits and DD&A, and LIFO sections, and propose a solution to the LIFO debate. In the
Legislation section, I highlight existing laws, the Energy Policy and Conservation Act of 1975, the
Energy Policy Act of 2005, and the Energy Independence and Security Act of 2007. In these
laws, I mention rescinding mandates (e.g., ethanol) and economic distortions (e.g., subsidies).
Recent Bills are also addressed that promote energy and economic growth and closer strategic
positions with our allies, which are included in the North American Energy Infrastructure,
Keystone XL, and Energy Security Acts.
For the Central Bank, I make the case that the Fed does not adhere to its stated position of
“core inflation” as the triggering mechanism for changes in interest rates to address inflationary
pressures. I provide empirical research to support my argument that the Fed’s interest rate
policy is flawed, and recommend policy shifts. These recommendations are based on changing
perceptions about monetary policy actions associated with energy prices with the objective of
mitigating volatile swings between perceived inflationary pressures and economic contractions
over the long-term, which provides the Fed with greater flexibility in balancing its dual mandate
of price stability (inflation management) and maximum employment. Empirical analysis
includes visualizing the influence of energy prices on rate moves and the effects over a time
series included in the Picturesque section. This lack of comprehension, and not allowing the
market to adjust naturally to a new equilibrium, has led to dire outcomes. Fed intervention is

8
not a solution to the problem; rather it introduces another problem into the system, causing
the unintended consequence of significant volatility and economic deterioration, only to have
to reverse the decision later to counter effects of prior rate moves.
The Push-Pull Dilemma describes the problem with assuming all forms of inflation are equal.
Secrets of the Temple, the Temple being a nickname for the Fed, describe discussions I had with
a Fed economist as it relates to my inflation differential arguments and its effects. To support
my claims, I reviewed meeting minutes of the Federal Open Market Committee (FOMC), the
group within the Fed that makes interest rate policy decisions. My findings are included in the
Minute Minutiae subsection, and focus on three key points that they made interest rate
increases as implemented with changes in the Fed Funds rate, despite the following: various
core inflation metrics were relatively stable; that the increases were made even while
acknowledging the impact that higher energy prices were having on the overall economy; and,
even though the risks between price stability and maximum employment were deemed in
balance. These subjects are addressed in of The Core, and The Core, and The Core; Collide-a-
scope; and, 50 shades of grey, respectively.
In order for the U.S. to capitalize on its energy assets to further its position, it is necessary to be
cognizant of its feasibility based on what is underpinning such a policy. This viability is
addressed in the Economic Fundamentals section, discussing such drivers as economic growth,
supply and demand, and the expected pricing environment. I provide a significant amount of
9
data in the Time Series section mentioning capital investment, and asset and production
growth, with additional granularity provided on per unit operating economic statistics.
In the Implications section, I describe how all the aforementioned items translate to its fiscal
health in Fiscal Physical. America’s Energy Renaissance has contributed greatly in international
trade, reducing its reliance on energy imports as reflecting in its Balance of Payments.
Eliminating mandates prohibiting export of energy products, specifically that of crude oil, and
facilitating growth in the Liquid Natural Gas (LNG) market through expedited permitting and
enabling exports, should further reduce the trade deficit. The Fed effect is spelled out in Taylor
Made, a modified application of the Taylor Rule, a tool often used as a benchmark to set rates.
In Deriving the Derivative, I explain the impact between an absolute and relative rate of change.
Game Theory incorporates potential Plays and Payoffs of key Players in response to actions
taken by others in the pursuit of maximizing their own positions. I discuss certain key issues in
order to compete with Australia, Brazil, Canada, Mexico, members of OPEC and Russia.
Throughout, I intersperse the commentary of other ancillary benefits from utilizing these policy
shifts, such as an enhanced infrastructure, freeing up transportation sources, and potentially
mitigating concerns of a highly contested method for enhanced recovery.
10
AGNOSTICS AND EVANGELISTS
Perhaps the most contentious issue surrounding the energy industry is from what source
supplies the market, with the argument largely focused on the negative externalities of carbon
emission produced by petroleum, natural gas and coal (hydrocarbons). Individuals and groups
that support one form of energy supply over another I describe as Evangelists, and it is that
group that drives policy. Others that have no preference outside of such issues as cost/benefit,
accessibility, and security are deemed Agnostics. I believe America’s energy policy should take
an All the Above Agnostic approach, limiting interference in promoting one form of energy over
another. Historically, government has been a poor asset allocator, with the market better at
assessing where to allocate limited resources.
EXTERNALITIES
Negative externalities are costs borne by a third party involuntarily. In the energy industry, the
most prominent one is pollution in the form of carbon emission. Other common externalities of
hydrocarbon energy sources are waste disposal, soil and water degradation, seismic activity
and cave-ins and depletion of resources associated with the extractive operations.
Negative externalities of non-hydrocarbon based sources are largely ignored in the energy
debate, and come in such forms as aesthetics, safety concerns and business disruption, cultural
activity interference and effects on wildlife.
11
For example, an offshore wind project off the coast of Massachusetts, Cape Wind, was
described as “visual pollution.”1 Other negative externalities, such as tourism and fishing
disruption, anxieties over depressed property values and associated obstructed views, as well
as concerns by a local Indian tribe over disturbing ancient burial grounds, are largely
downplayed by wind power Evangelists.2
Avian deaths caused by turbine blade strikes are frequent, which may result in a change in the
balance of the local ecosystem, such as overpopulation by rodentia, which could spread
diseases and destruction of property and crops.3 A recent court ruling may internalize the cost
of bird deaths.4 In addition to monetary fines, the ruling requires Duke to take the following
measures when birds are in the vicinity:
Cut back flora where prey may hide; and
Stop wind turbines
If the turbines are not turning, they are not making money. When in motion, wind turbines
generate a vortex that distorts planes’ signatures making them indistinguishable on air
controllers’ radar screens.5 This motion also leads to turbulence, which may require planes to
1 Seelye, Katherine Q. "Koch Brother Wages 12-Year Fight Over Wind Farm." New York Times 22 October 2013:
A12. <http://www.nytimes.com/2013/10/23/us/koch-brother-wages-12-year-fight-over-wind-farm.html?pagewanted=all&_r=0>.
2 Courtney. Cape Cod's Offshore Wind Farm: Yay [sic] or Nay? 29 April 2010. 2013.
<http://thegreenists.com/energy-saver/cape-cods-offshore-wind-farm-yay-or-nay/5699>. 3 Avary, Steven L. "Wind Power: Evaluating Cost Economics." 2014. 2. Print.
<https://www.linkedin.com/profile/view?id=2506829&trk=nav_responsive_tab_profile>. 4 Cappielo, Dina. Guilty plea in bird deaths at wind farms a first. 23 November 2013. 2013.
<http://www.myfoxny.com/story/24050658/guilty-plea-in-bird-deaths-at-wind-farms-a-first>. 5 Irvine, Chris. "Wind farms could pose danger to planes without new air traffic control radar." The Telegraph 25
May 2009. <http://www.telegraph.co.uk/travel/travelnews/5383658/Wind-farms-could-pose-danger-to-planes-without-new-air-traffic-control-radar-system.html>.

12
alter their paths.6 Consequently, the alteration causes more financial burdens for the airplane
and greater carbon emissions incurred with the consumption of additional jet fuel.
LEVELIZED COST OF ENERGY
One of the more frequent metrics of comparison between energy for electricity prices is the
LCOE, which is a discounted financial cost figure over the economic life of the project
incorporating capital costs, fixed and variable operating and maintenance (O&M) costs, fuel
input costs and carbon tax where relevant, and an assumed utilization rate.7 Joskow called this
metric flawed when comparing hydrocarbon versus renewable energy source technologies, as it
treats electricity generation as a “homogenous product governed by the law of one price,” that
it does not take into account volatility in the value of supply varying significantly over the year.8
However, he bases his argument on the assumption that demand is perfectly price inelastic
(i.e., transaction price insensitive), which might hold at a specific point in time, but unlikely over
a prolonged period as new energy supply is introduced. Other costs may come in the form of
externalities, opportunity costs (i.e., the best alternative’s value), and market distortions
through government intervention.9
6 Burnett, III, James H. boston.com. 10 June 2012. 2013. Web.
<http://www.boston.com/ae/movies/articles/2012/06/10/spin_a_good_yarn/>. 7 Avary, Steven L. "Wind Power: Evaluating Cost Economics." 2014. 1. Print
8 Joskow, Paul L. "Comparing the Cost of Intermittent and Dispatchable Electricity Generating Technologies."
American Economic Review: Papers & Proceedings 101.3 (2011): 239. Web. <https://www.aeaweb.org/articles.php?doi=10.1257/aer.101.3.238>.
9 Avary, Steven L. "Wind Power: Evaluating Cost Economics." 2014. 1. Print
13
Yet one of the historical drawbacks of renewables, higher costs relative to hydrocarbons, is
diminishing. In a recent report10 on LCOE, utility-scale wind and solar power are approaching
cost competitiveness with leading edge hydrocarbon-based technologies, even without
government subsidies. Other key findings include:
The Solar Photovoltaic (PV) technology source cost curve has shown dramatic improvements of almost 20% over the last year, while declining approximately 80% over the last five years.
Without subsidies, residential-scale solar PV is significantly more expensive than utility-scale. Lazard questions whether government subsidies distort long-term energy planning.
Land-based and offshore wind sources are on dramatically different trajectories. While cost estimates of land have decreased over 15% from the prior year, and almost 60% over the past five years, offshore costs nearly twice as much as land; therefore, it is not cost competitive without subsidies.
In response to intermittent resources, there has been an increase in battery storage; however, it remains expensive and not cost competitive without subsidies. Assuming efficiency improvements, and reductions in O&M and capital costs, battery storage could experience a 40% decline in costs by 2017.
For the foreseeable future, alternative energy sources are incapable of meeting baseload generation for an advanced economy.
TRADEOFFS
The purpose of assessing the negative externalities and an energy equivalent cost metric via the
LCOE is to bring greater attention to certain costs associated with the various energy
technologies that are often omitted by Evangelists for a more objective assessment and to
promote the Agnostic approach. From a holistic perspective, the debate is really about
10
Lazard. Lazard's Levelized Cost of Energy Analysis - Version 8.0. New York City: Lazard, September 2014. 20 September 2014. <http://www.lazard.com/PDF/Levelized%20Cost%20of%20Energy%20-%20Version%208.0.pdf>.
14
tradeoffs, netting out the various externalities against other factors like direct and indirect
financial costs and benefits, accessibility, dispacthability (i.e., on/off flexibility in response to
demand) and intermittency (i.e., demand dispatch inability or unpredictability).
15
POLICY SHIFTS
The key drivers in enhancing America’s position in addressing its global standing, tackling its
twin deficits, and providing a more robust economic base utilizing energy assets are through
policy shifts from the Executive Branch, Legislative Branch, and the quasi-governmental Federal
Reserve.
EXECUTIVE BRANCH
One of the roles for the executive branch is leading foreign policy. As the focal point of this
area, it is of great importance to have a clearly defined policy, the resources to enable it, and
decisive in its implementation. Given the current state of affairs, the Administration appears
disengaged and uncertain, rebuffing traditional allies and embracing those players that at times
have been hostile to the U.S., leading to a state of confusion. Instead of using successful
established patterns and “measuring twice and cutting once,” there are too many instances of
tailoring “by the seat of their pants,” with an “ill-suited” policy as a consequence. Saudi Prince
al-Waleed bin Talal stated, “The U.S. has to have a foreign policy. Well defined, well structured.
You don’t have it right now, unfortunately. It’s just complete chaos.”11
The world is looking for leadership. Yet when Ian Bremmer poses the question as to whom
would assume the mantle, he said “no one.”12 He bases this conclusion stating, “none has
political and economic muscle to remake the status quo.”13
11 Stephens, Bret. "Obama Survival Manual, Intl. Edition: If you think 2014 has been a year of unraveling and
disorder, just wait." The Wall Street Journal 13 October 2014. <http://online.wsj.com/articles/bret-stephens-obama-survival-manual-intl-edition-1413242790>.
12 Bremmer, Ian. Every Nation for Itself: Winners and Losers in a G-Zero World. New York: Penguin Group, 2012: 4.
Print 13
Bremmer, 10
16
International Relations Theory
In the process of executing foreign policy, it is important to have a “playbook” to provide
guidance in initiating and responding to actions as the circumstances dictate. International
relations are politics translated to the global forum; therefore, implementing and executing the
correct policy while assuming the appropriate posture is essential. Given the high stakes,
seeking guidance from the various international relations theorists and incorporating empirical
support in decision-making is critical with such criteria as constructing an overarching objective,
and applying certain tenets from the respective schools of thought.
Hegemonic Stability Theory
It is my belief that circumstances associated with these particular times suggest adherence to
the Hegemonic Stability Theory (HST), the overarching objective for international relations. The
world seems adrift, with little to no global leadership, leaving a vacuum for “bad actors” who
feel empowered to create chaos, death and destruction. This environment results in significant
geopolitical risk with a requisite for risk premiums in capital and assets.
The key tenet of HST is that a single nation-state that dominates the world, or a hegemon, will
exercise leadership via diplomatic channels, persuasion, or coercion; thus, providing a more
stable system globally.14 For instance, the period often referred to as Pax Britannica, a
timeframe of roughly a century ending at the beginning of World War I, was generally a time of
relative peace and prosperity across the globe. Britain utilized its powerful navy to secure
maritime routes that enabled for greater trade in goods and to project its influence to quell
uprisings.
14 Goldstein, Joshua S., International Relations. New York: Pearson-Longman. 2005. 107

17
Realists
The Realist School of International Relations takes a hard power, state-centric position, focusing
on safety, with a wealth maximizing economy utilized to fund a powerful military. Amassing
absolute power is critical, yet enhancing relative power is the interim goal on the path to be the
global hegemon.15 Yet, Mearsheimer comments that given certain geographical physical
characteristics, mainly water, would make it impossible to be a global hegemon, and any
aspirants would be constrained to be a regional hegemon.16 As I perceive it, perhaps the
biggest weakness of certain Realist ideology is when taken to the extreme, certain stances may
come across as belligerent, reducing the probability of building a broad coalition, limiting
responses to unilateral acts.
Geographical constraints notwithstanding, I am not convinced that a country is limited to
regional hegemony. For instance, at minimum, the United States would be considered a
regional hegemon, yet China and Russia may counterbalance each other in their respective
region. I suggest that America might position itself somewhere between a regional and global
hegemon, such as a “multi-hemispheric” hegemon excluding the sphere surrounding both
China and Russia.
15 Mearsheimer, John J., The Tragedy of Great Power Politics. New York: W.W. Norton & Company. 2001: 1-402 16
Mearsheimer, 84
18
Liberals
The main theme proposed by Complex Interdependence suggests a soft power approach that
promotes interconnectedness of mutually beneficial relationships in economic and national
security interests.17 This interdependence may help advance America’s interests with broader
and deeper ties with states and organizations that share certain worldviews. This perspective
leads us to reexamine ties to other parties that could at best be described as strained if not an
outright hostile relationship which resulted or could result in negative consequences. Just like
tending a growing tree, America may have to prune some of these relationships so that more
resources are diverted to those that foster a healthier organism.
However, a weakness of interdependence as characterized in the International Organization
Model is that there are constraints placed on the actors, limiting full capacity utilization given
the systems’ processes and procedures.18 When such occasions arise, America should reach
out to find a solution. While a broadly accepted diplomatic solution is preferable, there may be
times it would be more prudent to proceed down a different path. For instance, while most
countries are in favor of reducing carbon emissions, the effect of the Kyoto Protocol was of
little consequence. Signatories to the agreement breached their emissions limitations. Still
17 Keohane, Robert O. and Joseph S. Nye, Jr. Power and Interdependence. Pearson-Longman, February 20, 2011: 1-
294. Print 18
Keohane, 46-47
19
America, a non-ratifier, was able to achieve much of the objective via a market-based solution
(i.e., natural gas displacing coal).19
Because of significant shifts in foreign policy over the last few years, America is often described
as a state with a diminishing power position, although the fundamentals of a strong power base
are still intact. Such a view is described as the Eroding Hegemon Model (EH), and where it
occurs regime change follows.20 Perceptions of this weakened position is evidenced in current
events, with Russia taking a more belligerent stance, escalating activities rarely seen since the
fall of the Soviet Union.21
This EH model buttresses my position on HST, as I believe that states’ innate goal is to be the
global hegemon if given the opportunity and resources. If the U.S. will not step up, someone
else will make an attempt. Aggressive actions taken by certain global players, especially that of
China (e.g., Taiwan, South China Sea) and Russia (e.g., South Ossetia, Crimea), supports this
argument.
19 Lieberman, Ben. "What Americans Need to Know About the Copenhagen Global Warming Conference." Special
Report #71 on Climate Change. 2009. Web. 28 November 2014. <http://www.heritage.org/research/reports/2009/11/what-americans-need-to-know-about-the-copenhagen-global-warming-conference>.
20 Keohane, 36-37
21 Fox News. Russia has never flown bomber patrols over Gulf of Mexico before, US official claims. 13 November
2014. Web. 30 November 2014. <http://www.foxnews.com/world/2014/11/13/russian-defense-ministry-says-bomber-patrols-will-reach-gulf-mexico/>.
20
Central Limit Theorem
Rarely have there been situations where the goals of the two main schools of International
Relations, Liberals and Realists, have overlapped to such an extent. At this moment, the Liberal
tenet of interconnectedness and Realist’s strong economy that bolsters the military and
facilitates hegemonic aspirations are not mutually exclusive. My belief is in a hybrid of these
two schools,22 neither implementing policy based solely on soft power, nor that of hard power,
rather a default position of semi-hard power that focuses on more diplomatic measures yet
sealed with a “firm handshake.” The reasoning for this approach is that each situation is
different, and requires the flexibility to move along the continuum as the situation dictates.
A hybrid model is substantiated by a report23 that “hard power” is decreasing in the eyes of
public opinion, though relying on “soft power” may cause a vacuum leaving the opportunity for
bad actors to impose deleterious actions.
Incorporating international relations theory from the various schools is an important tool in
providing direction. While each situation faced is different, many of the same themes
encountered over history are repeated. Examining the features of similar situations and the
outcomes can help navigate obstacles to achieve the intended result.
22
Avary, Steven L. "Central Limit Theorem: A Treatise on International Relations Reconcilement." 14 April 2014. 12-14. Print <https://www.linkedin.com/profile/view?id=2506829&trk=nav_responsive_tab_profile>. 23
Fordham, Tina M., et al. Taking it to the streets: What the New Vox Populi Risk Means for Politics, the Economy and Markets. New York: Citi GPS: Global Perspectives & Solutions, 2014: 40. Web <https://ir.citi.com/MLFFG3mEHO39FBGJhaYs8f02RBUr5gk4DwtUNhgcMXG%2Bi%2FGKPG8GW8VegMsWPk40v5U3DEmh%2Bjo%3D>.
21
LEGISLATIVE BRANCH
With respect to the legislature, the key areas to be addressed are changes to the dichotomous
branches of fiscal policy, taxing and spending, eliminating mandates, and promoting bills
focused on facilitating energy growth.
Fiscal
My objective for changes in fiscal policy is to reduce the distortions caused by government
intervention. Furthermore, given that capital flows to where it is treated best, my objectives
include creation of a more hospitable environment through a more prudent tax policy in the
United States, making it more competitive with the rest of the world. Government
intervention, through excessive burdens of regulatory overreach or taxation, or by misallocating
resources through subsidies or government funding and loan guarantees, inserts a wedge, or
Dead Weight Loss (DWL), leading to economic frictions.
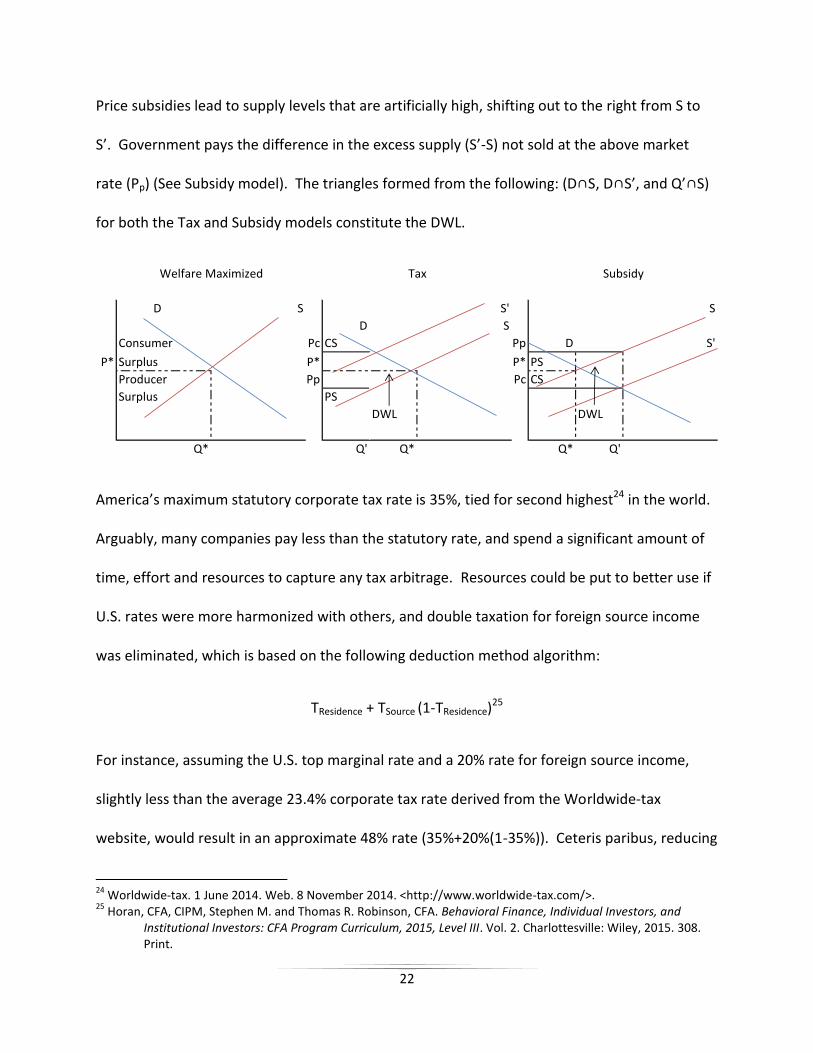
As shown in the models that follow, welfare is maximized amongst the various parties where
the Supply Curve (S) and Demand Curve (D) are in natural equilibrium at Price (P*) ∩ Quantity
(Q*). Producer Surplus (PS) is the amount the supplier receives in excess of its costs, and is the
area above S up to P*. Consumer Surplus (CS) is the amount a buyer saves, and is the area
below D down to P* (See Welfare Maximized model).
Disequilibria caused by government intervention reduce welfare by a loss of surplus by one or
both parties without a corresponding offset to the other party. Price distortions with a tax on
goods erodes welfare at CS from P* to Price to the consumer (Pc), and PS declines from P* to
Price to producer (Pp). S shifts upward to the left (S’) and reduces Q* to Q’ (See Tax model).
22
Price subsidies lead to supply levels that are artificially high, shifting out to the right from S to
S’. Government pays the difference in the excess supply (S’-S) not sold at the above market
rate (Pp) (See Subsidy model). The triangles formed from the following: (D∩S, D∩S’, and Q’∩S)
for both the Tax and Subsidy models constitute the DWL.
America’s maximum statutory corporate tax rate is 35%, tied for second highest24 in the world.
Arguably, many companies pay less than the statutory rate, and spend a significant amount of
time, effort and resources to capture any tax arbitrage. Resources could be put to better use if
U.S. rates were more harmonized with others, and double taxation for foreign source income
was eliminated, which is based on the following deduction method algorithm:
TResidence + TSource (1-TResidence)25
For instance, assuming the U.S. top marginal rate and a 20% rate for foreign source income,
slightly less than the average 23.4% corporate tax rate derived from the Worldwide-tax
website, would result in an approximate 48% rate (35%+20%(1-35%)). Ceteris paribus, reducing
24
Worldwide-tax. 1 June 2014. Web. 8 November 2014. <http://www.worldwide-tax.com/>. 25
Horan, CFA, CIPM, Stephen M. and Thomas R. Robinson, CFA. Behavioral Finance, Individual Investors, and Institutional Investors: CFA Program Curriculum, 2015, Level III. Vol. 2. Charlottesville: Wiley, 2015. 308. Print.
D S S' S
D S
Consumer Pc CS Pp D S'
P* Surplus P* P* PS
Producer Pp Pc CS
Surplus PS
DWL DWL
Q* Q' Q* Q* Q'
Welfare Maximized Tax Subsidy
23
the rate, and eliminating the double taxation would result in the following tax savings benefit
for foreign source income: 48%-TSource, which can be reinvested and provide a multiplier effect
of P (1+r)N.
A more prudent and robust fiscal policy would include accelerated depreciation, depletion, and
amortization (DD&A) schedules, tax holidays and special tax benefits, such as a higher rate for
deductions or credits, for repatriated funds that are devoted to research and development,
capital investment, personnel training and hiring, and for certain infrastructure project
investments. The accelerated DD&A provides the benefit of the time value of money of tax
shields for capital investment, and tax holidays would incentivize corporations to repatriate
funds from overseas to reinvest in the U.S.
24
Expenditures
At the heart of the American Government’s desire to make such expenditures is to increase
aggregate demand through Keynesian Economics with the objective to increase Real (i.e.,
inflation adjusted) Gross Domestic Product (GDP), the final value of all goods and services
produced in a country, represented by the GDP Expenditure Model below:
GDP = C+I+G+X-M
Defined as:
C = Consumers
I = Industrial
G = Government
X = Exports
M = Imports
With the various financings and the principal-agent relationship, there arise the attendant risks
of moral hazard, adverse selection and risk compensation. Briefly, moral hazard is the
additional risk someone undertakes if another party (i.e., principal) bears the risk burden. This
situation is seen frequently in financings where management (i.e., agent) is imprudent in such
areas as spending or operations. Moral hazard can be an ex-ante or ex-post risk. The central
feature of adverse selection is information asymmetry, where one party has a more complete
picture with their access to better information, allowing them to be in a better negotiating
situation than the other. The information asymmetry can manifest itself as risk compensation,
the requisite return based on the perceived level of risk. If the perception of this risk is
incorrect, it can lead to the asset associated with the risk to be overpriced significantly.
25
Government funding of various energy projects via a portfolio managed by the Department of
Energy (DOE) has taken center stage over the last few years. “Crony capitalism” has distorted
the funding process, with critical objectivity and robust financial analysis often secondary.
Thus, the triple net goal of people, planet, and profit is frequently supplanted with biases
toward energy source, individual companies or individuals that are well connected (e.g., George
Kaiser and Solyndra), often in exchange for quid pro quo support of various political parties,
policies or candidates. Given certain biases, and that the DOE personnel do not have “direct
skin in the game” in the form of personal capital at risk, which is commonplace in the private
sector; and, with limited concern over job security should the investment underperform, there
is not as great an incentive to be more thorough with due diligence. One of the most astute
comments I ever heard about reviewing business plans was, “All business plans have two things
in common, the numbers always go up, and they are always wrong.” The Prudent-Person Rule
is a legal maxim in the private sector restricting investing to those opportunities that have
assumptions scrutinized and significant iterative stress tests of the financial projections are
undertaken. Consequences of financial imprudence are reflected in the demise of Long-Term
Capital Management (LTCM), a highly sophisticated hedge fund with Nobel laureates on its
payroll. LTCM utilized a strategy based on correlations amongst different assets based on a
normal statistical distribution. The key question not addressed was what happens to
correlations when there is a kurtosis distribution, a situation where there is an extreme event?
LTCM’s failure is described as a result of the breakdown in asset correlations, where asset
prices moved differently than anticipated. The DOE exposed taxpayer money to the big solar
thermal project Ivanpah. One of the investors for this project is Google, led by Chairman Eric
26
Schmidt, who is very close to the current Administration. While the U.S. provided a $1.6 billion
construction loan, Ivanpah has recently approached the DOE again for money in the form of a
grant of around $500 million in which to pay off some of the loan. Purportedly, the need to
come hat and hand was due to unexpected weather, the sun did not shine enough.26 DOE
meet intermittency risk, perhaps the most prominent risk with many alternative energy
sources. Providing a grant would throw good money after bad, and the grant structure is “free
money” to the organization; therefore, no payoff to the American taxpayer.
Other than magnitude, essentially the only real differences between LTCM and Ivanpah was
with regards to “Other People’s Money” (OPM). LTCM’s was with money volunteered by
investors, while the DOE’s was taken involuntarily from taxpayers. As LTCM resides in the
annals of history, the DOE’s misallocation of taxpayer money continues unabated.
Should government continue to make investments, consideration of the position in the capital
structure is of significant importance. At no time should the government use taxpayer money
to take an equity position. Not only does this expose the portfolio to residual equity risk, but
also with a portfolio conflict where the government could have an outsized influence over the
entity and industry, clearing a path not available to others and coercing potential customers to
the government backed entity. Typically, companies or projects that seek government
financing are at a stage of maturity where they do not generate sufficient or stable enough cash
26
La Jeunesse, William. World's largest solar plant applying for federal grant to pay off federal loan. New York, 8 November 2014. Web. 29 November 2014. <http://www.foxnews.com/politics/2014/11/08/world-largest-solar-plant-applying-for-federal-grant-to-pay-off-its-federal/>.
27
flows to support a typical loan structure. Providing government guarantees, which prices the
instrument on the full faith and credit of the U.S. Government, exposes taxpayers to absorb the
loss in the event of a default by the issuer.
Reallocation
While my preference is to eliminate government involvement where possible, I am pragmatic in
the sense that there will always be some given entrenched interests. Therefore, I make the
case for reallocating involvement to areas I believe mitigate much of the risk to taxpayer money
as well as focusing on areas that have broad applications with a potential material impact. It is
my belief the key focus should be in research and development (R&D). In so doing, several risk
factors are minimized including direct commodity price, operational and business model. Also,
if funding was provided in staged tranches, with future funding based on meeting certain
milestones, such a structure should incentivize for a more focused approach on continuous
improvement and in a timely manner. It should also limit throwing good money after bad, and
alleviate concerns of moral hazard, risk compensation and adverse selection. Such an approach
should also reduce crony capitalism as well as the asymmetrical payoffs of privatized profits and
socialized losses. Focusing on R&D would imply the key risk remaining is technology, an area
where the U.S. has an absolute and comparative advantage over all the other market
participants. The focus should be on broad-based issues, such as carbon capture and
sequestration (CCS) for hydrocarbon-based energy sources, and battery storage, the “holy grail”
solution addressing intermittency limitations of alternative sources. The CCS issue may also be
beneficial as a source of enhanced hydrocarbon recovery with its reinjection into hydrocarbon
28
reservoirs, which might moderate the need to frac. Other areas that might be addressed
includes infrastructure spending such as upgrades to the electric grid, making it more resilient
and secure, and allowing for better interconnectedness permitting the ability to transmit from
one region to another to address supply and demand issues, as well as upgrades to the railway
infrastructure, midstream, and ports, reducing the burden on the transportation of goods.
Investment should boost the qualitative factors of America’s infrastructure, which ranks 15th,
12th, and 24th, out of 144 countries for railway, seaports, and electric supply, respectively27
In some of these infrastructure projects, it might make sense for public/private partnerships
with the understanding that funds will not be diverted to illusory “make work” government
interests, that labor is not limited to those individuals under collective bargaining agreements,
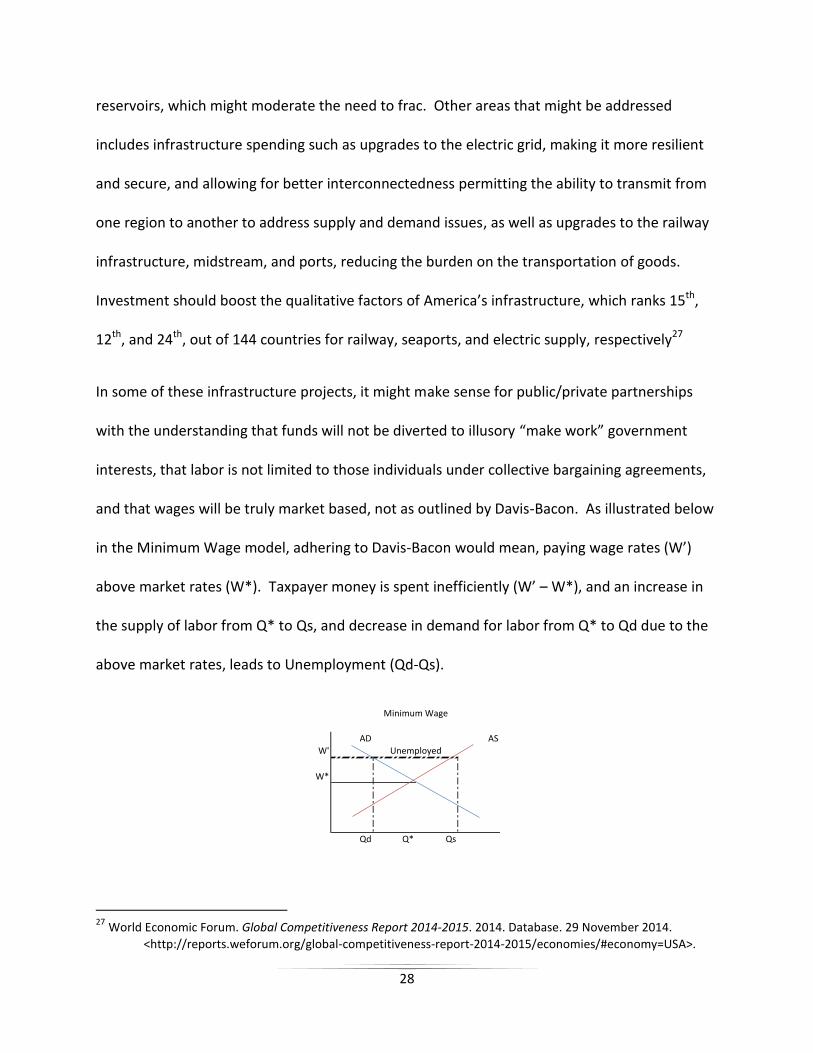
and that wages will be truly market based, not as outlined by Davis-Bacon. As illustrated below
in the Minimum Wage model, adhering to Davis-Bacon would mean, paying wage rates (W’)
above market rates (W*). Taxpayer money is spent inefficiently (W’ – W*), and an increase in
the supply of labor from Q* to Qs, and decrease in demand for labor from Q* to Qd due to the
above market rates, leads to Unemployment (Qd-Qs).
27 World Economic Forum. Global Competitiveness Report 2014-2015. 2014. Database. 29 November 2014.
<http://reports.weforum.org/global-competitiveness-report-2014-2015/economies/#economy=USA>.
AD AS
W'
W*
Qd Q* Qs
Minimum Wage
Unemployed

29
Taxes
With regards to tax policy, I am focusing on responding to debates about introducing new tax
structures, such as carbon or cap & trade, and renewable externality, and modifications to tax
credits and tax accounting methodologies for DD&A and LIFO.
Carbon
All energy sources have negative externalities that result in society having to bear some of the
costs. Various mechanisms have been proposed in which the goal is for the producer to
internalize the negative externality costs. One of the most frequently mentioned is inserting a
carbon tax. The tax is based on a per energy heating unit (i.e., Btu) produced. However, as
noted by the EIA,28 carbon emission is not uniform across source per Btu, ranging from 117
pounds of CO2 per million Btu for natural gas to 228.6 for anthracite coal. Therefore, such a tax
system would be “inequitable” solely from a per unit of carbon emitted perspective. For a coal-
fired electric utility, four different types of coal with different CO2 level content might be
consumed including anthracite (228.6), bituminous (205.7), lignite (215.4) or subbituminous
(214.3). Should there be a switching amongst the different sources of coal or if the facility
allows for switching amongst the different hydrocarbon sources, keeping track for assessing an
equitable carbon tax would be onerous, if not impossible.
Cap & Trade
Although not technically categorized as a tax is Cap & Trade, a mechanism where certain
producers limit supply, while “trading” their excess emission volumes available to other
28
U.S. Energy Information Administration. "How much carbon dioxide is produced when different fuels are burned?" 14 June 2014. U.S. Energy Information Administration. Web. 20 November 2014. <http://www.eia.gov/tools/faqs/faq.cfm?id=73&t=11>.
30
producers of carbon, thereby pushing up prices and limiting supply. The “tax” is transferred to
the purchaser, permitting it to emit additional CO2 volumes previously available to the seller.
Thus, this system in and of itself does not really reduce carbon emissions, it transfers it. A
cousin to Cap & Trade is renewable identification numbers (RINs), a tracking system imposed by
the Environmental Protection Agency (EPA) to confirm refiners use enough ethanol. In addition
to holding a RIN directly, should they not fulfill the requirement, RINs can be purchased from
others. This system has been gamed, with counterfeit RIN numbers valued in the millions of
dollars.29
Renewable Externality
For non-hydrocarbon source energy, rarely is a cost for negative externalities mentioned as part
of the debate. The recent charges filed against Duke set a precedent, and may result in
applying a similar “negative externality” tax across the board. Just as it would for
hydrocarbons, trying to derive the cost in which to assess the tax would be very difficult.
Would it be an actual hard count, or an estimate for such categories as bird kills? If so, would
there be a uniform set price per bird, or would there be different values assessed for birds that
are more endangered?
Regardless of method, eventually the consumer is the one that picks up the tax in the form of
higher prices, with the largest burden allocated between the consumer and the supplier based
on each party’s price inelasticity.
29 Loris, Nicholas D. The Ethanol Mandate: Don't Mend It, End It. Washington, D.C.: The Heritage Foundation
Backgrounder No. 2811, June 12, 2013. 3. Web. <http://report.heritage.org/bg2811>.
31
Tax credits and DD&A
After reviewing the President’s Budget Proposal,30 it is biased in its support of renewable
sources of energy at the expense of fossil-fuel sources. Tax credits are proposed for the
modification and permanent extension for the Renewable Electricity Production Tax Credit for
the 10-year period 2013-2023 of approximately $24.7 billion. Whereas, the proposal calls for
the repeal of several tax accounting related issues for fossil-fuel preferences over the same
period of an aggregate $48 billion, including expensing intangible drilling costs of an estimated
$13.7 billion, percentage depletion for oil & natural gas wells of $11.1 billion and domestic
manufacturing deduction for oil & natural gas production of $19.4 billion. DD&A is a cost
recovery method to incentivize continuous reinvestment by reducing taxes in a current period.
It is available to all companies, and the rates at which the cost recovery is allocated based on
the economic life of the assets. This tax shield reduces period taxes based on the formula
DD&A x Tax Rate. Taxes are not eliminated; rather they are deferred, allowing the funds
otherwise utilized for tax payments to be reinvested, expanding the economy. The value of the
tax shield is provided as (Annual DD&A x Tax Rate)/(1+r)t, with “r” representing the rate of
return for the invested funds and “t” representing time. As denoted mathematically,
lengthening “t” reduces the value of the tax shield to the company. Expensing items in the
period incurred accelerates the value of the tax shield rather than having it allocated over the
useful economic life as per DD&A tax schedules.
30
Joint Committee on Taxation. Estimated Budget Effects of the Revenue Provisions Contained in The President's Fiscal Year 2014 Budget Proposal: Fiscal Years 2013-2014. Washington, D.C.: Congress of the United States, 2013. Web. <https://www.jct.gov/publications.html?func=startdown&id=4520>.
32
LIFO
A catalyst for eliminating the Last-In First-Out (LIFO) inventory valuation method is the desire to
harmonize accounting standards, the U.S.’s Generally Accepted Accounting Principles (GAAP)
with that of International Financial Reporting Standards (IFRS), which is the most frequently
used standard outside of America. IFRS does not allow a provision for LIFO; therefore, any
attempts to be fully compliant would eliminate this method.
The appeal of LIFO is that the prices allocated to inventory sold are from the most recent units
purchased. In a normal price-increasing environment, this method allows higher priced
inventory to offset revenues and lowering taxable income, while also increasing after-tax cash
flow. As such, it is a better way in which to match current period economics, more closely
taxing “real income” rather than “nominal income” and its associated inflation.31 This inventory
method is prevalent in the energy industry, reflecting its volatile price nature. The budget
proposal includes $78.3 billion for repeal of LIFO for all industries. The LIFO Reserve, the
accumulated net income difference between using LIFO and the First-In First-Out (FIFO) method
for energy companies amounted to less than $15 billion,32 which comprises 37% of the total
LIFO reserve for all industries. In the context of the national budget, this figure is trivial, yet
when viewed alongside alternative energy sources, (e.g., wind and solar) that do not carry
inventory, it is apparent elimination of LIFO would change the competitive landscape amongst
the different energy sources.
31 The Committee for a Responsible Federal Budget. The Tax Break-Down: LIFO Accounting. Washington, D.C., 22
August 2013. Web. <http://crfb.org/blogs/tax-break-down-lifo-accounting>. 32
The Committee for a Responsible Federal Budget
33
Other consequences of LIFO repeal are expressed by the Vice President of Tax of a company,
stating that a LIFO liquidation would not result in additional revenue to the company, rather
deferred taxes would come due, and “In effect the repeal of LIFO is going after our equity.”33
Furthermore, a Director of Tax at PricewaterhouseCoopers, asserts that the termination of LIFO
may affect a company’s net operating losses (NOLs), an accumulation of period losses, which
are used to offset future taxable income.34 Should such a situation arise, impairment of NOLs
would cause a write-down of this asset, reducing reported income.
While potential funds received by the government through LIFO conversion are immaterial in
its overall budget, it has significant impact for the entities that adopted it. There may be an
exclusion for LIFO repeal as a requisite for harmonization. The IRS provides a provision in the
tax code where under certain circumstances, conformity requirement can be relaxed, providing
a potential solution in IFRS discussions.35 If LIFO is repealed, there should be a method in which
to alleviate the damage. Thus, I propose the following: grandfather existing inventories based
on LIFO at a time certain, with new inventory purchases based on the other inventory method
(e.g., FIFO) at a time certain. Amortization of the inventory costs between the two methods
will be done on a pro rata basis, resulting in a gradual transition to be fully compliant with IFRS
without as severe an immediate tax impact.
33
Leone, Marie. "Sucking the LIFO Out of Inventory: The government sees billions of dollars in potential tax revenues sitting on the shelves of company warehouses." CFO Magazine 15 July 2010. 4. Web. <http://ww2.cfo.com/accounting-tax/2010/07/sucking-the-lifo-out-of-inventory/>.
34 Leone, 5
35 Cuomo, CPA, Jason and Mark Lamonte. Is the End of LIFO Near? New York, NY: Moody's Investors Service, 2010.
8. Print
34
Legislation
My discussion about legislation is focused on eliminating biases of various energy sources
through fiscal measures and mandates. In addition, I identified bills with provisions to promote
American Energy growth. Some key legislation that I believe should be amended or aspects
repealed include the Energy Policy and Conservation Act of 1975, the Energy Policy Act of 2005
and the Energy Independence Act of 2007. Additional commentary is provided to explain my
logic not already discussed in other sections.
Law
Energy Policy and Conservation Act of 1975 (EPCA)
Mandate:
Prohibition of crude oil exports
Commentary – the goals of crude export prohibition was to limit foreign imports and conserve
domestic crude stocks in response to the energy crisis in 1973, when OPEC cut off supply due to
America’s support of Israel in the Yom Kippur War.
Neither limiting foreign imports, nor conserving domestic crude was achieved. Rather, it
caused inefficiencies in the market, such as the mismatch between various grades of domestic
crudes available with that of domestic refinery capability.36 Steps have been taken to erode
this restriction with the recent approval of condensate, a high quality of crude that needs little
36 Clayton, Blake. "The Case for Allowing U.S. Crude Oil Exports: Policy Innovation Memorandum No. 34."
The Council on Foreign Relations (2013). Web. 15 November 2014. <http://www.cfr.org/oil/case-allowing-us-crude-oil-exports/p31005>.

35
refining, for export shipment.37 A loophole was found in the law based on how crude and
certain forms of condensate are defined, opening a new pathway and limiting the effectiveness
of the existing ban. Should the President decide to pass on rescinding the mandate, if declared
in the national interest by Congress, there is a provision in EPCA that allows Congress to lift the
ban by amending EPCA.38
Energy Policy Act of 2005
Fiscal:
Guarantees for greenhouse gas innovative technologies, and funding 80% of project
costs for nuclear facilities
Grants for biomass every year over the life of the law
Subsidies for wind and other alternative energy sources
“Financial Backstop” with standby support for delays in new nuclear reactors
Mandates:
Renewable fuels (e.g., ethanol) to be blended in motor fuels
Exclusive use of alternative fuels by Federal Fleet vehicles
Commentary - A key selling point for biofuels is to minimize carbon emission, but “the great
majority of biofuels do not lead to significant net energy gain and cannot therefore lay claim to
being carbon neutral.”39 Exclusive source use is express bias and limits optionality in finding the
37 Berthelsen, Christian and Lynn Cook. "U.S. Ruling Loosens Four-Decade Ban On Oil Exports: Shipments of
Unrefined American Oil Could Begin as Early as August." The Wall Street Journal 14 June 2014. Web. 27 November 2014. <http://online.wsj.com/articles/u-s-ruling-would-allow-first-shipments-of-unrefined-oil-overseas-1403644494>.
38 Ebinger, Charles and Heather L. Greenley. Changing Markets: Economic Opportunities from Lifting the U.S. Ban
on Crude Oil Exports. Washington D.C.: Brookings Institute: Energy Security Initiative, 2014: xi. Print. 25 September 2014. <http://www.brookings.edu/~/media/research/files/reports/2014/09/09%208%20facts%20about%20crude%20oil%20production/crude%20oil%20exports%20web.pdf>.
39Walker, D.A. "Biofuels - for better or worse?" Annals of Applied Biology (2010): 320. Print. 10 November 2014.

36
most affordable energy source funded with taxpayer money. In addition, ethanol damages
traditional car engines when exceeding the 10% (E10) “blend wall.”40
Energy Independence and Security Act of 2007
Fiscal:
Loan program for battery technology
Grants for electric transportation technology
Mandates:
Vehicle electrification
Reduce petroleum consumption and increase alternative fuels by Federal agencies
Biofuels volume floor (i.e., Renewable Fuel Standard)
Commentary – the mandate provides price supports with the volume floor with prices above
market when it is oversupplied. Given the biofuel requirement, when crops used in biofuel and
foodstuffs are in short supply, this leads to food price inflation, and potential civil unrest due to
food scarcity. Also, as discussed in Energy Policy Act of 2005, there is express source bias.
40
Loris, 2-3

37
Bills
The bills that I focused on is the legislation that addressed the following areas: facilitating
Keystone XL, the centerpiece of American Energy Infrastructure Policy, more comprehensive
acts for energy infrastructure, particularly that of midstream assets, and bills that provided for
quicker permitting and enabling for energy exports.
North American Energy Infrastructure Act (NAEIA) A House bill41 was passed in June 2014 that addresses one of the key holdups in building out
America’s energy infrastructure, getting approval for cross-border segments in pipeline and
electric transmission, which was submitted for consideration to the Senate with its pending
bill42 introduced in September 2014. NAEIA requires authorization for construction,
connection, or maintaining the segments, from the Secretary of State for pipelines and
Secretary of Energy for electric transmission. In so doing, a Presidential Permit or Executive
Order is not required; thus, bypassing President Obama who has intimated that he would not
pass Keystone XL. While the authorized parties are members of the Administration and may be
under pressure not to approve it, they may be reluctant to prevent approval given their
respective constituencies and future career aspirations.
41
North American Energy Infrastructure Act. No. H.R. 3301. 113th, 2d Session. Washington, D.C.: 25 June 2014. Web. 15 November 2014. <https://www.govtrack.us/congress/bills/113/hr3301>. 42
North American Energy Infrastructure Act. No. S. 2823. 113th, 2d Session. Washington, D.C.: 16 September 2014. Web. 15 November 2014 <https://www.govtrack.us/congress/bills/113/s2823/text>.
38
Keystone XL
The House of Representatives passed H.R. 568243 in November 2014 approving the
construction, connection, operation and maintenance of the pipeline, including a provision for
any required rerouting within Nebraska and needing authorization by the state. The bill was
forwarded to the Senate, and missed passage by one vote that same month. With the
changeover in the Senate in January 2015, I anticipate that it will come up for another vote and
will pass in the Senate. President Obama is expected to veto the bill, and the Senate will take
another vote on whether to overrule the President’s veto. Should this situation arise, at this
juncture, I think it is too close to call on the overrule vote. Even so, it is my belief it is not
whether “if” Keystone will pass, but “when.” If not in 2015, I anticipate its passage in 2017.
Of note, the bill addresses one of the key tools utilized by the Administration to stall the project
by a myriad of environmental reviews and consultations, stating that the Environmental Impact
Statement issued in January 2014 will satisfy fully requirements of the National Environmental
Policy Act of 1969, and any other requisite reviews or consultations by Federal agencies. In
addition, this bill limits legal judicial review challenges to a Federal agency for acting on it to the
U.S. Court of Appeals, D.C. circuit.
43 Keystone XL Pipeline. No. H.R. 5682. 113
th, 2d Session. Washington, D.C.: 14 November 2014. Web. 15
November 2014. <https://www.govtrack.us/congress/bills/113/hr5682/text>.
39
North Atlantic Energy Security Act (NAESA) This Senate Bill44 proposed in July 2014 is designed to promote domestic energy efforts with
such features as:
Reducing the need for imports of natural gas, directly reducing the trade deficit;
Creating and supporting millions of new jobs across the United States;
Adding billions to GDP;
Generating additional Federal, State, and local government tax revenues; and
Revitalizing the manufacturing sector with abundant and affordable feedstocks
Some of the key matters for passing this bill include the significant amount of flaring or venting
of natural gas while extracting petroleum where there is insufficient natural gas infrastructure,
such as pipelines and gathering systems. The bill provides the Secretary of the Interior with
additional authority for approval of this infrastructure on Federal and Indian lands, and allows
the Secretary to increase the royalties from such lands.
In addition, the NAESA provides for a date certain of no later than 45 days after an application
is submitted for the approval of LNG exportation. Also included is expedited approval for
natural gas exportation to Ukraine, NATO member countries and Japan. This act would help
solidify relations with our allies, and mitigate concerns of Petropolitic supply disruptions
perpetrated by Russia.
44 North Atlantic Energy Security Act. No. S. 2592. 10 July 2014. Web. 14 November 2014
<https://www.govtrack.us/congress/bills/113/s2592/text>.
40
CENTRAL BANK
In general, the Fed’s dual mandate of price stability and maximum employment has an inverse
relationship. The three key tools utilized by the Fed to achieve this objective are open market
operations, reserve requirements and interest rate policy. Open market operations are when
the Fed transacts in the financial market by purchasing treasury securities. In doing so, due to
the inverse relationship between price and yield for bonds, the transactions reduce interest
rates and increase demand for credit that stimulates the economy. The term Quantitative
Easing (QE) is a form of open market operations with an added twist of including non-treasury
securities (e.g., mortgage-backed) with additional procedures in which to manipulate interest
rates. Reducing reserve requirements frees up funds of lenders previously held on account at
the Fed, allowing lenders to extend credit to customers with the goal of expanding the
economy. Interest rate policy via setting the Fed Funds rate has been the most frequently used
tool historically, with the significant QE expansion a relatively recent phenomenon. The Central
Bank section will focus on interest rate policy.
41
The Taylor Rule is often recommended as a rule of thumb for setting the nominal Fed Funds
Rate, incorporating a real rate based on risk pricing and an inflation risk premium. This rule is
represented by the following algorithm with assumed values in brackets based on long-term
trends:
i = r* + π + a1(π - π*) + a2(g - g*)
Defined as:
I = Target Fed Funds Rate
r* = Average real interest rate [2%]
π = Inflation rate [PCE]
π* = Target inflation rate [2%]
g = Real Gross Domestic Product (GDP) growth rate
g* = Average GDP growth rate [3%]
(a1, a2) = Parameter weights [50% each]
As can be seen by the formula and parameter weights, the Fed’s goal is to have a balanced
approach, a Goldilocks range for an economy that is not too hot and not too cold allowing for
moderate sustained growth. With any interest rate move, there is a lag time before the effects
of the move begin to show up in the data. The exact amount of time is subject to debate, but is
generally believed to be at least six to nine months.
As part of the Fed’s mandate, inflation takes a prominent role in monetary policy. Although the
Fed is chartered as an apolitical body, Fed Governors are political appointees, and it would be
naïve to assume that certain biases are never encountered when setting monetary policy. The
most frequently used tool by the Fed in policy actions is changes in interest rates by the Federal
42
Open Market Committee (FOMC). When assessing energy’s impact on inflation, the FOMC
communicates that it strips out the effects of the more volatile food and energy components,
and focuses on “core inflation.”
Picturesque
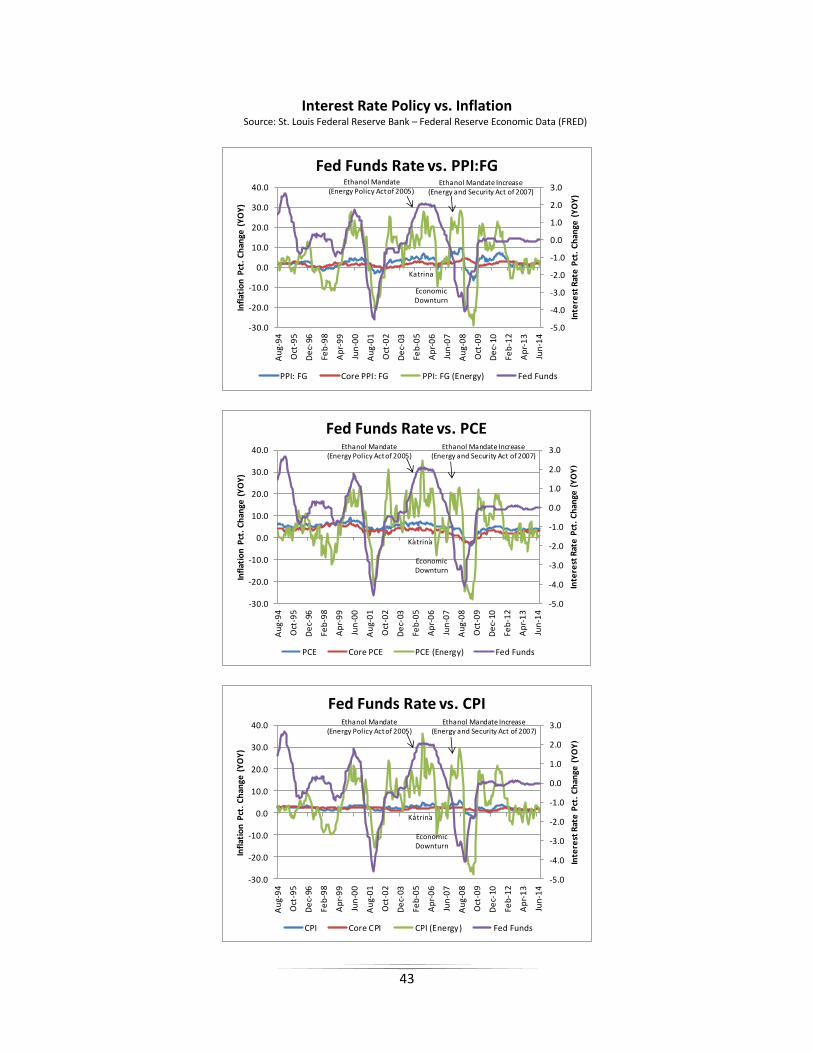
When assessing interest rate policy as it relates to taming inflation, I utilized three major
inflation measures, a subindex of the Producer Price Index (PPI): Finished Goods (FG); the
Personal Consumption Expenditure Price Index (PCE); and, the Consumer Price Index (CPI). As
inflationary pressures generally show up in the production process in a timelier manner, PPI
often serves as an early warning indicator. The most widely followed inflation measure is the
CPI, yet due to certain features such as different weightings between CPI and PCE, and PCE
making adjustments to relative prices and the substitution effect of goods and services, PCE is
the favored index utilized by the Fed in setting rates. As discussed, the FOMC states that it
focuses on core inflation measures. Yet when using an ocular test for interest rate policy in
response to the aforementioned inflation measures, it would appear that the FOMC does not
adhere to this guideline (See Interest Rate Policy vs. Inflation graphs). Changes in headline PPI:
FG, CPI and PCE, as well as their respective Core subindices, are relatively moderate, even
though there are wide swings in the Fed Funds Rate, closely mirroring the volatility in energy
price inflation, as represented by subindices (e.g., PCE (Energy)) of the respective inflation
measures. Based on this observation, I conclude the FOMC’s actions do not follow its
communicated guidance of adhering to fluctuations in core inflation measures as the triggering
mechanism in changing interest rates, rather energy price inflation dominates policy actions.
43
Interest Rate Policy vs. Inflation Source: St. Louis Federal Reserve Bank – Federal Reserve Economic Data (FRED)
-5.0
-4.0
-3.0
-2.0
-1.0
0.0
1.0
2.0
3.0
-30.0
-20.0
-10.0
0.0
10.0
20.0
30.0
40.0
Au
g-9
4
Oct
-95
De
c-96
Feb
-98
Ap
r-9
9
Jun
-00
Au
g-0
1
Oct
-02
De
c-03
Feb
-05
Ap
r-0
6
Jun
-07
Au
g-0
8
Oct
-09
De
c-10
Feb
-12
Ap
r-1
3
Jun
-14
Inte
rest
Rat
e P
ct.
Ch
ange
(Y
OY
)
Infl
atio
n P
ct.
Ch
ange
(Y
OY
)
Fed Funds Rate vs. PPI:FG
PPI: FG Core PPI: FG PPI: FG (Energy) Fed Funds
Ethanol Mandate (Energy Policy Actof 2005)
Economic Downturn
Ethanol Mandate Increase (Energy and Security Act of 2007)
Katrina
-5.0
-4.0
-3.0
-2.0
-1.0
0.0
1.0
2.0
3.0
-30.0
-20.0
-10.0
0.0
10.0
20.0
30.0
40.0
Au
g-9
4
Oct
-95
De
c-96
Feb
-98
Ap
r-9
9
Jun
-00
Au
g-0
1
Oct
-02
De
c-03
Feb
-05
Ap
r-0
6
Jun
-07
Au
g-0
8
Oct
-09
De
c-10
Feb
-12
Ap
r-1
3
Jun
-14
Inte
rest
Rat
e P
ct.
Ch
ange
(Y
OY)
Infl
atio
n P
ct.
Ch
ange
(Y
OY
)
Fed Funds Rate vs. PCE
PCE Core PCE PCE (Energy) Fed Funds
Ethanol Mandate (Energy Policy Actof 2005)
Economic Downturn
Ethanol Mandate Increase (Energy and Security Act of 2007)
Katrina
-5.0
-4.0
-3.0
-2.0
-1.0
0.0
1.0
2.0
3.0
-30.0
-20.0
-10.0
0.0
10.0
20.0
30.0
40.0
Au
g-9
4
Oct
-95
De
c-96
Feb
-98
Ap
r-9
9
Jun
-00
Au
g-0
1
Oct
-02
De
c-03
Feb
-05
Ap
r-0
6
Jun
-07
Au
g-0
8
Oct
-09
De
c-10
Feb
-12
Ap
r-1
3
Jun
-14
Inte
rest
Rat
e P
ct.
Ch
ange
(Y
OY)
Infl
atio
n P
ct.
Ch
ange
(Y
OY
)
Fed Funds Rate vs. CPI
CPI Core CPI CPI (Energy) Fed Funds
Ethanol Mandate (Energy Policy Actof 2005)
Economic Downturn
Ethanol Mandate Increase (Energy and Security Act of 2007)
Katrina
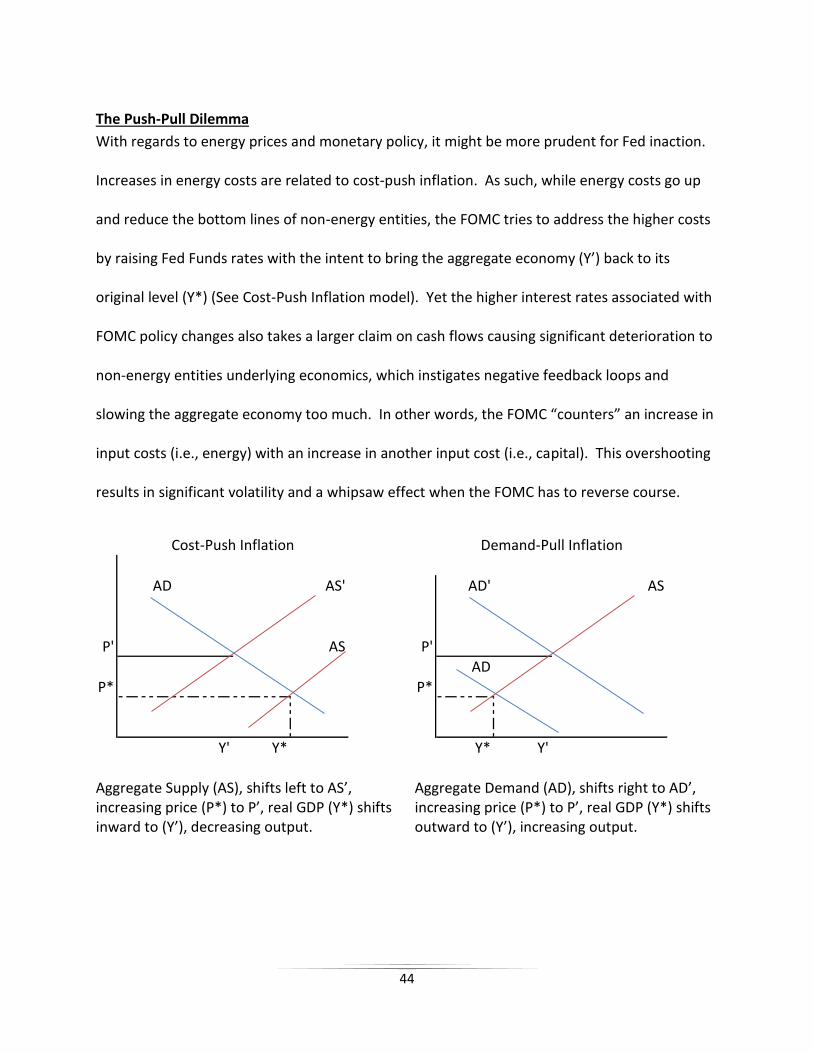
44
The Push-Pull Dilemma
With regards to energy prices and monetary policy, it might be more prudent for Fed inaction.
Increases in energy costs are related to cost-push inflation. As such, while energy costs go up
and reduce the bottom lines of non-energy entities, the FOMC tries to address the higher costs
by raising Fed Funds rates with the intent to bring the aggregate economy (Y’) back to its
original level (Y*) (See Cost-Push Inflation model). Yet the higher interest rates associated with
FOMC policy changes also takes a larger claim on cash flows causing significant deterioration to
non-energy entities underlying economics, which instigates negative feedback loops and
slowing the aggregate economy too much. In other words, the FOMC “counters” an increase in
input costs (i.e., energy) with an increase in another input cost (i.e., capital). This overshooting
results in significant volatility and a whipsaw effect when the FOMC has to reverse course.
Aggregate Supply (AS), shifts left to AS’, increasing price (P*) to P’, real GDP (Y*) shifts inward to (Y’), decreasing output.
Aggregate Demand (AD), shifts right to AD’, increasing price (P*) to P’, real GDP (Y*) shifts outward to (Y’), increasing output.
AD AS'
P' AS
P*
Y' Y*
Cost-Push Inflation
AD' AS
P'
AD
P*
Y* Y'
Demand-Pull Inflation

45
Secrets of the Temple
As the main author of a paper45 while at The University of Chicago, I made the claim that Fed
interest rate policy related to energy prices was erroneous. Unbeknownst to me at the time,
John Fernald, Ph.D., visiting adjunct professor for the course, was a member of the team of
economists at the Fed that focused on energy related matters, and described the critique as “A
fresh view!” This comment brings into question whether the Fed had ever considered this issue
and the implications on interest rate policy and economic growth. Interest rate policy should
focus on demand-pull inflation as illustrated in the model and following the premise that
“Inflation is always and everywhere a monetary phenomenon.”46 This argument is captured by
the Quantity Theory of Money, which states that the price level and money supply have a direct
and proportional relationship. If money supply increases, the prices of goods increase (i.e.,
inflation), expressed in the equation:
MV=QP
Defined as:
M = Money Supply (e.g., “M2” a Monetary Aggregate)
V = Velocity of Money (assumes M2 is relatively constant over the long-run)
Q = Quantity
P = Price
45
Anderson, Karie, Steve Avary and S. Gabe Leonard. "Macroeconomics: Assignment #3." Consideration of Rising Energy Prices by the FOMC. Chicago, 25 February 2005.
46 Friedman, Milton. "The Counter-Revolution in Monetary Theory." IEA Occasional Paper 33 (1970): 11. Web.
<http://0055d26.netsolhost.com/friedman/pdfs/other_academia/IEA.1970.pdf>.

46
Minute Minutiae
Looking over the FOMC minutes in a series of meetings that concluded with rate hikes
beginning in June 30, 2004 through June 29, 2006, I searched for language that buffered my
claims, and extracted a few samples of rate increase actions not following the stated policy of
using core inflation as the key determinant for interest rate policy, acknowledgement of the
impact of higher energy prices, or actions straying from its balanced dual mandate.
Of The Core, and The Core, and The Core Just as Douglas MacArthur’s “of The Corp” speech echoes his articulated exaggerated focus, yet
eschewing guidelines set by the Commander-in-Chief that escalated tensions in American
Foreign Policy, so too has the Fed’s actions led to deleterious effects on America’s Economy
which triggered a ripple effect by straying from its stated guidelines of policy driven by core
inflation. While “central bankers” may die, the residual effects of their misunderstanding are
indelible.
Shortly after the beginning of the rate increases, the minutes state that Core CPI had
“moderated substantially in May and June,” 47 although prices for food and energy had “sizable
increases.” After reviewing data of the after effects of Hurricane Katrina in August 2005, which
caused significant damage to U.S. energy infrastructure and a resultant spike in energy prices,
meeting minutes described Core CPI as “benign.”48 Still, rates were increased in response to a
47
The Federal Reserve Board. "Minutes of the Federal Open Market Committee: August 10, 2004." 10 August 2004. Web. 14 November 2014. <http://www.federalreserve.gov/fomc/minutes/20040810.htm> 48
The Federal Reserve Board. "Minutes of the Federal Open Market Committee: September 20, 2005." 20 September 2005. Web. 14 November 2014. <http://www.federalreserve.gov/fomc/minutes/20050920.htm>.

47
“surge in energy prices considerably boosted overall consumer price inflation over those
months.” Rate increases were also taken after reviewing the PPI, stating, “Although recent
increases in energy costs had pushed up producer prices in some sectors, overall producer price
inflation remained subdued.”49 Even rate actions related to inflation expectations does not
appear to follow policy as expressed in “measures of core inflation were thought likely to
remain in check over the remainder of this year and next.”50 Additionally, “Despite the rise in
oil prices … both market- and survey-based measures of inflation expectations seemed to
remain quite well anchored.”51 Such interest rate moves while acknowledging either headline
or core inflation as relatively tame, further erodes FOMC’s articulated policy guidelines.
Collide-a-scope FOMC rate increases in response to higher energy input costs suspends belief with
acknowledgement of its impact that “the recent surge in energy prices was anticipated to
impose some drag for a time,”52 and “High energy prices appeared to be taking a toll on
household and business confidence and might be beginning to crimp corporate profits.”53 The
soundness of these increases are doubtful as they exacerbated the problem.
49
The Federal Reserve Board. "Minutes of the Federal Open Market Committee: December 13, 2005." 13 December 2005. Web. 14 November 2014. <http://www.federalreserve.gov/fomc/minutes/20051213.htm>.
50 The Federal Reserve Board. "Minutes of the Federal Open Market Committee: May 3, 2005." 3 May 2005. Web.
2014 14 November. <http://www.federalreserve.gov/fomc/minutes/20050503.htm>. 51
The Federal Reserve Board. "Minutes of the Federal Open Market Committee: August 9, 2005." 9 August 2005. Web.14 November 2014. <http://www.federalreserve.gov/fomc/minutes/20050809.htm>. 52
The Federal Reserve Board. "Minutes of the Federal Open Market Committee: June 30, 2005." 30 June 2005. Web. 14 November 2014. <http://www.federalreserve.gov/fomc/minutes/20050630.htm>.
53 The Federal Reserve Board. "Minutes of the Federal Open Market Committee: May 3, 2005." 3 May 2005. Web.
2014 14 November. <http://www.federalreserve.gov/fomc/minutes/20050503.htm>.
48
50 shades of grey Corresponding with the Fed’s dual mandate is the dictum that they should be equally balanced,
a 50% parameter weighting. Comments such as, “The Committee perceives the upside and
downside risks to the attainment of both sustainable growth and price stability for the next few
quarters are roughly equal,”54 and, “Although energy prices had the potential to add to inflation
pressures … members agreed that the risks to inflation, as well as to growth, remained
essentially balanced,”55 questions the necessity of rate hike moves.
If the risks between the parameters is “roughly equal” or “essentially balanced,” why would
there need to be a change in existing rates? Such rate moves indicate a “shading toward” one
side, and imply the desire to disequilibrate, a breach of its dual mandate.
54
The Federal Reserve Board. "Minutes of the Federal Open Market Committee: June 30, 2005." 30 June 2005. Web. 14 November 2014. <http://www.federalreserve.gov/fomc/minutes/20050630.htm>.
55 The Federal Reserve Board. "Minutes of the Federal Open Market Committee: September 20, 2005." 20
September 2005. Web. 14 November 2014. <http://www.federalreserve.gov/fomc/minutes/20050920.htm>.
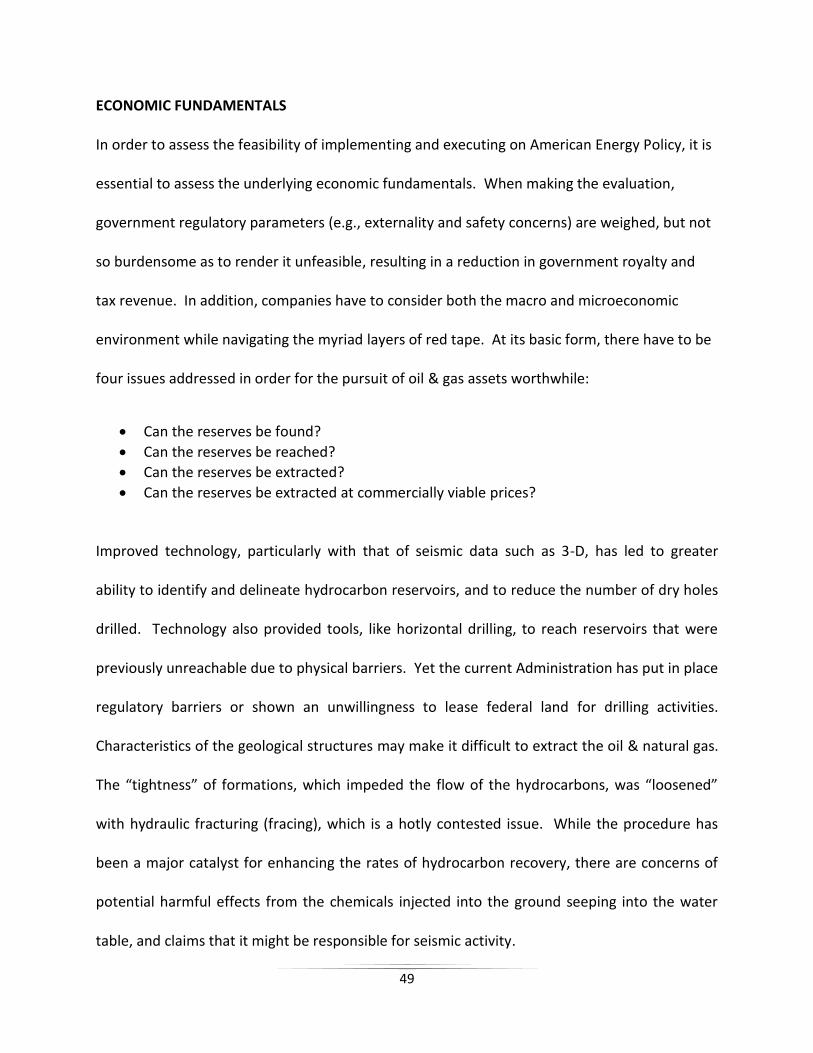
49
ECONOMIC FUNDAMENTALS
In order to assess the feasibility of implementing and executing on American Energy Policy, it is
essential to assess the underlying economic fundamentals. When making the evaluation,
government regulatory parameters (e.g., externality and safety concerns) are weighed, but not
so burdensome as to render it unfeasible, resulting in a reduction in government royalty and
tax revenue. In addition, companies have to consider both the macro and microeconomic
environment while navigating the myriad layers of red tape. At its basic form, there have to be
four issues addressed in order for the pursuit of oil & gas assets worthwhile:
Can the reserves be found?
Can the reserves be reached?
Can the reserves be extracted?
Can the reserves be extracted at commercially viable prices?
Improved technology, particularly with that of seismic data such as 3-D, has led to greater
ability to identify and delineate hydrocarbon reservoirs, and to reduce the number of dry holes
drilled. Technology also provided tools, like horizontal drilling, to reach reservoirs that were
previously unreachable due to physical barriers. Yet the current Administration has put in place
regulatory barriers or shown an unwillingness to lease federal land for drilling activities.
Characteristics of the geological structures may make it difficult to extract the oil & natural gas.
The “tightness” of formations, which impeded the flow of the hydrocarbons, was “loosened”
with hydraulic fracturing (fracing), which is a hotly contested issue. While the procedure has
been a major catalyst for enhancing the rates of hydrocarbon recovery, there are concerns of
potential harmful effects from the chemicals injected into the ground seeping into the water
table, and claims that it might be responsible for seismic activity.
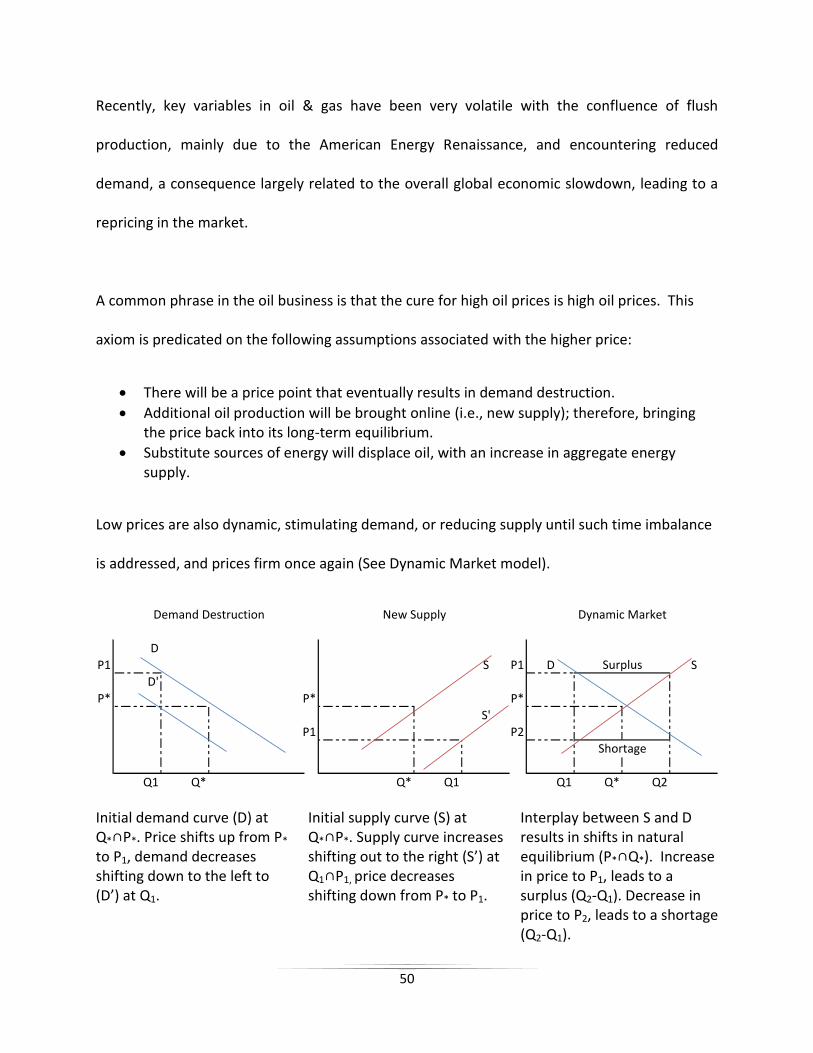
50
Recently, key variables in oil & gas have been very volatile with the confluence of flush
production, mainly due to the American Energy Renaissance, and encountering reduced
demand, a consequence largely related to the overall global economic slowdown, leading to a
repricing in the market.
A common phrase in the oil business is that the cure for high oil prices is high oil prices. This
axiom is predicated on the following assumptions associated with the higher price:
There will be a price point that eventually results in demand destruction.
Additional oil production will be brought online (i.e., new supply); therefore, bringing the price back into its long-term equilibrium.
Substitute sources of energy will displace oil, with an increase in aggregate energy supply.
Low prices are also dynamic, stimulating demand, or reducing supply until such time imbalance
is addressed, and prices firm once again (See Dynamic Market model).
Initial demand curve (D) at Q*∩P*. Price shifts up from P* to P1, demand decreases shifting down to the left to (D’) at Q1.
Initial supply curve (S) at Q*∩P*. Supply curve increases shifting out to the right (S’) at Q1∩P1, price decreases shifting down from P* to P1.
Interplay between S and D results in shifts in natural equilibrium (P*∩Q*). Increase in price to P1, leads to a surplus (Q2-Q1). Decrease in price to P2, leads to a shortage (Q2-Q1).
D
P1 S P1 D S
D'
P* P* P*
S'
P1 P2
Q1 Q* Q* Q1 Q1 Q* Q2
Demand Destruction New Supply
Surplus
Shortage
Dynamic Market
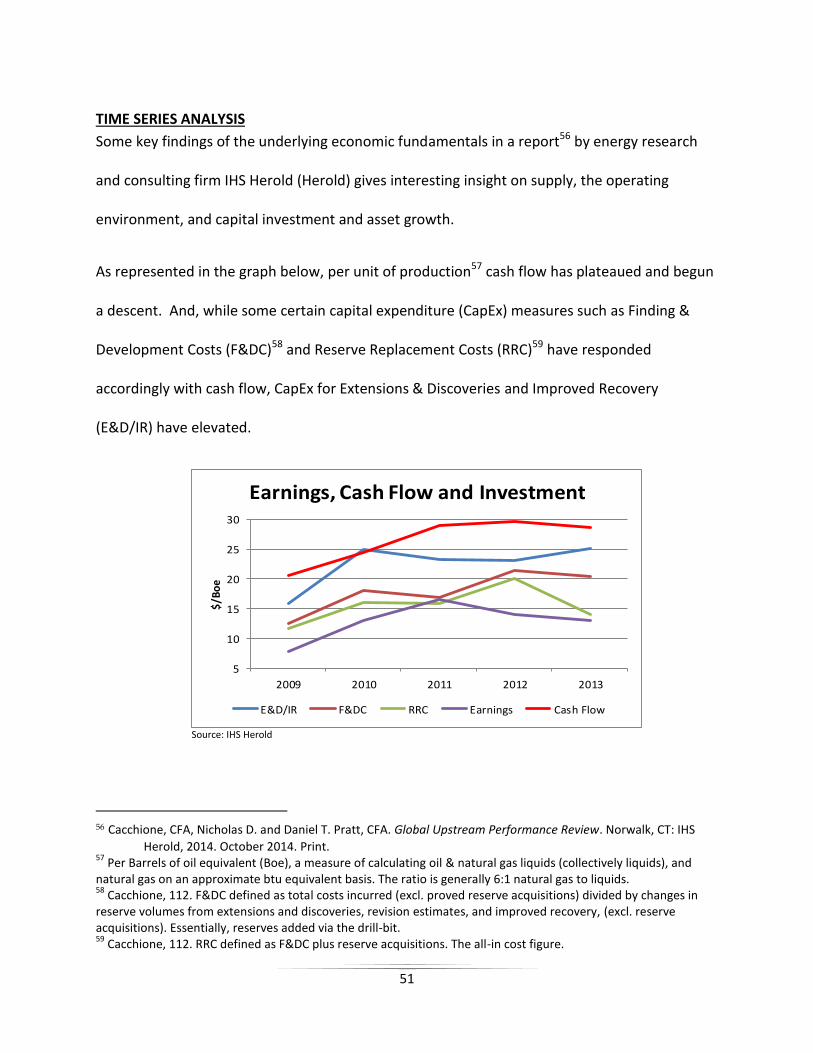
51
TIME SERIES ANALYSIS
Some key findings of the underlying economic fundamentals in a report56 by energy research
and consulting firm IHS Herold (Herold) gives interesting insight on supply, the operating
environment, and capital investment and asset growth.
As represented in the graph below, per unit of production57 cash flow has plateaued and begun
a descent. And, while some certain capital expenditure (CapEx) measures such as Finding &
Development Costs (F&DC)58 and Reserve Replacement Costs (RRC)59 have responded
accordingly with cash flow, CapEx for Extensions & Discoveries and Improved Recovery
(E&D/IR) have elevated.
Source: IHS Herold
56 Cacchione, CFA, Nicholas D. and Daniel T. Pratt, CFA. Global Upstream Performance Review. Norwalk, CT: IHS
Herold, 2014. October 2014. Print. 57
Per Barrels of oil equivalent (Boe), a measure of calculating oil & natural gas liquids (collectively liquids), and natural gas on an approximate btu equivalent basis. The ratio is generally 6:1 natural gas to liquids. 58
Cacchione, 112. F&DC defined as total costs incurred (excl. proved reserve acquisitions) divided by changes in reserve volumes from extensions and discoveries, revision estimates, and improved recovery, (excl. reserve acquisitions). Essentially, reserves added via the drill-bit. 59
Cacchione, 112. RRC defined as F&DC plus reserve acquisitions. The all-in cost figure.
5
10
15
20
25
30
2009 2010 2011 2012 2013
$/B
oe
Earnings, Cash Flow and Investment
E&D/IR F&DC RRC Earnings Cash Flow
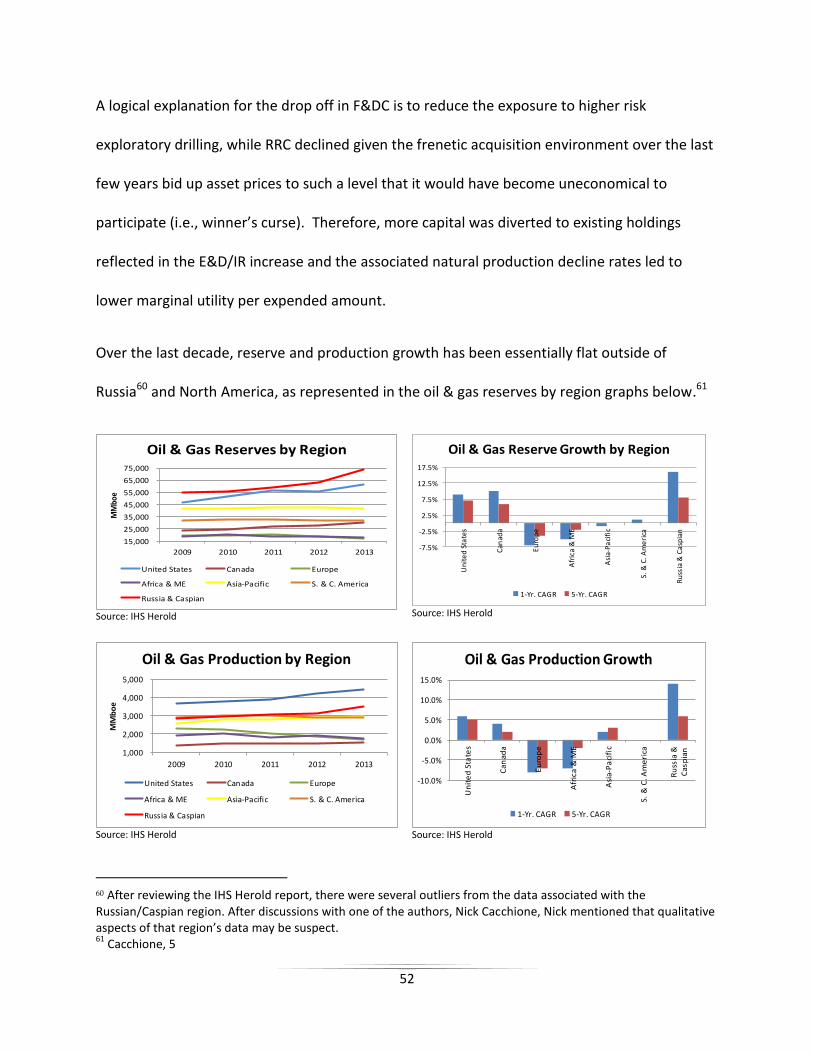
52
A logical explanation for the drop off in F&DC is to reduce the exposure to higher risk
exploratory drilling, while RRC declined given the frenetic acquisition environment over the last
few years bid up asset prices to such a level that it would have become uneconomical to
participate (i.e., winner’s curse). Therefore, more capital was diverted to existing holdings
reflected in the E&D/IR increase and the associated natural production decline rates led to
lower marginal utility per expended amount.
Over the last decade, reserve and production growth has been essentially flat outside of
Russia60 and North America, as represented in the oil & gas reserves by region graphs below.61
Source: IHS Herold
Source: IHS Herold
Source: IHS Herold
Source: IHS Herold
60 After reviewing the IHS Herold report, there were several outliers from the data associated with the Russian/Caspian region. After discussions with one of the authors, Nick Cacchione, Nick mentioned that qualitative aspects of that region’s data may be suspect. 61
Cacchione, 5
15,000
25,000
35,000
45,000
55,000
65,000
75,000
2009 2010 2011 2012 2013
MM
boe
Oil & Gas Reserves by Region
United States Canada Europe
Africa & ME Asia-Pacific S. & C. America
Russia & Caspian
-7.5%
-2.5%
2.5%
7.5%
12.5%
17.5%U
nit
ed
Sta
tes
Can
ada
Eu
rop
e
Afr
ica
& M
E
Asi
a-P
aci
fic
S. &
C. A
me
rica
Ru
ssia
& C
asp
ian
Oil & Gas Reserve Growth by Region
1-Yr. CAGR 5-Yr. CAGR
1,000
2,000
3,000
4,000
5,000
2009 2010 2011 2012 2013
MM
bo
e
Oil & Gas Production by Region
United States Canada Europe
Africa & ME Asia-Pacific S. & C. America
Russia & Caspian
-10.0%
-5.0%
0.0%
5.0%
10.0%
15.0%
Un
ite
d S
tate
s
Can
ada
Eu
rop
e
Afr
ica
& M
E
Asi
a-P
aci
fic
S. &
C. A
me
rica
Ru
ssia
&C
asp
ian
Oil & Gas Production Growth
1-Yr. CAGR 5-Yr. CAGR
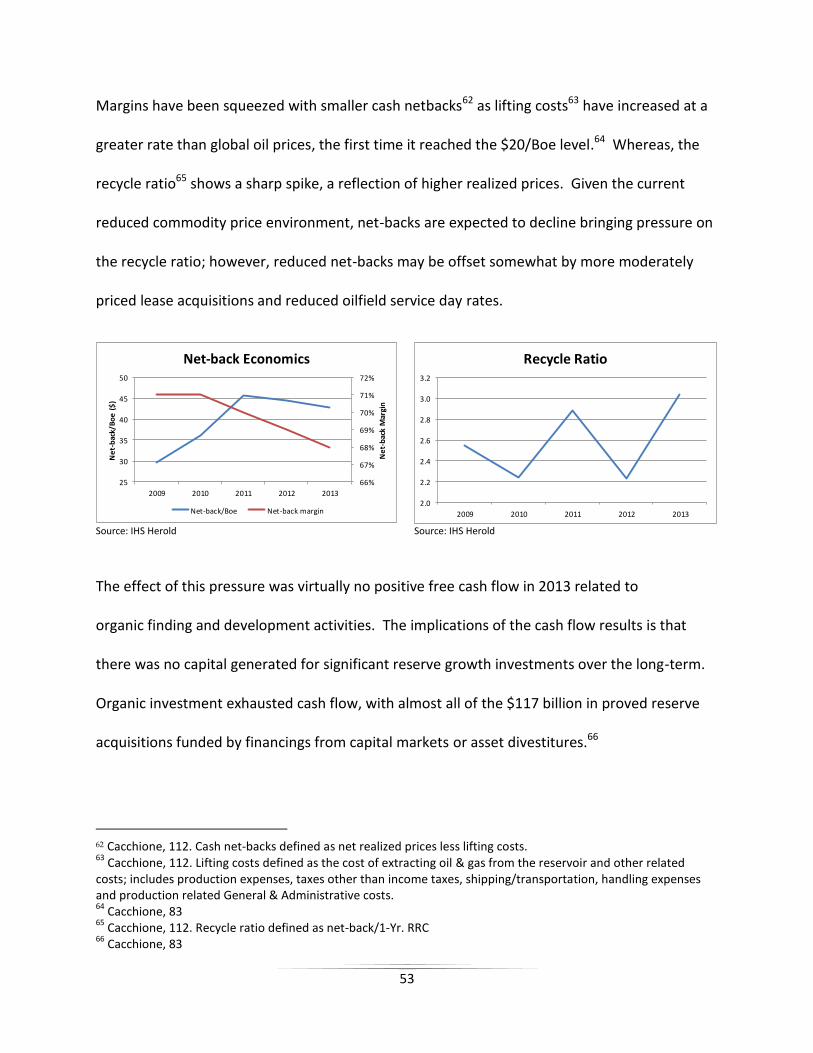
53
Margins have been squeezed with smaller cash netbacks62 as lifting costs63 have increased at a
greater rate than global oil prices, the first time it reached the $20/Boe level.64 Whereas, the
recycle ratio65 shows a sharp spike, a reflection of higher realized prices. Given the current
reduced commodity price environment, net-backs are expected to decline bringing pressure on
the recycle ratio; however, reduced net-backs may be offset somewhat by more moderately
priced lease acquisitions and reduced oilfield service day rates.
Source: IHS Herold
Source: IHS Herold
The effect of this pressure was virtually no positive free cash flow in 2013 related to
organic finding and development activities. The implications of the cash flow results is that
there was no capital generated for significant reserve growth investments over the long-term.
Organic investment exhausted cash flow, with almost all of the $117 billion in proved reserve
acquisitions funded by financings from capital markets or asset divestitures.66
62 Cacchione, 112. Cash net-backs defined as net realized prices less lifting costs. 63
Cacchione, 112. Lifting costs defined as the cost of extracting oil & gas from the reservoir and other related costs; includes production expenses, taxes other than income taxes, shipping/transportation, handling expenses and production related General & Administrative costs. 64
Cacchione, 83 65
Cacchione, 112. Recycle ratio defined as net-back/1-Yr. RRC 66
Cacchione, 83
66%
67%
68%
69%
70%
71%
72%
25
30
35
40
45
50
2009 2010 2011 2012 2013
Ne
t-b
ack
Mar
gin
Ne
t-b
ack/
Bo
e (
$)
Net-back Economics
Net-back/Boe Net-back margin2.0
2.2
2.4
2.6
2.8
3.0
3.2
2009 2010 2011 2012 2013
Recycle Ratio

54
Source: IHS Herold
Source: IHS Herold
Even with the recent softness, the Herold report deems the North American market as
attractive based on the following: secure free-market enterprise, ease of doing business,
relatively stable fiscal regimes, and the general support of oil & gas development.67
With respect to the attributes listed by Herold, I have a bit more cautious approach. Based on
the Ease of Doing Business Index,68 while America is ranked in the overall top 10, it is largely
due to two factors, ease of Getting Credit and its more effective and efficient bankruptcy
process in Resolving Insolvency, two sides of the same coin. The U.S. competitive position
could be enhanced dramatically with a reduction in red tape. With the results of the recent
midterm elections, it is almost certain that there will be an aggressive fight on fiscal policy that
may be prolonged and fill the air with uncertainty. While there might be general support for oil
& gas development, unquestionably there are powerful groups and individuals that are aligned
against it. I believe there will be improvements on all these factors. It is too early to tell how
these matters will be resolved, but they most likely will face significant head winds.
67
Cacchione, 6 68
World Bank. Doing Business Index. 2014. Web. 14 November 2014. <http://www.doingbusiness.org/rankings>.
0
10
20
30
40
50
60
2009 2010 2011 2012 2013
$/B
oe
Regional RRC
United States Canada Europe
Africa & ME Asia-Pacific S. & C. America
Russia & Caspian
0%
200%
400%
600%
2009 2010 2011 2012 2013
Reserve Replacement Rates
United States Canada Europe
Africa & ME Asia-Pacific S. & C. America
Russia & Caspian
55
CAPITAL DISCIPLINE
There is a saying that your experiences shape your perspective. As someone that grew up in
Houston, I have seen the ravages of the boom bust cycle associated with the oil patch up close
and personal. While I have a positive outlook for oil & gas prices over the long-term, given the
most recent volatility in the markets, there might be an extended period of significant price
pressure. Capital discipline, not outspending cash flow, is paramount in such an environment.
“Exibit A” for the capital discipline situation is Chesapeake Energy. Chesapeake has been
prominent in the news over the last few years with the previous management’s aggressive
strategy of taking on excessive leverage, its highly acquisitive nature and promoting itself as the
most active driller in the country, even in a deteriorating commodity price environment. The
following was excerpted from a January 2000 report69 on Chesapeake that I co-authored as a
high-yield bond analyst.
“Financial Leverage: Our greatest concern has been, and still is, the company’s high degree of
financial leverage … When the leverage issue was brought up to management during the
conference call, they mentioned that leverage can be reduced by growing the asset side of the
balance sheet as well as through actual paying down existing debt. To some extent we agree;
however, for those who have short-term memory, asset values can erode very quickly in a
commodity-based industry. As the saying goes: Those who forget history are doomed to
repeat it.”
69
Messina, F. Joseph and Steven L. Avary. Chesapeake Energy Corporation. Securities Research. Minneapolis: Dain Rauscher Wessels, 2000. 4. Print <https://www.linkedin.com/profile/view?id=2506829&trk=nav_responsive_tab_profile>.
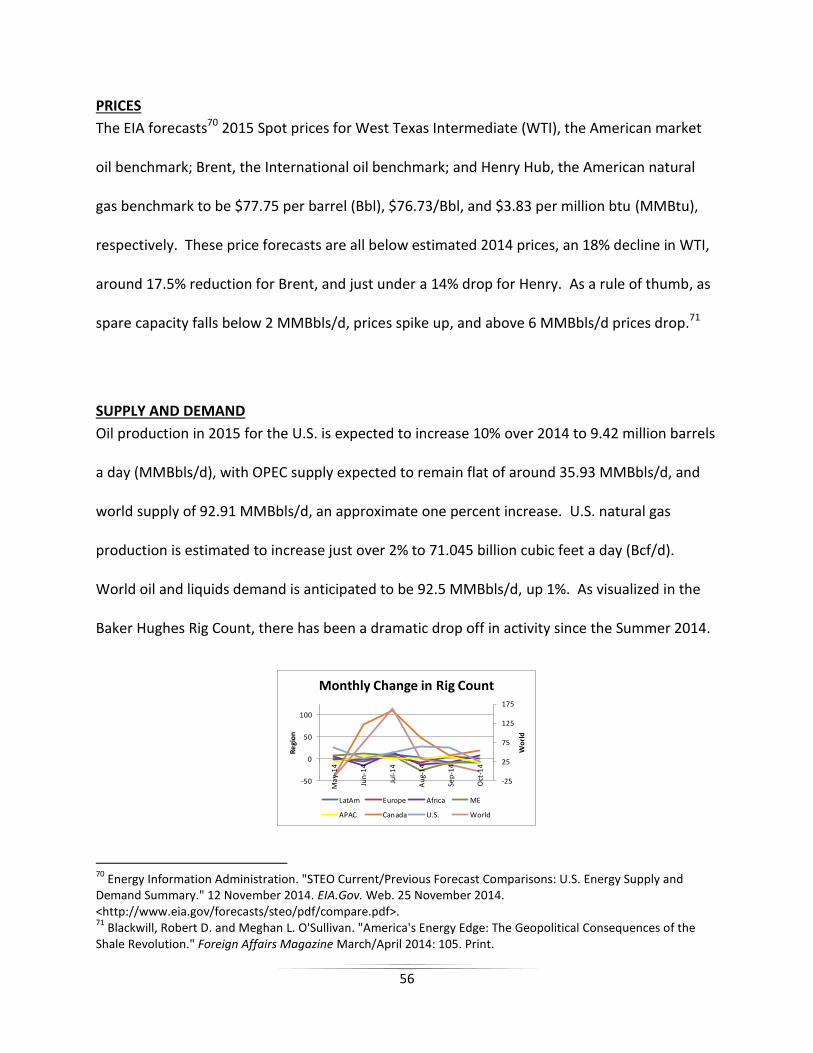
56
PRICES
The EIA forecasts70 2015 Spot prices for West Texas Intermediate (WTI), the American market
oil benchmark; Brent, the International oil benchmark; and Henry Hub, the American natural
gas benchmark to be $77.75 per barrel (Bbl), $76.73/Bbl, and $3.83 per million btu (MMBtu),
respectively. These price forecasts are all below estimated 2014 prices, an 18% decline in WTI,
around 17.5% reduction for Brent, and just under a 14% drop for Henry. As a rule of thumb, as
spare capacity falls below 2 MMBbls/d, prices spike up, and above 6 MMBbls/d prices drop.71
SUPPLY AND DEMAND
Oil production in 2015 for the U.S. is expected to increase 10% over 2014 to 9.42 million barrels
a day (MMBbls/d), with OPEC supply expected to remain flat of around 35.93 MMBbls/d, and
world supply of 92.91 MMBbls/d, an approximate one percent increase. U.S. natural gas
production is estimated to increase just over 2% to 71.045 billion cubic feet a day (Bcf/d).
World oil and liquids demand is anticipated to be 92.5 MMBbls/d, up 1%. As visualized in the
Baker Hughes Rig Count, there has been a dramatic drop off in activity since the Summer 2014.
70
Energy Information Administration. "STEO Current/Previous Forecast Comparisons: U.S. Energy Supply and Demand Summary." 12 November 2014. EIA.Gov. Web. 25 November 2014. <http://www.eia.gov/forecasts/steo/pdf/compare.pdf>. 71
Blackwill, Robert D. and Meghan L. O'Sullivan. "America's Energy Edge: The Geopolitical Consequences of the Shale Revolution." Foreign Affairs Magazine March/April 2014: 105. Print.
-25
25
75
125
175
-50
0
50
100
Ma
y-1
4
Jun
-14
Jul-
14
Au
g-1
4
Sep
-14
Oct
-14
Wo
rld
Re
gio
n
Monthly Change in Rig Count
LatAm Europe Africa ME
APAC Canada U.S. World
57
IMPLICATIONS
The recommendations for the various policy shifts by the Executive Branch is related to foreign
policy in securing resources and providing economic security, to drive trade agreements that
enhances our relationships that are mutually beneficial. The Legislative Branch propositions are
to eliminate the funding of projects that are best left to the private sector, and to eliminate
economic distortions through various price or volume support policies, or to rescind mandates
that restrict America from achieving its potential. Being a proponent of existing Bills should
result in a more robust domestic energy economy. Fed intervention with interest rate moves
based on erroneous perceptions, causes significant volatility and contributes to a more severe
downturn than what might have occurred otherwise with non-intervention. All these issues
translate to America’s global standing and provide support in reaching an ultimate objective of
being a Hegemon. In addition, policy shifts should bolster the trade and budget deficits, and
will be played out on the global stage in various iterations of Game Theory.
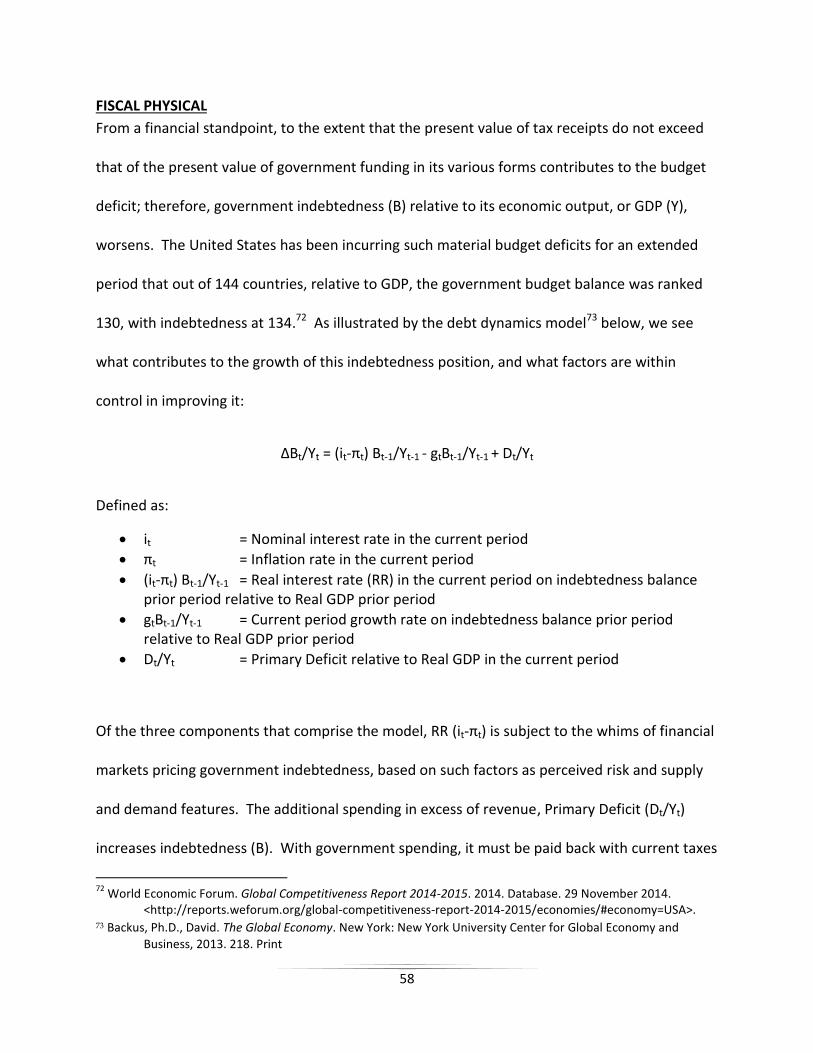
58
FISCAL PHYSICAL
From a financial standpoint, to the extent that the present value of tax receipts do not exceed
that of the present value of government funding in its various forms contributes to the budget
deficit; therefore, government indebtedness (B) relative to its economic output, or GDP (Y),
worsens. The United States has been incurring such material budget deficits for an extended
period that out of 144 countries, relative to GDP, the government budget balance was ranked
130, with indebtedness at 134.72 As illustrated by the debt dynamics model73 below, we see
what contributes to the growth of this indebtedness position, and what factors are within
control in improving it:
ΔBt/Yt = (it-πt) Bt-1/Yt-1 - gtBt-1/Yt-1 + Dt/Yt
Defined as:
it = Nominal interest rate in the current period
πt = Inflation rate in the current period
(it-πt) Bt-1/Yt-1 = Real interest rate (RR) in the current period on indebtedness balance prior period relative to Real GDP prior period
gtBt-1/Yt-1 = Current period growth rate on indebtedness balance prior period relative to Real GDP prior period
Dt/Yt = Primary Deficit relative to Real GDP in the current period
Of the three components that comprise the model, RR (it-πt) is subject to the whims of financial
markets pricing government indebtedness, based on such factors as perceived risk and supply
and demand features. The additional spending in excess of revenue, Primary Deficit (Dt/Yt)
increases indebtedness (B). With government spending, it must be paid back with current taxes
72
World Economic Forum. Global Competitiveness Report 2014-2015. 2014. Database. 29 November 2014. <http://reports.weforum.org/global-competitiveness-report-2014-2015/economies/#economy=USA>.
73 Backus, Ph.D., David. The Global Economy. New York: New York University Center for Global Economy and
Business, 2013. 218. Print
59
or borrowing (future taxes). Taxes drain the private sector of funds, and government
borrowing crowds out capital otherwise allocable to the private sector, with either taxes or
government borrowing constraining Y.
The premise for these expenditures is based on the Keynesian Multiplier, a theory that for
every dollar government spends, more than one dollar in value is created. The nuance of GDP
reporting is that all the components are based on value with the exception of Government,
which is based on cost, and cost ≠ value. With this understanding, as can be seen by the GDP
Expenditure Model, not all dollars are equal. Based on various studies,74 it is suggested that
there is no “Multiplier,” rather it is a “Divisor” with the value received per dollar spent less than
one, sometimes by a significant amount. In other words, if we were to accept this argument,
for every dollar government spends results in net wealth destruction. The lack of financial
incentives and ubiquitous inefficiencies in government processes lends credence to this claim.
74 Barro, Robert and Charles Redlick. "Macroeconomic Effects from Government Purchases and Taxes." National
Bureau of Economic Research Working Paper 15369 (2009). Web. 29 November 2014. <http://www.nber.org/papers/w15369.pdf>.
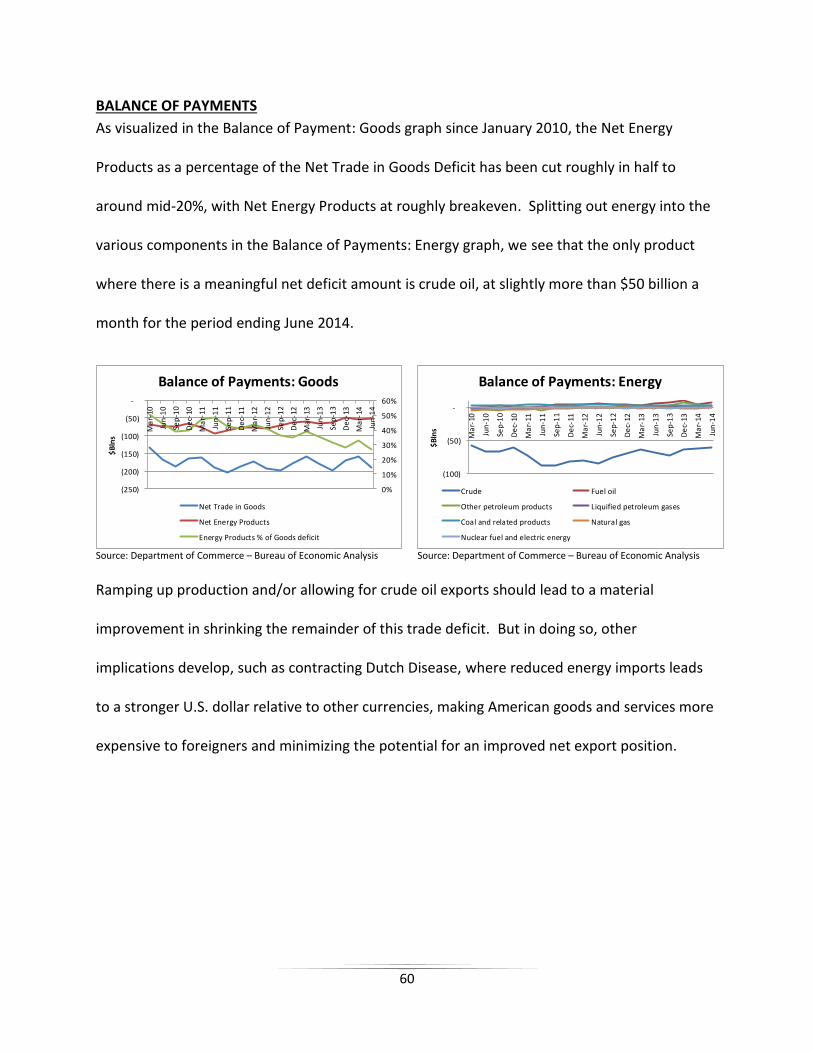
60
BALANCE OF PAYMENTS
As visualized in the Balance of Payment: Goods graph since January 2010, the Net Energy
Products as a percentage of the Net Trade in Goods Deficit has been cut roughly in half to
around mid-20%, with Net Energy Products at roughly breakeven. Splitting out energy into the
various components in the Balance of Payments: Energy graph, we see that the only product
where there is a meaningful net deficit amount is crude oil, at slightly more than $50 billion a
month for the period ending June 2014.
Source: Department of Commerce – Bureau of Economic Analysis
Source: Department of Commerce – Bureau of Economic Analysis
Ramping up production and/or allowing for crude oil exports should lead to a material
improvement in shrinking the remainder of this trade deficit. But in doing so, other
implications develop, such as contracting Dutch Disease, where reduced energy imports leads
to a stronger U.S. dollar relative to other currencies, making American goods and services more
expensive to foreigners and minimizing the potential for an improved net export position.
0%
10%
20%
30%
40%
50%
60%
(250)
(200)
(150)
(100)
(50)
-
Ma
r-10
Jun
-10
Sep
-10
De
c-10
Ma
r-11
Jun
-11
Sep
-11
De
c-11
Ma
r-12
Jun
-12
Sep
-12
De
c-12
Ma
r-13
Jun
-13
Sep
-13
De
c-13
Ma
r-14
Jun
-14
$B
lns
Balance of Payments: Goods
Net Trade in Goods
Net Energy Products
Energy Products % of Goods deficit
(100)
(50)
-
Ma
r-10
Jun
-10
Sep
-10
De
c-10
Ma
r-11
Jun
-11
Sep
-11
De
c-11
Ma
r-12
Jun
-12
Sep
-12
De
c-12
Ma
r-13
Jun
-13
Sep
-13
De
c-13
Ma
r-14
Jun
-14
$B
lns
Balance of Payments: Energy
Crude Fuel oil
Other petroleum products Liquified petroleum gases
Coal and related products Natural gas
Nuclear fuel and electric energy
61
CENTRAL BANK
Misunderstandings have real consequences as explained in a modified Taylor Rule analysis. Any
policy changes should be in the context of relative to the starting point, its rate of change.
Taylor Made
At the end of the period of tightening in June 2006 and given a nine-month lag, if we were to
make a slight modification to the Taylor Rule, inserting Core PCE for Headline PCE (π), suggests
that the Fed Funds rate should have been approximately 3.35% at the beginning of April 2007,
rather than 5.25%, a 190 basis points (bps) differential. One bps represents 1/100 of one
percent. If we were to apply this differential to an adjustable rate mortgage, it would equate to
an approximate $1.58 per $1,000 of outstanding indebtedness for the monthly payment.
Deriving the Derivative
Over the selected time series, there were 17 rate increases of 25 bps, for an aggregate change
of 4.25% (5.25%-1%). While this rate increase is substantial, to grasp its real impact it needs to
be in the context of rate of change from its starting point. It was not a 4.25% rate of change but
425% ((5.25%-1%)/1%). Given that much of the inflationary pressures were derived from
energy inflation and its cost-push features, a more logical approach would have been to be
more accommodative, to keep rates relatively low, in order to stimulate increased supply with
cheaper capital costs to fund additional investments. The impact of such a dramatic interest
rate increase can be traced to the financial markets, where floating rate, or adjustable rate debt
(e.g., mortgages) were repriced, as borrowers’ monthly mortgage payments skyrocketed and
contributed greatly to the economic downturn in 2008, with the impact visualized in the
Interest Rate Policy vs. Inflation graphs.
62
GAME THEORY
In essence, game theory contemplates strategy in a global chess game with each play from each
player having different potential payoffs, with each move and payoff impacting all the others.
Players
OPEC: Algeria, Angola, Ecuador, Iran, Iraq, Kuwait, Libya, Nigeria, Qatar,
Saudi Arabia, UAE and Venezuela
The oil cartel The Organization of the Petroleum Exporting Countries (OPEC) has had significant
influence over the global oil supply and price. Yet, long-term adherence to member production
agreements is rare, with individual members breaching their respective quotas in order to
capture more market share. While still pivotal, the organization itself is a shadow of its former
self with some members leaving (e.g., Indonesia) and other members in such disorder, that one
research firm described it as “a data-gathering and meeting-hosting bureaucracy.”75
Saudi Arabia is the de facto swing producer of OPEC, and in a period of normalcy, is usually the
only member of OPEC to have sufficient capacity to increase output dramatically. Wolfe
Research claims that the Saudi’s reduction in prices are largely due to “maintaining the stability
of global oil demand, while maintaining a high enough price to satisfy domestic budgetary
needs.”76 The increase in production is largely due to Iran, Iraq and Libya coming “back online”
after an extended period of reduced production, the effect of civil unrest (e.g., Arab Spring) and
military operations.
75
Sankey, Paul, et al. Global Oil: Oh Saudi where art Thou? New York, NY: Wolfe Research, 2014. 12. Print 76
Sankey, 13
63
Latin America: Brazil and Venezuela
Over the last few years, Brazil has squandered its ability to capitalize on significant resource
finds by its state owned oil company Petrobras. There has been high profile corruption
scandals connecting Petrobras to the Rousseff Administration, which was recently reelected to
another term. The key issue with Brazil is whether they will continue on the path with statist
policies, or will the Rousseff Administration follow the advice of the recently appointed finance
minister, Joaquim Levy, a University of Chicago-trained economist, who is a proponent of
market-based economics.77 I anticipate that Levy will follow closely Mexico’s PEMEX
privatization process, with the potential to push for privatization for Petrobras. Should that
occur, Petrobras should be a more effective and efficient competitor with other producers in
the America’s region. If Rousseff decides to rebuff Levy and stays the course, Petrobras will
most likely continue to underperform.
Petróleos de Venezuela, S.A. (PDVSA), is Venezuela’s state owned oil company, and usually
contributes around two-thirds of Venezuela’s GDP. The current Maduro Administration is a
continuation of the statist policies implemented by Chavez, using cash flows from PDVSA to
fund various social welfare projects and leaving little capital for reinvestment. What is
disconcerting for Venezuela and future OPEC discussions is the country’s representative to the
cartel, Rafael Ramirez. He was quoted about the November OPEC meeting that he would seek
77
Barchfield, Jenny. Brazil's Rousseff Names Banker as Finance Minister. ABC News. 27 November 2014. Web. 30 November 2014. <http://abcnews.go.com/International/wireStory/brazils-rousseff-names-banker-finance-minister-27221317>.
64
to defend prices that were falling “for no apparent reason.”78 Such a comment questions the
representative’s credibility. Either he is totally out of touch with current news, or he has no
grasp of simple economics.
Australia
From a geographic and resources standpoint, Australia is well positioned to supply LNG to the
growing Asian market and to capture higher regional price differentials in natural gas markets.
The Achilles heel for Australia is its relatively higher construction cost structure.79 Other key
issues are portfolio diversity and more price flexibility by buyers.80
78
Raval, Anjli and Neil Hume. "Oil Markets: A new chapter for OPEC?" The Financial Times 23 November 2014. Web. 23 November 2014 <http://www.ft.com/intl/cms/s/0/64c2485e-70a4-11e4-8113-00144feabdc0.html?siteedition=intl>.
79 Hirjee, John, Hugh Morgan and Andrew Lewandowski. Wood MacKenzie Seminar wrap. Markets Research.
Sydney: Deutsche Bank AG, 2014. 4. Print. 80
Hirjee, 1
65
North America: Canada, Mexico and the U.S.
I believe the Keystone XL Pipeline will be built allowing for Canadian oil to pass through the
U.S., reducing bottlenecks, and alleviating pressures on American transportation infrastructure.
It should also provide ancillary benefits of improved rail shipments of agricultural products
displaced currently by oil shipments, and therefore reducing food price inflationary pressures.
In addition, improved infrastructure should reduce regional oil & gas price differentials due to
lack of said infrastructure, making the market more economically efficient.
In addition to Keystone, Canada is also building pipelines to the West Coast to ship to Asia and
pipelines to the East Coast to ship to the Eastern U.S. markets.
Mexico may be one of the biggest winners in the energy race. With the recent decision to
privatize the state owned oil company, Petróleos Mexicanos (PEMEX), the country is taking the
right steps to exploit significant resources that were mismanaged in its current structure. While
PEMEX may provide some competition as a regional energy supplier, America can gain with
foreign trade with its oilfield service companies helping to develop and produce the assets, as
well as in technology transfers.
As I see it, the North American producers have more of a symbiotic relationship, and if push
comes to shove, may decide to form an “energy-bloc” to combat OPEC’s battles.
66
Russia
Russia receives special attention because of the following factors:
It has hegemonic aspirations, and has expressed it in word and deed
It has significant resources and supplies strategic markets in which to have influence
It has a powerful military, and is not afraid of using it to influence global issues
Its key man (i.e., Putin) has a rare skill set as a former KGB officer that includes global strategic positioning
In my opinion, given its situation, Russia has made the most of it by mitigating some of its risk
of falling demand by signing agreements with China for development of fields in Eastern Russia.
The price may be a bit below market, but China will provide funding to help develop the fields.
Oil & gas is Russia’s crown jewel, and until recently, considered the largest producer in the
world. Even so, as discussed, certain statistics maybe suspect. The cost figures provided
seemed suspiciously low relative to the other regions (See Russia and Caspian Region Capital
Expenditure Metrics Chart). Upon deeper review of the CapEx figures, a few things stand out to
me. When splitting out the regions’ figures between Russian and Kazakh entities versus
Western oil & gas companies that file public returns with regulators, the Western cost results
seem dramatically higher. Given that the geology in the region that the participants operate
most likely is fairly similar, with material differences in other costs associated with the CapEx
unlikely, why is there such a gap? The Western companies (e.g., BP) that show results
considerably below that region’s universe had partnerships with Russian entities. I have a
theory, perhaps it is subsidized or erroneous in order to incentivize Westerners to invest there
to compensate for nationalization risk (e.g., Royal Dutch Shell/Sakhalin Island). Caveat Emptor.
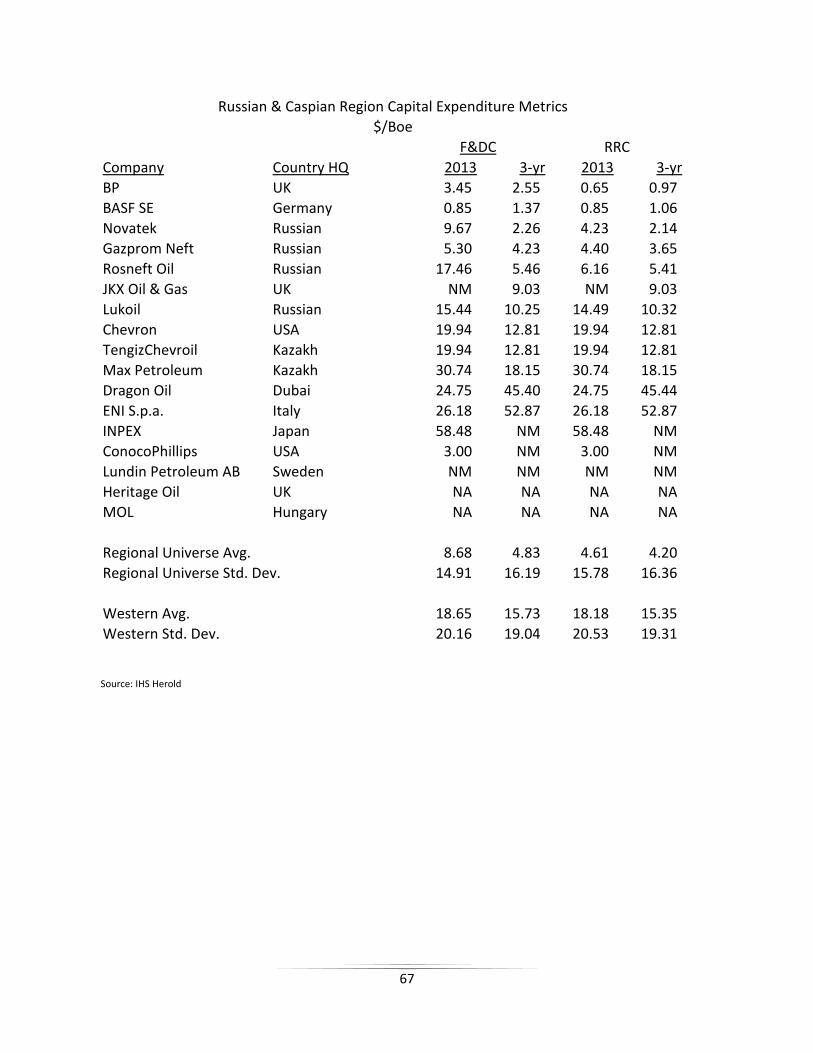
67
Source: IHS Herold
Company Country HQ 2013 3-yr 2013 3-yr
BP UK 3.45 2.55 0.65 0.97
BASF SE Germany 0.85 1.37 0.85 1.06
Novatek Russian 9.67 2.26 4.23 2.14
Gazprom Neft Russian 5.30 4.23 4.40 3.65
Rosneft Oil Russian 17.46 5.46 6.16 5.41
JKX Oil & Gas UK NM 9.03 NM 9.03
Lukoil Russian 15.44 10.25 14.49 10.32
Chevron USA 19.94 12.81 19.94 12.81
TengizChevroil Kazakh 19.94 12.81 19.94 12.81
Max Petroleum Kazakh 30.74 18.15 30.74 18.15
Dragon Oil Dubai 24.75 45.40 24.75 45.44
ENI S.p.a. Italy 26.18 52.87 26.18 52.87
INPEX Japan 58.48 NM 58.48 NM
ConocoPhillips USA 3.00 NM 3.00 NM
Lundin Petroleum AB Sweden NM NM NM NM
Heritage Oil UK NA NA NA NA
MOL Hungary NA NA NA NA
Regional Universe Avg. 8.68 4.83 4.61 4.20
Regional Universe Std. Dev. 14.91 16.19 15.78 16.36
Western Avg. 18.65 15.73 18.18 15.35
Western Std. Dev. 20.16 19.04 20.53 19.31
Russian & Caspian Region Capital Expenditure Metrics
F&DC RRC
$/Boe
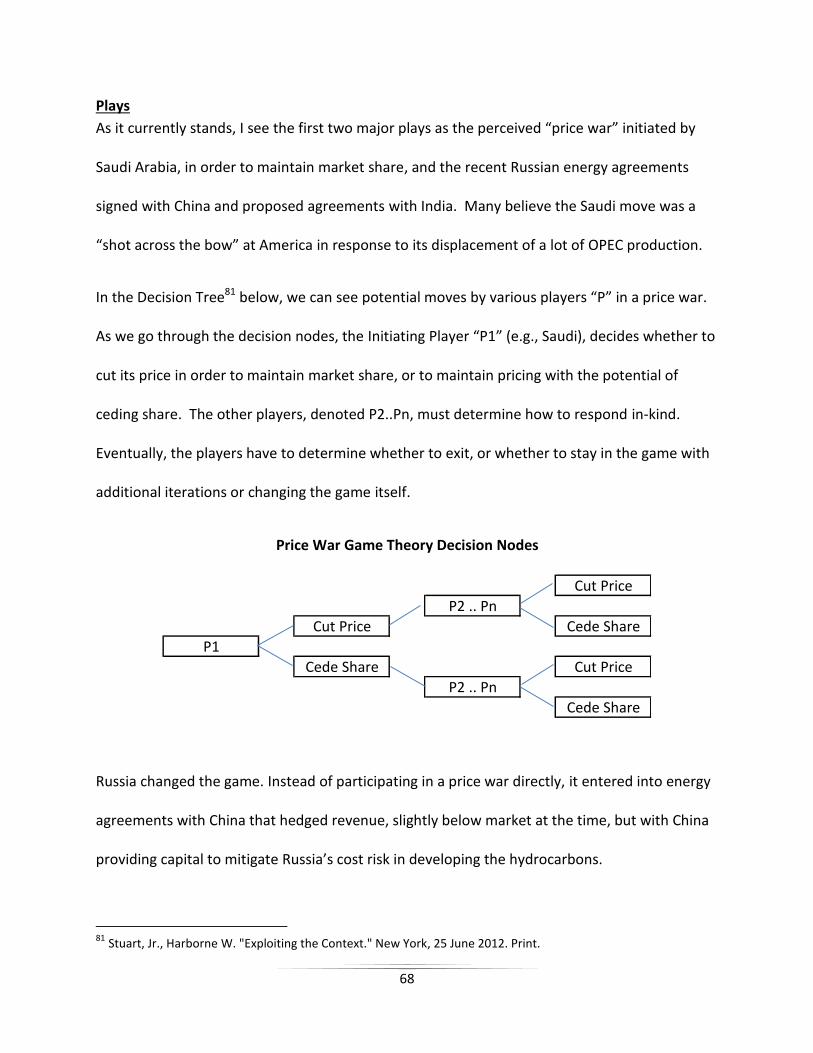
68
Plays
As it currently stands, I see the first two major plays as the perceived “price war” initiated by
Saudi Arabia, in order to maintain market share, and the recent Russian energy agreements
signed with China and proposed agreements with India. Many believe the Saudi move was a
“shot across the bow” at America in response to its displacement of a lot of OPEC production.
In the Decision Tree81 below, we can see potential moves by various players “P” in a price war.
As we go through the decision nodes, the Initiating Player “P1” (e.g., Saudi), decides whether to
cut its price in order to maintain market share, or to maintain pricing with the potential of
ceding share. The other players, denoted P2..Pn, must determine how to respond in-kind.
Eventually, the players have to determine whether to exit, or whether to stay in the game with
additional iterations or changing the game itself.
Russia changed the game. Instead of participating in a price war directly, it entered into energy
agreements with China that hedged revenue, slightly below market at the time, but with China
providing capital to mitigate Russia’s cost risk in developing the hydrocarbons.
81 Stuart, Jr., Harborne W. "Exploiting the Context." New York, 25 June 2012. Print.
Cut Price
P2 .. Pn
Cut Price Cede Share
P1
Cede Share Cut Price
P2 .. Pn
Cede Share
Price War Game Theory Decision Nodes
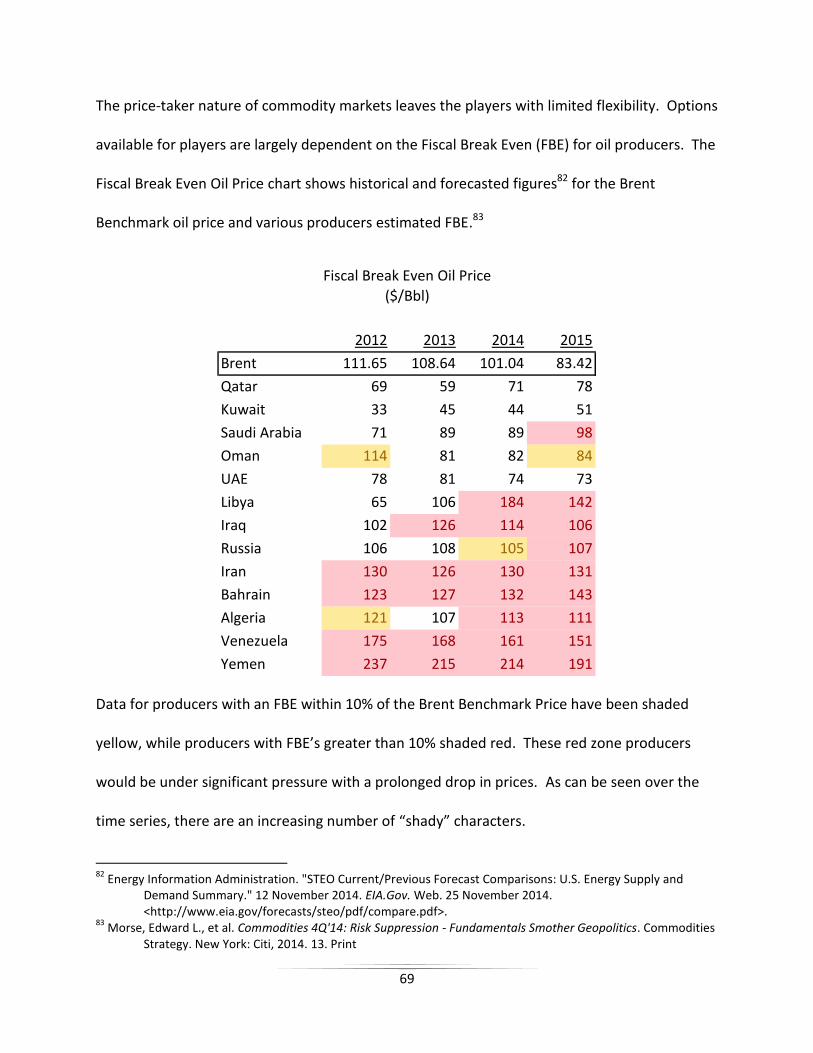
69
The price-taker nature of commodity markets leaves the players with limited flexibility. Options
available for players are largely dependent on the Fiscal Break Even (FBE) for oil producers. The
Fiscal Break Even Oil Price chart shows historical and forecasted figures82 for the Brent
Benchmark oil price and various producers estimated FBE.83
Data for producers with an FBE within 10% of the Brent Benchmark Price have been shaded
yellow, while producers with FBE’s greater than 10% shaded red. These red zone producers
would be under significant pressure with a prolonged drop in prices. As can be seen over the
time series, there are an increasing number of “shady” characters.
82
Energy Information Administration. "STEO Current/Previous Forecast Comparisons: U.S. Energy Supply and Demand Summary." 12 November 2014. EIA.Gov. Web. 25 November 2014. <http://www.eia.gov/forecasts/steo/pdf/compare.pdf>.
83 Morse, Edward L., et al. Commodities 4Q'14: Risk Suppression - Fundamentals Smother Geopolitics. Commodities
Strategy. New York: Citi, 2014. 13. Print
2012 2013 2014 2015
Brent 111.65 108.64 101.04 83.42
Qatar 69 59 71 78
Kuwait 33 45 44 51
Saudi Arabia 71 89 89 98
Oman 114 81 82 84
UAE 78 81 74 73
Libya 65 106 184 142
Iraq 102 126 114 106
Russia 106 108 105 107
Iran 130 126 130 131
Bahrain 123 127 132 143
Algeria 121 107 113 111
Venezuela 175 168 161 151
Yemen 237 215 214 191
Fiscal Break Even Oil Price
($/Bbl)
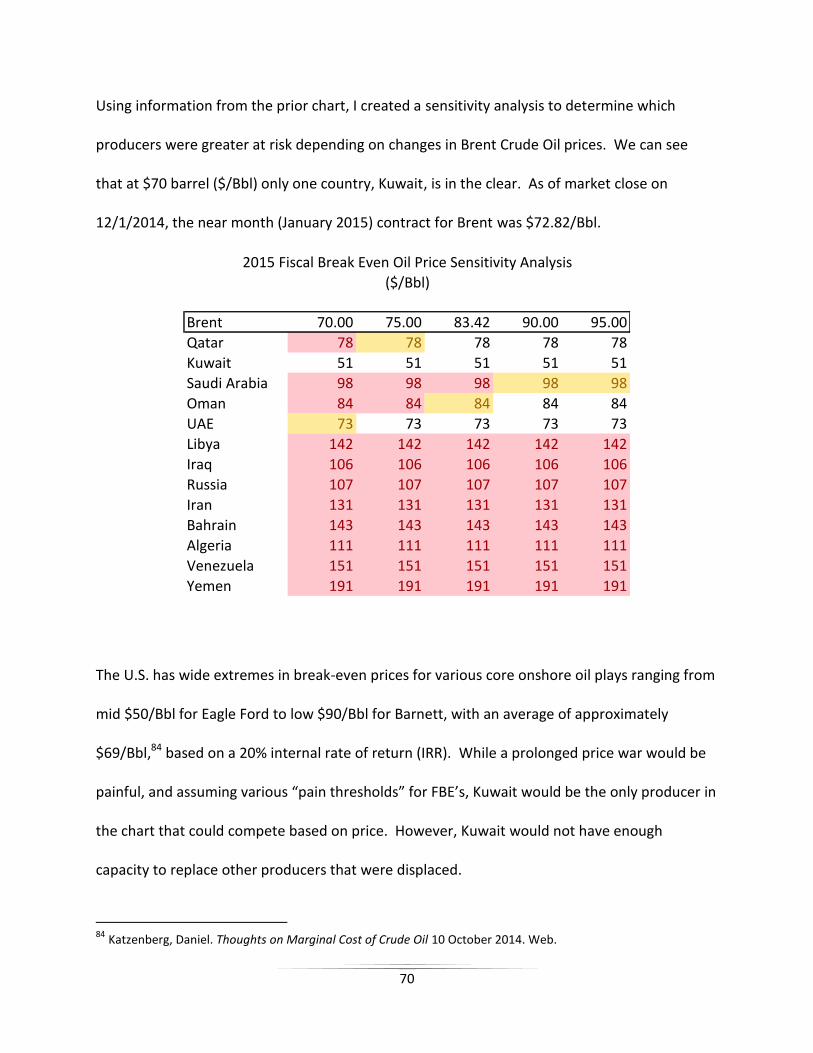
70
Using information from the prior chart, I created a sensitivity analysis to determine which
producers were greater at risk depending on changes in Brent Crude Oil prices. We can see
that at $70 barrel ($/Bbl) only one country, Kuwait, is in the clear. As of market close on
12/1/2014, the near month (January 2015) contract for Brent was $72.82/Bbl.
The U.S. has wide extremes in break-even prices for various core onshore oil plays ranging from
mid $50/Bbl for Eagle Ford to low $90/Bbl for Barnett, with an average of approximately
$69/Bbl,84 based on a 20% internal rate of return (IRR). While a prolonged price war would be
painful, and assuming various “pain thresholds” for FBE’s, Kuwait would be the only producer in
the chart that could compete based on price. However, Kuwait would not have enough
capacity to replace other producers that were displaced.
84 Katzenberg, Daniel. Thoughts on Marginal Cost of Crude Oil 10 October 2014. Web.
Brent 70.00 75.00 83.42 90.00 95.00
Qatar 78 78 78 78 78
Kuwait 51 51 51 51 51
Saudi Arabia 98 98 98 98 98
Oman 84 84 84 84 84
UAE 73 73 73 73 73
Libya 142 142 142 142 142
Iraq 106 106 106 106 106
Russia 107 107 107 107 107
Iran 131 131 131 131 131
Bahrain 143 143 143 143 143
Algeria 111 111 111 111 111
Venezuela 151 151 151 151 151
Yemen 191 191 191 191 191
2015 Fiscal Break Even Oil Price Sensitivity Analysis
($/Bbl)
71
Payoffs
While there may be a prolonged price war, I do not see it lasting more than 12 to 18 months.
Taken to an extreme, improbable but possible, there could be a rise in jingoistic tendencies.
Such an environment may result in the withdrawal of troops to battle ISIS, et al., and
withholding Western labor, operating processes and technology transfers.
Problems facing other countries in a quest to replicate America’s success with fracing are more
than favorable geology. Other issues involve property rights, provider networks and
infrastructure, risk tolerance, and entrepreneurial zeal not usually found in national oil
companies, making it an unfavorable outcome.85 Much of the Middle East is facing significant
Vox Populi Risk (VPR), especially Saudi, with ever increasing demands on health and education
by its youth. Given the long planning horizons for capital investments in natural resources, until
there is a resolution in VPR, many projects may go wanting.86
In a nutshell, the U.S. has more “arrows in its quiver.” The economies for many of the
producers are little more than “one-trick ponies,” not having as broad a portfolio of energy
sources, including renewables, or as diverse of an aggregate economy. It boils down to
rationality, what is their true pain threshold and how long are they willing to hold it? As I see it,
it would be a Pyrrhic victory at best for them.
85 Blackwill, Robert D. and Meghan L. O'Sullivan. "America's Energy Edge: The Geopolitical Consequences of the
Shale Revolution." Foreign Affairs Magazine March/April 2014: 103-104. Print. 86
Fordham, 18
72
In regards to other energy games, I see great opportunity to supply LNG to Asian markets and
to Europe. I agree with Bordoff’s analysis that Russia will continue to supply much of Europe
for quite some time, given its entrenchment and competitive cost structure with U.S. LNG
supply most likely to displace higher-cost providers.87 With that said, now is the time to start
laying the groundwork, through such measures as passing the aforementioned legislative bills,
and to seek partnerships to facilitate construction of European Energy Infrastructure and
providing the European market with greater leverage against Russia.
87 Bordoff, Jason and Trevor Houser. American Gas to the Rescue?: The Impact of US LNG Exports on European
Security and Russian Foreign Policy. New York: Columbia SIPA: Center on Global Energy Policy, 2014. 3. Print. <http://energypolicy.columbia.edu/sites/default/files/energy/CGEP_American%20Gas%20to%20the%20Rescue%3F.pdf>.

73
CONCLUSION
When opportunity knocks on your door, take it, and when such an important asset has other
complementary tools in which to aid it in which to capitalize on the opportunity, they should be
utilized as well. Implementing these tools for their best use has been a major constraint. Thus,
my argument is to remove the encumbrances, and facilitate energy promotion so that reaching
full potential might be possible. I address the ideological mentality of Evangelists that may not
give much credence to a triple bottom line. I recommend significant policy shifts to the
Executive Branch to adopt a more robust and coherent foreign policy by following tried and
true tenets of international relations. The Legislature is encouraged to reduce “wedge issues,”
the distortions through various tax and expenditure policies that shift the price of various assets
from their natural equilibrium and causing a Dead Weight Loss to the economy. Also, Congress
should push through legislation for the development of the energy industry and resulting in
ancillary benefits to the economy in general. I illuminate a misconception by the Fed about
addressing inflation and the ability for the market to self-correct, and provide details about the
underlying economic fundamentals to determine the feasibility of capturing the energy
opportunity. Then, I lay out the implications of all these factors as to how it translates to
America’s fiscal position, to its international trade position, and provide a brief analysis of how
Fed rate policy impacted society, and contributed to the economic downturn. In Game Theory,
I provide some possible outcomes in the goal to be a major energy producer that is a requisite
on attaining Hegemon status.
74
In writing a paper, there is the argument between taking a broad-based generalist versus very
narrow specialist approach. As part of the title, I used the adjective “Big.” The reason for this
is I wanted to address issues that have significant impact, whereas many thesis projects work
on items focused on the margin. I strived to strike a balance between providing enough
granularity in the detail without being esoteric, yet broad enough in scope that it held interest
with enough detail to provide substantive support.
When making an assessment, it is important to be dispassionate and objective letting the data
guide the process. However, after an assessment is made, passion is a catalyst in bringing the
issue to the forefront and pressing it to reach its full potential. I am passionate, some might say
an Evangelist … for American Energy.
75
BIBLIOGRAPHY
Anderson, Karie, Steve Avary and S. Gabe Leonard. "Macroeconomics: Assignment #3."
Consideration of Rising Energy Prices by the FOMC. Chicago, 25 February 2005. Print.
Avary, Steven L. "Central Limit Theorem: A Treatise on International Relations Reconcilement."
14 April 2014. 12-14. Print.
<https://www.linkedin.com/profile/view?id=2506829&trk=nav_responsive_tab_profile
>.
—. "Wind Power: Evaluating Cost Economics." 2014. Print.
<https://www.linkedin.com/profile/view?id=2506829&trk=nav_responsive_tab_profile
>.
Backus, Ph.D., David. The Global Economy. New York: New York University Center for Global
Economy and Business, 2013. Print.
Baker Hughes International. International Rig Count. October 2014. Web. 21 November 2014.
<http://phx.corporate-ir.net/phoenix.zhtml?c=79687&p=irol-rigcountsintl>.
Barchfield, Jenny. Brazil's Rousseff Names Banker as Finance Minister. ABC News. 27 November
2014. Web. 30 November 2014.
<http://abcnews.go.com/International/wireStory/brazils-rousseff-names-banker-
finance-minister-27221317>.
Barro, Robert and Charles Redlick. "Macroeconomic Effects from Government Purchases and
Taxes." National Bureau of Economic Research Working Paper 15369 (2009). Web. 29
November 2014. <http://www.nber.org/papers/w15369.pdf>.
Berthelsen, Christian and Lynn Cook. "U.S. Ruling Loosens Four-Decade Ban On Oil Exports:
Shipments of Unrefined American Oil Could Begin as Early as August." The Wall Street
Journal 14 June 2014. Web. 27 November 2014. <http://online.wsj.com/articles/u-s-
ruling-would-allow-first-shipments-of-unrefined-oil-overseas-1403644494>.
Blackwill, Robert D. and Meghan L. O'Sullivan. "America's Energy Edge: The Geopolitical
Consequences of the Shale Revolution." Foreign Affairs Magazine March/April 2014:
103-105. Print.
76
Bordoff, Jason and Trevor Houser. American Gas to the Rescue?: The Impact of US LNG Exports
on European Security and Russian Foreign Policy. New York: Columbia SIPA: Center on
Global Energy Policy, 2014. Print.
<http://energypolicy.columbia.edu/sites/default/files/energy/CGEP_American%20Gas%
20to%20the%20Rescue%3F.pdf>.
Bremmer, Ian. Every Nation for Itself: Winners and Losers in a G-Zero World. New York: Penguin
Group, 2012. Print.
Burnett, III, James H. boston.com. 10 June 2012. Web. 2013.
<http://www.boston.com/ae/movies/articles/2012/06/10/spin_a_good_yarn/>.
Cacchione, CFA, Nicholas D. and Daniel T. Pratt, CFA. Global Upstream Performance Review.
Norwalk, CT: IHS Herold, 2014. Print. October 2014.
Cappielo, Dina. Guilty plea in bird deaths at wind farms a first. 23 November 2013. Web. 2013.
<http://www.myfoxny.com/story/24050658/guilty-plea-in-bird-deaths-at-wind-farms-a-
first>.
Clayton, Blake. "The Case for Allowing U.S. Crude Oil Exports: Policy Innovation Memorandum
No. 34." The Council on Foreign Relations (2013). Web. 15 November 2014.
<http://www.cfr.org/oil/case-allowing-us-crude-oil-exports/p31005>.
Courtney. Cape Cod's Offshore Wind Farm: Yay [sic] or Nay? 29 April 2010. Web. 2013.
<http://thegreenists.com/energy-saver/cape-cods-offshore-wind-farm-yay-or-
nay/5699>.
Cuomo, CPA, Jason and Mark Lamonte. Is the End of LIFO Near? New York, NY: Moody's
Investors Service, 2010. Print.
Ebinger, Charles and Heather L. Greenley. Changing Markets: Economic Opportunities from
Lifting the U.S. Ban on Crude Oil Exports. Washington D.C.: Brookings Institute: Energy
Security Initiative, 2014. Print. 25 September 2014.
<http://www.brookings.edu/~/media/research/files/reports/2014/09/09%208%20facts
%20about%20crude%20oil%20production/crude%20oil%20exports%20web.pdf>.
Energy Independence and Security Act of 2007. No. Pub. L. 110-140. 121 Stat. 1492. 110th.
Washington, D.C.: 19 December 2007. Document. 25 November 2014.
<http://www.gpo.gov/fdsys/pkg/PLAW-110publ140/html/PLAW-110publ140.htm>.

77
Energy Information Administration. "STEO Current/Previous Forecast Comparisons: U.S. Energy
Supply and Demand Summary." 12 November 2014. EIA.Gov. Web. 25 November 2014.
<http://www.eia.gov/forecasts/steo/pdf/compare.pdf>.
Energy Policy Act of 2005. No. Pub. L. 109-58. 119 Stat. 594. 109th. Washington, D.C.: 8 August
2005. Document. 25 November 2014. <http://www.gpo.gov/fdsys/pkg/PLAW-
109publ58/pdf/PLAW-109publ58.pdf>.
Energy Policy and Conservation Act of 1975. No. Pub. L. 94-163. 94th. Washington, D.C.: 22
December 1975. Document.
Federal Reserve Bank of St. Louis. Federal Reserve Economic Data (FRED). St. Louis, n.d.
Database. 10 October 2014. <http://research.stlouisfed.org/fred2/>.
Fordham, Tina M., et al. Taking it to the streets: What the New Vox Populi Risk Means for
Politics, the Economy and Markets. New York: Citi GPS: Global Perspectives & Solutions,
2014. Print.
<https://ir.citi.com/MLFFG3mEHO39FBGJhaYs8f02RBUr5gk4DwtUNhgcMXG%2Bi%2FGK
PG8GW8VegMsWPk40v5U3DEmh%2Bjo%3D>.
Fox News. Russia has never flown bomber patrols over Gulf of Mexico before, US official claims.
13 November 2014. Web. 30 November 2014.
<http://www.foxnews.com/world/2014/11/13/russian-defense-ministry-says-bomber-
patrols-will-reach-gulf-mexico/>.
Friedman, Milton. "The Counter-Revolution in Monetary Theory." IEA Occasional Paper 33
(1970): 11. Print.
<http://0055d26.netsolhost.com/friedman/pdfs/other_academia/IEA.1970.pdf>.
Goldstein, Joshua S. International Relations. New York: Pearson-Longman, 2005. Print.
Hirjee, John, Hugh Morgan and Andrew Lewandowski. Wood MacKenzie Seminar wrap. Markets
Research. Sydney: Deutsche Bank AG, 2014. Print.
Horan, CFA, CIPM, Stephen M. and Thomas R. Robinson, CFA. Behavioral Finance, Individual
Investors, and Institutional Investors: CFA Program Curriculum, 2015, Level III. Vol. 2.
Charlottesville: Wiley, 2015. Print.
Irvine, Chris. "Wind farms could pose danger to planes without new air traffic control radar."
The Telegraph 25 May 2009. Web.
<http://www.telegraph.co.uk/travel/travelnews/5383658/Wind-farms-could-pose-
danger-to-planes-without-new-air-traffic-control-radar-system.html>.
78
Joint Committee on Taxation. Estimated Budget Effects of the Revenue Provisions Contained in
The President's Fiscal Year 2014 Budget Proposal: Fiscal Years 2013-2014. Washington,
D.C.: Congress of the United States, 2013. Web.
<https://www.jct.gov/publications.html?func=startdown&id=4520>.
Joskow, Paul L. "Comparing the Cost of Intermittent and Dispatchable Electricity Generating
Technologies." American Economic Review: Papers & Proceedings 101.3 (2011): 239.
Print. <https://www.aeaweb.org/articles.php?doi=10.1257/aer.101.3.238>.
Katzenberg, Daniel. Thoughts on Marginal Cost of Crude Oil 10 October 2014. Web.
Keohane, Robert O. and Joseph S. Nye, Jr. Power and Interdependence. Boston: Pearson-
Longman, February 20, 2011. Print.
Keystone XL Pipeline. No. H.R. 5682. 113th. Washington, D.C.: 14 November 2014. Document.
<https://www.govtrack.us/congress/bills/113/hr5682/text>.
La Jeunesse, William. World's largest solar plant applying for federal grant to pay off federal
loan. New York, 8 November 2014. Web. 29 November 2014.
<http://www.foxnews.com/politics/2014/11/08/world-largest-solar-plant-applying-for-
federal-grant-to-pay-off-its-federal/>.
Lazard. Lazard's Levelized Cost of Energy Analysis - Version 8.0. New York City: Lazard,
September 2014. Print. 20 September 2014.
<http://www.lazard.com/PDF/Levelized%20Cost%20of%20Energy%20-
%20Version%208.0.pdf>.
Leone, Marie. "Sucking the LIFO Out of Inventory: The government sees billions of dollars in
potential tax revenues sitting on the shelves of company warehouses." CFO Magazine
15 July 2010. Web. <http://ww2.cfo.com/accounting-tax/2010/07/sucking-the-lifo-out-
of-inventory/>.
Lieberman, Ben. "What Americans Need to Know About the Copenhagen Global Warming
Conference." Special Report #71 on Climate Change. 2009. Web. 28 November 2014.
<http://www.heritage.org/research/reports/2009/11/what-americans-need-to-know-
about-the-copenhagen-global-warming-conference>.
Loris, Nicholas D. The Ethanol Mandate: Don't Mend It, End It. Washington, D.C.: The Heritage
Foundation Backgrounder No. 2811, June 12, 2013. Web.
<http://report.heritage.org/bg2811>.
79
Mearsheimer, John J. The Tragedy of Great Power Politics. New York: W.W. Norton & Co., 2001.
Print.
Messina, F. Joseph and Steven L. Avary. Chesapeake Energy Corporation. Securities Research.
Minneapolis: Dain Rauscher Wessels, 2000. Print.
<https://www.linkedin.com/profile/view?id=2506829&trk=nav_responsive_tab_profile
>.
Morse, Edward L., et al. Commodities 4Q'14: Risk Suppression - Fundamentals Smother
Geopolitics. Commodities Strategy. New York: Citi, 2014. Print.
North American Energy Infrastructure Act. No. S. 2823. 113th, 2nd Session. Washington, D.C.:
16 September 2014. Document.
<https://www.govtrack.us/congress/bills/113/s2823/text>.
North American Energy Infrastructure Act. No. H.R. 3301. 113th, 2nd Session. Washington, D.C.:
25 June 2014. Document. <https://www.govtrack.us/congress/bills/113/hr3301>.
North Atlantic Energy Security Act. No. S. 2592. 113th, 2nd Session. 10 July 2014. Document.
<https://www.govtrack.us/congress/bills/113/s2592/text>.
Raval, Anjli and Neil Hume. "Oil Markets: A new chapter for OPEC?" The Financial Times 23
November 2014. Print. <http://www.ft.com/intl/cms/s/0/64c2485e-70a4-11e4-8113-
00144feabdc0.html?siteedition=intl>.
Sankey, Paul, et al. Global Oil: Oh Saudi where art Thou? New York, NY: Wolfe Research, 2014.
Print.
Seelye, Katherine Q. "Koch Brother Wages 12-Year Fight Over Wind Farm." New York Times 22
October 2013: A12. Web. <http://www.nytimes.com/2013/10/23/us/koch-brother-
wages-12-year-fight-over-wind-farm.html?pagewanted=all&_r=0>.
Stephens, Bret. "Obama Survival Manual, Intl. Edition: If you think 2014 has been a year of
unraveling and disorder, just wait." The Wall Street Journal 13 October 2014. Print.
<http://online.wsj.com/articles/bret-stephens-obama-survival-manual-intl-edition-
1413242790>.
Stuart, Jr., Harborne W. "Exploiting the Context." New York, 25 June 2012. Print.
The Committee for a Responsible Federal Budget. The Tax Break-Down: LIFO Accounting.
Washington, D.C., 22 August 2013. Document. <http://crfb.org/blogs/tax-break-down-
lifo-accounting>.
80
The Federal Reserve Board. "Minutes of the Federal Open Market Committee: August 10,
2004." 10 August 2004. Web. 14 November 2014.
<http://www.federalreserve.gov/fomc/minutes/20040810.htm>.
—. "Minutes of the Federal Open Market Committee: August 9, 2005." 9 August 2005. Web. 14
November 2014. <http://www.federalreserve.gov/fomc/minutes/20050809.htm>.
—. "Minutes of the Federal Open Market Committee: December 13, 2005." 13 December 2005.
Web. 14 November 2014.
<http://www.federalreserve.gov/fomc/minutes/20051213.htm>.
—. "Minutes of the Federal Open Market Committee: June 30, 2005." 30 June 2005. Web. 14
November 2014. <http://www.federalreserve.gov/fomc/minutes/20050630.htm>.
—. "Minutes of the Federal Open Market Committee: May 3, 2005." 3 May 2005. Web. 2014 14
November. <http://www.federalreserve.gov/fomc/minutes/20050503.htm>.
—. "Minutes of the Federal Open Market Committee: September 20, 2005." 20 September
2005. Web. 14 November 2014.
<http://www.federalreserve.gov/fomc/minutes/20050920.htm>.
U.S. Energy Information Administration. "How much carbon dioxide is produced when different
fuels are burned?" 14 June 2014. U.S. Energy Information Administration. Web. 20
November 2014. <http://www.eia.gov/tools/faqs/faq.cfm?id=73&t=11>.
Walker, D.A. "Biofuels - for better or worse?" Annals of Applied Biology (2010): 320, 323. Print.
10 November 2014.
World Bank. Doing Business Index. 2014. Web. 2014.
<http://www.doingbusiness.org/rankings>.
World Economic Forum. Global Competitiveness Report 2014-2015. 2014. Database. 29
November 2014. <http://reports.weforum.org/global-competitiveness-report-2014-
2015/economies/#economy=USA>.
Worldwide-tax. 1 June 2014. Database. 8 November 2014. <http://www.worldwide-tax.com/>.

81
ACKNOWLEDGMENTS
In normal times, taking on the subject matter incorporated into this thesis would be a
significant undertaking. These are not normal times. Given the dramatic changes in many of
the variables, much of the information I gathered over the last year or so became obsolete.
These paradigm shifts resulted in a constant reassessment of the thrust of the thesis. As such, I
reached out to others and sought their direction for gathering additional data, challenging
assumptions and guidance on the paper. It is to them I owe special thanks for their help, which
was instrumental in restraining me from assuming the fetal position. The correlation of the
success of this paper and their contributions is 1.
Special thanks to the following: David Backus, Ph.D. (NYU), Nick Cacchione, CFA (IHS Herold),
Jason Cuomo, CPA (Moody’s Investors Service), Liam Denning (The Wall Street Journal), Chris
Gadomsky (NYU), Heather Greenley (Brookings Institute), Kathryn Harmon (Lazard), John Hirjee
(Deutsche Bank), Daniel Katzenberg (RW Baird), Carolyn Kissane, Ph.D. (NYU), Rick Levitt (NYU),
Brian Lidsky (PLS Inc.), Jonathan McClelland (NYU) and Paul Sankey (Wolfe Research)