Embed Size (px)
Citation preview
F i n a l D r a f t
2015 Urban Water Management Plan—Simi Valley
Corporate Office
630 E. Foothill Blvd. San Dimas, CA 91773
June 2016
10850 Gold Center Drive, Suite 350
Rancho Cordova, CA 95670

Final Draft, 2015 Urban Water Management Plan – Simi Valley i Golden State Water Company \\sac2\job\2015\1570027.00_gswc-2015 uwmp\09-reports\simi valley\09-reports\9.09-reports\3_final draft\simi valley_2015_uwmp-final draft.docx
Table of Contents
Notice of Adoption ....................................................................................................................... vii
Abbreviations ............................................................................................................................... ix
Definitions ................................................................................................................................... xiii
Chapter 1: Introduction ............................................................................... 1-1
1.1 Background and Purpose .................................................................... 1-1 1.2 Urban Water Management Planning and the California Water
Code .................................................................................................... 1-3 1.2.1 Urban Water Management Planning Act of 1983 ..................... 1-3 1.2.2 Applicable Changes to the Water Code since 2010
UWMPs ................................................................................... 1-3 1.2.3 Water Conservation Act of 2009 (SBX7-7) (Appendix B) ......... 1-3
1.3 Urban Water Management Plans in Relation to Other Planning Efforts .................................................................................................. 1-4
1.4 UWMP Organization............................................................................ 1-4 1.5 UWMPs and Grant or Loan Eligibility .................................................. 1-5
Chapter 2: Plan Preparation ........................................................................ 2-1
2.1 Basis for Preparing a Plan ................................................................... 2-1 2.1.1 Public Water Systems .............................................................. 2-2
2.2 Regional Planning ............................................................................... 2-2 2.3 Individual or Regional Planning and Compliance ................................ 2-3 2.4 Fiscal or Calendar Year and Units of Measure ................................... 2-3 2.5 Coordination and Outreach ................................................................. 2-4
2.5.1 Wholesale and Retail Coordination .......................................... 2-4 2.5.2 Coordination with Other Agencies and the Community ........... 2-5 2.5.3 Notice to Cities and Counties ................................................... 2-6
Chapter 3: System Description ................................................................... 3-1
3.1 General Description............................................................................. 3-1 3.2 Service Area Climate........................................................................... 3-1 3.3 Service Area Population and Demographics ....................................... 3-3
3.3.3 Other Demographic Factors ..................................................... 3-5
Chapter 4: System Water Use ..................................................................... 4-1
4.1 Recycled versus Potable and Raw Water Demand ............................ 4-1 4.1.1 Water Use Projections ............................................................. 4-3
4.2 Distribution System Water Losses ...................................................... 4-6 4.3 Estimating Future Water Savings ........................................................ 4-7 4.4 Water Use for Lower Income Households ........................................... 4-7
Table of Contents (cont’d)
ii Final Draft, 2015 Urban Water Management Plan – Simi Valley Golden State Water Company
\\sac2\job\2015\1570027.00_gswc-2015 uwmp\09-reports\simi valley\09-reports\9.09-reports\3_final draft\simi valley_2015_uwmp-final draft.docx
Chapter 5: SBX7-7 Baselines and Targets .................................................. 5-1
5.1 Guidance for Wholesale Agencies ...................................................... 5-1 5.2 Updating Calculations from 2010 UWMP............................................ 5-1 5.3 Baseline Periods ................................................................................. 5-2 5.4 Service Area Population ..................................................................... 5-2 5.5 Gross Water Use ................................................................................ 5-3 5.6 Baseline Daily per Capita Water Use .................................................. 5-4 5.7 2015 and 2020 Targets ....................................................................... 5-4
5.7.1 5-Year Baseline – 2020 Target Confirmation ........................... 5-5 5.7.2 Baselines and Targets Summary ............................................. 5-6
5.8 2015 Compliance Daily per Capita Water Use (GPCD) ...................... 5-7 5.8.1 Meeting the 2015 Target .......................................................... 5-8
Chapter 6: System Supplies ........................................................................ 6-1
6.1 Purchased or Imported Water ............................................................. 6-1 6.2 Groundwater ....................................................................................... 6-2
6.2.1 Basin Description ..................................................................... 6-2 6.2.2 Groundwater Management ...................................................... 6-4 6.2.3 Overdraft Conditions ................................................................ 6-5 6.2.4 Historical Groundwater Pumping ............................................. 6-5
6.3 Surface Water ..................................................................................... 6-6 6.4 Stormwater .......................................................................................... 6-6 6.5 Wastewater and Recycled Water ........................................................ 6-7
6.5.1 Recycled Water Coordination .................................................. 6-7 6.5.2 Wastewater Collection, Treatment, and Disposal .................... 6-7 6.5.3 Recycled Water System........................................................... 6-8 6.5.4 Potential Recycled Water Beneficial Uses ............................... 6-9 6.5.5 Actions to Encourage and Optimize Future Recycled
Water Use ............................................................................. 6-10 6.6 Desalinated Water Opportunities ...................................................... 6-10 6.7 Exchanges or Transfers .................................................................... 6-12
6.7.1 Emergency Interties ............................................................... 6-12 6.8 Future Water Projects ....................................................................... 6-12 6.9 Summary of Existing and Planned Sources of Water ....................... 6-13
Chapter 7: Water Supply Reliability Assessment ....................................... 7-1
7.1 Constraints on Water Sources ............................................................ 7-1 7.2 Reliability by Type of Year .................................................................. 7-1 7.3 Supply and Demand Assessment ....................................................... 7-2
7.3.1 Normal Water Year Analysis .................................................... 7-3 7.3.2 Single-Dry-Year Analysis ......................................................... 7-3 7.3.3 Multiple-Dry-Year Analysis....................................................... 7-3
7.4 Regional Supply Reliability ................................................................. 7-4
Table of Contents (cont’d)
Final Draft, 2015 Urban Water Management Plan – Simi Valley iii Golden State Water Company \\sac2\job\2015\1570027.00_gswc-2015 uwmp\09-reports\simi valley\09-reports\9.09-reports\3_final draft\simi valley_2015_uwmp-final draft.docx
Chapter 8: Water Shortage Contingency Planning ..................................... 8-1
8.1 Stages of Action .................................................................................. 8-1 8.2 Prohibitions on End Uses .................................................................... 8-5
8.2.1 Landscape Irrigation ................................................................. 8-6 8.2.2 Commercial, Industrial, and Institutional (CII) .......................... 8-6 8.2.3 Water Features and Swimming Pools ...................................... 8-6 8.2.4 Defining Water Features .......................................................... 8-6 8.2.5 Other ........................................................................................ 8-7
8.3 Penalties, Charges, Other Enforcement of Prohibitions ...................... 8-7 8.4 Consumption Reduction Methods ....................................................... 8-7
8.4.1 Categories of Consumption Reduction Methods ...................... 8-8 8.5 Determining Water Shortage Reductions ............................................ 8-9 8.6 Revenue and Expenditure Impacts ..................................................... 8-9
8.6.1 Drought Rate Structures and Surcharges .............................. 8-10 8.6.2 Use of Financial Reserves ..................................................... 8-11 8.6.3 Other Measures ..................................................................... 8-11
8.7 Resolution or Ordinance.................................................................... 8-11 8.8 Catastrophic Supply Interruption ....................................................... 8-11 8.9 Minimum Supply Next Three Years ................................................... 8-13
Chapter 9: Demand Management Measures ............................................... 9-1
9.1 Demand Management Measures for Retail Agencies ......................... 9-1 9.1.1 Water Waste Prevention Ordinances ....................................... 9-1 9.1.2 Metering ................................................................................... 9-2 9.1.3 Conservation Pricing ................................................................ 9-3 9.1.4 Public Education and Outreach ................................................ 9-3
Public Information Programs ................................................... 9-3 School Education Programs .................................................... 9-3
9.1.5 Programs to Assess and Manage Distribution System Real Loss ................................................................................. 9-4
9.1.6 Water Conservation Program Coordination and Staffing Support .................................................................................... 9-5
9.1.7 Other Demand Management Measures ................................... 9-5 9.1.7.1 Residential Assistance Programs .......................... 9-5 9.1.7.2 Landscape Water Surveys ..................................... 9-5 9.1.7.3 High-Efficiency Clothes Washers ........................... 9-5 9.1.7.4 WaterSense Specification (WSS) Toilets ............... 9-6 9.1.7.5 WaterSense Specification for Residential
Development .......................................................... 9-6 9.1.7.6 Commercial, Industrial, and Institutional
DMMs .................................................................... 9-6 9.1.7.7 Large Landscape ................................................... 9-6 9.1.7.8 Financial Incentives ............................................... 9-7 9.1.7.9 Building Code/New Standards ............................... 9-7 9.1.7.10 Information/Tracking .............................................. 9-7
Table of Contents (cont’d)
iv Final Draft, 2015 Urban Water Management Plan – Simi Valley Golden State Water Company
\\sac2\job\2015\1570027.00_gswc-2015 uwmp\09-reports\simi valley\09-reports\9.09-reports\3_final draft\simi valley_2015_uwmp-final draft.docx
9.2 Implementation over the Past Five Years ........................................... 9-8 9.3 Planned Implementation to Achieve Water Use Targets .................... 9-9 9.4 Members of the California Urban Water Conservation Council ........ 9-12
Chapter 10: Plan Adoption, Submittal, and Implementation ..................... 10-1
10.1 Inclusion of All 2015 Data ................................................................. 10-1 10.2 Notice of Public Hearing ................................................................... 10-1
10.2.1 Notice to Cities and Counties ................................................. 10-1 10.2.2 Notice to the Public ................................................................ 10-2
10.3 Public Hearing and Adoption ............................................................ 10-3 10.3.1 Adoption ................................................................................. 10-3
10.4 Plan Submittal ................................................................................... 10-4 10.4.1 Submitting a UWMP to DWR ................................................. 10-4 10.4.2 Electronic Data Submittal....................................................... 10-4 10.4.3 Submitting a UWMP to the California State Library ............... 10-4 10.4.4 Submitting a UWMP to Cities and Counties .......................... 10-4
10.5 Public Availability .............................................................................. 10-5 10.6 Amending an Adopted UWMP .......................................................... 10-5 10.7 Implementation ................................................................................. 10-5
References .................................................................................................................................... i
List of Tables
Table 2-1: Public Water Systems .............................................................................................. 2-2 Table 2-2: Plan Identification .................................................................................................... 2-3 Table 2-3: Agency Identification................................................................................................ 2-4 Table 2-4: Water Supplier Information Exchange ..................................................................... 2-5 Table 2-5: Coordination with Agencies ..................................................................................... 2-6 Table 3-1: Population – Current and Projected ......................................................................... 3-4 Table 4-1: Demands for Potable and Raw Water - Actual ........................................................ 4-2 Table 4-2: Demands for Potable and Raw Water - Projected ................................................... 4-5 Table 4-3: Total Water Demands .............................................................................................. 4-5 Table 4-4: 12 Month Water Loss Audit Reporting ..................................................................... 4-6 Table 4-5: Inclusion in Water Use Projections .......................................................................... 4-7 Table 4-6: Low-Income Projected Water Demands .................................................................. 4-8 Table 5-1: Gallons Per Capita Per Day (GPCD) ....................................................................... 5-6 Table 5-2: Baselines and Targets Summary ............................................................................. 5-7 Table 5-3: 2015 Compliance ..................................................................................................... 5-8 Table 6-0: Well Name and Capacity, and Water Quality Assessment ...................................... 6-5 Table 6-1: Groundwater Volume Pumped ................................................................................ 6-6 Table 6-2: Wastewater Collected Within Service Area in 2015 ................................................ 6-8 Table 6-3: Wastewater Treatment and Discharge Within Service Area in 2015 ....................... 6-8
Table of Contents (cont’d)
Final Draft, 2015 Urban Water Management Plan – Simi Valley v Golden State Water Company \\sac2\job\2015\1570027.00_gswc-2015 uwmp\09-reports\simi valley\09-reports\9.09-reports\3_final draft\simi valley_2015_uwmp-final draft.docx
Table 6-4: Current and Projected Retailers Provided Recycled Water Within Service Area ......................................................................................................................... 6-9
Table 6-5: 2010 UWMP Recycled Water Use Projection Compared to 2015 Actual ................ 6-9 Table 6-6: Methods to Expand Future Recycled Water Use ................................................... 6-10 Table 6-7: Expected Future Water Supply Projects or Programs ........................................... 6-12 Table 6-8: Water Supplies — Actual ....................................................................................... 6-14 Table 6-9: Water Supplies — Projected .................................................................................. 6-14 Table 7-1: Bases of Water Year Data ....................................................................................... 7-2 Table 7-2: Normal Year Supply and Demand Comparison ....................................................... 7-3 Table 7-3: Single Dry Year Supply and Demand Comparison .................................................. 7-3 Table 7-4: Multiple Dry Years Supply and Demand Comparison .............................................. 7-4 Table 8-1: Stages of WSCP ...................................................................................................... 8-2 Table 8-2: Restrictions and Prohibitions on End Uses .............................................................. 8-5 Table 8-3: Summary of Penalties and Charges for Excessive Use .......................................... 8-7 Table 8-4: Summary of Consumption Reduction Methods ....................................................... 8-8 Table 8-5: Stages of WSCP - Consumption Reduction Methods .............................................. 8-8 Table 8-6: Water-Use Monitoring Mechanisms ......................................................................... 8-9 Table 8-7: Summary of Actions and Conditions that Impact Revenue .................................... 8-10 Table 8-8: Summary of Actions and Conditions that Impact Expenditures ............................. 8-10 Table 8-9: Proposed Measures to Overcome Revenue Impacts ............................................ 8-10 Table 8-10: Proposed Measures to Overcome Expenditure Impacts ..................................... 8-10 Table 8-11: Summary of Actions for Catastrophic Events ...................................................... 8-12 Table 8-12: Minimum Supply Next Three Years ...................................................................... 8-13 Table 9-1: DMM Program Budget – Actual Expenditures Summary Table (2011-2015) .......... 9-8 Table 9-2: DMM Narrative Summary Table (2011-2015) .......................................................... 9-9 Table 9-3: DMM Program Water Savings Summary Table (2011-2015) .................................. 9-9 Table 9-4: DMM Program Budget – Projected Expenditures Summary Table (2016-
2020) ...................................................................................................................... 9-11 Table 9-5: DMM Narrative Summary Table (2016-2020) ........................................................ 9-11 Table 10-1: Notification to Cities and Counties ....................................................................... 10-2
List of Figures
Figure 1-1: Simi Valley System Location Map ........................................................................... 1-2 Figure 3-1: Simi Valley System Service Area ............................................................................ 3-2 Figure 3-2: Monthly Average Climate Data in Simi Valley System ............................................ 3-3 Figure 4-1: Historic Water Use and Water Use Factors by Category ........................................ 4-3 Figure 4-2: Historical and Projected Connections ...................................................................... 4-4 Figure 6-1: Groundwater Basin Map .......................................................................................... 6-3
Table of Contents (cont’d)
vi Final Draft, 2015 Urban Water Management Plan – Simi Valley Golden State Water Company
\\sac2\job\2015\1570027.00_gswc-2015 uwmp\09-reports\simi valley\09-reports\9.09-reports\3_final draft\simi valley_2015_uwmp-final draft.docx
List of Appendices
Appendix A DWR Guidebook Urban Water Management Plan Checklist Appendix B Documentation of Water Use Projections Submittal Appendix C American Water Works Association Water Audits Appendix D DWR SBX7-7 Verification Tables Appendix E DWR Population Tool Appendix F Select CPUC Water Conservation and Rationing Rules and Regulations Appendix G Public Hearing Notice, Notifications, and Meeting Minutes Appendix H Groundwater Basin Water Rights Stipulation/Judgment [Not Used] Appendix I Documentation of Submittal to Library, Cities and Counties
Final Draft, 2015 Urban Water Management Plan – Simi Valley vii Golden State Water Company \\sac2\job\2015\1570027.00_gswc-2015 uwmp\09-reports\simi valley\09-reports\9.09-reports\3_final draft\simi valley_2015_uwmp-final draft.docx
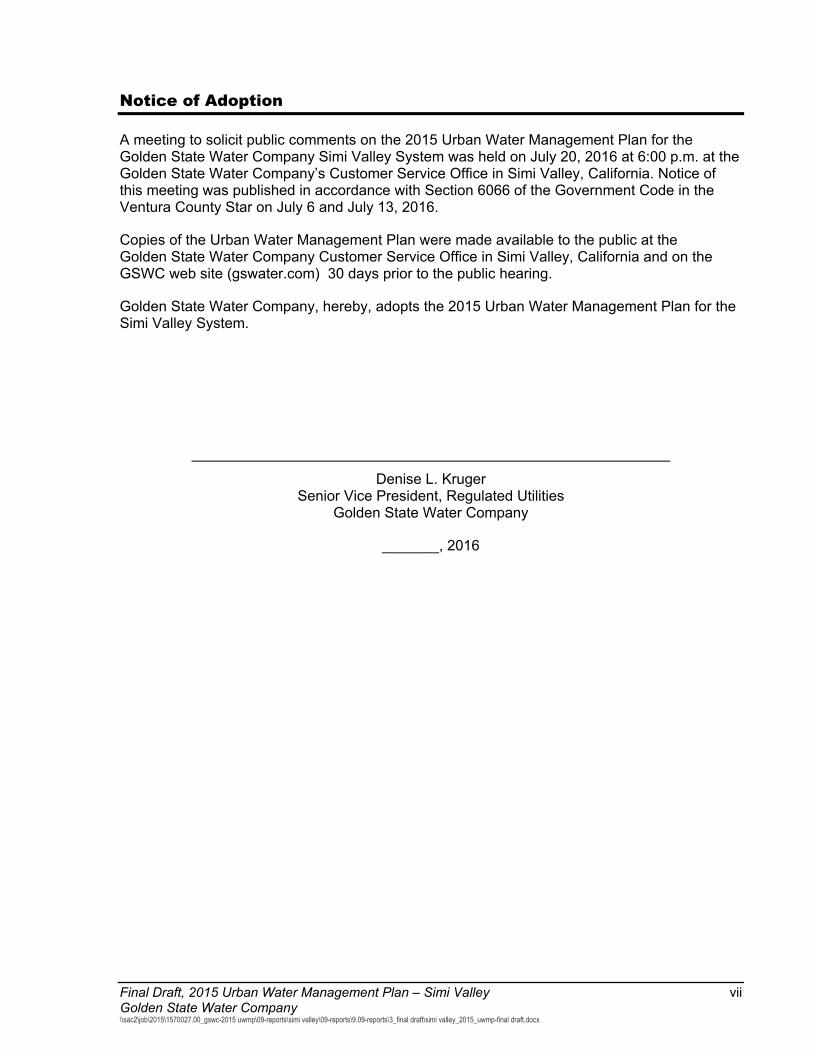
Notice of Adoption
A meeting to solicit public comments on the 2015 Urban Water Management Plan for the Golden State Water Company Simi Valley System was held on July 20, 2016 at 6:00 p.m. at the Golden State Water Company’s Customer Service Office in Simi Valley, California. Notice of this meeting was published in accordance with Section 6066 of the Government Code in the Ventura County Star on July 6 and July 13, 2016.
Copies of the Urban Water Management Plan were made available to the public at the Golden State Water Company Customer Service Office in Simi Valley, California and on the GSWC web site (gswater.com) 30 days prior to the public hearing.
Golden State Water Company, hereby, adopts the 2015 Urban Water Management Plan for the Simi Valley System.
Denise L. Kruger Senior Vice President, Regulated Utilities
Golden State Water Company
_______, 2016

viii Final Draft, 2015 Urban Water Management Plan – Simi Valley Golden State Water Company
\\sac2\job\2015\1570027.00_gswc-2015 uwmp\09-reports\simi valley\09-reports\9.09-reports\3_final draft\simi valley_2015_uwmp-final draft.docx
THIS PAGE INTENTIONALLY BLANK
Final Draft, 2015 Urban Water Management Plan – Simi Valley ix Golden State Water Company \\sac2\job\2015\1570027.00_gswc-2015 uwmp\09-reports\simi valley\09-reports\9.09-reports\3_final draft\simi valley_2015_uwmp-final draft.docx
Abbreviations
AF acre-feet
AFY acre-feet per year
Act Urban Water Management Planning Act
AMR automatic meter reading
AWWA American Water Works Association
BMPs best management practices
Cal EMA California Emergency Management Agency
CAL Green Code 2010 California Green Building Standards Code
ccf hundred cubic feet
CFS cubic feet per second
CII commercial, industrial, and institutional
CIMIS California Irrigation Management Information System
CMWD Calleguas Municipal Water District
COG Council of Governments
Council or CUWCC California Urban Water Conservation Council
CPUC California Public Utilities Commission
CRA Colorado River Aqueduct
DDW Division of Drinking Water, State Water Resources Control Board
DMM Demand Management Measure
DOF Department of Finance
DWF dry weather flow
DWR Department of Water Resources (California)
DWR Guidebook DWR Guidebook for Urban Water Suppliers
ERP emergency response plan
x Final Draft, 2015 Urban Water Management Plan – Simi Valley Golden State Water Company
\\sac2\job\2015\1570027.00_gswc-2015 uwmp\09-reports\simi valley\09-reports\9.09-reports\3_final draft\simi valley_2015_uwmp-final draft.docx
ETo evapotranspiration
GIS Geographic Information System
GPCD gallons per capita day
gpd gallons per day
gpm U.S. gallons per minute
GSWC Golden State Water Company
HCD Housing and Community Development
HECW high efficiency clothes washers
HET high efficiency toilets
ILI infrastructure leakage index
IRP Integrated Resource Plan
IRPSIM Integrated Resources Planning Simulation Model
MAF million acre-feet per year
MCLs maximum contaminant levels
Metropolitan Metropolitan Water District of Southern California
MF multi-family
mgp million gallons per day
mg/L milligrams per liter
MOU memorandum of understanding (regarding urban water conservation in California)
MWD Municipal Water District with reference to any of the member agencies of the Metropolitan Water District of Southern California
N/A not available, not applicable
NAICS North American Industry Classification System
O&M operation and maintenance
PCE tetrachloroethene
RHNA Regional Housing Needs Allocation
Final Draft, 2015 Urban Water Management Plan – Simi Valley xi Golden State Water Company \\sac2\job\2015\1570027.00_gswc-2015 uwmp\09-reports\simi valley\09-reports\9.09-reports\3_final draft\simi valley_2015_uwmp-final draft.docx
RTP Regional Transportation Plan
SBX7-7 Senate Bill X7-7, The Water Conservation Act of 2009
SCAG Southern California Association of Governments
SD Science Discover
SDWA Safe Drinking Water Act
SF single-family
SWP State Water Project
SWRB State Water Resources Board
TAF thousand acre-feet per year
TDS total dissolved solids
TOC total organic carbon
USEPA U.S. Environmental Protection Agency
UWMP Urban Water Management Plan
WAP Water Action Plan
WLCD Water Loss Control Department
WRCC Western Regional Climate Center
WSAP Water Supply Allocation Plan
WSDM Plan Water Surplus and Drought Management Plan
WSS WaterSense Specification
WWTP Wastewater Treatment Plant
WY water year

xii Final Draft, 2015 Urban Water Management Plan – Simi Valley Golden State Water Company
\\sac2\job\2015\1570027.00_gswc-2015 uwmp\09-reports\simi valley\09-reports\9.09-reports\3_final draft\simi valley_2015_uwmp-final draft.docx
THIS PAGE INTENTIONALLY BLANK
Final Draft, 2015 Urban Water Management Plan – Simi Valley xiii Golden State Water Company \\sac2\job\2015\1570027.00_gswc-2015 uwmp\09-reports\simi valley\09-reports\9.09-reports\3_final draft\simi valley_2015_uwmp-final draft.docx
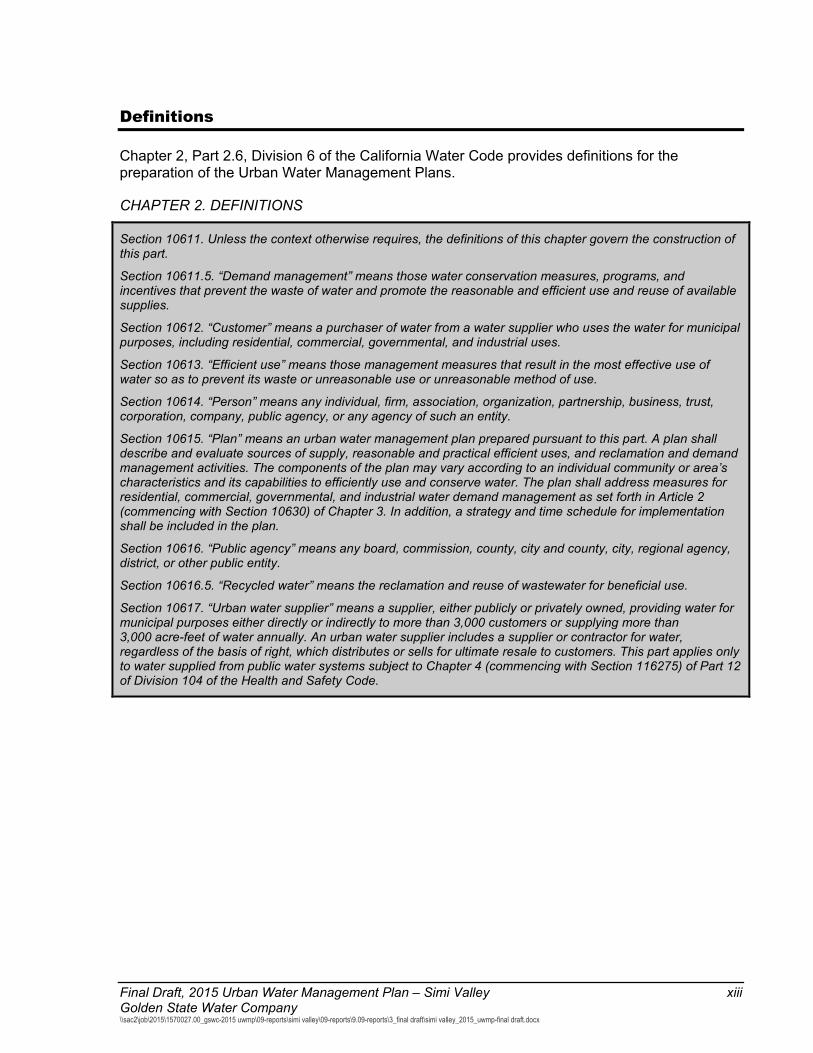
Definitions
Chapter 2, Part 2.6, Division 6 of the California Water Code provides definitions for the preparation of the Urban Water Management Plans.
CHAPTER 2. DEFINITIONS
Section 10611. Unless the context otherwise requires, the definitions of this chapter govern the construction of this part.
Section 10611.5. “Demand management” means those water conservation measures, programs, and incentives that prevent the waste of water and promote the reasonable and efficient use and reuse of available supplies.
Section 10612. “Customer” means a purchaser of water from a water supplier who uses the water for municipal purposes, including residential, commercial, governmental, and industrial uses.
Section 10613. “Efficient use” means those management measures that result in the most effective use of water so as to prevent its waste or unreasonable use or unreasonable method of use.
Section 10614. “Person” means any individual, firm, association, organization, partnership, business, trust, corporation, company, public agency, or any agency of such an entity.
Section 10615. “Plan” means an urban water management plan prepared pursuant to this part. A plan shall describe and evaluate sources of supply, reasonable and practical efficient uses, and reclamation and demand management activities. The components of the plan may vary according to an individual community or area’s characteristics and its capabilities to efficiently use and conserve water. The plan shall address measures for residential, commercial, governmental, and industrial water demand management as set forth in Article 2 (commencing with Section 10630) of Chapter 3. In addition, a strategy and time schedule for implementation shall be included in the plan.
Section 10616. “Public agency” means any board, commission, county, city and county, city, regional agency, district, or other public entity.
Section 10616.5. “Recycled water” means the reclamation and reuse of wastewater for beneficial use.
Section 10617. “Urban water supplier” means a supplier, either publicly or privately owned, providing water for municipal purposes either directly or indirectly to more than 3,000 customers or supplying more than 3,000 acre-feet of water annually. An urban water supplier includes a supplier or contractor for water, regardless of the basis of right, which distributes or sells for ultimate resale to customers. This part applies only to water supplied from public water systems subject to Chapter 4 (commencing with Section 116275) of Part 12 of Division 104 of the Health and Safety Code.
xiv Final Draft, 2015 Urban Water Management Plan – Simi Valley Golden State Water Company
\\sac2\job\2015\1570027.00_gswc-2015 uwmp\09-reports\simi valley\09-reports\9.09-reports\3_final draft\simi valley_2015_uwmp-final draft.docx
THIS PAGE INTENTIONALLY BLANK
Final Draft, 2015 Urban Water Management Plan – Simi Valley Page 1-1 Golden State Water Company \\sac2\job\2015\1570027.00_gswc-2015 uwmp\09-reports\simi valley\09-reports\9.09-reports\3_final draft\simi valley_2015_uwmp-final draft.docx
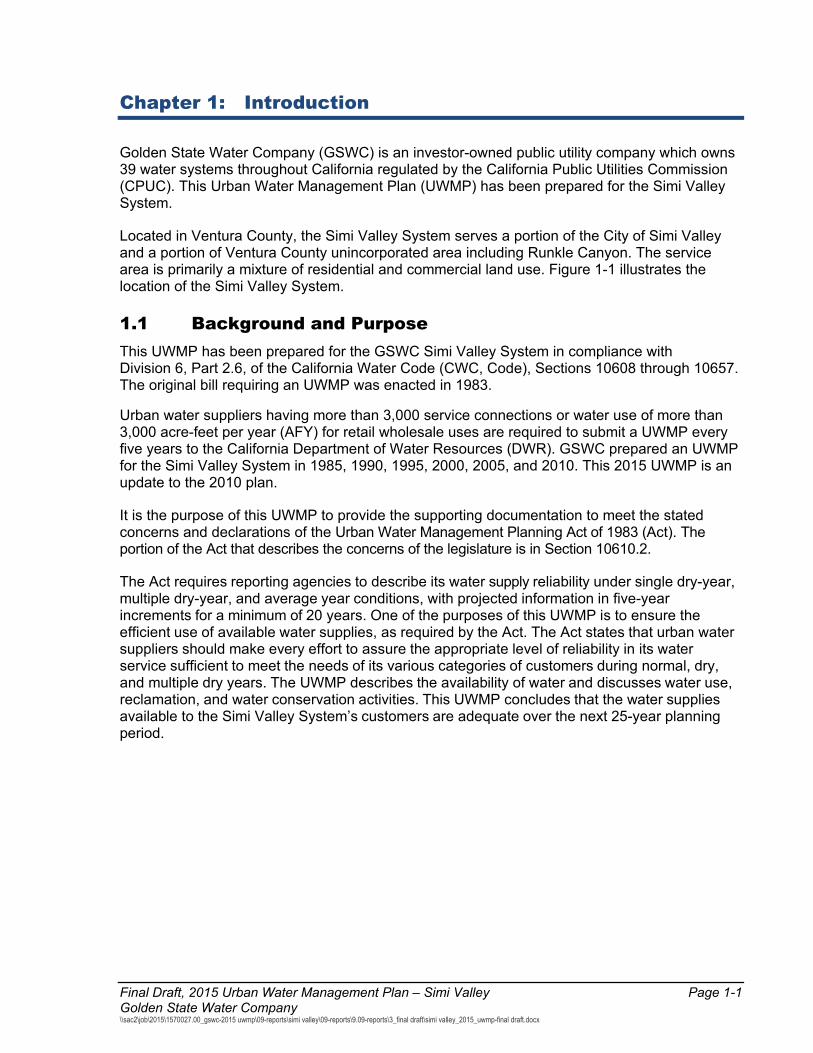
Chapter 1: Introduction
Golden State Water Company (GSWC) is an investor-owned public utility company which owns 39 water systems throughout California regulated by the California Public Utilities Commission (CPUC). This Urban Water Management Plan (UWMP) has been prepared for the Simi Valley System.
Located in Ventura County, the Simi Valley System serves a portion of the City of Simi Valley and a portion of Ventura County unincorporated area including Runkle Canyon. The service area is primarily a mixture of residential and commercial land use. Figure 1-1 illustrates the location of the Simi Valley System.
1.1 Background and Purpose This UWMP has been prepared for the GSWC Simi Valley System in compliance with Division 6, Part 2.6, of the California Water Code (CWC, Code), Sections 10608 through 10657. The original bill requiring an UWMP was enacted in 1983.
Urban water suppliers having more than 3,000 service connections or water use of more than 3,000 acre-feet per year (AFY) for retail wholesale uses are required to submit a UWMP every five years to the California Department of Water Resources (DWR). GSWC prepared an UWMP for the Simi Valley System in 1985, 1990, 1995, 2000, 2005, and 2010. This 2015 UWMP is an update to the 2010 plan.
It is the purpose of this UWMP to provide the supporting documentation to meet the stated concerns and declarations of the Urban Water Management Planning Act of 1983 (Act). The portion of the Act that describes the concerns of the legislature is in Section 10610.2.
The Act requires reporting agencies to describe its water supply reliability under single dry-year, multiple dry-year, and average year conditions, with projected information in five-year increments for a minimum of 20 years. One of the purposes of this UWMP is to ensure the efficient use of available water supplies, as required by the Act. The Act states that urban water suppliers should make every effort to assure the appropriate level of reliability in its water service sufficient to meet the needs of its various categories of customers during normal, dry, and multiple dry years. The UWMP describes the availability of water and discusses water use, reclamation, and water conservation activities. This UWMP concludes that the water supplies available to the Simi Valley System’s customers are adequate over the next 25-year planning period.
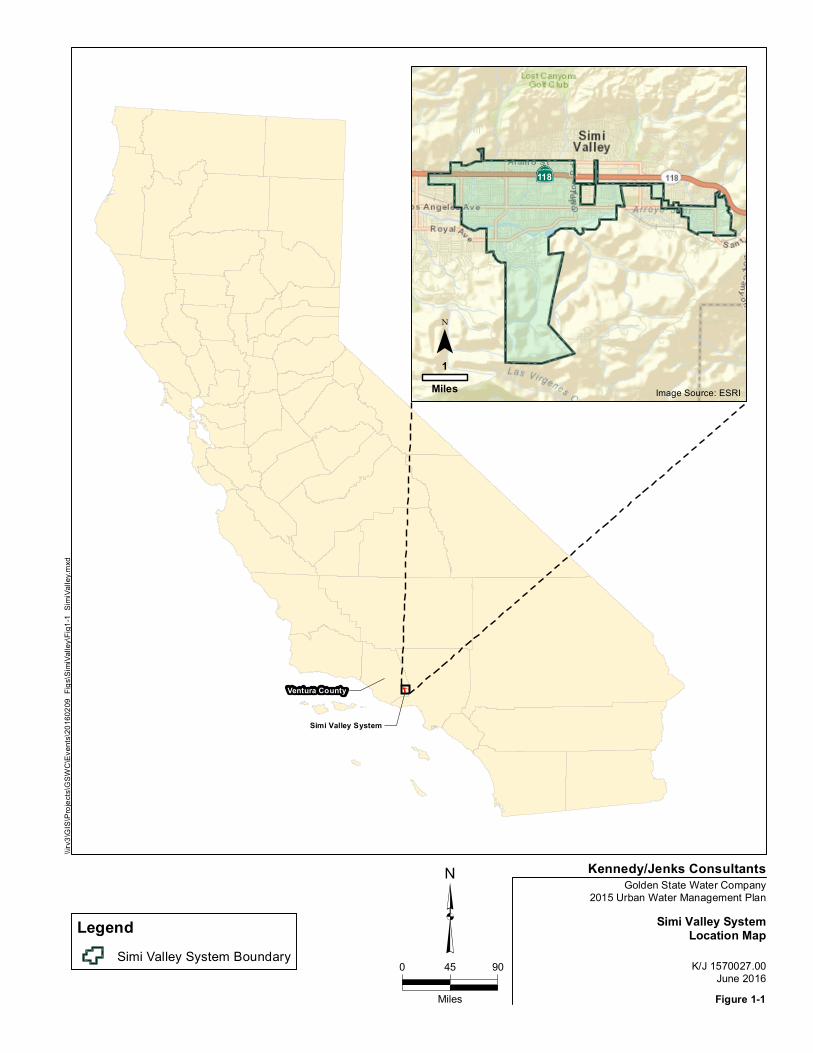
Simi Valley System
Ventura County
³0 45 90
Miles
Golden State Water Company2015 Urban Water Management Plan
Simi Valley SystemLocation Map
K/J 1570027.00June 2016Figure 1-1
Kennedy/Jenks Consultants
\\irv3
\GIS
\Proj
ects\
GSW
C\Ev
ents\
2016
0209
_Figs
\Sim
iValle
y\Fig1
-1_Sim
iValle
y.mxd
·|}þ118
1̄Miles
LegendSimi Valley System Boundary
Image Source: ESRI

Final Draft, 2015 Urban Water Management Plan – Simi Valley Page 1-3 Golden State Water Company \\sac2\job\2015\1570027.00_gswc-2015 uwmp\09-reports\simi valley\09-reports\9.09-reports\3_final draft\simi valley_2015_uwmp-final draft.docx
1.2 Urban Water Management Planning and the California Water Code
1.2.1 Urban Water Management Planning Act of 1983 The Act became part of the CWC with the passage of Assembly Bill 797 during the 1983–1984 regular session of the California legislature. Subsequently, assembly bills between 1990 and 2014 amended the Act to include additional data and reporting requirements. The Act describes the contents of the UWMP as well as how urban water suppliers should adopt and implement the UWMP and was updated most recently by SB 1420 and AB 2067.
This UWMP addresses all subjects required by Section 10631 of the Act which permits “levels of water management planning commensurate with the numbers of customers served and the volume of water supplied.” All applicable sections of the Act are discussed in this UWMP, with chapters of the UWMP and DWR Guidebook Checklist cross-referenced against the corresponding provision of the Act. Additionally, a completed copy of the 2015 Urban Water Management Plan Checklist, organized by subject is included as Appendix A.
1.2.2 Applicable Changes to the Water Code since 2010 UWMPs Since 2010, four legislative bills (Assembly Bill 2409 in 2010, Senate Bill 1036 in 2014, Assembly Bill 2067 in 2014, and Senate Bill 1420 in 2014) have made changes to the Water Code affecting requirements and guidance for UWMP development. A summary list of the topical changes is provided below.
Demand Management Measures, CWC Section 10631(f)(1) and (2)
Submittal Date, CWC Section 10621(d)
Electronic Submittal, CWC Section 10644(a)(2)
Standardized Forms, CWC Section 10644(a)(2)
Water Loss, CWC Section 10631(e)(1)(J) and (e)(3)(A) and (B)
Estimating Future Water Savings, CWC Section 10631(e)(4)
Voluntary Reporting of Energy Intensity, CWC Section 10631.2(a) and (b)
Defining Water Features, CWC Section 10632(b)
1.2.3 Water Conservation Act of 2009 (SBX7-7) (Appendix B) Senate Bill No. 7 (SBX7-7), which became law in November 2009, requires increased emphasis on water demand management and requires the state to achieve a 20 percent reduction in urban per capita water use by December 31, 2020. Retail urban water suppliers are required to report their Baseline Daily Per Capita Water Use (Baseline GPCD), 2015 interim Urban Water Use Target, 2020 Urban Water Use Target, and Compliance Daily per Capita Water Use. The Baseline GPCD, Targets, and methodologies are presented in Chapter 5.
Page 1-4 Final Draft, 2015 Urban Water Management Plan – Simi Valley Golden State Water Company
\\sac2\job\2015\1570027.00_gswc-2015 uwmp\09-reports\simi valley\09-reports\9.09-reports\3_final draft\simi valley_2015_uwmp-final draft.docx
1.3 Urban Water Management Plans in Relation to Other Planning Efforts
Regulated by the CPUC, GSWC pursues and develops planning documents in conjunction with CPUC requirements and approval. The CPUC adopted the 2005 Water Action Plan (WAP) in December 2005 and an updated 2010 WAP in October 2010 (CPUC 2005, 2010). The WAP is a general policy document. Specific implementation of policies and programs, along with modifications to CPUC ratemaking policies, and other programs including conservation, long-term planning, water quality and drought management programs are ongoing.
The purpose of the 2010 WAP update was to establish renewed focus on the following elements:
1. Maintain the highest standards of water quality;
2. Promote water infrastructure investment;
3. Strengthen water conservation programs to a level comparable to those of energy utilities;
4. Streamline CPUC regulatory decision-making;
5. Set rates that balance investment, conservation, and affordability; and
6. Assist low-income ratepayers.
GSWC has been actively involved with the CPUC in suggesting optimal approaches to the WAP. In particular, the GSWC has suggested specific implementation measures and modifications to certain CPUC rate setting practices so that regulated utilities are able as a practical matter to achieve the policy objectives of the WAP. These efforts are intended to include further investment in local resource optimization, reduced reliance on imported supplies, enhanced conservation, and intensification of company-wide efforts to optimize water resource mix, including planned water supply projects and programs to meet the long-term water supply needs of GSWC’s customers.
GSWC is currently updating the Simi Valley System Water Master Plan, expected to be final by July 2016. The Water Master Plan and this UWMP were developed concurrently and are consistent in representing the Simi Valley System’s historical and projected water supply and demand.
1.4 UWMP Organization The 2015 UWMP serves as an update to the 2010 UWMP and draws extensively from that report; however, this plan has been restructured in response to legislative changes discussed above and new requirements presented in the 2015 UWMP Guidebook for Urban Water Suppliers (DWR Guidebook) developed by DWR (DWR 2016a).
GSWC has organized its 2015 UWMP following DWR’s recommended outline from the DWR Guidebook. GSWC has also elected to present data in this UWMP using the DWR Tables as presented in the DWR Guidebook.
Final Draft, 2015 Urban Water Management Plan – Simi Valley Page 1-5 Golden State Water Company \\sac2\job\2015\1570027.00_gswc-2015 uwmp\09-reports\simi valley\09-reports\9.09-reports\3_final draft\simi valley_2015_uwmp-final draft.docx
1.5 UWMPs and Grant or Loan Eligibility Beginning in 2016, urban retail water suppliers must comply with water conservation requirements in the Water Conservation Act of 2009 (SB X7-7) in order to be eligible for State of California water grants and loans. Retail water suppliers can meet these requirements through:
1. Meeting its 2015 Interim Urban Water Use Target and reporting compliance in the 2015 UWMP,
2. Submitting documentation qualifying its entire service area as a disadvantaged community.

Page 1-6 Final Draft, 2015 Urban Water Management Plan – Simi Valley Golden State Water Company
\\sac2\job\2015\1570027.00_gswc-2015 uwmp\09-reports\simi valley\09-reports\9.09-reports\3_final draft\simi valley_2015_uwmp-final draft.docx
THIS PAGE INTENTIONALLY BLANK
Final Draft, 2015 Urban Water Management Plan – Simi Valley Page 2-1 Golden State Water Company \\sac2\job\2015\1570027.00_gswc-2015 uwmp\09-reports\simi valley\09-reports\9.09-reports\3_final draft\simi valley_2015_uwmp-final draft.docx
Chapter 2: Plan Preparation
2.1 Basis for Preparing a Plan
CWC 10617 “Urban water supplier” means a supplier, either publicly or privately owned, providing water for municipal purposes either directly or indirectly to more than 3,000 customers or supplying more than 3,000 acre-feet of water annually. An urban water supplier includes a supplier or contractor for water, regardless of the basis of right, which distributes or sells for ultimate resale to customers. This part applies only to water supplied from public water systems...
CWC 10620 (b) Every person that becomes an urban water supplier shall adopt an urban water management plan within
one year after it has become an urban water supplier.
CWC 10621 (a) Each urban water supplier shall update its plan at least once every five years on or before December 31, in
years ending in five and zero, except as provided in subdivision (d). (d) Each urban water supplier shall update and submit its 2015 plan to the department by July 1, 2016.
In accordance with the CWC, urban water suppliers with 3,000 or more service connections or supplying 3,000 or more acre-feet per year are required to prepare an Urban Water Management Plan every five years.
The Simi Valley System has historically supplied greater than 3,000 acre-feet of water per year, and currently serves approximately 13,450 connections, thus meeting the threshold for UWMP preparation.
GSWC prepared this UWMP with the assistance of its consultant, Kennedy/Jenks Consultants, as permitted by the following section of the Act:
Section 10620.
(e) The urban water supplier may prepare the plan with its own staff, by contract, or in cooperation with other governmental agencies.
Page 2-2 Final Draft, 2015 Urban Water Management Plan – Simi Valley Golden State Water Company
\\sac2\job\2015\1570027.00_gswc-2015 uwmp\09-reports\simi valley\09-reports\9.09-reports\3_final draft\simi valley_2015_uwmp-final draft.docx
2.1.1 Public Water Systems
CWC 10644 (a)(2) The plan, or amendments to the plan, submitted to the department ... shall include any standardized forms,
tables, or displays specified by the department.
CWC 10608.52 (a) The department, in consultation with the board, the California Bay-Delta Authority or its successor
agency, the State Department of Public Health, and the Public Utilities Commission, shall develop a single standardized water use reporting form to meet the water use information needs of each agency, including the needs of urban water suppliers that elect to determine and report progress toward achieving targets on a regional basis as provided in subdivision (a) of Section 10608.28.
(b) At a minimum, the form shall be developed to accommodate information sufficient to assess an urban water supplier's compliance with conservation targets pursuant to Section 10608.24... The form shall accommodate reporting by urban water suppliers on an individual or regional basis as provided in subdivision (a) of Section 10608.28.
California Health and Safety Code 116275 (h) “Public Water System” means a system for the provision of water for human consumption through pipes
or other constructed conveyances that has 15 or more service connections or regularly serves at least 25 individuals daily at least 60 days out of the year.
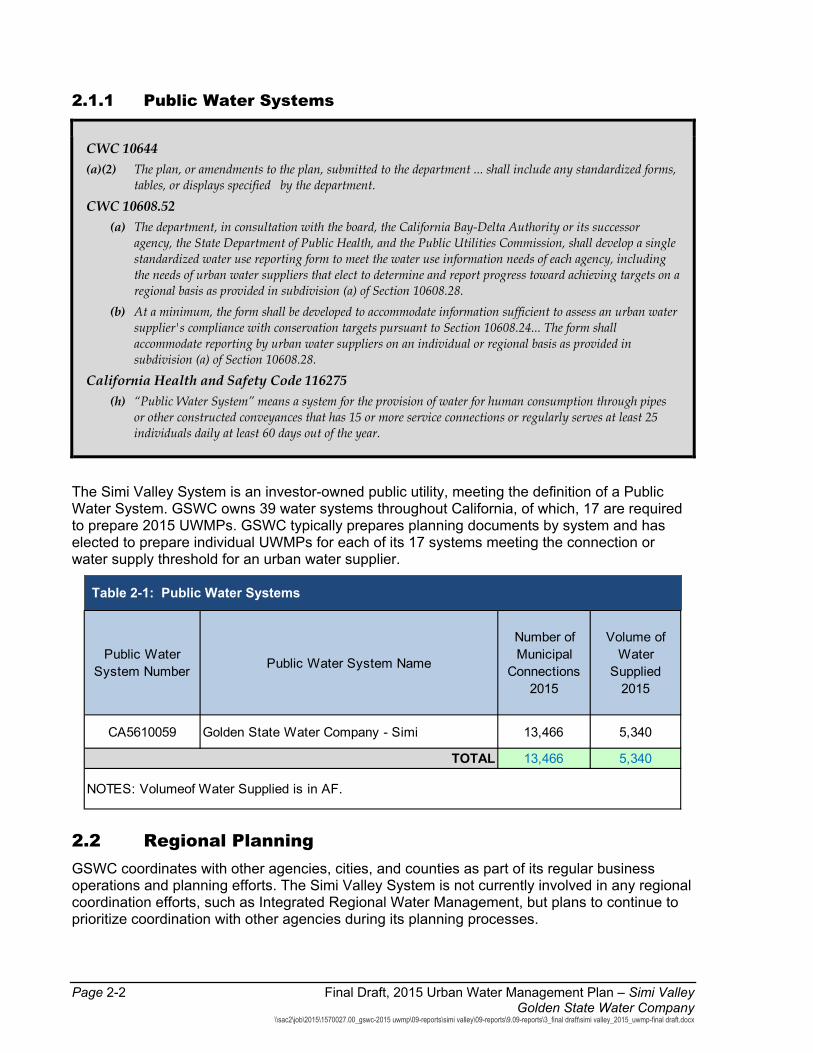
The Simi Valley System is an investor-owned public utility, meeting the definition of a Public Water System. GSWC owns 39 water systems throughout California, of which, 17 are required to prepare 2015 UWMPs. GSWC typically prepares planning documents by system and has elected to prepare individual UWMPs for each of its 17 systems meeting the connection or water supply threshold for an urban water supplier.
Table 2-1: Public Water Systems
2.2 Regional Planning GSWC coordinates with other agencies, cities, and counties as part of its regular business operations and planning efforts. The Simi Valley System is not currently involved in any regional coordination efforts, such as Integrated Regional Water Management, but plans to continue to prioritize coordination with other agencies during its planning processes.
Public Water System Number Public Water System Name
Number of Municipal
Connections 2015
Volume of Water
Supplied 2015
CA5610059 Golden State Water Company - Simi 13,466 5,340
13,466 5,340
NOTES: Volumeof Water Supplied is in AF.
TOTAL
Final Draft, 2015 Urban Water Management Plan – Simi Valley Page 2-3 Golden State Water Company \\sac2\job\2015\1570027.00_gswc-2015 uwmp\09-reports\simi valley\09-reports\9.09-reports\3_final draft\simi valley_2015_uwmp-final draft.docx
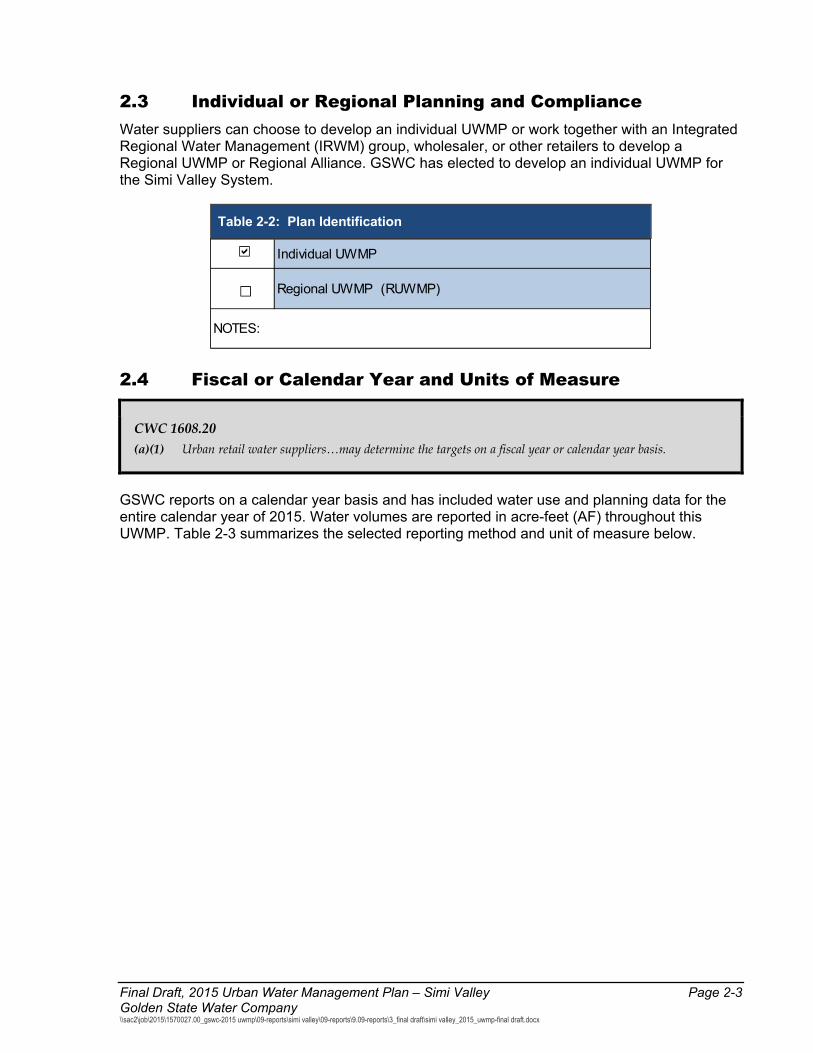
2.3 Individual or Regional Planning and Compliance Water suppliers can choose to develop an individual UWMP or work together with an Integrated Regional Water Management (IRWM) group, wholesaler, or other retailers to develop a Regional UWMP or Regional Alliance. GSWC has elected to develop an individual UWMP for the Simi Valley System.
Table 2-2: Plan Identification
2.4 Fiscal or Calendar Year and Units of Measure
CWC 1608.20 (a)(1) Urban retail water suppliers…may determine the targets on a fiscal year or calendar year basis.
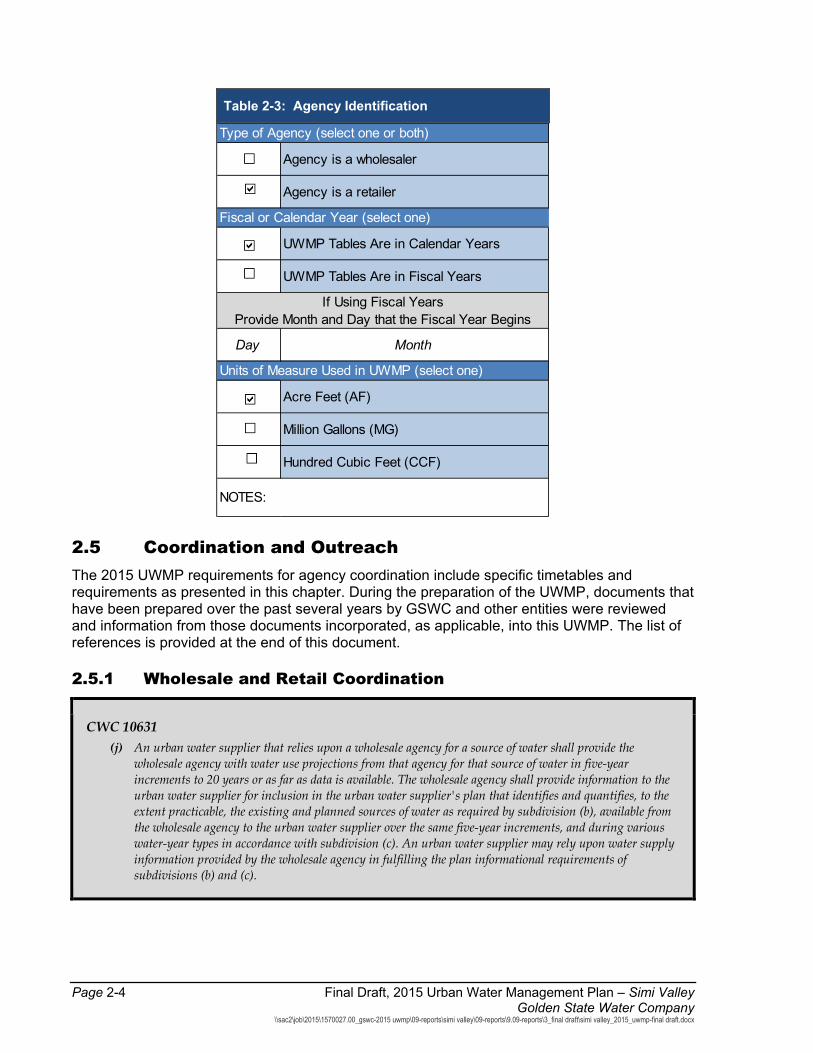
GSWC reports on a calendar year basis and has included water use and planning data for the entire calendar year of 2015. Water volumes are reported in acre-feet (AF) throughout this UWMP. Table 2-3 summarizes the selected reporting method and unit of measure below.
Individual UWMP
Regional UWMP (RUWMP)
NOTES:
Page 2-4 Final Draft, 2015 Urban Water Management Plan – Simi Valley Golden State Water Company
\\sac2\job\2015\1570027.00_gswc-2015 uwmp\09-reports\simi valley\09-reports\9.09-reports\3_final draft\simi valley_2015_uwmp-final draft.docx
Table 2-3: Agency Identification
2.5 Coordination and Outreach The 2015 UWMP requirements for agency coordination include specific timetables and requirements as presented in this chapter. During the preparation of the UWMP, documents that have been prepared over the past several years by GSWC and other entities were reviewed and information from those documents incorporated, as applicable, into this UWMP. The list of references is provided at the end of this document.
2.5.1 Wholesale and Retail Coordination
CWC 10631 (j) An urban water supplier that relies upon a wholesale agency for a source of water shall provide the
wholesale agency with water use projections from that agency for that source of water in five-year increments to 20 years or as far as data is available. The wholesale agency shall provide information to the urban water supplier for inclusion in the urban water supplier's plan that identifies and quantifies, to the extent practicable, the existing and planned sources of water as required by subdivision (b), available from the wholesale agency to the urban water supplier over the same five-year increments, and during various water-year types in accordance with subdivision (c). An urban water supplier may rely upon water supply information provided by the wholesale agency in fulfilling the plan informational requirements of subdivisions (b) and (c).
Agency is a wholesaler
Agency is a retailer
UWMP Tables Are in Calendar Years
UWMP Tables Are in Fiscal Years
Day Month
Acre Feet (AF)
Million Gallons (MG)
Hundred Cubic Feet (CCF)
NOTES:
Type of Agency (select one or both)
Fiscal or Calendar Year (select one)
If Using Fiscal Years Provide Month and Day that the Fiscal Year Begins
Units of Measure Used in UWMP (select one)

Final Draft, 2015 Urban Water Management Plan – Simi Valley Page 2-5 Golden State Water Company \\sac2\job\2015\1570027.00_gswc-2015 uwmp\09-reports\simi valley\09-reports\9.09-reports\3_final draft\simi valley_2015_uwmp-final draft.docx
Retail agencies are required to provide their wholesaler(s) with their projected water demand. The Simi Valley System receives treated water from Calleguas Municipal Water District (CMWD) as discussed in further detail in Chapter 6. GSWC has informed CMWD of the projected water use as documented in Table 2-4 and included in Appendix B.
Table 2-4: Water Supplier Information Exchange
2.5.2 Coordination with Other Agencies and the Community
CWC 10620 (d)(2) Each urban water supplier shall coordinate the preparation of its plan with other appropriate agencies in
the area, including other water suppliers that share a common source, water management agencies, and relevant public agencies, to the extent practicable.
CWC 10642 Each urban water supplier shall encourage the active involvement of diverse social, cultural, and economic elements of the population within the service area prior to and during the preparation of the plan.
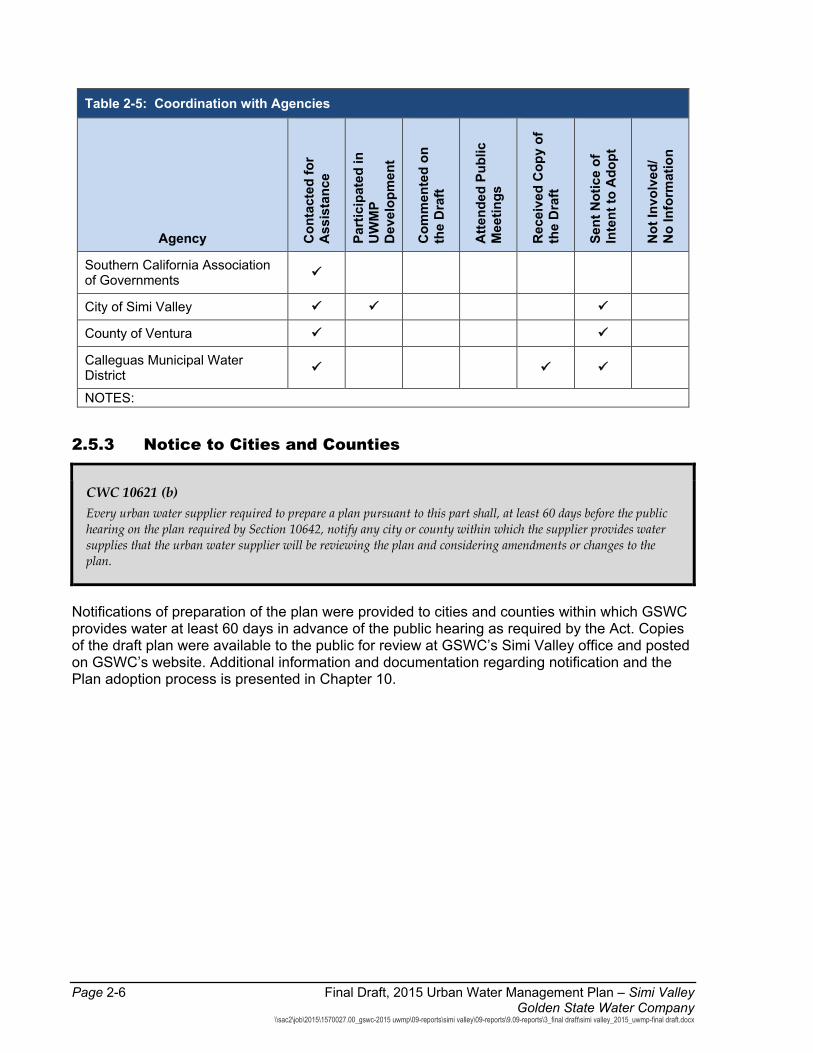
Table 2-5 lists the agencies with which coordination occurred while preparing this 2015 UWMP. The initial coordination began in February 2016, which included the distribution of notification letters and requests for information. Each notification letter was followed up with a telephone call as necessary to obtain supporting data and coordinate preparation of the UWMP. Table 2-5 also provides a list of agencies that were provided public hearing notifications and access to the draft UWMP and is discussed in further detail in Chapter 10.
The retail supplier has informed the following wholesale supplier(s) of projected water use in accordance with CWC 10631.
Wholesale Water Supplier Name
Calleguas Municipal Water District
NOTES:
Page 2-6 Final Draft, 2015 Urban Water Management Plan – Simi Valley Golden State Water Company
\\sac2\job\2015\1570027.00_gswc-2015 uwmp\09-reports\simi valley\09-reports\9.09-reports\3_final draft\simi valley_2015_uwmp-final draft.docx
Table 2-5: Coordination with Agencies
Agency Con
tact
ed fo
r A
ssis
tanc
e
Part
icip
ated
in
UW
MP
Dev
elop
men
t
Com
men
ted
on
the
Dra
ft
Atte
nded
Pub
lic
Mee
tings
Rec
eive
d C
opy
of
the
Dra
ft
Sent
Not
ice
of
Inte
nt to
Ado
pt
Not
Invo
lved
/ N
o In
form
atio
n
Southern California Association of Governments
City of Simi Valley
County of Ventura
Calleguas Municipal Water District
NOTES:
2.5.3 Notice to Cities and Counties
CWC 10621 (b) Every urban water supplier required to prepare a plan pursuant to this part shall, at least 60 days before the public hearing on the plan required by Section 10642, notify any city or county within which the supplier provides water supplies that the urban water supplier will be reviewing the plan and considering amendments or changes to the plan.
Notifications of preparation of the plan were provided to cities and counties within which GSWC provides water at least 60 days in advance of the public hearing as required by the Act. Copies of the draft plan were available to the public for review at GSWC’s Simi Valley office and posted on GSWC’s website. Additional information and documentation regarding notification and the Plan adoption process is presented in Chapter 10.
Final Draft, 2015 Urban Water Management Plan – Simi Valley Page 3-1 Golden State Water Company \\sac2\job\2015\1570027.00_gswc-2015 uwmp\09-reports\simi valley\09-reports\9.09-reports\3_final draft\simi valley_2015_uwmp-final draft.docx
Chapter 3: System Description
3.1 General Description
CWC Section 10631 Describe the service area of the supplier.
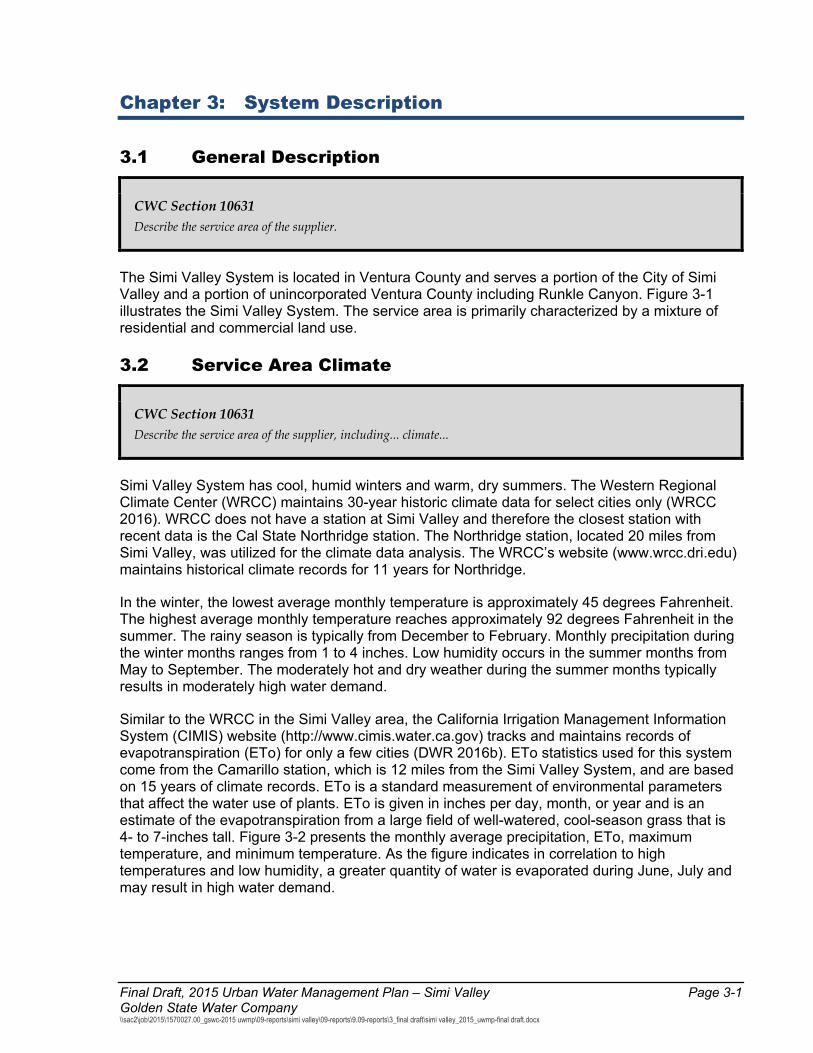
The Simi Valley System is located in Ventura County and serves a portion of the City of Simi Valley and a portion of unincorporated Ventura County including Runkle Canyon. Figure 3-1 illustrates the Simi Valley System. The service area is primarily characterized by a mixture of residential and commercial land use.
3.2 Service Area Climate
CWC Section 10631 Describe the service area of the supplier, including... climate...
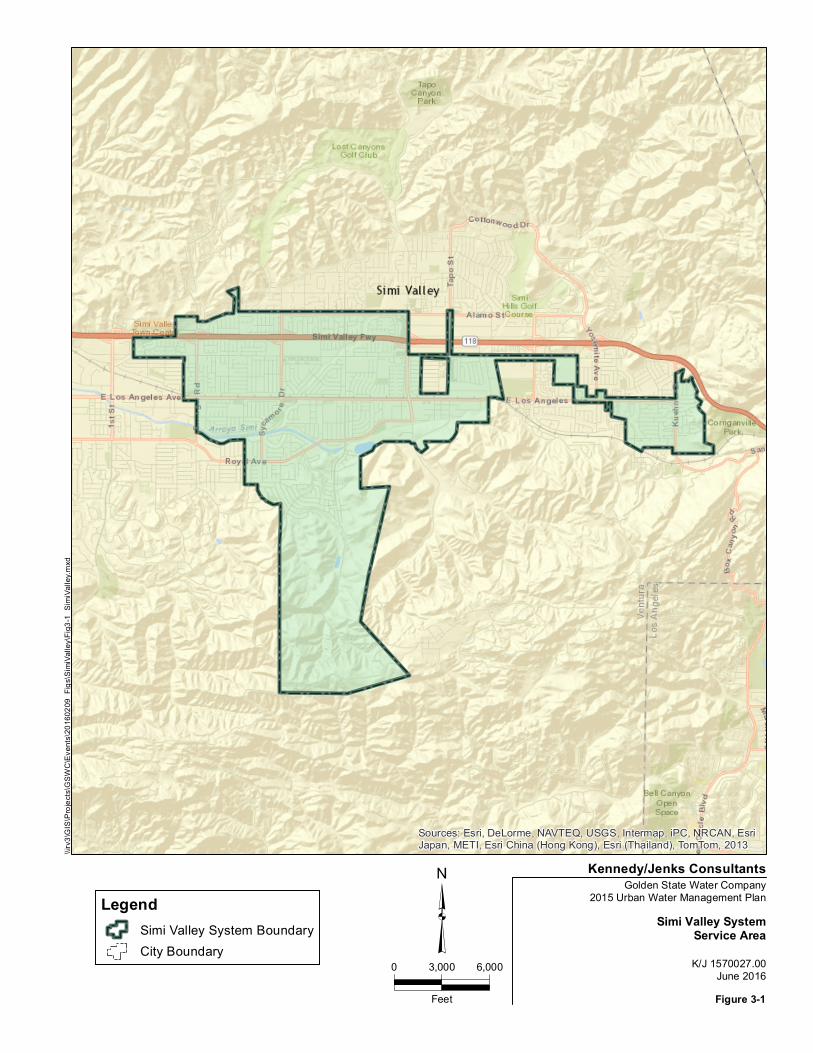
Simi Valley System has cool, humid winters and warm, dry summers. The Western Regional Climate Center (WRCC) maintains 30-year historic climate data for select cities only (WRCC 2016). WRCC does not have a station at Simi Valley and therefore the closest station with recent data is the Cal State Northridge station. The Northridge station, located 20 miles from Simi Valley, was utilized for the climate data analysis. The WRCC’s website (www.wrcc.dri.edu) maintains historical climate records for 11 years for Northridge.
In the winter, the lowest average monthly temperature is approximately 45 degrees Fahrenheit. The highest average monthly temperature reaches approximately 92 degrees Fahrenheit in the summer. The rainy season is typically from December to February. Monthly precipitation during the winter months ranges from 1 to 4 inches. Low humidity occurs in the summer months from May to September. The moderately hot and dry weather during the summer months typically results in moderately high water demand.
Similar to the WRCC in the Simi Valley area, the California Irrigation Management Information System (CIMIS) website (http://www.cimis.water.ca.gov) tracks and maintains records of evapotranspiration (ETo) for only a few cities (DWR 2016b). ETo statistics used for this system come from the Camarillo station, which is 12 miles from the Simi Valley System, and are based on 15 years of climate records. ETo is a standard measurement of environmental parameters that affect the water use of plants. ETo is given in inches per day, month, or year and is an estimate of the evapotranspiration from a large field of well-watered, cool-season grass that is 4- to 7-inches tall. Figure 3-2 presents the monthly average precipitation, ETo, maximum temperature, and minimum temperature. As the figure indicates in correlation to high temperatures and low humidity, a greater quantity of water is evaporated during June, July and may result in high water demand.
Sources: Esri, DeLorme, NAVTEQ, USGS, Intermap, iPC, NRCAN, EsriJapan, METI, Esri China (Hong Kong), Esri (Thailand), TomTom, 2013
³0 3,000 6,000
Feet
Golden State Water Company2015 Urban Water Management Plan
Simi Valley SystemService AreaK/J 1570027.00
June 2016Figure 3-1
Kennedy/Jenks Consultants
LegendSimi Valley System BoundaryCity Boundary
\\irv3
\GIS
\Proj
ects\
GSW
C\Ev
ents\
2016
0209
_Figs
\Sim
iValle
y\Fig3
-1_Sim
iValle
y.mxd
Final Draft, 2015 Urban Water Management Plan – Simi Valley Page 3-3 Golden State Water Company \\sac2\job\2015\1570027.00_gswc-2015 uwmp\09-reports\simi valley\09-reports\9.09-reports\3_final draft\simi valley_2015_uwmp-final draft.docx
Figure 3-2: Monthly Average Climate Data in Simi Valley System
3.3 Service Area Population and Demographics
CWC Section 10631 Describe the service area of the supplier, including current and projected population ...The projected population estimates shall be based upon data from the state, regional, or local service agency population projections within the service area of the urban water supplier and shall be in five-year increments to 20 years or as far as data is available.
In 2015 the estimated population of the Simi Valley System service area was 45,221, according to the DWR Population Tool and methodology described in Chapter 5. The following sections discuss population and other demographics that will influence water use.
3.3.1 SCAG Population Projection Development Methodology Population, housing, and employment projections were developed for the Simi Valley System using the Southern California Association of Governments (SCAG) population, housing, and employment data. SCAG updated its projections in 2012 for population, household, and employment growth through the year 2035 using 2010 U.S. Census data. SCAG’s methodology is described below, followed by the derivation of population projections for the Simi Valley System. Similar to the 2010 UWMP projections, the population projections use 2010 U.S. Census data.
Page 3-4 Final Draft, 2015 Urban Water Management Plan – Simi Valley Golden State Water Company
\\sac2\job\2015\1570027.00_gswc-2015 uwmp\09-reports\simi valley\09-reports\9.09-reports\3_final draft\simi valley_2015_uwmp-final draft.docx
The SCAG is a regional planning agency that provides demographic and economic data analysis for Imperial County, Los Angeles County, Orange County, Riverside County, San Bernardino County, and Ventura County. SCAG’s Integrated Growth Forecasting process uses a variety of estimates and projections from the federal and state governments. Sources include the U.S. Department of Labor, Internal Revenue Service (IRS), U.S. Citizenship and Immigration Services, U.S. Department of Health and Human Services, California Department of Finance (DOF), California Employment Development Department, and information received through the Intergovernmental Review process. On a regional level, the SCAG forecast uses a cohort component model to project birth and death rates based on demographic factors and estimates migration based on economic fluctuations. Projected growth of an individual jurisdiction is assumed to be proportionate to the jurisdiction’s historic contribution to county growth.
A detailed explanation of the population, household and employment projection process employed by SCAG can be found in the report: “Growth Forecast”, a supplemental report to the SCAG “Regional Transportation Plan, 2012-2035”.
3.3.2 Historical and Projected Population SCAG city level projections were used to determine projected population from 2020 to 2040. The Simi Valley System serves the City of Simi Valley. Therefore, the SCAG growth rate for 2015 through 2040 for the City of Simi Valley was used to project the population, household, and employment of the Simi Valley System. This methodology applies the SCAG growth rate to a consistent system boundary through 2040; therefore it is assumed that the projected population accounts for system in-fill only and does not include geographic growth such as tariff area expansion. Table 3-1 presents the current and projected population for the Simi Valley System.
Table 3-1: Population – Current and Projected
2015 2020 2025 2030 2035 2040(opt)
45,221 46,200 46,612 47,028 47,447 47,870
Population Served
NOTES: 1. 2015 population estimated using the DWR Online Population Tool.2. Projected population based on SCAG population growth rate for the City of Simi Valley.
Final Draft, 2015 Urban Water Management Plan – Simi Valley Page 3-5 Golden State Water Company \\sac2\job\2015\1570027.00_gswc-2015 uwmp\09-reports\simi valley\09-reports\9.09-reports\3_final draft\simi valley_2015_uwmp-final draft.docx
3.3.3 Other Demographic Factors
CWC 10631 Describe the service area of the supplier, including...other demographic factors affecting the supplier's water management planning.
The City of Simi Valley was chosen as demographically representative of the Simi Valley System. According to 2010 U.S. Census Data, the median age of Simi Valley’s residents is 38.1 years. Simi Valley has an average household size of 2.99 and a median household income of approximately $90,114 in 2014 dollars (2010-2014 American Community Survey 5-Year Estimates).
According to SCAG data for Simi Valley, population is expected to increase by a total of eight (8) percent from 2008 to 2035, which translates to a 0.3 percent growth rate per year. The number of households is expected to grow seven (7) percent during the same period, which equates to an annual household growth rate of 0.2 percent. Employment is expected to grow twenty-two (23) percent during the same period, which equates to an annual employment growth rate of 0.8 percent.
Page 3-6 Final Draft, 2015 Urban Water Management Plan – Simi Valley Golden State Water Company
\\sac2\job\2015\1570027.00_gswc-2015 uwmp\09-reports\simi valley\09-reports\9.09-reports\3_final draft\simi valley_2015_uwmp-final draft.docx
THIS PAGE INTENTIONALLY BLANK
Final Draft, 2015 Urban Water Management Plan – Simi Valley Page 4-1 Golden State Water Company \\sac2\job\2015\1570027.00_gswc-2015 uwmp\09-reports\simi valley\09-reports\9.09-reports\3_final draft\simi valley_2015_uwmp-final draft.docx
Chapter 4: System Water Use
4.1 Recycled versus Potable and Raw Water Demand The 2015 UWMP reports recycled, potable (drinking), and raw water demands separately. All water demands in the Simi Valley System are met by treated drinking water. Therefore, water demands reported in this chapter are for drinking water only. Water Uses by Sector
CWC 10631 (e)(1) Quantify, to the extent records are available, past and current water use, over the same five-year
increments described in subdivision (a), and projected water use, identifying the uses among water use sectors, including, but not necessarily limited to, all of the following uses:
(A) Single-family residential. (B) Multifamily. (C) Commercial. (D) Industrial. (E) Institutional and governmental. (F) Landscape. (G) Sales to other agencies. (H) Saline water intrusion barriers, groundwater recharge, or conjunctive use, or any combination thereof. (I) Agricultural...
(2) The water use projections shall be in the same five-year increments described in subdivision (a).
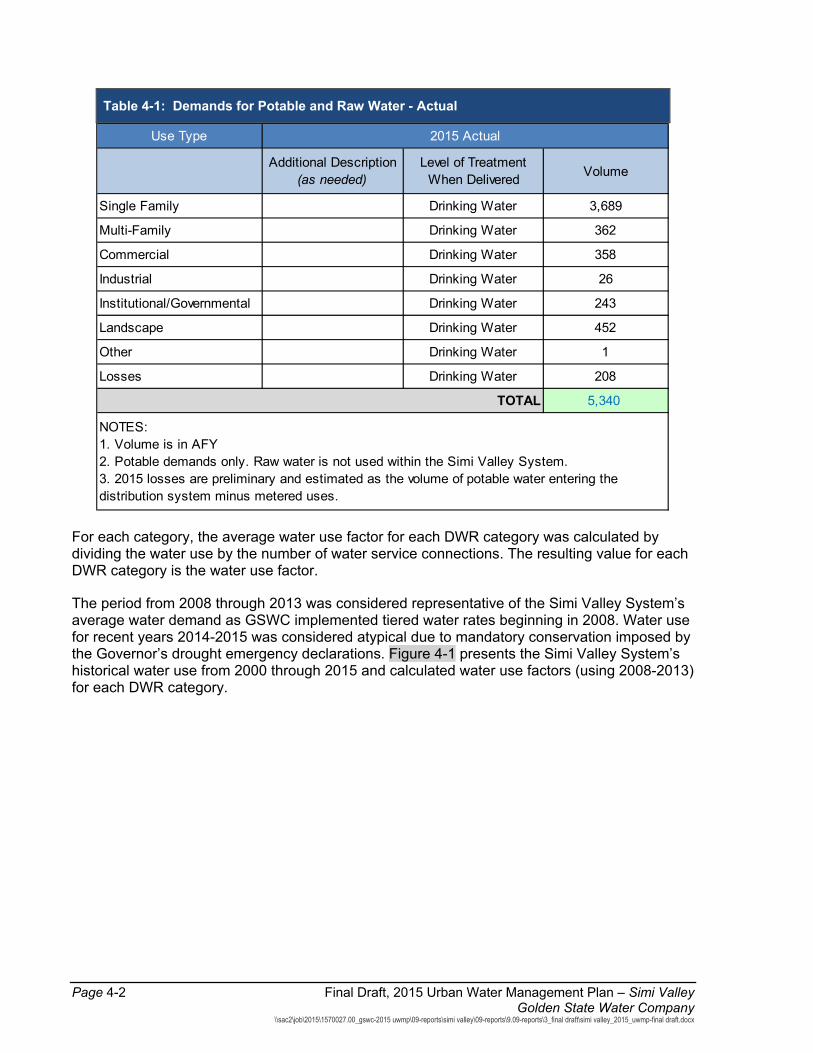
Historical connections and sales data from 1994 to 2015 were analyzed in order to provide an overview of historical water usage trends for the Simi Valley System. Connection and water sales data were grouped using the assigned North American Industry Classification System (NAICS) codes into the seven applicable DWR categories: single-family, multi-family, commercial, industrial, institutional/government, landscape, and other. For the Simi Valley System, other water uses include customer accounts that are inactive or idle. Table 4-1 presents the 2015 water use for the Simi Valley System broken down by the DWR categories, as well as estimated 2015 losses.
Page 4-2 Final Draft, 2015 Urban Water Management Plan – Simi Valley Golden State Water Company
\\sac2\job\2015\1570027.00_gswc-2015 uwmp\09-reports\simi valley\09-reports\9.09-reports\3_final draft\simi valley_2015_uwmp-final draft.docx
Table 4-1: Demands for Potable and Raw Water - Actual
For each category, the average water use factor for each DWR category was calculated by dividing the water use by the number of water service connections. The resulting value for each DWR category is the water use factor.
The period from 2008 through 2013 was considered representative of the Simi Valley System’s average water demand as GSWC implemented tiered water rates beginning in 2008. Water use for recent years 2014-2015 was considered atypical due to mandatory conservation imposed by the Governor’s drought emergency declarations. Figure 4-1 presents the Simi Valley System’s historical water use from 2000 through 2015 and calculated water use factors (using 2008-2013) for each DWR category.
Use Type
Additional Description (as needed)
Level of Treatment When Delivered Volume
Single Family Drinking Water 3,689
Multi-Family Drinking Water 362
Commercial Drinking Water 358
Industrial Drinking Water 26
Institutional/Governmental Drinking Water 243
Landscape Drinking Water 452
Other Drinking Water 1
Losses Drinking Water 208
5,340
2015 Actual
NOTES: 1. Volume is in AFY2. Potable demands only. Raw water is not used within the Simi Valley System. 3. 2015 losses are preliminary and estimated as the volume of potable water entering the distribution system minus metered uses.
TOTAL
Final Draft, 2015 Urban Water Management Plan – Simi Valley Page 4-3 Golden State Water Company \\sac2\job\2015\1570027.00_gswc-2015 uwmp\09-reports\simi valley\09-reports\9.09-reports\3_final draft\simi valley_2015_uwmp-final draft.docx
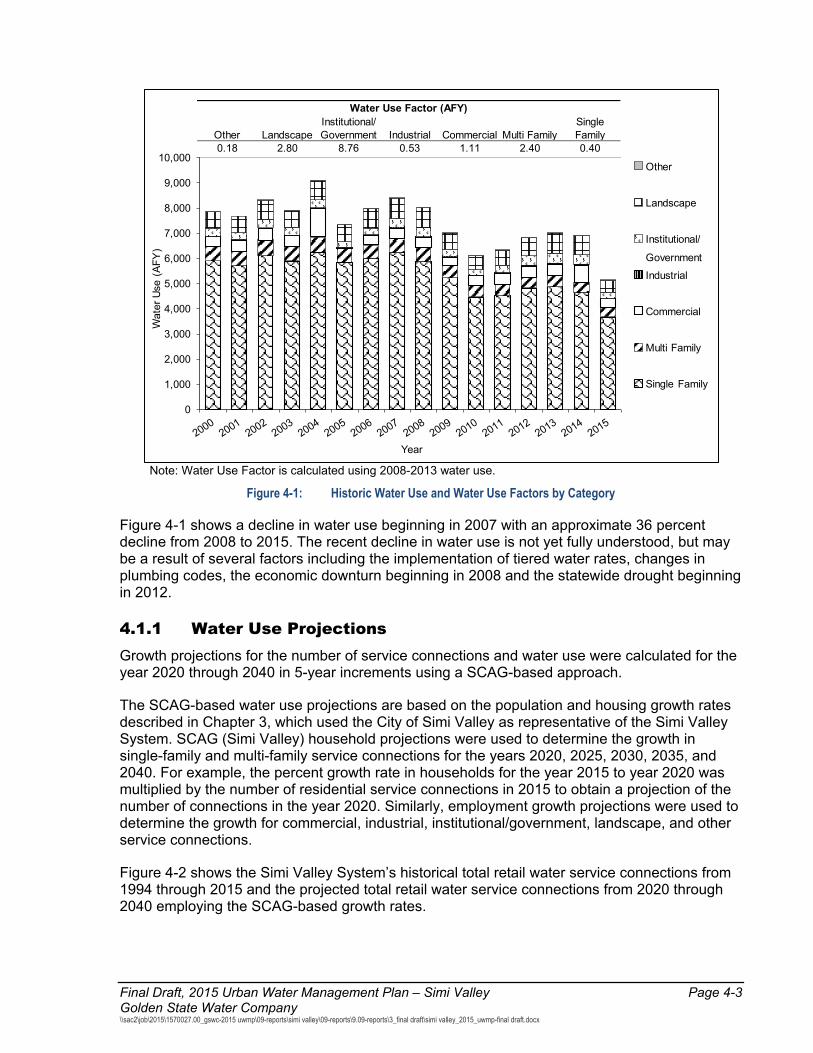
Note: Water Use Factor is calculated using 2008-2013 water use.
Figure 4-1: Historic Water Use and Water Use Factors by Category
Figure 4-1 shows a decline in water use beginning in 2007 with an approximate 36 percent decline from 2008 to 2015. The recent decline in water use is not yet fully understood, but may be a result of several factors including the implementation of tiered water rates, changes in plumbing codes, the economic downturn beginning in 2008 and the statewide drought beginning in 2012.
4.1.1 Water Use Projections Growth projections for the number of service connections and water use were calculated for the year 2020 through 2040 in 5-year increments using a SCAG-based approach.
The SCAG-based water use projections are based on the population and housing growth rates described in Chapter 3, which used the City of Simi Valley as representative of the Simi Valley System. SCAG (Simi Valley) household projections were used to determine the growth in single-family and multi-family service connections for the years 2020, 2025, 2030, 2035, and 2040. For example, the percent growth rate in households for the year 2015 to year 2020 was multiplied by the number of residential service connections in 2015 to obtain a projection of the number of connections in the year 2020. Similarly, employment growth projections were used to determine the growth for commercial, industrial, institutional/government, landscape, and other service connections.
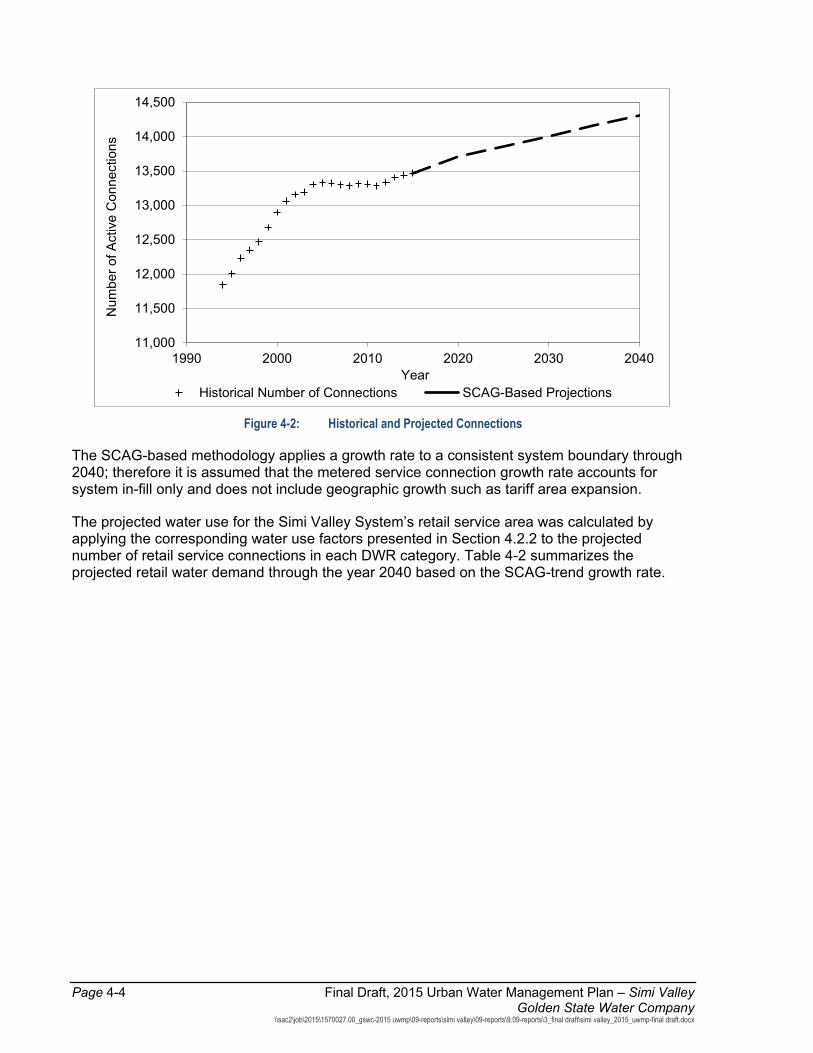
Figure 4-2 shows the Simi Valley System’s historical total retail water service connections from 1994 through 2015 and the projected total retail water service connections from 2020 through 2040 employing the SCAG-based growth rates.
Other LandscapeInstitutional/ Government Industrial Commercial Multi Family
Single Family
0.18 2.80 8.76 0.53 1.11 2.40 0.40
Water Use Factor (AFY)
0
1,000
2,000
3,000
4,000
5,000
6,000
7,000
8,000
9,000
10,000W
ater
Use
(AF
Y)
Year
Other
Landscape
Institutional/
Government
Industrial
Commercial
Multi Family
Single Family
Page 4-4 Final Draft, 2015 Urban Water Management Plan – Simi Valley Golden State Water Company
\\sac2\job\2015\1570027.00_gswc-2015 uwmp\09-reports\simi valley\09-reports\9.09-reports\3_final draft\simi valley_2015_uwmp-final draft.docx
Figure 4-2: Historical and Projected Connections
The SCAG-based methodology applies a growth rate to a consistent system boundary through 2040; therefore it is assumed that the metered service connection growth rate accounts for system in-fill only and does not include geographic growth such as tariff area expansion.
The projected water use for the Simi Valley System’s retail service area was calculated by applying the corresponding water use factors presented in Section 4.2.2 to the projected number of retail service connections in each DWR category. Table 4-2 summarizes the projected retail water demand through the year 2040 based on the SCAG-trend growth rate.
11,000
11,500
12,000
12,500
13,000
13,500
14,000
14,500
1990 2000 2010 2020 2030 2040
Num
ber o
f Act
ive
Con
nect
ions
Year Historical Number of Connections SCAG-Based Projections
Final Draft, 2015 Urban Water Management Plan – Simi Valley Page 4-5 Golden State Water Company \\sac2\job\2015\1570027.00_gswc-2015 uwmp\09-reports\simi valley\09-reports\9.09-reports\3_final draft\simi valley_2015_uwmp-final draft.docx
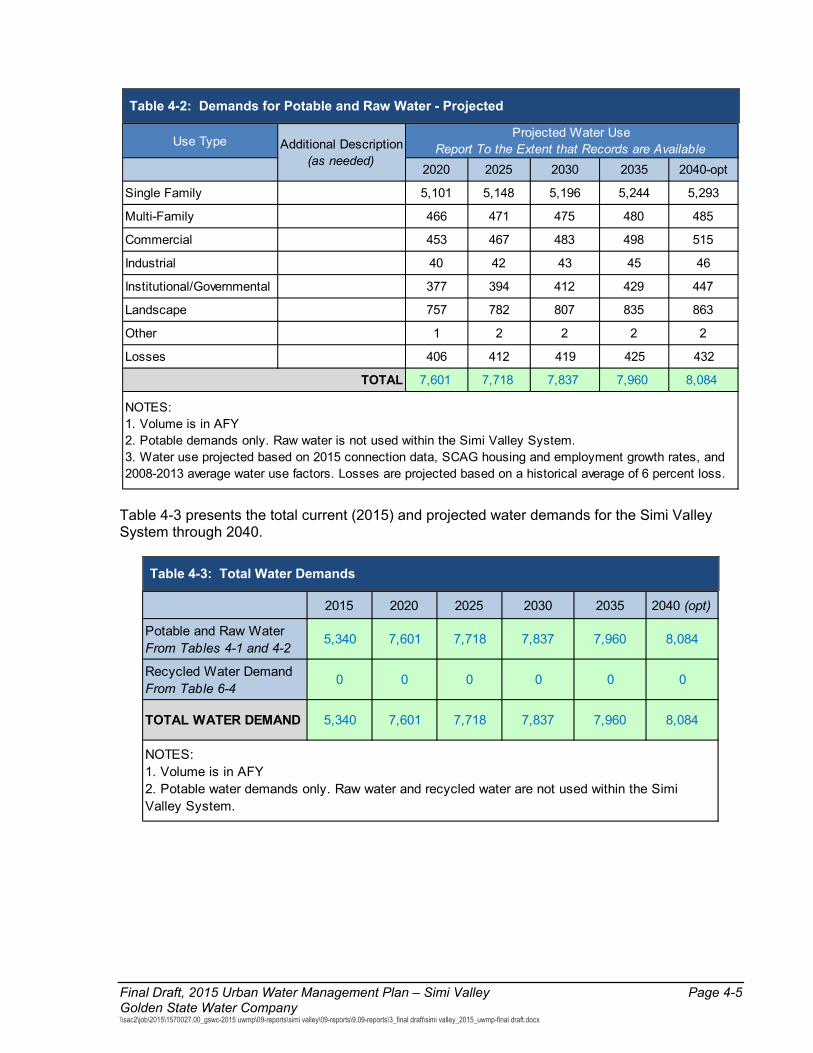
Table 4-2: Demands for Potable and Raw Water - Projected
Table 4-3 presents the total current (2015) and projected water demands for the Simi Valley System through 2040.
Table 4-3: Total Water Demands
Use Type
2020 2025 2030 2035 2040-opt
Single Family 5,101 5,148 5,196 5,244 5,293
Multi-Family 466 471 475 480 485
Commercial 453 467 483 498 515
Industrial 40 42 43 45 46
Institutional/Governmental 377 394 412 429 447
Landscape 757 782 807 835 863
Other 1 2 2 2 2
Losses 406 412 419 425 432
7,601 7,718 7,837 7,960 8,084
Additional Description (as needed)
Projected Water Use Report To the Extent that Records are Available
NOTES: 1. Volume is in AFY2. Potable demands only. Raw water is not used within the Simi Valley System. 3. Water use projected based on 2015 connection data, SCAG housing and employment growth rates, and 2008-2013 average water use factors. Losses are projected based on a historical average of 6 percent loss.
TOTAL
2015 2020 2025 2030 2035 2040 (opt)
Potable and Raw Water From Tables 4-1 and 4-2
5,340 7,601 7,718 7,837 7,960 8,084
Recycled Water Demand From Table 6-4
0 0 0 0 0 0
TOTAL WATER DEMAND 5,340 7,601 7,718 7,837 7,960 8,084
NOTES: 1. Volume is in AFY2. Potable water demands only. Raw water and recycled water are not used within the Simi Valley System.
Page 4-6 Final Draft, 2015 Urban Water Management Plan – Simi Valley Golden State Water Company
\\sac2\job\2015\1570027.00_gswc-2015 uwmp\09-reports\simi valley\09-reports\9.09-reports\3_final draft\simi valley_2015_uwmp-final draft.docx
4.2 Distribution System Water Losses
CWC 10631 (e)(1) Quantify, to the extent records are available, past and current water use over the same five-year increments
described in subdivision (a), and projected water use, identifying the uses among water use sectors, including, but not necessarily limited to, all of the following uses:...
(J) Distribution system water loss (3)(A) For the 2015 urban water management plan update, the distribution system water loss shall be quantified
for the most recent 12-month period available. For all subsequent updates, the distribution system water loss shall be quantified for each of the five years preceding the plan update.
(B) The distribution system water loss quantification shall be reported in accordance with a worksheet approved or developed by the department through a public process. The water loss quantification worksheet shall be based on the water system balance methodology developed by the American Water Works Association.
System losses must be incorporated when projecting total water demand. System losses are defined as the difference between annual water production and annual sales. Included are system losses due to leaks, reservoir overflows, or inaccurate meters, and other water used in operations such as system flushing and filter backwashing.
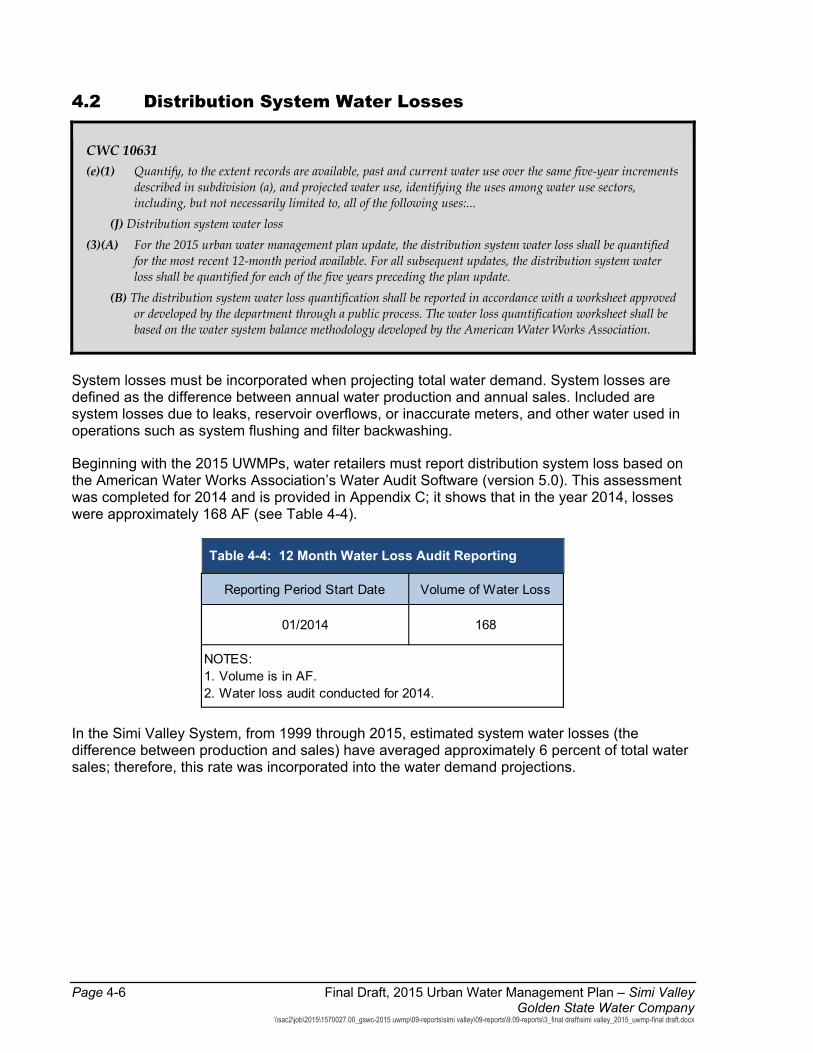
Beginning with the 2015 UWMPs, water retailers must report distribution system loss based on the American Water Works Association’s Water Audit Software (version 5.0). This assessment was completed for 2014 and is provided in Appendix C; it shows that in the year 2014, losses were approximately 168 AF (see Table 4-4).
Table 4-4: 12 Month Water Loss Audit Reporting
In the Simi Valley System, from 1999 through 2015, estimated system water losses (the difference between production and sales) have averaged approximately 6 percent of total water sales; therefore, this rate was incorporated into the water demand projections.
Reporting Period Start Date Volume of Water Loss
01/2014 168
NOTES: 1. Volume is in AF.2. Water loss audit conducted for 2014.
Final Draft, 2015 Urban Water Management Plan – Simi Valley Page 4-7 Golden State Water Company \\sac2\job\2015\1570027.00_gswc-2015 uwmp\09-reports\simi valley\09-reports\9.09-reports\3_final draft\simi valley_2015_uwmp-final draft.docx
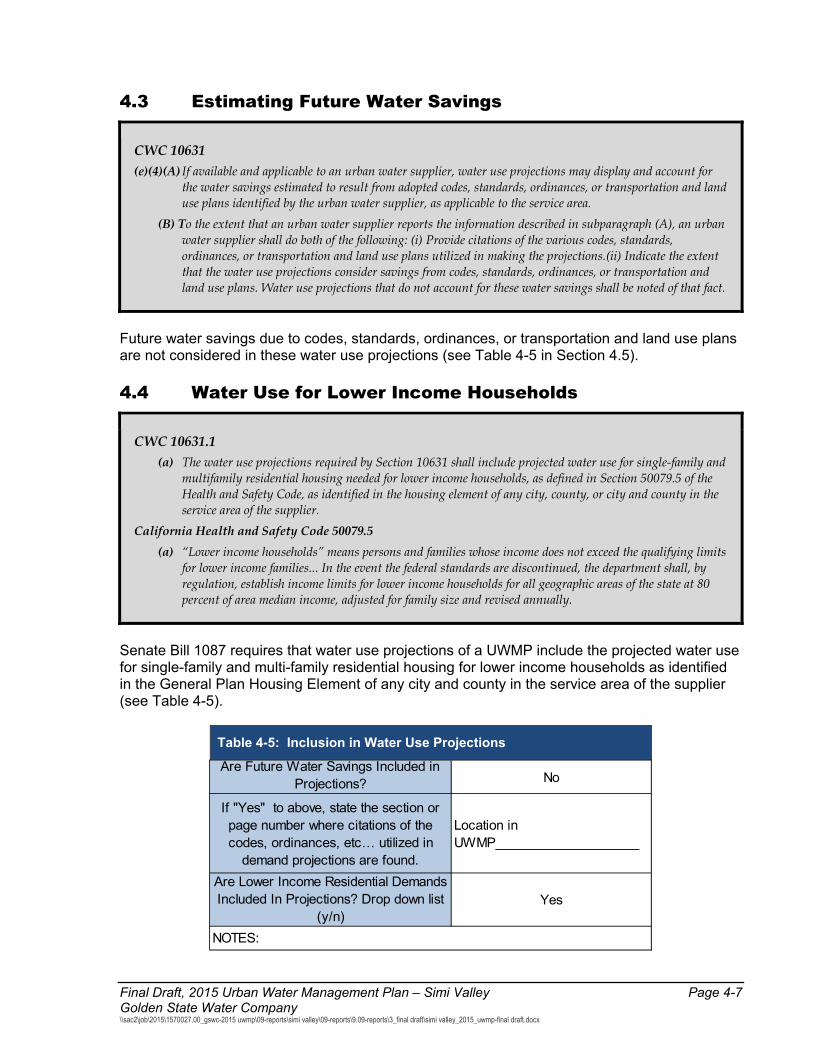
4.3 Estimating Future Water Savings
CWC 10631 (e)(4)(A) If available and applicable to an urban water supplier, water use projections may display and account for
the water savings estimated to result from adopted codes, standards, ordinances, or transportation and land use plans identified by the urban water supplier, as applicable to the service area.
(B) To the extent that an urban water supplier reports the information described in subparagraph (A), an urban water supplier shall do both of the following: (i) Provide citations of the various codes, standards, ordinances, or transportation and land use plans utilized in making the projections.(ii) Indicate the extent that the water use projections consider savings from codes, standards, ordinances, or transportation and land use plans. Water use projections that do not account for these water savings shall be noted of that fact.
Future water savings due to codes, standards, ordinances, or transportation and land use plans are not considered in these water use projections (see Table 4-5 in Section 4.5).
4.4 Water Use for Lower Income Households
CWC 10631.1 (a) The water use projections required by Section 10631 shall include projected water use for single-family and
multifamily residential housing needed for lower income households, as defined in Section 50079.5 of the Health and Safety Code, as identified in the housing element of any city, county, or city and county in the service area of the supplier.
California Health and Safety Code 50079.5 (a) “Lower income households” means persons and families whose income does not exceed the qualifying limits
for lower income families... In the event the federal standards are discontinued, the department shall, by regulation, establish income limits for lower income households for all geographic areas of the state at 80 percent of area median income, adjusted for family size and revised annually.
Senate Bill 1087 requires that water use projections of a UWMP include the projected water use for single-family and multi-family residential housing for lower income households as identified in the General Plan Housing Element of any city and county in the service area of the supplier (see Table 4-5).
Table 4-5: Inclusion in Water Use Projections
Are Future Water Savings Included in Projections? No
If "Yes" to above, state the section or page number where citations of the codes, ordinances, etc… utilized in
demand projections are found.
Location in UWMP____________________
Are Lower Income Residential Demands Included In Projections? Drop down list
(y/n)Yes
NOTES:

Page 4-8 Final Draft, 2015 Urban Water Management Plan – Simi Valley Golden State Water Company
\\sac2\job\2015\1570027.00_gswc-2015 uwmp\09-reports\simi valley\09-reports\9.09-reports\3_final draft\simi valley_2015_uwmp-final draft.docx
General Plan Housing Elements rely on the Regional Housing Needs Allocation (RHNA) generated by the State Department of Housing and Community Development (HCD) to allocate the regional need for housing to the regional Council of Governments (COG) (or a HCD for cities and counties not covered by a COG) for incorporation into housing element updates. Before the housing element is due, the HCD determines the total regional housing need for the next planning period for each region in the state and allocates that need. The COGs then allocate to each local jurisdiction its “fair share” of the RHNA, broken down by income categories; very low, low, moderate, and above moderate, over the housing element’s planning period.
The City of Simi Valley last updated its General Plan Housing Element in 2013. A lower income household is defined as a household with income that is 80 percent of median family income for that jurisdiction, adjusted for family size. The City’s Housing Element identifies the target number of low-income households in the unincorporated portions of the County from 2013-2021 as 16.6 percent and very low-income households as 24.7 percent. However, it is unknown what percentage of the low-income and very low-income households are within GSWC’s Simi Valley service area. For this reason, it is not possible to project water use for lower income households separately from overall residential demand. However, to remain consistent with the intent of the SB-1087 legislation and to comply with the UWMP Act, an effort has been made to identify those water use projections for future single and multi-family households based on the aggregate percentage of both the low-income and very low-income categories. The total of low-income and very low income housing need of 41.2 percent was used to estimate demand projections as shown in Table 4-6.
Table 4-6: Low-Income Projected Water Demands
2015 2020 2025 2030 2035
Single-Family Residence 582 602 622 642 662
Multi-Family Residence 43 45 47 49 51
Total 625 647 668 690 712
NOTES: Units in AFY GSWC will not deny or conditionally approve water services, or reduce the amount of services applied for by a proposed development that includes housing units affordable to lower income households unless one of the following occurs:
GSWC specifically finds that it does not have sufficient water supply.
GSWC is subject to a compliance order issued by the State Department of Public Health that prohibits new water connections.
The applicant has failed to agree to reasonable terms and conditions relating to the provision of services.
Final Draft, 2015 Urban Water Management Plan – Simi Valley Page 5-1 Golden State Water Company \\sac2\job\2015\1570027.00_gswc-2015 uwmp\09-reports\simi valley\09-reports\9.09-reports\3_final draft\simi valley_2015_uwmp-final draft.docx
Chapter 5: SBX7-7 Baselines and Targets
The Water Conservation Bill of 2009 (SBX7-7) is one of four policy bills enacted as part of the November 2009 Comprehensive Water Package (Special Session Policy Bills and Bond Summary). The Water Conservation Bill of 2009 provides the regulatory framework to support the statewide reduction in urban per capita water use described in the 20 by 2020 Water Conservation Plan (DWR 2010). Consistent with SBX7-7, each retail water supplier must determine and report its existing baseline water consumption and establish water use targets in gallons per capita per day (GPCD), and compare actual water use against the target; reporting began with the 2010 UWMP.
In the 2015 UWMP retail water agencies must demonstrate compliance with the target established for 2015 and demonstrate that the agency is on track to achieve its 2020 target. Compliance is done through completion of the DWR SBX7-7 Verification Tables submitted as Appendix D of the 2015 UWMP.
5.1 Guidance for Wholesale Agencies
For purposes of identifying baselines and targets, the following definition applies:
CWC 10608.12 (r) “Urban wholesale water supplier” means a water supplier, either publicly or privately owned, that provides
more than 3,000 acre-feet of water annually at wholesale for potable municipal purposes.
CWC 10608.36 Urban wholesale water suppliers shall include in the urban water management plans. an assessment of their present and proposed future measures, programs, and policies to help achieve the water use reductions required by this part.
The Simi Valley System does not supply wholesale water; however, the Calleguas Municipal Water District supplies the Simi Valley System with wholesale water. GSWC will provide Calleguas Municipal Water District with current and projected water demands and SBX7-7 targets, to aid in their assessment of present and future water conservation measures, programs, and policies.
5.2 Updating Calculations from 2010 UWMP
CWC 10608.20 (g) An urban retail water supplier may update its 2020 urban water use target in its 2015 urban water
management plan required pursuant to Part 2.6 (commencing with Section 10610). Methodologies DWR 2011, Methodology 2 Service Area Population Page 27 - Water suppliers may revise population estimates for baseline years between 2000 and 2010 when 2010 census information becomes available. DWR will examine discrepancy between the actual population estimate and DOF's projections for 2010; if significant discrepancies are discovered, DWR may require some or all suppliers to update their baseline population estimates.
Page 5-2 Final Draft, 2015 Urban Water Management Plan – Simi Valley Golden State Water Company
\\sac2\job\2015\1570027.00_gswc-2015 uwmp\09-reports\simi valley\09-reports\9.09-reports\3_final draft\simi valley_2015_uwmp-final draft.docx
The Simi Valley System first reported its Baseline Daily Per Capita Water Use (Baseline GPCD) in its 2010 UWMP; however, at the time the 2010 UWMP was prepared, complete 2010 Census data was not available. Therefore, for the 2015 UWMP, the Simi Valley System is required to recalculate baseline and target water use using 2010 Census data. The following sections summarize the calculations, which can be found in Attachment D.
5.3 Baseline Periods
CWC 10608.20 (e) An urban retail water supplier shall include in its urban water management plan due in 2010. . . the
baseline daily per capita water use...along with the bases for determining those estimates, including references to supporting data.
(g) An urban retail water supplier may update its 2020 urban water use target in its 2015 urban water management plan required pursuant to Part 2.6 (commencing with Section 10610).
Two water use baselines must be calculated prior to establishing target conservation water use. The first baseline is the average gross water use for a continuous period ending no earlier than December 31, 2004 and no later than December 31, 2010. This default baseline period is 10 years. If at least ten percent of the 2008 gross water use was met by recycled water, then this baseline period may be extended to include an additional 5 years. The Simi Valley System did not use recycled water in 2008, therefore the first baseline period for the Simi Valley System is 10 years from 1999 to 2008.
The second baseline must be the average gross water use for a continuous 5-year period ending no earlier than December 31, 2007 and no later than December 31, 2010. The Simi Valley System 5-year baseline is from 2003 to 2007.
5.4 Service Area Population
CWC 10608.20 (e) An urban retail water supplier shall include in its urban water management plan due in 2010.the baseline
per capita water use,...along with the bases for determining those estimates, including references to supporting data.
(f) When calculating per capita values for the purposes of this chapter, an urban retail water supplier shall determine population using federal, state, and local population reports and projections.
CWC10644 (a)(2) The plan...shall include any standardized forms, tables or displays specified by the department.
In order to calculate Base Daily Per Capita Water Use for past years, it was necessary to develop population estimates for the past years. The population for the Simi Valley System was calculated for 2010 and 2015 using the DWR online population tool. This was accomplished using a Geographic Information System (GIS) interface to derive population. By adding shape files for the entity service area boundaries or public water system boundary in 2010, population is derived using U.S. Census Bureau census tract data from that census year. Then, along with Simi Valley System production and service connections, the DWR population tool derives a persons-per-connection number, which is used to determine population in the intervening years between 1990 and 2010.
Final Draft, 2015 Urban Water Management Plan – Simi Valley Page 5-3 Golden State Water Company \\sac2\job\2015\1570027.00_gswc-2015 uwmp\09-reports\simi valley\09-reports\9.09-reports\3_final draft\simi valley_2015_uwmp-final draft.docx
The historic population presented in Chapter 3 was estimated using the DWR Population Tool. The population for the baseline period used for calculating the Baseline GPCD can be found in SBX7-7 Verification Table 3 in Appendix D. See Appendix E for the DWR Population Tool inputs and outputs.
5.5 Gross Water Use
CWC 10608.12 (g) “Gross Water Use” means the total volume of water, whether treated or untreated, entering the
distribution system of an urban retail water supplier, excluding all of the following: (1) Recycled water that is delivered within the service area of an urban retail water supplier or its urban
wholesale water supplier (2) The net volume of water that the urban retail water supplier places into long term storage (3) The volume of water the urban retail water supplier conveys for use by another urban water supplier (4) The volume of water delivered for agricultural use, except as otherwise provided in subdivision (f) of
Section 10608.24. California Code of Regulations Title 23 Division 2 Chapter 5.1 Article Section 596 (a) An urban retail water supplier that has a substantial percentage of industrial water use in its service area is eligible to exclude the process water use of existing industrial water customers from the calculation of its gross water use to avoid a disproportionate burden on another customer sector.
The Base Daily Water Use calculation is based on gross water use by an agency in each year and can be based on a ten-year average ending no earlier than 2004 and no later than 2010, or a 15-year average if ten percent of 2008 demand was met by recycled water. Base Daily Water Use must account for all water sent to retail customers, excluding:
Recycled water
Water sent to another water agency
Water that went into storage
It is at an agency’s discretion whether or not to exclude agricultural water use from the Base Daily Water Use Calculation. If agricultural water use is excluded from the Base Daily Water Use calculation it must also be excluded from the calculation of actual water use in later urban water management plans. The Simi Valley System did not supply water to agriculture during the period 1995 to 2010 and so agricultural water does not factor into the Simi Valley System’s SBX7-7 calculations.
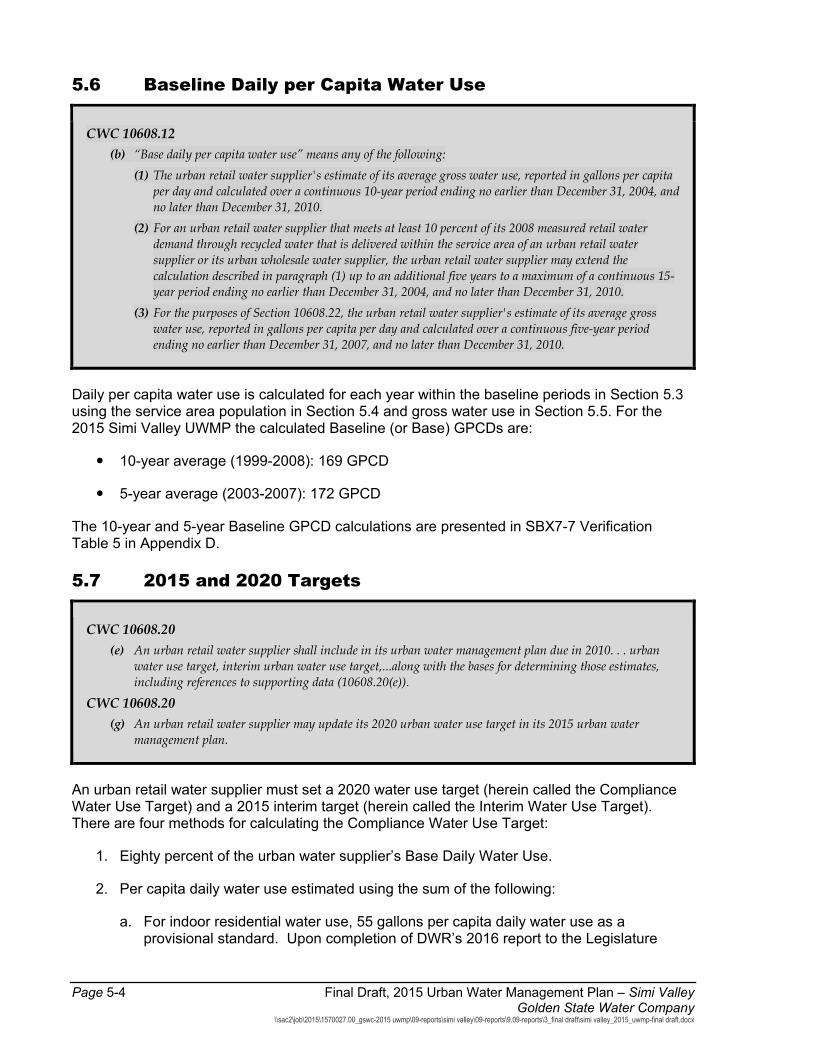
Page 5-4 Final Draft, 2015 Urban Water Management Plan – Simi Valley Golden State Water Company
\\sac2\job\2015\1570027.00_gswc-2015 uwmp\09-reports\simi valley\09-reports\9.09-reports\3_final draft\simi valley_2015_uwmp-final draft.docx
5.6 Baseline Daily per Capita Water Use
CWC 10608.12 (b) “Base daily per capita water use” means any of the following:
(1) The urban retail water supplier's estimate of its average gross water use, reported in gallons per capita per day and calculated over a continuous 10-year period ending no earlier than December 31, 2004, and no later than December 31, 2010.
(2) For an urban retail water supplier that meets at least 10 percent of its 2008 measured retail water demand through recycled water that is delivered within the service area of an urban retail water supplier or its urban wholesale water supplier, the urban retail water supplier may extend the calculation described in paragraph (1) up to an additional five years to a maximum of a continuous 15-year period ending no earlier than December 31, 2004, and no later than December 31, 2010.
(3) For the purposes of Section 10608.22, the urban retail water supplier's estimate of its average gross water use, reported in gallons per capita per day and calculated over a continuous five-year period ending no earlier than December 31, 2007, and no later than December 31, 2010.
Daily per capita water use is calculated for each year within the baseline periods in Section 5.3 using the service area population in Section 5.4 and gross water use in Section 5.5. For the 2015 Simi Valley UWMP the calculated Baseline (or Base) GPCDs are:
10-year average (1999-2008): 169 GPCD
5-year average (2003-2007): 172 GPCD
The 10-year and 5-year Baseline GPCD calculations are presented in SBX7-7 Verification Table 5 in Appendix D.
5.7 2015 and 2020 Targets
CWC 10608.20 (e) An urban retail water supplier shall include in its urban water management plan due in 2010. . . urban
water use target, interim urban water use target,...along with the bases for determining those estimates, including references to supporting data (10608.20(e)).
CWC 10608.20 (g) An urban retail water supplier may update its 2020 urban water use target in its 2015 urban water
management plan.
An urban retail water supplier must set a 2020 water use target (herein called the Compliance Water Use Target) and a 2015 interim target (herein called the Interim Water Use Target). There are four methods for calculating the Compliance Water Use Target:
1. Eighty percent of the urban water supplier’s Base Daily Water Use.
2. Per capita daily water use estimated using the sum of the following:
a. For indoor residential water use, 55 gallons per capita daily water use as a provisional standard. Upon completion of DWR’s 2016 report to the Legislature
Final Draft, 2015 Urban Water Management Plan – Simi Valley Page 5-5 Golden State Water Company \\sac2\job\2015\1570027.00_gswc-2015 uwmp\09-reports\simi valley\09-reports\9.09-reports\3_final draft\simi valley_2015_uwmp-final draft.docx
reviewing progress toward achieving the statewide 20 percent reduction target, this standard may be adjusted by the Legislature by statute.
b. For landscape irrigated through dedicated or residential meters or connections, water use efficiency equivalent to the standards of the Model Water Efficient Landscape Ordinance set forth in section 490 et seq. of Title 23 of the California Code of Regulations, as in effect the later of the year of the landscape’s installation or 1992.
c. For CII uses, a ten percent reduction in water use from the baseline commercial, industrial, and institutional/government water use by 2020.
3. Ninety-five percent of the applicable state hydrologic region target as stated in the state’s April 30, 2009, draft 20 by 2020 Water Conservation Plan. The Simi Valley System falls within the South Coast Region (target for this region is 142 GPCD).
4. Reduce the 10 or 15-year Base Daily Per Capita Water Use a specific amount for different water sectors:
a. Indoor residential water use to be reduced by 15 GPCD or an amount determined by use of DWR’s “BMP Calculator”.
b. A 20 percent savings on all unmetered uses.
c. A 10 percent savings on baseline CII use.
d. A 21.6 percent savings on current landscape and water loss uses.
The Simi Valley System’s 2010 UWMP used Compliance Method 1 to set the Compliance Water Use Target. For the 2015 UWMP, the GSWC will change its selected compliance methodology for the Simi Valley System and use Compliance Method 3 with a 2020 compliance target of 142 GPCD (see SBX7-7 Verification Table 7-E in Appendix D).
5.7.1 5-Year Baseline – 2020 Target Confirmation
CWC 10608.22 Notwithstanding the method adopted by an urban retail water supplier pursuant to Section 10608.20, an urban retail water supplier's per capita daily water use reduction shall be no less than 5 percent of base daily per capita water use as defined in paragraph (3) of subdivision (b) of Section 10608.12. This section does not apply to an urban retail water supplier with a base daily per capita water use at or below 100 gallons per capita per day.
The selected Compliance Water Use Target must be compared against what DWR calls the “Maximum Allowable GPCD”. The Maximum Allowable GPCD is based on 95 percent of a 5-year average base gross water use ending no earlier than 2007 and no later than 2010. The Maximum Allowable GPCD use is used to determine whether a supplier’s 2015 and 2020 per capita water use targets meet the minimum water use reduction of the SBX7-7 legislation. If an agency’s Compliance Water Use Target is higher than the Maximum Allowable GPCD, the agency must instead use the Maximum Allowable GPCD as its target.
The minimum retail water use reduction compliance target is calculated as 95 percent of the 5-year Baseline GPCD, or 164 GPCD, which is above the selected compliance target of 142
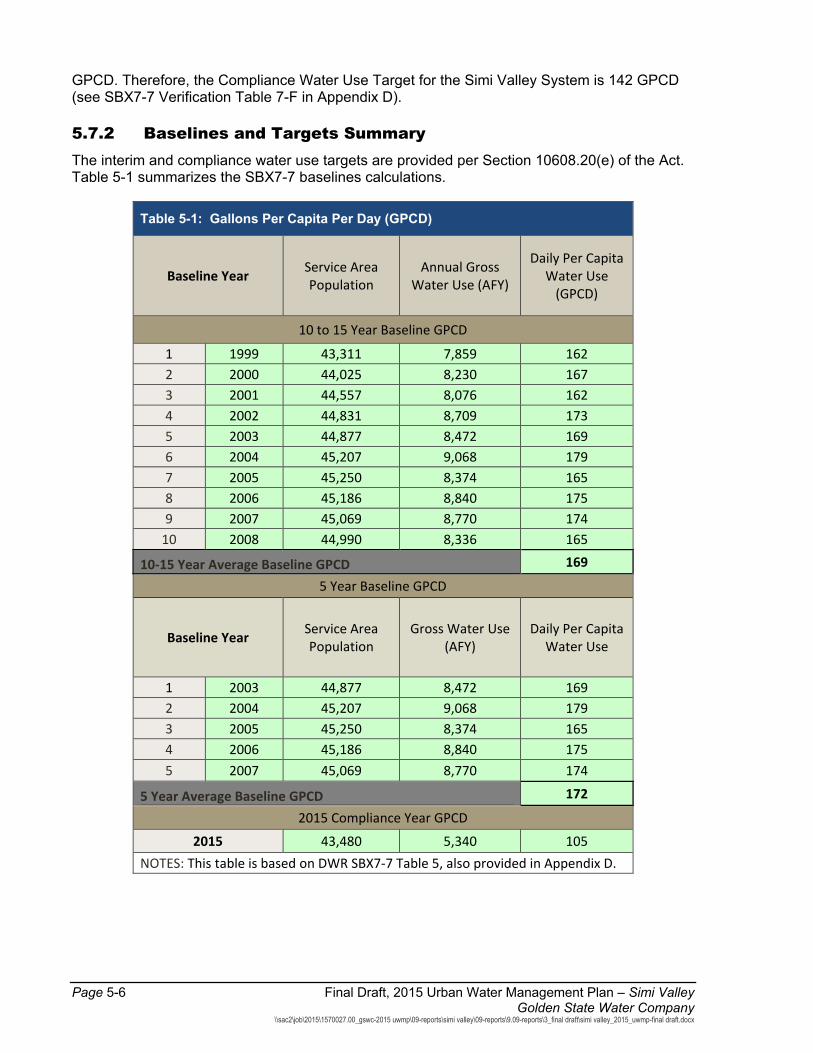
Page 5-6 Final Draft, 2015 Urban Water Management Plan – Simi Valley Golden State Water Company
\\sac2\job\2015\1570027.00_gswc-2015 uwmp\09-reports\simi valley\09-reports\9.09-reports\3_final draft\simi valley_2015_uwmp-final draft.docx
GPCD. Therefore, the Compliance Water Use Target for the Simi Valley System is 142 GPCD (see SBX7-7 Verification Table 7-F in Appendix D).
5.7.2 Baselines and Targets Summary The interim and compliance water use targets are provided per Section 10608.20(e) of the Act. Table 5-1 summarizes the SBX7-7 baselines calculations.
Table 5-1: Gallons Per Capita Per Day (GPCD)
Baseline Year Service Area Population
Annual Gross Water Use (AFY)
Daily Per Capita Water Use
(GPCD)
10 to 15 Year Baseline GPCD
1 1999 43,311 7,859 162 2 2000 44,025 8,230 167 3 2001 44,557 8,076 162 4 2002 44,831 8,709 173 5 2003 44,877 8,472 169 6 2004 45,207 9,068 179 7 2005 45,250 8,374 165 8 2006 45,186 8,840 175 9 2007 45,069 8,770 174
10 2008 44,990 8,336 165
10-15 Year Average Baseline GPCD 169
5 Year Baseline GPCD
Baseline Year Service Area Population
Gross Water Use (AFY)
Daily Per Capita Water Use
1 2003 44,877 8,472 169 2 2004 45,207 9,068 179 3 2005 45,250 8,374 165 4 2006 45,186 8,840 175 5 2007 45,069 8,770 174
5 Year Average Baseline GPCD 172
2015 Compliance Year GPCD
2015 43,480 5,340 105 NOTES: This table is based on DWR SBX7-7 Table 5, also provided in Appendix D.
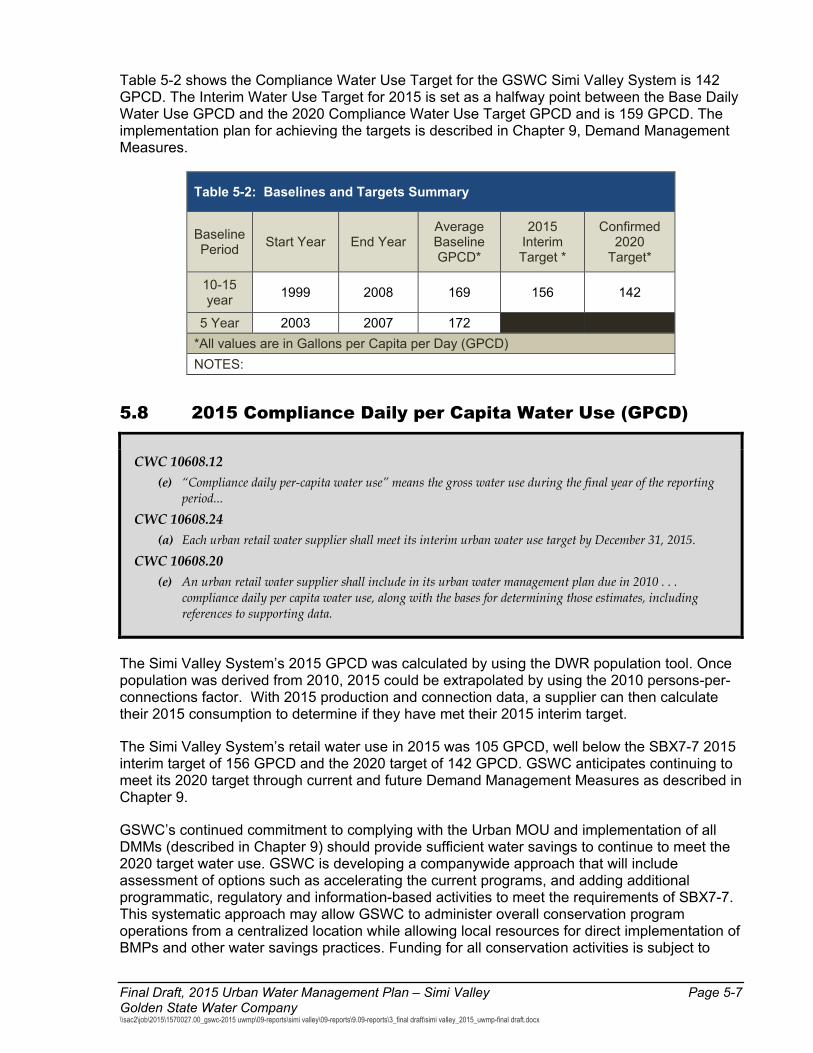
Final Draft, 2015 Urban Water Management Plan – Simi Valley Page 5-7 Golden State Water Company \\sac2\job\2015\1570027.00_gswc-2015 uwmp\09-reports\simi valley\09-reports\9.09-reports\3_final draft\simi valley_2015_uwmp-final draft.docx
Table 5-2 shows the Compliance Water Use Target for the GSWC Simi Valley System is 142 GPCD. The Interim Water Use Target for 2015 is set as a halfway point between the Base Daily Water Use GPCD and the 2020 Compliance Water Use Target GPCD and is 159 GPCD. The implementation plan for achieving the targets is described in Chapter 9, Demand Management Measures.
Table 5-2: Baselines and Targets Summary
Baseline Period Start Year End Year
Average Baseline GPCD*
2015 Interim Target *
Confirmed 2020
Target*
10-15 year 1999 2008 169 156 142
5 Year 2003 2007 172 *All values are in Gallons per Capita per Day (GPCD) NOTES:
5.8 2015 Compliance Daily per Capita Water Use (GPCD)
CWC 10608.12 (e) “Compliance daily per-capita water use” means the gross water use during the final year of the reporting
period...
CWC 10608.24 (a) Each urban retail water supplier shall meet its interim urban water use target by December 31, 2015.
CWC 10608.20 (e) An urban retail water supplier shall include in its urban water management plan due in 2010 . . .
compliance daily per capita water use, along with the bases for determining those estimates, including references to supporting data.
The Simi Valley System’s 2015 GPCD was calculated by using the DWR population tool. Once population was derived from 2010, 2015 could be extrapolated by using the 2010 persons-per-connections factor. With 2015 production and connection data, a supplier can then calculate their 2015 consumption to determine if they have met their 2015 interim target.
The Simi Valley System’s retail water use in 2015 was 105 GPCD, well below the SBX7-7 2015 interim target of 156 GPCD and the 2020 target of 142 GPCD. GSWC anticipates continuing to meet its 2020 target through current and future Demand Management Measures as described in Chapter 9.
GSWC’s continued commitment to complying with the Urban MOU and implementation of all DMMs (described in Chapter 9) should provide sufficient water savings to continue to meet the 2020 target water use. GSWC is developing a companywide approach that will include assessment of options such as accelerating the current programs, and adding additional programmatic, regulatory and information-based activities to meet the requirements of SBX7-7. This systematic approach may allow GSWC to administer overall conservation program operations from a centralized location while allowing local resources for direct implementation of BMPs and other water savings practices. Funding for all conservation activities is subject to
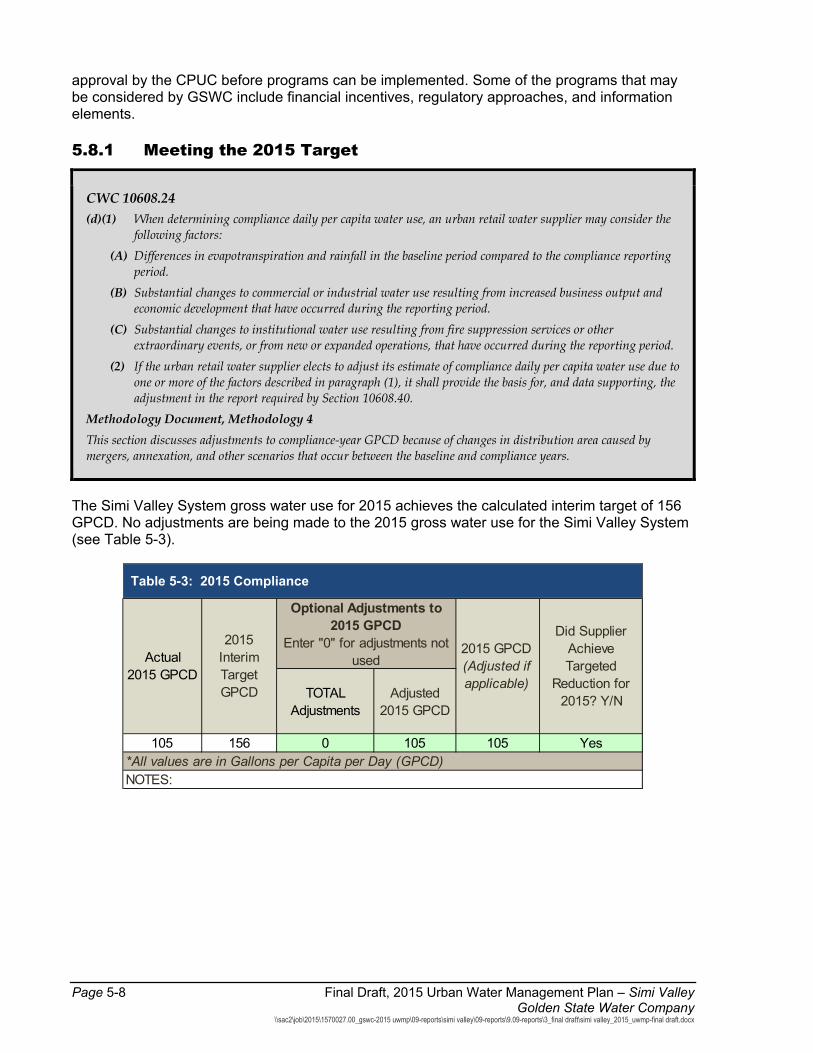
Page 5-8 Final Draft, 2015 Urban Water Management Plan – Simi Valley Golden State Water Company
\\sac2\job\2015\1570027.00_gswc-2015 uwmp\09-reports\simi valley\09-reports\9.09-reports\3_final draft\simi valley_2015_uwmp-final draft.docx
approval by the CPUC before programs can be implemented. Some of the programs that may be considered by GSWC include financial incentives, regulatory approaches, and information elements.
5.8.1 Meeting the 2015 Target
CWC 10608.24 (d)(1) When determining compliance daily per capita water use, an urban retail water supplier may consider the
following factors: (A) Differences in evapotranspiration and rainfall in the baseline period compared to the compliance reporting
period. (B) Substantial changes to commercial or industrial water use resulting from increased business output and
economic development that have occurred during the reporting period. (C) Substantial changes to institutional water use resulting from fire suppression services or other
extraordinary events, or from new or expanded operations, that have occurred during the reporting period. (2) If the urban retail water supplier elects to adjust its estimate of compliance daily per capita water use due to
one or more of the factors described in paragraph (1), it shall provide the basis for, and data supporting, the adjustment in the report required by Section 10608.40.
Methodology Document, Methodology 4 This section discusses adjustments to compliance-year GPCD because of changes in distribution area caused by mergers, annexation, and other scenarios that occur between the baseline and compliance years.
The Simi Valley System gross water use for 2015 achieves the calculated interim target of 156 GPCD. No adjustments are being made to the 2015 gross water use for the Simi Valley System (see Table 5-3).
Table 5-3: 2015 Compliance
TOTAL Adjustments
Adjusted 2015 GPCD
105 156 0 105 105 Yes*All values are in Gallons per Capita per Day (GPCD) NOTES:
Actual 2015 GPCD
2015 Interim Target GPCD
Optional Adjustments to 2015 GPCD
Enter "0" for adjustments not used
2015 GPCD (Adjusted if applicable)
Did Supplier Achieve Targeted
Reduction for 2015? Y/N

Final Draft, 2015 Urban Water Management Plan – Simi Valley Page 6-1 Golden State Water Company \\sac2\job\2015\1570027.00_gswc-2015 uwmp\09-reports\simi valley\09-reports\9.09-reports\3_final draft\simi valley_2015_uwmp-final draft.docx
Chapter 6: System Supplies
This chapter addresses the water supply sources of the Simi Valley System of GSWC. GSWC currently obtains its water supply for the Simi Valley System from imported water and groundwater. Imported water is purchased from the Calleguas Municipal Water District (Calleguas).
6.1 Purchased or Imported Water The Simi Valley System purchases treated water from Calleguas. Calleguas’ water supply sources include imported water, groundwater, and reclaimed wastewater. Imported water is supplied by Metropolitan Water District of Southern California (Metropolitan) via the West Valley Feeder No. 2 Pipeline. Calleguas’ sole connection to Metropolitan is located in the City of Chatsworth at Calleguas’ East Portal Facility. From this point, water is conveyed by Calleguas 1.39 miles through the Perliter Tunnel into Simi Valley, where it is distributed through the Calleguas transmission system, injected into the Las Posas aquifer, or stored in Lake Bard. Lake Bard is located at the west end of the valley and serves as a reserve source of supply in the event that the connection between Calleguas and Metropolitan is disrupted. Water provided to Calleguas is treated by Metropolitan at the Jensen Water Treatment Plant (JWTP) before being supplied to the Simi Valley System. Water stored in Lake Bard is treated before being supplied during the summer months to supplement imported Metropolitan deliveries. GSWC accounted for 6.1 percent of Callequas’ water deliveries in 2015 (Calleguas 2016).
Water imported from Calleguas is delivered to the Simi Valley System through the following connections in gallons per minute (gpm):
Fitzgerald connection with a capacity of 7,200 gpm (pumping capacity of 1,200 gpm).
Rebecca connection with a capacity of 3,200 gpm (pumping capacity 3,000 gpm).
Tapo connection with a capacity of 3,200 gpm (pumping capacity of 3,300 gpm).
Sycamore connection with a capacity of 8,000 gpm (pumping capacity of 6,600 gpm).
Katherine connection with a capacity of 2,160 gpm (pumping capacity of 1,600 gpm).
These connections have a combined active design capacity of 23,760 gpm (38,325 AFY). Total pumping capacities from these connections are 15,700 gpm (25,324 AFY). Between 2011 and 2015, purchased water quantities ranged from 5,243 AF to 6,873 AF. It should be noted that the connection capacity to deliver imported water to GSWC is significantly higher than the projected imported water supply required to meet normal year demands.
GSWC signed a purchase order with Calleguas for the purchase of 44,157.97 AF over 9 years beginning in 2004. The order provided GSWC with an initial base supply of 8,177 AFY from Calleguas. The purchased order expired on 12/31/2012. On November 28, 2012, Calleguas amended Ordinance No. 12, which covers the rules and regulations for water service to member agencies within Calleguas Municipal Water District. As part of Ordinance No. 12, Calleguas sets an annual Tier 1 limit based on a 10-year Peak Year Demand. For 2015, the new Initial Base Demand was set at 8,278.5 AFY. Tier 2 Supply Rate applies to all water purchases in excess of the Tier 1 Annual Maximum in a given calendar year.
Page 6-2 Final Draft, 2015 Urban Water Management Plan – Simi Valley Golden State Water Company
\\sac2\job\2015\1570027.00_gswc-2015 uwmp\09-reports\simi valley\09-reports\9.09-reports\3_final draft\simi valley_2015_uwmp-final draft.docx
The main water quality concerns for the water imported from Calleguas are related to the water supply source. The water quality is generally excellent; however, it is affected by seawater intrusion and agricultural drainage from peat soil islands in the Sacramento-San Joaquin River Delta. The water quality parameters that are of particular importance include total organic carbon (TOC), bromide, and salinity. Increased TOC and bromide levels may lead to increased concentrations of disinfection byproducts, and an increase in salinity will reduce the amount of groundwater that the Simi Valley System can utilize. The groundwater pumped in the Simi Valley System is blended with water purchased from Calleguas to reduce the high level of total dissolved solids (TDS) to acceptable levels. If salinity increases in the water imported from Calleguas, the volume of the higher TDS groundwater will need to be reduced in order to maintain a consistent quality of water.
The imported water is required to meet all drinking water standards as it leaves the JWTP treatment plant, and Calleguas is responsible for complying with all required water treatment regulations for this imported water; GSWC is responsible for parameters monitored in the distribution system (such as disinfectant by-products).
6.2 Groundwater The Simi Valley System is supplied by two GSWC-owned wells in the Simi Valley Groundwater Basin (Basin).
6.2.1 Basin Description
CWC 10631 (b) If groundwater is identified as an existing or planned source of water available to the supplier, all of the
following information shall be included in the plan: (2) A description of any groundwater basin or basins from which the urban water supplier pumps
groundwater.
The Simi Valley Groundwater Basin has a surface area of approximately 12,100 acres (19 square miles), shown on Figure 6-1. It is bound by the Santa Susana Mountains on the north and northeast, by the Simi Fault on the south, and by the Simi Hills on the southwest.
The Basin’s primary water-bearing unit is unconfined alluvium, which is locally confined on the western side of the Basin due to the presence of a clay lens. The alluvium generally consists of gravels, sands, and clays (DWR, 2004). Recharge to the Basin is from precipitation, seepage from minor streams, minor subsurface recharge from surrounding semi-permeable formations, and percolation from irrigation. Groundwater tends to flow westerly in the Basin. Historically, water levels in the Simi Basin have remained steady or risen since 1980 (DWR, 2004). Storage capacity for the Basin is about 180,000 acre-feet (AF). In 1999, it was estimated the Basin was 95 percent full (DWR, 2004).
Total groundwater extractions in the Simi Valley Basin have been estimated at approximately 5,500 AFY (Panaro, 2000). Much of this groundwater production, however, is a result of the City of Simi Valley’s dewatering program. The City operates several dewatering wells in the western portion of the valley to lower the groundwater table and relieve nuisance water. Since this water is typically high in TDS, it is discharged to the Arroyo Simi.
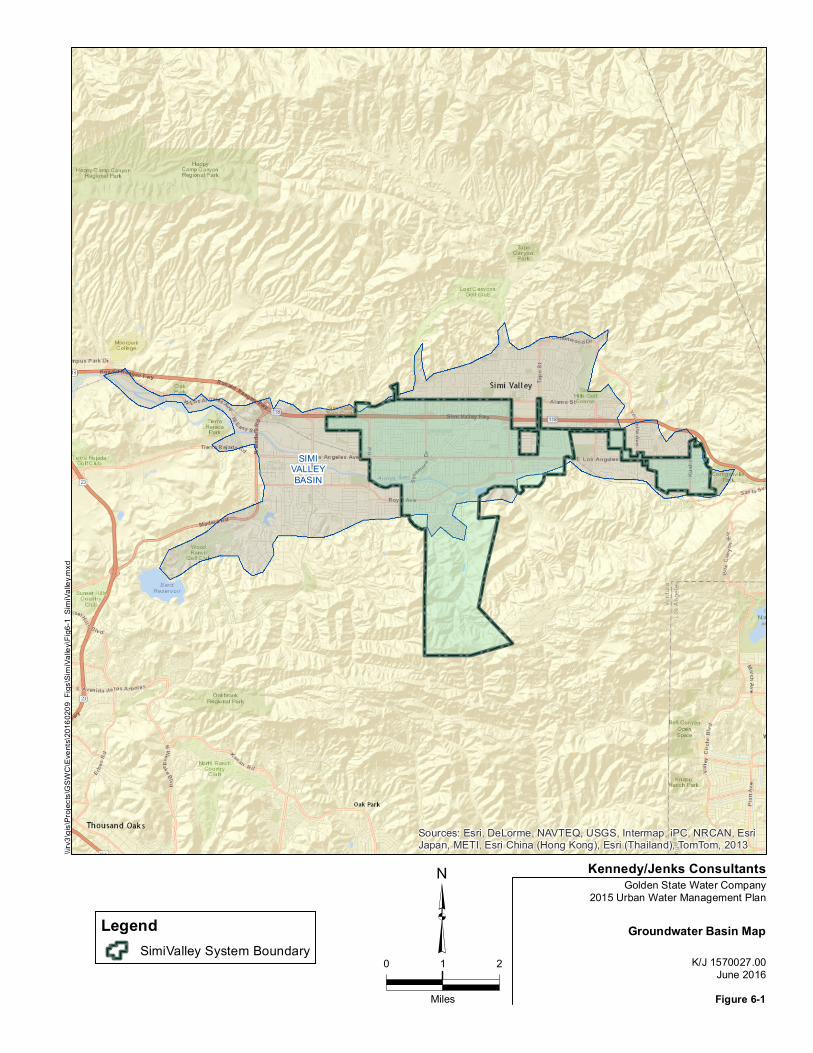
SIMIVALLEYBASIN
Sources: Esri, DeLorme, NAVTEQ, USGS, Intermap, iPC, NRCAN, EsriJapan, METI, Esri China (Hong Kong), Esri (Thailand), TomTom, 2013
³0 21
Miles
Golden State Water Company2015 Urban Water Management Plan
Groundwater Basin Map
K/J 1570027.00June 2016Figure 6-1
Kennedy/Jenks Consultants
LegendSimiValley System Boundary
\\irv3
\gis\P
rojec
ts\GS
WC\
Even
ts\20
1602
09_F
igs\Si
miVa
lley\F
ig6-1_
SimiVa
lley.m
xd
Page 6-4 Final Draft, 2015 Urban Water Management Plan – Simi Valley Golden State Water Company
\\sac2\job\2015\1570027.00_gswc-2015 uwmp\09-reports\simi valley\09-reports\9.09-reports\3_final draft\simi valley_2015_uwmp-final draft.docx
The safe yield of the Simi Valley Basin is estimated to be 6,100 AFY (SWRB, 1953). Historically, the Simi Valley System has reliably produced over 1,000 AFY of groundwater. GSWC’s groundwater extractions from through 2040 are projected to be 840 AFY, consistent with the recent average.
The groundwater wells in the Simi Valley System meet all current California Title 22 drinking water standards before water is delivered to customers. The main water quality concerns for groundwater in the Simi Valley System are TDS, chloride, salinity, nitrate, PCE, and perchlorate. Due to concentrations of some of these constituents at levels near to or exceeding current or proposed regulatory limits, groundwater is blended with treated surface water imported from Calleguas before distribution to the System. If salinity increases in the water imported from Calleguas, the volume of groundwater with high TDS will need to be reduced in order to maintain a consistent quality of water. Groundwater blending occurs at the Niles Blending Station and utilizes either Niles Well No. 1 or Sycamore Well No. 3.
The TDS and chloride levels in the Basin generally increase towards the western portion of the Basin. TDS and chloride in Niles Well No. 1 are approximately 400 mg/L and 130 mg/L, respectively. TDS and chloride in the Sycamore Well No. 3 are approximately 2,000 mg/L and 160 mg/L, respectively. TDS and chloride in dewatering wells located in the west side of the basin are in the range of 3,300 mg/L and 190 mg/L, respectively.
Nitrate concentrations have been measured above the Maximum Contaminant Level (MCL) of 45 mg/L in both the Sycamore Well and the Niles Well. Monitoring results indicate that nitrate concentrations in the blended water are well below the MCL.
Trace levels of both PCE and perchlorate have been detected in both wells. These detections are characterized as trace level since the concentrations are measured at or very near the detection limits of the current analytical methods. In both cases the concentrations observed are well below the respective MCLs. It is important to note that all groundwater is blended with water imported from Calleguas before distribution to the Simi Valley System. Monitoring results indicate that perchlorate and PCE concentrations in the blended water are non-detect.
6.2.2 Groundwater Management
CWC 10631 (b) ...If groundwater is identified as an existing or planned source of water available to the supplier, all of the
following information shall be included in the plan: (1) A copy of any groundwater management plan adopted by the urban water supplier... or any other
specific authorization for groundwater management. (2) ...For basins that a court or the board has adjudicated the rights to pump groundwater, a copy of the
order or decree adopted by the court or the board and a description of the amount of groundwater the urban water supplier has the legal right to pump under the order or decree.
The Simi Valley Basin is not managed or adjudicated. Under the Sustainable Groundwater Management Act of 2014 (SGMA), the basin priority is ranked low and thus is not required to be managed by a groundwater sustainability agency under SGMA. Significant changes to the management of the basin are therefore not expected as a result of the SGMA.
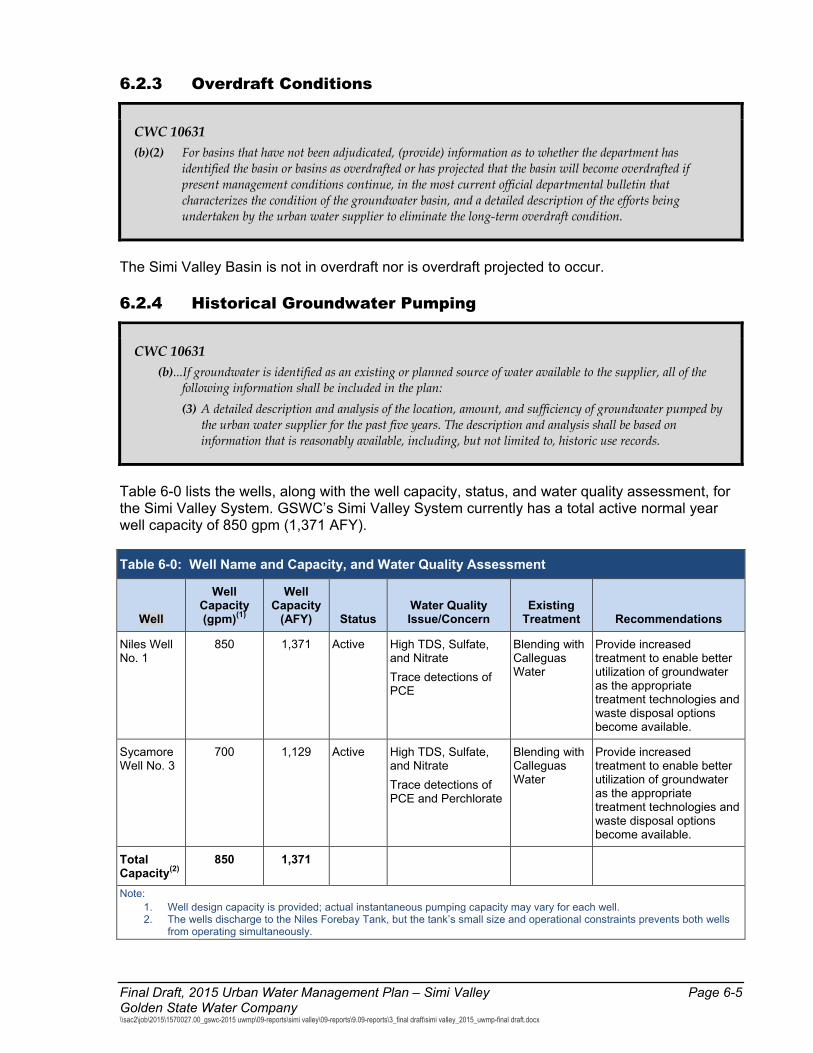
Final Draft, 2015 Urban Water Management Plan – Simi Valley Page 6-5 Golden State Water Company \\sac2\job\2015\1570027.00_gswc-2015 uwmp\09-reports\simi valley\09-reports\9.09-reports\3_final draft\simi valley_2015_uwmp-final draft.docx
6.2.3 Overdraft Conditions
CWC 10631 (b)(2) For basins that have not been adjudicated, (provide) information as to whether the department has
identified the basin or basins as overdrafted or has projected that the basin will become overdrafted if present management conditions continue, in the most current official departmental bulletin that characterizes the condition of the groundwater basin, and a detailed description of the efforts being undertaken by the urban water supplier to eliminate the long-term overdraft condition.
The Simi Valley Basin is not in overdraft nor is overdraft projected to occur.
6.2.4 Historical Groundwater Pumping
CWC 10631 (b)...If groundwater is identified as an existing or planned source of water available to the supplier, all of the
following information shall be included in the plan: (3) A detailed description and analysis of the location, amount, and sufficiency of groundwater pumped by
the urban water supplier for the past five years. The description and analysis shall be based on information that is reasonably available, including, but not limited to, historic use records.
Table 6-0 lists the wells, along with the well capacity, status, and water quality assessment, for the Simi Valley System. GSWC’s Simi Valley System currently has a total active normal year well capacity of 850 gpm (1,371 AFY).
Table 6-0: Well Name and Capacity, and Water Quality Assessment
Well
Well Capacity (gpm)(1)
Well Capacity
(AFY) Status Water Quality Issue/Concern
Existing Treatment Recommendations
Niles Well No. 1
850 1,371 Active High TDS, Sulfate, and Nitrate Trace detections of PCE
Blending with Calleguas Water
Provide increased treatment to enable better utilization of groundwater as the appropriate treatment technologies and waste disposal options become available.
Sycamore Well No. 3
700 1,129 Active High TDS, Sulfate, and Nitrate Trace detections of PCE and Perchlorate
Blending with Calleguas Water
Provide increased treatment to enable better utilization of groundwater as the appropriate treatment technologies and waste disposal options become available.
Total Capacity(2)
850 1,371
Note: 1. Well design capacity is provided; actual instantaneous pumping capacity may vary for each well. 2. The wells discharge to the Niles Forebay Tank, but the tank’s small size and operational constraints prevents both wells
from operating simultaneously.
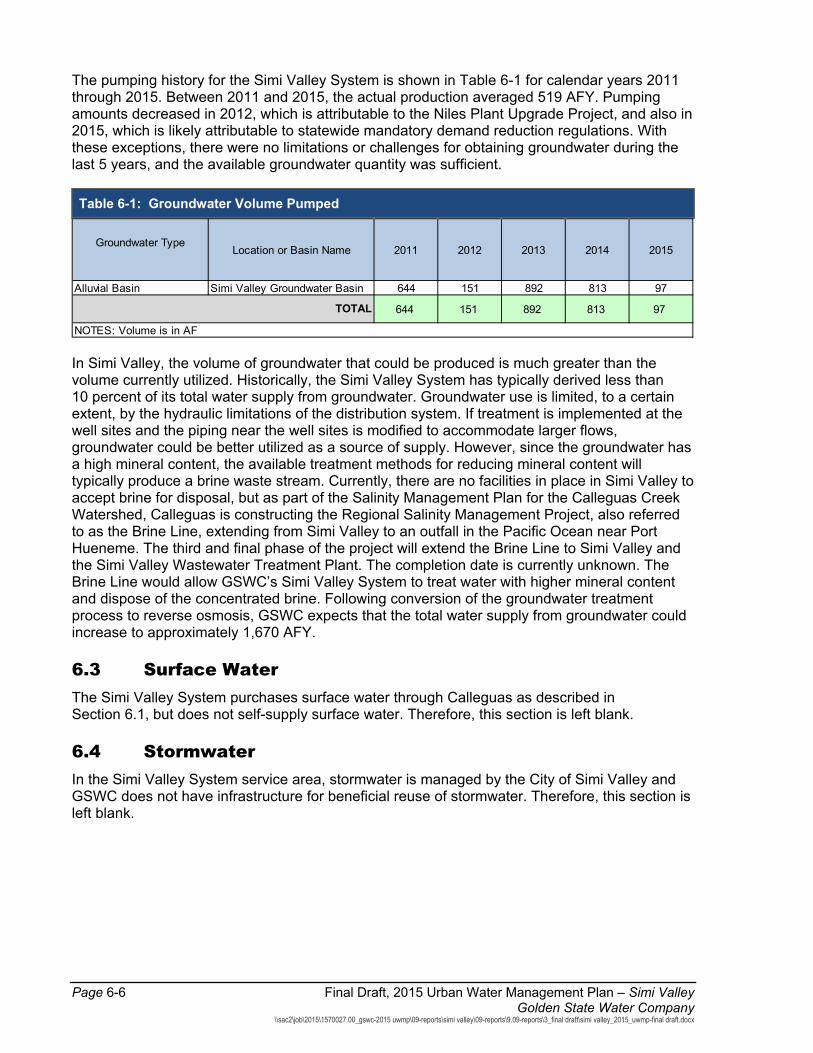
Page 6-6 Final Draft, 2015 Urban Water Management Plan – Simi Valley Golden State Water Company
\\sac2\job\2015\1570027.00_gswc-2015 uwmp\09-reports\simi valley\09-reports\9.09-reports\3_final draft\simi valley_2015_uwmp-final draft.docx
The pumping history for the Simi Valley System is shown in Table 6-1 for calendar years 2011 through 2015. Between 2011 and 2015, the actual production averaged 519 AFY. Pumping amounts decreased in 2012, which is attributable to the Niles Plant Upgrade Project, and also in 2015, which is likely attributable to statewide mandatory demand reduction regulations. With these exceptions, there were no limitations or challenges for obtaining groundwater during the last 5 years, and the available groundwater quantity was sufficient.
Table 6-1: Groundwater Volume Pumped
In Simi Valley, the volume of groundwater that could be produced is much greater than the volume currently utilized. Historically, the Simi Valley System has typically derived less than 10 percent of its total water supply from groundwater. Groundwater use is limited, to a certain extent, by the hydraulic limitations of the distribution system. If treatment is implemented at the well sites and the piping near the well sites is modified to accommodate larger flows, groundwater could be better utilized as a source of supply. However, since the groundwater has a high mineral content, the available treatment methods for reducing mineral content will typically produce a brine waste stream. Currently, there are no facilities in place in Simi Valley to accept brine for disposal, but as part of the Salinity Management Plan for the Calleguas Creek Watershed, Calleguas is constructing the Regional Salinity Management Project, also referred to as the Brine Line, extending from Simi Valley to an outfall in the Pacific Ocean near Port Hueneme. The third and final phase of the project will extend the Brine Line to Simi Valley and the Simi Valley Wastewater Treatment Plant. The completion date is currently unknown. The Brine Line would allow GSWC’s Simi Valley System to treat water with higher mineral content and dispose of the concentrated brine. Following conversion of the groundwater treatment process to reverse osmosis, GSWC expects that the total water supply from groundwater could increase to approximately 1,670 AFY.
6.3 Surface Water The Simi Valley System purchases surface water through Calleguas as described in Section 6.1, but does not self-supply surface water. Therefore, this section is left blank.
6.4 Stormwater In the Simi Valley System service area, stormwater is managed by the City of Simi Valley and GSWC does not have infrastructure for beneficial reuse of stormwater. Therefore, this section is left blank.
Groundwater TypeLocation or Basin Name 2011 2012 2013 2014 2015
Alluvial Basin Simi Valley Groundwater Basin 644 151 892 813 97
644 151 892 813 97
NOTES: Volume is in AF
TOTAL
Final Draft, 2015 Urban Water Management Plan – Simi Valley Page 6-7 Golden State Water Company \\sac2\job\2015\1570027.00_gswc-2015 uwmp\09-reports\simi valley\09-reports\9.09-reports\3_final draft\simi valley_2015_uwmp-final draft.docx
6.5 Wastewater and Recycled Water
6.5.1 Recycled Water Coordination
CWC 10633 The plan shall provide, to the extent available, information on recycled water and its potential for use as a water source in the service area of the urban water supplier. The preparation of the plan shall be coordinated with local water, wastewater, groundwater, and planning agencies that operate within the supplier's service area.
The City of Simi Valley, acting as the recycled water wholesaler, would be the lead agency in implementing the recycled water plan and distribution network. The City of Simi Valley produces of recycled water that meets California recycled water quality standards set forth in Title 22 of the California Code of Regulations. GSWC is working closely with the City of Simi Valley in planning a potential recycled water distribution system and identifying potential recycled water customers.
6.5.2 Wastewater Collection, Treatment, and Disposal
CWC 10633 (a) (Describe) the wastewater collection and treatment systems in the supplier's service area, including a
quantification of the amount of wastewater collected and treated and the methods of wastewater disposal.
CWC 10633 (b) (Describe) the quantity of treated wastewater that meets recycled water standards, is being discharged, and
is otherwise available for use in a recycled water project.
Wastewater in the Simi Valley System is collected by gravity sewers, lift stations, and force mains owned and operated by the City of Simi Valley and transported to the City’s wastewater treatment plant (WWTP). All wastewater entering the Simi Valley WWTP is treated to meet Title 22 recycled water quality standards. The plant’s design capacity is 12.5 million gallons of wastewater per day (mgd) (about 14,000 AFY); the average dry weather flow (DWF) is 10 mgd (about 11,200 AFY). Treated effluent not used for recycled water purposes (about 7.1 mgd or 8,000 AFY in 2015) is discharged into the Arroyo Simi reach of Calleguas Creek (City of Simi Valley, 2016).
Because the City of Simi Valley WWTP treats wastewater for a larger population than exists in the Simi Valley System, an estimated per capita wastewater generation factor was used to calculate the volume of wastewater generated by the customers in the Simi Valley System for Table 6-2. The wastewater generation factor is based on the population served and the volume of wastewater collected by the WWTP in 2015. The Simi Valley WWTP serves approximately 127,000 residents and treated 7.6 mgd (about 8,500 AFY) of wastewater in 2015, making the average per capita wastewater generation factor for the Simi Valley WWTP 60 gpd (about 0.067 AFY) (City of Simi Valley, 2016).
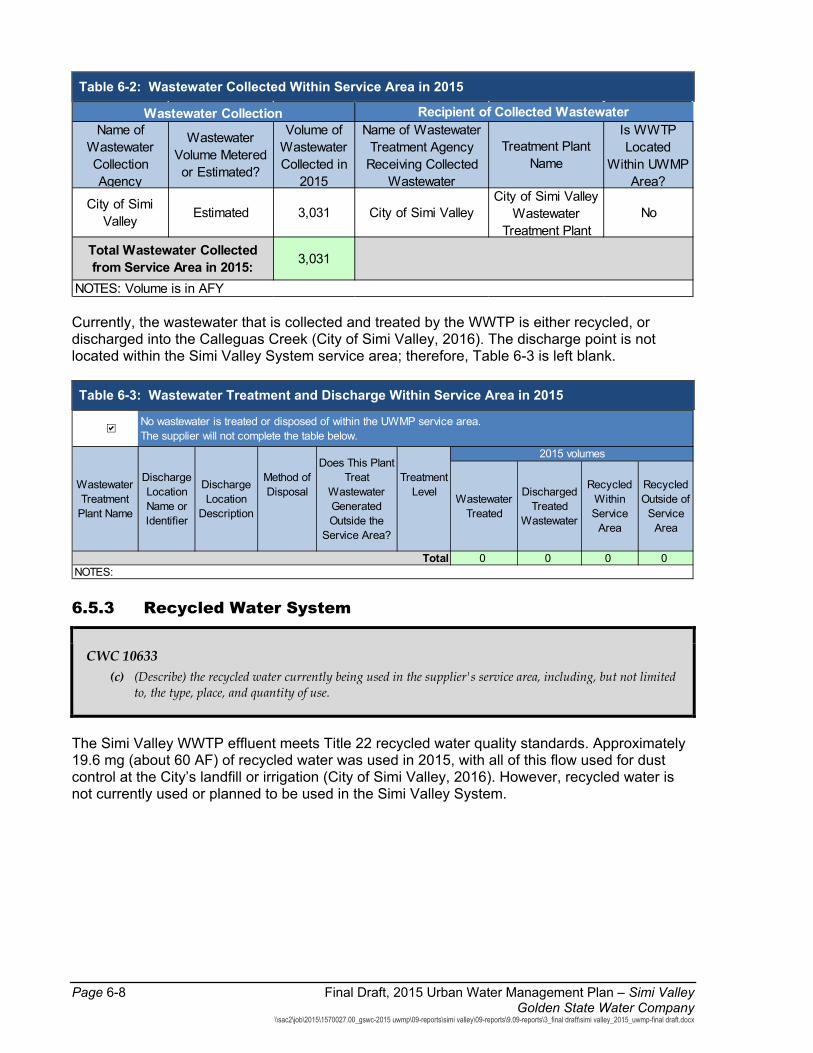
Page 6-8 Final Draft, 2015 Urban Water Management Plan – Simi Valley Golden State Water Company
\\sac2\job\2015\1570027.00_gswc-2015 uwmp\09-reports\simi valley\09-reports\9.09-reports\3_final draft\simi valley_2015_uwmp-final draft.docx
Table 6-2: Wastewater Collected Within Service Area in 2015
Currently, the wastewater that is collected and treated by the WWTP is either recycled, or discharged into the Calleguas Creek (City of Simi Valley, 2016). The discharge point is not located within the Simi Valley System service area; therefore, Table 6-3 is left blank.
Table 6-3: Wastewater Treatment and Discharge Within Service Area in 2015
6.5.3 Recycled Water System
CWC 10633 (c) (Describe) the recycled water currently being used in the supplier's service area, including, but not limited
to, the type, place, and quantity of use.
The Simi Valley WWTP effluent meets Title 22 recycled water quality standards. Approximately 19.6 mg (about 60 AF) of recycled water was used in 2015, with all of this flow used for dust control at the City’s landfill or irrigation (City of Simi Valley, 2016). However, recycled water is not currently used or planned to be used in the Simi Valley System.
Name of Wastewater Collection Agency
Wastewater Volume Metered or Estimated?
Volume of Wastewater Collected in
2015
Name of Wastewater Treatment Agency
Receiving Collected Wastewater
Treatment Plant Name
Is WWTP Located
Within UWMP Area?
City of Simi Valley Estimated 3,031 City of Simi Valley
City of Simi Valley Wastewater
Treatment PlantNo
3,031
NOTES: Volume is in AFY
Recipient of Collected Wastewater
Total Wastewater Collected from Service Area in 2015:
Wastewater Collection
Wastewater Treated
Discharged Treated
Wastewater
Recycled Within Service
Area
Recycled Outside of
Service Area
Total 0 0 0 0NOTES:
Wastewater Treatment
Plant Name
Discharge Location Name or Identifier
Discharge Location
Description
Method of Disposal
Does This Plant Treat
Wastewater Generated Outside the
Service Area?
Treatment Level
2015 volumes
No wastewater is treated or disposed of within the UWMP service area. The supplier will not complete the table below.
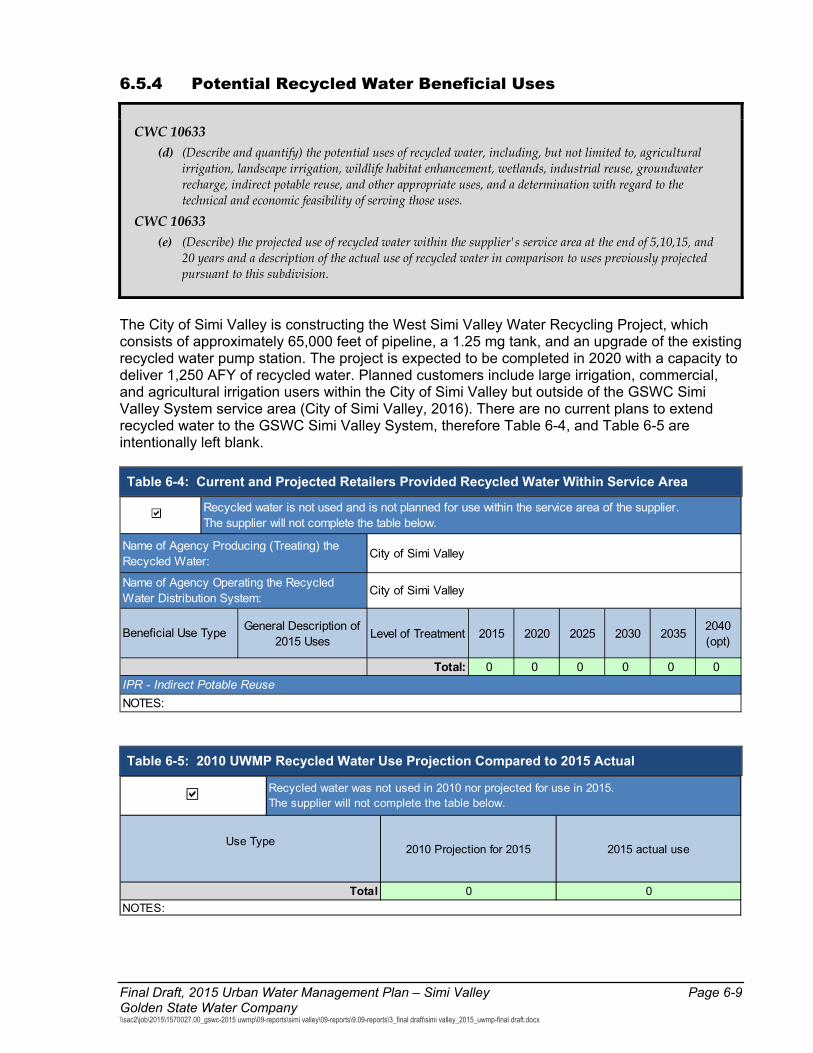
Final Draft, 2015 Urban Water Management Plan – Simi Valley Page 6-9 Golden State Water Company \\sac2\job\2015\1570027.00_gswc-2015 uwmp\09-reports\simi valley\09-reports\9.09-reports\3_final draft\simi valley_2015_uwmp-final draft.docx
6.5.4 Potential Recycled Water Beneficial Uses
CWC 10633 (d) (Describe and quantify) the potential uses of recycled water, including, but not limited to, agricultural
irrigation, landscape irrigation, wildlife habitat enhancement, wetlands, industrial reuse, groundwater recharge, indirect potable reuse, and other appropriate uses, and a determination with regard to the technical and economic feasibility of serving those uses.
CWC 10633 (e) (Describe) the projected use of recycled water within the supplier's service area at the end of 5,10,15, and
20 years and a description of the actual use of recycled water in comparison to uses previously projected pursuant to this subdivision.
The City of Simi Valley is constructing the West Simi Valley Water Recycling Project, which consists of approximately 65,000 feet of pipeline, a 1.25 mg tank, and an upgrade of the existing recycled water pump station. The project is expected to be completed in 2020 with a capacity to deliver 1,250 AFY of recycled water. Planned customers include large irrigation, commercial, and agricultural irrigation users within the City of Simi Valley but outside of the GSWC Simi Valley System service area (City of Simi Valley, 2016). There are no current plans to extend recycled water to the GSWC Simi Valley System, therefore Table 6-4, and Table 6-5 are intentionally left blank.
Table 6-4: Current and Projected Retailers Provided Recycled Water Within Service Area
Table 6-5: 2010 UWMP Recycled Water Use Projection Compared to 2015 Actual
General Description of 2015 Uses Level of Treatment 2015 2020 2025 2030 2035 2040
(opt)
Total: 0 0 0 0 0 0
NOTES:
Beneficial Use Type
IPR - Indirect Potable Reuse
Recycled water is not used and is not planned for use within the service area of the supplier.The supplier will not complete the table below.
Name of Agency Producing (Treating) the Recycled Water: City of Simi Valley
Name of Agency Operating the Recycled Water Distribution System: City of Simi Valley
2010 Projection for 2015 2015 actual use
0 0
Recycled water was not used in 2010 nor projected for use in 2015. The supplier will not complete the table below.
Use Type
NOTES:Total
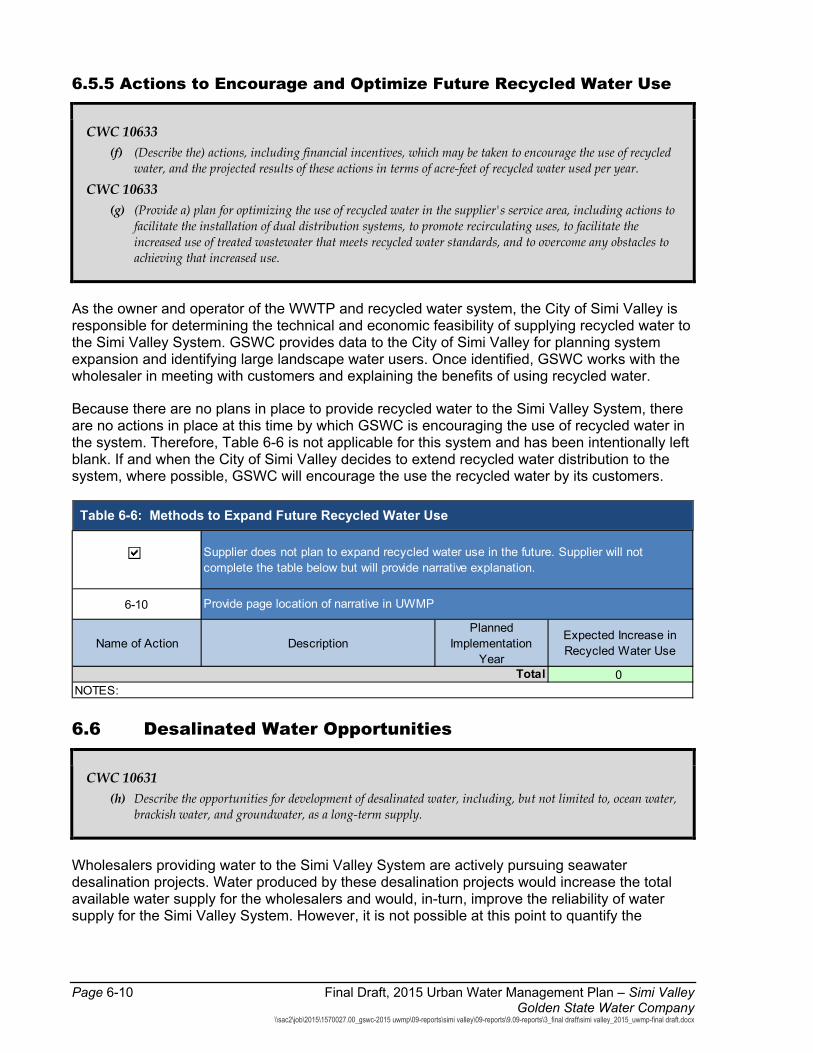
Page 6-10 Final Draft, 2015 Urban Water Management Plan – Simi Valley Golden State Water Company
\\sac2\job\2015\1570027.00_gswc-2015 uwmp\09-reports\simi valley\09-reports\9.09-reports\3_final draft\simi valley_2015_uwmp-final draft.docx
6.5.5 Actions to Encourage and Optimize Future Recycled Water Use
CWC 10633 (f) (Describe the) actions, including financial incentives, which may be taken to encourage the use of recycled
water, and the projected results of these actions in terms of acre-feet of recycled water used per year.
CWC 10633 (g) (Provide a) plan for optimizing the use of recycled water in the supplier's service area, including actions to
facilitate the installation of dual distribution systems, to promote recirculating uses, to facilitate the increased use of treated wastewater that meets recycled water standards, and to overcome any obstacles to achieving that increased use.
As the owner and operator of the WWTP and recycled water system, the City of Simi Valley is responsible for determining the technical and economic feasibility of supplying recycled water to the Simi Valley System. GSWC provides data to the City of Simi Valley for planning system expansion and identifying large landscape water users. Once identified, GSWC works with the wholesaler in meeting with customers and explaining the benefits of using recycled water.
Because there are no plans in place to provide recycled water to the Simi Valley System, there are no actions in place at this time by which GSWC is encouraging the use of recycled water in the system. Therefore, Table 6-6 is not applicable for this system and has been intentionally left blank. If and when the City of Simi Valley decides to extend recycled water distribution to the system, where possible, GSWC will encourage the use the recycled water by its customers.
Table 6-6: Methods to Expand Future Recycled Water Use
6.6 Desalinated Water Opportunities
CWC 10631 (h) Describe the opportunities for development of desalinated water, including, but not limited to, ocean water,
brackish water, and groundwater, as a long-term supply.
Wholesalers providing water to the Simi Valley System are actively pursuing seawater desalination projects. Water produced by these desalination projects would increase the total available water supply for the wholesalers and would, in-turn, improve the reliability of water supply for the Simi Valley System. However, it is not possible at this point to quantify the
6-10
Name of Action DescriptionPlanned
Implementation Year
Expected Increase in Recycled Water Use
0TotalNOTES:
Supplier does not plan to expand recycled water use in the future. Supplier will not complete the table below but will provide narrative explanation.
Provide page location of narrative in UWMP
Final Draft, 2015 Urban Water Management Plan – Simi Valley Page 6-11 Golden State Water Company \\sac2\job\2015\1570027.00_gswc-2015 uwmp\09-reports\simi valley\09-reports\9.09-reports\3_final draft\simi valley_2015_uwmp-final draft.docx
amount of desalinated water that will be available for the GSWC’s Simi Valley System. The following discussion summarizes the desalination plans of water wholesalers.
Metropolitan and its member agencies, including Calleguas, view seawater desalination as a component of a diversified water supply portfolio. Recent and continuous breakthroughs in membrane technology have helped to reduce desalination costs, leading to the consideration of desalination among the alternative resource options outlined in Metropolitan’s 2010 Integrated Resources Plan (IRP) Update. This updated plan describes a diversified regional strategy to include recycled water, groundwater recharge, and seawater desalination in its portfolio of methods to ensure robust water supply reliability. In 2001, Metropolitan established the Seawater Desalination Program to encourage its member agencies to develop desalination projects, and in the 2004 IRP Update established a target goal of up to 150,000 AFY of desalination capacity from its retailers by 2025. In 2014, Metropolitan included desalination projects in its Local Resources Program. This is an important component of the total estimated water supply production for the region. (Metropolitan, 2016)
To reduce demands on imported water and to increase the reliability of supply, Calleguas supports projects that would diversify its water supply. These projects include the use of desalters for the recovery and treatment of brackish groundwater, facilities for the collection and disposal of waste brines generated by groundwater treatment, and implementation of source control measures.
Four brackish groundwater recovery facilities that will employ reverse-osmosis treatment to produce potable water quality are being planned in the Calleguas service area, including the Camarillo Groundwater Treatment Facility (4 million gallons per day (mgd)), South Las Posas Basin Regional Desalter (5 mgd), West Simi Desalter (3 mgd), and the Somis Desalter (2 mgd). Brackish groundwater recovery projects reclaim poor quality groundwater. A major benefit of the recovery projects is that they use local groundwater resources that would otherwise remain unsuitable for beneficial use. As a result, these projects will increase the availability and reliability of the regional and local water supply.
In addition, Calleguas, working with other agencies and stakeholders, is constructing the Regional Salinity Management Project, also referred to as the Brine Line. This project will consist of a pipeline system to collect treated wastewater and brine concentrates from wastewater treatment plants, groundwater treatment facilities, and industrial operations. The collected water will be conveyed to agricultural areas and wetlands for direct use or to an ocean outfall near Port Hueneme. Phase 3 of the project will extend to Simi Valley. Once the facilities for brine disposal become available, groundwater treatment facilities will be better able to manage waste streams, and the availability of groundwater could significantly increase in the Simi Valley System. The Brine Line also will manage brine waste containing concentrated salts from the reverse osmosis treatment at desalting facilities. This waste would be mixed with treated municipal wastewater and could facilitate the beneficial use of up to 45,000 AFY for domestic and agricultural use, thus further reducing the need to import water to the region. GSWC has two groundwater wells in the Simi Groundwater Basin. Both wells produce groundwater that is high in TDS (900 – 1,200 mg/L) and must be blended with imported water for delivery to customers. Once the Brine Line is available, the groundwater could be treated at a desalter using reverse osmosis or another membrane treatment process, instead of blending with imported water. Increased usage of the two existing wells and/or construction of additional wells would be implemented to increase the yield to approximately 1,670 AFY.
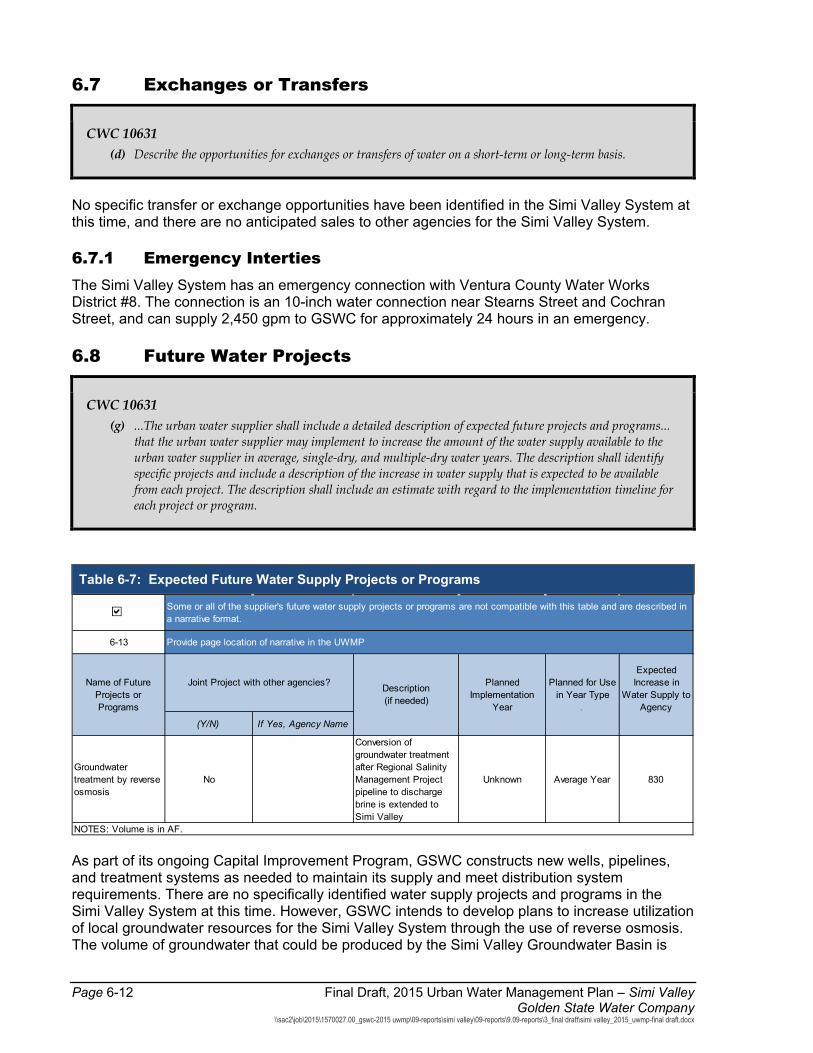
Page 6-12 Final Draft, 2015 Urban Water Management Plan – Simi Valley Golden State Water Company
\\sac2\job\2015\1570027.00_gswc-2015 uwmp\09-reports\simi valley\09-reports\9.09-reports\3_final draft\simi valley_2015_uwmp-final draft.docx
6.7 Exchanges or Transfers
CWC 10631 (d) Describe the opportunities for exchanges or transfers of water on a short-term or long-term basis.
No specific transfer or exchange opportunities have been identified in the Simi Valley System at this time, and there are no anticipated sales to other agencies for the Simi Valley System.
6.7.1 Emergency Interties The Simi Valley System has an emergency connection with Ventura County Water Works District #8. The connection is an 10-inch water connection near Stearns Street and Cochran Street, and can supply 2,450 gpm to GSWC for approximately 24 hours in an emergency.
6.8 Future Water Projects
CWC 10631 (g) ...The urban water supplier shall include a detailed description of expected future projects and programs...
that the urban water supplier may implement to increase the amount of the water supply available to the urban water supplier in average, single-dry, and multiple-dry water years. The description shall identify specific projects and include a description of the increase in water supply that is expected to be available from each project. The description shall include an estimate with regard to the implementation timeline for each project or program.
Table 6-7: Expected Future Water Supply Projects or Programs
As part of its ongoing Capital Improvement Program, GSWC constructs new wells, pipelines, and treatment systems as needed to maintain its supply and meet distribution system requirements. There are no specifically identified water supply projects and programs in the Simi Valley System at this time. However, GSWC intends to develop plans to increase utilization of local groundwater resources for the Simi Valley System through the use of reverse osmosis. The volume of groundwater that could be produced by the Simi Valley Groundwater Basin is
6-13
(Y/N) If Yes, Agency Name
Groundwater treatment by reverse osmosis
No
Conversion of groundwater treatment after Regional Salinity Management Project pipeline to discharge brine is extended to Simi Valley
Unknown Average Year 830
Some or all of the supplier's future water supply projects or programs are not compatible with this table and are described in a narrative format.
Joint Project with other agencies?
NOTES: Volume is in AF.
Name of Future Projects or Programs
Description(if needed)
Planned Implementation
Year
Expected Increase in
Water Supply to Agency
Planned for Use in Year Type
.
Provide page location of narrative in the UWMP
Final Draft, 2015 Urban Water Management Plan – Simi Valley Page 6-13 Golden State Water Company \\sac2\job\2015\1570027.00_gswc-2015 uwmp\09-reports\simi valley\09-reports\9.09-reports\3_final draft\simi valley_2015_uwmp-final draft.docx
greater than the volume currently utilized. Groundwater use is limited to a certain extent by the hydraulic limitations of the distribution system. If treatment is implemented at the well sites and the piping near the well sites is modified to accommodate larger flows, groundwater could be better utilized as a source of supply.
Since the groundwater has a high mineral content, the available treatment methods for reducing mineral content will typically produce a brine waste stream. Currently, there are no facilities in place in Simi Valley to accept brine for disposal, but construction is underway on the Regional Salinity Management Project that would collect brine in Simi Valley and discharge it to the Pacific Ocean near Port Hueneme. When the construction of the Brine Line is complete, GSWC will be able to process groundwater with reverse-osmosis treatment and discharge the resulting brine through the Brine Line, and therefore can improve utilization of groundwater with high TDS without the need for blending with large quantities of imported water. The completion date for the third and final phase of the project, which will extend the Brine Line to Simi Valley and the Simi Valley Wastewater Treatment Plant, is currently unknown. Following conversion of the groundwater treatment process to reverse osmosis, GSWC expects that the total water supply from groundwater could increase to approximately 1,670 AFY.
A potential long-term water supply transfer opportunity that GSWC is evaluating is the Cadiz Valley Water Conservation, Recovery and Storage Project (Cadiz Project). The project is designed to capture and conserve thousands of AF of native groundwater currently being lost to evaporation through an aquifer system beneath Cadiz’s property in eastern San Bernardino County, California. By implementing established groundwater management practices, the project will create a new, sustainable annual water supply for project participants. In addition, the project offers storage capacity that can be used by participants to carry-over – or “bank” – annual supplies, without the high rates of evaporative loss suffered by local surface reservoirs.
The Cadiz Project will produce up to 50,000 AFY for fifty years. GSWC is one of several entities that have expressed an interest in receiving water from the project. In 2009, GSWC signed a letter of intent to purchase up to 5,000 AFY and committed to paying a share of the cost of the project’s environmental evaluation. GSWC continues to evaluate the economics and technical feasibility of this project.
6.9 Summary of Existing and Planned Sources of Water
CWC 10631 (b) Identify and quantify, to the extent practicable, the existing and planned sources of water available to the
supplier over the same five-year increments described in subdivision 10631 (a). (4) (Provide a) detailed description and analysis of the amount and location of groundwater that is
projected to be pumped by the urban water supplier. The description and analysis shall be based on information that is reasonably available, including, but not limited to, historic use records.
GSWC currently obtains its water supply for the Simi Valley System by pumping groundwater and by purchasing imported water from Calleguas. Groundwater is pumped from a total of two active groundwater wells in the Simi Valley Groundwater Basin. Table 6-8 summarizes the actual water supplied to GSWC for the Simi Valley System in 2015.

Page 6-14 Final Draft, 2015 Urban Water Management Plan – Simi Valley Golden State Water Company
\\sac2\job\2015\1570027.00_gswc-2015 uwmp\09-reports\simi valley\09-reports\9.09-reports\3_final draft\simi valley_2015_uwmp-final draft.docx
Table 6-8: Water Supplies — Actual
Table 6-9 summarizes the planned water supplies available to GSWC for the Simi Valley System that will meet their projected water demands during normal water year conditions. The availability of water from each source is estimated through the year 2040, in accordance with GSWC’s long-term water supply planning projections and data provided by Calleguas (Calleguas, 2016). GSWC’s water supply is projected to increase by about 51 percent from 2015 to 2040 to meet the associated projected water demands. Groundwater is expected to comprise approximately 10 percent of the available supply, consistent with long term historical averages, through 2040, with the remainder provided by imported water from Calleguas. There is no recycled water supply planned for this system.
Table 6-9: Water Supplies — Projected
Water Supply
May use each category multiple times. Actual Volume
Water Quality
Total Right or Safe Yield
(optional)
Purchased or Imported Water Calleguas Municipal Water District
5,243 Drinking Water
Groundwater Simi Valley Groundwater Basin
97 Drinking Water
5,340 0
Additional Detail on Water Supply
2015
NOTES: Volume is in AF
Total
Water Supply
Reasonably Available Volume
Reasonably Available Volume
Reasonably Available Volume
Reasonably Available Volume
Reasonably Available Volume
Purchased or Imported Water Calleguas Municipal Water District
6,761 6,878 6,997 7,120 7,244
Groundwater Simi Valley Groundwater Basin
840 840 840 840 840
7,601 7,718 7,837 7,960 8,084
NOTES: Volume is in AFY
Additional Detail on Water Supply
Projected Water Supply Report To the Extent Practicable
2020 2025 2030 2035 2040 (opt)
Total
May use each category multiple times.
Final Draft, 2015 Urban Water Management Plan – Simi Valley Page 7-1 Golden State Water Company \\sac2\job\2015\1570027.00_gswc-2015 uwmp\09-reports\simi valley\09-reports\9.09-reports\3_final draft\simi valley_2015_uwmp-final draft.docx
Chapter 7: Water Supply Reliability Assessment
The Simi Valley System is supplied from two sources: imported water purchased from Calleguas and local groundwater. Therefore, conditions in local and distant areas can impact the reliability of supplies. This section summarizes the reliability of GSWC’s water supply sources. In general, GSWC’s supply is expected to be reliable for all scenarios (Calleguas 2016). GSWC will strive for reliability through the following steps:
Ensuring reliability of the Calleguas wholesale supply,
Providing a reliable groundwater supply, and
Creating conservation derived supply.
7.1 Constraints on Water Sources
CWC 10631 (c)(2) For any water source that may not be available at a consistent level of use, given specific legal,
environmental, water quality, or climatic factors, describe plans to supplement or replace that source with alternative sources or water demand management measures, to the extent practicable.
CWC 10634 The plan shall include information, to the extent practicable, relating to the quality of existing sources of water available to the supplier over the same five-year increments as described in subdivision (a) of Section 10631, and the manner in which water quality affects water management strategies and supply reliability.
Supply reliability for the Simi Valley System is based on the reliability of imported Metropolitan water, purchased through Calleguas, and local groundwater. Factors that might affect the supply of water from Metropolitan have already been taken into account by Metropolitan and Calleguas in the supply projections, therefore legal, environmental, water quality, or other constraints to the imported water supply are not anticipated.
The SGMA priority assigned to the Simi Valley Basin is low, and therefore constraints to groundwater supply are not anticipated. Contaminants are present in groundwater wells, and groundwater is therefore blended with imported water. Changes to groundwater quality that would constrain supply are not anticipated.
7.2 Reliability by Type of Year
CWC 10631 (c)(1) Describe the reliability of the water supply and vulnerability to seasonal or climatic shortage, to the extent
practicable, and provide data for each of the following: (A) an average water year, (B) a single dry water year, (C) multiple dry water years.
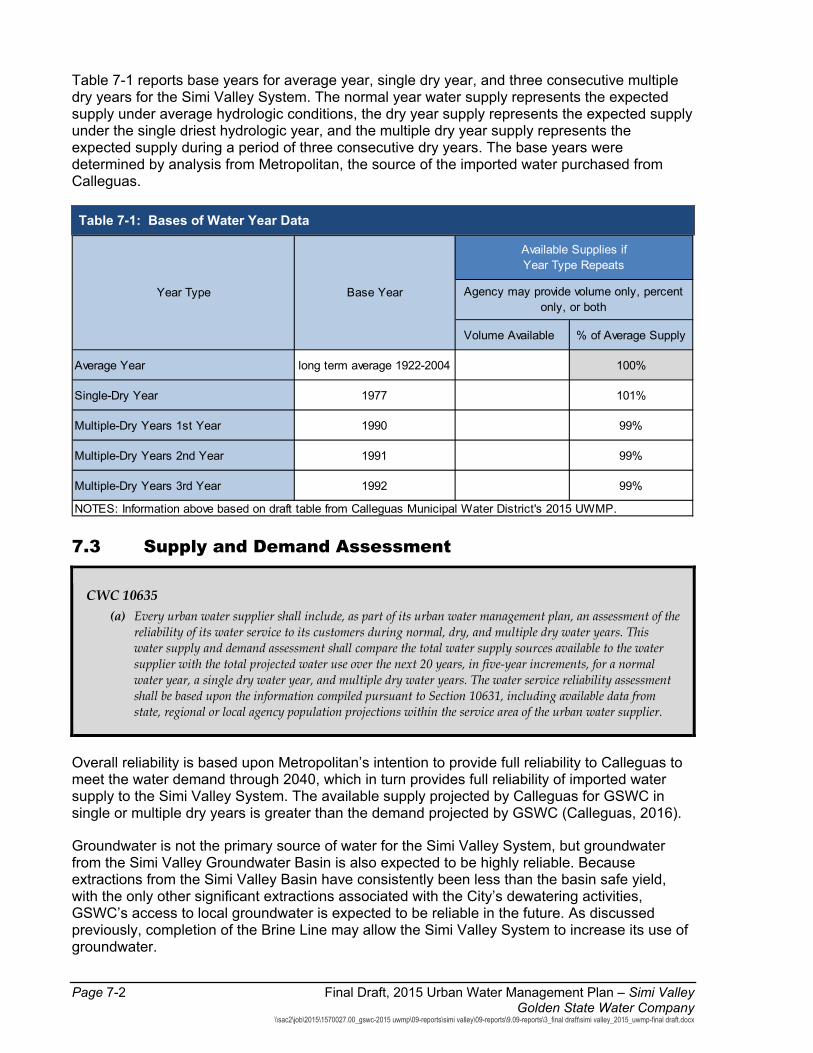
Page 7-2 Final Draft, 2015 Urban Water Management Plan – Simi Valley Golden State Water Company
\\sac2\job\2015\1570027.00_gswc-2015 uwmp\09-reports\simi valley\09-reports\9.09-reports\3_final draft\simi valley_2015_uwmp-final draft.docx
Table 7-1 reports base years for average year, single dry year, and three consecutive multiple dry years for the Simi Valley System. The normal year water supply represents the expected supply under average hydrologic conditions, the dry year supply represents the expected supply under the single driest hydrologic year, and the multiple dry year supply represents the expected supply during a period of three consecutive dry years. The base years were determined by analysis from Metropolitan, the source of the imported water purchased from Calleguas.
Table 7-1: Bases of Water Year Data
7.3 Supply and Demand Assessment
CWC 10635 (a) Every urban water supplier shall include, as part of its urban water management plan, an assessment of the
reliability of its water service to its customers during normal, dry, and multiple dry water years. This water supply and demand assessment shall compare the total water supply sources available to the water supplier with the total projected water use over the next 20 years, in five-year increments, for a normal water year, a single dry water year, and multiple dry water years. The water service reliability assessment shall be based upon the information compiled pursuant to Section 10631, including available data from state, regional or local agency population projections within the service area of the urban water supplier.
Overall reliability is based upon Metropolitan’s intention to provide full reliability to Calleguas to meet the water demand through 2040, which in turn provides full reliability of imported water supply to the Simi Valley System. The available supply projected by Calleguas for GSWC in single or multiple dry years is greater than the demand projected by GSWC (Calleguas, 2016).
Groundwater is not the primary source of water for the Simi Valley System, but groundwater from the Simi Valley Groundwater Basin is also expected to be highly reliable. Because extractions from the Simi Valley Basin have consistently been less than the basin safe yield, with the only other significant extractions associated with the City’s dewatering activities, GSWC’s access to local groundwater is expected to be reliable in the future. As discussed previously, completion of the Brine Line may allow the Simi Valley System to increase its use of groundwater.
Volume Available % of Average Supply
Average Year long term average 1922-2004 100%
Single-Dry Year 1977 101%
Multiple-Dry Years 1st Year 1990 99%
Multiple-Dry Years 2nd Year 1991 99%
Multiple-Dry Years 3rd Year 1992 99%
NOTES: Information above based on draft table from Calleguas Municipal Water District's 2015 UWMP.
Year Type Base Year Agency may provide volume only, percent only, or both
Available Supplies if Year Type Repeats

Final Draft, 2015 Urban Water Management Plan – Simi Valley Page 7-3 Golden State Water Company \\sac2\job\2015\1570027.00_gswc-2015 uwmp\09-reports\simi valley\09-reports\9.09-reports\3_final draft\simi valley_2015_uwmp-final draft.docx
The supply and demand presented in Table 7-2 through Table 7-4 are not adjusted for conservation. However, conservation measures, including requirements to comply with SBX7-7, implemented within the Simi Valley System are expected to reduce demands. In dry years, GSWC’s Water Shortage Contingency Plan may be used, further reducing demands.
7.3.1 Normal Water Year Analysis Table 7-2 summarizes the service supply reliability assessment for an average/normal water year based on water supply and water demand projections. As described previously in this chapter, purchased water provided by Calleguas, and local groundwater from the Simi Valley Basin, are expected to be highly reliable to meet the projected demands during normal water year conditions through 2040.
Table 7-2: Normal Year Supply and Demand Comparison
7.3.2 Single-Dry-Year Analysis Table 7-3 demonstrates the reliability of water supplies to meet projected annual water demands for the Simi Valley System in a single dry year. As described previously in this chapter, purchased water provided by Calleguas, and local groundwater from the Simi Valley Basin, are expected to be highly reliable to meet the projected demands in a single dry year through 2040. Actual demand may be lower due to short-term conservation measures and implementation of the Water Shortage Contingency Plan.
Table 7-3: Single Dry Year Supply and Demand Comparison
7.3.3 Multiple-Dry-Year Analysis Table 7-4 presents the projected multiple dry year water supply and demand assessment. Based on available supply projections for GSWC provided by Calleguas in their 2015 UWMP, available supply is expected to be less than demand for the multiple dry year scenarios through
2020 2025 2030 2035 2040 (Opt)
Supply totals7,601 7,718 7,837 7,960 8,084
Demand totals7,601 7,718 7,837 7,960 8,084
Difference0 0 0 0 0
NOTES: Volume is in AFY
2020 2025 2030 20352040 (Opt)
Supply totals 7,601 7,718 7,837 7,960 8,084
Demand totals 7,601 7,718 7,837 7,960 8,084
Difference 0 0 0 0 0
NOTES: Volume is in AFY
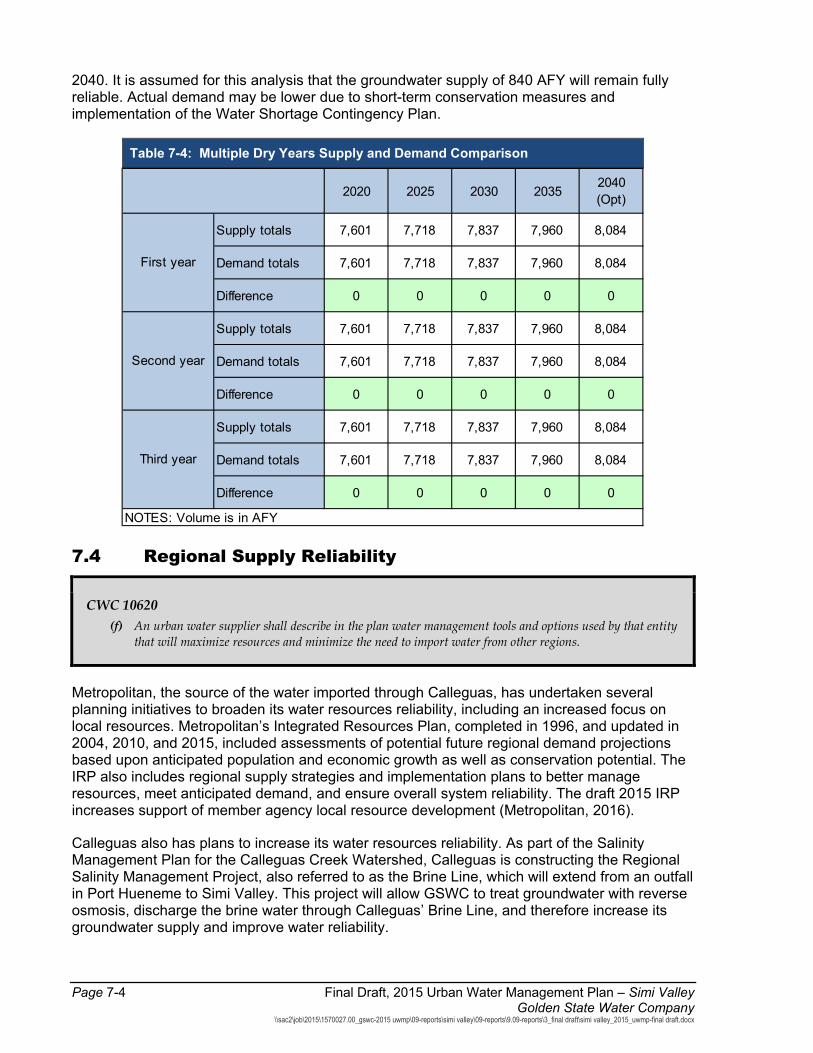
Page 7-4 Final Draft, 2015 Urban Water Management Plan – Simi Valley Golden State Water Company
\\sac2\job\2015\1570027.00_gswc-2015 uwmp\09-reports\simi valley\09-reports\9.09-reports\3_final draft\simi valley_2015_uwmp-final draft.docx
2040. It is assumed for this analysis that the groundwater supply of 840 AFY will remain fully reliable. Actual demand may be lower due to short-term conservation measures and implementation of the Water Shortage Contingency Plan.
Table 7-4: Multiple Dry Years Supply and Demand Comparison
7.4 Regional Supply Reliability
CWC 10620 (f) An urban water supplier shall describe in the plan water management tools and options used by that entity
that will maximize resources and minimize the need to import water from other regions.
Metropolitan, the source of the water imported through Calleguas, has undertaken several planning initiatives to broaden its water resources reliability, including an increased focus on local resources. Metropolitan’s Integrated Resources Plan, completed in 1996, and updated in 2004, 2010, and 2015, included assessments of potential future regional demand projections based upon anticipated population and economic growth as well as conservation potential. The IRP also includes regional supply strategies and implementation plans to better manage resources, meet anticipated demand, and ensure overall system reliability. The draft 2015 IRP increases support of member agency local resource development (Metropolitan, 2016).
Calleguas also has plans to increase its water resources reliability. As part of the Salinity Management Plan for the Calleguas Creek Watershed, Calleguas is constructing the Regional Salinity Management Project, also referred to as the Brine Line, which will extend from an outfall in Port Hueneme to Simi Valley. This project will allow GSWC to treat groundwater with reverse osmosis, discharge the brine water through Calleguas’ Brine Line, and therefore increase its groundwater supply and improve water reliability.
2020 2025 2030 20352040 (Opt)
Supply totals 7,601 7,718 7,837 7,960 8,084
Demand totals 7,601 7,718 7,837 7,960 8,084
Difference 0 0 0 0 0
Supply totals 7,601 7,718 7,837 7,960 8,084
Demand totals 7,601 7,718 7,837 7,960 8,084
Difference 0 0 0 0 0
Supply totals 7,601 7,718 7,837 7,960 8,084
Demand totals 7,601 7,718 7,837 7,960 8,084
Difference 0 0 0 0 0
First year
Second year
Third year
NOTES: Volume is in AFY
Final Draft, 2015 Urban Water Management Plan – Simi Valley Page 8-1 Golden State Water Company \\sac2\job\2015\1570027.00_gswc-2015 uwmp\09-reports\simi valley\09-reports\9.09-reports\3_final draft\simi valley_2015_uwmp-final draft.docx
Chapter 8: Water Shortage Contingency Planning
This chapter addresses the requirements in Section 10632 of the Act for the water shortage contingency analysis including stages of actions, prohibitions on end uses, penalties/charges/other prohibitions, consumption reduction methods, determining water shortage reductions, revenue and expenditure impacts, resolution or ordinance, catastrophic supply interruption, and minimum supply over the next three years.
CWC 10632 (a) The plan shall provide an urban water shortage contingency analysis that includes each of the following
elements that are within the authority of the urban water supplier.
8.1 Stages of Action
CWC 10632 (a)(1) Stages of action to be undertaken by the urban water supplier in response to water supply shortages,
including up to a 50 percent reduction in water supply, and an outline of specific water supply conditions which are applicable to each stage.
The Act requires documentation of actions to be undertaken during a water shortage. In addition to Rule 14.1 and in response to the Governor’s Executive Order (B-29-15) the State Water Resources Control Board (Water Board) imposed restrictions to achieve a statewide 25 percent reduction in potable urban water usage. In the Simi Valley System, GSWC enacted Schedule 14.1-BY on June 1, 2015. GSWC has developed actions to be undertaken in response to water supply shortages, including up to a 50 percent reduction in water supply. The CPUC has jurisdiction over GSWC because GSWC is an investor-owned water utility. Section 357 of the California Water Code requires that suppliers subject to regulation by the CPUC secure its approval before imposing water consumption regulations and restrictions required by water supply shortage emergencies. Implementation of the actions is dependent upon approval of the CPUC, especially for implementing mandatory water use restrictions.
GSWC Water Shortage Contingency Plan - Activation Overview
The GSWC must receive approval from the CPUC before it can activate demand reduction measures that impact customers. Several steps must first occur before GSWC can impose measures to reduce customer water demands. Steps are taken in the context that each water shortage condition triggering stages of action is different and unique. The water shortage contingency plan information below represents GSWC’s response to the current drought conditions (2012-2016) through the adopted Schedule 14.1 for the Simi Valley System, and could be updated as needed. The typical steps for activating GSWC water shortage response are as follows:
Step 1: GSWC determines water shortage conditions exist (due to supply shortfalls, state cutbacks, or emergency conditions).
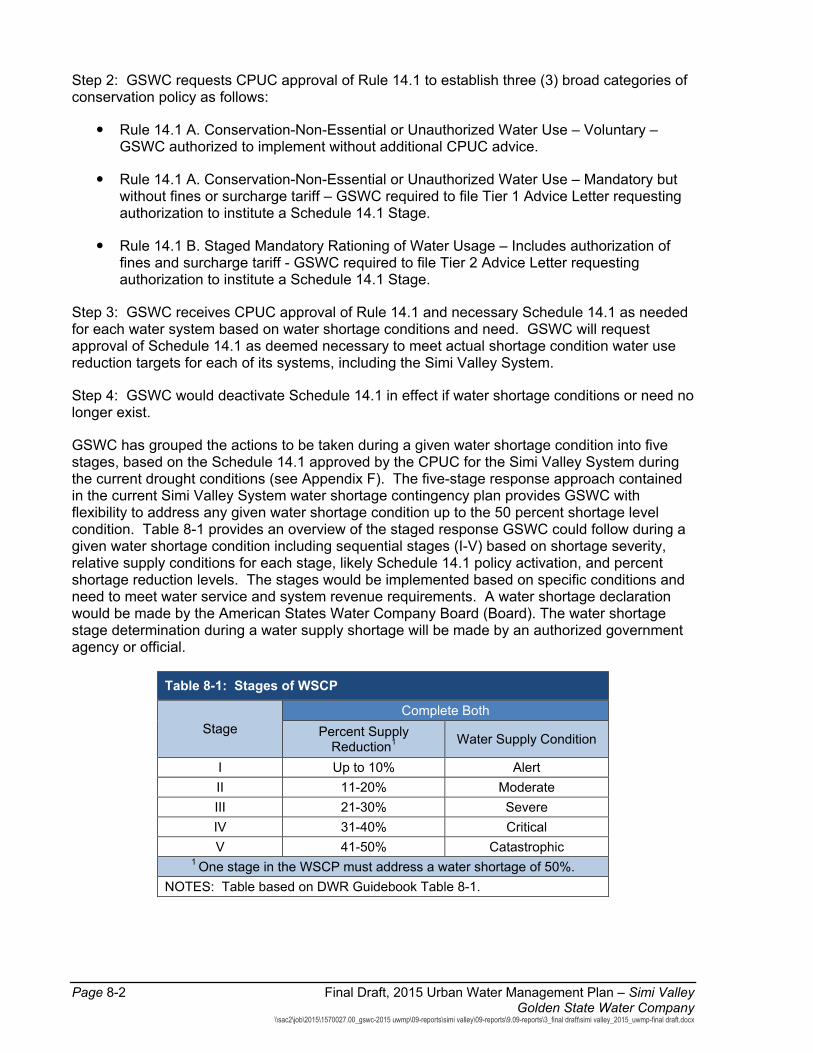
Page 8-2 Final Draft, 2015 Urban Water Management Plan – Simi Valley Golden State Water Company
\\sac2\job\2015\1570027.00_gswc-2015 uwmp\09-reports\simi valley\09-reports\9.09-reports\3_final draft\simi valley_2015_uwmp-final draft.docx
Step 2: GSWC requests CPUC approval of Rule 14.1 to establish three (3) broad categories of conservation policy as follows:
Rule 14.1 A. Conservation-Non-Essential or Unauthorized Water Use – Voluntary – GSWC authorized to implement without additional CPUC advice.
Rule 14.1 A. Conservation-Non-Essential or Unauthorized Water Use – Mandatory but without fines or surcharge tariff – GSWC required to file Tier 1 Advice Letter requesting authorization to institute a Schedule 14.1 Stage.
Rule 14.1 B. Staged Mandatory Rationing of Water Usage – Includes authorization of fines and surcharge tariff - GSWC required to file Tier 2 Advice Letter requesting authorization to institute a Schedule 14.1 Stage.
Step 3: GSWC receives CPUC approval of Rule 14.1 and necessary Schedule 14.1 as needed for each water system based on water shortage conditions and need. GSWC will request approval of Schedule 14.1 as deemed necessary to meet actual shortage condition water use reduction targets for each of its systems, including the Simi Valley System.
Step 4: GSWC would deactivate Schedule 14.1 in effect if water shortage conditions or need no longer exist.
GSWC has grouped the actions to be taken during a given water shortage condition into five stages, based on the Schedule 14.1 approved by the CPUC for the Simi Valley System during the current drought conditions (see Appendix F). The five-stage response approach contained in the current Simi Valley System water shortage contingency plan provides GSWC with flexibility to address any given water shortage condition up to the 50 percent shortage level condition. Table 8-1 provides an overview of the staged response GSWC could follow during a given water shortage condition including sequential stages (I-V) based on shortage severity, relative supply conditions for each stage, likely Schedule 14.1 policy activation, and percent shortage reduction levels. The stages would be implemented based on specific conditions and need to meet water service and system revenue requirements. A water shortage declaration would be made by the American States Water Company Board (Board). The water shortage stage determination during a water supply shortage will be made by an authorized government agency or official.
Table 8-1: Stages of WSCP
Stage Complete Both
Percent Supply Reduction1 Water Supply Condition
I Up to 10% Alert II 11-20% Moderate III 21-30% Severe IV 31-40% Critical V 41-50% Catastrophic
1 One stage in the WSCP must address a water shortage of 50%. NOTES: Table based on DWR Guidebook Table 8-1.
Final Draft, 2015 Urban Water Management Plan – Simi Valley Page 8-3 Golden State Water Company \\sac2\job\2015\1570027.00_gswc-2015 uwmp\09-reports\simi valley\09-reports\9.09-reports\3_final draft\simi valley_2015_uwmp-final draft.docx
The actions to be undertaken during each stage cannot be implemented until necessary Board and CPUC approvals have been executed. The types of measures that may be implemented in each stage include, but are not limited to, the following:
Stage I (up to 10 percent shortage) – Water alert conditions are declared and voluntary conservation is encouraged. The drought situation is explained to the public and governmental bodies. GSWC explains the possible subsequent water shortage stages in order to forecast possible future actions for the customer base. The focus is on customers with high per capita water usage to achieve proportionally greater reduction than those with low use. The activities performed by GSWC during this stage include, but are not limited to:
Public information campaign consisting of distribution of literature, speaking engagements, website updates, bill inserts, and conversation messages printed in local newspapers.
Educational programs in area schools.
Conservation Hotline, a toll-free number with trained Conservation Representatives to answer customer questions about conservation and water use efficiency.
Voluntary outdoor irrigation restrictions including limiting number of watering days per week, and time when irrigation can occur (e.g., between 7:00 pm and 8:00 am).
Discussion of equitable water waste response policy.
Stage II (11 - 20 percent shortage) – Stage II is a moderate shortage and will be implemented if the Stage I restrictions are deemed insufficient to achieve reductions due to water supply shortages or to achieve identified water usage goals established by an authorized government agency or official and will include all actions undertaken in Stage I. In addition, GSWC may propose voluntary conservation allotments and/or require mandatory conservation rules. The severity of actions depends upon the percentage of shortage and customer response. The level of voluntary or mandatory water use reduction requested from the customers is also based on the severity. It should be noted that prior to implementation of any mandatory reductions, GSWC must obtain approval from the CPUC. If necessary, GSWC may also support passage of drought ordinances by appropriate governmental agencies or officials. The activities performed by GSWC during this stage include, but are not limited to:
All measures implemented in Stage I.
Establishing customer baseline use period to be used as basis for usage reductions.
Usage in excess of customer baseline to be charged at regular rate plus a drought emergency surcharge (to be determined as approved by the CPUC).
Stage III (21 - 30 percent shortage) – Stage III is a severe shortage that entails or includes allocations and mandatory conservation rules. Stage III will be implemented if the Stage II allocations and drought emergency surcharges are deemed insufficient to achieve reductions due to water supply shortages or to achieve identified water usage goals established by an authorized government agency or official. This phase becomes effective upon notification to customers by the GSWC that water usage is to be reduced by a mandatory percentage. GSWC implements mandatory reductions after receiving approval from the CPUC. Rate changes are implemented to penalize excessive water usage. Water use restrictions are put into effect, i.e., prohibited uses can include restrictions of daytime hours for watering, excessive watering
Page 8-4 Final Draft, 2015 Urban Water Management Plan – Simi Valley Golden State Water Company
\\sac2\job\2015\1570027.00_gswc-2015 uwmp\09-reports\simi valley\09-reports\9.09-reports\3_final draft\simi valley_2015_uwmp-final draft.docx
resulting in gutter flooding, using a hose without a positive shutoff device, use of decorative fountains with non-recirculating pumps, washing down sidewalks or patios, not repairing leaks in a timely manner, etc. GSWC monitors water production weekly for compliance with necessary reductions. The use of flow restrictors is implemented if abusive practices are persistent and documented. The activities performed by GSWC during this stage include, but are not limited to:
All measures implemented in Stages I and II.
Adherence to customer baselines and actual water use reductions.
Usage in excess of customer baseline to be charged at regular rate plus an additional drought emergency surcharge amount (to be determined as approved by the CPUC).
Stage IV (31 - 40 percent shortage) – This is a critical shortage that includes all steps taken in prior stages regarding allocations and mandatory conservation. Stage IV will be implemented if the Stage III allocations and drought emergency surcharges are deemed insufficient to achieve reductions due to water supply shortages or to achieve identified water usage goals established by an authorized government agency or official. All activities are intensified and production is monitored daily by GSWC for compliance with necessary reductions. The activities performed by GSWC during this stage include, but are not limited to:
All measures implemented in Stages I-III.
Possible reductions in customer baselines and actual water use reductions.
Usage in excess of customer baseline to be charged at regular rate plus an additional drought emergency surcharge amount (to be determined as approved by the CPUC).
Stage V (41 - 50 percent shortage) – This is an emergency shortage that includes all steps taken in prior stages regarding allotments and mandatory conservation. This stage will be implemented in the event that the source of supply for the Simi Valley System is severely curtailed to the level that requires each customer to restrict their water use for only human health and safety purposes. All activities are intensified and production is monitored daily by GSWC for compliance with necessary reductions. The activities performed by GSWC during this stage include, but are not limited to:
All measures implemented in Stages I-IV.
Possible reductions in customer baselines and actual water use reductions.
Usage in excess of customer baseline to be charged at regular rate plus an additional drought emergency surcharge amount (to be determined as approved by the CPUC).
GSWC may update current water shortage condition response measures based on CPUC approvals and direction, state policy directives, emergency conditions, or to improve customer response.
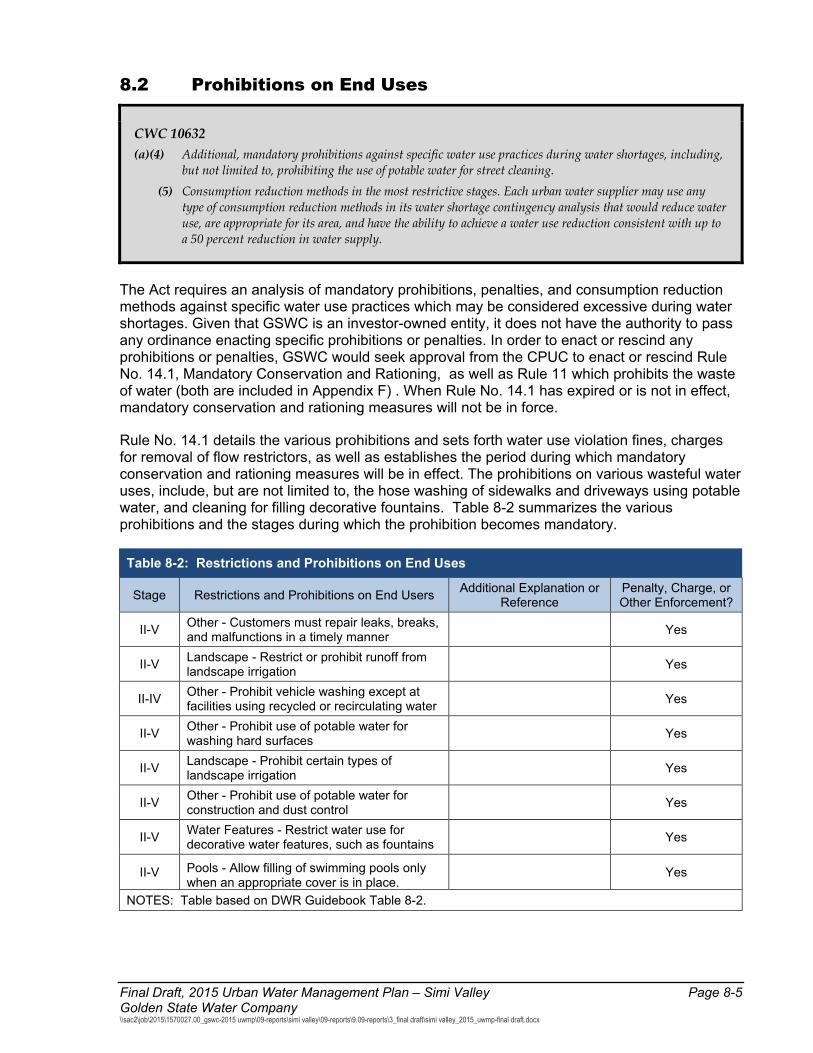
Final Draft, 2015 Urban Water Management Plan – Simi Valley Page 8-5 Golden State Water Company \\sac2\job\2015\1570027.00_gswc-2015 uwmp\09-reports\simi valley\09-reports\9.09-reports\3_final draft\simi valley_2015_uwmp-final draft.docx
8.2 Prohibitions on End Uses
CWC 10632 (a)(4) Additional, mandatory prohibitions against specific water use practices during water shortages, including,
but not limited to, prohibiting the use of potable water for street cleaning. (5) Consumption reduction methods in the most restrictive stages. Each urban water supplier may use any
type of consumption reduction methods in its water shortage contingency analysis that would reduce water use, are appropriate for its area, and have the ability to achieve a water use reduction consistent with up to a 50 percent reduction in water supply.
The Act requires an analysis of mandatory prohibitions, penalties, and consumption reduction methods against specific water use practices which may be considered excessive during water shortages. Given that GSWC is an investor-owned entity, it does not have the authority to pass any ordinance enacting specific prohibitions or penalties. In order to enact or rescind any prohibitions or penalties, GSWC would seek approval from the CPUC to enact or rescind Rule No. 14.1, Mandatory Conservation and Rationing, as well as Rule 11 which prohibits the waste of water (both are included in Appendix F) . When Rule No. 14.1 has expired or is not in effect, mandatory conservation and rationing measures will not be in force.
Rule No. 14.1 details the various prohibitions and sets forth water use violation fines, charges for removal of flow restrictors, as well as establishes the period during which mandatory conservation and rationing measures will be in effect. The prohibitions on various wasteful water uses, include, but are not limited to, the hose washing of sidewalks and driveways using potable water, and cleaning for filling decorative fountains. Table 8-2 summarizes the various prohibitions and the stages during which the prohibition becomes mandatory.
Table 8-2: Restrictions and Prohibitions on End Uses
Stage Restrictions and Prohibitions on End Users Additional Explanation or Reference
Penalty, Charge, or Other Enforcement?
II-V Other - Customers must repair leaks, breaks, and malfunctions in a timely manner
Yes
II-V Landscape - Restrict or prohibit runoff from landscape irrigation
Yes
II-IV Other - Prohibit vehicle washing except at facilities using recycled or recirculating water
Yes
II-V Other - Prohibit use of potable water for washing hard surfaces
Yes
II-V Landscape - Prohibit certain types of landscape irrigation
Yes
II-V Other - Prohibit use of potable water for construction and dust control
Yes
II-V Water Features - Restrict water use for decorative water features, such as fountains
Yes
II-V Pools - Allow filling of swimming pools only when an appropriate cover is in place.
Yes
NOTES: Table based on DWR Guidebook Table 8-2.
Page 8-6 Final Draft, 2015 Urban Water Management Plan – Simi Valley Golden State Water Company
\\sac2\job\2015\1570027.00_gswc-2015 uwmp\09-reports\simi valley\09-reports\9.09-reports\3_final draft\simi valley_2015_uwmp-final draft.docx
In addition to prohibitions during water supply shortage events requiring a voluntary or mandatory program, GSWC will make available to its customers water conservation kits as required by GSWC’s Rule No. 20. GSWC will notify customers of the availability of conservation kits and literature.
8.2.1 Landscape Irrigation Landscape irrigation reductions focus on less watering and reducing or avoiding water waste during irrigation. Landscape irrigation reductions may vary by user class or customer type depending on water shortage conditions and ability to meet overall water use reduction targets. Water allocation or budget concepts may be applied by GSWC to equitably reduce landscape water use while minimizing customer impact. Any landscape irrigation reduction policies require approval by the CPUC before GSWC can implement such measures.
8.2.2 Commercial, Industrial, and Institutional (CII) The CII category of customers is diversified and may require a tailored approach for meeting specified water use reduction targets. This could include focusing on large landscape irrigation, process water, business practices, or other means to meet CII water use reduction targets. The ability of CII customers to conserve water during a water shortage condition would be considered depending on which stage has been triggered and how much water use has already been reduced during previous stages. GSWC would work collaboratively with CII customers since water use cutbacks can impact business operations and solvency.
8.2.3 Water Features and Swimming Pools Water shortage response would focus on health and safety issues and tempering these uses based on the severity of the water shortage condition. The relative total water use from these sources would be a consideration for how water feature and swimming pool uses could be curtailed during specific water shortage conditions. Generally swimming pool filling and refilling would be impacted in the later stages of a water shortage condition. Water features are a relatively small discretionary use.
8.2.4 Defining Water Features GSWC would identify water features and estimate water use to be treated as a potential target for future demand reductions required during a water shortage condition.
CWC 10632 (b) Commencing with the urban water management plan update due July 1, 2016, for purposes of developing
the water shortage contingency analysis pursuant to subdivision (a), the urban water supplier shall analyze and define water features that are artificially supplied with water, including ponds, lakes, waterfalls, and fountains, separately from swimming pools and spas, as defined in subdivision (a) of Section 115921 of the Health and Safety Code.
Health and Safety Code Section 115921 As used in this article the following terms have the following meanings:
(a) “Swimming pool” or “pool” means any structure intended for swimming or recreational bathing that contains water over 18 inches deep. “Swimming pool” includes in-ground and aboveground structures and includes, but is not limited to, hot tubs, spas, portable spas, and non-portable wading pools.

Final Draft, 2015 Urban Water Management Plan – Simi Valley Page 8-7 Golden State Water Company \\sac2\job\2015\1570027.00_gswc-2015 uwmp\09-reports\simi valley\09-reports\9.09-reports\3_final draft\simi valley_2015_uwmp-final draft.docx
GSWC will begin collecting this information in its service areas, including the Simi Valley System, to be considered for use in response to future water shortage conditions.
8.2.5 Other Other measures may be considered as required to meet specific water shortage conditions.
8.3 Penalties, Charges, Other Enforcement of Prohibitions
CWC 10632 (a)(6) Penalties or charges for excessive use, where applicable.
In addition to prohibitions, Rule No. 14.1 provides penalties and charges for excessive water use. The enactment of these penalties and charges is contingent on approval of Rule 14.1 implementation by the CPUC. When the rule is in effect, violators receive one verbal and one written warning after which a flow-restricting device may be installed on the violator’s service connection for a reduction of up to 50 percent of normal flow or 6 ccf per month, whichever is greater. Table 8-3 summarizes the penalties and charges and the stage during which they take effect.
Table 8-3: Summary of Penalties and Charges for Excessive Use
Penalties or Charges Stage When Penalty
Takes Effect
Penalties for not reducing consumption III-V
Charges for excess use III-V
Flat fine; Charge per unit over allotment III-V
Flow restriction III-V
Termination of service III-V
8.4 Consumption Reduction Methods
CWC 10632 (a)(5) Consumption reduction methods in the most restrictive stages. Each urban water supplier may use any
type of consumption reduction methods in its water shortage contingency analysis that would reduce water use, are appropriate for its area, and have the ability to achieve a water use reduction consistent with up to a 50 percent reduction in water supply.
In addition to prohibitions and penalties, GSWC can use other consumption reduction methods to reduce water use up to 50 percent. Based on the requirements of the Act, Table 8-4 summarizes the methods that can be used by GSWC in order to enforce a reduction in consumption, where necessary (subject to CPUC approval). The following table may be updated as required if updates are approved by the CPUC.
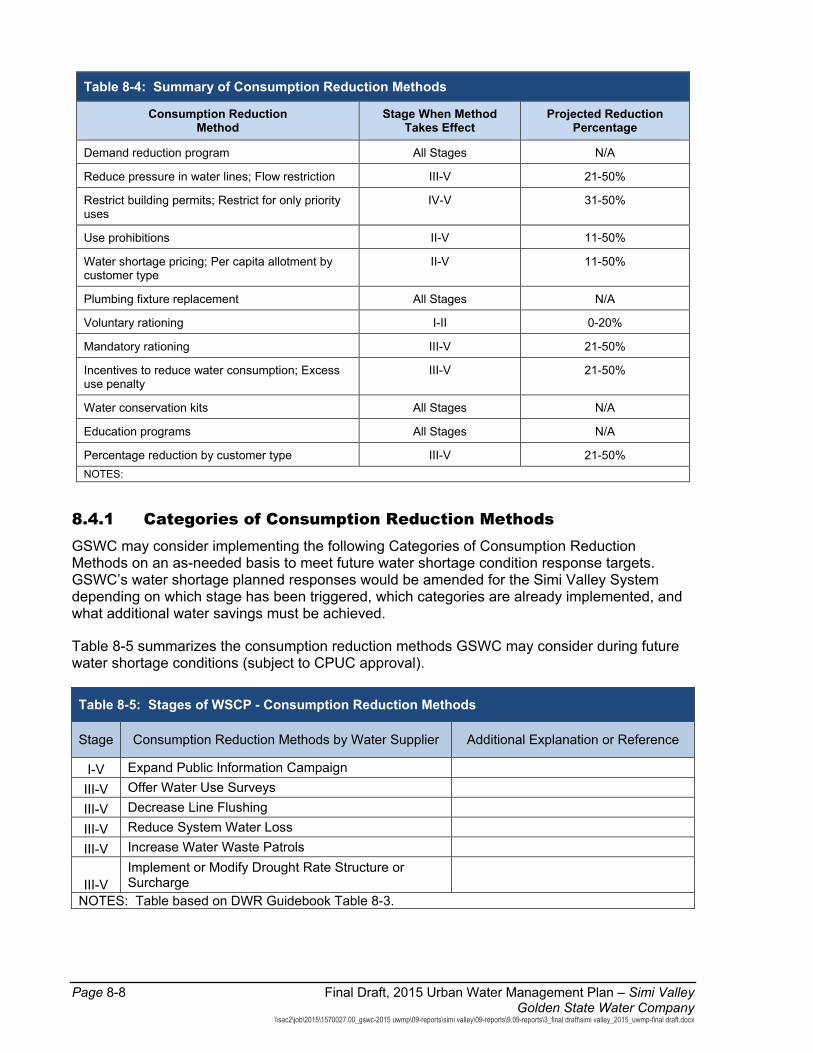
Page 8-8 Final Draft, 2015 Urban Water Management Plan – Simi Valley Golden State Water Company
\\sac2\job\2015\1570027.00_gswc-2015 uwmp\09-reports\simi valley\09-reports\9.09-reports\3_final draft\simi valley_2015_uwmp-final draft.docx
Table 8-4: Summary of Consumption Reduction Methods
Consumption Reduction Method
Stage When Method Takes Effect
Projected Reduction Percentage
Demand reduction program All Stages N/A
Reduce pressure in water lines; Flow restriction III-V 21-50%
Restrict building permits; Restrict for only priority uses
IV-V 31-50%
Use prohibitions II-V 11-50%
Water shortage pricing; Per capita allotment by customer type
II-V 11-50%
Plumbing fixture replacement All Stages N/A
Voluntary rationing I-II 0-20%
Mandatory rationing III-V 21-50%
Incentives to reduce water consumption; Excess use penalty
III-V 21-50%
Water conservation kits All Stages N/A
Education programs All Stages N/A
Percentage reduction by customer type III-V 21-50% NOTES:
8.4.1 Categories of Consumption Reduction Methods GSWC may consider implementing the following Categories of Consumption Reduction Methods on an as-needed basis to meet future water shortage condition response targets. GSWC’s water shortage planned responses would be amended for the Simi Valley System depending on which stage has been triggered, which categories are already implemented, and what additional water savings must be achieved.
Table 8-5 summarizes the consumption reduction methods GSWC may consider during future water shortage conditions (subject to CPUC approval).
Table 8-5: Stages of WSCP - Consumption Reduction Methods
Stage Consumption Reduction Methods by Water Supplier Additional Explanation or Reference
I-V Expand Public Information Campaign III-V Offer Water Use Surveys III-V Decrease Line Flushing III-V Reduce System Water Loss III-V Increase Water Waste Patrols
III-V Implement or Modify Drought Rate Structure or Surcharge
NOTES: Table based on DWR Guidebook Table 8-3.

Final Draft, 2015 Urban Water Management Plan – Simi Valley Page 8-9 Golden State Water Company \\sac2\job\2015\1570027.00_gswc-2015 uwmp\09-reports\simi valley\09-reports\9.09-reports\3_final draft\simi valley_2015_uwmp-final draft.docx
8.5 Determining Water Shortage Reductions
CWC 10632 (a)(9) A mechanism for determining actual reductions in water use pursuant to the urban water shortage
contingency analysis.
The Act asks for an analysis of mechanisms for determining actual reduction in water use when the Water Shortage Contingency Plan is in effect. Table 8-6 lists the mechanisms used by GSWC to monitor water use and the quality of data expected.
Table 8-6: Water-Use Monitoring Mechanisms
Mechanisms for Determining Actual Reductions Type and Quality of Data Expected
Customer meter readings Hourly/daily/monthly water consumption data for a specific user depending on frequency of readings
Production meter readings Hourly/daily/monthly water production depending on frequency of readings; correlates to water use plus system losses
In addition to the specific actions that GSWC can undertake to verify levels of water use and conservation achieved, GSWC can monitor long-term water use through regular meter readings, which gives GSWC the ability to flag exceptionally high usage for verification of water loss or abuse. Additional monitoring may be undertaken as needed depending on water shortage conditions or need to improve the precision of monitoring efforts.
8.6 Revenue and Expenditure Impacts
CWC 10632 (a)(7) An analysis of the impacts of each of the actions and conditions described in paragraphs (1) to (6),
inclusive, on the revenues and expenditures of the urban water supplier, and proposed measures to overcome those impacts, such as the development of reserves and rate adjustments.
The Act requires an analysis of the impacts of each of the actions taken for conservation and water restriction on the revenues and expenditures of the water supplier. Because GSWC is an investor-owned water utility and, as such, is regulated by the CPUC, the CPUC authorizes it to establish memorandum accounts (i.e., rate stabilization accounts) to track expenses and revenue shortfalls caused by both mandatory rationing and voluntary conservation efforts. Utilities with CPUC-approved water management plans are authorized to implement a surcharge to recover revenue shortfalls recorded in their drought memorandum accounts.
Table 8-7 provides a summary of actions with associated revenue reductions.
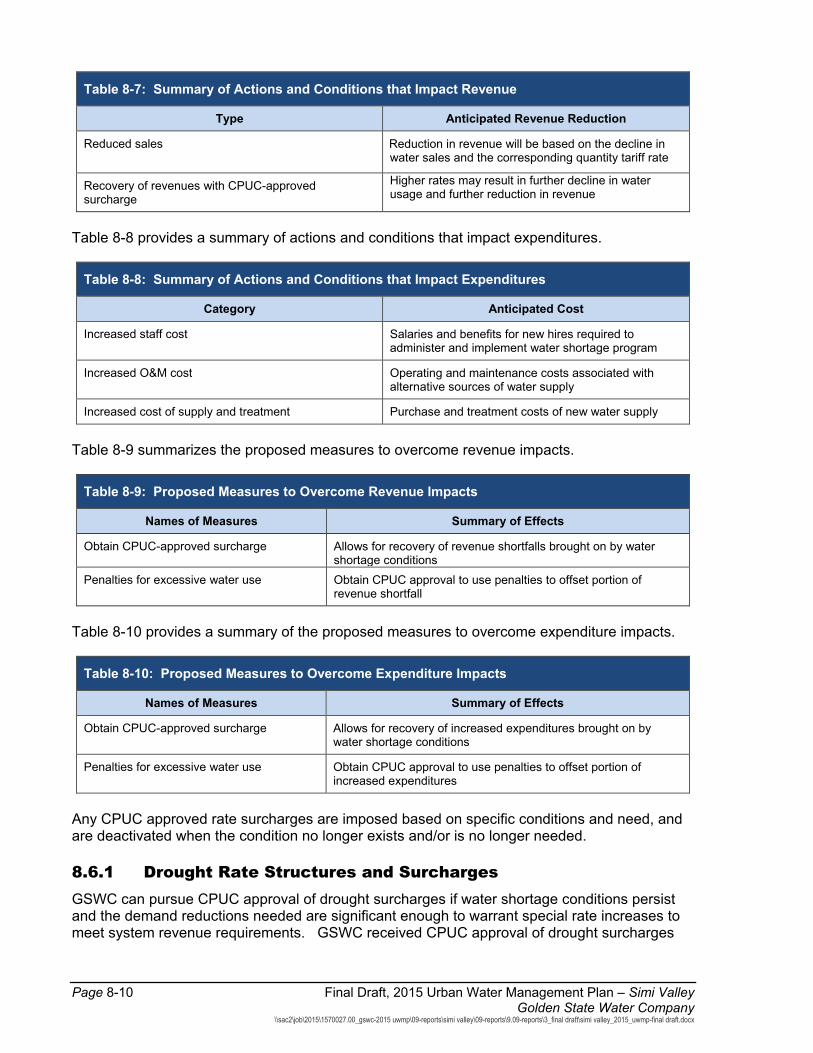
Page 8-10 Final Draft, 2015 Urban Water Management Plan – Simi Valley Golden State Water Company
\\sac2\job\2015\1570027.00_gswc-2015 uwmp\09-reports\simi valley\09-reports\9.09-reports\3_final draft\simi valley_2015_uwmp-final draft.docx
Table 8-7: Summary of Actions and Conditions that Impact Revenue
Type Anticipated Revenue Reduction
Reduced sales Reduction in revenue will be based on the decline in water sales and the corresponding quantity tariff rate
Recovery of revenues with CPUC-approved surcharge
Higher rates may result in further decline in water usage and further reduction in revenue
Table 8-8 provides a summary of actions and conditions that impact expenditures.
Table 8-8: Summary of Actions and Conditions that Impact Expenditures
Category Anticipated Cost
Increased staff cost Salaries and benefits for new hires required to administer and implement water shortage program
Increased O&M cost Operating and maintenance costs associated with alternative sources of water supply
Increased cost of supply and treatment Purchase and treatment costs of new water supply
Table 8-9 summarizes the proposed measures to overcome revenue impacts.
Table 8-9: Proposed Measures to Overcome Revenue Impacts
Names of Measures Summary of Effects
Obtain CPUC-approved surcharge Allows for recovery of revenue shortfalls brought on by water shortage conditions
Penalties for excessive water use Obtain CPUC approval to use penalties to offset portion of revenue shortfall
Table 8-10 provides a summary of the proposed measures to overcome expenditure impacts.
Table 8-10: Proposed Measures to Overcome Expenditure Impacts
Names of Measures Summary of Effects
Obtain CPUC-approved surcharge Allows for recovery of increased expenditures brought on by water shortage conditions
Penalties for excessive water use Obtain CPUC approval to use penalties to offset portion of increased expenditures
Any CPUC approved rate surcharges are imposed based on specific conditions and need, and are deactivated when the condition no longer exists and/or is no longer needed.
8.6.1 Drought Rate Structures and Surcharges GSWC can pursue CPUC approval of drought surcharges if water shortage conditions persist and the demand reductions needed are significant enough to warrant special rate increases to meet system revenue requirements. GSWC received CPUC approval of drought surcharges
Final Draft, 2015 Urban Water Management Plan – Simi Valley Page 8-11 Golden State Water Company \\sac2\job\2015\1570027.00_gswc-2015 uwmp\09-reports\simi valley\09-reports\9.09-reports\3_final draft\simi valley_2015_uwmp-final draft.docx
during the current extended drought condition. Rate stabilization fund balances were not adequate to cover the lower revenues from significant demand reductions experienced during the drought. These drought surcharge revenues allowed GSWC to meet system revenue requirements while meeting demand reduction targets. Drought surcharges would be discontinued when triggered water shortage conditions are deactivated and no longer in effect.
8.6.2 Use of Financial Reserves Being a regulated utility under the CPUC – GSWC is not allowed a financial reserve account. GSWC has General Rate Cases (GRCs) approved covering three years of rate schedules that include the cost of providing service in each water system, accounting for operation and maintenance, repair and replacement, and capital improvement costs required to meet all regulations and provide sustainable water service to customers. The rate case determining water charges during the 2013-2015 period are included in Appendix F. For extended water shortage conditions, GSWC would also likely request CPUC approval of Memorandum Accounts to track emergency or unforeseen costs during the extended demand reduction period. The tracked costs would later be reviewed by the CPUC and recovered through drought surcharges to generate additional revenues during extended demand reduction periods. Per CPUC rate making policy, GSWC financial reserves are not allowed to be addressed in the CPUC GRC process.
8.6.3 Other Measures GSWC may consider other measures as required to meet water shortage conditions.
8.7 Resolution or Ordinance
CWC 10632 (a)(8) A draft water shortage contingency resolution or ordinance.
Appendix F contains the GSWC Rule No. 14.1 policy, Schedule 14.1 and Rule 20 for the Simi Valley System.
8.8 Catastrophic Supply Interruption
CWC 10632 (a)(3) Actions to be undertaken by the urban water supplier to prepare for, and implement during, a catastrophic
interruption of water supplies including, but not limited to, a regional power outage, an earthquake, or other disaster.
The Act requires documentation of actions to be undertaken by the water supplier to prepare for, and implement during, a catastrophic interruption of water supplies. A catastrophic interruption constitutes a proclamation of a water shortage and could result from any event (either natural or man-made) that causes a water shortage severe enough to classify as either a Stage IV or Stage V water supply shortage condition.
In order to prepare for catastrophic events, GSWC has prepared an Emergency Response Plan (ERP) in accordance with other state and federal regulations. The purpose of this plan is to
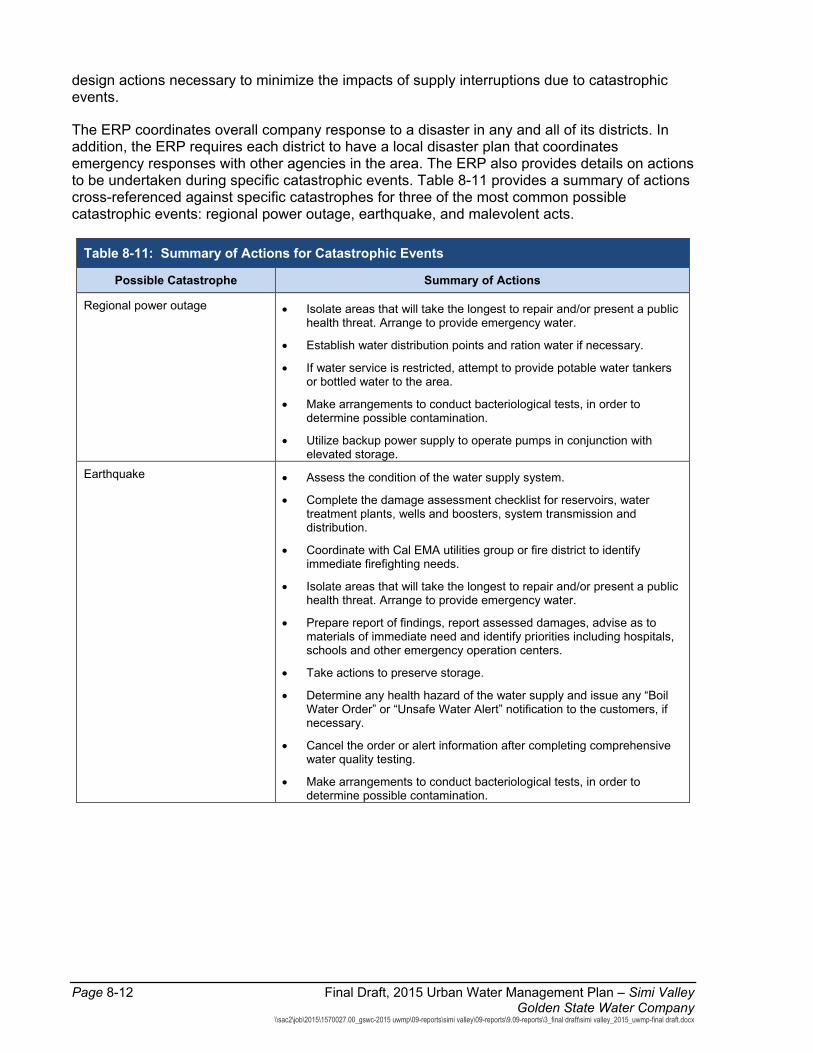
Page 8-12 Final Draft, 2015 Urban Water Management Plan – Simi Valley Golden State Water Company
\\sac2\job\2015\1570027.00_gswc-2015 uwmp\09-reports\simi valley\09-reports\9.09-reports\3_final draft\simi valley_2015_uwmp-final draft.docx
design actions necessary to minimize the impacts of supply interruptions due to catastrophic events.
The ERP coordinates overall company response to a disaster in any and all of its districts. In addition, the ERP requires each district to have a local disaster plan that coordinates emergency responses with other agencies in the area. The ERP also provides details on actions to be undertaken during specific catastrophic events. Table 8-11 provides a summary of actions cross-referenced against specific catastrophes for three of the most common possible catastrophic events: regional power outage, earthquake, and malevolent acts.
Table 8-11: Summary of Actions for Catastrophic Events
Possible Catastrophe Summary of Actions
Regional power outage • Isolate areas that will take the longest to repair and/or present a public health threat. Arrange to provide emergency water.
• Establish water distribution points and ration water if necessary.
• If water service is restricted, attempt to provide potable water tankers or bottled water to the area.
• Make arrangements to conduct bacteriological tests, in order to determine possible contamination.
• Utilize backup power supply to operate pumps in conjunction with elevated storage.
Earthquake • Assess the condition of the water supply system.
• Complete the damage assessment checklist for reservoirs, water treatment plants, wells and boosters, system transmission and distribution.
• Coordinate with Cal EMA utilities group or fire district to identify immediate firefighting needs.
• Isolate areas that will take the longest to repair and/or present a public health threat. Arrange to provide emergency water.
• Prepare report of findings, report assessed damages, advise as to materials of immediate need and identify priorities including hospitals, schools and other emergency operation centers.
• Take actions to preserve storage.
• Determine any health hazard of the water supply and issue any “Boil Water Order” or “Unsafe Water Alert” notification to the customers, if necessary.
• Cancel the order or alert information after completing comprehensive water quality testing.
• Make arrangements to conduct bacteriological tests, in order to determine possible contamination.
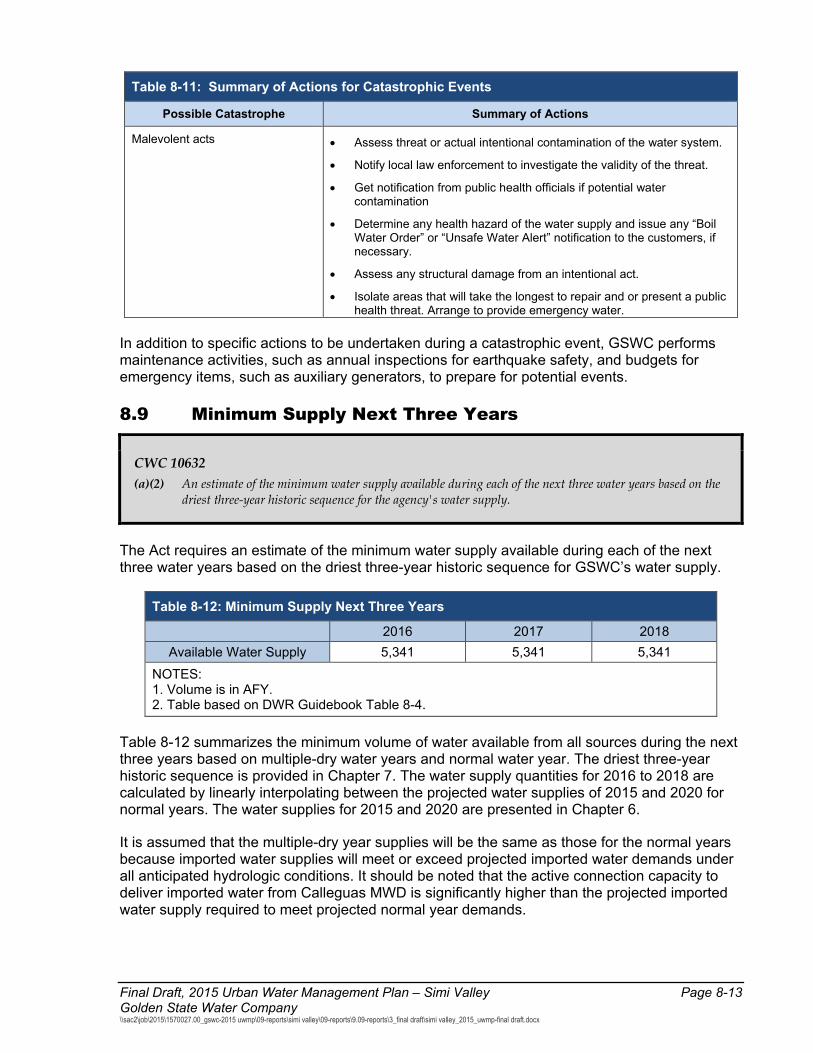
Final Draft, 2015 Urban Water Management Plan – Simi Valley Page 8-13 Golden State Water Company \\sac2\job\2015\1570027.00_gswc-2015 uwmp\09-reports\simi valley\09-reports\9.09-reports\3_final draft\simi valley_2015_uwmp-final draft.docx
Table 8-11: Summary of Actions for Catastrophic Events
Possible Catastrophe Summary of Actions
Malevolent acts • Assess threat or actual intentional contamination of the water system.
• Notify local law enforcement to investigate the validity of the threat.
• Get notification from public health officials if potential water contamination
• Determine any health hazard of the water supply and issue any “Boil Water Order” or “Unsafe Water Alert” notification to the customers, if necessary.
• Assess any structural damage from an intentional act.
• Isolate areas that will take the longest to repair and or present a public health threat. Arrange to provide emergency water.
In addition to specific actions to be undertaken during a catastrophic event, GSWC performs maintenance activities, such as annual inspections for earthquake safety, and budgets for emergency items, such as auxiliary generators, to prepare for potential events.
8.9 Minimum Supply Next Three Years
CWC 10632 (a)(2) An estimate of the minimum water supply available during each of the next three water years based on the
driest three-year historic sequence for the agency's water supply.
The Act requires an estimate of the minimum water supply available during each of the next three water years based on the driest three-year historic sequence for GSWC’s water supply.
Table 8-12: Minimum Supply Next Three Years
2016 2017 2018 Available Water Supply 5,341 5,341 5,341
NOTES: 1. Volume is in AFY. 2. Table based on DWR Guidebook Table 8-4.
Table 8-12 summarizes the minimum volume of water available from all sources during the next three years based on multiple-dry water years and normal water year. The driest three-year historic sequence is provided in Chapter 7. The water supply quantities for 2016 to 2018 are calculated by linearly interpolating between the projected water supplies of 2015 and 2020 for normal years. The water supplies for 2015 and 2020 are presented in Chapter 6.
It is assumed that the multiple-dry year supplies will be the same as those for the normal years because imported water supplies will meet or exceed projected imported water demands under all anticipated hydrologic conditions. It should be noted that the active connection capacity to deliver imported water from Calleguas MWD is significantly higher than the projected imported water supply required to meet projected normal year demands.
Page 8-14 Final Draft, 2015 Urban Water Management Plan – Simi Valley Golden State Water Company
\\sac2\job\2015\1570027.00_gswc-2015 uwmp\09-reports\simi valley\09-reports\9.09-reports\3_final draft\simi valley_2015_uwmp-final draft.docx
GSWC’s supply to the Simi Valley System is expected to be highly reliable from 2016 to 2018. This reliability is a result of:
Projected reliability of Calleguas as a member of Metropolitan, which expects surface water supplies to be highly reliable during normal and dry years; and
Reliable groundwater supplies as indicated in Chapters 6 and 7.

Final Draft, 2015 Urban Water Management Plan – Simi Valley Page 9-1 Golden State Water Company \\sac2\job\2015\1570027.00_gswc-2015 uwmp\09-reports\simi valley\09-reports\9.09-reports\3_final draft\simi valley_2015_uwmp-final draft.docx
Chapter 9: Demand Management Measures
This Chapter addresses the Demand Management Measure (DMM) requirements of the Act for the Simi Valley System and includes a description of utility-based and other DMMs being implemented, DMMs implemented over the past five years, and an overview of DMMs planned for implementation over the next five years to reliably meet SBX7-7 water use targets by 2020.
9.1 Demand Management Measures for Retail Agencies
CWC 10631 (f)(A)... The narrative shall describe the water demand management measure that the supplier plans to implement to
achieve its water use targets pursuant to Section 10608.20. (B) The narrative pursuant to this paragraph shall include descriptions of the following water demand
management measures: (i) Water waste prevention ordinances. (ii) Metering. (iii) Conservation pricing. (iv) Public education and outreach. (v) Programs to assess and manage distribution system real loss. (vi) Water conservation program coordination and staffing support. (vii) Other demand management measures that have a significant impact on water use as measured in gallons
per capita per day, including innovative measures, if implemented.
Sections 9.1.1 through 9.1.6 provide a narrative description of utility-based DMMs that GSWC has been implementing since its 2010 UWMPs were developed and adopted. GSWC is currently implementing all of these DMMs as standard practices. Section 9.1.7 provides a narrative description of other DMMs being implemented in the Simi Valley System that impact total water demands.
9.1.1 Water Waste Prevention Ordinances Although GSWC does not have rule-making authority, it supports member agencies and local cities in efforts to adopt ordinances that will reduce water waste. For GSWC, this provision is implemented through CPUC-approved rules provided in Appendix F, including Rule No. 14.1, the Water Conservation and Rationing Plan, Rule 20, prohibition of water waste, and Rule 11, Discontinuance and Restoration of Service.
The CPUC’s methodology for water utilities to implement Rule No. 14.1 is documented in Standard Practice U-40-W, “Instructions for Water Conservation, Rationing, and Service Connection Moratoria.” Rule No. 14.1 sets forth water use violation fines, charges for flow restrictors, and the period during which mandatory conservation and rationing measures will be in effect. Water conservation restrictions include:
Use of potable water for more than minimal landscaping.
Use through a broken or defective water meter.
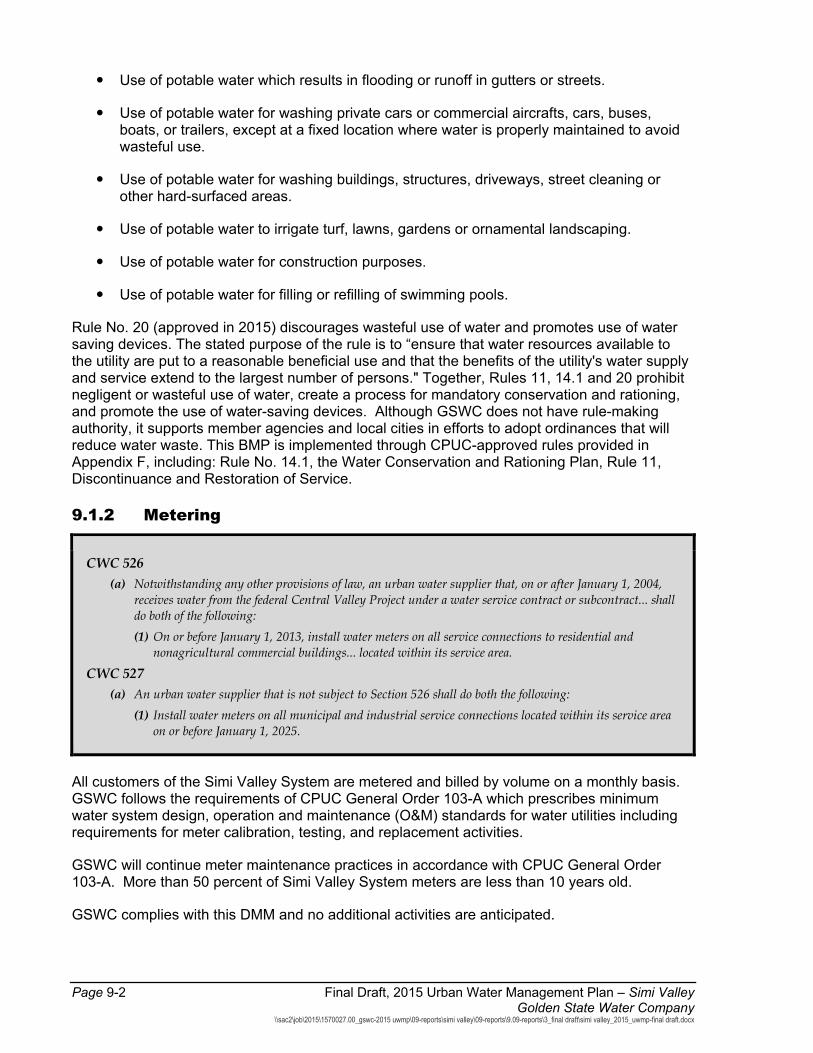
Page 9-2 Final Draft, 2015 Urban Water Management Plan – Simi Valley Golden State Water Company
\\sac2\job\2015\1570027.00_gswc-2015 uwmp\09-reports\simi valley\09-reports\9.09-reports\3_final draft\simi valley_2015_uwmp-final draft.docx
Use of potable water which results in flooding or runoff in gutters or streets.
Use of potable water for washing private cars or commercial aircrafts, cars, buses, boats, or trailers, except at a fixed location where water is properly maintained to avoid wasteful use.
Use of potable water for washing buildings, structures, driveways, street cleaning or other hard-surfaced areas.
Use of potable water to irrigate turf, lawns, gardens or ornamental landscaping.
Use of potable water for construction purposes.
Use of potable water for filling or refilling of swimming pools.
Rule No. 20 (approved in 2015) discourages wasteful use of water and promotes use of water saving devices. The stated purpose of the rule is to “ensure that water resources available to the utility are put to a reasonable beneficial use and that the benefits of the utility's water supply and service extend to the largest number of persons." Together, Rules 11, 14.1 and 20 prohibit negligent or wasteful use of water, create a process for mandatory conservation and rationing, and promote the use of water-saving devices. Although GSWC does not have rule-making authority, it supports member agencies and local cities in efforts to adopt ordinances that will reduce water waste. This BMP is implemented through CPUC-approved rules provided in Appendix F, including: Rule No. 14.1, the Water Conservation and Rationing Plan, Rule 11, Discontinuance and Restoration of Service.
9.1.2 Metering
CWC 526 (a) Notwithstanding any other provisions of law, an urban water supplier that, on or after January 1, 2004,
receives water from the federal Central Valley Project under a water service contract or subcontract... shall do both of the following: (1) On or before January 1, 2013, install water meters on all service connections to residential and
nonagricultural commercial buildings... located within its service area.
CWC 527 (a) An urban water supplier that is not subject to Section 526 shall do both the following:
(1) Install water meters on all municipal and industrial service connections located within its service area on or before January 1, 2025.
All customers of the Simi Valley System are metered and billed by volume on a monthly basis. GSWC follows the requirements of CPUC General Order 103-A which prescribes minimum water system design, operation and maintenance (O&M) standards for water utilities including requirements for meter calibration, testing, and replacement activities.
GSWC will continue meter maintenance practices in accordance with CPUC General Order 103-A. More than 50 percent of Simi Valley System meters are less than 10 years old.
GSWC complies with this DMM and no additional activities are anticipated.
Final Draft, 2015 Urban Water Management Plan – Simi Valley Page 9-3 Golden State Water Company \\sac2\job\2015\1570027.00_gswc-2015 uwmp\09-reports\simi valley\09-reports\9.09-reports\3_final draft\simi valley_2015_uwmp-final draft.docx
9.1.3 Conservation Pricing All metered customers in the Simi Valley System are charged volumetrically for water service. Effective September 1, 2009 GSWC implemented a tiered conservation pricing rate structure for residential customers as approved by the CPUC for the Simi Valley System. The current rate structure (included as Appendix F ) for residential customers has a fixed charge as well as volumetric escalating pricing tiers, depending on customer usage. Non-residential customers have a fixed charge and a constant volumetric charge. Implementation of this revised pricing policy is the result of GSWC’s collaboration with CPUC to implement conservation tiered rates for residential customers of investor-owned utilities. Unmetered customers are charged flat rates for service. Tiered rates are consistent with the CPUC’s 2010 Water Action Plan.
Since 2009, GSWC has been instituting third tier pricing structures and increasing volumetric charges for residential customers to cover water system costs.
GSWC will be submitting a General Rate Case filing with the CPUC in 2017 which includes proposed rates over the next three years based on volumetric charges for customers in the Simi Valley Rate Making Area. If approved, this rate adjustment will allow GSWC to adjust volumetric revenues and maintain a conservation-oriented rate structure that encourages efficient water use today and in the future.
GSWC has updated its Customer Information System (CIS) companywide. The new system allows access to total fixed and volumetric charge data. GSWC can utilize this data to track water use patterns and determine if annual revenue requirements will be met for a given water system.
GSWC is planning for the process of filing a General Rate Case (2017) application to adjust volumetric charges for residential and CII metered customers in its systems based on water system costs. If approved, the tiered rates for residential and uniform rates for CII accounts are expected to maintain water savings incentives and increase participation in DMM programs in many of GSWC’s systems.
9.1.4 Public Education and Outreach Public Information Programs GSWC offers public information programs for Simi Valley customers, provided by CMWD and Metropolitan. For 2015, GSWC is stipulated to have spent $5,857 for public outreach in the Simi Valley System. GSWC’s outreach efforts in the Simi Valley System include free conservation literature and brochures in the customer service area office and annual water conservation ads in the local paper in addition to participating in various conservation events. Customers can learn about rebates and other conservation programs on GSWC’s website, which provides links to Metropolitan’s website for detailed information.
School Education Programs GSWC conducted school conservation education programs for an estimated 15,525 students companywide. GSWC sponsors the WaterWise school education program in Simi Valley elementary schools, as implemented by its wholesalers, CMWD and Metropolitan, with an annual budget of approximately $11,000 for the Simi Valley Reporting Unit. Students learn about conservation practices and receive a free conservation kit that includes a water survey, 1.5 gpm low-flow shower head, 1.5 gpm kitchen sink and 1.0 gpm bathroom aerators, leak detection dye tablets, a watering gauge, and step-by-step instructions. The students are given a homework assignment to complete a water audit form and replace inefficient showerheads and
Page 9-4 Final Draft, 2015 Urban Water Management Plan – Simi Valley Golden State Water Company
\\sac2\job\2015\1570027.00_gswc-2015 uwmp\09-reports\simi valley\09-reports\9.09-reports\3_final draft\simi valley_2015_uwmp-final draft.docx
aerators with water-saving devices provided in the kit. The program has been a very effective way for GSWC to reach a large number of customers and educate students, who in turn educate their parents about water-efficiency practices and low-flow plumbing devices.
Results from the program are tracked, and a comprehensive Program Summary Report is generated at the end of each school year. This report documents the estimated reduction in water usage that was achieved through the retrofits and provides data on the percentage of students who participated in the program..
In addition to the DSC and partnering with wholesalers and other public agencies, GSWC implements Resource Action Programs (RAP) and the Science Discover (SD) program.
9.1.5 Programs to Assess and Manage Distribution System Real Loss
GSWC has an active Water Loss Control Program. Water losses are monitored by the Operations Engineering Department by reviewing the annual Distribution System Water Audits conducted in each water system. GSWC tracks both real and apparent losses as part of its on-going water loss control efforts. If the Operations Engineer determines from the annual water audit analysis that a leak detection survey is needed, GSWC will contract with a qualified leak detection company to perform the survey using the most current leak detection technology.
GSWC has been performing annual Distribution System Water Audits, consistent with American Water Works Association (AWWA) M36 methodology, since its 2010 UWMPs. If annual audit results indicate water losses would exceed water system goals, a full audit is triggered to identify water loss sources and determine impacts on overall system water losses.
For Calendar Year 2014, GSWC implemented the AWWA M36 Standard Water Audit methodology using version 5.0 of the water audit software. The approach consists of a component analysis of metered water sources, metered water demands, quantification of water losses (apparent and real), and calculation of non-revenue water as a percent of total system flows. Results of the analysis, which are included in Appendix A, show an infrastructure leakage index (ILI) of 0.17. According to general guidelines, an ILI of 1.0 to 3.0 is appropriate for systems where water resources are costly to develop or purchase, ability to increase revenues via water rates is greatly limited because of regulation or low ratepayer affordability, and operating with system leakage above this level would require expansion of existing infrastructure and/or additional water resources to meet the demand. The initial evaluation suggests that the Simi Valley System will review the water audit analysis with a focus on determining whether production and customer metering data contains any errors that is skewing results, as defined by AWWA methodology.
GSWC will continue to annually implement the Standard Audit and Water Balance worksheets procedures following the AWWA M36 protocol for calendar years 2015-2019, taking measurable steps to validate water audit data by October 2017. Data validation will improve data accuracy while cost-effectively reducing the ILI and non-revenue water through repair of leaks and other measures.
GSWC used version 5.0 of the AWWA Water Audit software for its system water audit evaluations, and will use the current software for all future evaluations (subject to AWWA software updates) which includes metrics for evaluating the validity of the system data. GSWC already has a comprehensive work order management system in place that documents leak
Final Draft, 2015 Urban Water Management Plan – Simi Valley Page 9-5 Golden State Water Company \\sac2\job\2015\1570027.00_gswc-2015 uwmp\09-reports\simi valley\09-reports\9.09-reports\3_final draft\simi valley_2015_uwmp-final draft.docx
locations and repair history which provides a solid foundation for future water loss control actions.
9.1.6 Water Conservation Program Coordination and Staffing Support
GSWC maintains a fully staffed Conservation Department with a companywide Water Use Efficiency Manager, Water Conservation Analyst and one Water Conservation Coordinator for each of the three regions to administer conservation programs and support wholesaler programs. GSWC also utilizes consultants to support program development and implementation on an as-needed basis.
9.1.7 Other Demand Management Measures GSWC intends to continue to plan and implement other DMM programs in the Simi Valley System using both GSWC only programs as well as collaborative programs with regional partners. Metropolitan is responsible for administering many of the DMM programs that GSWC offers to Simi Valley System customers. Additional detailed descriptions of wholesaler DMM implementation can also be found in Metropolitans DMM program documents and UWMPs. GSWC will continue to support Metropolitan activities and will focus on improving customer outreach and promoting awareness of available DMM programs.
As previously mentioned, once the next rate case is approved by the CPUC in 2017, GSWC will develop a prioritized water use efficiency program and implementation schedule for all customer service areas in the company focusing on systems that do not appear to be consistently meeting SBX7-7 2020 water use reduction targets. Specific conservation activities will be implemented that are both locally cost-effective and/or cost-effective to implement on a companywide basis. At this time, cost-effectiveness in the Simi Valley System will be based on the avoided cost of water.
9.1.7.1 Residential Assistance Programs GSWC has an audit program targeting high-use single-family (SF) and multi-family (MF) customers. GSWC identifies these customers based on billing data, and contacts them to offer free audits. Audits are also offered to walk-in customers at the local customer service area office. Additional home audits are conducted as part of the school education program (Section 7.3.1.6). Low-flow devices are available for free to customers at the GSWC office and are distributed to students as part of the free conservation kits they receive in the school education program.
9.1.7.2 Landscape Water Surveys GSWC identifies high-water use SF and MF customers throughout the company service areas and contacts them to offer free landscape water audits which are tracked with other DMM activities.
9.1.7.3 High-Efficiency Clothes Washers GSWC customers are eligible to participate in the High Efficiency Clothes Washer (HECW) rebate program administered by Metropolitan, which has been available since 2003. Metropolitan has supplemented its HECW rebate using state or federal grants whenever possible. The water efficiency of clothes washers is represented by the “water factor,” which is a measure of the amount of water used to wash a standard load of laundry. Washers with a lower water factor save more water. Metropolitan has continued to transform the market by changing its program requirement to lower water factors. The program eligibility requirement is currently
Page 9-6 Final Draft, 2015 Urban Water Management Plan – Simi Valley Golden State Water Company
\\sac2\job\2015\1570027.00_gswc-2015 uwmp\09-reports\simi valley\09-reports\9.09-reports\3_final draft\simi valley_2015_uwmp-final draft.docx
set at water factor 4.0, which saves more than 10,000 gallons per year per washer over a conventional top loading washer. GSWC does not contribute funds to the HECW rebate program. The GSWC webpage for Simi Valley advertises the rebates and provides a link to the Metropolitan website for full program details.
9.1.7.4 WaterSense Specification (WSS) Toilets Simi Valley System customers have been eligible to participate in the High Efficiency Toilet (HET) rebate program administered by Metropolitan since 1998. Currently, Metropolitan only provides funding for high-efficiency toilets (1.28 gallons per flush or less), which use 20 percent less than ultra-low-flush toilets (1.6 gallons per flush). Ultra-low-flush toilets are the current standard defined by the plumbing code. Metropolitan uses the EPA’s WaterSense list of tested toilets in its programs as qualifying models. The GSWC webpage for Simi Valley advertises the rebates and provides a link to the Metropolitan website for full details.
9.1.7.5 WaterSense Specification for Residential Development Integration of WSS fixtures for new development has been accelerated by the 2010 California Green Building Standards Code (CAL Green Code), which became effective in January 2011. The CAL Green Code sets mandatory green building measures, including a 20 percent reduction in indoor water use, as well as dedicated meter requirements and regulations addressing landscape irrigation and design. Local jurisdictions, at a minimum, must adopt the mandatory measures; the CAL Green Code also identifies voluntary measures that set a higher standard of efficiency for possible adoption. GSWC supports these new standards however does not have legal authority to adopt ordinances or regulations pertaining to this standard.
GSWC will continue to support incentive programs for water efficient devices and standards adopted by Metropolitan and Ventura County.
9.1.7.6 Commercial, Industrial, and Institutional DMMs The Commercial, Industrial, and Institutional BMPs are implemented by Metropolitan on behalf of GSWC. Simi Valley System customers are eligible to participate in Metropolitan’s CII program, Save Water, Save-A-Buck Program for Southern California businesses. Those who qualify are eligible for generous rebates to help encourage water efficiency and conservation. Devices available for rebates include: high efficiency toilets, zero water and ultra low water urinals, connectionless food steamers, air-cooled ice machines (Tier III), cooling tower and pH conductivity controllers, water brooms, and dry vacuum pumps. Additionally, the Save-A-Buck program offers rebates for outdoor landscaping equipment such as: weather based irrigation controllers, central computer irrigation controllers, rotating spray nozzles retrofits, and high efficiency large rotary nozzle retrofits.
9.1.7.7 Large Landscape GSWC’s landscape program consists of identifying and contacting high-use customers, providing information and offering water use surveys, voluntary water use budgets, and landscape training. Conservation-oriented rate structures and price increases over time are expected to generate increased participation rates along with outside funding sources that provide the funding mechanism for increased resources for program marketing.
Final Draft, 2015 Urban Water Management Plan – Simi Valley Page 9-7 Golden State Water Company \\sac2\job\2015\1570027.00_gswc-2015 uwmp\09-reports\simi valley\09-reports\9.09-reports\3_final draft\simi valley_2015_uwmp-final draft.docx
9.1.7.8 Financial Incentives Ongoing and/or additional financial incentives may be offered directly to customers by GSWC or in partnership with other agencies to improve cost-effectiveness as follows:
HECWs rebates: High-Efficiency Clothes Washer rebates are already being implemented by CCWD on behalf of GSWC and will continue to provide measurable water savings.
Zero and low-flow urinal rebates: Rebates would include CII fixtures such as zero consumption and ultra-low volume urinals as well as CII specific HETs.
Expansion of fixture rebates to CII and multi-family customers in all systems: Currently the toilet rebate programs are only available to CII and MF customers in select systems. GSWC will evaluate expansion of the programs to all customers and there will be increased focus on marketing to large Home Owner Association accounts.
Larger variety of fixture rebates: This may include hot water distribution tanks, and high-pressure spray nozzles.
Cash-for-Grass rebates: Customers will be provided with an incentive of up to $0.5 per square-foot of turf removed and replaced with California-Friendly landscape. The program is being considered for both residential and CII customers; it is currently being offered by CCWD and in select GSWC systems.
Expansion of large landscape program: GSWC will be evaluating the effectiveness of the current landscape program and making adjustments depending on the results. If the program is found to be successful at meeting reduction targets, the program may be accelerated and more devices will be offered, such as precision nozzles.
9.1.7.9 Building Code/New Standards GSWC supports adoption of the CAL Green Building Code standards (adopted January 2011) and SB407 provisions (Plumbing Retrofit on Resale) that improve the water use efficiency of new accounts and older accounts that retrofit fixtures and appliances with efficient products. These code changes will assist GSWC in meeting future water use targets on a reliable basis.
9.1.7.10 Information/Tracking Information and tracking represents a new element to the existing programs focusing on collecting and processing information and ensuring that the programs are on track to meet water savings goals. These activities will assist in DMM program design by providing more robust information about customers and their water use patterns. The immediate priorities include:
1. Automatic Meter Reading (AMR): GSWC will continue to implement and utilize AMR in its systems as a priority to obtain real time data for water usage and identify customer-side leaks. This information can also help GSWC monitor the impacts of existing programs, make adjustments where necessary and develop new programs.
2. Water Use Tracking Tools: Another priority, GSWC will continue to improve DMM program database tracking tools for water savings associated with its conservation plans and increase flexibility in adding or changing program elements to improve results.
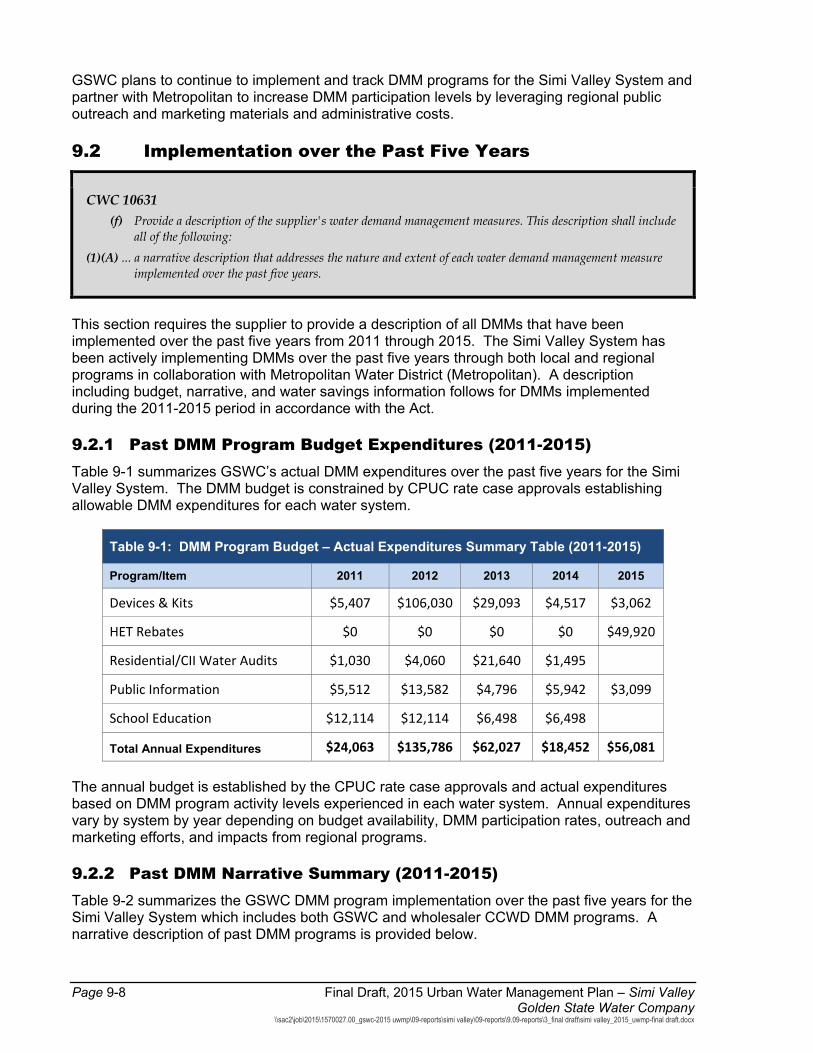
Page 9-8 Final Draft, 2015 Urban Water Management Plan – Simi Valley Golden State Water Company
\\sac2\job\2015\1570027.00_gswc-2015 uwmp\09-reports\simi valley\09-reports\9.09-reports\3_final draft\simi valley_2015_uwmp-final draft.docx
GSWC plans to continue to implement and track DMM programs for the Simi Valley System and partner with Metropolitan to increase DMM participation levels by leveraging regional public outreach and marketing materials and administrative costs.
9.2 Implementation over the Past Five Years
CWC 10631 (f) Provide a description of the supplier's water demand management measures. This description shall include
all of the following: (1)(A) ... a narrative description that addresses the nature and extent of each water demand management measure
implemented over the past five years.
This section requires the supplier to provide a description of all DMMs that have been implemented over the past five years from 2011 through 2015. The Simi Valley System has been actively implementing DMMs over the past five years through both local and regional programs in collaboration with Metropolitan Water District (Metropolitan). A description including budget, narrative, and water savings information follows for DMMs implemented during the 2011-2015 period in accordance with the Act.
9.2.1 Past DMM Program Budget Expenditures (2011-2015) Table 9-1 summarizes GSWC’s actual DMM expenditures over the past five years for the Simi Valley System. The DMM budget is constrained by CPUC rate case approvals establishing allowable DMM expenditures for each water system.
Table 9-1: DMM Program Budget – Actual Expenditures Summary Table (2011-2015)
Program/Item 2011 2012 2013 2014 2015
Devices & Kits $5,407 $106,030 $29,093 $4,517 $3,062
HET Rebates $0 $0 $0 $0 $49,920
Residential/CII Water Audits $1,030 $4,060 $21,640 $1,495
Public Information $5,512 $13,582 $4,796 $5,942 $3,099
School Education $12,114 $12,114 $6,498 $6,498
Total Annual Expenditures $24,063 $135,786 $62,027 $18,452 $56,081
The annual budget is established by the CPUC rate case approvals and actual expenditures based on DMM program activity levels experienced in each water system. Annual expenditures vary by system by year depending on budget availability, DMM participation rates, outreach and marketing efforts, and impacts from regional programs.
9.2.2 Past DMM Narrative Summary (2011-2015) Table 9-2 summarizes the GSWC DMM program implementation over the past five years for the Simi Valley System which includes both GSWC and wholesaler CCWD DMM programs. A narrative description of past DMM programs is provided below.
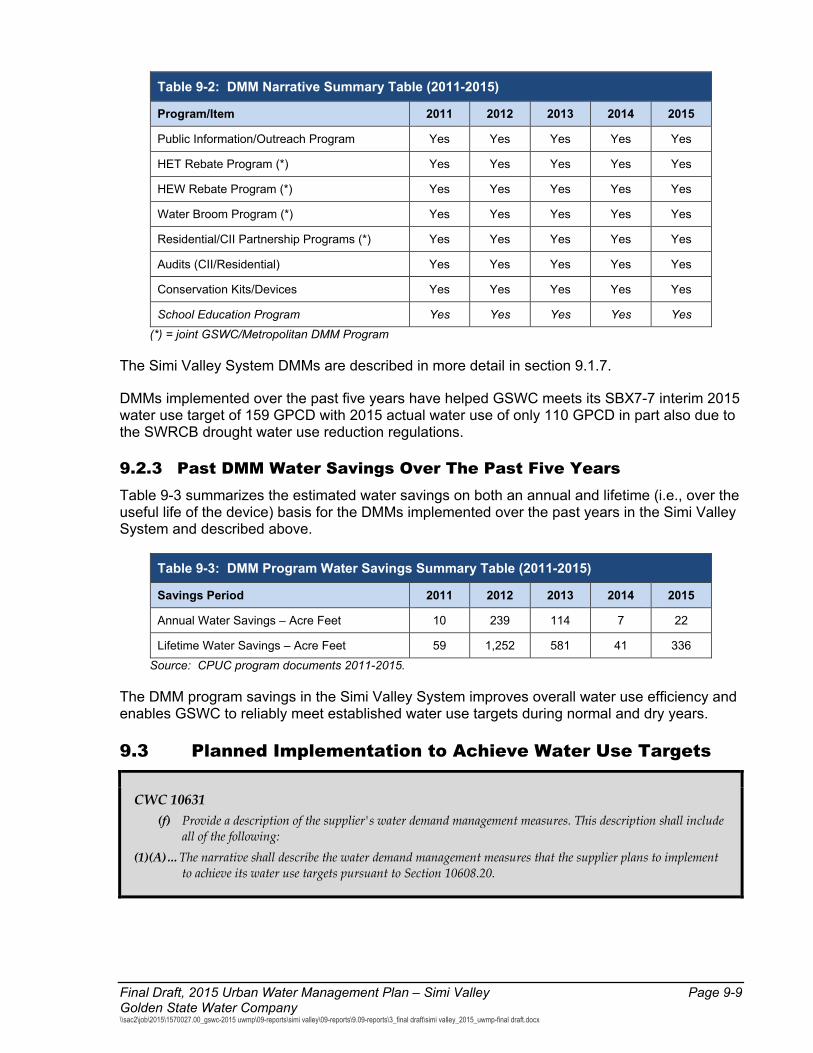
Final Draft, 2015 Urban Water Management Plan – Simi Valley Page 9-9 Golden State Water Company \\sac2\job\2015\1570027.00_gswc-2015 uwmp\09-reports\simi valley\09-reports\9.09-reports\3_final draft\simi valley_2015_uwmp-final draft.docx
Table 9-2: DMM Narrative Summary Table (2011-2015)
Program/Item 2011 2012 2013 2014 2015
Public Information/Outreach Program Yes Yes Yes Yes Yes
HET Rebate Program (*) Yes Yes Yes Yes Yes
HEW Rebate Program (*) Yes Yes Yes Yes Yes
Water Broom Program (*) Yes Yes Yes Yes Yes
Residential/CII Partnership Programs (*) Yes Yes Yes Yes Yes
Audits (CII/Residential) Yes Yes Yes Yes Yes
Conservation Kits/Devices Yes Yes Yes Yes Yes
School Education Program Yes Yes Yes Yes Yes (*) = joint GSWC/Metropolitan DMM Program
The Simi Valley System DMMs are described in more detail in section 9.1.7.
DMMs implemented over the past five years have helped GSWC meets its SBX7-7 interim 2015 water use target of 159 GPCD with 2015 actual water use of only 110 GPCD in part also due to the SWRCB drought water use reduction regulations.
9.2.3 Past DMM Water Savings Over The Past Five Years Table 9-3 summarizes the estimated water savings on both an annual and lifetime (i.e., over the useful life of the device) basis for the DMMs implemented over the past years in the Simi Valley System and described above.
Table 9-3: DMM Program Water Savings Summary Table (2011-2015)
Savings Period 2011 2012 2013 2014 2015
Annual Water Savings – Acre Feet 10 239 114 7 22
Lifetime Water Savings – Acre Feet 59 1,252 581 41 336 Source: CPUC program documents 2011-2015.
The DMM program savings in the Simi Valley System improves overall water use efficiency and enables GSWC to reliably meet established water use targets during normal and dry years.
9.3 Planned Implementation to Achieve Water Use Targets
CWC 10631 (f) Provide a description of the supplier's water demand management measures. This description shall include
all of the following: (1)(A)…The narrative shall describe the water demand management measures that the supplier plans to implement
to achieve its water use targets pursuant to Section 10608.20.
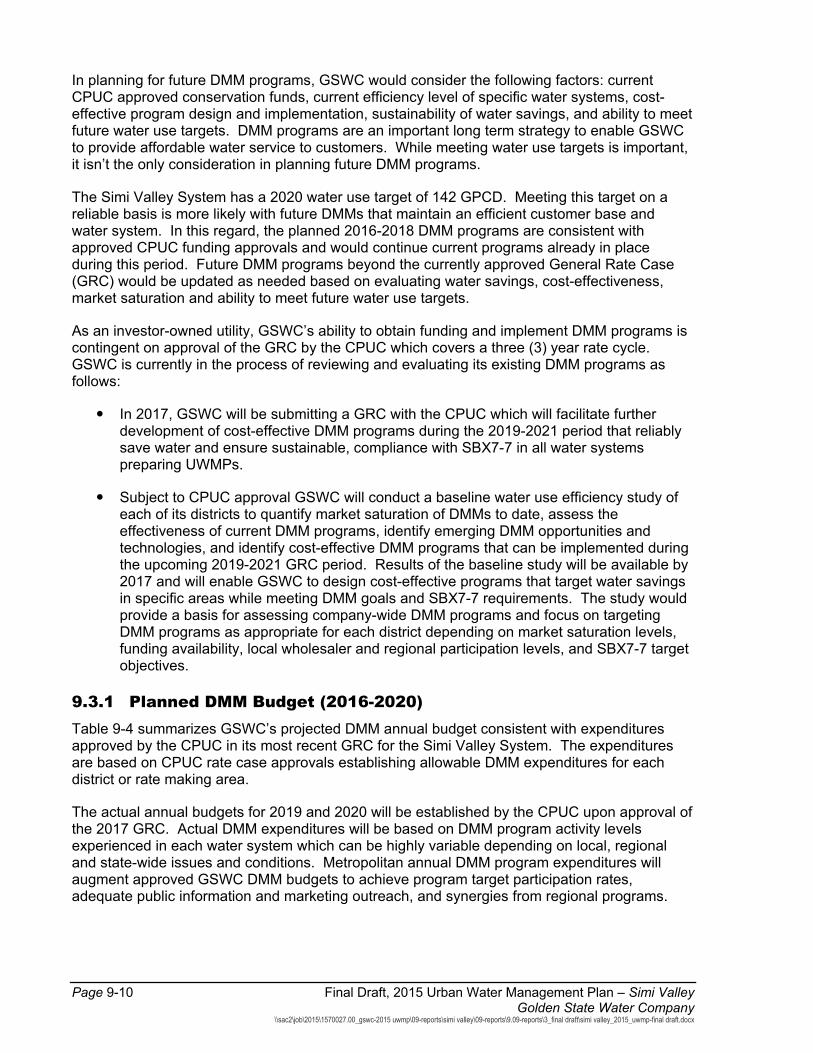
Page 9-10 Final Draft, 2015 Urban Water Management Plan – Simi Valley Golden State Water Company
\\sac2\job\2015\1570027.00_gswc-2015 uwmp\09-reports\simi valley\09-reports\9.09-reports\3_final draft\simi valley_2015_uwmp-final draft.docx
In planning for future DMM programs, GSWC would consider the following factors: current CPUC approved conservation funds, current efficiency level of specific water systems, cost-effective program design and implementation, sustainability of water savings, and ability to meet future water use targets. DMM programs are an important long term strategy to enable GSWC to provide affordable water service to customers. While meeting water use targets is important, it isn’t the only consideration in planning future DMM programs.
The Simi Valley System has a 2020 water use target of 142 GPCD. Meeting this target on a reliable basis is more likely with future DMMs that maintain an efficient customer base and water system. In this regard, the planned 2016-2018 DMM programs are consistent with approved CPUC funding approvals and would continue current programs already in place during this period. Future DMM programs beyond the currently approved General Rate Case (GRC) would be updated as needed based on evaluating water savings, cost-effectiveness, market saturation and ability to meet future water use targets.
As an investor-owned utility, GSWC’s ability to obtain funding and implement DMM programs is contingent on approval of the GRC by the CPUC which covers a three (3) year rate cycle. GSWC is currently in the process of reviewing and evaluating its existing DMM programs as follows:
In 2017, GSWC will be submitting a GRC with the CPUC which will facilitate further development of cost-effective DMM programs during the 2019-2021 period that reliably save water and ensure sustainable, compliance with SBX7-7 in all water systems preparing UWMPs.
Subject to CPUC approval GSWC will conduct a baseline water use efficiency study of each of its districts to quantify market saturation of DMMs to date, assess the effectiveness of current DMM programs, identify emerging DMM opportunities and technologies, and identify cost-effective DMM programs that can be implemented during the upcoming 2019-2021 GRC period. Results of the baseline study will be available by 2017 and will enable GSWC to design cost-effective programs that target water savings in specific areas while meeting DMM goals and SBX7-7 requirements. The study would provide a basis for assessing company-wide DMM programs and focus on targeting DMM programs as appropriate for each district depending on market saturation levels, funding availability, local wholesaler and regional participation levels, and SBX7-7 target objectives.
9.3.1 Planned DMM Budget (2016-2020) Table 9-4 summarizes GSWC’s projected DMM annual budget consistent with expenditures approved by the CPUC in its most recent GRC for the Simi Valley System. The expenditures are based on CPUC rate case approvals establishing allowable DMM expenditures for each district or rate making area.
The actual annual budgets for 2019 and 2020 will be established by the CPUC upon approval of the 2017 GRC. Actual DMM expenditures will be based on DMM program activity levels experienced in each water system which can be highly variable depending on local, regional and state-wide issues and conditions. Metropolitan annual DMM program expenditures will augment approved GSWC DMM budgets to achieve program target participation rates, adequate public information and marketing outreach, and synergies from regional programs.
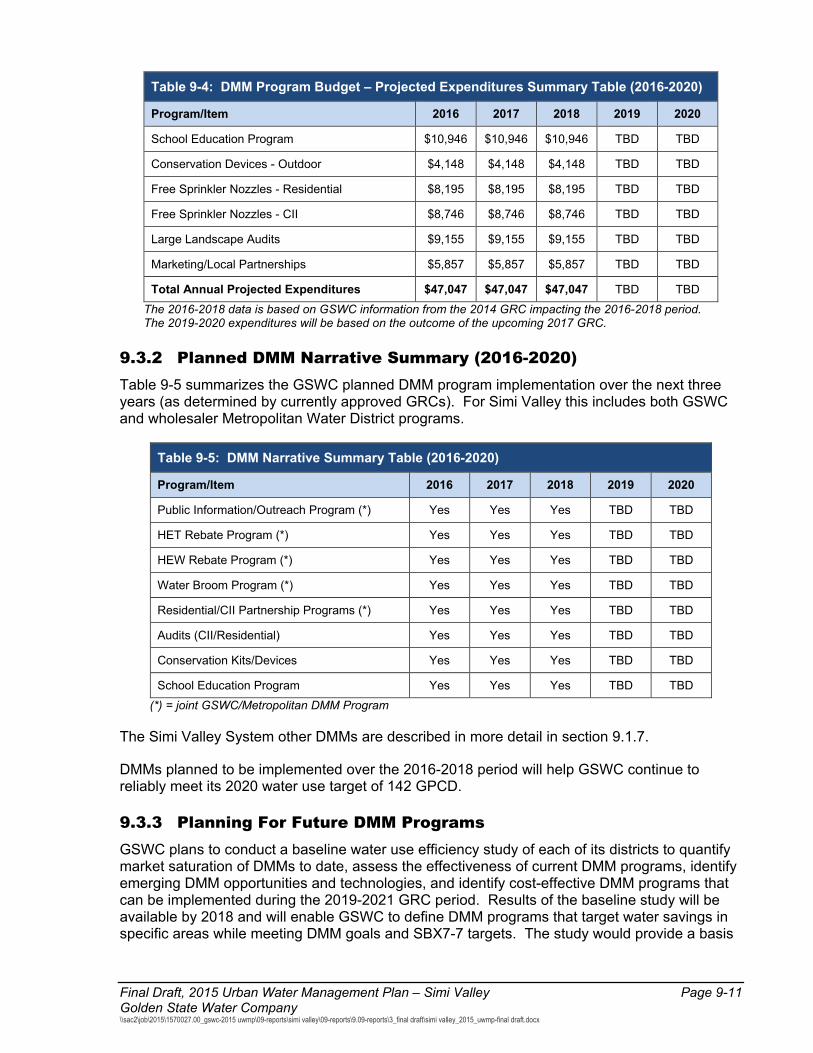
Final Draft, 2015 Urban Water Management Plan – Simi Valley Page 9-11 Golden State Water Company \\sac2\job\2015\1570027.00_gswc-2015 uwmp\09-reports\simi valley\09-reports\9.09-reports\3_final draft\simi valley_2015_uwmp-final draft.docx
Table 9-4: DMM Program Budget – Projected Expenditures Summary Table (2016-2020)
Program/Item 2016 2017 2018 2019 2020
School Education Program $10,946 $10,946 $10,946 TBD TBD
Conservation Devices - Outdoor $4,148 $4,148 $4,148 TBD TBD
Free Sprinkler Nozzles - Residential $8,195 $8,195 $8,195 TBD TBD
Free Sprinkler Nozzles - CII $8,746 $8,746 $8,746 TBD TBD
Large Landscape Audits $9,155 $9,155 $9,155 TBD TBD
Marketing/Local Partnerships $5,857 $5,857 $5,857 TBD TBD
Total Annual Projected Expenditures $47,047 $47,047 $47,047 TBD TBD The 2016-2018 data is based on GSWC information from the 2014 GRC impacting the 2016-2018 period. The 2019-2020 expenditures will be based on the outcome of the upcoming 2017 GRC.
9.3.2 Planned DMM Narrative Summary (2016-2020) Table 9-5 summarizes the GSWC planned DMM program implementation over the next three years (as determined by currently approved GRCs). For Simi Valley this includes both GSWC and wholesaler Metropolitan Water District programs.
Table 9-5: DMM Narrative Summary Table (2016-2020)
Program/Item 2016 2017 2018 2019 2020
Public Information/Outreach Program (*) Yes Yes Yes TBD TBD
HET Rebate Program (*) Yes Yes Yes TBD TBD
HEW Rebate Program (*) Yes Yes Yes TBD TBD
Water Broom Program (*) Yes Yes Yes TBD TBD
Residential/CII Partnership Programs (*) Yes Yes Yes TBD TBD
Audits (CII/Residential) Yes Yes Yes TBD TBD
Conservation Kits/Devices Yes Yes Yes TBD TBD
School Education Program Yes Yes Yes TBD TBD (*) = joint GSWC/Metropolitan DMM Program
The Simi Valley System other DMMs are described in more detail in section 9.1.7.
DMMs planned to be implemented over the 2016-2018 period will help GSWC continue to reliably meet its 2020 water use target of 142 GPCD.
9.3.3 Planning For Future DMM Programs GSWC plans to conduct a baseline water use efficiency study of each of its districts to quantify market saturation of DMMs to date, assess the effectiveness of current DMM programs, identify emerging DMM opportunities and technologies, and identify cost-effective DMM programs that can be implemented during the 2019-2021 GRC period. Results of the baseline study will be available by 2018 and will enable GSWC to define DMM programs that target water savings in specific areas while meeting DMM goals and SBX7-7 targets. The study would provide a basis

Page 9-12 Final Draft, 2015 Urban Water Management Plan – Simi Valley Golden State Water Company
\\sac2\job\2015\1570027.00_gswc-2015 uwmp\09-reports\simi valley\09-reports\9.09-reports\3_final draft\simi valley_2015_uwmp-final draft.docx
for optimizing the allocation of approved DMM budgets, assessing company-wide programs, and focusing DMMs as appropriate for each district depending on cost-effectiveness, funding availability, local wholesaler and regional participation levels, and SBX7-7 target objectives. The estimated budget for this study would be approximately $400,000 based on similar studies that have been completed by other agencies. Findings from already completed reports (e.g., market saturation studies) will provide a cost-effective basis to complete the GSWC study. The one-time cost of the study, estimated to be $1.50-2.00/connection, would be shared on a per connection basis with a focus on GSWC systems required to complete UWMPs and not meeting their specific SBX7-7 2020 water use targets.
9.4 Members of the California Urban Water Conservation Council
CWC 10631 (i) For purposes of this part, urban water suppliers that are members of the California Urban Water
Conservation Council shall be deemed in compliance with the requirements of subdivision (f) by complying with all the provisions of the “Memorandum of Understanding Regarding Urban Water Conservation in California” dated December 10, 2008, as it may be amended, and by submitting the annual reports required by Section 6.2 of that memorandum.
In 1991, GSWC became a signatory to the MOU regarding water conservation in California and a member of the CUWCC, establishing a firm commitment to the implementation of the Best Management Practices (BMPs) or DMMs. By becoming a signatory, GSWC committed to implement a specific set of locally cost-effective conservation practices in its service areas. In order to facilitate efficient BMP reporting for GSWC across their water systems spread throughout California, several BMP “Reporting Units” were established. The Simi Valley BMP Reporting Unit is equivalent to the Simi Valley System.
The CUWCC MOU and associated BMPs have been revised by the CUWCC frequently, including the provision for the flex track and water use target compliance methods for signatories. The original utility-based (foundational) DMMs described in section 9.1.1 through 9.1.6 of this chapter represent standard practices in most utilities that GSWC has been implementing for many years. Future direction on BMP implementation for GSWC will be affected by the SBX7-7 legislation, which establishes future water use targets for suppliers.
GSWC has been implementing the foundational BMPs since the 2010 UWMP cycle and plans to continue to implement the foundational BMPs as part of its on-going DMM implementation program.
Other cost-effective BMPs and/or DMMs may be implemented by GSWC (subject to CPUC approval) as needed to meet SBX7-7 water use targets in all GSWC water systems that are required to complete 2015 UWMPs.
Final Draft, 2015 Urban Water Management Plan – Simi Valley Page 9-13 Golden State Water Company \\sac2\job\2015\1570027.00_gswc-2015 uwmp\09-reports\simi valley\09-reports\9.09-reports\3_final draft\simi valley_2015_uwmp-final draft.docx
BMP Reporting
GSWC has historically filed BMP reports through the online CUWCC BMP reporting database as part of its UWMP preparation process. Because the CUWCC BMP reporting database system was not operating effectively at the time GSWC was preparing its 2015 UWMPs, the 2013-14 BMP reports continue to be filed with the CUWCC. GSWC is complying with DMM requirements of the Act through a narrative approach as depicted in Sections 9.1 through 9.3 of this Chapter.
Page 9-14 Final Draft, 2015 Urban Water Management Plan – Simi Valley Golden State Water Company
\\sac2\job\2015\1570027.00_gswc-2015 uwmp\09-reports\simi valley\09-reports\9.09-reports\3_final draft\simi valley_2015_uwmp-final draft.docx
THIS PAGE INTENTIONALLY BLANK

Final Draft, 2015 Urban Water Management Plan – Simi Valley Page 10-1 Golden State Water Company \\sac2\job\2015\1570027.00_gswc-2015 uwmp\09-reports\simi valley\09-reports\9.09-reports\3_final draft\simi valley_2015_uwmp-final draft.docx
Chapter 10: Plan Adoption, Submittal, and Implementation
This chapter describes GSWC’s actions to meet the requirements of the Act pertaining to public review and availability. GSWC must provide at least 60-day notice prior to changing or adopting the plan, must conduct a public hearing prior to adoption, must properly notice the public hearing, must make the document available for public review, and make the final plan available to the public, cities and counties, DWR and the public within 30-days of adoption. Further, the adopted plan must be submitted to DWR, cities and counties, and State Library within 30-days of adoption and discuss plan implementation.
10.1 Inclusion of All 2015 Data GSWC is reporting on a calendar year basis and has included water use and planning data for the entire 2015 calendar year. The Simi Valley System Distribution System Water Audit was based on the AWWA M36 methodology and used the AWWA Water Audit Software (version 5.0) to conduct the water audit based on calendar year 2014 data and information.
10.2 Notice of Public Hearing GSWC provided notice to cities, counties, and the community of the Public Hearing held prior to adoption of the 2015 UWMP for the Simi Valley System. GSWC considered public input received before adopting the 2015 UWMP.
10.2.1 Notice to Cities and Counties
CWC 10621 (b) Every urban water supplier required to prepare a plan shall... at least 60 days prior to the public hearing on
the plan ... notify any city or county within which the supplier provides waters supplies that the urban water supplier will be reviewing the plan and considering amendments or changes to the plan.
CWC 10642 …The urban water supplier shall provide notice of the time and place of hearing to any city or county within which the supplier provides water supplies. A privately owned water supplier shall provide an equivalent notice within its service area.
Notifications indicating preparation of the 2015 UWMP for the Simi Valley System were provided to cities and counties within which GSWC provides water at least 60 days in advance of the public hearing as required by the Act. Copies of the draft plan were available to the public for review at GSWC’s Customer Service Office and posted on GSWC’s website. Appendix G contains the following:
Copy of the public hearing notice from the local newspaper,
Screen capture of website posting of public hearing notice,
Notifications and follow-up correspondence provided to cities and counties, and
Meeting minutes from the 2015 UWMP public hearing.
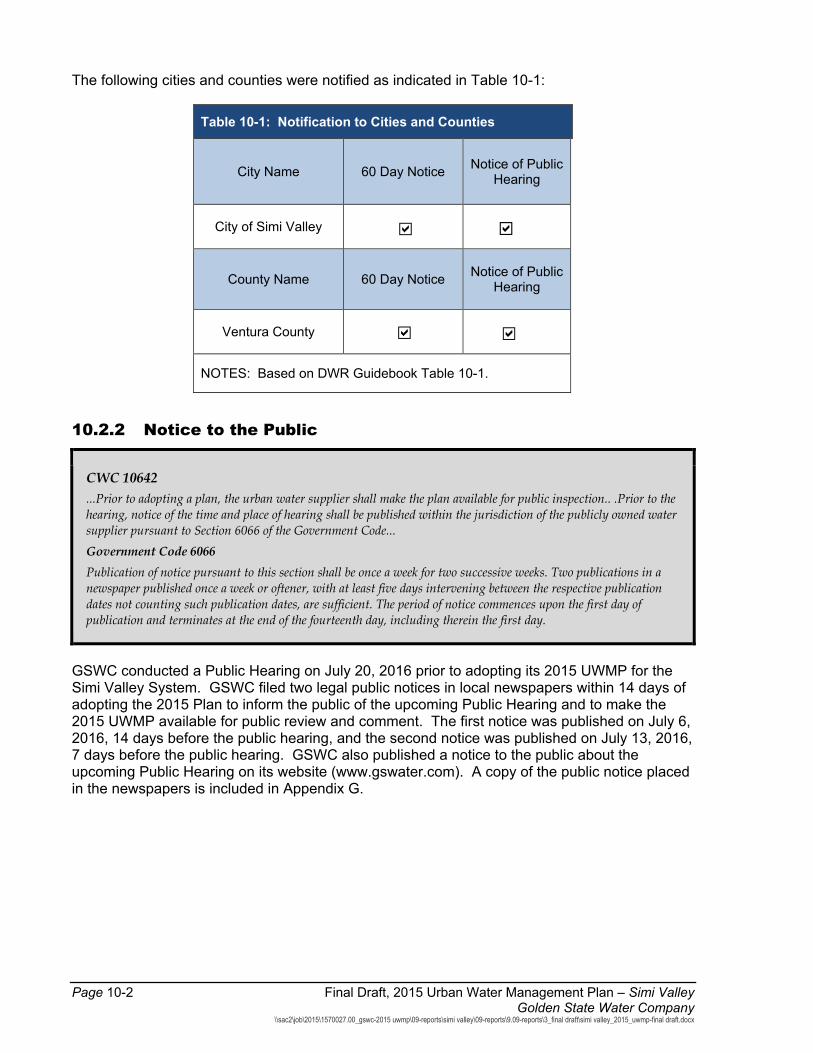
Page 10-2 Final Draft, 2015 Urban Water Management Plan – Simi Valley Golden State Water Company
\\sac2\job\2015\1570027.00_gswc-2015 uwmp\09-reports\simi valley\09-reports\9.09-reports\3_final draft\simi valley_2015_uwmp-final draft.docx
The following cities and counties were notified as indicated in Table 10-1:
Table 10-1: Notification to Cities and Counties
City Name 60 Day Notice Notice of Public Hearing
City of Simi Valley
County Name 60 Day Notice Notice of Public Hearing
Ventura County
NOTES: Based on DWR Guidebook Table 10-1.
10.2.2 Notice to the Public
CWC 10642 ...Prior to adopting a plan, the urban water supplier shall make the plan available for public inspection.. .Prior to the hearing, notice of the time and place of hearing shall be published within the jurisdiction of the publicly owned water supplier pursuant to Section 6066 of the Government Code... Government Code 6066 Publication of notice pursuant to this section shall be once a week for two successive weeks. Two publications in a newspaper published once a week or oftener, with at least five days intervening between the respective publication dates not counting such publication dates, are sufficient. The period of notice commences upon the first day of publication and terminates at the end of the fourteenth day, including therein the first day.
GSWC conducted a Public Hearing on July 20, 2016 prior to adopting its 2015 UWMP for the Simi Valley System. GSWC filed two legal public notices in local newspapers within 14 days of adopting the 2015 Plan to inform the public of the upcoming Public Hearing and to make the 2015 UWMP available for public review and comment. The first notice was published on July 6, 2016, 14 days before the public hearing, and the second notice was published on July 13, 2016, 7 days before the public hearing. GSWC also published a notice to the public about the upcoming Public Hearing on its website (www.gswater.com). A copy of the public notice placed in the newspapers is included in Appendix G.
Final Draft, 2015 Urban Water Management Plan – Simi Valley Page 10-3 Golden State Water Company \\sac2\job\2015\1570027.00_gswc-2015 uwmp\09-reports\simi valley\09-reports\9.09-reports\3_final draft\simi valley_2015_uwmp-final draft.docx
10.3 Public Hearing and Adoption
CWC 10642 ...Prior to adopting a plan, the urban water supplier shall hold a public hearing thereon.
CWC 10608.26 (a) In complying with this part, an urban retail water supplier shall conduct at least one public hearing to
accomplish all of the following: (1) Allow community input regarding the urban retail water supplier's implementation plan for
complying with this part. (2) Consider the economic impacts of the urban retail water supplier's implementation plan for complying
with this part. (3) Adopt a method, pursuant to subdivision (b) of Section 10608.20for determining its urban water use
target.
The GSWC conducted a Public Hearing, held at the GSWC Simi Valley Customer Service Office in Simi Valley, California, on July 20, 2016 prior to adopting its 2015 UWMP for the Simi Valley System. The purpose of the Public Hearing was to allow community input regarding GSWC’s implementation plan, to consider the economic impacts of GSWC’s implementation plan, and to adopt a method for complying with SBX7-7 for determining its urban water use target. The Public Hearing was opened and closed, with public comments documented and considered for inclusion into the 2015 UWMP.
10.3.1 Adoption
CWC 10642 ...After the hearing, the plan shall be adopted as prepared or as modified after the hearing.
GSWC considered public comments received at the July 20, 2016 Public Hearing. GSWC adopted its 2015 UWMP for the Simi Valley System on July 27, 2016 considering public comments received during the Public Hearing. The Plan was adopted by the GSWC Senior Vice President, Regulated Utilities, in accordance with GSWC procedure for adopting planning documents.
Page 10-4 Final Draft, 2015 Urban Water Management Plan – Simi Valley Golden State Water Company
\\sac2\job\2015\1570027.00_gswc-2015 uwmp\09-reports\simi valley\09-reports\9.09-reports\3_final draft\simi valley_2015_uwmp-final draft.docx
10.4 Plan Submittal
CWC 10621 (d) An urban water supplier shall update and submit its 2015 plan to the department by July 1, 2016.
CWC 10644 (a)(1) An urban water supplier shall submit to the department, the California State Library, and any city or
county within which the supplier provides water supplies a copy of its plan no later than 30 days after adoption.
CWC 10635 (b) The urban water supplier shall provide that portion of its urban water management plan prepared
pursuant to this article to any city or county within which it provides water supplies no later than 60 days after the submission of its urban water management plan.
GSWC adopted its 2015 UWMP for the Simi Valley System on July 27, 2016. A copy of GSWC’s adopted 2015 UWMP for the Simi Valley System was submitted to DWR, the California State Library, and any city or county within the supplier’s service area before August 26, 2016 (within 30 days after adoption).
10.4.1 Submitting a UWMP to DWR GSWC submitted the adopted 2015 UWMP for its Simi Valley System to DWR through the DWR online submittal process, including completed DWR Tables and Final 2015 UWMP document within 30 days of when the 2015 UWMP for the Simi Valley System was adopted by GSWC.
10.4.2 Electronic Data Submittal GSWC submitted completed DWR Tables included in its 2015 UWMP through the DWR online submittal process established by DWR to receive all UWMP submittals. Copies of submittal records received by DWR for the Simi Valley System 2015 UWMP data and information are included in Appendix I.
10.4.3 Submitting a UWMP to the California State Library GSWC prepared and submitted a copy of its adopted 2015 UWMP for the Simi Valley System to the California State Library within 30 days of adopting its 2015 UWMP.
10.4.4 Submitting a UWMP to Cities and Counties GSWC prepared and submitted a copy of its adopted 2015 UWMP for the Simi Valley System to all cities and counties receiving water service through the Simi Valley Water System within 30 days of adopting its 2015 UWMP.
Final Draft, 2015 Urban Water Management Plan – Simi Valley Page 10-5 Golden State Water Company \\sac2\job\2015\1570027.00_gswc-2015 uwmp\09-reports\simi valley\09-reports\9.09-reports\3_final draft\simi valley_2015_uwmp-final draft.docx
10.5 Public Availability
CWC 10645 Not later than 30 days after filing a copy of its plan with the department, the urban water supplier and the department shall make the plan available for public review during normal business hours.
The GSWC’s adopted 2015 UWMP for the Simi Valley System was made available to the public at the GSWC’s Simi Valley Customer Service Office and on the GSWC website within 30-days after adoption by GSWC. The Final 2015 UWMP was also submitted to DWR, the California State Library, and cities and counties within which GSWC provides water within 30 days after adoption. This plan includes all information necessary to meet the applicable requirements of California Water Code.
The adopted 2015 UWMP is available for public review at GSWC’s Simi Valley Office as required by the Act. Appendix G includes copies of the transmittals included with the adopted plan as supporting documentation.
10.6 Amending an Adopted UWMP
CWC 10621 (c) The amendments to, or changes in, the plan shall be adopted and filed in the manner set forth in Article 3
(commencing with Section 10640).
CWC 10644 (a)(1) Copies of amendments or changes to the plans shall be submitted to the department, the California State
Library, and any city or county within which the supplier provides water supplies within 30 days after adoption.
Copies of the GSWC’s 2015 UWMP, including any changes or amendments, was submitted to DWR, the California State Library, and any city or county within which the supplier provides water supplies within 30 days after adoption by GSWC.
10.7 Implementation Section 10643. An urban water supplier shall implement its plan adopted pursuant to this chapter in accordance with the schedule set forth in its plan.
GSWC is committed to the implementation of this UWMP concurrent with the scheduled activities identified herein as required by Section 10643 of the Act. Each system is managed through GSWC District offices and is afforded staff with appropriate regulatory approval to properly plan and implement responses identified in this document and other key planning efforts to proactively address water supply reliability challenges. Furthermore, each region of GSWC has a conservation coordinator that oversees the implementation of Demand Management Measures (DMMs) through GSWC participation in the California Urban Water Conservation Council’s (Council or CUWCC) Memorandum of Understanding (MOU).
Page 10-6 Final Draft, 2015 Urban Water Management Plan – Simi Valley Golden State Water Company
\\sac2\job\2015\1570027.00_gswc-2015 uwmp\09-reports\simi valley\09-reports\9.09-reports\3_final draft\simi valley_2015_uwmp-final draft.docx
GSWC is committed to implementation of the projects, plans, and discussions provided within this document. However, it is important to note that execution of the plan is contingent upon the regulatory limitations and approval of the CPUC and other state agencies. Additionally, this document merely presents the water supply, reliability, and conservation programs known and in effect at the time of adoption of this plan.
GSWC understands the limited nature of water supply in California and is committed to optimizing its available water resources. This commitment is demonstrated through GSWC’s use of water management tools throughout the company to promote the efficient use of water supplies from local sources, wherever feasible. GSWC takes steps to procure local reliable water supplies wherever feasible and cost effective to minimize dependence on importations from other regions. GSWC is a regular participant in regional water resources planning efforts, and has developed internal company water resource and master plans, as well as cost effective water conservation programs that enable GSWC to meet future water use targets.
Final Draft, 2015 Urban Water Management Plan – Simi Valley References - i Golden State Water Company \\sac2\job\2015\1570027.00_gswc-2015 uwmp\09-reports\simi valley\09-reports\9.09-reports\3_final draft\simi valley_2015_uwmp-final draft.docx
References
California Department of Water Resources (DWR). 2016a. 2015 Urban Water Management Plans, Guidebook for Urban Water Suppliers. March 2016.
California Department of Water Resources (DWR). 2016b. California Irrigation Management Information System. Accessed February 16. <http://wwwcimis.water.ca.gov/WSNReportCriteria.aspx>
California Department of Water Resources (DWR). 2010. 20x2020 Water Conservation Plan. February 2010.
California Department of Water Resources (DWR). 2004. California’s Groundwater: Bulletin 118-2003, Hydrologic Region South Coast, Simi Valley Groundwater Basin. Updated February 2004.
California Urban Water Conservation Council (CUWCC). 2016. Memorandum of Understanding Regarding Urban Water Conservation in California. As Amended January 4.
Calleguas Municipal Water District (Calleguas). 2016. 2015 Urban Water Management Plan. Black & Veatch. March.
City of Simi Valley. Planning Division. 2013-2021 Housing Element. City of Simi Valley. 2014.
City of Simi Valley. Public Works. Sewer System Management Plan. Updated April 2014.
City of Simi Valley. 2016. Draft 2015 Urban Water Management Plan for Ventura County Waterworks District No. 8. June 2016.
California Public Utilities Commission (CPUC). 2005. 2005 Water Action Plan.
California Public Utilities Commission (CPUC). 2010. 2010 Water Action Plan.
Metropolitan Water District of Southern California. 2016. Draft 2015 Urban Water Management Plan. March 2016.
Southern California Association of Governments (SCAG). 2012. 2012-2035 Regional Transportation Plan/Sustainable Communities Strategy. April.
State Water Resources Board (SWRB), 1953. Ventura County Investigation, Bulletin No. 12. 1953.
Panaro, D. 2000. Fox Canyon Groundwater Management Agency: Written Communication to R.R. Davis (DWR), March 2000.
Western Regional Climate Center (WRCC). 2016. Period of Record Monthly Climate Summary. Accessed February 16. < http://www.wrcc.dri.edu/climatedata/climsum/>.
References - ii Final Draft, 2015 Urban Water Management Plan – Simi Valley Golden State Water Company
\\sac2\job\2015\1570027.00_gswc-2015 uwmp\09-reports\simi valley\09-reports\9.09-reports\3_final draft\simi valley_2015_uwmp-final draft.docx
THIS PAGE INTENTIONALLY BLANK
Appendix A
DWR Guidebook Urban Water Management Plan Checklist
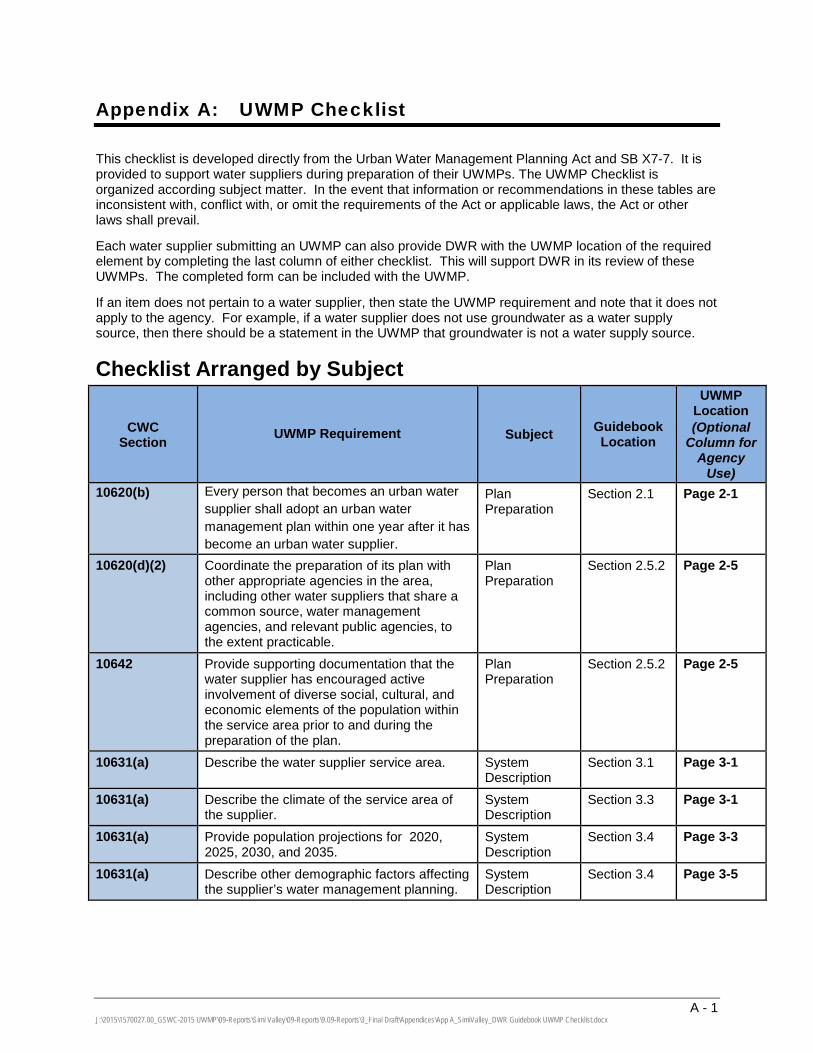
A - 1 J:\2015\1570027.00_GSWC-2015 UWMP\09-Reports\Simi Valley\09-Reports\9.09-Reports\3_Final Draft\Appendices\App A_SimiValley_DWR Guidebook UWMP Checklist.docx
Appendix A: UWMP Checklist
This checklist is developed directly from the Urban Water Management Planning Act and SB X7-7. It is provided to support water suppliers during preparation of their UWMPs. The UWMP Checklist is organized according subject matter. In the event that information or recommendations in these tables are inconsistent with, conflict with, or omit the requirements of the Act or applicable laws, the Act or other laws shall prevail.
Each water supplier submitting an UWMP can also provide DWR with the UWMP location of the required element by completing the last column of either checklist. This will support DWR in its review of these UWMPs. The completed form can be included with the UWMP.
If an item does not pertain to a water supplier, then state the UWMP requirement and note that it does not apply to the agency. For example, if a water supplier does not use groundwater as a water supply source, then there should be a statement in the UWMP that groundwater is not a water supply source.
Checklist Arranged by Subject
CWC Section UWMP Requirement Subject Guidebook
Location
UWMP Location (Optional
Column for Agency
Use) 10620(b) Every person that becomes an urban water
supplier shall adopt an urban water management plan within one year after it has become an urban water supplier.
Plan Preparation
Section 2.1 Page 2-1
10620(d)(2) Coordinate the preparation of its plan with other appropriate agencies in the area, including other water suppliers that share a common source, water management agencies, and relevant public agencies, to the extent practicable.
Plan Preparation
Section 2.5.2 Page 2-5
10642 Provide supporting documentation that the water supplier has encouraged active involvement of diverse social, cultural, and economic elements of the population within the service area prior to and during the preparation of the plan.
Plan Preparation
Section 2.5.2 Page 2-5
10631(a) Describe the water supplier service area. System Description
Section 3.1 Page 3-1
10631(a) Describe the climate of the service area of the supplier.
System Description
Section 3.3 Page 3-1
10631(a) Provide population projections for 2020, 2025, 2030, and 2035.
System Description
Section 3.4 Page 3-3
10631(a) Describe other demographic factors affecting the supplier’s water management planning.
System Description
Section 3.4 Page 3-5
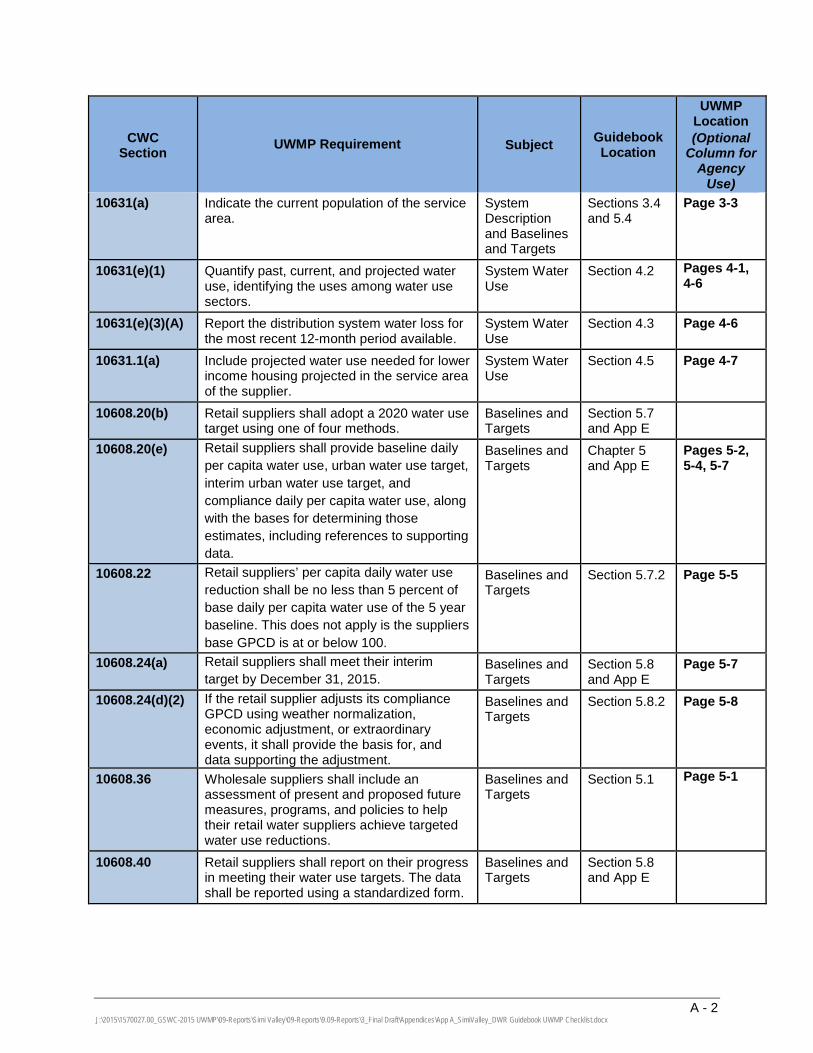
A - 2 J:\2015\1570027.00_GSWC-2015 UWMP\09-Reports\Simi Valley\09-Reports\9.09-Reports\3_Final Draft\Appendices\App A_SimiValley_DWR Guidebook UWMP Checklist.docx
CWC Section UWMP Requirement Subject Guidebook
Location
UWMP Location (Optional
Column for Agency
Use) 10631(a) Indicate the current population of the service
area. System Description and Baselines and Targets
Sections 3.4 and 5.4
Page 3-3
10631(e)(1) Quantify past, current, and projected water use, identifying the uses among water use sectors.
System Water Use
Section 4.2 Pages 4-1, 4-6
10631(e)(3)(A) Report the distribution system water loss for the most recent 12-month period available.
System Water Use
Section 4.3 Page 4-6
10631.1(a) Include projected water use needed for lower income housing projected in the service area of the supplier.
System Water Use
Section 4.5 Page 4-7
10608.20(b) Retail suppliers shall adopt a 2020 water use target using one of four methods.
Baselines and Targets
Section 5.7 and App E
10608.20(e) Retail suppliers shall provide baseline daily per capita water use, urban water use target, interim urban water use target, and compliance daily per capita water use, along with the bases for determining those estimates, including references to supporting data.
Baselines and Targets
Chapter 5 and App E
Pages 5-2, 5-4, 5-7
10608.22 Retail suppliers’ per capita daily water use reduction shall be no less than 5 percent of base daily per capita water use of the 5 year baseline. This does not apply is the suppliers base GPCD is at or below 100.
Baselines and Targets
Section 5.7.2 Page 5-5
10608.24(a) Retail suppliers shall meet their interim target by December 31, 2015.
Baselines and Targets
Section 5.8 and App E
Page 5-7
10608.24(d)(2) If the retail supplier adjusts its compliance GPCD using weather normalization, economic adjustment, or extraordinary events, it shall provide the basis for, and data supporting the adjustment.
Baselines and Targets
Section 5.8.2 Page 5-8
10608.36 Wholesale suppliers shall include an assessment of present and proposed future measures, programs, and policies to help their retail water suppliers achieve targeted water use reductions.
Baselines and Targets
Section 5.1 Page 5-1
10608.40 Retail suppliers shall report on their progress in meeting their water use targets. The data shall be reported using a standardized form.
Baselines and Targets
Section 5.8 and App E
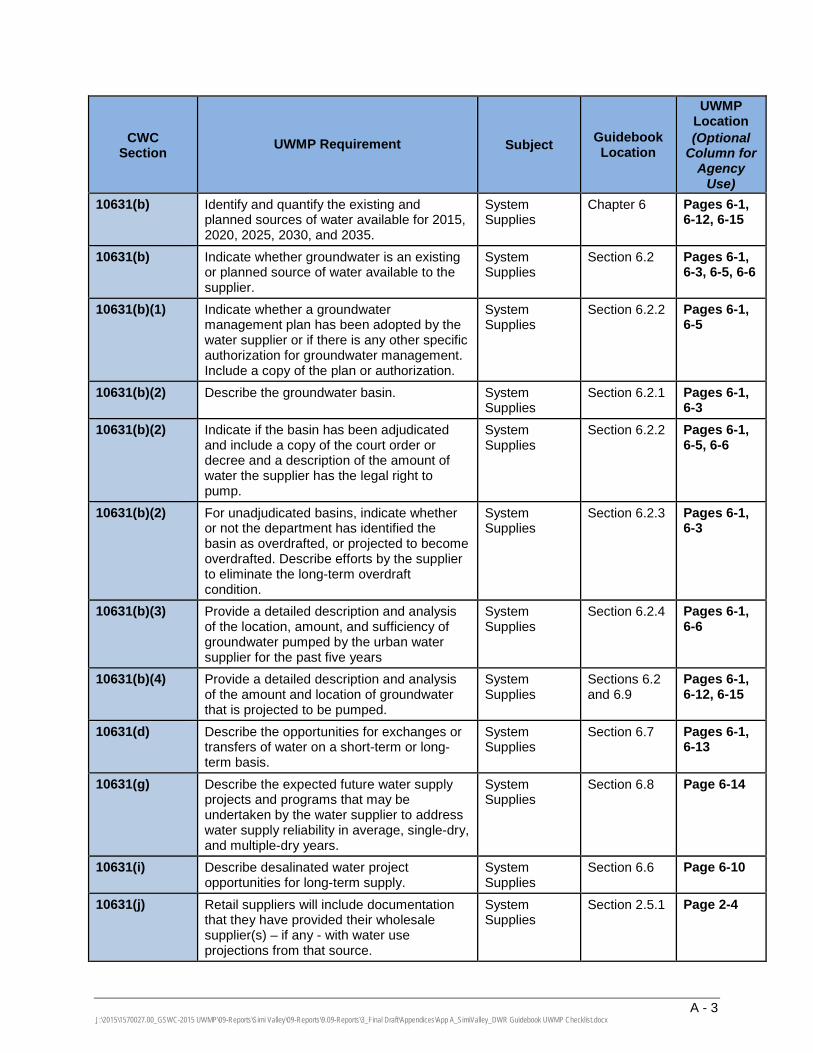
A - 3 J:\2015\1570027.00_GSWC-2015 UWMP\09-Reports\Simi Valley\09-Reports\9.09-Reports\3_Final Draft\Appendices\App A_SimiValley_DWR Guidebook UWMP Checklist.docx
CWC Section UWMP Requirement Subject Guidebook
Location
UWMP Location (Optional
Column for Agency
Use) 10631(b) Identify and quantify the existing and
planned sources of water available for 2015, 2020, 2025, 2030, and 2035.
System Supplies
Chapter 6 Pages 6-1, 6-12, 6-15
10631(b) Indicate whether groundwater is an existing or planned source of water available to the supplier.
System Supplies
Section 6.2 Pages 6-1, 6-3, 6-5, 6-6
10631(b)(1) Indicate whether a groundwater management plan has been adopted by the water supplier or if there is any other specific authorization for groundwater management. Include a copy of the plan or authorization.
System Supplies
Section 6.2.2 Pages 6-1, 6-5
10631(b)(2) Describe the groundwater basin. System Supplies
Section 6.2.1 Pages 6-1, 6-3
10631(b)(2) Indicate if the basin has been adjudicated and include a copy of the court order or decree and a description of the amount of water the supplier has the legal right to pump.
System Supplies
Section 6.2.2 Pages 6-1, 6-5, 6-6
10631(b)(2) For unadjudicated basins, indicate whether or not the department has identified the basin as overdrafted, or projected to become overdrafted. Describe efforts by the supplier to eliminate the long-term overdraft condition.
System Supplies
Section 6.2.3 Pages 6-1, 6-3
10631(b)(3) Provide a detailed description and analysis of the location, amount, and sufficiency of groundwater pumped by the urban water supplier for the past five years
System Supplies
Section 6.2.4 Pages 6-1, 6-6
10631(b)(4) Provide a detailed description and analysis of the amount and location of groundwater that is projected to be pumped.
System Supplies
Sections 6.2 and 6.9
Pages 6-1, 6-12, 6-15
10631(d) Describe the opportunities for exchanges or transfers of water on a short-term or long-term basis.
System Supplies
Section 6.7 Pages 6-1, 6-13
10631(g) Describe the expected future water supply projects and programs that may be undertaken by the water supplier to address water supply reliability in average, single-dry, and multiple-dry years.
System Supplies
Section 6.8 Page 6-14
10631(i) Describe desalinated water project opportunities for long-term supply.
System Supplies
Section 6.6 Page 6-10
10631(j) Retail suppliers will include documentation that they have provided their wholesale supplier(s) – if any - with water use projections from that source.
System Supplies
Section 2.5.1 Page 2-4
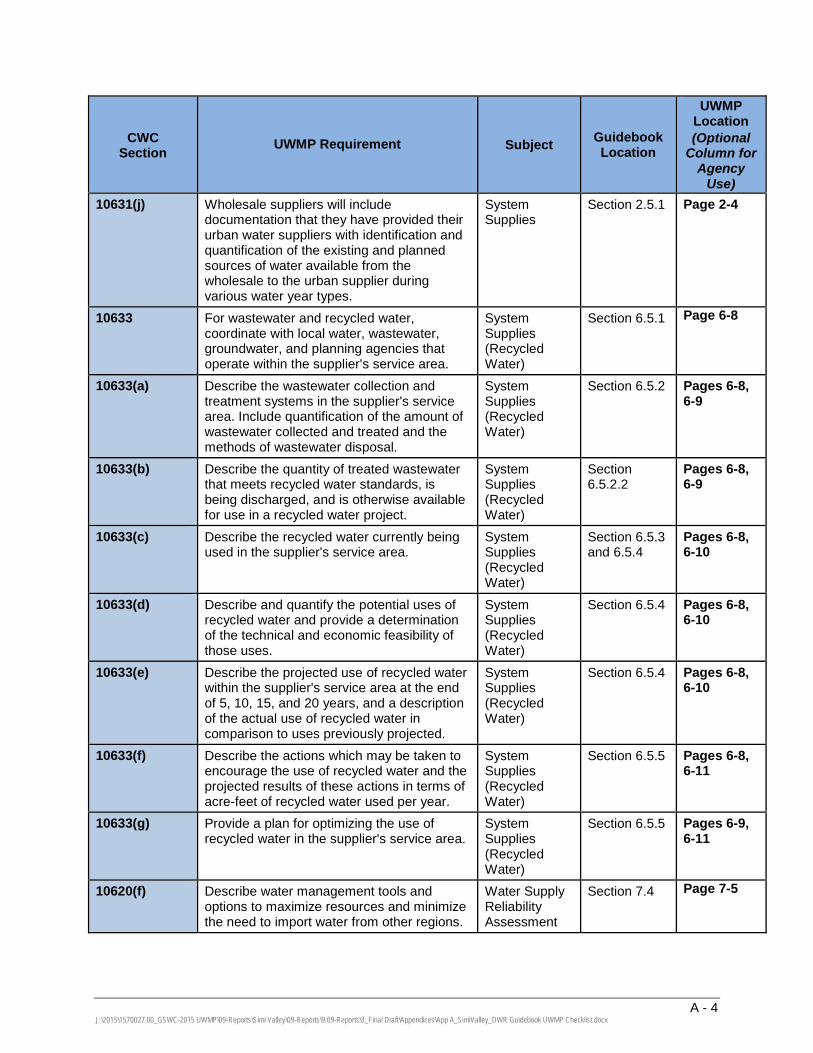
A - 4 J:\2015\1570027.00_GSWC-2015 UWMP\09-Reports\Simi Valley\09-Reports\9.09-Reports\3_Final Draft\Appendices\App A_SimiValley_DWR Guidebook UWMP Checklist.docx
CWC Section UWMP Requirement Subject Guidebook
Location
UWMP Location (Optional
Column for Agency
Use) 10631(j) Wholesale suppliers will include
documentation that they have provided their urban water suppliers with identification and quantification of the existing and planned sources of water available from the wholesale to the urban supplier during various water year types.
System Supplies
Section 2.5.1 Page 2-4
10633 For wastewater and recycled water, coordinate with local water, wastewater, groundwater, and planning agencies that operate within the supplier's service area.
System Supplies (Recycled Water)
Section 6.5.1 Page 6-8
10633(a) Describe the wastewater collection and treatment systems in the supplier's service area. Include quantification of the amount of wastewater collected and treated and the methods of wastewater disposal.
System Supplies (Recycled Water)
Section 6.5.2 Pages 6-8, 6-9
10633(b) Describe the quantity of treated wastewater that meets recycled water standards, is being discharged, and is otherwise available for use in a recycled water project.
System Supplies (Recycled Water)
Section 6.5.2.2
Pages 6-8, 6-9
10633(c) Describe the recycled water currently being used in the supplier's service area.
System Supplies (Recycled Water)
Section 6.5.3 and 6.5.4
Pages 6-8, 6-10
10633(d) Describe and quantify the potential uses of recycled water and provide a determination of the technical and economic feasibility of those uses.
System Supplies (Recycled Water)
Section 6.5.4 Pages 6-8, 6-10
10633(e) Describe the projected use of recycled water within the supplier's service area at the end of 5, 10, 15, and 20 years, and a description of the actual use of recycled water in comparison to uses previously projected.
System Supplies (Recycled Water)
Section 6.5.4 Pages 6-8, 6-10
10633(f) Describe the actions which may be taken to encourage the use of recycled water and the projected results of these actions in terms of acre-feet of recycled water used per year.
System Supplies (Recycled Water)
Section 6.5.5 Pages 6-8, 6-11
10633(g) Provide a plan for optimizing the use of recycled water in the supplier's service area.
System Supplies (Recycled Water)
Section 6.5.5 Pages 6-9, 6-11
10620(f) Describe water management tools and options to maximize resources and minimize the need to import water from other regions.
Water Supply Reliability Assessment
Section 7.4 Page 7-5
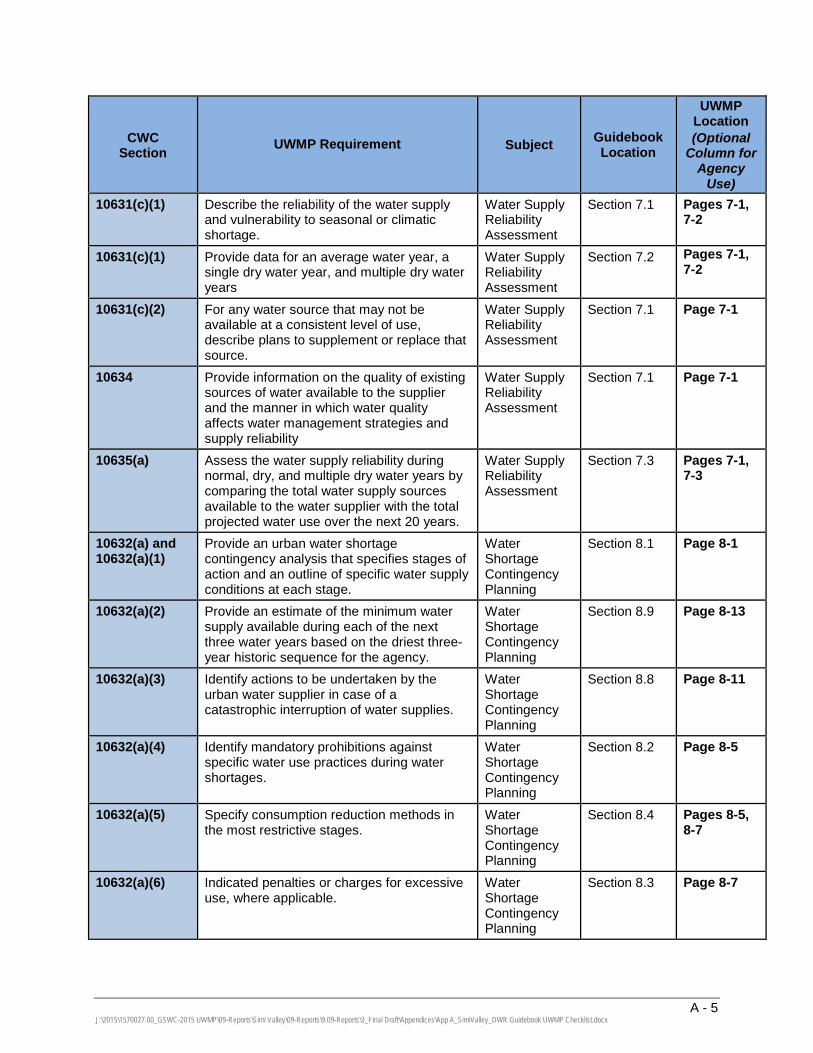
A - 5 J:\2015\1570027.00_GSWC-2015 UWMP\09-Reports\Simi Valley\09-Reports\9.09-Reports\3_Final Draft\Appendices\App A_SimiValley_DWR Guidebook UWMP Checklist.docx
CWC Section UWMP Requirement Subject Guidebook
Location
UWMP Location (Optional
Column for Agency
Use) 10631(c)(1) Describe the reliability of the water supply
and vulnerability to seasonal or climatic shortage.
Water Supply Reliability Assessment
Section 7.1 Pages 7-1, 7-2
10631(c)(1) Provide data for an average water year, a single dry water year, and multiple dry water years
Water Supply Reliability Assessment
Section 7.2 Pages 7-1, 7-2
10631(c)(2) For any water source that may not be available at a consistent level of use, describe plans to supplement or replace that source.
Water Supply Reliability Assessment
Section 7.1 Page 7-1
10634 Provide information on the quality of existing sources of water available to the supplier and the manner in which water quality affects water management strategies and supply reliability
Water Supply Reliability Assessment
Section 7.1 Page 7-1
10635(a) Assess the water supply reliability during normal, dry, and multiple dry water years by comparing the total water supply sources available to the water supplier with the total projected water use over the next 20 years.
Water Supply Reliability Assessment
Section 7.3 Pages 7-1, 7-3
10632(a) and 10632(a)(1)
Provide an urban water shortage contingency analysis that specifies stages of action and an outline of specific water supply conditions at each stage.
Water Shortage Contingency Planning
Section 8.1 Page 8-1
10632(a)(2) Provide an estimate of the minimum water supply available during each of the next three water years based on the driest three-year historic sequence for the agency.
Water Shortage Contingency Planning
Section 8.9 Page 8-13
10632(a)(3) Identify actions to be undertaken by the urban water supplier in case of a catastrophic interruption of water supplies.
Water Shortage Contingency Planning
Section 8.8 Page 8-11
10632(a)(4) Identify mandatory prohibitions against specific water use practices during water shortages.
Water Shortage Contingency Planning
Section 8.2 Page 8-5
10632(a)(5) Specify consumption reduction methods in the most restrictive stages.
Water Shortage Contingency Planning
Section 8.4 Pages 8-5, 8-7
10632(a)(6) Indicated penalties or charges for excessive use, where applicable.
Water Shortage Contingency Planning
Section 8.3 Page 8-7
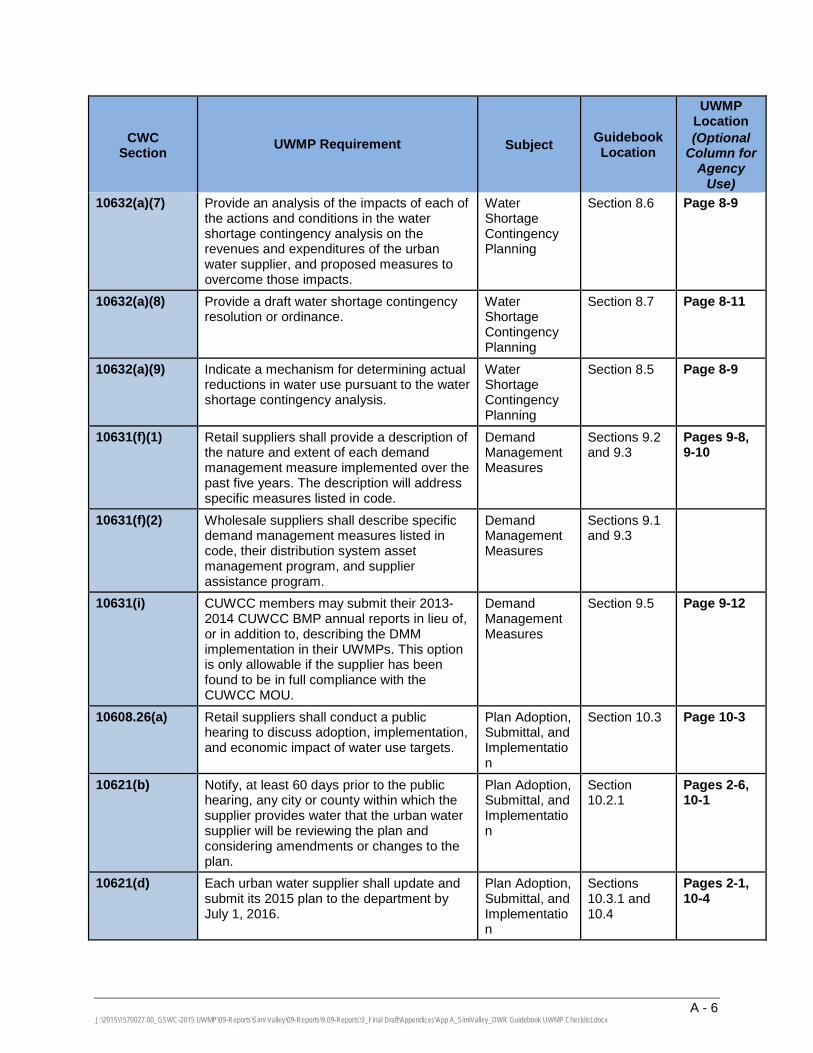
A - 6 J:\2015\1570027.00_GSWC-2015 UWMP\09-Reports\Simi Valley\09-Reports\9.09-Reports\3_Final Draft\Appendices\App A_SimiValley_DWR Guidebook UWMP Checklist.docx
CWC Section UWMP Requirement Subject Guidebook
Location
UWMP Location (Optional
Column for Agency
Use) 10632(a)(7) Provide an analysis of the impacts of each of
the actions and conditions in the water shortage contingency analysis on the revenues and expenditures of the urban water supplier, and proposed measures to overcome those impacts.
Water Shortage Contingency Planning
Section 8.6 Page 8-9
10632(a)(8) Provide a draft water shortage contingency resolution or ordinance.
Water Shortage Contingency Planning
Section 8.7 Page 8-11
10632(a)(9) Indicate a mechanism for determining actual reductions in water use pursuant to the water shortage contingency analysis.
Water Shortage Contingency Planning
Section 8.5 Page 8-9
10631(f)(1) Retail suppliers shall provide a description of the nature and extent of each demand management measure implemented over the past five years. The description will address specific measures listed in code.
Demand Management Measures
Sections 9.2 and 9.3
Pages 9-8, 9-10
10631(f)(2) Wholesale suppliers shall describe specific demand management measures listed in code, their distribution system asset management program, and supplier assistance program.
Demand Management Measures
Sections 9.1 and 9.3
10631(i) CUWCC members may submit their 2013-2014 CUWCC BMP annual reports in lieu of, or in addition to, describing the DMM implementation in their UWMPs. This option is only allowable if the supplier has been found to be in full compliance with the CUWCC MOU.
Demand Management Measures
Section 9.5 Page 9-12
10608.26(a) Retail suppliers shall conduct a public hearing to discuss adoption, implementation, and economic impact of water use targets.
Plan Adoption, Submittal, and Implementation
Section 10.3 Page 10-3
10621(b) Notify, at least 60 days prior to the public hearing, any city or county within which the supplier provides water that the urban water supplier will be reviewing the plan and considering amendments or changes to the plan.
Plan Adoption, Submittal, and Implementation
Section 10.2.1
Pages 2-6, 10-1
10621(d) Each urban water supplier shall update and submit its 2015 plan to the department by July 1, 2016.
Plan Adoption, Submittal, and Implementation
Sections 10.3.1 and 10.4
Pages 2-1, 10-4
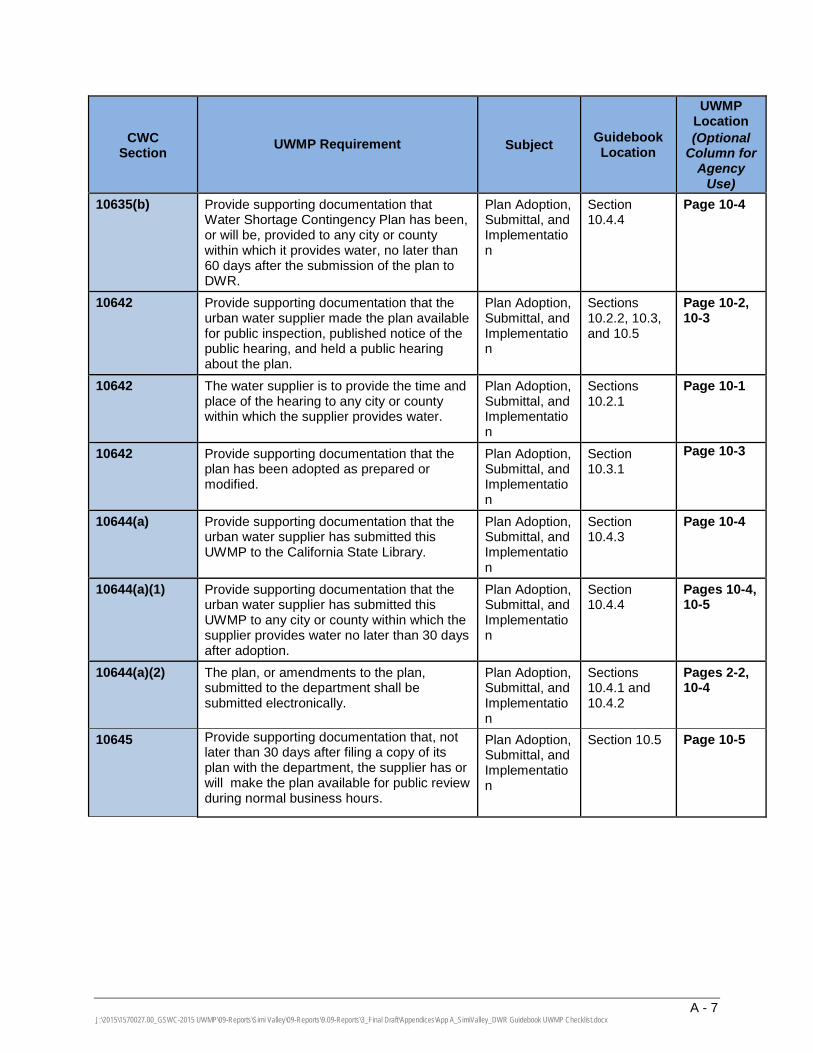
A - 7 J:\2015\1570027.00_GSWC-2015 UWMP\09-Reports\Simi Valley\09-Reports\9.09-Reports\3_Final Draft\Appendices\App A_SimiValley_DWR Guidebook UWMP Checklist.docx
CWC Section UWMP Requirement Subject Guidebook
Location
UWMP Location (Optional
Column for Agency
Use) 10635(b) Provide supporting documentation that
Water Shortage Contingency Plan has been, or will be, provided to any city or county within which it provides water, no later than 60 days after the submission of the plan to DWR.
Plan Adoption, Submittal, and Implementation
Section 10.4.4
Page 10-4
10642 Provide supporting documentation that the urban water supplier made the plan available for public inspection, published notice of the public hearing, and held a public hearing about the plan.
Plan Adoption, Submittal, and Implementation
Sections 10.2.2, 10.3, and 10.5
Page 10-2, 10-3
10642 The water supplier is to provide the time and place of the hearing to any city or county within which the supplier provides water.
Plan Adoption, Submittal, and Implementation
Sections 10.2.1
Page 10-1
10642 Provide supporting documentation that the plan has been adopted as prepared or modified.
Plan Adoption, Submittal, and Implementation
Section 10.3.1
Page 10-3
10644(a) Provide supporting documentation that the urban water supplier has submitted this UWMP to the California State Library.
Plan Adoption, Submittal, and Implementation
Section 10.4.3
Page 10-4
10644(a)(1) Provide supporting documentation that the urban water supplier has submitted this UWMP to any city or county within which the supplier provides water no later than 30 days after adoption.
Plan Adoption, Submittal, and Implementation
Section 10.4.4
Pages 10-4, 10-5
10644(a)(2) The plan, or amendments to the plan, submitted to the department shall be submitted electronically.
Plan Adoption, Submittal, and Implementation
Sections 10.4.1 and 10.4.2
Pages 2-2, 10-4
10645 Provide supporting documentation that, not later than 30 days after filing a copy of its plan with the department, the supplier has or will make the plan available for public review during normal business hours.
Plan Adoption, Submittal, and Implementation
Section 10.5 Page 10-5
Appendix B
Documentation of Water Use Projections Submittal
Kennedy/Jenks Consultants
j:\2015\1570027.00_gswc-2015 uwmp\09-reports\simi valley\06-corrspnd\6.03-other\demand projections memo simi valley_rev.doc © Kennedy/Jenks Consultants, Inc.
29 April 2016
Memorandum
To: Susan B. Mulligan General Manager Calleguas Municipal Water District 2100 Olsen Road Thousand Oaks, CA 91360 From: Mike Downey, Project Manager Kennedy/Jenks Consultants Subject: Golden State Water Company – Simi Valley System 2015 Urban Water Management Plan Demand Projections K/J 1570027*00
Golden State Water Company (GSWC) is currently in the process of preparing its 2015 Urban Water Management Plan (UWMP) for the Simi Valley System as required by State of California Law through the Urban Water Management Planning Act. The Simi Valley System currently obtains its water supply from local groundwater and purchased water from Calleguas Municipal Water District (CMWD). The purpose of this memorandum is to provide CMWD with the following preliminary information for use in the development of 2015 UWMPs:
Population estimates, historical and projections.
GSWC’s demand projections in 5-year increments from 2015-2040, including demand irrespective of source.
SBX7-7 baseline, target, and methodology used.
Simi Valley System’s water supply sources.
The information provided in this memorandum is preliminary and may be different from what is presented in the adopted 2015 GSWC Simi Valley UWMP. If you have any questions or concerns please feel free to contact Mike Downey with Kennedy/Jenks Consultants at [email protected] or (916) 858-2700.
Population Estimates
Projections for the Simi Valley System’s population from 2020 to 2040 were determined using the Southern California Association of Governments (SCAG) city-level projections. The current and projected population can be found in DWR Table 3-1 below.
Kennedy/Jenks Consultants
Memorandum Calleguas Municipal Water District 29 April 2016 1570027*00 Page 2
j:\2015\1570027.00_gswc-2015 uwmp\09-reports\simi valley\06-corrspnd\6.03-other\demand projections memo simi valley_rev.doc © Kennedy/Jenks Consultants, Inc.
Table 3‐1 Retail: Population ‐ Current and Projected
Population Served 2015 2020 2025 2030 2035 2040(opt)
43,480 44,422 44,818 45,217 45,620 46,027
NOTES:
Demand Projections
Projected water demand utilized SCAG growth projections applied to 2015 service connection numbers combined with its respective historical customer average water use. The projected water demand is found in DWR Table 4-3 below.
Table 4‐3 Retail: Total Water Demands
2015 2020 2025 2030 2035 2040 (opt)
Potable and Raw Water From Tables 4‐1 and 4‐2
5,340 7,601 7,718 7,837 7,960 8,084
Recycled Water Demand From Table 6‐4
0 0 0 0 0 0
TOTAL WATER DEMAND 5,340 7,601 7,718 7,837 7,960 8,084
NOTES: Units are in acre‐feet
SB X7-7 Baseline and Targets
The Simi Valley System first reported its Baseline Daily Per Capita Water Use in its 2010 UWMP; however, at the time the 2010 UWMP was prepared, full 2010 Census data was not available. Therefore, for the 2015 UWMP, the Simi Valley System is required to recalculate baseline and target water use using 2010 Census data.
For the 2015 GSWC Simi Valley System, a 10-year baseline was used and Compliance Method 3 was selected for updating urban water use targets. The interim and compliance water targets as required per Section 10608.20(e) of SBX7-7 are presented below in DWR Table 5-1.
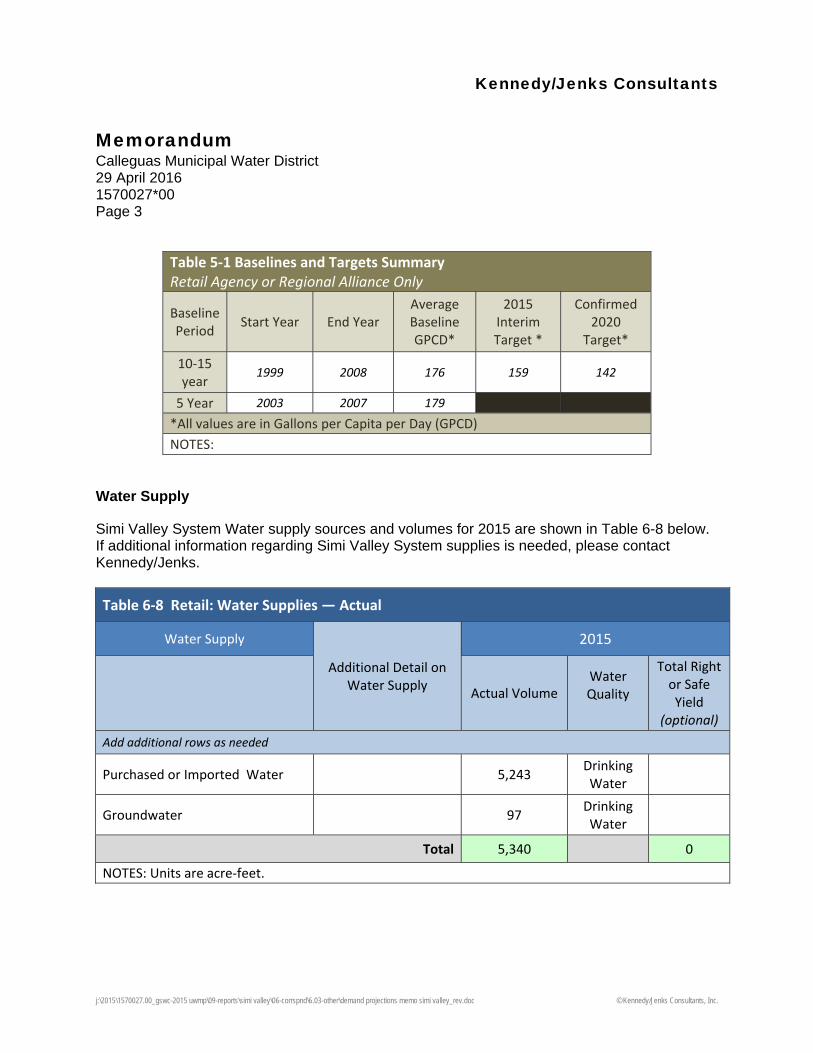
Kennedy/Jenks Consultants
Memorandum Calleguas Municipal Water District 29 April 2016 1570027*00 Page 3
j:\2015\1570027.00_gswc-2015 uwmp\09-reports\simi valley\06-corrspnd\6.03-other\demand projections memo simi valley_rev.doc © Kennedy/Jenks Consultants, Inc.
Table 5‐1 Baselines and Targets Summary Retail Agency or Regional Alliance Only
Baseline Period
Start Year End Year Average Baseline GPCD*
2015 Interim Target *
Confirmed 2020
Target*
10‐15 year
1999 2008 176 159 142
5 Year 2003 2007 179
*All values are in Gallons per Capita per Day (GPCD)
NOTES:
Water Supply
Simi Valley System Water supply sources and volumes for 2015 are shown in Table 6-8 below. If additional information regarding Simi Valley System supplies is needed, please contact Kennedy/Jenks.
Table 6‐8 Retail: Water Supplies — Actual
Water Supply
Additional Detail on Water Supply
2015
Actual Volume
Water Quality
Total Right or Safe Yield
(optional)
Add additional rows as needed
Purchased or Imported Water 5,243 Drinking Water
Groundwater 97 Drinking Water
Total 5,340 0
NOTES: Units are acre‐feet.
Appendix C
American Water Works Association Water Audits
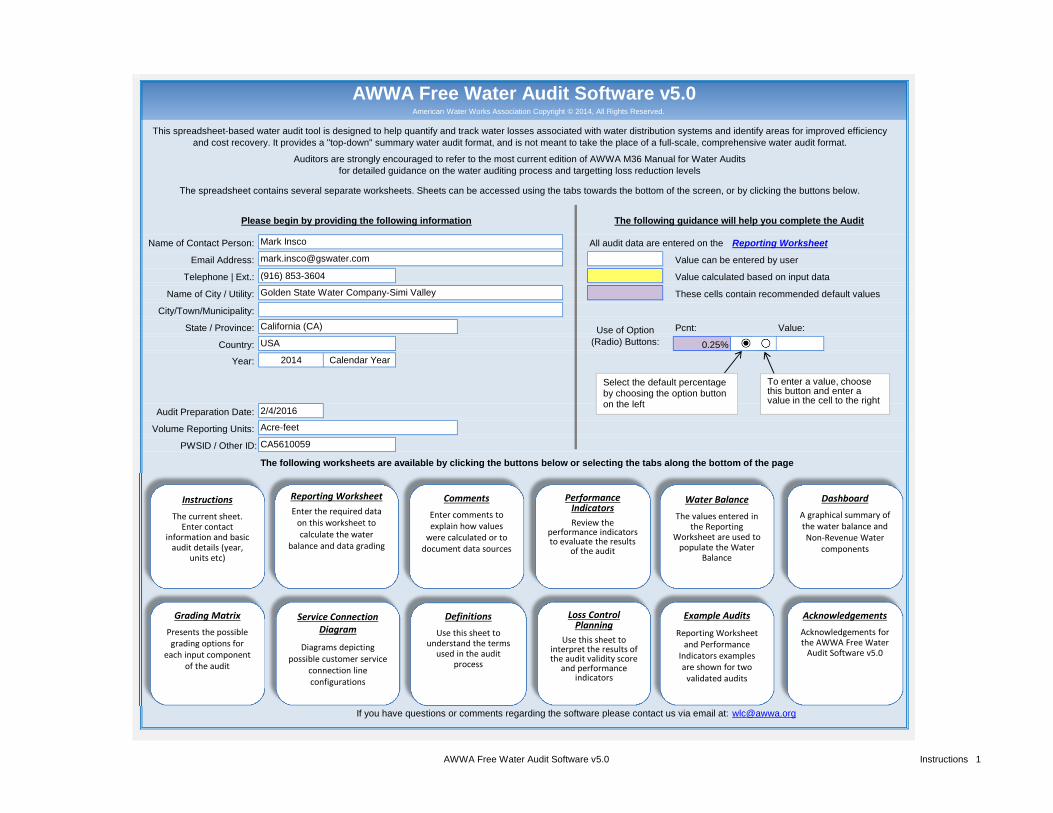
5
Name of Contact Person: All audit data are entered on the Reporting Worksheet
Email Address: Value can be entered by user
Telephone | Ext.: (916) 853-3604 Value calculated based on input data
Name of City / Utility: These cells contain recommended default values
City/Town/Municipality:
State / Province: Pcnt: Value:
Country: 0.25%
Year: 2014 Calendar Year
Start Date: Enter MM/YYYY numeric format
End Date: Enter MM/YYYY numeric format
Audit Preparation Date: 2/4/2016
Volume Reporting Units:
PWSID / Other ID:
If you have questions or comments regarding the software please contact us via email at: [email protected]
AWWA Free Water Audit Software v5.0
Golden State Water Company-Simi Valley
The following worksheets are available by clicking the buttons below or selecting the tabs along the bottom of the page
Auditors are strongly encouraged to refer to the most current edition of AWWA M36 Manual for Water Audits for detailed guidance on the water auditing process and targetting loss reduction levels
This spreadsheet-based water audit tool is designed to help quantify and track water losses associated with water distribution systems and identify areas for improved efficiency and cost recovery. It provides a "top-down" summary water audit format, and is not meant to take the place of a full-scale, comprehensive water audit format.
CA5610059
USAUse of Option
(Radio) Buttons:
The spreadsheet contains several separate worksheets. Sheets can be accessed using the tabs towards the bottom of the screen, or by clicking the buttons below.
Mark Insco
Acre-feet
Please begin by providing the following information The following guidance will help you complete the Audit
California (CA)
American Water Works Association Copyright © 2014, All Rights Reserved.
Select the default percentage by choosing the option button on the left
To enter a value, choose this button and enter a value in the cell to the right
Instructions
The current sheet.Enter contact
information and basic audit details (year,
units etc)
Performance IndicatorsReview the
performance indicators to evaluate the results
of the audit
Comments
Enter comments to explain how values were calculated or to document data sources
Water Balance
The values entered in the Reporting
Worksheet are used to populate the Water
Balance
Dashboard
A graphical summary of the water balance and Non‐Revenue Water
components
Grading Matrix
Presents the possible grading options for
each input component of the audit
Service Connection Diagram
Diagrams depicting possible customer service
connection line configurations
Acknowledgements
Acknowledgements for the AWWA Free Water Audit Software v5.0
Loss Control Planning
Use this sheet to interpret the results of the audit validity score
and performance indicators
Definitions
Use this sheet to understand the terms
used in the audit process
Example Audits
Reporting Worksheet and Performance
Indicators examples are shown for two validated audits
Reporting WorksheetEnter the required data on this worksheet to calculate the water
balance and data grading
AWWA Free Water Audit Software v5.0 Instructions 1
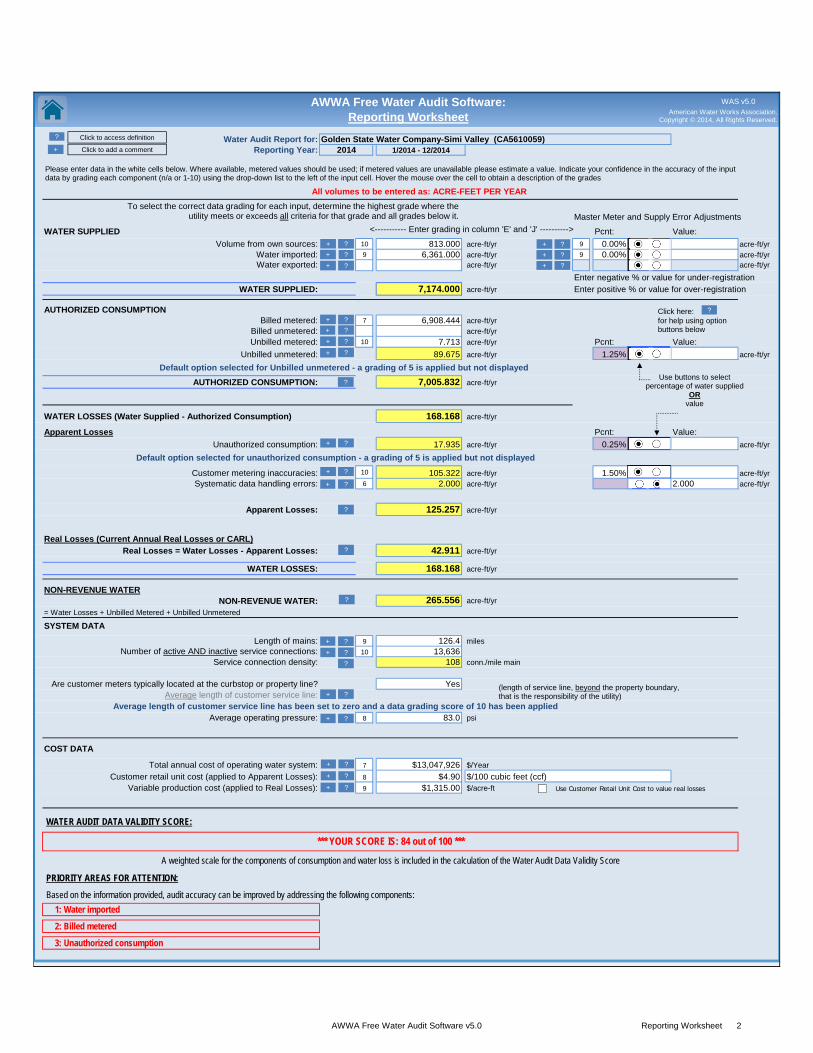
Water Audit Report for:Reporting Year:
All volumes to be entered as: ACRE-FEET PER YEAR
Master Meter and Supply Error Adjustments
WATER SUPPLIED Pcnt: Value:Volume from own sources: 10 813.000 acre-ft/yr 9 0.00% acre-ft/yr
Water imported: 9 6,361.000 acre-ft/yr 9 0.00% acre-ft/yrWater exported: acre-ft/yr acre-ft/yr
Enter negative % or value for under-registrationWATER SUPPLIED: 7,174.000 acre-ft/yr Enter positive % or value for over-registration
.AUTHORIZED CONSUMPTION
Billed metered: 7 6,908.444 acre-ft/yrBilled unmetered: acre-ft/yrUnbilled metered: 10 7.713 acre-ft/yr Pcnt: Value:
Unbilled unmetered: 89.675 acre-ft/yr 1.25% acre-ft/yr
AUTHORIZED CONSUMPTION: 7,005.832 acre-ft/yr
WATER LOSSES (Water Supplied - Authorized Consumption) 168.168 acre-ft/yr
Apparent Losses Pcnt: Value:Unauthorized consumption: 17.935 acre-ft/yr 0.25% acre-ft/yr
Customer metering inaccuracies: 10 105.322 acre-ft/yr 1.50% acre-ft/yrSystematic data handling errors: 6 2.000 acre-ft/yr 0.25% acre-ft/yr
Apparent Losses: 125.257 acre-ft/yr
Real Losses (Current Annual Real Losses or CARL)Real Losses = Water Losses - Apparent Losses: 42.911 acre-ft/yr
WATER LOSSES: 168.168 acre-ft/yr
NON-REVENUE WATERNON-REVENUE WATER: 265.556 acre-ft/yr
= Water Losses + Unbilled Metered + Unbilled Unmetered
SYSTEM DATA
Length of mains: 9 126.4 milesNumber of active AND inactive service connections: 10 13,636
Service connection density: 108 conn./mile main
YesAverage length of customer service line: ft
Average operating pressure: 8 83.0 psi
COST DATA
Total annual cost of operating water system: 7 $13,047,926 $/YearCustomer retail unit cost (applied to Apparent Losses): 8 $4.90
Variable production cost (applied to Real Losses): 9 $1,315.00 $/acre-ft
WATER AUDIT DATA VALIDITY SCORE:
PRIORITY AREAS FOR ATTENTION:
1: Water imported
2: Billed metered
3: Unauthorized consumption
AWWA Free Water Audit Software: Reporting Worksheet
Default option selected for Unbilled unmetered - a grading of 5 is applied but not displayed
2014 1/2014 - 12/2014Golden State Water Company-Simi Valley (CA5610059)
Average length of customer service line has been set to zero and a data grading score of 10 has been applied
Are customer meters typically located at the curbstop or property line?
Based on the information provided, audit accuracy can be improved by addressing the following components:
$/100 cubic feet (ccf)
<----------- Enter grading in column 'E' and 'J' ---------->
Default option selected for unauthorized consumption - a grading of 5 is applied but not displayed
2.000
*** YOUR SCORE IS: 84 out of 100 ***
A weighted scale for the components of consumption and water loss is included in the calculation of the Water Audit Data Validity Score
0.000
??
?
?
?
? Click to access definition
??
?
?
?
?
Please enter data in the white cells below. Where available, metered values should be used; if metered values are unavailable please estimate a value. Indicate your confidence in the accuracy of the input data by grading each component (n/a or 1-10) using the drop-down list to the left of the input cell. Hover the mouse over the cell to obtain a description of the grades
?
??
?
?
?
(length of service line, beyond the property boundary, that is the responsibility of the utility)
Use buttons to selectpercentage of water supplied
ORvalue
?Click here: for help using option buttons below
?
?
?
?
+
+ Click to add a comment
WAS v5.0
++
++
+
+
American Water Works Association.Copyright © 2014, All Rights Reserved.
???
+
++
+
+
+
++
+
+
+
+
+ Use Customer Retail Unit Cost to value real losses
?
To select the correct data grading for each input, determine the highest grade where the utility meets or exceeds all criteria for that grade and all grades below it.
AWWA Free Water Audit Software v5.0 Reporting Worksheet 2
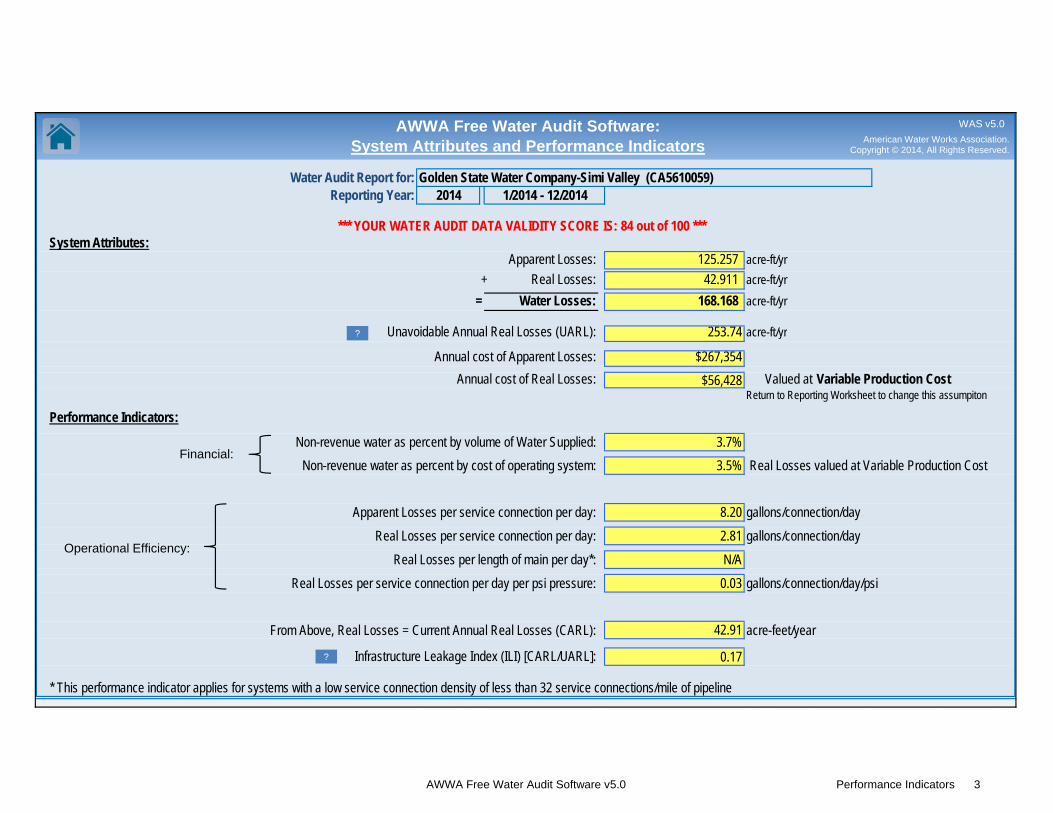
Water Audit Report for: Golden State Water Company-Simi Valley (CA5610059)Reporting Year:
System Attributes:Apparent Losses: 125.257 acre-ft/yr
+ Real Losses: 42.911 acre-ft/yr= Water Losses: 168.168 acre-ft/yr
Unavoidable Annual Real Losses (UARL): 253.74 acre-ft/yr
Annual cost of Apparent Losses: $267,354Annual cost of Real Losses: $56,428 Valued at Variable Production Cost
Performance Indicators:
Non-revenue water as percent by volume of Water Supplied: 3.7%Non-revenue water as percent by cost of operating system: 3.5% Real Losses valued at Variable Production Cost
Apparent Losses per service connection per day: 8.20 gallons/connection/dayReal Losses per service connection per day: 2.81 gallons/connection/day
Real Losses per length of main per day*: N/AReal Losses per service connection per day per psi pressure: 0.03 gallons/connection/day/psi
From Above, Real Losses = Current Annual Real Losses (CARL): 42.91 acre-feet/year
0.17
* This performance indicator applies for systems with a low service connection density of less than 32 service connections/mile of pipeline
AWWA Free Water Audit Software: System Attributes and Performance Indicators
*** YOUR WATER AUDIT DATA VALIDITY SCORE IS: 84 out of 100 ***
Infrastructure Leakage Index (ILI) [CARL/UARL]:
2014 1/2014 - 12/2014
Return to Reporting Worksheet to change this assumpiton
?
?
American Water Works Association.Copyright © 2014, All Rights Reserved.
WAS v5.0
Financial:
Operational Efficiency:
AWWA Free Water Audit Software v5.0 Performance Indicators 3
General Comment:
Audit Item
Volume from own sources:
Vol. from own sources: Master meter error adjustment:
Water imported:
Water imported: master meter error adjustment:
Water exported:
Water exported: master meter error adjustment:
Billed metered:
Billed unmetered:
Unbilled metered:
AWWA Free Water Audit Software: User Comments
Use this worksheet to add comments or notes to explain how an input value was calculated, or to document the sources of the information used.
Comment
WAS v5.0American Water Works Association.
Copyright © 2014, All Rights Reserved.
AWWA Free Water Audit Software v5.0 Comments 4

Audit Item Comment
Unbilled unmetered:
Unauthorized consumption:
Customer metering inaccuracies:
Systematic data handling errors:
Length of mains:
Number of active AND inactive service connections:
Average length of customer service line:
Average operating pressure:
Total annual cost of operating water system:
Customer retail unit cost (applied to Apparent Losses):
Variable production cost (applied to Real Losses):
AWWA Free Water Audit Software v5.0 Comments 5
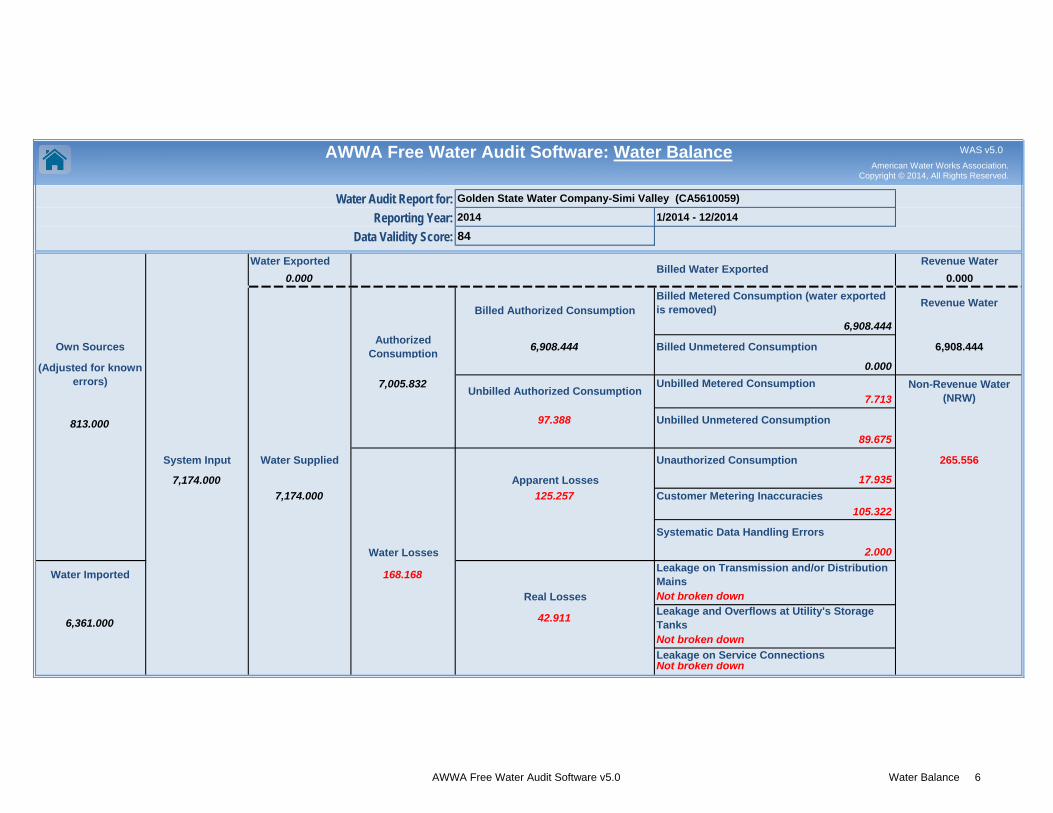
Water Audit Report for:
Reporting Year: 2014 1/2014 - 12/2014
Data Validity Score: 84
Water Exported Revenue Water0.000 0.000
Billed Metered Consumption (water exported is removed) Revenue Water
6,908.444
Own Sources Authorized Consumption 6,908.444 Billed Unmetered Consumption 6,908.444
0.0007,005.832 Unbilled Metered Consumption
7.713
813.000 97.388 Unbilled Unmetered Consumption
89.675
System Input Water Supplied Unauthorized Consumption 265.556
7,174.000 Apparent Losses 17.9357,174.000 125.257 Customer Metering Inaccuracies
105.322
Systematic Data Handling Errors
Water Losses 2.000
Water Imported 168.168 Leakage on Transmission and/or Distribution Mains
Real Losses Not broken down
6,361.000 42.911 Leakage and Overflows at Utility's Storage TanksNot broken downLeakage on Service ConnectionsNot broken down
AWWA Free Water Audit Software: Water Balance
Non-Revenue Water (NRW)
Billed Authorized Consumption
Unbilled Authorized Consumption
(Adjusted for known errors)
Billed Water Exported
Golden State Water Company-Simi Valley (CA5610059)
WAS v5.0American Water Works Association.
Copyright © 2014, All Rights Reserved.
AWWA Free Water Audit Software v5.0 Water Balance 6
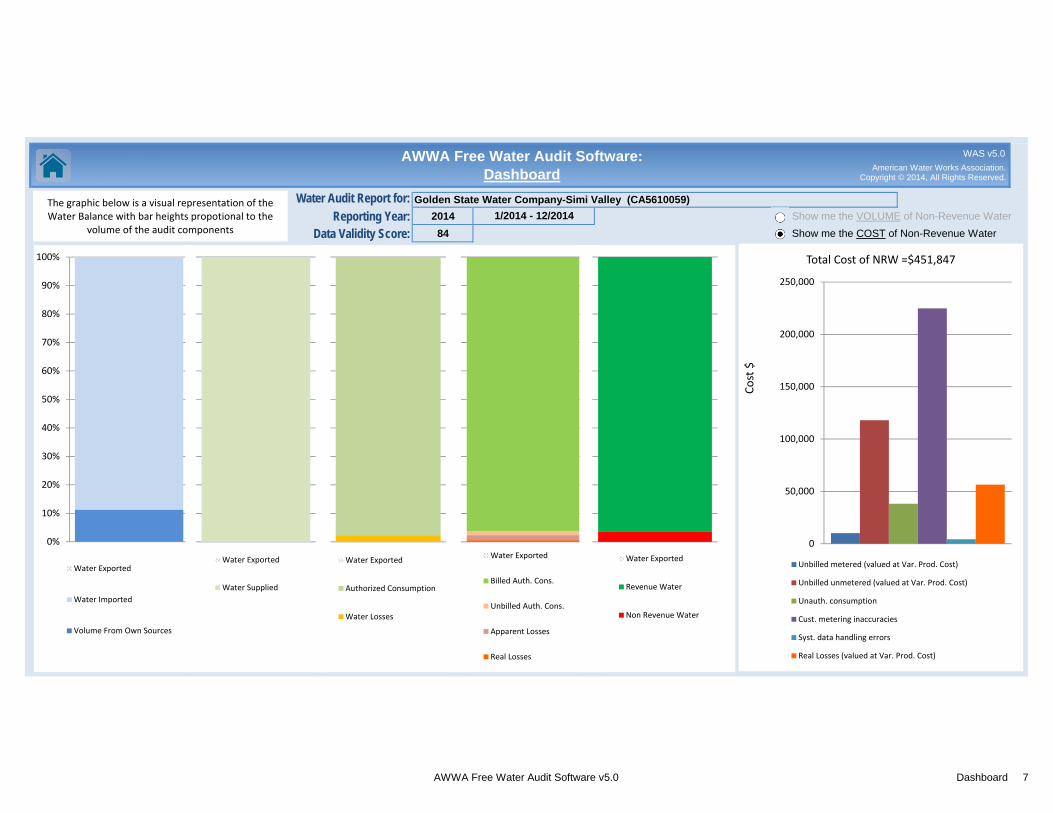
Water Audit Report for:
Reporting Year: 2014 Show me the VOLUME of Non-Revenue Water
Data Validity Score: 84 Show me the COST of Non-Revenue Water
AWWA Free Water Audit Software: Dashboard
1/2014 - 12/2014Golden State Water Company-Simi Valley (CA5610059)
0
50,000
100,000
150,000
200,000
250,000
Cost $
Total Cost of NRW =$451,847
Unbilled metered (valued at Var. Prod. Cost)
Unbilled unmetered (valued at Var. Prod. Cost)
Unauth. consumption
Cust. metering inaccuracies
Syst. data handling errors
Real Losses (valued at Var. Prod. Cost)
WAS v5.0American Water Works Association.
Copyright © 2014, All Rights Reserved.
Water Exported
Authorized Consumption
Water Losses
0%
10%
20%
30%
40%
50%
60%
70%
80%
90%
100%
Water Exported
Water Imported
Volume From Own Sources
Water Exported
Billed Auth. Cons.
Unbilled Auth. Cons.
Apparent Losses
Real Losses
Water Exported
Revenue Water
Non Revenue Water
The graphic below is a visual representation of the Water Balance with bar heights propotional to the
volume of the audit components
Water Exported
Water Supplied
AWWA Free Water Audit Software v5.0 Dashboard 7
Grading >>> n/a 1 2 3 4 5 6 7 8 9 10
Volume from own sources:
Select this grading only if the water utility
purchases/imports all of its water resources (i.e. has
no sources of its own)
Less than 25% of water production sources are metered, remaining
sources are estimated. No regular meter accuracy testing or electronic
calibration conducted.
25% - 50% of treated water production sources are metered;
other sources estimated. No regular meter accuracy testing or electronic
calibration conducted.
Conditions between 2 and 4
50% - 75% of treated water production sources are metered,
other sources estimated. Occasional meter accuracy testing or electronic
calibration conducted.
Conditions between 4 and 6
At least 75% of treated water production sources are metered, or at least 90% of the source flow is derived
from metered sources. Meter accuracy testing and/or electronic
calibration of related instrumentation is conducted annually. Less than 25% of tested meters are found outside of +/-
6% accuracy.
Conditions between 6 and 8
100% of treated water production sources are metered, meter accuracy
testing and electronic calibration of related instrumentation is conducted
annually, less than 10% of meters are found outside of +/- 6% accuracy
Conditions between 8 and 10
100% of treated water production sources are metered, meter accuracy
testing and electronic calibration of related instrumentation is conducted
semi-annually, with less than 10% found outside of +/- 3% accuracy. Procedures
are reviewed by a third party knowledgeable in the M36 methodology.
Improvements to attain higher data grading for "Volume from
own Sources" component:
to qualify for 2:Organize and launch efforts to
collect data for determining volume from own sources
to maintain 10:Standardize meter accuracy test
frequency to semi-annual, or more frequent, for all meters. Repair or replace meters outside of +/- 3%
accuracy. Continually investigate/pilot improving metering technology.
Volume from own sources master meter and supply error
adjustment:
Select n/a only if the water utility fails to have meters on its sources of supply
Inventory information on meters and paper records of measured volumes exist but are incomplete and/or in a
very crude condition; data error cannot be determined
No automatic datalogging of production volumes; daily readings
are scribed on paper records without any accountability controls. Flows are not balanced across the water distribution system: tank/storage
elevation changes are not employed in calculating the "Volume from own sources" component and archived
flow data is adjusted only when grossly evident data error occurs.
Conditions between 2 and 4
Production meter data is logged automatically in electronic format and reviewed at least on a monthly basis
with necessary corrections implemented. "Volume from own
sources" tabulations include estimate of daily changes in tanks/storage facilities. Meter data is adjusted when gross data errors occur, or
occasional meter testing deems this necessary.
Conditions between 4 and 6
Hourly production meter data logged automatically & reviewed on at least a
weekly basis. Data is adjusted to correct gross error when
meter/instrumentation equipment malfunction is detected; and/or error is confirmed by meter accuracy testing.
Tank/storage facility elevation changes are automatically used in calculating a balanced "Volume from own sources"
component, and data gaps in the archived data are corrected on at least
a weekly basis.
Conditions between 6 and 8
Continuous production meter data is logged automatically & reviewed each
business day. Data is adjusted to correct gross error from detected meter/instrumentation equipment
malfunction and/or results of meter accuracy testing. Tank/storage facility elevation changes are automatically used in "Volume from own sources"
tabulations and data gaps in the archived data are corrected on a daily
basis.
Conditions between 8 and 10
Computerized system (SCADA or similar) automatically balances flows from all sources and storages; results are reviewed each business day. Tight accountability controls ensure that all
data gaps that occur in the archived flow data are quickly detected and corrected.
Regular calibrations between SCADA and sources meters ensures minimal
data transfer error.
Improvements to attain higher data grading for "Master meter and supply error adjustment"
component:
to qualify for 2:Develop a plan to restructure
recordkeeping system to capture all flow data; set a procedure to review flow data on a daily basis to detect input errors. Obtain more reliable
information about existing meters by conducting field inspections of
meters and related instrumentation, and obtaining manufacturer
literature.
to maintain 10:Monitor meter innovations for
development of more accurate and less expensive flowmeters. Continue to
replace or repair meters as they perform outside of desired accuracy limits. Stay abreast of new and more accurate water level instruments to
better record tank/storage levels and archive the variations in storage volume.
Keep current with SCADA and data management systems to ensure that
archived data is well-managed and error free.
Water Imported:
Select n/a if the water utility's supply is
exclusively from its own water resources (no bulk
purchased/ imported water)
Less than 25% of imported water sources are metered, remaining
sources are estimated. No regular meter accuracy testing.
25% - 50% of imported water sources are metered; other sources
estimated. No regular meter accuracy testing.
Conditions between 2 and 4
50% - 75% of imported water sources are metered, other sources
estimated. Occasional meter accuracy testing conducted.
Conditions between 4 and 6
At least 75% of imported water sources are metered, meter accuracy testing and/or electronic calibration of related instrumentation is conducted annually for all meter installations.
Less than 25% of tested meters are found outside of +/- 6% accuracy.
Conditions between 6 and 8
100% of imported water sources are metered, meter accuracy testing and
electronic calibration of related instrumentation is conducted annually,
less than 10% of meters are found outside of +/- 6% accuracy
Conditions between 8 and 10
100% of imported water sources are metered, meter accuracy testing and
electronic calibration of related instrumentation is conducted semi-
annually for all meter installations, with less than 10% of accuracy tests found
outside of +/- 3% accuracy.
Improvements to attain higher data grading for "Water
Imported Volume" component:
(Note: usually the water supplier selling the water - "the Exporter" - to the utility being
audited is responsible to maintain the metering
installation measuring the imported volume. The utility should coordinate carefully with the Exporter to ensure that adequate meter upkeep takes place and an accurate
measure of the Water Imported volume is quantified. )
to qualify for 2:Review bulk water purchase
agreements with partner suppliers; confirm requirements for use and
maintenance of accurate metering. Identify needs for new or
replacement meters with goal to meter all imported water sources.
to maintain 10:Standardize meter accuracy test
frequency to semi-annual, or more frequent, for all meters. Continue to
conduct calibration of related instrumentation on a semi-annual basis. Repair or replace meters outside of +/-
3% accuracy. Continually investigate/pilot improving metering
technology.
AWWA Free Water Audit Software: Grading Matrix The grading assigned to each audit component and the corresponding recommended improvements and actions are highlighted in yellow. Audit accuracy is likely to be improved by prioritizing those items shown in red
to qualify for 6:Refine computerized data collection and archive to include hourly production meter data that is reviewed at least on a weekly basis to detect specific data anomalies and gaps.
Use daily net storage change to balance flows in calculating "Water Supplied" volume. Necessary corrections to data
errors are implemented on a weekly basis.
to qualify for 8:Ensure that all flow data is collected and archived on at least
an hourly basis. All data is reviewed and detected errors corrected each business day. Tank/storage levels variations
are employed in calculating balanced "Water Supplied" component. Adjust production meter data for gross error
and inaccuracy confirmed by testing.
to qualify for 10:Link all production and tank/storage facility elevation change data to a Supervisory Control & Data Acquisition (SCADA) System, or similar computerized monitoring/control system,
and establish automatic flow balancing algorithm and regularly calibrate between SCADA and source meters. Data is
reviewed and corrected each business day.
to qualify for 6:Formalize annual meter accuracy testing for all source
meters; specify the frequency of testing. Complete installation of meters on unmetered water production sources and complete replacement of all obsolete/defective meters.
to qualify for 8:Conduct annual meter accuracy testing and calibration of
related instrumentation on all meter installations on a regular basis. Complete project to install new, or replace defective existing, meters so that entire production meter population is
metered. Repair or replace meters outside of +/- 6% accuracy.
to qualify for 10:Maintain annual meter accuracy testing and calibration of
related instrumentation for all meter installations. Repair or replace meters outside of +/- 3% accuracy. Investigate new
meter technology; pilot one or more replacements with innovative meters in attempt to further improve meter
accuracy.
to qualify for 4:Install automatic datalogging equipment on production
meters. Complete installation of level instrumentation at all tanks/storage facilities and include tank level data in
automatic calculation routine in a computerized system. Construct a computerized listing or spreadsheet to archive
input volumes, tank/storage volume changes and import/export flows in order to determine the composite
"Water Supplied" volume for the distribution system. Set a procedure to review this data on a monthly basis to detect
gross anomalies and data gaps.
WATER SUPPLIED
to qualify for 8:Complete project to install new, or replace defective, meters
on all imported water interconnections. Maintain annual meter accuracy testing for all imported water meters and
conduct calibration of related instrumentation at least annually. Repair or replace meters outside of +/- 6%
accuracy.
to qualify for 4:Locate all water production sources on maps and in the field, launch meter accuracy testing for existing meters, begin to install meters on unmetered water production sources and replace any obsolete/defective meters.
To qualify for 4:Locate all imported water sources on maps and in the field, launch meter accuracy testing for existing meters, begin to
install meters on unmetered imported water interconnections and replace obsolete/defective meters.
to qualify for 6:Formalize annual meter accuracy testing for all imported water meters, planning for both regular meter accuracy
testing and calibration of the related instrumentation. Continue installation of meters on unmetered imported water
interconnections and replacement of obsolete/defective meters.
to qualify for 10:Conduct meter accuracy testing for all meters on a semi-
annual basis, along with calibration of all related instrumentation. Repair or replace meters outside of +/- 3%
accuracy. Investigate new meter technology; pilot one or more replacements with innovative meters in attempt to improve
meter accuracy.
WAS 5.0American Water Works Association. Copyright © 2014, All Rights Reserved.
AWWA Free Water Audit Software v5.0 Grading Matrix 8
Grading >>> n/a 1 2 3 4 5 6 7 8 9 10
Water imported master meter and supply error adjustment:
Select n/a if the Imported water supply is
unmetered, with Imported water quantities estimated on the billing invoices sent
by the Exporter to the purchasing Utility.
Inventory information on imported meters and paper records of
measured volumes exist but are incomplete and/or in a very crude
condition; data error cannot be determined Written agreement(s)
with water Exporter(s) are missing or written in vague language
concerning meter management and testing.
No automatic datalogging of imported supply volumes; daily readings are scribed on paper
records without any accountability controls to confirm data accuracy
and the absence of errors and data gaps in recorded volumes. Written agreement requires meter accuracy testing but is vague on the details of how and who conducts the testing.
Conditions between 2 and 4
Imported supply metered flow data is logged automatically in electronic format and reviewed at least on a monthly basis by the Exporter with
necessary corrections implemented. Meter data is adjusted by the
Exporter when gross data errors are detected. A coherent data trail exists
for this process to protect both the selling and the purchasing Utility.
Written agreement exists and clearly states requirements and roles for meter accuracy testing and data
management.
Conditions between 4 and 6
Hourly Imported supply metered data is logged automatically & reviewed on
at least a weekly basis by the Exporter. Data is adjusted to correct gross error when meter/instrumentation equipment malfunction is detected; and to correct for error confirmed by meter accuracy testing. Any data gaps in the archived data are detected and corrected during
the weekly review. A coherent data trail exists for this process to protect both the selling and the purchasing
Utility.
Conditions between 6 and 8
Continuous Imported supply metered flow data is logged automatically & reviewed each business day by the
Exporter. Data is adjusted to correct gross error from detected
meter/instrumentation equipment malfunction and/or results of meter
accuracy testing. Any data errors/gaps are detected and
corrected on a daily basis. A data trail exists for the process to protect both the selling and the purchasing Utility.
Conditions between 8 and 10
Computerized system (SCADA or similar) automatically records data
which is reviewed each business day by the Exporter. Tight accountability
controls ensure that all error/data gaps that occur in the archived flow data are
quickly detected and corrected. A reliable data trail exists and contract provisions for meter testing and data
management are reviewed by the selling and purchasing Utility at least once
every five years.
Improvements to attain higher data grading for "Water
imported master meter and supply error adjustment"
component:
to qualify for 2:Develop a plan to restructure
recordkeeping system to capture all flow data; set a procedure to review flow data on a daily basis to detect input errors. Obtain more reliable
information about existing meters by conducting field inspections of
meters and related instrumentation, and obtaining manufacturer
literature. Review the written agreement between the selling and
purchasing Utility.
to maintain 10:Monitor meter innovations for
development of more accurate and less expensive flowmeters; work with the
Exporter to help identify meter replacement needs. Keep
communication lines with Exporters open and maintain productive relations. Keep the written agreement current with clear and explicit language that meets
the ongoing needs of all parties.
Water Exported:
Select n/a if the water utility sells no bulk water to neighboring water utilities (no exported water sales)
Less than 25% of exported water sources are metered, remaining
sources are estimated. No regular meter accuracy testing.
25% - 50% of exported water sources are metered; other sources
estimated. No regular meter accuracy testing.
Conditions between 2 and 4
50% - 75% of exported water sources are metered, other sources
estimated. Occasional meter accuracy testing conducted.
Conditions between 4 and 6
At least 75% of exported water sources are metered, meter accuracy
testing and/or electronic calibration conducted annually. Less than 25% of tested meters are found outside of +/-
6% accuracy.
Conditions between 6 and 8
100% of exported water sources are metered, meter accuracy testing and
electronic calibration of related instrumentation is conducted annually,
less than 10% of meters are found outside of +/- 6% accuracy
Conditions between 8 and 10
100% of exported water sources are metered, meter accuracy testing and
electronic calibration of related instrumentation is conducted semi-
annually for all meter installations, with less than 10% of accuracy tests found
outside of +/- 3% accuracy.
Improvements to attain higher data grading for "Water
Exported Volume" component:
(Note: usually, if the water utility being audited sells
(Exports) water to a neighboring purchasing Utility,
it is the responsibility of the utility exporting the water to
maintain the metering installation measuring the
Exported volume. The utility exporting the water should ensure that adequate meter upkeep takes place and an
accurate measure of the Water Exported volume is
quantified. )
to qualify for 2:Review bulk water sales agreements
with purchasing utilities; confirm requirements for use & upkeep of
accurate metering. Identify needs to install new, or replace defective
meters as needed.
to maintain 10:Standardize meter accuracy test
frequency to semi-annual, or more frequent, for all meters. Repair or replace meters outside of +/- 3%
accuracy. Continually investigate/pilot improving metering technology.
Water exported master meter and supply error adjustment:
Select n/a only if the water utility fails to have meters
on its exported supply interconnections.
Inventory information on exported meters and paper records of
measured volumes exist but are incomplete and/or in a very crude
condition; data error cannot be determined Written agreement(s) with the utility purchasing the water
are missing or written in vague language concerning meter management and testing.
No automatic datalogging of exported supply volumes; daily readings are scribed on paper
records without any accountability controls to confirm data accuracy
and the absence of errors and data gaps in recorded volumes. Written agreement requires meter accuracy testing but is vague on the details of how and who conducts the testing.
Conditions between 2 and 4
Exported metered flow data is logged automatically in electronic format and reviewed at least on a monthly basis,
with necessary corrections implemented. Meter data is adjusted
by the utility selling (exporting) the water when gross data errors are
detected. A coherent data trail exists for this process to protect both the utility exporting the water and the
purchasing Utility. Written agreement exists and clearly states requirements and roles for meter accuracy testing
and data management.
Conditions between 4 and 6
Hourly exported supply metered data is logged automatically & reviewed on at least a weekly basis by the utility selling the water. Data is adjusted to correct
gross error when meter/instrumentation equipment
malfunction is detected; and to correct for error found by meter accuracy
testing. Any data gaps in the archived data are detected and corrected during
the weekly review. A coherent data trail exists for this process to protect both the selling (exporting) utility and
the purchasing Utility.
Conditions between 6 and 8
Continuous exported supply metered flow data is logged automatically & reviewed each business day by the utility selling (exporting) the water.
Data is adjusted to correct gross error from detected meter/instrumentation equipment malfunction and any error confirmed by meter accuracy testing.
Any data errors/gaps are detected and corrected on a daily basis. A data trail exists for the process to protect both the selling (exporting) Utility and the
purchasing Utility.
Conditions between 8 and 10
Computerized system (SCADA or similar) automatically records data
which is reviewed each business day by the utility selling (exporting) the water.
Tight accountability controls ensure that all error/data gaps that occur in the
archived flow data are quickly detected and corrected. A reliable data trail
exists and contract provisions for meter testing and data management are reviewed by the selling Utility and
purchasing Utility at least once every five years.
to qualify for 4:Install automatic datalogging equipment on Imported
supply meters. Set a procedure to review this data on a monthly basis to detect gross anomalies and data gaps. Launch discussions with the Exporters to jointly review
terms of the written agreements regarding meter accuracy testing and data management; revise the terms as
necessary.
to qualify for 6:Refine computerized data collection and archive to include
hourly Imported supply metered flow data that is reviewed at least on a weekly basis to detect specific data anomalies and gaps. Make necessary corrections to errors/data errors on a
weekly basis.
to qualify for 8:Ensure that all Imported supply metered flow data is
collected and archived on at least an hourly basis. All data is reviewed and errors/data gaps are corrected each business
day.
to qualify for 6:Formalize annual meter accuracy testing for all exported
water meters. Continue installation of meters on unmetered exported water interconnections and replacement of
obsolete/defective meters.
to qualify for 8:Complete project to install new, or replace defective, meters
on all exported water interconnections. Maintain annual meter accuracy testing for all exported water meters. Repair
or replace meters outside of +/- 6% accuracy.
to qualify for 10:Maintain annual meter accuracy testing for all meters. Repair or replace meters outside of +/- 3% accuracy. Investigate new
meter technology; pilot one or more replacements with innovative meters in attempt to improve meter accuracy.
to qualify for 10:Conduct accountability checks to confirm that all Imported
supply metered data is reviewed and corrected each business day by the Exporter. Results of all meter accuracy tests and data corrections should be available for sharing between the
Exporter and the purchasing Utility. Establish a schedule for a regular review and updating of the contractual language in the
written agreement between the selling and the purchasing Utility; at least every five years.
To qualify for 4:Locate all exported water sources on maps and in field,
launch meter accuracy testing for existing meters, begin to install meters on unmetered exported water
interconnections and replace obsolete/defective meters
AWWA Free Water Audit Software v5.0 Grading Matrix 9
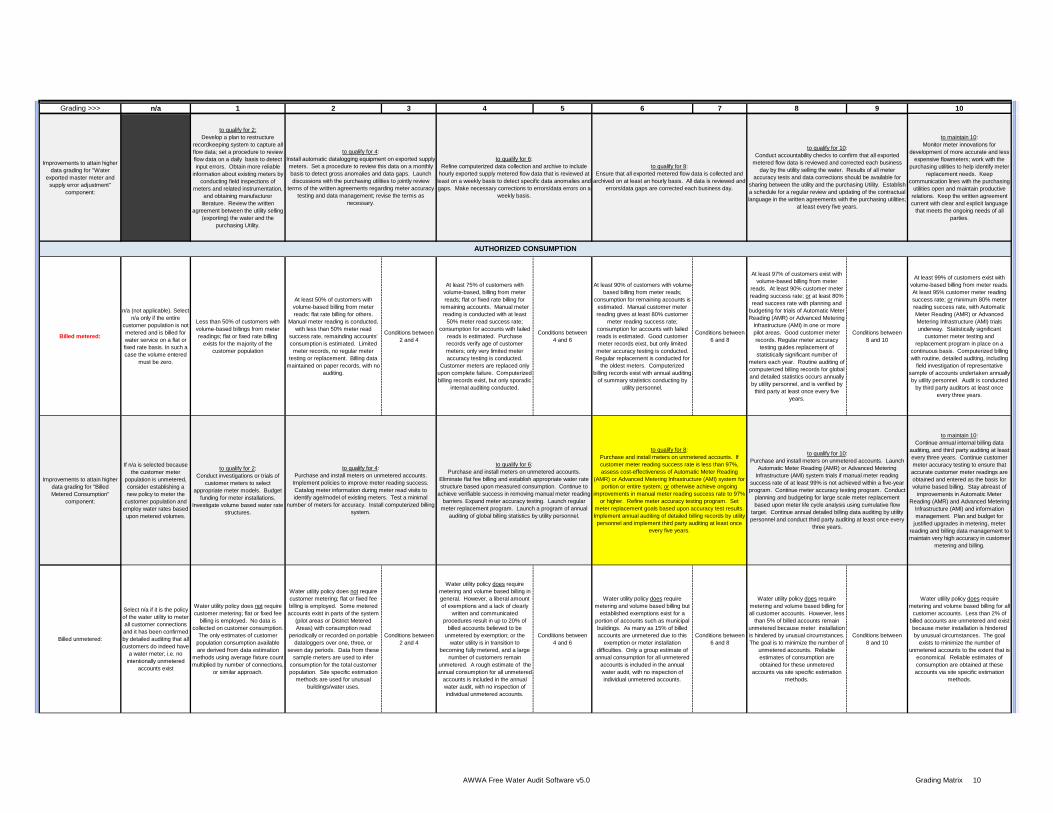
Grading >>> n/a 1 2 3 4 5 6 7 8 9 10
Improvements to attain higher data grading for "Water
exported master meter and supply error adjustment"
component:
to qualify for 2:Develop a plan to restructure
recordkeeping system to capture all flow data; set a procedure to review flow data on a daily basis to detect input errors. Obtain more reliable
information about existing meters by conducting field inspections of
meters and related instrumentation, and obtaining manufacturer
literature. Review the written agreement between the utility selling
(exporting) the water and the purchasing Utility.
to maintain 10:Monitor meter innovations for
development of more accurate and less expensive flowmeters; work with the
purchasing utilities to help identify meter replacement needs. Keep
communication lines with the purchasing utilities open and maintain productive
relations. Keep the written agreement current with clear and explicit language
that meets the ongoing needs of all parties.
Billed metered:
n/a (not applicable). Select n/a only if the entire
customer population is not metered and is billed for water service on a flat or fixed rate basis. In such a case the volume entered
must be zero.
Less than 50% of customers with volume-based billings from meter readings; flat or fixed rate billing
exists for the majority of the customer population
At least 50% of customers with volume-based billing from meter reads; flat rate billing for others.
Manual meter reading is conducted, with less than 50% meter read
success rate, remainding accounts' consumption is estimated. Limited
meter records, no regular meter testing or replacement. Billing data
maintained on paper records, with no auditing.
Conditions between 2 and 4
At least 75% of customers with volume-based, billing from meter reads; flat or fixed rate billing for
remaining accounts. Manual meter reading is conducted with at least
50% meter read success rate; consumption for accounts with failed
reads is estimated. Purchase records verify age of customer meters; only very limited meter accuracy testing is conducted.
Customer meters are replaced only upon complete failure. Computerized billing records exist, but only sporadic
internal auditing conducted.
Conditions between 4 and 6
At least 90% of customers with volume-based billing from meter reads;
consumption for remaining accounts is estimated. Manual customer meter reading gives at least 80% customer
meter reading success rate; consumption for accounts with failed reads is estimated. Good customer meter records eixst, but only limited meter accuracy testing is conducted. Regular replacement is conducted for
the oldest meters. Computerized billing records exist with annual auditing
of summary statistics conducting by utility personnel.
Conditions between 6 and 8
At least 97% of customers exist with volume-based billing from meter
reads. At least 90% customer meter reading success rate; or at least 80% read success rate with planning and
budgeting for trials of Automatic Meter Reading (AMR) or Advanced Metering
Infrastructure (AMI) in one or more pilot areas. Good customer meter records. Regular meter accuracy
testing guides replacement of statistically significant number of
meters each year. Routine auditing of computerized billing records for global and detailed statistics occurs annually by utility personnel, and is verified by
third party at least once every five years.
Conditions between 8 and 10
At least 99% of customers exist with volume-based billing from meter reads. At least 95% customer meter reading success rate; or minimum 80% meter reading success rate, with Automatic Meter Reading (AMR) or Advanced Metering Infrastructure (AMI) trials underway. Statistically significant
customer meter testing and replacement program in place on a
continuous basis. Computerized billing with routine, detailed auditing, including
field investigation of representative sample of accounts undertaken annually by utility personnel. Audit is conducted
by third party auditors at least once every three years.
Improvements to attain higher data grading for "Billed Metered Consumption"
component:
If n/a is selected because the customer meter
population is unmetered, consider establishing a new policy to meter the
customer population and employ water rates based upon metered volumes.
to qualify for 2:Conduct investigations or trials of
customer meters to select appropriate meter models. Budget
funding for meter installations. Investigate volume based water rate
structures.
to maintain 10:Continue annual internal billing data
auditing, and third party auditing at least every three years. Continue customer meter accuracy testing to ensure that accurate customer meter readings are obtained and entered as the basis for volume based billing. Stay abreast of
improvements in Automatic Meter Reading (AMR) and Advanced Metering
Infrastructure (AMI) and information management. Plan and budget for
justified upgrades in metering, meter reading and billing data management to maintain very high accuracy in customer
metering and billing.
Billed unmetered:
Select n/a if it is the policy of the water utility to meter all customer connections and it has been confirmed by detailed auditing that all customers do indeed have
a water meter; i.e. no intentionally unmetered
accounts exist
Water utility policy does not require customer metering; flat or fixed fee
billing is employed. No data is collected on customer consumption.
The only estimates of customer population consumption available are derived from data estimation
methods using average fixture count multiplied by number of connections,
or similar approach.
Water utility policy does not require customer metering; flat or fixed fee billing is employed. Some metered accounts exist in parts of the system
(pilot areas or District Metered Areas) with consumption read
periodically or recorded on portable dataloggers over one, three, or
seven day periods. Data from these sample meters are used to infer
consumption for the total customer population. Site specific estimation
methods are used for unusual buildings/water uses.
Conditions between 2 and 4
Water utility policy does require metering and volume based billing in general. However, a liberal amount of exemptions and a lack of clearly
written and communicated procedures result in up to 20% of
billed accounts believed to be unmetered by exemption; or the
water utility is in transition to becoming fully metered, and a large
number of customers remain unmetered. A rough estimate of the annual consumption for all unmetered
accounts is included in the annual water audit, with no inspection of individual unmetered accounts.
Conditions between 4 and 6
Water utility policy does require metering and volume based billing but
established exemptions exist for a portion of accounts such as municipal buildings. As many as 15% of billed accounts are unmetered due to this
exemption or meter installation difficulties. Only a group estimate of
annual consumption for all unmetered accounts is included in the annual water audit, with no inspection of individual unmetered accounts.
Conditions between 6 and 8
Water utility policy does require metering and volume based billing for all customer accounts. However, less
than 5% of billed accounts remain unmetered because meter installation is hindered by unusual circumstances. The goal is to minimize the number of
unmetered accounts. Reliable estimates of consumption are obtained for these unmetered
accounts via site specific estimation methods.
Conditions between 8 and 10
Water utility policy does require metering and volume based billing for all
customer accounts. Less than 2% of billed accounts are unmetered and exist because meter installation is hindered by unusual circumstances. The goal
exists to minimize the number of unmetered accounts to the extent that is
economical. Reliable estimates of consumption are obtained at these accounts via site specific estimation
methods.
to qualify for 4:Purchase and install meters on unmetered accounts.
Implement policies to improve meter reading success. Catalog meter information during meter read visits to identify age/model of existing meters. Test a minimal
number of meters for accuracy. Install computerized billing system.
to qualify for 6:Purchase and install meters on unmetered accounts.
Eliminate flat fee billing and establish appropriate water rate structure based upon measured consumption. Continue to
achieve verifiable success in removing manual meter reading barriers. Expand meter accuracy testing. Launch regular
meter replacement program. Launch a program of annual auditing of global billing statistics by utility personnel.
to qualify for 10:Purchase and install meters on unmetered accounts. Launch
Automatic Meter Reading (AMR) or Advanced Metering Infrastructure (AMI) system trials if manual meter reading
success rate of at least 99% is not achieved within a five-year program. Continue meter accuracy testing program. Conduct
planning and budgeting for large scale meter replacement based upon meter life cycle analysis using cumulative flow
target. Continue annual detailed billing data auditing by utility personnel and conduct third party auditing at least once every
three years.
to qualify for 4:Install automatic datalogging equipment on exported supply meters. Set a procedure to review this data on a monthly basis to detect gross anomalies and data gaps. Launch discussions with the purchasing utilities to jointly review
terms of the written agreements regarding meter accuracy testing and data management; revise the terms as
necessary.
to qualify for 8:Purchase and install meters on unmetered accounts. If customer meter reading success rate is less than 97%, assess cost-effectiveness of Automatic Meter Reading
(AMR) or Advanced Metering Infrastructure (AMI) system for portion or entire system; or otherwise achieve ongoing
improvements in manual meter reading success rate to 97% or higher. Refine meter accuracy testing program. Set
meter replacement goals based upon accuracy test results. Implement annual auditing of detailed billing records by utility personnel and implement third party auditing at least once
every five years.
AUTHORIZED CONSUMPTION
to qualify for 10:Conduct accountability checks to confirm that all exported
metered flow data is reviewed and corrected each business day by the utility selling the water. Results of all meter
accuracy tests and data corrections should be available for sharing between the utility and the purchasing Utility. Establish a schedule for a regular review and updating of the contractual language in the written agreements with the purchasing utilities;
at least every five years.
to qualify for 6:Refine computerized data collection and archive to include
hourly exported supply metered flow data that is reviewed at least on a weekly basis to detect specific data anomalies and gaps. Make necessary corrections to errors/data errors on a
weekly basis.
to qualify for 8:Ensure that all exported metered flow data is collected and
archived on at least an hourly basis. All data is reviewed and errors/data gaps are corrected each business day.
AWWA Free Water Audit Software v5.0 Grading Matrix 10
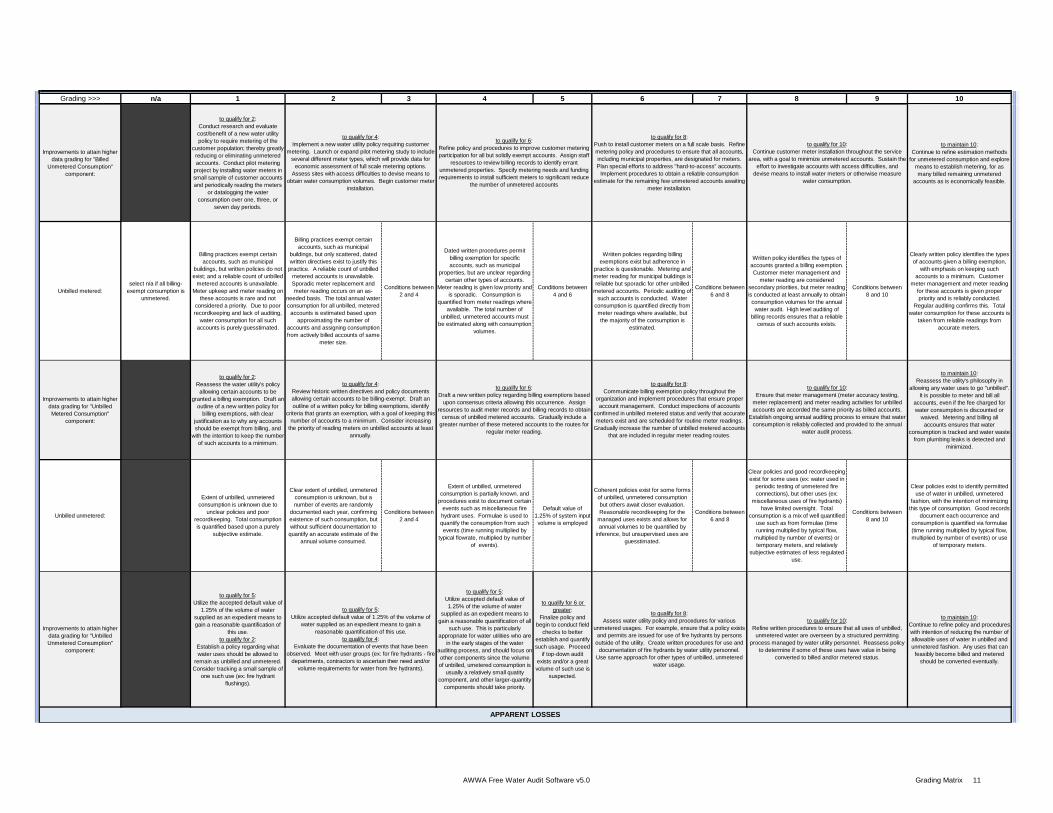
Grading >>> n/a 1 2 3 4 5 6 7 8 9 10
Improvements to attain higher data grading for "Billed
Unmetered Consumption" component:
to qualify for 2: Conduct research and evaluate cost/benefit of a new water utility policy to require metering of the
customer population; thereby greatly reducing or eliminating unmetered accounts. Conduct pilot metering
project by installing water meters in small sample of customer accounts and periodically reading the meters
or datalogging the water consumption over one, three, or
seven day periods.
to maintain 10: Continue to refine estimation methods
for unmetered consumption and explore means to establish metering, for as many billed remaining unmetered
accounts as is economically feasible.
Unbilled metered:select n/a if all billing-
exempt consumption is unmetered.
Billing practices exempt certain accounts, such as municipal
buildings, but written policies do not exist; and a reliable count of unbilled
metered accounts is unavailable. Meter upkeep and meter reading on
these accounts is rare and not considered a priority. Due to poor recordkeeping and lack of auditing,
water consumption for all such accounts is purely guesstimated.
Billing practices exempt certain accounts, such as municipal
buildings, but only scattered, dated written directives exist to justify this practice. A reliable count of unbilled
metered accounts is unavailable. Sporadic meter replacement and meter reading occurs on an as-
needed basis. The total annual water consumption for all unbilled, metered accounts is estimated based upon
approximating the number of accounts and assigning consumption from actively billed accounts of same
meter size.
Conditions between 2 and 4
Dated written procedures permit billing exemption for specific accounts, such as municipal
properties, but are unclear regarding certain other types of accounts.
Meter reading is given low priority and is sporadic. Consumption is
quantified from meter readings where available. The total number of
unbilled, unmetered accounts must be estimated along with consumption
volumes.
Conditions between 4 and 6
Written policies regarding billing exemptions exist but adherence in
practice is questionable. Metering and meter reading for municipal buildings is reliable but sporadic for other unbilled
metered accounts. Periodic auditing of such accounts is conducted. Water
consumption is quantified directly from meter readings where available, but the majority of the consumption is
estimated.
Conditions between 6 and 8
Written policy identifies the types of accounts granted a billing exemption. Customer meter management and
meter reading are considered secondary priorities, but meter reading is conducted at least annually to obtain consumption volumes for the annual water audit. High level auditing of
billing records ensures that a reliable census of such accounts exists.
Conditions between 8 and 10
Clearly written policy identifies the types of accounts given a billing exemption,
with emphasis on keeping such accounts to a minimum. Customer
meter management and meter reading for these accounts is given proper priority and is reliably conducted.
Regular auditing confirms this. Total water consumption for these accounts is
taken from reliable readings from accurate meters.
Improvements to attain higher data grading for "Unbilled Metered Consumption"
component:
to qualify for 2:Reassess the water utility's policy
allowing certain accounts to be granted a billing exemption. Draft an
outline of a new written policy for billing exemptions, with clear
justification as to why any accounts should be exempt from billing, and
with the intention to keep the number of such accounts to a minimum.
to maintain 10:Reassess the utility's philosophy in
allowing any water uses to go "unbilled". It is possible to meter and bill all
accounts, even if the fee charged for water consumption is discounted or
waived. Metering and billing all accounts ensures that water
consumption is tracked and water waste from plumbing leaks is detected and
minimized.
Unbilled unmetered:
Extent of unbilled, unmetered consumption is unknown due to
unclear policies and poor recordkeeping. Total consumption is quantified based upon a purely
subjective estimate.
Clear extent of unbilled, unmetered consumption is unknown, but a number of events are randomly
documented each year, confirming existence of such consumption, but without sufficient documentation to
quantify an accurate estimate of the annual volume consumed.
Conditions between 2 and 4
Extent of unbilled, unmetered consumption is partially known, and
procedures exist to document certain events such as miscellaneous fire hydrant uses. Formulae is used to quantify the consumption from such events (time running multiplied by
typical flowrate, multiplied by number of events).
Default value of 1.25% of system input volume is employed
Coherent policies exist for some forms of unbilled, unmetered consumption but others await closer evaluation. Reasonable recordkeeping for the
managed uses exists and allows for annual volumes to be quantified by
inference, but unsupervised uses are guesstimated.
Conditions between 6 and 8
Clear policies and good recordkeeping exist for some uses (ex: water used in
periodic testing of unmetered fire connections), but other uses (ex:
miscellaneous uses of fire hydrants) have limited oversight. Total
consumption is a mix of well quantified use such as from formulae (time running multiplied by typical flow,
multiplied by number of events) or temporary meters, and relatively
subjective estimates of less regulated use.
Conditions between 8 and 10
Clear policies exist to identify permitted use of water in unbilled, unmetered
fashion, with the intention of minimizing this type of consumption. Good records
document each occurrence and consumption is quantified via formulae (time running multiplied by typical flow, multiplied by number of events) or use
of temporary meters.
Improvements to attain higher data grading for "Unbilled Unmetered Consumption"
component:
to qualify for 5:Utilize the accepted default value of
1.25% of the volume of water supplied as an expedient means to gain a reasonable quantification of
this use.to qualify for 2:
Establish a policy regarding what water uses should be allowed to
remain as unbilled and unmetered. Consider tracking a small sample of
one such use (ex: fire hydrant flushings).
to qualify for 5:Utilize accepted default value of 1.25% of the volume of water
supplied as an expedient means to gain a reasonable quantification of all
such use. This is particularly appropriate for water utilities who are
in the early stages of the water auditing process, and should focus on other components since the volume of unbilled, umetered consumption is
usually a relatively small quatity component, and other larger-quantity
components should take priority.
to qualify for 6 or greater:
Finalize policy and begin to conduct field
checks to better establish and quantify such usage. Proceed
if top-down audit exists and/or a great volume of such use is
suspected.
to maintain 10:Continue to refine policy and procedures with intention of reducing the number of allowable uses of water in unbilled and unmetered fashion. Any uses that can
feasibly become billed and metered should be converted eventually.
to qualify for 10:Ensure that meter management (meter accuracy testing,
meter replacement) and meter reading activities for unbilled accounts are accorded the same priority as billed accounts.
Establish ongoing annual auditing process to ensure that water consumption is reliably collected and provided to the annual
water audit process.
to qualify for 4: Implement a new water utility policy requiring customer
metering. Launch or expand pilot metering study to include several different meter types, which will provide data for
economic assessment of full scale metering options. Assess sites with access difficulties to devise means to
obtain water consumption volumes. Begin customer meter installation.
to qualify for 6:Refine policy and procedures to improve customer metering participation for all but solidly exempt accounts. Assign staff
resources to review billing records to identify errant unmetered properties. Specify metering needs and funding requirements to install sufficient meters to significant reduce
the number of unmetered accounts
to qualify for 4:Review historic written directives and policy documents allowing certain accounts to be billing-exempt. Draft an outline of a written policy for billing exemptions, identify
criteria that grants an exemption, with a goal of keeping this number of accounts to a minimum. Consider increasing
the priority of reading meters on unbilled accounts at least annually.
to qualify for 6:Draft a new written policy regarding billing exemptions based
upon consensus criteria allowing this occurrence. Assign resources to audit meter records and billing records to obtain
census of unbilled metered accounts. Gradually include a greater number of these metered accounts to the routes for
regular meter reading.
to qualify for 10:Refine written procedures to ensure that all uses of unbilled,
unmetered water are overseen by a structured permitting process managed by water utility personnel. Reassess policy
to determine if some of these uses have value in being converted to billed and/or metered status.
to qualify for 8:Assess water utility policy and procedures for various
unmetered usages. For example, ensure that a policy exists and permits are issued for use of fire hydrants by persons outside of the utility. Create written procedures for use and
documentation of fire hydrants by water utility personnel. Use same approach for other types of unbilled, unmetered
water usage.
to qualify for 5:Utilize accepted default value of 1.25% of the volume of
water supplied as an expedient means to gain a reasonable quantification of this use.
to qualify for 4:Evaluate the documentation of events that have been
observed. Meet with user groups (ex: for fire hydrants - fire departments, contractors to ascertain their need and/or
volume requirements for water from fire hydrants).
to qualify for 8:Communicate billing exemption policy throughout the
organization and implement procedures that ensure proper account management. Conduct inspections of accounts
confirmed in unbilled metered status and verify that accurate meters exist and are scheduled for routine meter readings.
Gradually increase the number of unbilled metered accounts that are included in regular meter reading routes.
APPARENT LOSSES
to qualify for 8:Push to install customer meters on a full scale basis. Refine metering policy and procedures to ensure that all accounts, including municipal properties, are designated for meters. Plan special efforts to address "hard-to-access" accounts.
Implement procedures to obtain a reliable consumption estimate for the remaining few unmetered accounts awaiting
meter installation.
to qualify for 10:Continue customer meter installation throughout the service
area, with a goal to minimize unmetered accounts. Sustain the effort to investigate accounts with access difficulties, and
devise means to install water meters or otherwise measure water consumption.
AWWA Free Water Audit Software v5.0 Grading Matrix 11
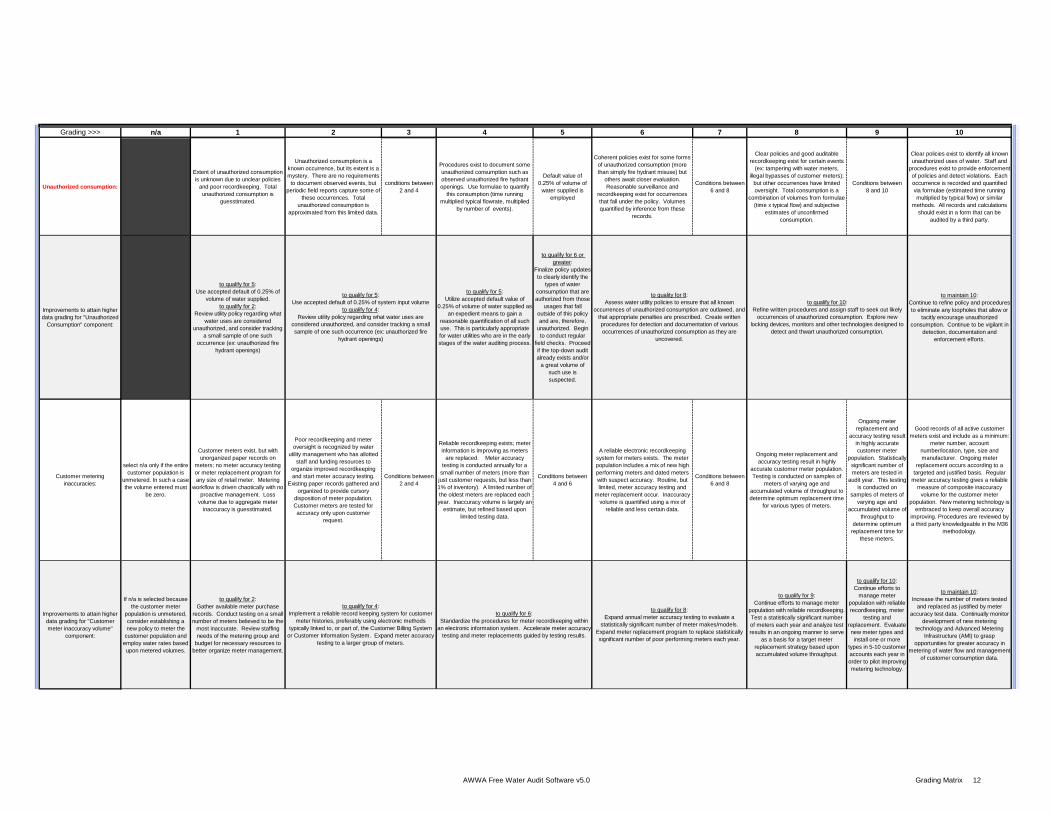
Grading >>> n/a 1 2 3 4 5 6 7 8 9 10
Unauthorized consumption:
Extent of unauthorized consumption is unknown due to unclear policies
and poor recordkeeping. Total unauthorized consumption is
guesstimated.
Unauthorized consumption is a known occurrence, but its extent is a mystery. There are no requirements to document observed events, but
periodic field reports capture some of these occurrences. Total
unauthorized consumption is approximated from this limited data.
conditions between 2 and 4
Procedures exist to document some unauthorized consumption such as observed unauthorized fire hydrant openings. Use formulae to quantify
this consumption (time running multiplied typical flowrate, multiplied
by number of events).
Default value of 0.25% of volume of
water supplied is employed
Coherent policies exist for some forms of unauthorized consumption (more than simply fire hydrant misuse) but
others await closer evaluation. Reasonable surveillance and
recordkeeping exist for occurrences that fall under the policy. Volumes quantified by inference from these
records.
Conditions between 6 and 8
Clear policies and good auditable recordkeeping exist for certain events
(ex: tampering with water meters, illegal bypasses of customer meters);
but other occurrences have limited oversight. Total consumption is a
combination of volumes from formulae (time x typical flow) and subjective
estimates of unconfirmed consumption.
Conditions between 8 and 10
Clear policies exist to identify all known unauthorized uses of water. Staff and
procedures exist to provide enforcement of policies and detect violations. Each occurrence is recorded and quantified via formulae (estimated time running multiplied by typical flow) or similar
methods. All records and calculations should exist in a form that can be
audited by a third party.
Improvements to attain higher data grading for "Unauthorized
Consumption" component:
to qualify for 5:Use accepted default of 0.25% of
volume of water supplied.to qualify for 2:
Review utility policy regarding what water uses are considered
unauthorized, and consider tracking a small sample of one such
occurrence (ex: unauthorized fire hydrant openings)
to qualify for 5:Utilize accepted default value of
0.25% of volume of water supplied as an expedient means to gain a
reasonable quantification of all such use. This is particularly appropriate for water utilities who are in the early stages of the water auditing process.
to qualify for 6 or greater:
Finalize policy updates to clearly identify the
types of water consumption that are authorized from those
usages that fall outside of this policy and are, therefore,
unauthorized. Begin to conduct regular
field checks. Proceed if the top-down audit already exists and/or
a great volume of such use is suspected.
to maintain 10:Continue to refine policy and procedures to eliminate any loopholes that allow or
tacitly encourage unauthorized consumption. Continue to be vigilant in
detection, documentation and enforcement efforts.
Customer metering inaccuracies:
select n/a only if the entire customer population is
unmetered. In such a case the volume entered must
be zero.
Customer meters exist, but with unorganized paper records on
meters; no meter accuracy testing or meter replacement program for any size of retail meter. Metering
workflow is driven chaotically with no proactive management. Loss
volume due to aggregate meter inaccuracy is guesstimated.
Poor recordkeeping and meter oversight is recognized by water
utility management who has allotted staff and funding resources to
organize improved recordkeeping and start meter accuracy testing.
Existing paper records gathered and organized to provide cursory
disposition of meter population. Customer meters are tested for accuracy only upon customer
request.
Conditions between 2 and 4
Reliable recordkeeping exists; meter information is improving as meters
are replaced. Meter accuracy testing is conducted annually for a
small number of meters (more than just customer requests, but less than 1% of inventory). A limited number of the oldest meters are replaced each year. Inaccuracy volume is largely an
estimate, but refined based upon limited testing data.
Conditions between 4 and 6
A reliable electronic recordkeeping system for meters exists. The meter population includes a mix of new high performing meters and dated meters with suspect accuracy. Routine, but limited, meter accuracy testing and
meter replacement occur. Inaccuracy volume is quantified using a mix of
reliable and less certain data.
Conditions between 6 and 8
Ongoing meter replacement and accuracy testing result in highly
accurate customer meter population. Testing is conducted on samples of
meters of varying age and accumulated volume of throughput to determine optimum replacement time
for various types of meters.
Ongoing meter replacement and
accuracy testing result in highly accurate customer meter
population. Statistically significant number of meters are tested in
audit year. This testing is conducted on
samples of meters of varying age and
accumulated volume of throughput to
determine optimum replacement time for
these meters.
Good records of all active customer meters exist and include as a minimum:
meter number, account number/location, type, size and manufacturer. Ongoing meter
replacement occurs according to a targeted and justified basis. Regular
meter accuracy testing gives a reliable measure of composite inaccuracy
volume for the customer meter population. New metering technology is
embraced to keep overall accuracy improving. Procedures are reviewed by a third party knowledgeable in the M36
methodology.
Improvements to attain higher data grading for "Customer meter inaccuracy volume"
component:
If n/a is selected because the customer meter
population is unmetered, consider establishing a new policy to meter the
customer population and employ water rates based upon metered volumes.
to qualify for 2:Gather available meter purchase
records. Conduct testing on a small number of meters believed to be the
most inaccurate. Review staffing needs of the metering group and
budget for necessary resources to better organize meter management.
to qualify for 9:Continue efforts to manage meter
population with reliable recordkeeping. Test a statistically significant number of meters each year and analyze test results in an ongoing manner to serve
as a basis for a target meter replacement strategy based upon accumulated volume throughput.
to qualify for 10:Continue efforts to
manage meter population with reliable recordkeeping, meter
testing and replacement. Evaluate new meter types and install one or more
types in 5-10 customer accounts each year in order to pilot improving metering technology.
to maintain 10:Increase the number of meters tested
and replaced as justified by meter accuracy test data. Continually monitor
development of new metering technology and Advanced Metering
Infrastructure (AMI) to grasp opportunities for greater accuracy in
metering of water flow and management of customer consumption data.
to qualify for 6:Standardize the procedures for meter recordkeeping within
an electronic information system. Accelerate meter accuracy testing and meter replacements guided by testing results.
to qualify for 8:Expand annual meter accuracy testing to evaluate a
statistically significant number of meter makes/models. Expand meter replacement program to replace statistically significant number of poor performing meters each year.
to qualify for 5:Use accepted default of 0.25% of system input volume
to qualify for 4:Review utility policy regarding what water uses are
considered unauthorized, and consider tracking a small sample of one such occurrence (ex: unauthorized fire
hydrant openings)
to qualify for 4:Implement a reliable record keeping system for customer
meter histories, preferably using electronic methods typically linked to, or part of, the Customer Billing System
or Customer Information System. Expand meter accuracy testing to a larger group of meters.
to quality for 8:Assess water utility policies to ensure that all known
occurrences of unauthorized consumption are outlawed, and that appropriate penalties are prescribed. Create written procedures for detection and documentation of various occurrences of unauthorized consumption as they are
uncovered.
to qualify for 10:Refine written procedures and assign staff to seek out likely
occurrences of unauthorized consumption. Explore new locking devices, monitors and other technologies designed to
detect and thwart unauthorized consumption.
AWWA Free Water Audit Software v5.0 Grading Matrix 12
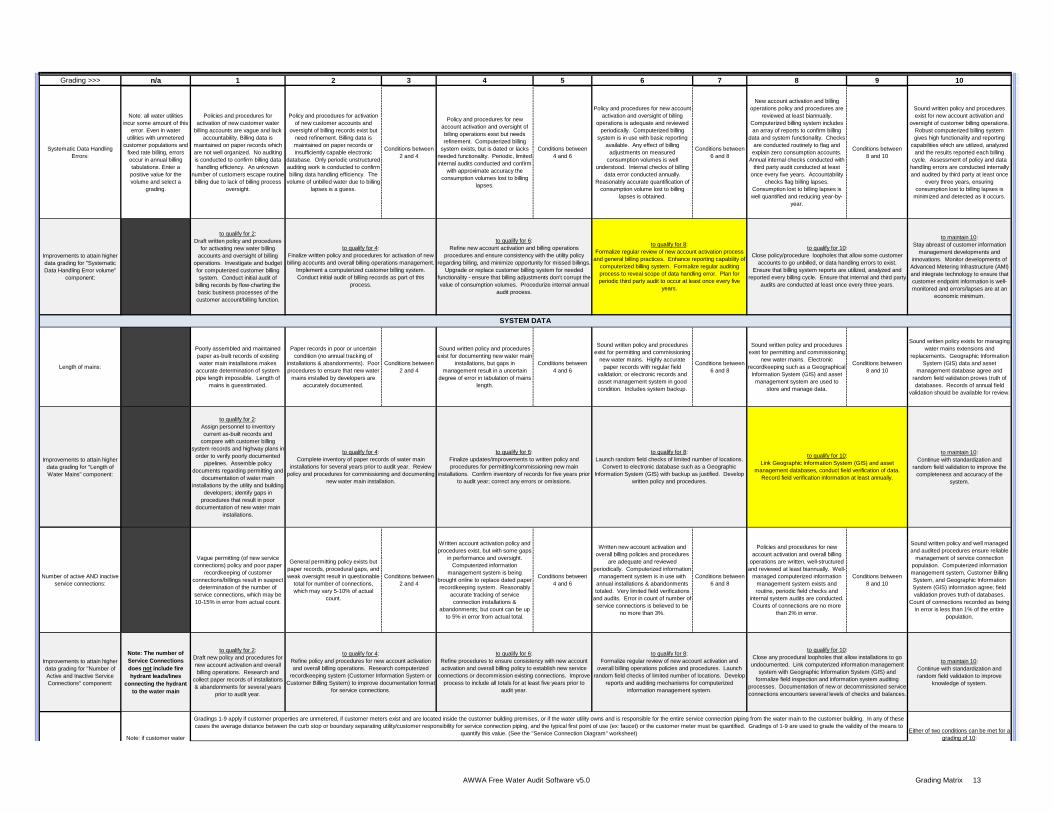
Grading >>> n/a 1 2 3 4 5 6 7 8 9 10
Systematic Data Handling Errors:
Note: all water utilities incur some amount of this
error. Even in water utilities with unmetered
customer populations and fixed rate billing, errors occur in annual billing tabulations. Enter a positive value for the volume and select a
grading.
Policies and procedures for activation of new customer water
billing accounts are vague and lack accountability. Billing data is
maintained on paper records which are not well organized. No auditing is conducted to confirm billing data handling efficiency. An unknown
number of customers escape routine billing due to lack of billing process
oversight.
Policy and procedures for activation of new customer accounts and
oversight of billing records exist but need refinement. Billing data is maintained on paper records or insufficiently capable electronic
database. Only periodic unstructured auditing work is conducted to confirm billing data handling efficiency. The
volume of unbilled water due to billing lapses is a guess.
Conditions between 2 and 4
Policy and procedures for new account activation and oversight of billing operations exist but needs refinement. Computerized billing
system exists, but is dated or lacks needed functionality. Periodic, limited internal audits conducted and confirm
with approximate accuracy the consumption volumes lost to billing
lapses.
Conditions between 4 and 6
Policy and procedures for new account activation and oversight of billing
operations is adequate and reviewed periodically. Computerized billing
system is in use with basic reporting available. Any effect of billing
adjustments on measured consumption volumes is well
understood. Internal checks of billing data error conducted annually.
Reasonably accurate quantification of consumption volume lost to billing
lapses is obtained.
Conditions between 6 and 8
New account activation and billing operations policy and procedures are
reviewed at least biannually. Computerized billing system includes an array of reports to confirm billing
data and system functionality. Checks are conducted routinely to flag and explain zero consumption accounts.
Annual internal checks conducted with third party audit conducted at least
once every five years. Accountability checks flag billing lapses.
Consumption lost to billing lapses is well quantified and reducing year-by-
year.
Conditions between 8 and 10
Sound written policy and procedures exist for new account activation and
oversight of customer billing operations. Robust computerized billing system gives high functionality and reporting
capabilities which are utilized, analyzed and the results reported each billing
cycle. Assessment of policy and data handling errors are conducted internally and audited by third party at least once
every three years, ensuring consumption lost to billing lapses is
minimized and detected as it occurs.
Improvements to attain higher data grading for "Systematic Data Handling Error volume"
component:
to qualify for 2:Draft written policy and procedures
for activating new water billing accounts and oversight of billing
operations. Investigate and budget for computerized customer billing system. Conduct initial audit of
billing records by flow-charting the basic business processes of the customer account/billing function.
to maintain 10:Stay abreast of customer information
management developments and innovations. Monitor developments of
Advanced Metering Infrastructure (AMI) and integrate technology to ensure that customer endpoint information is well-monitored and errors/lapses are at an
economic minimum.
Length of mains:
Poorly assembled and maintained paper as-built records of existing water main installations makes
accurate determination of system pipe length impossible. Length of
mains is guesstimated.
Paper records in poor or uncertain condition (no annual tracking of
installations & abandonments). Poor procedures to ensure that new water
mains installed by developers are accurately documented.
Conditions between 2 and 4
Sound written policy and procedures exist for documenting new water main
installations, but gaps in management result in a uncertain
degree of error in tabulation of mains length.
Conditions between 4 and 6
Sound written policy and procedures exist for permitting and commissioning
new water mains. Highly accurate paper records with regular field
validation; or electronic records and asset management system in good condition. Includes system backup.
Conditions between 6 and 8
Sound written policy and procedures exist for permitting and commissioning
new water mains. Electronic recordkeeping such as a Geographical
Information System (GIS) and asset management system are used to
store and manage data.
Conditions between 8 and 10
Sound written policy exists for managing water mains extensions and
replacements. Geographic Information System (GIS) data and asset
management database agree and random field validation proves truth of databases. Records of annual field
validation should be available for review.
Improvements to attain higher data grading for "Length of Water Mains" component:
to qualify for 2:Assign personnel to inventory current as-built records and
compare with customer billing system records and highway plans in
order to verify poorly documented pipelines. Assemble policy
documents regarding permitting and documentation of water main
installations by the utility and building developers; identify gaps in
procedures that result in poor documentation of new water main
installations.
to maintain 10:Continue with standardization and
random field validation to improve the completeness and accuracy of the
system.
Number of active AND inactive service connections:
Vague permitting (of new service connections) policy and poor paper
recordkeeping of customer connections/billings result in suspect
determination of the number of service connections, which may be 10-15% in error from actual count.
General permitting policy exists but paper records, procedural gaps, and weak oversight result in questionable
total for number of connections, which may vary 5-10% of actual
count.
Conditions between 2 and 4
Written account activation policy and procedures exist, but with some gaps
in performance and oversight. Computerized information
management system is being brought online to replace dated paper recordkeeping system. Reasonably
accurate tracking of service connection installations &
abandonments; but count can be up to 5% in error from actual total.
Conditions between 4 and 6
Written new account activation and overall billing policies and procedures
are adequate and reviewed periodically. Computerized information
management system is in use with annual installations & abandonments totaled. Very limited field verifications
and audits. Error in count of number of service connections is believed to be
no more than 3%.
Conditions between 6 and 8
Policies and procedures for new account activation and overall billing
operations are written, well-structured and reviewed at least biannually. Well-
managed computerized information management system exists and routine, periodic field checks and
internal system audits are conducted. Counts of connections are no more
than 2% in error.
Conditions between 8 and 10
Sound written policy and well managed and audited procedures ensure reliable
management of service connection population. Computerized information management system, Customer Billing System, and Geographic Information System (GIS) information agree; field validation proves truth of databases.
Count of connections recorded as being in error is less than 1% of the entire
population.
Improvements to attain higher data grading for "Number of Active and Inactive Service Connections" component:
Note: The number of Service Connections does not include fire hydrant leads/lines
connecting the hydrant to the water main
to qualify for 2:Draft new policy and procedures for new account activation and overall billing operations. Research and
collect paper records of installations & abandonments for several years
prior to audit year.
to maintain 10:Continue with standardization and random field validation to improve
knowledge of system.
to qualify for 10:Close any procedural loopholes that allow installations to go
undocumented. Link computerized information management system with Geographic Information System (GIS) and
formalize field inspection and information system auditing processes. Documentation of new or decommissioned service connections encounters several levels of checks and balances.
to qualify for 4:Refine policy and procedures for new account activation and overall billing operations. Research computerized
recordkeeping system (Customer Information System or Customer Billing System) to improve documentation format
for service connections.
to qualify for 6:Refine procedures to ensure consistency with new account activation and overall billing policy to establish new service
connections or decommission existing connections. Improve process to include all totals for at least five years prior to
audit year.
to qualify for 4:Complete inventory of paper records of water main
installations for several years prior to audit year. Review policy and procedures for commissioning and documenting
new water main installation.
to qualify for 8:Launch random field checks of limited number of locations.
Convert to electronic database such as a Geographic Information System (GIS) with backup as justified. Develop
written policy and procedures.
to qualify for 10:Link Geographic Information System (GIS) and asset
management databases, conduct field verification of data. Record field verification information at least annually.
to qualify for 6:Finalize updates/improvements to written policy and procedures for permitting/commissioning new main
installations. Confirm inventory of records for five years prior to audit year; correct any errors or omissions.
Note: if customer water
to qualify for 4:Finalize written policy and procedures for activation of new billing acocunts and overall billing operations management.
Implement a computerized customer billing system. Conduct initial audit of billing records as part of this
process.
to qualify for 6:Refine new account activation and billing operations
procedures and ensure consistency with the utility policy regarding billing, and minimize opportunity for missed billings.
Upgrade or replace customer billing system for needed functionality - ensure that billing adjustments don't corrupt the value of consumption volumes. Procedurize internal annual
audit process.
to qualify for 8:Formalize regular review of new account activation process
and general billing practices. Enhance reporting capability of computerized billing system. Formalize regular auditing process to reveal scope of data handling error. Plan for periodic third party audit to occur at least once every five
years.
Gradings 1-9 apply if customer properties are unmetered, if customer meters exist and are located inside the customer building premises, or if the water utility owns and is responsible for the entire service connection piping from the water main to the customer building. In any of these cases the average distance between the curb stop or boundary separating utility/customer responsibility for service connection piping, and the typical first point of use (ex: faucet) or the customer meter must be quantified. Gradings of 1-9 are used to grade the validity of the means to
quantify this value. (See the "Service Connection Diagram" worksheet)
to qualify for 8:Formalize regular review of new account activation and
overall billing operations policies and procedures. Launch random field checks of limited number of locations. Develop
reports and auditing mechanisms for computerized information management system.
SYSTEM DATA
Either of two conditions can be met for a grading of 10:
to qualify for 10:Close policy/procedure loopholes that allow some customer
accounts to go unbilled, or data handling errors to exist. Ensure that billing system reports are utilized, analyzed and
reported every billing cycle. Ensure that internal and third party audits are conducted at least once every three years.
AWWA Free Water Audit Software v5.0 Grading Matrix 13
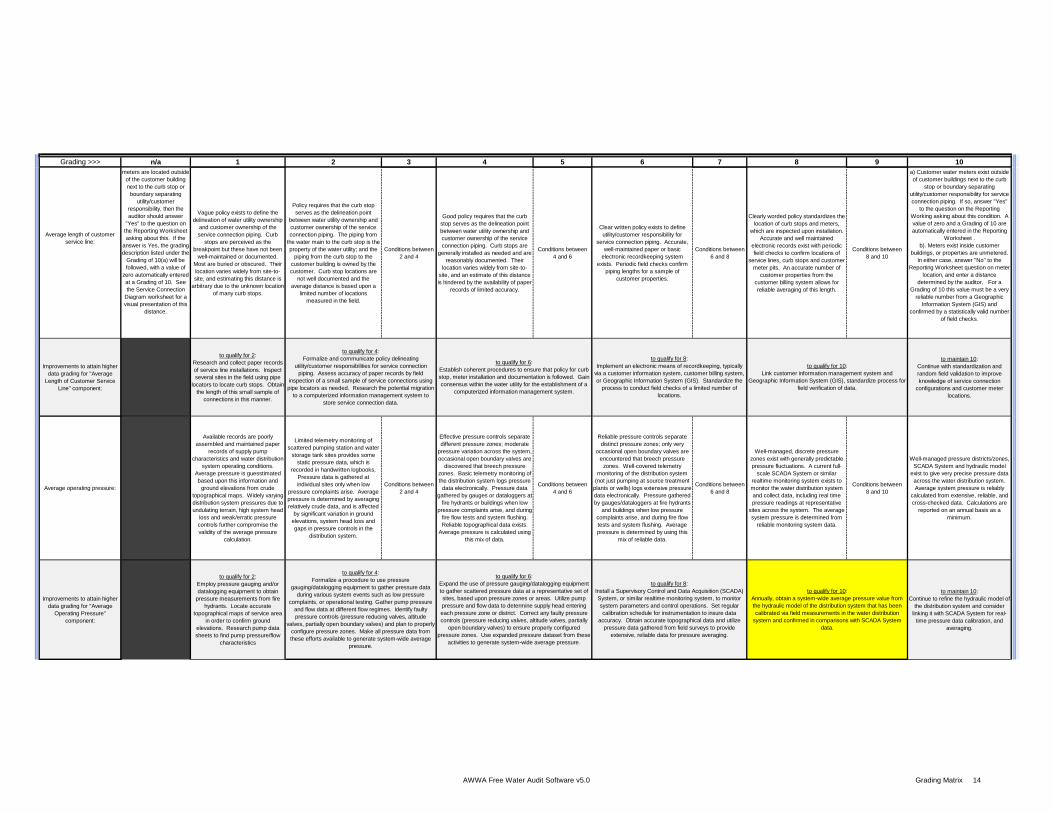
Grading >>> n/a 1 2 3 4 5 6 7 8 9 10
Vague policy exists to define the delineation of water utility ownership
and customer ownership of the service connection piping. Curb
stops are perceived as the breakpoint but these have not been
well-maintained or documented. Most are buried or obscured. Their location varies widely from site-to-site, and estimating this distance is
arbitrary due to the unknown location of many curb stops.
Policy requires that the curb stop serves as the delineation point
between water utility ownership and customer ownership of the service connection piping. The piping from
the water main to the curb stop is the property of the water utility; and the
piping from the curb stop to the customer building is owned by the customer. Curb stop locations are
not well documented and the average distance is based upon a
limited number of locations measured in the field.
Conditions between 2 and 4
Good policy requires that the curb stop serves as the delineation point between water utility ownership and customer ownership of the service connection piping. Curb stops are
generally installed as needed and are reasonably documented. Their
location varies widely from site-to-site, and an estimate of this distance is hindered by the availability of paper
records of limited accuracy.
Conditions between 4 and 6
Clear written policy exists to define utility/customer responsibility for
service connection piping. Accurate, well-maintained paper or basic
electronic recordkeeping system exists. Periodic field checks confirm
piping lengths for a sample of customer properties.
Conditions between 6 and 8
Clearly worded policy standardizes the location of curb stops and meters,
which are inspected upon installation. Accurate and well maintained
electronic records exist with periodic field checks to confirm locations of
service lines, curb stops and customer meter pits. An accurate number of
customer properties from the customer billing system allows for reliable averaging of this length.
Conditions between 8 and 10
Improvements to attain higher data grading for "Average
Length of Customer Service Line" component:
to qualify for 2:Research and collect paper records of service line installations. Inspect several sites in the field using pipe
locators to locate curb stops. Obtain the length of this small sample of
connections in this manner.
to maintain 10:Continue with standardization and random field validation to improve knowledge of service connection
configurations and customer meter locations.
Average operating pressure:
Available records are poorly assembled and maintained paper
records of supply pump characteristics and water distribution
system operating conditions. Average pressure is guesstimated based upon this information and
ground elevations from crude topographical maps. Widely varying distribution system pressures due to undulating terrain, high system head
loss and weak/erratic pressure controls further compromise the validity of the average pressure
calculation.
Limited telemetry monitoring of scattered pumping station and water
storage tank sites provides some static pressure data, which is
recorded in handwritten logbooks. Pressure data is gathered at individual sites only when low
pressure complaints arise. Average pressure is determined by averaging relatively crude data, and is affected
by significant variation in ground elevations, system head loss and gaps in pressure controls in the
distribution system.
Conditions between 2 and 4
Effective pressure controls separate different pressure zones; moderate
pressure variation across the system, occasional open boundary valves are
discovered that breech pressure zones. Basic telemetry monitoring of the distribution system logs pressure
data electronically. Pressure data gathered by gauges or dataloggers at
fire hydrants or buildings when low pressure complaints arise, and during
fire flow tests and system flushing. Reliable topographical data exists.
Average pressure is calculated using this mix of data.
Conditions between 4 and 6
Reliable pressure controls separate distinct pressure zones; only very
occasional open boundary valves are encountered that breech pressure
zones. Well-covered telemetry monitoring of the distribution system
(not just pumping at source treatment plants or wells) logs extensive pressure data electronically. Pressure gathered by gauges/dataloggers at fire hydrants
and buildings when low pressure complaints arise, and during fire flow tests and system flushing. Average pressure is determined by using this
mix of reliable data.
Conditions between 6 and 8
Well-managed, discrete pressure zones exist with generally predictable pressure fluctuations. A current full-
scale SCADA System or similar realtime monitoring system exists to monitor the water distribution system and collect data, including real time pressure readings at representative
sites across the system. The average system pressure is determined from
reliable monitoring system data.
Conditions between 8 and 10
Well-managed pressure districts/zones, SCADA System and hydraulic model
exist to give very precise pressure data across the water distribution system. Average system pressure is reliably
calculated from extensive, reliable, and cross-checked data. Calculations are
reported on an annual basis as a minimum.
Improvements to attain higher data grading for "Average
Operating Pressure" component:
to qualify for 2:Employ pressure gauging and/or datalogging equipment to obtain
pressure measurements from fire hydrants. Locate accurate
topographical maps of service area in order to confirm ground
elevations. Research pump data sheets to find pump pressure/flow
characteristics
to maintain 10: Continue to refine the hydraulic model of
the distribution system and consider linking it with SCADA System for real-
time pressure data calibration, and averaging.
to qualify for 4: Formalize a procedure to use pressure
gauging/datalogging equipment to gather pressure data during various system events such as low pressure
complaints, or operational testing. Gather pump pressure and flow data at different flow regimes. Identify faulty pressure controls (pressure reducing valves, altitude
valves, partially open boundary valves) and plan to properly configure pressure zones. Make all pressure data from these efforts available to generate system-wide average
pressure.
to qualify for 6: Expand the use of pressure gauging/datalogging equipment to gather scattered pressure data at a representative set of sites, based upon pressure zones or areas. Utilize pump pressure and flow data to determine supply head entering each pressure zone or district. Correct any faulty pressure controls (pressure reducing valves, altitude valves, partially
open boundary valves) to ensure properly configured pressure zones. Use expanded pressure dataset from these
activities to generate system-wide average pressure.
to qualify for 8: Install a Supervisory Control and Data Acquisition (SCADA) System, or similar realtime monitoring system, to monitor system parameters and control operations. Set regular calibration schedule for instrumentation to insure data
accuracy. Obtain accurate topographical data and utilize pressure data gathered from field surveys to provide
extensive, reliable data for pressure averaging.
to qualify for 10: Annually, obtain a system-wide average pressure value from the hydraulic model of the distribution system that has been calibrated via field measurements in the water distribution
system and confirmed in comparisons with SCADA System data.
to qualify for 6:Establish coherent procedures to ensure that policy for curb stop, meter installation and documentation is followed. Gain consensus within the water utility for the establishment of a
computerized information management system.
to qualify for 4:Formalize and communicate policy delineating
utility/customer responsibilities for service connection piping. Assess accuracy of paper records by field
inspection of a small sample of service connections using pipe locators as needed. Research the potential migration
to a computerized information management system to store service connection data.
to qualify for 10:Link customer information management system and
Geographic Information System (GIS), standardize process for field verification of data.
to qualify for 8:Implement an electronic means of recordkeeping, typically
via a customer information system, customer billing system, or Geographic Information System (GIS). Standardize the
process to conduct field checks of a limited number of locations.
Average length of customer service line:
meters are located outside of the customer building next to the curb stop or boundary separating
utility/customer responsibility, then the auditor should answer
"Yes" to the question on the Reporting Worksheet asking about this. If the
answer is Yes, the grading description listed under the
Grading of 10(a) will be followed, with a value of
zero automatically entered at a Grading of 10. See the Service Connection
Diagram worksheet for a visual presentation of this
distance.
a) Customer water meters exist outside of customer buildings next to the curb
stop or boundary separating utility/customer responsibility for service connection piping. If so, answer "Yes"
to the question on the Reporting Working asking about this condition. A value of zero and a Grading of 10 are automatically entered in the Reporting
Worksheet .b). Meters exist inside customer
buildings, or properties are unmetered. In either case, answer "No" to the
Reporting Worksheet question on meter location, and enter a distance
determined by the auditor. For a Grading of 10 this value must be a very
reliable number from a Geographic Information System (GIS) and
confirmed by a statistically valid number of field checks.
AWWA Free Water Audit Software v5.0 Grading Matrix 14
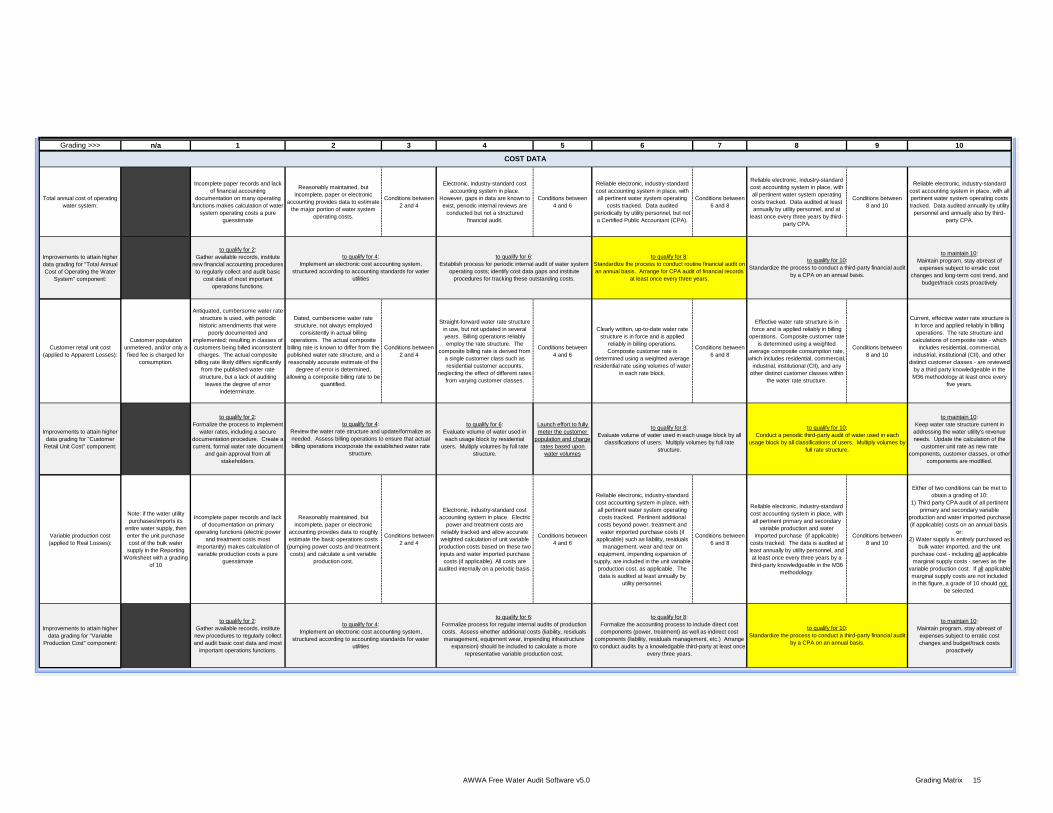
Grading >>> n/a 1 2 3 4 5 6 7 8 9 10
Total annual cost of operating water system:
Incomplete paper records and lack of financial accounting
documentation on many operating functions makes calculation of water
system operating costs a pure guesstimate
Reasonably maintained, but incomplete, paper or electronic
accounting provides data to estimate the major portion of water system
operating costs.
Conditions between 2 and 4
Electronic, industry-standard cost accounting system in place.
However, gaps in data are known to exist, periodic internal reviews are
conducted but not a structured financial audit.
Conditions between 4 and 6
Reliable electronic, industry-standard cost accounting system in place, with all pertinent water system operating
costs tracked. Data audited periodically by utility personnel, but not a Certified Public Accountant (CPA).
Conditions between 6 and 8
Reliable electronic, industry-standard cost accounting system in place, with all pertinent water system operating costs tracked. Data audited at least annually by utility personnel, and at
least once every three years by third-party CPA.
Conditions between 8 and 10
Reliable electronic, industry-standard cost accounting system in place, with all pertinent water system operating costs tracked. Data audited annually by utility
personnel and annually also by third-party CPA.
Improvements to attain higher data grading for "Total Annual Cost of Operating the Water
System" component:
to qualify for 2:Gather available records, institute
new financial accounting procedures to regularly collect and audit basic
cost data of most important operations functions.
to maintain 10:Maintain program, stay abreast of expenses subject to erratic cost
changes and long-term cost trend, and budget/track costs proactively
Customer retail unit cost (applied to Apparent Losses):
Customer population unmetered, and/or only a fixed fee is charged for
consumption.
Antiquated, cumbersome water rate structure is used, with periodic historic amendments that were
poorly documented and implemented; resulting in classes of customers being billed inconsistent
charges. The actual composite billing rate likely differs significantly
from the published water rate structure, but a lack of auditing
leaves the degree of error indeterminate.
Dated, cumbersome water rate structure, not always employed
consistently in actual billing operations. The actual composite
billing rate is known to differ from the published water rate structure, and a reasonably accurate estimate of the
degree of error is determined, allowing a composite billing rate to be
quantified.
Conditions between 2 and 4
Straight-forward water rate structure in use, but not updated in several years. Billing operations reliably employ the rate structure. The
composite billing rate is derived from a single customer class such as residential customer accounts,
neglecting the effect of different rates from varying customer classes.
Conditions between4 and 6
Clearly written, up-to-date water rate structure is in force and is applied
reliably in billing operations. Composite customer rate is
determined using a weighted average residential rate using volumes of water
in each rate block.
Conditions between 6 and 8
Effective water rate structure is in force and is applied reliably in billing
operations. Composite customer rate is determined using a weighted
average composite consumption rate, which includes residential, commercial,
industrial, institutional (CII), and any other distinct customer classes within
the water rate structure.
Conditions between 8 and 10
Current, effective water rate structure is in force and applied reliably in billing operations. The rate structure and
calculations of composite rate - which includes residential, commercial,
industrial, institutional (CII), and other distinct customer classes - are reviewed
by a third party knowledgeable in the M36 methodology at least once every
five years.
Improvements to attain higher data grading for "Customer
Retail Unit Cost" component:
to qualify for 2:Formalize the process to implement
water rates, including a secure documentation procedure. Create a current, formal water rate document
and gain approval from all stakeholders.
to qualify for 6:Evaluate volume of water used in each usage block by residential
users. Multiply volumes by full rate structure.
Launch effort to fully meter the customer
population and charge rates based upon
water volumes
to maintain 10:Keep water rate structure current in
addressing the water utility's revenue needs. Update the calculation of the
customer unit rate as new rate components, customer classes, or other
components are modified.
Variable production cost (applied to Real Losses):
Note: if the water utility purchases/imports its
entire water supply, then enter the unit purchase cost of the bulk water
supply in the Reporting Worksheet with a grading
of 10
Incomplete paper records and lack of documentation on primary
operating functions (electric power and treatment costs most
importantly) makes calculation of variable production costs a pure
guesstimate
Reasonably maintained, but incomplete, paper or electronic
accounting provides data to roughly estimate the basic operations costs
(pumping power costs and treatment costs) and calculate a unit variable
production cost.
Conditions between 2 and 4
Electronic, industry-standard cost accounting system in place. Electric
power and treatment costs are reliably tracked and allow accurate weighted calculation of unit variable
production costs based on these two inputs and water imported purchase
costs (if applicable). All costs are audited internally on a periodic basis.
Conditions between 4 and 6
Reliable electronic, industry-standard cost accounting system in place, with all pertinent water system operating costs tracked. Pertinent additional costs beyond power, treatment and water imported purchase costs (if
applicable) such as liability, residuals management, wear and tear on
equipment, impending expansion of supply, are included in the unit variable
production cost, as applicable. The data is audited at least annually by
utility personnel.
Conditions between 6 and 8
Reliable electronic, industry-standard cost accounting system in place, with all pertinent primary and secondary
variable production and water imported purchase (if applicable)
costs tracked. The data is audited at least annually by utility personnel, and at least once every three years by a third-party knowledgeable in the M36
methodology.
Conditions between 8 and 10
Either of two conditions can be met to obtain a grading of 10:
1) Third party CPA audit of all pertinent primary and secondary variable
production and water imported purchase (if applicable) costs on an annual basis.
or:2) Water supply is entirely purchased as
bulk water imported, and the unit purchase cost - including all applicable marginal supply costs - serves as the
variable production cost. If all applicable marginal supply costs are not included in this figure, a grade of 10 should not
be selected.
Improvements to attain higher data grading for "Variable
Production Cost" component:
to qualify for 2:Gather available records, institute new procedures to regularly collect and audit basic cost data and most
important operations functions.
to maintain 10:Maintain program, stay abreast of expenses subject to erratic cost changes and budget/track costs
proactively
to qualify for 6:Formalize process for regular internal audits of production costs. Assess whether additional costs (liability, residuals management, equipment wear, impending infrastructure
expansion) should be included to calculate a more representative variable production cost.
to qualify for 8:Formalize the accounting process to include direct cost components (power, treatment) as well as indirect cost
components (liability, residuals management, etc.) Arrange to conduct audits by a knowledgable third-party at least once
every three years.
to qualify for 10:Standardize the process to conduct a third-party financial audit
by a CPA on an annual basis.
to qualify for 4:Implement an electronic cost accounting system,
structured according to accounting standards for water utilities
to qualify for 4:Review the water rate structure and update/formalize as needed. Assess billing operations to ensure that actual billing operations incorporate the established water rate
structure.
to qualify for 8:Evaluate volume of water used in each usage block by all
classifications of users. Multiply volumes by full rate structure.
to qualify for 10:Conduct a periodic third-party audit of water used in each
usage block by all classifications of users. Multiply volumes by full rate structure.
to qualify for 4:Implement an electronic cost accounting system,
structured according to accounting standards for water utilities
to qualify for 10:Standardize the process to conduct a third-party financial audit
by a CPA on an annual basis.
COST DATA
to qualify for 6:Establish process for periodic internal audit of water system
operating costs; identify cost data gaps and institute procedures for tracking these outstanding costs.
to qualify for 8:Standardize the process to conduct routine financial audit on an annual basis. Arrange for CPA audit of financial records
at least once every three years.
AWWA Free Water Audit Software v5.0 Grading Matrix 15
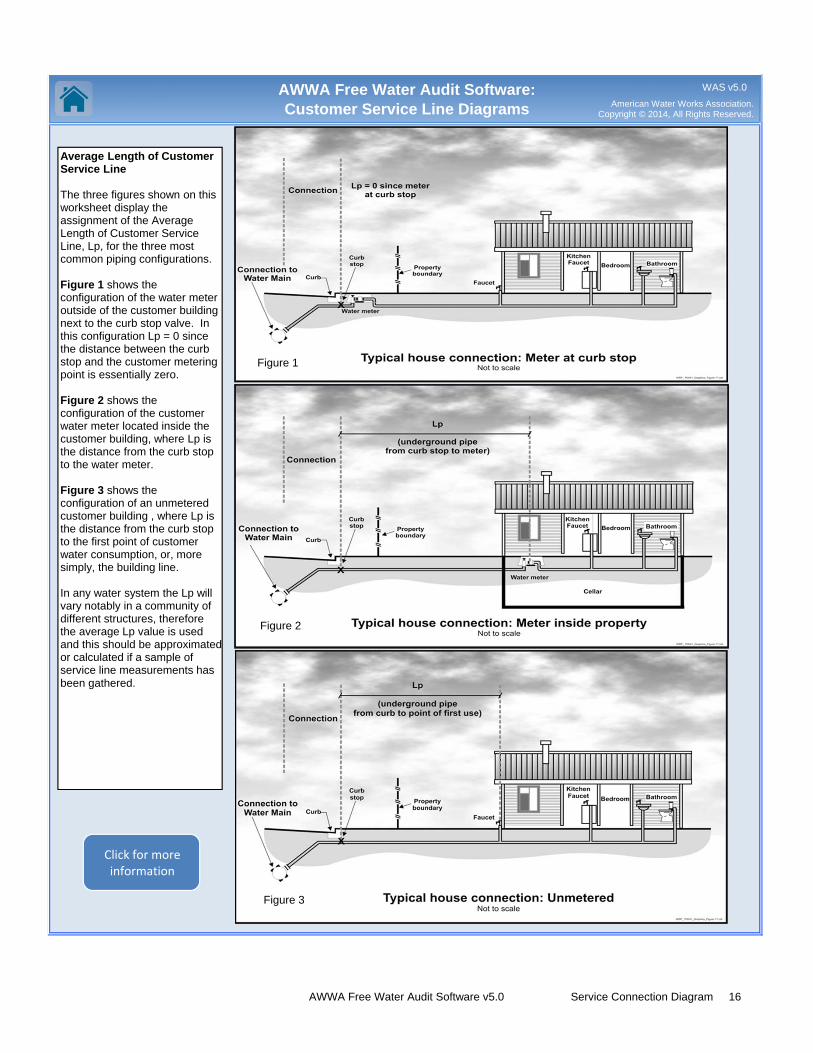
AWWA Free Water Audit Software: Customer Service Line Diagrams
Average Length of Customer Service Line
The three figures shown on this worksheet display the assignment of the Average Length of Customer Service Line, Lp, for the three most common piping configurations.
Figure 1 shows the configuration of the water meter outside of the customer building next to the curb stop valve. In this configuration Lp = 0 since the distance between the curb stop and the customer metering point is essentially zero.
Figure 2 shows the configuration of the customer water meter located inside the customer building, where Lp is the distance from the curb stop to the water meter.
Figure 3 shows the configuration of an unmetered customer building , where Lp is the distance from the curb stop to the first point of customer water consumption, or, more simply, the building line.
In any water system the Lp will vary notably in a community of different structures, therefore the average Lp value is used and this should be approximated or calculated if a sample of service line measurements has been gathered.
Figure 1
Figure 2
Figure 3
American Water Works Association.Copyright © 2014, All Rights Reserved.
WAS v5.0
Click for more information
AWWA Free Water Audit Software v5.0 Service Connection Diagram 16

Item Name
Apparent Losses
AUTHORIZED CONSUMPTION
Average length of customer service line
Average operating pressure
Billed Authorized Consumption
Billed metered consumption
Billed unmetered consumption
All consumption that is billed and authorized by the utility. This may include both metered and unmetered consumption. See "Authorized Consumption" for more information.
= unauthorized consumption + customer metering inaccuracies + systematic data handling errors
Apparent Losses include all types of inaccuracies associated with customer metering (worn meters as well as improperly sized meters or wrong type of meter for the water usage profile) as well as systematic data handling errors (meter reading, billing, archiving and reporting), plus unauthorized consumption (theft or illegal use).NOTE: Over-estimation of Apparent Losses results in under-estimation of Real Losses. Under-estimation of Apparent Losses results in over-estimation of Real Losses.
All metered consumption which is billed to retail customers, including all groups of customers such as domestic, commercial, industrial or institutional. It does NOT include water supplied to neighboring utilities (water exported) which is metered and billed. Be sure to subtract any consumption for exported water sales that may be included in these billing roles. Water supplied as exports to neighboring water utilities should be included only in the Water Exported component. The metered consumption data can be taken directly from billing records for the water audit period. The accuracy of yearly metered consumption data can be refined by including an adjustment to account for customer meter reading lag time since not all customer meters are read on the same day of the meter reading period. However additional analysis is necessary to determine the lag time adjustment value, which may or may not be significant.
All billed consumption which is calculated based on estimates or norms from water usage sites that have been determined by utility policy to be left unmetered. This is typically a very small component in systems that maintain a policy to meter their customer population. However, this quantity can be the key consumption component in utilities that have not adopted a universal metering policy. This component should NOT include any water that is supplied to neighboring utilities (water exported) which is unmetered but billed. Water supplied as exports to neighboring water utilities should be included only in the Water Exported component.
AWWA Free Water Audit Software: Definitions
Description
= billed water exported + billed metered + billed unmetered + unbilled metered + unbilled unmetered consumption
The volume of metered and/or unmetered water taken by registered customers, the water utility's own uses, and uses of others who are implicitly or explicitly authorized to do so by the water utility; for residential, commercial, industrial and public-minded purposes.
Typical retail customers' consumption is tabulated usually from established customer accounts as billed metered consumption, or - for unmetered customers - billed unmetered consumption. These types of consumption, along with billed water exported, provide revenue potential for the water utility. Be certain to tabulate the water exported volume as a separate component and do not "double-count" it by including in the billed metered consumption component as well as the water exported component. Unbilled authorized consumption occurs typically in non-account uses, including water for fire fighting and training, flushing of water mains and sewers, street cleaning, watering of municipal gardens, public fountains, or similar public-minded uses. Occasionally these uses may be metered and billed (or charged a flat fee), but usually they are unmetered and unbilled. In the latter case, the water auditor may use a default value to estimate this quantity, or implement procedures for the reliable quantification of these uses. This starts with documenting usage events as they occur and estimating the amount of water used in each event. (See Unbilled unmetered consumption)
This is the average length of customer service line, Lp, that is owned and maintained by the customer; from the point of ownership transfer to the customer water meter, or building line (if unmetered). The quantity is one of the data inputs for the calculation of Unavoidable Annual Real Losses (UARL), which serves as the denominator of the performance indicator: Infrastructure Leakage Index (ILI). The value of Lp is multiplied by the number of customer service connections to obtain a total length of customer owned piping in the system. The purpose of this parameter is to account for the unmetered service line infrastructure that is the responsibility of the customer for arranging repairs of leaks that occur on their lines. In many cases leak repairs arranged by customers take longer to be executed than leak repairs arranged by the water utility on utility-maintained piping. Leaks run longer - and lose more water - on customer-owned service piping, than utility owned piping.
If the customer water meter exists near the ownership transfer point (usually the curb stop located between the water main and the customer premises) this distance is zero because the meter and transfer point are the same. This is the often encountered configuration of customer water meters located in an underground meter box or "pit" outside of the customer's building. The Free Water Audit Software asks a "Yes/No" question about the meter at this location. If the auditor selects "Yes" then this distance is set to zero and the data grading score for this component is set to 10.
If water meters are typically located inside the customer premise/building, or properties are unmetered, it is up to the water auditor to estimate a system-wide average Lp length based upon the various customer land parcel sizes and building locations in the service area. Lp will be a shorter length in areas of high density housing, and a longer length in areas of low density housing and varied commercial and industrial buildings. General parcel demographics should be employed to obtain a composite average Lp length for the entire system.
Refer to the "Service Connection Diagram" worksheet for a depiction of the service line/metering configurations that typically exist in water utilities. This worksheet gives guidance on the determination of the Average Length, Lp, for each configuration.
This is the average pressure in the distribution system that is the subject of the water audit. Many water utilities have a calibrated hydraulic model of their water distribution system. For these utilities, the hydraulic model can be utilized to obtain a very accurate quantity of average pressure. In the absence of a hydraulic model, the average pressure may be approximated by obtaining readings of static water pressure from a representative sample of fire hydrants or other system access points evenly located across the system. A weighted average of the pressure can be assembled; but be sure to take into account the elevation of the fire hydrants, which typically exist several feet higher than the level of buried water pipelines. If the water utility is compiling the water audit for the first time, the average pressure can be approximated, but with a low data grading. In subsequent years of auditing, effort should be made to improve the accuracy of the average pressure quantity. This will then qualify the value for a higher data grading.
WAS v5.0American Water Works Association.
Copyright © 2014, All Rights Reserved.
Find
Find
Find
Find
ViewService
Connection Diagram
Find
Find
AWWA Free Water Audit Software v5.0 Definitions 17
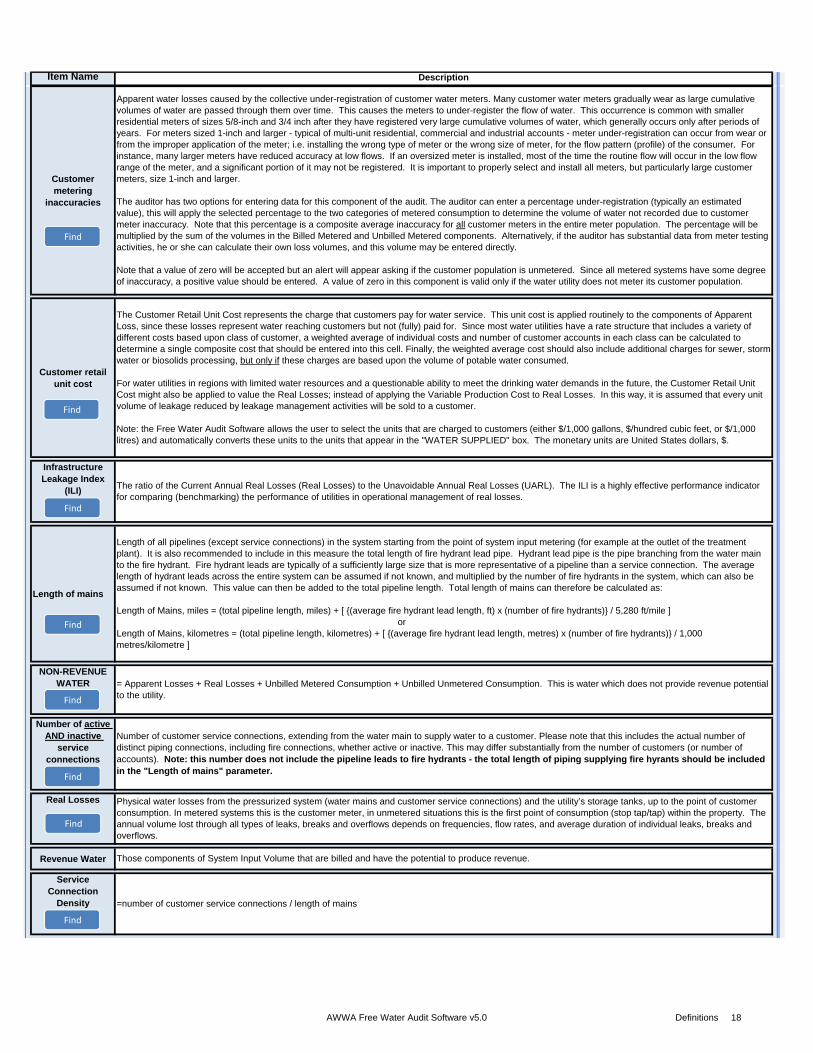
Item Name Description
Customer metering
inaccuracies
Customer retail unit cost
Infrastructure Leakage Index
(ILI)
Length of mains
NON-REVENUE WATER
Number of active AND inactive
service connections
Real Losses
Revenue Water
Service Connection
Density
Physical water losses from the pressurized system (water mains and customer service connections) and the utility’s storage tanks, up to the point of customer consumption. In metered systems this is the customer meter, in unmetered situations this is the first point of consumption (stop tap/tap) within the property. The annual volume lost through all types of leaks, breaks and overflows depends on frequencies, flow rates, and average duration of individual leaks, breaks and overflows.
=number of customer service connections / length of mains
Length of all pipelines (except service connections) in the system starting from the point of system input metering (for example at the outlet of the treatment plant). It is also recommended to include in this measure the total length of fire hydrant lead pipe. Hydrant lead pipe is the pipe branching from the water main to the fire hydrant. Fire hydrant leads are typically of a sufficiently large size that is more representative of a pipeline than a service connection. The average length of hydrant leads across the entire system can be assumed if not known, and multiplied by the number of fire hydrants in the system, which can also be assumed if not known. This value can then be added to the total pipeline length. Total length of mains can therefore be calculated as:
Length of Mains, miles = (total pipeline length, miles) + [ {(average fire hydrant lead length, ft) x (number of fire hydrants)} / 5,280 ft/mile ] orLength of Mains, kilometres = (total pipeline length, kilometres) + [ {(average fire hydrant lead length, metres) x (number of fire hydrants)} / 1,000 metres/kilometre ]
Those components of System Input Volume that are billed and have the potential to produce revenue.
= Apparent Losses + Real Losses + Unbilled Metered Consumption + Unbilled Unmetered Consumption. This is water which does not provide revenue potential to the utility.
Number of customer service connections, extending from the water main to supply water to a customer. Please note that this includes the actual number of distinct piping connections, including fire connections, whether active or inactive. This may differ substantially from the number of customers (or number of accounts). Note: this number does not include the pipeline leads to fire hydrants - the total length of piping supplying fire hyrants should be included in the "Length of mains" parameter.
Apparent water losses caused by the collective under-registration of customer water meters. Many customer water meters gradually wear as large cumulative volumes of water are passed through them over time. This causes the meters to under-register the flow of water. This occurrence is common with smaller residential meters of sizes 5/8-inch and 3/4 inch after they have registered very large cumulative volumes of water, which generally occurs only after periods of years. For meters sized 1-inch and larger - typical of multi-unit residential, commercial and industrial accounts - meter under-registration can occur from wear or from the improper application of the meter; i.e. installing the wrong type of meter or the wrong size of meter, for the flow pattern (profile) of the consumer. For instance, many larger meters have reduced accuracy at low flows. If an oversized meter is installed, most of the time the routine flow will occur in the low flow range of the meter, and a significant portion of it may not be registered. It is important to properly select and install all meters, but particularly large customer meters, size 1-inch and larger.
The auditor has two options for entering data for this component of the audit. The auditor can enter a percentage under-registration (typically an estimated value), this will apply the selected percentage to the two categories of metered consumption to determine the volume of water not recorded due to customer meter inaccuracy. Note that this percentage is a composite average inaccuracy for all customer meters in the entire meter population. The percentage will be multiplied by the sum of the volumes in the Billed Metered and Unbilled Metered components. Alternatively, if the auditor has substantial data from meter testing activities, he or she can calculate their own loss volumes, and this volume may be entered directly.
Note that a value of zero will be accepted but an alert will appear asking if the customer population is unmetered. Since all metered systems have some degree of inaccuracy, a positive value should be entered. A value of zero in this component is valid only if the water utility does not meter its customer population.
The Customer Retail Unit Cost represents the charge that customers pay for water service. This unit cost is applied routinely to the components of Apparent Loss, since these losses represent water reaching customers but not (fully) paid for. Since most water utilities have a rate structure that includes a variety of different costs based upon class of customer, a weighted average of individual costs and number of customer accounts in each class can be calculated to determine a single composite cost that should be entered into this cell. Finally, the weighted average cost should also include additional charges for sewer, storm water or biosolids processing, but only if these charges are based upon the volume of potable water consumed.
For water utilities in regions with limited water resources and a questionable ability to meet the drinking water demands in the future, the Customer Retail Unit Cost might also be applied to value the Real Losses; instead of applying the Variable Production Cost to Real Losses. In this way, it is assumed that every unit volume of leakage reduced by leakage management activities will be sold to a customer.
Note: the Free Water Audit Software allows the user to select the units that are charged to customers (either $/1,000 gallons, $/hundred cubic feet, or $/1,000 litres) and automatically converts these units to the units that appear in the "WATER SUPPLIED" box. The monetary units are United States dollars, $.
The ratio of the Current Annual Real Losses (Real Losses) to the Unavoidable Annual Real Losses (UARL). The ILI is a highly effective performance indicator for comparing (benchmarking) the performance of utilities in operational management of real losses.
Find
Find
Find
Find
Find
Find
Find
Find
AWWA Free Water Audit Software v5.0 Definitions 18
Item Name Description
Systematic data handling errors
Total annual cost of operating the
water system
Unauthorized consumption
Unavoidable Annual Real
Losses (UARL)
UARL (gallons)=(5.41Lm + 0.15Nc + 7.5Lc) xP, orUARL (litres)=(18.0Lm + 0.8Nc + 25.0Lc) xP
where:Lm = length of mains (miles or kilometres) Nc = number of customer service connectionsLp = the average distance of customer service connection piping (feet or metres) (see the Worksheet "Service Connection Diagram" for guidance on deterring the value of Lp) Lc = total length of customer service connection piping (miles or km) Lc = Nc X Lp (miles or kilometres)P = Pressure (psi or metres)
The UARL is a theoretical reference value representing the technical low limit of leakage that could be achieved if all of today's best technology could be successfully applied. It is a key variable in the calculation of the Infrastructure Leakage Index (ILI). Striving to reduce system leakage to a level close to the UARL is usually not needed unless the water supply is unusually expensive, scarce or both.
NOTE: The UARL calculation has not yet been proven as fully valid for very small, or low pressure water distribution systems. If, in gallons:(Lm x 32) + Nc < 3000 orP <35psiin litres:(Lm x 20) + Nc < 3000 orP < 25mthen the calculated UARL value may not be valid. The software does not display a value of UARL or ILI if either of these conditions is true.
These costs include those for operations, maintenance and any annually incurred costs for long-term upkeep of the drinking water supply and distribution system. It should include the costs of day-to-day upkeep and long-term financing such as repayment of capital bonds for infrastructure expansion or improvement. Typical costs include employee salaries and benefits, materials, equipment, insurance, fees, administrative costs and all other costs that exist to sustain the drinking water supply. Depending upon water utility accounting procedures or regulatory agency requirements, it may be appropriate to include depreciation in the total of this cost. This cost should not include any costs to operate wastewater, biosolids or other systems outside of drinking water.
Apparent losses caused by accounting omissions, errant computer programming, gaps in policy, procedure, and permitting/activation of new accounts; and any type of data lapse that results in under-stated customer water consumption in summary billing reports.
Systematic Data Handling Errors result in a direct loss of revenue potential. Water utilities can find "lost" revenue by keying on this component.
Utilities typically measure water consumption registered by water meters at customer premises. The meter should be read routinely (ex: monthly) and the data transferred to the Customer Billing System, which generates and sends a bill to the customer. Data Transfer Errors result in the consumption value being less than the actual consumption, creating an apparent loss. Such error might occur from illegible and mis-recorded hand-written readings compiled by meter readers, inputting an incorrect meter register unit conversion factor in the automatic meter reading equipment, or a variety of similar errors.
Apparent losses also occur from Data Analysis Errors in the archival and data reporting processes of the Customer Billing System. Inaccurate estimates used for accounts that fail to produce a meter reading are a common source of error. Billing adjustments may award customers a rightful monetary credit, but do so by creating a negative value of consumption, thus under-stating the actual consumption. Account activation lapses may allow new buildings to use water for months without meter readings and billing. Poor permitting and construction inspection practices can result in a new building lacking a billing account, a water meter and meter reading; i.e., the customer is unknown to the utility's billing system.
Close auditing of the permitting, metering, meter reading, billing and reporting processes of the water consumption data trail can uncover data management gaps that create volumes of systematic data handling error. Utilities should routinely analyze customer billing records to detect data anomalies and quantify these losses. For example, a billing account that registers zero consumption for two or more billing cycles should be checked to explain why usage has seemingly halted. Given the revenue loss impacts of these losses, water utilities are well-justified in providing continuous oversight and timely correction of data transfer errors & data handling errors.
If the water auditor has not yet gathered detailed data or assessment of systematic data handling error, it is recommended that the auditor apply the default value of 0.25% of the the Billed Authorized Consumption volume. However, if the auditor has investigated the billing system and its controls, and has well validated data that indicates the volume from systematic data handling error is substantially higher or lower than that generated by the default value, then the auditor should enter a quantity that was derived from the utility investigations and select an appropriate grading. Note: negative values are not allowed for this audit component. If the auditor enters zero for this component then a grading of 1 will be automatically assigned.
Includes water illegally withdrawn from fire hydrants, illegal connections, bypasses to customer consumption meters, or tampering with metering or meter reading equipment; as well as any other ways to receive water while thwarting the water utility's ability to collect revenue for the water. Unauthorized consumption results in uncaptured revenue and creates an error that understates customer consumption. In most water utilities this volume is low and, if the water auditor has not yet gathered detailed data for these loss occurrences, it is recommended that the auditor apply a default value of 0.25% of the volume of water supplied. However, if the auditor has investigated unauthorized occurrences, and has well validated data that indicates the volume from unauthorized consumption is substantially higher or lower than that generated by the default value, then the auditor should enter a quantity that was derived from the utility investigations. Note that a value of zero will not be accepted since all water utilities have some volume of unauthorized consumption occurring in their system.
Note: if the auditor selects the default value for unauthorized consumption, a data grading of 5 is automatically assigned, but not displayed on the Reporting Worksheet.
Find
Find
Find
Find
AWWA Free Water Audit Software v5.0 Definitions 19
Item Name Description
Unbilled Authorized
Consumption
Unbilled metered consumption
Unbilled unmetered
consumption
Convert From…
Million Gallons (US) = 3.06888329 Acre-feet
Use of Option Buttons
Variable production cost (applied to Real
Losses)
Volume from own sources
1
The cost to produce and supply the next unit of water (e.g., $/million gallons). This cost is determined by calculating the summed unit costs for ground and surface water treatment and all power used for pumping from the source to the customer. It may also include other miscellaneous unit costs that apply to the production of drinking water. It should also include the unit cost of bulk water purchased as an import if applicable.
It is common to apply this unit cost to the volume of Real Losses. However, if water resources are strained and the ability to meet future drinking water demands is in question, then the water auditor can be justified in applying the Customer Retail Rate to the Real Loss volume, rather than applying the Variable Production Cost.
The Free Water Audit Software applies the Variable Production costs to Real Losses by default. However, the auditor has the option on the Reporting Worksheet to select the Customer Retail Cost as the basis for the Real Loss cost evaluation if the auditor determines that this is warranted.
The volume of water withdrawn (abstracted) from water resources (rivers, lakes, streams, wells, etc) controlled by the water utility, and then treated for potable water distribution. Most water audits are compiled for utility retail water distribution systems, so this volume should reflect the amount of treated drinking water that entered the distribution system. Often the volume of water measured at the effluent of the treatment works is slightly less than the volume measured at the raw water source, since some of the water is used in the treatment process. Thus, it is useful if flows are metered at the effluent of the treatment works. If metering exists only at the raw water source, an adjustment for water used in the treatment process should be included to account for water consumed in treatment operations such as filter backwashing, basin flushing and cleaning, etc. If the audit is conducted for a wholesale water agency that sells untreated water, then this quantity reflects the measure of the raw water, typically metered at the source.
Any kind of Authorized Consumption which is neither billed or metered. This component typically includes water used in activities such as fire fighting, flushing of water mains and sewers, street cleaning, fire flow tests conducted by the water utility, etc. In most water utilities it is a small component which is very often substantially overestimated. It does NOT include water supplied to neighboring utilities (water exported) which is unmetered and unbilled – an unlikely case. This component has many sub-components of water use which are often tedious to identify and quantify. Because of this, and the fact that it is usually a small portion of the water supplied, it is recommended that the auditor apply the default value, which is 1.25% of the Water Supplied volume. Select the default percentage to enter this value.
If the water utility has carefully audited the unbilled, unmetered activities occurring in the system, and has well validated data that gives a value substantially higher or lower than the default volume, then the auditor should enter their own volume. However the default approach is recommended for most water utilities.
Note that a value of zero is not permitted, since all water utilities have some volume of water in this component occurring in their system.
The user may develop an audit based on one of three unit selections: 1) Million Gallons (US)2) Megalitres (Thousand Cubic Metres)3) Acre-feetOnce this selection has been made in the instructions sheet, all calculations are made on the basis of the chosen units. Should the user wish to make additional conversions, a unit converter is provided below (use drop down menus to select units from the yellow unit boxes):
Enter Units:
Units and Conversions
All consumption that is unbilled, but still authorized by the utility. This includes Unbilled Metered Consumption + Unbilled Unmetered Consumption. See "Authorized Consumption" for more information. For Unbilled Unmetered Consumption, the Free Water Audit Software provides the auditor the option to select a default value if they have not audited unmetered activities in detail. The default calculates a volume that is 1.25% of the Water Supplied volume. If the auditor has carefully audited the various unbilled, unmetered, authorized uses of water, and has established reliable estimates of this collective volume, then he or she may enter the volume directly for this component, and not use the default value.
(conversion factor = 3.06888328973723)
Metered consumption which is authorized by the water utility, but, for any reason, is deemed by utility policy to be unbilled. This might for example include metered water consumed by the utility itself in treatment or distribution operations, or metered water provided to civic institutions free of charge. It does not include water supplied to neighboring utilities (water exported) which may be metered but not billed.
Converts to…..
To use the default percent value choose this button To enter a value choose this button and enter the value in the cell to the right
NOTE: For Unbilled Unmetered Consumption, Unauthorized Consumption and Systematic Data Handling Errors, a recommended default value can be applied by selecting the Percent option. The default values are based on fixed percentages of Water Supplied or Billed Authorized Consumption and are recommended for use in this audit unless the auditor has well validated data for their system. Default values are shown by purple cells, as shown in the example above.
If a default value is selected, the user does not need to grade the item; a grading value of 5 is automatically applied (however, this grade will not be displayed).
Find
Find
Find
Find
AWWA Free Water Audit Software v5.0 Definitions 20
Item Name Description
Volume from own sources: Master
meter and supply error adjustment
Water exported
Water exported: Master meter and
supply error adjustment
Water imported
Water imported: Master meter and
supply error adjustment
WATER LOSSES= apparent losses + real losses
Water Losses are the difference between Water Supplied and Authorized Consumption. Water losses can be considered as a total volume for the whole system, or for partial systems such as transmission systems, pressure zones or district metered areas (DMA); if one of these configurations are the basis of the water audit.
An estimate or measure of the volume in which the Water Imported volume is incorrect. This adjustment is a weighted average that represents the collective error for all of the metered and archived imported flow for all days of the audit year. Meter error can occur in different ways. A meter may be inaccurate by under-registering flow (did not capture all the flow), or by over-registering flow (overstated the actual flow). Error in the metered, archived data can also occur due to data gaps caused by temporary outages of the meter or related instrumentation. All water utilities encounter some level of meter inaccuracy, particularly if meters are aged and infrequently tested. Occasional errors also occur in the archived metered data. Thus, a value of zero should not be entered. Enter a negative percentage or value for metered data under-registration; or, enter a positive percentage or value for metered data over-registration. If regular meter accuracy testing is conducted on the meter(s) - which is usually conducted by the water utility selling the water - then the results of this testing can be used to help quantify the meter error adjustment.
An estimate or measure of the volume in which the Water Exported volume is incorrect. This adjustment is a weighted average that represents the collective error for all of the metered and archived exported flow for all days of the audit year. Meter error can occur in different ways. A meter may be inaccurate by under-registering flow (did not capture all the flow), or by over-registering flow (overstated the actual flow). Error in the metered, archived data can also occur due to data gaps caused by temporary outages of the meter or related instrumentation. All water utilities encounter some degree of error in their metered data, particularly if meters are aged and infrequently tested. Occasional errors also occur in the archived data. Thus, a value of zero should not be entered. Enter a negative percentage or value for metered data under-registration; or enter a positive percentage or value for metered data over-registration. If regular meter accuracy testing is conducted on the meter(s) - which is usually conducted by the water utility selling the water - then the results of this testing can be used to help quantify the meter error adjustment. Corrections to data gaps or other errors found in the archived data should also be included as a portion of this meter error adjustment.
The Water Imported volume is the bulk water purchased to become part of the Water Supplied volume. Typically this is water purchased from a neighboring water utility or regional water authority, and is metered at the custody transfer point of interconnection between the two water utilities. Usually the meter(s) are owned by the water supplier selling the water to the utility conducting the water audit. The water supplier selling the bulk water usually charges the receiving utility based upon a wholesale water rate.
An estimate or measure of the degree of inaccuracy that exists in the master (production) meters measuring the annual Volume from own Sources, and any error in the data trail that exists to collect, store and report the summary production data. This adjustment is a weighted average number that represents the collective error for all master meters for all days of the audit year and any errors identified in the data trail. Meter error can occur in different ways. A meter or meters may be inaccurate by under-registering flow (did not capture all the flow), or by over-registering flow (overstated the actual flow). Data error can occur due to data gaps caused by temporary outages of the meter or related instrumentation. All water utilities encounter some degree of inaccuracy in master meters and data errors in archival systems are common; thus a value of zero should not be entered. Enter a negative percentage or value for metered data under-registration; or, enter a positive percentage or value for metered data over-registration.
The Water Exported volume is the bulk water conveyed and sold by the water utility to neighboring water systems that exists outside of their service area. Typically this water is metered at the custody transfer point of interconnection between the two water utilities. Usually the meter(s) are owned by the water utility that is selling the water: i.e. the exporter. If the water utility who is compiling the annual water audit sells bulk water in this manner, they are an exporter of water.
Note: The Water Exported volume is sold to wholesale customers who are typically charged a wholesale rate that is different than retail rates charged to the retail customers existing within the service area. Many state regulatory agencies require that the Water Exported volume be reported to them as a quantity separate and distinct from the retail customer billed consumption. For these reasons - and others - the Water Exported volume is always quantified separately from Billed Authorized Consumption in the standard water audit. Be certain not to "double-count" this quantity by including it in both the Water Exported box and the Billed Metered Consumption box of the water audit Reporting Worksheet. This volume should be included only in the Water Exported box.
Find
Find
Find
Find
Find
Find
AWWA Free Water Audit Software v5.0 Definitions 21
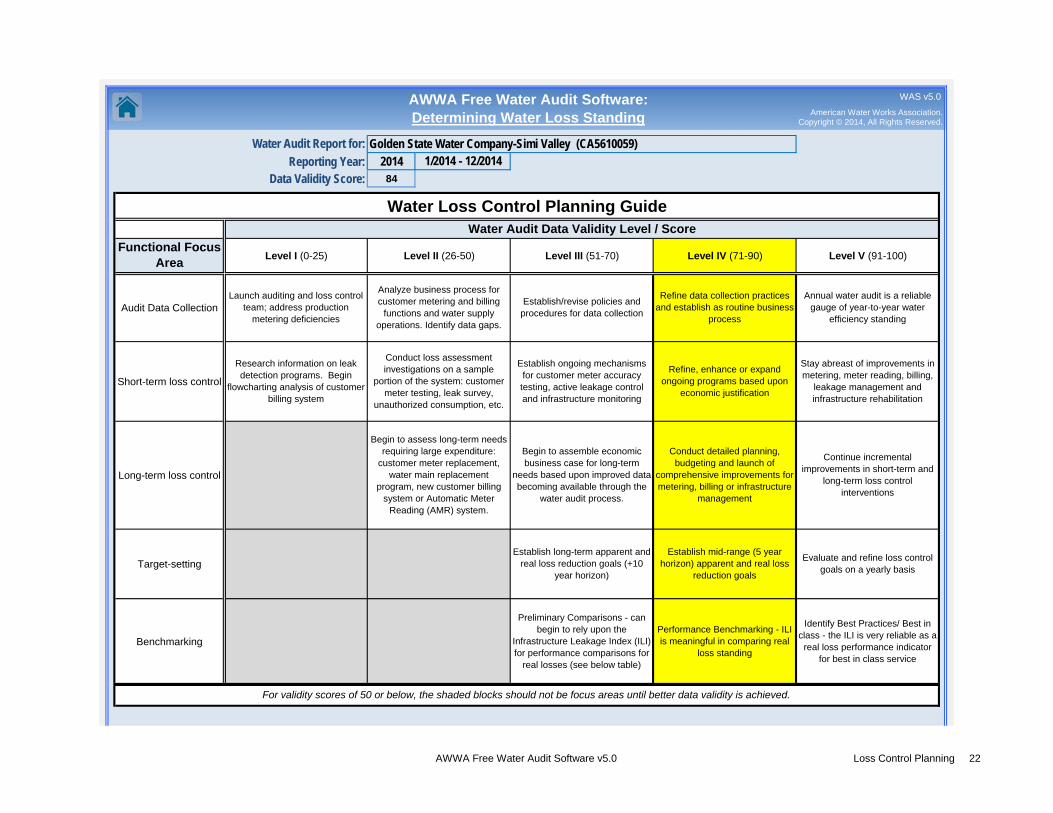
Water Audit Report for:
Reporting Year: 2014Data Validity Score: 84
Functional Focus Area
Audit Data Collection
Short-term loss control
Long-term loss control
Target-setting
Benchmarking
AWWA Free Water Audit Software: Determining Water Loss Standing
For validity scores of 50 or below, the shaded blocks should not be focus areas until better data validity is achieved.
Preliminary Comparisons - can begin to rely upon the
Infrastructure Leakage Index (ILI) for performance comparisons for
real losses (see below table)
Performance Benchmarking - ILI is meaningful in comparing real
loss standing
Identify Best Practices/ Best in class - the ILI is very reliable as a
real loss performance indicator for best in class service
Research information on leak detection programs. Begin
flowcharting analysis of customer billing system
Level II (26-50) Level V (91-100)
Analyze business process for customer metering and billing
functions and water supply operations. Identify data gaps.
Stay abreast of improvements in metering, meter reading, billing,
leakage management and infrastructure rehabilitation
Conduct loss assessment investigations on a sample
portion of the system: customer meter testing, leak survey,
unauthorized consumption, etc.
Establish ongoing mechanisms for customer meter accuracy testing, active leakage control and infrastructure monitoring
Refine, enhance or expand ongoing programs based upon
economic justification
Launch auditing and loss control team; address production
metering deficiencies
Evaluate and refine loss control goals on a yearly basis
Begin to assess long-term needs requiring large expenditure:
customer meter replacement, water main replacement
program, new customer billing system or Automatic Meter
Reading (AMR) system.
Begin to assemble economic business case for long-term
needs based upon improved data becoming available through the
water audit process.
Conduct detailed planning, budgeting and launch of
comprehensive improvements for metering, billing or infrastructure
management
Continue incremental improvements in short-term and
long-term loss control interventions
Establish long-term apparent and real loss reduction goals (+10
year horizon)
Establish mid-range (5 year horizon) apparent and real loss
reduction goals
Golden State Water Company-Simi Valley (CA5610059)1/2014 - 12/2014
Water Loss Control Planning Guide
Establish/revise policies and procedures for data collection
Refine data collection practices and establish as routine business
process
Annual water audit is a reliable gauge of year-to-year water
efficiency standing
Level III (51-70) Level IV (71-90)
Water Audit Data Validity Level / Score
Level I (0-25)
American Water Works Association.Copyright © 2014, All Rights Reserved.
WAS v5.0
AWWA Free Water Audit Software v5.0 Loss Control Planning 22

Target ILI Range
1.0 - 3.0
>3.0 -5.0
>5.0 - 8.0
Greater than 8.0
Less than 1.0
Water resources are believed to be sufficient to meet long-term needs, but demand management interventions (leakage management, water conservation) are included in the long-term planningWater resources are plentiful, reliable, and easily extracted.
Although operational and financial considerations may allow a long-term ILI greater than 8.0, such a level of leakage is not an effective utilization of water as a resource. Setting a target level greater than 8.0 - other than as an incremental goal to a smaller long-term target - is discouraged.
If the calculated Infrastructure Leakage Index (ILI) value for your system is 1.0 or less, two possibilities exist. a) you are maintaining your leakage at low levels in a class with the top worldwide performers in leakage control. b) A portion of your data may be flawed, causing your losses to be greatly understated. This is likely if you calculate a low ILI value but do not employ extensive leakage control practices in your operations. In such cases it is beneficial to validate the data by performing field measurements to confirm the accuracy of production and customer meters, or to identify any other potential sources of error in the data.
Water resources can be developed or purchased at reasonable expense; periodic water rate increases can be feasibly imposed and are tolerated by the customer population.
Cost to purchase or obtain/treat water is low, as are rates charged to customers.
Existing water supply infrastructure capability is sufficient to meet long-term demand as long as reasonable leakage management controls are in place.
Superior reliability, capacity and integrity of the water supply infrastructure make it relatively immune to supply shortages.
Financial Considerations
Once data have been entered into the Reporting Worksheet, the performance indicators are automatically calculated. How does a water utility operator know how well his or her system is performing? The AWWA Water Loss Control Committee provided the following table to assist water utilities is gauging an approximate
Infrastructure Leakage Index (ILI) that is appropriate for their water system and local conditions. The lower the amount of leakage and real losses that exist in the system, then the lower the ILI value will be.
Note: this table offers an approximate guideline for leakage reduction target-setting. The best means of setting such targets include performing an economic assessment of various loss control methods. However, this table is useful if such an assessment is not possible.
Water resources are costly to develop or purchase; ability to increase revenues via water rates is greatly limited because of regulation or low ratepayer affordability.
Water Resources Considerations
Available resources are greatly limited and are very difficult and/or environmentally unsound to develop.
Operational Considerations
Operating with system leakage above this level would require expansion of existing infrastructure and/or additional water resources to meet the demand.
General Guidelines for Setting a Target ILI(without doing a full economic analysis of leakage control options)
AWWA Free Water Audit Software v5.0 Loss Control Planning 23
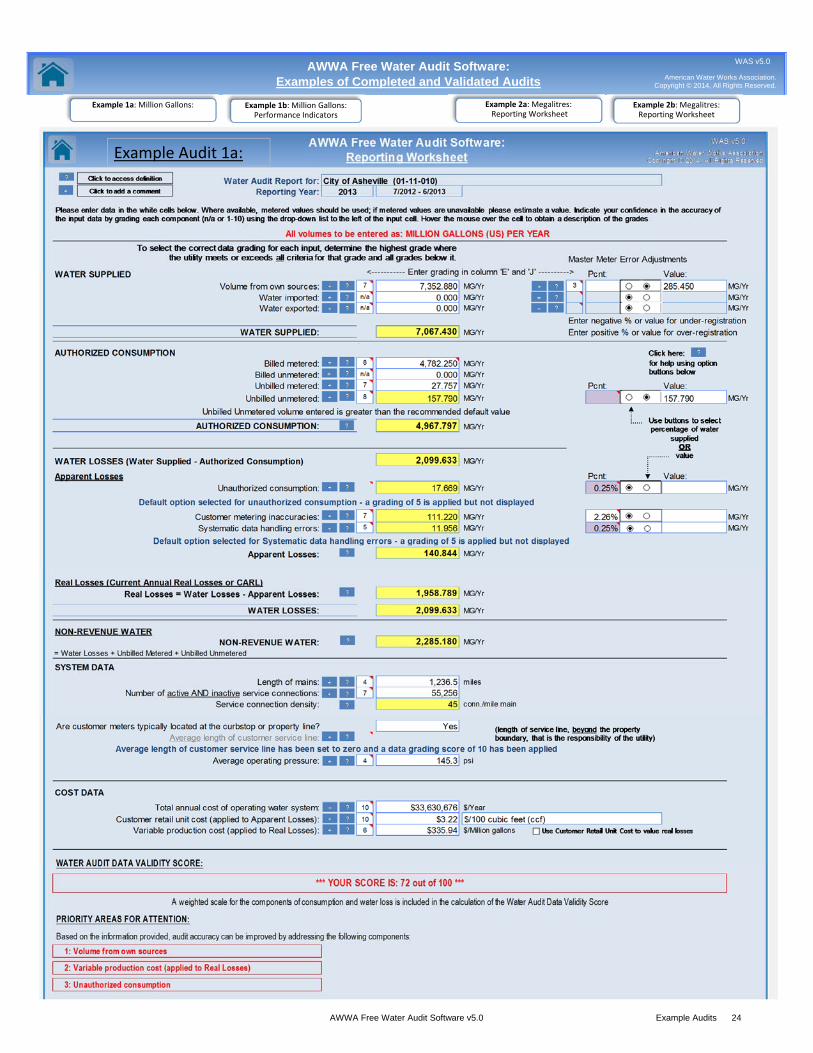
AWWA Free Water Audit Software: Examples of Completed and Validated Audits American Water Works Association.
Copyright © 2014, All Rights Reserved.
WAS v5.0
Example Audit 1a:
Example 1a: Million Gallons: Example 1b: Million Gallons:Performance Indicators
Example 2a: Megalitres:Reporting Worksheet
Example 2b: Megalitres:Reporting Worksheet
AWWA Free Water Audit Software v5.0 Example Audits 24
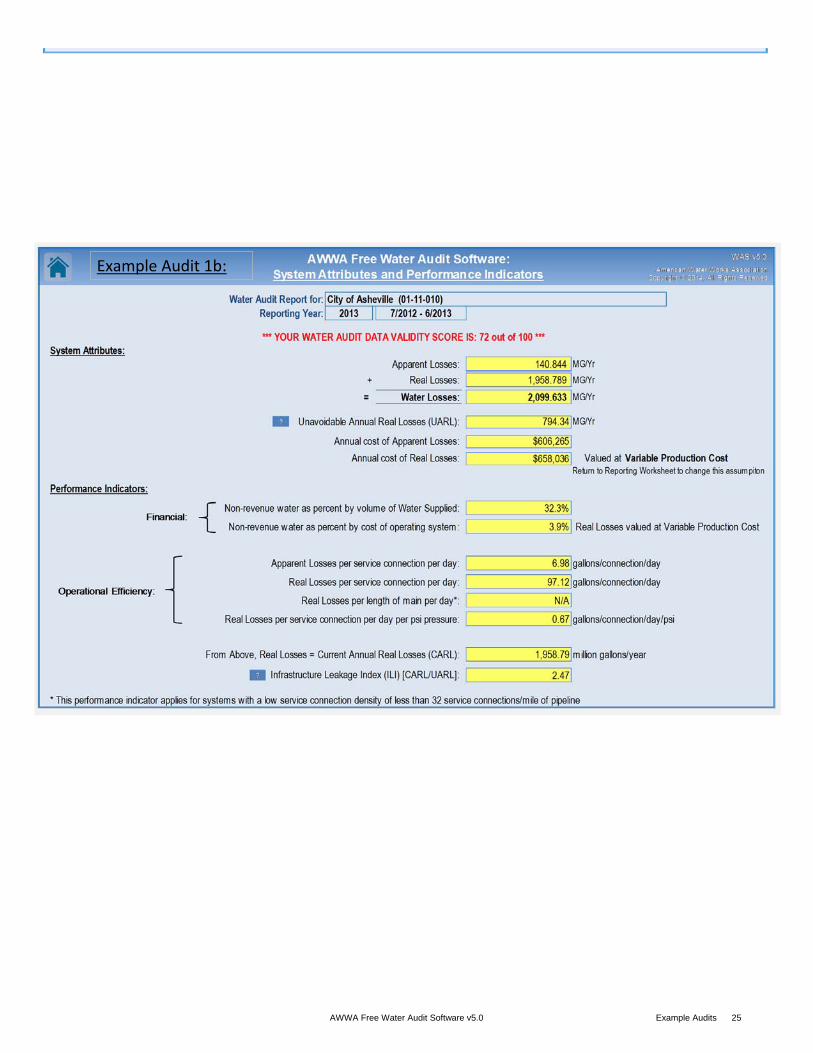
Example Audit 1b:
AWWA Free Water Audit Software v5.0 Example Audits 25
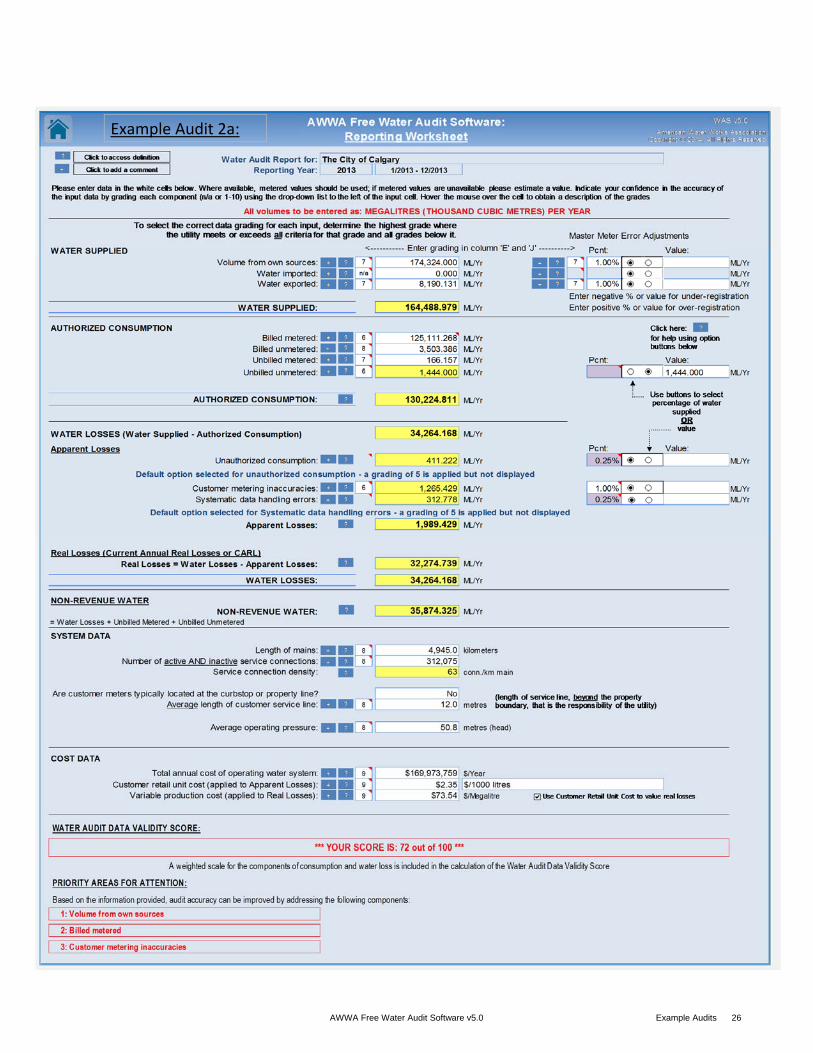
Example Audit 2a:
AWWA Free Water Audit Software v5.0 Example Audits 26
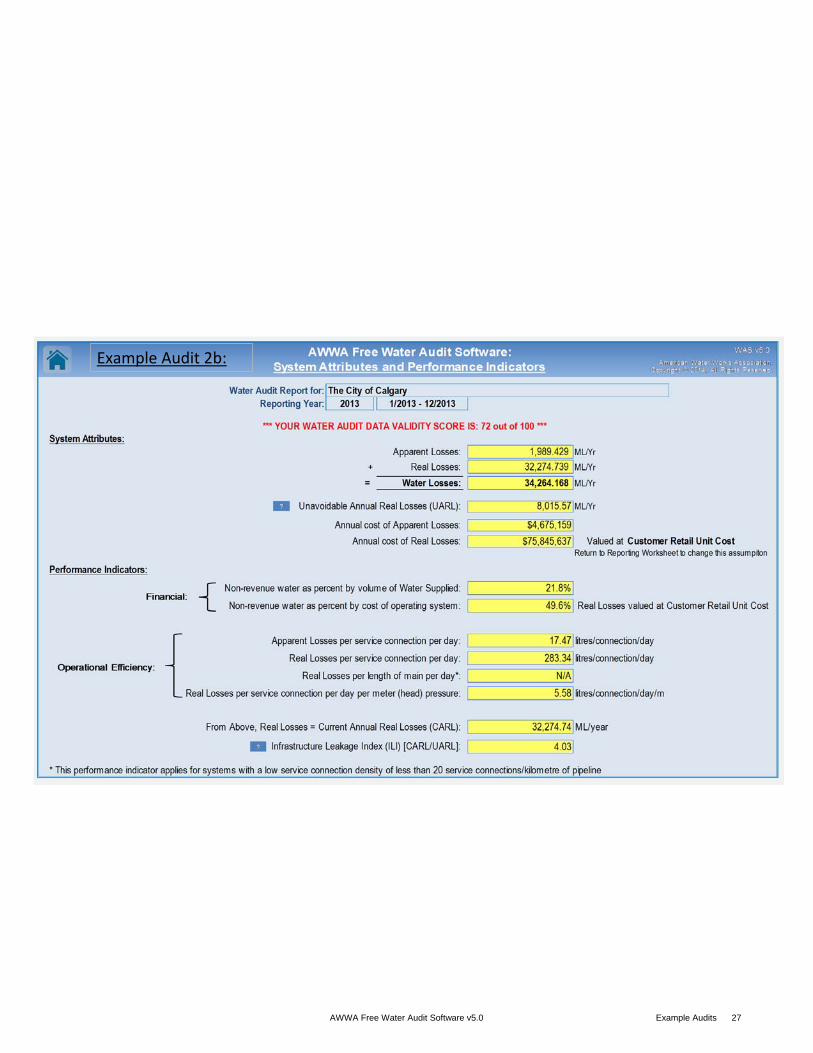
Example Audit 2b:
AWWA Free Water Audit Software v5.0 Example Audits 27
DEVELOPED BY: Andrew Chastain-Howley, PG*, MCSM. Black & Veatch Will J. Jernigan, P.E. Cavanaugh & Associates, P.A.George Kunkel, P.E. Philadelphia Water DepartmentAlain Lalonde, P.Eng. Master Meter Canada Inc.Ralph Y. McCord, P.E. Louisville Water CompanyDavid A. Sayers Delaware River Basin CommissionBrian M. Skeens, P.E. CH2M HILLReinhard Sturm Water Systems Optimization, Inc.John H. Van Arsdel M.E. Simpson Company, Inc.
REFERENCES:
AWWA Free Water Audit Software: Acknowledgements
- Alegre, H., Hirner, W., Baptista, J. and Parena, R. Performance Indicators for Water Supply Services. IWA Publishing ‘Manual of Best Practice’ Series, 2000. ISBN 1 900222 272
- Kunkel, G. et al, 2003. Water Loss Control Committee Report: Applying Worldwide Best Management Practices in Water Loss Control. Journal AWWA, 95:8:65
- AWWA Water Audits and Loss Control Programs, M36 Publication, 3 rd Edition, 2009- Service Connection Diagrams courtesy of Ronnie McKenzie, WRP Pty Ltd.
AWWA Water Audit Software Version 5.0 Developed by the Water Loss Control Committee of the American Water Works Association August, 2014
This software is intended to serve as a basic tool to compile a preliminary, or “top-down”, water audit. It is recommended that users also refer to the current edition of the AWWA M36 Publication, Water Audits and Loss Control Programs, for detailed guidance on compiling a comprehensive, or
“bottom-up”, water audit using the same water audit methodology.
American Water Works Association.Copyright © 2014, All Rights Reserved.
WAS v5.0www.awwa.org
AWWA Free Water Audit Software v5.0 Acknowledgements 28
VERSION HISTORY:
Version: Release Date:
Number of Worksheets:
v1 2005/2006 5
v2 2006 5
v3 2007 7
v4 - v4.2 2010 10
v5 2014 12
In v5, changes were made to the way Water Supplied information is entered into software, with each major component having a corresponding Master Meter Error Adjustment entry (and data grading requirement). This required changes to the data validity score calculation; v5 of the software uses a weighting system that is, in part, proportional to the volume of input components. The Grading Matrix was updated to reflect the new audit inputs and also to include clarifications and additions to the scale descriptions. The appearance of the software was updated in v5 to make the software more user-friendly and several new features were added to provide more feedback to the user. Notably, a dashboard tab has been added to provide more visual feedback on the water audit results and associated costs of Non-Revenue Water. A comments sheet was added to allow the user to track notes, comments and to cite sources used.
Key Features and Developments
The AWWA Water Audit Software was piloted in 2005 (v1.0 beta). The early versions (1.x) of the software restricted data entry to units of Million Gallons per year. For each entry into the audit, users identified whether the input was measured or estimated.
The most significant enhancement in v2 of the software was to allow the user to choose the volumetric units to be used in the audit, Million Gallons or Thousand Cubic Metres (megalitres) per year. Two financial performance indicators were added to provide feedback to the user on the cost of Real and Apparent losses.
In v3, the option to report volumetric units in acre-feet was added. Another new feature in v3 was the inclusion of default values for two water audit components (unbilled unmetered and unauthorized consumption). v3 also included two examples of completed audits in units of million gallons and Megalitres. Several checks were added into v3 to provide instant feedback to the user on common data entry problems, in order to help the user complete an accurate water audit.
v4 (and versions 4.x) of the software included a new approach to data grading. The simple "estimated" or "measured" approach was replaced with a more granular scale (typically 1-10) that reflected descriptions of utility practices and served to describe the confidence and accuracy of the input data. Each input value had a corresponding scale fully described in the Grading Matrix tab. The Grading Matrix also showed the actions required to move to a higher grading score. Grading descriptions were available on the Reporting Worksheet via a pop-up box next to each water audit input. A water audit data validity score is generated (max = 100) and priority areas for attention (to improve audit accuracy) are identified, once a user completes the requied data grading. A service connection diagram was also added to help users understand the impact of customer service line configurations on water losses and how this information should be entered into the water audit software. An acknoweldgements section was also added. Minor bug fixes resulted in the release of versions 4.1 and 4.2. A French language version was also made available for v4.2.
AWWA Free Water Audit Software v5.0 Acknowledgements 29
Appendix D
DWR SBX7-7 Verification Tables

D - 1 j:\2015\1570027.00_gswc-2015 uwmp\09-reports\simi valley\09-reports\9.09-reports\3_final draft\appendices\app d_simivalley_sbx7-7 verification tables.docx
Appendix D: SBX7-7 Verification Tables
SB X7-7 Table 0: Units of Measure Used in UWMP* (select one from the drop down list)
Acre Feet
*The unit of measure must be consistent with Table 2-3 NOTES:
Parameter Value Units2008 total water deliveries 8,336 Acre Feet
2008 total volume of delivered recycled water 0 Acre Feet
2008 recycled water as a percent of total deliveries 0.00% PercentNumber of years in baseline period1 10 YearsYear beginning baseline period range 1999Year ending baseline period range2 2008Number of years in baseline period 5 YearsYear beginning baseline period range 2003Year ending baseline period range3 2007
SB X7-7 Table-1: Baseline Period Ranges
1 If the 2008 recycled water percent is less than 10 percent, then the first baseline period is a continuous 10-year period. If the amount of recycled water delivered in 2008 is 10 percent or greater, the first baseline period is a continuous 10- to 15-year period.
2 The ending year must be between December 31, 2004 and December 31, 2010.
3 The ending year must be between December 31, 2007 and December 31, 2010.
5-year baseline period
Baseline
10- to 15-year baseline period
NOTES:
NOTES:
SB X7-7 Table 2: Method for Population Estimates
Method Used to Determine Population(may check more than one)
1. Department of Finance (DOF)DOF Table E-8 (1990 - 2000) and (2000-2010) andDOF Table E-5 (2011 - 2015) when available
3. DWR Population Tool
4. OtherDWR recommends pre-review
2. Persons-per-Connection Method
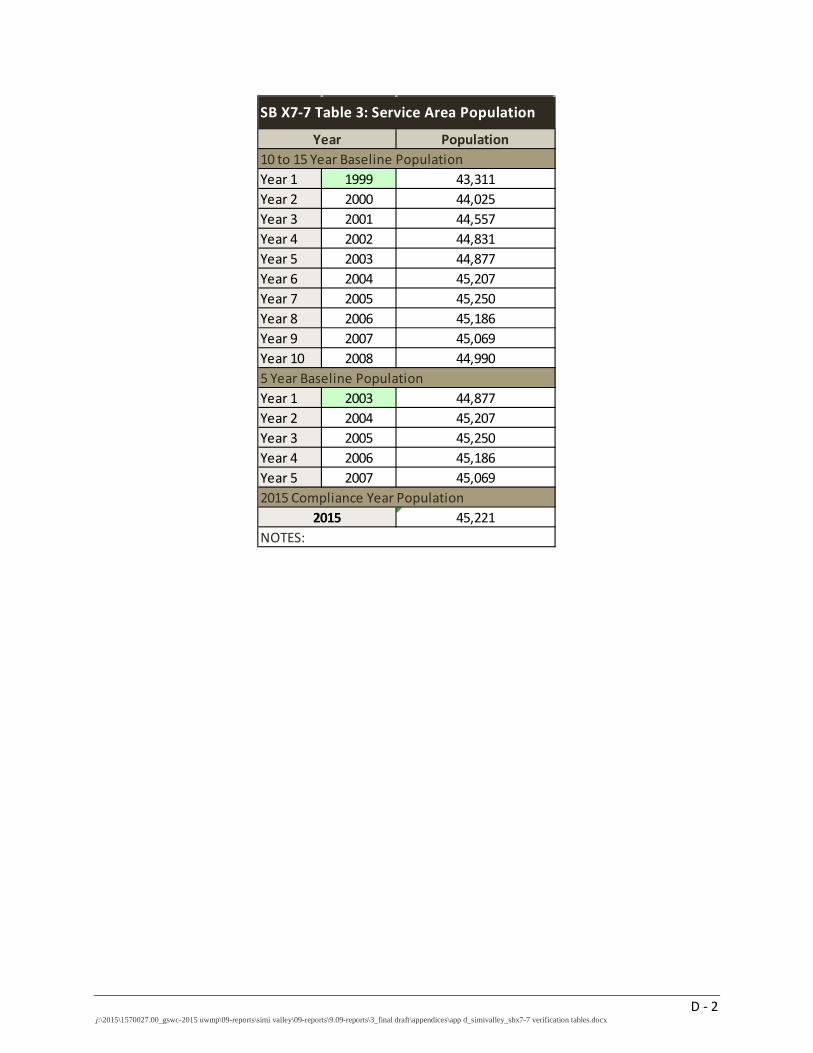
D - 2 j:\2015\1570027.00_gswc-2015 uwmp\09-reports\simi valley\09-reports\9.09-reports\3_final draft\appendices\app d_simivalley_sbx7-7 verification tables.docx
Population
Year 1 1999 43,311Year 2 2000 44,025Year 3 2001 44,557Year 4 2002 44,831Year 5 2003 44,877Year 6 2004 45,207Year 7 2005 45,250Year 8 2006 45,186Year 9 2007 45,069Year 10 2008 44,990
Year 1 2003 44,877Year 2 2004 45,207Year 3 2005 45,250Year 4 2006 45,186Year 5 2007 45,069
45,221
Year
2015
SB X7-7 Table 3: Service Area Population
10 to 15 Year Baseline Population
5 Year Baseline Population
2015 Compliance Year Population
NOTES:
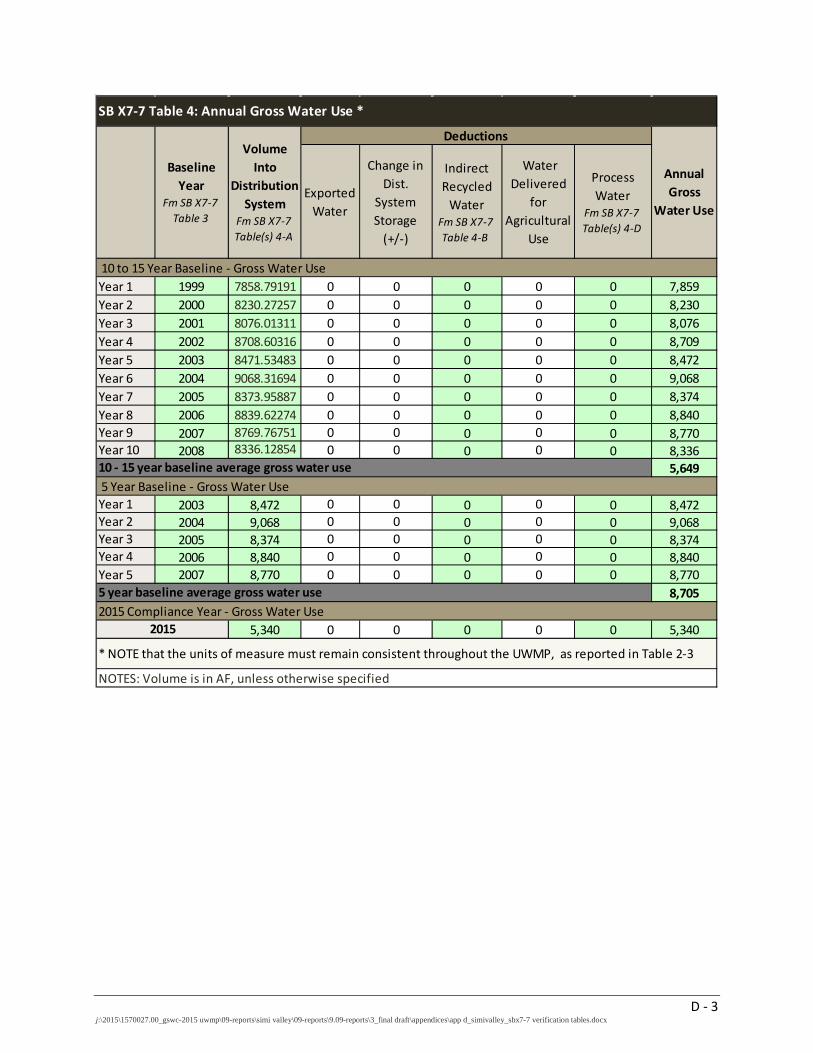
D - 3 j:\2015\1570027.00_gswc-2015 uwmp\09-reports\simi valley\09-reports\9.09-reports\3_final draft\appendices\app d_simivalley_sbx7-7 verification tables.docx
Exported Water
Change in Dist.
System Storage
(+/-)
Indirect Recycled
WaterFm SB X7-7 Table 4-B
Water Delivered
for Agricultural
Use
Process Water
Fm SB X7-7 Table(s) 4-D
Year 1 1999 7858.79191 0 0 0 0 0 7,859Year 2 2000 8230.27257 0 0 0 0 0 8,230Year 3 2001 8076.01311 0 0 0 0 0 8,076Year 4 2002 8708.60316 0 0 0 0 0 8,709Year 5 2003 8471.53483 0 0 0 0 0 8,472Year 6 2004 9068.31694 0 0 0 0 0 9,068Year 7 2005 8373.95887 0 0 0 0 0 8,374Year 8 2006 8839.62274 0 0 0 0 0 8,840Year 9 2007 8769.76751 0 0 0 0 0 8,770Year 10 2008 8336.12854 0 0 0 0 0 8,336
5,649
Year 1 2003 8,472 0 0 0 0 0 8,472Year 2 2004 9,068 0 0 0 0 0 9,068Year 3 2005 8,374 0 0 0 0 0 8,374Year 4 2006 8,840 0 0 0 0 0 8,840Year 5 2007 8,770 0 0 0 0 0 8,770
8,705
5,340 0 0 0 0 0 5,340
* NOTE that the units of measure must remain consistent throughout the UWMP, as reported in Table 2-3
NOTES: Volume is in AF, unless otherwise specified
SB X7-7 Table 4: Annual Gross Water Use *
2015
10 to 15 Year Baseline - Gross Water Use
10 - 15 year baseline average gross water use 5 Year Baseline - Gross Water Use
5 year baseline average gross water use2015 Compliance Year - Gross Water Use
Baseline Year
Fm SB X7-7 Table 3
Volume Into
Distribution System
Fm SB X7-7 Table(s) 4-A
Annual Gross
Water Use
Deductions
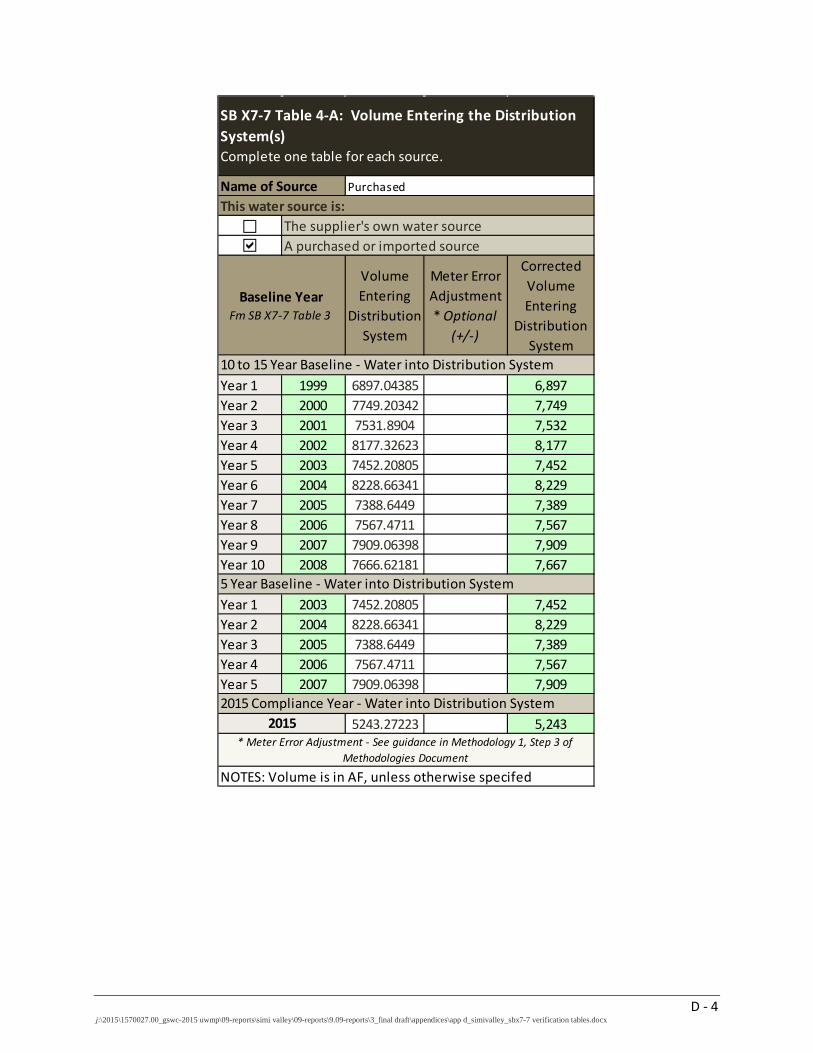
D - 4 j:\2015\1570027.00_gswc-2015 uwmp\09-reports\simi valley\09-reports\9.09-reports\3_final draft\appendices\app d_simivalley_sbx7-7 verification tables.docx
Volume Entering
Distribution System
Meter Error Adjustment* Optional
(+/-)
Corrected Volume Entering
Distribution System
Year 1 1999 6897.04385 6,897Year 2 2000 7749.20342 7,749Year 3 2001 7531.8904 7,532Year 4 2002 8177.32623 8,177Year 5 2003 7452.20805 7,452Year 6 2004 8228.66341 8,229Year 7 2005 7388.6449 7,389Year 8 2006 7567.4711 7,567Year 9 2007 7909.06398 7,909Year 10 2008 7666.62181 7,667
Year 1 2003 7452.20805 7,452Year 2 2004 8228.66341 8,229Year 3 2005 7388.6449 7,389Year 4 2006 7567.4711 7,567Year 5 2007 7909.06398 7,909
5243.27223 5,243
SB X7-7 Table 4-A: Volume Entering the Distribution System(s)Complete one table for each source.
10 to 15 Year Baseline - Water into Distribution System
5 Year Baseline - Water into Distribution System
2015 Compliance Year - Water into Distribution System
Name of Source
Baseline YearFm SB X7-7 Table 3
* Meter Error Adjustment - See guidance in Methodology 1, Step 3 of Methodologies Document
NOTES: Volume is in AF, unless otherwise specifed
This water source is:The supplier's own water sourceA purchased or imported source
2015
Purchased
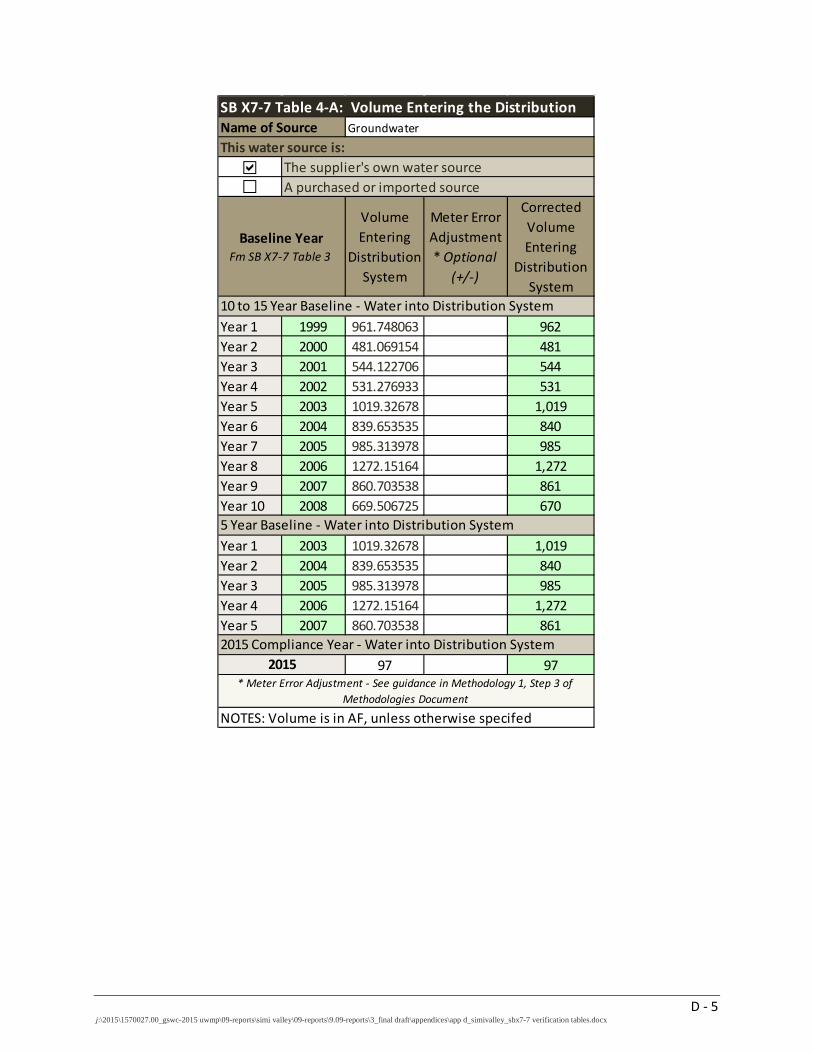
D - 5 j:\2015\1570027.00_gswc-2015 uwmp\09-reports\simi valley\09-reports\9.09-reports\3_final draft\appendices\app d_simivalley_sbx7-7 verification tables.docx
Volume Entering
Distribution System
Meter Error Adjustment* Optional
(+/-)
Corrected Volume Entering
Distribution System
Year 1 1999 961.748063 962Year 2 2000 481.069154 481Year 3 2001 544.122706 544Year 4 2002 531.276933 531Year 5 2003 1019.32678 1,019Year 6 2004 839.653535 840Year 7 2005 985.313978 985Year 8 2006 1272.15164 1,272Year 9 2007 860.703538 861Year 10 2008 669.506725 670
Year 1 2003 1019.32678 1,019Year 2 2004 839.653535 840Year 3 2005 985.313978 985Year 4 2006 1272.15164 1,272Year 5 2007 860.703538 861
97 97
Name of Source GroundwaterSB X7-7 Table 4-A: Volume Entering the Distribution
Baseline YearFm SB X7-7 Table 3
2015* Meter Error Adjustment - See guidance in Methodology 1, Step 3 of
Methodologies Document
NOTES: Volume is in AF, unless otherwise specifed
This water source is:The supplier's own water sourceA purchased or imported source
10 to 15 Year Baseline - Water into Distribution System
5 Year Baseline - Water into Distribution System
2015 Compliance Year - Water into Distribution System
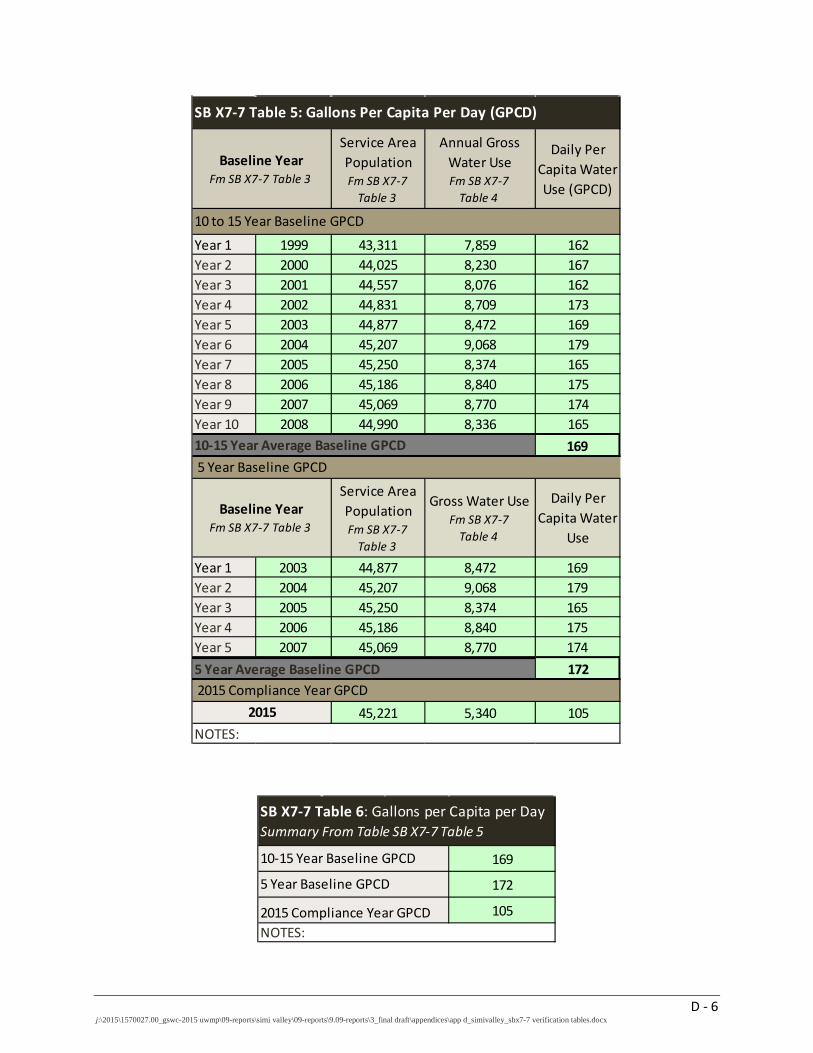
D - 6 j:\2015\1570027.00_gswc-2015 uwmp\09-reports\simi valley\09-reports\9.09-reports\3_final draft\appendices\app d_simivalley_sbx7-7 verification tables.docx
Service Area PopulationFm SB X7-7
Table 3
Annual Gross Water UseFm SB X7-7
Table 4
Daily Per Capita Water Use (GPCD)
Year 1 1999 43,311 7,859 162Year 2 2000 44,025 8,230 167Year 3 2001 44,557 8,076 162Year 4 2002 44,831 8,709 173Year 5 2003 44,877 8,472 169Year 6 2004 45,207 9,068 179Year 7 2005 45,250 8,374 165Year 8 2006 45,186 8,840 175Year 9 2007 45,069 8,770 174Year 10 2008 44,990 8,336 165
169
Service Area PopulationFm SB X7-7
Table 3
Gross Water UseFm SB X7-7
Table 4
Daily Per Capita Water
Use
Year 1 2003 44,877 8,472 169Year 2 2004 45,207 9,068 179Year 3 2005 45,250 8,374 165Year 4 2006 45,186 8,840 175Year 5 2007 45,069 8,770 174
172
45,221 5,340 105NOTES:
5 Year Average Baseline GPCD 2015 Compliance Year GPCD
2015
Baseline YearFm SB X7-7 Table 3
SB X7-7 Table 5: Gallons Per Capita Per Day (GPCD)
Baseline YearFm SB X7-7 Table 3
10 to 15 Year Baseline GPCD
10-15 Year Average Baseline GPCD 5 Year Baseline GPCD
169
172
2015 Compliance Year GPCD 105
SB X7-7 Table 6: Gallons per Capita per Day Summary From Table SB X7-7 Table 5
10-15 Year Baseline GPCD
5 Year Baseline GPCD
NOTES:
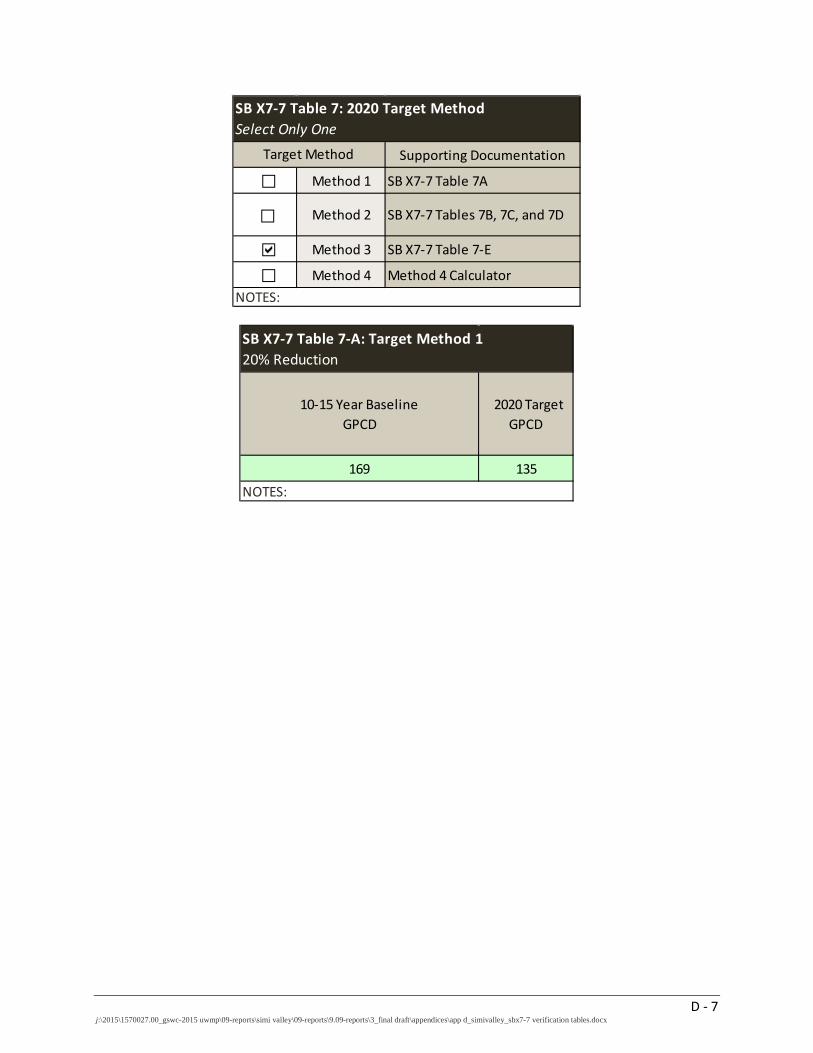
D - 7 j:\2015\1570027.00_gswc-2015 uwmp\09-reports\simi valley\09-reports\9.09-reports\3_final draft\appendices\app d_simivalley_sbx7-7 verification tables.docx
Supporting Documentation
Method 1 SB X7-7 Table 7A
Method 2 SB X7-7 Tables 7B, 7C, and 7D
Method 3 SB X7-7 Table 7-E
Method 4 Method 4 Calculator
SB X7-7 Table 7: 2020 Target MethodSelect Only One
Target Method
NOTES:
10-15 Year Baseline GPCD
2020 Target GPCD
169 135
SB X7-7 Table 7-A: Target Method 120% Reduction
NOTES:
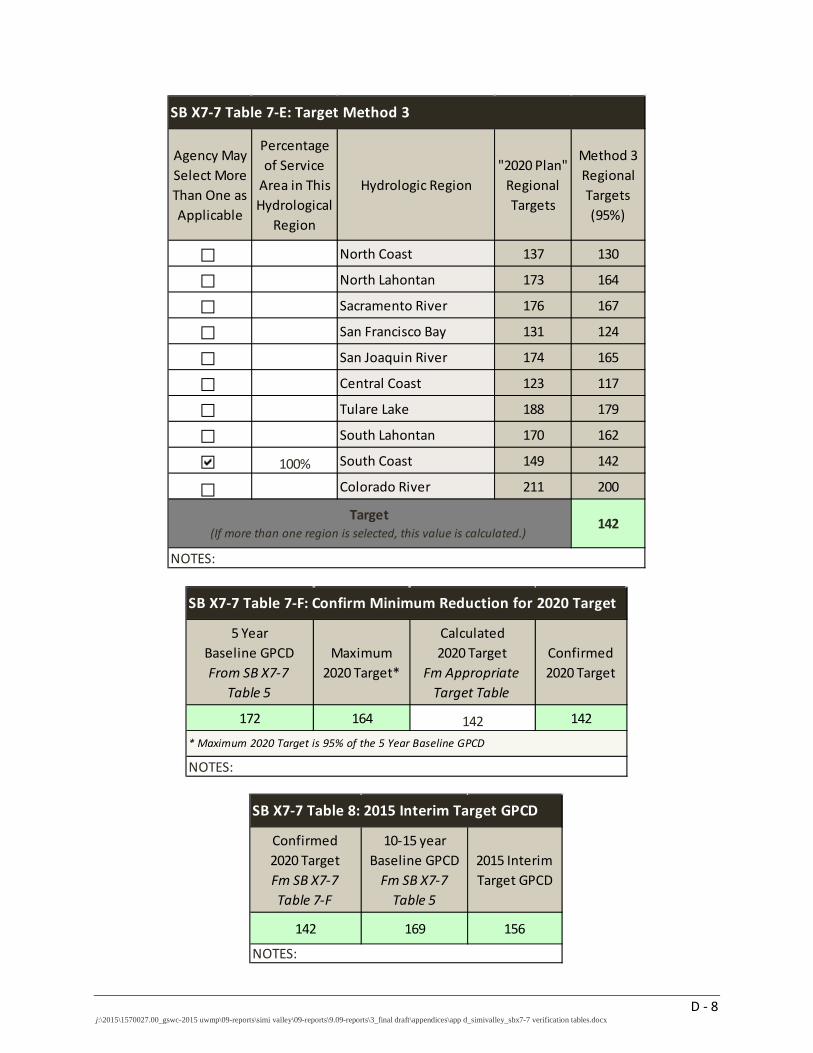
D - 8 j:\2015\1570027.00_gswc-2015 uwmp\09-reports\simi valley\09-reports\9.09-reports\3_final draft\appendices\app d_simivalley_sbx7-7 verification tables.docx
Agency May Select More Than One as Applicable
Percentage of Service
Area in This Hydrological
Region
Hydrologic Region"2020 Plan"
Regional Targets
Method 3 Regional Targets (95%)
North Coast 137 130
North Lahontan 173 164
Sacramento River 176 167
San Francisco Bay 131 124
San Joaquin River 174 165
Central Coast 123 117
Tulare Lake 188 179
South Lahontan 170 162
100% South Coast 149 142
Colorado River 211 200
142
SB X7-7 Table 7-E: Target Method 3
Target(If more than one region is selected, this value is calculated.)
NOTES:
5 YearBaseline GPCDFrom SB X7-7
Table 5
Maximum 2020 Target*
Calculated2020 Target
Fm Appropriate Target Table
Confirmed 2020 Target
172 164 142 142
SB X7-7 Table 7-F: Confirm Minimum Reduction for 2020 Target
* Maximum 2020 Target is 95% of the 5 Year Baseline GPCD
NOTES:
Confirmed2020 TargetFm SB X7-7Table 7-F
10-15 year Baseline GPCD
Fm SB X7-7Table 5
2015 Interim Target GPCD
142 169 156
SB X7-7 Table 8: 2015 Interim Target GPCD
NOTES:
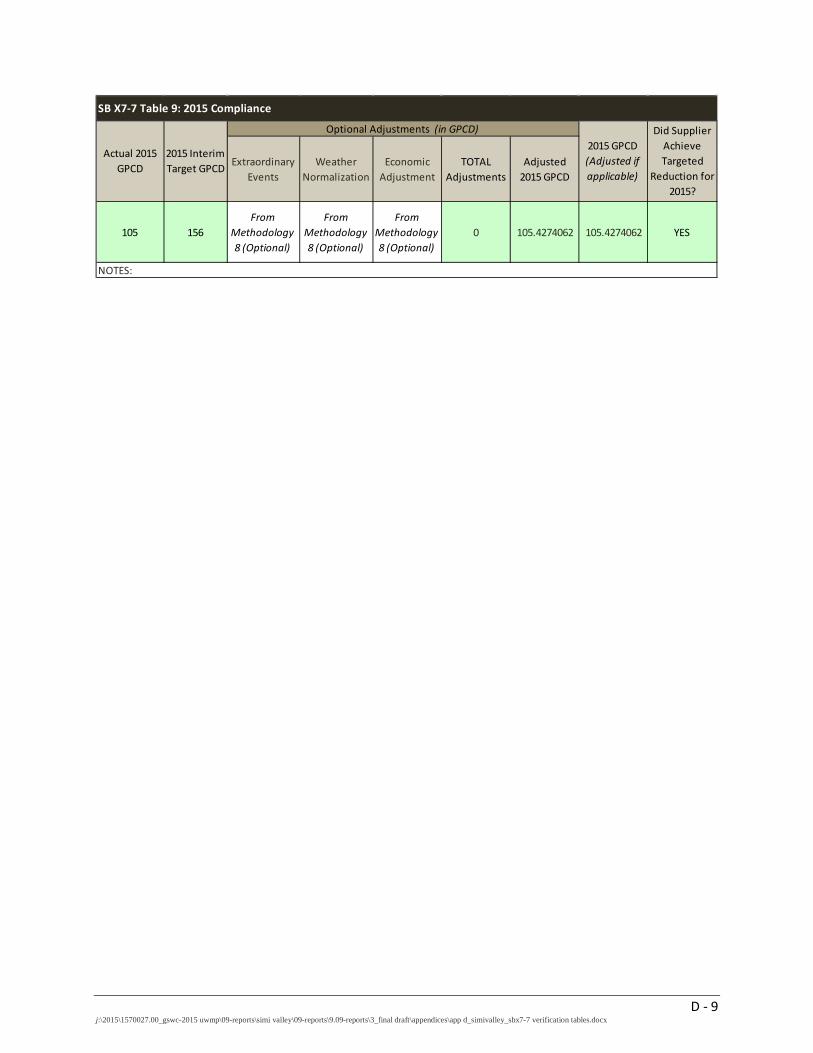
D - 9 j:\2015\1570027.00_gswc-2015 uwmp\09-reports\simi valley\09-reports\9.09-reports\3_final draft\appendices\app d_simivalley_sbx7-7 verification tables.docx
Extraordinary Events
Weather Normalization
Economic Adjustment
TOTAL Adjustments
Adjusted 2015 GPCD
105 156From
Methodology 8 (Optional)
From Methodology 8 (Optional)
From Methodology 8 (Optional)
0 105.4274062 105.4274062 YES
Optional Adjustments (in GPCD)
NOTES:
SB X7-7 Table 9: 2015 Compliance
Did Supplier Achieve Targeted
Reduction for 2015?
Actual 2015 GPCD
2015 Interim Target GPCD
2015 GPCD (Adjusted if applicable)
Appendix E
DWR Population Tool
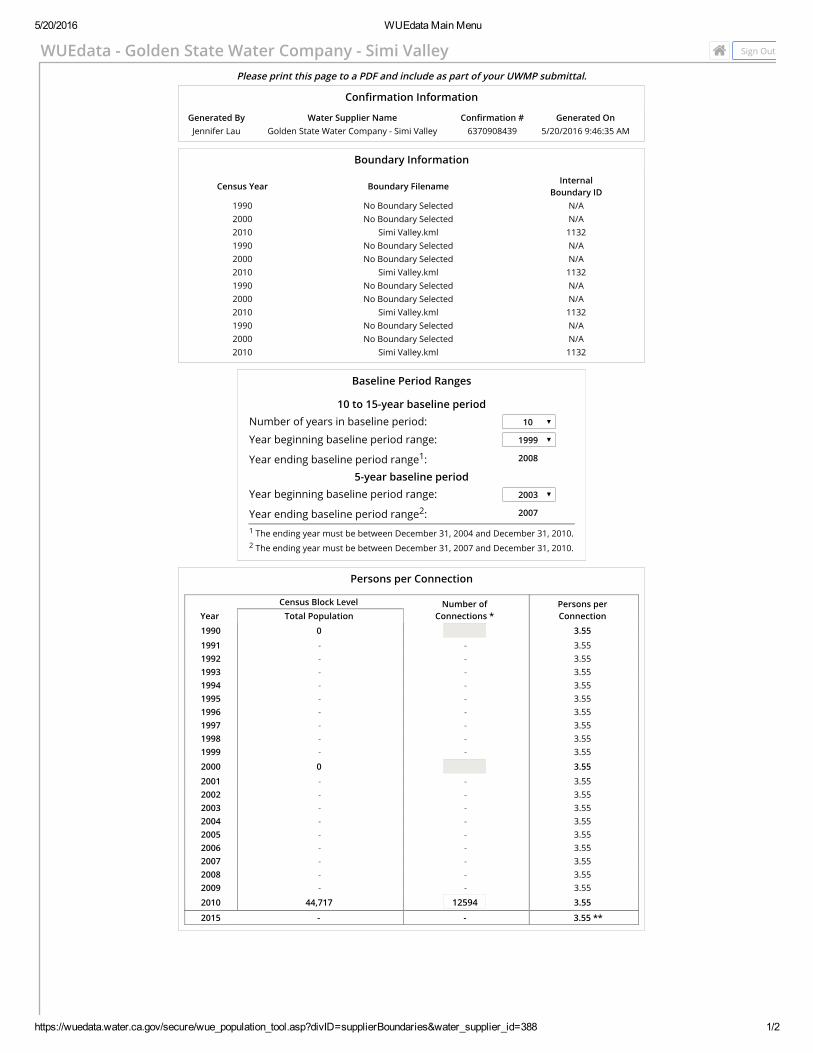
5/20/2016 WUEdata Main Menu
https://wuedata.water.ca.gov/secure/wue_population_tool.asp?divID=supplierBoundaries&water_supplier_id=388 1/2
Sign OutWUEdata - Golden State Water Company - Simi ValleyPlease print this page to a PDF and include as part of your UWMP submittal.
Con휩㥬rmation Information
Generated By Water Supplier Name Con휩㥬rmation # Generated OnJennifer Lau Golden State Water Company - Simi Valley 6370908439 5/20/2016 9:46:35 AM
Boundary Information
Census Year Boundary FilenameInternal
Boundary ID1990 No Boundary Selected N/A2000 No Boundary Selected N/A2010 Simi Valley.kml 11321990 No Boundary Selected N/A2000 No Boundary Selected N/A2010 Simi Valley.kml 11321990 No Boundary Selected N/A2000 No Boundary Selected N/A2010 Simi Valley.kml 11321990 No Boundary Selected N/A2000 No Boundary Selected N/A2010 Simi Valley.kml 1132
Baseline Period Ranges
10 to 15-year baseline periodNumber of years in baseline period: 10
Year beginning baseline period range: 1999
Year ending baseline period range1: 2008
5-year baseline periodYear beginning baseline period range: 2003
Year ending baseline period range2: 2007
1 The ending year must be between December 31, 2004 and December 31, 2010. 2 The ending year must be between December 31, 2007 and December 31, 2010.
Persons per Connection
YearCensus Block Level Number of
Connections *Persons per ConnectionTotal Population
1990 0 3.55
1991 - - 3.551992 - - 3.551993 - - 3.551994 - - 3.551995 - - 3.551996 - - 3.551997 - - 3.551998 - - 3.551999 - - 3.55
2000 0 3.55
2001 - - 3.552002 - - 3.552003 - - 3.552004 - - 3.552005 - - 3.552006 - - 3.552007 - - 3.552008 - - 3.552009 - - 3.55
2010 44,717 12594 3.55
2015 - - 3.55 **
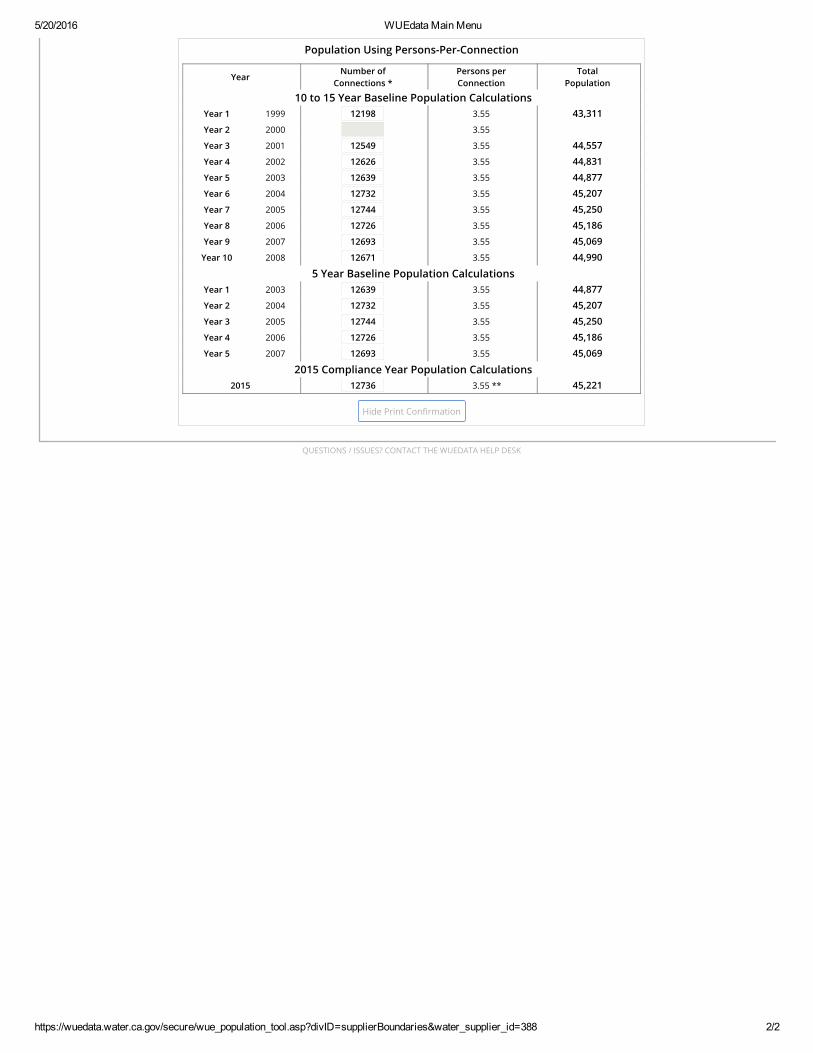
5/20/2016 WUEdata Main Menu
https://wuedata.water.ca.gov/secure/wue_population_tool.asp?divID=supplierBoundaries&water_supplier_id=388 2/2
QUESTIONS / ISSUES? CONTACT THE WUEDATA HELP DESK
Population Using Persons-Per-Connection
YearNumber of
Connections *Persons per Connection
Total Population
10 to 15 Year Baseline Population CalculationsYear 1 1999 12198 3.55 43,311
Year 2 2000 3.55
Year 3 2001 12549 3.55 44,557
Year 4 2002 12626 3.55 44,831
Year 5 2003 12639 3.55 44,877
Year 6 2004 12732 3.55 45,207
Year 7 2005 12744 3.55 45,250
Year 8 2006 12726 3.55 45,186
Year 9 2007 12693 3.55 45,069
Year 10 2008 12671 3.55 44,990
5 Year Baseline Population CalculationsYear 1 2003 12639 3.55 44,877
Year 2 2004 12732 3.55 45,207
Year 3 2005 12744 3.55 45,250
Year 4 2006 12726 3.55 45,186
Year 5 2007 12693 3.55 45,069
2015 Compliance Year Population Calculations2015 12736 3.55 ** 45,221
Hide Print Con휩㥬rmation
Appendix F
Select CPUC Water Conservation and Rationing Rules and Regulations
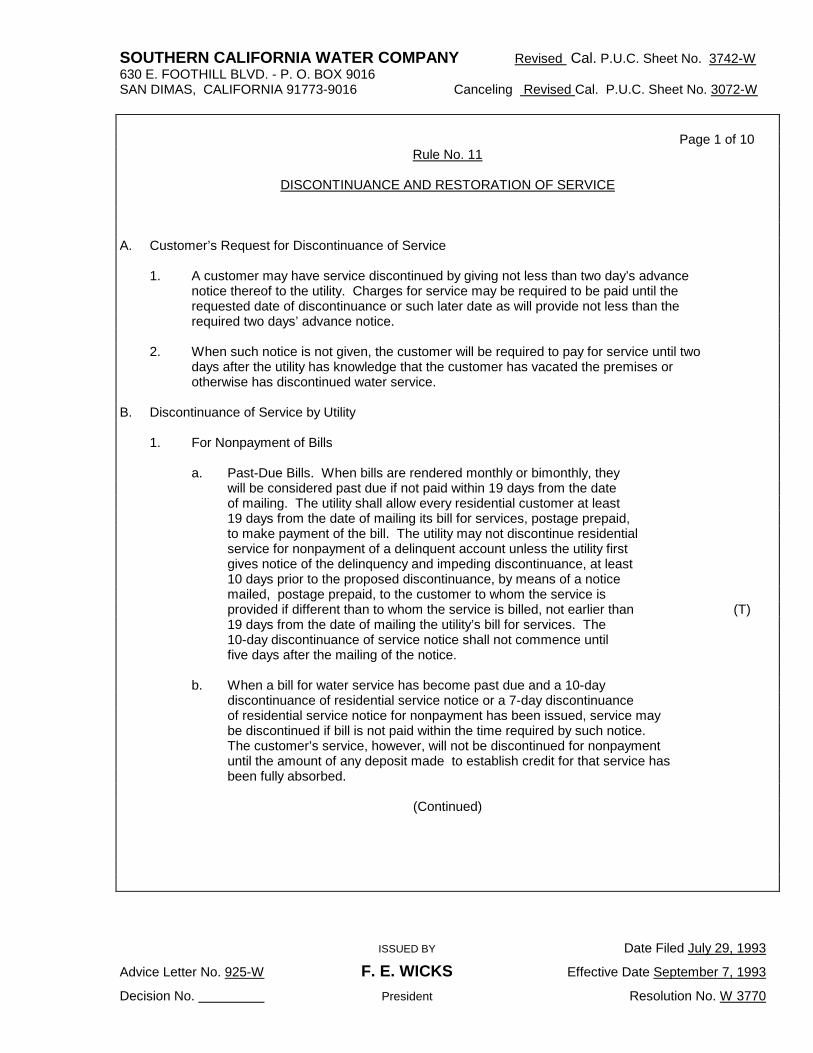
SOUTHERN CALIFORNIA WATER COMPANY Revised Cal. P.U.C. Sheet No. 3742-W 630 E. FOOTHILL BLVD. - P. O. BOX 9016 SAN DIMAS, CALIFORNIA 91773-9016 Canceling Revised Cal. P.U.C. Sheet No. 3072-W
ISSUED BY Date Filed July 29, 1993
Advice Letter No. 925-W F. E. WICKS Effective Date September 7, 1993
Decision No. President Resolution No. W 3770
Page 1 of 10 Rule No. 11
DISCONTINUANCE AND RESTORATION OF SERVICE
A. Customer’s Request for Discontinuance of Service
1. A customer may have service discontinued by giving not less than two day’s advancenotice thereof to the utility. Charges for service may be required to be paid until therequested date of discontinuance or such later date as will provide not less than therequired two days’ advance notice.
2. When such notice is not given, the customer will be required to pay for service until twodays after the utility has knowledge that the customer has vacated the premises orotherwise has discontinued water service.
B. Discontinuance of Service by Utility
1. For Nonpayment of Bills
a. Past-Due Bills. When bills are rendered monthly or bimonthly, theywill be considered past due if not paid within 19 days from the dateof mailing. The utility shall allow every residential customer at least19 days from the date of mailing its bill for services, postage prepaid,to make payment of the bill. The utility may not discontinue residentialservice for nonpayment of a delinquent account unless the utility firstgives notice of the delinquency and impeding discontinuance, at least10 days prior to the proposed discontinuance, by means of a noticemailed, postage prepaid, to the customer to whom the service isprovided if different than to whom the service is billed, not earlier than (T) 19 days from the date of mailing the utility’s bill for services. The10-day discontinuance of service notice shall not commence untilfive days after the mailing of the notice.
b. When a bill for water service has become past due and a 10-daydiscontinuance of residential service notice or a 7-day discontinuanceof residential service notice for nonpayment has been issued, service maybe discontinued if bill is not paid within the time required by such notice.The customer’s service, however, will not be discontinued for nonpaymentuntil the amount of any deposit made to establish credit for that service hasbeen fully absorbed.
(Continued)
SOUTHERN CALIFORNIA WATER COMPANY Revised Cal. P.U.C. Sheet No. 3743-W 630 E. FOOTHILL BLVD. - P. O. BOX 9016 SAN DIMAS, CALIFORNIA 91773-9016 Canceling Revised Cal. P.U.C. Sheet No. 3073-W
ISSUED BY Date Filed July 29, 1993
Advice Letter No. 925-W F. E. WICKS Effective Date September 7, 1993
Decision No. President Resolution No. W 3770
Page 2 of 10
Rule No. 11
(Continued) DISCONTINUANCE AND RESTORATION OF SERVICE
B. Discontinuance of Services by Utility (Continued) 1. For Nonpayment of Bills (Continued) c. Any customer, residential as well as nonresidential, who has initiated a billing complaint or requested an investigation within 5 days of receiving a disputed bill or who has, before discontinuance of service made a request for extension of the payment period of a bill asserted to be beyond the means of the customer to pay in full within the normal period for payment, shall not have residential water service discontinued for nonpayment during the pendency of an investigation by the utility of such customer complaint or request and shall be given an opportunity for review of the complaint, investigation, or request by a review manager of the utility. The review shall include consideration of whether a residential customer shall be permitted to make installment payments on any unpaid balance of the delinquent account over a reasonable period of time, not to exceed 12 months. Such service shall not be discontinued for nonpayment for any customer complying with an installment payment agreement entered into with the utility, provided the customer also keeps current his account for water service as charges accrue in each subsequent billing period. If a residential customer fails to comply with an installment payment agreement, the utility will give a 10-day discontinuance of service notice before discontinuing such service, but such notice shall not entitle the customer to further investigation by the utility. d. Any customer whose complaint or request for an investigation pursuant to subdivision (c) has resulted in an adverse determination by the utility may appeal the determination to the Commission. Any subsequent appeal of the dispute or complaint to the Commission shall be in accordance with the Commission adopted Rules of Practice and Procedure. e. Service to a residential water customer will not be discontinued for nonpayment when the customer has previously established to the satisfaction of the utility that:
(Continued)
SOUTHERN CALIFORNIA WATER COMPANY Revised Cal. P.U.C. Sheet No. 3744-W 630 E. FOOTHILL BLVD. - P. O. BOX 9016 SAN DIMAS, CALIFORNIA 91773-9016 Canceling Revised Cal. P.U.C. Sheet No. 3074-W
ISSUED BY Date Filed July 29, 1993
Advice Letter No. 925-W F. E. WICKS Effective Date September 7, 1993
Decision No. President Resolution No. W 3770
Page 3 of 10
Rule No. 11
(Continued) DISCONTINUANCE AND RESTORATION OF SERVICE
B. Discontinuance of Services by Utility (Continued) 1. For Nonpayment of Bills (Continued) e. (Continued) (1) The customer is elderly (age 62 or over) or handicapped,* or upon certification of a licensed physical or surgeon that to discontinue water will be life threatening to the customer; and *Proof of age must be supported by certificate of birth, driver’s license, passport or other reliable document. Proof of handicap must be by certification from a licensed physician, surgeon, public health nurse or social worker. (2) The customer is temporarily unable to pay for such service in accordance with the provisions of the utility’s tariffs; and (3) The customer is willing to arrange installment payments satisfactory to the utility, over a period not to exceed 12 months, including arrangements for prompt payment of subsequent bills. However, service may be discontinued to any customer who does not comply with an installment payment agreement or keep current his account for water service as charges accrue in each subsequent billing period. (f) A customer’s residential service may be discontinued for nonpayment of a bill for residential service previously rendered him at any location served by the utility. A nonresidential service may be discontinued for nonpayment of a bill for residential as well as nonresidential service previously rendered him at any location served by the utility. The discontinuance of service notice as set forth in subdivision (b) will be given in both cases stated above before discontinuance of service takes place.
(Continued)
SOUTHERN CALIFORNIA WATER COMPANY Revised Cal. P.U.C. Sheet No. 3745-W 630 E. FOOTHILL BLVD. P. O. BOX 9016 SAN DIMAS, CALIFORNIA 91773-9016 Cancelling Revised Cal. P.U.C. Sheet No. 3075-W
ISSUED BY Date Filed: July 29, 1993
Advice Letter No. 925-W F. E. WICKS Effective Date: September 7, 1993
Decision No. President Resolution No. W 3770
Page 4 of 10
Rule No. 11
DISCONTINUANCE AND RESTORATION OF SERVICE (Continued)
B. Discontinuance of Services by Utility (Continued) 1. For Nonpayment of Bills (Continued) f. (Continued) Residential services will not, however, be discontinued for nonpayment of bills for separate nonresidential service. g. Service will not be discontinued by reason of delinquency in payment for service on any Saturday, Sunday, legal holiday, or at any time during which the business offices of the utility are not open to the public. h. Where water service is provided to residential users in a multi-unit (T) residential structure, mobilehome park, or permanent residential struc- tures in a labor camp, where the owner, manager, or operator is listed by the utility as the customer of record, the utility will make every good faith effort to inform the users, when the account is in arrears, that service will be dicontinued. Notice will be in as prescribed in sub- division (a) above, and in Rules Nos. 5 and 8. (T) (1) Where said users are individually metered. (N) The utility is not required to make service available to these users unless each user agrees to the terms and conditions of service and meets the requirement of the law and the utility’s rules and tariffs. However, if one or more users are willing and able to assume respon- sibility for subsequent charges by these users to the account to the satisfaction of the utility, and if there is a practical physical means, legally available to the utility of selectively providing services to these users who have met the requirements of the utility’s rules and tariffs, the utility will make service available to these users. For these selected users establishment of credit will be as prescribed in Rule No. 6, except that where prior service for a period of time is a condition for establish- ing credit with the utility, proof that is acceptable to the utility of residence and prompt payment of rent or other credit obligation during that period of time is a satisfactory equivalent. (N)
(Continued)
SOUTHERN CALIFORNIA WATER COMPANY Original Cal. P.U.C. Sheet No. 3746-W 630 E. FOOTHILL BLVD. - P. O. BOX 9016 SAN DIMAS, CALIFORNIA 91773-9016 Canceling Cal. P.U.C. Sheet No. _____
ISSUED BY Date Filed July 29, 1993
Advice Letter No. 925-W F. E. WICKS Effective Date September 7, 1993
Decision No. President Resolution No. W 3770
Page 5 of 10
Rule No. 11
(Continued) DISCONTINUANCE AND RESTORATION OF SERVICE
B. Discontinuance of Services by Utility (Continued) 1. For Nonpayment of Bills (Continued) h. (Continued) (2) Where said users are master metered. (N) The utility is not required to make service available to these users unless each user agrees to the terms and conditions of service, and meets the requirements of the law and the utility’s rules and tariffs and the following: The same Rule 11, item B.1.h. (1) above which applies to individually metered users also applies to master metered users, except a representative may act on the behalf of a master metered user, and the utility will not discontinue service in any of the following situations: (a) During the pendency of an investigation by the utility of a master- meter customer dispute or complaint. (b) When the master-metered customer has been granted an extension of the period for repayment of a bill. (c) For an indebtedness owned by the master metered customer to any other person or corporation or when the obligation represented by the delinquent account or any other indebtedness was incurred with a person or corporation other than the utility demanding pay- ment therefor. (d) When a delinquent account relates to another property owned, managed, or operated by the master-metered customer. (e) When a public health or building officer certifies that determination would result in a significant threat to the health or safety of the residential occupants or the public. Proof of age or handicap are described in Rule 11.B.1.e. (N)
(Continued)
SOUTHERN CALIFORNIA WATER COMPANY Revised Cal. P.U.C. Sheet No. 3747-W 630 E. FOOTHILL BLVD. - P. O. BOX 9016 SAN DIMAS, CALIFORNIA 91773-9016 Canceling Original Cal. P.U.C. Sheet No. 3076-W
ISSUED BY Date Filed _____July 29, 1993____
Advice Letter No. 925-W F. E. WICKS Effective Date __September 7, 1993____
Decision No. President Resolution No.______W 3770 ______
Page 6 of 10
Rule No. 11
(Continued) DISCONTINUANCE AND RESTORATION OF SERVICE
B. Discontinuance of Services by Utility (Continued) 1. For Nonpayment of Bills (Continued) i. A reasonable attempt must be made by the utility to personally contact an adult person on the residential customer’s premises either by tele- phone, or in person, at hours prior to discontinuance. For elderly or (C) handicapped residential customers, the utility shall provide at least 48 hours’ notice by telephone or in person. For these customers, if tele- phone or personal contact cannot be made, a notice of discontinuance of service shall be posted in a conspicuous location at the service address at least 48 hours prior to discontinuance. Such notice shall be (N) independent of and in addition to, other notices(s) as may be prescribed (N) in the utility’s tariffs. (N) j. Residential Customer’s Remedies Upon Receipt of Discontinuance Notice. (1) If upon receipt of a 10 day discontinuance notice, a residential customer is unable to pay, he must contact the utility before discon- tinuance of service to make payment arrangements to avoid dis- continuance of service. (2) If, after contacting the utility, the residential customer alleges to the Commission an inability to pay and that he is unable to make payment arrangements with the utility he should write to the Commission’s Consumer Affairs Branch (CAB) to make an informal complaint. This action must be taken within the 10-day discontinuance of service notice. (3) The CAB’s resolution of the matter will be reported to the utility and the residential customer within ten business days after receipt of the informal complaint. If the customer is not satisfied with such resolution, he must file, within ten business days after the date of the CAB’s letter, a formal complaint with the Commission under Public Utilities Code Section 1702 on a form provided by the CAB.
(Continued)
SOUTHERN CALIFORNIA WATER COMPANY Revised Cal. P.U.C. Sheet No. 3748-W 630 E. FOOTHILL BLVD. - P. O. BOX 9016 SAN DIMAS, CALIFORNIA 91773-9016 Canceling Original Cal. P.U.C. Sheet No. 3077-W
ISSUED BY Date Filed July 29,1993
Advice Letter No. 925-W F. E. WICKS Effective Date September 7, 1993
Decision No. President Resolution No. W 3770
Page 7 of 10 Rule No. 11
(Continued) DISCONTINUANCE AND RESTORATION OF SERVICE
B. Discontinuance of Services by Utility (Continued)
1. For Nonpayment of Bills (Continued)
j. Residential Customer’s Remedies Upon Receipt of Discontinuance Notice.
(4) Failure of the residential as well as the nonresidential customer to observethese time limits shall entitle the utility to insist upon payment or, upon failure to pay, to discontinue the customer’s service.
k. Designation of a Third-Party Representative (Elderly or Handicapped only)
(1) Customer must inform utility if he desires that a third party receivediscontinuance or other notices on his behalf.
(2) Utility must be advised of name, address and telephone number of third party with a letter from third party accepting this responsibility.
(3) Only customers who certify that they are elderly or handicapped are entitled to third-party representation.*
2. For Noncompliance with Rules
The utility may discontinue service to any customer for violation of these rules after it hasgiven the customer at least five days’ written notice of such intention. Where safety ofwater supply is endangered, service may be discontinued immediately without notice.
3. For Waste of Water
a. Where negligent or wasteful use of water exists on customer’s premises, the utilitymay discontinue the service if such practices are not remedied within five days afterit has given the customer written notice to such effect.
(Continued)
* Proof of age must be supported by certificate of birth, driver’s license, passportor other reliable document. Proof of handicap must be by certification from alicensed physician, public health nurse or social worker.
SOUTHERN CALIFORNIA WATER COMPANY Revised Cal. P.U.C. Sheet No. 4804-W 630 E. FOOTHILL BLVD. - P. O. BOX 9016 SAN DIMAS, CALIFORNIA 91773-9016 Canceling Revised Cal. P.U.C. Sheet No. 3749-W
ISSUED BY Date Filed August 12, 2004
Advice Letter No. 1173-W F. E. WICKS Effective Date September 21, 2004
Decision No. 04-03-039 President Resolution No._____________
Page 8 of 10
Rule No. 11
(Continued) DISCONTINUANCE AND RESTORATION OF SERVICE
B. Continuance of Services by Utility (Continued) 3. For Waste of Water (Continued) b. In order to protect itself against serious and unnecessary waste or misuse of water, the utility may meter any flat rate service and apply the regularly established meter rates where the customer continues to misuse or waste water beyond five days after the utility has given the customer written notice to remedy such practices. 4. For Unsafe Apparatus or Where Service is Detrimental or Damaging to the Utility or its Customers If an unsafe or hazardous condition is found to exist on the customer’s premise, or if the use of water thereon by apparatus, appliances, equipment or otherwise is found to be detrimental or damaging to the utility or its customers, the service may be shutoff without notice. The utility will notify the customer immediately of the reasons for the discontinuance and the corrective action to be taken by the customer before service can be restored. 5. For Fraudulent Use of Service When the utility has discovered that a customer has obtained service by fraudulent means, or has diverted the water service for unauthorized use, the service to that customer may be discontinued without notice. The utility will not restore service to such customer until that customer has complied with all filed rules and reasonable requirements of the utility and the utility has been reimbursed for the full amount of the service rendered and the actual cost to the utility incurred by reason of the fraudulent use. C. Restoration of Service 1. Reconnection Charge Where service has been discontinued for violation of these rules or for nonpayment of bills, the utility may charge $25.00 for reconnection of service during regular working hours or $37.50 (I) for reconnection of service at other than regular working hours when the customer has requested that the reconnection be made at other than regular working hours.
(Continued)
SOUTHERN CALIFORNIA WATER COMPANY Revised Cal. P.U.C. Sheet No. 3750-W 630 E. FOOTHILL BLVD. - P. O. BOX 9016 SAN DIMAS, CALIFORNIA 91773-9016 Canceling Original Cal. P.U.C. Sheet No. _3080-W
ISSUED BY Date Filed July 29, 1993
Advice Letter No. 925-W F. E. WICKS Effective Date September 7, 1993
Decision No. President Resolution No. W 3770
Page 9 of 10
Rule No. 11
(Continued) DISCONTINUANCE AND RESTORATION OF SERVICE
C. Restoration of Service (Continued) 2. To be Made During Regular Working Hours The utility will endeavor to make reconnections during regular working hours on the day of the request, if the conditions permit; otherwise reconnections will be made on the regular working day following the day the request is made. 3. To Be Made at Other Than Regular Working Hours When a customer has requested that the reconnection be made at other than regular working hours, the utility will reasonably endeavor to so make the reconnection if practicable under the circumstances. 4. Wrongful Discontinuance A service wrongfully discontinued by the utility, must be restored without charge for the restoration to the customer within 24 hours. D. Refusal to Serve 1 Conditions for Refusal The utility may refuse to serve an applicant for service under the following conditions: a. If the applicant fails to comply with any of the rules as filed with the Public Utilities Commission. b. If the intended use of the service is of such a nature that it will be detrimental or injurious to existing customers. c. If, in the judgment of the utility, the applicant’s installation for utilizing the service is unsafe or hazardous, or of such nature that satisfactory service cannot be rendered.
(Continued)
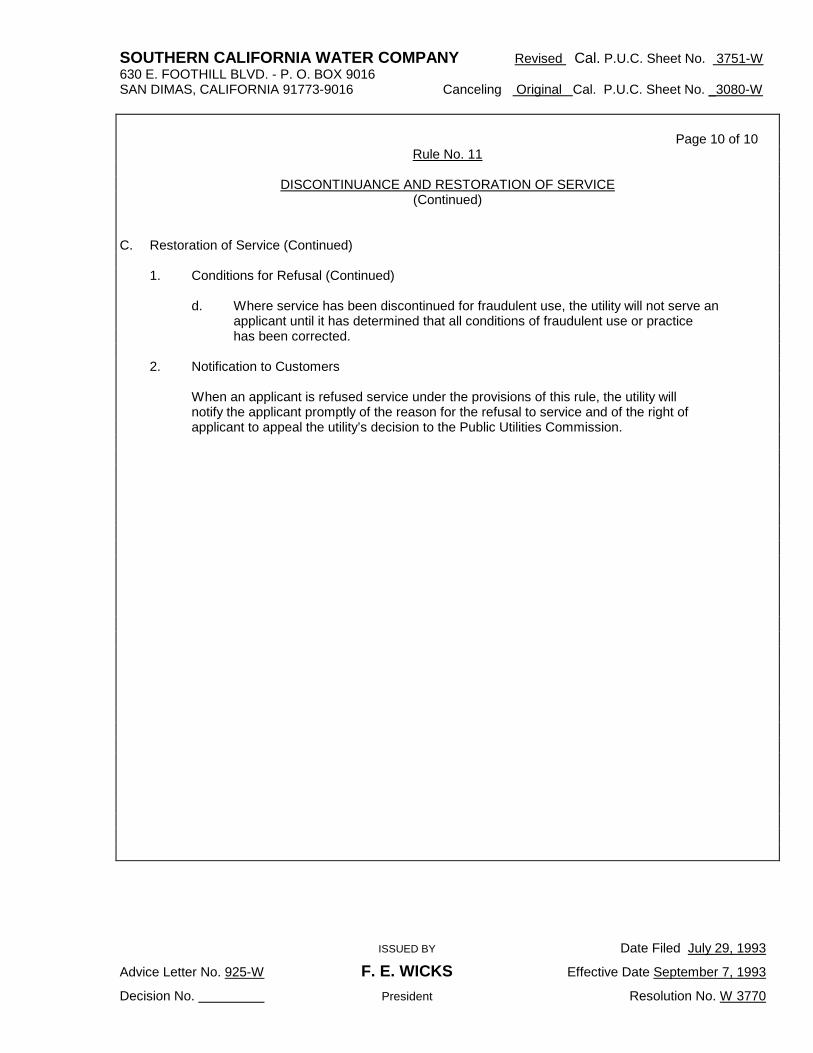
SOUTHERN CALIFORNIA WATER COMPANY Revised Cal. P.U.C. Sheet No. 3751-W 630 E. FOOTHILL BLVD. - P. O. BOX 9016 SAN DIMAS, CALIFORNIA 91773-9016 Canceling Original Cal. P.U.C. Sheet No. _3080-W
ISSUED BY Date Filed July 29, 1993
Advice Letter No. 925-W F. E. WICKS Effective Date September 7, 1993
Decision No. President Resolution No. W 3770
Page 10 of 10
Rule No. 11
(Continued) DISCONTINUANCE AND RESTORATION OF SERVICE
C. Restoration of Service (Continued) 1. Conditions for Refusal (Continued) d. Where service has been discontinued for fraudulent use, the utility will not serve an applicant until it has determined that all conditions of fraudulent use or practice has been corrected. 2. Notification to Customers When an applicant is refused service under the provisions of this rule, the utility will notify the applicant promptly of the reason for the refusal to service and of the right of applicant to appeal the utility’s decision to the Public Utilities Commission.
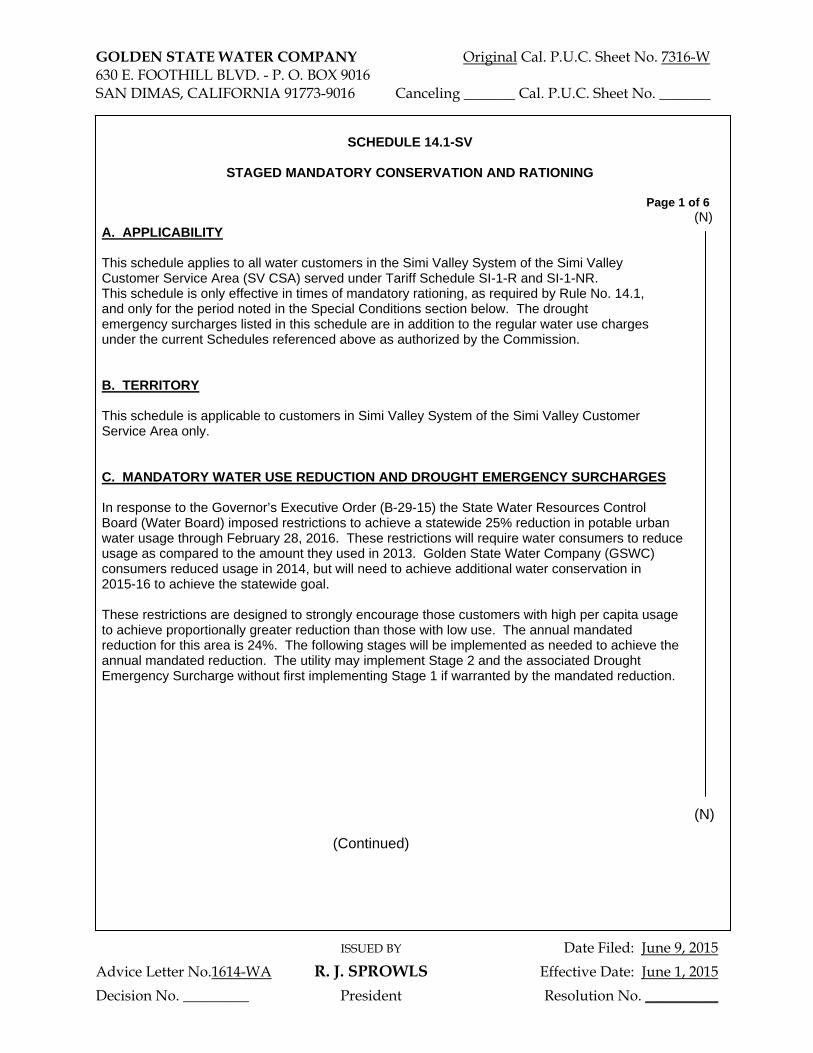
GOLDEN STATE WATER COMPANY Original Cal. P.U.C. Sheet No. 7316-W 630 E. FOOTHILL BLVD. - P. O. BOX 9016 SAN DIMAS, CALIFORNIA 91773-9016 Canceling _______ Cal. P.U.C. Sheet No. _______
ISSUED BY Date Filed: June 9, 2015
Advice Letter No.1614-WA R. J. SPROWLS Effective Date: June 1, 2015
Decision No. _________ President Resolution No. __________
SCHEDULE 14.1-SV
STAGED MANDATORY CONSERVATION AND RATIONING
Page 1 of 6 (N) A. APPLICABILITY This schedule applies to all water customers in the Simi Valley System of the Simi Valley Customer Service Area (SV CSA) served under Tariff Schedule SI-1-R and SI-1-NR. This schedule is only effective in times of mandatory rationing, as required by Rule No. 14.1, and only for the period noted in the Special Conditions section below. The drought emergency surcharges listed in this schedule are in addition to the regular water use charges under the current Schedules referenced above as authorized by the Commission. B. TERRITORY This schedule is applicable to customers in Simi Valley System of the Simi Valley Customer Service Area only. C. MANDATORY WATER USE REDUCTION AND DROUGHT EMERGENCY SURCHARGES In response to the Governor’s Executive Order (B-29-15) the State Water Resources Control Board (Water Board) imposed restrictions to achieve a statewide 25% reduction in potable urban water usage through February 28, 2016. These restrictions will require water consumers to reduce usage as compared to the amount they used in 2013. Golden State Water Company (GSWC) consumers reduced usage in 2014, but will need to achieve additional water conservation in 2015-16 to achieve the statewide goal. These restrictions are designed to strongly encourage those customers with high per capita usage to achieve proportionally greater reduction than those with low use. The annual mandated reduction for this area is 24%. The following stages will be implemented as needed to achieve the annual mandated reduction. The utility may implement Stage 2 and the associated Drought Emergency Surcharge without first implementing Stage 1 if warranted by the mandated reduction.
(N) (Continued)
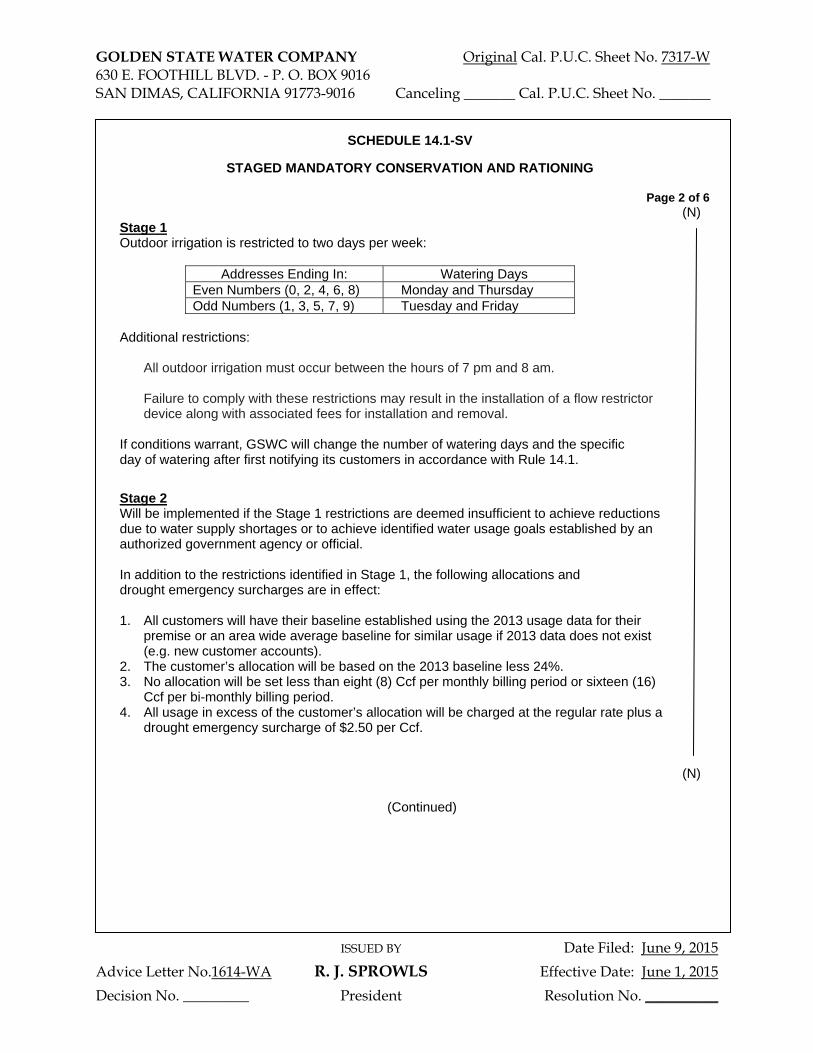
GOLDEN STATE WATER COMPANY Original Cal. P.U.C. Sheet No. 7317-W 630 E. FOOTHILL BLVD. - P. O. BOX 9016 SAN DIMAS, CALIFORNIA 91773-9016 Canceling _______ Cal. P.U.C. Sheet No. _______
ISSUED BY Date Filed: June 9, 2015
Advice Letter No.1614-WA R. J. SPROWLS Effective Date: June 1, 2015
Decision No. _________ President Resolution No. __________
SCHEDULE 14.1-SV
STAGED MANDATORY CONSERVATION AND RATIONING
Page 2 of 6 (N)
Stage 1 Outdoor irrigation is restricted to two days per week:
Addresses Ending In: Watering Days Even Numbers (0, 2, 4, 6, 8) Monday and Thursday Odd Numbers (1, 3, 5, 7, 9) Tuesday and Friday
Additional restrictions: All outdoor irrigation must occur between the hours of 7 pm and 8 am. Failure to comply with these restrictions may result in the installation of a flow restrictor device along with associated fees for installation and removal. If conditions warrant, GSWC will change the number of watering days and the specific day of watering after first notifying its customers in accordance with Rule 14.1.
Stage 2 Will be implemented if the Stage 1 restrictions are deemed insufficient to achieve reductions due to water supply shortages or to achieve identified water usage goals established by an authorized government agency or official. In addition to the restrictions identified in Stage 1, the following allocations and drought emergency surcharges are in effect: 1. All customers will have their baseline established using the 2013 usage data for their premise or an area wide average baseline for similar usage if 2013 data does not exist (e.g. new customer accounts). 2. The customer’s allocation will be based on the 2013 baseline less 24%. 3. No allocation will be set less than eight (8) Ccf per monthly billing period or sixteen (16) Ccf per bi-monthly billing period. 4. All usage in excess of the customer’s allocation will be charged at the regular rate plus a drought emergency surcharge of $2.50 per Ccf. (N)
(Continued)
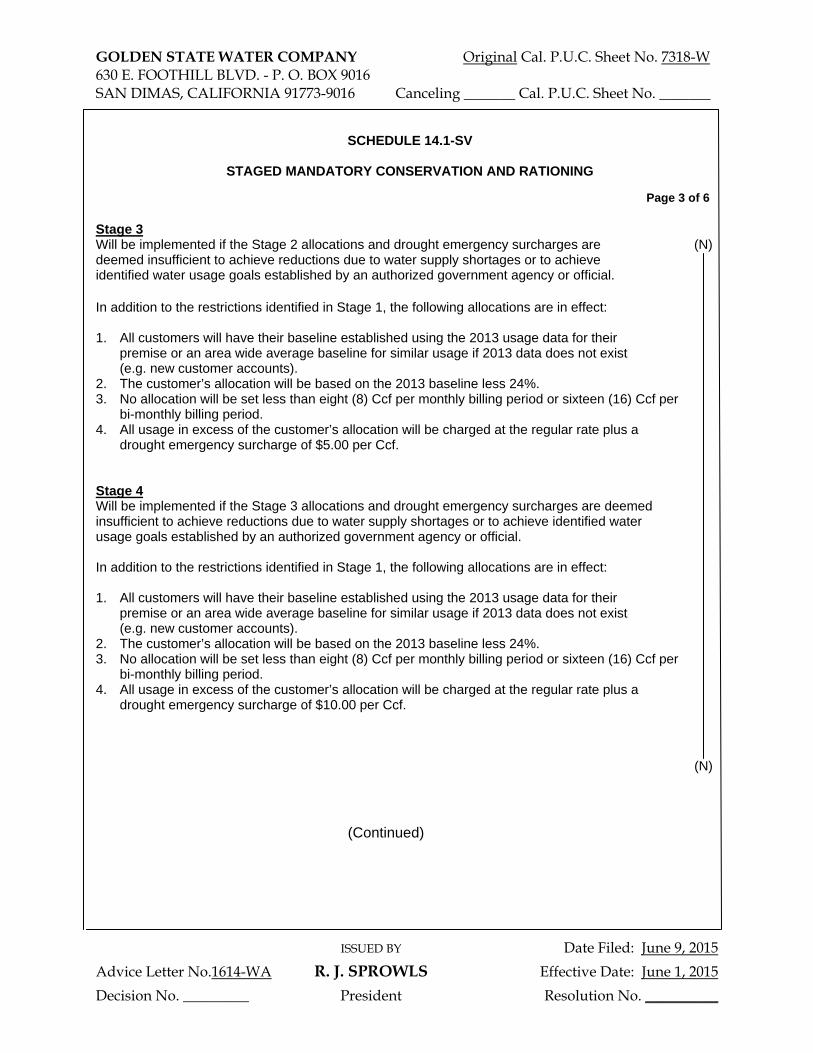
GOLDEN STATE WATER COMPANY Original Cal. P.U.C. Sheet No. 7318-W 630 E. FOOTHILL BLVD. - P. O. BOX 9016 SAN DIMAS, CALIFORNIA 91773-9016 Canceling _______ Cal. P.U.C. Sheet No. _______
ISSUED BY Date Filed: June 9, 2015
Advice Letter No.1614-WA R. J. SPROWLS Effective Date: June 1, 2015
Decision No. _________ President Resolution No. __________
SCHEDULE 14.1-SV
STAGED MANDATORY CONSERVATION AND RATIONING Page 3 of 6 Stage 3 Will be implemented if the Stage 2 allocations and drought emergency surcharges are (N) deemed insufficient to achieve reductions due to water supply shortages or to achieve identified water usage goals established by an authorized government agency or official. In addition to the restrictions identified in Stage 1, the following allocations are in effect: 1. All customers will have their baseline established using the 2013 usage data for their premise or an area wide average baseline for similar usage if 2013 data does not exist (e.g. new customer accounts). 2. The customer’s allocation will be based on the 2013 baseline less 24%. 3. No allocation will be set less than eight (8) Ccf per monthly billing period or sixteen (16) Ccf per bi-monthly billing period. 4. All usage in excess of the customer’s allocation will be charged at the regular rate plus a drought emergency surcharge of $5.00 per Ccf. Stage 4 Will be implemented if the Stage 3 allocations and drought emergency surcharges are deemed insufficient to achieve reductions due to water supply shortages or to achieve identified water usage goals established by an authorized government agency or official. In addition to the restrictions identified in Stage 1, the following allocations are in effect: 1. All customers will have their baseline established using the 2013 usage data for their premise or an area wide average baseline for similar usage if 2013 data does not exist (e.g. new customer accounts). 2. The customer’s allocation will be based on the 2013 baseline less 24%. 3. No allocation will be set less than eight (8) Ccf per monthly billing period or sixteen (16) Ccf per bi-monthly billing period. 4. All usage in excess of the customer’s allocation will be charged at the regular rate plus a drought emergency surcharge of $10.00 per Ccf. (N)
(Continued)
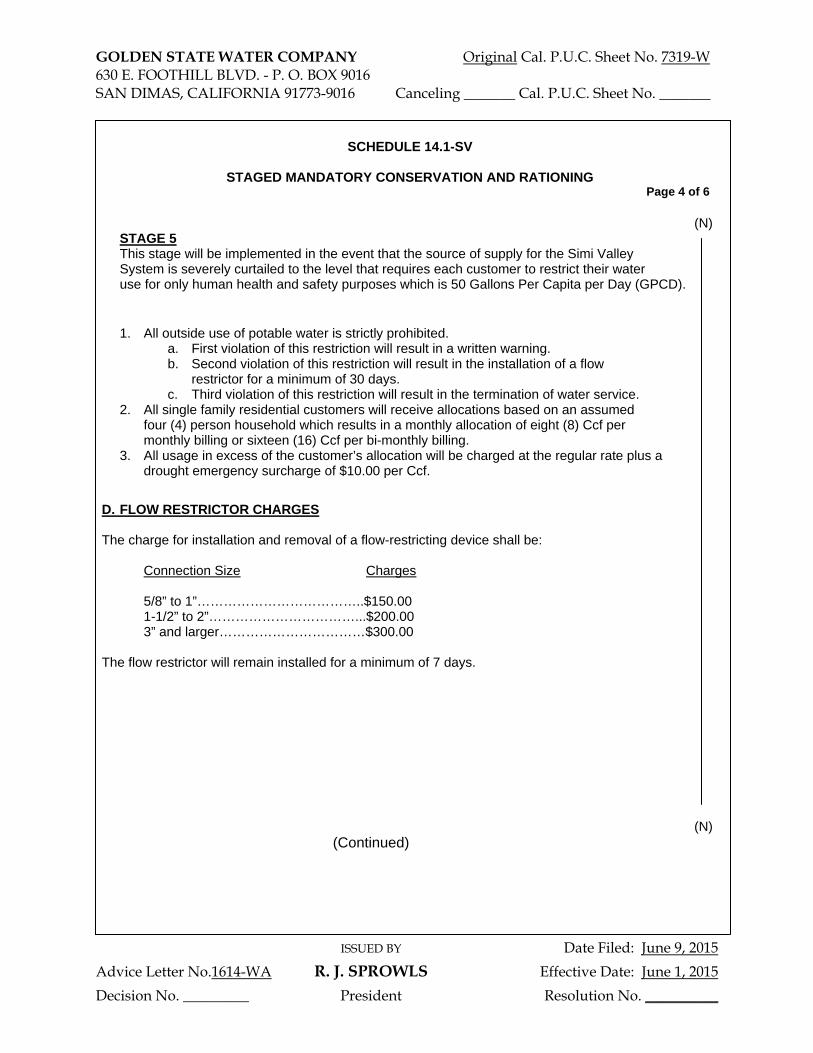
GOLDEN STATE WATER COMPANY Original Cal. P.U.C. Sheet No. 7319-W 630 E. FOOTHILL BLVD. - P. O. BOX 9016 SAN DIMAS, CALIFORNIA 91773-9016 Canceling _______ Cal. P.U.C. Sheet No. _______
ISSUED BY Date Filed: June 9, 2015
Advice Letter No.1614-WA R. J. SPROWLS Effective Date: June 1, 2015
Decision No. _________ President Resolution No. __________
SCHEDULE 14.1-SV
STAGED MANDATORY CONSERVATION AND RATIONING Page 4 of 6
(N) STAGE 5 This stage will be implemented in the event that the source of supply for the Simi Valley System is severely curtailed to the level that requires each customer to restrict their water use for only human health and safety purposes which is 50 Gallons Per Capita per Day (GPCD). 1. All outside use of potable water is strictly prohibited.
a. First violation of this restriction will result in a written warning. b. Second violation of this restriction will result in the installation of a flow restrictor for a minimum of 30 days. c. Third violation of this restriction will result in the termination of water service.
2. All single family residential customers will receive allocations based on an assumed four (4) person household which results in a monthly allocation of eight (8) Ccf per monthly billing or sixteen (16) Ccf per bi-monthly billing.
3. All usage in excess of the customer’s allocation will be charged at the regular rate plus a drought emergency surcharge of $10.00 per Ccf.
D. FLOW RESTRICTOR CHARGES The charge for installation and removal of a flow-restricting device shall be: Connection Size Charges 5/8” to 1”………………………………..$150.00 1-1/2” to 2”……………………………...$200.00 3” and larger……………………………$300.00 The flow restrictor will remain installed for a minimum of 7 days.
(N)
(Continued)
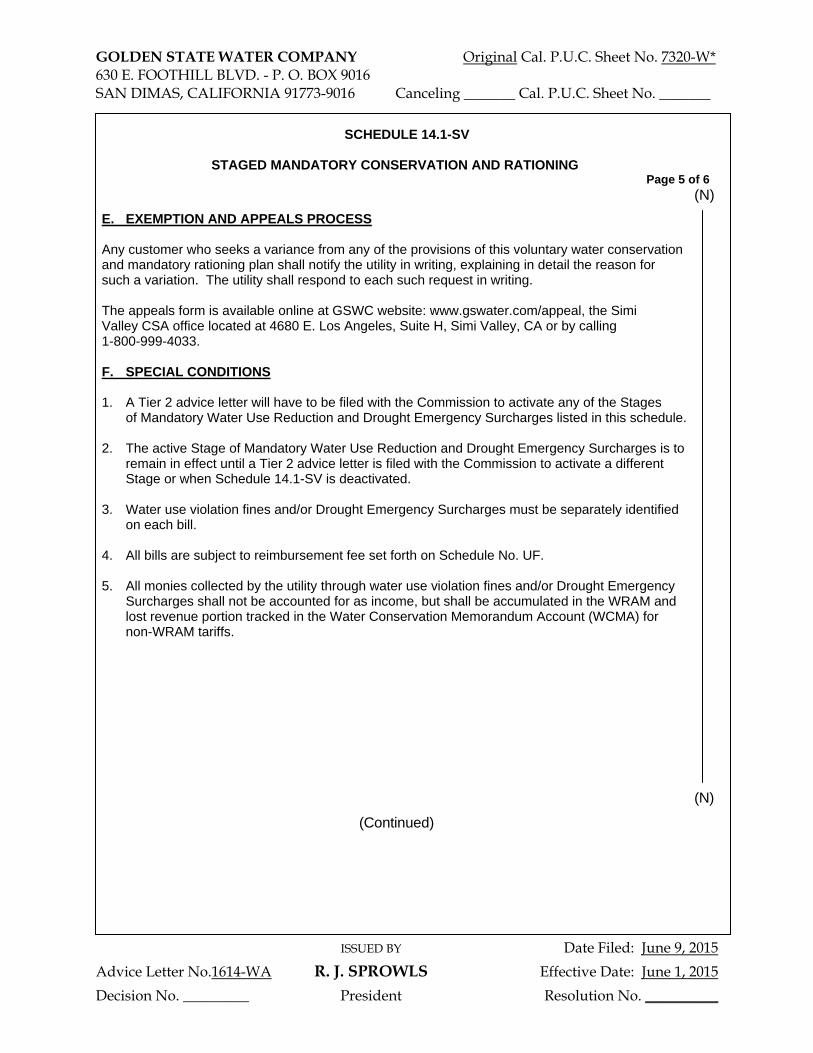
GOLDEN STATE WATER COMPANY Original Cal. P.U.C. Sheet No. 7320-W* 630 E. FOOTHILL BLVD. - P. O. BOX 9016 SAN DIMAS, CALIFORNIA 91773-9016 Canceling _______ Cal. P.U.C. Sheet No. _______
ISSUED BY Date Filed: June 9, 2015
Advice Letter No.1614-WA R. J. SPROWLS Effective Date: June 1, 2015
Decision No. _________ President Resolution No. __________
SCHEDULE 14.1-SV
STAGED MANDATORY CONSERVATION AND RATIONING Page 5 of 6 (N) E. EXEMPTION AND APPEALS PROCESS Any customer who seeks a variance from any of the provisions of this voluntary water conservation and mandatory rationing plan shall notify the utility in writing, explaining in detail the reason for such a variation. The utility shall respond to each such request in writing. The appeals form is available online at GSWC website: www.gswater.com/appeal, the Simi Valley CSA office located at 4680 E. Los Angeles, Suite H, Simi Valley, CA or by calling 1-800-999-4033. F. SPECIAL CONDITIONS 1. A Tier 2 advice letter will have to be filed with the Commission to activate any of the Stages of Mandatory Water Use Reduction and Drought Emergency Surcharges listed in this schedule. 2. The active Stage of Mandatory Water Use Reduction and Drought Emergency Surcharges is to remain in effect until a Tier 2 advice letter is filed with the Commission to activate a different Stage or when Schedule 14.1-SV is deactivated. 3. Water use violation fines and/or Drought Emergency Surcharges must be separately identified on each bill. 4. All bills are subject to reimbursement fee set forth on Schedule No. UF. 5. All monies collected by the utility through water use violation fines and/or Drought Emergency Surcharges shall not be accounted for as income, but shall be accumulated in the WRAM and lost revenue portion tracked in the Water Conservation Memorandum Account (WCMA) for non-WRAM tariffs.
(N)
(Continued)
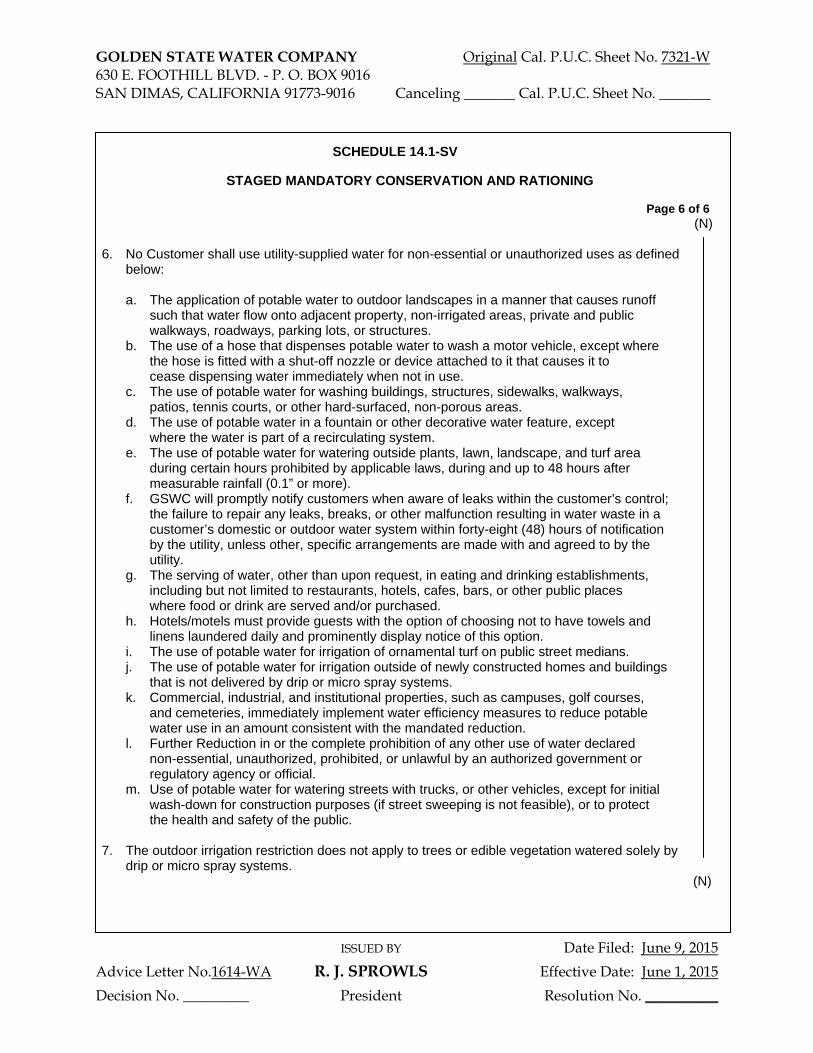
GOLDEN STATE WATER COMPANY Original Cal. P.U.C. Sheet No. 7321-W 630 E. FOOTHILL BLVD. - P. O. BOX 9016 SAN DIMAS, CALIFORNIA 91773-9016 Canceling _______ Cal. P.U.C. Sheet No. _______
ISSUED BY Date Filed: June 9, 2015
Advice Letter No.1614-WA R. J. SPROWLS Effective Date: June 1, 2015
Decision No. _________ President Resolution No. __________
SCHEDULE 14.1-SV
STAGED MANDATORY CONSERVATION AND RATIONING Page 6 of 6 (N) 6. No Customer shall use utility-supplied water for non-essential or unauthorized uses as defined below:
a. The application of potable water to outdoor landscapes in a manner that causes runoff such that water flow onto adjacent property, non-irrigated areas, private and public walkways, roadways, parking lots, or structures. b. The use of a hose that dispenses potable water to wash a motor vehicle, except where the hose is fitted with a shut-off nozzle or device attached to it that causes it to cease dispensing water immediately when not in use. c. The use of potable water for washing buildings, structures, sidewalks, walkways, patios, tennis courts, or other hard-surfaced, non-porous areas. d. The use of potable water in a fountain or other decorative water feature, except where the water is part of a recirculating system. e. The use of potable water for watering outside plants, lawn, landscape, and turf area during certain hours prohibited by applicable laws, during and up to 48 hours after measurable rainfall (0.1” or more). f. GSWC will promptly notify customers when aware of leaks within the customer’s control; the failure to repair any leaks, breaks, or other malfunction resulting in water waste in a customer’s domestic or outdoor water system within forty-eight (48) hours of notification by the utility, unless other, specific arrangements are made with and agreed to by the utility. g. The serving of water, other than upon request, in eating and drinking establishments, including but not limited to restaurants, hotels, cafes, bars, or other public places where food or drink are served and/or purchased. h. Hotels/motels must provide guests with the option of choosing not to have towels and linens laundered daily and prominently display notice of this option. i. The use of potable water for irrigation of ornamental turf on public street medians. j. The use of potable water for irrigation outside of newly constructed homes and buildings that is not delivered by drip or micro spray systems. k. Commercial, industrial, and institutional properties, such as campuses, golf courses, and cemeteries, immediately implement water efficiency measures to reduce potable water use in an amount consistent with the mandated reduction. l. Further Reduction in or the complete prohibition of any other use of water declared non-essential, unauthorized, prohibited, or unlawful by an authorized government or regulatory agency or official. m. Use of potable water for watering streets with trucks, or other vehicles, except for initial wash-down for construction purposes (if street sweeping is not feasible), or to protect the health and safety of the public.
7. The outdoor irrigation restriction does not apply to trees or edible vegetation watered solely by drip or micro spray systems. (N)
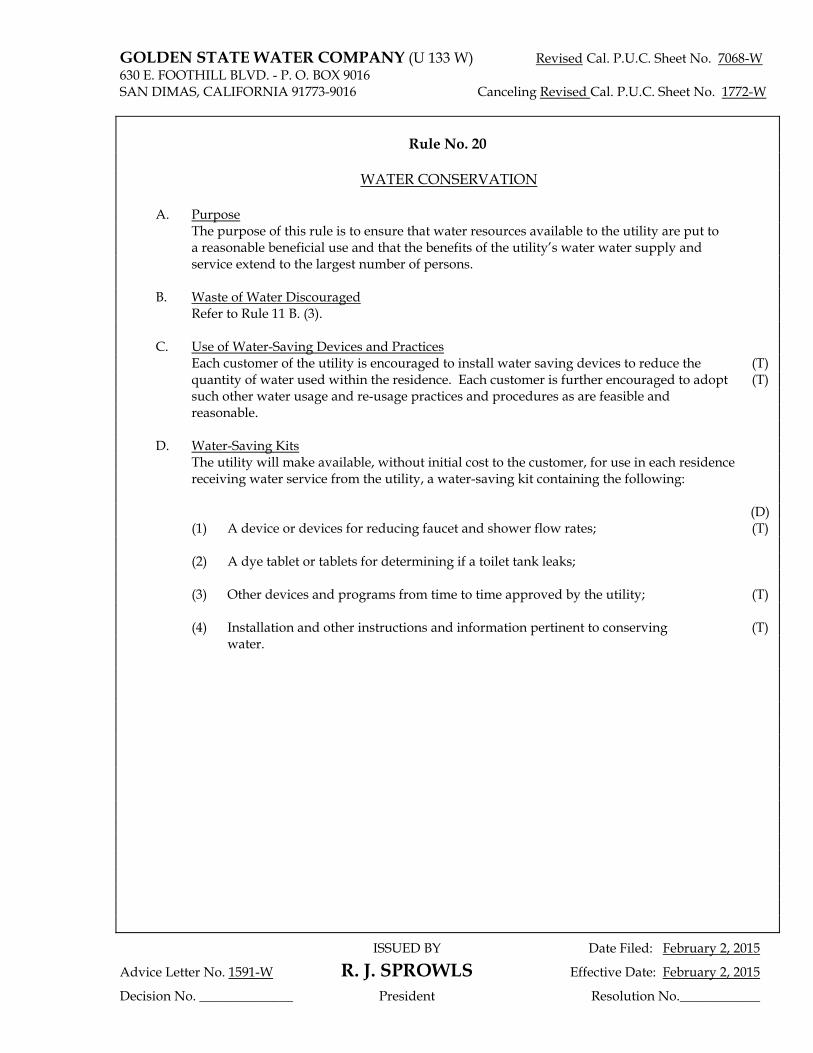
GOLDEN STATE WATER COMPANY (U 133 W) Revised Cal. P.U.C. Sheet No. 7068-W 630 E. FOOTHILL BLVD. - P. O. BOX 9016 SAN DIMAS, CALIFORNIA 91773-9016 Canceling Revised Cal. P.U.C. Sheet No. 1772-W
ISSUED BY Date Filed: February 2, 2015
Advice Letter No. 1591-W R. J. SPROWLS Effective Date: February 2, 2015
Decision No. ______________ President Resolution No.____________
Rule No. 20
WATER CONSERVATION
A. Purpose The purpose of this rule is to ensure that water resources available to the utility are put to a reasonable beneficial use and that the benefits of the utility’s water water supply and service extend to the largest number of persons. B. Waste of Water Discouraged Refer to Rule 11 B. (3). C. Use of Water-Saving Devices and Practices Each customer of the utility is encouraged to install water saving devices to reduce the (T) quantity of water used within the residence. Each customer is further encouraged to adopt (T) such other water usage and re-usage practices and procedures as are feasible and reasonable. D. Water-Saving Kits The utility will make available, without initial cost to the customer, for use in each residence receiving water service from the utility, a water-saving kit containing the following: (D) (1) A device or devices for reducing faucet and shower flow rates; (T) (2) A dye tablet or tablets for determining if a toilet tank leaks; (3) Other devices and programs from time to time approved by the utility; (T) (4) Installation and other instructions and information pertinent to conserving (T) water.

Appendix G
Public Hearing Notice, Notifications, and Meeting Minutes (To be incorporated into the Final UWMP)
630 E. Foothill Blvd. San Dimas, California 91773 (909) 394-3600
March 1, 2016
Eric Levitt City Manager City of Simi Valley 2929 Tapo Canyon Road Simi Valley, CA 93065
Subject: Golden State Water Company - Simi Valley System 2015 Urban Water Management Plan Preparation Notification and Information Request K/J 1570027*00
Dear Eric Levitt:
Golden State Water Company (GSWC) is currently in the process of preparing its 2015 Urban Water Management Plan (UWMP) for the Simi Valley system as required by State of California Law through the Urban Water Management Planning Act. The UWMP Act requires that Urban Water Retailers document water supply, reliability and other issues through the year 2040. This letter is provided as your official notice of UWMP preparation and request for information since your agency has governmental jurisdiction, possibly including land use planning over the Simi Valley system area. The UWMP process is intended to be a collaborative effort between all project stakeholders to the extent practicable.
Please review the enclosed figure showing the Simi Valley system service area and advise whether there are any issues that should be considered by GSWC in preparation of this UWMP. Items for consideration may include land developments anticipated between 2015 and 2040 within or immediately adjacent to the water system. Please also provide any pertinent supporting documentation. We will be happy to provide you with an electronic copy of the 2010 UWMP at your request.
We appreciate timely attention to the information requested above and ask you to provide a response no later than 18 March 2016. Kennedy/Jenks Consultants is preparing the UWMP under contract with GSWC and will be contacting you directly within the next few weeks to follow up on this request. In the meantime, should you have any questions or concerns please feel free to contact Mike Downey with Kennedy/Jenks Consultants at [email protected] or (916) 858-2700.
Very truly yours,
GOLDEN STATE WATER COMPANY
Robert R. McVicker, P.E., D.WRE Planning Manager
Enclosure

630 E. Foothill Blvd. San Dimas, California 91773 (909) 394-3600
March 1, 2016 Kim Prillhart Planning Director County of Ventura 800 South Victoria Avenue Ventura, CA 93009
Subject: Golden State Water Company - Simi Valley System 2015 Urban Water Management Plan Preparation Notification and Information Request
K/J 1570027*00
Dear Kim Prillhart:
Golden State Water Company (GSWC) is currently in the process of preparing its 2015 Urban Water Management Plan (UWMP) for the Simi Valley system as required by State of California Law through the Urban Water Management Planning Act. The UWMP Act requires that Urban Water Retailers document water supply, reliability and other issues through the year 2040. This letter is provided as your official notice of UWMP preparation and request for information since your agency has governmental jurisdiction, possibly including land use planning over the Simi Valley system area. The UWMP process is intended to be a collaborative effort between all project stakeholders to the extent practicable.
Please review the enclosed figure showing the Simi Valley system service area and advise whether there are any issues that should be considered by GSWC in preparation of this UWMP. Items for consideration may include land developments anticipated between 2015 and 2040 within or immediately adjacent to the water system. Please also provide any pertinent supporting documentation. We will be happy to provide you with an electronic copy of the 2010 UWMP at your request.
We appreciate timely attention to the information requested above and ask you to provide a response no later than 18 March 2016. Kennedy/Jenks Consultants is preparing the UWMP under contract with GSWC and will be contacting you directly within the next few weeks to follow up on this request. In the meantime, should you have any questions or concerns please feel free to contact Mike Downey with Kennedy/Jenks Consultants at [email protected] or (916) 858-2700.
Very truly yours,
GOLDEN STATE WATER COMPANY
Robert R. McVicker, P.E., D.WRE Planning Manager
Enclosure
Appendix H
Groundwater Basin Water Rights Stipulation/Judgment [Not Used]
Appendix I
Documentation of Submittal to Library, Cities and Counties (To be incorporated into the Final UWMP)