Embed Size (px)
Citation preview
Contents page Foreword by Member of Executive Council 2 1 SECTION 1: GENERAL INFORMATION 1.1 Submission of Annual Report to Executing Authority 3 1.2 Introduction 4 1.3 Information on Ministry 7 1.4 Mission Statement 8 1.5 Legislative mandate 8
2 SECTION 2: PROGRAMME PERFORMANCE 2.1 Voted Funds 9 2.2 Aim of Vote 9 2.3 Summary of Programmes 9 2.4 Overview of Service Delivery Environment for 2005/06 10 2.5 Overview of Organisational Environment for 2005/06 11 2.6 Strategic Overview and Key Policy Developments for 2005/06 13 2.7 Departmental Receipts 16 2.8 Departmental Payments 16 2.9 Programme Performance 16 2.9.1 Programme 1: Administration 16 2.9.2 Programme 2: Civilian Secretariat 20 2.9.3 Programme 3: Traffic Management 27 3 SECTION 3: REPORT OF AUDIT COMMITTEE 33
4 Section 4: Annual Financial Statements 5 Management Report 35
Report of Auditor General 40 Financial Statements 47
6 SECTION 5: HUMAN RESOURCE MANAGEMENT
Service Delivery 82 Personnel Expenditure 83 Employment & Vacancies 85 Employment Changes 86 Employment Equity 89 Leave utelisation 93 HIV/AIDS and Health Promotion 94 Labour Relations 95 Skills Development 96
2
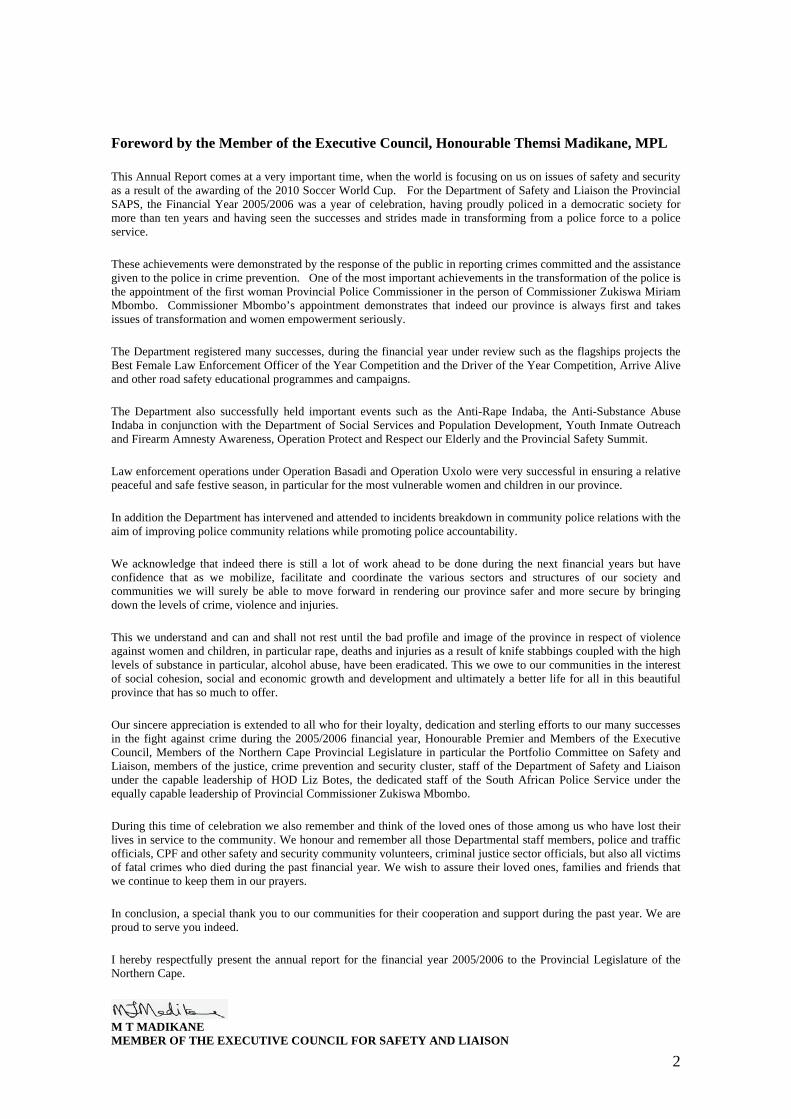
Foreword by the Member of the Executive Council, Honourable Themsi Madikane, MPL
This Annual Report comes at a very important time, when the world is focusing on us on issues of safety and security as a result of the awarding of the 2010 Soccer World Cup. For the Department of Safety and Liaison the Provincial SAPS, the Financial Year 2005/2006 was a year of celebration, having proudly policed in a democratic society for more than ten years and having seen the successes and strides made in transforming from a police force to a police service.
These achievements were demonstrated by the response of the public in reporting crimes committed and the assistance given to the police in crime prevention. One of the most important achievements in the transformation of the police is the appointment of the first woman Provincial Police Commissioner in the person of Commissioner Zukiswa Miriam Mbombo. Commissioner Mbombo’s appointment demonstrates that indeed our province is always first and takes issues of transformation and women empowerment seriously.
The Department registered many successes, during the financial year under review such as the flagships projects the Best Female Law Enforcement Officer of the Year Competition and the Driver of the Year Competition, Arrive Alive and other road safety educational programmes and campaigns.
The Department also successfully held important events such as the Anti-Rape Indaba, the Anti-Substance Abuse Indaba in conjunction with the Department of Social Services and Population Development, Youth Inmate Outreach and Firearm Amnesty Awareness, Operation Protect and Respect our Elderly and the Provincial Safety Summit.
Law enforcement operations under Operation Basadi and Operation Uxolo were very successful in ensuring a relative peaceful and safe festive season, in particular for the most vulnerable women and children in our province.
In addition the Department has intervened and attended to incidents breakdown in community police relations with the aim of improving police community relations while promoting police accountability.
We acknowledge that indeed there is still a lot of work ahead to be done during the next financial years but have confidence that as we mobilize, facilitate and coordinate the various sectors and structures of our society and communities we will surely be able to move forward in rendering our province safer and more secure by bringing down the levels of crime, violence and injuries.
This we understand and can and shall not rest until the bad profile and image of the province in respect of violence against women and children, in particular rape, deaths and injuries as a result of knife stabbings coupled with the high levels of substance in particular, alcohol abuse, have been eradicated. This we owe to our communities in the interest of social cohesion, social and economic growth and development and ultimately a better life for all in this beautiful province that has so much to offer.
Our sincere appreciation is extended to all who for their loyalty, dedication and sterling efforts to our many successes in the fight against crime during the 2005/2006 financial year, Honourable Premier and Members of the Executive Council, Members of the Northern Cape Provincial Legislature in particular the Portfolio Committee on Safety and Liaison, members of the justice, crime prevention and security cluster, staff of the Department of Safety and Liaison under the capable leadership of HOD Liz Botes, the dedicated staff of the South African Police Service under the equally capable leadership of Provincial Commissioner Zukiswa Mbombo.
During this time of celebration we also remember and think of the loved ones of those among us who have lost their lives in service to the community. We honour and remember all those Departmental staff members, police and traffic officials, CPF and other safety and security community volunteers, criminal justice sector officials, but also all victims of fatal crimes who died during the past financial year. We wish to assure their loved ones, families and friends that we continue to keep them in our prayers.
In conclusion, a special thank you to our communities for their cooperation and support during the past year. We are proud to serve you indeed.
I hereby respectfully present the annual report for the financial year 2005/2006 to the Provincial Legislature of the Northern Cape.
M T MADIKANE MEMBER OF THE EXECUTIVE COUNCIL FOR SAFETY AND LIAISON
3
SECTION 1
General Information
1.1 SUBMISSION OF THE ANNUAL REPORT TO THE EXECUTIVE AUTHORITY
To: Honourable Ms MT Madikane Member of Executive Council for Safety and Liaison Northern Cape Province SUBMISSION OF ANNUAL REPORT FOR THE FINANCIAL YEAR 01 APRIL 2005 TO 31 MARCH 2006 It is my privilege and honour to submit the Annual Report of the Department of Safety and Liaison for the accounting period 01 April 2005 to 31 March 2006.
LIZ BOTES
ACCOUNTING OFFICER DEPARTMENT OF SAFETY AND LIAISON: NORTHERN CAPE
4
1.2 INTRODUCTION BY HEAD OF DEPARTMENT The 2005/06 Annual Performance Plan articulated a new policy development in relation to the Department’s mandate, namely the reconfiguration of the Department to take over the traffic management functions to the Department from 01 April 2005. The Budget Vote was subsequently restructured into three programmes to accommodate the new functions, services and concomitant strategic policy priorities that have been introduced and added to the existing departmental strategic priorities The transfer of the traffic component was therefore to bring into the department a safety and security related function to allow growth in the budget of the Department that through re-alignment and -prioritisation would enable the Department to attain the requisite capacity levels within its historic programmes. . This report will give an account of the Department’s performance for the reporting period in relation to strategic priorities set for the MTEF and in particular the related key outputs and annual performance targets articulated in the 2005/06 Annual Performance Plan read with the Budget statement The main strategic organisational priority for the five-year term is for the Department to address the historic internal capacity problem to arrive at a situation where it is able to effectively and efficiently deliver on its core policy priorities. This strategic priority remained relevant for the reporting period since prior to 2005/06, the Department had to function and operate similarly and equally to other department with an average annual staff establishment of only 27 (Programme 1 and 2 inclusive of Head of Department, management and operational staff) and with little if any significant growth in the annual budget to fill the vacancies. The Department therefore set clear targets for itself in relation to improving its internal management and operational capacity during the 2005/06 financial year. Strategic service delivery priorities related to and directly influenced by the afore-mentioned organisational priority was the deepening and intensification of output and impact in relation to departmental line functions, i.e. crime prevention and community police relations: police performance monitoring and oversight as well as traffic management (road safety, licensing and law administration and revenue collection). Highlights of Achievements Organisational A once off massive increase came about as a result of the transfer of the traffic function to the Department of Safety & Liaison as of 01 April 2005. This enabled the Department to acquire the human resources so desperately needed, a development that obviously had a positive effect and impact on the overall departmental service delivery, labour practices as well as governance and administration.
Monitoring Oversight and Quality Assurance A significant increase in oversight visits to stations. A total of 126 Performance assessment & Accountability visits and meetings were conducted with SAPS provincial & area components and Stations (CPF’s & communities involved in some of these meetings) Crime Prevention and Community Police Relations The Department managed to develop, coordinate and report on an integrated Programme of Action for 2005/06 aimed at reducing levels of crime in the province.
5
Regional Community Safety Forums have been established in all regions and were trained in coordination of local safety.
42 Community Volunteers have been appointed, trained and deployed at the 21 provincial crime weight stations to assist and manage Traffic Management The Department managed the transfer and merger with the traffic component with as little as possible disruption in service delivery. Other strategic activities coordinated by the Department that relate to Governance and Administration and Provincial Programme of Action Provincial Justice, Crime Prevention and Security Cluster (JCPS) The Department also continued to coordinate the Provincial Justice Crime Prevention & Security (JCPS) Cluster that held 7 meetings of which one was a strategic planning session on deliverables and aligning priorities to Government’s Programme of Action. Upholding and improving Provincial Security and Security of Government Institutions and fighting Corruption In view of the Local Government Elections that were to be held during the 2005/06 financial year the Department coordinated a special Task Team on Security of Local Elections that met regularly to discuss and assess the security situation in the run-up to the elections and decided on appropriate responses in that regard. This strategy and approach to the elections proved to be successful in that the threats and risks could be identified and mitigated, the police could also adequately respond to incidents of election-related public violence, etc and the local elections in the province were relatively incident free. PUBLICATIONS & KEY DOCUMENTS
The department issued the following documents aimed at disclosing departmental plans and actual performance during the reporting period.
• Annual Report for 2004/05
• Annual Performance Plan for 2005/06 PRESENTATIONS AND BRIEFINGS The following are some of the key documented management presentations made during the period of reporting to the various Legislature and Executive Council Committees Portfolio Committee on Safety & Liaison and Public Accounts (SCOPA) • Presentation of Departmental Strategic Plan 2004 – 2009 and in particular the Annual
Performance and Operational Plans and Budget for 2005/06 on 17 May 2005 • Presentation of Departmental Annual Report for 2004/05 on 18 November 2005 Provincial Medium Term Expenditure Committee (PMTEC) • Presentation of 2006/07 Departmental Strategic Priorities and Budget to Treasury Officials
on 19 September 2005 and for purposes of Budget Bilateral with MEC for Finance on 20 October 2006.
Executive Council and Clusters The Department prepared and submitted memorandums and progress reports on
6
• Building and opening of police stations and related criminal justice infrastructure August, October, 2005 and January 2006
• Situation Report on Gangsterism threat (Oceans eleven) – September 2005 • Progress Report on Northern Cape Justice Crime Prevention and Security Cluster
Programme of Action – October 2005 • Anti-Rape Indaba – November 2005 • National Driver of the Year Competition – March 2006 • Security of Local Government Elections – June & July 2005 In conclusion, as Accounting Officer I am humbled to account on behalf of the Department, who I believe responded and reacted well within the context of the opportunities issues, challenges and service delivery demands presented by both the internal and external environments. I therefore wish to express my profound appreciation for the guidance and support received from the Member of Executive Council, Ms Themsi Madikane, Cluster Departments as well as all other partners who have contributed towards the outputs and impact of the Department, especially in relation to improvement of safety and security in the province. Special acknowledgement to the Office of the Auditor-General, whose approach to the auditing function continues to add value and contribute towards the overall improvement of effectiveness and efficiency in relation to corporate governance within the department. Lastly, but most importantly, my most humble and sincere appreciation to those dedicated colleagues, those managers, operational and support staff who are the delivery vehicles, the rain makers in the Department of Safety and Liaison who can never be compensated for their outstanding commitment, positive “Batho Pele” spirit and attitude in ensuring that the department continues to deliver on it mandate despite its limited resources and constraints. It is my humble belief that their exemplary conduct, attitude and approach in performing their duties indeed go a long way towards inspiring others who in the words of our honourable President “come to work as late as they possibly can, do as little as they possibly can and leave work as early as they possibly can” and are forever complaining, and blaming.
Liz Botes Accounting Officer Department of Safety and Liaison: Northern Cape
7
1.3 INFORMATION ON THE MINISTRY
The Department operated under the direction and guidance of and reported to Ms MT Madikane, Member of Executive Council for Safety and Liaison during the reporting period. The Member of Executive Council was supported by a Ministerial staff complement of five staff members who were mainly responsible for ministerial administrative support, executive, parliamentary, constituency/ community and media liaison and interaction. Other government departments and institutions that, although national competencies under the control of the National Minister of Safety and Security in as far as policing policy and budget are concerned, fall under the direction of and reported to the Member of Executive Council for Provincial Safety and Liaison in as far as policing functions, needs, priorities, conduct and performance in the Northern Cape are concerned are: 1. The South African Police Service: Northern Cape 2. The Independent Complaints Directorate: Northern Cape The work of the Ministry involved during the reporting period continued to revolve around oversight and giving strategic political direction in relation to legislation, policies and priorities aimed at meeting departmental aims and objectives and integrated service delivery (cooperative governance) within the context of democratic policing and police accountability as well as integrated social crime prevention and good community police relations.
8
1.4 MISSION STATEMENT
Vision A safe, secure and crime free environment for all where effective policing services are rendered.
Mission To promote effective crime prevention and safe and cost effective roads utilisation through sustainable and effective • Social crime prevention programmes • Monitoring and oversight functions • Community police partnerships • Crime prevention partnerships with related institutions on transversal issues related to crime
and policing. • Promoting safe mobility of people • Effective management of traffic in the Province 1.5 LEGISLATIVE MANDATE The Department of Safety and Liaison also known as the Provincial Secretariat for Safety and Security functions in terms of section fundamental legislative and policy framework mentioned below. • South African Police Act No.68 of 1995 • White Paper on Safety and Security (1998) • White Paper on Transformation of the Public Service (Batho Pele) • National Crime Prevention Strategy (NCPS) • White Paper on Safety and Security, 1998 • Constitution of South Africa, Act 108 of 1996 • Road Traffic Act No 93 of 1996 and Regulations • Land Transportation Act No 22 of 2003 • Criminal Procedure Act 85 of 1997 • President and Premier State of the Nation /Province Addresses • Budget Speeches of Minister/MEC for Finance and MEC for Safety & Liaison • Public Finance Management Act and Treasury Regulations • Cabinet and Executive Council Resolutions
9
SECTION 2 Programme Performance
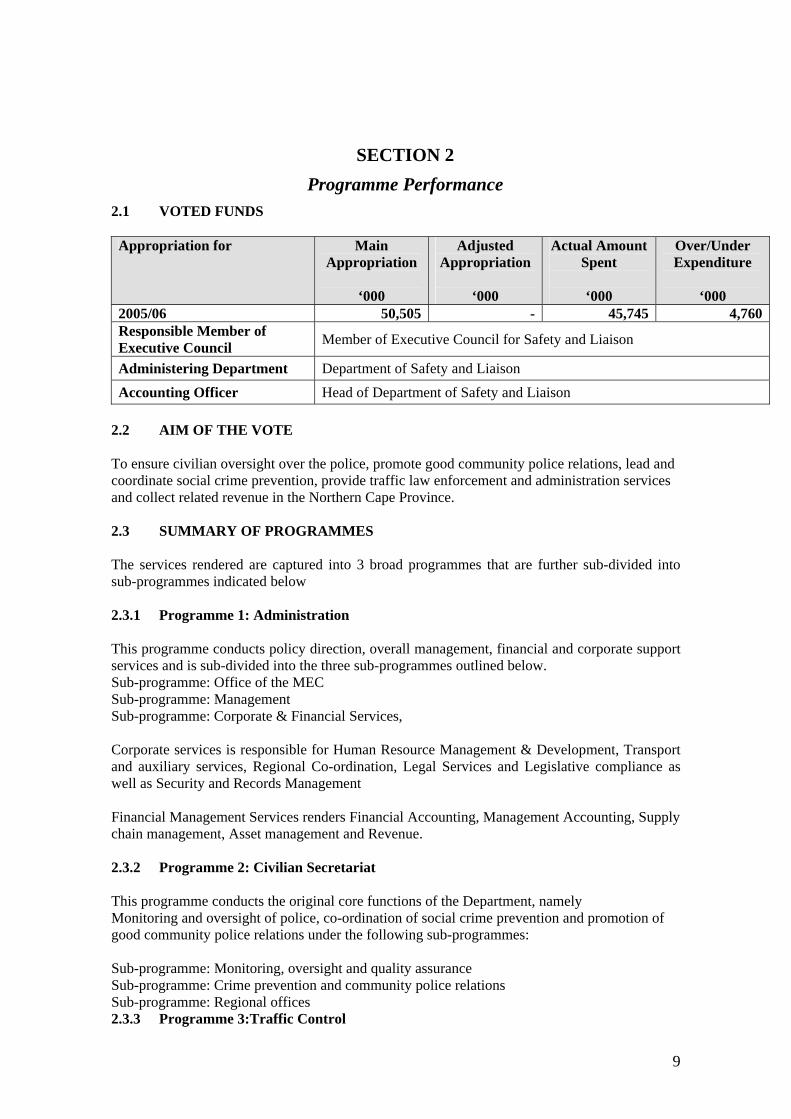
2.1 VOTED FUNDS Appropriation for Main
Appropriation
‘000
Adjusted Appropriation
‘000
Actual Amount Spent
‘000
Over/Under Expenditure
‘000
2005/06 50,505 - 45,745 4,760Responsible Member of Executive Council Member of Executive Council for Safety and Liaison
Administering Department Department of Safety and Liaison
Accounting Officer Head of Department of Safety and Liaison 2.2 AIM OF THE VOTE To ensure civilian oversight over the police, promote good community police relations, lead and coordinate social crime prevention, provide traffic law enforcement and administration services and collect related revenue in the Northern Cape Province. 2.3 SUMMARY OF PROGRAMMES The services rendered are captured into 3 broad programmes that are further sub-divided into sub-programmes indicated below 2.3.1 Programme 1: Administration This programme conducts policy direction, overall management, financial and corporate support services and is sub-divided into the three sub-programmes outlined below. Sub-programme: Office of the MEC Sub-programme: Management Sub-programme: Corporate & Financial Services, Corporate services is responsible for Human Resource Management & Development, Transport and auxiliary services, Regional Co-ordination, Legal Services and Legislative compliance as well as Security and Records Management
Financial Management Services renders Financial Accounting, Management Accounting, Supply chain management, Asset management and Revenue. 2.3.2 Programme 2: Civilian Secretariat This programme conducts the original core functions of the Department, namely Monitoring and oversight of police, co-ordination of social crime prevention and promotion of good community police relations under the following sub-programmes: Sub-programme: Monitoring, oversight and quality assurance Sub-programme: Crime prevention and community police relations Sub-programme: Regional offices 2.3.3 Programme 3:Traffic Control
10
This programme represents a new core function performed by the Department from the 2005/06 financial year. The function has been transferred from the Department of Transport, Roads and Public Works. The programme facilitates and promotes the efficient and safe mobility on roads in the province, ensures a sound information base for traffic management and implements measures to ensure compliance with road safety legislation and the mentioned main services are accordingly structured into the following sub-programmes. Sub-programme: Traffic Law Enforcement Sub-programme: Road Safety Education Sub-programme: Traffic law Administration & Licensing 2.4 OVERVIEW OF THE SERVICE DELIVERY ENVIRONMENT FOR 2005/06 The demand for and effectiveness of the services delivered by the Department of Safety and Liaison during 2005/06 was influenced by the environmental factors highlighted below. According to the police crime statistics for 2004/05 reported crime in the Northern Cape has stabilized and decreased in 66% of the crime categories. Of significance in this regard is the decrease in violent contact crimes such as murder, attempted murder, assault, including serious and indecent assault. Unfortunately though, reported rape in the province increased with 4% and the only policing area that recorded a decrease (4%) in rape is the Diamond Field Area. Statistics also indicate that rape in the Northern Cape has been consistently increasing since 2001 and compared to other provinces per 100 000 of the population, remains to be the highest. Rape in particular, but also other forms of abuse against women and children therefore remain to be serious crime problems within the Northern Cape Province. Whilst on the one hand, the increase can be regarded as positive in the sense that it could be indicative of communities and victims breaking the silence and having more confidence in the police and criminal justice system, on the other hand the reality of the matter, namely the occurrence of rape in the first place, is a negative factor and altogether unacceptable if we move from the premise that one rape is one too many. Statistics further indicate an increase in reported economic crimes like robbery, property related crime like common theft and housebreaking at residential premises as well as drug related crime and drunken driving. An increase in the latter two categories could similarly be indicative of positive action on the part of policing in terms of detection and law enforcement operations or communities providing SAPS with information on criminal activities, the negative aspect can also not be ignored namely that substance abuse in the province is on the increase, in the main as a result of the availability and accessibility of drugs and alcohol. All the above happens within an environment where poverty, unemployment and moral decay are at unacceptable levels and where competition for limited resources and even mere access to the available resources is therefore at times characterized by violence, corruption and crimes such as robbery, theft and housebreaking. Another service delivery environmental challenge relates to the increased number of vehicles on our roads (177 163) at 17% more registered vehicles during 2005/06 compared to the 151 000 for 2004/05, coupled with driver and vehicle unfitness, attitudes of road users, etc that lead to unacceptable levels of accidents and fatalities on our roads.
11
Compared to 2004/05 we have recorded a 9% increase in the number of road accidents and 36 % increase in the fatalities in the province during the reporting period, a situation that clearly puts an increased demand on traffic management services of the Department, both from enforcement and education as well as administration perspective. The service delivery environment is therefore further characteristic of insufficient commitment and dedication towards the role and responsibility of • Communities and business in changing their attitudes and taking up responsibility for their
individual and collective safety and the security of their personal belongings and environment.
• Local authorities in designing out opportunities for crime types through effective environmental design, town planning and delivery of basic municipal services e.g. street lighting, clean and safe environments, building regulations and by-laws for managing derelict and vacant premises, public disorderly behaviour e.g. drinking in public, number of and location of business premises zoned as liquor outlets, specifically taverns and shebeens within residential areas, etc.
• Government in using integrated development planning as powerful tool for effective planning around interventions and infrastructure aimed at proactive and reactive responsiveness to crime and lawlessness as well as socio-economic conditions that give rise or contribute to crime.
At a political level a new development in the external environment during the 2005/06 budget year was the disestablishment of the Cross- Boundary Municipalities and the incorporation of the Moshaweng Municipality and the Pampierstad area into the Northern Cape. This development also came with new demands and challenges for the Department from the 2006/07 financial year. 2.5 Overview o f the Organisational Environment for 2005/06 Apart from the external environmental factors mentioned above, some internal organizational factors also prevailed during the reporting period that played a role in the success or failure of the department in meeting the service delivery demands and specifically its set performance targets. The effectiveness of the Department as organization also requires the department to be effective in amongst others acquiring or procuring resources needed and managing those resources to achieve its objectives. As already mentioned in previous years’ reports the departmental strategic priority in relation to provision of a safe and secure environment is in the main to facilitate and mobilize the active and sustainable inter-sectoral, crosscutting and integrated cooperation, involvement and participation of various role-players and stakeholders within the different spheres of government, private sector and civil society in a massive holistic crime prevention effort. The department continued to position itself to play the leading role while at the same time coordinating and facilitating the active participation and involvement of various stakeholders and role-players from government, private sector and civil society. It must however be admitted that it remains a challenge to secure commitment, support and cooperation of and synergy between a whole range of people and institutions within and outside the Department. The one biggest organizational challenge that faced the Department since its inception was extreme understaffing and person power constraints. The Departmental Five Year Strategic Plan articulates this challenge as follows:
“The Department continues to be faced with severe management and administrative incapacity (qualitative & quantitative) in that that the key management structure of the Department is
12
composed of only two Senior Managers (one acting as Head of Department and the other the Chief Financial Officer) supported by three Deputy Directors, a situation that obliges all managers to function as line functionaries at the same time.”
The most significant organizational development during 2005/06 was the transfer of the traffic management function to the Department of Safety and Liaison from the Department of Transport, Roads and Public Works. As anticipated, the transfer of the traffic management function indeed enabled the Department to move significantly in respect of attaining the critical mass so desperately needed. The staff establishment of the Department grew from 27 to 207 from 01 April 2006 following the transfer of traffic and support personnel to the department. The Budget increased (nominally) by 383% with R 40,052million for 2005/06 compared to 2004/05.
Funds could be allocated for the filling of the most critical vacancies in Programmes 1 and 2 the historic Administration and Civilian Secretariat programmes of the Department The Corporate Services Directorate’s unfunded vacancy rate has effectively been reduced from 90% (28 posts) to 52% (16 posts). The Financial management Directorate’s unfunded vacancy rate has effectively been reduced from 87% (20 posts) to 35% (8 posts). The Monitoring, Oversight and Quality assurance Directorate’s unfunded vacancy rate effectively reduced from 92% (11posts) to 50% (6 posts); the Crime Prevention and Community Police Relations Directorate’s unfunded vacancy rate effectively reduced from 67% (8 posts) to 42% (5 posts) and all Civilian Secretariat Regional Offices’ unfunded vacancy rate effectively reduced from an average of 50% to 30% (3 posts). The departmental management capacity was also enhanced with two Directors (Senior Mangers) to head the Monitoring, Oversight and Quality assurance and Crime Prevention and Community Police Relations Directorates and four Assistant Directors to head the Regional Offices. Unfortunately though, attempts to attract a suitable Senior Manager to head the Corporate Services, was unsuccessful and the post could not be filled by year-end. Whilst it is clear from the above that the Department has done well in respect of acquiring human resources, the same cannot be said about other physical resources such as office accommodation and vehicles. The growth in the operational staff complement of the Department obviously placed a concomitant demand for physical resources, specifically official vehicles and office accommodation. The Department failed to acquire sufficient accommodation that would allow the filling of all the identified vacant posts approved for filling during 2005/06. The Department’s Provincial Head Office had to operate fragmented from five different premises during the year due to unavailability of suitable accommodation in the external environment. The external service provider of official transport also failed to timeously meet the demand of the Department for new operational vehicles. An obvious organisational challenge that came with the transfer of the traffic management function is the challenge attached to change specifically in relation to the management of expectations, fears and uncertainties within the department. The process of transition and adaptation to the new environment, culture and operational strategy was characterised by strained interpersonal relations, conflict and sporadic hostility. Important to mention in that regard was the organisational turbulence, compounded by the fact that it happened almost immediately after the transfer of the function to the Department, caused by closure of the National Traffic Information System (NaTIS) Helpdesk due to serious corrupt transactions and weaknesses that were prevalent since 2001. This step had a serious impact on
13
the service delivery of the Department in relation to administration of vehicle and driving licences and support to Registering Authorities. A lot of effort has gone into streamlining and addressing weaknesses in the NaTIS unit and preparing for the change to eNaTIS. The Department was further challenged by the complete lack of strategy and extensive backlogs in respect of collection of revenue generated from NaTIS functions. The Department’s strategic response to this challenge was to develop a strategy and plan that would enable the Department to effectively improve the legality and credibility of NaTIS transactions, performance of reconciliation of both NaTIS transactions and related revenue as well as collection of revenue due, starting with the year under review. Part of the Strategy was the drafting of a Service level agreement with Registering Authorities (Municipalities) and the consultation that ensued between Municipalities and the Department towards finalisation and conclusion of the agreements. Overall organisational weaknesses/ challenges at this point relate to inefficient business processes due to the lack of management information systems, policies and procedures to improve overall compliance, capacity and internal control systems to effect good governance and administration within the entire Department. 2.6 STRATEGIC OVERVIEW AND KEY POLICY DEVELOPMENTS DURING
THE 2005/06 FINANCIAL YEAR The Annual Report for 2005/06 is submitted within the context of the Department’s 2004-2009 Five-Year Strategic Plan that was developed and is being managed in accordance with the revised Treasury Regulations and Directives and is annually updated by the Department’s MTEF Strategic Plan, with specific reference to the 2005/06 Annual Performance Plan that was aimed at linking strategic and operational planning in the Department. A major policy change has come about following the reconfiguration of the department to take over the traffic management function from 01 April 2005 and the Department’s Budget Vote has been restructured from 2 to 3 programmes and new strategic policy priorities in relation to traffic management have been introduced and added to the existing departmental strategic priorities. Except for the changes related to the transfer of the traffic management function to the Department, there was no shift in the department’s historic strategic direction in relation to its vision, mission, organisational culture, policy priorities and strategic objectives as set out in the 2004 – 2009 Five-year Strategic Plan. Within the mentioned policy context, a key priority for the Department was to continue addressing its internal capacity to arrive at a situation where it is able to effectively and efficiently deliver on all its core policy priorities. 2.6.1 Address organisational challenges • The Corporate services Component was upgraded to a Directorate. • 23 posts have been filled during the past year. • Personnel strength of Corporate Services has been beefed up from 3 to 15 and Financial
Management from 3 to 14. • Legal administrative officer, labour relations officer, management accountant, financial
accountant and procurement officer are among the most important vacancies filled. • Two senior managers appointed to head Line function Directorates. Recruitment effort for
Senior Manager for Corporate Services was unsuccessful and post was re-advertised for filling in the new financial year Transversal Performance Management and Development System approved. All managers and supervisors trained.
• Bursary Policy drafted • Security Policy drafted • Risk Assessment Conducted during August 2005
14
• Transversal Supply Chain Management Policy approved • Revenue reconciliation strategy developed • Work Place Skills Plan and Training Committee established • Transport Committee established 2.6.2 Effective mobilisation of community involvement and support in the provision of
community safety and security • 340 Community members from 71 Community Policing Forums throughout the province
exposed to capacity building training from October to November 2005. • 21 CPF initiated community safety projects funded during 2005/06. 2.6.3 Strengthening the role of local government in crime prevention As reported in the previous report, the Department has commenced during the 2003/04 financial year to explore ways to establish and optimize the role of local government in local crime prevention and in particular the concept of Community Safety Forums as community safety and security coordination structures. In response to the challenges posed by the service delivery environment, the Department continued with the process of interacting with individual Local authorities both District and Category B and of establishing and launching Community Safety Forums in the remaining two Districts, after managing to establish 3 District Community Safety Forums during 2004/05. 2.6.4 Intensify efforts around integrated social crime prevention As reported in previous Annual Reports, the provincial crime prevention programme is underpinned by five integrated, inter-sectoral projects aimed at dealing with and addressing through specific activities and interventions the underlying conditions or problems that give rise to or contribute to crime. The Department of Safety and Liaison is responsible for the overall coordination, monitoring and reporting on these five projects and continued to do so during the reporting period in support of law enforcement and policing operations. This two-pronged approach to our crime problems seems to be having a positive effect on crime levels. • A major achievement was the development and reporting on a structured integrated
Programme of Action as part of the Justice, Crime Prevention and Security Cluster Programme of Action under the Cluster Priority reducing levels of crime.
• Anti-Rape and Anti-Substance Abuse Indaba held as part of integrated programme of Action • The Crime Prevention and Community Police Relations Directorate’s unfunded vacancy rate
effectively reduced from 67% (8 posts) to 42% (5 posts).•42 Community Volunteers have been appointed trained and deployed at the 21 provincial crime weight stations to assist and manage community-based social crime prevention projects together with 26 project management learners.Monitoring and oversight of the performance of the South African
Police Service
Strategic policy priorities in relation to this sub-programme revolve around effective police accountability and oversight, especially in relation to transformation of the South African Police Service in the context of: • Equality & equity, both in relation to human resources and physical resources; • Service delivery, police conduct, attitudes and paradigms • The effectiveness of police crime prevention strategies, operations and response to crime
trends and patterns with specific reference to higher levels of visibility, proactive preventative policing and successful investigations that lead to higher conviction rates.
• A key development in this regard was the implementation of a structured oversight programme through the implementation of the monitoring tool.
• The Monitoring, Oversight and Quality assurance Directorate’s unfunded vacancy rate effectively reduced from 92% (11posts) to 50% (6 posts).
15
• 126 Performance assessment & Accountability meetings held with SAPS provincial & area components and Stations (CPF’s & communities involved in some of these meetings)
2.6.6 Strengthening and capacitating of regional offices • Four Assistant Directors (Siyanda, Frances Baard, Pixley Ka Seme and Namakwa)
appointed to head Regional Offices • Five additional Field Officers (2 Frances Baard, 1 Siyanda, 1 Namkwa and 1Kgalagadi) appointed 2.6.6 Promoting traffic law enforcement and road safety as important components and
elements of safer communities • 12 Officials appointed within traffic component (NaTIS, Road Safety, Inspectorate etc) • 30 Student traffic officers recruited and commenced with training in January 2006. • Plans being finalised for opening of traffic station in Jan Kempdorp, Phokwane Municipality
during 2006/07. • NaTIS Helpdesk revamped, new officials appointed and trained, operations manual for
Registering Authorities developed. • e-NaTIS Training centre established and equipment installed. 12 Helpdesk and Registering
Authorities staff trained as e-NaTIS Trainers • Traffic Inspectorate established and staff appointed. • Draft Service Level Agreement with Registering Authorities circulated and in process of
being concluded 2.6.7 Expanded Public Works Programme
The Expanded Public Works Programme remains a key transversal policy priority in responding to the service delivery environment, specifically in respect of fighting poverty and unemployment. Department enlisted • 42 Community Safety Volunteers as part of the Expanded Public Works programme to
initiate and coordinate community safety programmes within the provincial 21 crime weight precincts.
• 25 Learnerships in the following learning areas o Project Management – 19 o Public Finance – 3 o Office Administration - 6
16
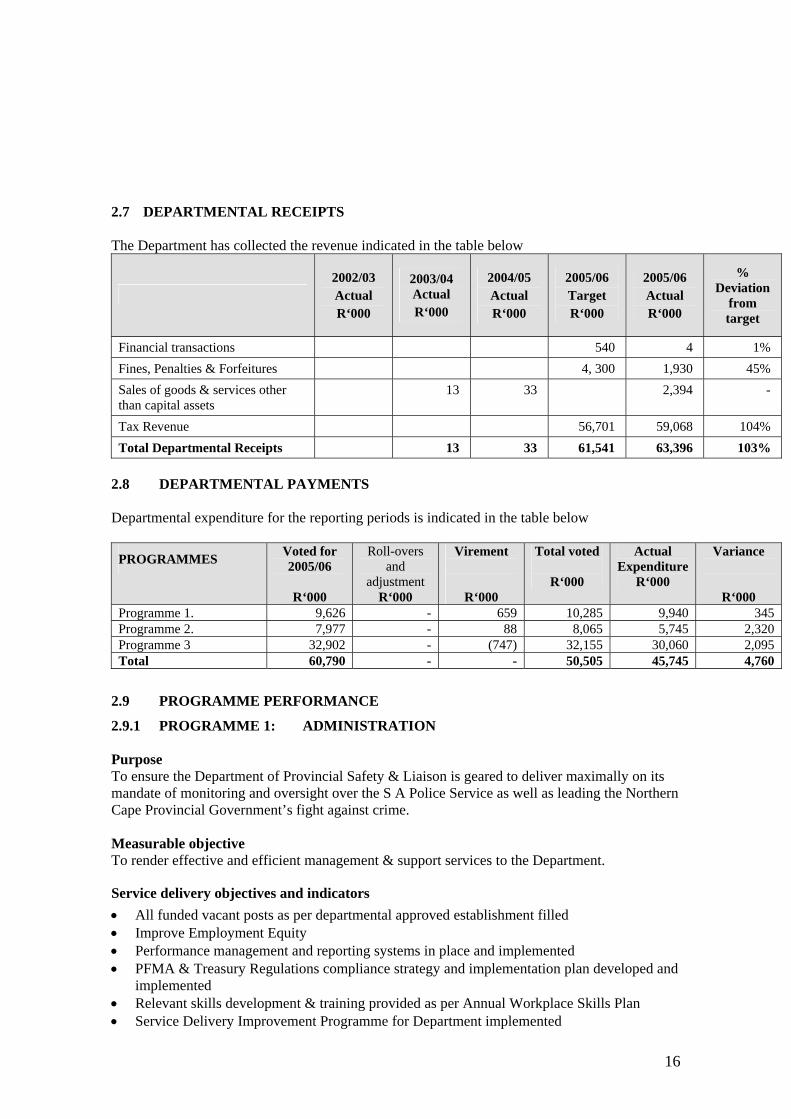
2.7 DEPARTMENTAL RECEIPTS The Department has collected the revenue indicated in the table below
2002/03 Actual R‘000
2003/04 Actual R‘000
2004/05 Actual R‘000
2005/06 Target R‘000
2005/06 Actual R‘000
% Deviation
from target
Financial transactions 540 4 1% Fines, Penalties & Forfeitures 4, 300 1,930 45% Sales of goods & services other than capital assets
13 33 2,394 -
Tax Revenue 56,701 59,068 104% Total Departmental Receipts 13 33 61,541 63,396 103%
2.8 DEPARTMENTAL PAYMENTS Departmental expenditure for the reporting periods is indicated in the table below
PROGRAMMES Voted for 2005/06
R‘000
Roll-overs and
adjustment R‘000
Virement
R‘000
Total voted
R‘000
Actual Expenditure
R‘000
Variance
R‘000 Programme 1. 9,626 - 659 10,285 9,940 345 Programme 2. 7,977 - 88 8,065 5,745 2,320 Programme 3 32,902 - (747) 32,155 30,060 2,095 Total 60,790 - - 50,505 45,745 4,760
2.9 PROGRAMME PERFORMANCE
2.9.1 PROGRAMME 1: ADMINISTRATION Purpose To ensure the Department of Provincial Safety & Liaison is geared to deliver maximally on its mandate of monitoring and oversight over the S A Police Service as well as leading the Northern Cape Provincial Government’s fight against crime. Measurable objective To render effective and efficient management & support services to the Department.
Service delivery objectives and indicators • All funded vacant posts as per departmental approved establishment filled • Improve Employment Equity • Performance management and reporting systems in place and implemented • PFMA & Treasury Regulations compliance strategy and implementation plan developed and
implemented • Relevant skills development & training provided as per Annual Workplace Skills Plan • Service Delivery Improvement Programme for Department implemented
17
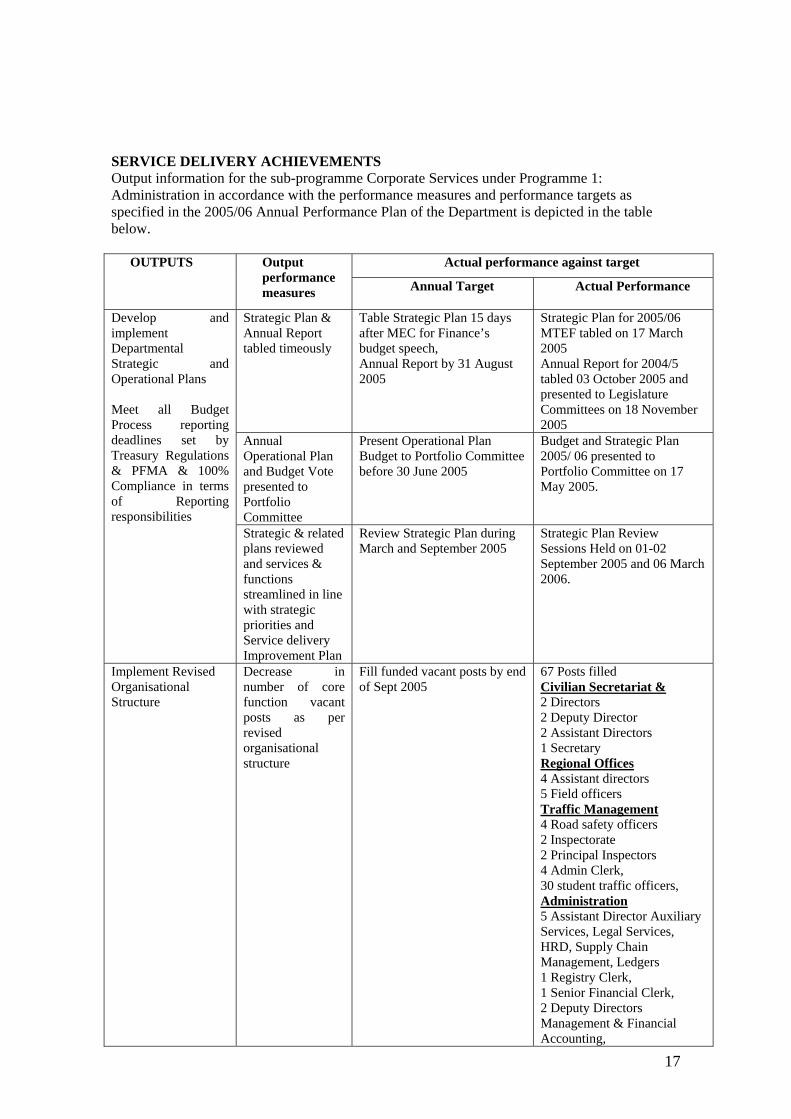
SERVICE DELIVERY ACHIEVEMENTS Output information for the sub-programme Corporate Services under Programme 1: Administration in accordance with the performance measures and performance targets as specified in the 2005/06 Annual Performance Plan of the Department is depicted in the table below.
Actual performance against target OUTPUTS Output
performance measures Annual Target Actual Performance
Strategic Plan & Annual Report tabled timeously
Table Strategic Plan 15 days after MEC for Finance’s budget speech, Annual Report by 31 August 2005
Strategic Plan for 2005/06 MTEF tabled on 17 March 2005 Annual Report for 2004/5 tabled 03 October 2005 and presented to Legislature Committees on 18 November 2005
Annual Operational Plan and Budget Vote presented to Portfolio Committee
Present Operational Plan Budget to Portfolio Committee before 30 June 2005
Budget and Strategic Plan 2005/ 06 presented to Portfolio Committee on 17 May 2005.
Develop and implement Departmental Strategic and Operational Plans Meet all Budget Process reporting deadlines set by Treasury Regulations & PFMA & 100% Compliance in terms of Reporting responsibilities Strategic & related
plans reviewed and services & functions streamlined in line with strategic priorities and Service delivery Improvement Plan
Review Strategic Plan during March and September 2005
Strategic Plan Review Sessions Held on 01-02 September 2005 and 06 March 2006.
Implement Revised Organisational Structure
Decrease in number of core function vacant posts as per revised organisational structure
Fill funded vacant posts by end of Sept 2005
67 Posts filled Civilian Secretariat & 2 Directors 2 Deputy Director 2 Assistant Directors 1 Secretary Regional Offices 4 Assistant directors 5 Field officers Traffic Management 4 Road safety officers 2 Inspectorate 2 Principal Inspectors 4 Admin Clerk, 30 student traffic officers, Administration 5 Assistant Director Auxiliary Services, Legal Services, HRD, Supply Chain Management, Ledgers 1 Registry Clerk, 1 Senior Financial Clerk, 2 Deputy Directors Management & Financial Accounting,
18
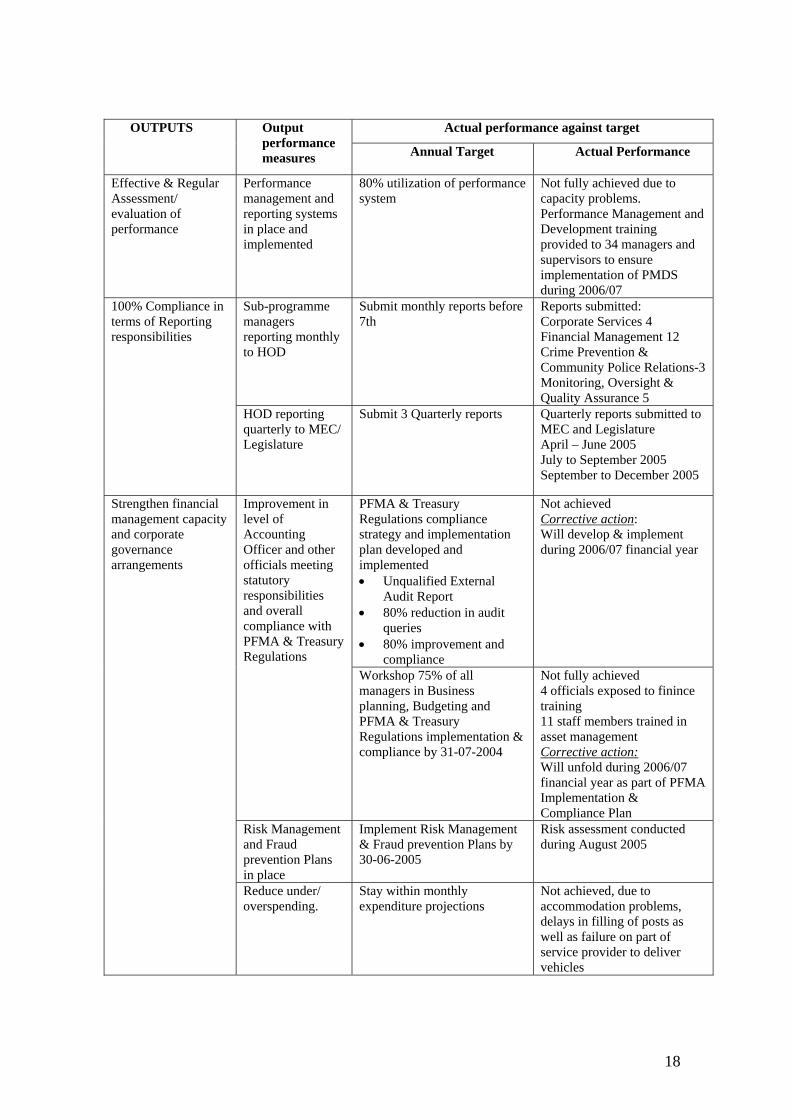
Actual performance against target OUTPUTS Output performance measures Annual Target Actual Performance
Effective & Regular Assessment/ evaluation of performance
Performance management and reporting systems in place and implemented
80% utilization of performance system
Not fully achieved due to capacity problems. Performance Management and Development training provided to 34 managers and supervisors to ensure implementation of PMDS during 2006/07
Sub-programme managers reporting monthly to HOD
Submit monthly reports before 7th
Reports submitted: Corporate Services 4 Financial Management 12 Crime Prevention & Community Police Relations-3 Monitoring, Oversight & Quality Assurance 5
100% Compliance in terms of Reporting responsibilities
HOD reporting quarterly to MEC/ Legislature
Submit 3 Quarterly reports
Quarterly reports submitted to MEC and Legislature April – June 2005 July to September 2005 September to December 2005
PFMA & Treasury Regulations compliance strategy and implementation plan developed and implemented • Unqualified External
Audit Report • 80% reduction in audit
queries • 80% improvement and
compliance
Not achieved Corrective action: Will develop & implement during 2006/07 financial year
Improvement in level of Accounting Officer and other officials meeting statutory responsibilities and overall compliance with PFMA & Treasury Regulations Workshop 75% of all
managers in Business planning, Budgeting and PFMA & Treasury Regulations implementation & compliance by 31-07-2004
Not fully achieved 4 officials exposed to finince training 11 staff members trained in asset management Corrective action: Will unfold during 2006/07 financial year as part of PFMA Implementation & Compliance Plan
Risk Management and Fraud prevention Plans in place
Implement Risk Management & Fraud prevention Plans by 30-06-2005
Risk assessment conducted during August 2005
Strengthen financial management capacity and corporate governance arrangements
Reduce under/ overspending.
Stay within monthly expenditure projections
Not achieved, due to accommodation problems, delays in filling of posts as well as failure on part of service provider to deliver vehicles
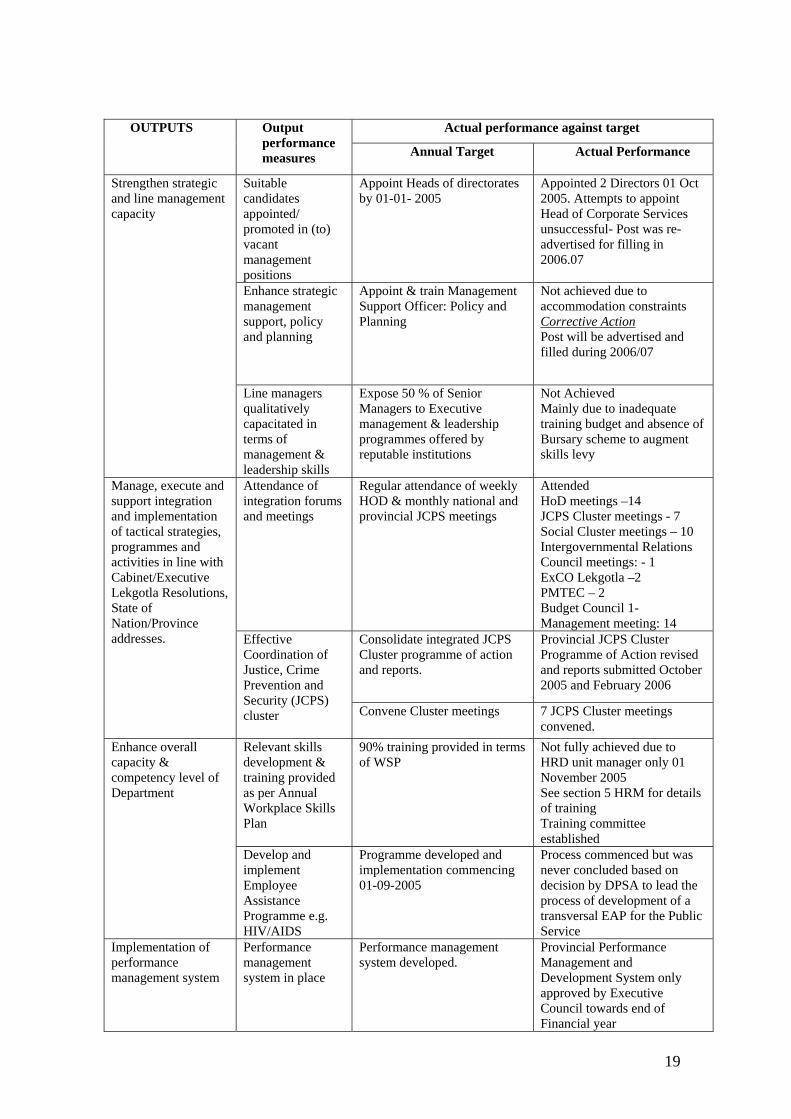
19
Actual performance against target OUTPUTS Output performance measures Annual Target Actual Performance
Suitable candidates appointed/ promoted in (to) vacant management positions
Appoint Heads of directorates by 01-01- 2005
Appointed 2 Directors 01 Oct 2005. Attempts to appoint Head of Corporate Services unsuccessful- Post was re-advertised for filling in 2006.07
Enhance strategic management support, policy and planning
Appoint & train Management Support Officer: Policy and Planning
Not achieved due to accommodation constraints Corrective Action Post will be advertised and filled during 2006/07
Strengthen strategic and line management capacity
Line managers qualitatively capacitated in terms of management & leadership skills
Expose 50 % of Senior Managers to Executive management & leadership programmes offered by reputable institutions
Not Achieved Mainly due to inadequate training budget and absence of Bursary scheme to augment skills levy
Attendance of integration forums and meetings
Regular attendance of weekly HOD & monthly national and provincial JCPS meetings
Attended HoD meetings –14 JCPS Cluster meetings - 7 Social Cluster meetings – 10 Intergovernmental Relations Council meetings: - 1 ExCO Lekgotla –2 PMTEC – 2 Budget Council 1-Management meeting: 14
Consolidate integrated JCPS Cluster programme of action and reports.
Provincial JCPS Cluster Programme of Action revised and reports submitted October 2005 and February 2006
Manage, execute and support integration and implementation of tactical strategies, programmes and activities in line with Cabinet/Executive Lekgotla Resolutions, State of Nation/Province addresses. Effective
Coordination of Justice, Crime Prevention and Security (JCPS) cluster
Convene Cluster meetings
7 JCPS Cluster meetings convened.
Relevant skills development & training provided as per Annual Workplace Skills Plan
90% training provided in terms of WSP
Not fully achieved due to HRD unit manager only 01 November 2005 See section 5 HRM for details of training Training committee established
Enhance overall capacity & competency level of Department
Develop and implement Employee Assistance Programme e.g. HIV/AIDS
Programme developed and implementation commencing 01-09-2005
Process commenced but was never concluded based on decision by DPSA to lead the process of development of a transversal EAP for the Public Service
Implementation of performance management system
Performance management system in place
Performance management system developed.
Provincial Performance Management and Development System only approved by Executive Council towards end of Financial year
20
Actual performance against target OUTPUTS Output performance measures Annual Target Actual Performance
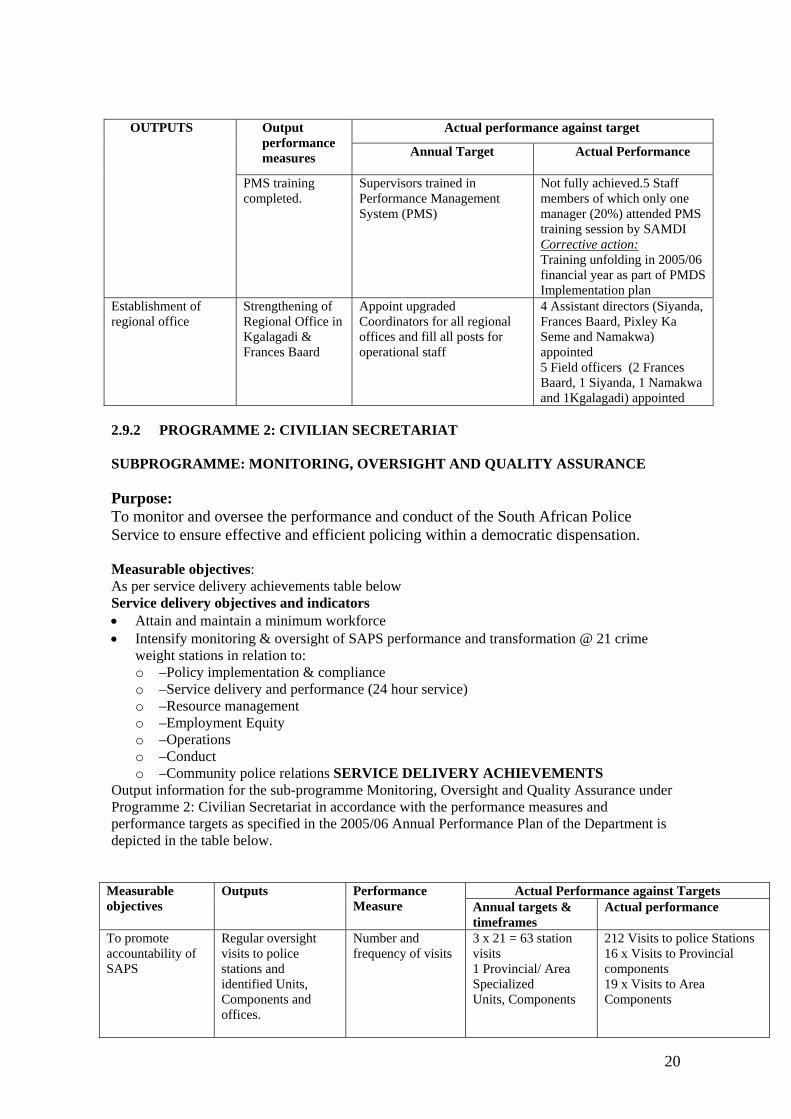
PMS training completed.
Supervisors trained in Performance Management System (PMS)
Not fully achieved.5 Staff members of which only one manager (20%) attended PMS training session by SAMDI Corrective action: Training unfolding in 2005/06 financial year as part of PMDS Implementation plan
Establishment of regional office
Strengthening of Regional Office in Kgalagadi & Frances Baard
Appoint upgraded Coordinators for all regional offices and fill all posts for operational staff
4 Assistant directors (Siyanda, Frances Baard, Pixley Ka Seme and Namakwa) appointed 5 Field officers (2 Frances Baard, 1 Siyanda, 1 Namakwa and 1Kgalagadi) appointed
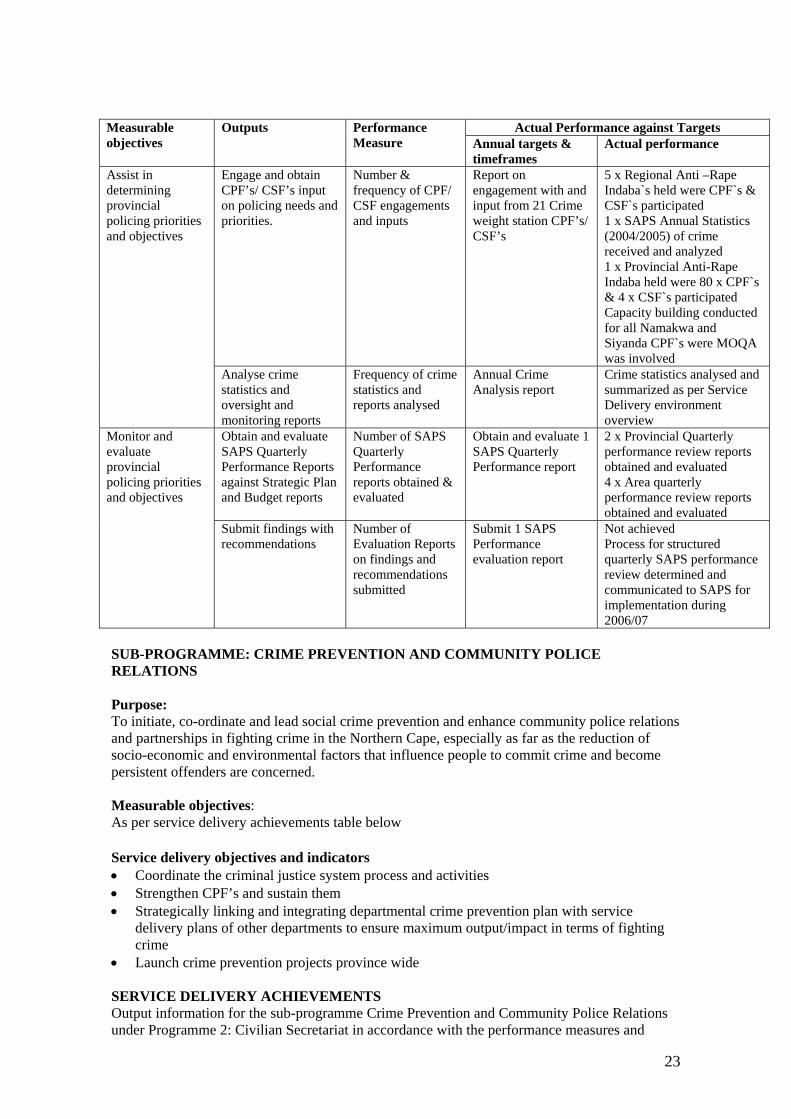
2.9.2 PROGRAMME 2: CIVILIAN SECRETARIAT SUBPROGRAMME: MONITORING, OVERSIGHT AND QUALITY ASSURANCE Purpose: To monitor and oversee the performance and conduct of the South African Police Service to ensure effective and efficient policing within a democratic dispensation. Measurable objectives: As per service delivery achievements table below Service delivery objectives and indicators • Attain and maintain a minimum workforce • Intensify monitoring & oversight of SAPS performance and transformation @ 21 crime
weight stations in relation to: o –Policy implementation & compliance o –Service delivery and performance (24 hour service) o –Resource management o –Employment Equity o –Operations o –Conduct o –Community police relations SERVICE DELIVERY ACHIEVEMENTS
Output information for the sub-programme Monitoring, Oversight and Quality Assurance under Programme 2: Civilian Secretariat in accordance with the performance measures and performance targets as specified in the 2005/06 Annual Performance Plan of the Department is depicted in the table below.
Actual Performance against Targets Measurable objectives
Outputs Performance Measure Annual targets &
timeframes Actual performance
To promote accountability of SAPS
Regular oversight visits to police stations and identified Units, Components and offices.
Number and frequency of visits
3 x 21 = 63 station visits 1 Provincial/ Area Specialized Units, Components
212 Visits to police Stations 16 x Visits to Provincial components 19 x Visits to Area Components
21
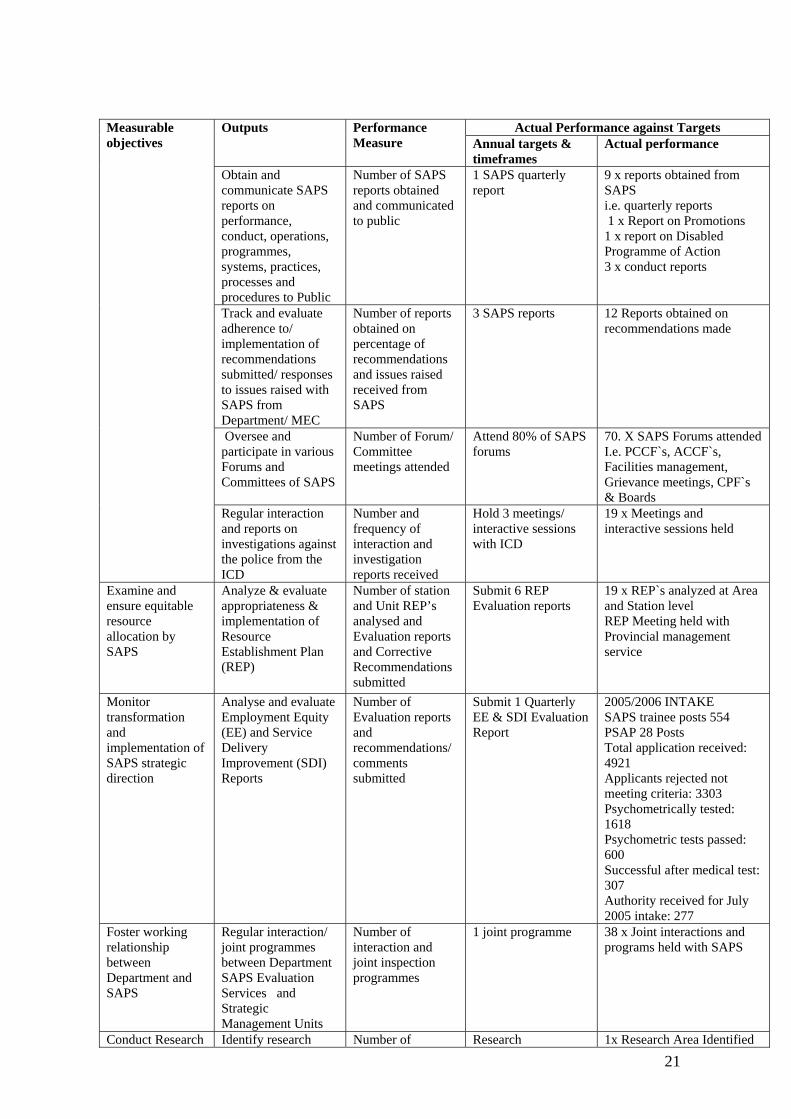
Actual Performance against Targets Measurable objectives
Outputs Performance Measure Annual targets &
timeframes Actual performance
Obtain and communicate SAPS reports on performance, conduct, operations, programmes, systems, practices, processes and procedures to Public
Number of SAPS reports obtained and communicated to public
1 SAPS quarterly report
9 x reports obtained from SAPS i.e. quarterly reports 1 x Report on Promotions 1 x report on Disabled Programme of Action 3 x conduct reports
Track and evaluate adherence to/ implementation of recommendations submitted/ responses to issues raised with SAPS from Department/ MEC
Number of reports obtained on percentage of recommendations and issues raised received from SAPS
3 SAPS reports 12 Reports obtained on recommendations made
Oversee and participate in various Forums and Committees of SAPS
Number of Forum/ Committee meetings attended
Attend 80% of SAPS forums
70. X SAPS Forums attended I.e. PCCF`s, ACCF`s, Facilities management, Grievance meetings, CPF`s & Boards
Regular interaction and reports on investigations against the police from the ICD
Number and frequency of interaction and investigation reports received
Hold 3 meetings/ interactive sessions with ICD
19 x Meetings and interactive sessions held
Examine and ensure equitable resource allocation by SAPS
Analyze & evaluate appropriateness & implementation of Resource Establishment Plan (REP)
Number of station and Unit REP’s analysed and Evaluation reports and Corrective Recommendations submitted
Submit 6 REP Evaluation reports
19 x REP`s analyzed at Area and Station level REP Meeting held with Provincial management service
Monitor transformation and implementation of SAPS strategic direction
Analyse and evaluate Employment Equity (EE) and Service Delivery Improvement (SDI) Reports
Number of Evaluation reports and recommendations/ comments submitted
Submit 1 Quarterly EE & SDI Evaluation Report
2005/2006 INTAKE SAPS trainee posts 554 PSAP 28 Posts Total application received: 4921 Applicants rejected not meeting criteria: 3303 Psychometrically tested: 1618 Psychometric tests passed: 600 Successful after medical test: 307 Authority received for July 2005 intake: 277
Foster working relationship between Department and SAPS
Regular interaction/ joint programmes between Department SAPS Evaluation Services and Strategic Management Units
Number of interaction and joint inspection programmes
1 joint programme 38 x Joint interactions and programs held with SAPS
Conduct Research Identify research Number of Research 1x Research Area Identified
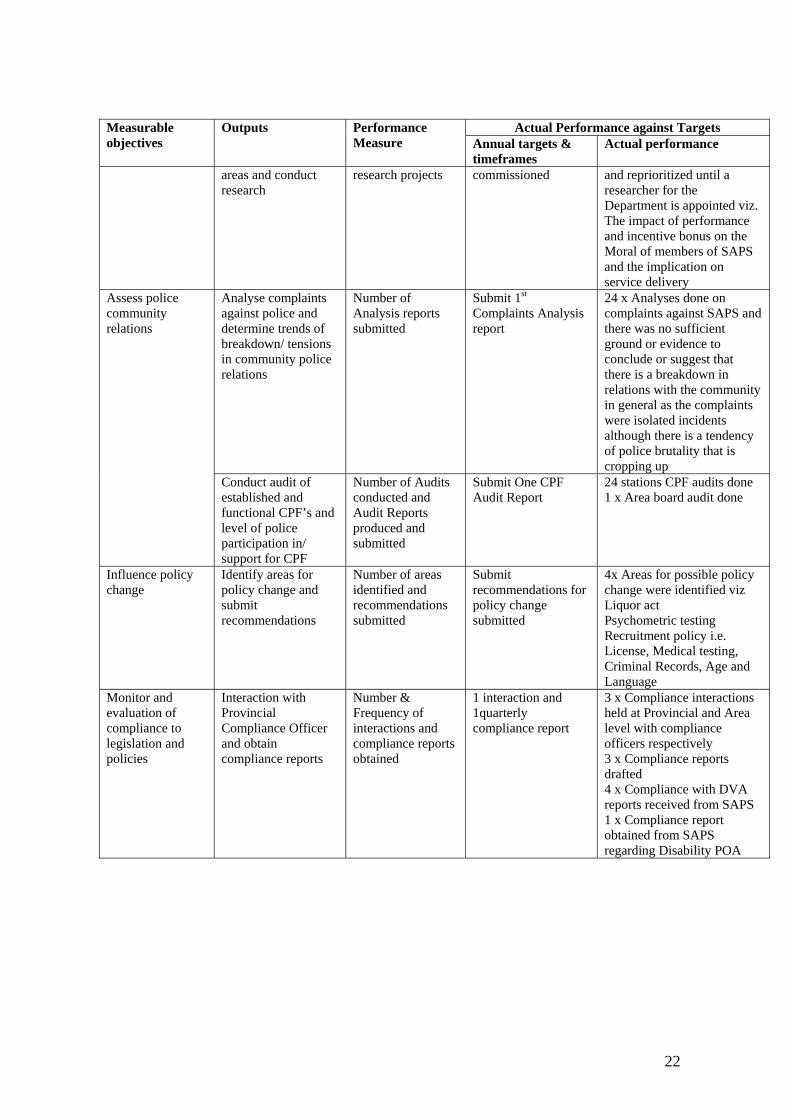
22
Actual Performance against Targets Measurable objectives
Outputs Performance Measure Annual targets &
timeframes Actual performance
areas and conduct research
research projects commissioned and reprioritized until a researcher for the Department is appointed viz. The impact of performance and incentive bonus on the Moral of members of SAPS and the implication on service delivery
Analyse complaints against police and determine trends of breakdown/ tensions in community police relations
Number of Analysis reports submitted
Submit 1st Complaints Analysis report
24 x Analyses done on complaints against SAPS and there was no sufficient ground or evidence to conclude or suggest that there is a breakdown in relations with the community in general as the complaints were isolated incidents although there is a tendency of police brutality that is cropping up
Assess police community relations
Conduct audit of established and functional CPF’s and level of police participation in/ support for CPF
Number of Audits conducted and Audit Reports produced and submitted
Submit One CPF Audit Report
24 stations CPF audits done 1 x Area board audit done
Influence policy change
Identify areas for policy change and submit recommendations
Number of areas identified and recommendations submitted
Submit recommendations for policy change submitted
4x Areas for possible policy change were identified viz Liquor act Psychometric testing Recruitment policy i.e. License, Medical testing, Criminal Records, Age and Language
Monitor and evaluation of compliance to legislation and policies
Interaction with Provincial Compliance Officer and obtain compliance reports
Number & Frequency of interactions and compliance reports obtained
1 interaction and 1quarterly compliance report
3 x Compliance interactions held at Provincial and Area level with compliance officers respectively 3 x Compliance reports drafted 4 x Compliance with DVA reports received from SAPS 1 x Compliance report obtained from SAPS regarding Disability POA
23
Actual Performance against Targets Measurable objectives
Outputs Performance Measure Annual targets &
timeframes Actual performance
Engage and obtain CPF’s/ CSF’s input on policing needs and priorities.
Number & frequency of CPF/ CSF engagements and inputs
Report on engagement with and input from 21 Crime weight station CPF’s/ CSF’s
5 x Regional Anti –Rape Indaba`s held were CPF`s & CSF`s participated 1 x SAPS Annual Statistics (2004/2005) of crime received and analyzed 1 x Provincial Anti-Rape Indaba held were 80 x CPF`s & 4 x CSF`s participated Capacity building conducted for all Namakwa and Siyanda CPF`s were MOQA was involved
Assist in determining provincial policing priorities and objectives
Analyse crime statistics and oversight and monitoring reports
Frequency of crime statistics and reports analysed
Annual Crime Analysis report
Crime statistics analysed and summarized as per Service Delivery environment overview
Obtain and evaluate SAPS Quarterly Performance Reports against Strategic Plan and Budget reports
Number of SAPS Quarterly Performance reports obtained & evaluated
Obtain and evaluate 1 SAPS Quarterly Performance report
2 x Provincial Quarterly performance review reports obtained and evaluated 4 x Area quarterly performance review reports obtained and evaluated
Monitor and evaluate provincial policing priorities and objectives
Submit findings with recommendations
Number of Evaluation Reports on findings and recommendations submitted
Submit 1 SAPS Performance evaluation report
Not achieved Process for structured quarterly SAPS performance review determined and communicated to SAPS for implementation during 2006/07
SUB-PROGRAMME: CRIME PREVENTION AND COMMUNITY POLICE RELATIONS Purpose: To initiate, co-ordinate and lead social crime prevention and enhance community police relations and partnerships in fighting crime in the Northern Cape, especially as far as the reduction of socio-economic and environmental factors that influence people to commit crime and become persistent offenders are concerned. Measurable objectives: As per service delivery achievements table below Service delivery objectives and indicators • Coordinate the criminal justice system process and activities • Strengthen CPF’s and sustain them • Strategically linking and integrating departmental crime prevention plan with service
delivery plans of other departments to ensure maximum output/impact in terms of fighting crime
• Launch crime prevention projects province wide SERVICE DELIVERY ACHIEVEMENTS Output information for the sub-programme Crime Prevention and Community Police Relations under Programme 2: Civilian Secretariat in accordance with the performance measures and
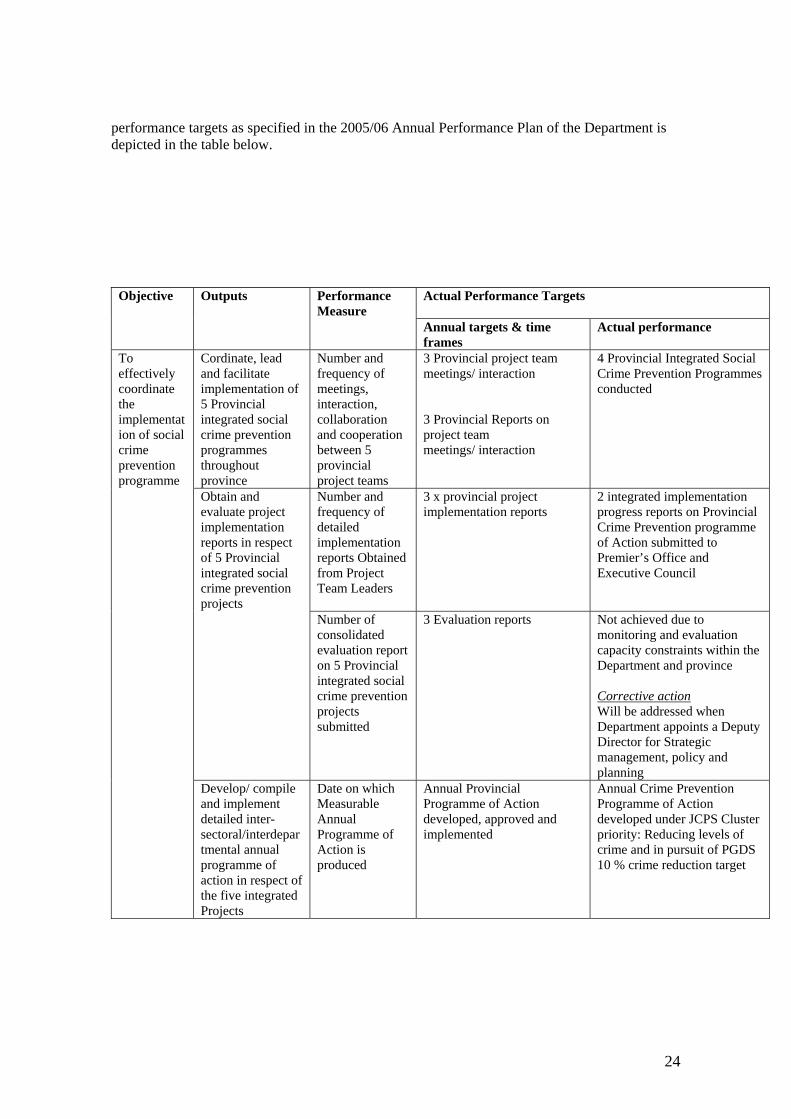
24
performance targets as specified in the 2005/06 Annual Performance Plan of the Department is depicted in the table below.
Actual Performance Targets
Objective Outputs Performance Measure
Annual targets & time frames
Actual performance
Cordinate, lead and facilitate implementation of 5 Provincial integrated social crime prevention programmes throughout province
Number and frequency of meetings, interaction, collaboration and cooperation between 5 provincial project teams
3 Provincial project team meetings/ interaction 3 Provincial Reports on project team meetings/ interaction
4 Provincial Integrated Social Crime Prevention Programmes conducted
Number and frequency of detailed implementation reports Obtained from Project Team Leaders
3 x provincial project implementation reports
2 integrated implementation progress reports on Provincial Crime Prevention programme of Action submitted to Premier’s Office and Executive Council
Obtain and evaluate project implementation reports in respect of 5 Provincial integrated social crime prevention projects
Number of consolidated evaluation report on 5 Provincial integrated social crime prevention projects submitted
3 Evaluation reports Not achieved due to monitoring and evaluation capacity constraints within the Department and province Corrective action Will be addressed when Department appoints a Deputy Director for Strategic management, policy and planning
To effectively coordinate the implementation of social crime prevention programme
Develop/ compile and implement detailed inter-sectoral/interdepartmental annual programme of action in respect of the five integrated Projects
Date on which Measurable Annual Programme of Action is produced
Annual Provincial Programme of Action developed, approved and implemented
Annual Crime Prevention Programme of Action developed under JCPS Cluster priority: Reducing levels of crime and in pursuit of PGDS 10 % crime reduction target
25
Actual Performance Targets
Objective Outputs Performance Measure
Annual targets & time frames
Actual performance
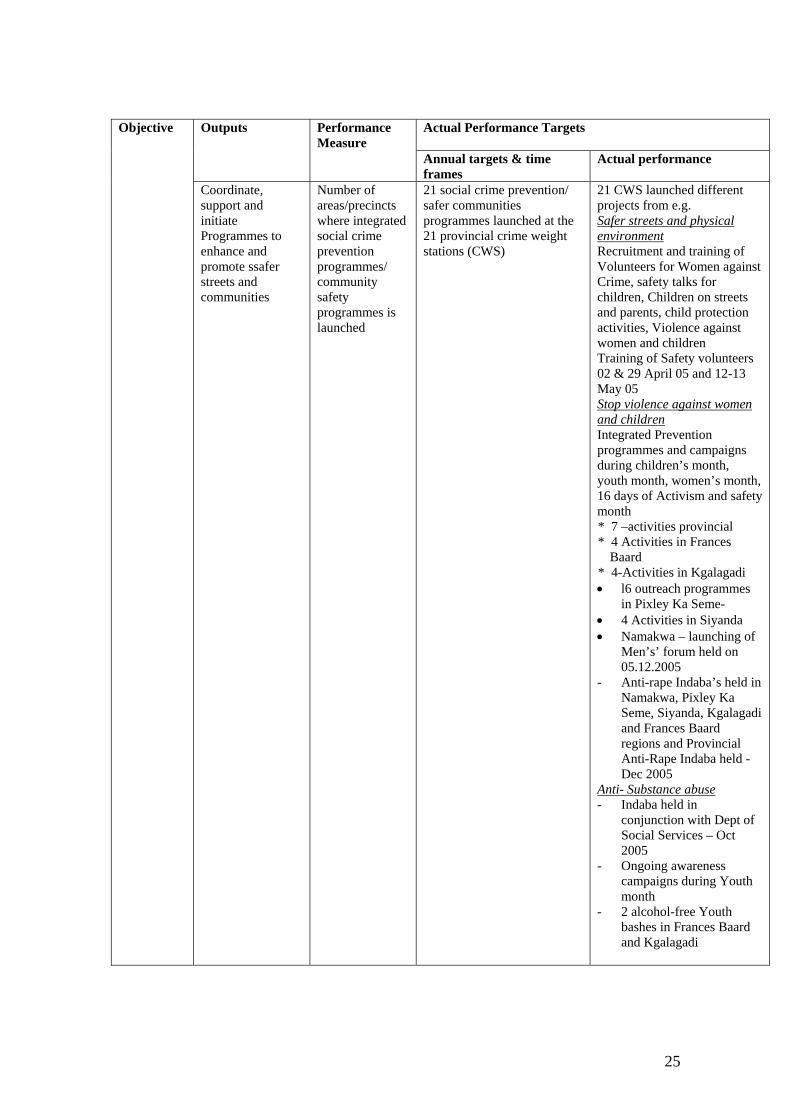
Coordinate, support and initiate Programmes to enhance and promote ssafer streets and communities
Number of areas/precincts where integrated social crime prevention programmes/ community safety programmes is launched
21 social crime prevention/ safer communities programmes launched at the 21 provincial crime weight stations (CWS)
21 CWS launched different projects from e.g. Safer streets and physical environment Recruitment and training of Volunteers for Women against Crime, safety talks for children, Children on streets and parents, child protection activities, Violence against women and children Training of Safety volunteers 02 & 29 April 05 and 12-13 May 05 Stop violence against women and children Integrated Prevention programmes and campaigns during children’s month, youth month, women’s month, 16 days of Activism and safety month * 7 –activities provincial * 4 Activities in Frances
Baard * 4-Activities in Kgalagadi • l6 outreach programmes
in Pixley Ka Seme- • 4 Activities in Siyanda • Namakwa – launching of
Men’s’ forum held on 05.12.2005
- Anti-rape Indaba’s held in Namakwa, Pixley Ka Seme, Siyanda, Kgalagadi and Frances Baard regions and Provincial Anti-Rape Indaba held - Dec 2005
Anti- Substance abuse - Indaba held in
conjunction with Dept of Social Services – Oct 2005
- Ongoing awareness campaigns during Youth month
- 2 alcohol-free Youth bashes in Frances Baard and Kgalagadi
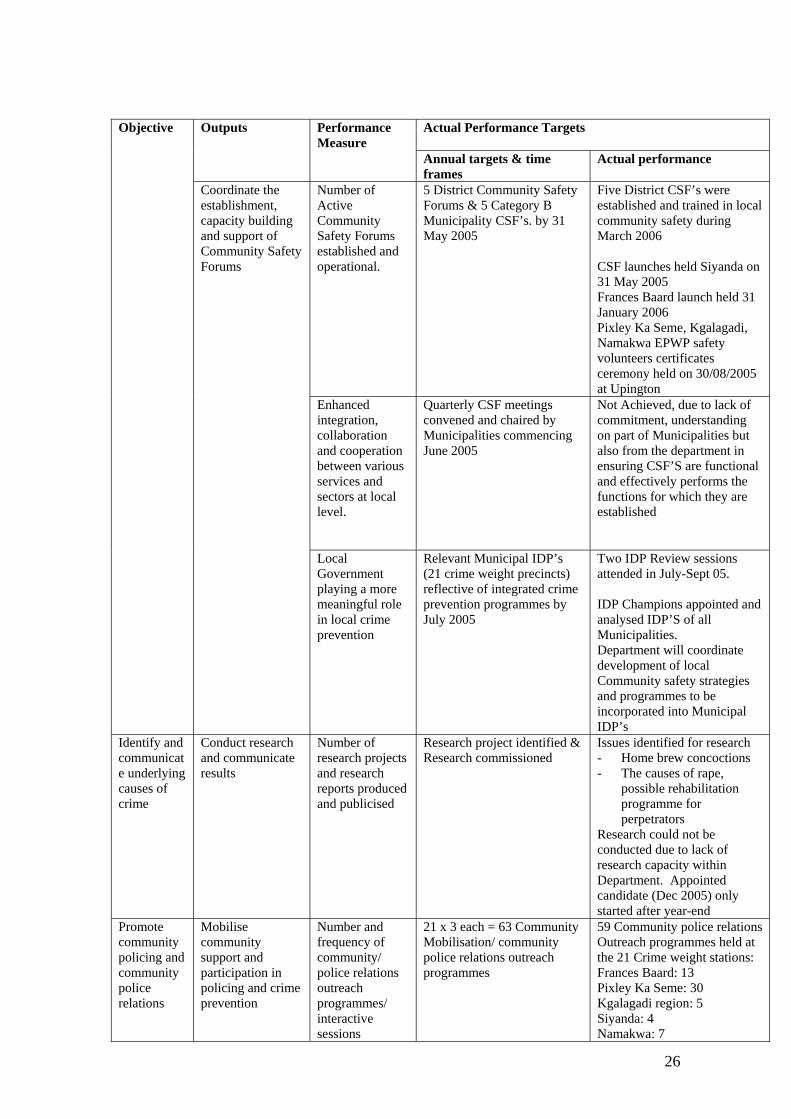
26
Actual Performance Targets
Objective Outputs Performance Measure
Annual targets & time frames
Actual performance
Number of Active Community Safety Forums established and operational.
5 District Community Safety Forums & 5 Category B Municipality CSF’s. by 31 May 2005
Five District CSF’s were established and trained in local community safety during March 2006 CSF launches held Siyanda on 31 May 2005 Frances Baard launch held 31 January 2006 Pixley Ka Seme, Kgalagadi, Namakwa EPWP safety volunteers certificates ceremony held on 30/08/2005 at Upington
Enhanced integration, collaboration and cooperation between various services and sectors at local level.
Quarterly CSF meetings convened and chaired by Municipalities commencing June 2005
Not Achieved, due to lack of commitment, understanding on part of Municipalities but also from the department in ensuring CSF’S are functional and effectively performs the functions for which they are established
Coordinate the establishment, capacity building and support of Community Safety Forums
Local Government playing a more meaningful role in local crime prevention
Relevant Municipal IDP’s (21 crime weight precincts) reflective of integrated crime prevention programmes by July 2005
Two IDP Review sessions attended in July-Sept 05. IDP Champions appointed and analysed IDP’S of all Municipalities. Department will coordinate development of local Community safety strategies and programmes to be incorporated into Municipal IDP’s
Identify and communicate underlying causes of crime
Conduct research and communicate results
Number of research projects and research reports produced and publicised
Research project identified & Research commissioned
Issues identified for research - Home brew concoctions - The causes of rape,
possible rehabilitation programme for perpetrators
Research could not be conducted due to lack of research capacity within Department. Appointed candidate (Dec 2005) only started after year-end
Promote community policing and community police relations
Mobilise community support and participation in policing and crime prevention
Number and frequency of community/ police relations outreach programmes/ interactive sessions
21 x 3 each = 63 Community Mobilisation/ community police relations outreach programmes
59 Community police relations Outreach programmes held at the 21 Crime weight stations: Frances Baard: 13 Pixley Ka Seme: 30 Kgalagadi region: 5 Siyanda: 4 Namakwa: 7
27
Actual Performance Targets
Objective Outputs Performance Measure
Annual targets & time frames
Actual performance
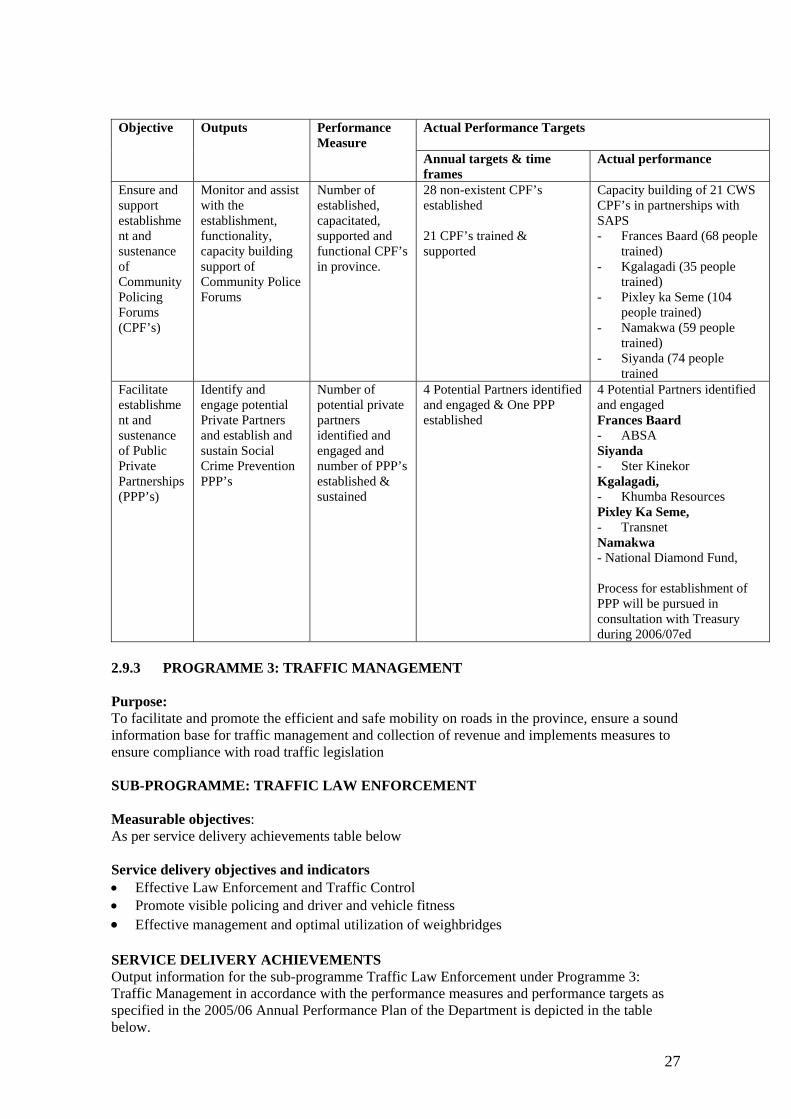
Ensure and support establishment and sustenance of Community Policing Forums (CPF’s)
Monitor and assist with the establishment, functionality, capacity building support of Community Police Forums
Number of established, capacitated, supported and functional CPF’s in province.
28 non-existent CPF’s established 21 CPF’s trained & supported
Capacity building of 21 CWS CPF’s in partnerships with SAPS - Frances Baard (68 people
trained) - Kgalagadi (35 people
trained) - Pixley ka Seme (104
people trained) - Namakwa (59 people
trained) - Siyanda (74 people
trained Facilitate establishment and sustenance of Public Private Partnerships (PPP’s)
Identify and engage potential Private Partners and establish and sustain Social Crime Prevention PPP’s
Number of potential private partners identified and engaged and number of PPP’s established & sustained
4 Potential Partners identified and engaged & One PPP established
4 Potential Partners identified and engaged Frances Baard - ABSA Siyanda - Ster Kinekor Kgalagadi, - Khumba Resources Pixley Ka Seme, - Transnet Namakwa - National Diamond Fund, Process for establishment of PPP will be pursued in consultation with Treasury during 2006/07ed
2.9.3 PROGRAMME 3: TRAFFIC MANAGEMENT Purpose: To facilitate and promote the efficient and safe mobility on roads in the province, ensure a sound information base for traffic management and collection of revenue and implements measures to ensure compliance with road traffic legislation SUB-PROGRAMME: TRAFFIC LAW ENFORCEMENT Measurable objectives: As per service delivery achievements table below Service delivery objectives and indicators • Effective Law Enforcement and Traffic Control • Promote visible policing and driver and vehicle fitness • Effective management and optimal utilization of weighbridges SERVICE DELIVERY ACHIEVEMENTS Output information for the sub-programme Traffic Law Enforcement under Programme 3: Traffic Management in accordance with the performance measures and performance targets as specified in the 2005/06 Annual Performance Plan of the Department is depicted in the table below.
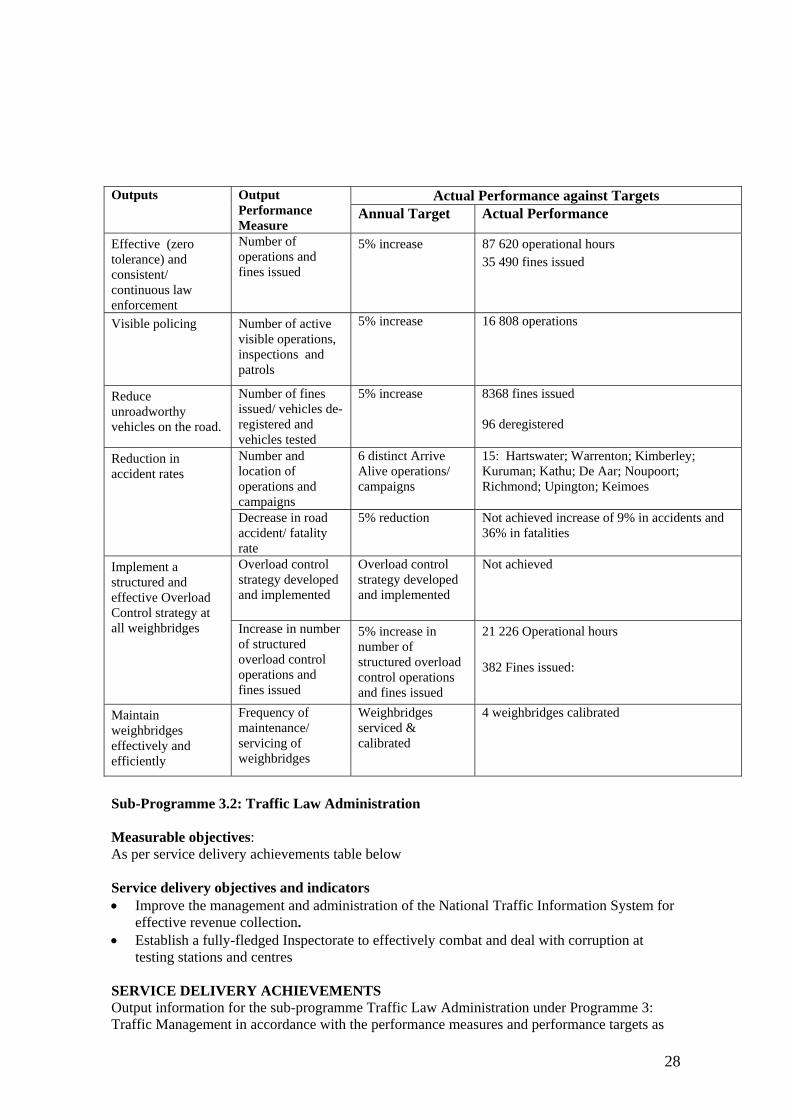
28
Actual Performance against Targets Outputs Output Performance Measure
Annual Target Actual Performance
Effective (zero tolerance) and consistent/ continuous law enforcement
Number of operations and fines issued
5% increase 87 620 operational hours 35 490 fines issued
Visible policing
Number of active visible operations, inspections and patrols
5% increase 16 808 operations
Reduce unroadworthy vehicles on the road.
Number of fines issued/ vehicles de-registered and vehicles tested
5% increase 8368 fines issued 96 deregistered
Number and location of operations and campaigns
6 distinct Arrive Alive operations/ campaigns
15: Hartswater; Warrenton; Kimberley; Kuruman; Kathu; De Aar; Noupoort; Richmond; Upington; Keimoes
Reduction in accident rates
Decrease in road accident/ fatality rate
5% reduction Not achieved increase of 9% in accidents and 36% in fatalities
Overload control strategy developed and implemented
Overload control strategy developed and implemented
Not achieved
Implement a structured and effective Overload Control strategy at all weighbridges
Increase in number of structured overload control operations and fines issued
5% increase in number of structured overload control operations and fines issued
21 226 Operational hours 382 Fines issued:
Maintain weighbridges effectively and efficiently
Frequency of maintenance/ servicing of weighbridges
Weighbridges serviced & calibrated
4 weighbridges calibrated
Sub-Programme 3.2: Traffic Law Administration Measurable objectives: As per service delivery achievements table below Service delivery objectives and indicators • Improve the management and administration of the National Traffic Information System for
effective revenue collection. • Establish a fully-fledged Inspectorate to effectively combat and deal with corruption at
testing stations and centres SERVICE DELIVERY ACHIEVEMENTS Output information for the sub-programme Traffic Law Administration under Programme 3: Traffic Management in accordance with the performance measures and performance targets as
29
specified in the 2005/06 Annual Performance Plan of the Department is depicted in the table below
Actual Performance against Target Outputs Performance Measure Annual Targets Actual performance Identification and registration of all NATIS users
% of and date by which users are registered
88 % of NaTIS users registered. Only problems were experienced at the Siyathemba (Prieska), Siyancuma (Douglas) and Richtersveld (Port Nolloth) Registering Authorities
Improve the National Traffic Information System and revenue collection. Draw up new
Agency Agreements with Registering Authorities to reflect the new parties to the agreements
New Agency Agreement with 26 Municipalities representing 39 Registry Authorities Signed
Service level Agreement drafted and consultations held with all 26 Municipalities. Changes as per inputs of Municipalities effected and conclusion of Service level agreement with individual Municipalities underway
Run an effective and efficient Helpdesk
Satisfactory level for efficiency and effectiveness
80 % satisfaction rate Not fully achieved satisfaction estimated at 60% due to closure of Helpdesk since May 2006 and newly transferred staff being trained
Training facility identified and secured
Training facility identified and secured at Padkamp
eNaTIS Training of trainers
A fully-fledged training facility established
12 Trainers trained 12 Trainers (5 Prov Helpdesk and 7 Municipalities) trained
Increase revenue raised through motor vehicle license fees.
10% and effective date of increase in motor vehicle licence fees
Executive Council Approval for Increase obtained
Not achieved Increase to be implemented during 2006/07
Collection of all motor vehicle licence fees due to province from Registering Authorities
Level and frequency of collection
100% due revenue collected
Exceeded target by 3% Collected R63,396 mil = 103% collection rate against target of R61,541 mil set
Effective marketing and sale of personalised numbers
% Increase in sale of personalised & specific numbers
5% increase Increase of 31% (R362 000) achieved 2004/05 = R1, 173 mil 2005/06 = R1, 535 mil
Abnormal Loads Administration
Increase revenue through effective abnormal load administration
10% increase on abnormal load revenues
90% (R920 000) increase achieved 2004/05 = R1, 013 mil 2005/06 = R1, 933 mil
Establish Inspectorate Unit
Unit operational
Inspectorate established and 1 Chief and 1 Principal Provincial nspectorate appointed February 2006
Number and frequency of inspections and visits
At least two inspection/ visit per Station/ Centre/ Authority per annum
Not Achieved Inspectorate only appointed February 2006
Ensure effective management of testing centres and stations.
Satisfactory Level of compliance
80% of all testing centres & stations inspected
Not Achieved
Inspectorate only appointed February 2006
30
Actual Performance against Target Outputs Performance Measure Annual Targets Actual performance Level of exposure and action taken against identified non-compliers and corrupt officials
100% of identified incidents
503 complaints of alleged fraud and corruption reported and being investigated
SUB-PROGRAMME 3.3: TRAFFIC ROAD SAFETY Measurable objectives: As per service delivery achievements table below Service delivery objectives and indicators • Appoint more road safety officers • Integrate road safety community structures with Community Policing Forums • Intensify and internalise the Arrive Alive Campaign. • Intensify other public awareness and communication regarding the dangers associated with
traffic violations by means of the radio, press, posters and brochures. • Inform the public about any occurrence which might influence their safe mobility on high
accident risk zones/ roads • Positively influence and or deal with the negative and destructive attitudes and perceptions
of all road users • Plan and co-ordinate on a provincial level road safety educational and communication
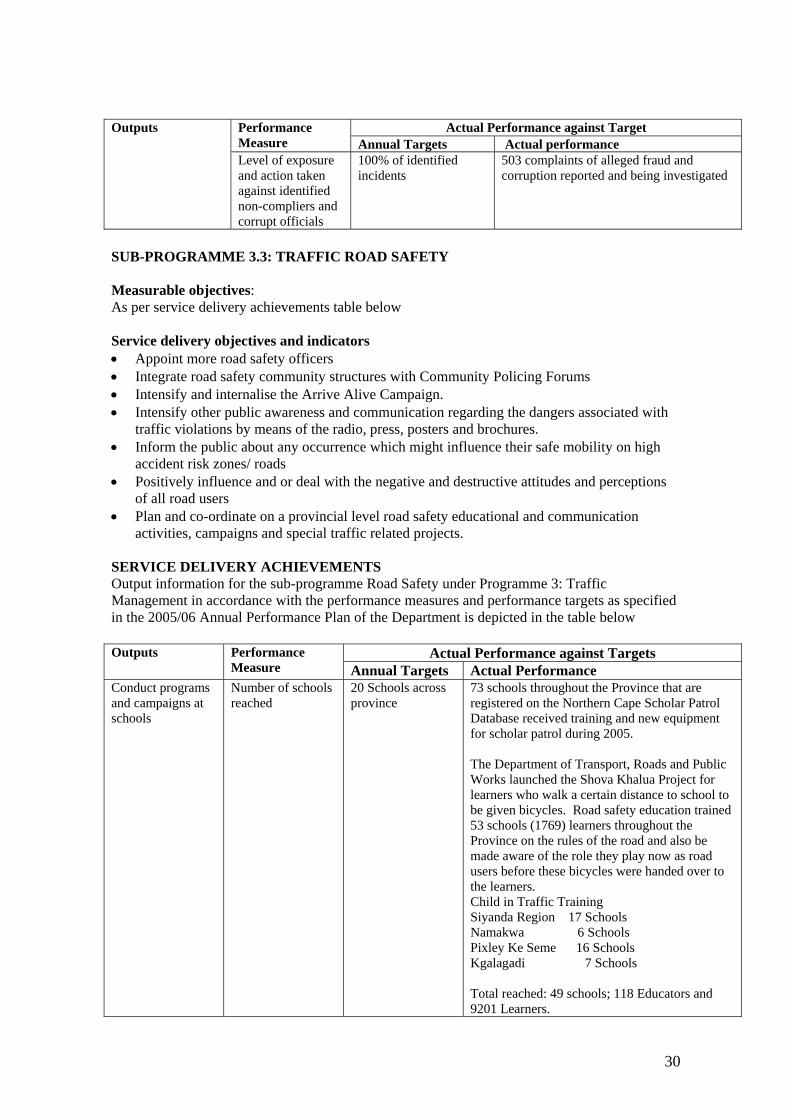
activities, campaigns and special traffic related projects. SERVICE DELIVERY ACHIEVEMENTS Output information for the sub-programme Road Safety under Programme 3: Traffic Management in accordance with the performance measures and performance targets as specified in the 2005/06 Annual Performance Plan of the Department is depicted in the table below
Actual Performance against Targets Outputs Performance Measure Annual Targets Actual Performance
Conduct programs and campaigns at schools
Number of schools reached
20 Schools across province
73 schools throughout the Province that are registered on the Northern Cape Scholar Patrol Database received training and new equipment for scholar patrol during 2005. The Department of Transport, Roads and Public Works launched the Shova Khalua Project for learners who walk a certain distance to school to be given bicycles. Road safety education trained 53 schools (1769) learners throughout the Province on the rules of the road and also be made aware of the role they play now as road users before these bicycles were handed over to the learners. Child in Traffic Training Siyanda Region 17 Schools Namakwa 6 Schools Pixley Ke Seme 16 Schools Kgalagadi 7 Schools Total reached: 49 schools; 118 Educators and 9201 Learners.
31
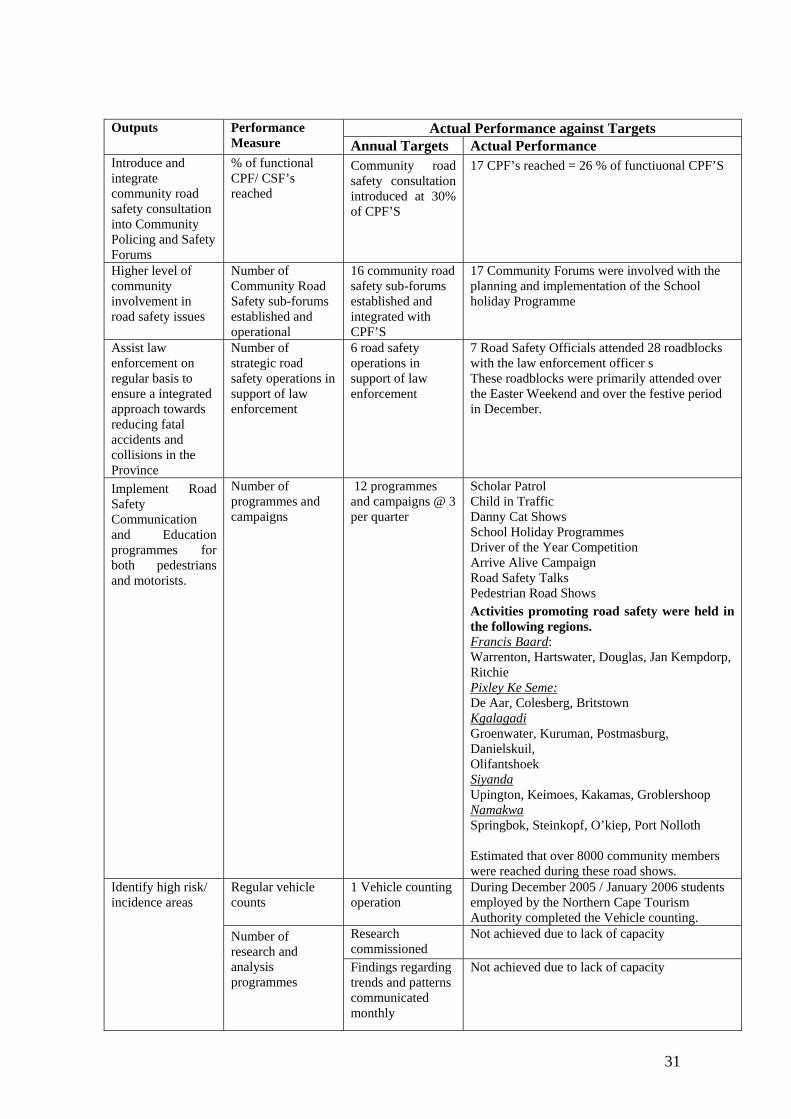
Actual Performance against Targets Outputs Performance Measure Annual Targets Actual Performance
Introduce and integrate community road safety consultation into Community Policing and Safety Forums
% of functional CPF/ CSF’s reached
Community road safety consultation introduced at 30% of CPF’S
17 CPF’s reached = 26 % of functiuonal CPF’S
Higher level of community involvement in road safety issues
Number of Community Road Safety sub-forums established and operational
16 community road safety sub-forums established and integrated with CPF’S
17 Community Forums were involved with the planning and implementation of the School holiday Programme
Assist law enforcement on regular basis to ensure a integrated approach towards reducing fatal accidents and collisions in the Province
Number of strategic road safety operations in support of law enforcement
6 road safety operations in support of law enforcement
7 Road Safety Officials attended 28 roadblocks with the law enforcement officer s These roadblocks were primarily attended over the Easter Weekend and over the festive period in December.
Implement Road Safety Communication and Education programmes for both pedestrians and motorists.
Number of programmes and campaigns
12 programmes and campaigns @ 3 per quarter
Scholar Patrol Child in Traffic Danny Cat Shows School Holiday Programmes Driver of the Year Competition Arrive Alive Campaign Road Safety Talks Pedestrian Road Shows Activities promoting road safety were held in the following regions. Francis Baard: Warrenton, Hartswater, Douglas, Jan Kempdorp, Ritchie Pixley Ke Seme: De Aar, Colesberg, Britstown Kgalagadi Groenwater, Kuruman, Postmasburg, Danielskuil, Olifantshoek Siyanda Upington, Keimoes, Kakamas, Groblershoop Namakwa Springbok, Steinkopf, O’kiep, Port Nolloth Estimated that over 8000 community members were reached during these road shows.
Regular vehicle counts
1 Vehicle counting operation
During December 2005 / January 2006 students employed by the Northern Cape Tourism Authority completed the Vehicle counting.
Research commissioned
Not achieved due to lack of capacity
Identify high risk/ incidence areas
Number of research and analysis programmes
Findings regarding trends and patterns communicated monthly
Not achieved due to lack of capacity
32
Actual Performance against Targets Outputs Performance Measure Annual Targets Actual Performance
OFM/Arrive Alive Billboards
Number, date and location of billboards erected
Erection of 4 billboards @ Keimoes Kakamas Hopetown Warrenton by 30 Nov 2005
The 2 structures for the billboards in Siyanda are erected but the signage is outstanding. Unfortunately the site we identified and approved by Sol Plaatjie Municipality has been sold to a property Investor.
Driver of the Year
Number of and Successful regional and provincial competitions
3 Regional and 1 Provincial Competitions
1 In House Competition KlienseeMine 3 Competitions: Kimberley, Upington, Springbok 1 Provincial Competition: Kimberley Participated in planning and execution of 1 National Competition: Nelspruit, Mpumalanga
School Debate Competition
Number of and Successful regional and provincial competitions
Project to be launched and regional competitions commenced
Not Achieved. Project Postponed to 2006/07 due to capacity constraints
Road Safety & Water Affairs integrated Road Safety Program
Launch & effective implementation of program
Project implementation workshops completed
Water Affairs withdrew from the project due to budget constraints thus the project had to be cancelled
SECTION 3 Report of the Audit Committee
33
AUDIT COMMITTEE REPORT Report of the Audit Committee in terms of regulations 27 [1] [10] [b] and [c] of the PFMA, Act 1 of 1999, as amended. We are pleased to present our report for the financial year ended 31 March 2006. AUDIT COMMITTEE MEMBERS AND ATTENDANCE The following persons served as members of the Provincial Audit Committee during the period under review, and their attendance record at formal Audit Committee meeting is as follows: Name of member Number of meetings attended Independent members: Prof. JE Kleynhans [chair] 7 out of 7 Ms KM Mogotsi 3 out of 7 Mr G Oberholster 3 out of 7 Mr H Ramage 1 resigned (resigned 6 June 2005) Internal members: SE Mokoko 1 out of 7 Adv. H Botha 6 out of 7 Mr T Moraladi 6 out of 7 1 AUDIT COMMITTEE RESPONSIBILITY The Audit Committee adopted appropriate terms of reference as its Audit Committee Charter. The Charter is regularly updated with principles of good governance and with the requirements of the PFMA. The Audit Committee is accountable to the Provincial Executive Committee and has an oversight function with regard to: � Financial management; � Risk Management; � Compliance with laws, regulations and good ethics; � Reporting practices; and � Internal and external audit functions. 2 REPORT ON THE OPERATIONS OF THE AUDIT COMMITTEE During the period under review, the following key activities were undertaken: � Considered internal audit plans. � Monitored the effectiveness of the internal audit function. � Monitored the independence and objectivity of both internal and external auditors. � Considered external audit reports. � Monitored Management’s follow-up matters previously reported on by the external
auditors THE EFFECTIVENESS OF INTERNAL CONTROL AND RISK MANAGEMENT • A risk managing process is in place and that the major risks under the control of the
Department of Safety and Liaison are properly managed;
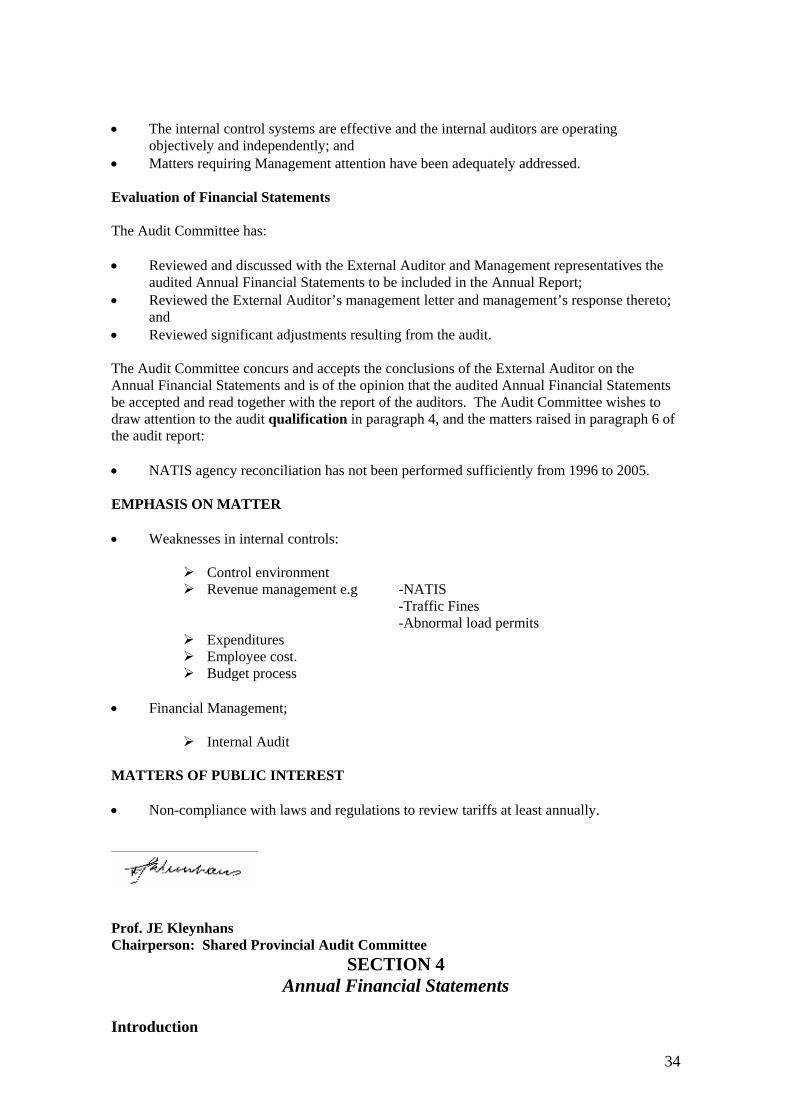
34
• The internal control systems are effective and the internal auditors are operating objectively and independently; and
• Matters requiring Management attention have been adequately addressed. Evaluation of Financial Statements The Audit Committee has: • Reviewed and discussed with the External Auditor and Management representatives the
audited Annual Financial Statements to be included in the Annual Report; • Reviewed the External Auditor’s management letter and management’s response thereto;
and • Reviewed significant adjustments resulting from the audit. The Audit Committee concurs and accepts the conclusions of the External Auditor on the Annual Financial Statements and is of the opinion that the audited Annual Financial Statements be accepted and read together with the report of the auditors. The Audit Committee wishes to draw attention to the audit qualification in paragraph 4, and the matters raised in paragraph 6 of the audit report: • NATIS agency reconciliation has not been performed sufficiently from 1996 to 2005. EMPHASIS ON MATTER • Weaknesses in internal controls:
Control environment Revenue management e.g -NATIS
-Traffic Fines -Abnormal load permits
Expenditures Employee cost. Budget process
• Financial Management;
Internal Audit MATTERS OF PUBLIC INTEREST • Non-compliance with laws and regulations to review tariffs at least annually.
Prof. JE Kleynhans Chairperson: Shared Provincial Audit Committee
SECTION 4 Annual Financial Statements
Introduction
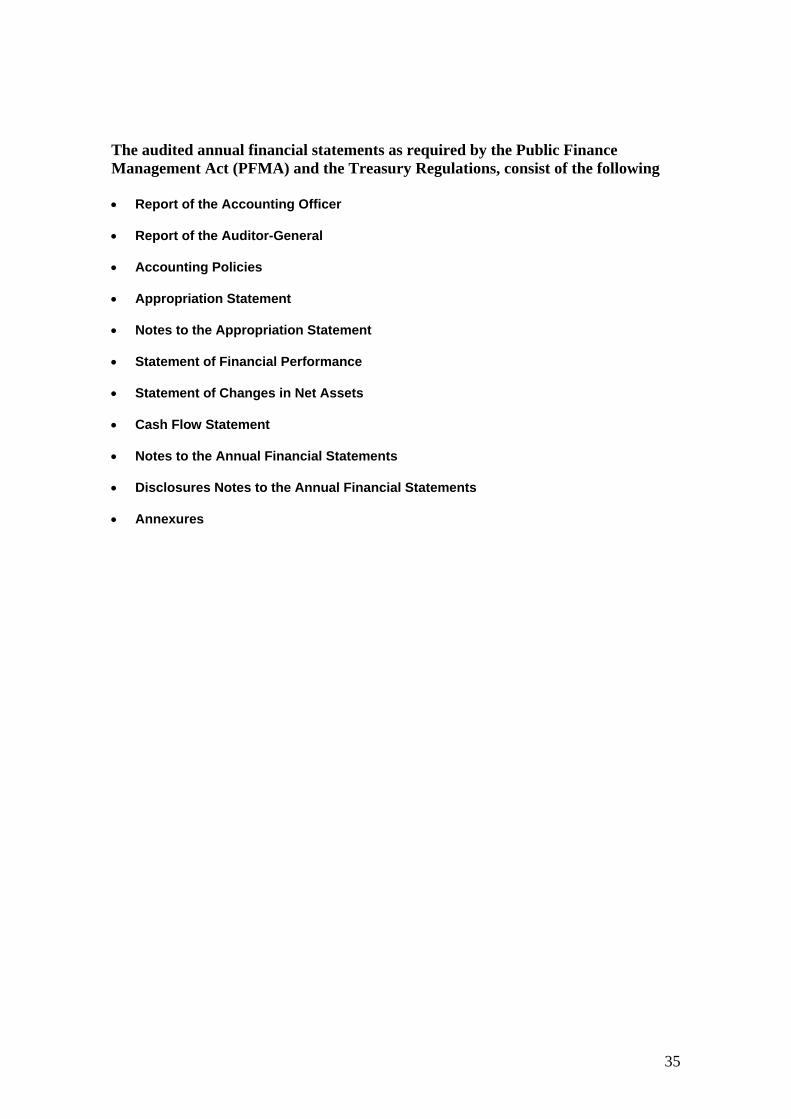
35
The audited annual financial statements as required by the Public Finance Management Act (PFMA) and the Treasury Regulations, consist of the following • Report of the Accounting Officer • Report of the Auditor-General • Accounting Policies • Appropriation Statement • Notes to the Appropriation Statement • Statement of Financial Performance • Statement of Changes in Net Assets • Cash Flow Statement • Notes to the Annual Financial Statements • Disclosures Notes to the Annual Financial Statements • Annexures

36
Department of Safety and Liaison Vote 3
REPORT OF THE ACCOUNTING OFFICER For the year ended 31 March 2006
1. General review of the state of financial affairs.
With the merge of the Department with the Traffic unit which used to resort under the Department of Transport, Roads and Public Works, the department grew tremendously with the Traffic Management becoming an extra programme within the structure of the Department. The department grew from a staff complement of 28 people to 214 as at 31/03/2006. Traffic Law Enforcement became a direct responsibility of the Department and coupled with this is revenue of about R62 million which made the Department the main revenue collector in the province. Part of the responsibility that came with this is the flag ship Driver of the year project. The Department hosted successful regional competitions in Siyanda, Namaqua and Frances Baard as build up toward the Provincial Competitions that culminated in the National Driver of the Year that was held in Mpumalanga during October 2005. The Northern Cape province secured third place in one of the categories and will be participating in the international competitions to be hosted in Belguim during the 2006 financial year. Key projects undertaken by the Civilian Secretariat programme were amongst others:
Crime Prevention and Community Police Relations 1. Anti-substance abuse Indaba in conjunction with Department of Social Services and
Population Development 2. Anti-Rape indaba 3. Public Awareness and Education campaigns during Women’s, Youth and Safety
month 4. Community Safety Forum training on Local Crime Prevention 5. Community Police Forum festive season crime prevention projects
Monitoring, Oversight and Quality Assurance 1. Human Rights workshop for South African Police Services and Community Policing
Forums 2. Oversight visits to crime weight stations
The Department incurred under-expenditure in the amount of R4,186 million. The bulk of the under-expenditure was incurred under Programme 2: Civilian Secretariat at R2,320 million and Programme 3: Traffic Management R2,095 million.
The under-spending in the year under review was as a result of
37
1. Lack of accommodation led to the department not being able to fill its posts timously so that people could start to work and expenditure could start to be registered
2. Non responsiveness of Municipalities to the department call for submission of programmes to be funded under the festive season Arrive Alive campaign
The situation with the vehicles that were applied for in June 2005 and only delivered during the reporting financial year in question also led to these levels of under expenditure.
2. Services rendered by the Department
For the annual year 2005/06 the Department had an allocation of R50,505 mil which was divided into the following programmes:
Programme 1: Administration: R8,913
2: Civilian Secretariat R8,970 3: Traffic Management R32 922
Programme 1 includes 1. Office of the MEC
2. Management and 3. Financial Services and Corporate Services
Programme 2 is one of the core business of the Department and includes: 3. Monitoring, Oversight and Quality Assurance and 4. Crime Prevention and Community Police Relations
The tariff policy that was inherited from the Department of Transport for Traffic related services was not adjusted or augmented.
3. The inventories are:
Pens : R1,912.19 Punchers and Staplers : R1,539.07 Paper and files : R20,060.52 Catridge : R41.095.19 Ink : R1,560.00
4. Capacity Constraints
The main constrain here is accommodation and shared services like Imperial Fleet Services that do not deliver timeously on requisition submitted. These are exogenous in nature. The other constraints are capacity as far as human capital is concerned. The Department is in the process of implementing a bursary policy so as to uplift the level of skills within the department. The filling of posts picked up during the last quarter and the accommodation crisis hampered this process somewhat.
5. Corporate Governance arrangements
38
In leading in the coordination and creation of a safe, secure and crime free Northern Cape Province and also as contained in the Provincial Growth and Development Strategy whose target is to reduce crime by 10% by 2014, the Department should therefore with its partners coordinate it’s resources in an endeavour to achieve the above said goals. The establishment of Community Safety Forums in the 5 District Municipalities further enhanced cooperation between province and local authorities in rendering the Northern Cape per se province.
6. Asset Management
Asset Management is a responsibility that is currently driven from the Provincial Treasury. The intervention are to make the Department ready to change over from the cash basis of accounting to the accrual basis of accounting. The Asset Management reforms could not be fully complied with as the proposed structure has not yet been inserted into the Departmental structure and the crisis with accommodation is also exacerbating this.
7. Events after reporting dates
A number of invoices amounting to R576 000 were paid after the reporting date. 8. Performance information
Information and reporting systems used to monitor and report on performance of the Department are the Departmental Strategic Plans, Quarterly and Annual Reports, Monthly In-year Monitoring reports and yearly and Annual Financial Statements.
9. Scopa resolutions
RESOLUTION MECHANISM TO ADDRESS THE WEAKNESS
R1. Weakness with regard to acquisition and disposal of assets should be addressed. Also, the asset maintenance plan should be reviewed and implemented in line with provincial legislation.
The Supply chain management policy makes provision for the acquisition, maintenance and disposal
R2. Proper procedures should be followed to ensure approval of unauthorized expenditure.
Unauthorised expenditure is dealt with transversally at a provincial level due to Cost containment measurers in place.
R3. Policies and procedures to address the weaknesses in internal control should be reviewed and implemented.
The strategic planning process will address these weaknesses and implement them.
39
RESOLUTION MECHANISM TO ADDRESS THE WEAKNESS
R4. The following policies should be developed and implemented:
An Overtime Policy Procurement policy to provide
financial process for each of the main accounting cycles
A policy for credit control A fraud prevention plan
The policies will be developed as soon as there is capacity in the department
R5. All journal entries should be approved in delegations
Delegations will be updated
R6. Weakness in internal controls on personnel expenditure as stated 4.3 (c ) of the annual report should be addressed
Capacity will be addressed via absorption of personnel to perform key control function.
R7. Creditors reconciliations should be performed on a regular basis
Reconciliations are performed
R8. All weaknesses identified in respect of control of consumable stock
A stock register is designed and kept up to date.
R9. The list of bank signatories should be regularly updated.
The list is updated every year.
R10. Major weaknesses on the budget process raised in paragraph 4.3 (c) of the annual report should be addressed
Same as in R6
R11. Non-compliance to the law and regulations as raised under paragraph 4.4 of the report should be addressed.
The department will via the strategic planning sessions implement measures of to improve the status quo.
10. Approval
The Annual Financial Statements set out on pages 47 to 81 have been approved by the Accounting Officer.
………………………… . E. Botes 31 May 2006 Accounting Officer Date
40
REPORT OF THE AUDITOR-GENERAL TO THE NORTHERN CAPE PROVINCIAL LEGISLATURE ON THE FINANCIAL STATEMENTS OF
VOTE 3 – DEPARTMENT OF SAFETY AND LIAISON FOR THE YEAR ENDED 31 MARCH 2006
1. AUDIT ASSIGNMENT
The financial statements as set out on pages 47 to 81 for the year ended 31 March 2006 have been audited in terms of section 188 of the Constitution of the Republic of South Africa, 1996, read with sections 4 and 20 of the Public Audit Act, 2004 (Act No. 25 of 2004). The fixed assets opening balances have not been audited because of the timing of guidance from National Treasury to the departments relating to the treatment, valuation and disclosure of fixed assets. These financial statements, the maintenance of effective control measures and compliance with relevant laws and regulations are the responsibility of the accounting officer. My responsibility is to express an opinion on these financial statements, based on the audit.
2. NATURE AND SCOPE
The audit was conducted in accordance with International Standards on Auditing read with General Notice 544 of 2006, issued in Government Gazette no. 28723 of 10 April 2006 and General notice 808 of 2006, issued in Government Gazette no. 28954 of 23 June 2006. Those standards require that I plan and perform the audit to obtain reasonable assurance that the financial statements are free of material misstatement.
An audit includes: • examining, on a test basis, evidence supporting the amounts and
disclosures in the financial statements, • assessing the accounting principles used and significant estimates made by
management, and • evaluating the overall financial statement presentation.
I believe that the audit provides a reasonable basis for my opinion.
3. BASIS OF ACCOUNTING
The department’s policy is to prepare financial statements on the modified cash basis of accounting determined by the National Treasury, as described in the accounting policy in the financial statements.
41
4. QUALIFICATION 4.1 NaTIS agency receivables and payables
An appropriate documented and approved policy and procedure framework for the National Traffic Information System (NaTIS) relating to the monitoring of revenue and debtor management was not in place. NaTIS revenue is recovered by municipalities acting as agents for the department. The reconciliation between the recovered revenue according to NaTIS and the money received by the department according to the accounting system was performed in sufficient detail for the first time in the financial year under review. The resultant receivable of R3 636 680 and payable of R508 934 emanating from these reconciliations due to either over- or underpayments by agents during the financial year were disclosed in the disclosure notes to the financial statements. However, due to prior year reconciliations not being performed at all or being performed only partially the completeness of the NaTIS agency receivables and payables balances could not be verified.
5. QUALIFIED AUDIT OPINION
In my opinion, except for the effect on the financial statements of the matters referred to in the preceding paragraph, the financial statements present fairly, in all material respects, the financial position of the Department of Safety and Liaison at 31 March 2006 and the results of its operations and cash flows for the year then ended, in accordance with the modified cash basis of accounting determined by the National Treasury of South Africa, as described in the accounting policy in the financial statements, and in the manner required by the Public Finance Management Act, 1999 (Act No. 1 of 1999) (PFMA).
6. EMPHASIS OF MATTER
Without further qualifying the audit opinion expressed above, attention is drawn to the following matters:
6.1 Weaknesses in internal control
The responsibility to institute and maintain a system of internal control is defined in section 38 of the PFMA. Except for a subsistence and travel policy, cell phone and land line policy and subsidised vehicle policy, the Department of Safety and Liaison did not document and approve any policies and procedures to manage the activities of the department. The lack of these policies and procedures resulted in the following weaknesses:
6.1.1 Control environment (i) No evidence could be obtained that a risk assessment was performed during the
year. The department used the Northern Cape provincial fraud prevention plan, even though this plan has not been tailored to address the specific risks of the department.
(ii) The department did not have a written delegation of authority according to which
officials may approve warrant vouchers, cheques or electronic payments.
42
(iii) A written code of conduct was not promulgated by the department. (iv) No contingency plans or mechanisms existed for database recovery. 6.1.2 Revenue management (i) NaTIS management
No service level agreements existed between the department and the municipalities acting as agents for NaTIS functions. It was therefore not possible to determine the responsibilities of each party, the agency commission amounts involved or the adherence to any other clauses relating to these kinds of agreements.
The NaTIS system could not provide sufficient details of the arrear debtors such as ageing and whether vehicles were scrapped. No proof could be obtained that the department followed up on any of the arrear debtors. Licenses for vehicles used by the Roads Capital Account in the building and maintenance of roads, the so-called yellow fleet, were issued without prior receipt of the money.
Nineteen (19) instances totalling R23 070 were noted where personalised or specific number plates were issued without prior receipt of the money.
(ii) Traffic fine management
Various traffic fines were not captured on the Trafman system. The tickets not captured on the system will therefore not be forwarded to the magistrate’s court for recovery. Various traffic fines were cancelled without issuing a replacement ticket or indicating the reason for cancellation. Traffic fines captured on the Trafman system are submitted to the magistrate courts for recovery, by compiling a register of control document from the system. Various tickets on the Trafman system could not be traced to an entry in the register of control document at the Kimberley Traffic Station, indicating that these tickets will not be recovered. For the months of April 2005 and March 2006 verified, R92 610 (64 per cent) and R25 550 (14 per cent), respectively of the tickets could not be traced to the register of control document. Traffic fine revenue is allocated to either the municipality in whose municipal area the fine was issued or the department if it was issued outside a municipal area. The allocation is done by an official at the magistrate’s court. No system was in place to ensure that traffic fines issued that should be allocated to the department were in fact recovered and remitted to the department.
(iii) Abnormal load permit management
A reconciliation between the abnormal load permits issued according to the abnormal load permit listing and the money received according to the accounting system indicated that revenue was overstated by R232 720.
43
Duties in the abnormal load permit section were not segregated as only one official was responsible for processing permits, approving permits on behalf of the Head of the Department, recommending cancellations and handling refunds. No proof could be obtained that any supervisory checks were performed. Abnormal load permits covering more than one province but only paid for in one province was not always paid to or received from the various provinces affected.
6.1.3 Expenditure (i) Controls over the remittance register were insufficient, as instances were noted
where invoices were not captured on the register. The invoice receipt date were not always indicated, resulting in the inability to determine if the invoice was paid within 30 days as required by Treasury Regulation 8.2.3.
(ii) One lease contract could not be submitted for audit purposes. R50 783 of the
disclosed operating lease commitment amount of R719 138 in note 22 to the financial statements could therefore not be verified.
(iii) Claims were not submitted timeously towards clearing the advance taken as
instances were noted where periods of up to four months lapsed before the advance was cleared.
(iv) Five subsistence and travel claims totalling R4 016 were paid without evidence
of an approval signature. 6.1.4 Employee cost (i) No human resource plan existed. The number of vacancies, plans to address
the vacancies and the comparison with the vacancy norm could therefore not be established.
(ii) The post matching was not performed resulting in inaccurate and incomplete
salary information being used for decision making. (iii) Job descriptions were not prepared which could result in officials not
understanding their objectives, responsibilities and what they will be accountable for.
(iv) The employment contract of the chief financial officer could not be obtained for
audit purposes. The performance contract of the Head of the Department could not be obtained for audit purposes either.
(v) No performance evaluations were performed for year under review. (vi) The remuneration package structuring information on eight officials’ personnel
files were not updated resulting in the information not corresponding with the actual remuneration package payments as per Persal.
(vii) No evidence could be obtained that positions were advertised for five positions. (viii) Annexure 3A in the financial statements indicates that financial guarantees were
issued and released during the year. The Persal system was not updated with
44
this information and the related Persal reports can therefore not be used for management control purposes.
(ix) Four housing files were noted lacking the following information:
- An authorised state guarantee application form - The agreement of loan between the official and the bank - Attorney’s statement of account
(x) Five instances were noted where leave was taken prior to leave being approved. (xi) Eleven (11) instances were noted where the leave information according to the
Persal system did not correspond with leave application forms. (xii) Four instances totalling 10 leave days were noted where the leave application
form information was not captured on Persal. (xiii) The control sheets in the personnel, leave, housing and subsidised vehicle files
were not signed resulting in uncertainty as to the location of a file. This resulted in the following limitation of scope instances:
- The personnel files of seven officials whose services were terminated
during the year could not be obtained for audit purposes. - 14 housing files could not be submitted for audit purposes. The
adherence to the conditions of home owner allowances could therefore not be verified.
- The personnel and leave file of one official could not be obtained for audit purposes. Furthermore, various instances were noted where personnel files did not contain a copy of the identity document, proof of qualifications, curriculum vitae, terms of employment and employee benefits.
- Three subsidised vehicle files could not be obtained for audit purposes. Furthermore, various instances were noted where the subsidised vehicle files did not contain application forms, claim forms, contracts with the service provider and vehicle log sheets.
(xiv) As reported in the prior year audit report, the attendance registers were not
completed on a daily basis. 6.1.5 Budget process (i) No evidence could be obtained to determine if the strategic plan and budget
were submitted on time to the Treasury. (ii) No evidence could be obtained to determine if the quarterly performance reports
were submitted on time to the executive authority. (iii) No evidence could be obtained to determine if the report on the utilisation of
savings in terms of section 43 of the PFMA was submitted within seven days to the Treasury.
6.2 Matters in the public interest
45
Due to the lack of adherence to the South African Public Service Financial Disclosure Framework, some of the personnel have not declared their financial and business interests.
6.3 Non-compliance with laws and regulations
According to Treasury Regulation 7.3.1, the accounting officer should review at least annually all tariffs and the Treasury should approve the tariffs. No proof could be obtained that any tariffs were reviewed or approved.
6.4 Financial management Internal audit
The internal audit function is performed by a centralised internal audit department, which resides under the Office of the Premier.
An overview was performed on the functionality of the internal audit department. Various shortcomings rendered the functionality of the internal audit department inefficient and ineffective during the year under review:
- The internal audit charter, as required by Treasury Regulation 3.2.5 and the Institute of Internal Auditors (IIA) 1000-1, was only approved on 15 August 2005.
- The current staffing component, as well as the available funds, seems to be inadequate to efficiently and effectively deliver a service all the provincial departments of the Northern Cape Province. No formal training and development plan was in place to ensure continuous training and development of existing staff.
- No approved annual internal audit plan and three-year strategic plan exist for the internal audit department.
- The audit committee did not evaluate the performance of the internal audit during the year.
- Internal audit did not report functionally directly to the audit committee during the year.
- Internal audit did not submit quarterly reports to the audit committee detailing its performance against the annual internal audit plan.
Some of the above findings were also highlighted in the audit report of the 2004-05 financial year. As a result of the above, no reliance could be placed on the work performed by internal audit for external audit purposes.
6.5 Performance information
In terms of section 20(2)(c) of the Public Audit Act of 2004 the Auditor-General must draw a conclusion on the reported information relating to the performance of the department against predetermined objectives. Although the guideline for the preparation of annual reports clearly requests the department to submit the
46
details to the Auditor-General by no later than 15 June 2006, I only received the performance information by 28 June 2006. Our review of the information relating to the three programmes in the department revealed the following:
(i) The reported performance is not supported by source documentation. (ii) Not all predetermined objectives as defined in the strategic and performance
implementation plans are reported on. (iii) Some predetermined objectives are included in the performance report that is
not part of the strategic planning documents of the department. 7. APPRECIATION
The assistance rendered by the staff of the Department of Safety and Liaison during the audit is sincerely appreciated. AL Kimmie for Auditor-General Kimberley 31 July 2006
47
DEPARTMENT OF SAFETY AND LIAISON VOTE 3
ACCOUNTING POLICIES
for the year ended 31 March 2006 The Financial Statements have been prepared in accordance with the following policies, which have been applied consistently in all material aspects, unless otherwise indicated. However, where appropriate and meaningful, additional information has been disclosed to enhance the usefulness of the Financial Statements and to comply with the statutory requirements of the Public Finance Management Act, Act 1 of 1999 (as amended by Act 29 of 1999), and the Treasury Regulations issued in terms of the Act and the Division of Revenue Act, Act 1 of 2005.
1. Presentation of the Financial Statements
1.1 Basis of preparation
The Financial Statements have been prepared on a modified cash basis of accounting, except where stated otherwise. The modified cash basis constitutes the cash basis of accounting supplemented with additional disclosure items. Under the cash basis of accounting transactions and other events are recognised when cash is received or paid or when the final authorisation for payment is effected on the system (by no later than 31 March of each year)..
1.2 Presentation currency
All amounts have been presented in the currency of the South African Rand (R) which is also the functional currency of the department.
1.3 Rounding
Unless otherwise stated all financial figures have been rounded to the nearest one thousand Rand (R’000).
1.4 Comparative figures Prior period comparative information has been presented in the current year’s financial statements. Where necessary figures included in the prior period financial statements have been reclassified to ensure that the format in which the information is presented is consistent with the format of the current year’s financial statements. A comparison between actual and budgeted amounts per major classification of expenditure is included in the appropriation statement.
2. Revenue
2.1 Appropriated funds Appropriated funds are recognised in the financial records on the date the appropriation becomes effective. Adjustments to the appropriated funds made in terms of the adjustments budget process are recognised in the financial records on the date the adjustments become effective. Total appropriated funds are presented in the statement of financial performance. Unexpended appropriated funds are surrendered to the National/Provincial Revenue Fund, unless approval has been given by the National/Provincial Treasury to rollover the funds to the
48
DEPARTMENT OF SAFETY AND LIAISON
VOTE 3
ACCOUNTING POLICIES for the year ended 31 March 2006
subsequent financial year. These rollover funds form part of retained funds in the annual financial statements. Amounts owing to the National/Provincial Revenue Fund at the end of the financial year are recognised in the statement of financial position.
2.2 Departmental revenue All departmental revenue is paid into the National/Provincial Revenue Fund when received, unless otherwise stated. Amounts owing to the National/Provincial Revenue Fund at the end of the financial year are recognised in the statement of financial position.
2.2.1 Tax revenue Tax revenue consists of all compulsory unrequited amounts collected by the department in accordance with laws and or regulations (excluding fines, penalties & forfeits). Tax receipts are recognised in the statement of financial performance when received.
2.2.2 Sales of goods and services other than capital assets The proceeds received from the sale of goods and/or the provision of services is recognised in the statement of financial performance when the cash is received.
2.2.3 Fines, penalties & forfeits Fines, penalties & forfeits are compulsory unrequited amounts which were imposed by a court or quasi-judicial body and collected by the department. Revenue arising from fines, penalties and forfeits is recognised in the statement of financial performance when the cash is received.
2.2.4 Interest, dividends and rent on land Interest, dividends and rent on land is recognised in the statement of financial performance when the cash is received.
2.2.5 Sale of capital assets The proceeds received on sale of capital assets are recognised in the statement of financial performance when the cash is received.
2.2.6 Financial transactions in assets and liabilities Repayments of loans and advances previously extended to employees and public corporations for policy purposes are recognised as revenue in the statement of financial performance on receipt of the funds. Amounts receivable at the reporting date are disclosed in the disclosure notes to the annual financial statements. Cheques issued in previous accounting periods that expire before being banked are recognised as revenue in the statement of financial performance when the cheque becomes stale. When the cheque is reissued the payment is made from Revenue.
49
DEPARTMENT OF SAFETY AND LIAISON VOTE 3
ACCOUNTING POLICIES
for the year ended 31 March 2006
2.2.7 Gifts, donations and sponsorships (transfers received)
All cash gifts, donations and sponsorships are paid into the National/Provincial Revenue Fund and recorded as revenue in the statement of financial performance when received. Amounts receivable at the reporting date are disclosed in the disclosure notes to the financial statements.
All in-kind gifts, donations and sponsorships are disclosed at fair value in the annexures to the financial statements.
2.3 Local and foreign aid assistance Local and foreign aid assistance is recognised in the financial records when notification of the donation is received from the National Treasury or when the department directly receives the cash from the donor(s). The total cash amounts received during the year is reflected in the statement of financial performance as revenue. All in-kind local and foreign aid assistance are disclosed at fair value in the annexures to the annual financial statements The cash payments made during the year relating to local and foreign aid assistance projects are recognised as expenditure in the statement of financial performance. A receivable is recognised in the statement of financial position to the value of the amounts expensed prior to the receipt of the funds. A payable is raised in the statement of financial position where amounts have been inappropriately expensed using local and foreign aid assistance, Unutilised amounts are recognised in the statement of financial position.
3. Expenditure
3.1 Compensation of employees Salaries and wages comprise payments to employees. Salaries and wages are recognised as an expense in the statement of financial performance when the final authorisation for payment is effected on the system (by no later than 31 March of each year). Capitalised compensation forms part of the expenditure for capital assets in the statement of financial performance1. All other payments are classified as current expense. Social contributions include the entities' contribution to social insurance schemes paid on behalf of the employee. Social contributions are recognised as an expense in the statement of financial performance when the final authorisation for payment is effected on the system.
3.1.1 Short term employee benefits Short term employee benefits comprise of leave entitlements (capped leave), thirteenth cheques and performance bonuses.
50
DEPARTMENT OF SAFETY AND LIAISON VOTE 3
ACCOUNTING POLICIES
for the year ended 31 March 2006 The cost of short-term employee benefits is expensed as salaries and wages in the statement of financial performance when the final authorisation for payment is effected on the system (by no later than 31 March of each year). Short-term employee benefits that give rise to a present legal or constructive obligation are disclosed in the notes to the financial statements. These amounts are not recognised in the statement of financial performance.
3.1.2 Long-term employee benefits 3.1.2.1 Termination benefits
Termination benefits such as severance packages are recognised as an expense in the statement of financial performance as a transfer when the final authorisation for payment is effected on the system (by no later than 31 March of each year).
3.1.2.2 Post employment retirement benefits The department provides retirement benefits (pension benefits) for certain of its employees through a defined benefit plan for government employees. These benefits are funded by both employer and employee contributions. Employer contributions to the fund are expensed when the final authorisation for payment to the fund is effected on the system (by no later than 31 March of each year). No provision is made for retirement benefits in the financial statements of the department. Any potential liabilities are disclosed in the financial statements of the National/Provincial Revenue Fund and not in the financial statements of the employer department. The department provides medical benefits for certain of its employees. Employer contributions to the medical funds are expensed when the final authorisation for payment to the fund is effected on the system (by no later than 31 March of each year).
3.2 Goods and services Payments made for goods and/or services are recognised as an expense in the statement of financial performance when the final authorisation for payment is effected on the system (by no later than 31 March of each year). The expense is classified as capital if the goods and services were used on a capital project.
3.3 Interest and rent on land
Interest and rental payments are recognised as an expense in the statement of financial performance when the final authorisation for payment is effected on the system (by no later than 31 March of each year). This item excludes rental for the use of buildings or other fixed structures.
3.4 Financial transactions in assets and liabilities Debts are written off when identified as irrecoverable. Debts written-off are limited to the amount of savings and/or underspending of appropriated funds. The write off occurs at year-end or when funds are available. No provision is made for irrecoverable amounts but amounts are disclosed as a disclosure note.
51
DEPARTMENT OF SAFETY AND LIAISON VOTE 3
ACCOUNTING POLICIES
for the year ended 31 March 2006 All other losses are recognised when authorisation has been granted for the recognition thereof.
3.5 Unauthorised expenditure When discovered unauthorised expenditure is recognised as an asset in the statement of financial position until such time as the expenditure is either approved by the relevant authority, recovered from the responsible person or written off as irrecoverable in the statement of financial performance. Unauthorised expenditure approved with funding is recognised in the statement of financial performance when the unauthorised expenditure is approved and the related funds are received. Where the amount is approved without funding it is recognised as expenditure, subject to availability of savings, in the statement of financial performance on the date of approval.
3.6 Fruitless and wasteful expenditure Fruitless and wasteful expenditure is recognised as an asset in the statement of financial position until such time as the expenditure is recovered from the responsible person or written off as irrecoverable in the statement of financial performance.
3.7 Irregular expenditure Irregular expenditure is recognised as expenditure in the statement of financial performance. If the expenditure is not condoned by the relevant authority it is treated as an asset until it is recovered or written off as irrecoverable.
3.8 Transfers and subsidies Transfers and subsidies are recognised as an expense when the final authorisation for payment is effected on the system (by no later than 31 March of each year).
3.9 Expenditure for capital assets Payments made for capital assets are recognised as an expense in the statement of financial performance when the final authorisation for payment is effected on the system (by no later than 31 March of each year)..
4. Assets
4.1 Cash and cash equivalents Cash and cash equivalents are carried in the statement of financial position at cost. For the purposes of the cash flow statement, cash and cash equivalents comprise cash on hand, deposits held, other sort-term highly liquid investments and bank overdrafts.
4.2 Prepayments and advances Amounts prepaid or advanced are recognised in the statement of financial position when the payments are made.
52
DEPARTMENT OF SAFETY AND LIAISON VOTE 3
ACCOUNTING POLICIES
for the year ended 31 March 2006
4.3 Receivables Receivables included in the statement of financial position arise from cash payments made that are recoverable from another party. Revenue receivable not yet collected is included in the disclosure notes. Amounts that are potentially irrecoverable are included in the disclosure notes.
4.4 Investments Capitalised investments are shown at cost in the statement of financial position. Any cash flows such as dividends received or proceeds from the sale of the investment are recognised in the statement of financial performance. Investments are tested for an impairment loss whenever events or changes in circumstances indicate that the investment may be impaired. Any impairment loss is included in the disclosure notes.
4.5 Loans Loans are recognised in the statement of financial position at the nominal amount. Amounts that are potentially irrecoverable are included in the disclosure notes.
4.6 Inventory Inventories on hand at the reporting date are disclosed at cost in the disclosure notes.
4.7 Asset Registers
Assets are recorded in an asset register, at cost, on receipt of the item. Cost of an asset is defined as the total cost of acquisition. Assets procured in previous financial periods, may be stated at fair value, where determinable, or R1, in instances where the original cost of acquisition or fair value cannot be established. No revaluation or impairment of assets is currently recognised in the asset register. Projects (of construction/development) running over more than one financial year relating to assets, are only brought into the asset register on completion of the project and at the total cost incurred over the duration of the project. Annexure 4 and 5 of the disclosure notes, reflect the total movement in the asset register of assets with a cost equal to and exceeding R5000 (therefore capital assets only) for the current financial year. The movement is reflected at the cost as recorded in the asset register and not the carrying value, as depreciation is not recognized in the financial statements under the modified cash basis of accounting. The opening balance reflected on Annexure 4 and 5 will include items procured in prior accounting periods and the closing balance will represent the total cost of the register for capital assets on hand.
5. Liabilities
53
DEPARTMENT OF SAFETY AND LIAISON VOTE 3
ACCOUNTING POLICIES
for the year ended 31 March 2006
5.1 Payables Recognised payables mainly comprise of amounts owing to other governmental entities. These payables are recognised at historical cost in the statement of financial position.
5.2 Lease commitments Lease commitments represent amounts owing from the reporting date to the end of the lease contract. These commitments are not recognised in the statement of financial position as a liability or as expenditure in the statement of financial performance but are included in the disclosure notes. Operating and finance lease commitments are expensed when the payments are made. Assets acquired in terms of finance lease agreements are disclosed in the annexures to the financial statements.
5.3 Accruals
Accruals represent goods/services that have been received, but where no invoice has been received from the supplier at the reporting date, or where an invoice has been received but final authorisation for payment has not been effected on the system. Accruals are not recognised in the statement of financial position as a liability or as expenditure in the statement of financial performance but are included in the disclosure notes.
5.4 Contingent liabilities A contingent liability is a possible obligation that arises from past events and whose existence will be confirmed only by the occurrence or non-occurrence of one or more uncertain future events not wholly within the control of the department; or A contingent liability is a present obligation that arises from past events but is not recognised because:
• It is not probable that an outflow of resources embodying economic benefits or service potential will be required to settle the obligation; or
• The amount of the obligation cannot be measured with sufficient reliability.
Contingent liabilities are included in the disclosure notes.
5.5 Commitments
Commitments represent goods/services that have been approved and/or contracted, but where no delivery has taken place at the reporting date. Commitments are not recognised in the statement of financial position as a liability or as expenditure in the statement of financial performance but are included in the disclosure notes.
6. Net Assets
54
DEPARTMENT OF SAFETY AND LIAISON VOTE 3
ACCOUNTING POLICIES
for the year ended 31 March 2006
6.1 Capitalisation reserve The capitalisation reserve comprises of financial assets and/or liabilities originating in a prior reporting period but which are recognised in the statement of financial position for the first time in the current reporting period. Amounts are transferred to the National/Provincial Revenue Fund on disposal, repayment or recovery of such amounts.
6.2 Recoverable revenue Amounts are recognised as recoverable revenue when a payment made and recognised in a previous financial year becomes recoverable from a debtor.
7. Related party transactions Related parties are departments that control or significantly influence the department in making financial and operating decisions. Specific information with regards to related party transactions is included in the disclosure notes.
8. Key management personnel Key management personnel are those persons having the authority and responsibility for planning, directing and controlling the activities of the department. Compensation paid to key management personnel including their family members where relevant, is included in the disclosure notes.
9. Public private partnerships
A public private partnership (PPP) is a commercial transaction between the department and a private party in terms of which the private party:
• Performs an institutional function on behalf of the institution; and/or • acquires the use of state property for its own commercial purposes; and • assumes substantial financial, technical and operational risks in connection with the
performance of the institutional function and/or use of state property; and • receives a benefit for performing the institutional function or from utilizing the state
property, either by way of: o consideration to be paid by the department which derives from a Revenue Fund; o charges fees to be collected by the private party from users or customers of a
service provided to them; or o a combination of such consideration and such charges or fees.
A description of the PPP arrangement, the contract fees and current and capital expenditure relating to the PPP arrangement is included in the disclosure notes. .
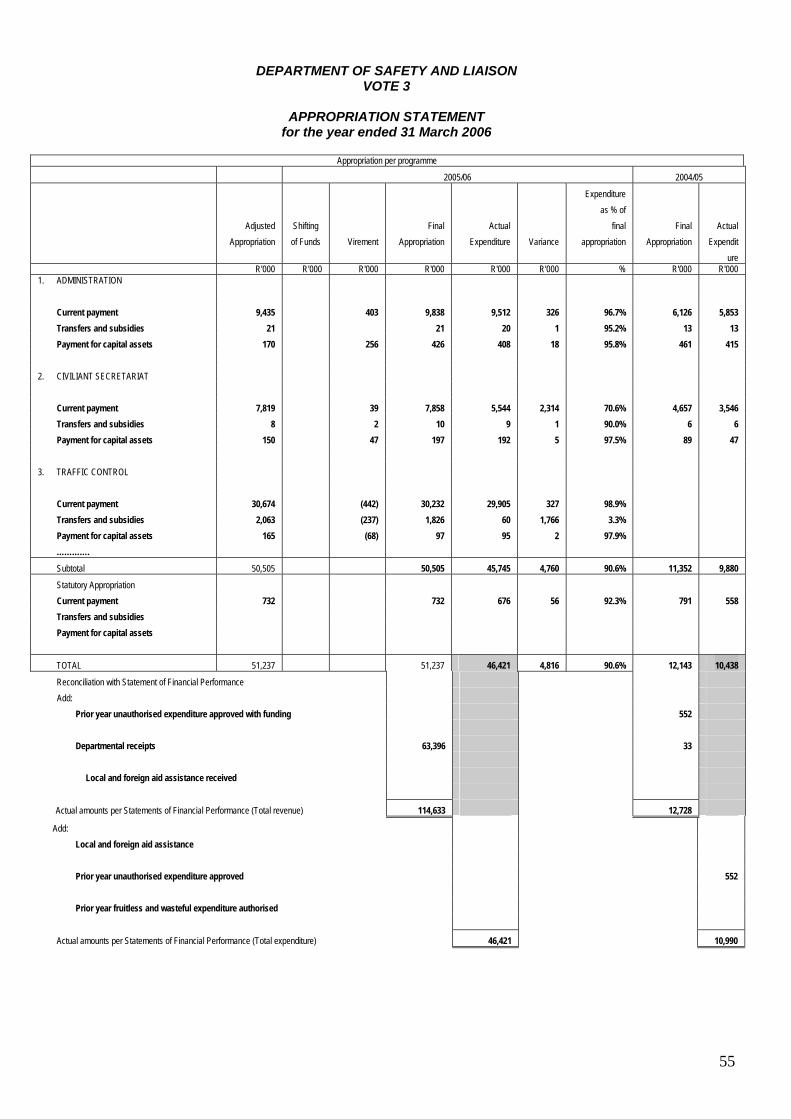
DEPARTMENT OF SAFETY AND LIAISON VOTE 3
APPROPRIATION STATEMENT
for the year ended 31 March 2006
55
Appropriation per programme
2005/06 2004/05
Adjusted Appropriation
Shifting of Funds
Virement
Final Appropriation
Actual Expenditure
Variance
Expenditure as % of
final appropriation
Final Appropriation
Actual Expendit
ure R'000 R'000 R'000 R'000 R'000 R'000 % R'000 R'000
1. ADMINISTRATION Current payment 9,435 403 9,838 9,512 326 96.7% 6,126 5,853 Transfers and subsidies 21 21 20 1 95.2% 13 13 Payment for capital assets 170 256 426 408 18 95.8% 461 415 2. CIVILIANT SECRETARIAT Current payment 7,819 39 7,858 5,544 2,314 70.6% 4,657 3,546 Transfers and subsidies 8 2 10 9 1 90.0% 6 6 Payment for capital assets 150 47 197 192 5 97.5% 89 47 3. TRAFFIC CONTROL Current payment 30,674 (442) 30,232 29,905 327 98.9% Transfers and subsidies 2,063 (237) 1,826 60 1,766 3.3% Payment for capital assets 165 (68) 97 95 2 97.9% ………….
Subtotal 50,505 50,505 45,745 4,760 90.6% 11,352 9,880
Statutory Appropriation Current payment 732 732 676 56 92.3% 791 558 Transfers and subsidies Payment for capital assets
TOTAL 51,237 51,237 46,421 4,816 90.6% 12,143 10,438
Reconciliation with Statement of Financial Performance Add:
Prior year unauthorised expenditure approved with funding 552
Departmental receipts 63,396 33
Local and foreign aid assistance received
Actual amounts per Statements of Financial Performance (Total revenue) 114,633 12,728
Add: Local and foreign aid assistance
Prior year unauthorised expenditure approved 552
Prior year fruitless and wasteful expenditure authorised
Actual amounts per Statements of Financial Performance (Total expenditure) 46,421 10,990
DEPARTMENT OF SAFETY AND LIAISON VOTE 3
APPROPRIATION STATEMENT
for the year ended 31 MARCH 2006
56
Appropriation per economic classification
2005/06 2004/05
Adjusted
Appropriation
Shifting of
Funds
Virement
Final
Appropriation
Actual
Expenditure
Variance
Expenditure as % of final
appropriation
Final
Appropriation
Actual
expenditure
R'000 R'000 R'000 R'000 R'000 R'000 % R'000 R'000 Current payments Compensation of employees 30,436 30,436 27,816 2,620 91.4% 6.087 5,536 Goods and services 17,492 17,492 17,145 347 98.0% 4,696 3,863 Transfers and subsidies Provinces and municipalities 92 (235) (143) 89 (232) -62.2% 19 19 Public corporations and private enterprises
2,000 2,000 2000 0.0%
Payments for capital assets Machinery and equipment 485 235 720 695 25 96.5% 550 462 Total 50,505 50,505 45,745 4,760 90.6% 11,352 9,880
Statutory Appropriation
2005/06 2004/05
Details of direct changes against the National/Provincial Revenue Fund
Adjusted
Appropriation
Shifting of
Funds
Virement
Final
Appropriation
Actual
Expenditure
Variance
Expenditure as % of final
appropriation
Final
Appropriation
Actual
expenditure
R'000 R'000 R'000 R'000 R'000 R'000 % R'000 R'000 Member of executive committee / parliamentary officers/legislature
732
732 676 56 92.3% 791 558
Total 732 732 676 56 92.3% 791 558
DEPARTMENT OF SAFETY AND LIAISON VOTE 3
APPROPRIATION STATEMENT
for the year ended 31 MARCH 2006
57
Statutory Appropriation per economic classification
2005/06 2004/05
Adjusted
Appropriation
Shifting of Funds
Virement
Final
Appropriation
Actual
Expenditure
Variance
Expenditure as % of final
appropriation
Final
Appropriation
Actual
expenditure
R'000 R'000 R'000 R'000 R'000 R'000 % R'000 R'000 Current payment Compensation of employees 732 732 676 56 92.3% 791 558 Total 732 732 676 56 92.3% 791 558
58
2005/06 2004/05
Programme per subprogramme
Adjusted Appropriation
Shifting of Funds
Virement
Final Appropriation
Actual Expendit
ure
Variance
Expenditure as % of
final appropriation
Final Appropriation
Actual Expenditure
R'000 R'000 R'000 R'000 R'000 R'000 % R'000 R'000 1.1 Office of the MEC Current payment Transfers and subsidies Payment for capital assets 1.2 Management Current payment Transfers and subsidies Payment for capital
assets 1.3 Corporate Services Current payment Transfers and subsidies Payment for capital assets
2,445
7 70
838 2
6,152 12
100
(79)
(70)
59 1
7
20 (1) 63
403
256
2,366
7
897 3
7
6,575 11
419
2,323
6
857 3
7
6,332 11
401
43 1
40
243
18
98.2% 85.7%
0%
95.5% 100%
100%
96.3% 100%
95.7%
2,142
6 350
738 2
-
3,245 5
111
1,988
6 343
656 2
-
3,209 5
72
TOTAL 9,626 659 10,285 9,940 345 96.6% 6,600 6,281
2005/06 2004/05
Economic Classification
Adjusted
Appropriation
Shifting of Funds
Virement
Final
Appropriation
Actual
Expendit
ure
Variance
Expenditure as % of final
appropriation
Final
Appropriation
Actual
Expenditure
R'000 R'000 R'000 R'000 R'000 R'000 % R'000 R'000 Current payment Compensation of employees Goods and services Transfers and subsidies to: Provinces and municipalities Payment for capital assets Machinery and equipment
6,368 3,067
21
170
(299)
702
256
6,069 3,769
20
426
5,810 3,702
20
408
259 67
1
18
95.7% 98.2%
95.2%
95.8%
3,538 2,588
13
461
3,449 2,404
13
415
Total 9,626 659 10,285 9,940 345 96.6% 6,600 6,281
DEPARTMENT OF SAFETY AND LIAISON VOTE 3
PROGRAMME 2
for the year ended 31 March 2006
59
2005/06 2004/05
Programme per subprogramme
Adjusted Appropriation
Shifting of Funds
Virement
Final Appropriation
Actual Expendit
ure
Variance
Expenditure as % of
final appropriation
Final Appropriation
Actual Expenditure
R'000 R'000 R'000 R'000 R'000 R'000 % R'000 R'000 2.1 Monitoring, Oversight and Quality Assurance Current payment Transfers and subsidies Payment for capital
assets 2.2 Crime Prevention and Community Police Relations Current payment Transfers and subsidies Payment for capital
assets 2.3 Regional offices Current payment Transfers and subsidies Payment for capital assets
2,720
3 50
3,367 3
50
1,732 2
50
(910)
(1)
198 1
50
712
(50)
43
4
4
35 2
1,810
2 93
3,569 4
104
2,479 4
965
2 93
2,516 3
99
2,063 4
845
1,053 1
5
416
53.3%
100.0% 100.0%
70.5% 75.0%
95.2%
83.2% 100% 0.0%
1,017
2 30
1,948 1
41
1,948 3
18
891
2 9
1,094 1
-
1,561 3
38
TOTAL 7,977 88 8,065 5,745 2,320 71.2% 4,752 3,599
2005/06 2004/05
Economic Classification
Adjusted
Appropriation
Shifting of
Funds
Virement
Final
Appropriation
Actual
Expendit
ure
Variance
Expenditure as % of final
appropriation
Final
Appropriation
Actual
Expenditure
R'000 R'000 R'000 R'000 R'000 R'000 % R'000 R'000 Current payment Compensation of employees Goods and services Transfers and subsidies to: Provinces and municipalities Payment for capital assets Machinery and equipment
5,249 2,570
8
150
39
2
47
5,249 2,609
10
197
2,937 2,607
9
192
2,312
2
1
5
56.0% 99.9%
90.0%
97.5%
2,549 2,108
6
89
2,087 1,459
6
47
Total 7,977 88 8,065 5,745 2,320 71.2% 4,752 3,599
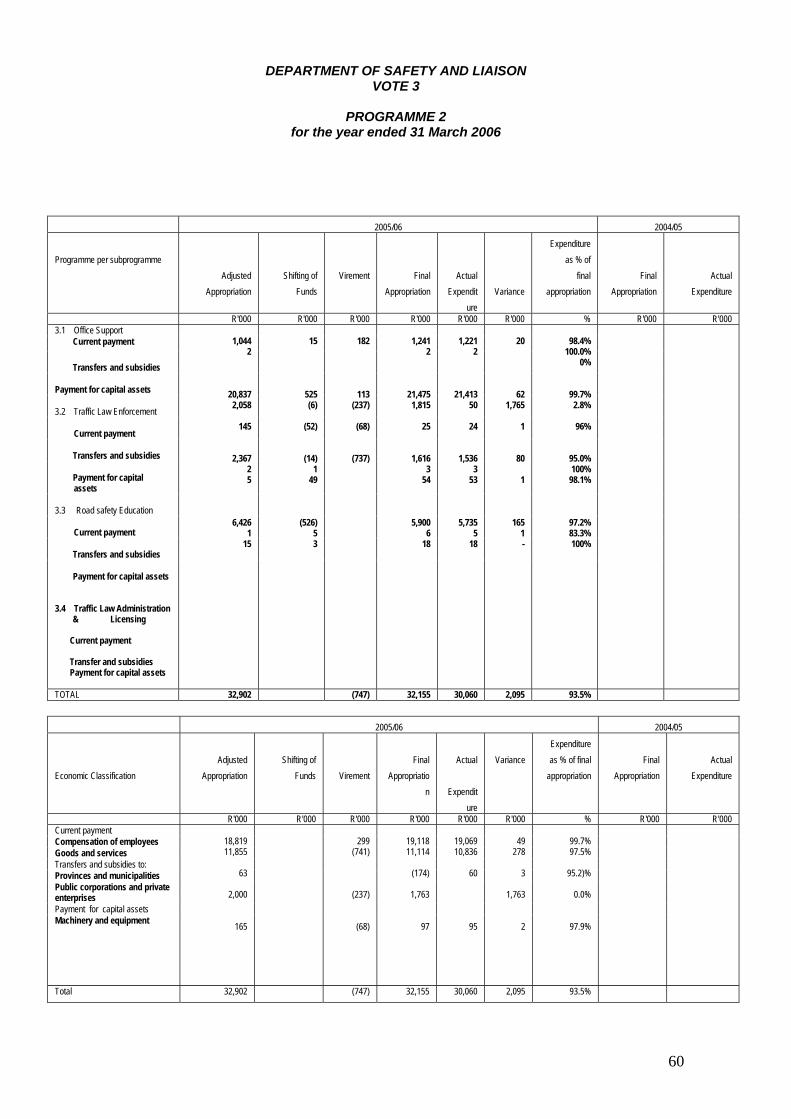
DEPARTMENT OF SAFETY AND LIAISON VOTE 3
PROGRAMME 2
for the year ended 31 March 2006
60
2005/06 2004/05
Programme per subprogramme
Adjusted Appropriation
Shifting of Funds
Virement
Final Appropriation
Actual Expendit
ure
Variance
Expenditure as % of
final appropriation
Final Appropriation
Actual Expenditure
R'000 R'000 R'000 R'000 R'000 R'000 % R'000 R'000 3.1 Office Support Current payment Transfers and subsidies Payment for capital assets 3.2 Traffic Law Enforcement Current payment Transfers and subsidies Payment for capital
assets 3.3 Road safety Education Current payment Transfers and subsidies Payment for capital assets 3.4 Traffic Law Administration
& Licensing Current payment Transfer and subsidies Payment for capital assets
1,044
2
20,837 2,058
145
2,367 2 5
6,426 1
15
15
525 (6)
(52)
(14) 1
49
(526) 5 3
182
113 (237)
(68)
(737)
1,241
2
21,475 1,815
25
1,616 3
54
5,900 6
18
1,221
2
21,413 50
24
1,536 3
53
5,735 5
18
20
62 1,765
1
80
1
165 1 -
98.4%
100.0% 0%
99.7% 2.8%
96%
95.0% 100%
98.1%
97.2% 83.3% 100%
TOTAL 32,902 (747) 32,155 30,060 2,095 93.5%
2005/06 2004/05
Economic Classification
Adjusted
Appropriation
Shifting of
Funds
Virement
Final
Appropriation
Actual
Expendit
ure
Variance
Expenditure as % of final
appropriation
Final
Appropriation
Actual
Expenditure
R'000 R'000 R'000 R'000 R'000 R'000 % R'000 R'000 Current payment Compensation of employees Goods and services Transfers and subsidies to: Provinces and municipalities Public corporations and private enterprises Payment for capital assets Machinery and equipment
18,819 11,855
63
2,000
165
299
(741)
(237)
(68)
19,118 11,114
(174)
1,763
97
19,069 10,836
60
95
49
278
3
1,763
2
99.7% 97.5%
95.2)%
0.0%
97.9%
Total 32,902 (747) 32,155 30,060 2,095 93.5%
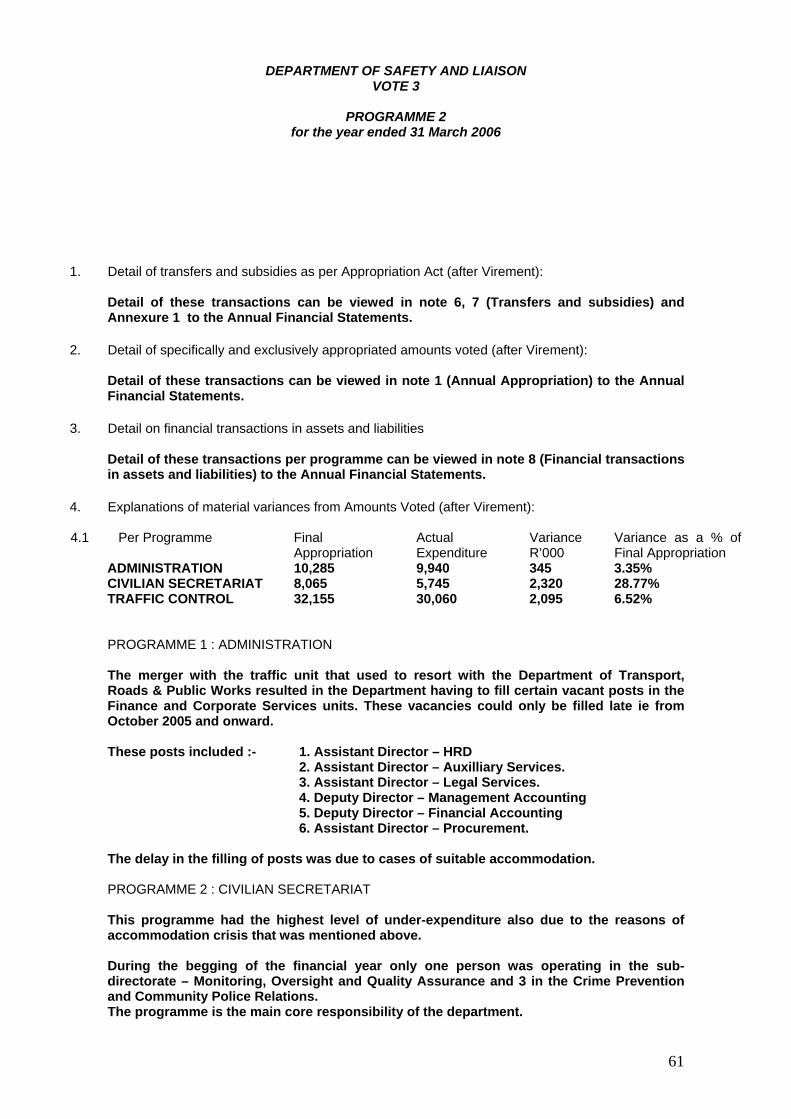
DEPARTMENT OF SAFETY AND LIAISON VOTE 3
PROGRAMME 2
for the year ended 31 March 2006
61
1. Detail of transfers and subsidies as per Appropriation Act (after Virement): Detail of these transactions can be viewed in note 6, 7 (Transfers and subsidies) and Annexure 1 to the Annual Financial Statements.
2. Detail of specifically and exclusively appropriated amounts voted (after Virement): Detail of these transactions can be viewed in note 1 (Annual Appropriation) to the Annual Financial Statements.
3. Detail on financial transactions in assets and liabilities Detail of these transactions per programme can be viewed in note 8 (Financial transactions in assets and liabilities) to the Annual Financial Statements.
4. Explanations of material variances from Amounts Voted (after Virement): 4.1 Per Programme Final
Appropriation Actual Expenditure
Variance R’000
Variance as a % of Final Appropriation
ADMINISTRATION 10,285 9,940 345 3.35% CIVILIAN SECRETARIAT 8,065 5,745 2,320 28.77% TRAFFIC CONTROL 32,155 30,060 2,095 6.52%
PROGRAMME 1 : ADMINISTRATION The merger with the traffic unit that used to resort with the Department of Transport, Roads & Public Works resulted in the Department having to fill certain vacant posts in the Finance and Corporate Services units. These vacancies could only be filled late ie from October 2005 and onward. These posts included :- 1. Assistant Director – HRD 2. Assistant Director – Auxilliary Services. 3. Assistant Director – Legal Services. 4. Deputy Director – Management Accounting 5. Deputy Director – Financial Accounting 6. Assistant Director – Procurement. The delay in the filling of posts was due to cases of suitable accommodation. PROGRAMME 2 : CIVILIAN SECRETARIAT This programme had the highest level of under-expenditure also due to the reasons of accommodation crisis that was mentioned above. During the begging of the financial year only one person was operating in the sub-directorate – Monitoring, Oversight and Quality Assurance and 3 in the Crime Prevention and Community Police Relations. The programme is the main core responsibility of the department.
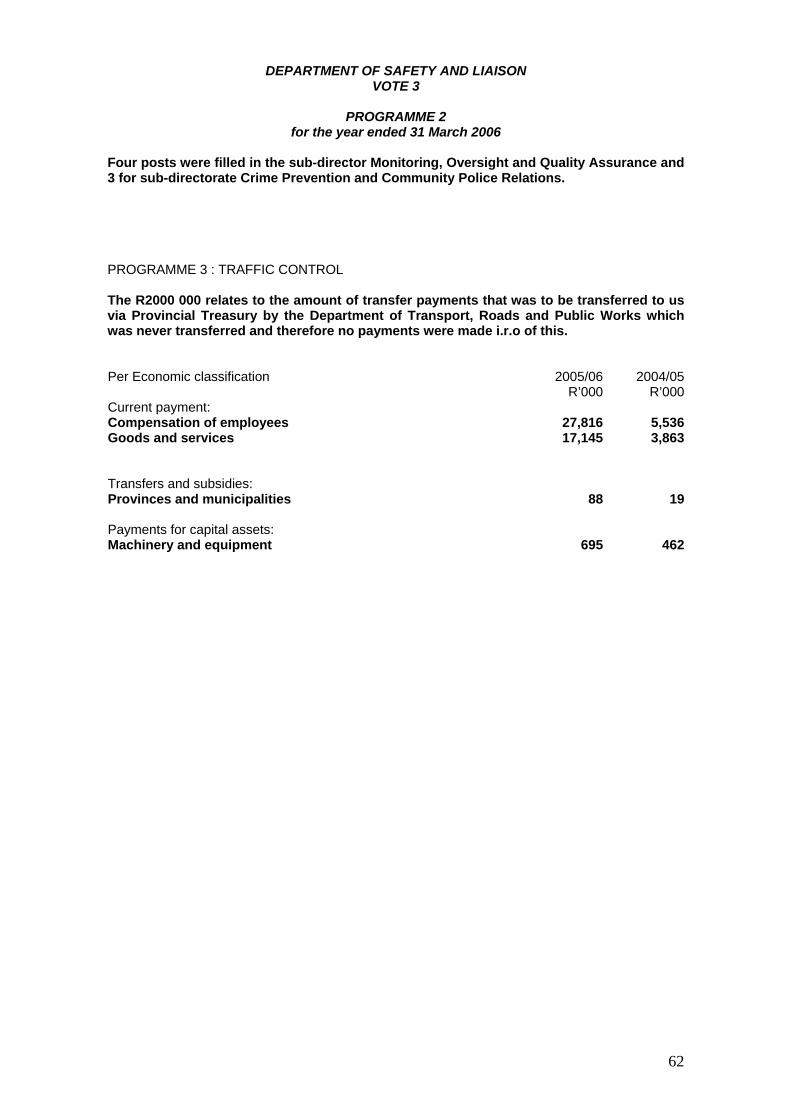
DEPARTMENT OF SAFETY AND LIAISON VOTE 3
PROGRAMME 2
for the year ended 31 March 2006
62
Four posts were filled in the sub-director Monitoring, Oversight and Quality Assurance and 3 for sub-directorate Crime Prevention and Community Police Relations. PROGRAMME 3 : TRAFFIC CONTROL The R2000 000 relates to the amount of transfer payments that was to be transferred to us via Provincial Treasury by the Department of Transport, Roads and Public Works which was never transferred and therefore no payments were made i.r.o of this. Per Economic classification 2005/06 2004/05 R’000 R’000Current payment: Compensation of employees 27,816 5,536Goods and services 17,145 3,863 Transfers and subsidies: Provinces and municipalities 88 19 Payments for capital assets: Machinery and equipment 695 462
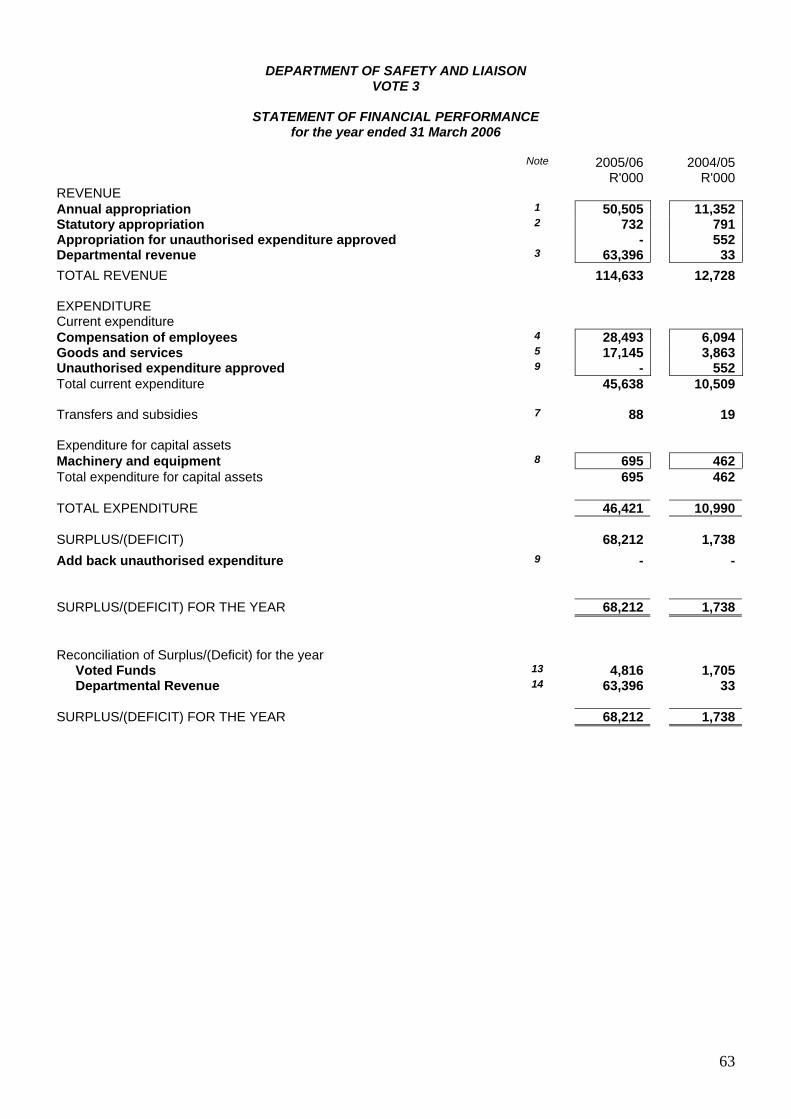
DEPARTMENT OF SAFETY AND LIAISON VOTE 3
STATEMENT OF FINANCIAL PERFORMANCE
for the year ended 31 March 2006
63
Note 2005/06 2004/05 R'000 R'000REVENUE Annual appropriation 1 50,505 11,352Statutory appropriation 2 732 791Appropriation for unauthorised expenditure approved - 552Departmental revenue 3 63,396 33TOTAL REVENUE 114,633 12,728 EXPENDITURE Current expenditure Compensation of employees 4 28,493 6,094Goods and services 5 17,145 3,863Unauthorised expenditure approved 9 - 552Total current expenditure 45,638 10,509 Transfers and subsidies 7 88 19 Expenditure for capital assets Machinery and equipment 8 695 462Total expenditure for capital assets 695 462 TOTAL EXPENDITURE 46,421 10,990 SURPLUS/(DEFICIT) 68,212 1,738Add back unauthorised expenditure 9 - - SURPLUS/(DEFICIT) FOR THE YEAR 68,212 1,738 Reconciliation of Surplus/(Deficit) for the year
Voted Funds 13 4,816 1,705Departmental Revenue 14 63,396 33
SURPLUS/(DEFICIT) FOR THE YEAR 68,212 1,738
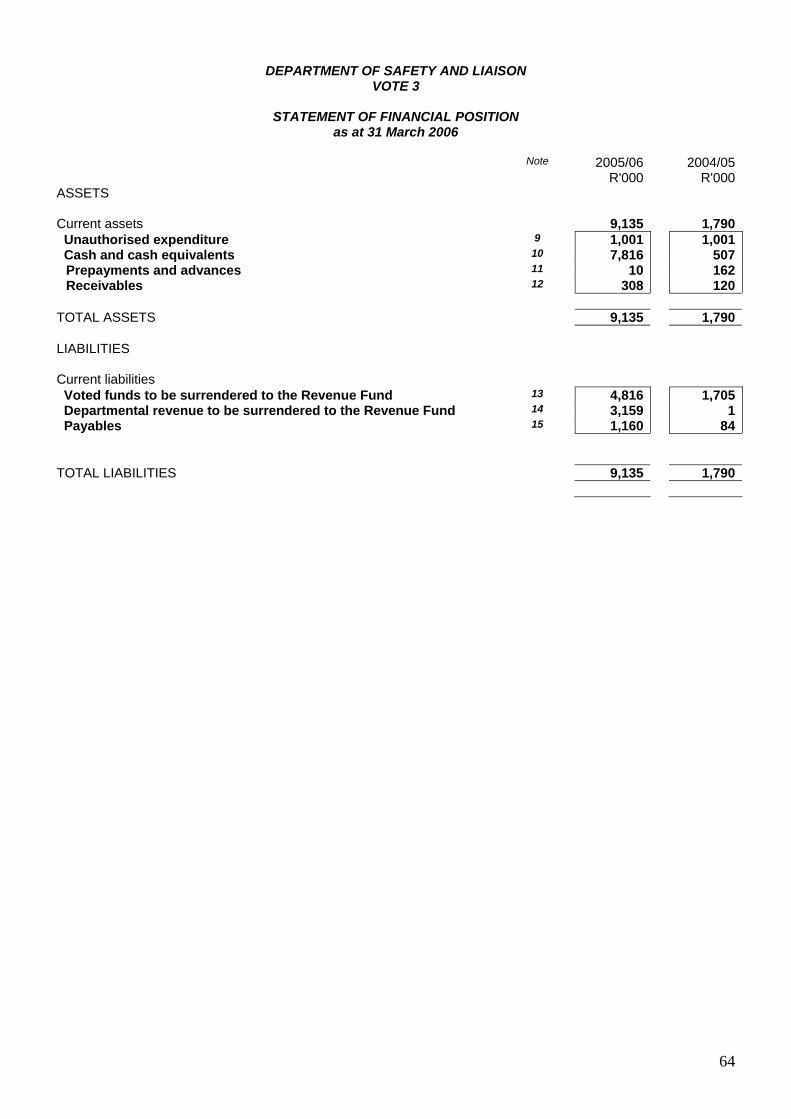
DEPARTMENT OF SAFETY AND LIAISON VOTE 3
STATEMENT OF FINANCIAL POSITION
as at 31 March 2006
64
Note 2005/06 2004/05 R'000 R'000ASSETS Current assets 9,135 1,790 Unauthorised expenditure 9 1,001 1,001 Cash and cash equivalents 10 7,816 507
Prepayments and advances 11 10 162Receivables 12 308 120
TOTAL ASSETS 9,135 1,790 LIABILITIES Current liabilities Voted funds to be surrendered to the Revenue Fund 13 4,816 1,705 Departmental revenue to be surrendered to the Revenue Fund 14 3,159 1 Payables 15 1,160 84 TOTAL LIABILITIES 9,135 1,790
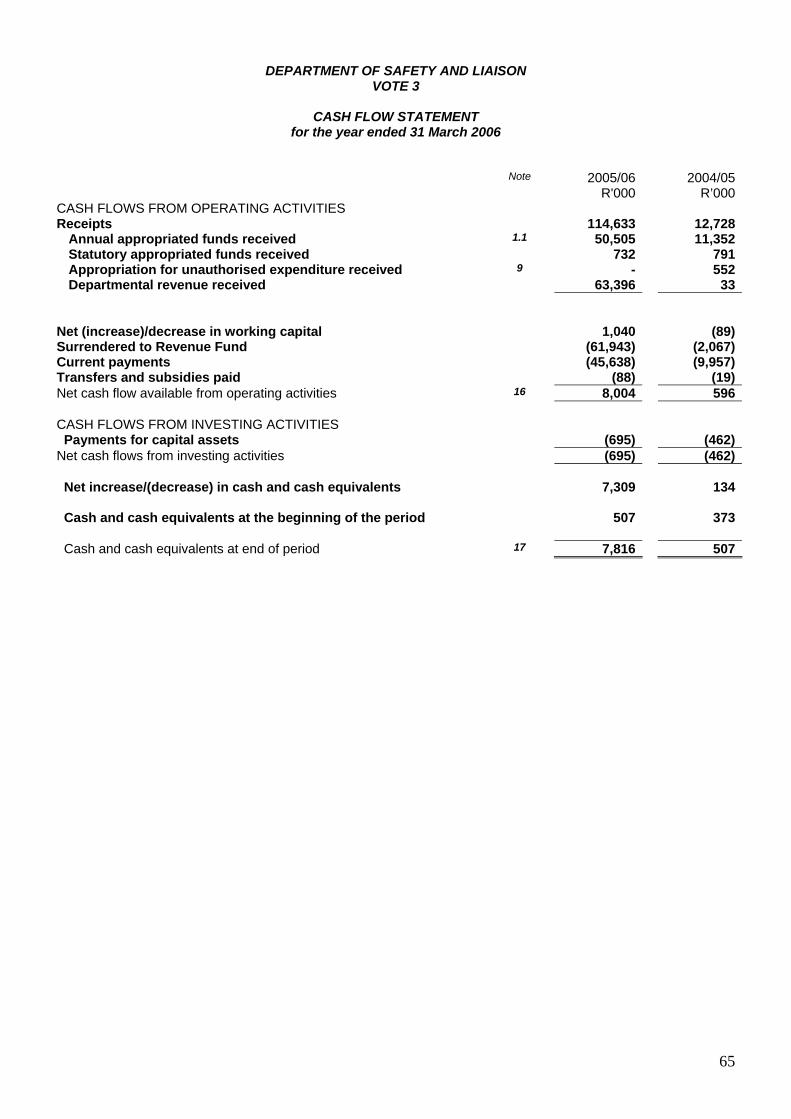
DEPARTMENT OF SAFETY AND LIAISON VOTE 3
CASH FLOW STATEMENT
for the year ended 31 March 2006
65
Note 2005/06 2004/05 R'000 R’000CASH FLOWS FROM OPERATING ACTIVITIES Receipts 114,633 12,728
Annual appropriated funds received 1.1 50,505 11,352Statutory appropriated funds received 732 791Appropriation for unauthorised expenditure received 9 - 552Departmental revenue received 63,396 33
Net (increase)/decrease in working capital 1,040 (89)Surrendered to Revenue Fund (61,943) (2,067)Current payments (45,638) (9,957)Transfers and subsidies paid (88) (19)Net cash flow available from operating activities 16 8,004 596 CASH FLOWS FROM INVESTING ACTIVITIES Payments for capital assets (695) (462)Net cash flows from investing activities (695) (462) Net increase/(decrease) in cash and cash equivalents 7,309 134 Cash and cash equivalents at the beginning of the period 507 373 Cash and cash equivalents at end of period 17 7,816 507
DEPARTMENT OF SAFETY AND LIAISON VOTE 3
NOTES TO THE ANNUAL FINANCIAL STATEMENTS
for the year ended 31 March 2006
66
1. Annual Appropriation 1.1 Annual Appropriation Included are funds appropriated in terms of the Appropriation Act for National Departments (Voted funds) and Provincial Departments :**
Final Appropriation
Actual FundsReceived
Funds not requested/
not received
Appropriation received2004/05
Programmes R’000 R’000 R’000 R’000ADMINISTRATION
10,285 10,285 - 6,600
CIVILIAN SECRETARIAT
8,065 8,065
- 4,752
TRAFFIC CONROL
32,155 32,155
- -
Total 50,505 50,505 - 11,352
2. Statutory Appropriation
2005/06 2004/05President and Deputy President’s salaries Member of executive committee/parliamentary officers 732 791 732 791
3. Departmental revenue to be surrendered to revenue fund Description Notes 2005/06 2004/05 Tax revenue 59,068 -Sales of goods and services other than capital assets 3.1 2,394 33Fines, penalties and forfeits 1,930 -Interest, dividends and rent on land 3.2 4 -Departmental revenue collected 63,396 33 3.1 Sales of goods and services other than capital assets
2005/06 2004/05 Administrative fees 2,394 33
Total 2,394 33 3.2 Interest, dividends and rent on land
2005/06 2004/05 Rent on land 4 - Total 4 -
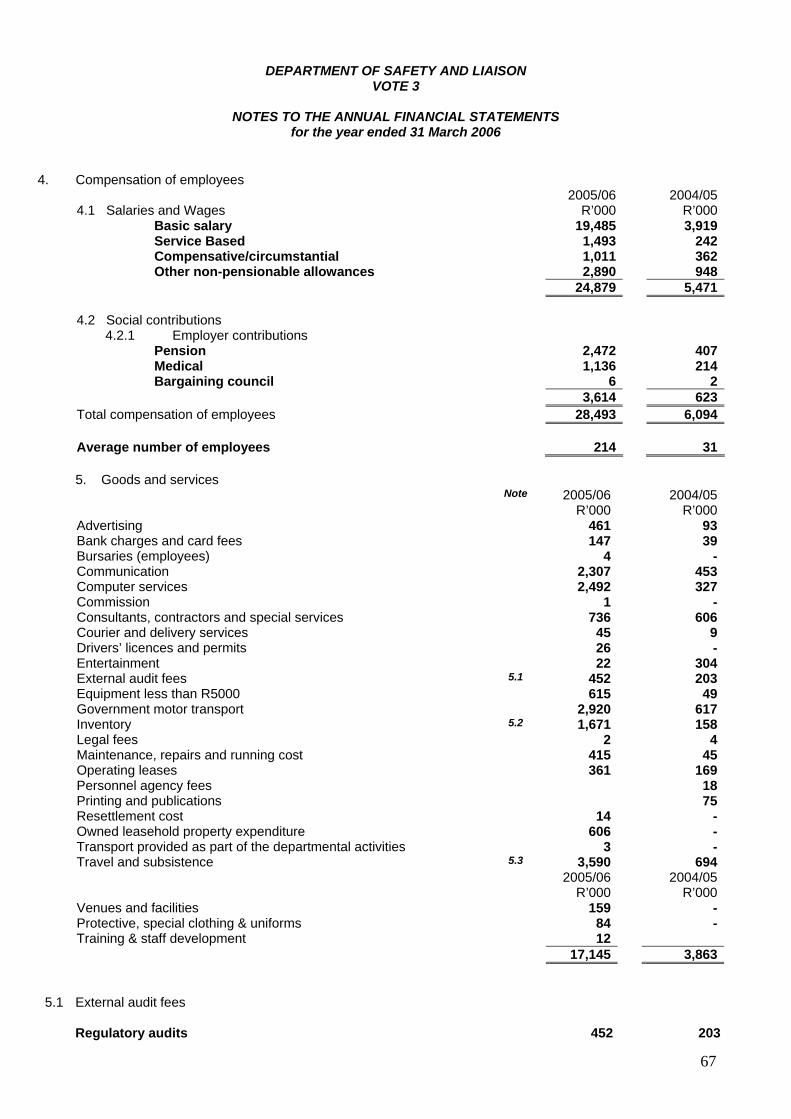
DEPARTMENT OF SAFETY AND LIAISON VOTE 3
NOTES TO THE ANNUAL FINANCIAL STATEMENTS
for the year ended 31 March 2006
67
4. Compensation of employees
2005/06 2004/054.1 Salaries and Wages R’000 R’000
Basic salary 19,485 3,919Service Based 1,493 242Compensative/circumstantial 1,011 362Other non-pensionable allowances 2,890 948 24,879 5,471
4.2 Social contributions
4.2.1 Employer contributions Pension 2,472 407Medical 1,136 214Bargaining council 6 2 3,614 623
Total compensation of employees 28,493 6,094 Average number of employees 214 31
5. Goods and services Note 2005/06 2004/05 R’000 R’000Advertising 461 93Bank charges and card fees 147 39Bursaries (employees) 4 -Communication 2,307 453Computer services 2,492 327Commission 1 -Consultants, contractors and special services 736 606Courier and delivery services 45 9Drivers’ licences and permits 26 -Entertainment 22 304External audit fees 5.1 452 203Equipment less than R5000 615 49Government motor transport 2,920 617Inventory 5.2 1,671 158Legal fees 2 4Maintenance, repairs and running cost 415 45Operating leases 361 169Personnel agency fees 18Printing and publications 75Resettlement cost 14 -Owned leasehold property expenditure 606 -Transport provided as part of the departmental activities 3 -Travel and subsistence 5.3 3,590 694 2005/06 2004/05 R’000 R’000Venues and facilities 159 -Protective, special clothing & uniforms 84 -Training & staff development 12 17,145 3,863
5.1 External audit fees
Regulatory audits 452 203
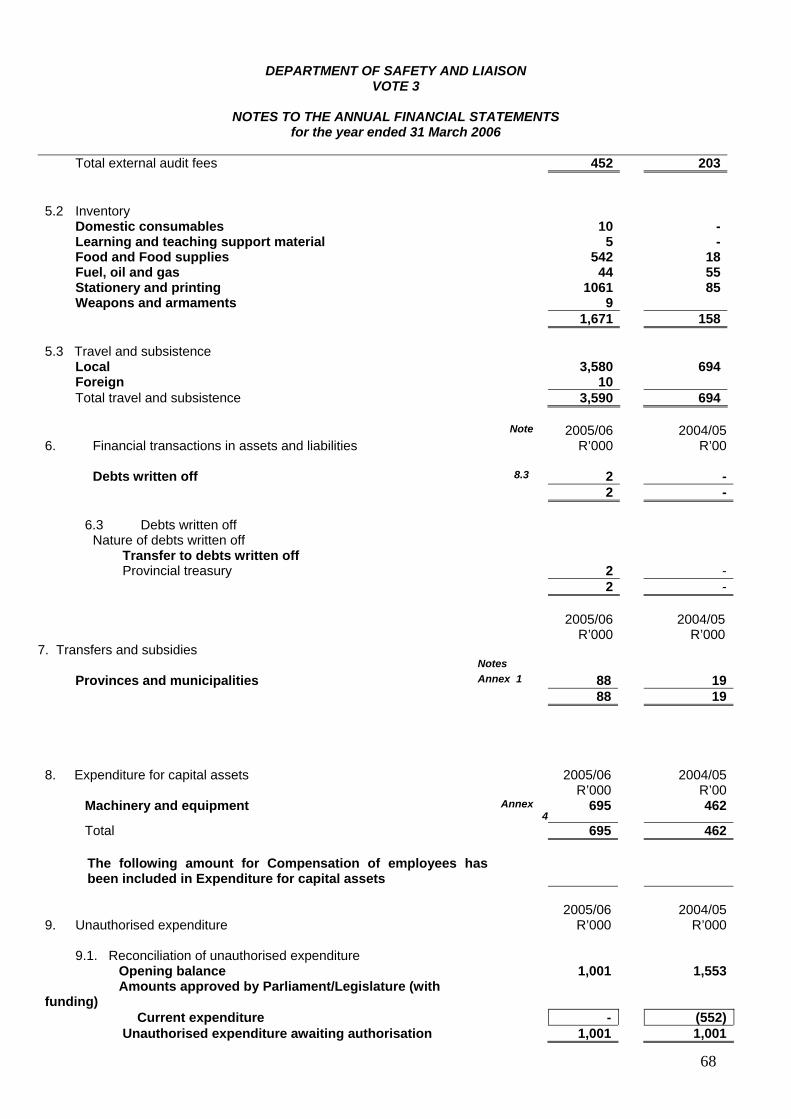
DEPARTMENT OF SAFETY AND LIAISON VOTE 3
NOTES TO THE ANNUAL FINANCIAL STATEMENTS
for the year ended 31 March 2006
68
Total external audit fees 452 203 5.2 Inventory
Domestic consumables 10 -Learning and teaching support material 5 -Food and Food supplies 542 18Fuel, oil and gas 44 55Stationery and printing 1061 85Weapons and armaments 9 1,671 158
5.3 Travel and subsistence Local 3,580 694Foreign 10 Total travel and subsistence 3,590 694
Note 2005/06 2004/056. Financial transactions in assets and liabilities R’000 R’00
Debts written off 8.3 2 - 2 -
6.3 Debts written off Nature of debts written off
Transfer to debts written off Provincial treasury 2 -
2 -
2005/06 2004/05R’000 R’000
7. Transfers and subsidies Notes Provinces and municipalities Annex 1 88 19 88 19
8. Expenditure for capital assets 2005/06 2004/05
R’000 R’00Machinery and equipment Annex
4695 462
Total 695 462
The following amount for Compensation of employees has been included in Expenditure for capital assets
2005/06 2004/059. Unauthorised expenditure R’000 R’000
9.1. Reconciliation of unauthorised expenditure
Opening balance 1,001 1,553 Amounts approved by Parliament/Legislature (with funding)
Current expenditure - (552)Unauthorised expenditure awaiting authorisation 1,001 1,001
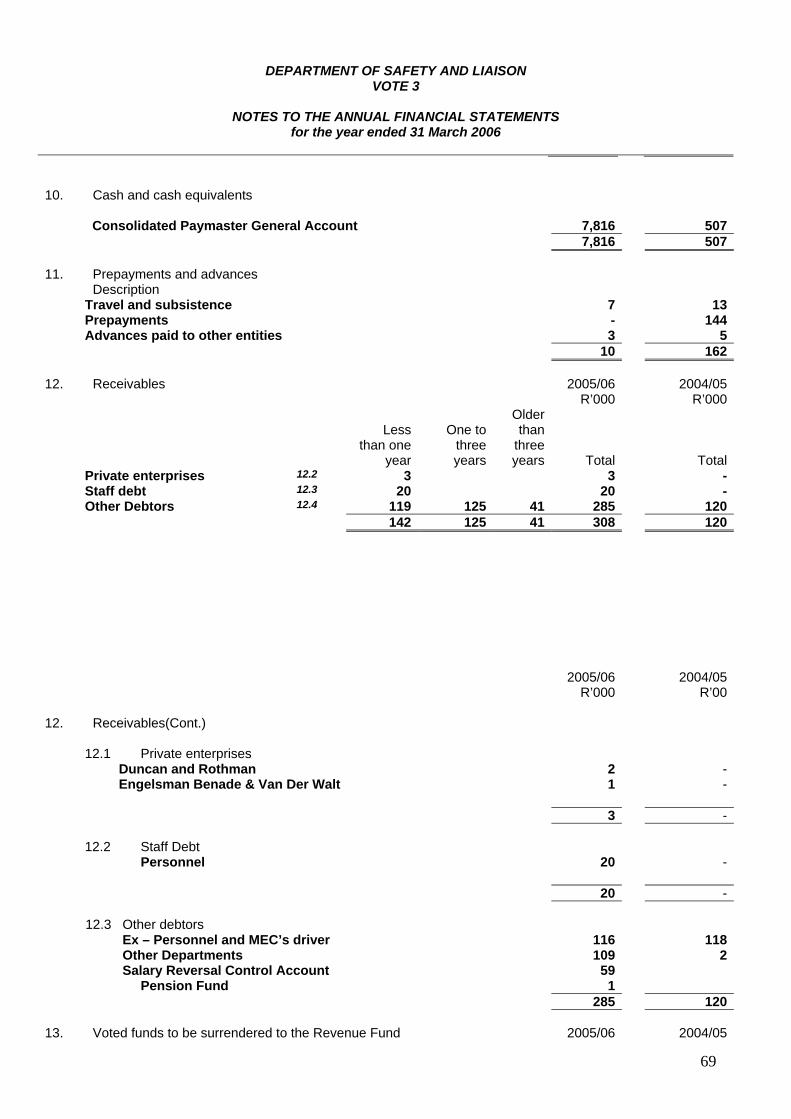
DEPARTMENT OF SAFETY AND LIAISON VOTE 3
NOTES TO THE ANNUAL FINANCIAL STATEMENTS
for the year ended 31 March 2006
69
10. Cash and cash equivalents
Consolidated Paymaster General Account 7,816 507 7,816 507 11. Prepayments and advances Description
Travel and subsistence 7 13Prepayments - 144Advances paid to other entities 3 5
10 162 12. Receivables 2005/06 2004/05
R’000 R’000
Less than one
year
One to
three years
Older than
three years
Total
TotalPrivate enterprises 12.2 3 3 -Staff debt 12.3 20 20 -Other Debtors 12.4 119 125 41 285 120 142 125 41 308 120
2005/06 2004/05 R’000 R’00
12. Receivables(Cont.) 12.1 Private enterprises
Duncan and Rothman 2 - Engelsman Benade & Van Der Walt 1 - 3 -
12.2 Staff Debt Personnel 20 -
20 - 12.3 Other debtors Ex – Personnel and MEC’s driver 116 118 Other Departments 109 2 Salary Reversal Control Account 59
Pension Fund 1 285 120 13. Voted funds to be surrendered to the Revenue Fund 2005/06 2004/05
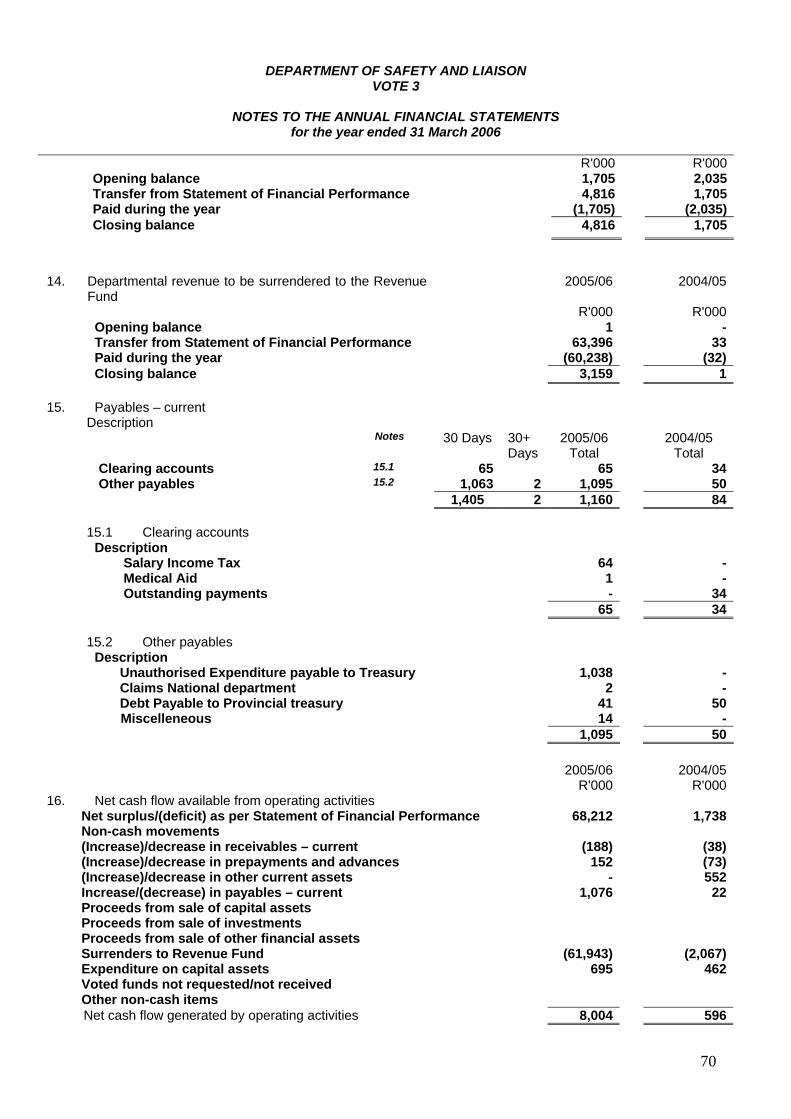
DEPARTMENT OF SAFETY AND LIAISON VOTE 3
NOTES TO THE ANNUAL FINANCIAL STATEMENTS
for the year ended 31 March 2006
70
R'000 R'000 Opening balance 1,705 2,035 Transfer from Statement of Financial Performance 4,816 1,705 Paid during the year (1,705) (2,035) Closing balance 4,816 1,705
14. Departmental revenue to be surrendered to the Revenue
Fund 2005/06 2004/05
R'000 R'000 Opening balance 1 - Transfer from Statement of Financial Performance 63,396 33 Paid during the year (60,238) (32) Closing balance 3,159 1
15. Payables – current
Description Notes 30 Days 30+
Days 2005/06
Total 2004/05
Total Clearing accounts 15.1 65 65 34Other payables 15.2 1,063 2 1,095 50
1,405 2 1,160 84
15.1 Clearing accounts Description Salary Income Tax 64 - Medical Aid 1 - Outstanding payments - 34
65 34
15.2 Other payables Description Unauthorised Expenditure payable to Treasury 1,038 - Claims National department 2 - Debt Payable to Provincial treasury 41 50
Miscelleneous 14 - 1,095 50
2005/06 2004/05 R'000 R'000
16. Net cash flow available from operating activities Net surplus/(deficit) as per Statement of Financial Performance 68,212 1,738Non-cash movements (Increase)/decrease in receivables – current (188) (38)(Increase)/decrease in prepayments and advances 152 (73)(Increase)/decrease in other current assets - 552Increase/(decrease) in payables – current 1,076 22Proceeds from sale of capital assets Proceeds from sale of investments Proceeds from sale of other financial assets Surrenders to Revenue Fund (61,943) (2,067)Expenditure on capital assets 695 462Voted funds not requested/not received Other non-cash items
Net cash flow generated by operating activities 8,004 596
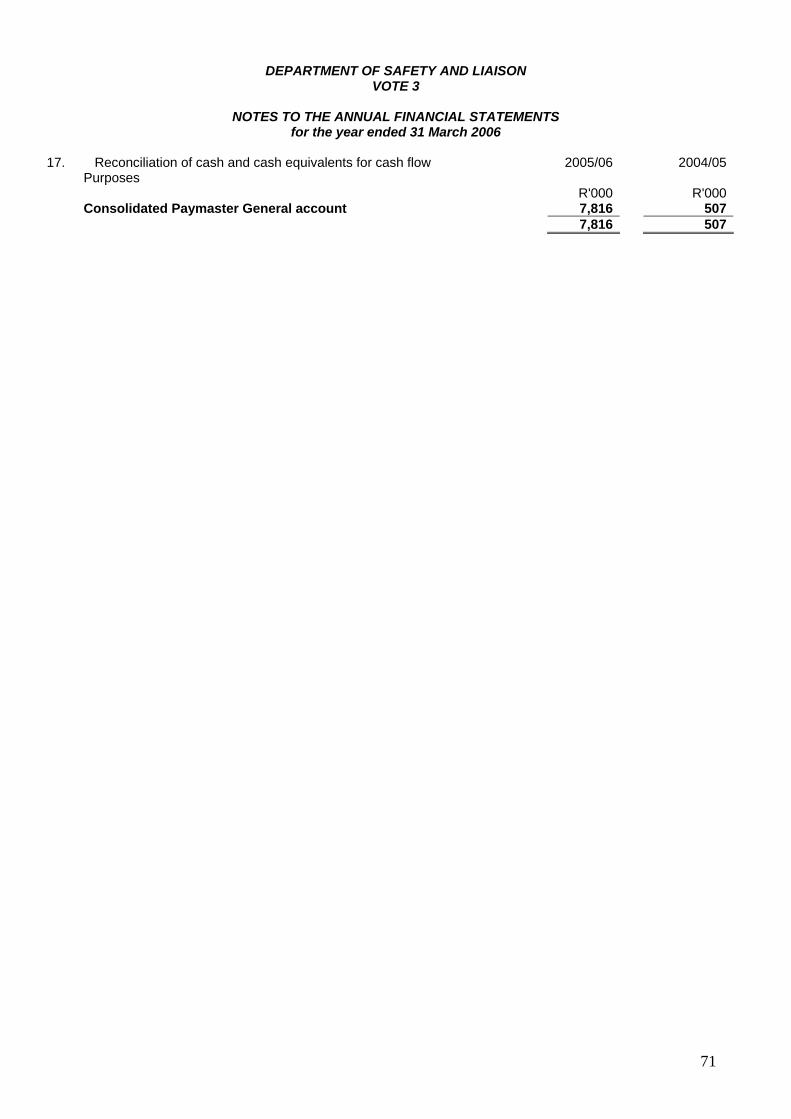
DEPARTMENT OF SAFETY AND LIAISON VOTE 3
NOTES TO THE ANNUAL FINANCIAL STATEMENTS
for the year ended 31 March 2006
71
17. Reconciliation of cash and cash equivalents for cash flow Purposes
2005/06 2004/05
R'000 R'000 Consolidated Paymaster General account 7,816 507 7,816 507
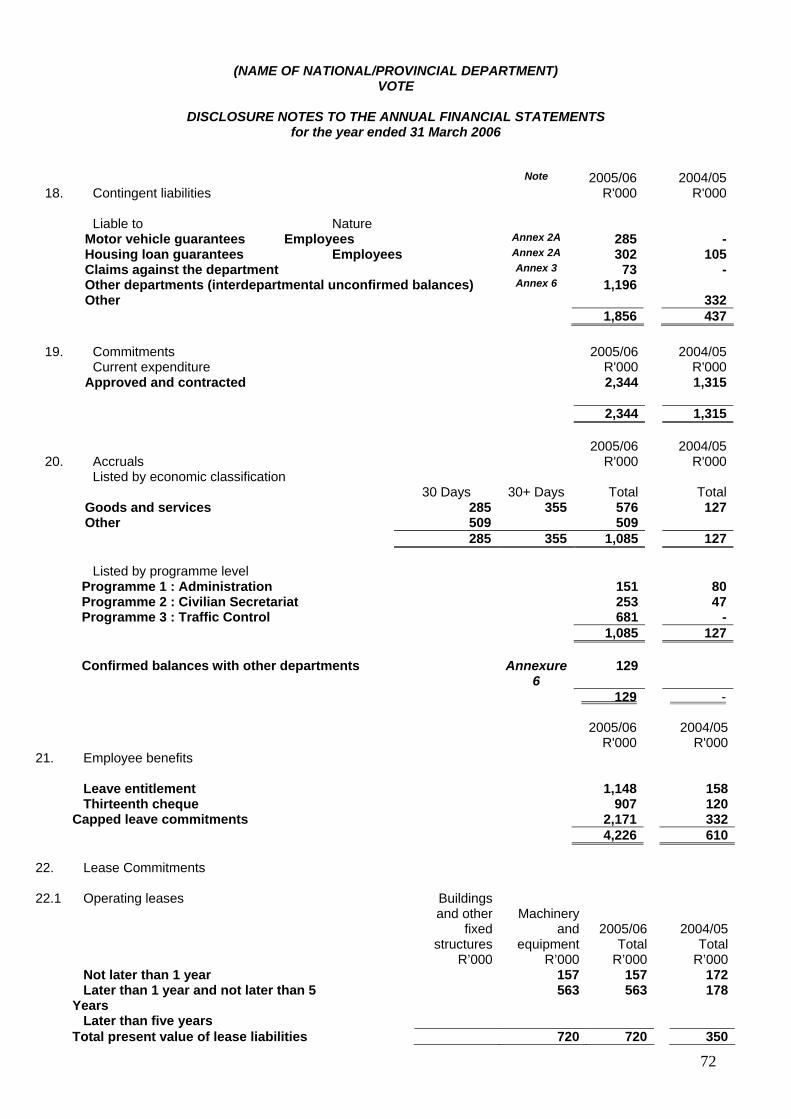
(NAME OF NATIONAL/PROVINCIAL DEPARTMENT) VOTE
DISCLOSURE NOTES TO THE ANNUAL FINANCIAL STATEMENTS
for the year ended 31 March 2006
72
Note 2005/06 2004/0518. Contingent liabilities R'000 R'000 Liable to Nature
Motor vehicle guarantees Employees Annex 2A 285 -Housing loan guarantees Employees Annex 2A 302 105Claims against the department Annex 3 73 -Other departments (interdepartmental unconfirmed balances) Annex 6 1,196 Other 332
1,856 437
19. Commitments 2005/06 2004/05 Current expenditure R'000 R'000
Approved and contracted 2,344 1,315 2,344 1,315 2005/06 2004/0520. Accruals R'000 R'000 Listed by economic classification
30 Days 30+ Days Total TotalGoods and services 285 355 576 127Other 509 509
285 355 1,085 127 Listed by programme level Programme 1 : Administration 151 80 Programme 2 : Civilian Secretariat 253 47 Programme 3 : Traffic Control 681 - 1,085 127 Confirmed balances with other departments Annexure
6 129
129 -
2005/06 2004/05 R'000 R'00021. Employee benefits Leave entitlement 1,148 158 Thirteenth cheque 907 120 Capped leave commitments 2,171 332 4,226 610 22. Lease Commitments
22.1 Operating leases Buildings
and other fixed
structures R’000
Machinery
and equipment
R’000
2005/06 Total
R’000
2004/05 Total
R’000 Not later than 1 year 157 157 172 Later than 1 year and not later than 5 Years
563 563 178
Later than five years Total present value of lease liabilities 720 720 350
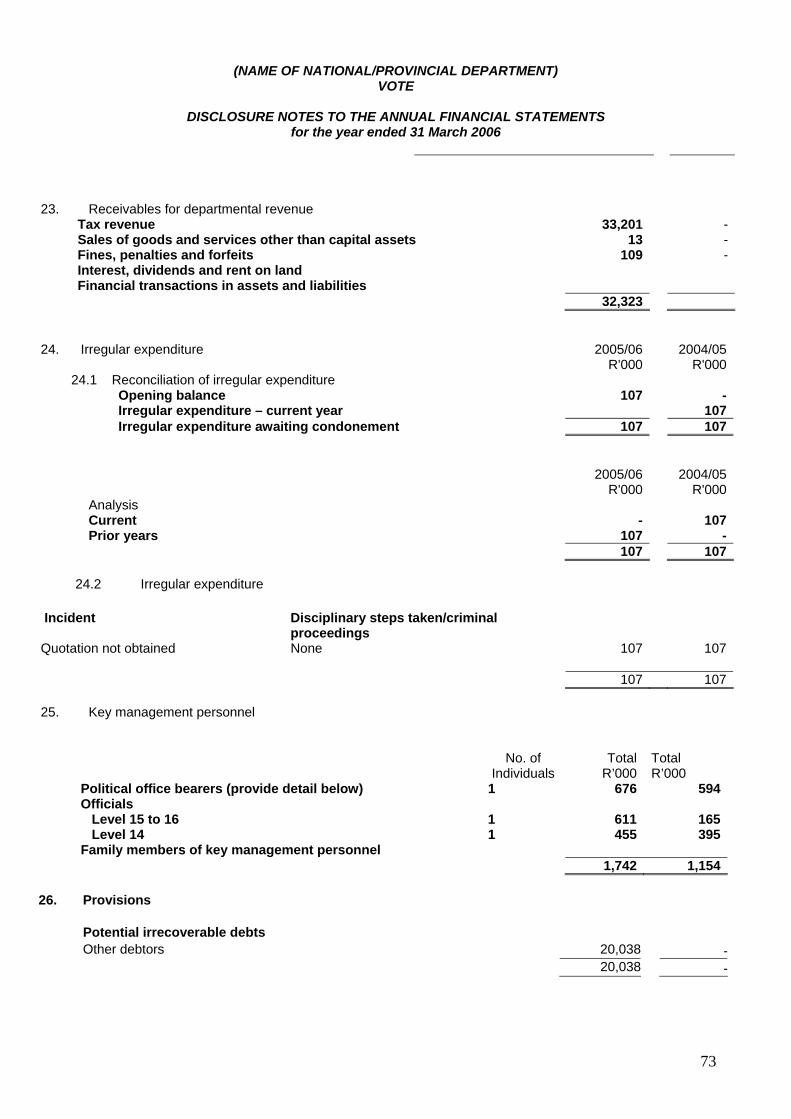
(NAME OF NATIONAL/PROVINCIAL DEPARTMENT) VOTE
DISCLOSURE NOTES TO THE ANNUAL FINANCIAL STATEMENTS
for the year ended 31 March 2006
73
23. Receivables for departmental revenue Tax revenue 33,201 - Sales of goods and services other than capital assets 13 - Fines, penalties and forfeits 109 - Interest, dividends and rent on land Financial transactions in assets and liabilities 32,323
24. Irregular expenditure 2005/06 2004/05 R'000 R'000
24.1 Reconciliation of irregular expenditure Opening balance 107 -Irregular expenditure – current year 107Irregular expenditure awaiting condonement 107 107
2005/06 2004/05 R'000 R'000 Analysis Current - 107 Prior years 107 -
107 107 24.2 Irregular expenditure
Incident Disciplinary steps taken/criminal proceedings
Quotation not obtained None 107 107 107 107
25. Key management personnel
No. of
Individuals Total
R’000 Total R’000
Political office bearers (provide detail below) 1 676 594Officials Level 15 to 16 1 611 165 Level 14 1 455 395Family members of key management personnel 1,742 1,154
26. Provisions Potential irrecoverable debts Other debtors 20,038 - 20,038 -
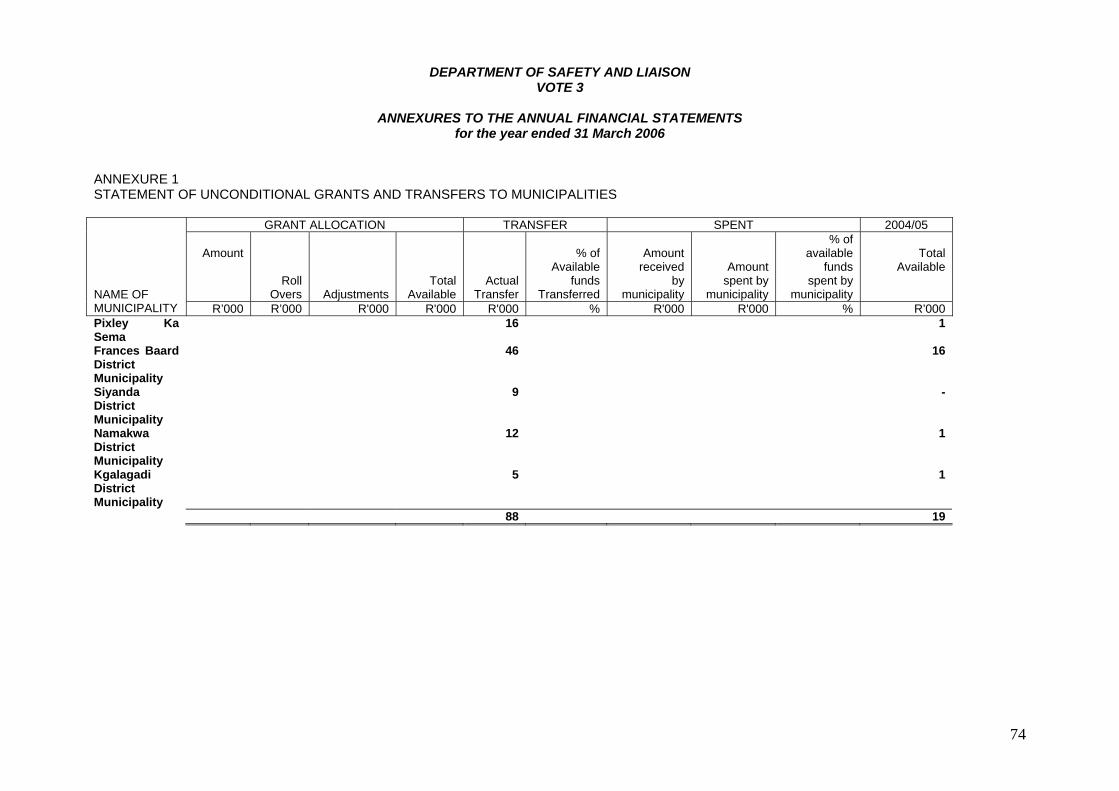
DEPARTMENT OF SAFETY AND LIAISON VOTE 3
ANNEXURES TO THE ANNUAL FINANCIAL STATEMENTS
for the year ended 31 March 2006
74
ANNEXURE 1 STATEMENT OF UNCONDITIONAL GRANTS AND TRANSFERS TO MUNICIPALITIES
GRANT ALLOCATION TRANSFER SPENT 2004/05
Amount
Roll Overs
Adjustments
TotalAvailable
ActualTransfer
% of
Available funds
Transferred
Amount
receivedby
municipality
Amount spent by
municipality
% of available
fundsspent by
municipality
Total
Available NAME OF MUNICIPALITY R’000 R’000 R'000 R'000 R'000 % R'000 R'000 % R’000 Pixley Ka Sema
16 1
Frances Baard District Municipality
46 16
Siyanda District Municipality
9 -
Namakwa District Municipality
12 1
Kgalagadi District Municipality
5 1
88 19
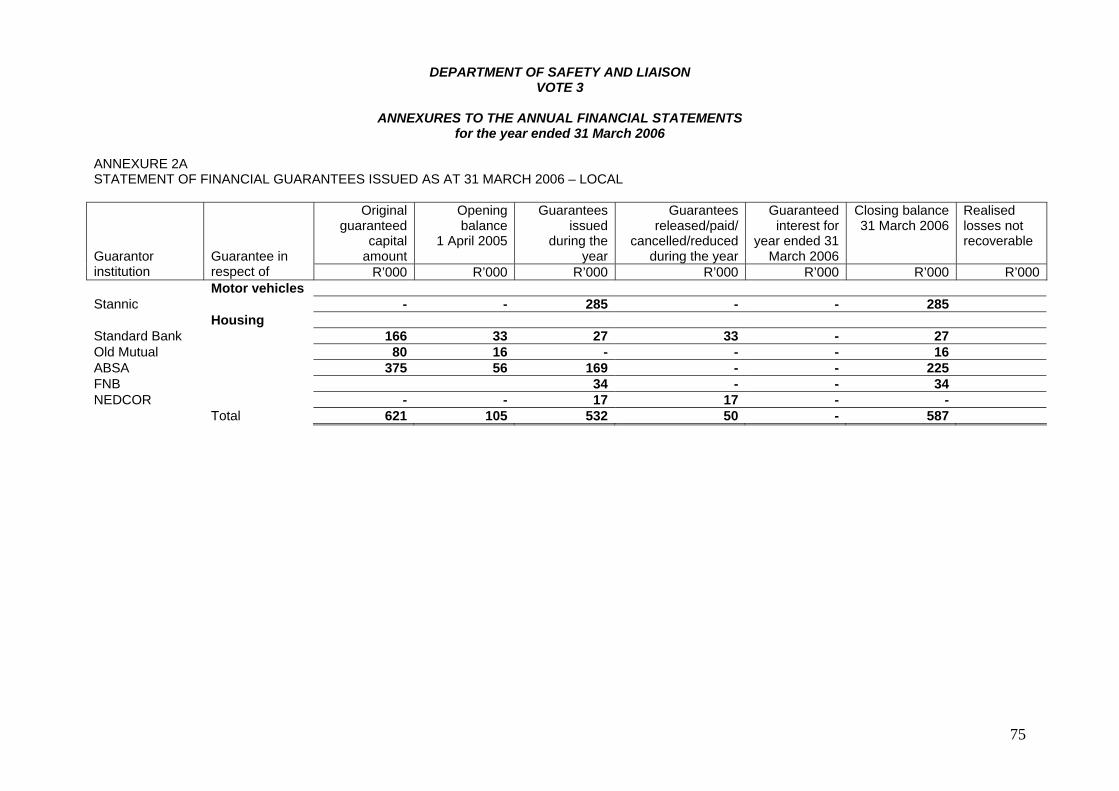
DEPARTMENT OF SAFETY AND LIAISON VOTE 3
ANNEXURES TO THE ANNUAL FINANCIAL STATEMENTS
for the year ended 31 March 2006
75
ANNEXURE 2A STATEMENT OF FINANCIAL GUARANTEES ISSUED AS AT 31 MARCH 2006 – LOCAL
Originalguaranteed
capitalamount
Opening balance
1 April 2005
Guaranteesissued
during theyear
Guaranteesreleased/paid/
cancelled/reduced during the year
Guaranteed interest for
year ended 31 March 2006
Closing balance31 March 2006
Realised losses not recoverable
Guarantor institution
Guarantee in respect of R’000 R’000 R’000 R’000 R’000 R’000 R’000
Motor vehicles Stannic - - 285 - - 285 Housing Standard Bank 166 33 27 33 - 27 Old Mutual 80 16 - - - 16 ABSA 375 56 169 - - 225 FNB 34 - - 34 NEDCOR - - 17 17 - - Total 621 105 532 50 - 587
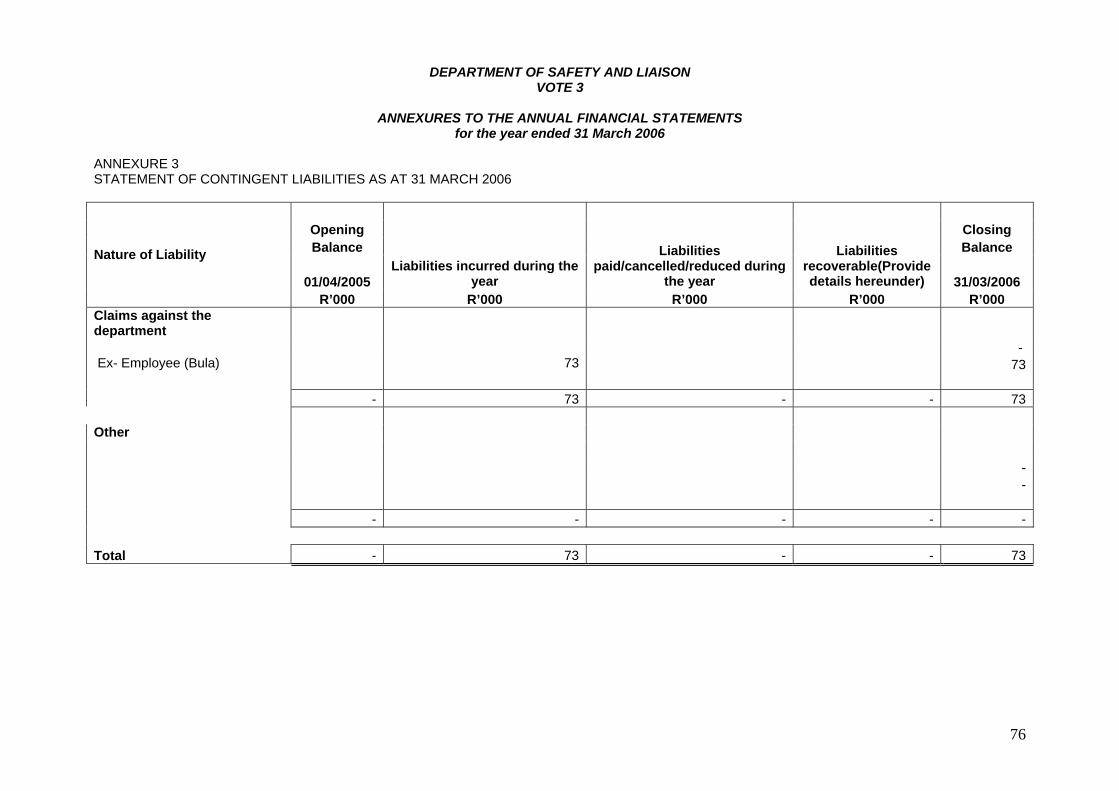
DEPARTMENT OF SAFETY AND LIAISON VOTE 3
ANNEXURES TO THE ANNUAL FINANCIAL STATEMENTS
for the year ended 31 March 2006
76
ANNEXURE 3 STATEMENT OF CONTINGENT LIABILITIES AS AT 31 MARCH 2006
Opening Closing Balance Balance
01/04/2005 Liabilities incurred during the
year
Liabilities paid/cancelled/reduced during
the year
Liabilities recoverable(Provide details hereunder) 31/03/2006
Nature of Liability
R’000 R’000 R’000 R’000 R’000 Claims against the department
- Ex- Employee (Bula) 73 73 - 73 - - 73 Other - - - - - - - Total - 73 - - 73
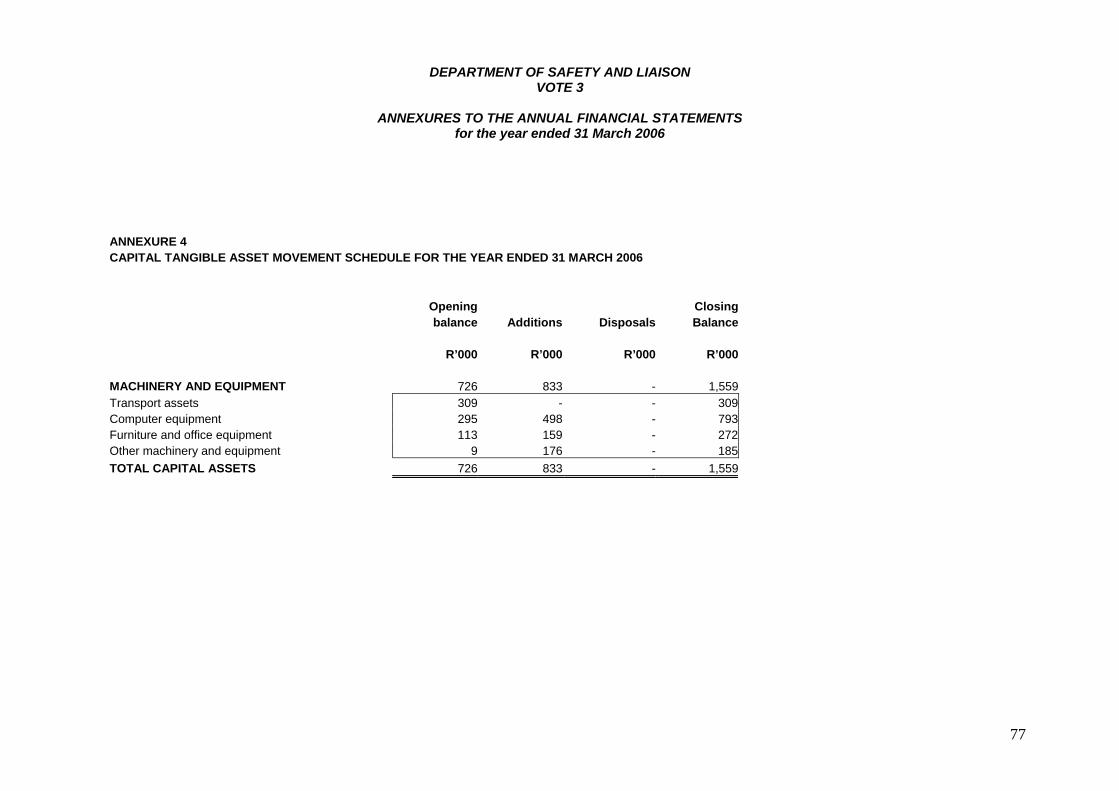
DEPARTMENT OF SAFETY AND LIAISON VOTE 3
ANNEXURES TO THE ANNUAL FINANCIAL STATEMENTS
for the year ended 31 March 2006
77
ANNEXURE 4 CAPITAL TANGIBLE ASSET MOVEMENT SCHEDULE FOR THE YEAR ENDED 31 MARCH 2006 Opening Closing balance Additions Disposals Balance R’000 R’000 R’000 R’000 MACHINERY AND EQUIPMENT 726 833 - 1,559 Transport assets 309 - - 309 Computer equipment 295 498 - 793 Furniture and office equipment 113 159 - 272 Other machinery and equipment 9 176 - 185 TOTAL CAPITAL ASSETS 726 833 - 1,559
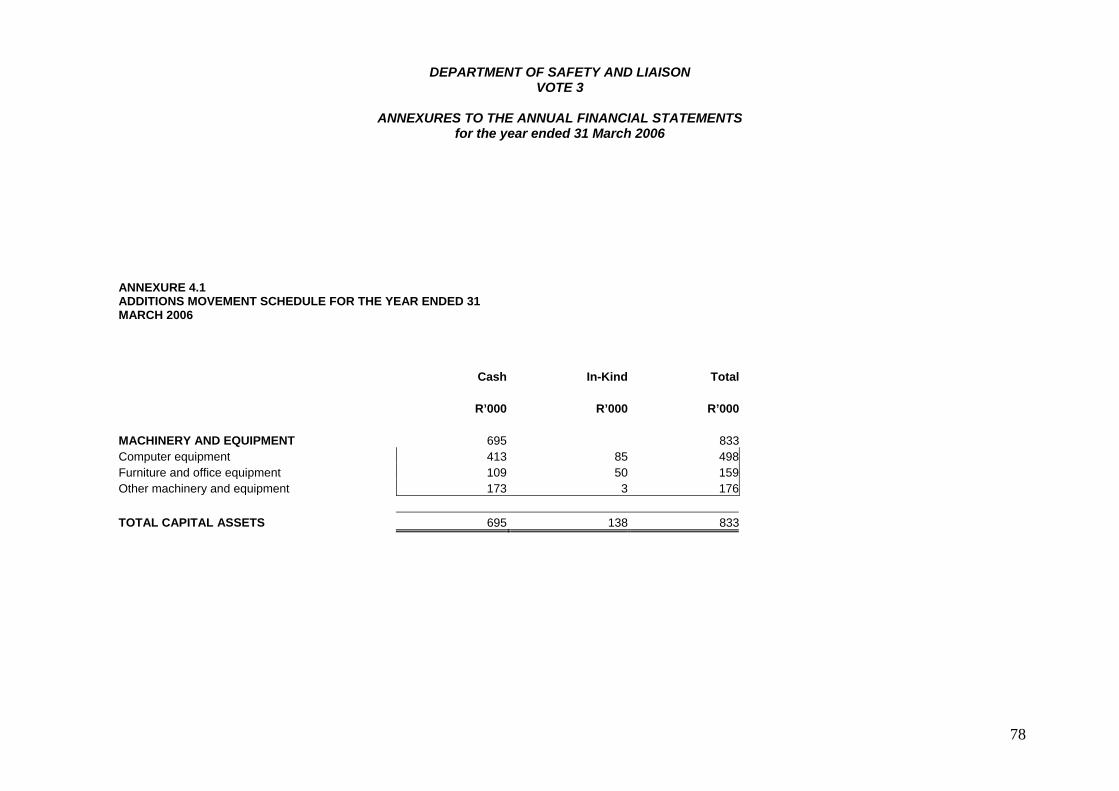
DEPARTMENT OF SAFETY AND LIAISON VOTE 3
ANNEXURES TO THE ANNUAL FINANCIAL STATEMENTS
for the year ended 31 March 2006
78
ANNEXURE 4.1 ADDITIONS MOVEMENT SCHEDULE FOR THE YEAR ENDED 31 MARCH 2006
Cash In-Kind Total R’000 R’000 R’000 MACHINERY AND EQUIPMENT 695 833 Computer equipment 413 85 498 Furniture and office equipment 109 50 159 Other machinery and equipment 173 3 176 TOTAL CAPITAL ASSETS 695 138 833
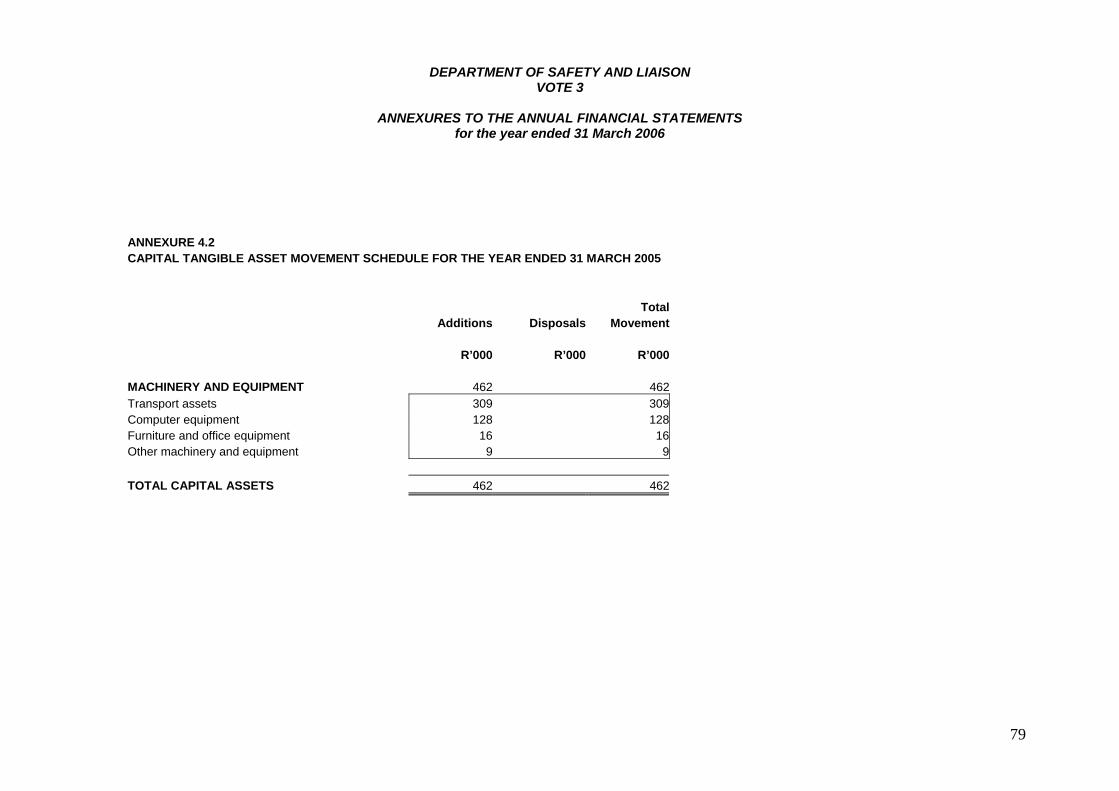
DEPARTMENT OF SAFETY AND LIAISON VOTE 3
ANNEXURES TO THE ANNUAL FINANCIAL STATEMENTS
for the year ended 31 March 2006
79
ANNEXURE 4.2 CAPITAL TANGIBLE ASSET MOVEMENT SCHEDULE FOR THE YEAR ENDED 31 MARCH 2005 Total Additions Disposals Movement R’000 R’000 R’000 MACHINERY AND EQUIPMENT 462 462 Transport assets 309 309 Computer equipment 128 128 Furniture and office equipment 16 16 Other machinery and equipment 9 9 TOTAL CAPITAL ASSETS 462 462
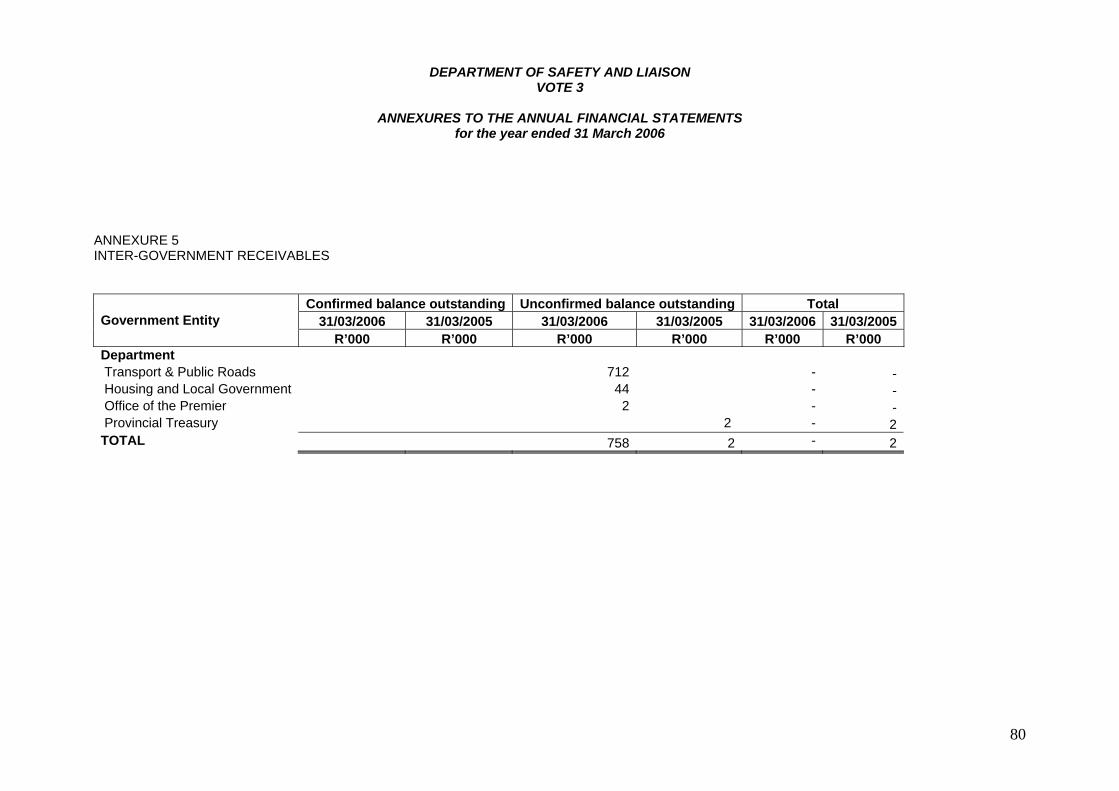
DEPARTMENT OF SAFETY AND LIAISON VOTE 3
ANNEXURES TO THE ANNUAL FINANCIAL STATEMENTS
for the year ended 31 March 2006
80
ANNEXURE 5 INTER-GOVERNMENT RECEIVABLES
Confirmed balance outstanding Unconfirmed balance outstanding Total 31/03/2006 31/03/2005 31/03/2006 31/03/2005 31/03/2006 31/03/2005Government Entity
R’000 R’000 R’000 R’000 R’000 R’000 Department Transport & Public Roads 712 - - Housing and Local Government 44 - - Office of the Premier 2 - - Provincial Treasury 2 - 2 TOTAL 758 2 - 2
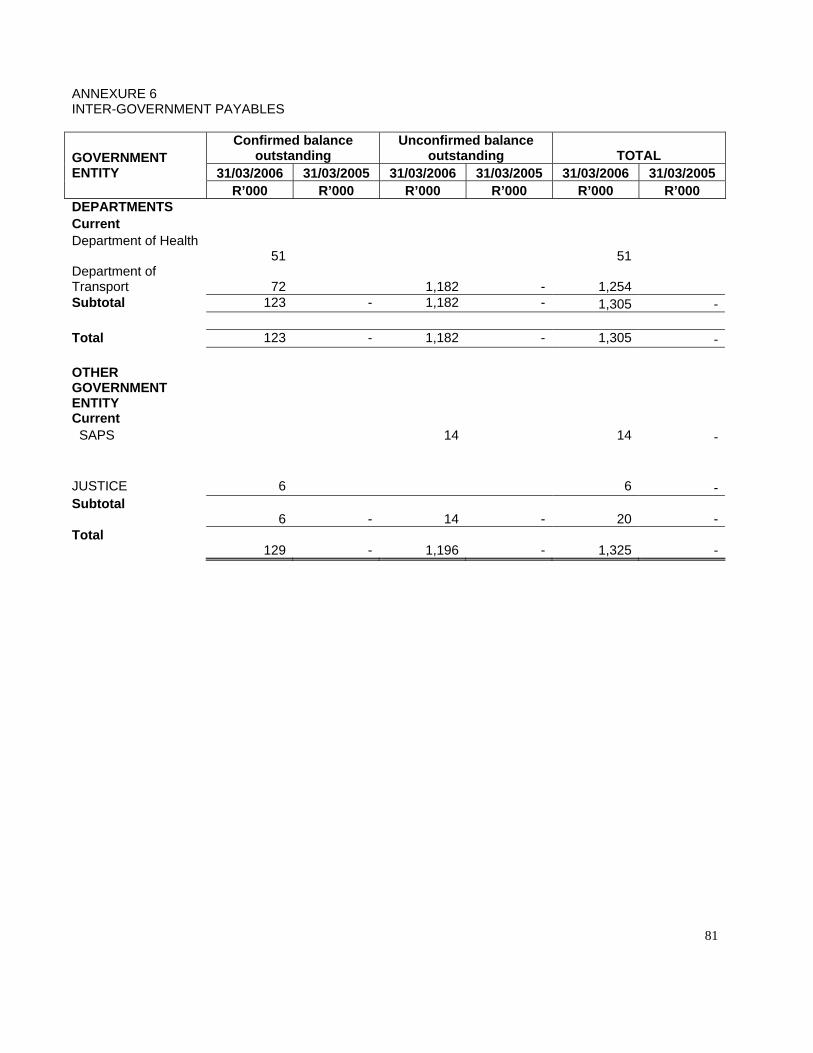
ANNEXURE 6 INTER-GOVERNMENT PAYABLES
Confirmed balance outstanding
Unconfirmed balance outstanding TOTAL
31/03/2006 31/03/2005 31/03/2006 31/03/2005 31/03/2006 31/03/2005 GOVERNMENT ENTITY
R’000 R’000 R’000 R’000 R’000 R’000 DEPARTMENTS Current Department of Health
51 51 Department of Transport
72
1,182
- 1,254
Subtotal 123 - 1,182 - 1,305 - Total 123 - 1,182 - 1,305 - OTHER GOVERNMENT ENTITY
Current SAPS 14 14 - JUSTICE 6 6 -Subtotal
6
-
14
-
20 - Total
129
-
1,196
-
1,325 -
81
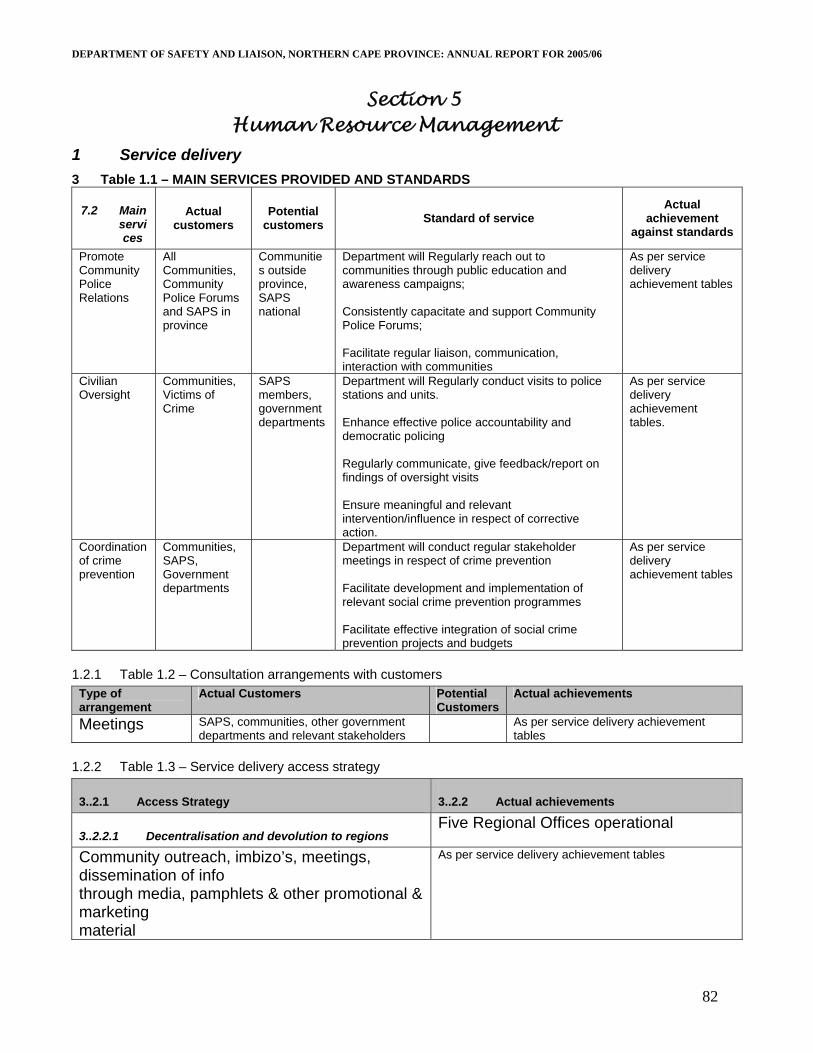
DEPARTMENT OF SAFETY AND LIAISON, NORTHERN CAPE PROVINCE: ANNUAL REPORT FOR 2005/06
82
Section 5 Human Resource Management
1 Service delivery 3 Table 1.1 – MAIN SERVICES PROVIDED AND STANDARDS
7.2 Main services
Actual customers
Potential customers Standard of service
Actual achievement
against standards
Promote Community Police Relations
All Communities, Community Police Forums and SAPS in province
Communities outside province, SAPS national
Department will Regularly reach out to communities through public education and awareness campaigns; Consistently capacitate and support Community Police Forums; Facilitate regular liaison, communication, interaction with communities
As per service delivery achievement tables
Civilian Oversight
Communities, Victims of Crime
SAPS members, government departments
Department will Regularly conduct visits to police stations and units. Enhance effective police accountability and democratic policing Regularly communicate, give feedback/report on findings of oversight visits Ensure meaningful and relevant intervention/influence in respect of corrective action.
As per service delivery achievement tables.
Coordination of crime prevention
Communities, SAPS, Government departments
Department will conduct regular stakeholder meetings in respect of crime prevention Facilitate development and implementation of relevant social crime prevention programmes Facilitate effective integration of social crime prevention projects and budgets
As per service delivery achievement tables
1.2.1 Table 1.2 – Consultation arrangements with customers Type of arrangement
Actual Customers Potential Customers
Actual achievements
Meetings SAPS, communities, other government departments and relevant stakeholders
As per service delivery achievement tables
1.2.2 Table 1.3 – Service delivery access strategy
3..2.1 Access Strategy 3..2.2 Actual achievements
3..2.2.1 Decentralisation and devolution to regions Five Regional Offices operational
Community outreach, imbizo’s, meetings, dissemination of info through media, pamphlets & other promotional & marketing material
As per service delivery achievement tables
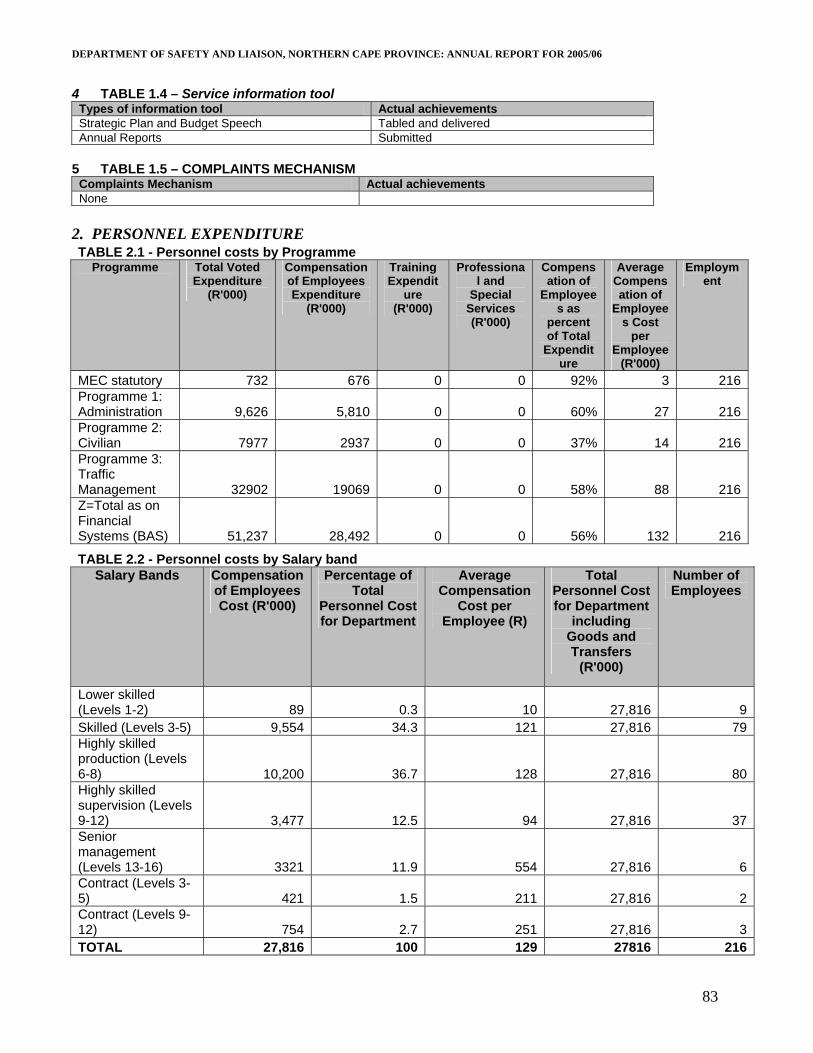
DEPARTMENT OF SAFETY AND LIAISON, NORTHERN CAPE PROVINCE: ANNUAL REPORT FOR 2005/06
83
4 TABLE 1.4 – Service information tool Types of information tool Actual achievements Strategic Plan and Budget Speech Tabled and delivered Annual Reports Submitted
5 TABLE 1.5 – COMPLAINTS MECHANISM Complaints Mechanism Actual achievements None
2. PERSONNEL EXPENDITURE TABLE 2.1 - Personnel costs by Programme
Programme Total Voted Expenditure
(R'000)
Compensation of Employees Expenditure
(R'000)
Training Expendit
ure (R'000)
Professional and
Special Services (R'000)
Compensation of
Employees as
percent of Total
Expenditure
Average Compensation of
Employees Cost
per Employee
(R'000)
Employment
MEC statutory 732 676 0 0 92% 3 216Programme 1: Administration 9,626 5,810 0 0 60% 27 216Programme 2: Civilian 7977 2937 0 0 37% 14 216Programme 3: Traffic Management 32902 19069 0 0 58% 88 216Z=Total as on Financial Systems (BAS) 51,237 28,492 0 0 56% 132 216
TABLE 2.2 - Personnel costs by Salary band Salary Bands Compensation
of Employees Cost (R'000)
Percentage of Total
Personnel Cost for Department
Average Compensation
Cost per Employee (R)
Total Personnel Cost for Department
including Goods and Transfers
(R'000)
Number of Employees
Lower skilled (Levels 1-2) 89 0.3 10 27,816 9 Skilled (Levels 3-5) 9,554 34.3 121 27,816 79 Highly skilled production (Levels 6-8) 10,200 36.7 128 27,816 80 Highly skilled supervision (Levels 9-12) 3,477 12.5 94 27,816 37 Senior management (Levels 13-16) 3321 11.9 554 27,816 6 Contract (Levels 3-5) 421 1.5 211 27,816 2 Contract (Levels 9-12) 754 2.7 251 27,816 3 TOTAL 27,816 100 129 27816 216
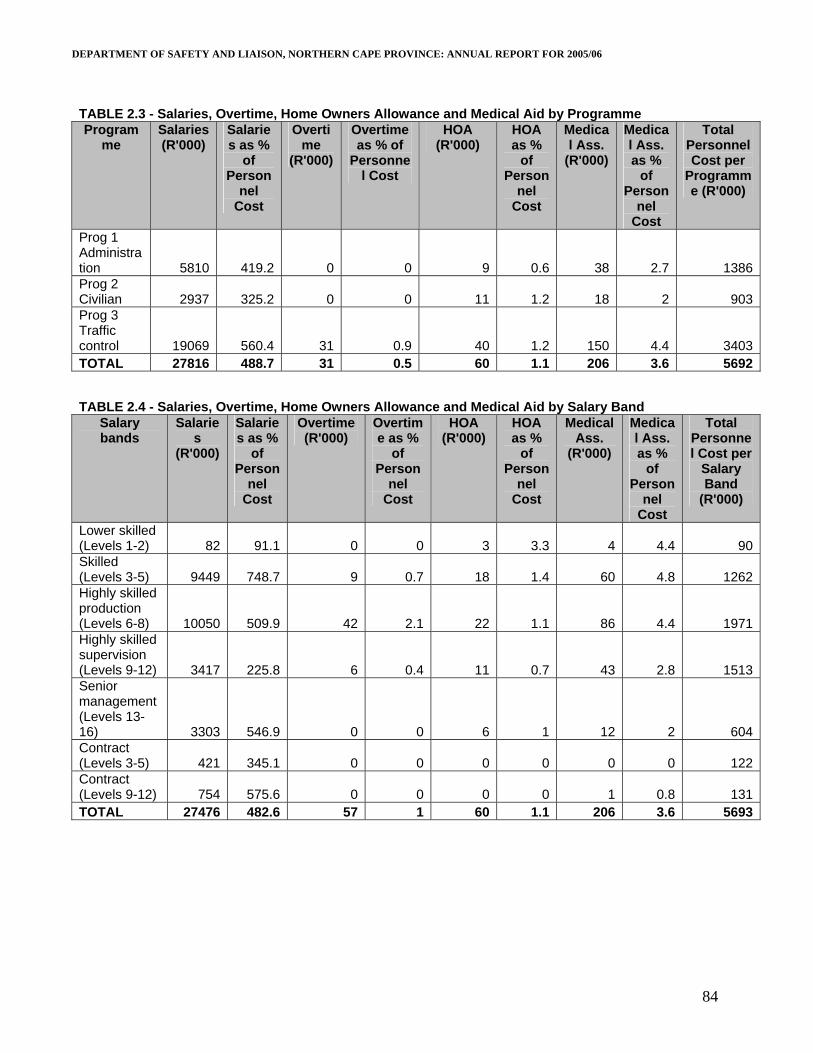
DEPARTMENT OF SAFETY AND LIAISON, NORTHERN CAPE PROVINCE: ANNUAL REPORT FOR 2005/06
84
TABLE 2.3 - Salaries, Overtime, Home Owners Allowance and Medical Aid by Programme Program
me Salaries (R'000)
Salaries as %
of Person
nel Cost
Overtime
(R'000)
Overtime as % of
Personnel Cost
HOA (R'000)
HOA as %
of Person
nel Cost
Medical Ass.
(R'000)
Medical Ass. as %
of Person
nel Cost
Total Personnel Cost per
Programme (R'000)
Prog 1 Administration 5810 419.2 0 0 9 0.6 38 2.7 1386Prog 2 Civilian 2937 325.2 0 0 11 1.2 18 2 903Prog 3 Traffic control 19069 560.4 31 0.9 40 1.2 150 4.4 3403TOTAL 27816 488.7 31 0.5 60 1.1 206 3.6 5692
TABLE 2.4 - Salaries, Overtime, Home Owners Allowance and Medical Aid by Salary Band Salary bands
Salaries
(R'000)
Salaries as %
of Person
nel Cost
Overtime (R'000)
Overtime as %
of Person
nel Cost
HOA (R'000)
HOA as %
of Person
nel Cost
Medical Ass.
(R'000)
Medical Ass. as %
of Person
nel Cost
Total Personnel Cost per
Salary Band
(R'000)
Lower skilled (Levels 1-2) 82 91.1 0 0 3 3.3 4 4.4 90Skilled (Levels 3-5) 9449 748.7 9 0.7 18 1.4 60 4.8 1262Highly skilled production (Levels 6-8) 10050 509.9 42 2.1 22 1.1 86 4.4 1971Highly skilled supervision (Levels 9-12) 3417 225.8 6 0.4 11 0.7 43 2.8 1513Senior management (Levels 13-16) 3303 546.9 0 0 6 1 12 2 604Contract (Levels 3-5) 421 345.1 0 0 0 0 0 0 122Contract (Levels 9-12) 754 575.6 0 0 0 0 1 0.8 131TOTAL 27476 482.6 57 1 60 1.1 206 3.6 5693
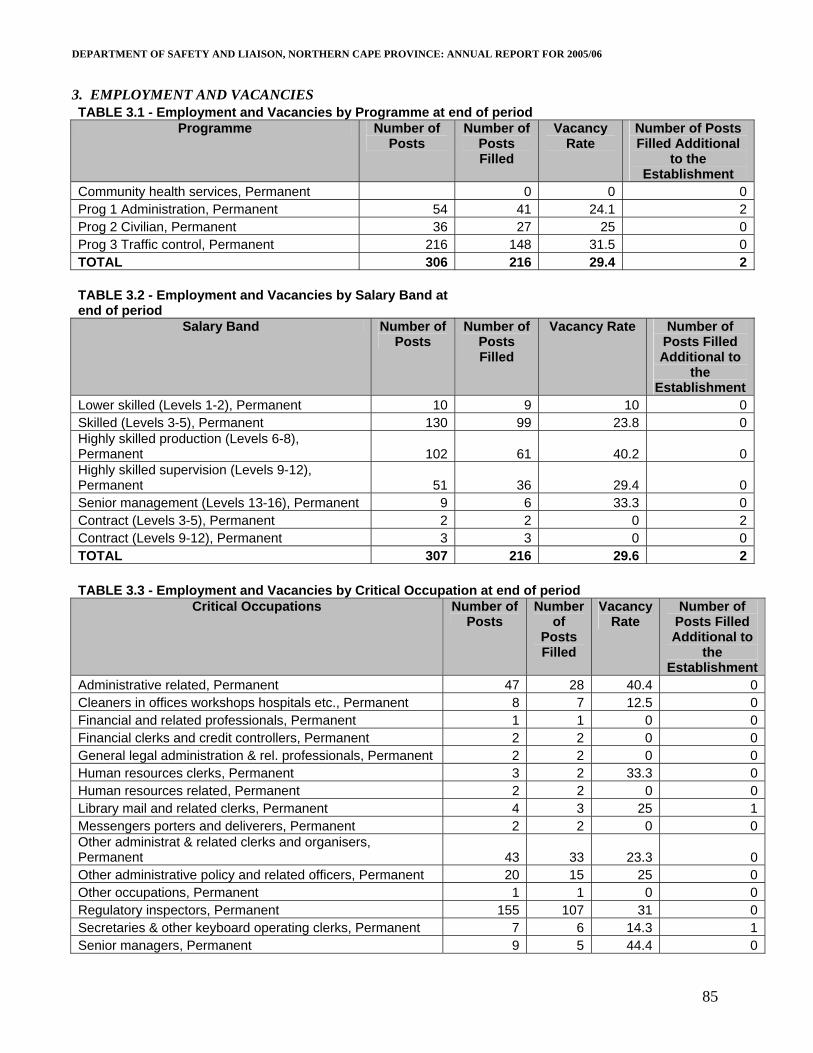
DEPARTMENT OF SAFETY AND LIAISON, NORTHERN CAPE PROVINCE: ANNUAL REPORT FOR 2005/06
85
3. EMPLOYMENT AND VACANCIES TABLE 3.1 - Employment and Vacancies by Programme at end of period
Programme Number of Posts
Number of Posts Filled
Vacancy Rate
Number of Posts Filled Additional
to the Establishment
Community health services, Permanent 0 0 0Prog 1 Administration, Permanent 54 41 24.1 2Prog 2 Civilian, Permanent 36 27 25 0Prog 3 Traffic control, Permanent 216 148 31.5 0TOTAL 306 216 29.4 2 TABLE 3.2 - Employment and Vacancies by Salary Band at end of period
Salary Band Number of Posts
Number of Posts Filled
Vacancy Rate Number of Posts Filled Additional to
the Establishment
Lower skilled (Levels 1-2), Permanent 10 9 10 0Skilled (Levels 3-5), Permanent 130 99 23.8 0Highly skilled production (Levels 6-8), Permanent 102 61 40.2 0Highly skilled supervision (Levels 9-12), Permanent 51 36 29.4 0Senior management (Levels 13-16), Permanent 9 6 33.3 0Contract (Levels 3-5), Permanent 2 2 0 2Contract (Levels 9-12), Permanent 3 3 0 0TOTAL 307 216 29.6 2 TABLE 3.3 - Employment and Vacancies by Critical Occupation at end of period
Critical Occupations Number of Posts
Number of
Posts Filled
Vacancy Rate
Number of Posts Filled Additional to
the Establishment
Administrative related, Permanent 47 28 40.4 0Cleaners in offices workshops hospitals etc., Permanent 8 7 12.5 0Financial and related professionals, Permanent 1 1 0 0Financial clerks and credit controllers, Permanent 2 2 0 0General legal administration & rel. professionals, Permanent 2 2 0 0Human resources clerks, Permanent 3 2 33.3 0Human resources related, Permanent 2 2 0 0Library mail and related clerks, Permanent 4 3 25 1Messengers porters and deliverers, Permanent 2 2 0 0Other administrat & related clerks and organisers, Permanent 43 33 23.3 0Other administrative policy and related officers, Permanent 20 15 25 0Other occupations, Permanent 1 1 0 0Regulatory inspectors, Permanent 155 107 31 0Secretaries & other keyboard operating clerks, Permanent 7 6 14.3 1Senior managers, Permanent 9 5 44.4 0
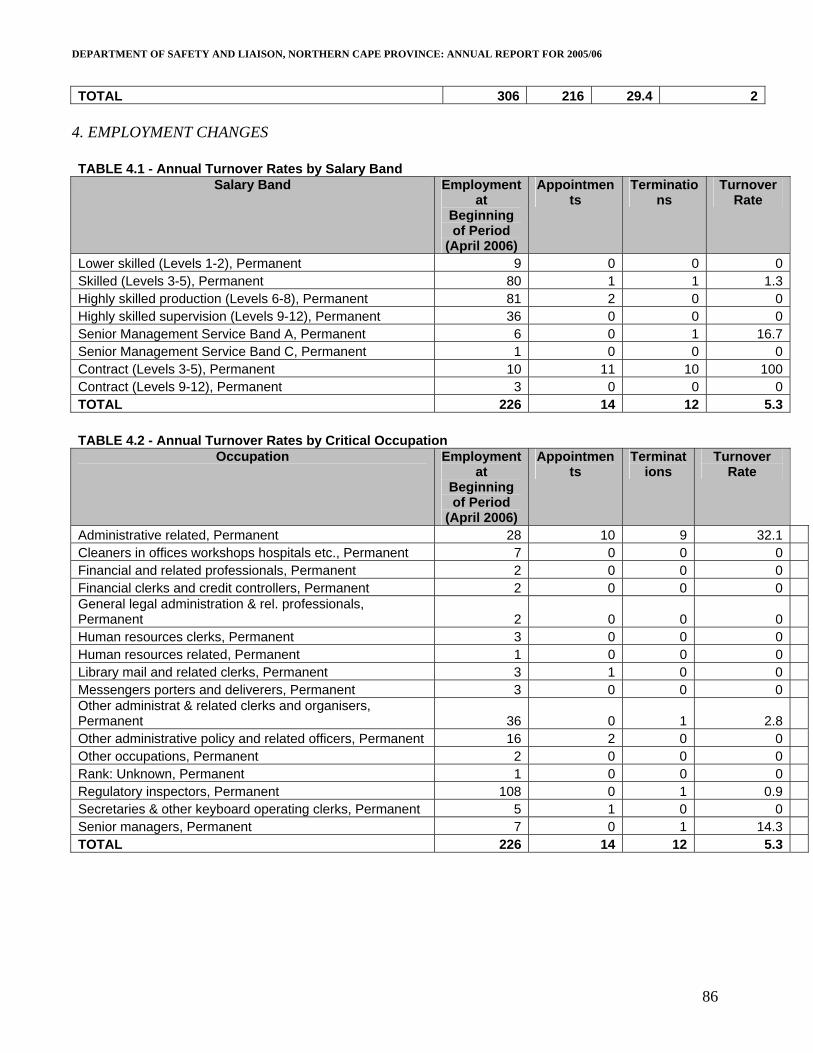
DEPARTMENT OF SAFETY AND LIAISON, NORTHERN CAPE PROVINCE: ANNUAL REPORT FOR 2005/06
86
TOTAL 306 216 29.4 2 4. EMPLOYMENT CHANGES TABLE 4.1 - Annual Turnover Rates by Salary Band
Salary Band Employment at
Beginning of Period
(April 2006)
Appointments
Terminations
Turnover Rate
Lower skilled (Levels 1-2), Permanent 9 0 0 0 Skilled (Levels 3-5), Permanent 80 1 1 1.3 Highly skilled production (Levels 6-8), Permanent 81 2 0 0 Highly skilled supervision (Levels 9-12), Permanent 36 0 0 0 Senior Management Service Band A, Permanent 6 0 1 16.7 Senior Management Service Band C, Permanent 1 0 0 0 Contract (Levels 3-5), Permanent 10 11 10 100 Contract (Levels 9-12), Permanent 3 0 0 0 TOTAL 226 14 12 5.3
TABLE 4.2 - Annual Turnover Rates by Critical Occupation
Occupation Employment at
Beginning of Period
(April 2006)
Appointments
Terminations
Turnover Rate
Administrative related, Permanent 28 10 9 32.1 Cleaners in offices workshops hospitals etc., Permanent 7 0 0 0 Financial and related professionals, Permanent 2 0 0 0 Financial clerks and credit controllers, Permanent 2 0 0 0 General legal administration & rel. professionals, Permanent 2 0 0 0 Human resources clerks, Permanent 3 0 0 0 Human resources related, Permanent 1 0 0 0 Library mail and related clerks, Permanent 3 1 0 0 Messengers porters and deliverers, Permanent 3 0 0 0 Other administrat & related clerks and organisers, Permanent 36 0 1 2.8 Other administrative policy and related officers, Permanent 16 2 0 0 Other occupations, Permanent 2 0 0 0 Rank: Unknown, Permanent 1 0 0 0 Regulatory inspectors, Permanent 108 0 1 0.9 Secretaries & other keyboard operating clerks, Permanent 5 1 0 0 Senior managers, Permanent 7 0 1 14.3 TOTAL 226 14 12 5.3
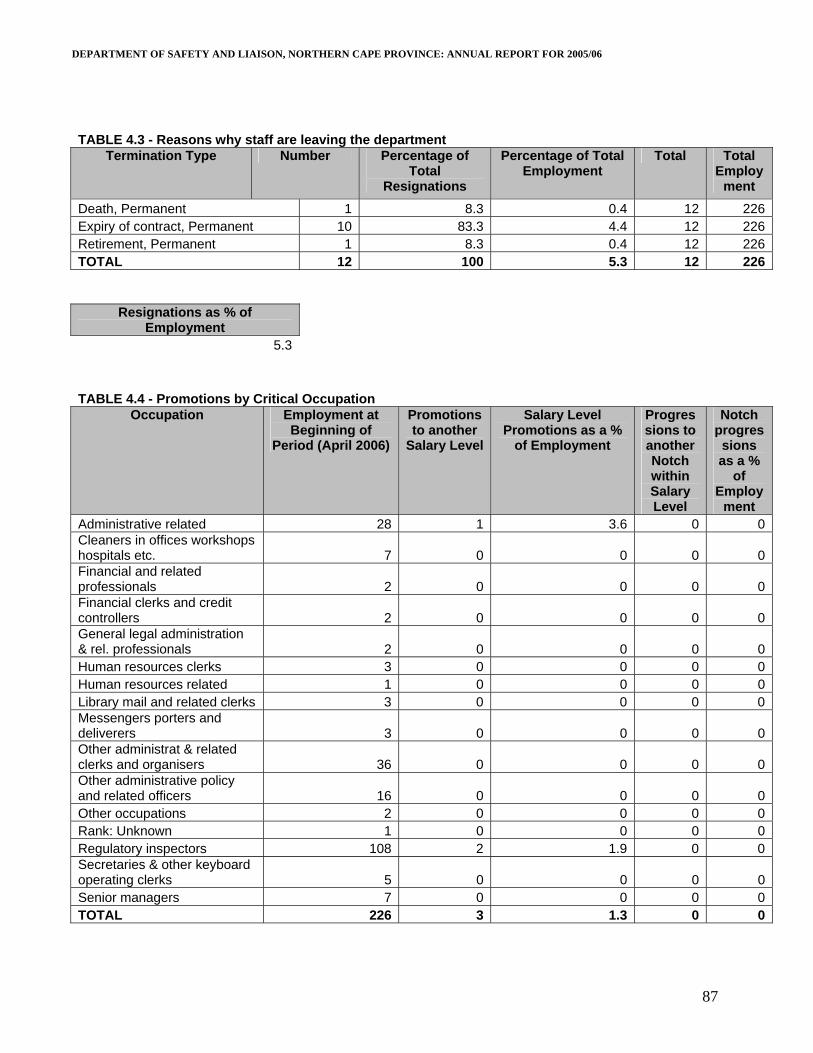
DEPARTMENT OF SAFETY AND LIAISON, NORTHERN CAPE PROVINCE: ANNUAL REPORT FOR 2005/06
87
TABLE 4.3 - Reasons why staff are leaving the department
Termination Type Number Percentage of Total
Resignations
Percentage of Total Employment
Total Total Employ
ment Death, Permanent 1 8.3 0.4 12 226Expiry of contract, Permanent 10 83.3 4.4 12 226Retirement, Permanent 1 8.3 0.4 12 226TOTAL 12 100 5.3 12 226
Resignations as % of Employment
5.3 TABLE 4.4 - Promotions by Critical Occupation
Occupation Employment at Beginning of
Period (April 2006)
Promotions to another
Salary Level
Salary Level Promotions as a %
of Employment
Progressions to another Notch within Salary Level
Notch progressions as a %
of Employ
ment Administrative related 28 1 3.6 0 0Cleaners in offices workshops hospitals etc. 7 0 0 0 0Financial and related professionals 2 0 0 0 0Financial clerks and credit controllers 2 0 0 0 0General legal administration & rel. professionals 2 0 0 0 0Human resources clerks 3 0 0 0 0Human resources related 1 0 0 0 0Library mail and related clerks 3 0 0 0 0Messengers porters and deliverers 3 0 0 0 0Other administrat & related clerks and organisers 36 0 0 0 0Other administrative policy and related officers 16 0 0 0 0Other occupations 2 0 0 0 0Rank: Unknown 1 0 0 0 0Regulatory inspectors 108 2 1.9 0 0Secretaries & other keyboard operating clerks 5 0 0 0 0Senior managers 7 0 0 0 0TOTAL 226 3 1.3 0 0
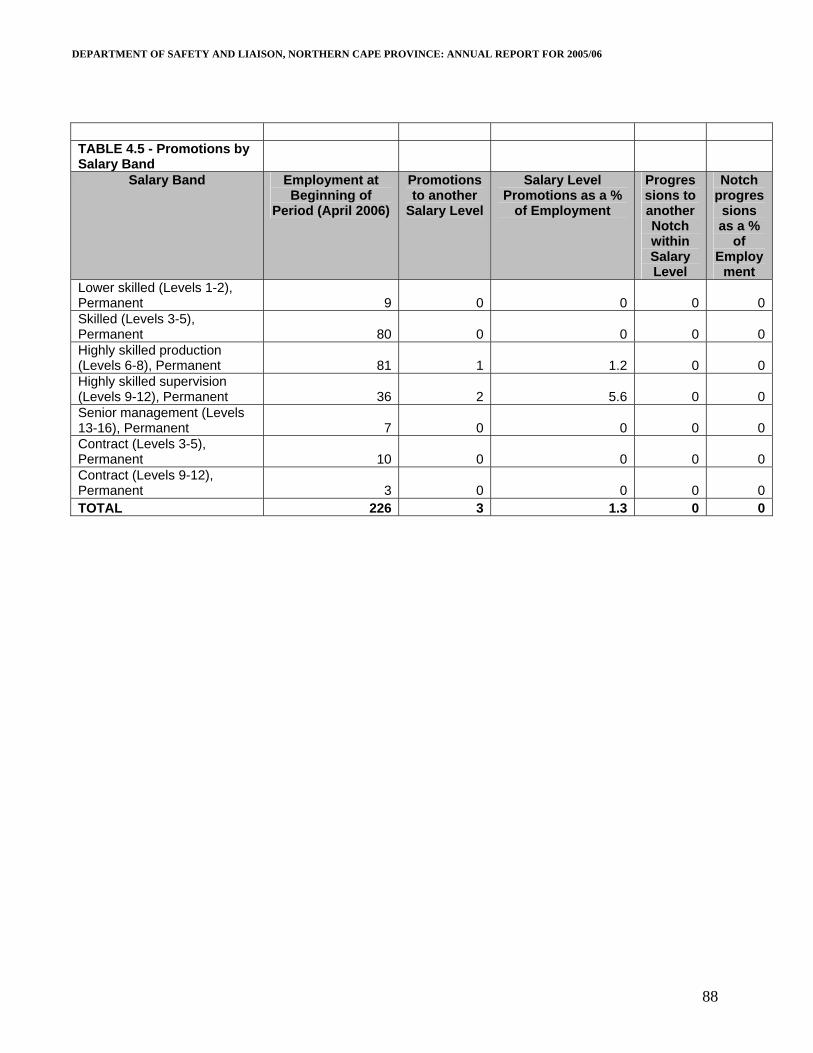
DEPARTMENT OF SAFETY AND LIAISON, NORTHERN CAPE PROVINCE: ANNUAL REPORT FOR 2005/06
88
TABLE 4.5 - Promotions by Salary Band
Salary Band Employment at Beginning of
Period (April 2006)
Promotions to another
Salary Level
Salary Level Promotions as a %
of Employment
Progressions to another Notch within Salary Level
Notch progressions as a %
of Employ
ment Lower skilled (Levels 1-2), Permanent 9 0 0 0 0Skilled (Levels 3-5), Permanent 80 0 0 0 0Highly skilled production (Levels 6-8), Permanent 81 1 1.2 0 0Highly skilled supervision (Levels 9-12), Permanent 36 2 5.6 0 0Senior management (Levels 13-16), Permanent 7 0 0 0 0Contract (Levels 3-5), Permanent 10 0 0 0 0Contract (Levels 9-12), Permanent 3 0 0 0 0TOTAL 226 3 1.3 0 0
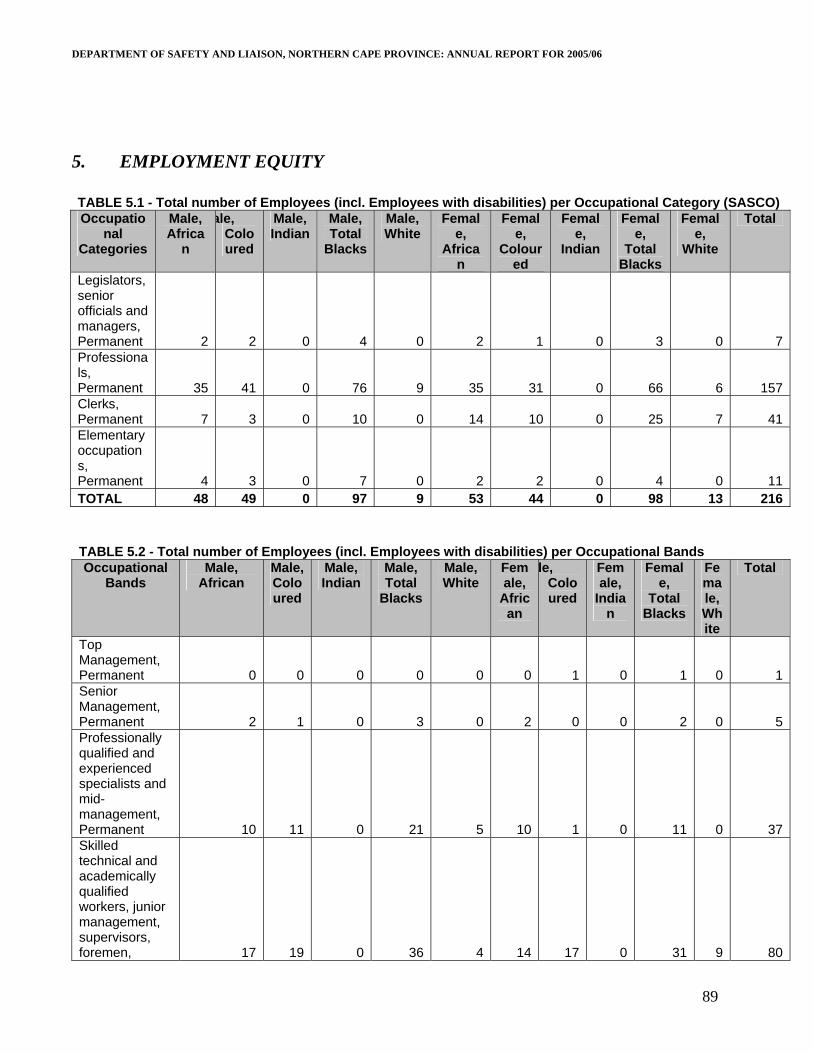
DEPARTMENT OF SAFETY AND LIAISON, NORTHERN CAPE PROVINCE: ANNUAL REPORT FOR 2005/06
89
5. EMPLOYMENT EQUITY TABLE 5.1 - Total number of Employees (incl. Employees with disabilities) per Occupational Category (SASCO) Occupatio
nal Categories
Male, Africa
n
ale, Coloured
Male, Indian
Male, Total
Blacks
Male, White
Female,
African
Female,
Coloured
Female,
Indian
Female,
Total Blacks
Female,
White
Total
Legislators, senior officials and managers, Permanent 2 2 0 4 0 2 1 0 3 0 7Professionals, Permanent 35 41 0 76 9 35 31 0 66 6 157Clerks, Permanent 7 3 0 10 0 14 10 0 25 7 41Elementary occupations, Permanent 4 3 0 7 0 2 2 0 4 0 11TOTAL 48 49 0 97 9 53 44 0 98 13 216
TABLE 5.2 - Total number of Employees (incl. Employees with disabilities) per Occupational Bands Occupational
Bands Male,
African Male, Coloured
Male, Indian
Male, Total
Blacks
Male, White
Female,
African
le, Coloured
Female,
Indian
Female,
Total Blacks
Female, White
Total
Top Management, Permanent 0 0 0 0 0 0 1 0 1 0 1Senior Management, Permanent 2 1 0 3 0 2 0 0 2 0 5Professionally qualified and experienced specialists and mid-management, Permanent 10 11 0 21 5 10 1 0 11 0 37Skilled technical and academically qualified workers, junior management, supervisors, foremen, 17 19 0 36 4 14 17 0 31 9 80
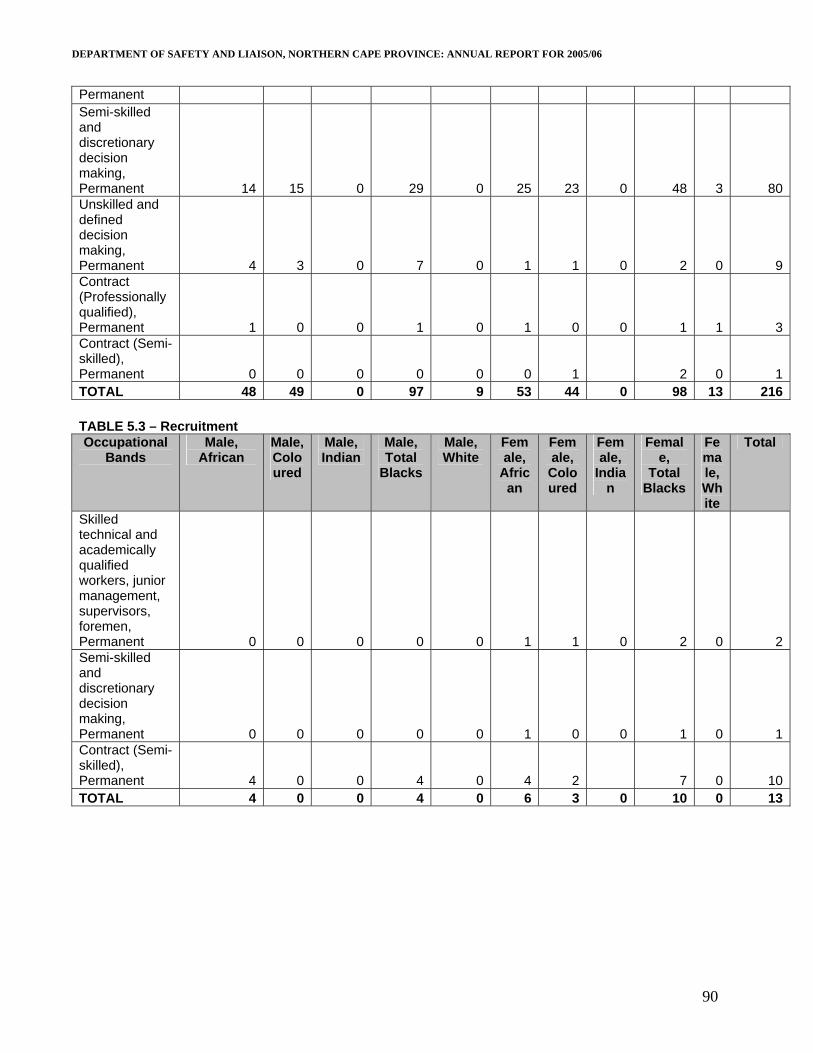
DEPARTMENT OF SAFETY AND LIAISON, NORTHERN CAPE PROVINCE: ANNUAL REPORT FOR 2005/06
90
Permanent Semi-skilled and discretionary decision making, Permanent 14 15 0 29 0 25 23 0 48 3 80Unskilled and defined decision making, Permanent 4 3 0 7 0 1 1 0 2 0 9Contract (Professionally qualified), Permanent 1 0 0 1 0 1 0 0 1 1 3Contract (Semi-skilled), Permanent 0 0 0 0 0 0 1 2 0 1TOTAL 48 49 0 97 9 53 44 0 98 13 216 TABLE 5.3 – Recruitment Occupational
Bands Male,
African Male, Coloured
Male, Indian
Male, Total
Blacks
Male, White
Female,
African
Female, Coloured
Female,
Indian
Female,
Total Blacks
Female, White
Total
Skilled technical and academically qualified workers, junior management, supervisors, foremen, Permanent 0 0 0 0 0 1 1 0 2 0 2Semi-skilled and discretionary decision making, Permanent 0 0 0 0 0 1 0 0 1 0 1Contract (Semi-skilled), Permanent 4 0 0 4 0 4 2 7 0 10TOTAL 4 0 0 4 0 6 3 0 10 0 13
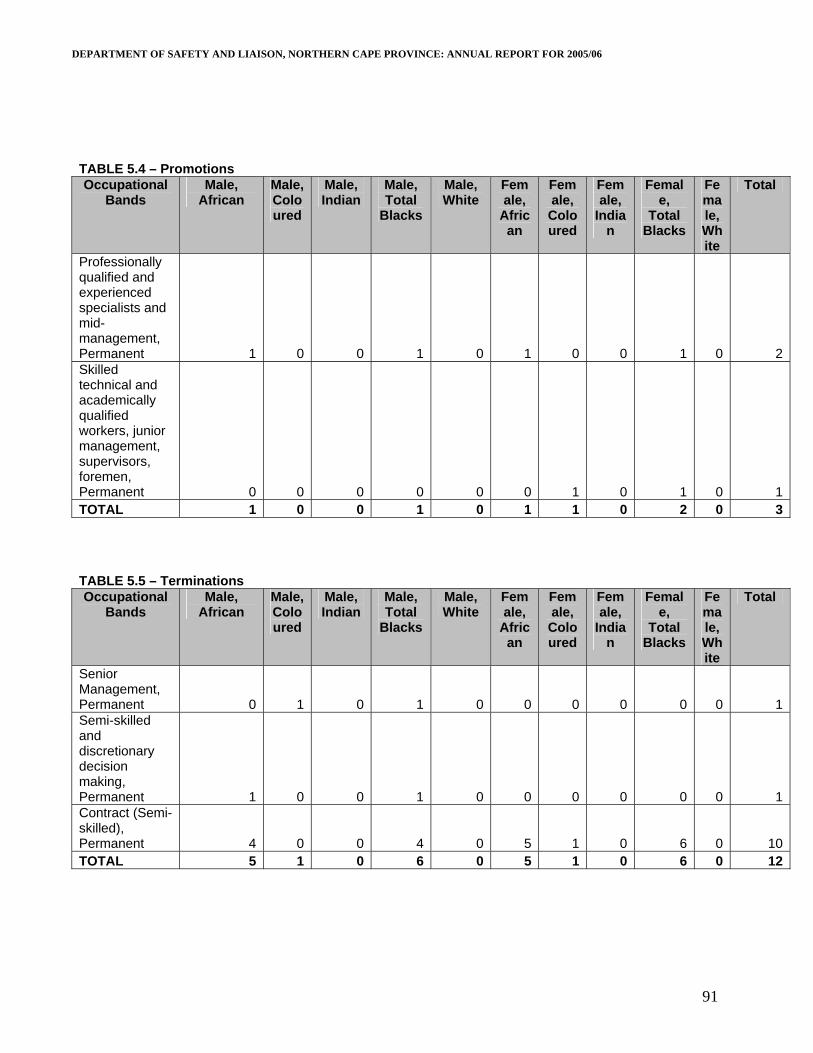
DEPARTMENT OF SAFETY AND LIAISON, NORTHERN CAPE PROVINCE: ANNUAL REPORT FOR 2005/06
91
TABLE 5.4 – Promotions Occupational
Bands Male,
African Male, Coloured
Male, Indian
Male, Total
Blacks
Male, White
Female,
African
Female, Coloured
Female,
Indian
Female,
Total Blacks
Female, White
Total
Professionally qualified and experienced specialists and mid-management, Permanent 1 0 0 1 0 1 0 0 1 0 2Skilled technical and academically qualified workers, junior management, supervisors, foremen, Permanent 0 0 0 0 0 0 1 0 1 0 1TOTAL 1 0 0 1 0 1 1 0 2 0 3
TABLE 5.5 – Terminations Occupational
Bands Male,
African Male, Coloured
Male, Indian
Male, Total
Blacks
Male, White
Female,
African
Female, Coloured
Female,
Indian
Female,
Total Blacks
Female, White
Total
Senior Management, Permanent 0 1 0 1 0 0 0 0 0 0 1Semi-skilled and discretionary decision making, Permanent 1 0 0 1 0 0 0 0 0 0 1Contract (Semi-skilled), Permanent 4 0 0 4 0 5 1 0 6 0 10TOTAL 5 1 0 6 0 5 1 0 6 0 12
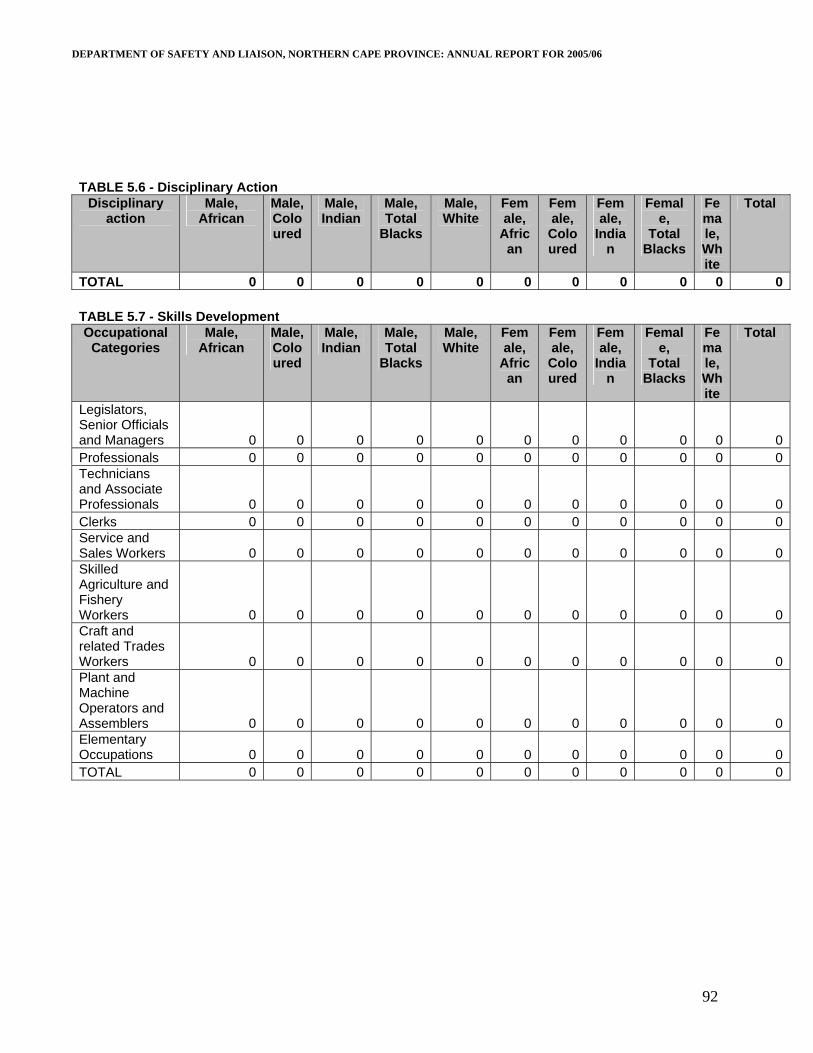
DEPARTMENT OF SAFETY AND LIAISON, NORTHERN CAPE PROVINCE: ANNUAL REPORT FOR 2005/06
92
TABLE 5.6 - Disciplinary Action
Disciplinary action
Male, African
Male, Coloured
Male, Indian
Male, Total
Blacks
Male, White
Female,
African
Female, Coloured
Female,
Indian
Female,
Total Blacks
Female, White
Total
TOTAL 0 0 0 0 0 0 0 0 0 0 0 TABLE 5.7 - Skills Development Occupational
Categories Male,
African Male, Coloured
Male, Indian
Male, Total
Blacks
Male, White
Female,
African
Female, Coloured
Female,
Indian
Female,
Total Blacks
Female, White
Total
Legislators, Senior Officials and Managers 0 0 0 0 0 0 0 0 0 0 0Professionals 0 0 0 0 0 0 0 0 0 0 0Technicians and Associate Professionals 0 0 0 0 0 0 0 0 0 0 0Clerks 0 0 0 0 0 0 0 0 0 0 0Service and Sales Workers 0 0 0 0 0 0 0 0 0 0 0Skilled Agriculture and Fishery Workers 0 0 0 0 0 0 0 0 0 0 0Craft and related Trades Workers 0 0 0 0 0 0 0 0 0 0 0Plant and Machine Operators and Assemblers 0 0 0 0 0 0 0 0 0 0 0Elementary Occupations 0 0 0 0 0 0 0 0 0 0 0TOTAL 0 0 0 0 0 0 0 0 0 0 0
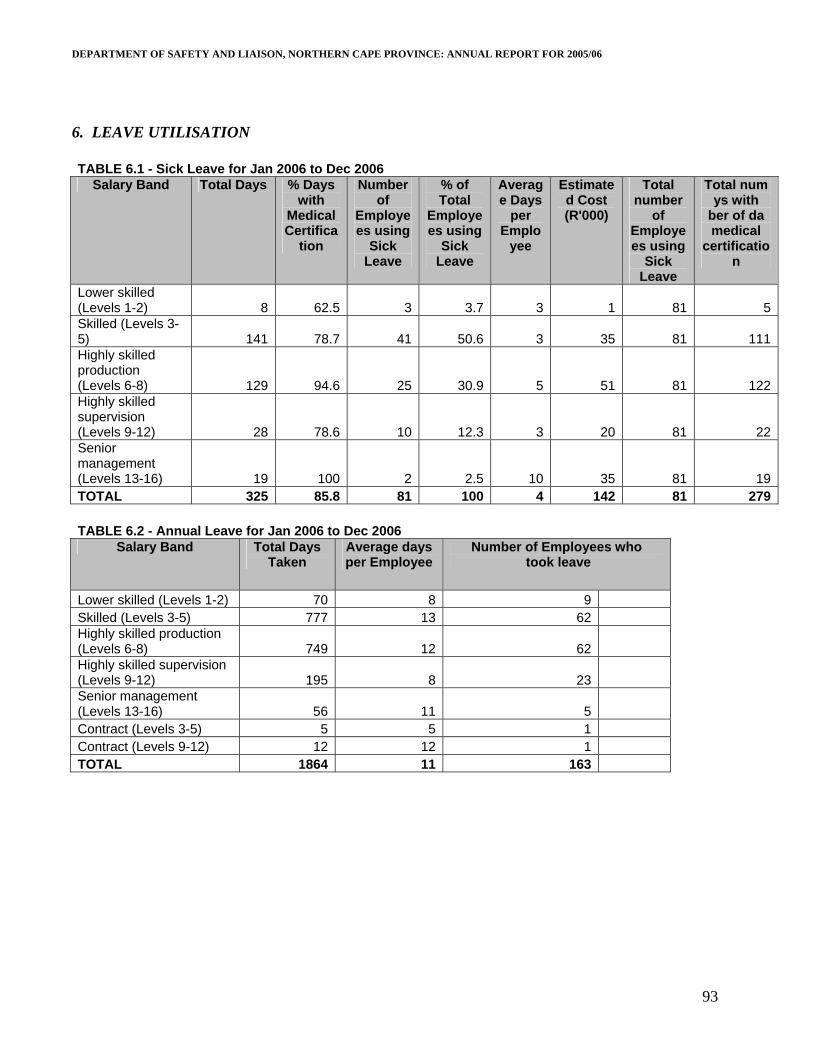
DEPARTMENT OF SAFETY AND LIAISON, NORTHERN CAPE PROVINCE: ANNUAL REPORT FOR 2005/06
93
6. LEAVE UTILISATION TABLE 6.1 - Sick Leave for Jan 2006 to Dec 2006
Salary Band Total Days % Days with
Medical Certifica
tion
Number of
Employees using
Sick Leave
% of Total
Employees using
Sick Leave
Average Days
per Emplo
yee
Estimated Cost (R'000)
Total number
of Employees using
Sick Leave
Total num ys with
ber of da medical
certification
Lower skilled (Levels 1-2) 8 62.5 3 3.7 3 1 81 5Skilled (Levels 3-5) 141 78.7 41 50.6 3 35 81 111Highly skilled production (Levels 6-8) 129 94.6 25 30.9 5 51 81 122Highly skilled supervision (Levels 9-12) 28 78.6 10 12.3 3 20 81 22Senior management (Levels 13-16) 19 100 2 2.5 10 35 81 19TOTAL 325 85.8 81 100 4 142 81 279 TABLE 6.2 - Annual Leave for Jan 2006 to Dec 2006
Salary Band Total Days Taken
Average days per Employee
Number of Employees who took leave
Lower skilled (Levels 1-2) 70 8 9 Skilled (Levels 3-5) 777 13 62 Highly skilled production (Levels 6-8) 749 12 62 Highly skilled supervision (Levels 9-12) 195 8 23 Senior management (Levels 13-16) 56 11 5 Contract (Levels 3-5) 5 5 1 Contract (Levels 9-12) 12 12 1 TOTAL 1864 11 163
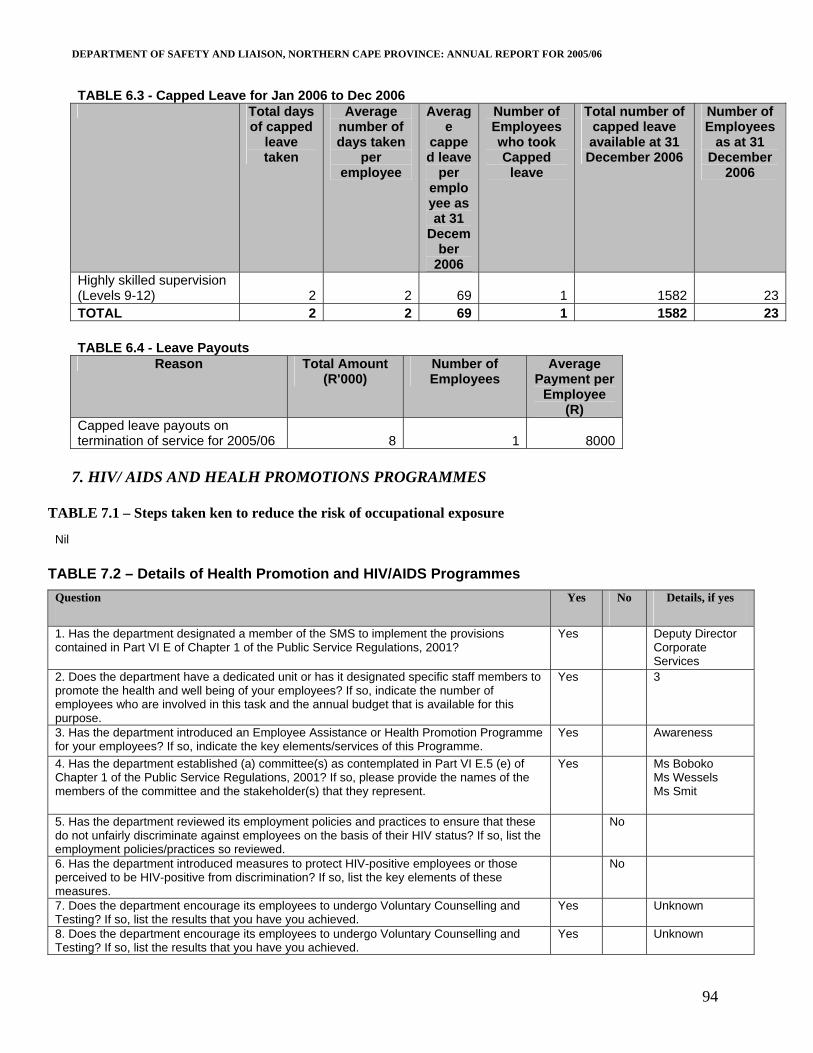
DEPARTMENT OF SAFETY AND LIAISON, NORTHERN CAPE PROVINCE: ANNUAL REPORT FOR 2005/06
94
TABLE 6.3 - Capped Leave for Jan 2006 to Dec 2006 Total days
of capped leave taken
Average number of days taken
per employee
Average
capped leave
per employee as at 31
December
2006
Number of Employees who took Capped
leave
Total number of capped leave available at 31 December 2006
Number of Employees
as at 31 December
2006
Highly skilled supervision (Levels 9-12) 2 2 69 1 1582 23 TOTAL 2 2 69 1 1582 23 TABLE 6.4 - Leave Payouts
Reason Total Amount (R'000)
Number of Employees
Average Payment per
Employee (R)
Capped leave payouts on termination of service for 2005/06 8 1 8000
7. HIV/ AIDS AND HEALH PROMOTIONS PROGRAMMES
TABLE 7.1 – Steps taken ken to reduce the risk of occupational exposure
Nil
TABLE 7.2 – Details of Health Promotion and HIV/AIDS Programmes Question Yes No Details, if yes
1. Has the department designated a member of the SMS to implement the provisions contained in Part VI E of Chapter 1 of the Public Service Regulations, 2001?
Yes Deputy Director Corporate Services
2. Does the department have a dedicated unit or has it designated specific staff members to promote the health and well being of your employees? If so, indicate the number of employees who are involved in this task and the annual budget that is available for this purpose.
Yes 3
3. Has the department introduced an Employee Assistance or Health Promotion Programme for your employees? If so, indicate the key elements/services of this Programme.
Yes Awareness
4. Has the department established (a) committee(s) as contemplated in Part VI E.5 (e) of Chapter 1 of the Public Service Regulations, 2001? If so, please provide the names of the members of the committee and the stakeholder(s) that they represent.
Yes Ms Boboko Ms Wessels Ms Smit
5. Has the department reviewed its employment policies and practices to ensure that these do not unfairly discriminate against employees on the basis of their HIV status? If so, list the employment policies/practices so reviewed.
No
6. Has the department introduced measures to protect HIV-positive employees or those perceived to be HIV-positive from discrimination? If so, list the key elements of these measures.
No
7. Does the department encourage its employees to undergo Voluntary Counselling and Testing? If so, list the results that you have you achieved.
Yes Unknown
8. Does the department encourage its employees to undergo Voluntary Counselling and Testing? If so, list the results that you have you achieved.
Yes Unknown
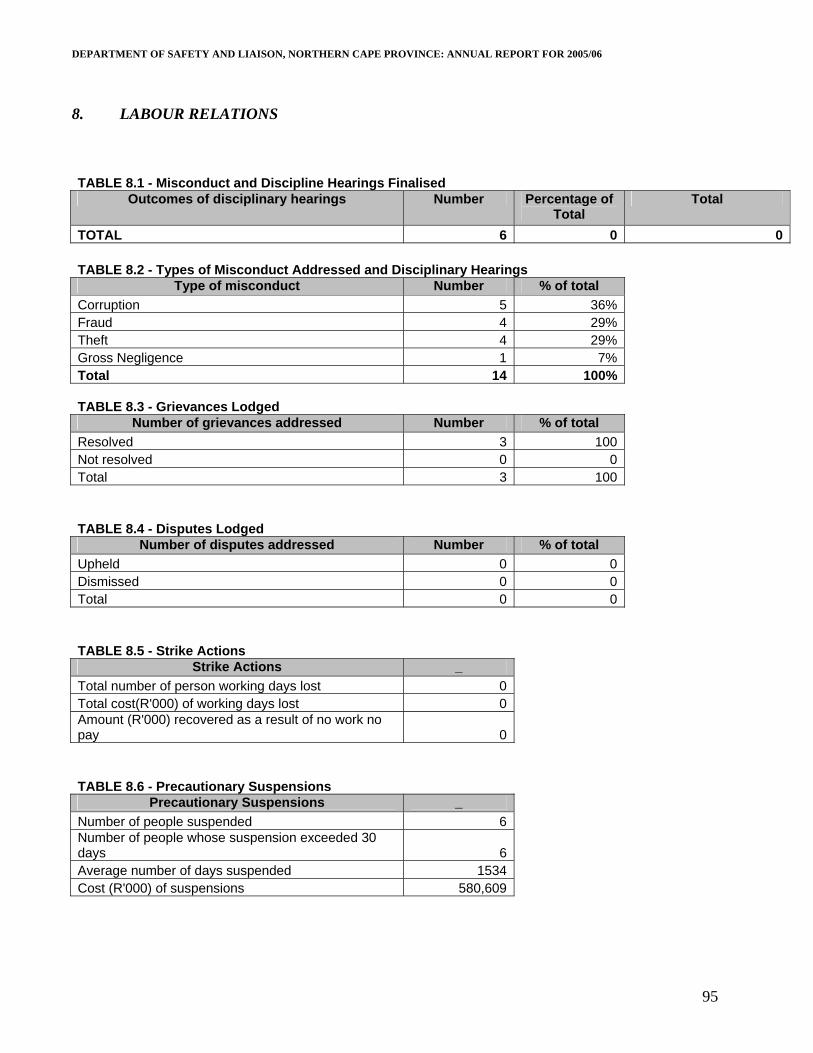
DEPARTMENT OF SAFETY AND LIAISON, NORTHERN CAPE PROVINCE: ANNUAL REPORT FOR 2005/06
95
8. LABOUR RELATIONS TABLE 8.1 - Misconduct and Discipline Hearings Finalised
Outcomes of disciplinary hearings Number Percentage of Total
Total
TOTAL 6 0 0 TABLE 8.2 - Types of Misconduct Addressed and Disciplinary Hearings
Type of misconduct Number % of total Corruption 5 36% Fraud 4 29% Theft 4 29% Gross Negligence 1 7% Total 14 100% TABLE 8.3 - Grievances Lodged
Number of grievances addressed Number % of total Resolved 3 100 Not resolved 0 0 Total 3 100 TABLE 8.4 - Disputes Lodged
Number of disputes addressed Number % of total Upheld 0 0 Dismissed 0 0 Total 0 0 TABLE 8.5 - Strike Actions
Strike Actions _ Total number of person working days lost 0 Total cost(R'000) of working days lost 0 Amount (R'000) recovered as a result of no work no pay 0 TABLE 8.6 - Precautionary Suspensions
Precautionary Suspensions _ Number of people suspended 6 Number of people whose suspension exceeded 30 days 6 Average number of days suspended 1534 Cost (R'000) of suspensions 580,609
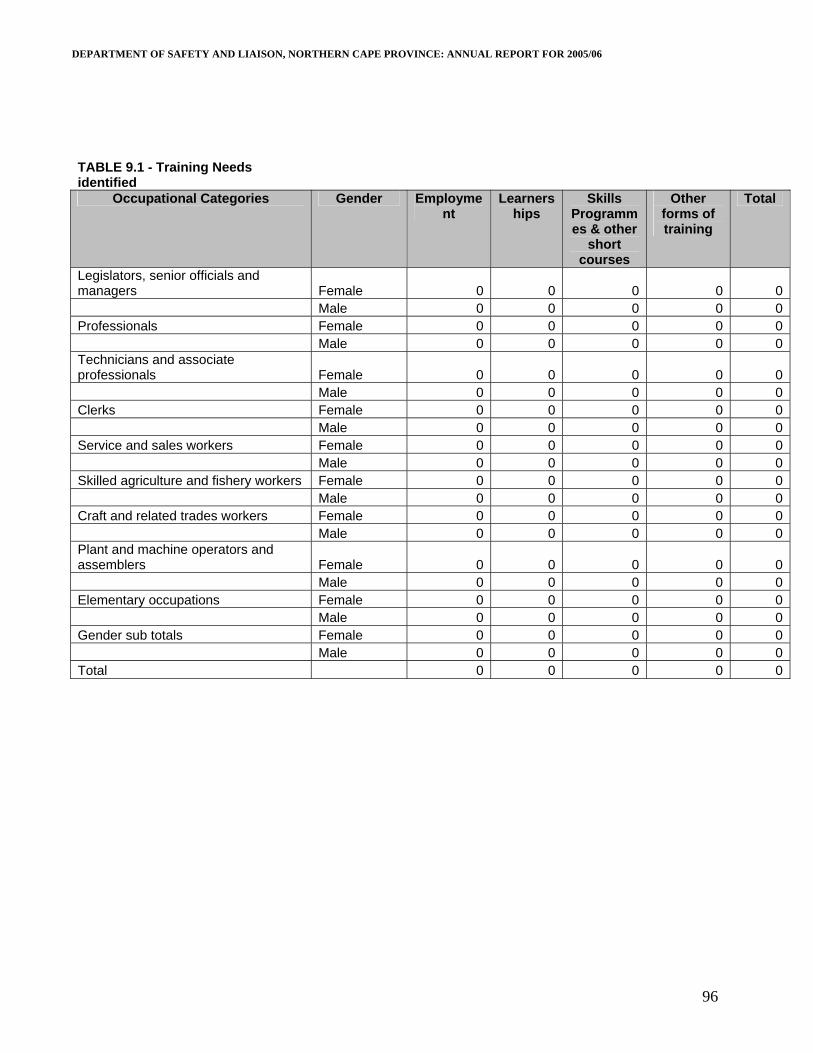
DEPARTMENT OF SAFETY AND LIAISON, NORTHERN CAPE PROVINCE: ANNUAL REPORT FOR 2005/06
96
TABLE 9.1 - Training Needs identified
Occupational Categories Gender Employment
Learnerships
Skills Programmes & other
short courses
Other forms of training
Total
Legislators, senior officials and managers Female 0 0 0 0 0 Male 0 0 0 0 0Professionals Female 0 0 0 0 0 Male 0 0 0 0 0Technicians and associate professionals Female 0 0 0 0 0 Male 0 0 0 0 0Clerks Female 0 0 0 0 0 Male 0 0 0 0 0Service and sales workers Female 0 0 0 0 0 Male 0 0 0 0 0Skilled agriculture and fishery workers Female 0 0 0 0 0 Male 0 0 0 0 0Craft and related trades workers Female 0 0 0 0 0 Male 0 0 0 0 0Plant and machine operators and assemblers Female 0 0 0 0 0 Male 0 0 0 0 0Elementary occupations Female 0 0 0 0 0 Male 0 0 0 0 0Gender sub totals Female 0 0 0 0 0 Male 0 0 0 0 0Total 0 0 0 0 0
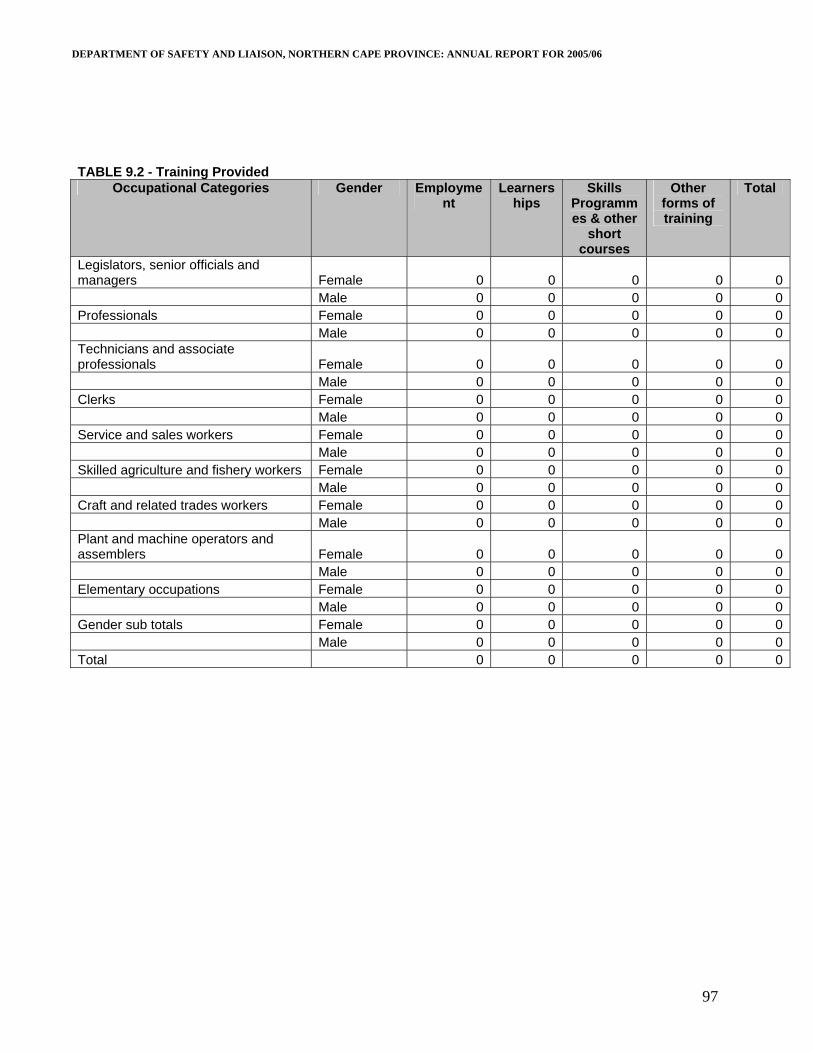
DEPARTMENT OF SAFETY AND LIAISON, NORTHERN CAPE PROVINCE: ANNUAL REPORT FOR 2005/06
97
TABLE 9.2 - Training Provided
Occupational Categories Gender Employment
Learnerships
Skills Programmes & other
short courses
Other forms of training
Total
Legislators, senior officials and managers Female 0 0 0 0 0 Male 0 0 0 0 0Professionals Female 0 0 0 0 0 Male 0 0 0 0 0Technicians and associate professionals Female 0 0 0 0 0 Male 0 0 0 0 0Clerks Female 0 0 0 0 0 Male 0 0 0 0 0Service and sales workers Female 0 0 0 0 0 Male 0 0 0 0 0Skilled agriculture and fishery workers Female 0 0 0 0 0 Male 0 0 0 0 0Craft and related trades workers Female 0 0 0 0 0 Male 0 0 0 0 0Plant and machine operators and assemblers Female 0 0 0 0 0 Male 0 0 0 0 0Elementary occupations Female 0 0 0 0 0 Male 0 0 0 0 0Gender sub totals Female 0 0 0 0 0 Male 0 0 0 0 0Total 0 0 0 0 0

DEPARTMENT OF SAFETY AND LIAISON, NORTHERN CAPE PROVINCE: ANNUAL REPORT FOR 2005/06
98