Embed Size (px)
Citation preview
FINAL CONTRACT REPORT
INTEGRATED CCTV/VIVDS PROTOTYPE FIELD TEST
Brian L. Smith, Ph.D. Assistant Professor
Seong J. Namkoong, Ph.D. Visiting Research Scientist
Hema Tanikella
Graduate Research Assistant
Department of Civil Engineering University of Virginia
Project Managers
Catherine C. McGhee, Virginia Transportation Research Council Michael A. Perfater, Virginia Transportation Research Council
Contract Research Sponsored by the Virginia Transportation Research Council
Virginia Transportation Research Council (A Cooperative Organization Sponsored Jointly by the
Virginia Department of Transportation and the University of Virginia)
Charlottesville, Virginia
September 2004 VTRC 05-CR2

ii
NOTICE
The project that is the subject of this report was done under contract for the Virginia Department of Transportation, Virginia Transportation Research Council. The contents of this report reflect the views of the authors, who are responsible for the facts and the accuracy of the data presented herein. The contents do not necessarily reflect the official views or policies of the Virginia Department of Transportation, the Commonwealth Transportation Board, or the Federal Highway Administration. This report does not constitute a standard, specification, or regulation. Each contract report is peer reviewed and accepted for publication by Research Council staff with expertise in related technical areas. Final editing and proofreading of the report are performed by the contractor.
Copyright 2004 by the Commonwealth of Virginia.
iii
ABSTRACT
The Virginia Department of Transportation (VDOT) has invested in extensive closed-circuit television (CCTV) systems to monitor freeways in urban areas. Generally, these devices are installed as part of freeway management systems (Smart Traffic Centers [STCs]). Although CCTVs have proven to be very effective in supporting incident management, they simply provide images that must be interpreted by trained operators—not measures of traffic conditions (such as flow rate and average speeds). A previous study completed by the University of Virginia and Virginia Transportation Research Council concluded, however, that it is feasible to integrate CCTV with video image vehicle detection systems (VIVDS) currently on the market to provide the ability to measure traffic conditions. The purpose of this research effort was to develop, deploy, and evaluate an integrated CCTV/VIVDS system (referred to as Phase II Autotrack) in an operational STC.
Based on a field evaluation at the Hampton Roads STC, it was concluded that Phase II
Autotrack effectively measures traffic volumes and that the system effectively measures speed during daylight conditions. This proves that an integrated CCTV/VIVDS system should be aggressively developed and finalized to supplement, and at times, replace, existing loop detectors in Virginia. For example, if VDOT were to replace only one quarter of the loops in the Hampton Roads STC with integrated CCTV/VIVDS, it is estimated that the agency would realize a capital/installation savings of $4.9 million and would reduce operating costs by $230,000 per year. Based on these conclusions, the following recommendations have been offered to VDOT:
1. VDOT’s Mobility Management Division should coordinate the installation and use of
Phase II Autotrack at four existing CCTV locations throughout the Commonwealth. 2. The Virginia Transportation Research Council should continue the development of
Phase II Autotrack in order to improve speed measurement performance. 3. The Virginia Transportation Research Council should develop a Phase III Autotrack
to investigate the use of additional image-processing capabilities to support STC operations.
1
FINAL CONTRACT REPORT
INTEGRATED CCTV/VIVDS PROTOTYPE FIELD TEST
Brian L. Smith, Ph.D. Assistant Professor
Department of Civil Engineering University of Virginia
Seong J. Namkoong, Ph.D. Visiting Research Scientist
Department of Civil Engineering University of Virginia
Hema Tanikella
Graduate Research Assistant Department of Civil Engineering
University of Virginia
INTRODUCTION The foundation of transportation management, and many of the other services that
collectively form intelligent transportation systems (ITS), is the ability to monitor traffic conditions. Generally, two key subsystems are used to provide this capability. First, a visual monitoring subsystem is used to allow traffic operators and travelers alike to directly see conditions at strategic locations. Technically, this subsystem uses moveable (i.e., pan/tilt/zoom) closed-circuit television (CCTV) cameras and a high-capacity communications network to provide this functionality. The second subsystem directly measures traffic conditions (i.e., flow rates, average speeds, etc.) at strategic locations. Technically, this subsystem uses a variety of sensors (including inductive loop detectors, acoustic detectors, and video image vehicle detection systems [VIVDS]) and a low-capacity communications network to measure conditions. Combined, the visual monitoring and traffic measurement subsystems comprise a significant investment and maintenance commitment for transportation agencies, such as the Virginia Department of Transportation (VDOT).
In order to reduce both capital and maintenance costs, combining these two subsystems
into one is conceptually advantageous. An ideal way to do this is by using VIVDS as the traffic measurement device. VIVDS use software to analyze digitized video from a CCTV to identify the presence of vehicles in zones manually defined by engineers calibrating the system. In other words, an engineer will install a CCTV camera and define detection zones in travel lanes, and then the software will mimic the operation of more traditional vehicle detectors, such as inductive loops. The difficulty in integrating CCTV and VIVDS lies in the movement of the camera. The calibration of VIVDS is critical to the detector’s effectiveness, and small movements of the camera will destroy the calibration. Of course, in order for visual CCTV
2
monitoring to be effective, the cameras must be moved to monitor a specific area of interest. Thus, the challenge of integrating CCTV and VIVDS is to identify a way to return the camera to precisely the same position it was in when VIVDS calibration was conducted. This design will allow the camera to be used for traffic measurement under “normal” circumstances and also support visual monitoring during nonrecurrent, incident situations.
A study completed by the University of Virginia (UVA) and the Virginia Transportation
Research Council (VTRC) in 2002 concluded that it is feasible to integrate these subsystems using image-processing techniques. The feasibility was established by creating a prototype integrated CCTV/VIVDS system, referred to as Autotrack, which was evaluated through laboratory testing designed to emulate real-world conditions. Two of the key recommendations resulting from this research effort were (Smith and Pack, 2002):
1. A modified prototype Autotrack system should be developed that is suitable for field
deployment with existing CCTV cameras. 2. The field-level Autotrack prototype should be evaluated extensively to make a final
decision regarding CCTV/VIVDS integration in future and redesigned/redeveloped transportation management systems.
This report presents the findings of the follow-on project designed to address the
aforementioned recommendations. In particular, it describes the design of a “field-ready” integrated CCTV/VIVDS system (referred to as Phase II Autotrack) and the results of an evaluation of the system at VDOT’s Hampton Roads Smart Traffic Center (HRSTC).
PURPOSE AND SCOPE
The purpose of this research was to develop an integrated CCTV/VIVDS and evaluate the system using VDOT Smart Traffic Center equipment. The scope of the project was limited to freeway applications of CCTV and VIVDS.
METHODOLOGY
This research effort involved four tasks: 1. Literature Review
2. Generation of Requirements for Enhancement to Create Phase II Autotrack
3. Development of Phase II Autotrack Design
4. Phase II Autotrack Field Deployment and Evaluation

3
Literature Review
A review of the literature was conducted to provide a foundation for the research. In particular, literature related to the original VTRC Autotrack project (Phase I Autotrack) was examined in depth (Smith and Pack, 2002). Generation of Requirements for Enhancement to Create Phase II Autotrack
Based on an analysis of the Phase I Autotrack, as well as site visits to HRSTC and discussions with HRSTC staff, the research team generated requirements for enhancing the original Autotrack system to create Phase II Autotrack.. Development of Phase II Autotrack Design
The Phase II Autotrack design was developed taking into consideration the field requirements identified in Task 2. The system was built using the LabVIEW software package to support image-processing functionality. Phase II Autotrack Field Deployment and Evaluation
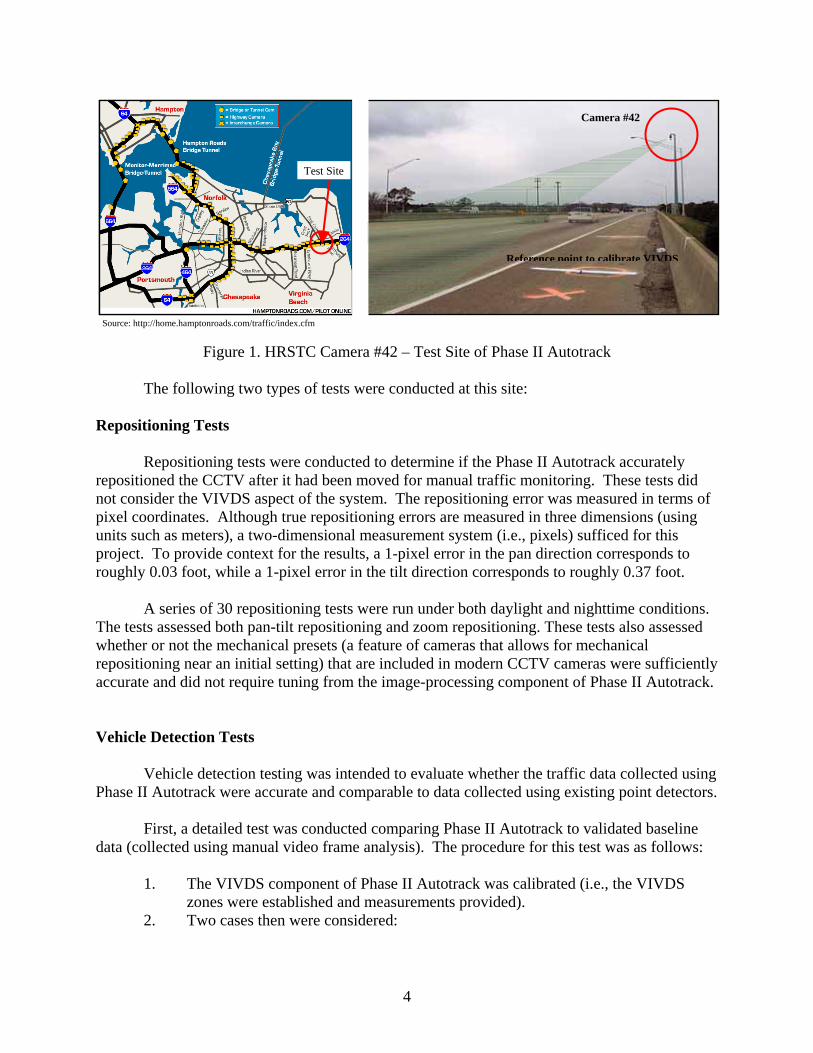
In order to fully evaluate the system under field conditions, Phase II Autotrack was integrated with an existing CCTV camera in the HRSTC. Camera #42 of the system was selected because it was located near existing point detectors (to be used for comparison) and because HRSTC staff could isolate the video and control of the camera in the existing fiber communications network. Figure 1 shows the location and the field of view for Camera #42. The test site was located on I-264 in the vicinity of exit 21B (First Colonial Road). At this location Camera #42 monitors the three eastbound lanes of I-264.
4
Figure 1. HRSTC Camera #42 – Test Site of Phase II Autotrack
The following two types of tests were conducted at this site:
Repositioning Tests
Repositioning tests were conducted to determine if the Phase II Autotrack accurately repositioned the CCTV after it had been moved for manual traffic monitoring. These tests did not consider the VIVDS aspect of the system. The repositioning error was measured in terms of pixel coordinates. Although true repositioning errors are measured in three dimensions (using units such as meters), a two-dimensional measurement system (i.e., pixels) sufficed for this project. To provide context for the results, a 1-pixel error in the pan direction corresponds to roughly 0.03 foot, while a 1-pixel error in the tilt direction corresponds to roughly 0.37 foot. A series of 30 repositioning tests were run under both daylight and nighttime conditions. The tests assessed both pan-tilt repositioning and zoom repositioning. These tests also assessed whether or not the mechanical presets (a feature of cameras that allows for mechanical repositioning near an initial setting) that are included in modern CCTV cameras were sufficiently accurate and did not require tuning from the image-processing component of Phase II Autotrack. Vehicle Detection Tests
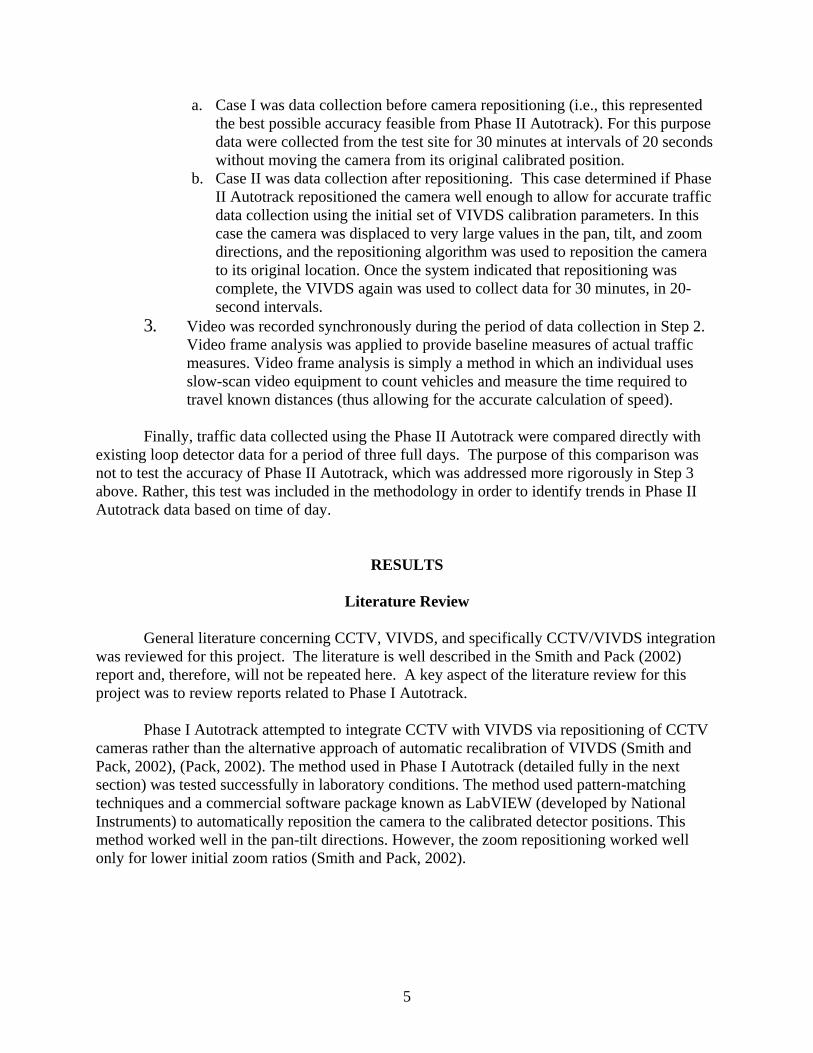
Vehicle detection testing was intended to evaluate whether the traffic data collected using Phase II Autotrack were accurate and comparable to data collected using existing point detectors.
First, a detailed test was conducted comparing Phase II Autotrack to validated baseline
data (collected using manual video frame analysis). The procedure for this test was as follows: 1. The VIVDS component of Phase II Autotrack was calibrated (i.e., the VIVDS
zones were established and measurements provided). 2. Two cases then were considered:
Camera #42
Test Site
Reference point to calibrate VIVDS
Source: http://home.hamptonroads.com/traffic/index.cfm
5
a. Case I was data collection before camera repositioning (i.e., this represented the best possible accuracy feasible from Phase II Autotrack). For this purpose data were collected from the test site for 30 minutes at intervals of 20 seconds without moving the camera from its original calibrated position.
b. Case II was data collection after repositioning. This case determined if Phase II Autotrack repositioned the camera well enough to allow for accurate traffic data collection using the initial set of VIVDS calibration parameters. In this case the camera was displaced to very large values in the pan, tilt, and zoom directions, and the repositioning algorithm was used to reposition the camera to its original location. Once the system indicated that repositioning was complete, the VIVDS again was used to collect data for 30 minutes, in 20-second intervals.
3. Video was recorded synchronously during the period of data collection in Step 2. Video frame analysis was applied to provide baseline measures of actual traffic measures. Video frame analysis is simply a method in which an individual uses slow-scan video equipment to count vehicles and measure the time required to travel known distances (thus allowing for the accurate calculation of speed).
Finally, traffic data collected using the Phase II Autotrack were compared directly with
existing loop detector data for a period of three full days. The purpose of this comparison was not to test the accuracy of Phase II Autotrack, which was addressed more rigorously in Step 3 above. Rather, this test was included in the methodology in order to identify trends in Phase II Autotrack data based on time of day.
RESULTS
Literature Review General literature concerning CCTV, VIVDS, and specifically CCTV/VIVDS integration was reviewed for this project. The literature is well described in the Smith and Pack (2002) report and, therefore, will not be repeated here. A key aspect of the literature review for this project was to review reports related to Phase I Autotrack.
Phase I Autotrack attempted to integrate CCTV with VIVDS via repositioning of CCTV cameras rather than the alternative approach of automatic recalibration of VIVDS (Smith and Pack, 2002), (Pack, 2002). The method used in Phase I Autotrack (detailed fully in the next section) was tested successfully in laboratory conditions. The method used pattern-matching techniques and a commercial software package known as LabVIEW (developed by National Instruments) to automatically reposition the camera to the calibrated detector positions. This method worked well in the pan-tilt directions. However, the zoom repositioning worked well only for lower initial zoom ratios (Smith and Pack, 2002).
6
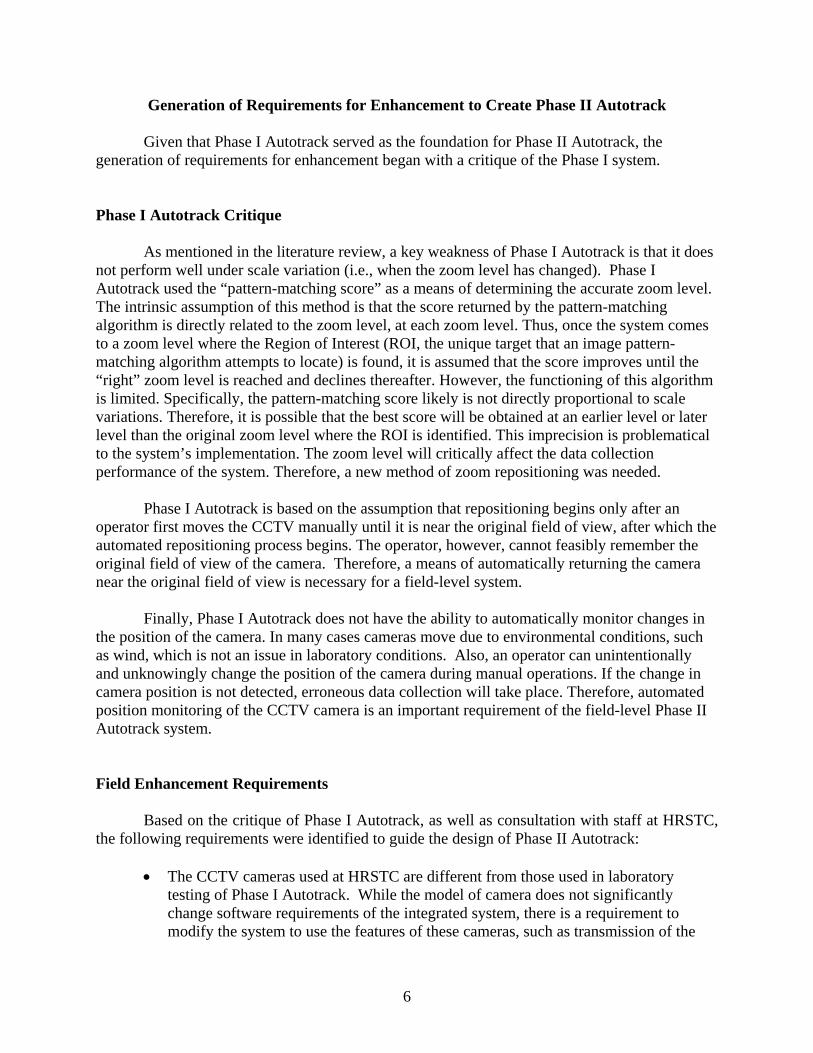
Generation of Requirements for Enhancement to Create Phase II Autotrack Given that Phase I Autotrack served as the foundation for Phase II Autotrack, the generation of requirements for enhancement began with a critique of the Phase I system. Phase I Autotrack Critique
As mentioned in the literature review, a key weakness of Phase I Autotrack is that it does not perform well under scale variation (i.e., when the zoom level has changed). Phase I Autotrack used the “pattern-matching score” as a means of determining the accurate zoom level. The intrinsic assumption of this method is that the score returned by the pattern-matching algorithm is directly related to the zoom level, at each zoom level. Thus, once the system comes to a zoom level where the Region of Interest (ROI, the unique target that an image pattern-matching algorithm attempts to locate) is found, it is assumed that the score improves until the “right” zoom level is reached and declines thereafter. However, the functioning of this algorithm is limited. Specifically, the pattern-matching score likely is not directly proportional to scale variations. Therefore, it is possible that the best score will be obtained at an earlier level or later level than the original zoom level where the ROI is identified. This imprecision is problematical to the system’s implementation. The zoom level will critically affect the data collection performance of the system. Therefore, a new method of zoom repositioning was needed.
Phase I Autotrack is based on the assumption that repositioning begins only after an
operator first moves the CCTV manually until it is near the original field of view, after which the automated repositioning process begins. The operator, however, cannot feasibly remember the original field of view of the camera. Therefore, a means of automatically returning the camera near the original field of view is necessary for a field-level system.
Finally, Phase I Autotrack does not have the ability to automatically monitor changes in
the position of the camera. In many cases cameras move due to environmental conditions, such as wind, which is not an issue in laboratory conditions. Also, an operator can unintentionally and unknowingly change the position of the camera during manual operations. If the change in camera position is not detected, erroneous data collection will take place. Therefore, automated position monitoring of the CCTV camera is an important requirement of the field-level Phase II Autotrack system. Field Enhancement Requirements Based on the critique of Phase I Autotrack, as well as consultation with staff at HRSTC, the following requirements were identified to guide the design of Phase II Autotrack:
• The CCTV cameras used at HRSTC are different from those used in laboratory testing of Phase I Autotrack. While the model of camera does not significantly change software requirements of the integrated system, there is a requirement to modify the system to use the features of these cameras, such as transmission of the

7
pan-tilt-zoom (PTZ) values and availability of a mechanical PTZ preset position function.
• It is not always possible to find an ideal ROI in field conditions (i.e., in many cases, it
is difficult to identify regions in a freeway image with unique shapes and colors). Therefore, it is necessary to use a second ROI.
• Zoom repositioning in the laboratory was accurate only for lower zoom ratios (i.e.,
relatively little image magnification). In the field, the cameras are frequently zoomed in to levels greater than four times the initial image. Therefore, the enhanced field system should be able to accurately reposition in the zoom direction at all zoom levels.
• Cameras in the field are frequently pointed in multiple directions (some times very far
away from the original VIVDS-calibrated position) for manual traffic monitoring based on traffic conditions, time of day, congestion, and so forth. The field system should be able to return to the original VIVDS-calibrated position after the camera has pointed in a different direction.
• The system should be able to automatically monitor any change in position of the
camera that is either made by the operator or occurs by accident or due to environmental reasons.
Development of Phase II Autotrack Design
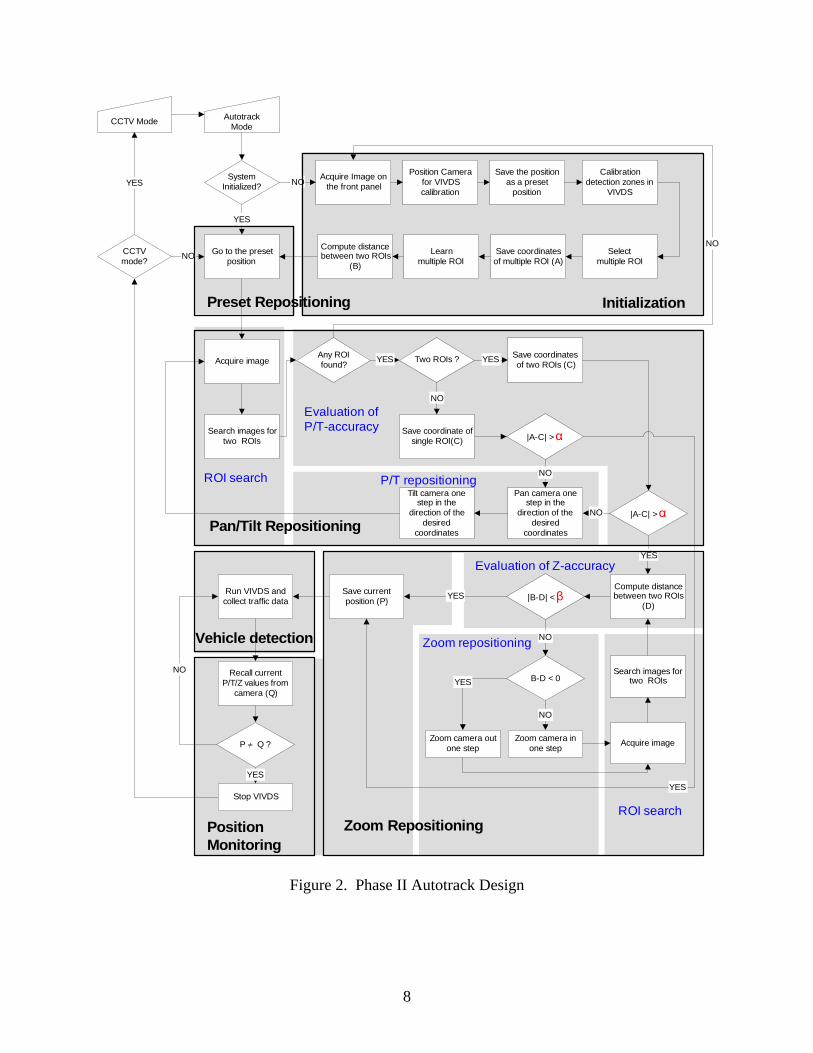
Based on the enhancement requirements previously presented, the Phase II Autotrack design was developed. A flowchart of the design is presented in Figure 2, which is supplemented by a discussion of each of the six main modules: 1.) Autotrack initialization, 2.) preset repositioning, 3.) pan-tilt repositioning, 4.) zoom repositioning, 5.) vehicle detection, and 6.) position monitoring.
8
Go to the presetposition
AutotrackModeCCTV Mode
SystemInitialized?
Acquire Image onthe front panel
Position Camerafor VIVDScalibration
Calibrationdetection zones in
VIVDS
Selectmultiple ROI
Learnmultiple ROI
Save the positionas a preset
positionNO
YES
Acquire image
Search images fortwo ROIs
Save coordinate ofsingle ROI(C)
|A-C| > α
YES
Pan camera onestep in the
direction of thedesired
coordinates
Tilt camera onestep in the
direction of thedesired
coordinates
NO
Two ROIs ?
NO
Save coordinatesof two ROIs (C)YESAny ROI
found? YES
Save currentposition (P)
Initialization
Pan/Tilt Repositioning
Compute distancebetween two ROIs
(D)|B-D| < β
Zoom camera outone step
Save coordinatesof multiple ROI (A)
Compute distancebetween two ROIs
(B)
B-D < 0
Zoom camera inone step
NO
YES
NO
YES
|A-C| > α
NO
YES
Zoom Repositioning
Recall currentP/T/Z values from
camera (Q)
P ≠ Q ?
Run VIVDS andcollect traffic data
NO
Vehicle detection
PositionMonitoring
Stop VIVDS
YES
CCTVmode? NO
YES
Acquire image
Search images fortwo ROIs
Preset Repositioning
Evaluation of Z-accuracy
ROI search
Zoom repositioning
ROI search P/T repositioning
Evaluation ofP/T-accuracy
NO
Figure 2. Phase II Autotrack Design
9
Autotrack Initialization
The initialization process begins by acquiring video images from the camera and displaying them on the Autotrack computer. Next, the camera is positioned by an operator for VIVDS calibration. The VIVDS calibration process is conducted in accordance to the procedures recommended by the manufacturer of the VIVDS equipment. Once the calibration is complete, the position is saved using the camera’s mechanical preset function.
The next step in the Autotrack initialization process is for the operator to identify two
ROIs to serve as target regions for use in the repositioning process. The regions are defined simply using the computer mouse. Next, Phase II Autotrack determines the centroid points of both ROIs and calculates the linear distance between the ROI centroids.
Finally, the process “Learn Multiple ROIs” uses the LabView image-processing function
to determine and store the pixel details within each ROI. These details are later used in the matching phase to match pixel values in a new image with those of the stored ROI.
Preset Repositioning
After Phase II Autotrack has been initialized, the system will use VIVDS to collect traffic data (described in the “Vehicle Detection” phase) until an operator moves the camera for manual visual inspection. Once data collection is complete, the camera is repositioned using the mechanical preset established in the initialization phase.
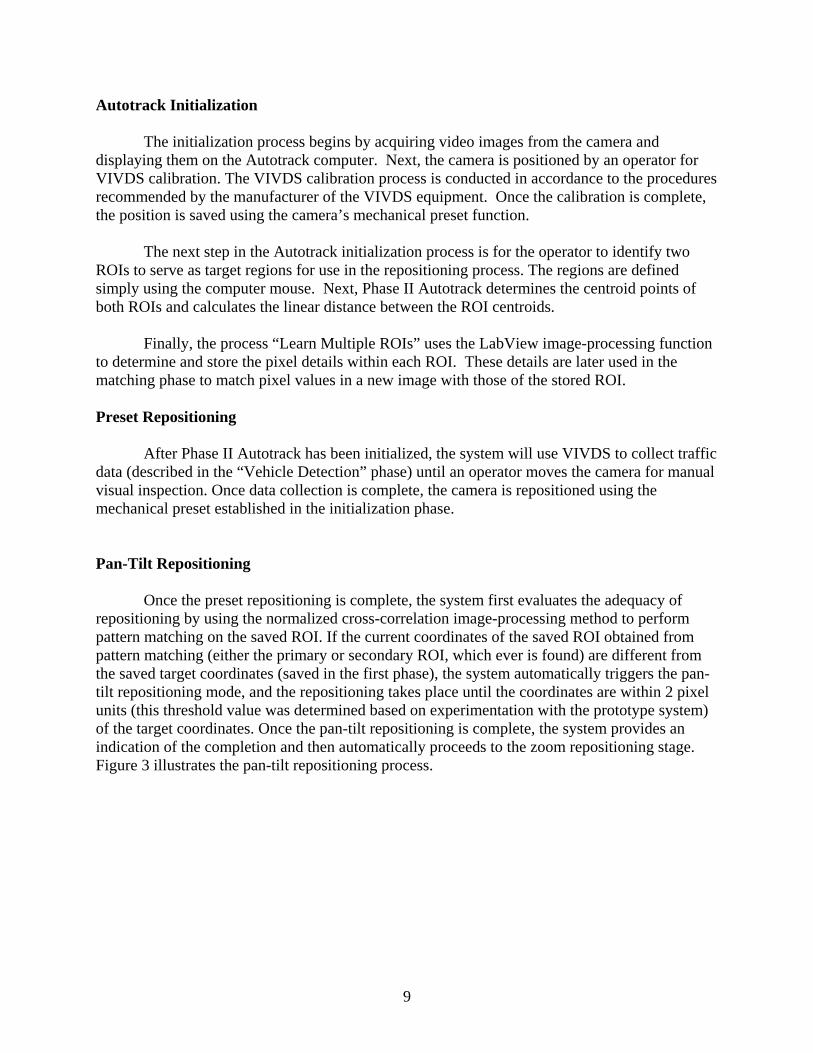
Pan-Tilt Repositioning
Once the preset repositioning is complete, the system first evaluates the adequacy of repositioning by using the normalized cross-correlation image-processing method to perform pattern matching on the saved ROI. If the current coordinates of the saved ROI obtained from pattern matching (either the primary or secondary ROI, which ever is found) are different from the saved target coordinates (saved in the first phase), the system automatically triggers the pan-tilt repositioning mode, and the repositioning takes place until the coordinates are within 2 pixel units (this threshold value was determined based on experimentation with the prototype system) of the target coordinates. Once the pan-tilt repositioning is complete, the system provides an indication of the completion and then automatically proceeds to the zoom repositioning stage. Figure 3 illustrates the pan-tilt repositioning process.
10
Figure 3. Pan-Tilt Repositioning Approach
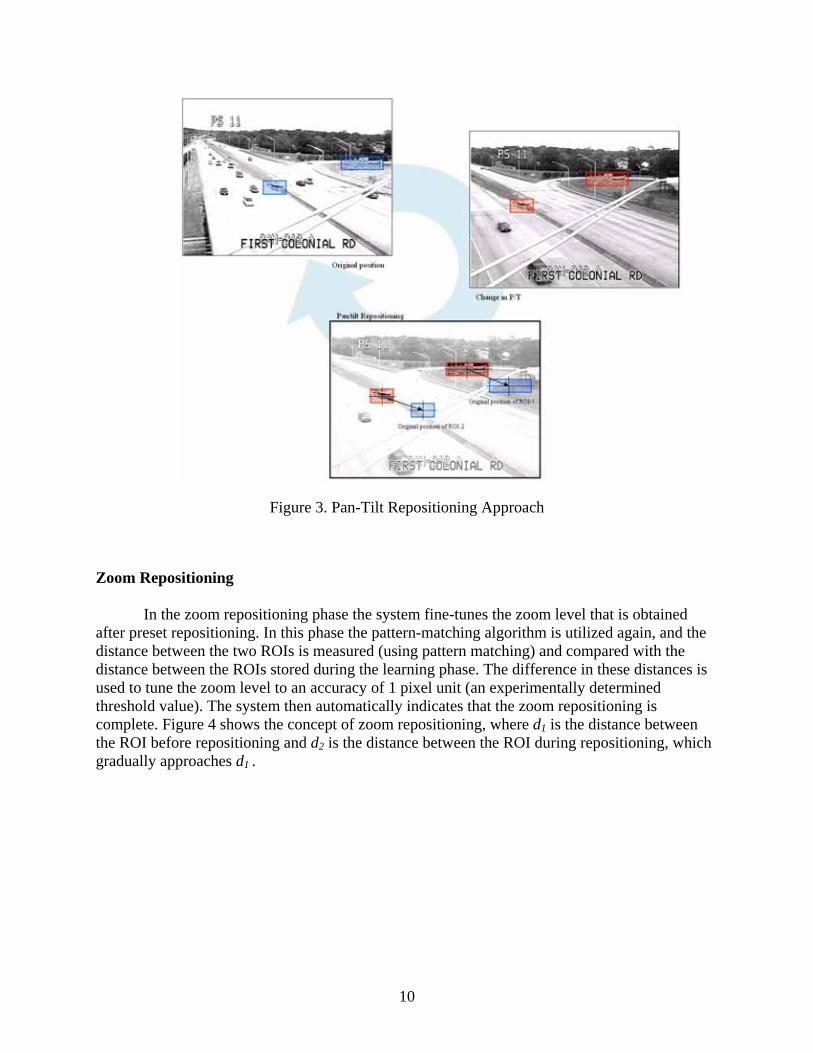
Zoom Repositioning
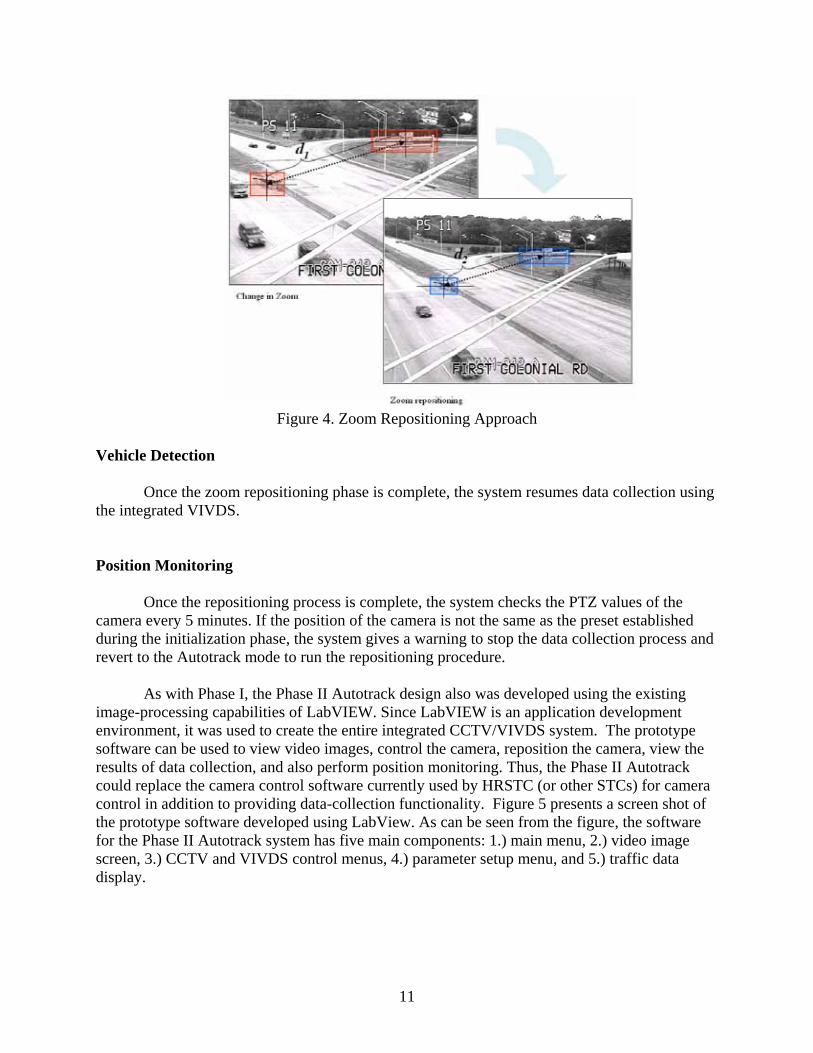
In the zoom repositioning phase the system fine-tunes the zoom level that is obtained after preset repositioning. In this phase the pattern-matching algorithm is utilized again, and the distance between the two ROIs is measured (using pattern matching) and compared with the distance between the ROIs stored during the learning phase. The difference in these distances is used to tune the zoom level to an accuracy of 1 pixel unit (an experimentally determined threshold value). The system then automatically indicates that the zoom repositioning is complete. Figure 4 shows the concept of zoom repositioning, where d1 is the distance between the ROI before repositioning and d2 is the distance between the ROI during repositioning, which gradually approaches d1 .
11
Figure 4. Zoom Repositioning Approach
Vehicle Detection
Once the zoom repositioning phase is complete, the system resumes data collection using the integrated VIVDS. Position Monitoring
Once the repositioning process is complete, the system checks the PTZ values of the camera every 5 minutes. If the position of the camera is not the same as the preset established during the initialization phase, the system gives a warning to stop the data collection process and revert to the Autotrack mode to run the repositioning procedure.
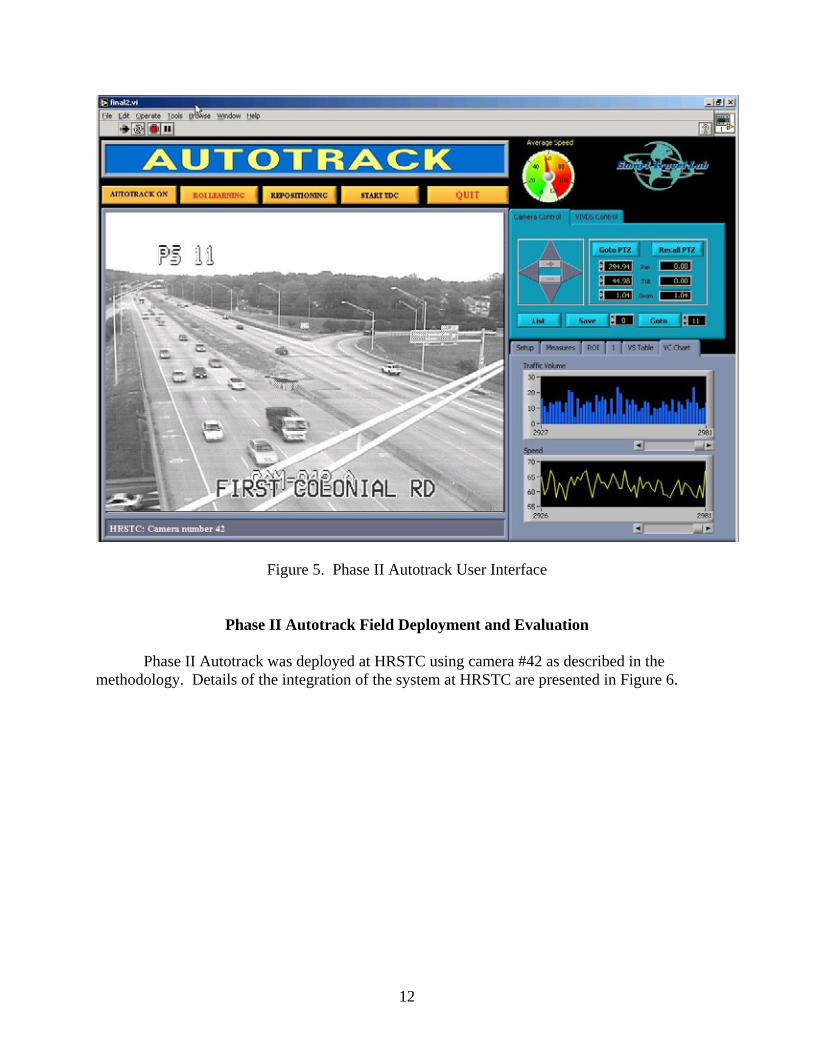
As with Phase I, the Phase II Autotrack design also was developed using the existing image-processing capabilities of LabVIEW. Since LabVIEW is an application development environment, it was used to create the entire integrated CCTV/VIVDS system. The prototype software can be used to view video images, control the camera, reposition the camera, view the results of data collection, and also perform position monitoring. Thus, the Phase II Autotrack could replace the camera control software currently used by HRSTC (or other STCs) for camera control in addition to providing data-collection functionality. Figure 5 presents a screen shot of the prototype software developed using LabView. As can be seen from the figure, the software for the Phase II Autotrack system has five main components: 1.) main menu, 2.) video image screen, 3.) CCTV and VIVDS control menus, 4.) parameter setup menu, and 5.) traffic data display.
12
Figure 5. Phase II Autotrack User Interface
Phase II Autotrack Field Deployment and Evaluation
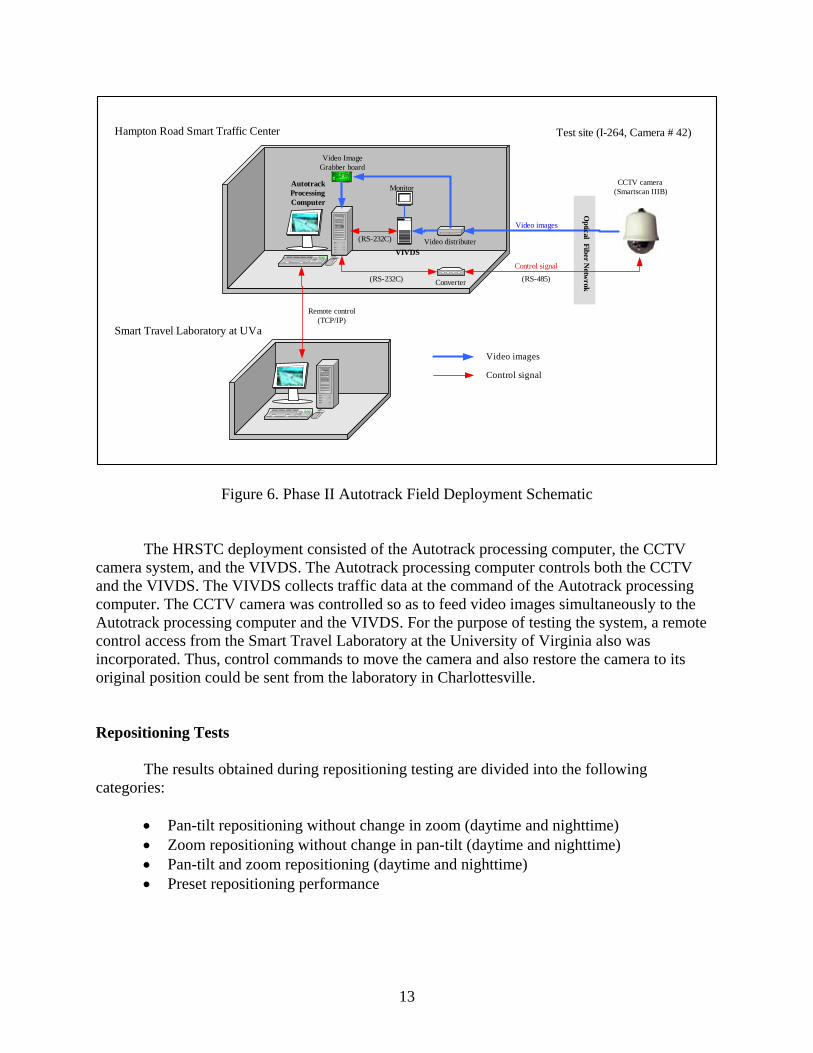
Phase II Autotrack was deployed at HRSTC using camera #42 as described in the
methodology. Details of the integration of the system at HRSTC are presented in Figure 6.
13
Video ImageGrabber board
Video distributer
MonitorCCTV camera
(Smartscan IIIB)
Converter(RS-232C) (RS-485)
Video images
Control signal
Remote control(TCP/IP)
Hampton Road Smart Traffic Center
(RS-232C)
VIVDS
AutotrackProcessingComputer
Video images
Control signal
Smart Travel Laboratory at UVa
Test site (I-264, Camera # 42)
Optical Fiber N
etwrok
Figure 6. Phase II Autotrack Field Deployment Schematic
The HRSTC deployment consisted of the Autotrack processing computer, the CCTV
camera system, and the VIVDS. The Autotrack processing computer controls both the CCTV and the VIVDS. The VIVDS collects traffic data at the command of the Autotrack processing computer. The CCTV camera was controlled so as to feed video images simultaneously to the Autotrack processing computer and the VIVDS. For the purpose of testing the system, a remote control access from the Smart Travel Laboratory at the University of Virginia also was incorporated. Thus, control commands to move the camera and also restore the camera to its original position could be sent from the laboratory in Charlottesville.
Repositioning Tests
The results obtained during repositioning testing are divided into the following categories:
• Pan-tilt repositioning without change in zoom (daytime and nighttime) • Zoom repositioning without change in pan-tilt (daytime and nighttime) • Pan-tilt and zoom repositioning (daytime and nighttime) • Preset repositioning performance
14
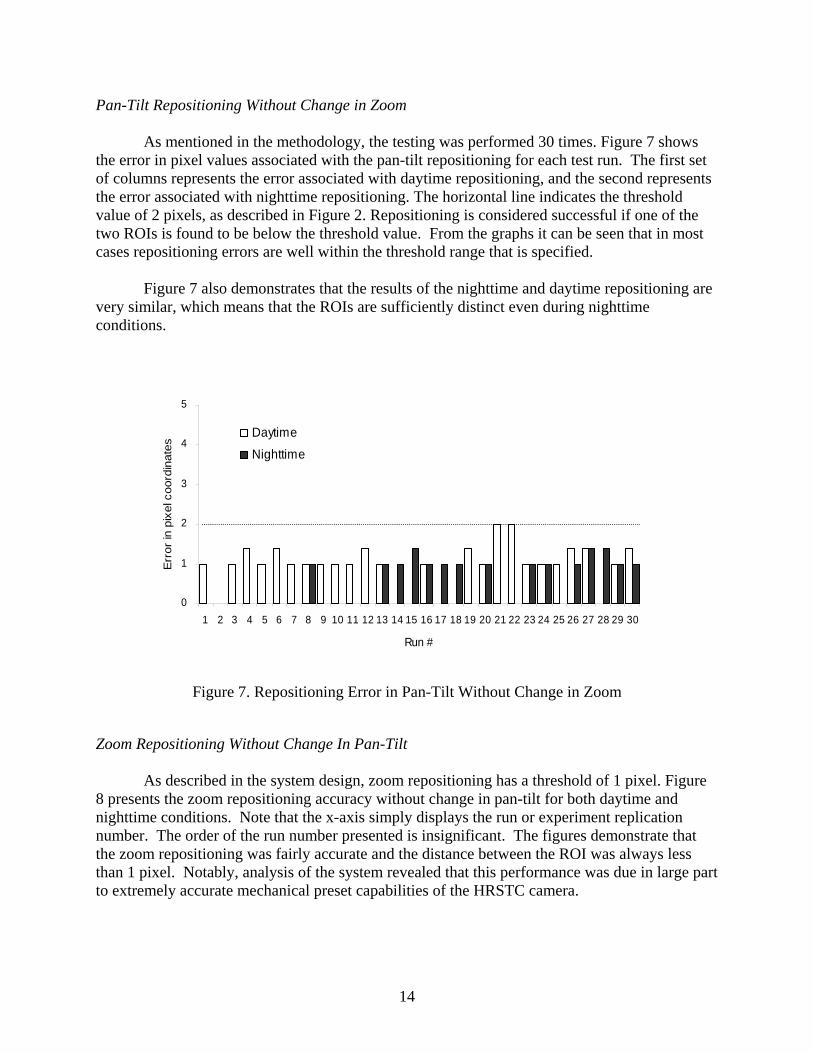
Pan-Tilt Repositioning Without Change in Zoom
As mentioned in the methodology, the testing was performed 30 times. Figure 7 shows the error in pixel values associated with the pan-tilt repositioning for each test run. The first set of columns represents the error associated with daytime repositioning, and the second represents the error associated with nighttime repositioning. The horizontal line indicates the threshold value of 2 pixels, as described in Figure 2. Repositioning is considered successful if one of the two ROIs is found to be below the threshold value. From the graphs it can be seen that in most cases repositioning errors are well within the threshold range that is specified.
Figure 7 also demonstrates that the results of the nighttime and daytime repositioning are
very similar, which means that the ROIs are sufficiently distinct even during nighttime conditions.
Figure 7. Repositioning Error in Pan-Tilt Without Change in Zoom
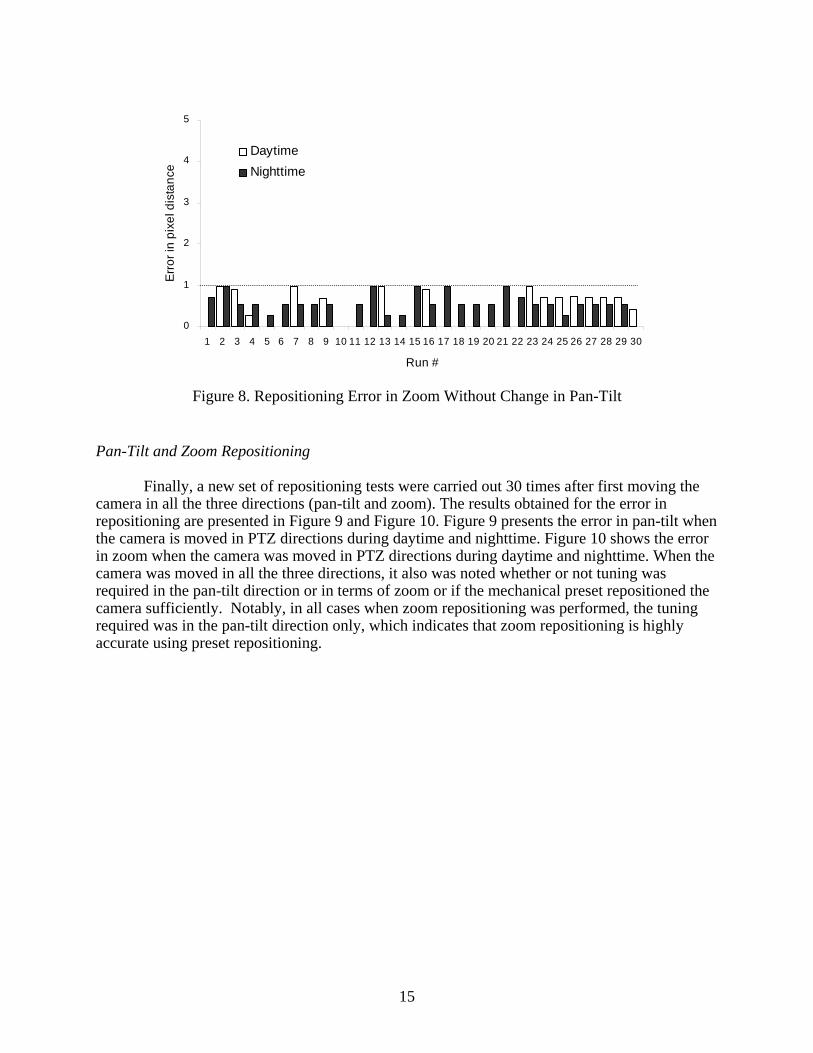
Zoom Repositioning Without Change In Pan-Tilt
As described in the system design, zoom repositioning has a threshold of 1 pixel. Figure 8 presents the zoom repositioning accuracy without change in pan-tilt for both daytime and nighttime conditions. Note that the x-axis simply displays the run or experiment replication number. The order of the run number presented is insignificant. The figures demonstrate that the zoom repositioning was fairly accurate and the distance between the ROI was always less than 1 pixel. Notably, analysis of the system revealed that this performance was due in large part to extremely accurate mechanical preset capabilities of the HRSTC camera.
0
1
2
3
4
5
1 2 3 4 5 6 7 8 9 10 11 12 13 14 15 16 17 18 19 20 21 22 23 24 25 26 27 28 29 30
Run #
Err
or in
pix
el c
oord
inat
es
Daytime
Nighttime
15
Figure 8. Repositioning Error in Zoom Without Change in Pan-Tilt
Pan-Tilt and Zoom Repositioning
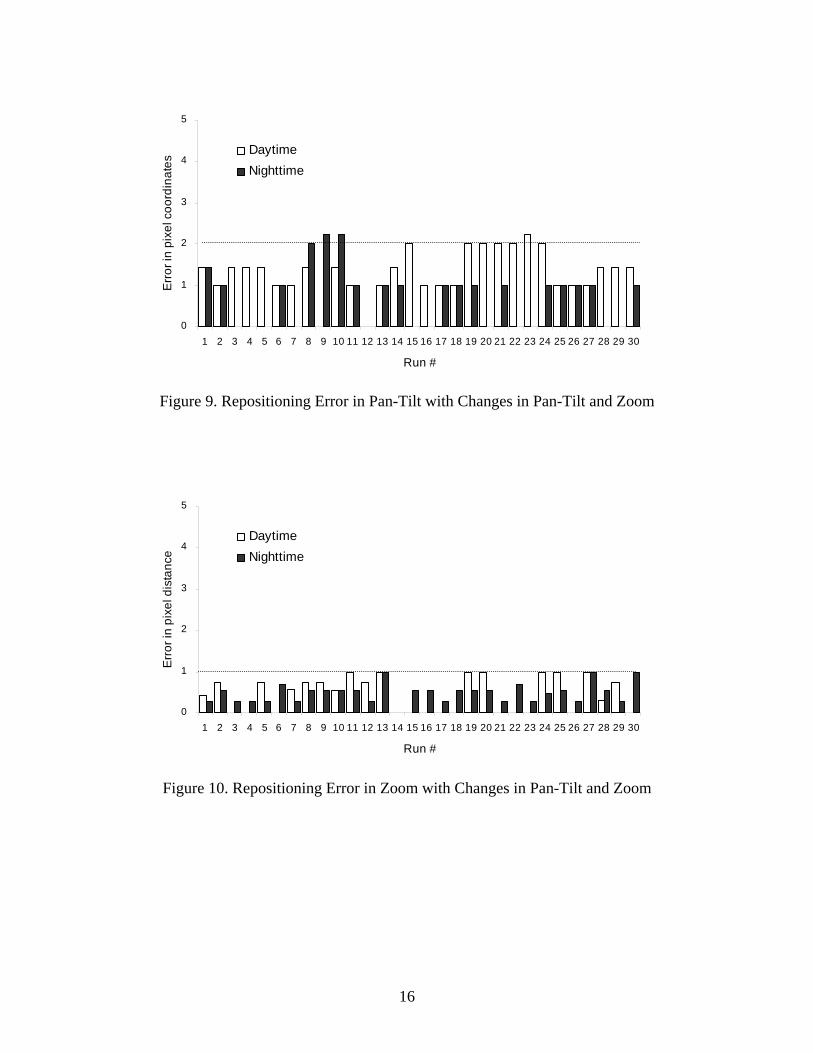
Finally, a new set of repositioning tests were carried out 30 times after first moving the camera in all the three directions (pan-tilt and zoom). The results obtained for the error in repositioning are presented in Figure 9 and Figure 10. Figure 9 presents the error in pan-tilt when the camera is moved in PTZ directions during daytime and nighttime. Figure 10 shows the error in zoom when the camera was moved in PTZ directions during daytime and nighttime. When the camera was moved in all the three directions, it also was noted whether or not tuning was required in the pan-tilt direction or in terms of zoom or if the mechanical preset repositioned the camera sufficiently. Notably, in all cases when zoom repositioning was performed, the tuning required was in the pan-tilt direction only, which indicates that zoom repositioning is highly accurate using preset repositioning.
0
1
2
3
4
5
1 2 3 4 5 6 7 8 9 10 11 12 13 14 15 16 17 18 19 20 21 22 23 24 25 26 27 28 29 30
Run #
Err
or in
pix
el d
ista
nce
DaytimeNighttime
16
0
1
2
3
4
5
1 2 3 4 5 6 7 8 9 10 11 12 13 14 15 16 17 18 19 20 21 22 23 24 25 26 27 28 29 30
Run #
Err
or in
pix
el c
oord
inat
esDaytimeNighttime
Figure 9. Repositioning Error in Pan-Tilt with Changes in Pan-Tilt and Zoom
Figure 10. Repositioning Error in Zoom with Changes in Pan-Tilt and Zoom
0
1
2
3
4
5
1 2 3 4 5 6 7 8 9 10 11 12 13 14 15 16 17 18 19 20 21 22 23 24 25 26 27 28 29 30
Run #
Err
or in
pix
el d
ista
nce
DaytimeNighttime
17
Preset Repositioning Performance
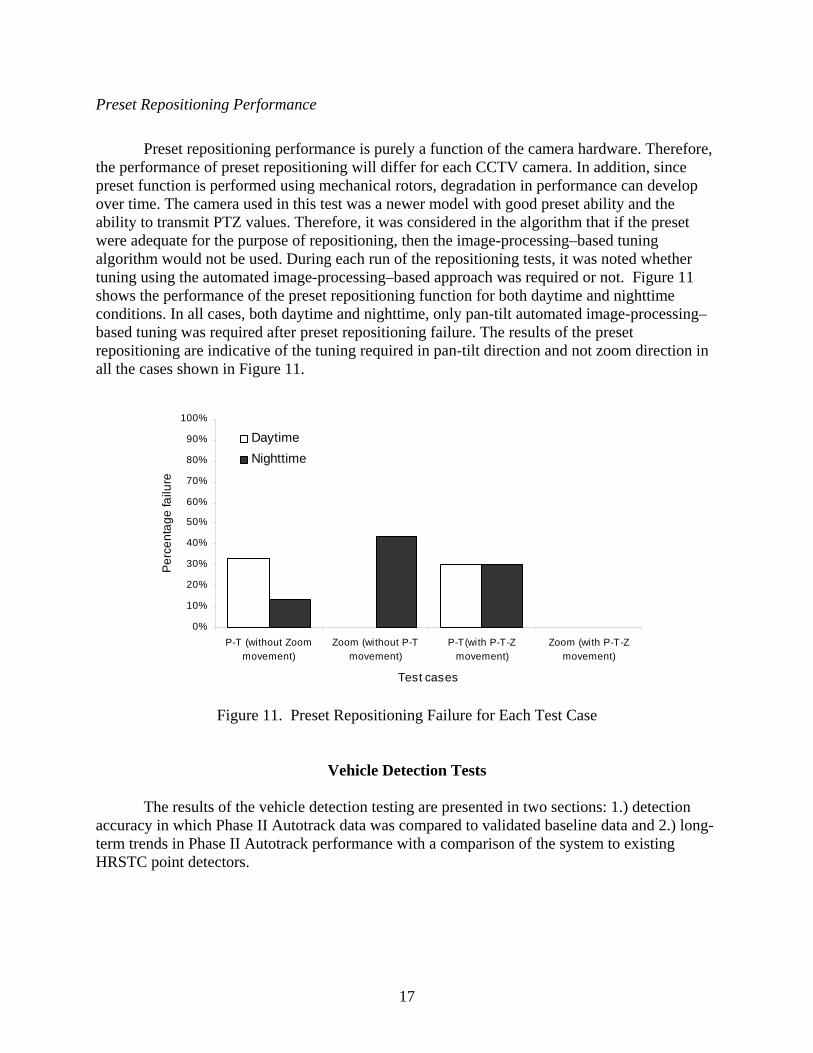
Preset repositioning performance is purely a function of the camera hardware. Therefore, the performance of preset repositioning will differ for each CCTV camera. In addition, since preset function is performed using mechanical rotors, degradation in performance can develop over time. The camera used in this test was a newer model with good preset ability and the ability to transmit PTZ values. Therefore, it was considered in the algorithm that if the preset were adequate for the purpose of repositioning, then the image-processing–based tuning algorithm would not be used. During each run of the repositioning tests, it was noted whether tuning using the automated image-processing–based approach was required or not. Figure 11 shows the performance of the preset repositioning function for both daytime and nighttime conditions. In all cases, both daytime and nighttime, only pan-tilt automated image-processing–based tuning was required after preset repositioning failure. The results of the preset repositioning are indicative of the tuning required in pan-tilt direction and not zoom direction in all the cases shown in Figure 11.
0%
10%
20%
30%
40%
50%
60%
70%
80%
90%
100%
P-T (without Zoommovement)
Zoom (without P-Tmovement)
P-T(with P-T-Zmovement)
Zoom (with P-T-Zmovement)
Test cases
Per
cent
age
failu
re
DaytimeNighttime
Figure 11. Preset Repositioning Failure for Each Test Case
Vehicle Detection Tests
The results of the vehicle detection testing are presented in two sections: 1.) detection accuracy in which Phase II Autotrack data was compared to validated baseline data and 2.) long-term trends in Phase II Autotrack performance with a comparison of the system to existing HRSTC point detectors.
18
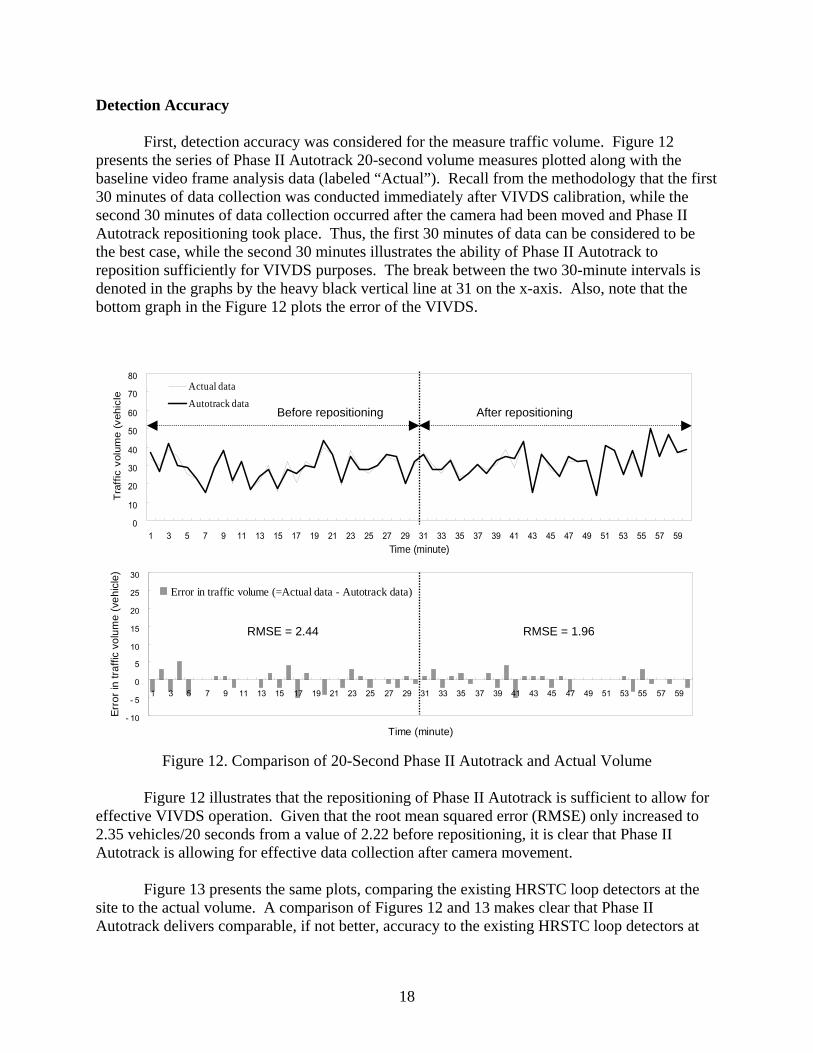
Detection Accuracy
First, detection accuracy was considered for the measure traffic volume. Figure 12 presents the series of Phase II Autotrack 20-second volume measures plotted along with the baseline video frame analysis data (labeled “Actual”). Recall from the methodology that the first 30 minutes of data collection was conducted immediately after VIVDS calibration, while the second 30 minutes of data collection occurred after the camera had been moved and Phase II Autotrack repositioning took place. Thus, the first 30 minutes of data can be considered to be the best case, while the second 30 minutes illustrates the ability of Phase II Autotrack to reposition sufficiently for VIVDS purposes. The break between the two 30-minute intervals is denoted in the graphs by the heavy black vertical line at 31 on the x-axis. Also, note that the bottom graph in the Figure 12 plots the error of the VIVDS.
Figure 12. Comparison of 20-Second Phase II Autotrack and Actual Volume
Figure 12 illustrates that the repositioning of Phase II Autotrack is sufficient to allow for effective VIVDS operation. Given that the root mean squared error (RMSE) only increased to 2.35 vehicles/20 seconds from a value of 2.22 before repositioning, it is clear that Phase II Autotrack is allowing for effective data collection after camera movement. Figure 13 presents the same plots, comparing the existing HRSTC loop detectors at the site to the actual volume. A comparison of Figures 12 and 13 makes clear that Phase II Autotrack delivers comparable, if not better, accuracy to the existing HRSTC loop detectors at
0
10
20
30
40
50
60
70
80
1 3 5 7 9 11 13 15 17 19 21 23 25 27 29 31 33 35 37 39 41 43 45 47 49 51 53 55 57 59Time (minute)
Traf
fic v
olum
e (v
ehic
le
Actual dataAutotrack data
- 10
- 5
0
5
10
15
20
25
30
1 3 5 7 9 11 13 15 17 19 21 23 25 27 29 31 33 35 37 39 41 43 45 47 49 51 53 55 57 59
Time (minute)
Erro
r in
traffi
c vo
lum
e (v
ehic
le)
Error in traffic volume (=Actual data - Autotrack data)
Before repositioning After repositioning
RMSE = 2.44 RMSE = 1.96
19
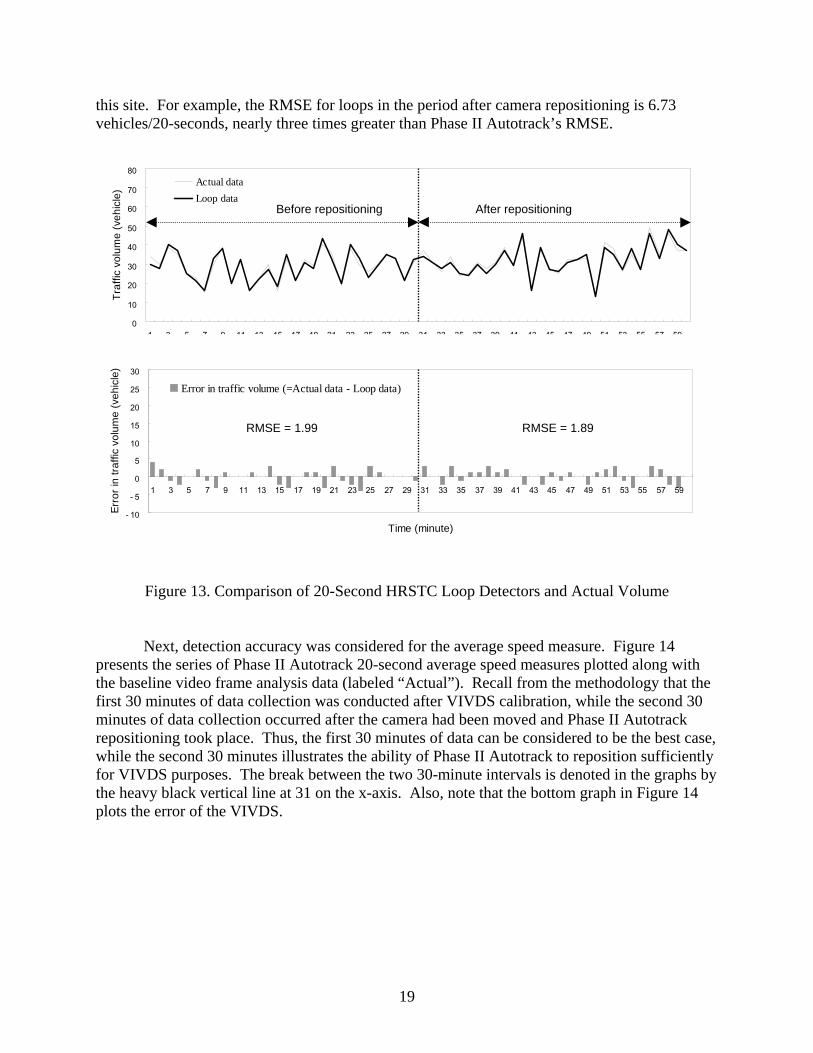
this site. For example, the RMSE for loops in the period after camera repositioning is 6.73 vehicles/20-seconds, nearly three times greater than Phase II Autotrack’s RMSE.
Figure 13. Comparison of 20-Second HRSTC Loop Detectors and Actual Volume
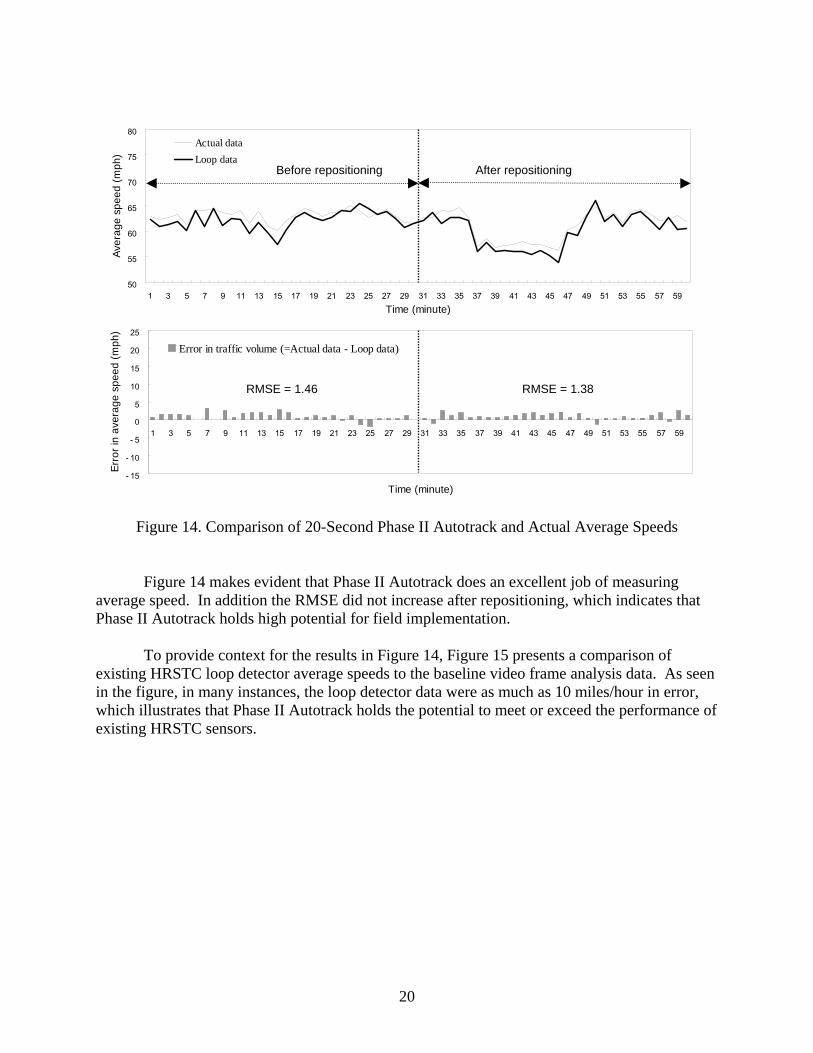
Next, detection accuracy was considered for the average speed measure. Figure 14 presents the series of Phase II Autotrack 20-second average speed measures plotted along with the baseline video frame analysis data (labeled “Actual”). Recall from the methodology that the first 30 minutes of data collection was conducted after VIVDS calibration, while the second 30 minutes of data collection occurred after the camera had been moved and Phase II Autotrack repositioning took place. Thus, the first 30 minutes of data can be considered to be the best case, while the second 30 minutes illustrates the ability of Phase II Autotrack to reposition sufficiently for VIVDS purposes. The break between the two 30-minute intervals is denoted in the graphs by the heavy black vertical line at 31 on the x-axis. Also, note that the bottom graph in Figure 14 plots the error of the VIVDS.
0
10
20
30
40
50
60
70
80
1 3 5 7 9 11 13 15 17 19 21 23 25 27 29 31 33 35 37 39 41 43 45 47 49 51 53 55 57 59
Time (minute)
Traf
fic v
olum
e (v
ehic
le)
Actual dataLoop data
- 10
- 5
0
5
10
15
20
25
30
1 3 5 7 9 11 13 15 17 19 21 23 25 27 29 31 33 35 37 39 41 43 45 47 49 51 53 55 57 59
Time (minute)
Erro
r in
traffi
c vo
lum
e (v
ehic
le)
Error in traffic volume (=Actual data - Loop data)
Before repositioning After repositioning
RMSE = 1.99 RMSE = 1.89
20
- 15
- 10
- 5
0
5
10
15
20
25
1 3 5 7 9 11 13 15 17 19 21 23 25 27 29 31 33 35 37 39 41 43 45 47 49 51 53 55 57 59
Time (minute)
Erro
r in
aver
age
spee
d (m
ph)
Error in traffic volume (=Actual data - Loop data)
50
55
60
65
70
75
80
1 3 5 7 9 11 13 15 17 19 21 23 25 27 29 31 33 35 37 39 41 43 45 47 49 51 53 55 57 59
Time (minute)
Aver
age
spee
d (m
ph)
Actual dataLoop data
Before repositioning After repositioning
RMSE = 1.46 RMSE = 1.38
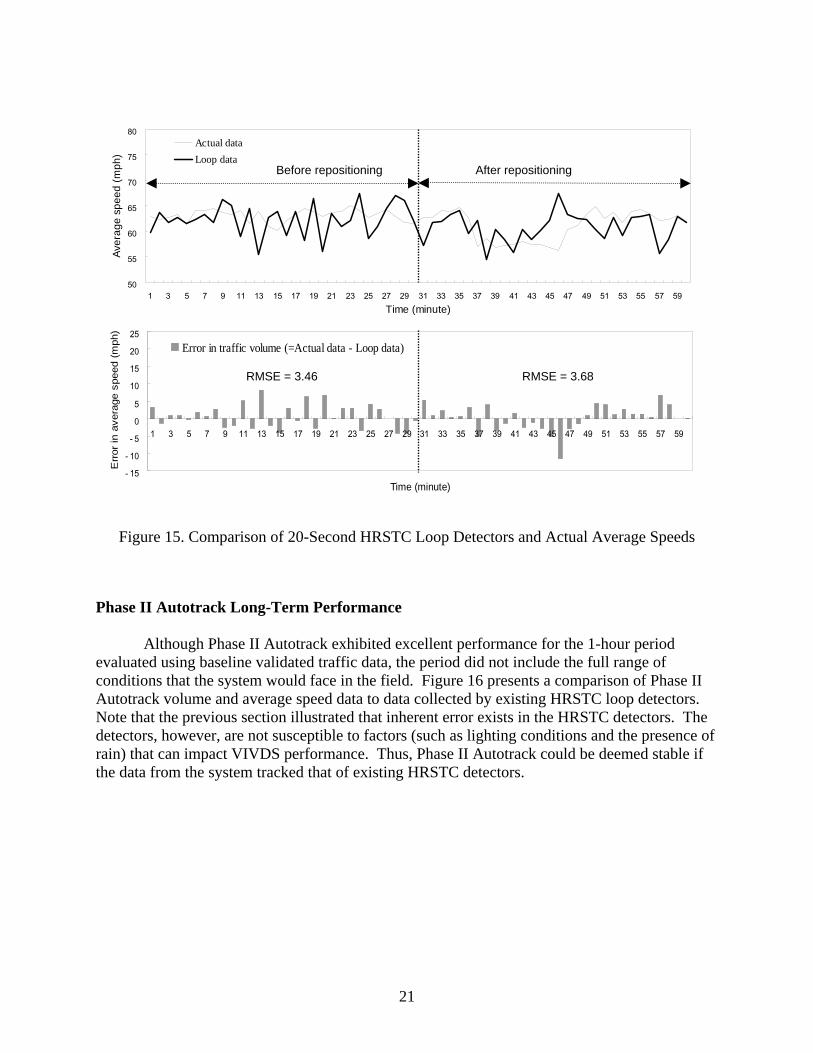
Figure 14. Comparison of 20-Second Phase II Autotrack and Actual Average Speeds Figure 14 makes evident that Phase II Autotrack does an excellent job of measuring average speed. In addition the RMSE did not increase after repositioning, which indicates that Phase II Autotrack holds high potential for field implementation. To provide context for the results in Figure 14, Figure 15 presents a comparison of existing HRSTC loop detector average speeds to the baseline video frame analysis data. As seen in the figure, in many instances, the loop detector data were as much as 10 miles/hour in error, which illustrates that Phase II Autotrack holds the potential to meet or exceed the performance of existing HRSTC sensors.
21
Figure 15. Comparison of 20-Second HRSTC Loop Detectors and Actual Average Speeds
Phase II Autotrack Long-Term Performance
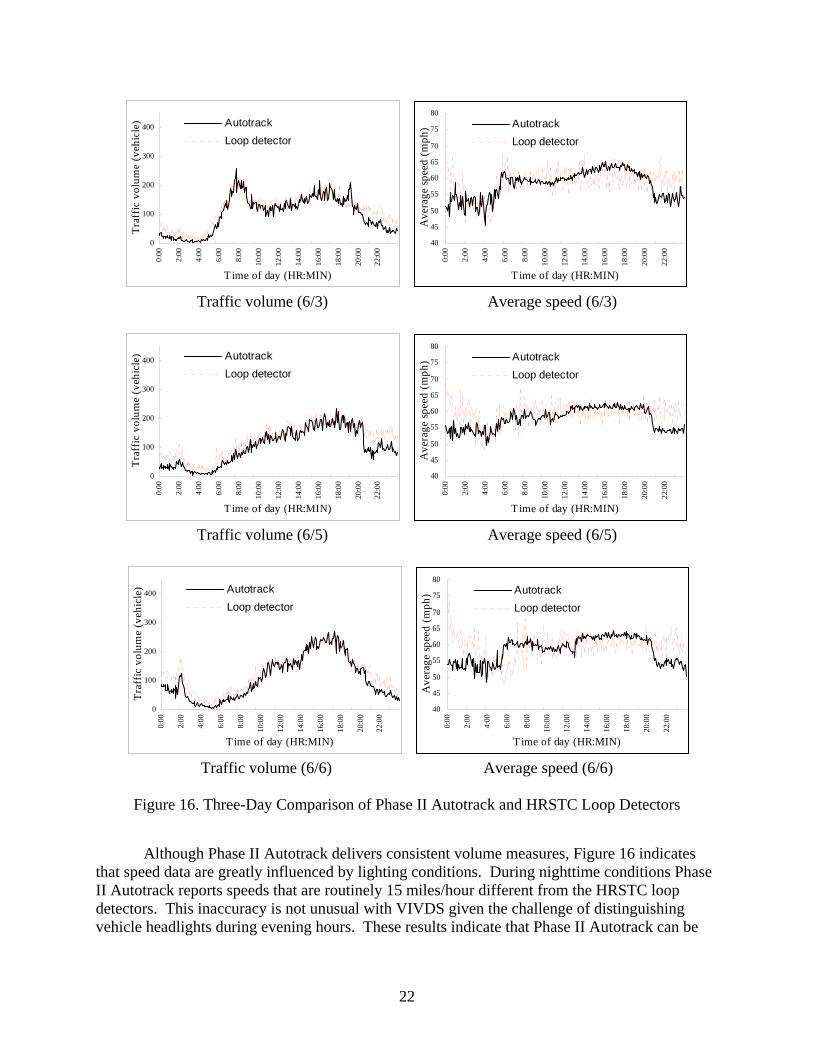
Although Phase II Autotrack exhibited excellent performance for the 1-hour period
evaluated using baseline validated traffic data, the period did not include the full range of conditions that the system would face in the field. Figure 16 presents a comparison of Phase II Autotrack volume and average speed data to data collected by existing HRSTC loop detectors. Note that the previous section illustrated that inherent error exists in the HRSTC detectors. The detectors, however, are not susceptible to factors (such as lighting conditions and the presence of rain) that can impact VIVDS performance. Thus, Phase II Autotrack could be deemed stable if the data from the system tracked that of existing HRSTC detectors.
- 15
- 10
- 5
0
5
10
15
20
25
1 3 5 7 9 11 13 15 17 19 21 23 25 27 29 31 33 35 37 39 41 43 45 47 49 51 53 55 57 59
Time (minute)
Erro
r in
ave
rage
spe
ed (
mph
)
Error in traffic volume (=Actual data - Loop data)
50
55
60
65
70
75
80
1 3 5 7 9 11 13 15 17 19 21 23 25 27 29 31 33 35 37 39 41 43 45 47 49 51 53 55 57 59
Time (minute)
Aver
age
spee
d (m
ph)
Actual dataLoop data
Before repositioning After repositioning
RMSE = 3.46 RMSE = 3.68
22
0
100
200
300
400
0:00
2:00
4:00
6:00
8:00
10:0
0
12:0
0
14:0
0
16:0
0
18:0
0
20:0
0
22:0
0
T ime of day (HR:MIN)
Traf
fic v
olum
e (v
ehic
le) Autotrack
Loop detector
40
45
50
55
60
65
70
75
80
0:00
2:00
4:00
6:00
8:00
10:0
0
12:0
0
14:0
0
16:0
0
18:0
0
20:0
0
22:0
0
T ime of day (HR:MIN)
Ave
rage
spee
d (m
ph) Autotrack
Loop detector
Traffic volume (6/3) Average speed (6/3)
0
100
200
300
400
0:00
2:00
4:00
6:00
8:00
10:0
0
12:0
0
14:0
0
16:0
0
18:0
0
20:0
0
22:0
0
T ime of day (HR:MIN)
Traf
fic v
olum
e (v
ehic
le) Autotrack
Loop detector
40
45
50
55
60
65
70
75
80
0:00
2:00
4:00
6:00
8:00
10:0
0
12:0
0
14:0
0
16:0
0
18:0
0
20:0
0
22:0
0
T ime of day (HR:MIN)
Ave
rage
spee
d (m
ph) Autotrack
Loop detector
Traffic volume (6/5) Average speed (6/5)
0
100
200
300
400
0:00
2:00
4:00
6:00
8:00
10:0
0
12:0
0
14:0
0
16:0
0
18:0
0
20:0
0
22:0
0
T ime of day (HR:MIN)
Traf
fic v
olum
e (v
ehic
le) Autotrack
Loop detector
40
45
50
55
60
65
70
75
80
0:00
2:00
4:00
6:00
8:00
10:0
0
12:0
0
14:0
0
16:0
0
18:0
0
20:0
0
22:0
0
T ime of day (HR:MIN)
Ave
rage
spee
d (m
ph) Autotrack
Loop detector
Traffic volume (6/6) Average speed (6/6)
Figure 16. Three-Day Comparison of Phase II Autotrack and HRSTC Loop Detectors
Although Phase II Autotrack delivers consistent volume measures, Figure 16 indicates that speed data are greatly influenced by lighting conditions. During nighttime conditions Phase II Autotrack reports speeds that are routinely 15 miles/hour different from the HRSTC loop detectors. This inaccuracy is not unusual with VIVDS given the challenge of distinguishing vehicle headlights during evening hours. These results indicate that Phase II Autotrack can be

23
used during daylight conditions for volume and speed, but only for volume during nighttime conditions.
CONCLUSIONS
Based on the results of this research, the following conclusions may be drawn concerning the feasibility of fielding an integrated CCTV/VIVDS system:
• Repositioning performance can be improved by integrating mechanical preset functions commonly available on new cameras.
• The use of two ROIs improves camera repositioning performance. • Integrated CCTV/VIVDS can be used to collect accurate volume data under a variety
of conditions. This volume data can be collected during times when the camera is not being positioned by an operator to investigate an incident.
• Integrated CCTV/VIVDS can be used to collect accurate average speed data during
daylight conditions.
RECOMMENDATIONS 1. VDOT’s Mobility Management Division should coordinate the installation and use of Phase
II Autotrack at four existing CCTV locations throughout the Commonwealth. Given the promising results of this research, VDOT should test the effectiveness and utility of Phase II Autotrack at four CCTV locations, which will provide long-term information, as well as insight into the impact of roadway geometry, camera type, and camera placement on the system.
2. The Virginia Transportation Research Council should continue the development of Phase II
Autotrack in order to improve speed measurement performance. In-depth analysis and development should take place to seek to improve (to the extent possible) the speed measurement performance of Phase II Autotrack.
3. The Virginia Transportation Research Council should investigate the use of additional
image-processing capabilities and develop a Phase III Autotrack to support STC operations. Given the promising results of this research, automated extraction of information from video imagery clearly provides the means to better monitor and manage freeway facilities. Another key, unmet need of STCs is automated shoulder monitoring. STCs must be able to identify vehicles stopped on shoulder lanes in order to manage the situation (provide for safety of motorists, clear the vehicle quickly to minimize rubbernecking impacts, investigate potential security concerns, etc.) Phase III Autotrack should be developed to provide shoulder-monitoring capabilities in addition to the existing traffic data-collection capability.

24
REFERENCES Pack, M.L. Automatic Camera Repositioning Techniques for Integrating CCTV Traffic
Surveillance Systems With Video Image Vehicle Detection Systems. Masters Thesis in Engineering. University of Virginia, Charlottesville, 2002.
Smith, B.L., and Pack, M. L. Camera Positioning and Calibration Techniques for Integrating
Traffic Surveillance Video Systems with Machine-Vision Vehicle Detection Devices. VTRC 03-CR9. Virginia Transportation Research Council. Charlottesville, 2002.