Embed Size (px)
Citation preview
Final Contaminant Candidate List 3 Chemicals: Screening to a PCCL

Office of Water (4607M) EPA 815-R-09-007 August 2009 www.epa.gov/safewater
EPA-OGWDW Final CCL 3 Chemicals: EPA 815-R-09-007 Screening to a PCCL August 2009
Table of Contents
1.0 INTRODUCTION ........................................................................................................................ 1
2.0 HEALTH EFFECTS DATA ELEMENTS....................................................................................... 3
2.1 Dose-Response Data Elements ........................................................................................... 4
2.2 Categorical Data Elements .................................................................................................. 5
2.3 Calibration of the Data for Partitioning into Toxicity Categories....................................... 6
2.3.1 Dose-Response Data..................................................................................................... 6
2.3.2 Categorical Data ........................................................................................................... 9
2.4 Combining the Data Elements for Screening .................................................................... 12
3.0 OCCURRENCE DATA ELEMENTS ........................................................................................... 13
3.1 Finished Water Data .......................................................................................................... 13
3.2 Ambient Water Data ......................................................................................................... 15
3.3 Environmental Release Data ............................................................................................. 15
3.4 Production Data................................................................................................................. 16
3.5 Disinfection Byproducts (DBPs) and Drinking Water Treatment Chemicals .................. 16
3.6 Combining the Data Elements for Screening .................................................................... 16
4.0 CRITERIA FOR SELECTING A PCCL...................................................................................... 17
4.1 Finished and Ambient Water Concentration Data ............................................................ 17
4.2 Environmental Release Data ............................................................................................. 18
4.3 Production Data................................................................................................................. 19
4.4 DBPS and Drinking Water Additives ............................................................................... 20
5.0 EFFICACY OF THE FRAMEWORK AS A SCREENING TOOL..................................................... 20
6.0 REFERENCES .......................................................................................................................... 21
7.0 APPENDICES ....................................................................................................................... A1-1
Appendix 1. Criteria for Selecting the PCCL ...................................................................... A1-1
Appendix 2. Chemicals Passing Screening to the PCCL ..................................................... A2-1
Page i of v
EPA-OGWDW Final CCL 3 Chemicals: EPA 815-R-09-007 Screening to a PCCL August 2009
Table of Exhibits
Exhibit 1: Partition for Screening the Universe ............................................................................. 3
Exhibit 2: Potency Distributions for the Health Effects Test Set and Universe Chemicals .......... 7
Exhibit 3: Hodge Sterner Scale for Categorizing Chemicals Based on LD50 Values (Health Canada, 2005) ........................................................................................................ 8
Exhibit 4: Potency Measures for Universe Data Element Partitioned Based on Toxicity (mg/kg/day or mg/kg) ......................................................................................................... 9
Exhibit 5: Cancer Grouping and Description under the U.S. EPA 1986 Guidelines ..................... 9
Exhibit 6: IARC Cancer Groupings (ITER, 2006) ...................................................................... 10
Exhibit 7: Partitioning of Cancer Data Based on TD50 Values and Weight of Evidence ............ 11
Exhibit 8: Examples of Potency Data Elements for the Selected Chemical Drawn from the Universe ...................................................................................................................... 12
Exhibit 9: Number of Chemicals with Median Concentrations Distributed through the Screening Framework by Health Effects Category .......................................................... 14
Exhibit 10: Criteria for Screening Health Effects and Water Categories .................................... 18
Exhibit 11: Criteria for Screening Health Effects and Environmental Release Categories ......... 19
Exhibit 12: Criteria for Screening Health Effects and Production Categories ............................ 19
Page ii of v
EPA-OGWDW Final CCL 3 Chemicals: EPA 815-R-09-007 Screening to a PCCL August 2009
List of Acronyms and Abbreviations
< Less than
≤ Less than or equal to
> Greater than
≥ Greater than or equal to
µg/L Micrograms per liter
CASRN Chemical Abstract Services Registry Number
CCL Contaminant Candidate List
CCL 1 EPA’s first contaminant candidate list
CCL 3 EPA’s third Contaminant Candidate List
CE Clear evidence of carcinogenicity
CUS/IUR Chemical Update System/Inventory Update Rule
DBPs Disinfection By-Products
DBP-CAN Disinfection By-Product with Carcinogenicity Estimates
DSS-Tox Distributed Structure-Searchable Toxicity
DWEL Drinking water equivalent level
E Equivocal
EE Equivocal evidence of carcinogenicity
EPA United States Environmental Protection Agency
FDA United States Food and Drug Administration
FW/AW Finished Water/Ambient Water
H High probability of causing cancer
HM High moderate probability of causing cancer
IRIS Integrated Risk Information System (EPA)
kg Kilogram
L Liter
L Low probability of causing cancer
LD50 Lethal dose 50; an estimate of a single dose that is expected to cause the death of 50 percent of the exposed animals; it is derived from experimental data.
Page iii of v
EPA-OGWDW Final CCL 3 Chemicals: EPA 815-R-09-007 Screening to a PCCL August 2009
lbs Pounds
LM Low moderate probability of causing cancer
LOAEL Lowest observed adverse effect level
M Moderate probability of causing cancer
Mar Marginal probability of causing cancer
MCLG Maximum contaminant level goal
MRDD Maximum recommended daily dose
mg/kg Milligrams per kilogram body weight
mg/kg/day Milligrams per kilogram body weight per day
N Negative
NAWQA National Water Quality Assessment Program (USGS)
NCFAP National Center for Food and Agricultural Policy
NCI National Cancer Institute
NDWAC National Drinking Water Advisory Council
NE No evidence of carcinogenicity
NOAEL No observed adverse effect level
NPDWR National Primary Drinking Water Regulations
NREC National Reconnaissance of Emerging Contaminants
NTP National Toxicology Program
NTPMSR National Toxicology Program multi-species results
P Positive
PCCL Preliminary CCL
PPMP Pesticide Pilot Monitoring Program
RfD Reference dose
QSAR Quantitative Structure Activity Relationship
RfD-eq Reference Dose -equivalent
SE Some evidence of carcinogenicity
TD50 Tumorigenic dose 50; The dose-rate which if administered chronically for the standard life-span of the species will have a 50% probability of causing tumors at some point during that period.
Page iv of v
EPA-OGWDW Final CCL 3 Chemicals: Screening to a PCCL
EPA 815-R-09-007 August 2009
TRI Toxics Release Inventory
TS Test Set of chemicals
U Universe
USGS United States Geological Survey
yr Year
Page v of v
EPA-OGWDW Final CCL 3 Chemicals: EPA 815-R-09-007 Screening to a PCCL August 2009
1.0 Introduction Every five years the United States Environmental Protection Agency (EPA) is required to publish a list of contaminants (1) that are currently unregulated, (2) that are known or anticipated to occur in public water systems, and (3) which may require regulations under the Safe Drinking Water Act (SDWA). This list is known as the Contaminant Candidate List or CCL. SDWA section 1412(b)(1) requires that in the development of the CCL, EPA consider specific data sources and include the scientific community. EPA must evaluate substances identified in section 101(14) of the Comprehensive Environmental Response, Compensation, and Liability Act (CERCLA) of 1980 and substances registered as pesticides under the Federal Insecticide, Fungicide, and Rodenticide Act (FIFRA). SDWA also requires the Agency to consider the National Contaminant Occurrence Database established under section 1445(g) of SDWA. SDWA directs the Agency to consult with the scientific community, including the Science Advisory Board (SAB). In addition, it directs the Agency to consider the health effects and occurrence information for unregulated contaminants to identify those contaminants that present the greatest public health concern related to exposure from drinking water. EPA interprets the criterion that contaminants are known or anticipated to occur in public water systems broadly. In evaluating this criterion, EPA considers not only public water system monitoring data, but also data on concentrations in ambient surface and ground waters, releases to the environment (e.g., Toxics Release Inventory), and production. While such data may not establish conclusively that contaminants are known to occur in public water systems, EPA believes these data are sufficient to anticipate that contaminants may occur in public water systems and support their inclusion on the CCL. The Agency considered adverse health effects that may pose a greater risk to life stages and other sensitive groups which represent a meaningful portion of the population. Adverse health effects associated with infants, children, pregnant women, the elderly, and individuals with a history of serious illness were evaluated. In selecting contaminants for the CCL 3, each of the above requirements was met. SDWA section 1412(b)(1) also requires EPA to determine whether to regulate at least five contaminants from the CCL every five years. SDWA specifies that EPA shall regulate a contaminant if the Administrator determines that: The contaminant may have an adverse effect on the health of persons; The contaminant is known to occur, or there is a substantial likelihood that the
contaminant will occur in public water systems with a frequency and at levels of public health concern; and
In the sole judgment of the Administrator, regulation of such contaminant presents a meaningful opportunity for health risk reduction for persons served by public water systems.
Once contaminants have been placed on the CCL, EPA identifies if there are any additional data needs or if there are sufficient information to make a regulatory determination. EPA interprets these criteria for regulatory determination as more rigorous than what is used to place contaminants on the CCL.
Page 1 of 21
EPA-OGWDW Final CCL 3 Chemicals: EPA 815-R-09-007 Screening to a PCCL August 2009
EPA developed a multi-step process, based on available data, to characterize occurrence and adverse health risks a contaminant may pose to consumers of public water systems for inclusion on the Contaminant Candidate Lists (CCL). The steps involve:
1) Building a broad CCL Universe of potential drinking water contaminants for consideration (see “Final Contaminant Candidate List 3 Chemicals: Identifying the Universe” (USEPA, 2009a));
2) Using straightforward screening criteria related to a contaminant’s potential to occur in drinking water and potential for public health concern to narrow the Universe to a Preliminary CCL (PCCL), and;
3) Using a structured classification approach (e.g., a classification model) as a tool, along with expert judgment, to develop a proposed CCL from the PCCL (see “Final Contaminant Candidate List 3 Chemicals: Classification of the PCCL to the CCL” (USEPA, 2009b)).
4) Providing opportunities for public comment and contaminant nomination (see “Summary of Nominations for the Third Contaminant Candidate List” (USEPA, 2009c)).
This report focuses on the second step, in which EPA uses an approach to screen chemicals to a PCCL using the data available from a set of data sources that EPA evaluated for health effects and occurrence information to compile the CCL 3 Universe.
These data sources have yielded over 6,000 chemicals which populate the CCL 3 Chemical Universe. Along with the names and identifying characteristics of these chemicals the Universe is the repository for the health-related and occurrence-related information. This information was used to screen individual contaminants to determine if they should advance from the Universe to the PCCL. In the case of health effects, the Universe includes both quantitative and qualitative information on the hazard and/or dose-response properties of the contaminants. For occurrence, the Universe includes both quantitative and qualitative information on occurrence in water, releases to the environment, and amount produced. The process for the selection of data sources and Universe chemicals is detailed in the document entitled, “Contaminant Candidate List 3 Chemicals: Identifying the Universe” (USEPA, 2009a).
EPA based the screening approach, in part, on the National Drinking Water Advisory Council (NDWAC) recommendation that screening the Universe of chemicals for selection of the PCCL should be based on widely available data elements that represent important health effects and occurrence properties (NDWAC, 2004). NDWAC also recommended that the screening be versatile, yet as simple as possible, and facilitate the identification of those contaminants most in need of further consideration through the PCCL to CCL process. EPA considered this an important goal when establishing the screening criteria.
The basic framework developed by EPA for use in screening is shown in Exhibit 1. Applying this framework to the CCL 3 Universe groups contaminants categorized by their toxicity along the vertical axis and by their occurrence on the horizontal axis. It arrays the data in a way that will allow for a separation of chemicals into those that move to the PCCL based on their toxicity and occurrence properties (e.g., upper right in Exhibit 1) and those that are not further evaluated
Page 2 of 21
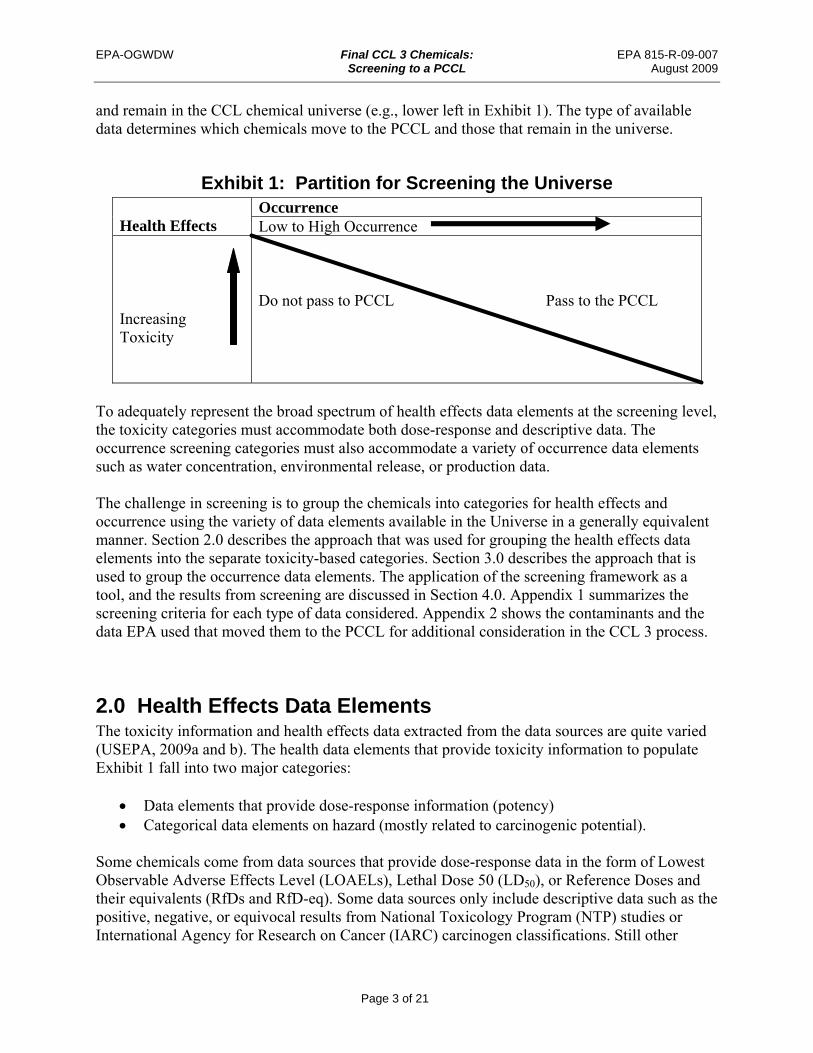
Exhibit 1: Partition for Screening the Universe
Health Effects Occurrence Low to High Occurrence
Increasing Toxicity
Do not pass to PCCL Pass to the PCCL
EPA-OGWDW Final CCL 3 Chemicals: EPA 815-R-09-007 Screening to a PCCL August 2009
and remain in the CCL chemical universe (e.g., lower left in Exhibit 1). The type of available data determines which chemicals move to the PCCL and those that remain in the universe.
To adequately represent the broad spectrum of health effects data elements at the screening level, the toxicity categories must accommodate both dose-response and descriptive data. The occurrence screening categories must also accommodate a variety of occurrence data elements such as water concentration, environmental release, or production data. The challenge in screening is to group the chemicals into categories for health effects and occurrence using the variety of data elements available in the Universe in a generally equivalent manner. Section 2.0 describes the approach that was used for grouping the health effects data elements into the separate toxicity-based categories. Section 3.0 describes the approach that is used to group the occurrence data elements. The application of the screening framework as a tool, and the results from screening are discussed in Section 4.0. Appendix 1 summarizes the screening criteria for each type of data considered. Appendix 2 shows the contaminants and the data EPA used that moved them to the PCCL for additional consideration in the CCL 3 process.
2.0 Health Effects Data Elements The toxicity information and health effects data extracted from the data sources are quite varied (USEPA, 2009a and b). The health data elements that provide toxicity information to populate Exhibit 1 fall into two major categories: Data elements that provide dose-response information (potency) Categorical data elements on hazard (mostly related to carcinogenic potential).
Some chemicals come from data sources that provide dose-response data in the form of Lowest Observable Adverse Effects Level (LOAELs), Lethal Dose 50 (LD50), or Reference Doses and their equivalents (RfDs and RfD-eq). Some data sources only include descriptive data such as the positive, negative, or equivocal results from National Toxicology Program (NTP) studies or International Agency for Research on Cancer (IARC) carcinogen classifications. Still other
Page 3 of 21
EPA-OGWDW Final CCL 3 Chemicals: EPA 815-R-09-007 Screening to a PCCL August 2009
chemicals are in the Universe by virtue of their being on a list, such as the State of California list of reproductive or developmental toxicants (“Proposition 65”) which does not have any accompanying toxicological data. For this reason, it is important that the screening process for deriving the PCCL be able to accommodate a variety of health effects data inputs. After examining the breadth of available health effects data, EPA established five categories for screening. The five categories are as follows: Toxicity Category 1 Toxicity Category 2 Toxicity Category 3 (the central tendency grouping) Toxicity Category 4 Toxicity Category 5
The toxicity of the grouping decreases as the number for the grouping increases, with Toxicity Category 1 being the most toxic grouping and Toxicity Category 5 the least toxic grouping. Within each Toxicity Category, the partitioning criteria vary depending on the data element used. The partitioning criteria that place a LOAEL in Toxicity Category 1 differ from the criteria used for LD50 values that place it in the same category. Both criteria are intended to identify contaminants of approximately equivalent toxicity. The following sections provide information on the data elements available in the Universe that reflect the dose-response properties and categorical or descriptive information for the chemicals in the Universe.
2.1 Dose-Response Data Elements The NDWAC recommended that screening be based on data elements that demonstrate toxic effects (i.e., LOAELs, LD50s, Cancer Slope Factors, etc.) rather than on data elements that are based on no effects (i.e., No observed adverse effect level (NOAELs) or that include uncertainty factors in their derivation (i.e., RfD-eq). However, because of the limitations on the types of data available for many of the contaminants, it is not possible to be this restrictive. Of the chemicals in the universe, about 500 had LOAEL data and about 2,000 had LD50 data. The remainder were lacking the endpoints recommended by the NDWAC, so EPA used other data elements that provide quantitative information on dose-response that can be partitioned into the five toxicity groupings. Major endpoints that fall in this category, in addition to LOAELs and LD50s, are as follows:
RfDs and RfD-equivalents: RfDs, Minimal Risk Levels from the Agency for Toxic Substance and Disease Registry, Tolerable Daily Intakes from the World Health Organization (WHO), Acceptable Daily Intakes from WHO and the Food and Drug Administration (FDA), Public Health Goals from California EPA, and Tolerable Upper Intake Levels from the Institute of Medicine.
NOAELs - No Observed Adverse Effect Levels.
Page 4 of 21
EPA-OGWDW Final CCL 3 Chemicals: EPA 815-R-09-007 Screening to a PCCL August 2009
50
species will have a 50% probability of causing tumors throughout that period. Chemicals with TD50 data have positive cancer results in at least one study.
Maximum Recommended Daily Dose (MRDD) - Recommendations for the maximum adult daily therapeutic doses for pharmaceuticals (FDA).
Including the measures of toxic potency listed above in the health effects screening framework expands the number of chemicals from the Universe that can be screened on the basis of their dose-response for possible inclusion in the PCCL. The approach used to partition each of these toxicity measures for screening is described in Section 2.3.
2.2 Categorical Data Elements There are three groups of categorical data elements and health effects information in the Universe. These groups categorize chemicals according to their carcinogenic potential, mutagenicity information, or classification as a developmental or reproductive toxicant. Categorical data sets in the Universe include the following:
U.S. EPA Cancer Groupings
IARC Cancer Groupings
NTP weight-of-evidence findings from cancer bioassays
National Cancer Institute (NCI) weight-of-evidence findings from cancer bioassays
California EPA list of chemicals suspected of causing cancer
EPA Water Disinfection By-Products with Carcinogenicity Estimates (DBP-CAN) groupings based on carcinogenic potential derived from Quantitative Structure Activity Relationship (QSAR) projections and expert judgment
California list of chemicals suspected of being developmental or reproductive toxicants
U.S. EPA groupings of disinfection by-products (DBPs) based on QSAR predictions of their ability to cause developmental or reproductive toxicity.
Even with the expansion of the types of dose-response data suitable for screening described in Section 2.1, many chemicals in the Universe lack dose-response data elements making it important to use the categorical information at this screening stage. The categorical cancer information is amenable to the screening approach illustrated in Exhibit 1 because, in most cases, it includes subcategories related to the strength of the cancer data and its applicability to humans. The second group of categorical data elements provides information on genotoxicity and mutagenicity. This group is considered categorical because results are classified as positive, negative, or equivocal. However, it is common to have multiple genotoxicity assays for any given chemical, and it is unusual for all assays of a given chemical to have the same result.
TD s - The dose-rate which if administered chronically for the standard life-span of the
Page 5 of 21
EPA-OGWDW Final CCL 3 Chemicals: EPA 815-R-09-007 Screening to a PCCL August 2009
Accordingly, there is a need to integrate all of the genotoxicity results and determine a categorical weight-of-evidence if the data are to be useful for screening. However, the Universe contained few weight-of-evidence findings on genotoxicity, and, when such results are available, they are usually tied to cancer assessments with dose-response measures. Accordingly, the use of the categorical cancer information along with TD50 dose-response data reduces the importance of including genotoxicity as a screening criterion. The genotoxicity data remain available as a supplemental health effects element that can be applied in the evaluation of the PCCL and in making decisions for chemicals that fall close to the screening barrier that separates the chemicals that will move to the PCCL from those that will remain in the Universe.
The third type of categorical information in the database comes from the State of California’s list of reproductive and developmental toxicants or other similar lists. These lists are groupings that are based on a single toxicological property, but not partitioned by the degree of hazard. In this respect the lists are different from the cancer information that includes subdivisions based on the hazard weight-of-evidence and supported by quantitative cancer slope factors and/or TD50 values. For this reason, the California list of developmental and reproductive toxicants and the California list of carcinogens are not used for the screening framework but they are retained as supplemental information that may be useful in the evaluation of the initial PCCL screening results.
2.3 Calibration of the Data for Partitioning into Toxicity Categories
2.3.1 Dose-Response Data As mentioned in the previous section, the health effects information found in the Universe is diverse. Accordingly, the challenge in screening is to be able to partition each type of data element into the five toxicity-based categories in a reproducible and logical manner. The main data elements proposed for screening (RfD-eq, NOAEL, and LOAEL values) have been used by EPA in establishing Maximum Contaminant Level Goals (MCLGs) or Lifetime Health Advisories. Accordingly, it was possible to compile a set of test chemicals (TS) found in drinking water that had multiple data elements from the set of toxicity data (i.e., RfD-eq, NOAEL, LOAEL, LD50) and examine the range and distribution of values associated with each dose-response data element. Distributions were also determined for the other measures of dose-response found in the Universe (U) at the time the screening process was developed (i.e., LOAELs, LD50s, MRDDs, TD50s). Each measure of toxicity covered a range of close to ten orders of magnitude and had a roughly normal distribution when arrayed according to their log10 value rounded to a single significant figure (Exhibit 2). Each data set is skewed toward higher potency chemicals due to the difficulty in identifying conventional toxicity data for many chemicals that are slightly or practically nontoxic. The RfDs and NOAELs in the Universe were not initially compiled.
Page 6 of 21
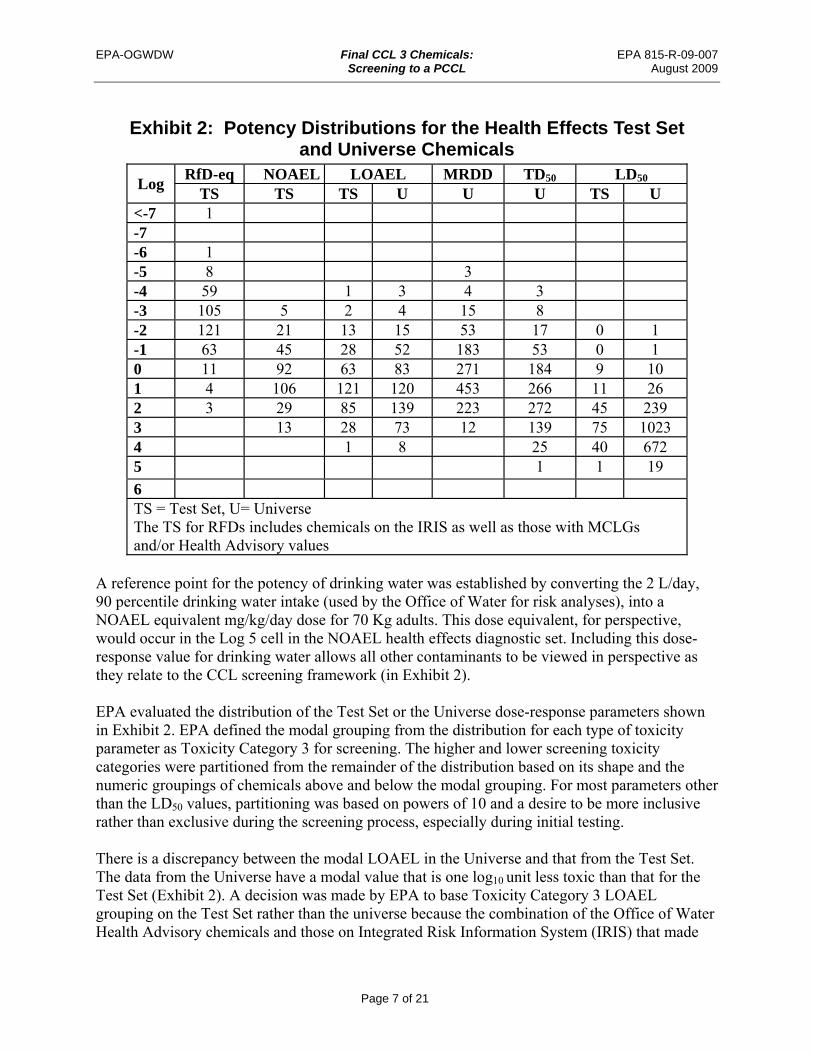
Exhibit 2: Potency Distributions for the Health Effects Test Set and Universe Chemicals
Log RfD-eq NOAEL LOAEL MRDD TD50 LD50
TS TS TS U U U TS U <-7 1 -7 -6 1 -5 8 3 -4 59 1 3 4 3 -3 105 5 2 4 15 8 -2 121 21 13 15 53 17 0 1 -1 63 45 28 52 183 53 0 1 0 11 92 63 83 271 184 9 10 1 4 106 121 120 453 266 11 26 2 3 29 85 139 223 272 45 239 3 13 28 73 12 139 75 1023 4 1 8 25 40 672 5 1 1 19
6 TS = Test Set, U= Universe The TS for RFDs includes chemicals on the IRIS as well as those with MCLGs and/or Health Advisory values
EPA-OGWDW Final CCL 3 Chemicals: EPA 815-R-09-007 Screening to a PCCL August 2009
A reference point for the potency of drinking water was established by converting the 2 L/day, 90 percentile drinking water intake (used by the Office of Water for risk analyses), into a NOAEL equivalent mg/kg/day dose for 70 Kg adults. This dose equivalent, for perspective, would occur in the Log 5 cell in the NOAEL health effects diagnostic set. Including this dose-response value for drinking water allows all other contaminants to be viewed in perspective as they relate to the CCL screening framework (in Exhibit 2).
EPA evaluated the distribution of the Test Set or the Universe dose-response parameters shown in Exhibit 2. EPA defined the modal grouping from the distribution for each type of toxicity parameter as Toxicity Category 3 for screening. The higher and lower screening toxicity categories were partitioned from the remainder of the distribution based on its shape and the numeric groupings of chemicals above and below the modal grouping. For most parameters other than the LD50 values, partitioning was based on powers of 10 and a desire to be more inclusive rather than exclusive during the screening process, especially during initial testing.
There is a discrepancy between the modal LOAEL in the Universe and that from the Test Set. The data from the Universe have a modal value that is one log10 unit less toxic than that for the Test Set (Exhibit 2). A decision was made by EPA to base Toxicity Category 3 LOAEL grouping on the Test Set rather than the universe because the combination of the Office of Water Health Advisory chemicals and those on Integrated Risk Information System (IRIS) that made
Page 7 of 21
EPA-OGWDW Final CCL 3 Chemicals: EPA 815-R-09-007 Screening to a PCCL August 2009
up that set is more representative of chemicals that EPA had found to be of environmental and/or regulatory concern than the Universe compilation.
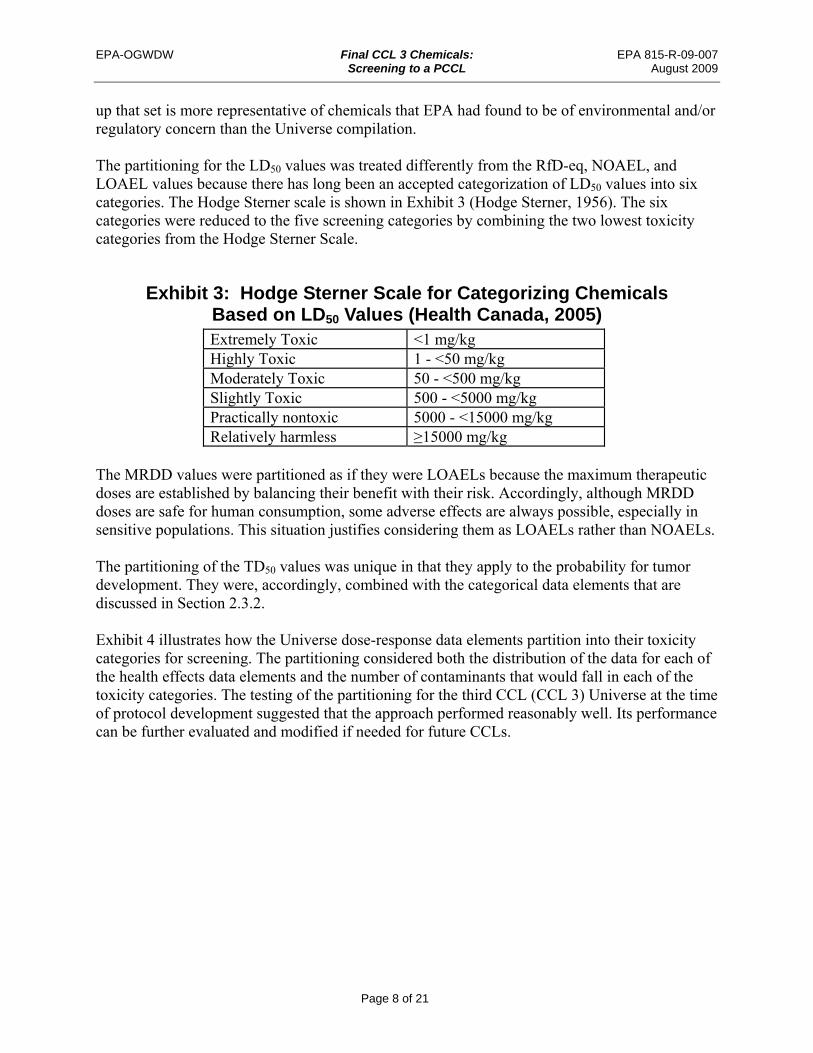
The partitioning for the LD50 values was treated differently from the RfD-eq, NOAEL, and LOAEL values because there has long been an accepted categorization of LD50 values into six categories. The Hodge Sterner scale is shown in Exhibit 3 (Hodge Sterner, 1956). The six categories were reduced to the five screening categories by combining the two lowest toxicity categories from the Hodge Sterner Scale.
Exhibit 3: Hodge Sterner Scale for Categorizing Chemicals Based on LD50 Values (Health Canada, 2005) Extremely Toxic <1 mg/kg Highly Toxic 1 - <50 mg/kg Moderately Toxic 50 - <500 mg/kg Slightly Toxic 500 - <5000 mg/kg Practically nontoxic 5000 - <15000 mg/kg Relatively harmless ≥15000 mg/kg
The MRDD values were partitioned as if they were LOAELs because the maximum therapeutic doses are established by balancing their benefit with their risk. Accordingly, although MRDD doses are safe for human consumption, some adverse effects are always possible, especially in sensitive populations. This situation justifies considering them as LOAELs rather than NOAELs.
The partitioning of the TD50 values was unique in that they apply to the probability for tumor development. They were, accordingly, combined with the categorical data elements that are discussed in Section 2.3.2.
Exhibit 4 illustrates how the Universe dose-response data elements partition into their toxicity categories for screening. The partitioning considered both the distribution of the data for each of the health effects data elements and the number of contaminants that would fall in each of the toxicity categories. The testing of the partitioning for the third CCL (CCL 3) Universe at the time of protocol development suggested that the approach performed reasonably well. Its performance can be further evaluated and modified if needed for future CCLs.
Page 8 of 21
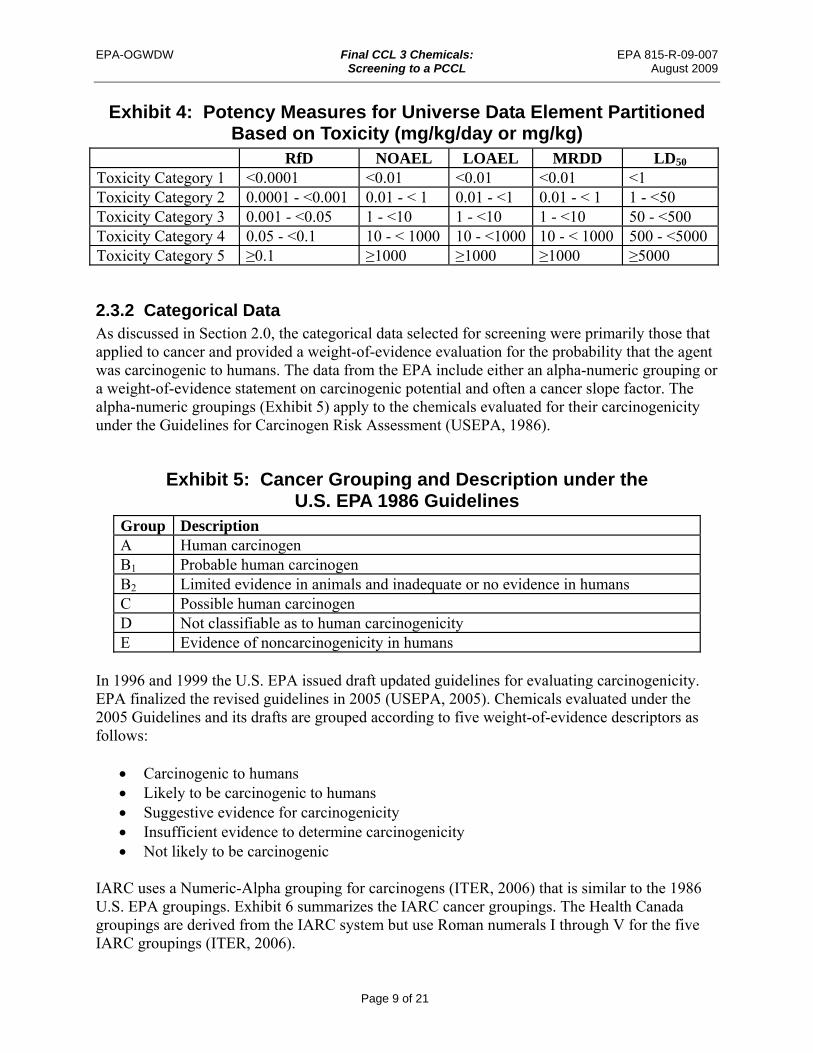
Exhibit 4: Potency Measures for Universe Data Element Partitioned Based on Toxicity (mg/kg/day or mg/kg)
RfD NOAEL LOAEL MRDD LD50
Toxicity Category 1 <0.0001 <0.01 <0.01 <0.01 <1 Toxicity Category 2 0.0001 - <0.001 0.01 - < 1 0.01 - <1 0.01 - < 1 1 - <50 Toxicity Category 3 0.001 - <0.05 1 - <10 1 - <10 1 - <10 50 - <500 Toxicity Category 4 0.05 - <0.1 10 - < 1000 10 - <1000 10 - < 1000 500 - <5000 Toxicity Category 5 ≥0.1 ≥1000 ≥1000 ≥1000 ≥5000
Exhibit 5: Cancer Grouping and Description under the U.S. EPA 1986 Guidelines
Group Description A Human carcinogen B1 Probable human carcinogen B2 Limited evidence in animals and inadequate or no evidence in humans C Possible human carcinogen D Not classifiable as to human carcinogenicity E Evidence of noncarcinogenicity in humans
EPA-OGWDW Final CCL 3 Chemicals: EPA 815-R-09-007 Screening to a PCCL August 2009
2.3.2 Categorical Data As discussed in Section 2.0, the categorical data selected for screening were primarily those that applied to cancer and provided a weight-of-evidence evaluation for the probability that the agent was carcinogenic to humans. The data from the EPA include either an alpha-numeric grouping or a weight-of-evidence statement on carcinogenic potential and often a cancer slope factor. The alpha-numeric groupings (Exhibit 5) apply to the chemicals evaluated for their carcinogenicity under the Guidelines for Carcinogen Risk Assessment (USEPA, 1986).
In 1996 and 1999 the U.S. EPA issued draft updated guidelines for evaluating carcinogenicity. EPA finalized the revised guidelines in 2005 (USEPA, 2005). Chemicals evaluated under the 2005 Guidelines and its drafts are grouped according to five weight-of-evidence descriptors as follows: Carcinogenic to humans Likely to be carcinogenic to humans Suggestive evidence for carcinogenicity Insufficient evidence to determine carcinogenicity Not likely to be carcinogenic
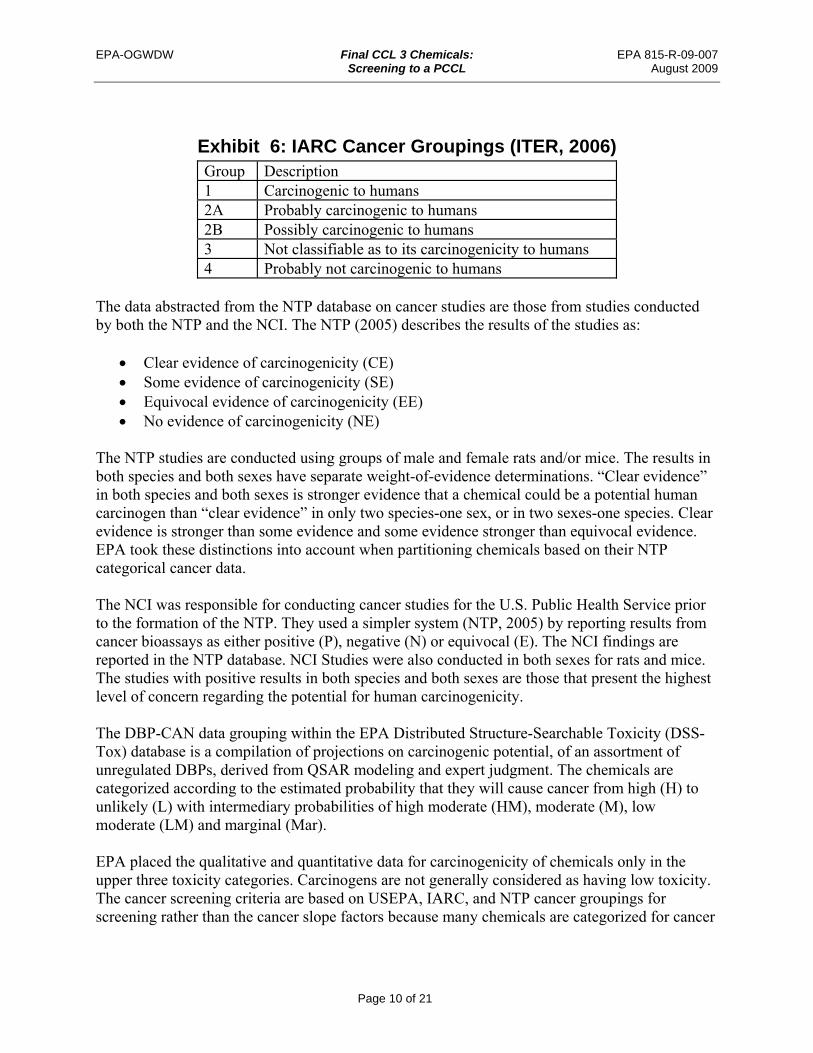
IARC uses a Numeric-Alpha grouping for carcinogens (ITER, 2006) that is similar to the 1986 U.S. EPA groupings. Exhibit 6 summarizes the IARC cancer groupings. The Health Canada groupings are derived from the IARC system but use Roman numerals I through V for the five IARC groupings (ITER, 2006).
Page 9 of 21
EPA-OGWDW Final CCL 3 Chemicals: EPA 815-R-09-007 Screening to a PCCL August 2009
Exhibit 6: IARC Cancer Groupings (ITER, 2006) Group Description 1 Carcinogenic to humans 2A Probably carcinogenic to humans 2B Possibly carcinogenic to humans 3 Not classifiable as to its carcinogenicity to humans 4 Probably not carcinogenic to humans
The data abstracted from the NTP database on cancer studies are those from studies conducted by both the NTP and the NCI. The NTP (2005) describes the results of the studies as:
Clear evidence of carcinogenicity (CE) Some evidence of carcinogenicity (SE) Equivocal evidence of carcinogenicity (EE) No evidence of carcinogenicity (NE)
The NTP studies are conducted using groups of male and female rats and/or mice. The results in both species and both sexes have separate weight-of-evidence determinations. “Clear evidence” in both species and both sexes is stronger evidence that a chemical could be a potential human carcinogen than “clear evidence” in only two species-one sex, or in two sexes-one species. Clear evidence is stronger than some evidence and some evidence stronger than equivocal evidence. EPA took these distinctions into account when partitioning chemicals based on their NTP categorical cancer data.
The NCI was responsible for conducting cancer studies for the U.S. Public Health Service prior to the formation of the NTP. They used a simpler system (NTP, 2005) by reporting results from cancer bioassays as either positive (P), negative (N) or equivocal (E). The NCI findings are reported in the NTP database. NCI Studies were also conducted in both sexes for rats and mice. The studies with positive results in both species and both sexes are those that present the highest level of concern regarding the potential for human carcinogenicity.
The DBP-CAN data grouping within the EPA Distributed Structure-Searchable Toxicity (DSS-Tox) database is a compilation of projections on carcinogenic potential, of an assortment of unregulated DBPs, derived from QSAR modeling and expert judgment. The chemicals are categorized according to the estimated probability that they will cause cancer from high (H) to unlikely (L) with intermediary probabilities of high moderate (HM), moderate (M), low moderate (LM) and marginal (Mar).
EPA placed the qualitative and quantitative data for carcinogenicity of chemicals only in the upper three toxicity categories. Carcinogens are not generally considered as having low toxicity. The cancer screening criteria are based on USEPA, IARC, and NTP cancer groupings for screening rather than the cancer slope factors because many chemicals are categorized for cancer
Page 10 of 21
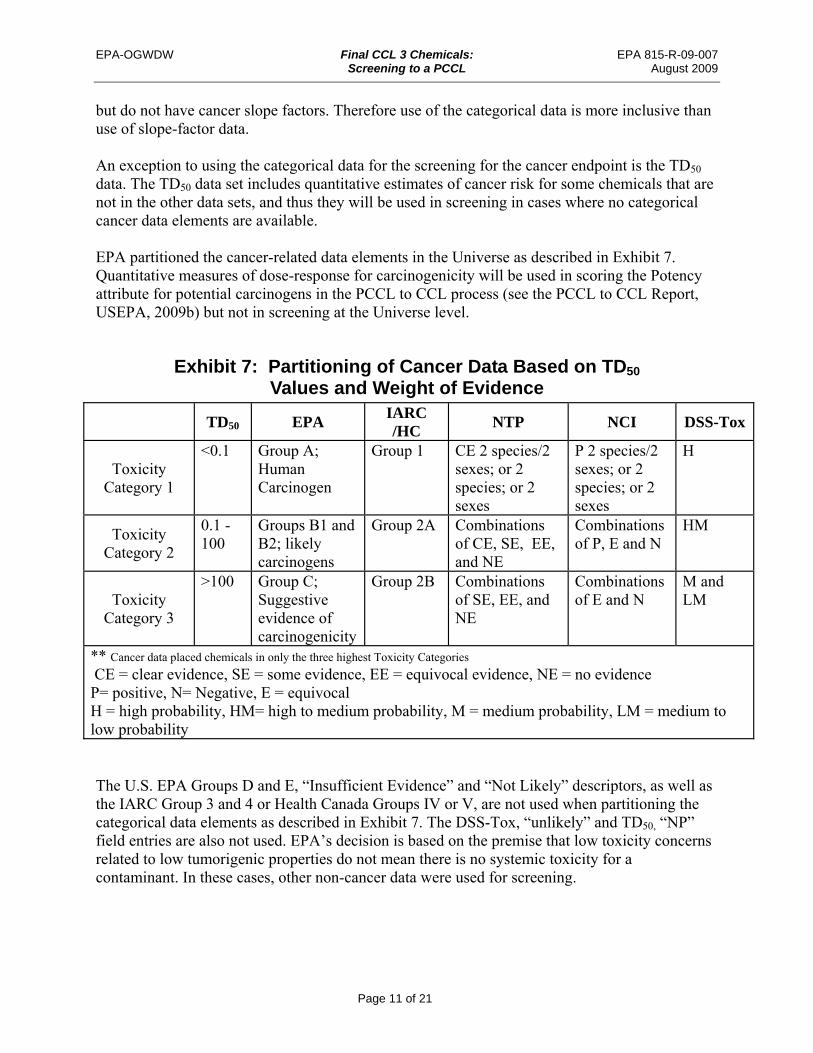
Exhibit 7: Partitioning of Cancer Data Based on TD50
Values and Weight of Evidence
TD50 EPA IARC /HC
NTP NCI DSS-Tox
Toxicity Category 1
<0.1 Group A; Human Carcinogen
Group 1 CE 2 species/2 sexes; or 2 species; or 2 sexes
P 2 species/2 sexes; or 2 species; or 2 sexes
H
Toxicity Category 2
0.1 -100
Groups B1 and B2; likely carcinogens
Group 2A Combinations of CE, SE, EE, and NE
Combinations of P, E and N
HM
Toxicity Category 3
>100 Group C; Suggestive evidence of carcinogenicity
Group 2B Combinations of SE, EE, and NE
Combinations of E and N
M and LM
** Cancer data placed chemicals in only the three highest Toxicity Categories
CE = clear evidence, SE = some evidence, EE = equivocal evidence, NE = no evidence P= positive, N= Negative, E = equivocal H = high probability, HM= high to medium probability, M = medium probability, LM = medium to low probability
EPA-OGWDW Final CCL 3 Chemicals: EPA 815-R-09-007 Screening to a PCCL August 2009
but do not have cancer slope factors. Therefore use of the categorical data is more inclusive than use of slope-factor data.
An exception to using the categorical data for the screening for the cancer endpoint is the TD50
data. The TD50 data set includes quantitative estimates of cancer risk for some chemicals that are not in the other data sets, and thus they will be used in screening in cases where no categorical cancer data elements are available.
EPA partitioned the cancer-related data elements in the Universe as described in Exhibit 7. Quantitative measures of dose-response for carcinogenicity will be used in scoring the Potency attribute for potential carcinogens in the PCCL to CCL process (see the PCCL to CCL Report, USEPA, 2009b) but not in screening at the Universe level.
The U.S. EPA Groups D and E, “Insufficient Evidence” and “Not Likely” descriptors, as well as the IARC Group 3 and 4 or Health Canada Groups IV or V, are not used when partitioning the categorical data elements as described in Exhibit 7. The DSS-Tox, “unlikely” and TD50, “NP” field entries are also not used. EPA’s decision is based on the premise that low toxicity concerns related to low tumorigenic properties do not mean there is no systemic toxicity for a contaminant. In these cases, other non-cancer data were used for screening.
Page 11 of 21
EPA-OGWDW Final CCL 3 Chemicals: EPA 815-R-09-007 Screening to a PCCL August 2009
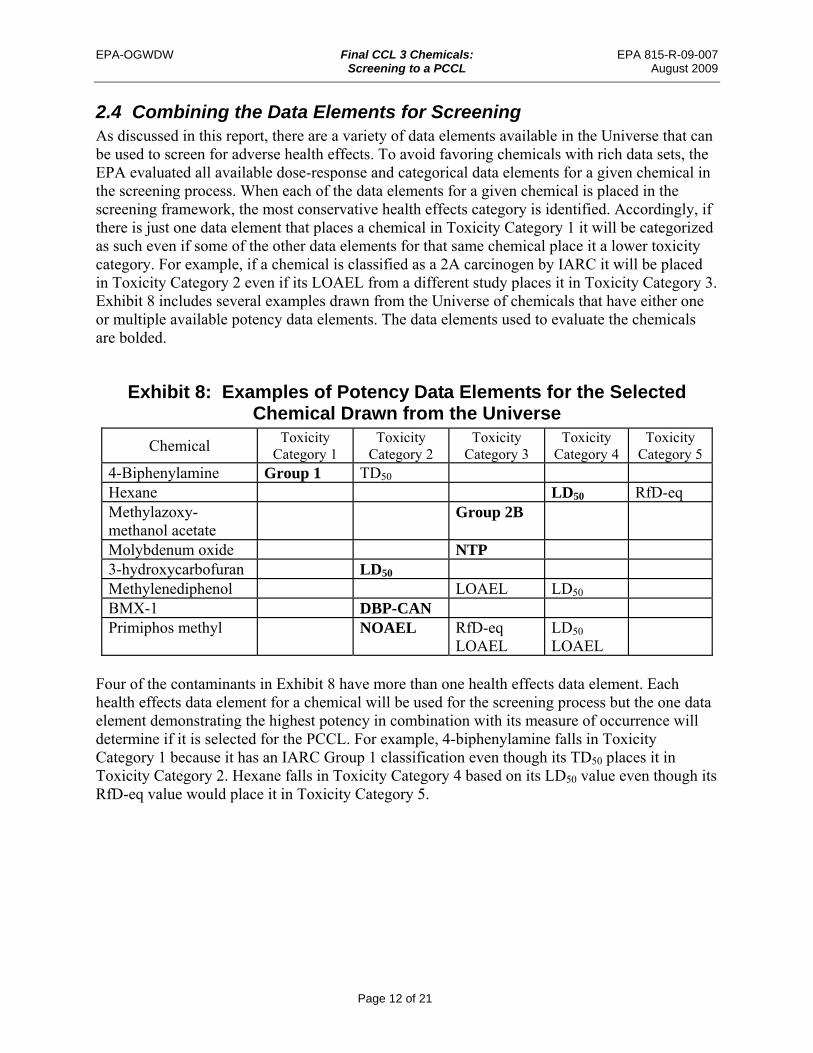
2.4 Combining the Data Elements for Screening As discussed in this report, there are a variety of data elements available in the Universe that can be used to screen for adverse health effects. To avoid favoring chemicals with rich data sets, the EPA evaluated all available dose-response and categorical data elements for a given chemical in the screening process. When each of the data elements for a given chemical is placed in the screening framework, the most conservative health effects category is identified. Accordingly, if there is just one data element that places a chemical in Toxicity Category 1 it will be categorized as such even if some of the other data elements for that same chemical place it a lower toxicity category. For example, if a chemical is classified as a 2A carcinogen by IARC it will be placed in Toxicity Category 2 even if its LOAEL from a different study places it in Toxicity Category 3. Exhibit 8 includes several examples drawn from the Universe of chemicals that have either one or multiple available potency data elements. The data elements used to evaluate the chemicals are bolded.
Exhibit 8: Examples of Potency Data Elements for the Selected Chemical Drawn from the Universe
Chemical Toxicity
Category 1 Toxicity
Category 2 Toxicity
Category 3 Toxicity Category 4
Toxicity Category 5
4-Biphenylamine Group 1 TD50 Hexane LD50 RfD-eq Methylazoxymethanol acetate
Group 2B
Molybdenum oxide NTP 3-hydroxycarbofuran LD50 Methylenediphenol LOAEL LD50
BMX-1 DBP-CAN Primiphos methyl NOAEL RfD-eq
LOAEL LD50
LOAEL
Four of the contaminants in Exhibit 8 have more than one health effects data element. Each health effects data element for a chemical will be used for the screening process but the one data element demonstrating the highest potency in combination with its measure of occurrence will determine if it is selected for the PCCL. For example, 4-biphenylamine falls in Toxicity Category 1 because it has an IARC Group 1 classification even though its TD50 places it in Toxicity Category 2. Hexane falls in Toxicity Category 4 based on its LD50 value even though its RfD-eq value would place it in Toxicity Category 5.
Page 12 of 21
EPA-OGWDW Final CCL 3 Chemicals: EPA 815-R-09-007 Screening to a PCCL August 2009
3.0 Occurrence Data Elements EPA found that data elements representing a chemical’s potential to occur in drinking water vary greatly in terms of the occurrence factor they represent. The goal was to determine which data elements best represented the potential to occur in drinking water. EPA considered and evaluated data elements in the following categories: Finished Water – measures concentration and frequency of detections Ambient Water – measures concentration and frequency of detections Total Releases in the Environment – measures pounds per year and number of states Pesticide Application Rates – measures pounds per year and number of states Production volume – measures pounds per year
In addition to evaluating quantitative data elements, EPA also analyzed chemicals with descriptive data based upon their likelihood of occurring in drinking water. Examples of these types of chemicals include disinfection byproducts and drinking water treatment additives. The following sections describe the occurrence categories and how EPA utilized them in the development of the screening criteria. To analyze the occurrence data and develop the screening criteria, EPA assembled a diagnostic test set of approximately 200 chemicals. Some of these chemicals were selected from past CCLs and National Primary Drinking Water Regulations (NPDWRs), and some were randomly pulled from the Universe of contaminants considered for the draft CCL 3. Most of them had data on concentrations in water, environmental release and production, and as such constituted a relatively complete set of occurrence data elements.
3.1 Finished Water Data Using the Universe as a starting point, EPA considered data elements that are readily available for chemicals in finished water. The finished water data elements are from the National Contaminant Occurrence Database (unregulated contaminant monitoring) Rounds 1 and 2, the National Inorganic Radionuclides Survey, the Unregulated Contaminant Monitoring Regulation monitoring, the Information Collection Rule database for DBPs, U.S. Department of Agriculture Pesticide Data Program (PDP), and Pesticides Pilot Monitoring Program (PPMP) (USGS and USEPA). The finished water data elements evaluated include: percent of samples with detections, percent of public water systems with detections, median concentration of detections, mean concentration of detections, and maximum concentration of detections.
The median, mean, and maximum concentration values are based on analytical detections only. Non-detections were not included in these concentration measure calculations. In both the data
Page 13 of 21
EPA-OGWDW Final CCL 3 Chemicals: EPA 815-R-09-007 Screening to a PCCL August 2009
sets for finished and ambient water (Section 3.2), some chemicals had no detections at any of the sites surveyed. Some data sets included mean, median, and maximum values whereas others included only one or two of the data elements.
For screening purposes, EPA determined that the concentration data were the most appropriate data elements because they have a more direct relationship with dose-response than the detection frequency. The concentration data ranged from <0.1 g/L to >10,000 g/L. The range was subdivided using powers of ten. Some chemicals had finished water data available from multiple sources; in those cases, the highest value was used for the purposes of screening.
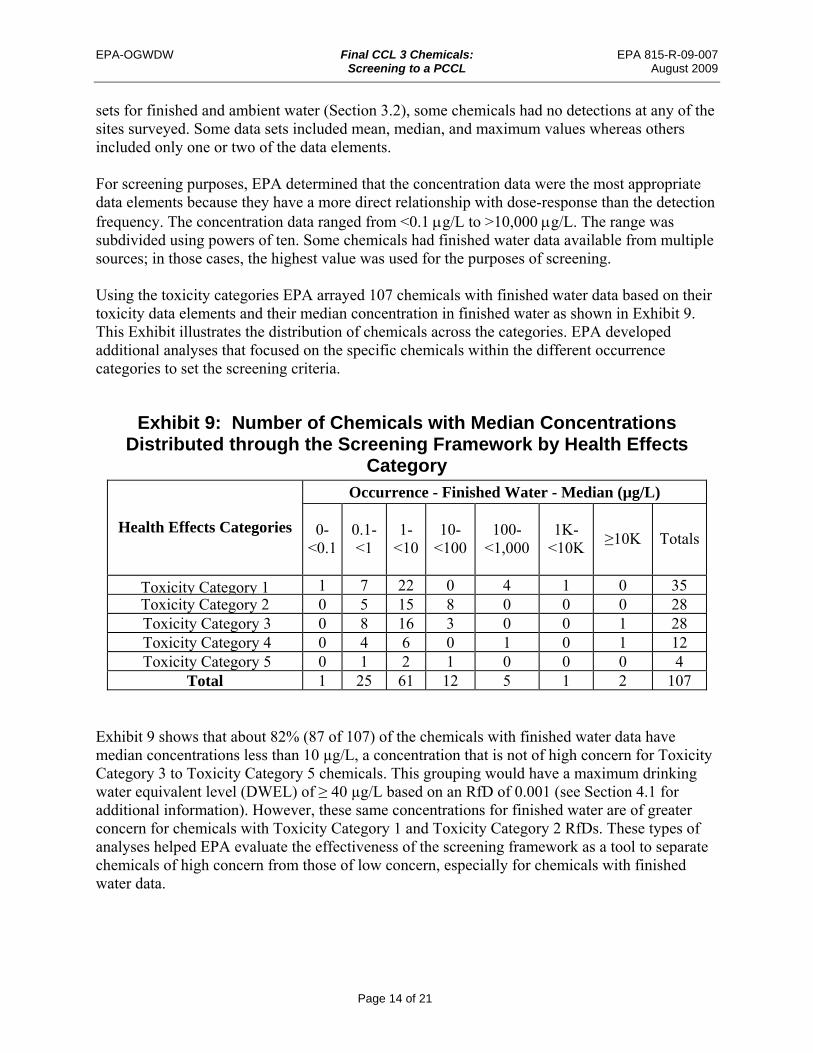
Using the toxicity categories EPA arrayed 107 chemicals with finished water data based on their toxicity data elements and their median concentration in finished water as shown in Exhibit 9. This Exhibit illustrates the distribution of chemicals across the categories. EPA developed additional analyses that focused on the specific chemicals within the different occurrence categories to set the screening criteria.
Exhibit 9: Number of Chemicals with Median Concentrations Distributed through the Screening Framework by Health Effects
Category
Health Effects Categories
Occurrence - Finished Water - Median (µg/L)
0<0.1
0.1<1
1<10
10<100
100<1,000
1K<10K
≥10K Totals
Toxicity Category 1 1 7 22 0 4 1 0 35 Toxicity Category 2 0 5 15 8 0 0 0 28 Toxicity Category 3 0 8 16 3 0 0 1 28 Toxicity Category 4 0 4 6 0 1 0 1 12 Toxicity Category 5 0 1 2 1 0 0 0 4
Total 1 25 61 12 5 1 2 107
Exhibit 9 shows that about 82% (87 of 107) of the chemicals with finished water data have median concentrations less than 10 µg/L, a concentration that is not of high concern for Toxicity Category 3 to Toxicity Category 5 chemicals. This grouping would have a maximum drinking water equivalent level (DWEL) of ≥ 40 µg/L based on an RfD of 0.001 (see Section 4.1 for additional information). However, these same concentrations for finished water are of greater concern for chemicals with Toxicity Category 1 and Toxicity Category 2 RfDs. These types of analyses helped EPA evaluate the effectiveness of the screening framework as a tool to separate chemicals of high concern from those of low concern, especially for chemicals with finished water data.
Page 14 of 21
EPA-OGWDW Final CCL 3 Chemicals: EPA 815-R-09-007 Screening to a PCCL August 2009
3.2 Ambient Water Data EPA obtained data on ambient water values from the United States Geological Survey (USGS) National Water Quality Assessment Program (NAWQA), the USGS National Reconnaissance of Emerging Contaminants (NREC), and the PPMP. The NAWQA data include all the nationwide data from Cycle 1 of NAWQA, which encompasses data collected from 1992 to 2001. The NRECs database includes occurrence data collected by the USGS Toxic Substances Hydrology Program from 1999 to 2001 in samples from 142 streams, 55 wells, and seven effluent samples from 36 states. The PPMP data includes pesticide concentrations in water, and the sampling methods include 178 different pesticides and degradation products. The ambient water data elements analyzed include: percent of samples with detections, percent of sites with detections, median concentration of detections, mean concentration of detections, and maximum concentration of detections.
As was the case for finished water, the median, mean, and maximum values are based on analytical detections only. Non-detections were not included in the concentration datasets. The subdivisions for the data were developed by first determining the range of available ambient water concentration data, and then partitioning the range by powers of ten. In this case, the concentration data ranged from <0.01 g/L (for all concentration data) to >10,000 g/L. One of the data sources, NREC, did not contain mean or maximum concentration data, so it was only represented in the percent of samples, percent of sites, and median concentrations. EPA developed matrices similar to Exhibit 9 for all of the ambient water data elements using the set of 200 diagnostic chemicals.
3.3 Environmental Release Data The environmental release data are those reported for 2002 from the Toxics Release Inventory (TRI) and the National Pesticide Use Database, as created by the National Center for Food and Agricultural Policy (NCFAP). The most recent version of the NCFAP database was released in 2000, and reflects pesticide use in 1997. The environmental release data elements considered include:
total releases to the environment (lbs/yr) number of states with total releases pesticide application (lbs/yr) number of states with pesticide application
As was the case for the finished and ambient water data, EPA chose to use the data on the pounds per year released to the environment for screening rather than the number of states with releases. The subdivisions used for release data were developed by first determining the range of
Page 15 of 21
EPA-OGWDW Final CCL 3 Chemicals: EPA 815-R-09-007 Screening to a PCCL August 2009
release values represented by the data, and then partitioning the range based on powers of ten. In this case, the release data ranged from less than 10 pounds per year to greater than 10 million pounds per year. EPA developed matrices similar to Exhibit 9 for all of the environmental release data elements.
3.4 Production Data The data used to assess production volume are the Toxic Substances Control Act chemical production volume ranges reported under the Chemical Update System/Inventory Update Rule (CUS/IUR). EPA used the most recent year of data available for each particular chemical. Every chemical on EPA’s High Production Volume list is also in the CUS/IUR data source. Therefore, CUS/IUR is the primary source for production data. CUS/IUR reports chemical production data as ranges rather than as exact values. Therefore, EPA chose to use those ranges as the subdivisions for the production occurrence data. The production data ranges from less than 10,000 lbs/yr to greater than 1 billion lbs/yr. EPA developed matrices similar to Exhibit 9 for all of the production data on the test set chemicals.
3.5 Disinfection Byproducts (DBPs) and Drinking Water Treatment Chemicals EPA recognized that two groupings of chemicals have water occurrence even in cases where quantitative data were not available: the DBPs from the DSS-Tox data source and the treatment chemicals from NSF Standard 60. In many cases there were finished water data or production data for some of these chemicals, but some of the chemicals lacked quantitative data. Among the Universe of chemicals that lacked the preferred data elements, both the DBPs and treatment chemicals have a strong potential to be present in drinking water. Accordingly, EPA is moving chemicals in these two categories forward to the PCCL for further evaluation, even when limited health effects or occurrence information are available.
3.6 Combining the Data Elements for Screening EPA selected the occurrence data elements for screening based upon their presence in the universe and their suitability as a screening tool. Analyses were performed to see if the occurrence could be correlated across the various data elements. The diagnostic chemicals were used for the correlation analysis since most had data for the following data elements: mean, median, or maximum concentrations in finished and/or ambient water, amount released to the environment, and production volume. The analyses with the diagnostic chemicals demonstrated a limited correlation across the data elements. A chemical with a high release to the environment did not necessarily occur in finished or ambient water at a high concentration or even have a high frequency of detections. As a result, EPA decided to apply the occurrence screening data elements in a hierarchical manner. Chemicals known to occur in finished or ambient water occupy the highest position in the hierarchy and are most representative of a chemical’s potential to occur in drinking water.
Page 16 of 21
EPA-OGWDW Final CCL 3 Chemicals: EPA 815-R-09-007 Screening to a PCCL August 2009
Environmental releases and production are less reflective of a chemical's potential to occur in drinking water. Accordingly, EPA selected the following hierarchy:
Finished Water = Ambient Water > Environmental Release Data > Production Data. EPA also decided that when multiple values exist for the chemicals within a given component of the hierarchy, the most conservative would be used as the occurrence screening element. For example, in the case of a chemical that has finished water data and ambient water data, the highest available numerical concentration value would be selected as the occurrence screening data element.
4.0 Criteria for Selecting a PCCL The last step in the screening process was to use the intersections between health effects and occurrence data elements to establish the criteria for moving chemicals from the Universe to a PCCL. EPA grouped the Universe of chemicals that had values for health effects and occurrence data elements using the screening framework described in Section 1.0. Because the chemicals would be evaluated using a hierarchical approach for their occurrence elements, separate criteria were developed for each of the occurrence elements. To test the criteria, EPA used the set of 200 diagnostic chemicals. As stated in Section 3.0, the set of diagnostic contaminants included some chemicals regulated through NPDWRs, some from past CCLs, and a few drawn from the Universe because they had fairly complete data for all of the occurrence data elements. The selected regulated chemicals represented the characteristics of chemicals that the screening process should move to the PCCL. Accordingly, the locations of these chemicals in the completed screening framework were used to assist in placing the barrier separating those chemical contaminants that would move to the PCCL from those that would not be further evaluated. The series of criteria are described in the following sections and summarized in Appendix 1.
4.1 Finished and Ambient Water Concentration Data As mentioned earlier, the finished and ambient water data are those most representative of contaminants likely to be found in drinking water. For this reason EPA scrutinized these data elements more closely than the other occurrence data elements. Initially, the placement of the bold black line on Exhibit 10 was positioned so that it would move the regulated chemicals and most of the past CCL chemicals to the PCCL. Past CCL contaminants that remained in the Universe and did not pass on to the PCCL (fell to the gray side of the black line) were ones proven to be poor candidates for regulation. The second tool used to evaluate the position of the black line was the DWEL. The DWEL is calculated by multiplying the RfD in mg/kg/day by an adult body weight of 70 kg and dividing by a drinking water intake of 2 L/day (rounded to one significant figure). The RfD is a dose that is estimated to be without adverse effects for even sensitive populations. It includes a margin of safety in the form of a composite uncertainty factor. Most often, the uncertainty factor is a value of 100, 300, 1000 or 3000. For this exercise, the DWEL was derived from the lower RfD value
Page 17 of 21
EPA-OGWDW Final CCL 3 Chemicals: EPA 815-R-09-007 Screening to a PCCL August 2009
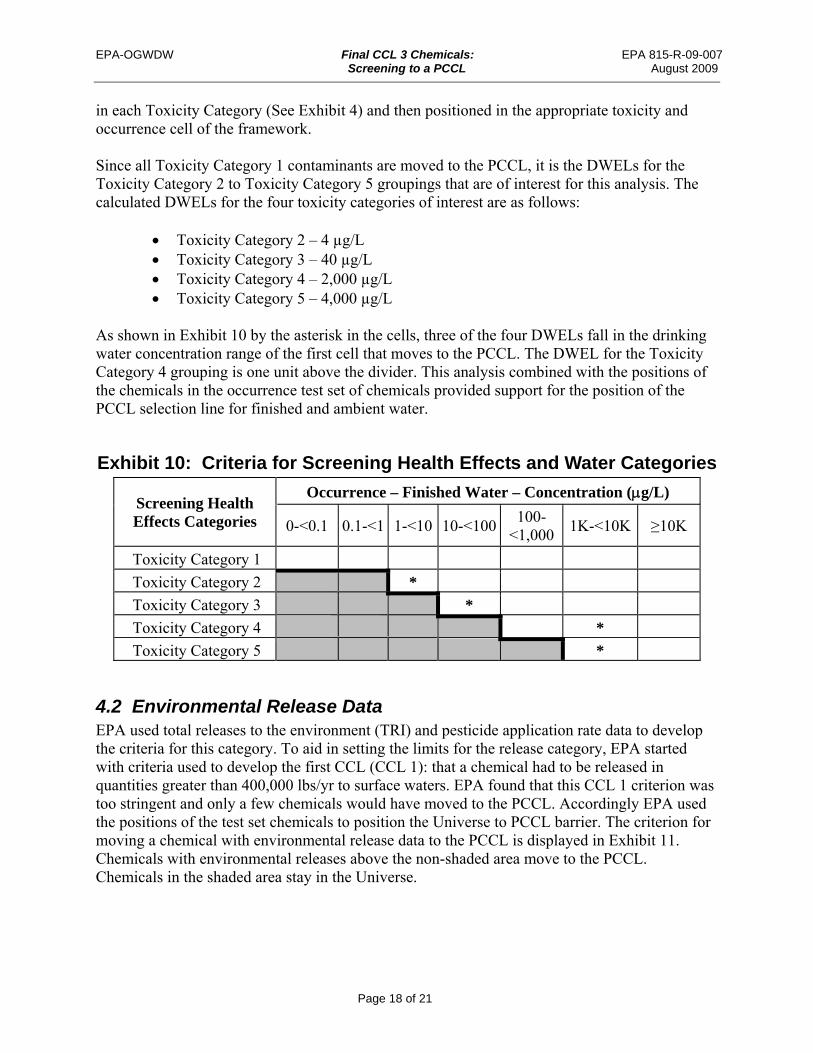
in each Toxicity Category (See Exhibit 4) and then positioned in the appropriate toxicity and occurrence cell of the framework.
Since all Toxicity Category 1 contaminants are moved to the PCCL, it is the DWELs for the Toxicity Category 2 to Toxicity Category 5 groupings that are of interest for this analysis. The calculated DWELs for the four toxicity categories of interest are as follows:
Toxicity Category 2 – 4 µg/L Toxicity Category 3 – 40 µg/L Toxicity Category 4 – 2,000 µg/L Toxicity Category 5 – 4,000 µg/L
As shown in Exhibit 10 by the asterisk in the cells, three of the four DWELs fall in the drinking water concentration range of the first cell that moves to the PCCL. The DWEL for the Toxicity Category 4 grouping is one unit above the divider. This analysis combined with the positions of the chemicals in the occurrence test set of chemicals provided support for the position of the PCCL selection line for finished and ambient water.
Exhibit 10: Criteria for Screening Health Effects and Water Categories
Screening Health Effects Categories
Occurrence – Finished Water – Concentration (g/L)
0-<0.1 0.1-<1 1-<10 10-<100 100
<1,000 1K-<10K ≥10K
Toxicity Category 1
Toxicity Category 2 *
Toxicity Category 3 *
Toxicity Category 4 *
Toxicity Category 5 *
4.2 Environmental Release Data EPA used total releases to the environment (TRI) and pesticide application rate data to develop the criteria for this category. To aid in setting the limits for the release category, EPA started with criteria used to develop the first CCL (CCL 1): that a chemical had to be released in quantities greater than 400,000 lbs/yr to surface waters. EPA found that this CCL 1 criterion was too stringent and only a few chemicals would have moved to the PCCL. Accordingly EPA used the positions of the test set chemicals to position the Universe to PCCL barrier. The criterion for moving a chemical with environmental release data to the PCCL is displayed in Exhibit 11. Chemicals with environmental releases above the non-shaded area move to the PCCL. Chemicals in the shaded area stay in the Universe.
Page 18 of 21
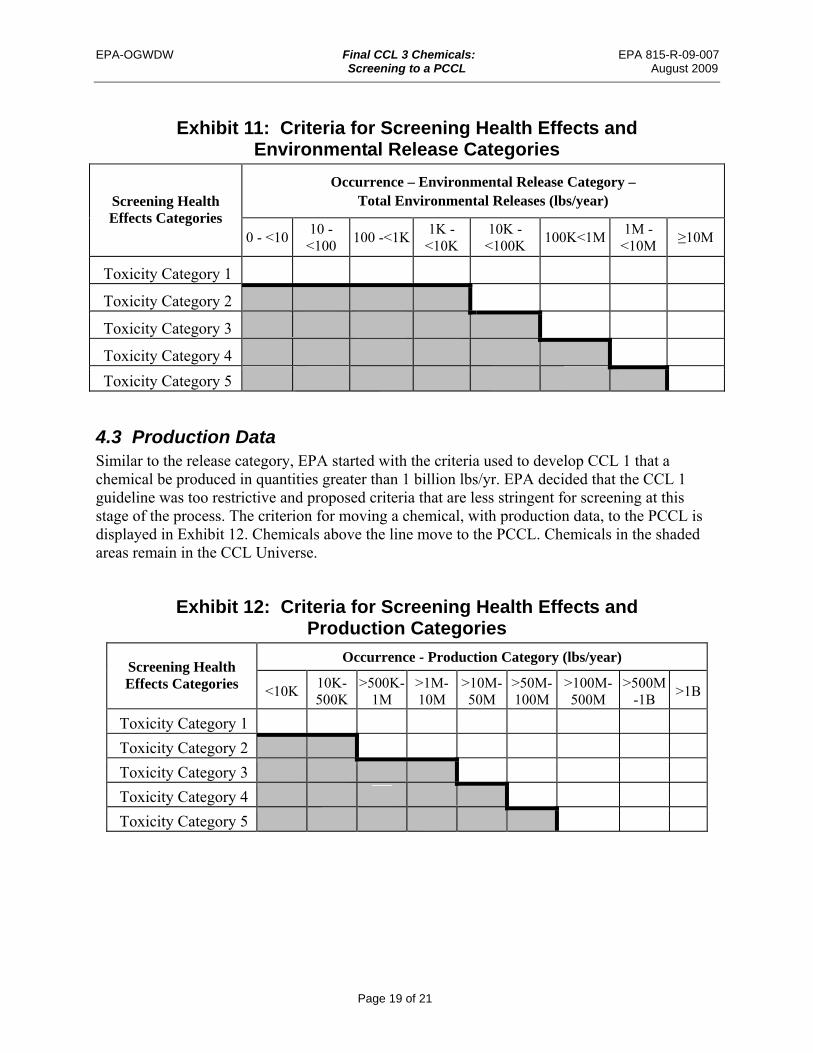
Exhibit 11: Criteria for Screening Health Effects and Environmental Release Categories
Screening Health Effects Categories
Occurrence – Environmental Release Category – Total Environmental Releases (lbs/year)
0 - <10 10 -<100
100 -<1K 1K -<10K
10K -<100K
100K<1M 1M -<10M
≥10M
Toxicity Category 1
Toxicity Category 2
Toxicity Category 3
Toxicity Category 4
Toxicity Category 5
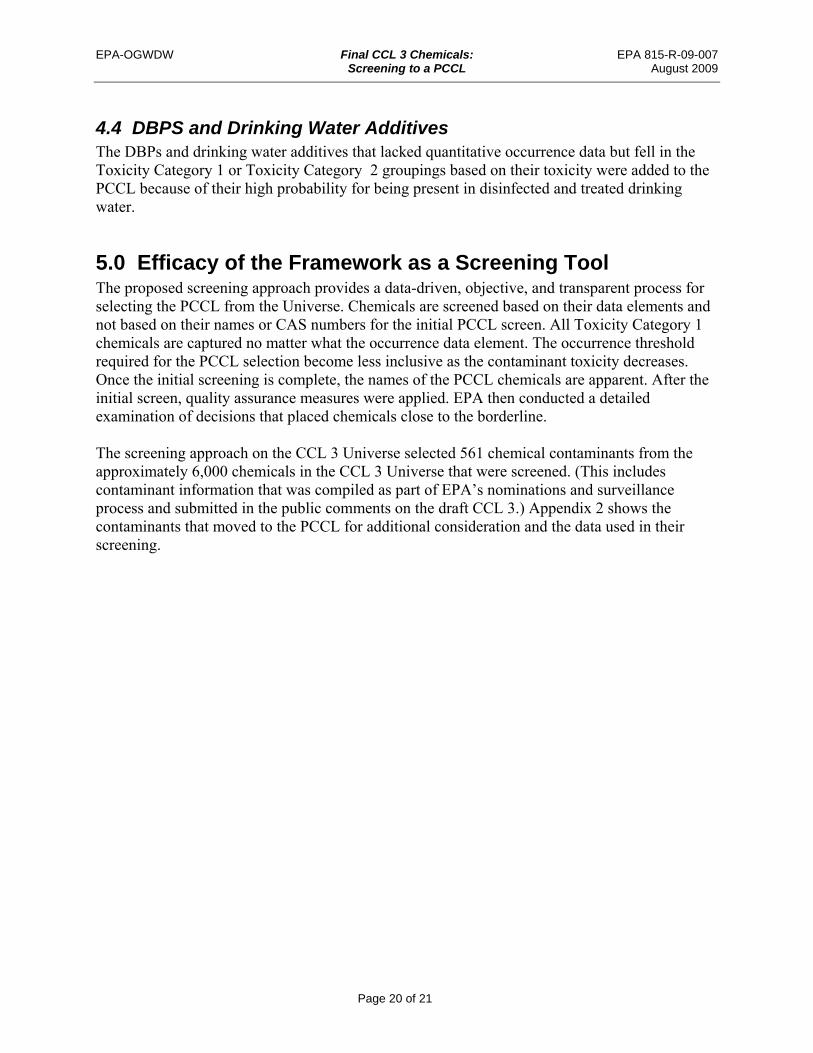
Exhibit 12: Criteria for Screening Health Effects and Production Categories
Screening Health Effects Categories
Occurrence - Production Category (lbs/year)
<10K 10K-500K
>500K-1M
>1M-10M
>10M-50M
>50M-100M
>100M-500M
>500M -1B
>1B
Toxicity Category 1
Toxicity Category 2
Toxicity Category 3
Toxicity Category 4
Toxicity Category 5
EPA-OGWDW Final CCL 3 Chemicals: EPA 815-R-09-007 Screening to a PCCL August 2009
4.3 Production Data Similar to the release category, EPA started with the criteria used to develop CCL 1 that a chemical be produced in quantities greater than 1 billion lbs/yr. EPA decided that the CCL 1 guideline was too restrictive and proposed criteria that are less stringent for screening at this stage of the process. The criterion for moving a chemical, with production data, to the PCCL is displayed in Exhibit 12. Chemicals above the line move to the PCCL. Chemicals in the shaded areas remain in the CCL Universe.
Page 19 of 21
EPA-OGWDW Final CCL 3 Chemicals: EPA 815-R-09-007 Screening to a PCCL August 2009
4.4 DBPS and Drinking Water Additives The DBPs and drinking water additives that lacked quantitative occurrence data but fell in the Toxicity Category 1 or Toxicity Category 2 groupings based on their toxicity were added to the PCCL because of their high probability for being present in disinfected and treated drinking water.
5.0 Efficacy of the Framework as a Screening Tool The proposed screening approach provides a data-driven, objective, and transparent process for selecting the PCCL from the Universe. Chemicals are screened based on their data elements and not based on their names or CAS numbers for the initial PCCL screen. All Toxicity Category 1 chemicals are captured no matter what the occurrence data element. The occurrence threshold required for the PCCL selection become less inclusive as the contaminant toxicity decreases. Once the initial screening is complete, the names of the PCCL chemicals are apparent. After the initial screen, quality assurance measures were applied. EPA then conducted a detailed examination of decisions that placed chemicals close to the borderline. The screening approach on the CCL 3 Universe selected 561 chemical contaminants from the approximately 6,000 chemicals in the CCL 3 Universe that were screened. (This includes contaminant information that was compiled as part of EPA’s nominations and surveillance process and submitted in the public comments on the draft CCL 3.) Appendix 2 shows the contaminants that moved to the PCCL for additional consideration and the data used in their screening.
Page 20 of 21
EPA-OGWDW Final CCL 3 Chemicals: EPA 815-R-09-007 Screening to a PCCL August 2009
6.0 References Health Canada. 2005. What is an LD50 and LC50. Canadian Center for Occupational Health and Safety. Ontario Canada. Available at. http://www.ccohs.ca/oshanswers/chemicals/ld50.html Hodge, H.C. and J.H. Sterner. 1956. Combined tabulation of toxicity classes. In: Spector, W.S., ed. Handbook of toxicology, Philadelphia, W.B. Saunders Company, Vol. 1. International Toxicity Estimates for Risk (ITER). 2006. ITER Definitions (Classification). Toxicology Excellence for Risk Assessment, Cincinnati, OH. Available at: http://www/iter.ctcnet.net/publicurl.glossary.html National Drinking Water Advisory Committee (NDWAC). 2004. CCL Classification Process. Report from the NDWAC to the U.S. Environmental Protection Agency Office of Ground Water and Drinking Water. May 19. National Toxicology Program (NTP). 2005. Management Status Report Produced from the NTP Chemtrack System. Central Data Management (EC-03) National Institute of Environmental Health Services, Research Triangle Park, NC. USEPA. 1986. United States Environmental Protection Agency. Guidelines for carcinogen risk assessment. Fed. Reg. 51(185):33992-34003. USEPA. 2005. United States Environmental Protection Agency. Guidelines for Carcinogen Risk Assessment. EPA/630/P-03/001B. Risk Assessment Forum, Washington, DC. USEPA. 2009a. Final Contaminant Candidate List 3 Chemicals: Identifying the Universe. EPA 815-R-09-006. August 2009. USEPA. 2009b. Final Contaminant Candidate List 3 Chemicals: Classification of PCCL to the CCL. EPA 815-R-09-008. August 2009. USEPA. 2009c. Summary of Nominations for the Third Contaminant Candidate List. EPA-815R-09-011. August 2009.
Page 21 of 21
EPA-OGWDW Final CCL 3 Chemicals: EPA 815-R-09-007 Screening to a PCCL August 2009
7.0 Appendices Appendix 1. Criteria for Selecting the PCCL
Contains the series of criteria used to select the PCCL from the CCL Chemical Universe. This criterion is based upon the following hierarchy: Concentrations in Water > Releases to the Environment > Production
Concentrations in Water Toxicity Category 1 chemicals with any concentration Toxicity Category 2 chemicals with concentrations ≥ 1 g/l Toxicity Category 3 chemicals with concentrations ≥ 10 g/l Toxicity Category 4 chemicals with concentrations ≥ 100 g/l Toxicity Category 5 chemicals with concentrations ≥ 1000 g/l
Releases to the Environment Toxicity Category 1 chemicals with any amount released Toxicity Category 2 chemicals with releases/application ≥ 10,000 lbs/yr Toxicity Category 3 chemicals with releases/application ≥ 100,000 lbs/yr Toxicity Category 4 chemicals with releases/application ≥ 1 M lbs/yr Toxicity Category 5 chemicals with releases/application ≥ 10 M lbs/yr
Production Toxicity Category 1 chemicals with any amount produced Toxicity Category 2 chemicals production volumes > 500,000 lbs/yr Toxicity Category 3 chemicals with production volumes > 10 M lbs/yr Toxicity Category 4 chemicals with production volumes > 50 M lbs/yr Toxicity Category 5 chemicals with production volumes > 100 M lbs/yr
A1-1
EPA-OGWDW Final CCL 3 Chemicals: EPA 815-R-09-007 Screening to a PCCL August 2009
Appendix 2. Chemicals Passing Screening to the PCCL
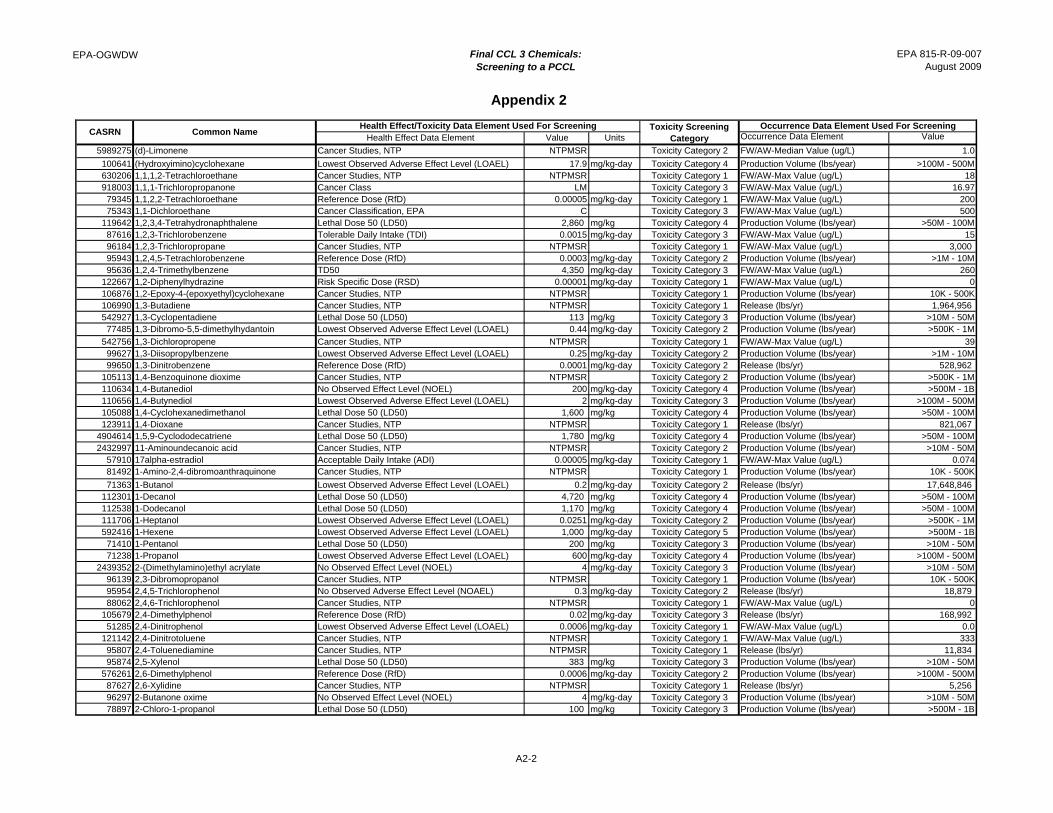
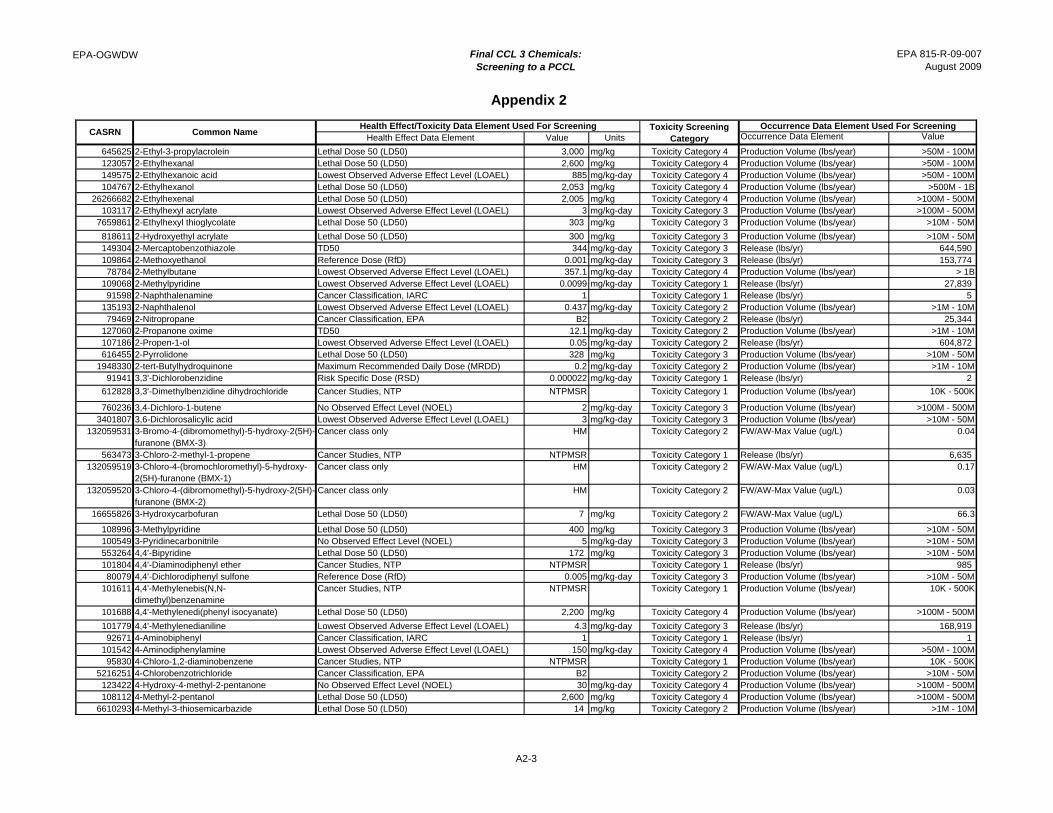
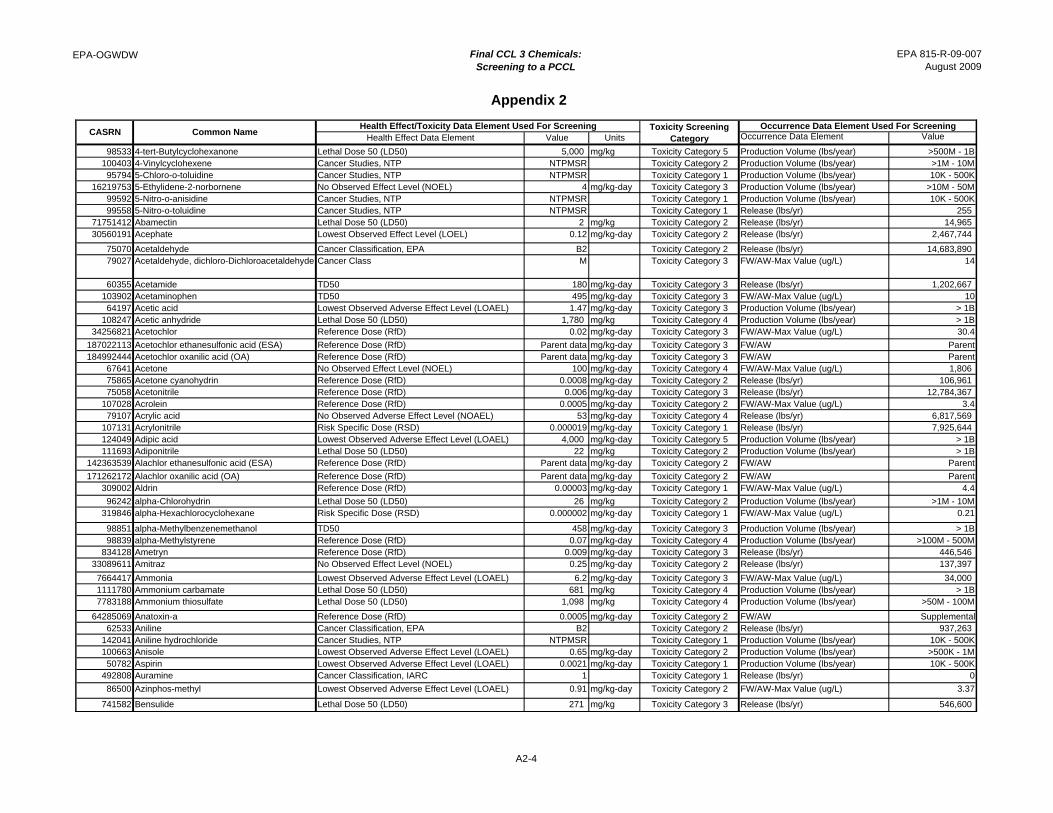
The following table in Appendix 2 presents the CASRN, names of the contaminants listed on the PCCL, and the health effects and occurrence data elements that were used in their screening. The data elements are described in the text of this report.
For the Health Effects Data Element, Cancer Studies NTP, the Value is shown as the National Toxicology Program multi-species results (NTPMSR), representing the more detailed criteria and data used to derive the Toxicity Screening Category. They are described in detail in the text. For the Occurrence data elements, the Release data may be either national TRI data or pesticide application data. The notation “FW/AW” indicates the data are finished or ambient water data. Also noted, for some pesticide degradates, data from the parent compound were used for screening; for some contaminants supplemental data, compiled in the nominations and surveillance process were also used.
Further data and information for the contaminants are available on the Contaminant Information Sheets available in the CCL 3 water docket.
A2-1
EPA-OGWDW Final CCL 3 Chemicals: Screening to a PCCL
Appendix 2
EPA 815-R-09-007August 2009
Health Effect Data Element Value Units Occurrence Data Element Value
5989275 (d)-Limonene Cancer Studies, NTP NTPMSR Toxicity Category 2 FW/AW-Median Value (ug/L) 1.0
100641 (Hydroxyimino)cyclohexane Lowest Observed Adverse Effect Level (LOAEL) 17.9 mg/kg-day Toxicity Category 4 Production Volume (lbs/year) >100M - 500M630206 1,1,1,2-Tetrachloroethane Cancer Studies, NTP NTPMSR Toxicity Category 1 FW/AW-Max Value (ug/L) 18918003 1,1,1-Trichloropropanone Cancer Class LM Toxicity Category 3 FW/AW-Max Value (ug/L) 16.9779345 1,1,2,2-Tetrachloroethane Reference Dose (RfD) 0.00005 mg/kg-day Toxicity Category 1 FW/AW-Max Value (ug/L) 20075343 1,1-Dichloroethane Cancer Classification, EPA C Toxicity Category 3 FW/AW-Max Value (ug/L) 500
119642 1,2,3,4-Tetrahydronaphthalene Lethal Dose 50 (LD50) 2,860 mg/kg Toxicity Category 4 Production Volume (lbs/year) >50M - 100M87616 1,2,3-Trichlorobenzene Tolerable Daily Intake (TDI) 0.0015 mg/kg-day Toxicity Category 3 FW/AW-Max Value (ug/L) 1596184 1,2,3-Trichloropropane Cancer Studies, NTP NTPMSR Toxicity Category 1 FW/AW-Max Value (ug/L) 3,000 95943 1,2,4,5-Tetrachlorobenzene Reference Dose (RfD) 0.0003 mg/kg-day Toxicity Category 2 Production Volume (lbs/year) >1M - 10M95636 1,2,4-Trimethylbenzene TD50 4,350 mg/kg-day Toxicity Category 3 FW/AW-Max Value (ug/L) 260
122667 1,2-Diphenylhydrazine Risk Specific Dose (RSD) 0.00001 mg/kg-day Toxicity Category 1 FW/AW-Max Value (ug/L) 0106876 1,2-Epoxy-4-(epoxyethyl)cyclohexane Cancer Studies, NTP NTPMSR Toxicity Category 1 Production Volume (lbs/year) 10K - 500K106990 1,3-Butadiene Cancer Studies, NTP NTPMSR Toxicity Category 1 Release (lbs/yr) 1,964,956 542927 1,3-Cyclopentadiene Lethal Dose 50 (LD50) 113 mg/kg Toxicity Category 3 Production Volume (lbs/year) >10M - 50M77485 1,3-Dibromo-5,5-dimethylhydantoin Lowest Observed Adverse Effect Level (LOAEL) 0.44 mg/kg-day Toxicity Category 2 Production Volume (lbs/year) >500K - 1M
542756 1,3-Dichloropropene Cancer Studies, NTP NTPMSR Toxicity Category 1 FW/AW-Max Value (ug/L) 3999627 1,3-Diisopropylbenzene Lowest Observed Adverse Effect Level (LOAEL) 0.25 mg/kg-day Toxicity Category 2 Production Volume (lbs/year) >1M - 10M99650 1,3-Dinitrobenzene Reference Dose (RfD) 0.0001 mg/kg-day Toxicity Category 2 Release (lbs/yr) 528,962
105113 1,4-Benzoquinone dioxime Cancer Studies, NTP NTPMSR Toxicity Category 2 Production Volume (lbs/year) >500K - 1M110634 1,4-Butanediol No Observed Effect Level (NOEL) 200 mg/kg-day Toxicity Category 4 Production Volume (lbs/year) >500M - 1B110656 1,4-Butynediol Lowest Observed Adverse Effect Level (LOAEL) 2 mg/kg-day Toxicity Category 3 Production Volume (lbs/year) >100M - 500M105088 1,4-Cyclohexanedimethanol Lethal Dose 50 (LD50) 1,600 mg/kg Toxicity Category 4 Production Volume (lbs/year) >50M - 100M123911 1,4-Dioxane Cancer Studies, NTP NTPMSR Toxicity Category 1 Release (lbs/yr) 821,067
4904614 1,5,9-Cyclododecatriene Lethal Dose 50 (LD50) 1,780 mg/kg Toxicity Category 4 Production Volume (lbs/year) >50M - 100M2432997 11-Aminoundecanoic acid Cancer Studies, NTP NTPMSR Toxicity Category 2 Production Volume (lbs/year) >10M - 50M
57910 17alpha-estradiol Acceptable Daily Intake (ADI) 0.00005 mg/kg-day Toxicity Category 1 FW/AW-Max Value (ug/L) 0.07481492 1-Amino-2,4-dibromoanthraquinone Cancer Studies, NTP NTPMSR Toxicity Category 1 Production Volume (lbs/year) 10K - 500K
71363 1-Butanol Lowest Observed Adverse Effect Level (LOAEL) 0.2 mg/kg-day Toxicity Category 2 Release (lbs/yr) 17,648,846 112301 1-Decanol Lethal Dose 50 (LD50) 4,720 mg/kg Toxicity Category 4 Production Volume (lbs/year) >50M - 100M112538 1-Dodecanol Lethal Dose 50 (LD50) 1,170 mg/kg Toxicity Category 4 Production Volume (lbs/year) >50M - 100M111706 1-Heptanol Lowest Observed Adverse Effect Level (LOAEL) 0.0251 mg/kg-day Toxicity Category 2 Production Volume (lbs/year) >500K - 1M592416 1-Hexene Lowest Observed Adverse Effect Level (LOAEL) 1,000 mg/kg-day Toxicity Category 5 Production Volume (lbs/year) >500M - 1B71410 1-Pentanol Lethal Dose 50 (LD50) 200 mg/kg Toxicity Category 3 Production Volume (lbs/year) >10M - 50M71238 1-Propanol Lowest Observed Adverse Effect Level (LOAEL) 600 mg/kg-day Toxicity Category 4 Production Volume (lbs/year) >100M - 500M
2439352 2-(Dimethylamino)ethyl acrylate No Observed Effect Level (NOEL) 4 mg/kg-day Toxicity Category 3 Production Volume (lbs/year) >10M - 50M96139 2,3-Dibromopropanol Cancer Studies, NTP NTPMSR Toxicity Category 1 Production Volume (lbs/year) 10K - 500K95954 2,4,5-Trichlorophenol No Observed Adverse Effect Level (NOAEL) 0.3 mg/kg-day Toxicity Category 2 Release (lbs/yr) 18,879 88062 2,4,6-Trichlorophenol Cancer Studies, NTP NTPMSR Toxicity Category 1 FW/AW-Max Value (ug/L) 0
105679 2,4-Dimethylphenol Reference Dose (RfD) 0.02 mg/kg-day Toxicity Category 3 Release (lbs/yr) 168,992 51285 2,4-Dinitrophenol Lowest Observed Adverse Effect Level (LOAEL) 0.0006 mg/kg-day Toxicity Category 1 FW/AW-Max Value (ug/L) 0.0
121142 2,4-Dinitrotoluene Cancer Studies, NTP NTPMSR Toxicity Category 1 FW/AW-Max Value (ug/L) 33395807 2,4-Toluenediamine Cancer Studies, NTP NTPMSR Toxicity Category 1 Release (lbs/yr) 11,834 95874 2,5-Xylenol Lethal Dose 50 (LD50) 383 mg/kg Toxicity Category 3 Production Volume (lbs/year) >10M - 50M
576261 2,6-Dimethylphenol Reference Dose (RfD) 0.0006 mg/kg-day Toxicity Category 2 Production Volume (lbs/year) >100M - 500M87627 2,6-Xylidine Cancer Studies, NTP NTPMSR Toxicity Category 1 Release (lbs/yr) 5,256 96297 2-Butanone oxime No Observed Effect Level (NOEL) 4 mg/kg-day Toxicity Category 3 Production Volume (lbs/year) >10M - 50M78897 2-Chloro-1-propanol Lethal Dose 50 (LD50) 100 mg/kg Toxicity Category 3 Production Volume (lbs/year) >500M - 1B
Toxicity Screening Category
Occurrence Data Element Used For ScreeningHealth Effect/Toxicity Data Element Used For ScreeningCommon NameCASRN
A2-2
EPA-OGWDW Final CCL 3 Chemicals: Screening to a PCCL
Appendix 2
EPA 815-R-09-007August 2009
Health Effect Data Element Value Units Occurrence Data Element ValueToxicity Screening
Category
Occurrence Data Element Used For ScreeningHealth Effect/Toxicity Data Element Used For ScreeningCommon NameCASRN
645625 2-Ethyl-3-propylacrolein Lethal Dose 50 (LD50) 3,000 mg/kg Toxicity Category 4 Production Volume (lbs/year) >50M - 100M123057 2-Ethylhexanal Lethal Dose 50 (LD50) 2,600 mg/kg Toxicity Category 4 Production Volume (lbs/year) >50M - 100M149575 2-Ethylhexanoic acid Lowest Observed Adverse Effect Level (LOAEL) 885 mg/kg-day Toxicity Category 4 Production Volume (lbs/year) >50M - 100M104767 2-Ethylhexanol Lethal Dose 50 (LD50) 2,053 mg/kg Toxicity Category 4 Production Volume (lbs/year) >500M - 1B
26266682 2-Ethylhexenal Lethal Dose 50 (LD50) 2,005 mg/kg Toxicity Category 4 Production Volume (lbs/year) >100M - 500M103117 2-Ethylhexyl acrylate Lowest Observed Adverse Effect Level (LOAEL) 3 mg/kg-day Toxicity Category 3 Production Volume (lbs/year) >100M - 500M
7659861 2-Ethylhexyl thioglycolate Lethal Dose 50 (LD50) 303 mg/kg Toxicity Category 3 Production Volume (lbs/year) >10M - 50M
818611 2-Hydroxyethyl acrylate Lethal Dose 50 (LD50) 300 mg/kg Toxicity Category 3 Production Volume (lbs/year) >10M - 50M149304 2-Mercaptobenzothiazole TD50 344 mg/kg-day Toxicity Category 3 Release (lbs/yr) 644,590 109864 2-Methoxyethanol Reference Dose (RfD) 0.001 mg/kg-day Toxicity Category 3 Release (lbs/yr) 153,774 78784 2-Methylbutane Lowest Observed Adverse Effect Level (LOAEL) 357.1 mg/kg-day Toxicity Category 4 Production Volume (lbs/year) > 1B
109068 2-Methylpyridine Lowest Observed Adverse Effect Level (LOAEL) 0.0099 mg/kg-day Toxicity Category 1 Release (lbs/yr) 27,839 91598 2-Naphthalenamine Cancer Classification, IARC 1 Toxicity Category 1 Release (lbs/yr) 5
135193 2-Naphthalenol Lowest Observed Adverse Effect Level (LOAEL) 0.437 mg/kg-day Toxicity Category 2 Production Volume (lbs/year) >1M - 10M79469 2-Nitropropane Cancer Classification, EPA B2 Toxicity Category 2 Release (lbs/yr) 25,344
127060 2-Propanone oxime TD50 12.1 mg/kg-day Toxicity Category 2 Production Volume (lbs/year) >1M - 10M107186 2-Propen-1-ol Lowest Observed Adverse Effect Level (LOAEL) 0.05 mg/kg-day Toxicity Category 2 Release (lbs/yr) 604,872 616455 2-Pyrrolidone Lethal Dose 50 (LD50) 328 mg/kg Toxicity Category 3 Production Volume (lbs/year) >10M - 50M
1948330 2-tert-Butylhydroquinone Maximum Recommended Daily Dose (MRDD) 0.2 mg/kg-day Toxicity Category 2 Production Volume (lbs/year) >1M - 10M91941 3,3'-Dichlorobenzidine Risk Specific Dose (RSD) 0.000022 mg/kg-day Toxicity Category 1 Release (lbs/yr) 2
612828 3,3'-Dimethylbenzidine dihydrochloride Cancer Studies, NTP NTPMSR Toxicity Category 1 Production Volume (lbs/year) 10K - 500K
760236 3,4-Dichloro-1-butene No Observed Effect Level (NOEL) 2 mg/kg-day Toxicity Category 3 Production Volume (lbs/year) >100M - 500M3401807 3,6-Dichlorosalicylic acid Lowest Observed Adverse Effect Level (LOAEL) 3 mg/kg-day Toxicity Category 3 Production Volume (lbs/year) >10M - 50M
132059531 3-Bromo-4-(dibromomethyl)-5-hydroxy-2(5H)-furanone (BMX-3)
Cancer class only HM Toxicity Category 2 FW/AW-Max Value (ug/L) 0.04
563473 3-Chloro-2-methyl-1-propene Cancer Studies, NTP NTPMSR Toxicity Category 1 Release (lbs/yr) 6,635 132059519 3-Chloro-4-(bromochloromethyl)-5-hydroxy-
2(5H)-furanone (BMX-1)Cancer class only HM Toxicity Category 2 FW/AW-Max Value (ug/L) 0.17
132059520 3-Chloro-4-(dibromomethyl)-5-hydroxy-2(5H)-furanone (BMX-2)
Cancer class only HM Toxicity Category 2 FW/AW-Max Value (ug/L) 0.03
16655826 3-Hydroxycarbofuran Lethal Dose 50 (LD50) 7 mg/kg Toxicity Category 2 FW/AW-Max Value (ug/L) 66.3
108996 3-Methylpyridine Lethal Dose 50 (LD50) 400 mg/kg Toxicity Category 3 Production Volume (lbs/year) >10M - 50M100549 3-Pyridinecarbonitrile No Observed Effect Level (NOEL) 5 mg/kg-day Toxicity Category 3 Production Volume (lbs/year) >10M - 50M553264 4,4'-Bipyridine Lethal Dose 50 (LD50) 172 mg/kg Toxicity Category 3 Production Volume (lbs/year) >10M - 50M101804 4,4'-Diaminodiphenyl ether Cancer Studies, NTP NTPMSR Toxicity Category 1 Release (lbs/yr) 985 80079 4,4'-Dichlorodiphenyl sulfone Reference Dose (RfD) 0.005 mg/kg-day Toxicity Category 3 Production Volume (lbs/year) >10M - 50M
101611 4,4'-Methylenebis(N,N-dimethyl)benzenamine
Cancer Studies, NTP NTPMSR Toxicity Category 1 Production Volume (lbs/year) 10K - 500K
101688 4,4'-Methylenedi(phenyl isocyanate) Lethal Dose 50 (LD50) 2,200 mg/kg Toxicity Category 4 Production Volume (lbs/year) >100M - 500M
101779 4,4'-Methylenedianiline Lowest Observed Adverse Effect Level (LOAEL) 4.3 mg/kg-day Toxicity Category 3 Release (lbs/yr) 168,919 92671 4-Aminobiphenyl Cancer Classification, IARC 1 Toxicity Category 1 Release (lbs/yr) 1
101542 4-Aminodiphenylamine Lowest Observed Adverse Effect Level (LOAEL) 150 mg/kg-day Toxicity Category 4 Production Volume (lbs/year) >50M - 100M95830 4-Chloro-1,2-diaminobenzene Cancer Studies, NTP NTPMSR Toxicity Category 1 Production Volume (lbs/year) 10K - 500K
5216251 4-Chlorobenzotrichloride Cancer Classification, EPA B2 Toxicity Category 2 Production Volume (lbs/year) >10M - 50M123422 4-Hydroxy-4-methyl-2-pentanone No Observed Effect Level (NOEL) 30 mg/kg-day Toxicity Category 4 Production Volume (lbs/year) >100M - 500M108112 4-Methyl-2-pentanol Lethal Dose 50 (LD50) 2,600 mg/kg Toxicity Category 4 Production Volume (lbs/year) >100M - 500M
6610293 4-Methyl-3-thiosemicarbazide Lethal Dose 50 (LD50) 14 mg/kg Toxicity Category 2 Production Volume (lbs/year) >1M - 10M
A2-3
EPA-OGWDW Final CCL 3 Chemicals: Screening to a PCCL
Appendix 2
EPA 815-R-09-007August 2009
Health Effect Data Element Value Units Occurrence Data Element ValueToxicity Screening
Category
Occurrence Data Element Used For ScreeningHealth Effect/Toxicity Data Element Used For ScreeningCommon NameCASRN
98533 4-tert-Butylcyclohexanone Lethal Dose 50 (LD50) 5,000 mg/kg Toxicity Category 5 Production Volume (lbs/year) >500M - 1B100403 4-Vinylcyclohexene Cancer Studies, NTP NTPMSR Toxicity Category 2 Production Volume (lbs/year) >1M - 10M95794 5-Chloro-o-toluidine Cancer Studies, NTP NTPMSR Toxicity Category 1 Production Volume (lbs/year) 10K - 500K
16219753 5-Ethylidene-2-norbornene No Observed Effect Level (NOEL) 4 mg/kg-day Toxicity Category 3 Production Volume (lbs/year) >10M - 50M99592 5-Nitro-o-anisidine Cancer Studies, NTP NTPMSR Toxicity Category 1 Production Volume (lbs/year) 10K - 500K99558 5-Nitro-o-toluidine Cancer Studies, NTP NTPMSR Toxicity Category 1 Release (lbs/yr) 255
71751412 Abamectin Lethal Dose 50 (LD50) 2 mg/kg Toxicity Category 2 Release (lbs/yr) 14,965 30560191 Acephate Lowest Observed Effect Level (LOEL) 0.12 mg/kg-day Toxicity Category 2 Release (lbs/yr) 2,467,744
75070 Acetaldehyde Cancer Classification, EPA B2 Toxicity Category 2 Release (lbs/yr) 14,683,890 79027 Acetaldehyde, dichloro-Dichloroacetaldehyde Cancer Class M Toxicity Category 3 FW/AW-Max Value (ug/L) 14
60355 Acetamide TD50 180 mg/kg-day Toxicity Category 3 Release (lbs/yr) 1,202,667 103902 Acetaminophen TD50 495 mg/kg-day Toxicity Category 3 FW/AW-Max Value (ug/L) 1064197 Acetic acid Lowest Observed Adverse Effect Level (LOAEL) 1.47 mg/kg-day Toxicity Category 3 Production Volume (lbs/year) > 1B
108247 Acetic anhydride Lethal Dose 50 (LD50) 1,780 mg/kg Toxicity Category 4 Production Volume (lbs/year) > 1B34256821 Acetochlor Reference Dose (RfD) 0.02 mg/kg-day Toxicity Category 3 FW/AW-Max Value (ug/L) 30.4
187022113 Acetochlor ethanesulfonic acid (ESA) Reference Dose (RfD) Parent data mg/kg-day Toxicity Category 3 FW/AW Parent184992444 Acetochlor oxanilic acid (OA) Reference Dose (RfD) Parent data mg/kg-day Toxicity Category 3 FW/AW Parent
67641 Acetone No Observed Effect Level (NOEL) 100 mg/kg-day Toxicity Category 4 FW/AW-Max Value (ug/L) 1,806 75865 Acetone cyanohydrin Reference Dose (RfD) 0.0008 mg/kg-day Toxicity Category 2 Release (lbs/yr) 106,961 75058 Acetonitrile Reference Dose (RfD) 0.006 mg/kg-day Toxicity Category 3 Release (lbs/yr) 12,784,367
107028 Acrolein Reference Dose (RfD) 0.0005 mg/kg-day Toxicity Category 2 FW/AW-Max Value (ug/L) 3.479107 Acrylic acid No Observed Adverse Effect Level (NOAEL) 53 mg/kg-day Toxicity Category 4 Release (lbs/yr) 6,817,569
107131 Acrylonitrile Risk Specific Dose (RSD) 0.000019 mg/kg-day Toxicity Category 1 Release (lbs/yr) 7,925,644 124049 Adipic acid Lowest Observed Adverse Effect Level (LOAEL) 4,000 mg/kg-day Toxicity Category 5 Production Volume (lbs/year) > 1B111693 Adiponitrile Lethal Dose 50 (LD50) 22 mg/kg Toxicity Category 2 Production Volume (lbs/year) > 1B
142363539 Alachlor ethanesulfonic acid (ESA) Reference Dose (RfD) Parent data mg/kg-day Toxicity Category 2 FW/AW Parent
171262172 Alachlor oxanilic acid (OA) Reference Dose (RfD) Parent data mg/kg-day Toxicity Category 2 FW/AW Parent309002 Aldrin Reference Dose (RfD) 0.00003 mg/kg-day Toxicity Category 1 FW/AW-Max Value (ug/L) 4.4
96242 alpha-Chlorohydrin Lethal Dose 50 (LD50) 26 mg/kg Toxicity Category 2 Production Volume (lbs/year) >1M - 10M319846 alpha-Hexachlorocyclohexane Risk Specific Dose (RSD) 0.000002 mg/kg-day Toxicity Category 1 FW/AW-Max Value (ug/L) 0.21
98851 alpha-Methylbenzenemethanol TD50 458 mg/kg-day Toxicity Category 3 Production Volume (lbs/year) > 1B98839 alpha-Methylstyrene Reference Dose (RfD) 0.07 mg/kg-day Toxicity Category 4 Production Volume (lbs/year) >100M - 500M
834128 Ametryn Reference Dose (RfD) 0.009 mg/kg-day Toxicity Category 3 Release (lbs/yr) 446,546 33089611 Amitraz No Observed Effect Level (NOEL) 0.25 mg/kg-day Toxicity Category 2 Release (lbs/yr) 137,397
7664417 Ammonia Lowest Observed Adverse Effect Level (LOAEL) 6.2 mg/kg-day Toxicity Category 3 FW/AW-Max Value (ug/L) 34,000 1111780 Ammonium carbamate Lethal Dose 50 (LD50) 681 mg/kg Toxicity Category 4 Production Volume (lbs/year) > 1B7783188 Ammonium thiosulfate Lethal Dose 50 (LD50) 1,098 mg/kg Toxicity Category 4 Production Volume (lbs/year) >50M - 100M
64285069 Anatoxin-a Reference Dose (RfD) 0.0005 mg/kg-day Toxicity Category 2 FW/AW Supplemental62533 Aniline Cancer Classification, EPA B2 Toxicity Category 2 Release (lbs/yr) 937,263
142041 Aniline hydrochloride Cancer Studies, NTP NTPMSR Toxicity Category 1 Production Volume (lbs/year) 10K - 500K100663 Anisole Lowest Observed Adverse Effect Level (LOAEL) 0.65 mg/kg-day Toxicity Category 2 Production Volume (lbs/year) >500K - 1M50782 Aspirin Lowest Observed Adverse Effect Level (LOAEL) 0.0021 mg/kg-day Toxicity Category 1 Production Volume (lbs/year) 10K - 500K
492808 Auramine Cancer Classification, IARC 1 Toxicity Category 1 Release (lbs/yr) 0
86500 Azinphos-methyl Lowest Observed Adverse Effect Level (LOAEL) 0.91 mg/kg-day Toxicity Category 2 FW/AW-Max Value (ug/L) 3.37
741582 Bensulide Lethal Dose 50 (LD50) 271 mg/kg Toxicity Category 3 Release (lbs/yr) 546,600
A2-4
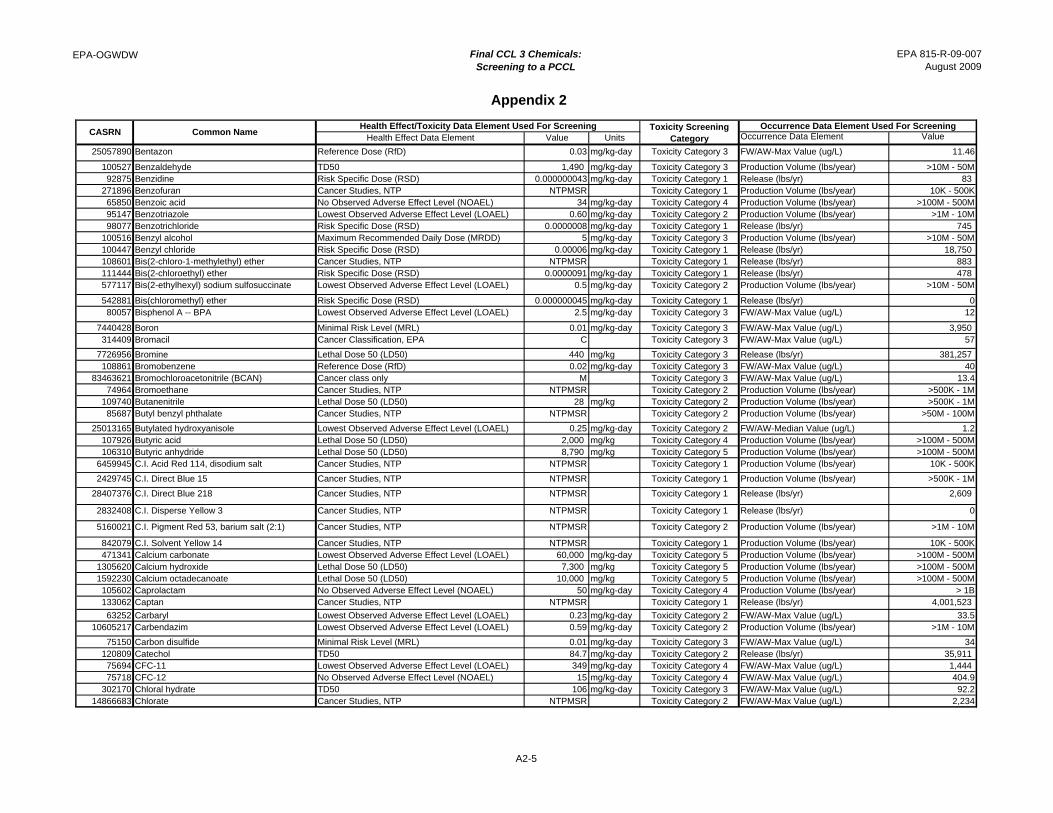
EPA-OGWDW Final CCL 3 Chemicals: Screening to a PCCL
Appendix 2
EPA 815-R-09-007August 2009
Health Effect Data Element Value Units Occurrence Data Element ValueToxicity Screening
Category
Occurrence Data Element Used For ScreeningHealth Effect/Toxicity Data Element Used For ScreeningCommon NameCASRN
25057890 Bentazon Reference Dose (RfD) 0.03 mg/kg-day Toxicity Category 3 FW/AW-Max Value (ug/L) 11.46
100527 Benzaldehyde TD50 1,490 mg/kg-day Toxicity Category 3 Production Volume (lbs/year) >10M - 50M92875 Benzidine Risk Specific Dose (RSD) 0.000000043 mg/kg-day Toxicity Category 1 Release (lbs/yr) 83
271896 Benzofuran Cancer Studies, NTP NTPMSR Toxicity Category 1 Production Volume (lbs/year) 10K - 500K65850 Benzoic acid No Observed Adverse Effect Level (NOAEL) 34 mg/kg-day Toxicity Category 4 Production Volume (lbs/year) >100M - 500M95147 Benzotriazole Lowest Observed Adverse Effect Level (LOAEL) 0.60 mg/kg-day Toxicity Category 2 Production Volume (lbs/year) >1M - 10M98077 Benzotrichloride Risk Specific Dose (RSD) 0.0000008 mg/kg-day Toxicity Category 1 Release (lbs/yr) 745
100516 Benzyl alcohol Maximum Recommended Daily Dose (MRDD) 5 mg/kg-day Toxicity Category 3 Production Volume (lbs/year) >10M - 50M100447 Benzyl chloride Risk Specific Dose (RSD) 0.00006 mg/kg-day Toxicity Category 1 Release (lbs/yr) 18,750 108601 Bis(2-chloro-1-methylethyl) ether Cancer Studies, NTP NTPMSR Toxicity Category 1 Release (lbs/yr) 883 111444 Bis(2-chloroethyl) ether Risk Specific Dose (RSD) 0.0000091 mg/kg-day Toxicity Category 1 Release (lbs/yr) 478 577117 Bis(2-ethylhexyl) sodium sulfosuccinate Lowest Observed Adverse Effect Level (LOAEL) 0.5 mg/kg-day Toxicity Category 2 Production Volume (lbs/year) >10M - 50M
542881 Bis(chloromethyl) ether Risk Specific Dose (RSD) 0.000000045 mg/kg-day Toxicity Category 1 Release (lbs/yr) 080057 Bisphenol A -- BPA Lowest Observed Adverse Effect Level (LOAEL) 2.5 mg/kg-day Toxicity Category 3 FW/AW-Max Value (ug/L) 12
7440428 Boron Minimal Risk Level (MRL) 0.01 mg/kg-day Toxicity Category 3 FW/AW-Max Value (ug/L) 3,950 314409 Bromacil Cancer Classification, EPA C Toxicity Category 3 FW/AW-Max Value (ug/L) 57
7726956 Bromine Lethal Dose 50 (LD50) 440 mg/kg Toxicity Category 3 Release (lbs/yr) 381,257 108861 Bromobenzene Reference Dose (RfD) 0.02 mg/kg-day Toxicity Category 3 FW/AW-Max Value (ug/L) 40
83463621 Bromochloroacetonitrile (BCAN) Cancer class only M Toxicity Category 3 FW/AW-Max Value (ug/L) 13.474964 Bromoethane Cancer Studies, NTP NTPMSR Toxicity Category 2 Production Volume (lbs/year) >500K - 1M
109740 Butanenitrile Lethal Dose 50 (LD50) 28 mg/kg Toxicity Category 2 Production Volume (lbs/year) >500K - 1M85687 Butyl benzyl phthalate Cancer Studies, NTP NTPMSR Toxicity Category 2 Production Volume (lbs/year) >50M - 100M
25013165 Butylated hydroxyanisole Lowest Observed Adverse Effect Level (LOAEL) 0.25 mg/kg-day Toxicity Category 2 FW/AW-Median Value (ug/L) 1.2107926 Butyric acid Lethal Dose 50 (LD50) 2,000 mg/kg Toxicity Category 4 Production Volume (lbs/year) >100M - 500M106310 Butyric anhydride Lethal Dose 50 (LD50) 8,790 mg/kg Toxicity Category 5 Production Volume (lbs/year) >100M - 500M
6459945 C.I. Acid Red 114, disodium salt Cancer Studies, NTP NTPMSR Toxicity Category 1 Production Volume (lbs/year) 10K - 500K
2429745 C.I. Direct Blue 15 Cancer Studies, NTP NTPMSR Toxicity Category 1 Production Volume (lbs/year) >500K - 1M
28407376 C.I. Direct Blue 218 Cancer Studies, NTP NTPMSR Toxicity Category 1 Release (lbs/yr) 2,609
2832408 C.I. Disperse Yellow 3 Cancer Studies, NTP NTPMSR Toxicity Category 1 Release (lbs/yr) 0
5160021 C.I. Pigment Red 53, barium salt (2:1) Cancer Studies, NTP NTPMSR Toxicity Category 2 Production Volume (lbs/year) >1M - 10M
842079 C.I. Solvent Yellow 14 Cancer Studies, NTP NTPMSR Toxicity Category 1 Production Volume (lbs/year) 10K - 500K471341 Calcium carbonate Lowest Observed Adverse Effect Level (LOAEL) 60,000 mg/kg-day Toxicity Category 5 Production Volume (lbs/year) >100M - 500M
1305620 Calcium hydroxide Lethal Dose 50 (LD50) 7,300 mg/kg Toxicity Category 5 Production Volume (lbs/year) >100M - 500M1592230 Calcium octadecanoate Lethal Dose 50 (LD50) 10,000 mg/kg Toxicity Category 5 Production Volume (lbs/year) >100M - 500M105602 Caprolactam No Observed Adverse Effect Level (NOAEL) 50 mg/kg-day Toxicity Category 4 Production Volume (lbs/year) > 1B133062 Captan Cancer Studies, NTP NTPMSR Toxicity Category 1 Release (lbs/yr) 4,001,523
63252 Carbaryl Lowest Observed Adverse Effect Level (LOAEL) 0.23 mg/kg-day Toxicity Category 2 FW/AW-Max Value (ug/L) 33.510605217 Carbendazim Lowest Observed Adverse Effect Level (LOAEL) 0.59 mg/kg-day Toxicity Category 2 Production Volume (lbs/year) >1M - 10M
75150 Carbon disulfide Minimal Risk Level (MRL) 0.01 mg/kg-day Toxicity Category 3 FW/AW-Max Value (ug/L) 34120809 Catechol TD50 84.7 mg/kg-day Toxicity Category 2 Release (lbs/yr) 35,911 75694 CFC-11 Lowest Observed Adverse Effect Level (LOAEL) 349 mg/kg-day Toxicity Category 4 FW/AW-Max Value (ug/L) 1,444 75718 CFC-12 No Observed Adverse Effect Level (NOAEL) 15 mg/kg-day Toxicity Category 4 FW/AW-Max Value (ug/L) 404.9
302170 Chloral hydrate TD50 106 mg/kg-day Toxicity Category 3 FW/AW-Max Value (ug/L) 92.214866683 Chlorate Cancer Studies, NTP NTPMSR Toxicity Category 2 FW/AW-Max Value (ug/L) 2,234
A2-5
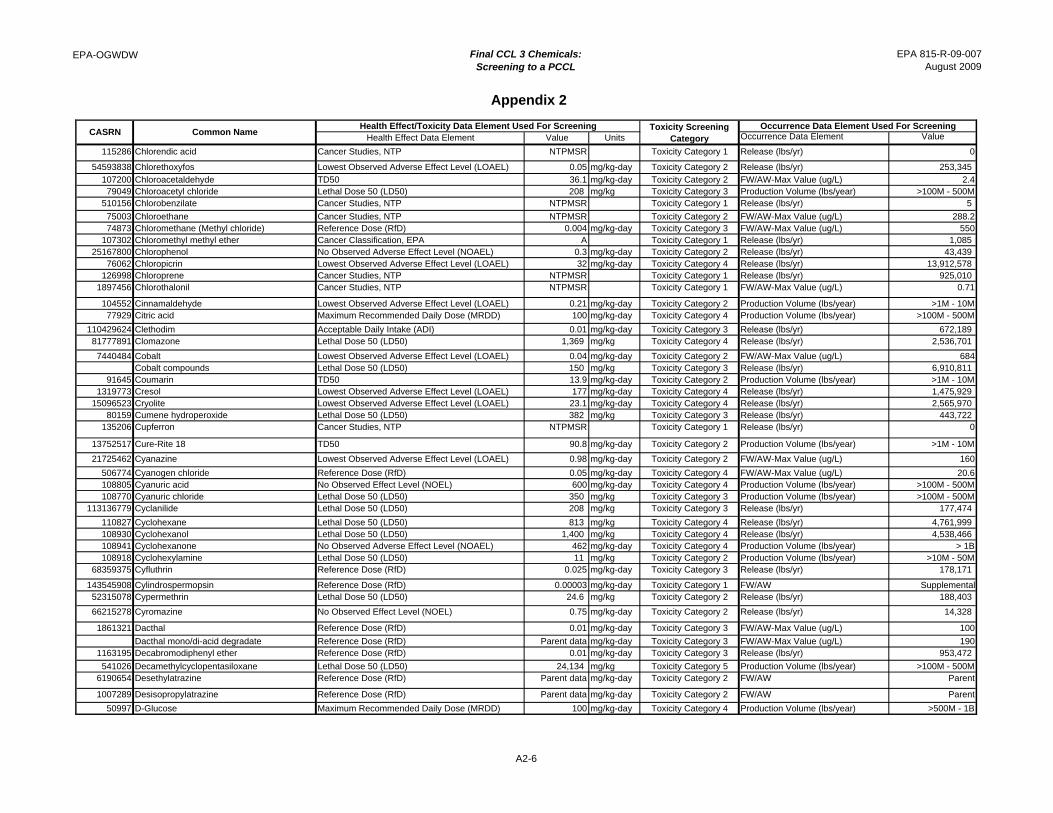
EPA-OGWDW Final CCL 3 Chemicals: Screening to a PCCL
Appendix 2
EPA 815-R-09-007August 2009
Health Effect Data Element Value Units Occurrence Data Element ValueToxicity Screening
Category
Occurrence Data Element Used For ScreeningHealth Effect/Toxicity Data Element Used For ScreeningCommon NameCASRN
115286 Chlorendic acid Cancer Studies, NTP NTPMSR Toxicity Category 1 Release (lbs/yr) 0
54593838 Chlorethoxyfos Lowest Observed Adverse Effect Level (LOAEL) 0.05 mg/kg-day Toxicity Category 2 Release (lbs/yr) 253,345
107200 Chloroacetaldehyde TD50 36.1 mg/kg-day Toxicity Category 2 FW/AW-Max Value (ug/L) 2.479049 Chloroacetyl chloride Lethal Dose 50 (LD50) 208 mg/kg Toxicity Category 3 Production Volume (lbs/year) >100M - 500M
510156 Chlorobenzilate Cancer Studies, NTP NTPMSR Toxicity Category 1 Release (lbs/yr) 5
75003 Chloroethane Cancer Studies, NTP NTPMSR Toxicity Category 2 FW/AW-Max Value (ug/L) 288.274873 Chloromethane (Methyl chloride) Reference Dose (RfD) 0.004 mg/kg-day Toxicity Category 3 FW/AW-Max Value (ug/L) 550
107302 Chloromethyl methyl ether Cancer Classification, EPA A Toxicity Category 1 Release (lbs/yr) 1,085 25167800 Chlorophenol No Observed Adverse Effect Level (NOAEL) 0.3 mg/kg-day Toxicity Category 2 Release (lbs/yr) 43,439
76062 Chloropicrin Lowest Observed Adverse Effect Level (LOAEL) 32 mg/kg-day Toxicity Category 4 Release (lbs/yr) 13,912,578 126998 Chloroprene Cancer Studies, NTP NTPMSR Toxicity Category 1 Release (lbs/yr) 925,010
1897456 Chlorothalonil Cancer Studies, NTP NTPMSR Toxicity Category 1 FW/AW-Max Value (ug/L) 0.71
104552 Cinnamaldehyde Lowest Observed Adverse Effect Level (LOAEL) 0.21 mg/kg-day Toxicity Category 2 Production Volume (lbs/year) >1M - 10M77929 Citric acid Maximum Recommended Daily Dose (MRDD) 100 mg/kg-day Toxicity Category 4 Production Volume (lbs/year) >100M - 500M
110429624 Clethodim Acceptable Daily Intake (ADI) 0.01 mg/kg-day Toxicity Category 3 Release (lbs/yr) 672,189 81777891 Clomazone Lethal Dose 50 (LD50) 1,369 mg/kg Toxicity Category 4 Release (lbs/yr) 2,536,701
7440484 Cobalt Lowest Observed Adverse Effect Level (LOAEL) 0.04 mg/kg-day Toxicity Category 2 FW/AW-Max Value (ug/L) 684Cobalt compounds Lethal Dose 50 (LD50) 150 mg/kg Toxicity Category 3 Release (lbs/yr) 6,910,811
91645 Coumarin TD50 13.9 mg/kg-day Toxicity Category 2 Production Volume (lbs/year) >1M - 10M1319773 Cresol Lowest Observed Adverse Effect Level (LOAEL) 177 mg/kg-day Toxicity Category 4 Release (lbs/yr) 1,475,929
15096523 Cryolite Lowest Observed Adverse Effect Level (LOAEL) 23.1 mg/kg-day Toxicity Category 4 Release (lbs/yr) 2,565,970 80159 Cumene hydroperoxide Lethal Dose 50 (LD50) 382 mg/kg Toxicity Category 3 Release (lbs/yr) 443,722
135206 Cupferron Cancer Studies, NTP NTPMSR Toxicity Category 1 Release (lbs/yr) 0
13752517 Cure-Rite 18 TD50 90.8 mg/kg-day Toxicity Category 2 Production Volume (lbs/year) >1M - 10M
21725462 Cyanazine Lowest Observed Adverse Effect Level (LOAEL) 0.98 mg/kg-day Toxicity Category 2 FW/AW-Max Value (ug/L) 160
506774 Cyanogen chloride Reference Dose (RfD) 0.05 mg/kg-day Toxicity Category 4 FW/AW-Max Value (ug/L) 20.6108805 Cyanuric acid No Observed Effect Level (NOEL) 600 mg/kg-day Toxicity Category 4 Production Volume (lbs/year) >100M - 500M108770 Cyanuric chloride Lethal Dose 50 (LD50) 350 mg/kg Toxicity Category 3 Production Volume (lbs/year) >100M - 500M
113136779 Cyclanilide Lethal Dose 50 (LD50) 208 mg/kg Toxicity Category 3 Release (lbs/yr) 177,474
110827 Cyclohexane Lethal Dose 50 (LD50) 813 mg/kg Toxicity Category 4 Release (lbs/yr) 4,761,999 108930 Cyclohexanol Lethal Dose 50 (LD50) 1,400 mg/kg Toxicity Category 4 Release (lbs/yr) 4,538,466 108941 Cyclohexanone No Observed Adverse Effect Level (NOAEL) 462 mg/kg-day Toxicity Category 4 Production Volume (lbs/year) > 1B108918 Cyclohexylamine Lethal Dose 50 (LD50) 11 mg/kg Toxicity Category 2 Production Volume (lbs/year) >10M - 50M
68359375 Cyfluthrin Reference Dose (RfD) 0.025 mg/kg-day Toxicity Category 3 Release (lbs/yr) 178,171
143545908 Cylindrospermopsin Reference Dose (RfD) 0.00003 mg/kg-day Toxicity Category 1 FW/AW Supplemental52315078 Cypermethrin Lethal Dose 50 (LD50) 24.6 mg/kg Toxicity Category 2 Release (lbs/yr) 188,403
66215278 Cyromazine No Observed Effect Level (NOEL) 0.75 mg/kg-day Toxicity Category 2 Release (lbs/yr) 14,328
1861321 Dacthal Reference Dose (RfD) 0.01 mg/kg-day Toxicity Category 3 FW/AW-Max Value (ug/L) 100
Dacthal mono/di-acid degradate Reference Dose (RfD) Parent data mg/kg-day Toxicity Category 3 FW/AW-Max Value (ug/L) 1901163195 Decabromodiphenyl ether Reference Dose (RfD) 0.01 mg/kg-day Toxicity Category 3 Release (lbs/yr) 953,472
541026 Decamethylcyclopentasiloxane Lethal Dose 50 (LD50) 24,134 mg/kg Toxicity Category 5 Production Volume (lbs/year) >100M - 500M6190654 Desethylatrazine Reference Dose (RfD) Parent data mg/kg-day Toxicity Category 2 FW/AW Parent
1007289 Desisopropylatrazine Reference Dose (RfD) Parent data mg/kg-day Toxicity Category 2 FW/AW Parent
50997 D-Glucose Maximum Recommended Daily Dose (MRDD) 100 mg/kg-day Toxicity Category 4 Production Volume (lbs/year) >500M - 1B
A2-6
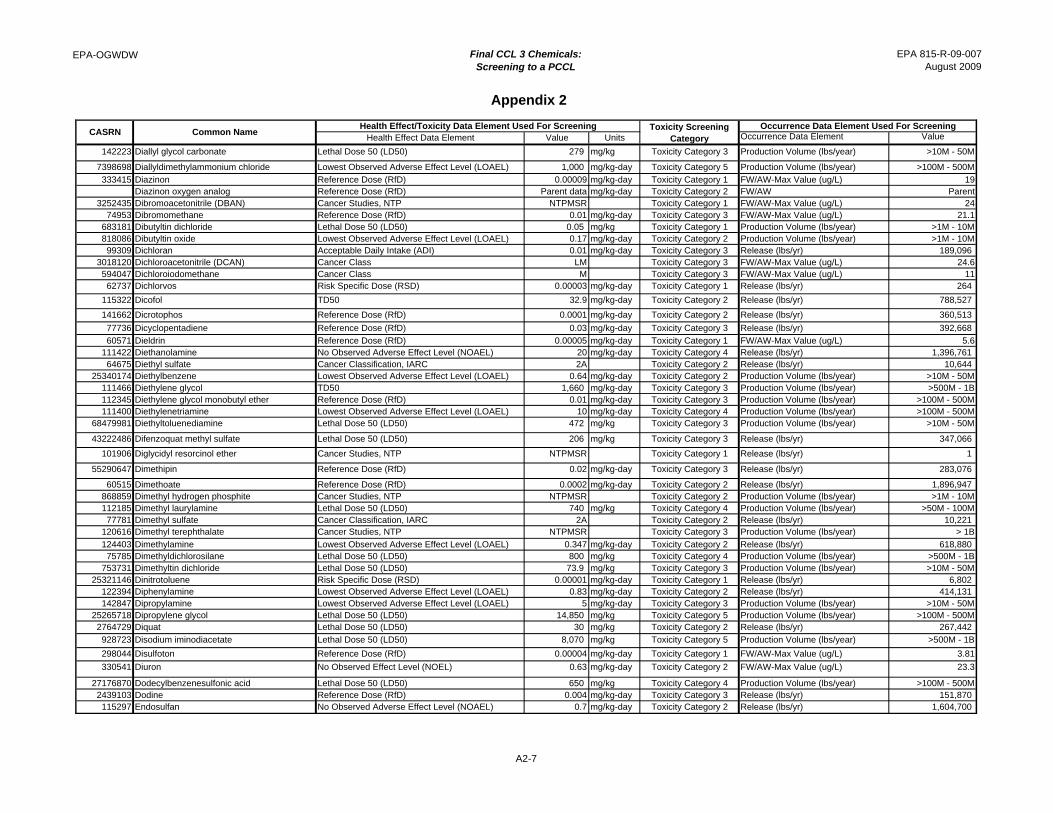
EPA-OGWDW Final CCL 3 Chemicals: Screening to a PCCL
Appendix 2
EPA 815-R-09-007August 2009
Health Effect Data Element Value Units Occurrence Data Element ValueToxicity Screening
Category
Occurrence Data Element Used For ScreeningHealth Effect/Toxicity Data Element Used For ScreeningCommon NameCASRN
142223 Diallyl glycol carbonate Lethal Dose 50 (LD50) 279 mg/kg Toxicity Category 3 Production Volume (lbs/year) >10M - 50M
7398698 Diallyldimethylammonium chloride Lowest Observed Adverse Effect Level (LOAEL) 1,000 mg/kg-day Toxicity Category 5 Production Volume (lbs/year) >100M - 500M
333415 Diazinon Reference Dose (RfD) 0.00009 mg/kg-day Toxicity Category 1 FW/AW-Max Value (ug/L) 19Diazinon oxygen analog Reference Dose (RfD) Parent data mg/kg-day Toxicity Category 2 FW/AW Parent
3252435 Dibromoacetonitrile (DBAN) Cancer Studies, NTP NTPMSR Toxicity Category 1 FW/AW-Max Value (ug/L) 2474953 Dibromomethane Reference Dose (RfD) 0.01 mg/kg-day Toxicity Category 3 FW/AW-Max Value (ug/L) 21.1
683181 Dibutyltin dichloride Lethal Dose 50 (LD50) 0.05 mg/kg Toxicity Category 1 Production Volume (lbs/year) >1M - 10M818086 Dibutyltin oxide Lowest Observed Adverse Effect Level (LOAEL) 0.17 mg/kg-day Toxicity Category 2 Production Volume (lbs/year) >1M - 10M99309 Dichloran Acceptable Daily Intake (ADI) 0.01 mg/kg-day Toxicity Category 3 Release (lbs/yr) 189,096
3018120 Dichloroacetonitrile (DCAN) Cancer Class LM Toxicity Category 3 FW/AW-Max Value (ug/L) 24.6594047 Dichloroiodomethane Cancer Class M Toxicity Category 3 FW/AW-Max Value (ug/L) 1162737 Dichlorvos Risk Specific Dose (RSD) 0.00003 mg/kg-day Toxicity Category 1 Release (lbs/yr) 264
115322 Dicofol TD50 32.9 mg/kg-day Toxicity Category 2 Release (lbs/yr) 788,527
141662 Dicrotophos Reference Dose (RfD) 0.0001 mg/kg-day Toxicity Category 2 Release (lbs/yr) 360,513
77736 Dicyclopentadiene Reference Dose (RfD) 0.03 mg/kg-day Toxicity Category 3 Release (lbs/yr) 392,668
60571 Dieldrin Reference Dose (RfD) 0.00005 mg/kg-day Toxicity Category 1 FW/AW-Max Value (ug/L) 5.6111422 Diethanolamine No Observed Adverse Effect Level (NOAEL) 20 mg/kg-day Toxicity Category 4 Release (lbs/yr) 1,396,761 64675 Diethyl sulfate Cancer Classification, IARC 2A Toxicity Category 2 Release (lbs/yr) 10,644
25340174 Diethylbenzene Lowest Observed Adverse Effect Level (LOAEL) 0.64 mg/kg-day Toxicity Category 2 Production Volume (lbs/year) >10M - 50M111466 Diethylene glycol TD50 1,660 mg/kg-day Toxicity Category 3 Production Volume (lbs/year) >500M - 1B112345 Diethylene glycol monobutyl ether Reference Dose (RfD) 0.01 mg/kg-day Toxicity Category 3 Production Volume (lbs/year) >100M - 500M111400 Diethylenetriamine Lowest Observed Adverse Effect Level (LOAEL) 10 mg/kg-day Toxicity Category 4 Production Volume (lbs/year) >100M - 500M
68479981 Diethyltoluenediamine Lethal Dose 50 (LD50) 472 mg/kg Toxicity Category 3 Production Volume (lbs/year) >10M - 50M
43222486 Difenzoquat methyl sulfate Lethal Dose 50 (LD50) 206 mg/kg Toxicity Category 3 Release (lbs/yr) 347,066
101906 Diglycidyl resorcinol ether Cancer Studies, NTP NTPMSR Toxicity Category 1 Release (lbs/yr) 1
55290647 Dimethipin Reference Dose (RfD) 0.02 mg/kg-day Toxicity Category 3 Release (lbs/yr) 283,076
60515 Dimethoate Reference Dose (RfD) 0.0002 mg/kg-day Toxicity Category 2 Release (lbs/yr) 1,896,947 868859 Dimethyl hydrogen phosphite Cancer Studies, NTP NTPMSR Toxicity Category 2 Production Volume (lbs/year) >1M - 10M112185 Dimethyl laurylamine Lethal Dose 50 (LD50) 740 mg/kg Toxicity Category 4 Production Volume (lbs/year) >50M - 100M77781 Dimethyl sulfate Cancer Classification, IARC 2A Toxicity Category 2 Release (lbs/yr) 10,221
120616 Dimethyl terephthalate Cancer Studies, NTP NTPMSR Toxicity Category 3 Production Volume (lbs/year) > 1B
124403 Dimethylamine Lowest Observed Adverse Effect Level (LOAEL) 0.347 mg/kg-day Toxicity Category 2 Release (lbs/yr) 618,880 75785 Dimethyldichlorosilane Lethal Dose 50 (LD50) 800 mg/kg Toxicity Category 4 Production Volume (lbs/year) >500M - 1B
753731 Dimethyltin dichloride Lethal Dose 50 (LD50) 73.9 mg/kg Toxicity Category 3 Production Volume (lbs/year) >10M - 50M25321146 Dinitrotoluene Risk Specific Dose (RSD) 0.00001 mg/kg-day Toxicity Category 1 Release (lbs/yr) 6,802
122394 Diphenylamine Lowest Observed Adverse Effect Level (LOAEL) 0.83 mg/kg-day Toxicity Category 2 Release (lbs/yr) 414,131 142847 Dipropylamine Lowest Observed Adverse Effect Level (LOAEL) 5 mg/kg-day Toxicity Category 3 Production Volume (lbs/year) >10M - 50M
25265718 Dipropylene glycol Lethal Dose 50 (LD50) 14,850 mg/kg Toxicity Category 5 Production Volume (lbs/year) >100M - 500M2764729 Diquat Lethal Dose 50 (LD50) 30 mg/kg Toxicity Category 2 Release (lbs/yr) 267,442
928723 Disodium iminodiacetate Lethal Dose 50 (LD50) 8,070 mg/kg Toxicity Category 5 Production Volume (lbs/year) >500M - 1B
298044 Disulfoton Reference Dose (RfD) 0.00004 mg/kg-day Toxicity Category 1 FW/AW-Max Value (ug/L) 3.81
330541 Diuron No Observed Effect Level (NOEL) 0.63 mg/kg-day Toxicity Category 2 FW/AW-Max Value (ug/L) 23.3
27176870 Dodecylbenzenesulfonic acid Lethal Dose 50 (LD50) 650 mg/kg Toxicity Category 4 Production Volume (lbs/year) >100M - 500M2439103 Dodine Reference Dose (RfD) 0.004 mg/kg-day Toxicity Category 3 Release (lbs/yr) 151,870 115297 Endosulfan No Observed Adverse Effect Level (NOAEL) 0.7 mg/kg-day Toxicity Category 2 Release (lbs/yr) 1,604,700
A2-7
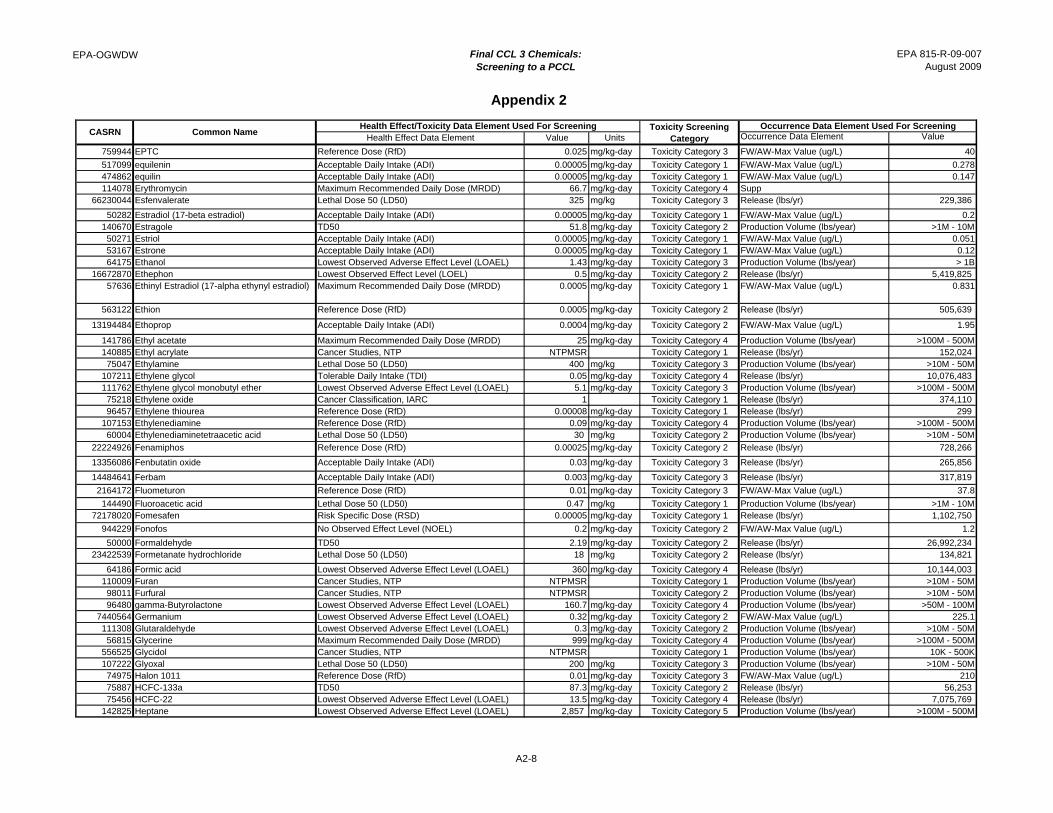
EPA-OGWDW Final CCL 3 Chemicals: Screening to a PCCL
Appendix 2
EPA 815-R-09-007August 2009
Health Effect Data Element Value Units Occurrence Data Element ValueToxicity Screening
Category
Occurrence Data Element Used For ScreeningHealth Effect/Toxicity Data Element Used For ScreeningCommon NameCASRN
759944 EPTC Reference Dose (RfD) 0.025 mg/kg-day Toxicity Category 3 FW/AW-Max Value (ug/L) 40
517099 equilenin Acceptable Daily Intake (ADI) 0.00005 mg/kg-day Toxicity Category 1 FW/AW-Max Value (ug/L) 0.278474862 equilin Acceptable Daily Intake (ADI) 0.00005 mg/kg-day Toxicity Category 1 FW/AW-Max Value (ug/L) 0.147114078 Erythromycin Maximum Recommended Daily Dose (MRDD) 66.7 mg/kg-day Toxicity Category 4 Supp
66230044 Esfenvalerate Lethal Dose 50 (LD50) 325 mg/kg Toxicity Category 3 Release (lbs/yr) 229,386
50282 Estradiol (17-beta estradiol) Acceptable Daily Intake (ADI) 0.00005 mg/kg-day Toxicity Category 1 FW/AW-Max Value (ug/L) 0.2140670 Estragole TD50 51.8 mg/kg-day Toxicity Category 2 Production Volume (lbs/year) >1M - 10M50271 Estriol Acceptable Daily Intake (ADI) 0.00005 mg/kg-day Toxicity Category 1 FW/AW-Max Value (ug/L) 0.05153167 Estrone Acceptable Daily Intake (ADI) 0.00005 mg/kg-day Toxicity Category 1 FW/AW-Max Value (ug/L) 0.1264175 Ethanol Lowest Observed Adverse Effect Level (LOAEL) 1.43 mg/kg-day Toxicity Category 3 Production Volume (lbs/year) > 1B
16672870 Ethephon Lowest Observed Effect Level (LOEL) 0.5 mg/kg-day Toxicity Category 2 Release (lbs/yr) 5,419,825 57636 Ethinyl Estradiol (17-alpha ethynyl estradiol) Maximum Recommended Daily Dose (MRDD) 0.0005 mg/kg-day Toxicity Category 1 FW/AW-Max Value (ug/L) 0.831
563122 Ethion Reference Dose (RfD) 0.0005 mg/kg-day Toxicity Category 2 Release (lbs/yr) 505,639
13194484 Ethoprop Acceptable Daily Intake (ADI) 0.0004 mg/kg-day Toxicity Category 2 FW/AW-Max Value (ug/L) 1.95
141786 Ethyl acetate Maximum Recommended Daily Dose (MRDD) 25 mg/kg-day Toxicity Category 4 Production Volume (lbs/year) >100M - 500M140885 Ethyl acrylate Cancer Studies, NTP NTPMSR Toxicity Category 1 Release (lbs/yr) 152,024 75047 Ethylamine Lethal Dose 50 (LD50) 400 mg/kg Toxicity Category 3 Production Volume (lbs/year) >10M - 50M
107211 Ethylene glycol Tolerable Daily Intake (TDI) 0.05 mg/kg-day Toxicity Category 4 Release (lbs/yr) 10,076,483 111762 Ethylene glycol monobutyl ether Lowest Observed Adverse Effect Level (LOAEL) 5.1 mg/kg-day Toxicity Category 3 Production Volume (lbs/year) >100M - 500M75218 Ethylene oxide Cancer Classification, IARC 1 Toxicity Category 1 Release (lbs/yr) 374,110 96457 Ethylene thiourea Reference Dose (RfD) 0.00008 mg/kg-day Toxicity Category 1 Release (lbs/yr) 299
107153 Ethylenediamine Reference Dose (RfD) 0.09 mg/kg-day Toxicity Category 4 Production Volume (lbs/year) >100M - 500M60004 Ethylenediaminetetraacetic acid Lethal Dose 50 (LD50) 30 mg/kg Toxicity Category 2 Production Volume (lbs/year) >10M - 50M
22224926 Fenamiphos Reference Dose (RfD) 0.00025 mg/kg-day Toxicity Category 2 Release (lbs/yr) 728,266
13356086 Fenbutatin oxide Acceptable Daily Intake (ADI) 0.03 mg/kg-day Toxicity Category 3 Release (lbs/yr) 265,856
14484641 Ferbam Acceptable Daily Intake (ADI) 0.003 mg/kg-day Toxicity Category 3 Release (lbs/yr) 317,819
2164172 Fluometuron Reference Dose (RfD) 0.01 mg/kg-day Toxicity Category 3 FW/AW-Max Value (ug/L) 37.8
144490 Fluoroacetic acid Lethal Dose 50 (LD50) 0.47 mg/kg Toxicity Category 1 Production Volume (lbs/year) >1M - 10M72178020 Fomesafen Risk Specific Dose (RSD) 0.00005 mg/kg-day Toxicity Category 1 Release (lbs/yr) 1,102,750
944229 Fonofos No Observed Effect Level (NOEL) 0.2 mg/kg-day Toxicity Category 2 FW/AW-Max Value (ug/L) 1.2
50000 Formaldehyde TD50 2.19 mg/kg-day Toxicity Category 2 Release (lbs/yr) 26,992,234 23422539 Formetanate hydrochloride Lethal Dose 50 (LD50) 18 mg/kg Toxicity Category 2 Release (lbs/yr) 134,821
64186 Formic acid Lowest Observed Adverse Effect Level (LOAEL) 360 mg/kg-day Toxicity Category 4 Release (lbs/yr) 10,144,003 110009 Furan Cancer Studies, NTP NTPMSR Toxicity Category 1 Production Volume (lbs/year) >10M - 50M98011 Furfural Cancer Studies, NTP NTPMSR Toxicity Category 2 Production Volume (lbs/year) >10M - 50M96480 gamma-Butyrolactone Lowest Observed Adverse Effect Level (LOAEL) 160.7 mg/kg-day Toxicity Category 4 Production Volume (lbs/year) >50M - 100M
7440564 Germanium Lowest Observed Adverse Effect Level (LOAEL) 0.32 mg/kg-day Toxicity Category 2 FW/AW-Max Value (ug/L) 225.1111308 Glutaraldehyde Lowest Observed Adverse Effect Level (LOAEL) 0.3 mg/kg-day Toxicity Category 2 Production Volume (lbs/year) >10M - 50M56815 Glycerine Maximum Recommended Daily Dose (MRDD) 999 mg/kg-day Toxicity Category 4 Production Volume (lbs/year) >100M - 500M
556525 Glycidol Cancer Studies, NTP NTPMSR Toxicity Category 1 Production Volume (lbs/year) 10K - 500K107222 Glyoxal Lethal Dose 50 (LD50) 200 mg/kg Toxicity Category 3 Production Volume (lbs/year) >10M - 50M74975 Halon 1011 Reference Dose (RfD) 0.01 mg/kg-day Toxicity Category 3 FW/AW-Max Value (ug/L) 21075887 HCFC-133a TD50 87.3 mg/kg-day Toxicity Category 2 Release (lbs/yr) 56,253 75456 HCFC-22 Lowest Observed Adverse Effect Level (LOAEL) 13.5 mg/kg-day Toxicity Category 4 Release (lbs/yr) 7,075,769
142825 Heptane Lowest Observed Adverse Effect Level (LOAEL) 2,857 mg/kg-day Toxicity Category 5 Production Volume (lbs/year) >100M - 500M
A2-8
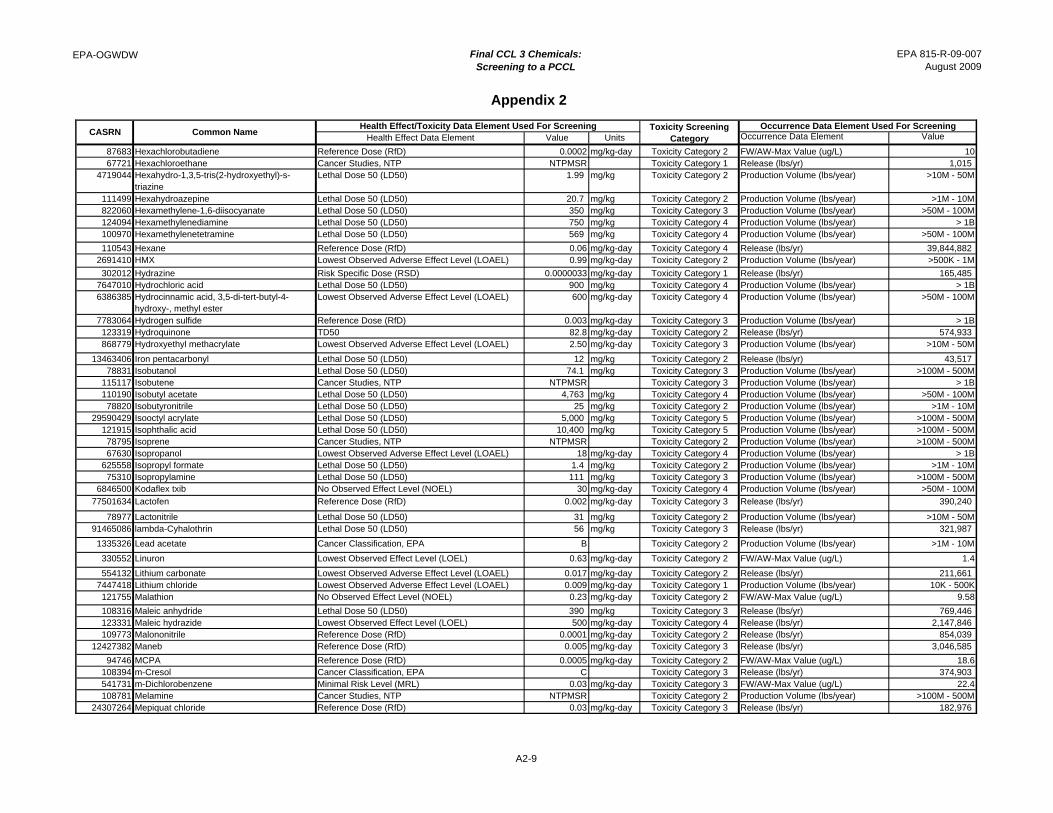
EPA-OGWDW Final CCL 3 Chemicals: Screening to a PCCL
Appendix 2
EPA 815-R-09-007August 2009
Health Effect Data Element Value Units Occurrence Data Element ValueToxicity Screening
Category
Occurrence Data Element Used For ScreeningHealth Effect/Toxicity Data Element Used For ScreeningCommon NameCASRN
87683 Hexachlorobutadiene Reference Dose (RfD) 0.0002 mg/kg-day Toxicity Category 2 FW/AW-Max Value (ug/L) 1067721 Hexachloroethane Cancer Studies, NTP NTPMSR Toxicity Category 1 Release (lbs/yr) 1,015
4719044 Hexahydro-1,3,5-tris(2-hydroxyethyl)-s-triazine
Lethal Dose 50 (LD50) 1.99 mg/kg Toxicity Category 2 Production Volume (lbs/year) >10M - 50M
111499 Hexahydroazepine Lethal Dose 50 (LD50) 20.7 mg/kg Toxicity Category 2 Production Volume (lbs/year) >1M - 10M822060 Hexamethylene-1,6-diisocyanate Lethal Dose 50 (LD50) 350 mg/kg Toxicity Category 3 Production Volume (lbs/year) >50M - 100M124094 Hexamethylenediamine Lethal Dose 50 (LD50) 750 mg/kg Toxicity Category 4 Production Volume (lbs/year) > 1B100970 Hexamethylenetetramine Lethal Dose 50 (LD50) 569 mg/kg Toxicity Category 4 Production Volume (lbs/year) >50M - 100M
110543 Hexane Reference Dose (RfD) 0.06 mg/kg-day Toxicity Category 4 Release (lbs/yr) 39,844,882 2691410 HMX Lowest Observed Adverse Effect Level (LOAEL) 0.99 mg/kg-day Toxicity Category 2 Production Volume (lbs/year) >500K - 1M
302012 Hydrazine Risk Specific Dose (RSD) 0.0000033 mg/kg-day Toxicity Category 1 Release (lbs/yr) 165,485 7647010 Hydrochloric acid Lethal Dose 50 (LD50) 900 mg/kg Toxicity Category 4 Production Volume (lbs/year) > 1B6386385 Hydrocinnamic acid, 3,5-di-tert-butyl-4-
hydroxy-, methyl esterLowest Observed Adverse Effect Level (LOAEL) 600 mg/kg-day Toxicity Category 4 Production Volume (lbs/year) >50M - 100M
7783064 Hydrogen sulfide Reference Dose (RfD) 0.003 mg/kg-day Toxicity Category 3 Production Volume (lbs/year) > 1B123319 Hydroquinone TD50 82.8 mg/kg-day Toxicity Category 2 Release (lbs/yr) 574,933 868779 Hydroxyethyl methacrylate Lowest Observed Adverse Effect Level (LOAEL) 2.50 mg/kg-day Toxicity Category 3 Production Volume (lbs/year) >10M - 50M
13463406 Iron pentacarbonyl Lethal Dose 50 (LD50) 12 mg/kg Toxicity Category 2 Release (lbs/yr) 43,517 78831 Isobutanol Lethal Dose 50 (LD50) 74.1 mg/kg Toxicity Category 3 Production Volume (lbs/year) >100M - 500M
115117 Isobutene Cancer Studies, NTP NTPMSR Toxicity Category 3 Production Volume (lbs/year) > 1B110190 Isobutyl acetate Lethal Dose 50 (LD50) 4,763 mg/kg Toxicity Category 4 Production Volume (lbs/year) >50M - 100M78820 Isobutyronitrile Lethal Dose 50 (LD50) 25 mg/kg Toxicity Category 2 Production Volume (lbs/year) >1M - 10M
29590429 Isooctyl acrylate Lethal Dose 50 (LD50) 5,000 mg/kg Toxicity Category 5 Production Volume (lbs/year) >100M - 500M121915 Isophthalic acid Lethal Dose 50 (LD50) 10,400 mg/kg Toxicity Category 5 Production Volume (lbs/year) >100M - 500M78795 Isoprene Cancer Studies, NTP NTPMSR Toxicity Category 2 Production Volume (lbs/year) >100M - 500M67630 Isopropanol Lowest Observed Adverse Effect Level (LOAEL) 18 mg/kg-day Toxicity Category 4 Production Volume (lbs/year) > 1B
625558 Isopropyl formate Lethal Dose 50 (LD50) 1.4 mg/kg Toxicity Category 2 Production Volume (lbs/year) >1M - 10M75310 Isopropylamine Lethal Dose 50 (LD50) 111 mg/kg Toxicity Category 3 Production Volume (lbs/year) >100M - 500M
6846500 Kodaflex txib No Observed Effect Level (NOEL) 30 mg/kg-day Toxicity Category 4 Production Volume (lbs/year) >50M - 100M
77501634 Lactofen Reference Dose (RfD) 0.002 mg/kg-day Toxicity Category 3 Release (lbs/yr) 390,240
78977 Lactonitrile Lethal Dose 50 (LD50) 31 mg/kg Toxicity Category 2 Production Volume (lbs/year) >10M - 50M91465086 lambda-Cyhalothrin Lethal Dose 50 (LD50) 56 mg/kg Toxicity Category 3 Release (lbs/yr) 321,987
1335326 Lead acetate Cancer Classification, EPA B Toxicity Category 2 Production Volume (lbs/year) >1M - 10M
330552 Linuron Lowest Observed Effect Level (LOEL) 0.63 mg/kg-day Toxicity Category 2 FW/AW-Max Value (ug/L) 1.4
554132 Lithium carbonate Lowest Observed Adverse Effect Level (LOAEL) 0.017 mg/kg-day Toxicity Category 2 Release (lbs/yr) 211,661 7447418 Lithium chloride Lowest Observed Adverse Effect Level (LOAEL) 0.009 mg/kg-day Toxicity Category 1 Production Volume (lbs/year) 10K - 500K121755 Malathion No Observed Effect Level (NOEL) 0.23 mg/kg-day Toxicity Category 2 FW/AW-Max Value (ug/L) 9.58
108316 Maleic anhydride Lethal Dose 50 (LD50) 390 mg/kg Toxicity Category 3 Release (lbs/yr) 769,446 123331 Maleic hydrazide Lowest Observed Effect Level (LOEL) 500 mg/kg-day Toxicity Category 4 Release (lbs/yr) 2,147,846 109773 Malononitrile Reference Dose (RfD) 0.0001 mg/kg-day Toxicity Category 2 Release (lbs/yr) 854,039
12427382 Maneb Reference Dose (RfD) 0.005 mg/kg-day Toxicity Category 3 Release (lbs/yr) 3,046,585
94746 MCPA Reference Dose (RfD) 0.0005 mg/kg-day Toxicity Category 2 FW/AW-Max Value (ug/L) 18.6108394 m-Cresol Cancer Classification, EPA C Toxicity Category 3 Release (lbs/yr) 374,903 541731 m-Dichlorobenzene Minimal Risk Level (MRL) 0.03 mg/kg-day Toxicity Category 3 FW/AW-Max Value (ug/L) 22.4108781 Melamine Cancer Studies, NTP NTPMSR Toxicity Category 2 Production Volume (lbs/year) >100M - 500M
24307264 Mepiquat chloride Reference Dose (RfD) 0.03 mg/kg-day Toxicity Category 3 Release (lbs/yr) 182,976
A2-9
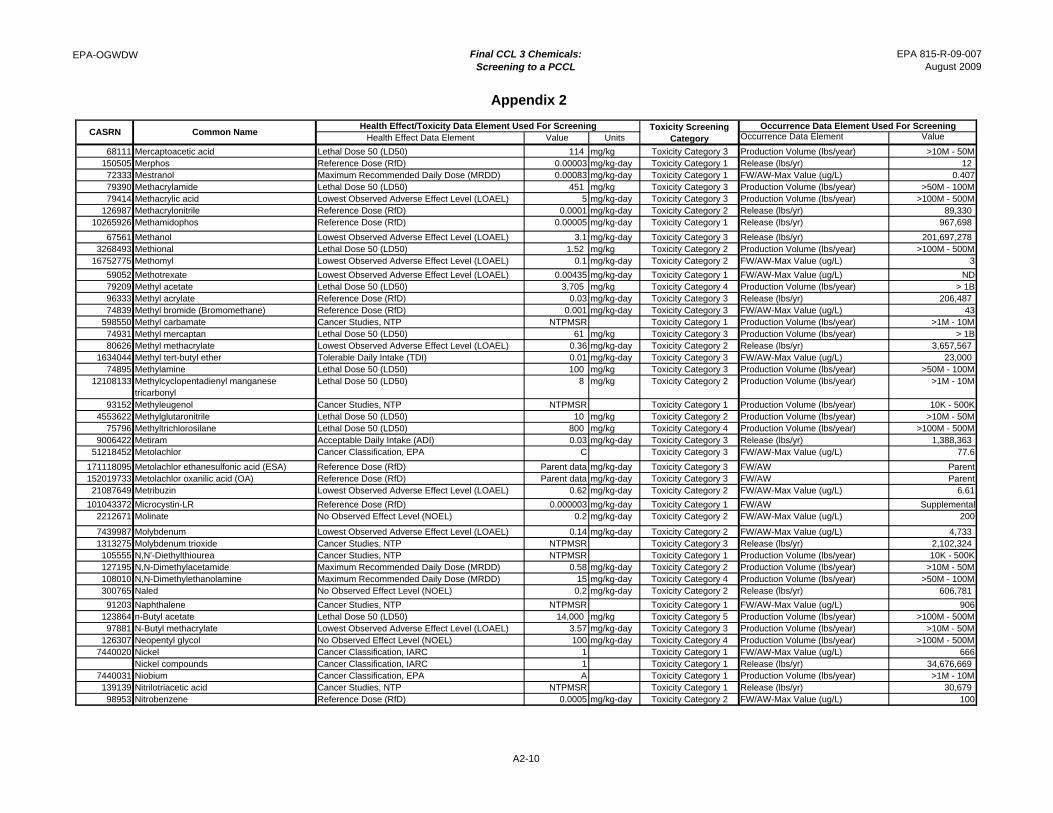
EPA-OGWDW Final CCL 3 Chemicals: Screening to a PCCL
Appendix 2
EPA 815-R-09-007August 2009
Health Effect Data Element Value Units Occurrence Data Element ValueToxicity Screening
Category
Occurrence Data Element Used For ScreeningHealth Effect/Toxicity Data Element Used For ScreeningCommon NameCASRN
68111 Mercaptoacetic acid Lethal Dose 50 (LD50) 114 mg/kg Toxicity Category 3 Production Volume (lbs/year) >10M - 50M150505 Merphos Reference Dose (RfD) 0.00003 mg/kg-day Toxicity Category 1 Release (lbs/yr) 12
72333 Mestranol Maximum Recommended Daily Dose (MRDD) 0.00083 mg/kg-day Toxicity Category 1 FW/AW-Max Value (ug/L) 0.40779390 Methacrylamide Lethal Dose 50 (LD50) 451 mg/kg Toxicity Category 3 Production Volume (lbs/year) >50M - 100M79414 Methacrylic acid Lowest Observed Adverse Effect Level (LOAEL) 5 mg/kg-day Toxicity Category 3 Production Volume (lbs/year) >100M - 500M
126987 Methacrylonitrile Reference Dose (RfD) 0.0001 mg/kg-day Toxicity Category 2 Release (lbs/yr) 89,330 10265926 Methamidophos Reference Dose (RfD) 0.00005 mg/kg-day Toxicity Category 1 Release (lbs/yr) 967,698
67561 Methanol Lowest Observed Adverse Effect Level (LOAEL) 3.1 mg/kg-day Toxicity Category 3 Release (lbs/yr) 201,697,278 3268493 Methional Lethal Dose 50 (LD50) 1.52 mg/kg Toxicity Category 2 Production Volume (lbs/year) >100M - 500M
16752775 Methomyl Lowest Observed Adverse Effect Level (LOAEL) 0.1 mg/kg-day Toxicity Category 2 FW/AW-Max Value (ug/L) 3
59052 Methotrexate Lowest Observed Adverse Effect Level (LOAEL) 0.00435 mg/kg-day Toxicity Category 1 FW/AW-Max Value (ug/L) ND79209 Methyl acetate Lethal Dose 50 (LD50) 3,705 mg/kg Toxicity Category 4 Production Volume (lbs/year) > 1B96333 Methyl acrylate Reference Dose (RfD) 0.03 mg/kg-day Toxicity Category 3 Release (lbs/yr) 206,487 74839 Methyl bromide (Bromomethane) Reference Dose (RfD) 0.001 mg/kg-day Toxicity Category 3 FW/AW-Max Value (ug/L) 43
598550 Methyl carbamate Cancer Studies, NTP NTPMSR Toxicity Category 1 Production Volume (lbs/year) >1M - 10M74931 Methyl mercaptan Lethal Dose 50 (LD50) 61 mg/kg Toxicity Category 3 Production Volume (lbs/year) > 1B80626 Methyl methacrylate Lowest Observed Adverse Effect Level (LOAEL) 0.36 mg/kg-day Toxicity Category 2 Release (lbs/yr) 3,657,567
1634044 Methyl tert-butyl ether Tolerable Daily Intake (TDI) 0.01 mg/kg-day Toxicity Category 3 FW/AW-Max Value (ug/L) 23,000 74895 Methylamine Lethal Dose 50 (LD50) 100 mg/kg Toxicity Category 3 Production Volume (lbs/year) >50M - 100M
12108133 Methylcyclopentadienyl manganese tricarbonyl
Lethal Dose 50 (LD50) 8 mg/kg Toxicity Category 2 Production Volume (lbs/year) >1M - 10M
93152 Methyleugenol Cancer Studies, NTP NTPMSR Toxicity Category 1 Production Volume (lbs/year) 10K - 500K4553622 Methylglutaronitrile Lethal Dose 50 (LD50) 10 mg/kg Toxicity Category 2 Production Volume (lbs/year) >10M - 50M
75796 Methyltrichlorosilane Lethal Dose 50 (LD50) 800 mg/kg Toxicity Category 4 Production Volume (lbs/year) >100M - 500M9006422 Metiram Acceptable Daily Intake (ADI) 0.03 mg/kg-day Toxicity Category 3 Release (lbs/yr) 1,388,363
51218452 Metolachlor Cancer Classification, EPA C Toxicity Category 3 FW/AW-Max Value (ug/L) 77.6
171118095 Metolachlor ethanesulfonic acid (ESA) Reference Dose (RfD) Parent data mg/kg-day Toxicity Category 3 FW/AW Parent152019733 Metolachlor oxanilic acid (OA) Reference Dose (RfD) Parent data mg/kg-day Toxicity Category 3 FW/AW Parent21087649 Metribuzin Lowest Observed Adverse Effect Level (LOAEL) 0.62 mg/kg-day Toxicity Category 2 FW/AW-Max Value (ug/L) 6.61
101043372 Microcystin-LR Reference Dose (RfD) 0.000003 mg/kg-day Toxicity Category 1 FW/AW Supplemental2212671 Molinate No Observed Effect Level (NOEL) 0.2 mg/kg-day Toxicity Category 2 FW/AW-Max Value (ug/L) 200
7439987 Molybdenum Lowest Observed Adverse Effect Level (LOAEL) 0.14 mg/kg-day Toxicity Category 2 FW/AW-Max Value (ug/L) 4,733 1313275 Molybdenum trioxide Cancer Studies, NTP NTPMSR Toxicity Category 3 Release (lbs/yr) 2,102,324 105555 N,N'-Diethylthiourea Cancer Studies, NTP NTPMSR Toxicity Category 1 Production Volume (lbs/year) 10K - 500K127195 N,N-Dimethylacetamide Maximum Recommended Daily Dose (MRDD) 0.58 mg/kg-day Toxicity Category 2 Production Volume (lbs/year) >10M - 50M108010 N,N-Dimethylethanolamine Maximum Recommended Daily Dose (MRDD) 15 mg/kg-day Toxicity Category 4 Production Volume (lbs/year) >50M - 100M300765 Naled No Observed Effect Level (NOEL) 0.2 mg/kg-day Toxicity Category 2 Release (lbs/yr) 606,781
91203 Naphthalene Cancer Studies, NTP NTPMSR Toxicity Category 1 FW/AW-Max Value (ug/L) 906123864 n-Butyl acetate Lethal Dose 50 (LD50) 14,000 mg/kg Toxicity Category 5 Production Volume (lbs/year) >100M - 500M97881 N-Butyl methacrylate Lowest Observed Adverse Effect Level (LOAEL) 3.57 mg/kg-day Toxicity Category 3 Production Volume (lbs/year) >10M - 50M
126307 Neopentyl glycol No Observed Effect Level (NOEL) 100 mg/kg-day Toxicity Category 4 Production Volume (lbs/year) >100M - 500M7440020 Nickel Cancer Classification, IARC 1 Toxicity Category 1 FW/AW-Max Value (ug/L) 666
Nickel compounds Cancer Classification, IARC 1 Toxicity Category 1 Release (lbs/yr) 34,676,669 7440031 Niobium Cancer Classification, EPA A Toxicity Category 1 Production Volume (lbs/year) >1M - 10M139139 Nitrilotriacetic acid Cancer Studies, NTP NTPMSR Toxicity Category 1 Release (lbs/yr) 30,679 98953 Nitrobenzene Reference Dose (RfD) 0.0005 mg/kg-day Toxicity Category 2 FW/AW-Max Value (ug/L) 100
A2-10
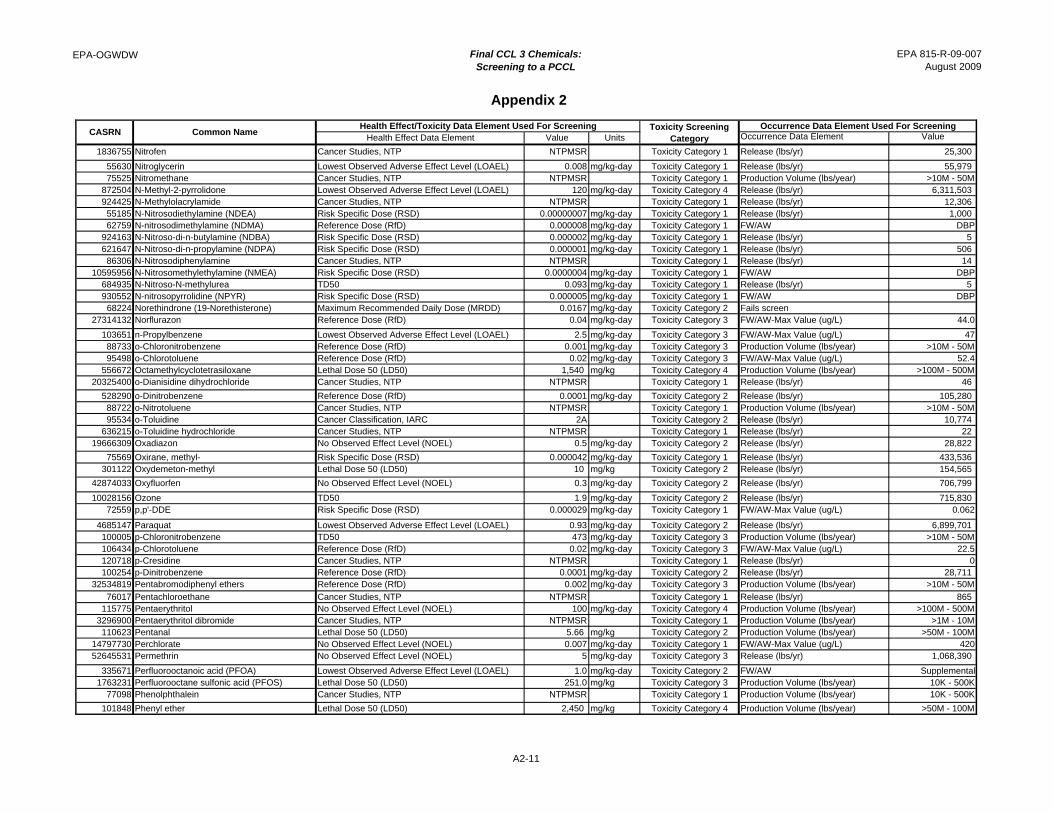
EPA-OGWDW Final CCL 3 Chemicals: Screening to a PCCL
Appendix 2
EPA 815-R-09-007August 2009
Health Effect Data Element Value Units Occurrence Data Element ValueToxicity Screening
Category
Occurrence Data Element Used For ScreeningHealth Effect/Toxicity Data Element Used For ScreeningCommon NameCASRN
1836755 Nitrofen Cancer Studies, NTP NTPMSR Toxicity Category 1 Release (lbs/yr) 25,300
55630 Nitroglycerin Lowest Observed Adverse Effect Level (LOAEL) 0.008 mg/kg-day Toxicity Category 1 Release (lbs/yr) 55,979 75525 Nitromethane Cancer Studies, NTP NTPMSR Toxicity Category 1 Production Volume (lbs/year) >10M - 50M
872504 N-Methyl-2-pyrrolidone Lowest Observed Adverse Effect Level (LOAEL) 120 mg/kg-day Toxicity Category 4 Release (lbs/yr) 6,311,503 924425 N-Methylolacrylamide Cancer Studies, NTP NTPMSR Toxicity Category 1 Release (lbs/yr) 12,306 55185 N-Nitrosodiethylamine (NDEA) Risk Specific Dose (RSD) 0.00000007 mg/kg-day Toxicity Category 1 Release (lbs/yr) 1,000 62759 N-nitrosodimethylamine (NDMA) Reference Dose (RfD) 0.000008 mg/kg-day Toxicity Category 1 FW/AW DBP
924163 N-Nitroso-di-n-butylamine (NDBA) Risk Specific Dose (RSD) 0.000002 mg/kg-day Toxicity Category 1 Release (lbs/yr) 5 621647 N-Nitroso-di-n-propylamine (NDPA) Risk Specific Dose (RSD) 0.000001 mg/kg-day Toxicity Category 1 Release (lbs/yr) 506 86306 N-Nitrosodiphenylamine Cancer Studies, NTP NTPMSR Toxicity Category 1 Release (lbs/yr) 14
10595956 N-Nitrosomethylethylamine (NMEA) Risk Specific Dose (RSD) 0.0000004 mg/kg-day Toxicity Category 1 FW/AW DBP684935 N-Nitroso-N-methylurea TD50 0.093 mg/kg-day Toxicity Category 1 Release (lbs/yr) 5 930552 N-nitrosopyrrolidine (NPYR) Risk Specific Dose (RSD) 0.000005 mg/kg-day Toxicity Category 1 FW/AW DBP
68224 Norethindrone (19-Norethisterone) Maximum Recommended Daily Dose (MRDD) 0.0167 mg/kg-day Toxicity Category 2 Fails screen27314132 Norflurazon Reference Dose (RfD) 0.04 mg/kg-day Toxicity Category 3 FW/AW-Max Value (ug/L) 44.0
103651 n-Propylbenzene Lowest Observed Adverse Effect Level (LOAEL) 2.5 mg/kg-day Toxicity Category 3 FW/AW-Max Value (ug/L) 4788733 o-Chloronitrobenzene Reference Dose (RfD) 0.001 mg/kg-day Toxicity Category 3 Production Volume (lbs/year) >10M - 50M95498 o-Chlorotoluene Reference Dose (RfD) 0.02 mg/kg-day Toxicity Category 3 FW/AW-Max Value (ug/L) 52.4
556672 Octamethylcyclotetrasiloxane Lethal Dose 50 (LD50) 1,540 mg/kg Toxicity Category 4 Production Volume (lbs/year) >100M - 500M20325400 o-Dianisidine dihydrochloride Cancer Studies, NTP NTPMSR Toxicity Category 1 Release (lbs/yr) 46
528290 o-Dinitrobenzene Reference Dose (RfD) 0.0001 mg/kg-day Toxicity Category 2 Release (lbs/yr) 105,280 88722 o-Nitrotoluene Cancer Studies, NTP NTPMSR Toxicity Category 1 Production Volume (lbs/year) >10M - 50M95534 o-Toluidine Cancer Classification, IARC 2A Toxicity Category 2 Release (lbs/yr) 10,774
636215 o-Toluidine hydrochloride Cancer Studies, NTP NTPMSR Toxicity Category 1 Release (lbs/yr) 22 19666309 Oxadiazon No Observed Effect Level (NOEL) 0.5 mg/kg-day Toxicity Category 2 Release (lbs/yr) 28,822
75569 Oxirane, methyl- Risk Specific Dose (RSD) 0.000042 mg/kg-day Toxicity Category 1 Release (lbs/yr) 433,536 301122 Oxydemeton-methyl Lethal Dose 50 (LD50) 10 mg/kg Toxicity Category 2 Release (lbs/yr) 154,565
42874033 Oxyfluorfen No Observed Effect Level (NOEL) 0.3 mg/kg-day Toxicity Category 2 Release (lbs/yr) 706,799
10028156 Ozone TD50 1.9 mg/kg-day Toxicity Category 2 Release (lbs/yr) 715,830 72559 p,p'-DDE Risk Specific Dose (RSD) 0.000029 mg/kg-day Toxicity Category 1 FW/AW-Max Value (ug/L) 0.062
4685147 Paraquat Lowest Observed Adverse Effect Level (LOAEL) 0.93 mg/kg-day Toxicity Category 2 Release (lbs/yr) 6,899,701 100005 p-Chloronitrobenzene TD50 473 mg/kg-day Toxicity Category 3 Production Volume (lbs/year) >10M - 50M106434 p-Chlorotoluene Reference Dose (RfD) 0.02 mg/kg-day Toxicity Category 3 FW/AW-Max Value (ug/L) 22.5120718 p-Cresidine Cancer Studies, NTP NTPMSR Toxicity Category 1 Release (lbs/yr) 0100254 p-Dinitrobenzene Reference Dose (RfD) 0.0001 mg/kg-day Toxicity Category 2 Release (lbs/yr) 28,711
32534819 Pentabromodiphenyl ethers Reference Dose (RfD) 0.002 mg/kg-day Toxicity Category 3 Production Volume (lbs/year) >10M - 50M
76017 Pentachloroethane Cancer Studies, NTP NTPMSR Toxicity Category 1 Release (lbs/yr) 865 115775 Pentaerythritol No Observed Effect Level (NOEL) 100 mg/kg-day Toxicity Category 4 Production Volume (lbs/year) >100M - 500M
3296900 Pentaerythritol dibromide Cancer Studies, NTP NTPMSR Toxicity Category 1 Production Volume (lbs/year) >1M - 10M110623 Pentanal Lethal Dose 50 (LD50) 5.66 mg/kg Toxicity Category 2 Production Volume (lbs/year) >50M - 100M
14797730 Perchlorate No Observed Effect Level (NOEL) 0.007 mg/kg-day Toxicity Category 1 FW/AW-Max Value (ug/L) 42052645531 Permethrin No Observed Effect Level (NOEL) 5 mg/kg-day Toxicity Category 3 Release (lbs/yr) 1,068,390
335671 Perfluorooctanoic acid (PFOA) Lowest Observed Adverse Effect Level (LOAEL) 1.0 mg/kg-day Toxicity Category 2 FW/AW Supplemental1763231 Perfluorooctane sulfonic acid (PFOS) Lethal Dose 50 (LD50) 251.0 mg/kg Toxicity Category 3 Production Volume (lbs/year) 10K - 500K
77098 Phenolphthalein Cancer Studies, NTP NTPMSR Toxicity Category 1 Production Volume (lbs/year) 10K - 500K
101848 Phenyl ether Lethal Dose 50 (LD50) 2,450 mg/kg Toxicity Category 4 Production Volume (lbs/year) >50M - 100M
A2-11
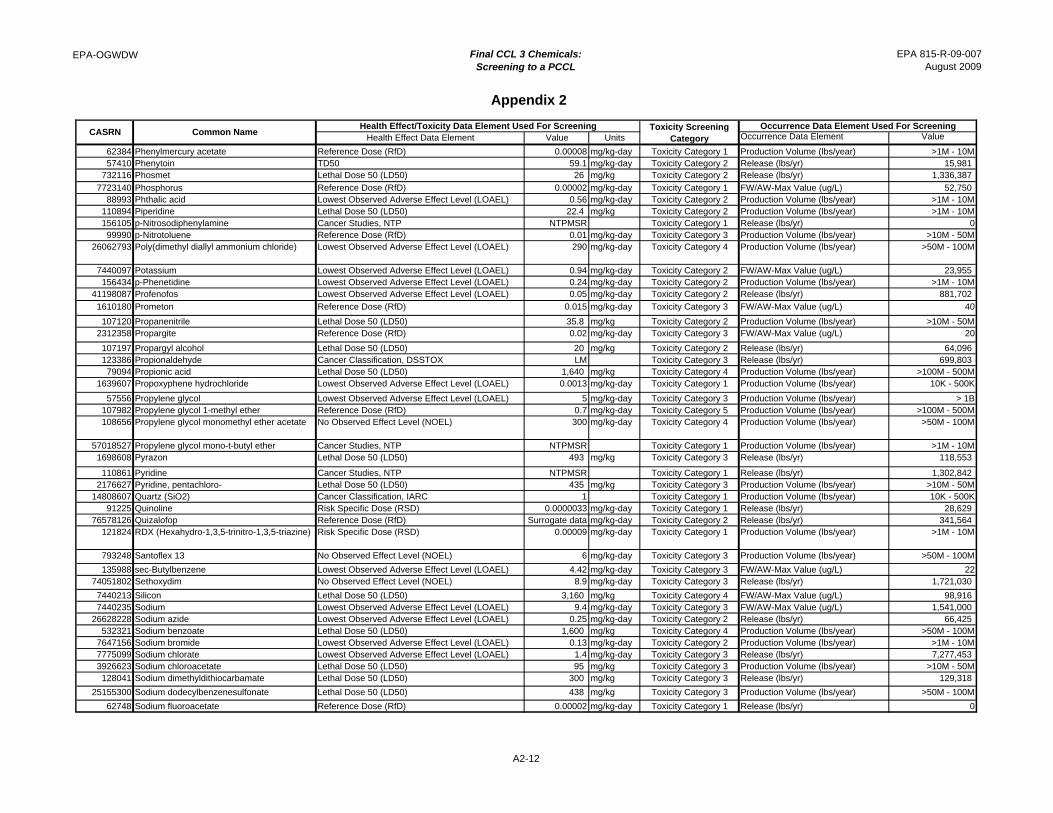
EPA-OGWDW Final CCL 3 Chemicals: Screening to a PCCL
Appendix 2
EPA 815-R-09-007August 2009
Health Effect Data Element Value Units Occurrence Data Element ValueToxicity Screening
Category
Occurrence Data Element Used For ScreeningHealth Effect/Toxicity Data Element Used For ScreeningCommon NameCASRN
62384 Phenylmercury acetate Reference Dose (RfD) 0.00008 mg/kg-day Toxicity Category 1 Production Volume (lbs/year) >1M - 10M57410 Phenytoin TD50 59.1 mg/kg-day Toxicity Category 2 Release (lbs/yr) 15,981
732116 Phosmet Lethal Dose 50 (LD50) 26 mg/kg Toxicity Category 2 Release (lbs/yr) 1,336,387
7723140 Phosphorus Reference Dose (RfD) 0.00002 mg/kg-day Toxicity Category 1 FW/AW-Max Value (ug/L) 52,750 88993 Phthalic acid Lowest Observed Adverse Effect Level (LOAEL) 0.56 mg/kg-day Toxicity Category 2 Production Volume (lbs/year) >1M - 10M
110894 Piperidine Lethal Dose 50 (LD50) 22.4 mg/kg Toxicity Category 2 Production Volume (lbs/year) >1M - 10M156105 p-Nitrosodiphenylamine Cancer Studies, NTP NTPMSR Toxicity Category 1 Release (lbs/yr) 099990 p-Nitrotoluene Reference Dose (RfD) 0.01 mg/kg-day Toxicity Category 3 Production Volume (lbs/year) >10M - 50M
26062793 Poly(dimethyl diallyl ammonium chloride) Lowest Observed Adverse Effect Level (LOAEL) 290 mg/kg-day Toxicity Category 4 Production Volume (lbs/year) >50M - 100M
7440097 Potassium Lowest Observed Adverse Effect Level (LOAEL) 0.94 mg/kg-day Toxicity Category 2 FW/AW-Max Value (ug/L) 23,955 156434 p-Phenetidine Lowest Observed Adverse Effect Level (LOAEL) 0.24 mg/kg-day Toxicity Category 2 Production Volume (lbs/year) >1M - 10M
41198087 Profenofos Lowest Observed Adverse Effect Level (LOAEL) 0.05 mg/kg-day Toxicity Category 2 Release (lbs/yr) 881,702
1610180 Prometon Reference Dose (RfD) 0.015 mg/kg-day Toxicity Category 3 FW/AW-Max Value (ug/L) 40
107120 Propanenitrile Lethal Dose 50 (LD50) 35.8 mg/kg Toxicity Category 2 Production Volume (lbs/year) >10M - 50M2312358 Propargite Reference Dose (RfD) 0.02 mg/kg-day Toxicity Category 3 FW/AW-Max Value (ug/L) 20
107197 Propargyl alcohol Lethal Dose 50 (LD50) 20 mg/kg Toxicity Category 2 Release (lbs/yr) 64,096 123386 Propionaldehyde Cancer Classification, DSSTOX LM Toxicity Category 3 Release (lbs/yr) 699,803 79094 Propionic acid Lethal Dose 50 (LD50) 1,640 mg/kg Toxicity Category 4 Production Volume (lbs/year) >100M - 500M
1639607 Propoxyphene hydrochloride Lowest Observed Adverse Effect Level (LOAEL) 0.0013 mg/kg-day Toxicity Category 1 Production Volume (lbs/year) 10K - 500K
57556 Propylene glycol Lowest Observed Adverse Effect Level (LOAEL) 5 mg/kg-day Toxicity Category 3 Production Volume (lbs/year) > 1B107982 Propylene glycol 1-methyl ether Reference Dose (RfD) 0.7 mg/kg-day Toxicity Category 5 Production Volume (lbs/year) >100M - 500M108656 Propylene glycol monomethyl ether acetate No Observed Effect Level (NOEL) 300 mg/kg-day Toxicity Category 4 Production Volume (lbs/year) >50M - 100M
57018527 Propylene glycol mono-t-butyl ether Cancer Studies, NTP NTPMSR Toxicity Category 1 Production Volume (lbs/year) >1M - 10M1698608 Pyrazon Lethal Dose 50 (LD50) 493 mg/kg Toxicity Category 3 Release (lbs/yr) 118,553
110861 Pyridine Cancer Studies, NTP NTPMSR Toxicity Category 1 Release (lbs/yr) 1,302,842 2176627 Pyridine, pentachloro- Lethal Dose 50 (LD50) 435 mg/kg Toxicity Category 3 Production Volume (lbs/year) >10M - 50M
14808607 Quartz (SiO2) Cancer Classification, IARC 1 Toxicity Category 1 Production Volume (lbs/year) 10K - 500K91225 Quinoline Risk Specific Dose (RSD) 0.0000033 mg/kg-day Toxicity Category 1 Release (lbs/yr) 28,629
76578126 Quizalofop Reference Dose (RfD) Surrogate data mg/kg-day Toxicity Category 2 Release (lbs/yr) 341,564 121824 RDX (Hexahydro-1,3,5-trinitro-1,3,5-triazine) Risk Specific Dose (RSD) 0.00009 mg/kg-day Toxicity Category 1 Production Volume (lbs/year) >1M - 10M
793248 Santoflex 13 No Observed Effect Level (NOEL) 6 mg/kg-day Toxicity Category 3 Production Volume (lbs/year) >50M - 100M
135988 sec-Butylbenzene Lowest Observed Adverse Effect Level (LOAEL) 4.42 mg/kg-day Toxicity Category 3 FW/AW-Max Value (ug/L) 2274051802 Sethoxydim No Observed Effect Level (NOEL) 8.9 mg/kg-day Toxicity Category 3 Release (lbs/yr) 1,721,030
7440213 Silicon Lethal Dose 50 (LD50) 3,160 mg/kg Toxicity Category 4 FW/AW-Max Value (ug/L) 98,916 7440235 Sodium Lowest Observed Adverse Effect Level (LOAEL) 9.4 mg/kg-day Toxicity Category 3 FW/AW-Max Value (ug/L) 1,541,000
26628228 Sodium azide Lowest Observed Adverse Effect Level (LOAEL) 0.25 mg/kg-day Toxicity Category 2 Release (lbs/yr) 66,425 532321 Sodium benzoate Lethal Dose 50 (LD50) 1,600 mg/kg Toxicity Category 4 Production Volume (lbs/year) >50M - 100M
7647156 Sodium bromide Lowest Observed Adverse Effect Level (LOAEL) 0.13 mg/kg-day Toxicity Category 2 Production Volume (lbs/year) >1M - 10M7775099 Sodium chlorate Lowest Observed Adverse Effect Level (LOAEL) 1.4 mg/kg-day Toxicity Category 3 Release (lbs/yr) 7,277,453 3926623 Sodium chloroacetate Lethal Dose 50 (LD50) 95 mg/kg Toxicity Category 3 Production Volume (lbs/year) >10M - 50M128041 Sodium dimethyldithiocarbamate Lethal Dose 50 (LD50) 300 mg/kg Toxicity Category 3 Release (lbs/yr) 129,318
25155300 Sodium dodecylbenzenesulfonate Lethal Dose 50 (LD50) 438 mg/kg Toxicity Category 3 Production Volume (lbs/year) >50M - 100M
62748 Sodium fluoroacetate Reference Dose (RfD) 0.00002 mg/kg-day Toxicity Category 1 Release (lbs/yr) 0
A2-12
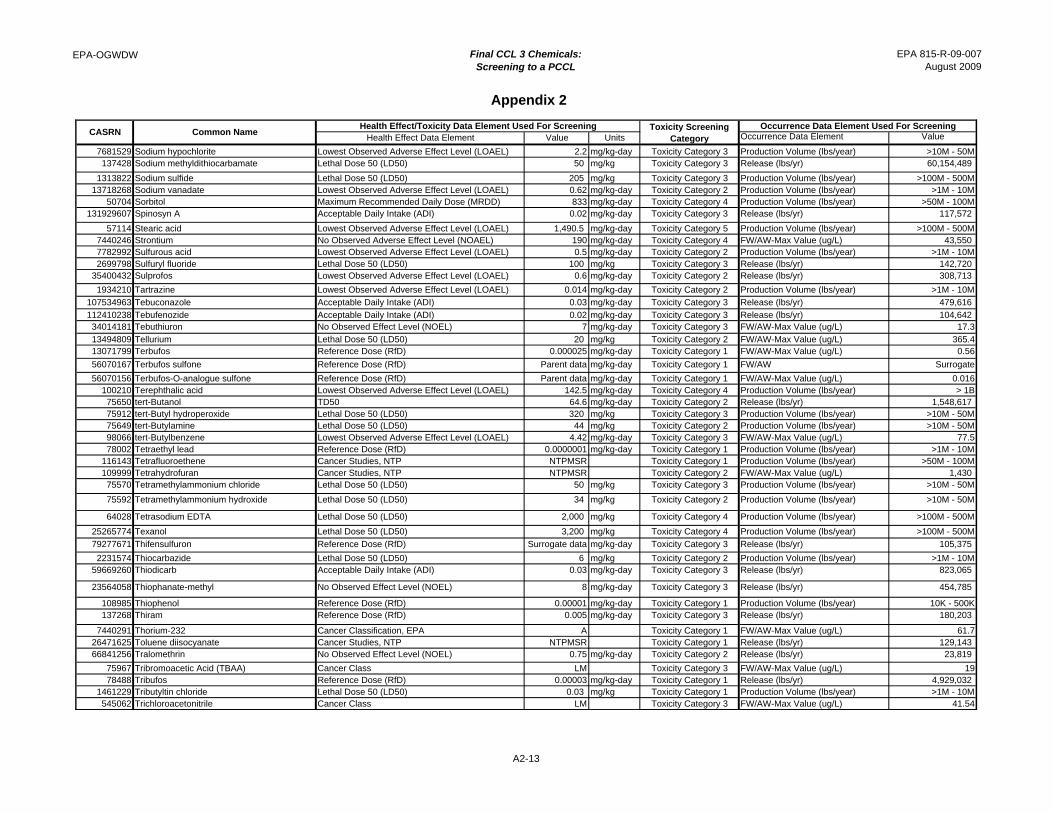
EPA-OGWDW Final CCL 3 Chemicals: Screening to a PCCL
Appendix 2
EPA 815-R-09-007August 2009
Health Effect Data Element Value Units Occurrence Data Element ValueToxicity Screening
Category
Occurrence Data Element Used For ScreeningHealth Effect/Toxicity Data Element Used For ScreeningCommon NameCASRN
7681529 Sodium hypochlorite Lowest Observed Adverse Effect Level (LOAEL) 2.2 mg/kg-day Toxicity Category 3 Production Volume (lbs/year) >10M - 50M137428 Sodium methyldithiocarbamate Lethal Dose 50 (LD50) 50 mg/kg Toxicity Category 3 Release (lbs/yr) 60,154,489
1313822 Sodium sulfide Lethal Dose 50 (LD50) 205 mg/kg Toxicity Category 3 Production Volume (lbs/year) >100M - 500M13718268 Sodium vanadate Lowest Observed Adverse Effect Level (LOAEL) 0.62 mg/kg-day Toxicity Category 2 Production Volume (lbs/year) >1M - 10M
50704 Sorbitol Maximum Recommended Daily Dose (MRDD) 833 mg/kg-day Toxicity Category 4 Production Volume (lbs/year) >50M - 100M131929607 Spinosyn A Acceptable Daily Intake (ADI) 0.02 mg/kg-day Toxicity Category 3 Release (lbs/yr) 117,572
57114 Stearic acid Lowest Observed Adverse Effect Level (LOAEL) 1,490.5 mg/kg-day Toxicity Category 5 Production Volume (lbs/year) >100M - 500M7440246 Strontium No Observed Adverse Effect Level (NOAEL) 190 mg/kg-day Toxicity Category 4 FW/AW-Max Value (ug/L) 43,550 7782992 Sulfurous acid Lowest Observed Adverse Effect Level (LOAEL) 0.5 mg/kg-day Toxicity Category 2 Production Volume (lbs/year) >1M - 10M2699798 Sulfuryl fluoride Lethal Dose 50 (LD50) 100 mg/kg Toxicity Category 3 Release (lbs/yr) 142,720
35400432 Sulprofos Lowest Observed Adverse Effect Level (LOAEL) 0.6 mg/kg-day Toxicity Category 2 Release (lbs/yr) 308,713
1934210 Tartrazine Lowest Observed Adverse Effect Level (LOAEL) 0.014 mg/kg-day Toxicity Category 2 Production Volume (lbs/year) >1M - 10M
107534963 Tebuconazole Acceptable Daily Intake (ADI) 0.03 mg/kg-day Toxicity Category 3 Release (lbs/yr) 479,616
112410238 Tebufenozide Acceptable Daily Intake (ADI) 0.02 mg/kg-day Toxicity Category 3 Release (lbs/yr) 104,642 34014181 Tebuthiuron No Observed Effect Level (NOEL) 7 mg/kg-day Toxicity Category 3 FW/AW-Max Value (ug/L) 17.3
13494809 Tellurium Lethal Dose 50 (LD50) 20 mg/kg Toxicity Category 2 FW/AW-Max Value (ug/L) 365.413071799 Terbufos Reference Dose (RfD) 0.000025 mg/kg-day Toxicity Category 1 FW/AW-Max Value (ug/L) 0.56
56070167 Terbufos sulfone Reference Dose (RfD) Parent data mg/kg-day Toxicity Category 1 FW/AW Surrogate
56070156 Terbufos-O-analogue sulfone Reference Dose (RfD) Parent data mg/kg-day Toxicity Category 1 FW/AW-Max Value (ug/L) 0.016100210 Terephthalic acid Lowest Observed Adverse Effect Level (LOAEL) 142.5 mg/kg-day Toxicity Category 4 Production Volume (lbs/year) > 1B75650 tert-Butanol TD50 64.6 mg/kg-day Toxicity Category 2 Release (lbs/yr) 1,548,617 75912 tert-Butyl hydroperoxide Lethal Dose 50 (LD50) 320 mg/kg Toxicity Category 3 Production Volume (lbs/year) >10M - 50M75649 tert-Butylamine Lethal Dose 50 (LD50) 44 mg/kg Toxicity Category 2 Production Volume (lbs/year) >10M - 50M98066 tert-Butylbenzene Lowest Observed Adverse Effect Level (LOAEL) 4.42 mg/kg-day Toxicity Category 3 FW/AW-Max Value (ug/L) 77.578002 Tetraethyl lead Reference Dose (RfD) 0.0000001 mg/kg-day Toxicity Category 1 Production Volume (lbs/year) >1M - 10M
116143 Tetrafluoroethene Cancer Studies, NTP NTPMSR Toxicity Category 1 Production Volume (lbs/year) >50M - 100M109999 Tetrahydrofuran Cancer Studies, NTP NTPMSR Toxicity Category 2 FW/AW-Max Value (ug/L) 1,430 75570 Tetramethylammonium chloride Lethal Dose 50 (LD50) 50 mg/kg Toxicity Category 3 Production Volume (lbs/year) >10M - 50M
75592 Tetramethylammonium hydroxide Lethal Dose 50 (LD50) 34 mg/kg Toxicity Category 2 Production Volume (lbs/year) >10M - 50M
64028 Tetrasodium EDTA Lethal Dose 50 (LD50) 2,000 mg/kg Toxicity Category 4 Production Volume (lbs/year) >100M - 500M
25265774 Texanol Lethal Dose 50 (LD50) 3,200 mg/kg Toxicity Category 4 Production Volume (lbs/year) >100M - 500M
79277671 Thifensulfuron Reference Dose (RfD) Surrogate data mg/kg-day Toxicity Category 3 Release (lbs/yr) 105,375
2231574 Thiocarbazide Lethal Dose 50 (LD50) 6 mg/kg Toxicity Category 2 Production Volume (lbs/year) >1M - 10M59669260 Thiodicarb Acceptable Daily Intake (ADI) 0.03 mg/kg-day Toxicity Category 3 Release (lbs/yr) 823,065
23564058 Thiophanate-methyl No Observed Effect Level (NOEL) 8 mg/kg-day Toxicity Category 3 Release (lbs/yr) 454,785
108985 Thiophenol Reference Dose (RfD) 0.00001 mg/kg-day Toxicity Category 1 Production Volume (lbs/year) 10K - 500K137268 Thiram Reference Dose (RfD) 0.005 mg/kg-day Toxicity Category 3 Release (lbs/yr) 180,203
7440291 Thorium-232 Cancer Classification, EPA A Toxicity Category 1 FW/AW-Max Value (ug/L) 61.726471625 Toluene diisocyanate Cancer Studies, NTP NTPMSR Toxicity Category 1 Release (lbs/yr) 129,143 66841256 Tralomethrin No Observed Effect Level (NOEL) 0.75 mg/kg-day Toxicity Category 2 Release (lbs/yr) 23,819
75967 Tribromoacetic Acid (TBAA) Cancer Class LM Toxicity Category 3 FW/AW-Max Value (ug/L) 1978488 Tribufos Reference Dose (RfD) 0.00003 mg/kg-day Toxicity Category 1 Release (lbs/yr) 4,929,032
1461229 Tributyltin chloride Lethal Dose 50 (LD50) 0.03 mg/kg Toxicity Category 1 Production Volume (lbs/year) >1M - 10M545062 Trichloroacetonitrile Cancer Class LM Toxicity Category 3 FW/AW-Max Value (ug/L) 41.54
A2-13
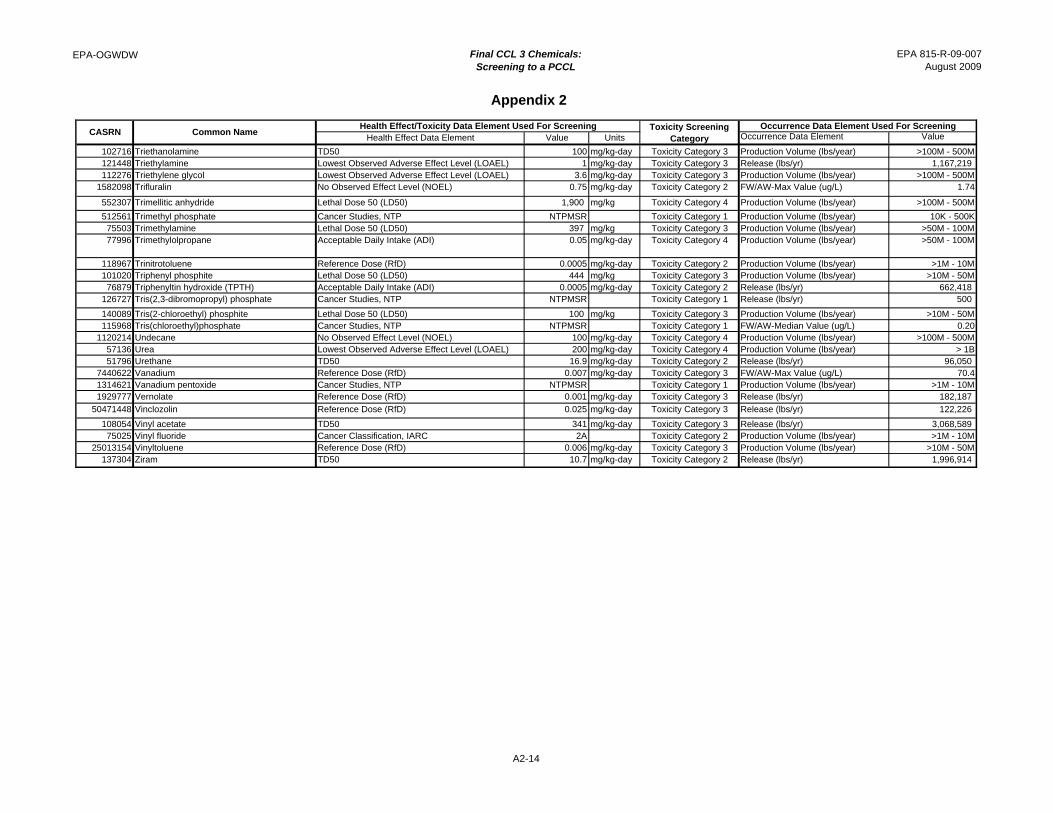
EPA-OGWDW Final CCL 3 Chemicals: Screening to a PCCL
Appendix 2
EPA 815-R-09-007August 2009
Health Effect Data Element Value Units Occurrence Data Element ValueToxicity Screening
Category
Occurrence Data Element Used For ScreeningHealth Effect/Toxicity Data Element Used For ScreeningCommon NameCASRN
102716 Triethanolamine TD50 100 mg/kg-day Toxicity Category 3 Production Volume (lbs/year) >100M - 500M121448 Triethylamine Lowest Observed Adverse Effect Level (LOAEL) 1 mg/kg-day Toxicity Category 3 Release (lbs/yr) 1,167,219 112276 Triethylene glycol Lowest Observed Adverse Effect Level (LOAEL) 3.6 mg/kg-day Toxicity Category 3 Production Volume (lbs/year) >100M - 500M
1582098 Trifluralin No Observed Effect Level (NOEL) 0.75 mg/kg-day Toxicity Category 2 FW/AW-Max Value (ug/L) 1.74
552307 Trimellitic anhydride Lethal Dose 50 (LD50) 1,900 mg/kg Toxicity Category 4 Production Volume (lbs/year) >100M - 500M
512561 Trimethyl phosphate Cancer Studies, NTP NTPMSR Toxicity Category 1 Production Volume (lbs/year) 10K - 500K75503 Trimethylamine Lethal Dose 50 (LD50) 397 mg/kg Toxicity Category 3 Production Volume (lbs/year) >50M - 100M77996 Trimethylolpropane Acceptable Daily Intake (ADI) 0.05 mg/kg-day Toxicity Category 4 Production Volume (lbs/year) >50M - 100M
118967 Trinitrotoluene Reference Dose (RfD) 0.0005 mg/kg-day Toxicity Category 2 Production Volume (lbs/year) >1M - 10M101020 Triphenyl phosphite Lethal Dose 50 (LD50) 444 mg/kg Toxicity Category 3 Production Volume (lbs/year) >10M - 50M76879 Triphenyltin hydroxide (TPTH) Acceptable Daily Intake (ADI) 0.0005 mg/kg-day Toxicity Category 2 Release (lbs/yr) 662,418
126727 Tris(2,3-dibromopropyl) phosphate Cancer Studies, NTP NTPMSR Toxicity Category 1 Release (lbs/yr) 500
140089 Tris(2-chloroethyl) phosphite Lethal Dose 50 (LD50) 100 mg/kg Toxicity Category 3 Production Volume (lbs/year) >10M - 50M115968 Tris(chloroethyl)phosphate Cancer Studies, NTP NTPMSR Toxicity Category 1 FW/AW-Median Value (ug/L) 0.20
1120214 Undecane No Observed Effect Level (NOEL) 100 mg/kg-day Toxicity Category 4 Production Volume (lbs/year) >100M - 500M57136 Urea Lowest Observed Adverse Effect Level (LOAEL) 200 mg/kg-day Toxicity Category 4 Production Volume (lbs/year) > 1B51796 Urethane TD50 16.9 mg/kg-day Toxicity Category 2 Release (lbs/yr) 96,050
7440622 Vanadium Reference Dose (RfD) 0.007 mg/kg-day Toxicity Category 3 FW/AW-Max Value (ug/L) 70.41314621 Vanadium pentoxide Cancer Studies, NTP NTPMSR Toxicity Category 1 Production Volume (lbs/year) >1M - 10M1929777 Vernolate Reference Dose (RfD) 0.001 mg/kg-day Toxicity Category 3 Release (lbs/yr) 182,187
50471448 Vinclozolin Reference Dose (RfD) 0.025 mg/kg-day Toxicity Category 3 Release (lbs/yr) 122,226
108054 Vinyl acetate TD50 341 mg/kg-day Toxicity Category 3 Release (lbs/yr) 3,068,589 75025 Vinyl fluoride Cancer Classification, IARC 2A Toxicity Category 2 Production Volume (lbs/year) >1M - 10M
25013154 Vinyltoluene Reference Dose (RfD) 0.006 mg/kg-day Toxicity Category 3 Production Volume (lbs/year) >10M - 50M137304 Ziram TD50 10.7 mg/kg-day Toxicity Category 2 Release (lbs/yr) 1,996,914
A2-14