Embed Size (px)
Citation preview
1.
FINAL BUDGET OUTCOME
2017
2.
Acronyms ABG Autonomous Bougainville Government ADB Asian Development Bank BPNG Bank of Papua New Guinea CSA Commercial and Statutory Authority DNPM Department of National Planning and Monitoring DSIP District Support Improvement Program FAA Final Available Appropriation FBO Final Budget Outcome GDP Gross Domestic Product GFS Government Financial Statistics GoPNG Government of Papua New Guinea GST Goods & Services Tax ICT Information and Communications Technology IMF International Monetary Fund IFMS Integrated Financial Management System IPBC Independent Public Business Corporation IRC Internal Revenue Commission LNG Liquefied Natural Gas MTDP Medium Term Development Plan (2018-2022) MTFS Medium Term Fiscal Strategy (2018-2022) MTRS Medium Term Revenue Strategy (2018-2022) MYEFO Mid-Year Economic and Fiscal Outlook NEC National Executive Council NPCP National Petroleum Company of PNG NSL Nambawan Super Limited OSPEAC Organisational Staffing and Personnel Emoluments
Audit Committee PE Personal Emoluments PIP Public Investment Program PNGDSP Papua New Guinea Development Strategic Plan RMF Results Monitoring Framework SIGTAS Standard Integrated Government Tax
Administration System SOE State Owned Enterprise UBSA Umbrella Benefits Sharing Agreement WPA Waigani Public Account
3.
Contents PART 1 ............................................................................................................................... 7
FINAL BUDGET OUTCOME BY FISCAL OPERATIONS .................................................... 7
1.1 General Government Fiscal Operations .............................................................. 7
1.1.1 2017 Supplementary Budget ............................................................................ 8
1.2 Revenue ................................................................................................................. 9
1.1.2 Total Revenue and Grants ............................................................................... 9
1.1.3 Tax Revenue ................................................................................................. 10
1.1.4 Other Revenue .............................................................................................. 13
1.3 Expenditure and Net Lending ............................................................................ 14
1.4 Financing ............................................................................................................. 18
1.4.1 Net Financing................................................................................................. 18
1.4.2 External Financing ......................................................................................... 19
1.4.3 Domestic Financing ....................................................................................... 19
1.4.4 Debt Service .................................................................................................. 20
1.5 Public Debt .......................................................................................................... 21
1.6 Superannuation .................................................................................................. 21
1.6.1 Automation Payments .................................................................................... 21
1.6.2 Exit Payments ................................................................................................ 22
1.7 Trust Accounts ................................................................................................... 22
1.8 Government Finance Statistics .......................................................................... 25
1.8.1 Changes between the GFSM 1986 and GFSM 2014 ..................................... 25
1.8.2 Balancing items ............................................................................................. 25
1.8.3 General Government Debt ............................................................................. 27
FISCAL TABLES ................................................................................................................ 28
Table A: Statement of Operations for the General Government of Papua New Guinea ... 28
Table B: Statement of Sources and Uses of Cash for the General Government of Papua New Guinea..................................................................................................................... 29
Table C: General Government Revenue by Economic Classification ............................... 30
Table D (i): General Budgetary Expenditure by Economic Classification ......................... 32
Table D (ii): General Budgetary Government Expenditure by Economic Classification .... 33
Table E: Transaction in Assets and Liabilities for the General Government ..................... 35
Table F: Stocks in General Government Debt ................................................................. 36
4.
PART 2 .............................................................................................................................. 37
FINAL BUDGET OUTCOME BY AGENCY ......................................................................... 37
2.1 2017 Expenditure Outcome ................................................................................ 37
2.2 2017 Expenditure Outcome ................................................................................ 37
2.3 Section 3 and Section 4 Transfers ..................................................................... 38
2.3.1 Section 3 Secretary’s Advance ...................................................................... 38
2.3.2 Section 4 ........................................................................................................ 38
2.4 Detailed Expenditure .......................................................................................... 39
5.
TABLES TABLE 1 BUDGET BALANCE 2016 – 2017 (KINA MILLION) ................................................................................................. 8
TABLE 2 TOTAL REVENUE AND GRANTS (KINA, MILLION) .................................................................................................... 9
TABLE 3 TAXES ON INCOME, PROFIT AND CAPITAL GAINS (KINA, MILLION) .......................................................................... 10
TABLE 4 TAXES ON PAYROLL AND WORKFORCE (KINA, MILLION) ........................................................................................ 11
TABLE 5: TAXES ON GOODS AND SERVICES (KINA, MILLION) .............................................................................................. 12
TABLE 6: TAXES ON INTERNATIONAL TRADE AND TRANSACTIONS (KINA, MILLION) ................................................................. 12
TABLE 7: GRANTS (KINA, MILLION)............................................................................................................................... 13
TABLE 8: OTHER REVENUE (KINA, MILLION) ................................................................................................................... 14
TABLE 9: EXPENDITURE BY FUNDING SOURCE 2016-17 (KINA MILLION) ............................................................................. 14
TABLE 10: EXPENDITURE BY AGENCY TYPE 2016-17 [EXCLUDING DONOR GRANTS, AND CONCESSIONAL LOANS] (KINA MILLION) . 16
TABLE 11: GOPNG DOMESTIC FUNDING BY 2014 GFS FUNCTIONAL CLASSIFICATION OF EXPENSE BY ECONOMIC ITEM TYPE 2016-
17 [EXCLUDING DONOR GRANTS, AND CONCESSIONAL LOANS] (KINA MILLION) ........................................................... 17
TABLE 12: SELECTED KEY EXPENDITURE ITEMS – 2017 (KINA MILLION) .............................................................................. 17
TABLE 13: FINANCING SOURCES 2016 – 2017 - (KINA MILLION) ...................................................................................... 18
TABLE 14: EXTERNAL BORROWING AND PRINCIPAL REPAYMENTS 2016 - 2017 (KINA, MILLION) ............................................ 19
TABLE 15: DOMESTIC BORROWING AND PRINCIPAL REPAYMENTS 2016 - 2017 (KINA, MILLION) ............................................ 20
TABLE 16: INTEREST AND FEES – 2017 (KINA, MILLION) .................................................................................................. 20
TABLE 17: CENTRAL GOVERNMENT DEBT 2016 – 2017 (KINA, MILLION) ........................................................................... 21
TABLE 18: SOURCE OF FUNDS FOR BUDGET FUNDED TRUST ACCOUNTS: 2005 – 2017 ......................................................... 23
TABLE 19: APPROPRIATION FOR TRUST ACCOUNTS – 2017 (KINA, MILLION) ....................................................................... 23
TABLE 20: GOPNG FUNDED EXPENDITURE BY SECTORS (KINA, MILLIONS) ........................................................................... 37
TABLE 21: SECTION 4 TRANSFER BY SECTORS (KINA, MILLIONS) ......................................................................................... 38
TABLE 22: ADMINISTRATION SECTOR ............................................................................................................................ 40
TABLE 23: COMMUNITY AND CULTURE .......................................................................................................................... 42
TABLE 24 DEBT INTEREST ............................................................................................................................................ 42
TABLE 25 ECONOMIC SECTOR ...................................................................................................................................... 43
TABLE 26: EDUCATION SECTOR .................................................................................................................................... 45
TABLE 27: HEALTH SECTOR ......................................................................................................................................... 46
TABLE 28: LAW AND JUSTICE SECTOR ............................................................................................................................ 47
TABLE 29: MISCELLANEOUS EXPENSE ............................................................................................................................ 48
TABLE 30: PROVINCES SECTOR ..................................................................................................................................... 48
TABLE 31: TRANSPORT SECTOR .................................................................................................................................... 50
TABLE 32: UTILITIES ................................................................................................................................................... 50
6.
INTRODUCTION
The Final Budget Outcome (FBO) Report is released in accordance with the requirements of sections 13 – 16 of the Papua New Guinea Fiscal Responsibility Act, 2006 (amended 2017). The Act requires the Treasurer to release and table a final budget outcome report for each financial year no later than three months after end of the financial year. The purpose of the FBO Report is to provide the final fiscal outcomes for the financial year. The FBO Report provides to Parliament and the public a summary of fiscal performance, together with a comparison and explanation of the major variations from the Budget estimates for total revenue and grants, total expenditure and net lending, and the budget balance. It also provides a summary of the National Government financing activities for the financial year and a summary of the National Government debt position, together with comparative figures for the previous financial year. The financial information presented in this report is based on the same reporting standards as used in the 2017 Volume 1 and Volume 2 Budget documents. Part 1 of this report, Final Budget Outcome by Fiscal Operations, is reported using the new GFS 2014 reporting framework as introduced in the 2016 Budget Volume 1, Economic and Development Policies document. Part 2 of this report, Final Budget Outcome by Agency, is still reported using the GFS 1986 reporting framework as reported in the 2017 Budget Volume 2 document. This is transitional as the migration to the updated GFS 2014 reporting framework is completed. Generally, the information presented in this report follows the traditional cash reporting standards originally laid down in the GFS 1986 Manual.
The general government sector under GFSM 2014 consists of all government units, representing budgetary central government, provincial government, local government and extra budgetary accounts within the country that are controlled and largely financed by the National Government. In contrast, the coverage of the GFSM 1986 system was defined on a narrower functional basis to include all units performing government functions. The current GFS 2014 coverage includes Budgetary Fiscal Transactions of the Government. The ongoing roll-out, currently only covers the budgetary units but will eventually be extended to cover extra budgetary units such as statutory bodies and public corporations (SOEs). Work is underway to have Volume 2 of the Budget document reported in the GFS 2014 reporting framework. Once this is done, future FBO reports will fully reflect the GFS 2014 reporting framework. Section 1.8 of this report provides a clear explanation to the changes between GFSM 1986 and GFSM 2014. Furthermore, the information presented in this report may not reconcile fully with information published in the Public Accounts as some revenues and expenditures detailed in this report will be reported or classified differently in the Public Accounts. For example, transactions relating to debt are generally reported on a net basis and split into principal and interest components in this report, whereas they are reported on a gross basis in the Public Accounts and not split between principal and interest components. The information presented in this report is based on the same data used in the preparation of the Public Accounts; however, this report is compiled before that data has been subject to independent audit. This report will therefore not include the effects of any adjustments made to the underlying data arising from the audit process. In addition, there are some areas where updated figures will modify the actual outcomes, such as when reports are received from all donors on projects grants, and more reporting is provided on the Infrastructure Tax Credit (ITC).
7.
PART 1
FINAL BUDGET OUTCOME BY FISCAL OPERATIONS 1.1 General Government Fiscal Operations
The Final Budget Outcome for 2017 presents a Net Borrowing requirement of K1,794.7 million (2.4 per cent of GDP), 41.9 per cent lower than the 2016 deficit of K3,086.9 million (4.6 per cent of GDP). The 2017 Net Borrowing outcome is lower by K81.7 million (4.4 per cent) compared to the 2017 Supplementary Budget. This is a significant reduction, in line with the O’Neil – Abel Government’s objectives stated in the Alotau Accord 2 and operationalized in the 100 Day’s plan to ensure that PNG “lives within its means”. It is the result of the proactive steps taken by the Government in the 2017 Supplementary Budget to address the projected revenue shortfall and expenditure overruns.
Throughout 2017, the Government has continued to carefully manage fiscal conditions against the background of subdued economic conditions reflected in downward revisions to GDP growth rates. This largely reflects lower than anticipated growth in the mining and agricultural sectors, with the oil and gas sector projected to contract by 0.5 percentage points. The downward revision reflects a benign world economy where gold, oil, and PNG’s agricultural commodity prices only resumed clear upward trends late in the year. If this is coupled with improved, but continued tightness in the availability of foreign currency, it helps explain the stable performance of revenue in aggregate.
Within this improved but still challenging economic environment, the 2017 Budget outcome is in line with the plan presented in the 2017 Budget with major priorities, including Tuition Fee Free (TFF) Education, Free Primary Health Care and key development projects related to the hosting of APEC and key infrastructure projects being fully funded. The 2017 National General Elections have been delivered successfully and within the budget appropriation of K400.0 million.
To maintain the commitment to a sustainable fiscal deficit and, given the rigid nature of expenditures on Personnel Emoluments (PE) and interest and other costs, the main adjustments in the 2017 Supplementary Budget have come from capital expenditures (PIP) and other development projects. This includes the Services Improvement programmes (SIPs) which were reduced by 80.0 per cent and which contributed significantly to the reprioritisation. Other reductions in the PIP targeted projects that have not yet commenced. All adjustments in the PIP were targeted at non-labour intensive sectors that would otherwise detract from employment growth. The declining capital expenditure trends will be reversed, as presented in the 2018 Budget and Medium Term Fiscal Strategy 2018-22 (MTFS).

8.
Table 1 Budget Balance 2016 – 2017 (Kina Million)
2016 Actuals
2017 Budget
2017 Supp. Budget
2017 Outcome
Revenue and Grants 10,485.5 11,473.1 10,979.2 11,525.1 Expenditure and Net Lending 13,572.4 13,349.5 12,855.6 13,319.7 Budget Balance -3,086.9 -1,876.5 -1,876.5 -1,794.7 % of GDP -4.6% 2.5% -2.5% -2.4% Debt to GDP (%) 32.4% 31.9%* 32.1% 31.9% Non-resource primary balance (% of non- resource GDP)
-4.4% -1.2% -1.2% -1.5%
Source: Department of Treasury * Corresponds to the debt to GDP ratio using 2016 debt stock outcomes (not available at the time of the 2017 Budget)
Total Revenue and Grants is higher by K545.9 million (5.0 per cent) and K1,039.5 million (or 9.9 per cent) compared to the 2017 Supplementary Budget and the 2016 actuals, respectively. This is due to improved tax collections in particular GST and higher than budgeted donor grants. This outcome is also substantially higher than the 2017 estimate (K10571.2 million) contained in the 2018 Budget which shows the improved performance of IRC and Customs over the final quarter of 2017.
Total Expenditures and Net Lending of K13,319.7 million is K464.2 million (3.6 per cent) higher than the 2017 Supplementary Budget estimate of K12,855.6 million. However, compared to the 2016 actuals, it is lower by K252.7 million (or 1.9 per cent). This generally reflects stricter warrant releases and more stringent prioritization across Goods and Services and net acquisition of non-financial assets. Part of those savings were offset by some further increases in personnel emoluments by both National Department and Provinces, although the pace of overspending in this category has been slowed substantially. 1.1.1 2017 Supplementary Budget
The fiscal outlook for 2017 weakened in the first half of the year, with the 2017 Mid-Year Economic and Fiscal Outlook (MYEFO) and subsequent reports indicating a projected K494.0 million shortfall in revenue and a K800.1 million projected overrun in expenditure comprising increases in compensation of employees (PE) (K430.1 million), office rentals (K50.0 million), public debt interest (K150.0 million), pharmaceutical drugs (K100.0 million), Department of Works expenditures (K51.2 million) and other minor adjustments (K18.8 million) by year end.
To proactively manage these pressures, the Government introduced the 2017 Supplementary Budget, which approved a reduction in Capital Expenditure of K1,268.3 million and Operational Expenditure of K25.8 million (totalling K1,294.1 million) to be allocated to cover the K800.1 million in over expenditures noted above and the revenue shortfall of K494.0 million.
These adjustments, which included a significant reduction to the SIPs, were necessary to ensure that the planned deficit remained at K1,876.4 million or 2.5 per cent of GDP and the Debt to GDP ratio remained at 32.2 per cent.
Furthermore, in recognition of the difficult economic and fiscal conditions, the Government introduced its 100 Day’s Plan in an effort to mobilise greater revenue efforts, curtail certain expenditure categories and instigate a number of reviews, stimulate some urgent public investments, relieve the foreign exchange imbalance and improve governance. These measures have made a significant contribution to the fiscal consolidation efforts.

9.
1.2 Revenue
1.1.2 Total Revenue and Grants Total Revenue and Grants for 2017 totalled K11,525.1 million, K545.9 million or 5.0 per cent higher than the 2017 Supplementary Budget estimate. It is also K1,039.5 million or 9.9 per cent higher than the revenue collected in 2016. Excluding donor grants, domestic revenues have exceeded the 2017 Supplementary Budget projections, with a strong contribution from GST receipts and supported by higher than anticipated receipts from salaries and wages tax, dividend withholding tax, import taxes and excise duties. These measures more than compensated for the fall in corporate income tax1. Improved GST collections reflect the anticipated gradual recovery of the domestic economy from the recent drought, improvement in the foreign exchange imbalance and moderate improvements to commodity prices of PNG major export commodities. In addition to the improved economic climate, the revenue figures clearly illustrate improved compliance efforts by IRC which is a major focus of the Medium Term Revenue Strategy 2018-22 (MTRS). Of the K11,525.1 million, the Internal Revenue Commission (IRC) collected K7,468.8 million (64.8 per cent of total revenue) inclusive of GST & Bookmakers Turnover Taxes to provinces, which was K90.9 million or 1.2 per cent higher than the 2017 Supplementary Budget estimate of K7,377.9 million. It is also higher by K470.6 million (or 6.7 per cent) compared to the 2016 actuals. Similarly, PNG Customs collected K1,665.5 million, higher by K105.0 million or 6.7 per cent against the 2017 Supplementary Budget estimate of K1,560.5 million. Customs collections were higher by K249.7 million or 17.6 per cent against the 2016 actuals. Other Revenues (Non-Tax revenue) totalled K943.8 million, lower by K198.0 million or 17.3 per cent against the 2017 Supplementary Budget estimate. Dividends totalled K841.6 million, lower by K28.4 million or 3.3 per cent against the 2017 Supplementary Budget estimate of K870.0 million. Fees and Charges amounted to K82.9 million, lower by K133.8 million against the 2017 Supplementary Budget estimate of K216.7 million. Despite the lower outturns than projected in the Supplementary Budget, the 2017 outcome was still K310 million higher than the 2016 outturn. Donor Grants totalled K1,439.9 million, higher by K471.8 million or 48.7 per cent against the 2017 Supplementary Budget estimate of K968.1 million. Table 2 Total Revenue and Grants (Kina, Million)
2016 Actuals
2017 Budget
2017 Supp. Budget
2017 Outcome
Tax Revenue 8,421.6 9,158.2 8,869.3 9,141.4 Grants 1,430.0 968.1 968.1 1,439.9 Other Revenue 633.9 1,346.9 1,141.8 943.8 Total Revenue 10,485.5 11,473.2 10,979.2 11,525.1
Source: Department of Treasury *The 2017 Total Revenue and Grants outcome is reported under the 2014 GFS reporting.
1 Company Tax collections is subject to a two to three years lag. Also, firms are allowed to use GST refunds as an offset to corporate tax payments. This results in lower corporate receipts and lower GST refund amounts, noting the weak economic activity in 2015 and 2016.
10.
1.1.3 Tax Revenue
Taxes on Income, Profits and Capital Gains (TIPCG)
Given the subdued GDP growth rate, by mid- 2017 PNG was confronted with the prospects of a further decline in revenue collections. At the time of the 2017 Supplementary Budget, corporate tax collections were projected to be down by almost K500 million compared to 2016. This was in part due to income tax receipts being offset against GST refunds that had not been paid. The minimal growth in adjusted (for GST offsets) corporate income tax was indicative of the subdued nature of the economy. Lower corporate tax collections also reflected the fact that losses were being carried forward from 2015-16 following the drought and lower commodity price environment. Personal income tax collections, however, were expected to be up by 5.0 per cent in 2017, despite the projected decline in employment levels in 2017 reflecting the increase in the public service wage bill.
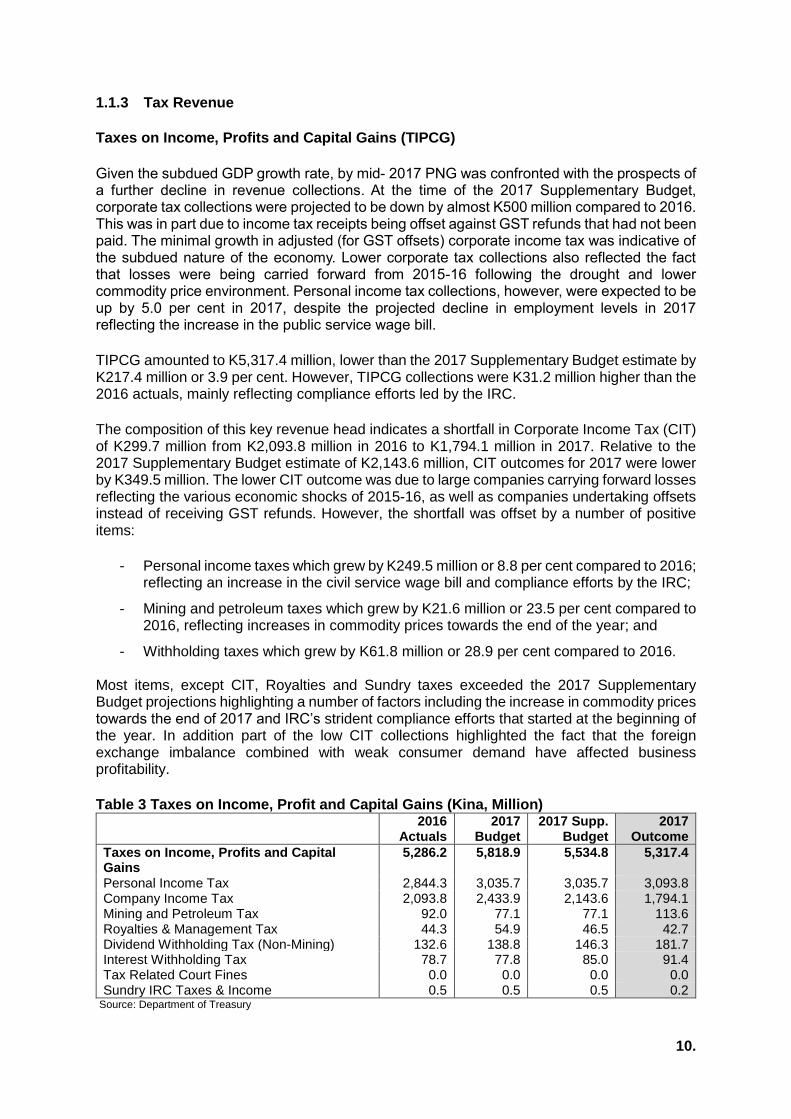
TIPCG amounted to K5,317.4 million, lower than the 2017 Supplementary Budget estimate by K217.4 million or 3.9 per cent. However, TIPCG collections were K31.2 million higher than the 2016 actuals, mainly reflecting compliance efforts led by the IRC.
The composition of this key revenue head indicates a shortfall in Corporate Income Tax (CIT) of K299.7 million from K2,093.8 million in 2016 to K1,794.1 million in 2017. Relative to the 2017 Supplementary Budget estimate of K2,143.6 million, CIT outcomes for 2017 were lower by K349.5 million. The lower CIT outcome was due to large companies carrying forward losses reflecting the various economic shocks of 2015-16, as well as companies undertaking offsets instead of receiving GST refunds. However, the shortfall was offset by a number of positive items:
- Personal income taxes which grew by K249.5 million or 8.8 per cent compared to 2016; reflecting an increase in the civil service wage bill and compliance efforts by the IRC;
- Mining and petroleum taxes which grew by K21.6 million or 23.5 per cent compared to 2016, reflecting increases in commodity prices towards the end of the year; and
- Withholding taxes which grew by K61.8 million or 28.9 per cent compared to 2016.
Most items, except CIT, Royalties and Sundry taxes exceeded the 2017 Supplementary Budget projections highlighting a number of factors including the increase in commodity prices towards the end of 2017 and IRC’s strident compliance efforts that started at the beginning of the year. In addition part of the low CIT collections highlighted the fact that the foreign exchange imbalance combined with weak consumer demand have affected business profitability.
Table 3 Taxes on Income, Profit and Capital Gains (Kina, Million) 2016
Actuals 2017
Budget 2017 Supp.
Budget 2017
Outcome
Taxes on Income, Profits and Capital Gains
5,286.2 5,818.9 5,534.8 5,317.4
Personal Income Tax 2,844.3 3,035.7 3,035.7 3,093.8 Company Income Tax 2,093.8 2,433.9 2,143.6 1,794.1 Mining and Petroleum Tax 92.0 77.1 77.1 113.6 Royalties & Management Tax 44.3 54.9 46.5 42.7 Dividend Withholding Tax (Non-Mining) 132.6 138.8 146.3 181.7 Interest Withholding Tax 78.7 77.8 85.0 91.4 Tax Related Court Fines 0.0 0.0 0.0 0.0 Sundry IRC Taxes & Income 0.5 0.5 0.5 0.2
Source: Department of Treasury
11.
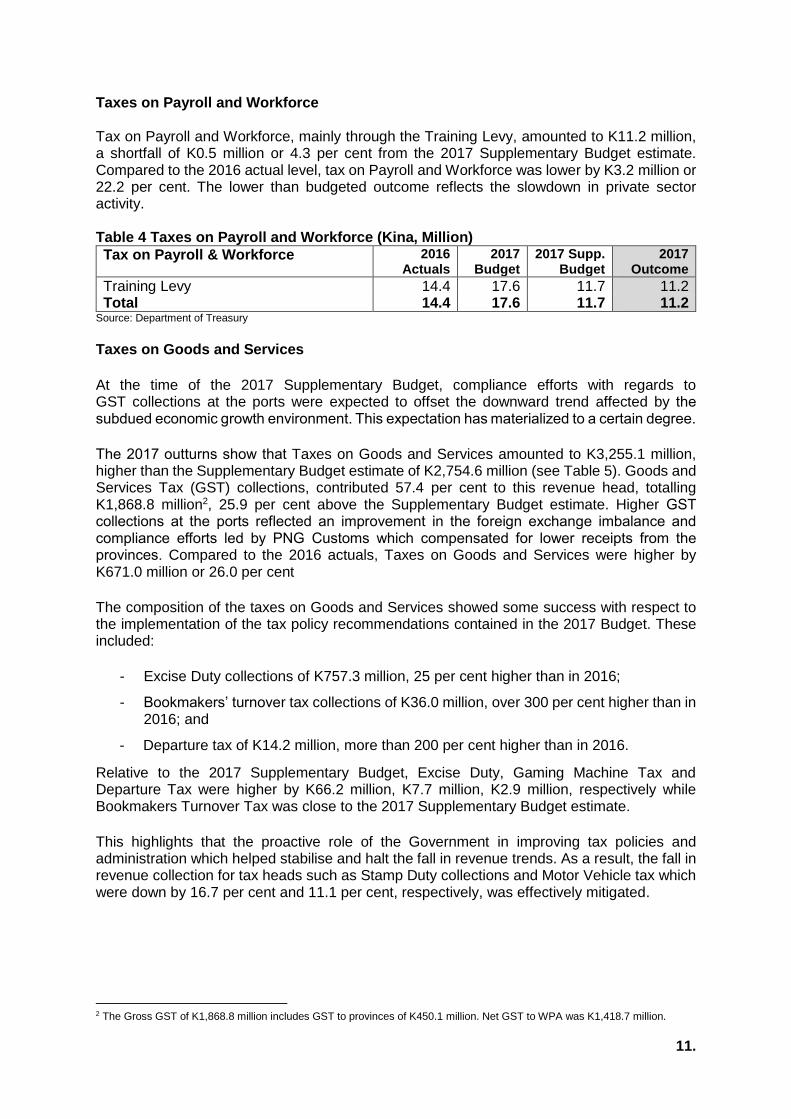
Taxes on Payroll and Workforce Tax on Payroll and Workforce, mainly through the Training Levy, amounted to K11.2 million, a shortfall of K0.5 million or 4.3 per cent from the 2017 Supplementary Budget estimate. Compared to the 2016 actual level, tax on Payroll and Workforce was lower by K3.2 million or 22.2 per cent. The lower than budgeted outcome reflects the slowdown in private sector activity. Table 4 Taxes on Payroll and Workforce (Kina, Million)
Tax on Payroll & Workforce 2016 Actuals
2017 Budget
2017 Supp. Budget
2017 Outcome
Training Levy 14.4 17.6 11.7 11.2 Total 14.4 17.6 11.7 11.2
Source: Department of Treasury
Taxes on Goods and Services
At the time of the 2017 Supplementary Budget, compliance efforts with regards to GST collections at the ports were expected to offset the downward trend affected by the subdued economic growth environment. This expectation has materialized to a certain degree.
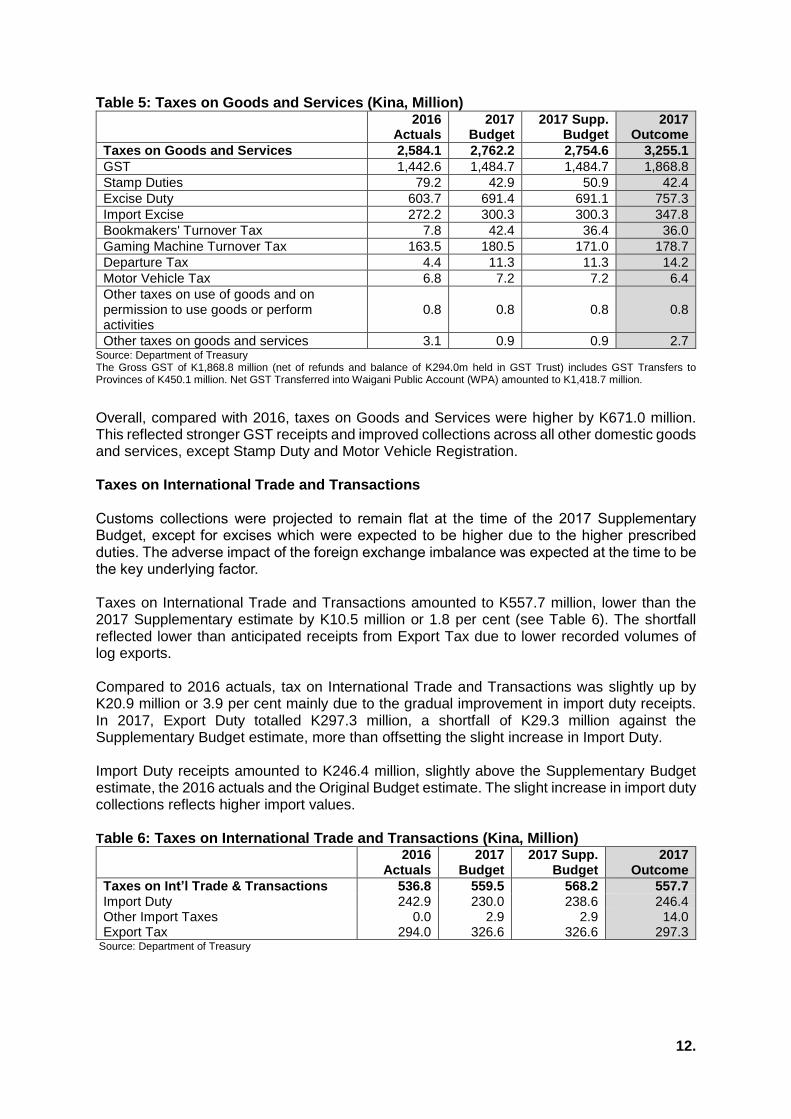
The 2017 outturns show that Taxes on Goods and Services amounted to K3,255.1 million, higher than the Supplementary Budget estimate of K2,754.6 million (see Table 5). Goods and Services Tax (GST) collections, contributed 57.4 per cent to this revenue head, totalling K1,868.8 million2, 25.9 per cent above the Supplementary Budget estimate. Higher GST collections at the ports reflected an improvement in the foreign exchange imbalance and compliance efforts led by PNG Customs which compensated for lower receipts from the provinces. Compared to the 2016 actuals, Taxes on Goods and Services were higher by K671.0 million or 26.0 per cent
The composition of the taxes on Goods and Services showed some success with respect to the implementation of the tax policy recommendations contained in the 2017 Budget. These included:
- Excise Duty collections of K757.3 million, 25 per cent higher than in 2016;
- Bookmakers’ turnover tax collections of K36.0 million, over 300 per cent higher than in 2016; and
- Departure tax of K14.2 million, more than 200 per cent higher than in 2016.
Relative to the 2017 Supplementary Budget, Excise Duty, Gaming Machine Tax and Departure Tax were higher by K66.2 million, K7.7 million, K2.9 million, respectively while Bookmakers Turnover Tax was close to the 2017 Supplementary Budget estimate.
This highlights that the proactive role of the Government in improving tax policies and administration which helped stabilise and halt the fall in revenue trends. As a result, the fall in revenue collection for tax heads such as Stamp Duty collections and Motor Vehicle tax which were down by 16.7 per cent and 11.1 per cent, respectively, was effectively mitigated.
2 The Gross GST of K1,868.8 million includes GST to provinces of K450.1 million. Net GST to WPA was K1,418.7 million.
12.
Table 5: Taxes on Goods and Services (Kina, Million)
2016
Actuals 2017
Budget 2017 Supp.
Budget 2017
Outcome
Taxes on Goods and Services 2,584.1 2,762.2 2,754.6 3,255.1
GST 1,442.6 1,484.7 1,484.7 1,868.8
Stamp Duties 79.2 42.9 50.9 42.4
Excise Duty 603.7 691.4 691.1 757.3
Import Excise 272.2 300.3 300.3 347.8
Bookmakers' Turnover Tax 7.8 42.4 36.4 36.0
Gaming Machine Turnover Tax 163.5 180.5 171.0 178.7
Departure Tax 4.4 11.3 11.3 14.2
Motor Vehicle Tax 6.8 7.2 7.2 6.4
Other taxes on use of goods and on permission to use goods or perform activities
0.8 0.8 0.8 0.8
Other taxes on goods and services 3.1 0.9 0.9 2.7 Source: Department of Treasury The Gross GST of K1,868.8 million (net of refunds and balance of K294.0m held in GST Trust) includes GST Transfers to Provinces of K450.1 million. Net GST Transferred into Waigani Public Account (WPA) amounted to K1,418.7 million.
Overall, compared with 2016, taxes on Goods and Services were higher by K671.0 million. This reflected stronger GST receipts and improved collections across all other domestic goods and services, except Stamp Duty and Motor Vehicle Registration. Taxes on International Trade and Transactions Customs collections were projected to remain flat at the time of the 2017 Supplementary Budget, except for excises which were expected to be higher due to the higher prescribed duties. The adverse impact of the foreign exchange imbalance was expected at the time to be the key underlying factor. Taxes on International Trade and Transactions amounted to K557.7 million, lower than the 2017 Supplementary estimate by K10.5 million or 1.8 per cent (see Table 6). The shortfall reflected lower than anticipated receipts from Export Tax due to lower recorded volumes of log exports. Compared to 2016 actuals, tax on International Trade and Transactions was slightly up by K20.9 million or 3.9 per cent mainly due to the gradual improvement in import duty receipts. In 2017, Export Duty totalled K297.3 million, a shortfall of K29.3 million against the Supplementary Budget estimate, more than offsetting the slight increase in Import Duty. Import Duty receipts amounted to K246.4 million, slightly above the Supplementary Budget estimate, the 2016 actuals and the Original Budget estimate. The slight increase in import duty collections reflects higher import values. Table 6: Taxes on International Trade and Transactions (Kina, Million)
2016 Actuals
2017 Budget
2017 Supp. Budget
2017 Outcome
Taxes on Int’l Trade & Transactions 536.8 559.5 568.2 557.7 Import Duty 242.9 230.0 238.6 246.4 Other Import Taxes 0.0 2.9 2.9 14.0 Export Tax 294.0 326.6 326.6 297.3
Source: Department of Treasury

13.
1.2.3. Grants Donor Grants amounted to K1,439.9 million, a large part of it coming from Australian Aid (AusAID). This outcome is higher than the 2017 Supplementary Budget estimate of K968.1 million by K471.8 million or 48.7 per cent (Table 7). Compared to 2016 actuals, Donor Grants were higher by K9.9 million or 0.7 per cent. Table 7: Grants (Kina, Million)
2016
Actuals 2017
Budget 2017 Supp.
Budget 2017
Outcome
GRANTS 1430.1 968.1 968.1 1,439.9 From Foreign Governments 1261.4 829.4 829.4 1,281.9 Current 1207.1 663.5 663.5 1,025.5
Cash 0.0 0.0 0.0 0.0
In-Kind 1207.1 663.5 663.5 1,025.5 Capital 54.3 165.9 165.9 256.4
Cash 0.0 0.0 0.0 0.0
In-Kind 54.3 165.9 165.9 256.4 From International Organizations 168.7 138.7 138.7 158.0 Current 147.0 111.0 111.0 126.4
Cash 0.0 0.0 0.0 0.0
In-Kind 147.0 111.0 111.0 126.4 Capital 21.7 27.7 27.7 31.6
Cash 0.0 0.0 0.0 0.0
In-Kind 21.7 27.7 27.7 31.6 Source: Department of Treasury and Department of National Planning and Monitoring
1.1.4 Other Revenue Collections of Other Revenue (non-tax revenue) amounted to K943.8 million in 2017. This is lower than the 2017 Supplementary Budget estimate by K198.0 million or 17.3 per cent (see Table 8). The shortfall in Other Revenue primarily reflects lower than anticipated receipts from fees and charges and a small portion from dividends. The dividends paid in 2017 amounted to K841.6 million slightly down by K28.4 million or 3.3 per cent compared to the Supplementary Budget estimate of K870.0 million. However, against the 2016 actuals of K528.9 million, dividends are significantly higher by K312.7 million or 59.1 per cent. Of the K841.6 million in dividends paid in 2017, Kumul Petroleum Holdings Ltd (KPHL) paid K300.0 million, the Bank of PNG (BPNG) paid K100.0 million, the Ok Tedi Mine paid K262.3 million and the National Fisheries Authority paid K179.1 million. Only KCH has not paid its projected dividend of K20.0 million in the 2017 Supplementary Budget. The improved dividend collections in 2017 are part of the 100 Day’s Plan aimed at ensuring mining and petroleum projects and SOEs pay their full share of dividends to the State. Fees and Charges amounted to K82.9 million, lower by K133.8 million against the 2017 Supplementary Budget estimate of K216.7 million. This is mainly attributed to weak collections from land lease rentals, administrative fees and work permits, and delays in balance transfers from State entities.

14.
Table 8: Other Revenue (Kina, Million)
2016
Actuals 2017
Budget 2017 Supp.
Budget 2017
Outcome
OTHER REVENUE 633.9 1,346.9 1,141.8 943.8
Property Income 551.3 1,130.1 925.1 860.9
Interest 0.0 0.0 4.0 0.0
Dividends 528.9 1,075 870.0 841.6
Mining Petroleum and Gas Dividends 300.5 500.0 600.0 562.3
Dividends from Statutory Authorities 225.0 375.0 200.0 279.3
Dividends from State Owned Enterprises 0.0 125.0 20.0 0.0
Other Dividends 3.4 75.0 0.0 0.0
Rent 22.4 51.1 51.1 19.3
Sales of goods and services 63.5 115.2 115.2 62.8
Administrative fees 28.7 62.8 62.8 22.9
Incidental sales by nonmarket establishments
34.9 52.4 24.0 39.9
Fines, penalties, and forfeits 1.8 0.8 0.8 1.6
Transfers not elsewhere classified 17.2 0.8 100.7 18.5
Current transfers not elsewhere classified 17.2 100.8 100.7 18.5 Source: Department of Treasury
1.3 Expenditure and Net Lending
Total Expenditure and Net Lending in 2017 was K13,319.7 million. Compared to the 2017 Supplementary Budget estimate of K12,855.6 million, the 2017 Budget outcome is K464.15 million (or 3.6 per cent) higher. This reflects expenditure overruns, especially in compensation of employees (PE) and debt service categories offsetting reductions to grant expenditures. It also reflects donor grant related expenditure being 48.7 per cent higher than budgeted in the 2017 Supplementary. Project expenditure funded by concessional loans was also higher by 27.2 per cent than budgeted in the Supplementary. Compared to the 2017 Original Budget estimate of K13,349.5 million, the 2017 outcome is
K29.8 million (or 0.2 per cent) lower. Similarly, it is lower by K252.7 million (or 1.9 per cent)
compared to the 2016 outcome. This decrease was a result of the Government’s strong commitment in cutting down on less productive expenditures and effectively reprioritising expenditures through the 2017 Supplementary Budget. Table 9: Expenditure by Funding Source 2016-17 (Kina Million)
Sources of Funding 2016
Actuals 2017
Budget 2017 Supp.
Budget 2017
Outcome
Domestic Funding 11,148.6 11,928.6 11,434.7 11,303.7 Operational1 9,099.0 9,336.2 10,036.3 10,152.3 Capital Investment 2,059.6 2,592.4 1,398.3 1,151.4
Project Support Grants 1,430.1 968.1 968.1 1,439.9 Concessional Loans 993.8 452.8 452.8 576.1
Total Expenditure and Net Lending 13,572.4 13,349.5 12,855.6 13,319.7 Source: Department of Treasury
1Inclusive of GST and Book makers Turn over tax to provinces in compliance with the 2014 GFS reporting requirement.
As at the end of 2017, domestically funded expenditure (i.e. GoPNG expenditure) was K11,303.7 million, K131.0 million or 1.1 per cent lower than the 2017 supplementary appropriation of K11,434.7 million. In aggregate, the 2017 outcome was driven by tighter expenditure controls resulting in a slowing down of the year-on-year growth rates of a number of expenditure heads. Structural
15.
issues, such as PE, that have grown significantly over the past few years and which have affected the Government’s consolidation efforts have been better monitored and managed post the 2017 Supplementary Budget. Compared to the 2017 Original Budget, the PE “blow out” increased by K501.7 million or 12.9 per cent. The original 2017 Budget reflected an overestimation of the pace at which this structural issue could be addressed. As a result, the Government in the 2018 Budget and its medium term fiscal strategy adopted more realistic projections of what could be achieved. Nevertheless, there are some encouraging signs. The 2017 compensation of employees (PE) final outcome is K113.2 million or 2.6 per cent higher than the 2017 Supplementary Budget of K4,263.2 million. Although this still represents an overspending, it has been reduced considerably compared to the 2016 over-expenditure of K470.1 million. The lower PE overrun for 2017 is attributed to solving issues related to the interface between Alesco and IFMS which in the past resulted in an artificially inflated PE number. It also reflects the proactive rebasing of PE from K3,874.6 million to K4,263.2 million at the time of the Supplementary Budget by reallocating funds from SIPs and other capital projects. Compared to the 2016 actual, public wage bill has increased by K354.8 million or 8.8 per cent. The trend in PE expenditure is projected to slow further over the medium term through the continuing work of OSPEAC and the implementation of the MTFS. In line with the 100 Day’s Plan, the Government is addressing this structural issue and the reform efforts by OSEPAC will be scaled up accordingly. Specifically the over-expenditure from the teachers’ salaries and wages continues to adversely affect the public wage bill. According to the Teachers’ Services Commission (TSC), the growth in teacher numbers has increased substantially since 2013 averaging 1,500 annually, outpacing the growth in the appropriation. This issue will be addressed in the medium term as presented in the MTFS. Detailed data on expenditure on Goods and Services and PE for all agencies is reflected in Part 2 of this document using the GFS 1986 classification.
Total capital investment expenditure, comprising domestically funded and funding through concessional loans and project support grants from donors was K3,167.4 million in 2017, K348.2 million or 12.4 per cent higher than the 2017 Supplementary Budget estimate of K2,819.3 million. The domestically funded investment underspending of K246.9 million was more than compensated by higher drawdowns from concessional loan funding investments by K123.3 million and donor grant investments by K471.8 million. This reflects the Government’s strategy to stabilise its spending while partnering with donors to finance and implement a number of high impact projects. Compared to the 2016 outcome, total capital investment declined by K1,316.1 million, taking into account the new GFS reporting framework (GFS 2014), which excludes Tax Credits under expenditure in the 2016 actuals. This highlights the fact that in recent years the burden of fiscal adjustment has fallen principally on capital expenditures, a trend that the Government will address in the 2018 Budget and over the medium term to support the economic recovery. The domestically funded capital investment final outcome was K1,151.4 million, a K246.9 million reduction against the 2017 Supplementary Budget estimate of K1,398.3 million. This reduction reflects careful reprioritisation of key national infrastructure projects, refocusing capital investment on projects with high implementation and disbursement rates and limiting expenditure on non-productive capital expenditure.

16.
The net concessional loan funding capital investment was K576.1 million in 2017, K123.3 million higher than the 2017 Supplementary Budget estimate of K452.8 million. As in the 2016 fiscal year, improved project implementation led to actual drawdowns being higher than the original projections for 2017. Compared to 2016, drawdown rates were lower reflecting constraints on counterpart funding requirements. Project Support Grant expenditure was K1,439.9 million in 2017, which is K471.8 million higher than the 2017 Supplementary Budget estimate of K968.1 million. The higher reported figure is partly due to exchange rate movements against the respective currencies of Development Partners and partly due to the strategy of leveraging donor funding for a number of projects. Table 10: Expenditure by Agency Type 2016-17 [Excluding Donor Grants, and Concessional Loans] (Kina Million)
Agency Type 2016
Actuals 2017
Budget 2017 Supp.
Budget 2017
Outcome
National Departments 5,390.3 5,909.8 6,279.0 5,728.3 Provincial Government1 3,658.4 3,721.6 2,772.2 3,178.5 Autonomous Bougainville Govt. 211.0 248.5 218.6 165.2 Commercial & Statutory Authority 624.6 665.8 632.0 597.9 Interest Payment 1,264.3 1,382.9 1,532.8 1,633.9
Grand Total 11,148.6 11,928.6 11,434.1 11,303.7 Source: Department of Treasury
1Inclusive of GST and Book makers Turn over tax to provinces in compliance with the 2014 GFS reporting requirement.
The GoPNG funded expenditure outcome for National Departments, against the Supplementary Budget, was lower by K550.7 million and for Commercial and Statutory Authorities (CSA) was lower by K34.1 million. Similarly, the total expenditure outcome for the Autonomous Bougainville Government (ABG) was K165.2 million, which was K53.4 million or 24.4 per cent lower than the 2017 Supplementary Budget. These savings reflect substantial reductions to goods and services outlays to these areas. In contrast Provincial Government expenditure was higher by K406.3 million, mainly driven by an overspending on PE. Efforts such as the roll out of the IFMS are ongoing at the provincial level to better control PE and overall expenditure. Compared to the 2016 outcomes, GoPNG funded expenditure decreased to Provincial Governments (lower by K479.9 million), ABG (lower by K45.8 million) and CSAs (lower by K26.6 million). In contrast National Departmental expenditure increased by K337.9 million but this predominately reflected an increase needed to clear some of the arrears accumulated in the recent past. Total Interest Payments and Fees in 2017 was K1,524.9 million3 (see table 11). This is K276.8 million or 9.3 per cent higher than the 2016 actual. This reflected primarily the sharp increase in the cost of domestic borrowing attributed to an increase in roll-over costs of Treasury Bills given the limits on further domestic market borrowing. Compared to the 2016 outcome, total interest payments and fees were K276.8 million (22.1 per cent) higher.
3 AS per GFS 2014 Classification, actually payment of Interest is stated as K1,524.9 million and fees and charges of K109.0 million are captured under use of goods and services amounting to K1,633.9 . million
17.
Table 11: GoPNG Domestic Funding by 2014 GFS Functional Classification of Expense by Economic Item Type 2016-17 [Excluding Donor Grants, and Concessional Loans]4 (Kina Million)
Economic Item 2016 Actual
2017 Budget
2017 Suppl.
Budget 2017
Outcome
Compensation of Employees 4,463.4 3,874.6 4,263.2 4,376.4
Wages and salaries 4,021.6 3,516.2 3,858.9 4,201.2
Wages and salaries in cash 3,901.7 3,418.3 3,748.6 4,093.7
Wages and salaries in kind 119.9 97.9 110.3 107.4
Employers' social contributions 441.8 358.4 404.2 175.2
Actual employers’ social contributions 441.8 358.4 404.2 175.2
Use of goods and services 2,776.9 3,533.5 3,448.9 3,365.0
Use of goods and services 2,776.9 3,533.5 3,448.9 3,365.0
Grants 1,885.2 2,263.7 1,394.6 1,342.9
Grants to other general government units 1,885.2 2,263.7 1,394.6 1,342.9
Interest* 1,248.1 1,365.7 1,515.6 1,524.9
To non-residents 77.0 167.9 167.9 168.9
To residents other than general government 1,171.1 1,197.8 1,347.8 1,356.0
Net Acquisition Nonfinancial assets 677.9 812.7 717.1 601.2
Acquisition of Fixed assets (Buildings and Structures) 677.9 812.7 717.1 601.2
Other expenses 92.1 78.3 95.3 93.4
Transfers not elsewhere classified 92.1 78.3 95.3 93.3
Grand Total 11,148.3 11,928.5 11,434.7 11,303.7 Source: Department of Treasury
¹Captures pure interest payments. Other debt service related costs are captured under Uses of Goods and Services. *Bookmakers Turnover Tax and GST Transfers are excluded in this table as there are insufficient data on how these funds are being spent at the provincial level.
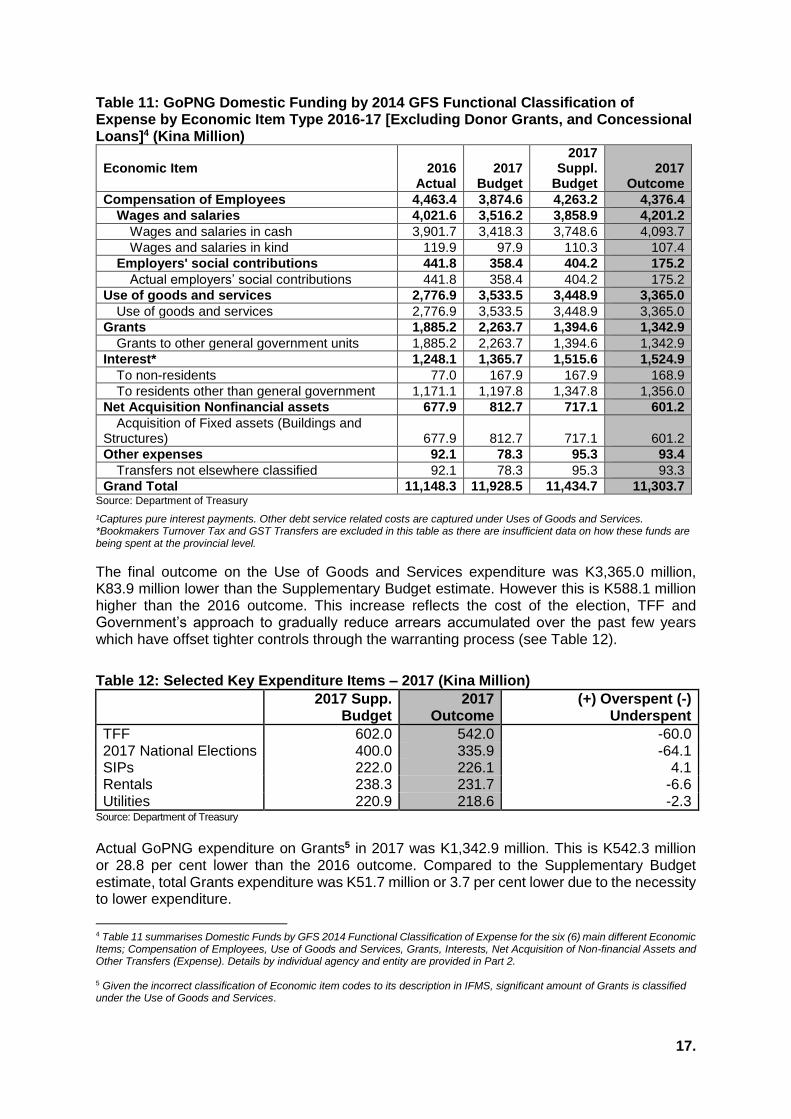
The final outcome on the Use of Goods and Services expenditure was K3,365.0 million, K83.9 million lower than the Supplementary Budget estimate. However this is K588.1 million higher than the 2016 outcome. This increase reflects the cost of the election, TFF and Government’s approach to gradually reduce arrears accumulated over the past few years which have offset tighter controls through the warranting process (see Table 12).
Table 12: Selected Key Expenditure Items – 2017 (Kina Million)
2017 Supp.
Budget 2017
Outcome (+) Overspent (-)
Underspent
TFF 602.0 542.0 -60.0 2017 National Elections 400.0 335.9 -64.1 SIPs 222.0 226.1 4.1 Rentals 238.3 231.7 -6.6 Utilities 220.9 218.6 -2.3
Source: Department of Treasury
Actual GoPNG expenditure on Grants5 in 2017 was K1,342.9 million. This is K542.3 million or 28.8 per cent lower than the 2016 outcome. Compared to the Supplementary Budget estimate, total Grants expenditure was K51.7 million or 3.7 per cent lower due to the necessity to lower expenditure.
4 Table 11 summarises Domestic Funds by GFS 2014 Functional Classification of Expense for the six (6) main different Economic Items; Compensation of Employees, Use of Goods and Services, Grants, Interests, Net Acquisition of Non-financial Assets and Other Transfers (Expense). Details by individual agency and entity are provided in Part 2. 5 Given the incorrect classification of Economic item codes to its description in IFMS, significant amount of Grants is classified under the Use of Goods and Services.
18.
GoPNG’s Net Acquisition of Nonfinancial Assets6 expenditure in 2017 was K601.2 million. This is K76.7 million or 11.3 per cent lower than the 2016 outcome. Compared with the 2017 Supplementary Budget estimate, Net Acquisition of Nonfinancial Assets was K115.8 million or 16.2 per cent lower. Overall, the improved revenue performance (higher by K474.4 million) offset part of the overspending (higher by K324.2 million) thus allowing the Government to meet its obligations to lower the deficit, keep borrowing under control and reduce its arrears. 1.4 Financing
The Net Borrowing (deficit) outcome for 2017 was K1,794.7 million (or 2.4 per cent of GDP). Actual net incurrence of liabilities (i.e. borrowing) for 2017 was at K1,614.3 million; with the remainder of K180.4 million being financed by a drawdown in cash balances by revenue generating agencies7 . The fiscal balance presents a significant improvement compared to the K3,086.9 million (or 4.6 per cent of GDP) recorded at the end of 2016 and the 3.8 per cent of GDP projected at the time of the MYEFO. It is below the projected K1,876.4 million (or 2.5 per cent of GDP) projected in the 2017 Supplementary Budget. This improved performance highlights Government’s commitment to fiscal discipline as stated in the Alotau Accord 2 and operationalised in the 100 Day’s Plan.
The reduction in the budget deficit in 2017 and the debt to GDP ratio are consistent with the new Medium Term Debt Strategy and well within the limits imposed by the Fiscal Responsibility Act. These improved trends will also assist in providing a robust framework that will underpin the Development Policy Operations (budget support) scheduled for 2018 by the World Bank (WB) and Asian Development Bank (ADB). It will also contribute in providing a lower risk environment for external loan applications.
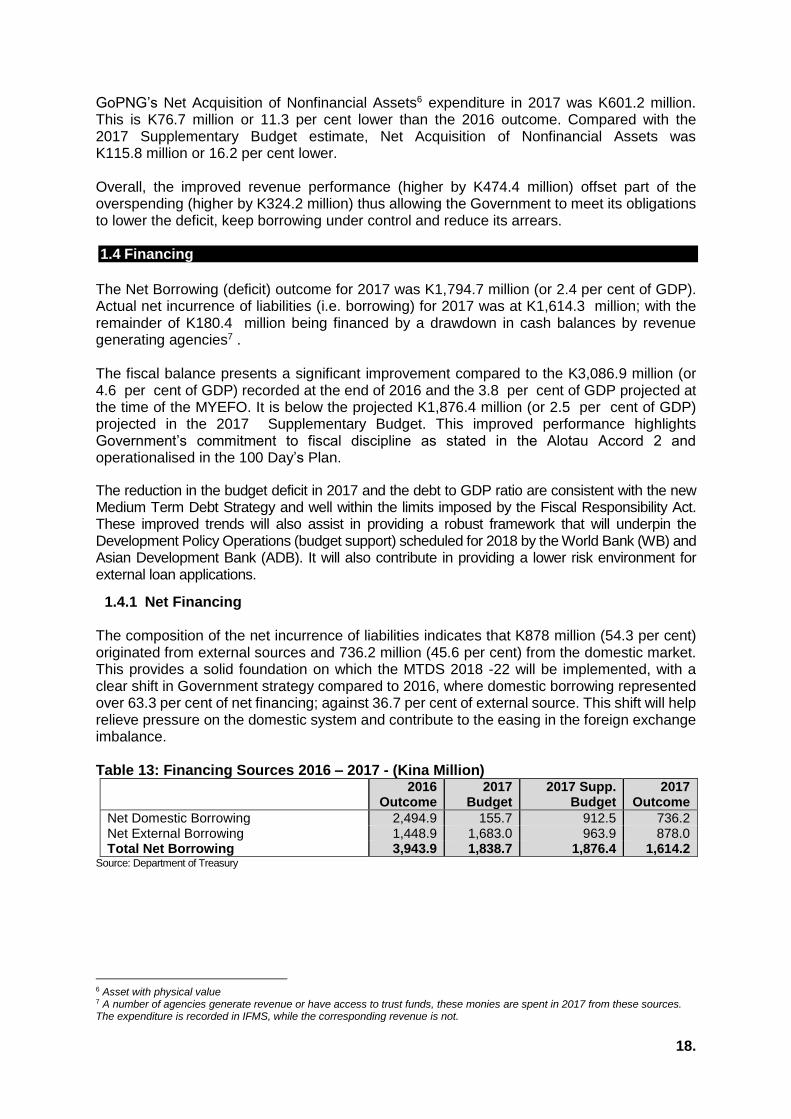
1.4.1 Net Financing The composition of the net incurrence of liabilities indicates that K878 million (54.3 per cent) originated from external sources and 736.2 million (45.6 per cent) from the domestic market. This provides a solid foundation on which the MTDS 2018 -22 will be implemented, with a clear shift in Government strategy compared to 2016, where domestic borrowing represented over 63.3 per cent of net financing; against 36.7 per cent of external source. This shift will help relieve pressure on the domestic system and contribute to the easing in the foreign exchange imbalance. Table 13: Financing Sources 2016 – 2017 - (Kina Million)
2016
Outcome 2017
Budget 2017 Supp.
Budget 2017
Outcome
Net Domestic Borrowing 2,494.9 155.7 912.5 736.2 Net External Borrowing 1,448.9 1,683.0 963.9 878.0 Total Net Borrowing 3,943.9 1,838.7 1,876.4 1,614.2
Source: Department of Treasury
6 Asset with physical value 7 A number of agencies generate revenue or have access to trust funds, these monies are spent in 2017 from these sources. The expenditure is recorded in IFMS, while the corresponding revenue is not.
19.
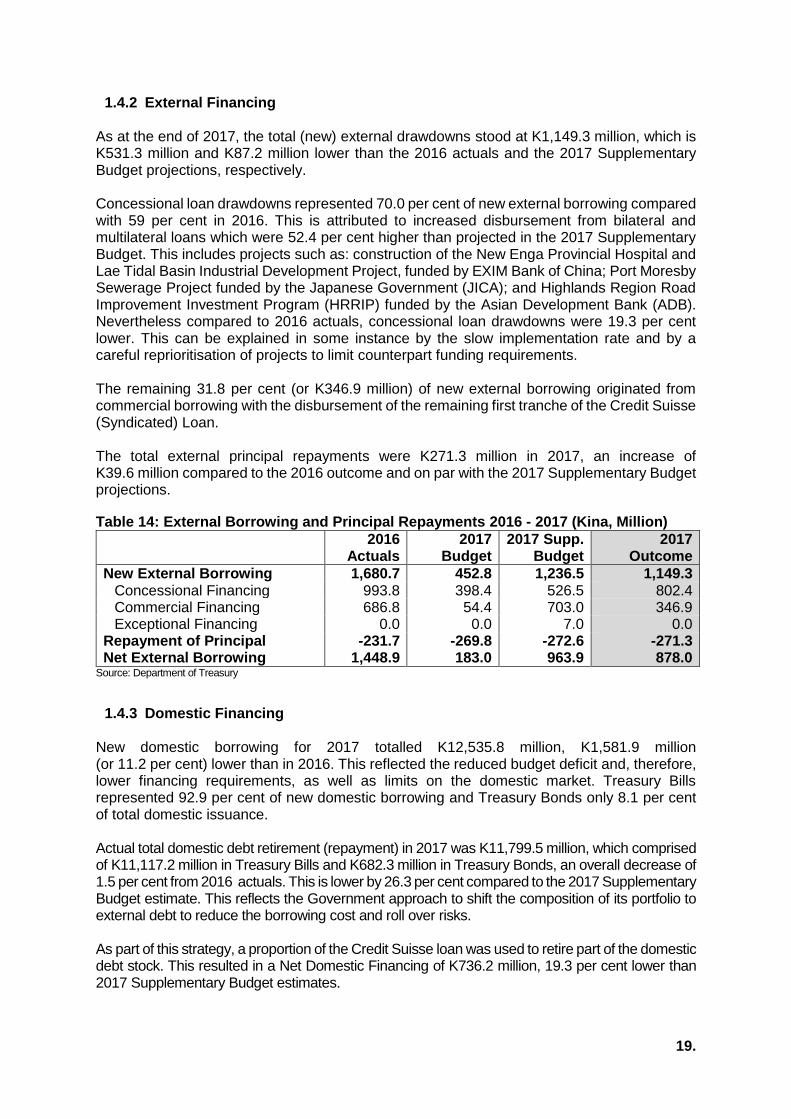
1.4.2 External Financing As at the end of 2017, the total (new) external drawdowns stood at K1,149.3 million, which is K531.3 million and K87.2 million lower than the 2016 actuals and the 2017 Supplementary Budget projections, respectively. Concessional loan drawdowns represented 70.0 per cent of new external borrowing compared with 59 per cent in 2016. This is attributed to increased disbursement from bilateral and multilateral loans which were 52.4 per cent higher than projected in the 2017 Supplementary Budget. This includes projects such as: construction of the New Enga Provincial Hospital and Lae Tidal Basin Industrial Development Project, funded by EXIM Bank of China; Port Moresby Sewerage Project funded by the Japanese Government (JICA); and Highlands Region Road Improvement Investment Program (HRRIP) funded by the Asian Development Bank (ADB). Nevertheless compared to 2016 actuals, concessional loan drawdowns were 19.3 per cent lower. This can be explained in some instance by the slow implementation rate and by a careful reprioritisation of projects to limit counterpart funding requirements. The remaining 31.8 per cent (or K346.9 million) of new external borrowing originated from commercial borrowing with the disbursement of the remaining first tranche of the Credit Suisse (Syndicated) Loan. The total external principal repayments were K271.3 million in 2017, an increase of K39.6 million compared to the 2016 outcome and on par with the 2017 Supplementary Budget projections.
Table 14: External Borrowing and Principal Repayments 2016 - 2017 (Kina, Million)
2016 Actuals
2017 Budget
2017 Supp. Budget
2017 Outcome
New External Borrowing 1,680.7 452.8 1,236.5 1,149.3 Concessional Financing 993.8 398.4 526.5 802.4 Commercial Financing 686.8 54.4 703.0 346.9 Exceptional Financing 0.0 0.0 7.0 0.0
Repayment of Principal -231.7 -269.8 -272.6 -271.3 Net External Borrowing 1,448.9 183.0 963.9 878.0
Source: Department of Treasury
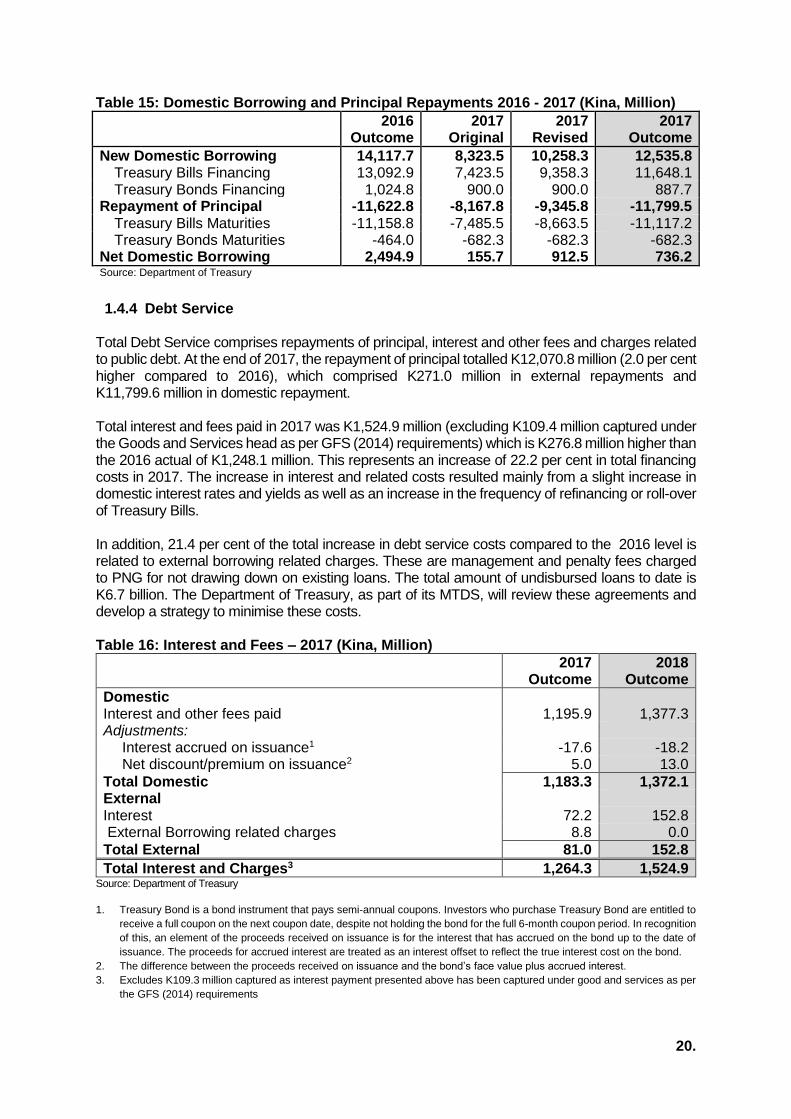
1.4.3 Domestic Financing New domestic borrowing for 2017 totalled K12,535.8 million, K1,581.9 million (or 11.2 per cent) lower than in 2016. This reflected the reduced budget deficit and, therefore, lower financing requirements, as well as limits on the domestic market. Treasury Bills represented 92.9 per cent of new domestic borrowing and Treasury Bonds only 8.1 per cent of total domestic issuance. Actual total domestic debt retirement (repayment) in 2017 was K11,799.5 million, which comprised of K11,117.2 million in Treasury Bills and K682.3 million in Treasury Bonds, an overall decrease of 1.5 per cent from 2016 actuals. This is lower by 26.3 per cent compared to the 2017 Supplementary Budget estimate. This reflects the Government approach to shift the composition of its portfolio to external debt to reduce the borrowing cost and roll over risks. As part of this strategy, a proportion of the Credit Suisse loan was used to retire part of the domestic debt stock. This resulted in a Net Domestic Financing of K736.2 million, 19.3 per cent lower than 2017 Supplementary Budget estimates.
20.
Table 15: Domestic Borrowing and Principal Repayments 2016 - 2017 (Kina, Million)
2016
Outcome 2017
Original 2017
Revised 2017
Outcome
New Domestic Borrowing 14,117.7 8,323.5 10,258.3 12,535.8 Treasury Bills Financing 13,092.9 7,423.5 9,358.3 11,648.1 Treasury Bonds Financing 1,024.8 900.0 900.0 887.7
Repayment of Principal -11,622.8 -8,167.8 -9,345.8 -11,799.5 Treasury Bills Maturities -11,158.8 -7,485.5 -8,663.5 -11,117.2 Treasury Bonds Maturities -464.0 -682.3 -682.3 -682.3
Net Domestic Borrowing 2,494.9 155.7 912.5 736.2 Source: Department of Treasury
1.4.4 Debt Service Total Debt Service comprises repayments of principal, interest and other fees and charges related to public debt. At the end of 2017, the repayment of principal totalled K12,070.8 million (2.0 per cent higher compared to 2016), which comprised K271.0 million in external repayments and K11,799.6 million in domestic repayment. Total interest and fees paid in 2017 was K1,524.9 million (excluding K109.4 million captured under the Goods and Services head as per GFS (2014) requirements) which is K276.8 million higher than the 2016 actual of K1,248.1 million. This represents an increase of 22.2 per cent in total financing costs in 2017. The increase in interest and related costs resulted mainly from a slight increase in domestic interest rates and yields as well as an increase in the frequency of refinancing or roll-over of Treasury Bills. In addition, 21.4 per cent of the total increase in debt service costs compared to the 2016 level is related to external borrowing related charges. These are management and penalty fees charged to PNG for not drawing down on existing loans. The total amount of undisbursed loans to date is K6.7 billion. The Department of Treasury, as part of its MTDS, will review these agreements and develop a strategy to minimise these costs. Table 16: Interest and Fees – 2017 (Kina, Million)
2017 Outcome
2018 Outcome
Domestic Interest and other fees paid 1,195.9 1,377.3 Adjustments:
Interest accrued on issuance1 -17.6 -18.2 Net discount/premium on issuance2 5.0 13.0
Total Domestic 1,183.3 1,372.1 External Interest 72.2 152.8 External Borrowing related charges 8.8 0.0
Total External 81.0 152.8
Total Interest and Charges3 1,264.3 1,524.9 Source: Department of Treasury
1. Treasury Bond is a bond instrument that pays semi-annual coupons. Investors who purchase Treasury Bond are entitled to
receive a full coupon on the next coupon date, despite not holding the bond for the full 6-month coupon period. In recognition
of this, an element of the proceeds received on issuance is for the interest that has accrued on the bond up to the date of
issuance. The proceeds for accrued interest are treated as an interest offset to reflect the true interest cost on the bond.
2. The difference between the proceeds received on issuance and the bond’s face value plus accrued interest.
3. Excludes K109.3 million captured as interest payment presented above has been captured under good and services as per
the GFS (2014) requirements
21.
1.5 Public Debt
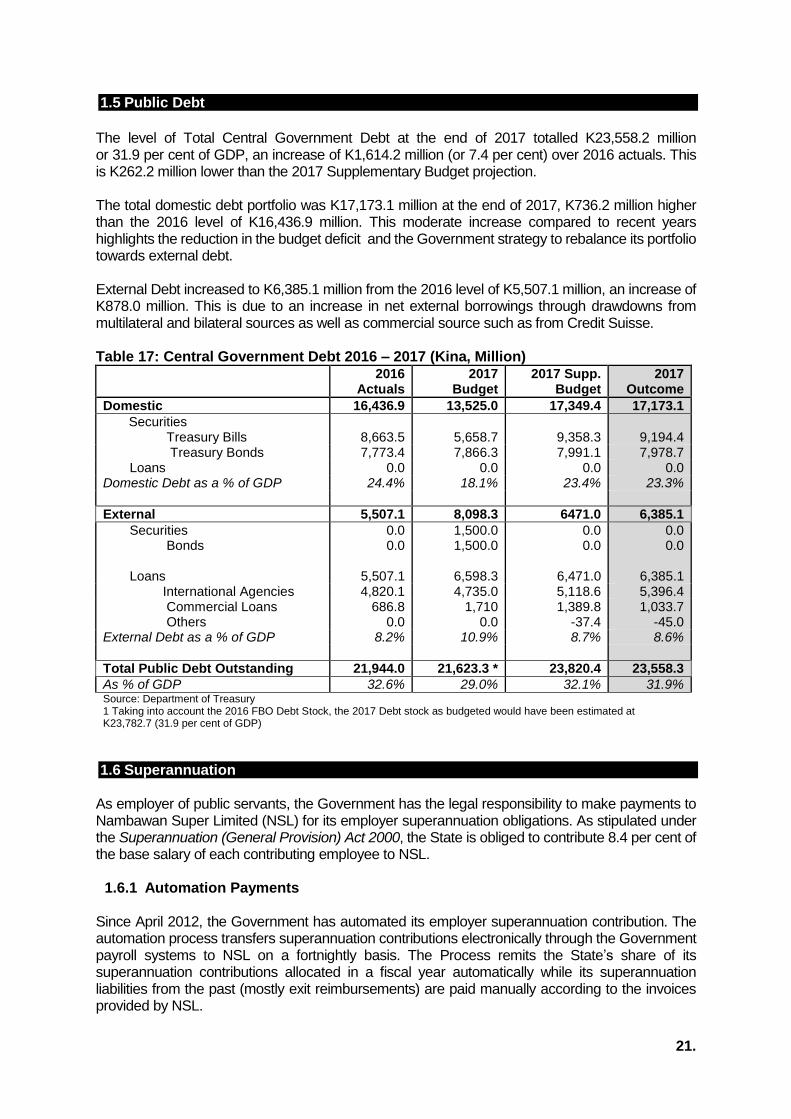
The level of Total Central Government Debt at the end of 2017 totalled K23,558.2 million or 31.9 per cent of GDP, an increase of K1,614.2 million (or 7.4 per cent) over 2016 actuals. This is K262.2 million lower than the 2017 Supplementary Budget projection. The total domestic debt portfolio was K17,173.1 million at the end of 2017, K736.2 million higher than the 2016 level of K16,436.9 million. This moderate increase compared to recent years highlights the reduction in the budget deficit and the Government strategy to rebalance its portfolio towards external debt. External Debt increased to K6,385.1 million from the 2016 level of K5,507.1 million, an increase of K878.0 million. This is due to an increase in net external borrowings through drawdowns from multilateral and bilateral sources as well as commercial source such as from Credit Suisse. Table 17: Central Government Debt 2016 – 2017 (Kina, Million)
2016
Actuals 2017
Budget 2017 Supp.
Budget 2017
Outcome
Domestic 16,436.9 13,525.0 17,349.4 17,173.1
Securities Treasury Bills
8,663.5
5,658.7 9,358.3 9,194.4
Treasury Bonds 7,773.4 7,866.3 7,991.1 7,978.7 Loans 0.0 0.0 0.0 0.0
Domestic Debt as a % of GDP 24.4% 18.1% 23.4% 23.3%
External 5,507.1 8,098.3 6471.0 6,385.1
Securities Bonds Loans
0.0 0.0
5,507.1
1,500.0 1,500.0
6,598.3
0.0 0.0
6,471.0
0.0 0.0
6,385.1
International Agencies 4,820.1 4,735.0 5,118.6 5,396.4 Commercial Loans 686.8 1,710 1,389.8 1,033.7 Others 0.0 0.0 -37.4 -45.0
External Debt as a % of GDP 8.2% 10.9% 8.7% 8.6%
Total Public Debt Outstanding 21,944.0 21,623.3 * 23,820.4 23,558.3
As % of GDP 32.6% 29.0% 32.1% 31.9% Source: Department of Treasury 1 Taking into account the 2016 FBO Debt Stock, the 2017 Debt stock as budgeted would have been estimated at K23,782.7 (31.9 per cent of GDP)
1.6 Superannuation
As employer of public servants, the Government has the legal responsibility to make payments to Nambawan Super Limited (NSL) for its employer superannuation obligations. As stipulated under the Superannuation (General Provision) Act 2000, the State is obliged to contribute 8.4 per cent of the base salary of each contributing employee to NSL.
1.6.1 Automation Payments Since April 2012, the Government has automated its employer superannuation contribution. The automation process transfers superannuation contributions electronically through the Government payroll systems to NSL on a fortnightly basis. The Process remits the State’s share of its superannuation contributions allocated in a fiscal year automatically while its superannuation liabilities from the past (mostly exit reimbursements) are paid manually according to the invoices provided by NSL.

22.
In 2017, the Government remitted the full appropriation of K182.0 million through the automation process which was paid directly to the NSL’s nominated account. In this year’s budget, the Government has appropriated K170.47 million for the automation in 2018. This process has significantly improved the financial certainty for both public servants and NSL, and reduced related financial and economic costs.
1.6.2 Exit Payments The Government also appropriates money annually to make exit payments to members who are owed payments prior to 2009 where the State did not fully meet its superannuation obligations as provided under the Act. Due to the fall in revenues as a result of low commodity prices, the Government has underfunded these superannuation obligations over past years. In 2017, the Government budgeted K90.0 million for exit payments owed to NSL. This enabled the Government to complete the reimbursements it owed to NSL for payments it made on behalf of the State to exiting members. It was also used to make payments directly to exiting members through NSL. In 2018, the Government increased the funding for this to K151.5 million. This allocation will be used to pay entitlements for exiting members. Despite the current economic challenge, the Government remains committed to addressing the remaining outstanding liabilities.
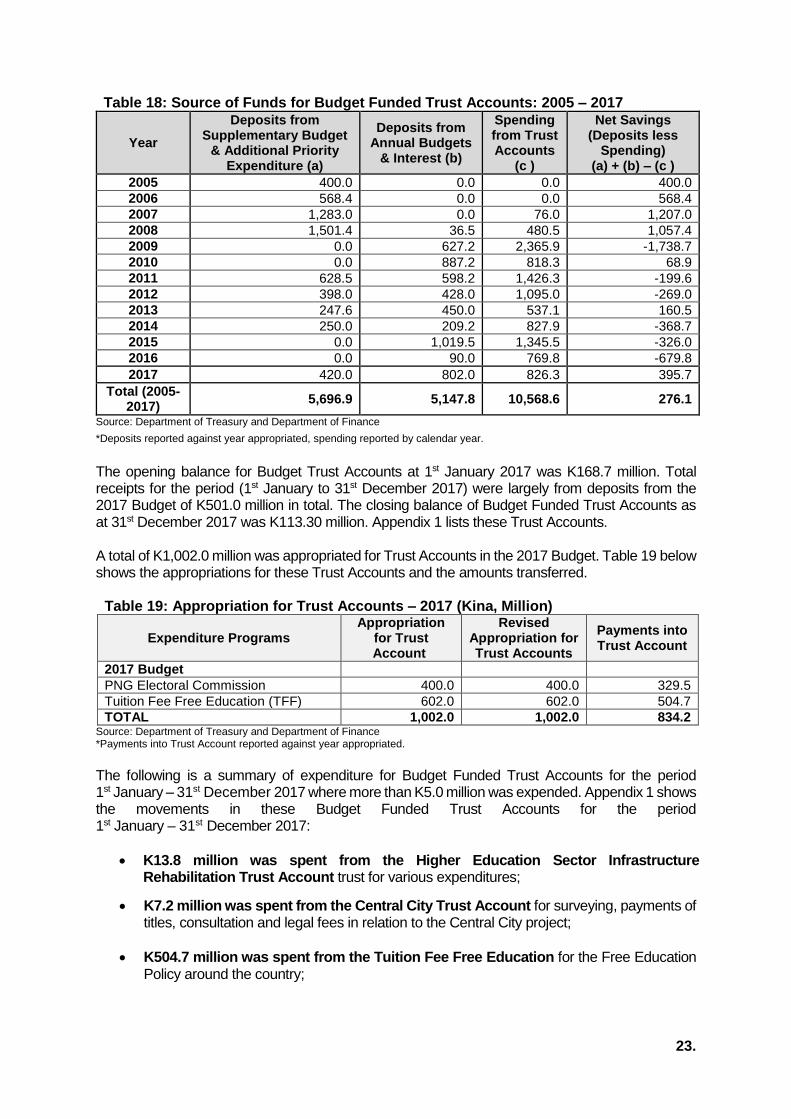
1.7 Trust Accounts Since 2005, a total of K11,756.7 million has been appropriated and deposited into the Budget Funded Trust Accounts for the implementation of expenditure programs. The Trust Accounts have largely been funded from additional mineral revenue in supplementary budgets and from annual budgets. The purpose of holding funds in trusts is to give time to agencies to properly plan and implement projects. Table 18 shows a summary of the movement of funds in and out of Budget Funded Trust Accounts from 2005 to 2017.
23.
Table 18: Source of Funds for Budget Funded Trust Accounts: 2005 – 2017
Year
Deposits from Supplementary Budget
& Additional Priority Expenditure (a)
Deposits from Annual Budgets
& Interest (b)
Spending from Trust Accounts
(c )
Net Savings (Deposits less
Spending) (a) + (b) – (c )
2005 400.0 0.0 0.0 400.0
2006 568.4 0.0 0.0 568.4
2007 1,283.0 0.0 76.0 1,207.0
2008 1,501.4 36.5 480.5 1,057.4
2009 0.0 627.2 2,365.9 -1,738.7
2010 0.0 887.2 818.3 68.9
2011 628.5 598.2 1,426.3 -199.6
2012 398.0 428.0 1,095.0 -269.0
2013 247.6 450.0 537.1 160.5
2014 250.0 209.2 827.9 -368.7
2015 0.0 1,019.5 1,345.5 -326.0
2016 0.0 90.0 769.8 -679.8
2017 420.0 802.0 826.3 395.7
Total (2005-2017)
5,696.9 5,147.8 10,568.6 276.1
Source: Department of Treasury and Department of Finance
*Deposits reported against year appropriated, spending reported by calendar year.
The opening balance for Budget Trust Accounts at 1st January 2017 was K168.7 million. Total receipts for the period (1st January to 31st December 2017) were largely from deposits from the 2017 Budget of K501.0 million in total. The closing balance of Budget Funded Trust Accounts as at 31st December 2017 was K113.30 million. Appendix 1 lists these Trust Accounts. A total of K1,002.0 million was appropriated for Trust Accounts in the 2017 Budget. Table 19 below shows the appropriations for these Trust Accounts and the amounts transferred.
Table 19: Appropriation for Trust Accounts – 2017 (Kina, Million)
Expenditure Programs Appropriation
for Trust Account
Revised Appropriation for Trust Accounts
Payments into Trust Account
2017 Budget
PNG Electoral Commission 400.0 400.0 329.5
Tuition Fee Free Education (TFF) 602.0 602.0 504.7
TOTAL 1,002.0 1,002.0 834.2 Source: Department of Treasury and Department of Finance *Payments into Trust Account reported against year appropriated. The following is a summary of expenditure for Budget Funded Trust Accounts for the period 1st January – 31st December 2017 where more than K5.0 million was expended. Appendix 1 shows the movements in these Budget Funded Trust Accounts for the period 1st January – 31st December 2017:
K13.8 million was spent from the Higher Education Sector Infrastructure Rehabilitation Trust Account trust for various expenditures;
K7.2 million was spent from the Central City Trust Account for surveying, payments of titles, consultation and legal fees in relation to the Central City project;
K504.7 million was spent from the Tuition Fee Free Education for the Free Education Policy around the country;
24.
K11.0 million was spent from the 2015 Pacific Games for funding the Sports Infrastructure Trust Account. The trust name was also amended to the Sports Infrastructures Trust Account;
K5.8 Million was spent from the PNG Customs Technology Trust Account for various expenditure; and.
K6.1 million was spent from the ABG Restoration and Development Grant Trust during this period in relation to impact projects associated with the ABG Restoration and Development program in the Autonomous Region of Bougainville.
District Services Improvement Program (DSIP) Trust Accounts Prior to 2012, a total of K1,789.0 million was appropriated for the DSIP and paid into 89 DSIP Trust Accounts. Since 2013, all districts were been funded their DSIP directly through the Budget to their respective trust accounts. The DSIP trust account was revoked on the 20th of May 2016 and all the bank accounts were closed in 2016. The total remaining balance of K18.2 million was transferred to all the respective DSIP Operating Accounts in August 2016. Appendix 2 shows the movements of funds for the period 1st January to 31st December 2017 for each of the 89 DSIP subsidiary bank accounts.
25.
1.8 Government Finance Statistics Information contained herein is derived from the International Monetary Fund’s Government Finance Statistics Manual 2014 (GFSM 2014). This is to inform the public that the Government has already adopted the updated Government Finance Statistics (GFS 2014) reporting framework, starting with the 2016 National Budget.
The GFS 2014 framework is a macroeconomic statistical system designed to support fiscal analysis. The GFS 2014 framework incorporates economic and accounting principles that can be used when compiling government budgets and presenting fiscal statistics.
Since the 2016 Budget, the Government undertook a major reform to improve the reporting of its finances by moving to the updated international standard of reporting in GFS 2014. This has resulted in some re-categorisation of revenues and expenditures.
1.8.1 Changes between the GFSM 1986 and GFSM 2014
In the 2013 Budget the Government announced that it would be moving from an International Monetary Fund (IMF) GFSM 1986 framework of Budget reporting to an updated GFSM 2001 framework. The IMF in 2015 released an updated version of the GFSM 2001, the GFSM 2014.
The updated framework allows for harmonisation with other macroeconomic frameworks, such as the System of National Accounts, Monetary Statistics and Trade Statistics, and also allows for cross-country comparisons. The GFSM 2014 was used for the first time in Papua New Guinea in Volume 1 of the 2016 Budget. It represented a significant modernisation and expansion of the coverage of the previously used GFSM 1986.
The GFSM 2014 better defines the public sector and in particular the general government sector, as it is based on the concept of institutional unit coverage. The general government sector consists of all government units, representing budgetary central government, provincial government, local government and extra-budgetary accounts within the country that are controlled and largely financed by the government. In contrast, the coverage of the GFSM 1986 system was defined on a narrower functional basis to include all units carrying out a function of government.
Due to its broader and more extensive coverage of economic units, the GFSM 2014 allows for greater understanding of where and how the government is spending its money, and therefore supports better decision making, economically as well as functionally.
Three new tables were introduced to Volume 1 of the 2016 Budget: The Statement of Sources and Uses of Cash, the Statement of Operations, and the Classification of Functions of Government (COFOG). It also includes a new reporting approach to the pre-existing Revenue and Expense (previously Expenditure) Tables, the Transactions in Financial Asset and Liabilities Table (replacing the Central Government Financing Table), and a revised General Government Debt table.
1.8.2 Balancing items Two important balances are derived from GFSM 2014 and used in the Volume 1 Tables. Revenue minus expenses (other than the consumption of fixed capital) equals the Gross Operating Balance and is set out in the Statement of Operations. The Gross Operating
26.
Balance is therefore, a reflection of the total change in net worth of the general government sector due to transactions and is a measure of the sustainability of government operations. The Gross Operating Balance minus the Net Acquisition of Non-Financial Assets gives Net Lending/Net Borrowing. Net Lending/Borrowing is also equal to Net Acquisition of Financial Assets minus Net Incurrence of Liabilities. In essence, Net Lending/Borrowing measures the extent to which the government is either putting financial resources at the disposal of other sectors in the economy and non-residents (Net Lending) or utilising the financial resources generated by other sectors and non-residents (Net Borrowing). This balance can therefore be seen as an indicator of the financial impact of government activity on the rest of the economy and non-residents. It is the equivalent of the overall deficit/surplus in the GFSM 1986, but determined using the accrual basis of recording.
Net Lending/Borrowing is similar to a surplus/deficit under GFSM 1986; however, there are two major differences:
(1) Net Lending/Borrowing does not include any financing transactions, whereas the overall deficit/surplus included lending for policy purposes; and
(2) Net Lending/Borrowing is an accrual concept, while the overall deficit/surplus is a cash concept.
The Statement of Sources and Uses of Cash may assist in assessing the liquidity of the general government. The statement reflects the total amount of cash generated or absorbed by current operating activities, transactions in non-financial assets (fixed assets, property, plant and equipment), and transactions involving financial assets and liabilities other than the financial asset currency (cash) itself. The net change in the stock of cash is the sum of the net cash received/used from these operating activities, transactions in non-financial assets and transactions involving financial assets (other than cash) and liabilities. As a ‘cash’ statement it excludes in-kind related flows/transactions.
The Statement of Operations presents details of transactions in revenue and expense, as well as the net investment in non-financial assets, the net acquisition of financial assets, and the net incurrence of liabilities. The Statement of Operations is intended to be compiled using the accrual basis of recording transactions. With the exception of consumption of fixed capital, in-kind and imputed transactions, and other accounts receivable/payable, all of the line items in the Statement of Operations can be applied to both cash and accrual data. In the case the Government of PNG a modified cash-basis approach is taken where some accrual-like information is available.
Under the GFSM 2014 methodology, Revenue transactions are recorded on a gross basis and in the Government of PNG context, non-payable Infrastructure Tax Credits (ITC), revenue from asset sales and recoveries of previous years will be excluded. Goods and Services Tax (GST) collections and bookmakers’ licence fees collected and to be transferred to provinces will not be offset in revenue but the corresponding amounts will be reflected as items in expense per economic and functional classification in the Expense Table. Under the GFSM 2014 methodology, sales of assets are deducted from the total non-financial assets to reflect the net investment in non-financial assets. New borrowing acquired and received by the Government is regarded as an incurrence of a liability and is therefore registered as a transaction in assets and liabilities. The GFSM 2014 now includes all in-kind related receipts where data is available.
The classification of Expense by economic type under GFSM 2014 is broadly similar to the corresponding classification in the GFSM 1986. The primary exception is that acquisitions of non-financial assets are not considered an expense and repayment of borrowing is regarded as transactions in assets in liabilities under GFSM 2014. Other differences include:
27.
Consumption of fixed capital which is an expense under GFSM 2014 was not included under the GFSM 1986 as it is a non-cash expense. Transfer payments are classified by type of payment under GFSM 2014. Under the GFSM 1986 they were classified by the sector receiving the payment. The major types of transfer payments are subsidies, grants, and social benefits. The GFSM 2014 now includes all in-kind related payments where data is available.
Table B (i) details the General Government Expense Economic Classification. This table provides for a summary of expense per economic classification and Table B (ii) provides final output expenditure for the National Government, Provincial Governments, Autonomous Bougainville Government and Commercial and Statutory Authorities.
1.8.3 General Government Debt
Table C details the General Government’s Transactions in Financial Assets and Liabilities.
Table F summarises the General Government’s Stock of Debt at the end of the reporting period.
The new Classification of Functions of Government (COFOG) shows the cross-economic functional classification of expenditure for the general government, detailing where government expenditure is directed by function. COFOG provides meaningful information that may be used to study the effectiveness of government programs in areas like health, education, economic affairs, social protection and general public services. There are ten major functions. It is an internationally standardised table that allows cross-country comparisons of government priorities.
28.
FISCAL TABLES
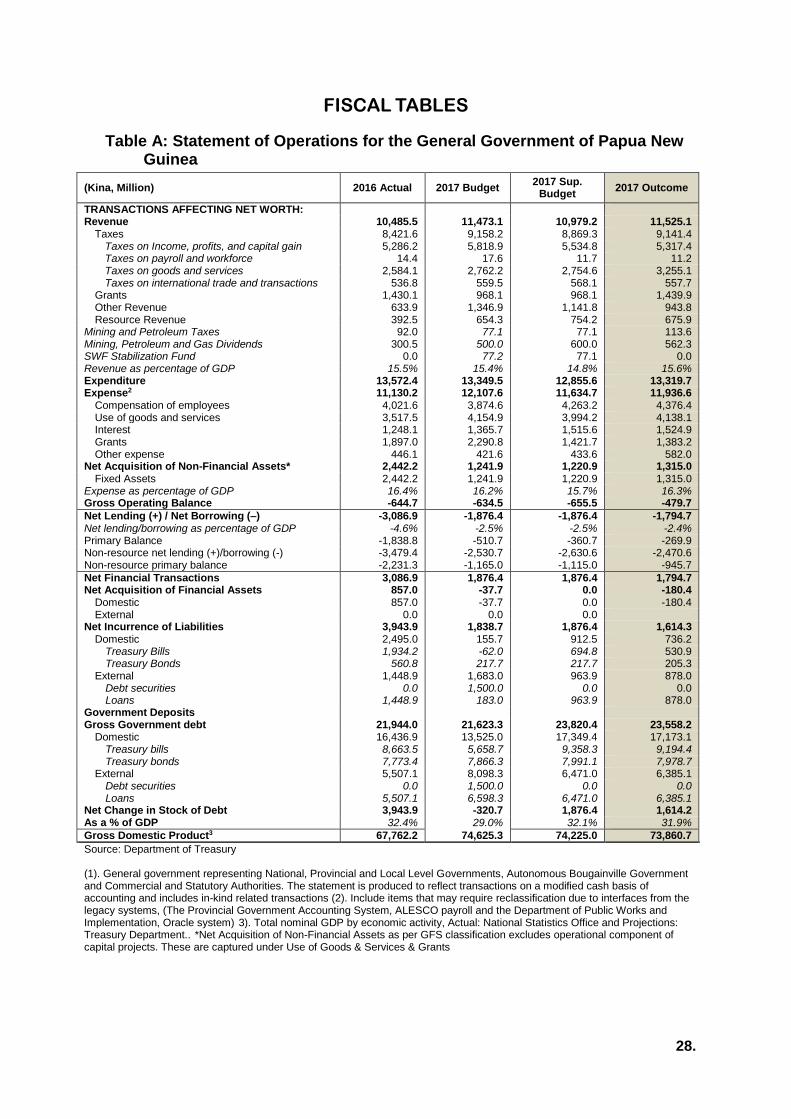
Table A: Statement of Operations for the General Government of Papua New Guinea
(Kina, Million) 2016 Actual 2017 Budget 2017 Sup.
Budget 2017 Outcome
TRANSACTIONS AFFECTING NET WORTH: Revenue 10,485.5 11,473.1 10,979.2 11,525.1
Taxes 8,421.6 9,158.2 8,869.3 9,141.4 Taxes on Income, profits, and capital gain 5,286.2 5,818.9 5,534.8 5,317.4 Taxes on payroll and workforce 14.4 17.6 11.7 11.2 Taxes on goods and services 2,584.1 2,762.2 2,754.6 3,255.1 Taxes on international trade and transactions 536.8 559.5 568.1 557.7
Grants 1,430.1 968.1 968.1 1,439.9 Other Revenue 633.9 1,346.9 1,141.8 943.8 Resource Revenue 392.5 654.3 754.2 675.9
Mining and Petroleum Taxes 92.0 77.1 77.1 113.6 Mining, Petroleum and Gas Dividends 300.5 500.0 600.0 562.3 SWF Stabilization Fund 0.0 77.2 77.1 0.0 Revenue as percentage of GDP 15.5% 15.4% 14.8% 15.6% Expenditure 13,572.4 13,349.5 12,855.6 13,319.7 Expense2 11,130.2 12,107.6 11,634.7 11,936.6
Compensation of employees 4,021.6 3,874.6 4,263.2 4,376.4 Use of goods and services 3,517.5 4,154.9 3,994.2 4,138.1 Interest 1,248.1 1,365.7 1,515.6 1,524.9 Grants 1,897.0 2,290.8 1,421.7 1,383.2 Other expense 446.1 421.6 433.6 582.0
Net Acquisition of Non-Financial Assets* 2,442.2 1,241.9 1,220.9 1,315.0 Fixed Assets 2,442.2 1,241.9 1,220.9 1,315.0
Expense as percentage of GDP 16.4% 16.2% 15.7% 16.3% Gross Operating Balance -644.7 -634.5 -655.5 -479.7
Net Lending (+) / Net Borrowing (–) -3,086.9 -1,876.4 -1,876.4 -1,794.7 Net lending/borrowing as percentage of GDP -4.6% -2.5% -2.5% -2.4% Primary Balance -1,838.8 -510.7 -360.7 -269.9 Non-resource net lending (+)/borrowing (-) -3,479.4 -2,530.7 -2,630.6 -2,470.6 Non-resource primary balance -2,231.3 -1,165.0 -1,115.0 -945.7
Net Financial Transactions 3,086.9 1,876.4 1,876.4 1,794.7 Net Acquisition of Financial Assets 857.0 -37.7 0.0 -180.4
Domestic 857.0 -37.7 0.0 -180.4 External 0.0 0.0 0.0
Net Incurrence of Liabilities 3,943.9 1,838.7 1,876.4 1,614.3 Domestic 2,495.0 155.7 912.5 736.2
Treasury Bills 1,934.2 -62.0 694.8 530.9 Treasury Bonds 560.8 217.7 217.7 205.3
External 1,448.9 1,683.0 963.9 878.0 Debt securities 0.0 1,500.0 0.0 0.0 Loans 1,448.9 183.0 963.9 878.0
Government Deposits Gross Government debt 21,944.0 21,623.3 23,820.4 23,558.2
Domestic 16,436.9 13,525.0 17,349.4 17,173.1 Treasury bills 8,663.5 5,658.7 9,358.3 9,194.4 Treasury bonds 7,773.4 7,866.3 7,991.1 7,978.7
External 5,507.1 8,098.3 6,471.0 6,385.1 Debt securities 0.0 1,500.0 0.0 0.0 Loans 5,507.1 6,598.3 6,471.0 6,385.1
Net Change in Stock of Debt 3,943.9 -320.7 1,876.4 1,614.2 As a % of GDP 32.4% 29.0% 32.1% 31.9%
Gross Domestic Product3 67,762.2 74,625.3 74,225.0 73,860.7
Source: Department of Treasury (1). General government representing National, Provincial and Local Level Governments, Autonomous Bougainville Government and Commercial and Statutory Authorities. The statement is produced to reflect transactions on a modified cash basis of accounting and includes in-kind related transactions (2). Include items that may require reclassification due to interfaces from the legacy systems, (The Provincial Government Accounting System, ALESCO payroll and the Department of Public Works and Implementation, Oracle system) 3). Total nominal GDP by economic activity, Actual: National Statistics Office and Projections: Treasury Department.. *Net Acquisition of Non-Financial Assets as per GFS classification excludes operational component of capital projects. These are captured under Use of Goods & Services & Grants

29.
Table B: Statement of Sources and Uses of Cash for the General Government of Papua New Guinea
(Kina, Million) 2016
Actuals 2017
Budget 2017 Supp
Budget 2017
Outcome
CASH FLOWS FROM OPERATING ACTIVITIES: Revenue cash flows 9,055.4 10,505.0 10,011.1 10,085.2
Taxes 8,421.6 9,158.2 8,879.1 9,141.4 Social contributions 0.0 0.0 0.0 0.0 Grants 0.0 0.0 0.0 0.0 Other receipts 633.9 1,346.9 1,132.0 943.8
Revenue as percentage of GDP 13.4% 14.1% 13.5% 13.7% Expense cash flows2 9,700.1 11,041.6 11,496.0 10,514.1
Compensation of employees 4,021.6 3,776.7 4,278.0 4,268.9 Uses of goods and services 3,517.5 4,154.9 3,994.2 4,138.1 Interest 1,248.1 1,365.7 1,515.6 1,524.9 Subsidies 0.0 0.0 0.0 0.0 Grants 466.9 1,322.7 1,289.5 0.0 Social benefits 0.0 0.0 0.0 0.0 Other payments 446.1 421.6 418.6 582.2
Expense as percentage of GDP 14.3% 14.8% 15.5% 14.2% Net cash inflow from operating activities -644.7 -536.5 -1,485.5 -428.9 CASH FLOWS FROM TRANSACTIONS IN NONFINANCIAL ASSETS:
Net cash outflow from investment in nonfinancial assets 2,442.2 1,241.9 1,220.9 1,315.0
Fixed assets 2,442.2 1,241.9 1,220.9 1,315.0 Expenditure cash flows 12,142.3 12,283.5 12,717.5 11,879.8
Cash surplus (+) / Cash deficit (–) -3,086.9 -1,778.5 -2,706.4 -1,743.9 Surplus/Deficit as percentage of GDP -4.6% -2.4% -3.6% -2.4%
CASH FLOWS FROM TRANSACTIONS IN FINANCIAL ASSETS AND LIABILITIES (FINANCING)
Net acquisition of financial assets other than cash 857.0 -37.7 0.0 -180.4
Domestic 857.0 -37.7 0.0 -180.4 External 0.0 0.0 0.0 0.0
Net incurrence of liabilities 3,943.9 1,838.7 1,876.4 1,614.3
Domestic 2,495.0 155.7 912.5 736.2 External 1,448.9 1,683.0 963.9 878.0
Net cash inflow from financing activities 3,086.9 1,876.4 1,876.4 1,794.7
Gross Domestic Product3 67,762.2 74,625.3 74,225.0 73,860.7 Source: Department of Treasury. 1. Central government representing National, Provincial and Local Level Governments, Autonomous Bougainville Government and Commercial and Statutory Authorities. The statement is produced to reflect transactions on a modified cash basis of accounting where information is available. 2. Include items that may require reclassification due to interfaces from the legacy systems, (The Provincial Government Accounting System, ALESCO payroll and the Department of Public Works and Implementation, Oracle system). 3. Total nominal GDP by economic activity, Actual: National Statistics Office and Projections: Treasury Department.
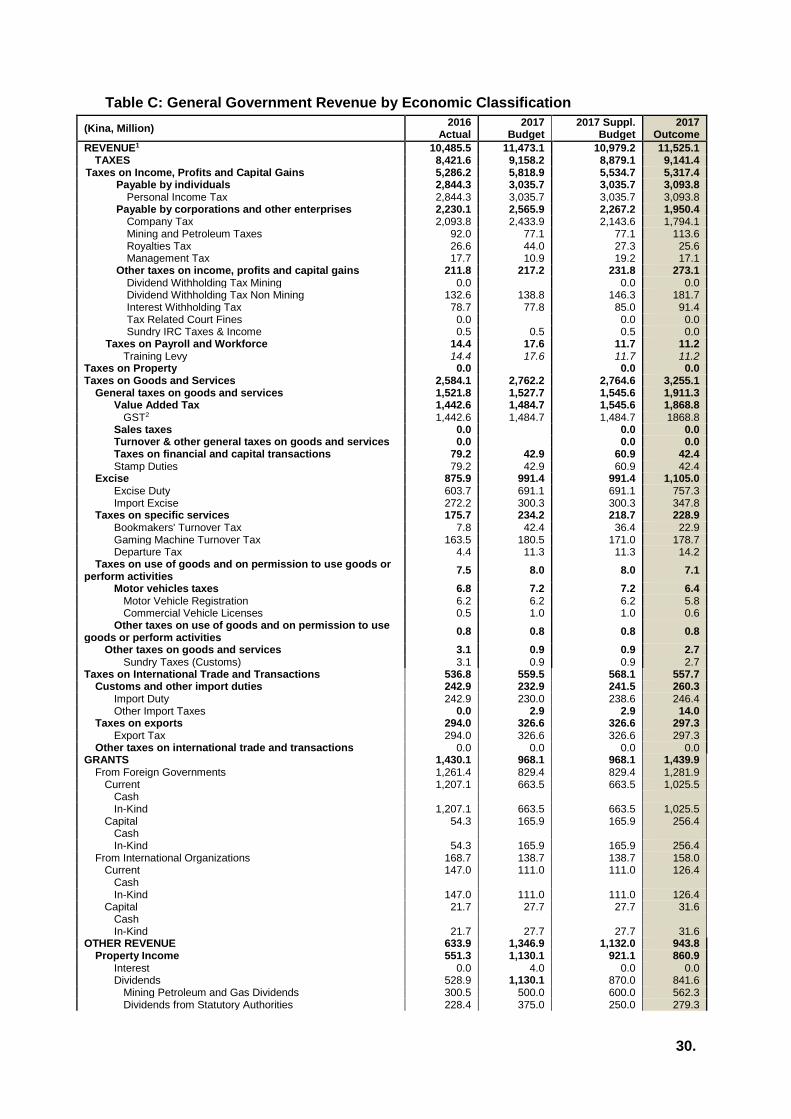
30.
Table C: General Government Revenue by Economic Classification
(Kina, Million) 2016
Actual 2017
Budget 2017 Suppl.
Budget 2017
Outcome
REVENUE1 10,485.5 11,473.1 10,979.2 11,525.1 TAXES 8,421.6 9,158.2 8,879.1 9,141.4
Taxes on Income, Profits and Capital Gains 5,286.2 5,818.9 5,534.7 5,317.4 Payable by individuals 2,844.3 3,035.7 3,035.7 3,093.8
Personal Income Tax 2,844.3 3,035.7 3,035.7 3,093.8 Payable by corporations and other enterprises 2,230.1 2,565.9 2,267.2 1,950.4
Company Tax 2,093.8 2,433.9 2,143.6 1,794.1 Mining and Petroleum Taxes 92.0 77.1 77.1 113.6 Royalties Tax 26.6 44.0 27.3 25.6 Management Tax 17.7 10.9 19.2 17.1
Other taxes on income, profits and capital gains 211.8 217.2 231.8 273.1 Dividend Withholding Tax Mining 0.0 0.0 0.0 Dividend Withholding Tax Non Mining 132.6 138.8 146.3 181.7 Interest Withholding Tax 78.7 77.8 85.0 91.4 Tax Related Court Fines 0.0 0.0 0.0 Sundry IRC Taxes & Income 0.5 0.5 0.5 0.0
Taxes on Payroll and Workforce 14.4 17.6 11.7 11.2 Training Levy 14.4 17.6 11.7 11.2
Taxes on Property 0.0 0.0 0.0 Taxes on Goods and Services 2,584.1 2,762.2 2,764.6 3,255.1
General taxes on goods and services 1,521.8 1,527.7 1,545.6 1,911.3 Value Added Tax 1,442.6 1,484.7 1,545.6 1,868.8
GST2 1,442.6 1,484.7 1,484.7 1868.8 Sales taxes 0.0 0.0 0.0 Turnover & other general taxes on goods and services 0.0 0.0 0.0 Taxes on financial and capital transactions 79.2 42.9 60.9 42.4 Stamp Duties 79.2 42.9 60.9 42.4
Excise 875.9 991.4 991.4 1,105.0 Excise Duty 603.7 691.1 691.1 757.3 Import Excise 272.2 300.3 300.3 347.8
Taxes on specific services 175.7 234.2 218.7 228.9 Bookmakers' Turnover Tax 7.8 42.4 36.4 22.9 Gaming Machine Turnover Tax 163.5 180.5 171.0 178.7 Departure Tax 4.4 11.3 11.3 14.2
Taxes on use of goods and on permission to use goods or perform activities
7.5 8.0 8.0 7.1
Motor vehicles taxes 6.8 7.2 7.2 6.4 Motor Vehicle Registration 6.2 6.2 6.2 5.8 Commercial Vehicle Licenses 0.5 1.0 1.0 0.6
Other taxes on use of goods and on permission to use goods or perform activities
0.8 0.8 0.8 0.8
Other taxes on goods and services 3.1 0.9 0.9 2.7 Sundry Taxes (Customs) 3.1 0.9 0.9 2.7
Taxes on International Trade and Transactions 536.8 559.5 568.1 557.7 Customs and other import duties 242.9 232.9 241.5 260.3
Import Duty 242.9 230.0 238.6 246.4 Other Import Taxes 0.0 2.9 2.9 14.0
Taxes on exports 294.0 326.6 326.6 297.3 Export Tax 294.0 326.6 326.6 297.3
Other taxes on international trade and transactions 0.0 0.0 0.0 0.0 GRANTS 1,430.1 968.1 968.1 1,439.9
From Foreign Governments 1,261.4 829.4 829.4 1,281.9 Current 1,207.1 663.5 663.5 1,025.5
Cash In-Kind 1,207.1 663.5 663.5 1,025.5
Capital 54.3 165.9 165.9 256.4 Cash In-Kind 54.3 165.9 165.9 256.4
From International Organizations 168.7 138.7 138.7 158.0 Current 147.0 111.0 111.0 126.4
Cash In-Kind 147.0 111.0 111.0 126.4
Capital 21.7 27.7 27.7 31.6 Cash In-Kind 21.7 27.7 27.7 31.6
OTHER REVENUE 633.9 1,346.9 1,132.0 943.8 Property Income 551.3 1,130.1 921.1 860.9
Interest 0.0 4.0 0.0 0.0 Dividends 528.9 1,130.1 870.0 841.6
Mining Petroleum and Gas Dividends 300.5 500.0 600.0 562.3 Dividends from Statutory Authorities 228.4 375.0 250.0 279.3
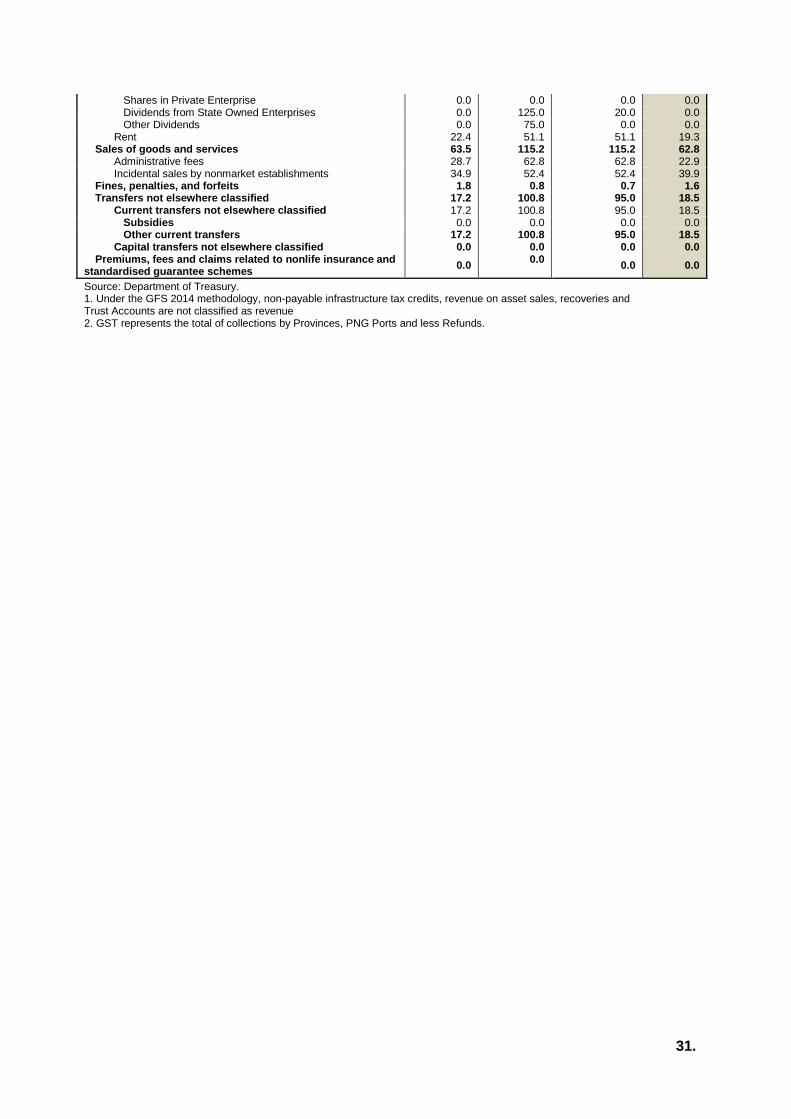
31.
Shares in Private Enterprise 0.0 0.0 0.0 0.0 Dividends from State Owned Enterprises 0.0 125.0 20.0 0.0 Other Dividends 0.0 75.0 0.0 0.0
Rent 22.4 51.1 51.1 19.3 Sales of goods and services 63.5 115.2 115.2 62.8
Administrative fees 28.7 62.8 62.8 22.9 Incidental sales by nonmarket establishments 34.9 52.4 52.4 39.9
Fines, penalties, and forfeits 1.8 0.8 0.7 1.6 Transfers not elsewhere classified 17.2 100.8 95.0 18.5
Current transfers not elsewhere classified 17.2 100.8 95.0 18.5 Subsidies 0.0 0.0 0.0 0.0 Other current transfers 17.2 100.8 95.0 18.5
Capital transfers not elsewhere classified 0.0 0.0 0.0 0.0 Premiums, fees and claims related to nonlife insurance and
standardised guarantee schemes 0.0
0.0 0.0 0.0
Source: Department of Treasury. 1. Under the GFS 2014 methodology, non-payable infrastructure tax credits, revenue on asset sales, recoveries and Trust Accounts are not classified as revenue 2. GST represents the total of collections by Provinces, PNG Ports and less Refunds.

32.
Table D (i): General Budgetary Expenditure by Economic Classification
Economic Items (Kina, Million) 2016 Actual 2017
Budget
2017 Suppl.
Budget
2017 Outcome
Compensation of Employees 4,463.3 3,874.6 4,263.2 4,376.4 Wages and salaries [GFS] 4,021.6 3,516.2 3,858.9 4,201.2
Wages and salaries in cash 3,901.70 3,418.3 3,748.6 4,093.7 Wages and salaries in kind 119.90 97.9 110.3 107.4
Employers' social contributions 441.7 358.4 404.2 175.2
Actual employers’ social contributions 441.70 358.4 404.2 175.2 Use of goods and services 3,658.4 4,154.9 3,994.2 4,138.1
Use of goods and services 3,658.40 4,154.9 3,994.2 4,138.1 Grants 1,925.2 2,290.8 1,421.7 1,383.2
Grants to other general government units 1,925.23 2,290.8 1,421.7 1,383.2 Interest 1,248.1 1,365.7 1,515.7 1,524.9
To non-residents 77.00 167.9 167.9 168.9 To residents other than general government 1,171.10 1,197.8 1,347.8 1,356.0
Net Acquisition Nonfinancial assets 1,671.8 1,241.9 1,225.5 1,315.0 Acquisition of Fixed assets (Buildings and
Structures) 1,671.8 1,241.9 1,225.5 1,315.0
Acquisition of Fixed assets (Buildings and Structures) 1,597.22 1,206.6 1,109.6 1,275.2 Information, computer, and telecommunications (ICT)
equipment 33.15 14.7 19.5 22.3
Machinery and equipment other than transport equipment
24.20 16.3 15.5 12.6
Other structures 0.0 0.0 79.2 3.4 Transport equipment 17.20 4.3 1.6 1.6
Other expenses 605.6 421.6 433.6 582.2
Premiums, fees, and claims related to nonlife insurance and standardized guarantee schemes
5.00 0.0 0.0 0.1
Transfers not elsewhere classified 600.61 421.6 423.1 582.2
Grand Total 13,572.4 13,349.5 12,855.6 13,319.9
Source: Department of Treasury.
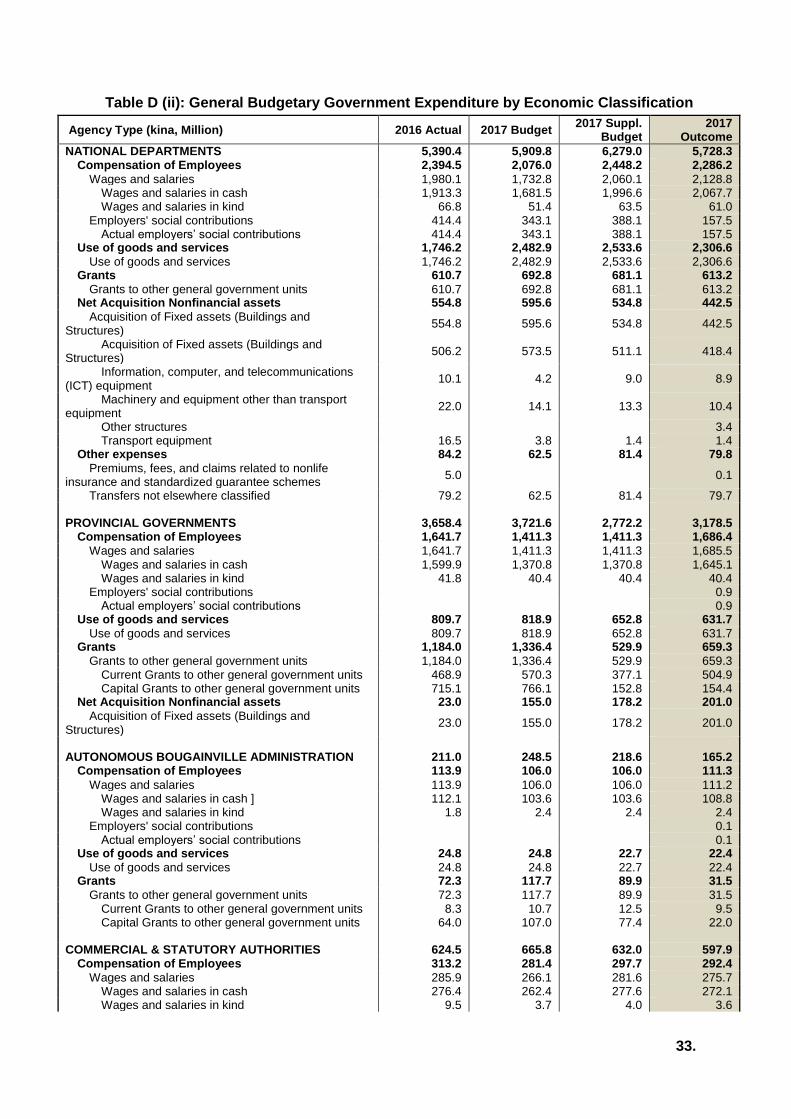
33.
Table D (ii): General Budgetary Government Expenditure by Economic Classification
Agency Type (kina, Million) 2016 Actual 2017 Budget 2017 Suppl.
Budget 2017
Outcome
NATIONAL DEPARTMENTS 5,390.4 5,909.8 6,279.0 5,728.3 Compensation of Employees 2,394.5 2,076.0 2,448.2 2,286.2
Wages and salaries 1,980.1 1,732.8 2,060.1 2,128.8 Wages and salaries in cash 1,913.3 1,681.5 1,996.6 2,067.7 Wages and salaries in kind 66.8 51.4 63.5 61.0
Employers' social contributions 414.4 343.1 388.1 157.5 Actual employers’ social contributions 414.4 343.1 388.1 157.5
Use of goods and services 1,746.2 2,482.9 2,533.6 2,306.6
Use of goods and services 1,746.2 2,482.9 2,533.6 2,306.6 Grants 610.7 692.8 681.1 613.2
Grants to other general government units 610.7 692.8 681.1 613.2 Net Acquisition Nonfinancial assets 554.8 595.6 534.8 442.5
Acquisition of Fixed assets (Buildings and Structures)
554.8 595.6 534.8 442.5
Acquisition of Fixed assets (Buildings and Structures)
506.2 573.5 511.1 418.4
Information, computer, and telecommunications (ICT) equipment
10.1 4.2 9.0 8.9
Machinery and equipment other than transport equipment
22.0 14.1 13.3 10.4
Other structures 3.4 Transport equipment 16.5 3.8 1.4 1.4
Other expenses 84.2 62.5 81.4 79.8
Premiums, fees, and claims related to nonlife insurance and standardized guarantee schemes
5.0 0.1
Transfers not elsewhere classified 79.2 62.5 81.4 79.7
PROVINCIAL GOVERNMENTS 3,658.4 3,721.6 2,772.2 3,178.5 Compensation of Employees 1,641.7 1,411.3 1,411.3 1,686.4
Wages and salaries 1,641.7 1,411.3 1,411.3 1,685.5 Wages and salaries in cash 1,599.9 1,370.8 1,370.8 1,645.1 Wages and salaries in kind 41.8 40.4 40.4 40.4
Employers' social contributions 0.9 Actual employers’ social contributions 0.9
Use of goods and services 809.7 818.9 652.8 631.7
Use of goods and services 809.7 818.9 652.8 631.7 Grants 1,184.0 1,336.4 529.9 659.3
Grants to other general government units 1,184.0 1,336.4 529.9 659.3 Current Grants to other general government units 468.9 570.3 377.1 504.9 Capital Grants to other general government units 715.1 766.1 152.8 154.4
Net Acquisition Nonfinancial assets 23.0 155.0 178.2 201.0
Acquisition of Fixed assets (Buildings and Structures)
23.0 155.0 178.2 201.0
AUTONOMOUS BOUGAINVILLE ADMINISTRATION 211.0 248.5 218.6 165.2
Compensation of Employees 113.9 106.0 106.0 111.3
Wages and salaries 113.9 106.0 106.0 111.2 Wages and salaries in cash ] 112.1 103.6 103.6 108.8 Wages and salaries in kind 1.8 2.4 2.4 2.4
Employers' social contributions 0.1 Actual employers’ social contributions 0.1
Use of goods and services 24.8 24.8 22.7 22.4
Use of goods and services 24.8 24.8 22.7 22.4 Grants 72.3 117.7 89.9 31.5
Grants to other general government units 72.3 117.7 89.9 31.5 Current Grants to other general government units 8.3 10.7 12.5 9.5 Capital Grants to other general government units 64.0 107.0 77.4 22.0
COMMERCIAL & STATUTORY AUTHORITIES 624.5 665.8 632.0 597.9 Compensation of Employees 313.2 281.4 297.7 292.4
Wages and salaries 285.9 266.1 281.6 275.7 Wages and salaries in cash 276.4 262.4 277.6 272.1 Wages and salaries in kind 9.5 3.7 4.0 3.6
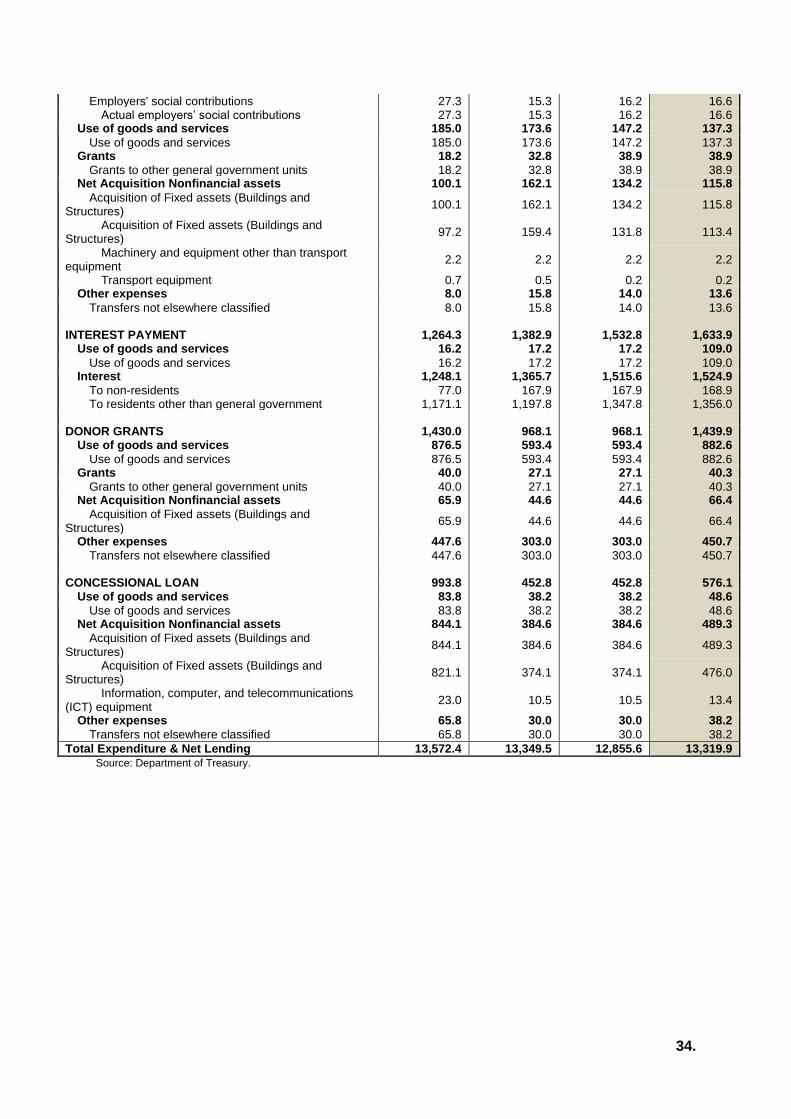
34.
Employers' social contributions 27.3 15.3 16.2 16.6 Actual employers’ social contributions 27.3 15.3 16.2 16.6
Use of goods and services 185.0 173.6 147.2 137.3
Use of goods and services 185.0 173.6 147.2 137.3 Grants 18.2 32.8 38.9 38.9
Grants to other general government units 18.2 32.8 38.9 38.9 Net Acquisition Nonfinancial assets 100.1 162.1 134.2 115.8
Acquisition of Fixed assets (Buildings and Structures)
100.1 162.1 134.2 115.8
Acquisition of Fixed assets (Buildings and Structures)
97.2 159.4 131.8 113.4
Machinery and equipment other than transport equipment
2.2 2.2 2.2 2.2
Transport equipment 0.7 0.5 0.2 0.2 Other expenses 8.0 15.8 14.0 13.6
Transfers not elsewhere classified 8.0 15.8 14.0 13.6
INTEREST PAYMENT 1,264.3 1,382.9 1,532.8 1,633.9 Use of goods and services 16.2 17.2 17.2 109.0
Use of goods and services 16.2 17.2 17.2 109.0 Interest 1,248.1 1,365.7 1,515.6 1,524.9
To non-residents 77.0 167.9 167.9 168.9 To residents other than general government 1,171.1 1,197.8 1,347.8 1,356.0
DONOR GRANTS 1,430.0 968.1 968.1 1,439.9
Use of goods and services 876.5 593.4 593.4 882.6
Use of goods and services 876.5 593.4 593.4 882.6 Grants 40.0 27.1 27.1 40.3
Grants to other general government units 40.0 27.1 27.1 40.3 Net Acquisition Nonfinancial assets 65.9 44.6 44.6 66.4
Acquisition of Fixed assets (Buildings and Structures)
65.9 44.6 44.6 66.4
Other expenses 447.6 303.0 303.0 450.7
Transfers not elsewhere classified 447.6 303.0 303.0 450.7
CONCESSIONAL LOAN 993.8 452.8 452.8 576.1 Use of goods and services 83.8 38.2 38.2 48.6
Use of goods and services 83.8 38.2 38.2 48.6 Net Acquisition Nonfinancial assets 844.1 384.6 384.6 489.3
Acquisition of Fixed assets (Buildings and Structures)
844.1 384.6 384.6 489.3
Acquisition of Fixed assets (Buildings and Structures)
821.1 374.1 374.1 476.0
Information, computer, and telecommunications (ICT) equipment
23.0 10.5 10.5 13.4
Other expenses 65.8 30.0 30.0 38.2
Transfers not elsewhere classified 65.8 30.0 30.0 38.2
Total Expenditure & Net Lending 13,572.4 13,349.5 12,855.6 13,319.9 Source: Department of Treasury.
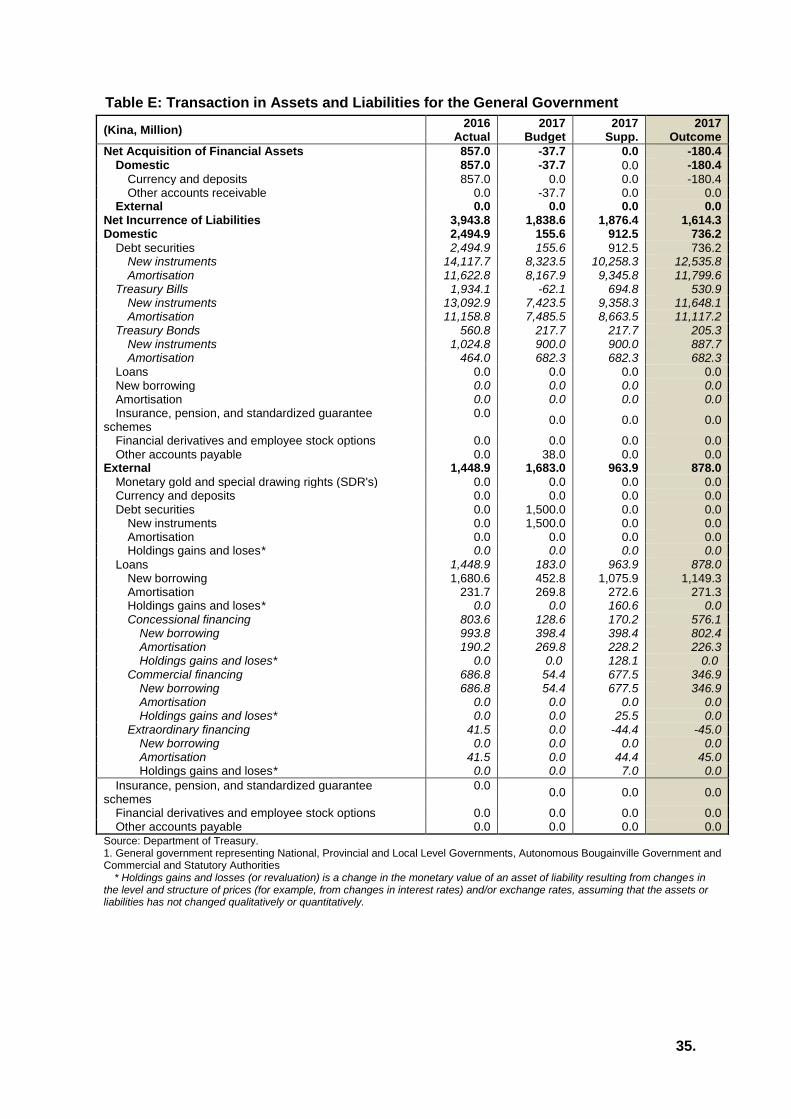
35.
Table E: Transaction in Assets and Liabilities for the General Government
(Kina, Million) 2016
Actual 2017
Budget 2017
Supp. 2017
Outcome
Net Acquisition of Financial Assets 857.0 -37.7 0.0 -180.4 Domestic 857.0 -37.7 0.0 -180.4
Currency and deposits 857.0 0.0 0.0 -180.4 Other accounts receivable 0.0 -37.7 0.0 0.0
External 0.0 0.0 0.0 0.0 Net Incurrence of Liabilities 3,943.8 1,838.6 1,876.4 1,614.3 Domestic 2,494.9 155.6 912.5 736.2
Debt securities 2,494.9 155.6 912.5 736.2 New instruments 14,117.7 8,323.5 10,258.3 12,535.8 Amortisation 11,622.8 8,167.9 9,345.8 11,799.6
Treasury Bills 1,934.1 -62.1 694.8 530.9 New instruments 13,092.9 7,423.5 9,358.3 11,648.1 Amortisation 11,158.8 7,485.5 8,663.5 11,117.2
Treasury Bonds 560.8 217.7 217.7 205.3 New instruments 1,024.8 900.0 900.0 887.7 Amortisation 464.0 682.3 682.3 682.3
Loans 0.0 0.0 0.0 0.0 New borrowing 0.0 0.0 0.0 0.0 Amortisation 0.0 0.0 0.0 0.0 Insurance, pension, and standardized guarantee
schemes 0.0
0.0 0.0 0.0
Financial derivatives and employee stock options 0.0 0.0 0.0 0.0 Other accounts payable 0.0 38.0 0.0 0.0
External 1,448.9 1,683.0 963.9 878.0
Monetary gold and special drawing rights (SDR's) 0.0 0.0 0.0 0.0 Currency and deposits 0.0 0.0 0.0 0.0 Debt securities 0.0 1,500.0 0.0 0.0
New instruments 0.0 1,500.0 0.0 0.0 Amortisation 0.0 0.0 0.0 0.0 Holdings gains and loses* 0.0 0.0 0.0 0.0
Loans 1,448.9 183.0 963.9 878.0 New borrowing 1,680.6 452.8 1,075.9 1,149.3 Amortisation 231.7 269.8 272.6 271.3 Holdings gains and loses* 0.0 0.0 160.6 0.0 Concessional financing 803.6 128.6 170.2 576.1
New borrowing 993.8 398.4 398.4 802.4 Amortisation 190.2 269.8 228.2 226.3 Holdings gains and loses* 0.0 0.0 128.1 0.0
Commercial financing 686.8 54.4 677.5 346.9 New borrowing 686.8 54.4 677.5 346.9 Amortisation 0.0 0.0 0.0 0.0 Holdings gains and loses* 0.0 0.0 25.5 0.0
Extraordinary financing 41.5 0.0 -44.4 -45.0 New borrowing 0.0 0.0 0.0 0.0 Amortisation 41.5 0.0 44.4 45.0 Holdings gains and loses* 0.0 0.0 7.0 0.0
Insurance, pension, and standardized guarantee schemes
0.0 0.0 0.0 0.0
Financial derivatives and employee stock options 0.0 0.0 0.0 0.0 Other accounts payable 0.0 0.0 0.0 0.0
Source: Department of Treasury. 1. General government representing National, Provincial and Local Level Governments, Autonomous Bougainville Government and Commercial and Statutory Authorities
* Holdings gains and losses (or revaluation) is a change in the monetary value of an asset of liability resulting from changes in the level and structure of prices (for example, from changes in interest rates) and/or exchange rates, assuming that the assets or liabilities has not changed qualitatively or quantitatively.
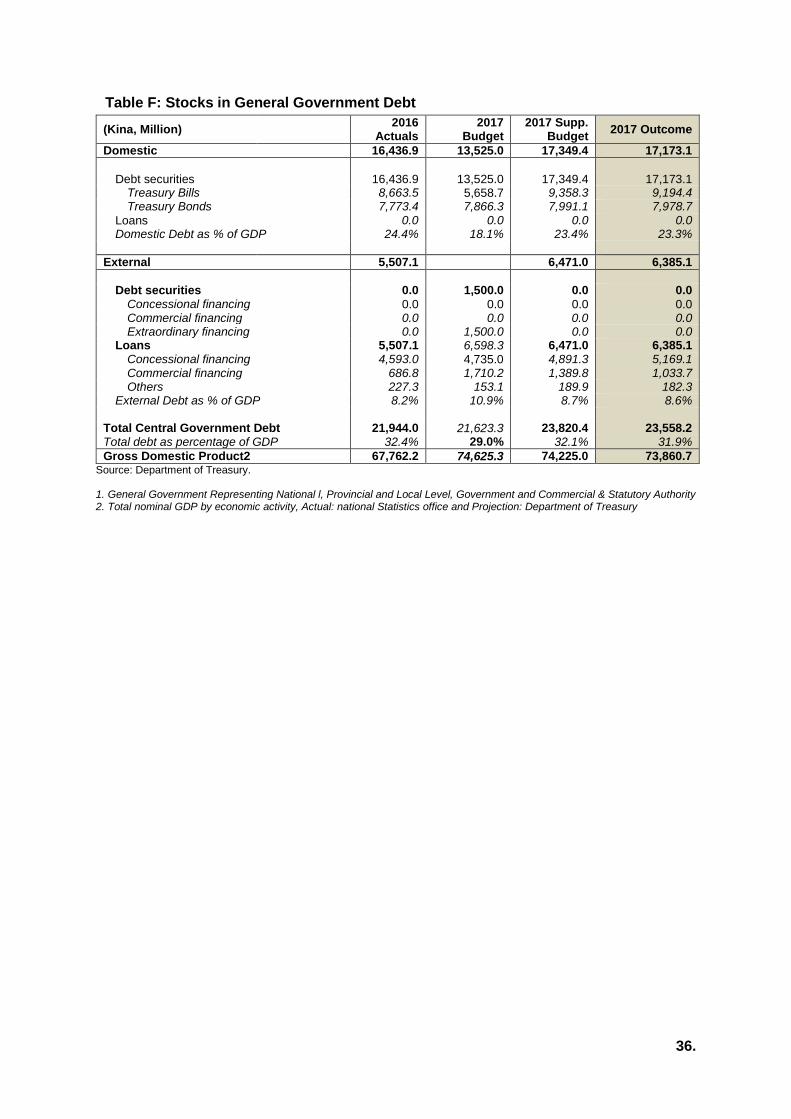
36.
Table F: Stocks in General Government Debt
(Kina, Million) 2016
Actuals 2017
Budget 2017 Supp.
Budget 2017 Outcome
Domestic 16,436.9 13,525.0 17,349.4 17,173.1
Debt securities 16,436.9 13,525.0 17,349.4 17,173.1 Treasury Bills 8,663.5 5,658.7 9,358.3 9,194.4 Treasury Bonds 7,773.4 7,866.3 7,991.1 7,978.7
Loans 0.0 0.0 0.0 0.0 Domestic Debt as % of GDP 24.4% 18.1% 23.4% 23.3%
External 5,507.1 6,471.0 6,385.1
Debt securities 0.0 1,500.0 0.0 0.0
Concessional financing 0.0 0.0 0.0 0.0 Commercial financing 0.0 0.0 0.0 0.0 Extraordinary financing 0.0 1,500.0 0.0 0.0
Loans 5,507.1 6,598.3 6,471.0 6,385.1 Concessional financing 4,593.0 4,735.0 4,891.3 5,169.1 Commercial financing 686.8 1,710.2 1,389.8 1,033.7 Others 227.3 153.1 189.9 182.3
External Debt as % of GDP 8.2% 10.9% 8.7% 8.6%
Total Central Government Debt 21,944.0 21,623.3 23,820.4 23,558.2 Total debt as percentage of GDP 32.4% 29.0% 32.1% 31.9%
Gross Domestic Product2 67,762.2 74,625.3 74,225.0 73,860.7 Source: Department of Treasury. 1. General Government Representing National l, Provincial and Local Level, Government and Commercial & Statutory Authority 2. Total nominal GDP by economic activity, Actual: national Statistics office and Projection: Department of Treasury

37.
PART 2
FINAL BUDGET OUTCOME BY AGENCY
2.1 2017 Expenditure Outcome This section of the Final Budget Outcome (FBO) summarises agencies’ final expenditure for the 2017 financial year. The 2017 FBO reports expenditure as an integrated Budget, combining the Operational and Capital expenditures. Data reported in this part, Part 2, is sourced from the Integrated Financial Management System (IFMS) using the GFS 1986 standard, to be consistent with the 2017 Appropriation Bills.
The total 2017 Original Budget was K12,970.2 million8 (including donor support grants and concessional loan funding), which was then reduced by K494.0 million to K12,476.3 million through the 2017 Supplementary Budget. Both the Original and Revised 2017 Budgets are inclusive of Interest Payments which do not factor in the allocation for Amortisation under Debt Services. All discussions in this section are based on the revised budget, particularly the GoPNG funded component.
The total revised GoPNG funded appropriation in 2017 was K11,055.3 million. The total actual expenditure outcome in 2017 was K10,840.6 million (including the savings on PE from double counting) which translates to a total underspending of K214.7 million against the total revised appropriation. 2.2 2017 Expenditure Outcome The 2017 Budget funded a total of 141 government agencies which are subsumed into nine (9) sectors. However, for budgeting and accounting purposes, Debt Interest and Miscellaneous items are included to show total expenditure as depicted in Table 20 below. Table 20: GoPNG Funded Expenditure by Sectors (Kina, Millions)
Sectors 2017
Budget Supp/Transfers 2017 Suppl.
Total Expense
Variance
Administration 898.5 237.9 1,136.4 1,214.5 78.1
Community & Culture 67.6 11.3 78.9 79.6 0.7
Debt Services9 1,382.9 149.9 1,532.8 1,633.9 101.0
Economic 340.4 -0.8 339.6 322.1 -17.5
Education 1,092.5 -522.6 569.9 557.6 -12.3
Health 967.9 191.2 1,159.1 1,157.7 -1.4
Law & Justice 1,067.0 44.4 1,111.4 1,124.3 12.9
Miscellaneous 1,491.4 297.3 1,788.7 1,551.2 -237.5
Provinces 3,590.8 -909.7 2,681.1 2,880.5 199.4
Transport 600.6 14.2 614.8 562.0 -52.8
Utilities 49.6 -7.0 42.6 41.5 -1.1
Grand Total 11,549.3 494.0 11,055.310 11,125.011 69.5 Source: Department of Treasury, IFMS 2161 Report
Of the nine sectors, the Provinces sector was the highest spender with K2, 880.5 million or 25.9 per cent of total expenditure. Debt services was the second highest with K1, 633.9 million or 14.7 per cent (inclusive of fees of charges captured under goods and services, which is
8 Excludes GST and Bookmaker’s Turnover Tax (BTT) to Provinces. 9 Information sourced from IFMS and Treasury. It includes interest payments as well as other fees and debt related charges. 10 This does not take into account the GST and BTT transfers to the Provinces 11 The variance from figure stated in section 3.2 (K10,840.6m) is due to K284.4m identified as double counting in the IFMS on PE/superannuation. The figure in the variance column would decrease by this much. Also, the figure does not include the GST and BTT transfers to the Provinces.
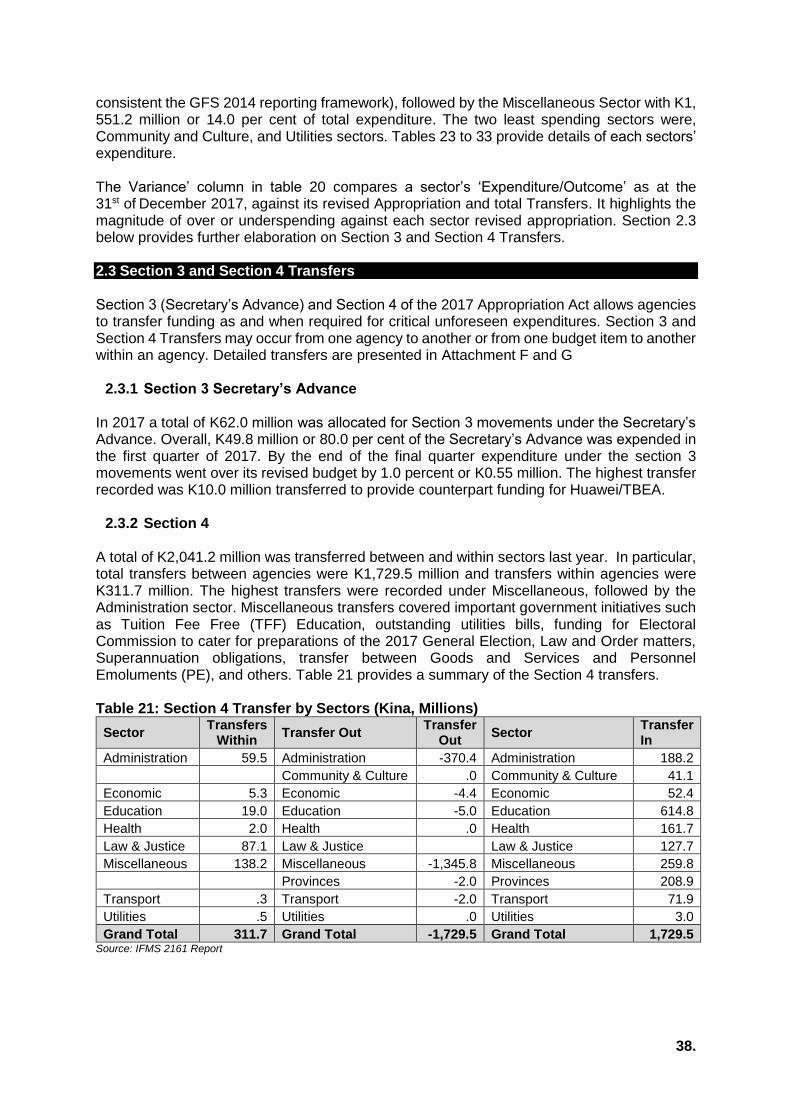
38.
consistent the GFS 2014 reporting framework), followed by the Miscellaneous Sector with K1, 551.2 million or 14.0 per cent of total expenditure. The two least spending sectors were, Community and Culture, and Utilities sectors. Tables 23 to 33 provide details of each sectors’ expenditure. The Variance’ column in table 20 compares a sector’s ‘Expenditure/Outcome’ as at the 31st of December 2017, against its revised Appropriation and total Transfers. It highlights the magnitude of over or underspending against each sector revised appropriation. Section 2.3 below provides further elaboration on Section 3 and Section 4 Transfers. 2.3 Section 3 and Section 4 Transfers Section 3 (Secretary’s Advance) and Section 4 of the 2017 Appropriation Act allows agencies to transfer funding as and when required for critical unforeseen expenditures. Section 3 and Section 4 Transfers may occur from one agency to another or from one budget item to another within an agency. Detailed transfers are presented in Attachment F and G
2.3.1 Section 3 Secretary’s Advance In 2017 a total of K62.0 million was allocated for Section 3 movements under the Secretary’s Advance. Overall, K49.8 million or 80.0 per cent of the Secretary’s Advance was expended in the first quarter of 2017. By the end of the final quarter expenditure under the section 3 movements went over its revised budget by 1.0 percent or K0.55 million. The highest transfer recorded was K10.0 million transferred to provide counterpart funding for Huawei/TBEA.
2.3.2 Section 4 A total of K2,041.2 million was transferred between and within sectors last year. In particular, total transfers between agencies were K1,729.5 million and transfers within agencies were K311.7 million. The highest transfers were recorded under Miscellaneous, followed by the Administration sector. Miscellaneous transfers covered important government initiatives such as Tuition Fee Free (TFF) Education, outstanding utilities bills, funding for Electoral Commission to cater for preparations of the 2017 General Election, Law and Order matters, Superannuation obligations, transfer between Goods and Services and Personnel Emoluments (PE), and others. Table 21 provides a summary of the Section 4 transfers. Table 21: Section 4 Transfer by Sectors (Kina, Millions)
Sector Transfers
Within Transfer Out
Transfer Out
Sector Transfer In
Administration 59.5 Administration -370.4 Administration 188.2
Community & Culture .0 Community & Culture 41.1
Economic 5.3 Economic -4.4 Economic 52.4
Education 19.0 Education -5.0 Education 614.8
Health 2.0 Health .0 Health 161.7
Law & Justice 87.1 Law & Justice Law & Justice 127.7
Miscellaneous 138.2 Miscellaneous -1,345.8 Miscellaneous 259.8
Provinces -2.0 Provinces 208.9
Transport .3 Transport -2.0 Transport 71.9
Utilities .5 Utilities .0 Utilities 3.0
Grand Total 311.7 Grand Total -1,729.5 Grand Total 1,729.5 Source: IFMS 2161 Report
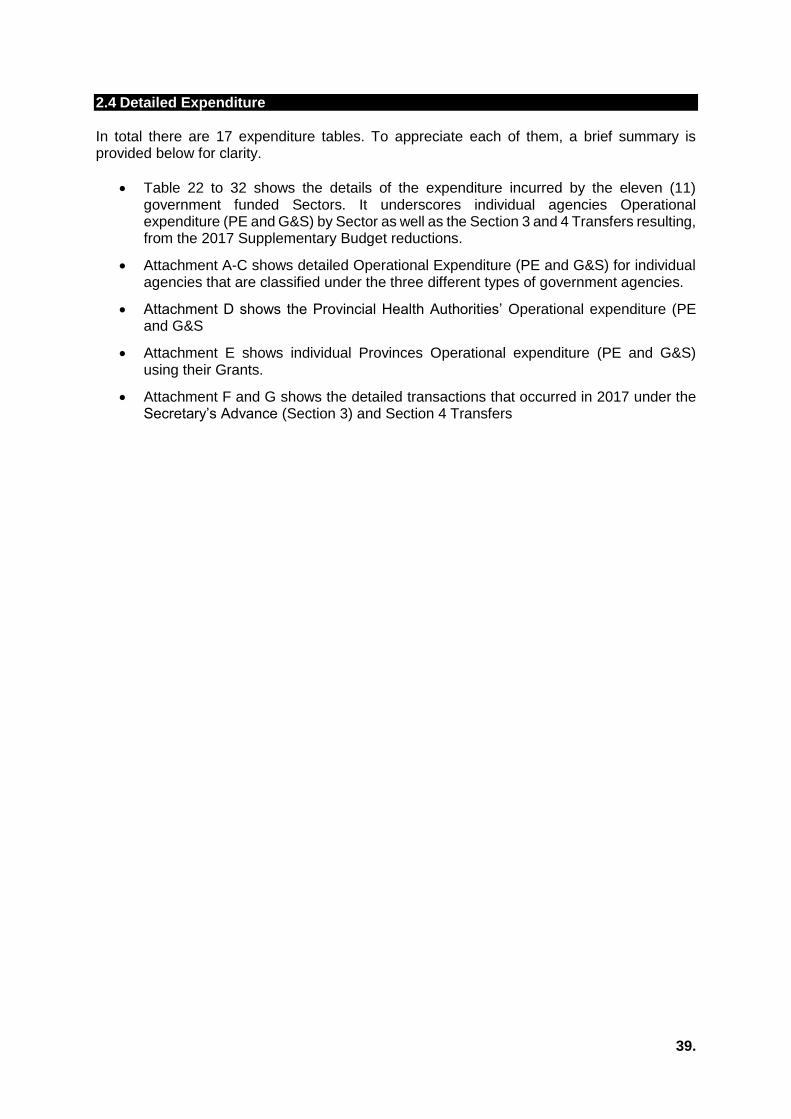
39.
2.4 Detailed Expenditure In total there are 17 expenditure tables. To appreciate each of them, a brief summary is provided below for clarity.
Table 22 to 32 shows the details of the expenditure incurred by the eleven (11) government funded Sectors. It underscores individual agencies Operational expenditure (PE and G&S) by Sector as well as the Section 3 and 4 Transfers resulting, from the 2017 Supplementary Budget reductions.
Attachment A-C shows detailed Operational Expenditure (PE and G&S) for individual agencies that are classified under the three different types of government agencies.
Attachment D shows the Provincial Health Authorities’ Operational expenditure (PE and G&S
Attachment E shows individual Provinces Operational expenditure (PE and G&S) using their Grants.
Attachment F and G shows the detailed transactions that occurred in 2017 under the Secretary’s Advance (Section 3) and Section 4 Transfers

40.
Table 22: Administration Sector
Expenditure Type by Sector 2017
Budget Suppl/
Transfers Revised Budget
Total Expense
Variance
201-National Parliament 106.9 29.2 136.1 134.5 -1.5
Goods & Services 27.0 12.5 39.5 38.0 -1.5
Personnel Emoluments 79.9 16.7 96.6 96.6 0.0
202-Office of Governor-General 5.6 2.9 8.6 8.5 -0.1
Goods & Services 3.7 1.9 5.6 5.6 0.0
Personnel Emoluments 1.9 1.1 2.9 2.8 -0.1
203-Department of Prime Minister & NEC 60.6 208.7 269.3 255.8 -13.5
Goods & Services 17.5 190.5 207.9 192.2 -15.7
Personnel Emoluments 43.1 18.2 61.3 63.6 2.2
204-National Statistical Office 9.6 1.1 10.7 9.0 -1.6
Goods & Services 4.8 0.0 4.8 2.7 -2.1
Personnel Emoluments 4.8 1.1 5.9 6.4 0.5
205-Office of Bougainville Affairs 2.5 0.6 3.2 3.9 0.7
Goods & Services 0.9 0.6 1.5 1.5 0.0
Personnel Emoluments 1.6 0.1 1.7 2.4 0.7
206-Department of Finance 33.4 20.6 54.0 54.6 0.6
Goods & Services 18.8 19.2 38.0 37.0 -1.0
Personnel Emoluments 14.6 1.4 16.0 17.5 1.5
208-Department of Treasury 149.9 -10.8 139.1 137.6 -1.5
Goods & Services 136.1 -11.0 125.1 122.2 -2.9
Personnel Emoluments 13.9 0.2 14.0 15.3 1.3
209-Registrar For Political Parties 5.7 0.3 6.0 6.8 0.8
Goods & Services 2.0 0.3 2.2 1.8 -0.4
Personnel Emoluments 3.7 0.0 3.7 4.9 1.2
211-PNG Customs Service 51.8 1.8 53.6 210.6 157.0
Debt Services 0.0 0.0 0.0 172.5 172.5
Goods & Services 21.8 -1.2 20.6 5.0 -15.6
Personnel Emoluments 30.0 3.0 33.0 33.2 0.1
212-Information Technology Division 10.1 -0.3 9.8 8.6 -1.2
Goods & Services 7.0 -0.3 6.7 6.4 -0.2
Personnel Emoluments 3.1 0.0 3.1 2.2 -1.0
213-Fire Services 18.1 3.0 21.1 21.7 0.6
Goods & Services 5.9 -1.7 4.2 3.8 -0.4
Personnel Emoluments 12.2 4.7 17.0 18.0 1.0
215-PNG Immigration and Citizenship Services
8.2 1.5 9.8 10.5 0.7
Personnel Emoluments 8.2 1.5 9.8 10.5 0.7
216-Internal Revenue Commission 75.1 0.0 75.1 45.3 -29.9
Goods & Services 30.0 -2.2 27.8 4.0 -23.8
Personnel Emoluments 45.1 2.2 47.3 41.3 -6.0
217-Department of Foreign Affairs and Trade
43.1 -29.2 13.9 15.4 1.5
Goods & Services 17.2 -14.4 2.8 3.1 0.3
Personnel Emoluments 25.9 -14.8 11.1 12.3 1.2
219-PNG Institute of Public Administration
5.6 -0.3 5.3 5.8 0.5
Goods & Services 1.5 -1.2 0.3 0.2 -0.1
Personnel Emoluments 4.1 0.9 5.0 5.6 0.6
220-Department of Personnel Management
15.1 12.2 27.3 27.4 0.1
Goods & Services 3.4 3.2 6.7 6.5 -0.2
Personnel Emoluments 11.6 9.0 20.6 20.9 0.3
221-Public Service Commission 5.5 -0.2 5.3 5.6 0.3
Goods & Services 1.3 -0.3 0.9 0.8 -0.1
Personnel Emoluments 4.2 0.1 4.4 4.8 0.4
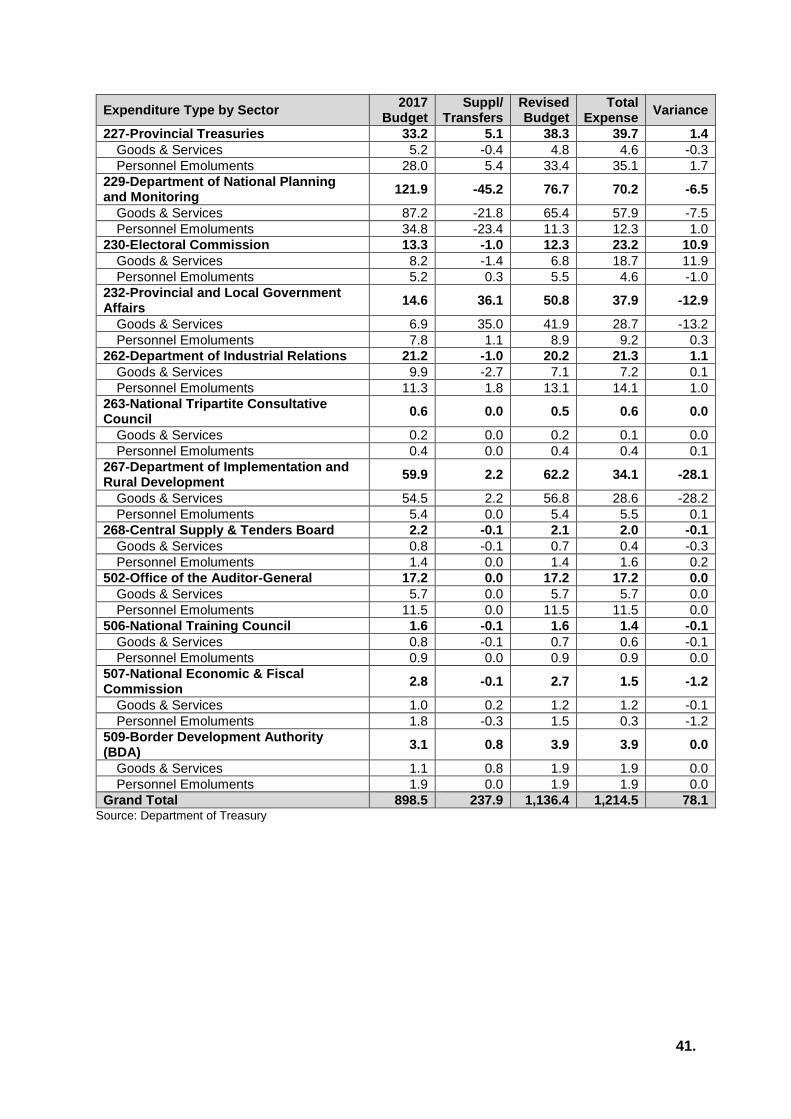
41.
Expenditure Type by Sector 2017
Budget Suppl/
Transfers Revised Budget
Total Expense
Variance
227-Provincial Treasuries 33.2 5.1 38.3 39.7 1.4
Goods & Services 5.2 -0.4 4.8 4.6 -0.3
Personnel Emoluments 28.0 5.4 33.4 35.1 1.7
229-Department of National Planning and Monitoring
121.9 -45.2 76.7 70.2 -6.5
Goods & Services 87.2 -21.8 65.4 57.9 -7.5
Personnel Emoluments 34.8 -23.4 11.3 12.3 1.0
230-Electoral Commission 13.3 -1.0 12.3 23.2 10.9
Goods & Services 8.2 -1.4 6.8 18.7 11.9
Personnel Emoluments 5.2 0.3 5.5 4.6 -1.0
232-Provincial and Local Government Affairs
14.6 36.1 50.8 37.9 -12.9
Goods & Services 6.9 35.0 41.9 28.7 -13.2
Personnel Emoluments 7.8 1.1 8.9 9.2 0.3
262-Department of Industrial Relations 21.2 -1.0 20.2 21.3 1.1
Goods & Services 9.9 -2.7 7.1 7.2 0.1
Personnel Emoluments 11.3 1.8 13.1 14.1 1.0
263-National Tripartite Consultative Council
0.6 0.0 0.5 0.6 0.0
Goods & Services 0.2 0.0 0.2 0.1 0.0
Personnel Emoluments 0.4 0.0 0.4 0.4 0.1
267-Department of Implementation and Rural Development
59.9 2.2 62.2 34.1 -28.1
Goods & Services 54.5 2.2 56.8 28.6 -28.2
Personnel Emoluments 5.4 0.0 5.4 5.5 0.1
268-Central Supply & Tenders Board 2.2 -0.1 2.1 2.0 -0.1
Goods & Services 0.8 -0.1 0.7 0.4 -0.3
Personnel Emoluments 1.4 0.0 1.4 1.6 0.2
502-Office of the Auditor-General 17.2 0.0 17.2 17.2 0.0
Goods & Services 5.7 0.0 5.7 5.7 0.0
Personnel Emoluments 11.5 0.0 11.5 11.5 0.0
506-National Training Council 1.6 -0.1 1.6 1.4 -0.1
Goods & Services 0.8 -0.1 0.7 0.6 -0.1
Personnel Emoluments 0.9 0.0 0.9 0.9 0.0
507-National Economic & Fiscal Commission
2.8 -0.1 2.7 1.5 -1.2
Goods & Services 1.0 0.2 1.2 1.2 -0.1
Personnel Emoluments 1.8 -0.3 1.5 0.3 -1.2
509-Border Development Authority (BDA)
3.1 0.8 3.9 3.9 0.0
Goods & Services 1.1 0.8 1.9 1.9 0.0
Personnel Emoluments 1.9 0.0 1.9 1.9 0.0
Grand Total 898.5 237.9 1,136.4 1,214.5 78.1 Source: Department of Treasury
42.
Table 23: Community and Culture
Expenditure Type by Sector 2017
Budget Suppl/
Transfers Revised Budget
Total Expense
Variance
233-Office of Censorship 2.3 0.8 3.1 2.8 -0.3
Goods & Services 0.4 0.8 1.2 1.2 -0.1
Personnel Emoluments 1.9 0.0 1.9 1.7 -0.2
237-PNG National Commission for UNESCO
0.0 1.2 1.2 1.4 0.2
Personnel Emoluments 0.0 1.2 1.2 1.4 0.2
242-Department of Community Development
9.8 14.0 23.8 24.3 0.5
Goods & Services 2.8 10.8 13.6 13.6 0.0
Personnel Emoluments 7.0 3.2 10.2 10.7 0.5
243-National Volunteer Services 2.9 0.0 2.8 2.4 -0.4
Goods & Services 0.7 0.0 0.6 0.6 -0.1
Personnel Emoluments 2.2 0.0 2.2 1.8 -0.4
246-Office of Urbanization 1.2 0.1 1.3 2.1 0.8
Goods & Services 0.1 0.0 0.1 0.1 0.0
Personnel Emoluments 1.1 0.1 1.1 2.0 0.9
516-Papua New Guinea Sports Foundation
33.7 -2.9 30.7 30.2 -0.5
Goods & Services 28.1 -2.9 25.2 25.2 0.0
Personnel Emoluments 5.5 0.0 5.5 5.0 -0.5
521-National Youth Commission 2.8 -0.1 2.7 4.0 1.3
Goods & Services 1.2 -0.1 1.1 1.1 0.0
Personnel Emoluments 1.6 0.0 1.6 2.9 1.3
539-National Museum and Art Gallery 11.6 -1.9 9.7 8.9 -0.7
Goods & Services 7.9 -1.9 6.0 6.0 0.0
Personnel Emoluments 3.7 0.0 3.7 2.9 -0.7
542-National Cultural Commission 3.5 0.1 3.6 3.5 -0.1
Goods & Services 0.8 -0.1 0.7 0.7 0.0
Personnel Emoluments 2.7 0.2 2.9 2.8 -0.1
Grand Total 67.6 11.2 78.9 79.6 0.7 Source: Department of Treasury
Table 24 Debt Interest
Expenditure Type by Sector 2017
Budget Suppl/
Transfers Revised Budget
Total Expense
Variance
299-Treasury and Finance - Public Debt Charges
1,382.9 150.0 1,532.9 1,633.9 -101.0
Debt Services 1,382.9 150.0 1,532.9 1,633.9 -101.0
Grand Total 1,382.9 150.0 1,532.9 1,633.9 -101.0 Source: Department of Treasury
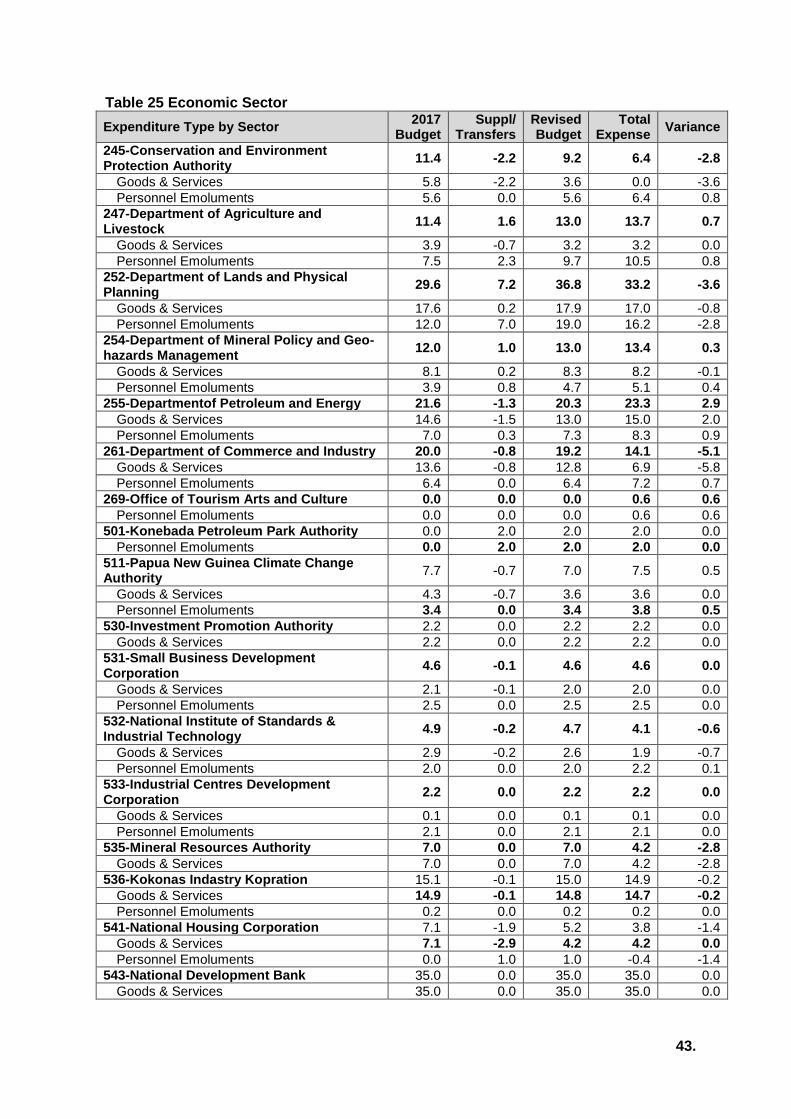
43.
Table 25 Economic Sector
Expenditure Type by Sector 2017
Budget Suppl/
Transfers Revised Budget
Total Expense
Variance
245-Conservation and Environment Protection Authority
11.4 -2.2 9.2 6.4 -2.8
Goods & Services 5.8 -2.2 3.6 0.0 -3.6
Personnel Emoluments 5.6 0.0 5.6 6.4 0.8
247-Department of Agriculture and Livestock
11.4 1.6 13.0 13.7 0.7
Goods & Services 3.9 -0.7 3.2 3.2 0.0
Personnel Emoluments 7.5 2.3 9.7 10.5 0.8
252-Department of Lands and Physical Planning
29.6 7.2 36.8 33.2 -3.6
Goods & Services 17.6 0.2 17.9 17.0 -0.8
Personnel Emoluments 12.0 7.0 19.0 16.2 -2.8
254-Department of Mineral Policy and Geo-hazards Management
12.0 1.0 13.0 13.4 0.3
Goods & Services 8.1 0.2 8.3 8.2 -0.1
Personnel Emoluments 3.9 0.8 4.7 5.1 0.4
255-Departmentof Petroleum and Energy 21.6 -1.3 20.3 23.3 2.9
Goods & Services 14.6 -1.5 13.0 15.0 2.0
Personnel Emoluments 7.0 0.3 7.3 8.3 0.9
261-Department of Commerce and Industry 20.0 -0.8 19.2 14.1 -5.1
Goods & Services 13.6 -0.8 12.8 6.9 -5.8
Personnel Emoluments 6.4 0.0 6.4 7.2 0.7
269-Office of Tourism Arts and Culture 0.0 0.0 0.0 0.6 0.6
Personnel Emoluments 0.0 0.0 0.0 0.6 0.6
501-Konebada Petroleum Park Authority 0.0 2.0 2.0 2.0 0.0
Personnel Emoluments 0.0 2.0 2.0 2.0 0.0
511-Papua New Guinea Climate Change Authority
7.7 -0.7 7.0 7.5 0.5
Goods & Services 4.3 -0.7 3.6 3.6 0.0
Personnel Emoluments 3.4 0.0 3.4 3.8 0.5
530-Investment Promotion Authority 2.2 0.0 2.2 2.2 0.0
Goods & Services 2.2 0.0 2.2 2.2 0.0
531-Small Business Development Corporation
4.6 -0.1 4.6 4.6 0.0
Goods & Services 2.1 -0.1 2.0 2.0 0.0
Personnel Emoluments 2.5 0.0 2.5 2.5 0.0
532-National Institute of Standards & Industrial Technology
4.9 -0.2 4.7 4.1 -0.6
Goods & Services 2.9 -0.2 2.6 1.9 -0.7
Personnel Emoluments 2.0 0.0 2.0 2.2 0.1
533-Industrial Centres Development Corporation
2.2 0.0 2.2 2.2 0.0
Goods & Services 0.1 0.0 0.1 0.1 0.0
Personnel Emoluments 2.1 0.0 2.1 2.1 0.0
535-Mineral Resources Authority 7.0 0.0 7.0 4.2 -2.8
Goods & Services 7.0 0.0 7.0 4.2 -2.8
536-Kokonas Indastry Kopration 15.1 -0.1 15.0 14.9 -0.2
Goods & Services 14.9 -0.1 14.8 14.7 -0.2
Personnel Emoluments 0.2 0.0 0.2 0.2 0.0
541-National Housing Corporation 7.1 -1.9 5.2 3.8 -1.4
Goods & Services 7.1 -2.9 4.2 4.2 0.0
Personnel Emoluments 0.0 1.0 1.0 -0.4 -1.4
543-National Development Bank 35.0 0.0 35.0 35.0 0.0
Goods & Services 35.0 0.0 35.0 35.0 0.0
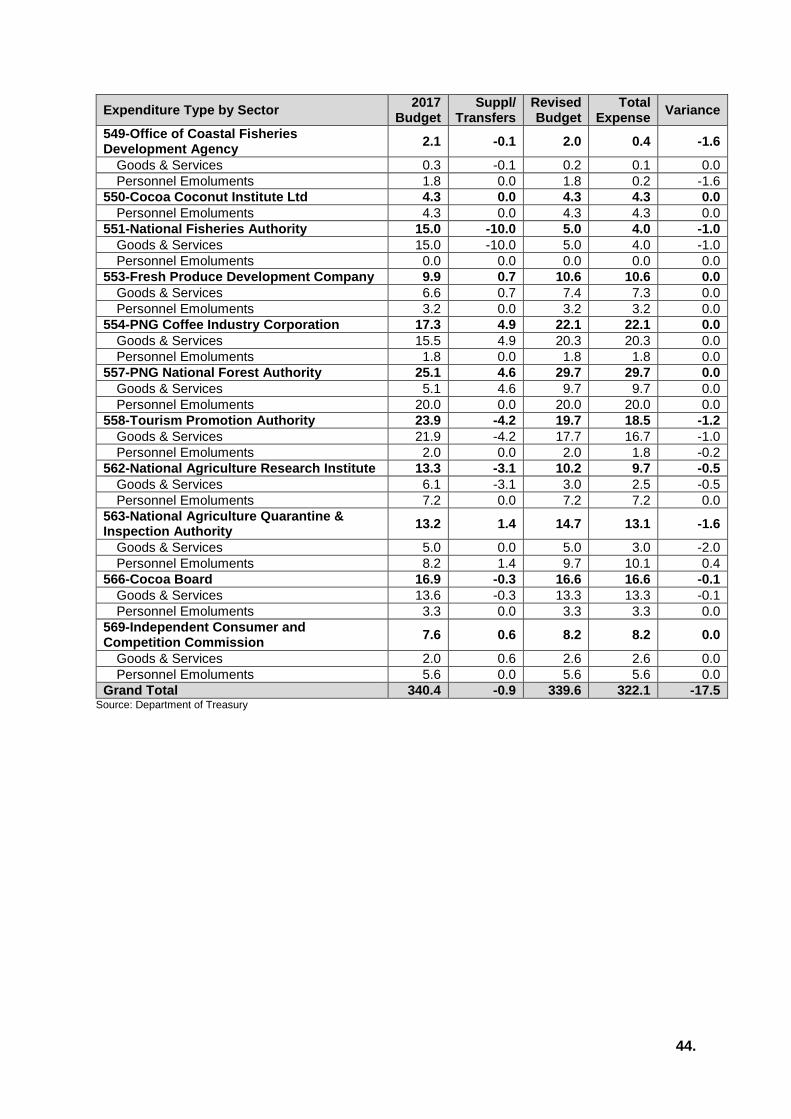
44.
Expenditure Type by Sector 2017
Budget Suppl/
Transfers Revised Budget
Total Expense
Variance
549-Office of Coastal Fisheries Development Agency
2.1 -0.1 2.0 0.4 -1.6
Goods & Services 0.3 -0.1 0.2 0.1 0.0
Personnel Emoluments 1.8 0.0 1.8 0.2 -1.6
550-Cocoa Coconut Institute Ltd 4.3 0.0 4.3 4.3 0.0
Personnel Emoluments 4.3 0.0 4.3 4.3 0.0
551-National Fisheries Authority 15.0 -10.0 5.0 4.0 -1.0
Goods & Services 15.0 -10.0 5.0 4.0 -1.0
Personnel Emoluments 0.0 0.0 0.0 0.0 0.0
553-Fresh Produce Development Company 9.9 0.7 10.6 10.6 0.0
Goods & Services 6.6 0.7 7.4 7.3 0.0
Personnel Emoluments 3.2 0.0 3.2 3.2 0.0
554-PNG Coffee Industry Corporation 17.3 4.9 22.1 22.1 0.0
Goods & Services 15.5 4.9 20.3 20.3 0.0
Personnel Emoluments 1.8 0.0 1.8 1.8 0.0
557-PNG National Forest Authority 25.1 4.6 29.7 29.7 0.0
Goods & Services 5.1 4.6 9.7 9.7 0.0
Personnel Emoluments 20.0 0.0 20.0 20.0 0.0
558-Tourism Promotion Authority 23.9 -4.2 19.7 18.5 -1.2
Goods & Services 21.9 -4.2 17.7 16.7 -1.0
Personnel Emoluments 2.0 0.0 2.0 1.8 -0.2
562-National Agriculture Research Institute 13.3 -3.1 10.2 9.7 -0.5
Goods & Services 6.1 -3.1 3.0 2.5 -0.5
Personnel Emoluments 7.2 0.0 7.2 7.2 0.0
563-National Agriculture Quarantine & Inspection Authority
13.2 1.4 14.7 13.1 -1.6
Goods & Services 5.0 0.0 5.0 3.0 -2.0
Personnel Emoluments 8.2 1.4 9.7 10.1 0.4
566-Cocoa Board 16.9 -0.3 16.6 16.6 -0.1
Goods & Services 13.6 -0.3 13.3 13.3 -0.1
Personnel Emoluments 3.3 0.0 3.3 3.3 0.0
569-Independent Consumer and Competition Commission
7.6 0.6 8.2 8.2 0.0
Goods & Services 2.0 0.6 2.6 2.6 0.0
Personnel Emoluments 5.6 0.0 5.6 5.6 0.0
Grand Total 340.4 -0.9 339.6 322.1 -17.5 Source: Department of Treasury

45.
Table 26: Education Sector
Expenditure Type by Sector 2017
Budget Suppl/
Transfers Revised Budget
Total Expense
Variance
235-Department of Education 800.5 -524.6 275.9 272.4 -3.5
Goods & Services 691.9 -569.9 121.9 118.6 -3.3
Personnel Emoluments 108.6 45.4 154.0 153.7 -0.3
236-Department of Higher Education Research Science & Technology
113.6 13.8 127.4 125.3 -2.1
Goods & Services 109.3 13.8 123.1 120.8 -2.3
Personnel Emoluments 4.3 0.0 4.3 4.5 0.2
251-PNG Science & Technology Secretariat
3.2 0.0 3.1 3.4 0.2
Goods & Services 1.4 0.0 1.4 1.4 0.0
Personnel Emoluments 1.8 0.0 1.8 2.0 0.2
505-National Research Institute 5.1 -0.6 4.5 4.0 -0.5
Goods & Services 2.1 -0.6 1.5 1.3 -0.3
Personnel Emoluments 3.0 0.0 3.0 2.7 -0.2
512-University of Papua New Guinea 69.3 3.0 72.2 67.7 -4.5
Goods & Services 23.2 -5.7 17.5 13.0 -4.5
Personnel Emoluments 46.0 8.7 54.7 54.7 0.0
513-University of Technology 50.3 -6.1 44.2 43.2 -1.0
Goods & Services 17.8 -8.2 9.6 9.6 0.0
Personnel Emoluments 32.6 2.1 34.6 33.6 -1.0
514-University of Goroka 19.6 0.1 19.7 19.1 -0.6
Goods & Services 2.4 0.1 2.5 1.9 -0.6
Personnel Emoluments 17.2 0.0 17.2 17.2 0.0
515-University of Environment & Natural Resources
23.0 -4.2 18.9 18.9 0.0
Goods & Services 6.4 -4.2 2.3 2.3 0.0
Personnel Emoluments 16.6 0.0 16.6 16.6 0.0
518-PNG Maritime College 7.9 -4.0 3.9 3.6 -0.3
Goods & Services 4.2 -4.0 0.2 0.1 -0.1
Personnel Emoluments 3.7 0.0 3.7 3.5 -0.3
Grand Total 1,092.5 -522.6 569.9 557.6 -12.3 Source: Department of Treasury
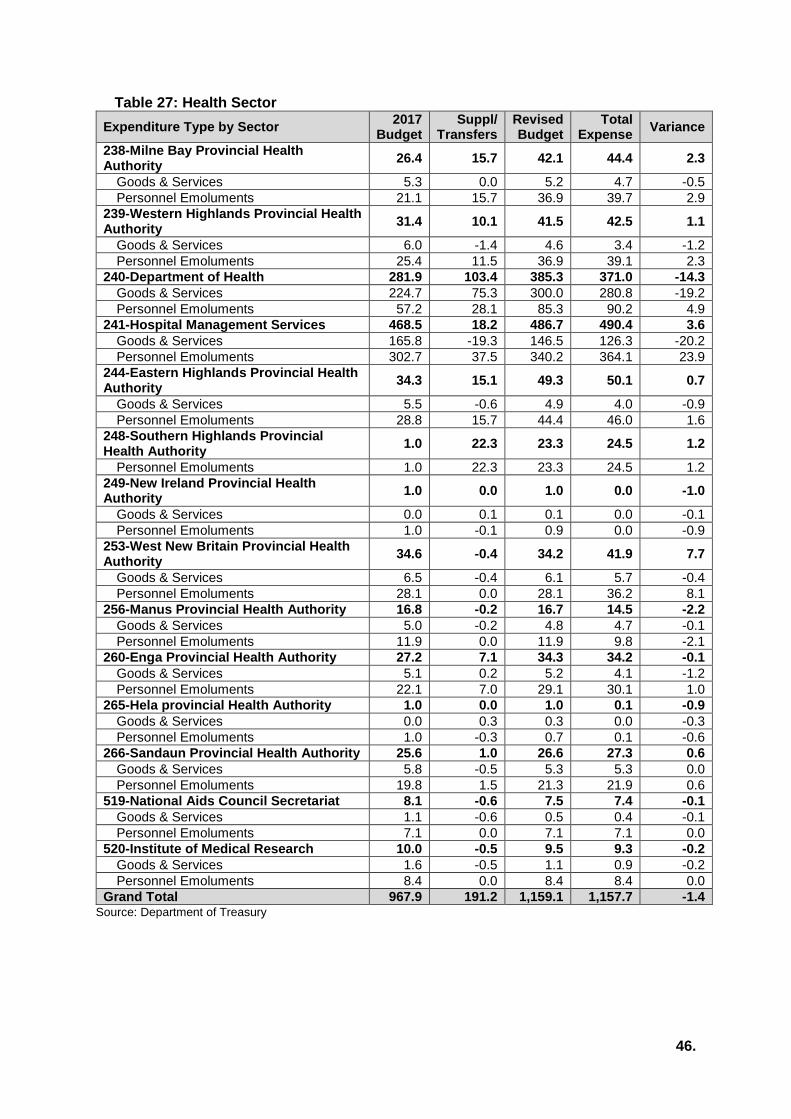
46.
Table 27: Health Sector
Expenditure Type by Sector 2017
Budget Suppl/
Transfers Revised Budget
Total Expense
Variance
238-Milne Bay Provincial Health Authority
26.4 15.7 42.1 44.4 2.3
Goods & Services 5.3 0.0 5.2 4.7 -0.5
Personnel Emoluments 21.1 15.7 36.9 39.7 2.9
239-Western Highlands Provincial Health Authority
31.4 10.1 41.5 42.5 1.1
Goods & Services 6.0 -1.4 4.6 3.4 -1.2
Personnel Emoluments 25.4 11.5 36.9 39.1 2.3
240-Department of Health 281.9 103.4 385.3 371.0 -14.3
Goods & Services 224.7 75.3 300.0 280.8 -19.2
Personnel Emoluments 57.2 28.1 85.3 90.2 4.9
241-Hospital Management Services 468.5 18.2 486.7 490.4 3.6
Goods & Services 165.8 -19.3 146.5 126.3 -20.2
Personnel Emoluments 302.7 37.5 340.2 364.1 23.9
244-Eastern Highlands Provincial Health Authority
34.3 15.1 49.3 50.1 0.7
Goods & Services 5.5 -0.6 4.9 4.0 -0.9
Personnel Emoluments 28.8 15.7 44.4 46.0 1.6
248-Southern Highlands Provincial Health Authority
1.0 22.3 23.3 24.5 1.2
Personnel Emoluments 1.0 22.3 23.3 24.5 1.2
249-New Ireland Provincial Health Authority
1.0 0.0 1.0 0.0 -1.0
Goods & Services 0.0 0.1 0.1 0.0 -0.1
Personnel Emoluments 1.0 -0.1 0.9 0.0 -0.9
253-West New Britain Provincial Health Authority
34.6 -0.4 34.2 41.9 7.7
Goods & Services 6.5 -0.4 6.1 5.7 -0.4
Personnel Emoluments 28.1 0.0 28.1 36.2 8.1
256-Manus Provincial Health Authority 16.8 -0.2 16.7 14.5 -2.2
Goods & Services 5.0 -0.2 4.8 4.7 -0.1
Personnel Emoluments 11.9 0.0 11.9 9.8 -2.1
260-Enga Provincial Health Authority 27.2 7.1 34.3 34.2 -0.1
Goods & Services 5.1 0.2 5.2 4.1 -1.2
Personnel Emoluments 22.1 7.0 29.1 30.1 1.0
265-Hela provincial Health Authority 1.0 0.0 1.0 0.1 -0.9
Goods & Services 0.0 0.3 0.3 0.0 -0.3
Personnel Emoluments 1.0 -0.3 0.7 0.1 -0.6
266-Sandaun Provincial Health Authority 25.6 1.0 26.6 27.3 0.6
Goods & Services 5.8 -0.5 5.3 5.3 0.0
Personnel Emoluments 19.8 1.5 21.3 21.9 0.6
519-National Aids Council Secretariat 8.1 -0.6 7.5 7.4 -0.1
Goods & Services 1.1 -0.6 0.5 0.4 -0.1
Personnel Emoluments 7.1 0.0 7.1 7.1 0.0
520-Institute of Medical Research 10.0 -0.5 9.5 9.3 -0.2
Goods & Services 1.6 -0.5 1.1 0.9 -0.2
Personnel Emoluments 8.4 0.0 8.4 8.4 0.0
Grand Total 967.9 191.2 1,159.1 1,157.7 -1.4 Source: Department of Treasury
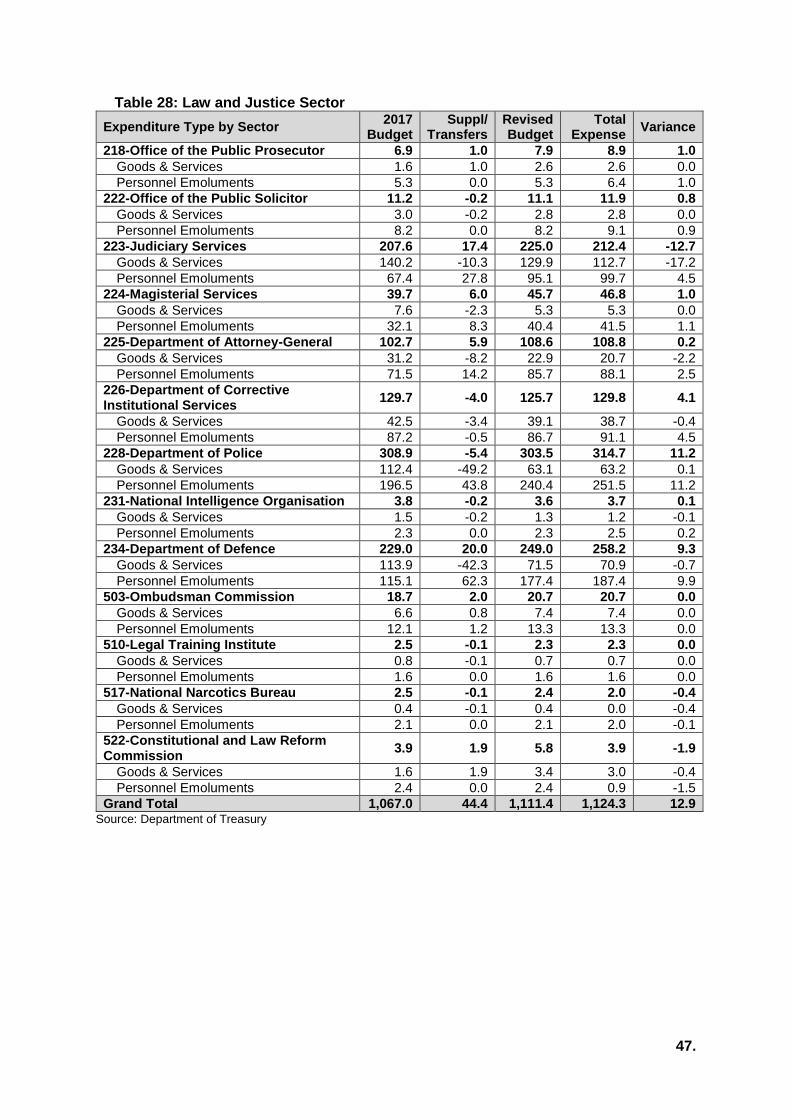
47.
Table 28: Law and Justice Sector
Expenditure Type by Sector 2017
Budget Suppl/
Transfers Revised Budget
Total Expense
Variance
218-Office of the Public Prosecutor 6.9 1.0 7.9 8.9 1.0
Goods & Services 1.6 1.0 2.6 2.6 0.0
Personnel Emoluments 5.3 0.0 5.3 6.4 1.0
222-Office of the Public Solicitor 11.2 -0.2 11.1 11.9 0.8
Goods & Services 3.0 -0.2 2.8 2.8 0.0
Personnel Emoluments 8.2 0.0 8.2 9.1 0.9
223-Judiciary Services 207.6 17.4 225.0 212.4 -12.7
Goods & Services 140.2 -10.3 129.9 112.7 -17.2
Personnel Emoluments 67.4 27.8 95.1 99.7 4.5
224-Magisterial Services 39.7 6.0 45.7 46.8 1.0
Goods & Services 7.6 -2.3 5.3 5.3 0.0
Personnel Emoluments 32.1 8.3 40.4 41.5 1.1
225-Department of Attorney-General 102.7 5.9 108.6 108.8 0.2
Goods & Services 31.2 -8.2 22.9 20.7 -2.2
Personnel Emoluments 71.5 14.2 85.7 88.1 2.5
226-Department of Corrective Institutional Services
129.7 -4.0 125.7 129.8 4.1
Goods & Services 42.5 -3.4 39.1 38.7 -0.4
Personnel Emoluments 87.2 -0.5 86.7 91.1 4.5
228-Department of Police 308.9 -5.4 303.5 314.7 11.2
Goods & Services 112.4 -49.2 63.1 63.2 0.1
Personnel Emoluments 196.5 43.8 240.4 251.5 11.2
231-National Intelligence Organisation 3.8 -0.2 3.6 3.7 0.1
Goods & Services 1.5 -0.2 1.3 1.2 -0.1
Personnel Emoluments 2.3 0.0 2.3 2.5 0.2
234-Department of Defence 229.0 20.0 249.0 258.2 9.3
Goods & Services 113.9 -42.3 71.5 70.9 -0.7
Personnel Emoluments 115.1 62.3 177.4 187.4 9.9
503-Ombudsman Commission 18.7 2.0 20.7 20.7 0.0
Goods & Services 6.6 0.8 7.4 7.4 0.0
Personnel Emoluments 12.1 1.2 13.3 13.3 0.0
510-Legal Training Institute 2.5 -0.1 2.3 2.3 0.0
Goods & Services 0.8 -0.1 0.7 0.7 0.0
Personnel Emoluments 1.6 0.0 1.6 1.6 0.0
517-National Narcotics Bureau 2.5 -0.1 2.4 2.0 -0.4
Goods & Services 0.4 -0.1 0.4 0.0 -0.4
Personnel Emoluments 2.1 0.0 2.1 2.0 -0.1
522-Constitutional and Law Reform Commission
3.9 1.9 5.8 3.9 -1.9
Goods & Services 1.6 1.9 3.4 3.0 -0.4
Personnel Emoluments 2.4 0.0 2.4 0.9 -1.5
Grand Total 1,067.0 44.4 1,111.4 1,124.3 12.9 Source: Department of Treasury

48.
Table 29: Miscellaneous Expense
Expenditure Type by Sector 2017
Budget Suppl/
Transfers Revised Budget
Total Expense
Variance
207-Treasury and Finance - Miscellaneous 1,491.4 297.3 1,788.7 1,551.2 -237.5
Goods & Services 1,154.5 230.1 1,384.7 1,250.5 -134.2
Personnel Emoluments 336.9 67.1 404.0 300.7 -103.3
Grand Total 1,491.4 297.3 1,788.7 1,551.2 -237.5 Source: Department of Treasury
Table 30: Provinces Sector
Expenditure Type by Sector 2017
Budget Suppl/
Transfers Revised Budget
Total Expense
Variance
571-Fly River Provincial Administration 137.4 -38.1 99.4 109.0 9.6
Goods & Services 85.8 -38.1 47.8 46.7 -1.0
Personnel Emoluments 51.6 0.0 51.6 62.3 10.7
572-Gulf Provincial Administration 86.0 -25.3 60.8 61.5 0.7
Goods & Services 56.2 -25.3 31.0 29.3 -1.7
Personnel Emoluments 29.8 0.0 29.8 32.2 2.4
573-Central Provincial Administration 145.5 -41.7 103.8 123.3 19.5
Goods & Services 83.8 -41.7 42.2 41.4 -0.8
Personnel Emoluments 61.6 0.0 61.6 81.9 20.3
574-National Capital District 166.4 19.1 185.6 191.3 5.8
Debt Services 100.0 50.0 150.0 158.0 8.0
Goods & Services 66.4 -30.9 35.6 33.3 -2.3
Personnel Emoluments 0.0 0.0 0.0 0.0 0.0
575-Milne Bay Provincial Administration 157.5 -44.0 113.5 115.8 2.2
Goods & Services 87.9 -44.0 44.0 43.3 -0.7
Personnel Emoluments 69.6 0.0 69.6 72.5 3.0
576-Oro Provincial Administration 89.9 -25.4 64.5 66.4 1.9
Goods & Services 51.9 -25.4 26.5 26.0 -0.5
Personnel Emoluments 38.0 0.0 38.0 40.4 2.4
577-Southern Highlands Provincial Administration 188.7 -50.5 138.2 162.6 24.4
Goods & Services 96.6 -50.5 46.1 44.6 -1.5
Personnel Emoluments 92.1 0.0 92.1 118.0 25.9
578-Enga Provincial Administration 160.8 -46.2 114.7 139.9 25.2
Goods & Services 95.4 -46.2 49.2 50.2 1.0
Personnel Emoluments 65.5 0.0 65.5 89.6 24.1
579-Western Highlands Provincial Administration 170.8 -41.0 129.8 142.8 13.1
Goods & Services 80.4 -41.0 39.4 36.7 -2.7
Personnel Emoluments 90.4 0.0 90.4 106.2 15.7
580-Simbu Provincial Administration 188.6 -58.8 129.7 140.9 11.2
Goods & Services 107.7 -58.8 48.8 48.0 -0.8
Personnel Emoluments 80.9 0.0 80.9 92.9 12.0
581-Eastern Highlands Provincial Administration 238.4 -69.6 168.8 181.5 12.8
Goods & Services 143.4 -69.6 73.8 67.6 -6.2
Personnel Emoluments 95.0 0.0 95.0 114.0 19.0
582-Morobe Provincial Administration 274.0 -85.1 188.9 218.2 29.3
Goods & Services 113.5 -85.1 28.4 27.2 -1.2
Personnel Emoluments 160.5 0.0 160.5 191.0 30.5
583-Madang Provincial Administration 245.7 -68.1 177.6 194.0 16.4
Goods & Services 132.4 -68.1 64.4 63.6 -0.8
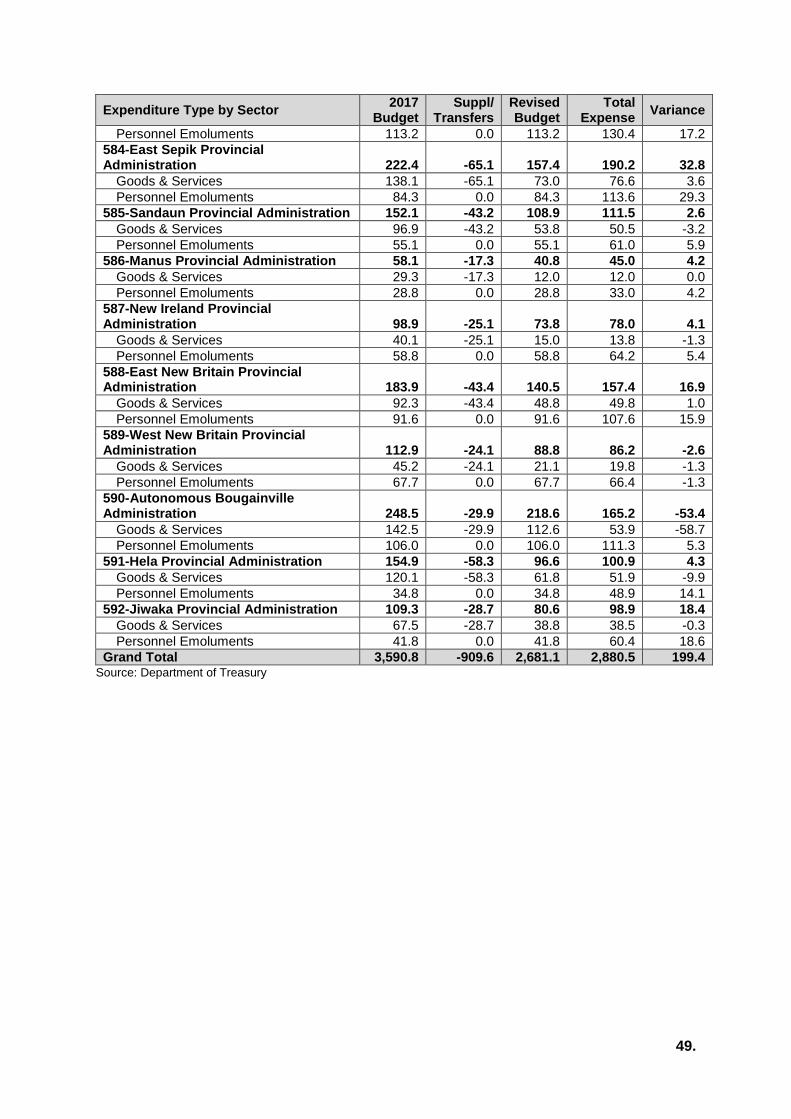
49.
Expenditure Type by Sector 2017
Budget Suppl/
Transfers Revised Budget
Total Expense
Variance
Personnel Emoluments 113.2 0.0 113.2 130.4 17.2
584-East Sepik Provincial Administration 222.4 -65.1 157.4 190.2 32.8
Goods & Services 138.1 -65.1 73.0 76.6 3.6
Personnel Emoluments 84.3 0.0 84.3 113.6 29.3
585-Sandaun Provincial Administration 152.1 -43.2 108.9 111.5 2.6
Goods & Services 96.9 -43.2 53.8 50.5 -3.2
Personnel Emoluments 55.1 0.0 55.1 61.0 5.9
586-Manus Provincial Administration 58.1 -17.3 40.8 45.0 4.2
Goods & Services 29.3 -17.3 12.0 12.0 0.0
Personnel Emoluments 28.8 0.0 28.8 33.0 4.2
587-New Ireland Provincial Administration 98.9 -25.1 73.8 78.0 4.1
Goods & Services 40.1 -25.1 15.0 13.8 -1.3
Personnel Emoluments 58.8 0.0 58.8 64.2 5.4
588-East New Britain Provincial Administration 183.9 -43.4 140.5 157.4 16.9
Goods & Services 92.3 -43.4 48.8 49.8 1.0
Personnel Emoluments 91.6 0.0 91.6 107.6 15.9
589-West New Britain Provincial Administration 112.9 -24.1 88.8 86.2 -2.6
Goods & Services 45.2 -24.1 21.1 19.8 -1.3
Personnel Emoluments 67.7 0.0 67.7 66.4 -1.3
590-Autonomous Bougainville Administration 248.5 -29.9 218.6 165.2 -53.4
Goods & Services 142.5 -29.9 112.6 53.9 -58.7
Personnel Emoluments 106.0 0.0 106.0 111.3 5.3
591-Hela Provincial Administration 154.9 -58.3 96.6 100.9 4.3
Goods & Services 120.1 -58.3 61.8 51.9 -9.9
Personnel Emoluments 34.8 0.0 34.8 48.9 14.1
592-Jiwaka Provincial Administration 109.3 -28.7 80.6 98.9 18.4
Goods & Services 67.5 -28.7 38.8 38.5 -0.3
Personnel Emoluments 41.8 0.0 41.8 60.4 18.6
Grand Total 3,590.8 -909.6 2,681.1 2,880.5 199.4 Source: Department of Treasury
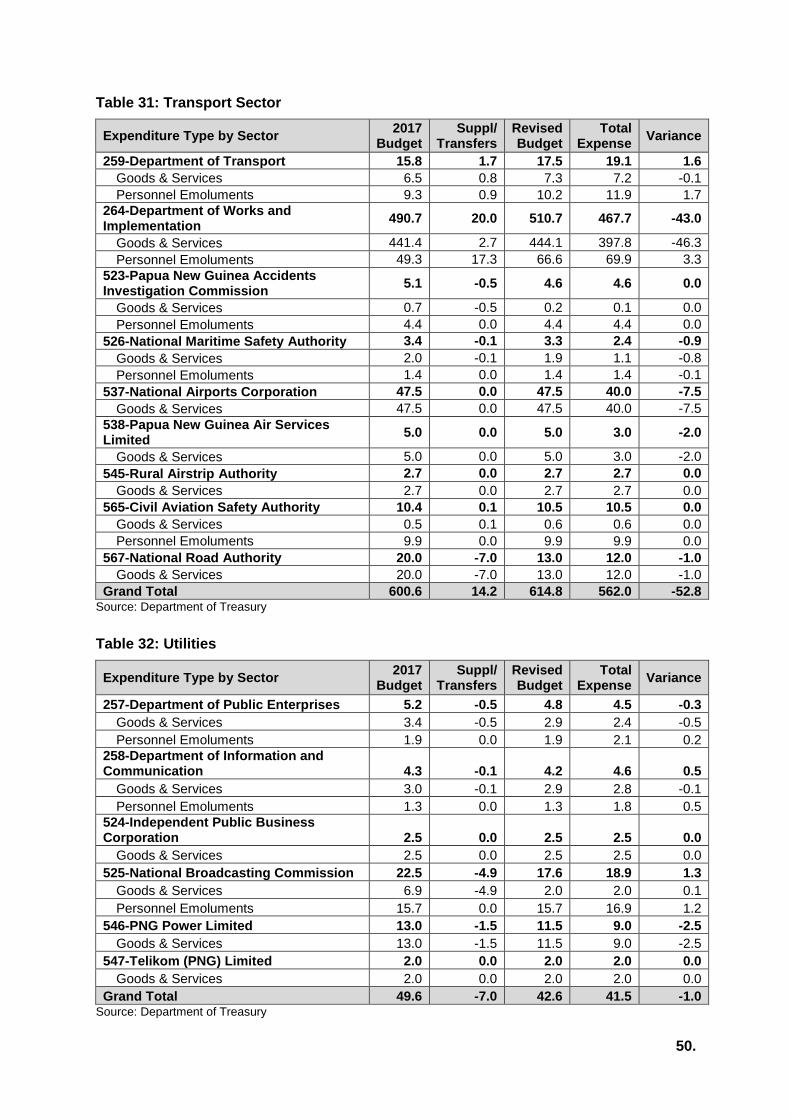
50.
Table 31: Transport Sector
Expenditure Type by Sector 2017
Budget Suppl/
Transfers Revised Budget
Total Expense
Variance
259-Department of Transport 15.8 1.7 17.5 19.1 1.6
Goods & Services 6.5 0.8 7.3 7.2 -0.1
Personnel Emoluments 9.3 0.9 10.2 11.9 1.7
264-Department of Works and Implementation
490.7 20.0 510.7 467.7 -43.0
Goods & Services 441.4 2.7 444.1 397.8 -46.3
Personnel Emoluments 49.3 17.3 66.6 69.9 3.3
523-Papua New Guinea Accidents Investigation Commission
5.1 -0.5 4.6 4.6 0.0
Goods & Services 0.7 -0.5 0.2 0.1 0.0
Personnel Emoluments 4.4 0.0 4.4 4.4 0.0
526-National Maritime Safety Authority 3.4 -0.1 3.3 2.4 -0.9
Goods & Services 2.0 -0.1 1.9 1.1 -0.8
Personnel Emoluments 1.4 0.0 1.4 1.4 -0.1
537-National Airports Corporation 47.5 0.0 47.5 40.0 -7.5
Goods & Services 47.5 0.0 47.5 40.0 -7.5
538-Papua New Guinea Air Services Limited
5.0 0.0 5.0 3.0 -2.0
Goods & Services 5.0 0.0 5.0 3.0 -2.0
545-Rural Airstrip Authority 2.7 0.0 2.7 2.7 0.0
Goods & Services 2.7 0.0 2.7 2.7 0.0
565-Civil Aviation Safety Authority 10.4 0.1 10.5 10.5 0.0
Goods & Services 0.5 0.1 0.6 0.6 0.0
Personnel Emoluments 9.9 0.0 9.9 9.9 0.0
567-National Road Authority 20.0 -7.0 13.0 12.0 -1.0
Goods & Services 20.0 -7.0 13.0 12.0 -1.0
Grand Total 600.6 14.2 614.8 562.0 -52.8 Source: Department of Treasury
Table 32: Utilities
Expenditure Type by Sector 2017
Budget Suppl/
Transfers Revised Budget
Total Expense
Variance
257-Department of Public Enterprises 5.2 -0.5 4.8 4.5 -0.3
Goods & Services 3.4 -0.5 2.9 2.4 -0.5
Personnel Emoluments 1.9 0.0 1.9 2.1 0.2
258-Department of Information and Communication 4.3 -0.1 4.2 4.6 0.5
Goods & Services 3.0 -0.1 2.9 2.8 -0.1
Personnel Emoluments 1.3 0.0 1.3 1.8 0.5
524-Independent Public Business Corporation 2.5 0.0 2.5 2.5 0.0
Goods & Services 2.5 0.0 2.5 2.5 0.0
525-National Broadcasting Commission 22.5 -4.9 17.6 18.9 1.3
Goods & Services 6.9 -4.9 2.0 2.0 0.1
Personnel Emoluments 15.7 0.0 15.7 16.9 1.2
546-PNG Power Limited 13.0 -1.5 11.5 9.0 -2.5
Goods & Services 13.0 -1.5 11.5 9.0 -2.5
547-Telikom (PNG) Limited 2.0 0.0 2.0 2.0 0.0
Goods & Services 2.0 0.0 2.0 2.0 0.0
Grand Total 49.6 -7.0 42.6 41.5 -1.0 Source: Department of Treasury
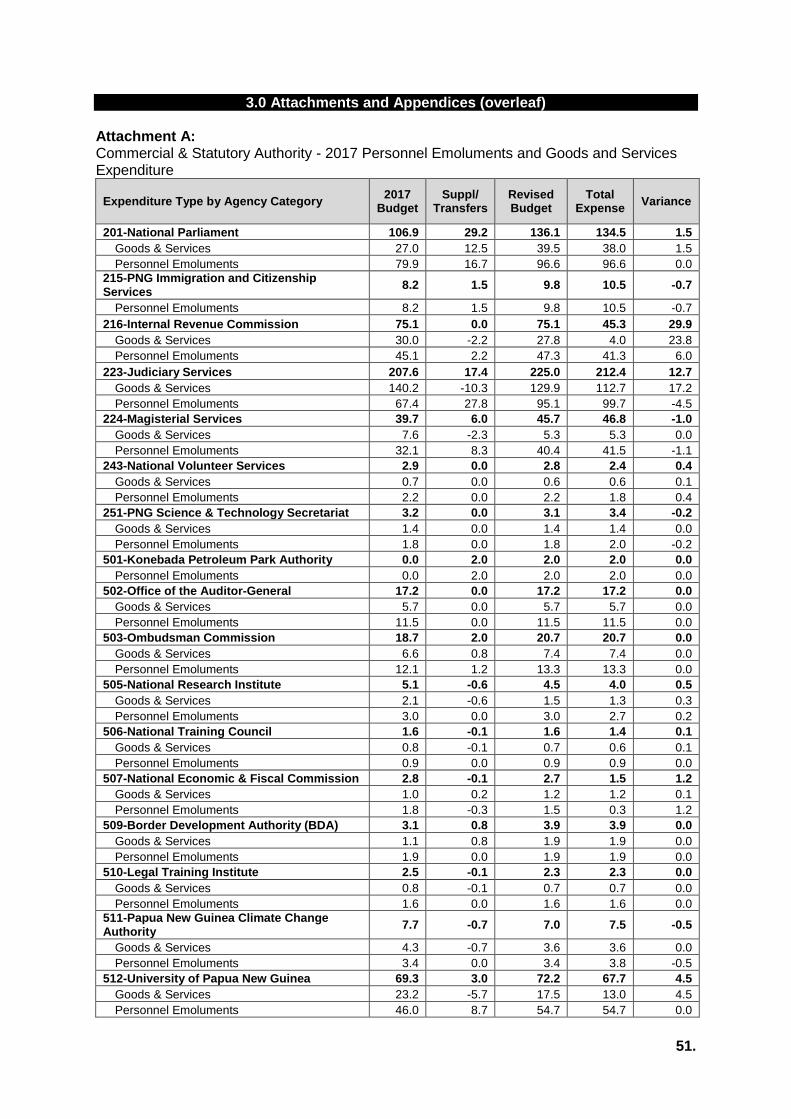
51.
3.0 Attachments and Appendices (overleaf) Attachment A: Commercial & Statutory Authority - 2017 Personnel Emoluments and Goods and Services Expenditure
Expenditure Type by Agency Category 2017
Budget Suppl/
Transfers Revised Budget
Total Expense
Variance
201-National Parliament 106.9 29.2 136.1 134.5 1.5
Goods & Services 27.0 12.5 39.5 38.0 1.5
Personnel Emoluments 79.9 16.7 96.6 96.6 0.0
215-PNG Immigration and Citizenship Services
8.2 1.5 9.8 10.5 -0.7
Personnel Emoluments 8.2 1.5 9.8 10.5 -0.7
216-Internal Revenue Commission 75.1 0.0 75.1 45.3 29.9
Goods & Services 30.0 -2.2 27.8 4.0 23.8
Personnel Emoluments 45.1 2.2 47.3 41.3 6.0
223-Judiciary Services 207.6 17.4 225.0 212.4 12.7
Goods & Services 140.2 -10.3 129.9 112.7 17.2
Personnel Emoluments 67.4 27.8 95.1 99.7 -4.5
224-Magisterial Services 39.7 6.0 45.7 46.8 -1.0
Goods & Services 7.6 -2.3 5.3 5.3 0.0
Personnel Emoluments 32.1 8.3 40.4 41.5 -1.1
243-National Volunteer Services 2.9 0.0 2.8 2.4 0.4
Goods & Services 0.7 0.0 0.6 0.6 0.1
Personnel Emoluments 2.2 0.0 2.2 1.8 0.4
251-PNG Science & Technology Secretariat 3.2 0.0 3.1 3.4 -0.2
Goods & Services 1.4 0.0 1.4 1.4 0.0
Personnel Emoluments 1.8 0.0 1.8 2.0 -0.2
501-Konebada Petroleum Park Authority 0.0 2.0 2.0 2.0 0.0
Personnel Emoluments 0.0 2.0 2.0 2.0 0.0
502-Office of the Auditor-General 17.2 0.0 17.2 17.2 0.0
Goods & Services 5.7 0.0 5.7 5.7 0.0
Personnel Emoluments 11.5 0.0 11.5 11.5 0.0
503-Ombudsman Commission 18.7 2.0 20.7 20.7 0.0
Goods & Services 6.6 0.8 7.4 7.4 0.0
Personnel Emoluments 12.1 1.2 13.3 13.3 0.0
505-National Research Institute 5.1 -0.6 4.5 4.0 0.5
Goods & Services 2.1 -0.6 1.5 1.3 0.3
Personnel Emoluments 3.0 0.0 3.0 2.7 0.2
506-National Training Council 1.6 -0.1 1.6 1.4 0.1
Goods & Services 0.8 -0.1 0.7 0.6 0.1
Personnel Emoluments 0.9 0.0 0.9 0.9 0.0
507-National Economic & Fiscal Commission 2.8 -0.1 2.7 1.5 1.2
Goods & Services 1.0 0.2 1.2 1.2 0.1
Personnel Emoluments 1.8 -0.3 1.5 0.3 1.2
509-Border Development Authority (BDA) 3.1 0.8 3.9 3.9 0.0
Goods & Services 1.1 0.8 1.9 1.9 0.0
Personnel Emoluments 1.9 0.0 1.9 1.9 0.0
510-Legal Training Institute 2.5 -0.1 2.3 2.3 0.0
Goods & Services 0.8 -0.1 0.7 0.7 0.0
Personnel Emoluments 1.6 0.0 1.6 1.6 0.0
511-Papua New Guinea Climate Change Authority
7.7 -0.7 7.0 7.5 -0.5
Goods & Services 4.3 -0.7 3.6 3.6 0.0
Personnel Emoluments 3.4 0.0 3.4 3.8 -0.5
512-University of Papua New Guinea 69.3 3.0 72.2 67.7 4.5
Goods & Services 23.2 -5.7 17.5 13.0 4.5
Personnel Emoluments 46.0 8.7 54.7 54.7 0.0
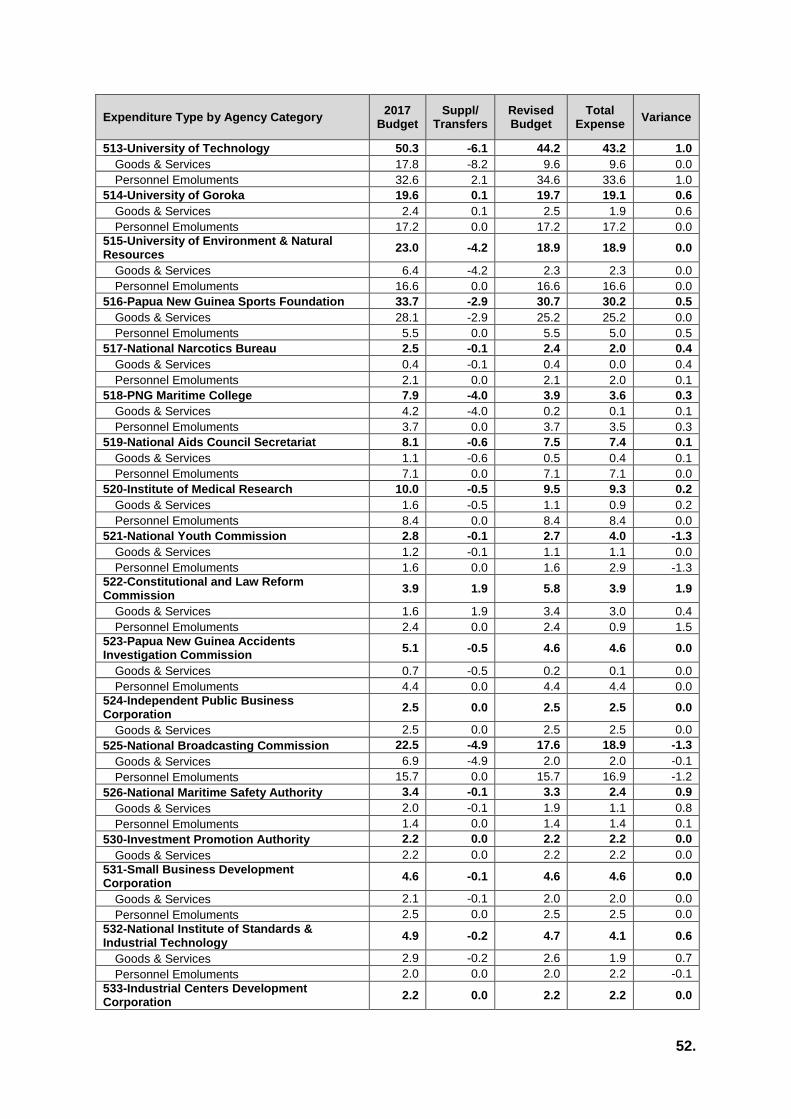
52.
Expenditure Type by Agency Category 2017
Budget Suppl/
Transfers Revised Budget
Total Expense
Variance
513-University of Technology 50.3 -6.1 44.2 43.2 1.0
Goods & Services 17.8 -8.2 9.6 9.6 0.0
Personnel Emoluments 32.6 2.1 34.6 33.6 1.0
514-University of Goroka 19.6 0.1 19.7 19.1 0.6
Goods & Services 2.4 0.1 2.5 1.9 0.6
Personnel Emoluments 17.2 0.0 17.2 17.2 0.0
515-University of Environment & Natural Resources
23.0 -4.2 18.9 18.9 0.0
Goods & Services 6.4 -4.2 2.3 2.3 0.0
Personnel Emoluments 16.6 0.0 16.6 16.6 0.0
516-Papua New Guinea Sports Foundation 33.7 -2.9 30.7 30.2 0.5
Goods & Services 28.1 -2.9 25.2 25.2 0.0
Personnel Emoluments 5.5 0.0 5.5 5.0 0.5
517-National Narcotics Bureau 2.5 -0.1 2.4 2.0 0.4
Goods & Services 0.4 -0.1 0.4 0.0 0.4
Personnel Emoluments 2.1 0.0 2.1 2.0 0.1
518-PNG Maritime College 7.9 -4.0 3.9 3.6 0.3
Goods & Services 4.2 -4.0 0.2 0.1 0.1
Personnel Emoluments 3.7 0.0 3.7 3.5 0.3
519-National Aids Council Secretariat 8.1 -0.6 7.5 7.4 0.1
Goods & Services 1.1 -0.6 0.5 0.4 0.1
Personnel Emoluments 7.1 0.0 7.1 7.1 0.0
520-Institute of Medical Research 10.0 -0.5 9.5 9.3 0.2
Goods & Services 1.6 -0.5 1.1 0.9 0.2
Personnel Emoluments 8.4 0.0 8.4 8.4 0.0
521-National Youth Commission 2.8 -0.1 2.7 4.0 -1.3
Goods & Services 1.2 -0.1 1.1 1.1 0.0
Personnel Emoluments 1.6 0.0 1.6 2.9 -1.3
522-Constitutional and Law Reform Commission
3.9 1.9 5.8 3.9 1.9
Goods & Services 1.6 1.9 3.4 3.0 0.4
Personnel Emoluments 2.4 0.0 2.4 0.9 1.5
523-Papua New Guinea Accidents Investigation Commission
5.1 -0.5 4.6 4.6 0.0
Goods & Services 0.7 -0.5 0.2 0.1 0.0
Personnel Emoluments 4.4 0.0 4.4 4.4 0.0
524-Independent Public Business Corporation
2.5 0.0 2.5 2.5 0.0
Goods & Services 2.5 0.0 2.5 2.5 0.0
525-National Broadcasting Commission 22.5 -4.9 17.6 18.9 -1.3
Goods & Services 6.9 -4.9 2.0 2.0 -0.1
Personnel Emoluments 15.7 0.0 15.7 16.9 -1.2
526-National Maritime Safety Authority 3.4 -0.1 3.3 2.4 0.9
Goods & Services 2.0 -0.1 1.9 1.1 0.8
Personnel Emoluments 1.4 0.0 1.4 1.4 0.1
530-Investment Promotion Authority 2.2 0.0 2.2 2.2 0.0
Goods & Services 2.2 0.0 2.2 2.2 0.0
531-Small Business Development Corporation
4.6 -0.1 4.6 4.6 0.0
Goods & Services 2.1 -0.1 2.0 2.0 0.0
Personnel Emoluments 2.5 0.0 2.5 2.5 0.0
532-National Institute of Standards & Industrial Technology
4.9 -0.2 4.7 4.1 0.6
Goods & Services 2.9 -0.2 2.6 1.9 0.7
Personnel Emoluments 2.0 0.0 2.0 2.2 -0.1
533-Industrial Centers Development Corporation
2.2 0.0 2.2 2.2 0.0
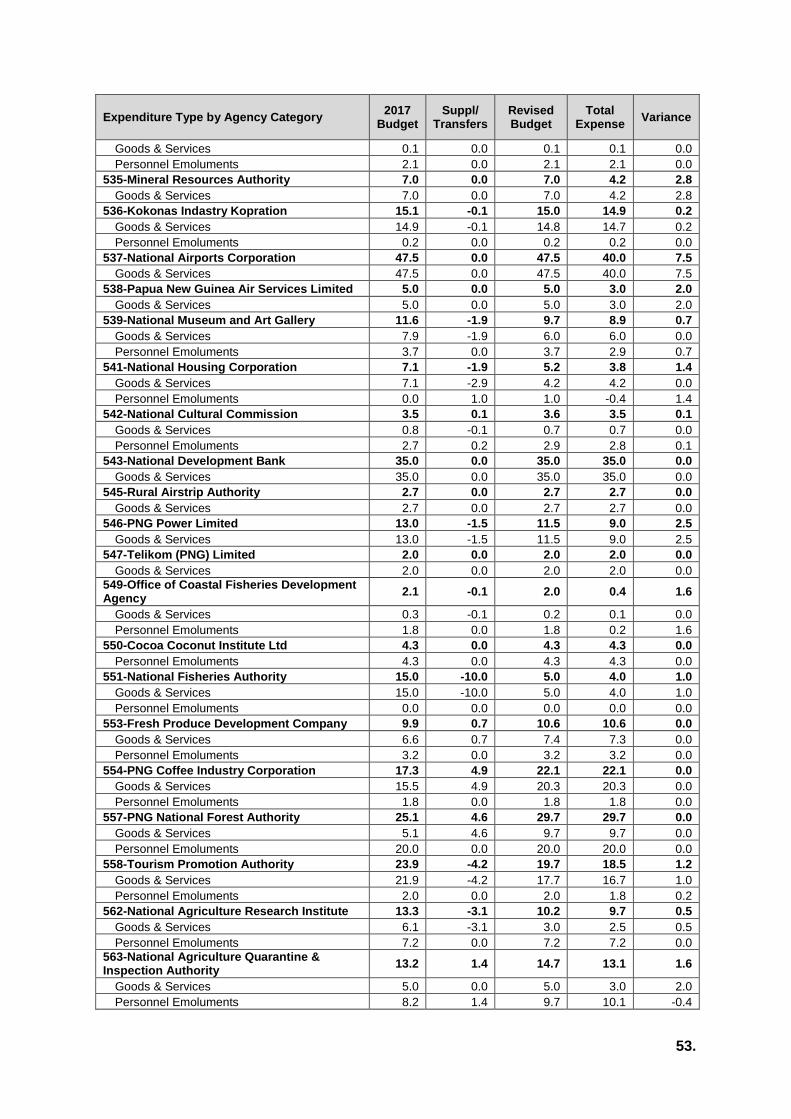
53.
Expenditure Type by Agency Category 2017
Budget Suppl/
Transfers Revised Budget
Total Expense
Variance
Goods & Services 0.1 0.0 0.1 0.1 0.0
Personnel Emoluments 2.1 0.0 2.1 2.1 0.0
535-Mineral Resources Authority 7.0 0.0 7.0 4.2 2.8
Goods & Services 7.0 0.0 7.0 4.2 2.8
536-Kokonas Indastry Kopration 15.1 -0.1 15.0 14.9 0.2
Goods & Services 14.9 -0.1 14.8 14.7 0.2
Personnel Emoluments 0.2 0.0 0.2 0.2 0.0
537-National Airports Corporation 47.5 0.0 47.5 40.0 7.5
Goods & Services 47.5 0.0 47.5 40.0 7.5
538-Papua New Guinea Air Services Limited 5.0 0.0 5.0 3.0 2.0
Goods & Services 5.0 0.0 5.0 3.0 2.0
539-National Museum and Art Gallery 11.6 -1.9 9.7 8.9 0.7
Goods & Services 7.9 -1.9 6.0 6.0 0.0
Personnel Emoluments 3.7 0.0 3.7 2.9 0.7
541-National Housing Corporation 7.1 -1.9 5.2 3.8 1.4
Goods & Services 7.1 -2.9 4.2 4.2 0.0
Personnel Emoluments 0.0 1.0 1.0 -0.4 1.4
542-National Cultural Commission 3.5 0.1 3.6 3.5 0.1
Goods & Services 0.8 -0.1 0.7 0.7 0.0
Personnel Emoluments 2.7 0.2 2.9 2.8 0.1
543-National Development Bank 35.0 0.0 35.0 35.0 0.0
Goods & Services 35.0 0.0 35.0 35.0 0.0
545-Rural Airstrip Authority 2.7 0.0 2.7 2.7 0.0
Goods & Services 2.7 0.0 2.7 2.7 0.0
546-PNG Power Limited 13.0 -1.5 11.5 9.0 2.5
Goods & Services 13.0 -1.5 11.5 9.0 2.5
547-Telikom (PNG) Limited 2.0 0.0 2.0 2.0 0.0
Goods & Services 2.0 0.0 2.0 2.0 0.0
549-Office of Coastal Fisheries Development Agency
2.1 -0.1 2.0 0.4 1.6
Goods & Services 0.3 -0.1 0.2 0.1 0.0
Personnel Emoluments 1.8 0.0 1.8 0.2 1.6
550-Cocoa Coconut Institute Ltd 4.3 0.0 4.3 4.3 0.0
Personnel Emoluments 4.3 0.0 4.3 4.3 0.0
551-National Fisheries Authority 15.0 -10.0 5.0 4.0 1.0
Goods & Services 15.0 -10.0 5.0 4.0 1.0
Personnel Emoluments 0.0 0.0 0.0 0.0 0.0
553-Fresh Produce Development Company 9.9 0.7 10.6 10.6 0.0
Goods & Services 6.6 0.7 7.4 7.3 0.0
Personnel Emoluments 3.2 0.0 3.2 3.2 0.0
554-PNG Coffee Industry Corporation 17.3 4.9 22.1 22.1 0.0
Goods & Services 15.5 4.9 20.3 20.3 0.0
Personnel Emoluments 1.8 0.0 1.8 1.8 0.0
557-PNG National Forest Authority 25.1 4.6 29.7 29.7 0.0
Goods & Services 5.1 4.6 9.7 9.7 0.0
Personnel Emoluments 20.0 0.0 20.0 20.0 0.0
558-Tourism Promotion Authority 23.9 -4.2 19.7 18.5 1.2
Goods & Services 21.9 -4.2 17.7 16.7 1.0
Personnel Emoluments 2.0 0.0 2.0 1.8 0.2
562-National Agriculture Research Institute 13.3 -3.1 10.2 9.7 0.5
Goods & Services 6.1 -3.1 3.0 2.5 0.5
Personnel Emoluments 7.2 0.0 7.2 7.2 0.0
563-National Agriculture Quarantine & Inspection Authority
13.2 1.4 14.7 13.1 1.6
Goods & Services 5.0 0.0 5.0 3.0 2.0
Personnel Emoluments 8.2 1.4 9.7 10.1 -0.4
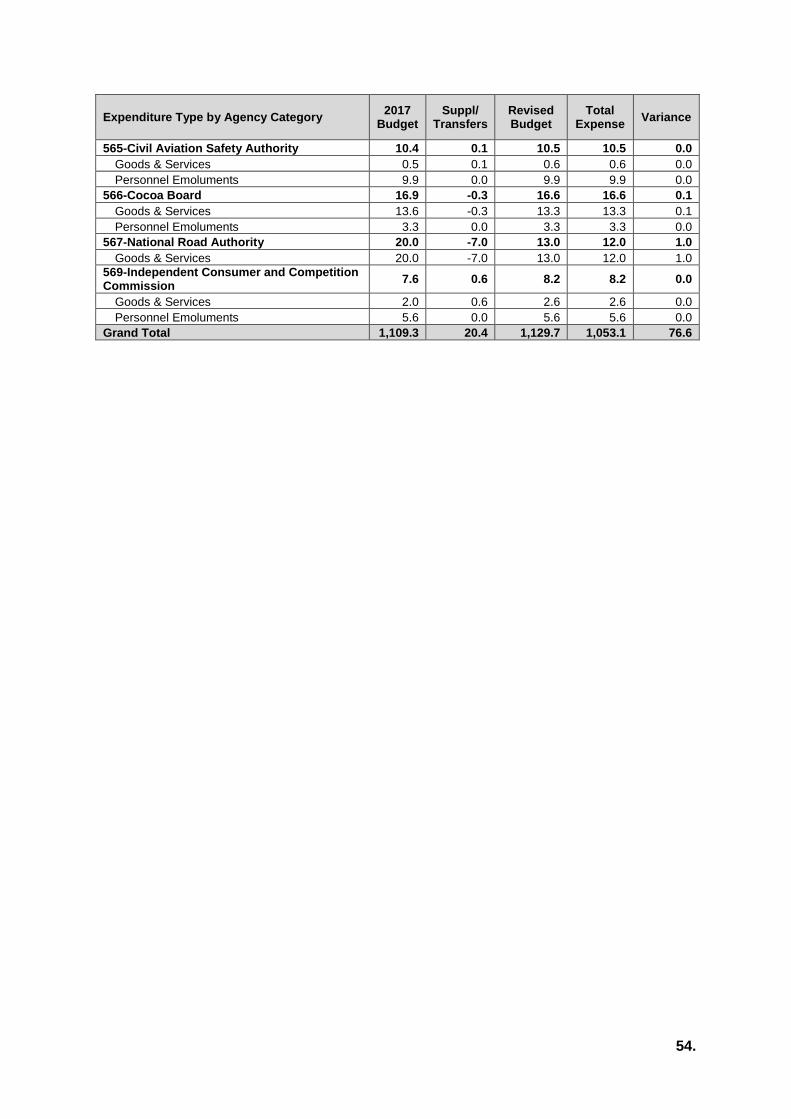
54.
Expenditure Type by Agency Category 2017
Budget Suppl/
Transfers Revised Budget
Total Expense
Variance
565-Civil Aviation Safety Authority 10.4 0.1 10.5 10.5 0.0
Goods & Services 0.5 0.1 0.6 0.6 0.0
Personnel Emoluments 9.9 0.0 9.9 9.9 0.0
566-Cocoa Board 16.9 -0.3 16.6 16.6 0.1
Goods & Services 13.6 -0.3 13.3 13.3 0.1
Personnel Emoluments 3.3 0.0 3.3 3.3 0.0
567-National Road Authority 20.0 -7.0 13.0 12.0 1.0
Goods & Services 20.0 -7.0 13.0 12.0 1.0
569-Independent Consumer and Competition Commission
7.6 0.6 8.2 8.2 0.0
Goods & Services 2.0 0.6 2.6 2.6 0.0
Personnel Emoluments 5.6 0.0 5.6 5.6 0.0
Grand Total 1,109.3 20.4 1,129.7 1,053.1 76.6
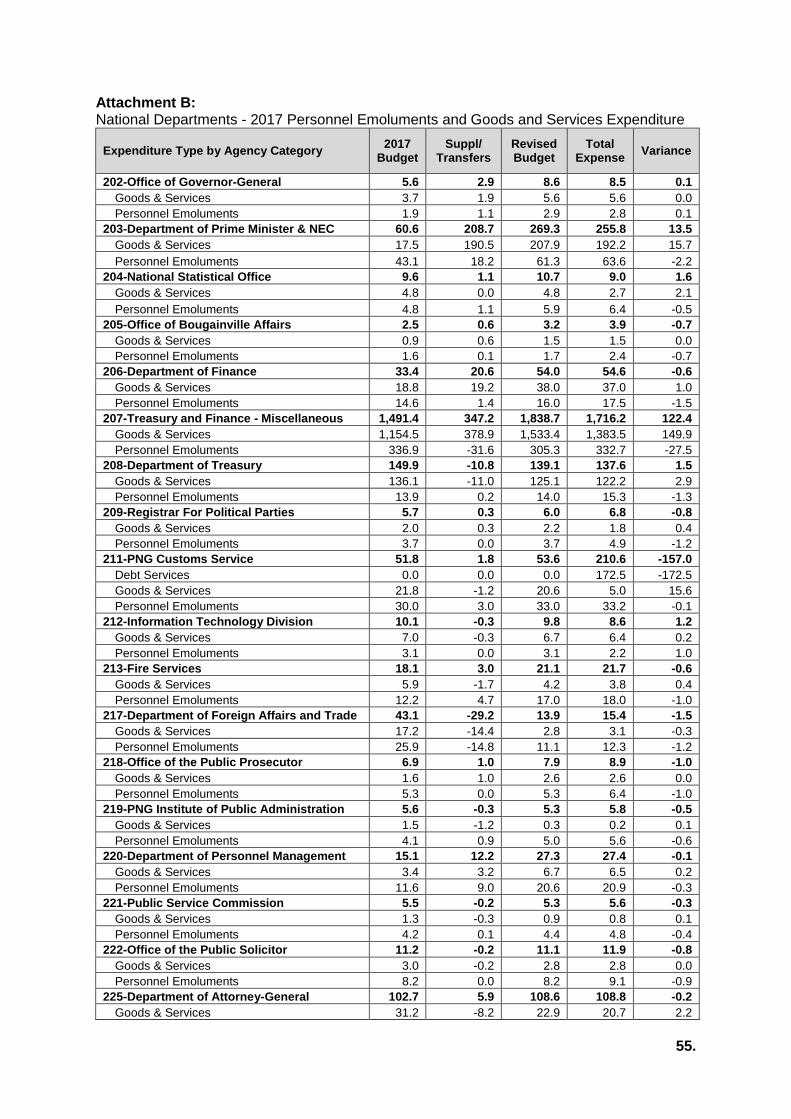
55.
Attachment B: National Departments - 2017 Personnel Emoluments and Goods and Services Expenditure
Expenditure Type by Agency Category 2017
Budget Suppl/
Transfers Revised Budget
Total Expense
Variance
202-Office of Governor-General 5.6 2.9 8.6 8.5 0.1
Goods & Services 3.7 1.9 5.6 5.6 0.0
Personnel Emoluments 1.9 1.1 2.9 2.8 0.1
203-Department of Prime Minister & NEC 60.6 208.7 269.3 255.8 13.5
Goods & Services 17.5 190.5 207.9 192.2 15.7
Personnel Emoluments 43.1 18.2 61.3 63.6 -2.2
204-National Statistical Office 9.6 1.1 10.7 9.0 1.6
Goods & Services 4.8 0.0 4.8 2.7 2.1
Personnel Emoluments 4.8 1.1 5.9 6.4 -0.5
205-Office of Bougainville Affairs 2.5 0.6 3.2 3.9 -0.7
Goods & Services 0.9 0.6 1.5 1.5 0.0
Personnel Emoluments 1.6 0.1 1.7 2.4 -0.7
206-Department of Finance 33.4 20.6 54.0 54.6 -0.6
Goods & Services 18.8 19.2 38.0 37.0 1.0
Personnel Emoluments 14.6 1.4 16.0 17.5 -1.5
207-Treasury and Finance - Miscellaneous 1,491.4 347.2 1,838.7 1,716.2 122.4
Goods & Services 1,154.5 378.9 1,533.4 1,383.5 149.9
Personnel Emoluments 336.9 -31.6 305.3 332.7 -27.5
208-Department of Treasury 149.9 -10.8 139.1 137.6 1.5
Goods & Services 136.1 -11.0 125.1 122.2 2.9
Personnel Emoluments 13.9 0.2 14.0 15.3 -1.3
209-Registrar For Political Parties 5.7 0.3 6.0 6.8 -0.8
Goods & Services 2.0 0.3 2.2 1.8 0.4
Personnel Emoluments 3.7 0.0 3.7 4.9 -1.2
211-PNG Customs Service 51.8 1.8 53.6 210.6 -157.0
Debt Services 0.0 0.0 0.0 172.5 -172.5
Goods & Services 21.8 -1.2 20.6 5.0 15.6
Personnel Emoluments 30.0 3.0 33.0 33.2 -0.1
212-Information Technology Division 10.1 -0.3 9.8 8.6 1.2
Goods & Services 7.0 -0.3 6.7 6.4 0.2
Personnel Emoluments 3.1 0.0 3.1 2.2 1.0
213-Fire Services 18.1 3.0 21.1 21.7 -0.6
Goods & Services 5.9 -1.7 4.2 3.8 0.4
Personnel Emoluments 12.2 4.7 17.0 18.0 -1.0
217-Department of Foreign Affairs and Trade 43.1 -29.2 13.9 15.4 -1.5
Goods & Services 17.2 -14.4 2.8 3.1 -0.3
Personnel Emoluments 25.9 -14.8 11.1 12.3 -1.2
218-Office of the Public Prosecutor 6.9 1.0 7.9 8.9 -1.0
Goods & Services 1.6 1.0 2.6 2.6 0.0
Personnel Emoluments 5.3 0.0 5.3 6.4 -1.0
219-PNG Institute of Public Administration 5.6 -0.3 5.3 5.8 -0.5
Goods & Services 1.5 -1.2 0.3 0.2 0.1
Personnel Emoluments 4.1 0.9 5.0 5.6 -0.6
220-Department of Personnel Management 15.1 12.2 27.3 27.4 -0.1
Goods & Services 3.4 3.2 6.7 6.5 0.2
Personnel Emoluments 11.6 9.0 20.6 20.9 -0.3
221-Public Service Commission 5.5 -0.2 5.3 5.6 -0.3
Goods & Services 1.3 -0.3 0.9 0.8 0.1
Personnel Emoluments 4.2 0.1 4.4 4.8 -0.4
222-Office of the Public Solicitor 11.2 -0.2 11.1 11.9 -0.8
Goods & Services 3.0 -0.2 2.8 2.8 0.0
Personnel Emoluments 8.2 0.0 8.2 9.1 -0.9
225-Department of Attorney-General 102.7 5.9 108.6 108.8 -0.2
Goods & Services 31.2 -8.2 22.9 20.7 2.2
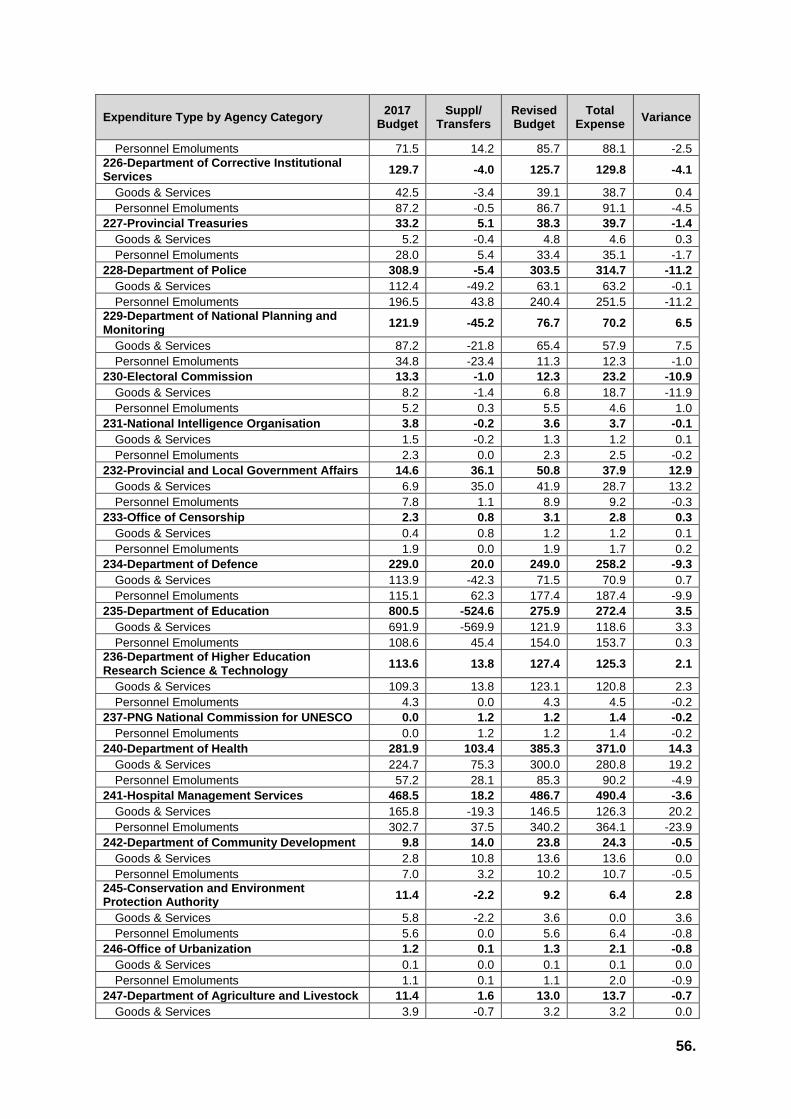
56.
Expenditure Type by Agency Category 2017
Budget Suppl/
Transfers Revised Budget
Total Expense
Variance
Personnel Emoluments 71.5 14.2 85.7 88.1 -2.5
226-Department of Corrective Institutional Services
129.7 -4.0 125.7 129.8 -4.1
Goods & Services 42.5 -3.4 39.1 38.7 0.4
Personnel Emoluments 87.2 -0.5 86.7 91.1 -4.5
227-Provincial Treasuries 33.2 5.1 38.3 39.7 -1.4
Goods & Services 5.2 -0.4 4.8 4.6 0.3
Personnel Emoluments 28.0 5.4 33.4 35.1 -1.7
228-Department of Police 308.9 -5.4 303.5 314.7 -11.2
Goods & Services 112.4 -49.2 63.1 63.2 -0.1
Personnel Emoluments 196.5 43.8 240.4 251.5 -11.2
229-Department of National Planning and Monitoring
121.9 -45.2 76.7 70.2 6.5
Goods & Services 87.2 -21.8 65.4 57.9 7.5
Personnel Emoluments 34.8 -23.4 11.3 12.3 -1.0
230-Electoral Commission 13.3 -1.0 12.3 23.2 -10.9
Goods & Services 8.2 -1.4 6.8 18.7 -11.9
Personnel Emoluments 5.2 0.3 5.5 4.6 1.0
231-National Intelligence Organisation 3.8 -0.2 3.6 3.7 -0.1
Goods & Services 1.5 -0.2 1.3 1.2 0.1
Personnel Emoluments 2.3 0.0 2.3 2.5 -0.2
232-Provincial and Local Government Affairs 14.6 36.1 50.8 37.9 12.9
Goods & Services 6.9 35.0 41.9 28.7 13.2
Personnel Emoluments 7.8 1.1 8.9 9.2 -0.3
233-Office of Censorship 2.3 0.8 3.1 2.8 0.3
Goods & Services 0.4 0.8 1.2 1.2 0.1
Personnel Emoluments 1.9 0.0 1.9 1.7 0.2
234-Department of Defence 229.0 20.0 249.0 258.2 -9.3
Goods & Services 113.9 -42.3 71.5 70.9 0.7
Personnel Emoluments 115.1 62.3 177.4 187.4 -9.9
235-Department of Education 800.5 -524.6 275.9 272.4 3.5
Goods & Services 691.9 -569.9 121.9 118.6 3.3
Personnel Emoluments 108.6 45.4 154.0 153.7 0.3
236-Department of Higher Education Research Science & Technology
113.6 13.8 127.4 125.3 2.1
Goods & Services 109.3 13.8 123.1 120.8 2.3
Personnel Emoluments 4.3 0.0 4.3 4.5 -0.2
237-PNG National Commission for UNESCO 0.0 1.2 1.2 1.4 -0.2
Personnel Emoluments 0.0 1.2 1.2 1.4 -0.2
240-Department of Health 281.9 103.4 385.3 371.0 14.3
Goods & Services 224.7 75.3 300.0 280.8 19.2
Personnel Emoluments 57.2 28.1 85.3 90.2 -4.9
241-Hospital Management Services 468.5 18.2 486.7 490.4 -3.6
Goods & Services 165.8 -19.3 146.5 126.3 20.2
Personnel Emoluments 302.7 37.5 340.2 364.1 -23.9
242-Department of Community Development 9.8 14.0 23.8 24.3 -0.5
Goods & Services 2.8 10.8 13.6 13.6 0.0
Personnel Emoluments 7.0 3.2 10.2 10.7 -0.5
245-Conservation and Environment Protection Authority
11.4 -2.2 9.2 6.4 2.8
Goods & Services 5.8 -2.2 3.6 0.0 3.6
Personnel Emoluments 5.6 0.0 5.6 6.4 -0.8
246-Office of Urbanization 1.2 0.1 1.3 2.1 -0.8
Goods & Services 0.1 0.0 0.1 0.1 0.0
Personnel Emoluments 1.1 0.1 1.1 2.0 -0.9
247-Department of Agriculture and Livestock 11.4 1.6 13.0 13.7 -0.7
Goods & Services 3.9 -0.7 3.2 3.2 0.0

57.
Expenditure Type by Agency Category 2017
Budget Suppl/
Transfers Revised Budget
Total Expense
Variance
Personnel Emoluments 7.5 2.3 9.7 10.5 -0.8
252-Department of Lands and Physical Planning
29.6 7.2 36.8 33.2 3.6
Goods & Services 17.6 0.2 17.9 17.0 0.8
Personnel Emoluments 12.0 7.0 19.0 16.2 2.8
254-Department of Mineral Policy and Geo-hazards Management
12.0 1.0 13.0 13.4 -0.3
Goods & Services 8.1 0.2 8.3 8.2 0.1
Personnel Emoluments 3.9 0.8 4.7 5.1 -0.4
255-Departmentof Petroleum and Energy 21.6 -1.3 20.3 23.3 -2.9
Goods & Services 14.6 -1.5 13.0 15.0 -2.0
Personnel Emoluments 7.0 0.3 7.3 8.3 -0.9
257-Department of Public Enterprises 5.2 -0.5 4.8 4.5 0.3
Goods & Services 3.4 -0.5 2.9 2.4 0.5
Personnel Emoluments 1.9 0.0 1.9 2.1 -0.2
258-Department of Information and Communication
4.3 -0.1 4.2 4.6 -0.5
Goods & Services 3.0 -0.1 2.9 2.8 0.1
Personnel Emoluments 1.3 0.0 1.3 1.8 -0.5
259-Department of Transport 15.8 1.7 17.5 19.1 -1.6
Goods & Services 6.5 0.8 7.3 7.2 0.1
Personnel Emoluments 9.3 0.9 10.2 11.9 -1.7
261-Department of Commerce and Industry 20.0 -0.8 19.2 14.1 5.1
Goods & Services 13.6 -0.8 12.8 6.9 5.8
Personnel Emoluments 6.4 0.0 6.4 7.2 -0.7
262-Department of Industrial Relations 21.2 -1.0 20.2 21.3 -1.1
Goods & Services 9.9 -2.7 7.1 7.2 -0.1
Personnel Emoluments 11.3 1.8 13.1 14.1 -1.0
263-National Tripartite Consultative Council 0.6 0.0 0.5 0.6 0.0
Goods & Services 0.2 0.0 0.2 0.1 0.0
Personnel Emoluments 0.4 0.0 0.4 0.4 -0.1
264-Department of Works and Implementation
490.7 20.0 510.7 467.7 43.0
Goods & Services 441.4 2.7 444.1 397.8 46.3
Personnel Emoluments 49.3 17.3 66.6 69.9 -3.3
267-Department of Implementation and Rural Development
59.9 2.2 62.2 34.1 28.1
Goods & Services 54.5 2.2 56.8 28.6 28.2
Personnel Emoluments 5.4 0.0 5.4 5.5 -0.1
268-Central Supply & Tenders Board 2.2 -0.1 2.1 2.0 0.1
Goods & Services 0.8 -0.1 0.7 0.4 0.3
Personnel Emoluments 1.4 0.0 1.4 1.6 -0.2
269-Office of Tourism Arts and Culture 0.0 0.0 0.0 0.6 -0.6
Personnel Emoluments 0.0 0.0 0.0 0.6 -0.6
Grand Total 5,267.0 224.5 5,491.5 5,442.9 48.6
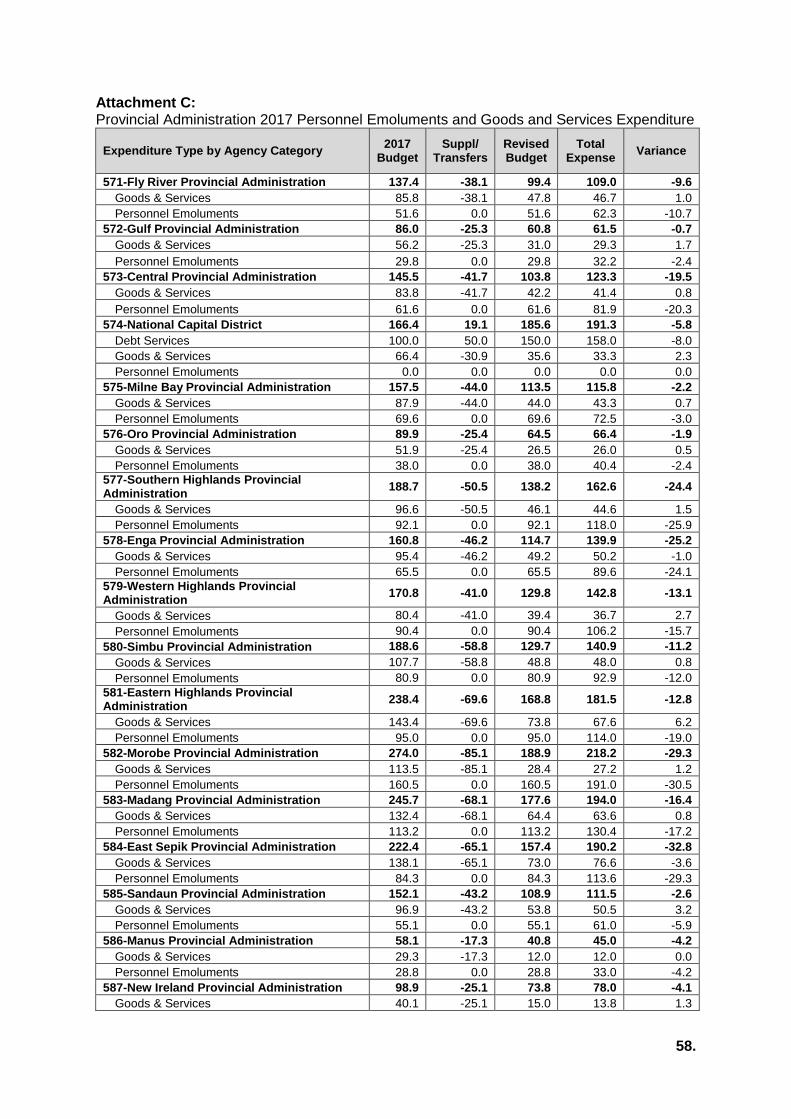
58.
Attachment C: Provincial Administration 2017 Personnel Emoluments and Goods and Services Expenditure
Expenditure Type by Agency Category 2017
Budget Suppl/
Transfers Revised Budget
Total Expense
Variance
571-Fly River Provincial Administration 137.4 -38.1 99.4 109.0 -9.6
Goods & Services 85.8 -38.1 47.8 46.7 1.0
Personnel Emoluments 51.6 0.0 51.6 62.3 -10.7
572-Gulf Provincial Administration 86.0 -25.3 60.8 61.5 -0.7
Goods & Services 56.2 -25.3 31.0 29.3 1.7
Personnel Emoluments 29.8 0.0 29.8 32.2 -2.4
573-Central Provincial Administration 145.5 -41.7 103.8 123.3 -19.5
Goods & Services 83.8 -41.7 42.2 41.4 0.8
Personnel Emoluments 61.6 0.0 61.6 81.9 -20.3
574-National Capital District 166.4 19.1 185.6 191.3 -5.8
Debt Services 100.0 50.0 150.0 158.0 -8.0
Goods & Services 66.4 -30.9 35.6 33.3 2.3
Personnel Emoluments 0.0 0.0 0.0 0.0 0.0
575-Milne Bay Provincial Administration 157.5 -44.0 113.5 115.8 -2.2
Goods & Services 87.9 -44.0 44.0 43.3 0.7
Personnel Emoluments 69.6 0.0 69.6 72.5 -3.0
576-Oro Provincial Administration 89.9 -25.4 64.5 66.4 -1.9
Goods & Services 51.9 -25.4 26.5 26.0 0.5
Personnel Emoluments 38.0 0.0 38.0 40.4 -2.4
577-Southern Highlands Provincial Administration
188.7 -50.5 138.2 162.6 -24.4
Goods & Services 96.6 -50.5 46.1 44.6 1.5
Personnel Emoluments 92.1 0.0 92.1 118.0 -25.9
578-Enga Provincial Administration 160.8 -46.2 114.7 139.9 -25.2
Goods & Services 95.4 -46.2 49.2 50.2 -1.0
Personnel Emoluments 65.5 0.0 65.5 89.6 -24.1
579-Western Highlands Provincial Administration
170.8 -41.0 129.8 142.8 -13.1
Goods & Services 80.4 -41.0 39.4 36.7 2.7
Personnel Emoluments 90.4 0.0 90.4 106.2 -15.7
580-Simbu Provincial Administration 188.6 -58.8 129.7 140.9 -11.2
Goods & Services 107.7 -58.8 48.8 48.0 0.8
Personnel Emoluments 80.9 0.0 80.9 92.9 -12.0
581-Eastern Highlands Provincial Administration
238.4 -69.6 168.8 181.5 -12.8
Goods & Services 143.4 -69.6 73.8 67.6 6.2
Personnel Emoluments 95.0 0.0 95.0 114.0 -19.0
582-Morobe Provincial Administration 274.0 -85.1 188.9 218.2 -29.3
Goods & Services 113.5 -85.1 28.4 27.2 1.2
Personnel Emoluments 160.5 0.0 160.5 191.0 -30.5
583-Madang Provincial Administration 245.7 -68.1 177.6 194.0 -16.4
Goods & Services 132.4 -68.1 64.4 63.6 0.8
Personnel Emoluments 113.2 0.0 113.2 130.4 -17.2
584-East Sepik Provincial Administration 222.4 -65.1 157.4 190.2 -32.8
Goods & Services 138.1 -65.1 73.0 76.6 -3.6
Personnel Emoluments 84.3 0.0 84.3 113.6 -29.3
585-Sandaun Provincial Administration 152.1 -43.2 108.9 111.5 -2.6
Goods & Services 96.9 -43.2 53.8 50.5 3.2
Personnel Emoluments 55.1 0.0 55.1 61.0 -5.9
586-Manus Provincial Administration 58.1 -17.3 40.8 45.0 -4.2
Goods & Services 29.3 -17.3 12.0 12.0 0.0
Personnel Emoluments 28.8 0.0 28.8 33.0 -4.2
587-New Ireland Provincial Administration 98.9 -25.1 73.8 78.0 -4.1
Goods & Services 40.1 -25.1 15.0 13.8 1.3
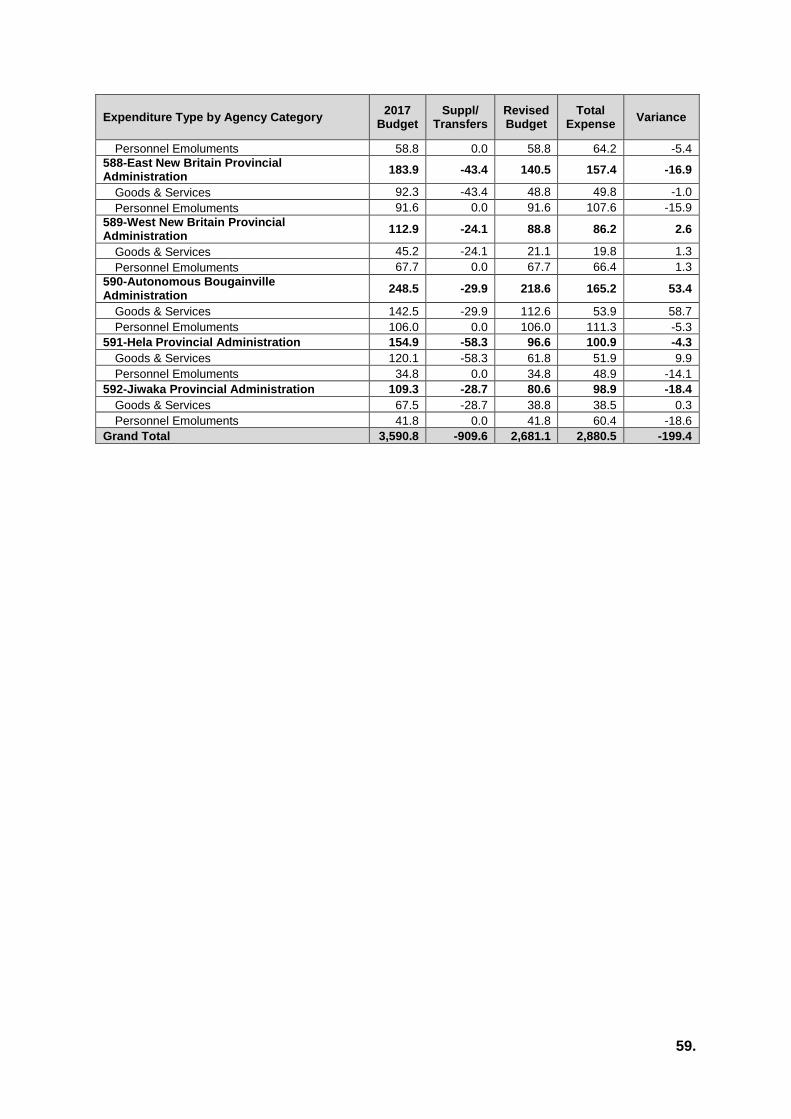
59.
Expenditure Type by Agency Category 2017
Budget Suppl/
Transfers Revised Budget
Total Expense
Variance
Personnel Emoluments 58.8 0.0 58.8 64.2 -5.4
588-East New Britain Provincial Administration
183.9 -43.4 140.5 157.4 -16.9
Goods & Services 92.3 -43.4 48.8 49.8 -1.0
Personnel Emoluments 91.6 0.0 91.6 107.6 -15.9
589-West New Britain Provincial Administration
112.9 -24.1 88.8 86.2 2.6
Goods & Services 45.2 -24.1 21.1 19.8 1.3
Personnel Emoluments 67.7 0.0 67.7 66.4 1.3
590-Autonomous Bougainville Administration
248.5 -29.9 218.6 165.2 53.4
Goods & Services 142.5 -29.9 112.6 53.9 58.7
Personnel Emoluments 106.0 0.0 106.0 111.3 -5.3
591-Hela Provincial Administration 154.9 -58.3 96.6 100.9 -4.3
Goods & Services 120.1 -58.3 61.8 51.9 9.9
Personnel Emoluments 34.8 0.0 34.8 48.9 -14.1
592-Jiwaka Provincial Administration 109.3 -28.7 80.6 98.9 -18.4
Goods & Services 67.5 -28.7 38.8 38.5 0.3
Personnel Emoluments 41.8 0.0 41.8 60.4 -18.6
Grand Total 3,590.8 -909.6 2,681.1 2,880.5 -199.4
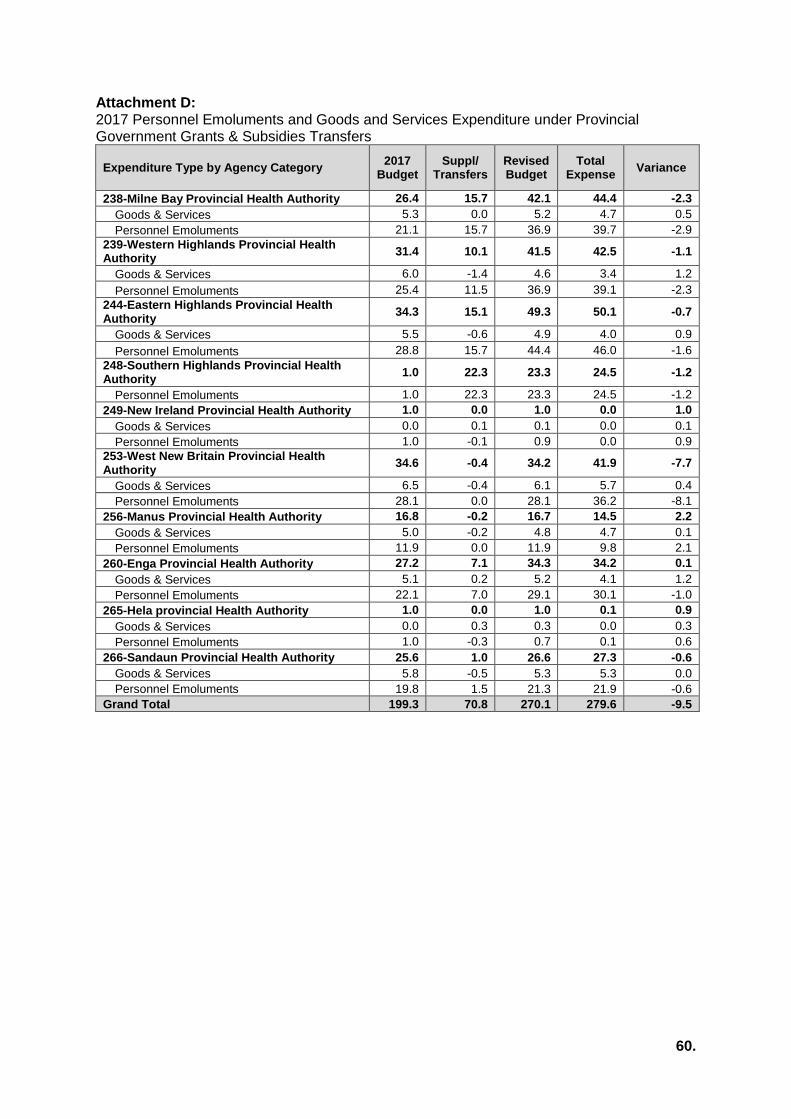
60.
Attachment D: 2017 Personnel Emoluments and Goods and Services Expenditure under Provincial Government Grants & Subsidies Transfers
Expenditure Type by Agency Category 2017
Budget Suppl/
Transfers Revised Budget
Total Expense
Variance
238-Milne Bay Provincial Health Authority 26.4 15.7 42.1 44.4 -2.3
Goods & Services 5.3 0.0 5.2 4.7 0.5
Personnel Emoluments 21.1 15.7 36.9 39.7 -2.9
239-Western Highlands Provincial Health Authority
31.4 10.1 41.5 42.5 -1.1
Goods & Services 6.0 -1.4 4.6 3.4 1.2
Personnel Emoluments 25.4 11.5 36.9 39.1 -2.3
244-Eastern Highlands Provincial Health Authority
34.3 15.1 49.3 50.1 -0.7
Goods & Services 5.5 -0.6 4.9 4.0 0.9
Personnel Emoluments 28.8 15.7 44.4 46.0 -1.6
248-Southern Highlands Provincial Health Authority
1.0 22.3 23.3 24.5 -1.2
Personnel Emoluments 1.0 22.3 23.3 24.5 -1.2
249-New Ireland Provincial Health Authority 1.0 0.0 1.0 0.0 1.0
Goods & Services 0.0 0.1 0.1 0.0 0.1
Personnel Emoluments 1.0 -0.1 0.9 0.0 0.9
253-West New Britain Provincial Health Authority
34.6 -0.4 34.2 41.9 -7.7
Goods & Services 6.5 -0.4 6.1 5.7 0.4
Personnel Emoluments 28.1 0.0 28.1 36.2 -8.1
256-Manus Provincial Health Authority 16.8 -0.2 16.7 14.5 2.2
Goods & Services 5.0 -0.2 4.8 4.7 0.1
Personnel Emoluments 11.9 0.0 11.9 9.8 2.1
260-Enga Provincial Health Authority 27.2 7.1 34.3 34.2 0.1
Goods & Services 5.1 0.2 5.2 4.1 1.2
Personnel Emoluments 22.1 7.0 29.1 30.1 -1.0
265-Hela provincial Health Authority 1.0 0.0 1.0 0.1 0.9
Goods & Services 0.0 0.3 0.3 0.0 0.3
Personnel Emoluments 1.0 -0.3 0.7 0.1 0.6
266-Sandaun Provincial Health Authority 25.6 1.0 26.6 27.3 -0.6
Goods & Services 5.8 -0.5 5.3 5.3 0.0
Personnel Emoluments 19.8 1.5 21.3 21.9 -0.6
Grand Total 199.3 70.8 270.1 279.6 -9.5
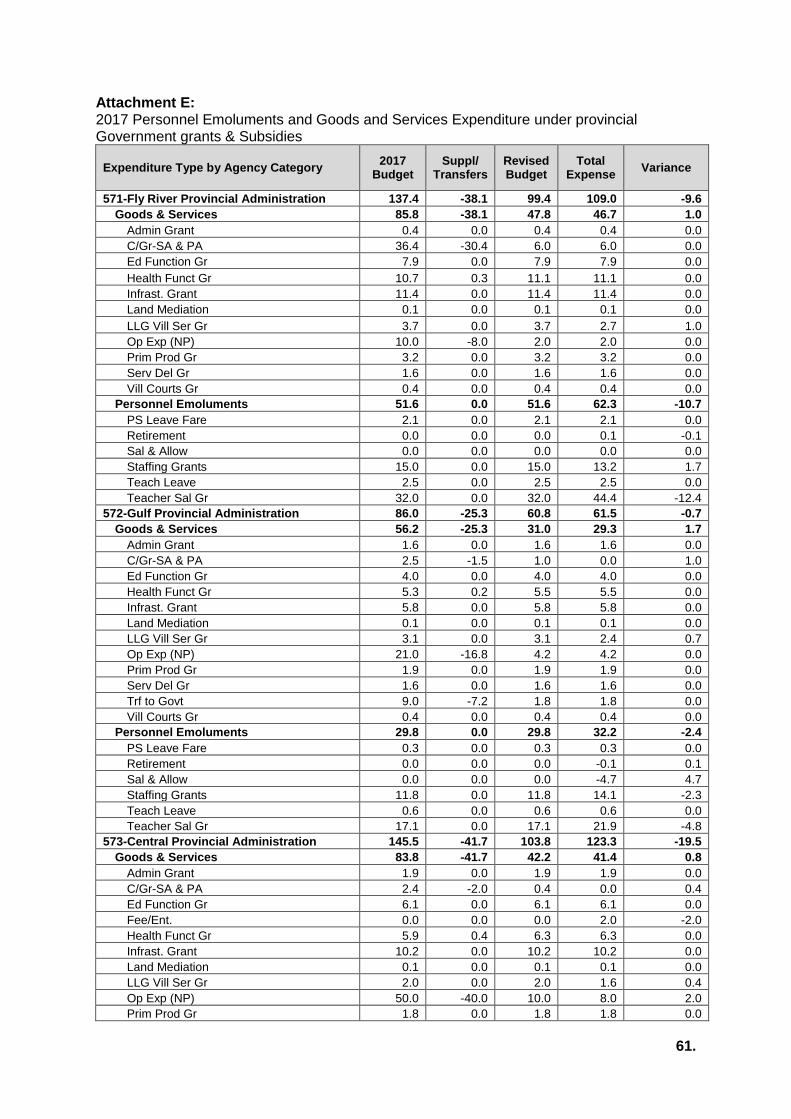
61.
Attachment E: 2017 Personnel Emoluments and Goods and Services Expenditure under provincial Government grants & Subsidies
Expenditure Type by Agency Category 2017
Budget Suppl/
Transfers Revised Budget
Total Expense
Variance
571-Fly River Provincial Administration 137.4 -38.1 99.4 109.0 -9.6
Goods & Services 85.8 -38.1 47.8 46.7 1.0
Admin Grant 0.4 0.0 0.4 0.4 0.0
C/Gr-SA & PA 36.4 -30.4 6.0 6.0 0.0
Ed Function Gr 7.9 0.0 7.9 7.9 0.0
Health Funct Gr 10.7 0.3 11.1 11.1 0.0
Infrast. Grant 11.4 0.0 11.4 11.4 0.0
Land Mediation 0.1 0.0 0.1 0.1 0.0
LLG Vill Ser Gr 3.7 0.0 3.7 2.7 1.0
Op Exp (NP) 10.0 -8.0 2.0 2.0 0.0
Prim Prod Gr 3.2 0.0 3.2 3.2 0.0
Serv Del Gr 1.6 0.0 1.6 1.6 0.0
Vill Courts Gr 0.4 0.0 0.4 0.4 0.0
Personnel Emoluments 51.6 0.0 51.6 62.3 -10.7
PS Leave Fare 2.1 0.0 2.1 2.1 0.0
Retirement 0.0 0.0 0.0 0.1 -0.1
Sal & Allow 0.0 0.0 0.0 0.0 0.0
Staffing Grants 15.0 0.0 15.0 13.2 1.7
Teach Leave 2.5 0.0 2.5 2.5 0.0
Teacher Sal Gr 32.0 0.0 32.0 44.4 -12.4
572-Gulf Provincial Administration 86.0 -25.3 60.8 61.5 -0.7
Goods & Services 56.2 -25.3 31.0 29.3 1.7
Admin Grant 1.6 0.0 1.6 1.6 0.0
C/Gr-SA & PA 2.5 -1.5 1.0 0.0 1.0
Ed Function Gr 4.0 0.0 4.0 4.0 0.0
Health Funct Gr 5.3 0.2 5.5 5.5 0.0
Infrast. Grant 5.8 0.0 5.8 5.8 0.0
Land Mediation 0.1 0.0 0.1 0.1 0.0
LLG Vill Ser Gr 3.1 0.0 3.1 2.4 0.7
Op Exp (NP) 21.0 -16.8 4.2 4.2 0.0
Prim Prod Gr 1.9 0.0 1.9 1.9 0.0
Serv Del Gr 1.6 0.0 1.6 1.6 0.0
Trf to Govt 9.0 -7.2 1.8 1.8 0.0
Vill Courts Gr 0.4 0.0 0.4 0.4 0.0
Personnel Emoluments 29.8 0.0 29.8 32.2 -2.4
PS Leave Fare 0.3 0.0 0.3 0.3 0.0
Retirement 0.0 0.0 0.0 -0.1 0.1
Sal & Allow 0.0 0.0 0.0 -4.7 4.7
Staffing Grants 11.8 0.0 11.8 14.1 -2.3
Teach Leave 0.6 0.0 0.6 0.6 0.0
Teacher Sal Gr 17.1 0.0 17.1 21.9 -4.8
573-Central Provincial Administration 145.5 -41.7 103.8 123.3 -19.5
Goods & Services 83.8 -41.7 42.2 41.4 0.8
Admin Grant 1.9 0.0 1.9 1.9 0.0
C/Gr-SA & PA 2.4 -2.0 0.4 0.0 0.4
Ed Function Gr 6.1 0.0 6.1 6.1 0.0
Fee/Ent. 0.0 0.0 0.0 2.0 -2.0
Health Funct Gr 5.9 0.4 6.3 6.3 0.0
Infrast. Grant 10.2 0.0 10.2 10.2 0.0
Land Mediation 0.1 0.0 0.1 0.1 0.0
LLG Vill Ser Gr 2.0 0.0 2.0 1.6 0.4
Op Exp (NP) 50.0 -40.0 10.0 8.0 2.0
Prim Prod Gr 1.8 0.0 1.8 1.8 0.0
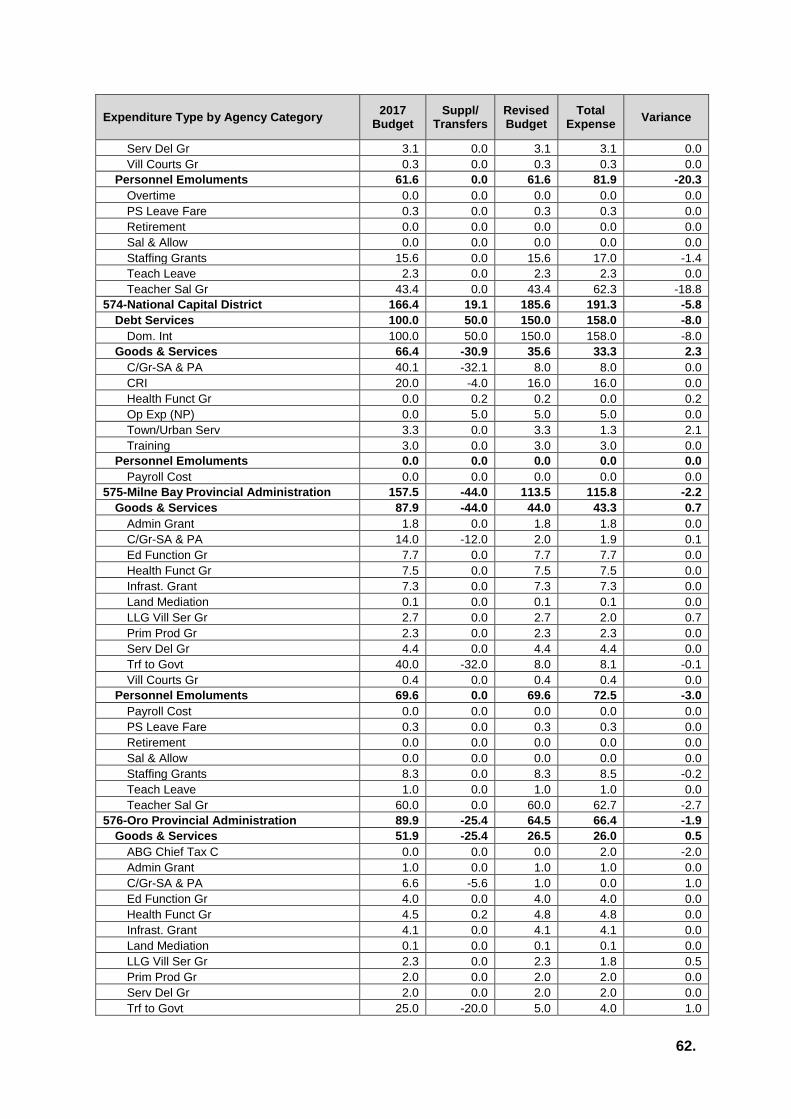
62.
Expenditure Type by Agency Category 2017
Budget Suppl/
Transfers Revised Budget
Total Expense
Variance
Serv Del Gr 3.1 0.0 3.1 3.1 0.0
Vill Courts Gr 0.3 0.0 0.3 0.3 0.0
Personnel Emoluments 61.6 0.0 61.6 81.9 -20.3
Overtime 0.0 0.0 0.0 0.0 0.0
PS Leave Fare 0.3 0.0 0.3 0.3 0.0
Retirement 0.0 0.0 0.0 0.0 0.0
Sal & Allow 0.0 0.0 0.0 0.0 0.0
Staffing Grants 15.6 0.0 15.6 17.0 -1.4
Teach Leave 2.3 0.0 2.3 2.3 0.0
Teacher Sal Gr 43.4 0.0 43.4 62.3 -18.8
574-National Capital District 166.4 19.1 185.6 191.3 -5.8
Debt Services 100.0 50.0 150.0 158.0 -8.0
Dom. Int 100.0 50.0 150.0 158.0 -8.0
Goods & Services 66.4 -30.9 35.6 33.3 2.3
C/Gr-SA & PA 40.1 -32.1 8.0 8.0 0.0
CRI 20.0 -4.0 16.0 16.0 0.0
Health Funct Gr 0.0 0.2 0.2 0.0 0.2
Op Exp (NP) 0.0 5.0 5.0 5.0 0.0
Town/Urban Serv 3.3 0.0 3.3 1.3 2.1
Training 3.0 0.0 3.0 3.0 0.0
Personnel Emoluments 0.0 0.0 0.0 0.0 0.0
Payroll Cost 0.0 0.0 0.0 0.0 0.0
575-Milne Bay Provincial Administration 157.5 -44.0 113.5 115.8 -2.2
Goods & Services 87.9 -44.0 44.0 43.3 0.7
Admin Grant 1.8 0.0 1.8 1.8 0.0
C/Gr-SA & PA 14.0 -12.0 2.0 1.9 0.1
Ed Function Gr 7.7 0.0 7.7 7.7 0.0
Health Funct Gr 7.5 0.0 7.5 7.5 0.0
Infrast. Grant 7.3 0.0 7.3 7.3 0.0
Land Mediation 0.1 0.0 0.1 0.1 0.0
LLG Vill Ser Gr 2.7 0.0 2.7 2.0 0.7
Prim Prod Gr 2.3 0.0 2.3 2.3 0.0
Serv Del Gr 4.4 0.0 4.4 4.4 0.0
Trf to Govt 40.0 -32.0 8.0 8.1 -0.1
Vill Courts Gr 0.4 0.0 0.4 0.4 0.0
Personnel Emoluments 69.6 0.0 69.6 72.5 -3.0
Payroll Cost 0.0 0.0 0.0 0.0 0.0
PS Leave Fare 0.3 0.0 0.3 0.3 0.0
Retirement 0.0 0.0 0.0 0.0 0.0
Sal & Allow 0.0 0.0 0.0 0.0 0.0
Staffing Grants 8.3 0.0 8.3 8.5 -0.2
Teach Leave 1.0 0.0 1.0 1.0 0.0
Teacher Sal Gr 60.0 0.0 60.0 62.7 -2.7
576-Oro Provincial Administration 89.9 -25.4 64.5 66.4 -1.9
Goods & Services 51.9 -25.4 26.5 26.0 0.5
ABG Chief Tax C 0.0 0.0 0.0 2.0 -2.0
Admin Grant 1.0 0.0 1.0 1.0 0.0
C/Gr-SA & PA 6.6 -5.6 1.0 0.0 1.0
Ed Function Gr 4.0 0.0 4.0 4.0 0.0
Health Funct Gr 4.5 0.2 4.8 4.8 0.0
Infrast. Grant 4.1 0.0 4.1 4.1 0.0
Land Mediation 0.1 0.0 0.1 0.1 0.0
LLG Vill Ser Gr 2.3 0.0 2.3 1.8 0.5
Prim Prod Gr 2.0 0.0 2.0 2.0 0.0
Serv Del Gr 2.0 0.0 2.0 2.0 0.0
Trf to Govt 25.0 -20.0 5.0 4.0 1.0
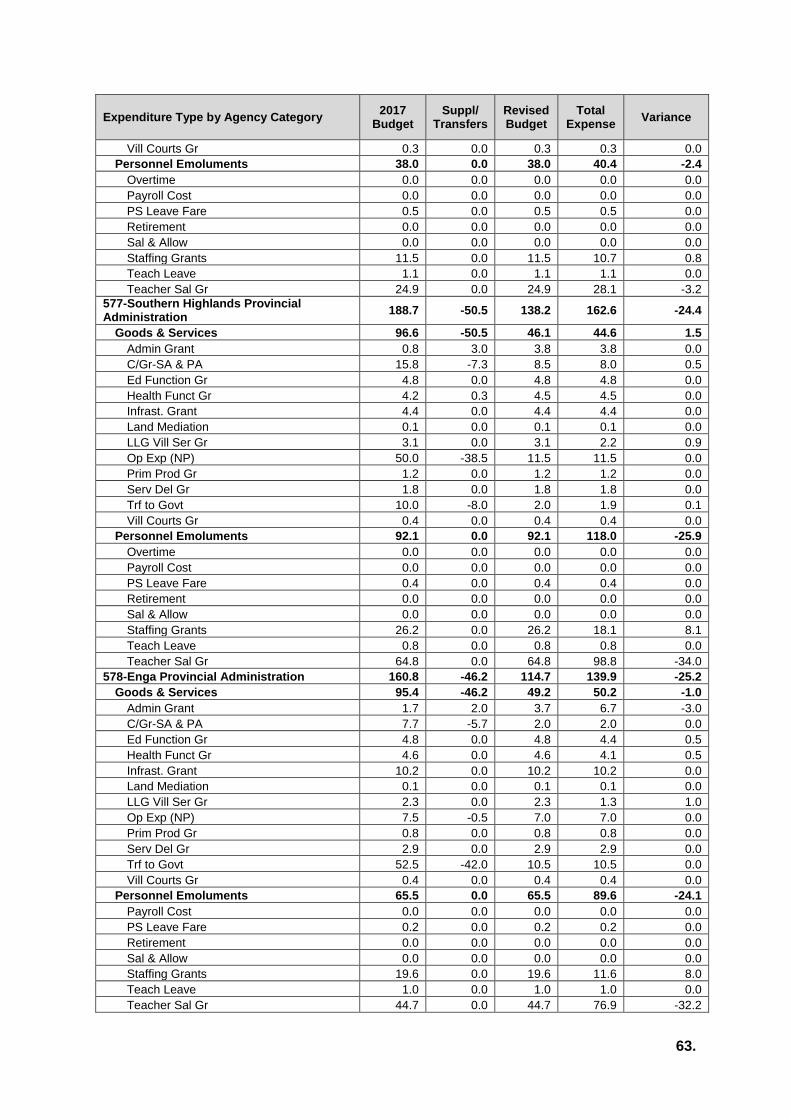
63.
Expenditure Type by Agency Category 2017
Budget Suppl/
Transfers Revised Budget
Total Expense
Variance
Vill Courts Gr 0.3 0.0 0.3 0.3 0.0
Personnel Emoluments 38.0 0.0 38.0 40.4 -2.4
Overtime 0.0 0.0 0.0 0.0 0.0
Payroll Cost 0.0 0.0 0.0 0.0 0.0
PS Leave Fare 0.5 0.0 0.5 0.5 0.0
Retirement 0.0 0.0 0.0 0.0 0.0
Sal & Allow 0.0 0.0 0.0 0.0 0.0
Staffing Grants 11.5 0.0 11.5 10.7 0.8
Teach Leave 1.1 0.0 1.1 1.1 0.0
Teacher Sal Gr 24.9 0.0 24.9 28.1 -3.2
577-Southern Highlands Provincial Administration
188.7 -50.5 138.2 162.6 -24.4
Goods & Services 96.6 -50.5 46.1 44.6 1.5
Admin Grant 0.8 3.0 3.8 3.8 0.0
C/Gr-SA & PA 15.8 -7.3 8.5 8.0 0.5
Ed Function Gr 4.8 0.0 4.8 4.8 0.0
Health Funct Gr 4.2 0.3 4.5 4.5 0.0
Infrast. Grant 4.4 0.0 4.4 4.4 0.0
Land Mediation 0.1 0.0 0.1 0.1 0.0
LLG Vill Ser Gr 3.1 0.0 3.1 2.2 0.9
Op Exp (NP) 50.0 -38.5 11.5 11.5 0.0
Prim Prod Gr 1.2 0.0 1.2 1.2 0.0
Serv Del Gr 1.8 0.0 1.8 1.8 0.0
Trf to Govt 10.0 -8.0 2.0 1.9 0.1
Vill Courts Gr 0.4 0.0 0.4 0.4 0.0
Personnel Emoluments 92.1 0.0 92.1 118.0 -25.9
Overtime 0.0 0.0 0.0 0.0 0.0
Payroll Cost 0.0 0.0 0.0 0.0 0.0
PS Leave Fare 0.4 0.0 0.4 0.4 0.0
Retirement 0.0 0.0 0.0 0.0 0.0
Sal & Allow 0.0 0.0 0.0 0.0 0.0
Staffing Grants 26.2 0.0 26.2 18.1 8.1
Teach Leave 0.8 0.0 0.8 0.8 0.0
Teacher Sal Gr 64.8 0.0 64.8 98.8 -34.0
578-Enga Provincial Administration 160.8 -46.2 114.7 139.9 -25.2
Goods & Services 95.4 -46.2 49.2 50.2 -1.0
Admin Grant 1.7 2.0 3.7 6.7 -3.0
C/Gr-SA & PA 7.7 -5.7 2.0 2.0 0.0
Ed Function Gr 4.8 0.0 4.8 4.4 0.5
Health Funct Gr 4.6 0.0 4.6 4.1 0.5
Infrast. Grant 10.2 0.0 10.2 10.2 0.0
Land Mediation 0.1 0.0 0.1 0.1 0.0
LLG Vill Ser Gr 2.3 0.0 2.3 1.3 1.0
Op Exp (NP) 7.5 -0.5 7.0 7.0 0.0
Prim Prod Gr 0.8 0.0 0.8 0.8 0.0
Serv Del Gr 2.9 0.0 2.9 2.9 0.0
Trf to Govt 52.5 -42.0 10.5 10.5 0.0
Vill Courts Gr 0.4 0.0 0.4 0.4 0.0
Personnel Emoluments 65.5 0.0 65.5 89.6 -24.1
Payroll Cost 0.0 0.0 0.0 0.0 0.0
PS Leave Fare 0.2 0.0 0.2 0.2 0.0
Retirement 0.0 0.0 0.0 0.0 0.0
Sal & Allow 0.0 0.0 0.0 0.0 0.0
Staffing Grants 19.6 0.0 19.6 11.6 8.0
Teach Leave 1.0 0.0 1.0 1.0 0.0
Teacher Sal Gr 44.7 0.0 44.7 76.9 -32.2
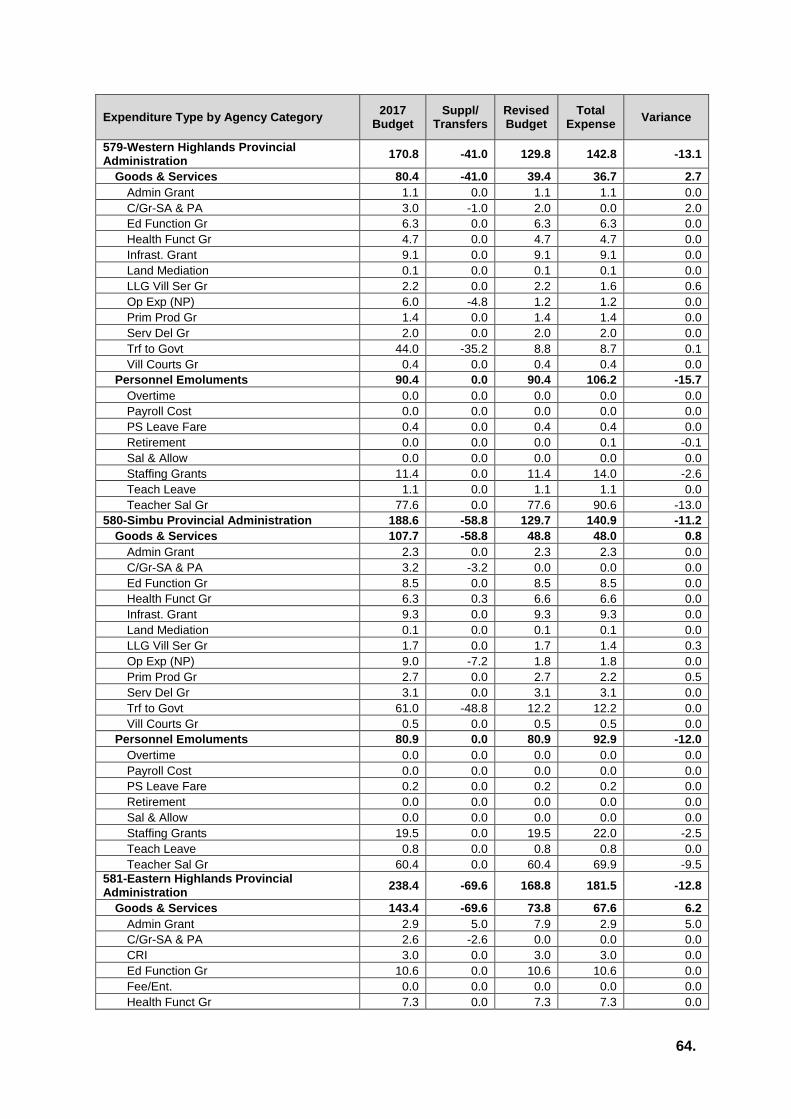
64.
Expenditure Type by Agency Category 2017
Budget Suppl/
Transfers Revised Budget
Total Expense
Variance
579-Western Highlands Provincial Administration
170.8 -41.0 129.8 142.8 -13.1
Goods & Services 80.4 -41.0 39.4 36.7 2.7
Admin Grant 1.1 0.0 1.1 1.1 0.0
C/Gr-SA & PA 3.0 -1.0 2.0 0.0 2.0
Ed Function Gr 6.3 0.0 6.3 6.3 0.0
Health Funct Gr 4.7 0.0 4.7 4.7 0.0
Infrast. Grant 9.1 0.0 9.1 9.1 0.0
Land Mediation 0.1 0.0 0.1 0.1 0.0
LLG Vill Ser Gr 2.2 0.0 2.2 1.6 0.6
Op Exp (NP) 6.0 -4.8 1.2 1.2 0.0
Prim Prod Gr 1.4 0.0 1.4 1.4 0.0
Serv Del Gr 2.0 0.0 2.0 2.0 0.0
Trf to Govt 44.0 -35.2 8.8 8.7 0.1
Vill Courts Gr 0.4 0.0 0.4 0.4 0.0
Personnel Emoluments 90.4 0.0 90.4 106.2 -15.7
Overtime 0.0 0.0 0.0 0.0 0.0
Payroll Cost 0.0 0.0 0.0 0.0 0.0
PS Leave Fare 0.4 0.0 0.4 0.4 0.0
Retirement 0.0 0.0 0.0 0.1 -0.1
Sal & Allow 0.0 0.0 0.0 0.0 0.0
Staffing Grants 11.4 0.0 11.4 14.0 -2.6
Teach Leave 1.1 0.0 1.1 1.1 0.0
Teacher Sal Gr 77.6 0.0 77.6 90.6 -13.0
580-Simbu Provincial Administration 188.6 -58.8 129.7 140.9 -11.2
Goods & Services 107.7 -58.8 48.8 48.0 0.8
Admin Grant 2.3 0.0 2.3 2.3 0.0
C/Gr-SA & PA 3.2 -3.2 0.0 0.0 0.0
Ed Function Gr 8.5 0.0 8.5 8.5 0.0
Health Funct Gr 6.3 0.3 6.6 6.6 0.0
Infrast. Grant 9.3 0.0 9.3 9.3 0.0
Land Mediation 0.1 0.0 0.1 0.1 0.0
LLG Vill Ser Gr 1.7 0.0 1.7 1.4 0.3
Op Exp (NP) 9.0 -7.2 1.8 1.8 0.0
Prim Prod Gr 2.7 0.0 2.7 2.2 0.5
Serv Del Gr 3.1 0.0 3.1 3.1 0.0
Trf to Govt 61.0 -48.8 12.2 12.2 0.0
Vill Courts Gr 0.5 0.0 0.5 0.5 0.0
Personnel Emoluments 80.9 0.0 80.9 92.9 -12.0
Overtime 0.0 0.0 0.0 0.0 0.0
Payroll Cost 0.0 0.0 0.0 0.0 0.0
PS Leave Fare 0.2 0.0 0.2 0.2 0.0
Retirement 0.0 0.0 0.0 0.0 0.0
Sal & Allow 0.0 0.0 0.0 0.0 0.0
Staffing Grants 19.5 0.0 19.5 22.0 -2.5
Teach Leave 0.8 0.0 0.8 0.8 0.0
Teacher Sal Gr 60.4 0.0 60.4 69.9 -9.5
581-Eastern Highlands Provincial Administration
238.4 -69.6 168.8 181.5 -12.8
Goods & Services 143.4 -69.6 73.8 67.6 6.2
Admin Grant 2.9 5.0 7.9 2.9 5.0
C/Gr-SA & PA 2.6 -2.6 0.0 0.0 0.0
CRI 3.0 0.0 3.0 3.0 0.0
Ed Function Gr 10.6 0.0 10.6 10.6 0.0
Fee/Ent. 0.0 0.0 0.0 0.0 0.0
Health Funct Gr 7.3 0.0 7.3 7.3 0.0

65.
Expenditure Type by Agency Category 2017
Budget Suppl/
Transfers Revised Budget
Total Expense
Variance
Infrast. Grant 17.2 0.0 17.2 17.2 0.0
Land Mediation 0.1 0.0 0.1 0.1 0.0
LLG Vill Ser Gr 2.7 0.0 2.7 2.0 0.7
Op Exp (NP) 12.0 -9.6 2.4 1.9 0.5
Prim Prod Gr 2.7 0.0 2.7 2.7 0.0
Serv Del Gr 3.6 0.0 3.6 3.6 0.0
Trf to Govt 78.0 -62.4 15.6 15.6 0.0
Vill Courts Gr 0.6 0.0 0.6 0.6 0.0
Personnel Emoluments 95.0 0.0 95.0 114.0 -19.0
Payroll Cost 0.0 0.0 0.0 0.0 0.0
PS Leave Fare 0.7 0.0 0.7 0.7 0.0
Retirement 0.0 0.0 0.0 0.0 0.0
Sal & Allow 0.0 0.0 0.0 0.0 0.0
Staffing Grants 10.1 0.0 10.1 10.3 -0.2
Teach Leave 1.0 0.0 1.0 1.0 0.0
Teacher Sal Gr 83.2 0.0 83.2 102.0 -18.8
582-Morobe Provincial Administration 274.0 -85.1 188.9 218.2 -29.3
Goods & Services 113.5 -85.1 28.4 27.2 1.2
Admin Grant 0.0 0.0 0.0 0.0 0.0
C/Gr-SA & PA 6.7 -5.7 1.0 1.0 0.0
Ed Function Gr 0.0 0.0 0.0 0.0 0.0
Health Funct Gr 0.0 0.5 0.5 0.5 0.0
Infrast. Grant 0.0 0.0 0.0 0.0 0.0
Land Mediation 0.0 0.0 0.0 0.0 0.0
LLG Vill Ser Gr 6.9 0.0 6.9 5.7 1.2
Op Exp (NP) 14.0 -11.2 2.8 2.8 0.0
Prim Prod Gr 0.0 0.0 0.0 0.0 0.0
Serv Del Gr 0.0 0.0 0.0 0.0 0.0
Trf to Govt 86.0 -68.8 17.2 17.2 0.0
Vill Courts Gr 0.0 0.0 0.0 0.0 0.0
Personnel Emoluments 160.5 0.0 160.5 191.0 -30.5
Overtime 0.0 0.0 0.0 0.0 0.0
Payroll Cost 0.0 0.0 0.0 -0.1 0.1
PS Leave Fare 1.2 0.0 1.2 1.2 0.0
Retirement 0.0 0.0 0.0 0.0 0.0
Sal & Allow 0.0 0.0 0.0 0.0 0.0
Staffing Grants 31.4 0.0 31.4 33.9 -2.5
Teach Leave 5.0 0.0 5.0 5.0 0.0
Teacher Sal Gr 122.9 0.0 122.9 150.9 -28.0
583-Madang Provincial Administration 245.7 -68.1 177.6 194.0 -16.4
Goods & Services 132.4 -68.1 64.4 63.6 0.8
Admin Grant 4.7 0.0 4.7 4.7 0.0
C/Gr-SA & PA 4.5 -4.5 0.0 0.0 0.0
Ed Function Gr 8.5 0.0 8.5 8.5 0.0
Health Funct Gr 8.5 0.4 9.0 9.0 0.0
Infrast. Grant 14.1 0.0 14.1 14.1 0.0
Land Mediation 0.1 0.0 0.1 0.1 0.0
LLG Vill Ser Gr 4.4 0.0 4.4 3.6 0.8
Op Exp (NP) 26.0 -20.8 5.2 5.2 0.0
Prim Prod Gr 3.4 0.0 3.4 3.4 0.0
Serv Del Gr 3.7 0.0 3.7 3.7 0.0
Trf to Govt 54.0 -43.2 10.8 10.8 0.0
Vill Courts Gr 0.6 0.0 0.6 0.6 0.0
Personnel Emoluments 113.2 0.0 113.2 130.4 -17.2
Payroll Cost 0.0 0.0 0.0 0.0 0.0
PS Leave Fare 0.7 0.0 0.7 0.7 0.0

66.
Expenditure Type by Agency Category 2017
Budget Suppl/
Transfers Revised Budget
Total Expense
Variance
Retirement 0.0 0.0 0.0 0.0 0.0
Sal & Allow 0.0 0.0 0.0 0.0 0.0
Staffing Grants 25.3 0.0 25.3 25.9 -0.6
Teach Leave 2.0 0.0 2.0 2.0 0.0
Teacher Sal Gr 85.2 0.0 85.2 101.8 -16.6
584-East Sepik Provincial Administration 222.4 -65.1 157.4 190.2 -32.8
Goods & Services 138.1 -65.1 73.0 76.6 -3.6
Admin Grant 3.3 0.0 3.3 3.3 0.0
C/Gr-SA & PA 6.5 -6.5 0.0 0.0 0.0
CRI 3.0 -3.0 0.0 0.0 0.0
Ed Function Gr 12.2 0.0 12.2 12.2 0.0
Health Funct Gr 11.2 0.4 11.6 11.6 0.0
Infrast. Grant 19.8 0.0 19.8 19.8 0.0
Land Mediation 0.1 0.0 0.1 0.1 0.0
LLG Vill Ser Gr 4.9 0.0 4.9 3.9 0.9
Op Exp (NP) 3.0 -2.4 0.6 0.6 0.0
Prim Prod Gr 3.4 0.0 3.4 3.4 0.0
Serv Del Gr 3.1 0.0 3.1 3.1 0.0
Trf to Govt 67.0 -53.6 13.4 17.9 -4.5
Vill Courts Gr 0.8 0.0 0.8 0.8 0.0
Personnel Emoluments 84.3 0.0 84.3 113.6 -29.3
Land Mediators 0.0 0.0 0.0 0.0 0.0
Payroll Cost 0.0 0.0 0.0 0.0 0.0
PS Leave Fare 1.0 0.0 1.0 1.0 0.0
Retirement 0.0 0.0 0.0 0.0 0.0
Sal & Allow 0.0 0.0 0.0 0.0 0.0
Staffing Grants 18.6 0.0 18.6 20.7 -2.0
Teach Leave 1.0 0.0 1.0 1.0 0.0
Teacher Sal Gr 63.7 0.0 63.7 90.8 -27.2
585-Sandaun Provincial Administration 152.1 -43.2 108.9 111.5 -2.6
Goods & Services 96.9 -43.2 53.8 50.5 3.2
Admin Grant 3.0 0.0 3.0 3.0 0.0
C/Gr-SA & PA 9.2 -8.0 1.2 1.2 0.0
CRI 4.0 0.0 4.0 3.0 1.0
Ed Function Gr 9.0 0.0 9.0 9.0 0.0
Health Funct Gr 9.7 0.0 9.7 9.7 0.0
Infrast. Grant 7.2 0.0 7.2 7.2 0.0
Land Mediation 0.1 0.0 0.1 0.1 0.0
LLG Vill Ser Gr 4.3 0.0 4.3 3.5 0.8
Op Exp (NP) 1.0 0.0 1.0 0.0 1.0
Prim Prod Gr 3.2 0.0 3.2 3.2 0.0
Serv Del Gr 2.0 0.0 2.0 2.0 0.0
Trf to Govt 44.0 -35.2 8.8 8.4 0.4
Vill Courts Gr 0.3 0.0 0.3 0.3 0.0
Personnel Emoluments 55.1 0.0 55.1 61.0 -5.9
Payroll Cost 0.0 0.0 0.0 0.0 0.0
PS Leave Fare 0.7 0.0 0.7 0.7 0.0
Retirement 0.0 0.0 0.0 0.0 0.0
Sal & Allow 0.0 0.0 0.0 0.0 0.0
Staffing Grants 12.0 0.0 12.0 9.4 2.6
Teach Leave 1.0 0.0 1.0 1.0 0.0
Teacher Sal Gr 41.5 0.0 41.5 49.9 -8.4
586-Manus Provincial Administration 58.1 -17.3 40.8 45.0 -4.2
Goods & Services 29.3 -17.3 12.0 12.0 0.0
Admin Grant 0.2 0.0 0.2 0.2 0.0
C/Gr-SA & PA 1.3 -1.3 0.0 0.0 0.0
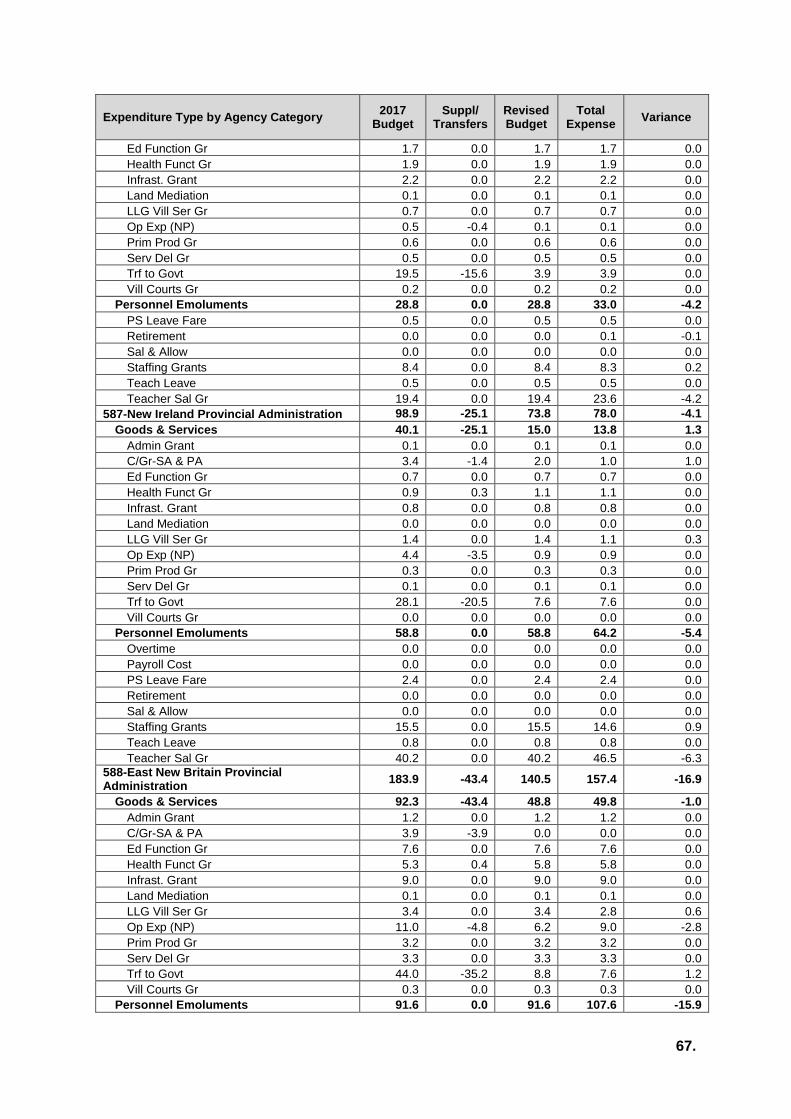
67.
Expenditure Type by Agency Category 2017
Budget Suppl/
Transfers Revised Budget
Total Expense
Variance
Ed Function Gr 1.7 0.0 1.7 1.7 0.0
Health Funct Gr 1.9 0.0 1.9 1.9 0.0
Infrast. Grant 2.2 0.0 2.2 2.2 0.0
Land Mediation 0.1 0.0 0.1 0.1 0.0
LLG Vill Ser Gr 0.7 0.0 0.7 0.7 0.0
Op Exp (NP) 0.5 -0.4 0.1 0.1 0.0
Prim Prod Gr 0.6 0.0 0.6 0.6 0.0
Serv Del Gr 0.5 0.0 0.5 0.5 0.0
Trf to Govt 19.5 -15.6 3.9 3.9 0.0
Vill Courts Gr 0.2 0.0 0.2 0.2 0.0
Personnel Emoluments 28.8 0.0 28.8 33.0 -4.2
PS Leave Fare 0.5 0.0 0.5 0.5 0.0
Retirement 0.0 0.0 0.0 0.1 -0.1
Sal & Allow 0.0 0.0 0.0 0.0 0.0
Staffing Grants 8.4 0.0 8.4 8.3 0.2
Teach Leave 0.5 0.0 0.5 0.5 0.0
Teacher Sal Gr 19.4 0.0 19.4 23.6 -4.2
587-New Ireland Provincial Administration 98.9 -25.1 73.8 78.0 -4.1
Goods & Services 40.1 -25.1 15.0 13.8 1.3
Admin Grant 0.1 0.0 0.1 0.1 0.0
C/Gr-SA & PA 3.4 -1.4 2.0 1.0 1.0
Ed Function Gr 0.7 0.0 0.7 0.7 0.0
Health Funct Gr 0.9 0.3 1.1 1.1 0.0
Infrast. Grant 0.8 0.0 0.8 0.8 0.0
Land Mediation 0.0 0.0 0.0 0.0 0.0
LLG Vill Ser Gr 1.4 0.0 1.4 1.1 0.3
Op Exp (NP) 4.4 -3.5 0.9 0.9 0.0
Prim Prod Gr 0.3 0.0 0.3 0.3 0.0
Serv Del Gr 0.1 0.0 0.1 0.1 0.0
Trf to Govt 28.1 -20.5 7.6 7.6 0.0
Vill Courts Gr 0.0 0.0 0.0 0.0 0.0
Personnel Emoluments 58.8 0.0 58.8 64.2 -5.4
Overtime 0.0 0.0 0.0 0.0 0.0
Payroll Cost 0.0 0.0 0.0 0.0 0.0
PS Leave Fare 2.4 0.0 2.4 2.4 0.0
Retirement 0.0 0.0 0.0 0.0 0.0
Sal & Allow 0.0 0.0 0.0 0.0 0.0
Staffing Grants 15.5 0.0 15.5 14.6 0.9
Teach Leave 0.8 0.0 0.8 0.8 0.0
Teacher Sal Gr 40.2 0.0 40.2 46.5 -6.3
588-East New Britain Provincial Administration
183.9 -43.4 140.5 157.4 -16.9
Goods & Services 92.3 -43.4 48.8 49.8 -1.0
Admin Grant 1.2 0.0 1.2 1.2 0.0
C/Gr-SA & PA 3.9 -3.9 0.0 0.0 0.0
Ed Function Gr 7.6 0.0 7.6 7.6 0.0
Health Funct Gr 5.3 0.4 5.8 5.8 0.0
Infrast. Grant 9.0 0.0 9.0 9.0 0.0
Land Mediation 0.1 0.0 0.1 0.1 0.0
LLG Vill Ser Gr 3.4 0.0 3.4 2.8 0.6
Op Exp (NP) 11.0 -4.8 6.2 9.0 -2.8
Prim Prod Gr 3.2 0.0 3.2 3.2 0.0
Serv Del Gr 3.3 0.0 3.3 3.3 0.0
Trf to Govt 44.0 -35.2 8.8 7.6 1.2
Vill Courts Gr 0.3 0.0 0.3 0.3 0.0
Personnel Emoluments 91.6 0.0 91.6 107.6 -15.9
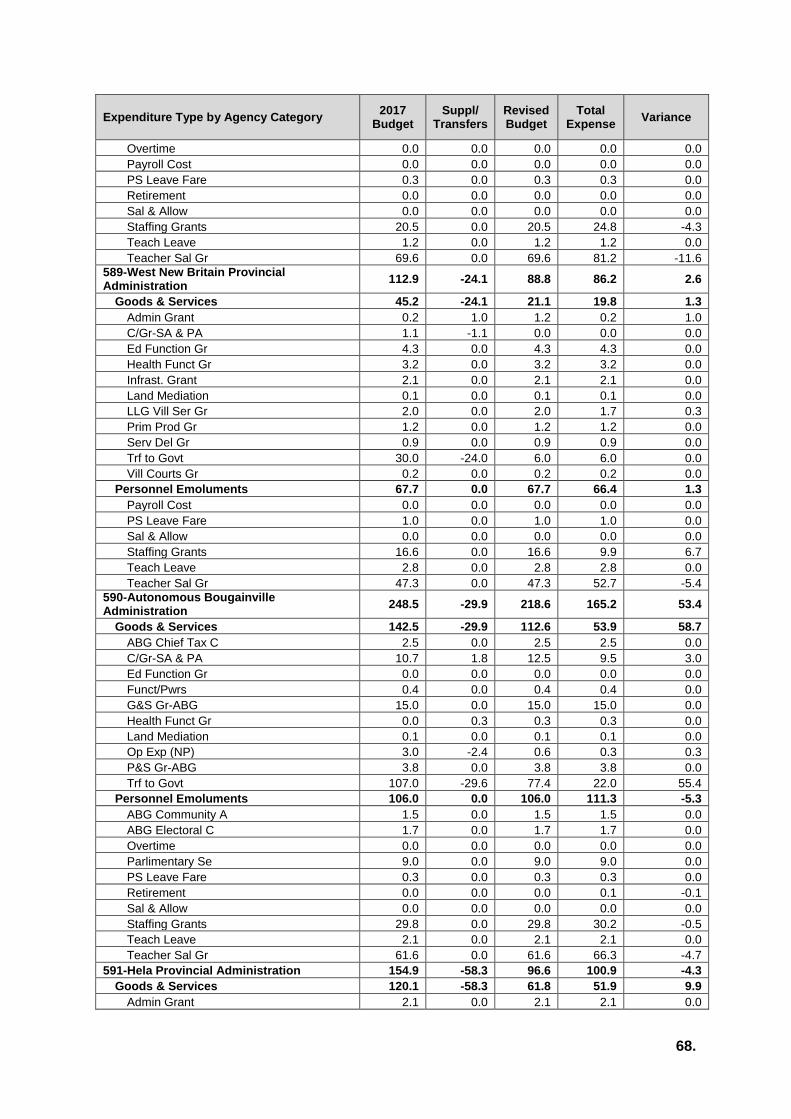
68.
Expenditure Type by Agency Category 2017
Budget Suppl/
Transfers Revised Budget
Total Expense
Variance
Overtime 0.0 0.0 0.0 0.0 0.0
Payroll Cost 0.0 0.0 0.0 0.0 0.0
PS Leave Fare 0.3 0.0 0.3 0.3 0.0
Retirement 0.0 0.0 0.0 0.0 0.0
Sal & Allow 0.0 0.0 0.0 0.0 0.0
Staffing Grants 20.5 0.0 20.5 24.8 -4.3
Teach Leave 1.2 0.0 1.2 1.2 0.0
Teacher Sal Gr 69.6 0.0 69.6 81.2 -11.6
589-West New Britain Provincial Administration
112.9 -24.1 88.8 86.2 2.6
Goods & Services 45.2 -24.1 21.1 19.8 1.3
Admin Grant 0.2 1.0 1.2 0.2 1.0
C/Gr-SA & PA 1.1 -1.1 0.0 0.0 0.0
Ed Function Gr 4.3 0.0 4.3 4.3 0.0
Health Funct Gr 3.2 0.0 3.2 3.2 0.0
Infrast. Grant 2.1 0.0 2.1 2.1 0.0
Land Mediation 0.1 0.0 0.1 0.1 0.0
LLG Vill Ser Gr 2.0 0.0 2.0 1.7 0.3
Prim Prod Gr 1.2 0.0 1.2 1.2 0.0
Serv Del Gr 0.9 0.0 0.9 0.9 0.0
Trf to Govt 30.0 -24.0 6.0 6.0 0.0
Vill Courts Gr 0.2 0.0 0.2 0.2 0.0
Personnel Emoluments 67.7 0.0 67.7 66.4 1.3
Payroll Cost 0.0 0.0 0.0 0.0 0.0
PS Leave Fare 1.0 0.0 1.0 1.0 0.0
Sal & Allow 0.0 0.0 0.0 0.0 0.0
Staffing Grants 16.6 0.0 16.6 9.9 6.7
Teach Leave 2.8 0.0 2.8 2.8 0.0
Teacher Sal Gr 47.3 0.0 47.3 52.7 -5.4
590-Autonomous Bougainville Administration
248.5 -29.9 218.6 165.2 53.4
Goods & Services 142.5 -29.9 112.6 53.9 58.7
ABG Chief Tax C 2.5 0.0 2.5 2.5 0.0
C/Gr-SA & PA 10.7 1.8 12.5 9.5 3.0
Ed Function Gr 0.0 0.0 0.0 0.0 0.0
Funct/Pwrs 0.4 0.0 0.4 0.4 0.0
G&S Gr-ABG 15.0 0.0 15.0 15.0 0.0
Health Funct Gr 0.0 0.3 0.3 0.3 0.0
Land Mediation 0.1 0.0 0.1 0.1 0.0
Op Exp (NP) 3.0 -2.4 0.6 0.3 0.3
P&S Gr-ABG 3.8 0.0 3.8 3.8 0.0
Trf to Govt 107.0 -29.6 77.4 22.0 55.4
Personnel Emoluments 106.0 0.0 106.0 111.3 -5.3
ABG Community A 1.5 0.0 1.5 1.5 0.0
ABG Electoral C 1.7 0.0 1.7 1.7 0.0
Overtime 0.0 0.0 0.0 0.0 0.0
Parlimentary Se 9.0 0.0 9.0 9.0 0.0
PS Leave Fare 0.3 0.0 0.3 0.3 0.0
Retirement 0.0 0.0 0.0 0.1 -0.1
Sal & Allow 0.0 0.0 0.0 0.0 0.0
Staffing Grants 29.8 0.0 29.8 30.2 -0.5
Teach Leave 2.1 0.0 2.1 2.1 0.0
Teacher Sal Gr 61.6 0.0 61.6 66.3 -4.7
591-Hela Provincial Administration 154.9 -58.3 96.6 100.9 -4.3
Goods & Services 120.1 -58.3 61.8 51.9 9.9
Admin Grant 2.1 0.0 2.1 2.1 0.0
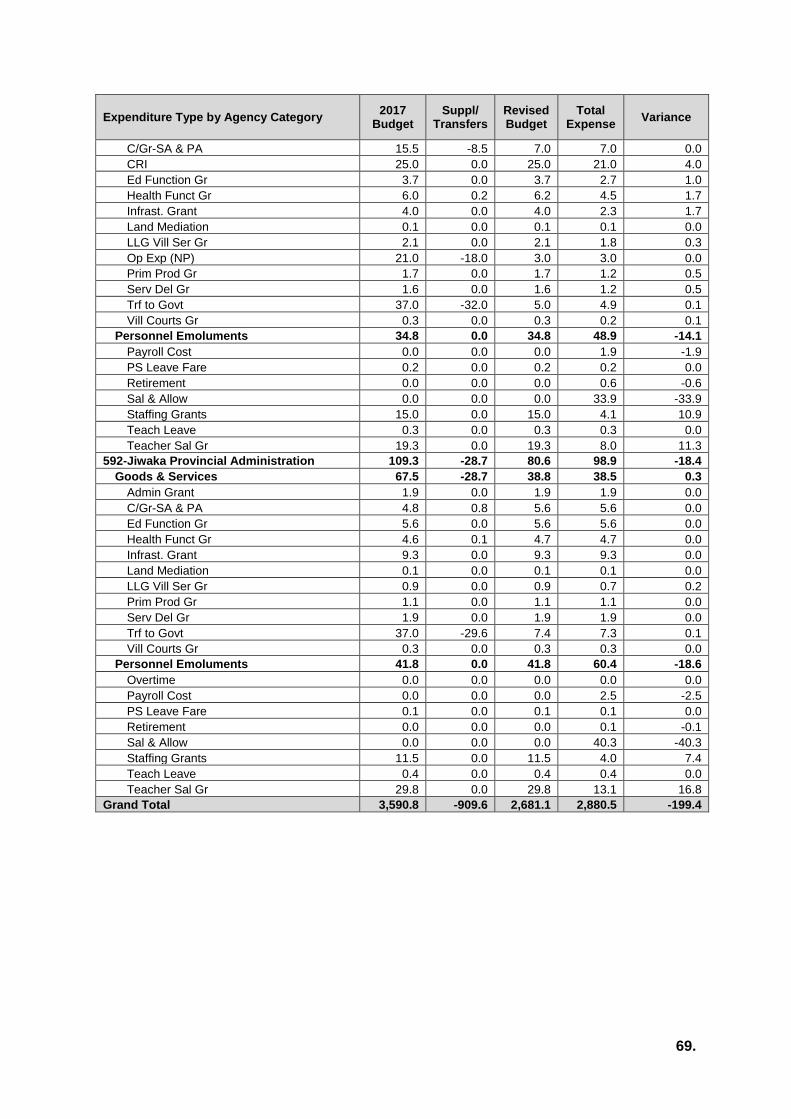
69.
Expenditure Type by Agency Category 2017
Budget Suppl/
Transfers Revised Budget
Total Expense
Variance
C/Gr-SA & PA 15.5 -8.5 7.0 7.0 0.0
CRI 25.0 0.0 25.0 21.0 4.0
Ed Function Gr 3.7 0.0 3.7 2.7 1.0
Health Funct Gr 6.0 0.2 6.2 4.5 1.7
Infrast. Grant 4.0 0.0 4.0 2.3 1.7
Land Mediation 0.1 0.0 0.1 0.1 0.0
LLG Vill Ser Gr 2.1 0.0 2.1 1.8 0.3
Op Exp (NP) 21.0 -18.0 3.0 3.0 0.0
Prim Prod Gr 1.7 0.0 1.7 1.2 0.5
Serv Del Gr 1.6 0.0 1.6 1.2 0.5
Trf to Govt 37.0 -32.0 5.0 4.9 0.1
Vill Courts Gr 0.3 0.0 0.3 0.2 0.1
Personnel Emoluments 34.8 0.0 34.8 48.9 -14.1
Payroll Cost 0.0 0.0 0.0 1.9 -1.9
PS Leave Fare 0.2 0.0 0.2 0.2 0.0
Retirement 0.0 0.0 0.0 0.6 -0.6
Sal & Allow 0.0 0.0 0.0 33.9 -33.9
Staffing Grants 15.0 0.0 15.0 4.1 10.9
Teach Leave 0.3 0.0 0.3 0.3 0.0
Teacher Sal Gr 19.3 0.0 19.3 8.0 11.3
592-Jiwaka Provincial Administration 109.3 -28.7 80.6 98.9 -18.4
Goods & Services 67.5 -28.7 38.8 38.5 0.3
Admin Grant 1.9 0.0 1.9 1.9 0.0
C/Gr-SA & PA 4.8 0.8 5.6 5.6 0.0
Ed Function Gr 5.6 0.0 5.6 5.6 0.0
Health Funct Gr 4.6 0.1 4.7 4.7 0.0
Infrast. Grant 9.3 0.0 9.3 9.3 0.0
Land Mediation 0.1 0.0 0.1 0.1 0.0
LLG Vill Ser Gr 0.9 0.0 0.9 0.7 0.2
Prim Prod Gr 1.1 0.0 1.1 1.1 0.0
Serv Del Gr 1.9 0.0 1.9 1.9 0.0
Trf to Govt 37.0 -29.6 7.4 7.3 0.1
Vill Courts Gr 0.3 0.0 0.3 0.3 0.0
Personnel Emoluments 41.8 0.0 41.8 60.4 -18.6
Overtime 0.0 0.0 0.0 0.0 0.0
Payroll Cost 0.0 0.0 0.0 2.5 -2.5
PS Leave Fare 0.1 0.0 0.1 0.1 0.0
Retirement 0.0 0.0 0.0 0.1 -0.1
Sal & Allow 0.0 0.0 0.0 40.3 -40.3
Staffing Grants 11.5 0.0 11.5 4.0 7.4
Teach Leave 0.4 0.0 0.4 0.4 0.0
Teacher Sal Gr 29.8 0.0 29.8 13.1 16.8
Grand Total 3,590.8 -909.6 2,681.1 2,880.5 -199.4
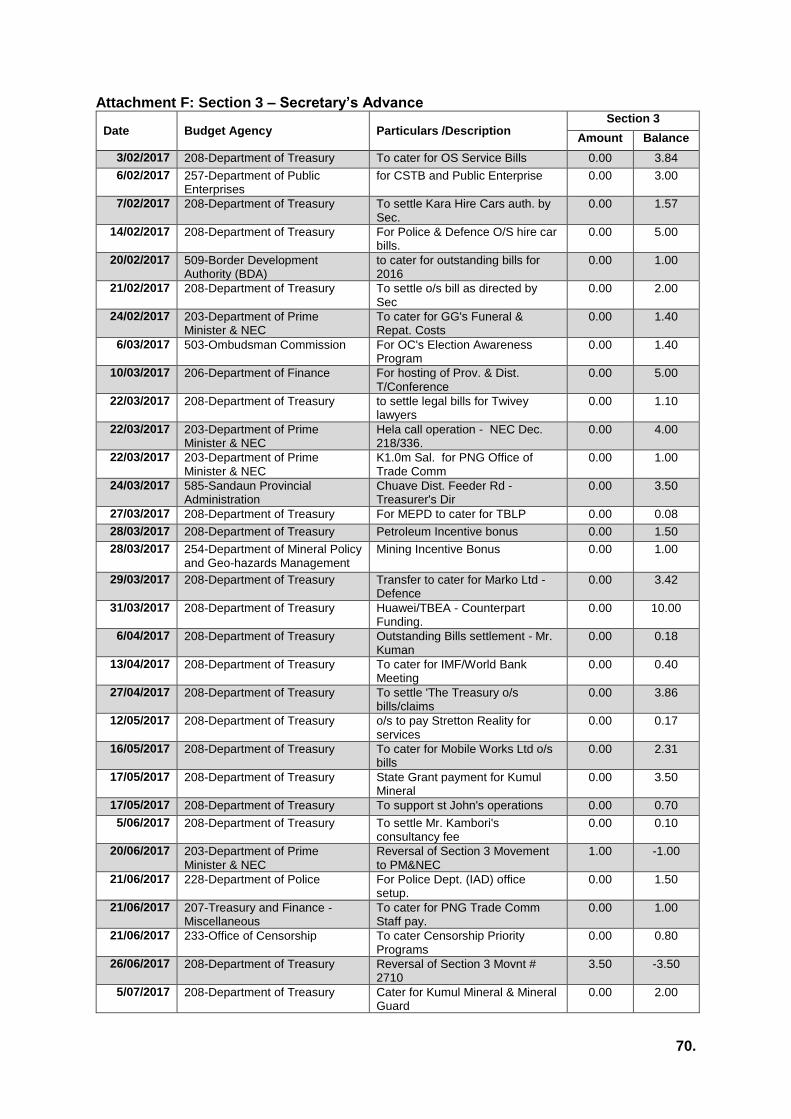
70.
Attachment F: Section 3 – Secretary’s Advance
Date Budget Agency Particulars /Description Section 3
Amount Balance
3/02/2017 208-Department of Treasury To cater for OS Service Bills 0.00 3.84
6/02/2017 257-Department of Public Enterprises
for CSTB and Public Enterprise 0.00 3.00
7/02/2017 208-Department of Treasury To settle Kara Hire Cars auth. by Sec.
0.00 1.57
14/02/2017 208-Department of Treasury For Police & Defence O/S hire car bills.
0.00 5.00
20/02/2017 509-Border Development Authority (BDA)
to cater for outstanding bills for 2016
0.00 1.00
21/02/2017 208-Department of Treasury To settle o/s bill as directed by Sec
0.00 2.00
24/02/2017 203-Department of Prime Minister & NEC
To cater for GG's Funeral & Repat. Costs
0.00 1.40
6/03/2017 503-Ombudsman Commission For OC's Election Awareness Program
0.00 1.40
10/03/2017 206-Department of Finance For hosting of Prov. & Dist. T/Conference
0.00 5.00
22/03/2017 208-Department of Treasury to settle legal bills for Twivey lawyers
0.00 1.10
22/03/2017 203-Department of Prime Minister & NEC
Hela call operation - NEC Dec. 218/336.
0.00 4.00
22/03/2017 203-Department of Prime Minister & NEC
K1.0m Sal. for PNG Office of Trade Comm
0.00 1.00
24/03/2017 585-Sandaun Provincial Administration
Chuave Dist. Feeder Rd - Treasurer's Dir
0.00 3.50
27/03/2017 208-Department of Treasury For MEPD to cater for TBLP 0.00 0.08
28/03/2017 208-Department of Treasury Petroleum Incentive bonus 0.00 1.50
28/03/2017 254-Department of Mineral Policy and Geo-hazards Management
Mining Incentive Bonus 0.00 1.00
29/03/2017 208-Department of Treasury Transfer to cater for Marko Ltd - Defence
0.00 3.42
31/03/2017 208-Department of Treasury Huawei/TBEA - Counterpart Funding.
0.00 10.00
6/04/2017 208-Department of Treasury Outstanding Bills settlement - Mr. Kuman
0.00 0.18
13/04/2017 208-Department of Treasury To cater for IMF/World Bank Meeting
0.00 0.40
27/04/2017 208-Department of Treasury To settle 'The Treasury o/s bills/claims
0.00 3.86
12/05/2017 208-Department of Treasury o/s to pay Stretton Reality for services
0.00 0.17
16/05/2017 208-Department of Treasury To cater for Mobile Works Ltd o/s bills
0.00 2.31
17/05/2017 208-Department of Treasury State Grant payment for Kumul Mineral
0.00 3.50
17/05/2017 208-Department of Treasury To support st John's operations 0.00 0.70
5/06/2017 208-Department of Treasury To settle Mr. Kambori's consultancy fee
0.00 0.10
20/06/2017 203-Department of Prime Minister & NEC
Reversal of Section 3 Movement to PM&NEC
1.00 -1.00
21/06/2017 228-Department of Police For Police Dept. (IAD) office setup.
0.00 1.50
21/06/2017 207-Treasury and Finance - Miscellaneous
To cater for PNG Trade Comm Staff pay.
0.00 1.00
21/06/2017 233-Office of Censorship To cater Censorship Priority Programs
0.00 0.80
26/06/2017 208-Department of Treasury Reversal of Section 3 Movnt # 2710
3.50 -3.50
5/07/2017 208-Department of Treasury Cater for Kumul Mineral & Mineral Guard
0.00 2.00
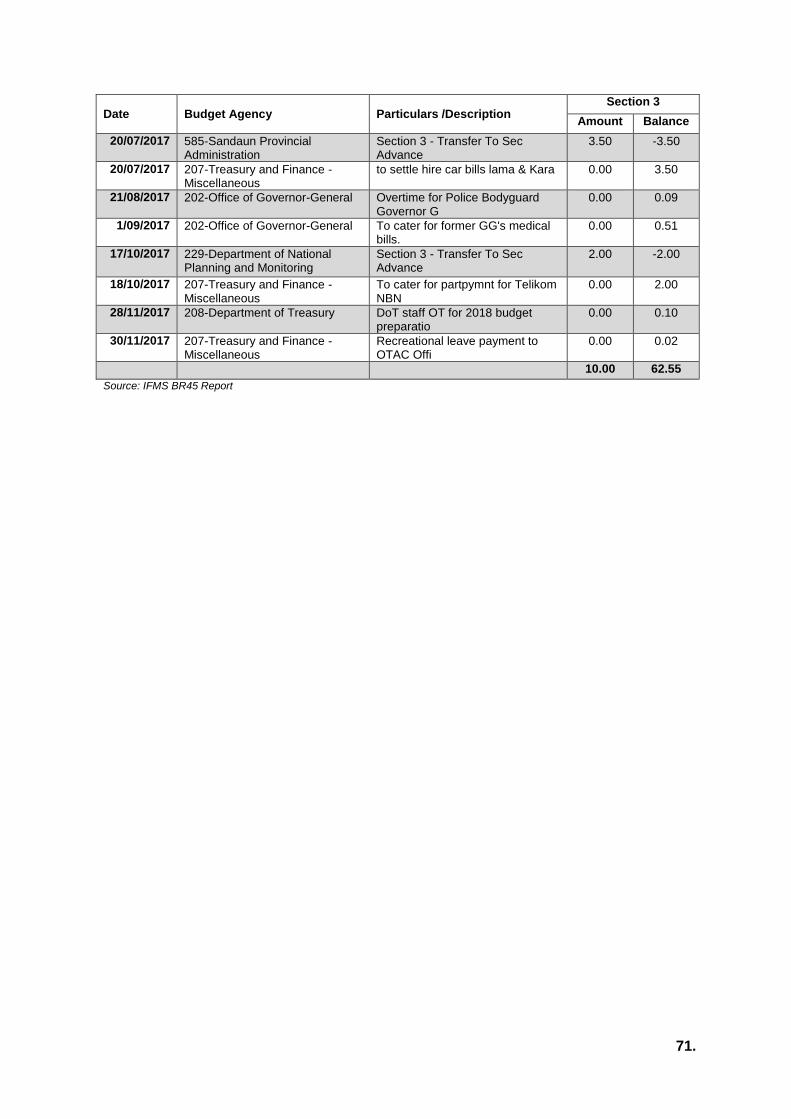
71.
Date Budget Agency Particulars /Description Section 3
Amount Balance
20/07/2017 585-Sandaun Provincial Administration
Section 3 - Transfer To Sec Advance
3.50 -3.50
20/07/2017 207-Treasury and Finance - Miscellaneous
to settle hire car bills lama & Kara 0.00 3.50
21/08/2017 202-Office of Governor-General Overtime for Police Bodyguard Governor G
0.00 0.09
1/09/2017 202-Office of Governor-General To cater for former GG's medical bills.
0.00 0.51
17/10/2017 229-Department of National Planning and Monitoring
Section 3 - Transfer To Sec Advance
2.00 -2.00
18/10/2017 207-Treasury and Finance - Miscellaneous
To cater for partpymnt for Telikom NBN
0.00 2.00
28/11/2017 208-Department of Treasury DoT staff OT for 2018 budget preparatio
0.00 0.10
30/11/2017 207-Treasury and Finance - Miscellaneous
Recreational leave payment to OTAC Offi
0.00 0.02
10.00 62.55
Source: IFMS BR45 Report
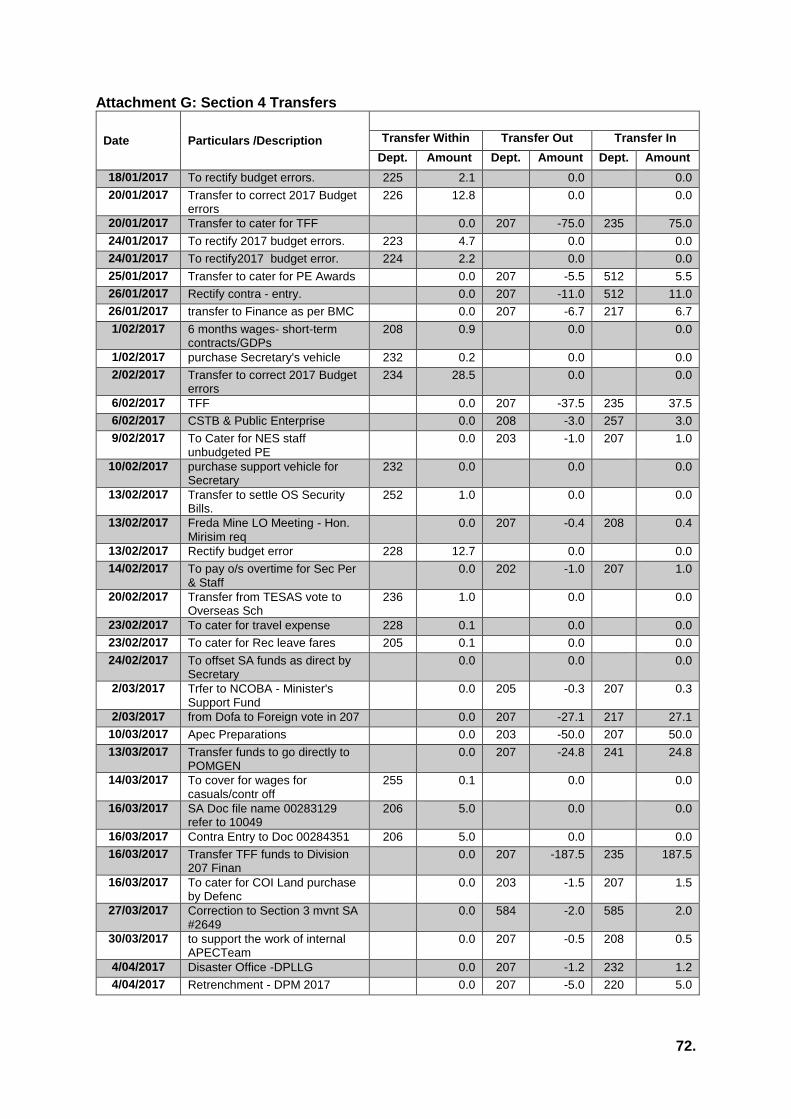
72.
Attachment G: Section 4 Transfers
Date Particulars /Description
Transfer Within Transfer Out Transfer In
Dept. Amount Dept. Amount Dept. Amount
18/01/2017 To rectify budget errors. 225 2.1 0.0 0.0
20/01/2017 Transfer to correct 2017 Budget errors
226 12.8 0.0 0.0
20/01/2017 Transfer to cater for TFF 0.0 207 -75.0 235 75.0
24/01/2017 To rectify 2017 budget errors. 223 4.7 0.0 0.0
24/01/2017 To rectify2017 budget error. 224 2.2 0.0 0.0
25/01/2017 Transfer to cater for PE Awards 0.0 207 -5.5 512 5.5
26/01/2017 Rectify contra - entry. 0.0 207 -11.0 512 11.0
26/01/2017 transfer to Finance as per BMC 0.0 207 -6.7 217 6.7
1/02/2017 6 months wages- short-term contracts/GDPs
208 0.9 0.0 0.0
1/02/2017 purchase Secretary's vehicle 232 0.2 0.0 0.0
2/02/2017 Transfer to correct 2017 Budget errors
234 28.5 0.0 0.0
6/02/2017 TFF 0.0 207 -37.5 235 37.5
6/02/2017 CSTB & Public Enterprise 0.0 208 -3.0 257 3.0
9/02/2017 To Cater for NES staff unbudgeted PE
0.0 203 -1.0 207 1.0
10/02/2017 purchase support vehicle for Secretary
232 0.0 0.0 0.0
13/02/2017 Transfer to settle OS Security Bills.
252 1.0 0.0 0.0
13/02/2017 Freda Mine LO Meeting - Hon. Mirisim req
0.0 207 -0.4 208 0.4
13/02/2017 Rectify budget error 228 12.7 0.0 0.0
14/02/2017 To pay o/s overtime for Sec Per & Staff
0.0 202 -1.0 207 1.0
20/02/2017 Transfer from TESAS vote to Overseas Sch
236 1.0 0.0 0.0
23/02/2017 To cater for travel expense 228 0.1 0.0 0.0
23/02/2017 To cater for Rec leave fares 205 0.1 0.0 0.0
24/02/2017 To offset SA funds as direct by Secretary
0.0 0.0 0.0
2/03/2017 Trfer to NCOBA - Minister's Support Fund
0.0 205 -0.3 207 0.3
2/03/2017 from Dofa to Foreign vote in 207 0.0 207 -27.1 217 27.1
10/03/2017 Apec Preparations 0.0 203 -50.0 207 50.0
13/03/2017 Transfer funds to go directly to POMGEN
0.0 207 -24.8 241 24.8
14/03/2017 To cover for wages for casuals/contr off
255 0.1 0.0 0.0
16/03/2017 SA Doc file name 00283129 refer to 10049
206 5.0 0.0 0.0
16/03/2017 Contra Entry to Doc 00284351 206 5.0 0.0 0.0
16/03/2017 Transfer TFF funds to Division 207 Finan
0.0 207 -187.5 235 187.5
16/03/2017 To cater for COI Land purchase by Defenc
0.0 203 -1.5 207 1.5
27/03/2017 Correction to Section 3 mvnt SA #2649
0.0 584 -2.0 585 2.0
30/03/2017 to support the work of internal APECTeam
0.0 207 -0.5 208 0.5
4/04/2017 Disaster Office -DPLLG 0.0 207 -1.2 232 1.2
4/04/2017 Retrenchment - DPM 2017 0.0 207 -5.0 220 5.0
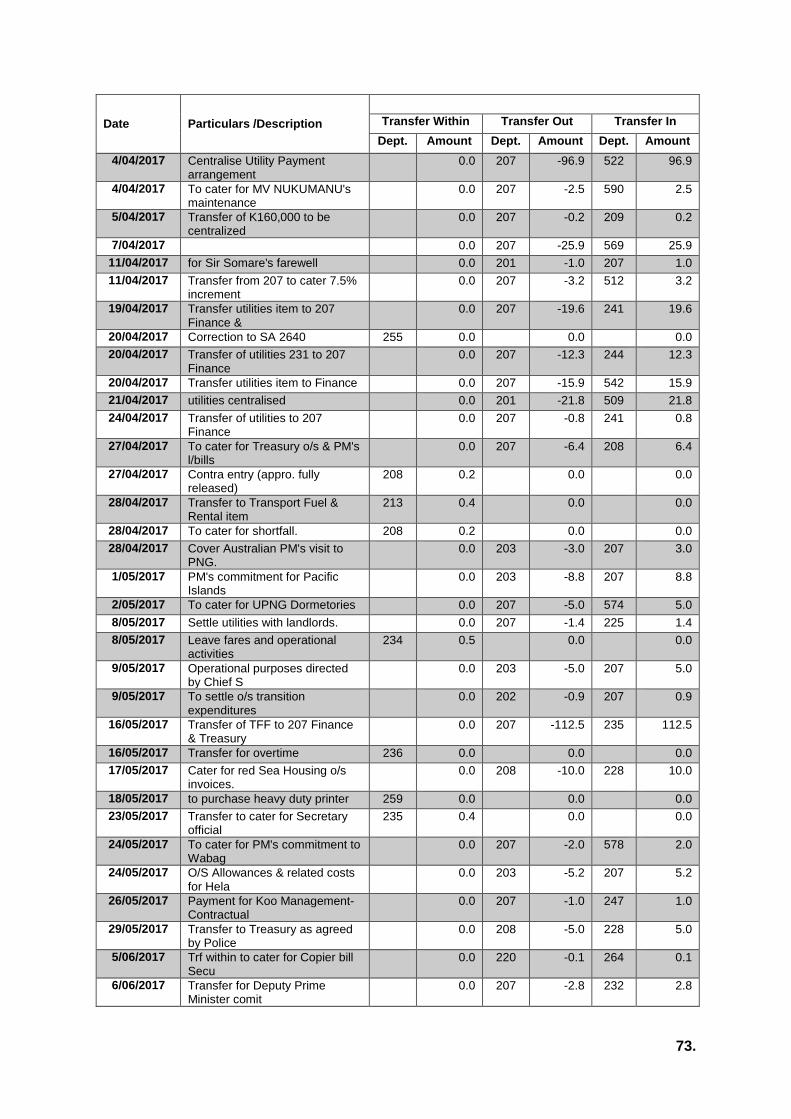
73.
Date Particulars /Description
Transfer Within Transfer Out Transfer In
Dept. Amount Dept. Amount Dept. Amount
4/04/2017 Centralise Utility Payment arrangement
0.0 207 -96.9 522 96.9
4/04/2017 To cater for MV NUKUMANU's maintenance
0.0 207 -2.5 590 2.5
5/04/2017 Transfer of K160,000 to be centralized
0.0 207 -0.2 209 0.2
7/04/2017 0.0 207 -25.9 569 25.9
11/04/2017 for Sir Somare's farewell 0.0 201 -1.0 207 1.0
11/04/2017 Transfer from 207 to cater 7.5% increment
0.0 207 -3.2 512 3.2
19/04/2017 Transfer utilities item to 207 Finance &
0.0 207 -19.6 241 19.6
20/04/2017 Correction to SA 2640 255 0.0 0.0 0.0
20/04/2017 Transfer of utilities 231 to 207 Finance
0.0 207 -12.3 244 12.3
20/04/2017 Transfer utilities item to Finance 0.0 207 -15.9 542 15.9
21/04/2017 utilities centralised 0.0 201 -21.8 509 21.8
24/04/2017 Transfer of utilities to 207 Finance
0.0 207 -0.8 241 0.8
27/04/2017 To cater for Treasury o/s & PM's l/bills
0.0 207 -6.4 208 6.4
27/04/2017 Contra entry (appro. fully released)
208 0.2 0.0 0.0
28/04/2017 Transfer to Transport Fuel & Rental item
213 0.4 0.0 0.0
28/04/2017 To cater for shortfall. 208 0.2 0.0 0.0
28/04/2017 Cover Australian PM's visit to PNG.
0.0 203 -3.0 207 3.0
1/05/2017 PM's commitment for Pacific Islands
0.0 203 -8.8 207 8.8
2/05/2017 To cater for UPNG Dormetories 0.0 207 -5.0 574 5.0
8/05/2017 Settle utilities with landlords. 0.0 207 -1.4 225 1.4
8/05/2017 Leave fares and operational activities
234 0.5 0.0 0.0
9/05/2017 Operational purposes directed by Chief S
0.0 203 -5.0 207 5.0
9/05/2017 To settle o/s transition expenditures
0.0 202 -0.9 207 0.9
16/05/2017 Transfer of TFF to 207 Finance & Treasury
0.0 207 -112.5 235 112.5
16/05/2017 Transfer for overtime 236 0.0 0.0 0.0
17/05/2017 Cater for red Sea Housing o/s invoices.
0.0 208 -10.0 228 10.0
18/05/2017 to purchase heavy duty printer 259 0.0 0.0 0.0
23/05/2017 Transfer to cater for Secretary official
235 0.4 0.0 0.0
24/05/2017 To cater for PM's commitment to Wabag
0.0 207 -2.0 578 2.0
24/05/2017 O/S Allowances & related costs for Hela
0.0 203 -5.2 207 5.2
26/05/2017 Payment for Koo Management-Contractual
0.0 207 -1.0 247 1.0
29/05/2017 Transfer to Treasury as agreed by Police
0.0 208 -5.0 228 5.0
5/06/2017 Trf within to cater for Copier bill Secu
0.0 220 -0.1 264 0.1
6/06/2017 Transfer for Deputy Prime Minister comit
0.0 207 -2.8 232 2.8
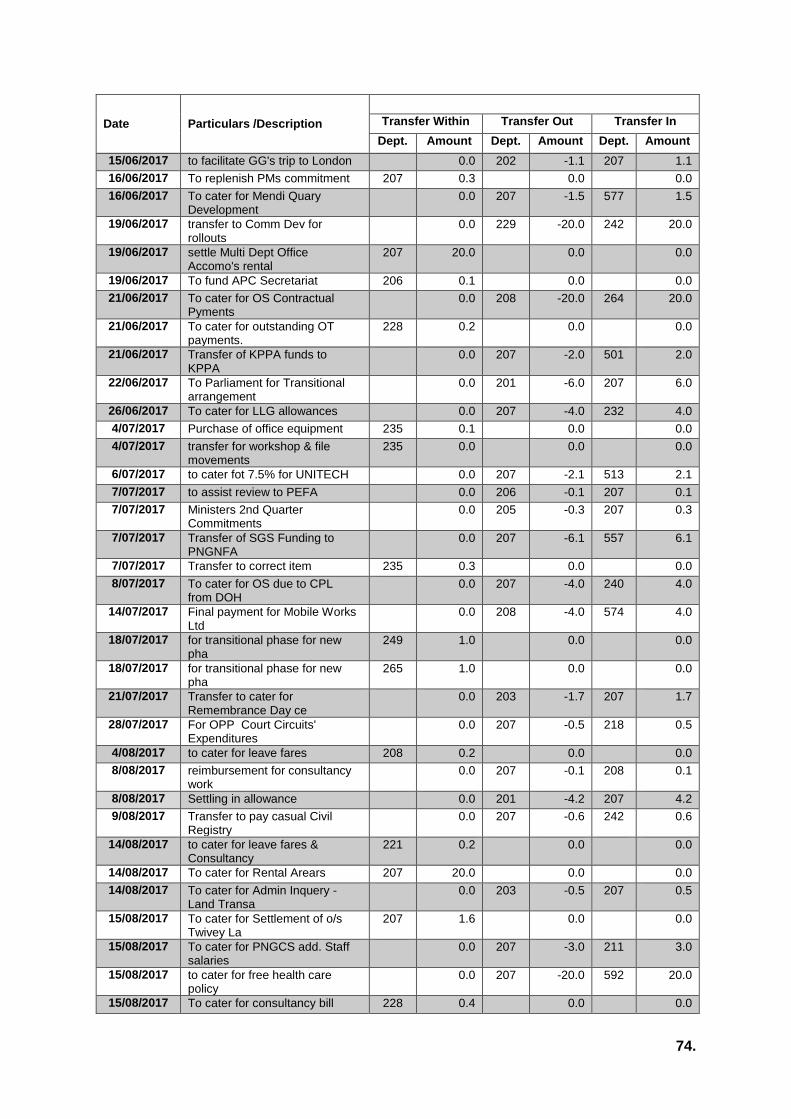
74.
Date Particulars /Description
Transfer Within Transfer Out Transfer In
Dept. Amount Dept. Amount Dept. Amount
15/06/2017 to facilitate GG's trip to London 0.0 202 -1.1 207 1.1
16/06/2017 To replenish PMs commitment 207 0.3 0.0 0.0
16/06/2017 To cater for Mendi Quary Development
0.0 207 -1.5 577 1.5
19/06/2017 transfer to Comm Dev for rollouts
0.0 229 -20.0 242 20.0
19/06/2017 settle Multi Dept Office Accomo's rental
207 20.0 0.0 0.0
19/06/2017 To fund APC Secretariat 206 0.1 0.0 0.0
21/06/2017 To cater for OS Contractual Pyments
0.0 208 -20.0 264 20.0
21/06/2017 To cater for outstanding OT payments.
228 0.2 0.0 0.0
21/06/2017 Transfer of KPPA funds to KPPA
0.0 207 -2.0 501 2.0
22/06/2017 To Parliament for Transitional arrangement
0.0 201 -6.0 207 6.0
26/06/2017 To cater for LLG allowances 0.0 207 -4.0 232 4.0
4/07/2017 Purchase of office equipment 235 0.1 0.0 0.0
4/07/2017 transfer for workshop & file movements
235 0.0 0.0 0.0
6/07/2017 to cater fot 7.5% for UNITECH 0.0 207 -2.1 513 2.1
7/07/2017 to assist review to PEFA 0.0 206 -0.1 207 0.1
7/07/2017 Ministers 2nd Quarter Commitments
0.0 205 -0.3 207 0.3
7/07/2017 Transfer of SGS Funding to PNGNFA
0.0 207 -6.1 557 6.1
7/07/2017 Transfer to correct item 235 0.3 0.0 0.0
8/07/2017 To cater for OS due to CPL from DOH
0.0 207 -4.0 240 4.0
14/07/2017 Final payment for Mobile Works Ltd
0.0 208 -4.0 574 4.0
18/07/2017 for transitional phase for new pha
249 1.0 0.0 0.0
18/07/2017 for transitional phase for new pha
265 1.0 0.0 0.0
21/07/2017 Transfer to cater for Remembrance Day ce
0.0 203 -1.7 207 1.7
28/07/2017 For OPP Court Circuits' Expenditures
0.0 207 -0.5 218 0.5
4/08/2017 to cater for leave fares 208 0.2 0.0 0.0
8/08/2017 reimbursement for consultancy work
0.0 207 -0.1 208 0.1
8/08/2017 Settling in allowance 0.0 201 -4.2 207 4.2
9/08/2017 Transfer to pay casual Civil Registry
0.0 207 -0.6 242 0.6
14/08/2017 to cater for leave fares & Consultancy
221 0.2 0.0 0.0
14/08/2017 To cater for Rental Arears 207 20.0 0.0 0.0
14/08/2017 To cater for Admin Inquery - Land Transa
0.0 203 -0.5 207 0.5
15/08/2017 To cater for Settlement of o/s Twivey La
207 1.6 0.0 0.0
15/08/2017 To cater for PNGCS add. Staff salaries
0.0 207 -3.0 211 3.0
15/08/2017 to cater for free health care policy
0.0 207 -20.0 592 20.0
15/08/2017 To cater for consultancy bill 228 0.4 0.0 0.0

75.
Date Particulars /Description
Transfer Within Transfer Out Transfer In
Dept. Amount Dept. Amount Dept. Amount
22/08/2017 Donation for Hanuabada fire appeal
0.0 207 -0.1 208 0.1
24/08/2017 Transfer to 207 Treasury & Fin for TFF
0.0 207 -152.0 235 152.0
24/08/2017 TRF TO DPM FOR RETRENCHMENT PROGRAM
0.0 207 -4.0 220 4.0
24/08/2017 Leave fares for staffs 206 0.1 0.0 0.0
24/08/2017 To cater for shortfall in appropriation.
507 0.5 0.0 0.0
25/08/2017 To cater for funeral expenses 228 0.1 0.0 0.0
25/08/2017 To cater for outstanding liabilities
226 3.6 0.0 0.0
28/08/2017 Transfer to Leave Fares within for short
213 0.2 0.0 0.0
29/08/2017 To cater for NHC Operational costs
0.0 207 -0.5 541 0.5
29/08/2017 To cater for OT & TA 208 0.0 0.0 0.0
30/08/2017 To settle consultancy fees for Mr Kchand
0.0 207 -0.1 208 0.1
30/08/2017 Contra entry 226 0.5 0.0 0.0
1/09/2017 To cater for outstanding claims 225 0.0 0.0 0.0
4/09/2017 Transfer to NCC to cater for festival
0.0 207 -0.1 542 0.1
4/09/2017 Transfer to Urbanisation for leave fares
0.0 207 -0.1 246 0.1
4/09/2017 To support Defence core activities
234 5.4 0.0 0.0
4/09/2017 To cater for shortfall in ops cost. 0.0 206 -0.2 207 0.2
4/09/2017 To cater for s/fall in salaries. Nat Par
0.0 201 -7.5 207 7.5
4/09/2017 To cater for s/fall in wages & other ops
255 1.2 0.0 0.0
4/09/2017 To cater for wages for staff wages.
257 0.5 0.0 0.0
5/09/2017 259 0.1 0.0 0.0
5/09/2017 to cater for coffee berry borer 0.0 207 -2.0 229 2.0
5/09/2017 Transfer to UOG to cater for text books
0.0 207 -1.0 514 1.0
8/09/2017 Police Minister's office refurbishment.
228 0.1 0.0 0.0
11/09/2017 Contra-entry to reverse SA Doc. 2773,
206 0.1 0.0 0.0
14/09/2017 0.0 203 -2.0 207 2.0
14/09/2017 To cater for Multi-office rental. 207 20.0 0.0 0.0
14/09/2017 For Asender Cosnult'y service agreement.
0.0 207 -0.2 220 0.2
15/09/2017 To cover DoF Sec. Delegation o-seas tri
0.0 207 -0.4 217 0.4
15/09/2017 To cater for overseas and overtime.
208 1.8 0.0 0.0
19/09/2017 To cater for shortfall in critical items
245 0.5 0.0 0.0
22/09/2017 To cater for Leave fares for FRCD.
206 0.1 0.0 0.0
22/09/2017 To cater for ICT Contract agreement.
0.0 207 -3.0 208 3.0
25/09/2017 To cater for exhausted economic item
0.0 207 -0.3 267 0.3
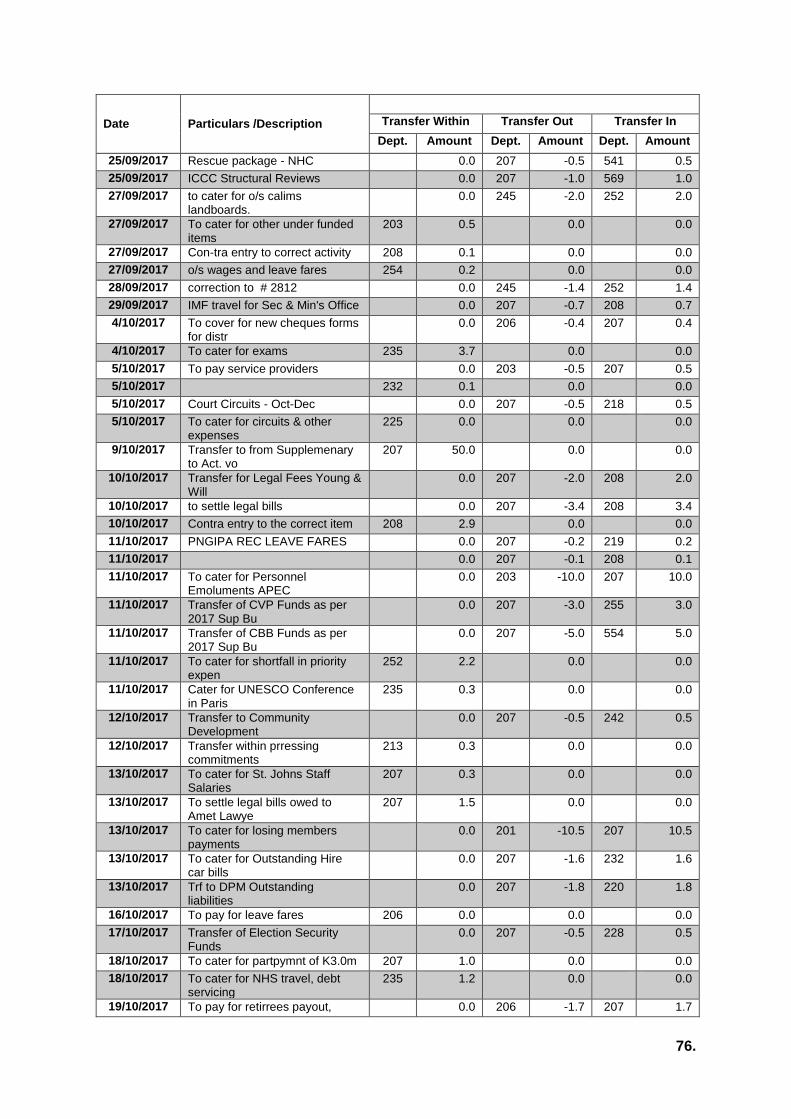
76.
Date Particulars /Description
Transfer Within Transfer Out Transfer In
Dept. Amount Dept. Amount Dept. Amount
25/09/2017 Rescue package - NHC 0.0 207 -0.5 541 0.5
25/09/2017 ICCC Structural Reviews 0.0 207 -1.0 569 1.0
27/09/2017 to cater for o/s calims landboards.
0.0 245 -2.0 252 2.0
27/09/2017 To cater for other under funded items
203 0.5 0.0 0.0
27/09/2017 Con-tra entry to correct activity 208 0.1 0.0 0.0
27/09/2017 o/s wages and leave fares 254 0.2 0.0 0.0
28/09/2017 correction to # 2812 0.0 245 -1.4 252 1.4
29/09/2017 IMF travel for Sec & Min's Office 0.0 207 -0.7 208 0.7
4/10/2017 To cover for new cheques forms for distr
0.0 206 -0.4 207 0.4
4/10/2017 To cater for exams 235 3.7 0.0 0.0
5/10/2017 To pay service providers 0.0 203 -0.5 207 0.5
5/10/2017 232 0.1 0.0 0.0
5/10/2017 Court Circuits - Oct-Dec 0.0 207 -0.5 218 0.5
5/10/2017 To cater for circuits & other expenses
225 0.0 0.0 0.0
9/10/2017 Transfer to from Supplemenary to Act. vo
207 50.0 0.0 0.0
10/10/2017 Transfer for Legal Fees Young & Will
0.0 207 -2.0 208 2.0
10/10/2017 to settle legal bills 0.0 207 -3.4 208 3.4
10/10/2017 Contra entry to the correct item 208 2.9 0.0 0.0
11/10/2017 PNGIPA REC LEAVE FARES 0.0 207 -0.2 219 0.2
11/10/2017 0.0 207 -0.1 208 0.1
11/10/2017 To cater for Personnel Emoluments APEC
0.0 203 -10.0 207 10.0
11/10/2017 Transfer of CVP Funds as per 2017 Sup Bu
0.0 207 -3.0 255 3.0
11/10/2017 Transfer of CBB Funds as per 2017 Sup Bu
0.0 207 -5.0 554 5.0
11/10/2017 To cater for shortfall in priority expen
252 2.2 0.0 0.0
11/10/2017 Cater for UNESCO Conference in Paris
235 0.3 0.0 0.0
12/10/2017 Transfer to Community Development
0.0 207 -0.5 242 0.5
12/10/2017 Transfer within prressing commitments
213 0.3 0.0 0.0
13/10/2017 To cater for St. Johns Staff Salaries
207 0.3 0.0 0.0
13/10/2017 To settle legal bills owed to Amet Lawye
207 1.5 0.0 0.0
13/10/2017 To cater for losing members payments
0.0 201 -10.5 207 10.5
13/10/2017 To cater for Outstanding Hire car bills
0.0 207 -1.6 232 1.6
13/10/2017 Trf to DPM Outstanding liabilities
0.0 207 -1.8 220 1.8
16/10/2017 To pay for leave fares 206 0.0 0.0 0.0
17/10/2017 Transfer of Election Security Funds
0.0 207 -0.5 228 0.5
18/10/2017 To cater for partpymnt of K3.0m 207 1.0 0.0 0.0
18/10/2017 To cater for NHS travel, debt servicing
235 1.2 0.0 0.0
19/10/2017 To pay for retirrees payout, 0.0 206 -1.7 207 1.7

77.
Date Particulars /Description
Transfer Within Transfer Out Transfer In
Dept. Amount Dept. Amount Dept. Amount
19/10/2017 For Refurbishment of office (Vulupindi)
0.0 206 -3.0 207 3.0
19/10/2017 For leave fares 206 0.4 0.0 0.0
20/10/2017 235 0.4 0.0 0.0
20/10/2017 235 4.0 0.0 0.0
23/10/2017 To cater for NHS travel, debt servicing
235 1.3 0.0 0.0
23/10/2017 To cater for NHS travel, debt servicing
235 1.0 0.0 0.0
24/10/2017 235 0.3 0.0 0.0
24/10/2017 to assist ministrial support 0.0 207 -0.1 236 0.1
31/10/2017 To replenish item utilized by CSD
208 0.0 0.0 0.0
31/10/2017 To cater for shortfalls 0.0 207 -0.3 209 0.3
31/10/2017 contra entry 235 4.0 0.0 0.0
1/11/2017 to cater for purchase of new ambulance
0.0 207 -0.2 253 0.2
1/11/2017 to cater for 7th PNG Games 0.0 207 -3.0 516 3.0
1/11/2017 To cater for new Ministers operations
0.0 207 -0.6 565 0.6
1/11/2017 To offset adjustemnt done for Sup Budget
0.0 207 -41.0 208 41.0
2/11/2017 To cover APEC operations. 0.0 203 -35.0 207 35.0
2/11/2017 to cater for medical supplies 0.0 207 -100.0 241 100.0
8/11/2017 To cater for leave fares 236 0.1 0.0 0.0
8/11/2017 Transfer of Maintenance Funds Sup Budget
0.0 207 -51.2 264 51.2
8/11/2017 Transfer of LAGIS funds to Lands Sup Bud
0.0 207 -1.8 252 1.8
8/11/2017 Transfer to cater for Bud BK Printing
0.0 207 -0.2 208 0.2
8/11/2017 To settle Lama Rent A Car Mendi Callout
0.0 207 -2.0 208 2.0
9/11/2017 To purchase Secretary's Official Vehicle
0.0 207 -0.2 254 0.2
9/11/2017 additional to SA#2877 207 0.1 0.0 0.0
10/11/2017 Correction to SA#2878 0.0 207 -0.1 208 0.1
13/11/2017 Part pymny for Red Sea Housing
0.0 207 -2.0 208 2.0
13/11/2017 To cater for rental for resident 0.0 207 -0.1 254 0.1
13/11/2017 to cater for other operations 259 0.2 0.0 0.0
15/11/2017 Transfer to WNB admin account for PNG Ga
0.0 207 -0.8 589 0.8
16/11/2017 Transfer to WNB Admin Acct for PNG games
0.0 207 -0.2 589 0.2
16/11/2017 To cater for Police O/S hire car bills
207 5.0 0.0 0.0
16/11/2017 contra 0.0 207 -0.2 589 0.2
16/11/2017 To cater for PNG games in West New Brita
0.0 207 -0.2 589 0.2
17/11/2017 Trf within for 50 silver jubilee/Awarene
213 0.1 0.0 0.0
20/11/2017 To pay for VH Office fit out 206 3.0 0.0 0.0
21/11/2017 Contra entry, move funds to correct item
206 3.0 0.0 0.0
21/11/2017 Facilitate urgent progrms for Agency 209
0.0 207 -0.2 209 0.2
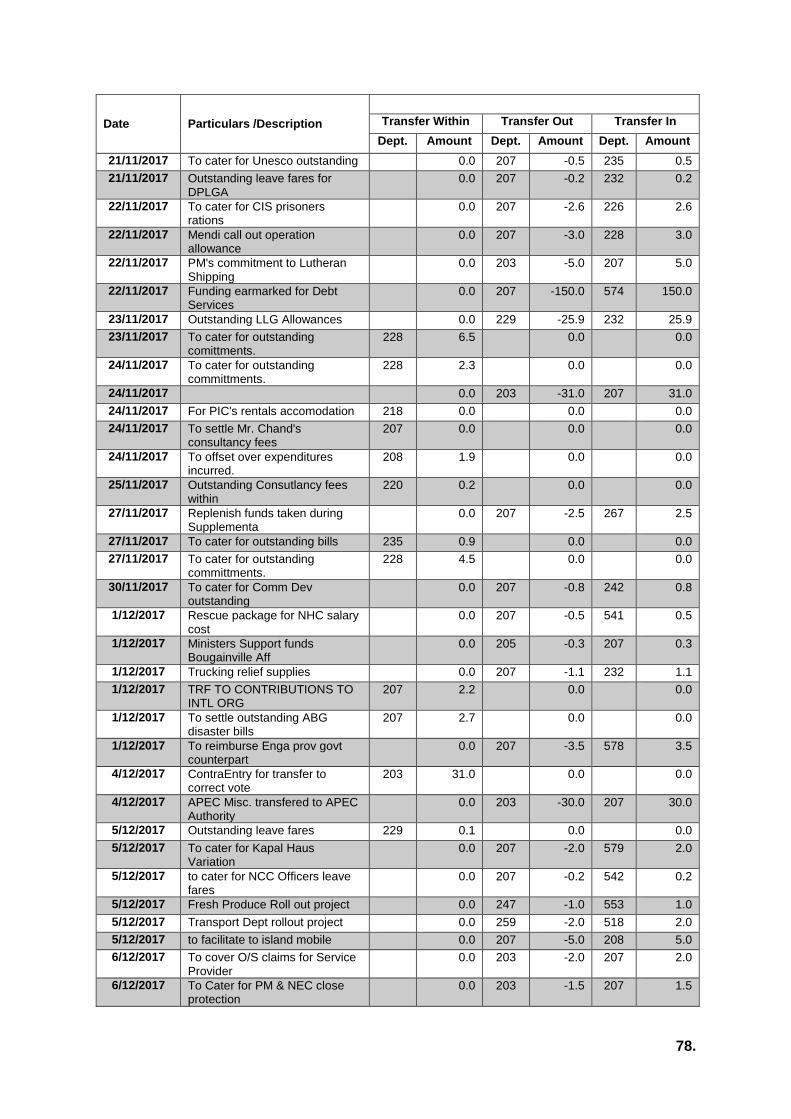
78.
Date Particulars /Description
Transfer Within Transfer Out Transfer In
Dept. Amount Dept. Amount Dept. Amount
21/11/2017 To cater for Unesco outstanding 0.0 207 -0.5 235 0.5
21/11/2017 Outstanding leave fares for DPLGA
0.0 207 -0.2 232 0.2
22/11/2017 To cater for CIS prisoners rations
0.0 207 -2.6 226 2.6
22/11/2017 Mendi call out operation allowance
0.0 207 -3.0 228 3.0
22/11/2017 PM's commitment to Lutheran Shipping
0.0 203 -5.0 207 5.0
22/11/2017 Funding earmarked for Debt Services
0.0 207 -150.0 574 150.0
23/11/2017 Outstanding LLG Allowances 0.0 229 -25.9 232 25.9
23/11/2017 To cater for outstanding comittments.
228 6.5 0.0 0.0
24/11/2017 To cater for outstanding committments.
228 2.3 0.0 0.0
24/11/2017 0.0 203 -31.0 207 31.0
24/11/2017 For PIC's rentals accomodation 218 0.0 0.0 0.0
24/11/2017 To settle Mr. Chand's consultancy fees
207 0.0 0.0 0.0
24/11/2017 To offset over expenditures incurred.
208 1.9 0.0 0.0
25/11/2017 Outstanding Consutlancy fees within
220 0.2 0.0 0.0
27/11/2017 Replenish funds taken during Supplementa
0.0 207 -2.5 267 2.5
27/11/2017 To cater for outstanding bills 235 0.9 0.0 0.0
27/11/2017 To cater for outstanding committments.
228 4.5 0.0 0.0
30/11/2017 To cater for Comm Dev outstanding
0.0 207 -0.8 242 0.8
1/12/2017 Rescue package for NHC salary cost
0.0 207 -0.5 541 0.5
1/12/2017 Ministers Support funds Bougainville Aff
0.0 205 -0.3 207 0.3
1/12/2017 Trucking relief supplies 0.0 207 -1.1 232 1.1
1/12/2017 TRF TO CONTRIBUTIONS TO INTL ORG
207 2.2 0.0 0.0
1/12/2017 To settle outstanding ABG disaster bills
207 2.7 0.0 0.0
1/12/2017 To reimburse Enga prov govt counterpart
0.0 207 -3.5 578 3.5
4/12/2017 ContraEntry for transfer to correct vote
203 31.0 0.0 0.0
4/12/2017 APEC Misc. transfered to APEC Authority
0.0 203 -30.0 207 30.0
5/12/2017 Outstanding leave fares 229 0.1 0.0 0.0
5/12/2017 To cater for Kapal Haus Variation
0.0 207 -2.0 579 2.0
5/12/2017 to cater for NCC Officers leave fares
0.0 207 -0.2 542 0.2
5/12/2017 Fresh Produce Roll out project 0.0 247 -1.0 553 1.0
5/12/2017 Transport Dept rollout project 0.0 259 -2.0 518 2.0
5/12/2017 to facilitate to island mobile 0.0 207 -5.0 208 5.0
6/12/2017 To cover O/S claims for Service Provider
0.0 203 -2.0 207 2.0
6/12/2017 To Cater for PM & NEC close protection
0.0 203 -1.5 207 1.5
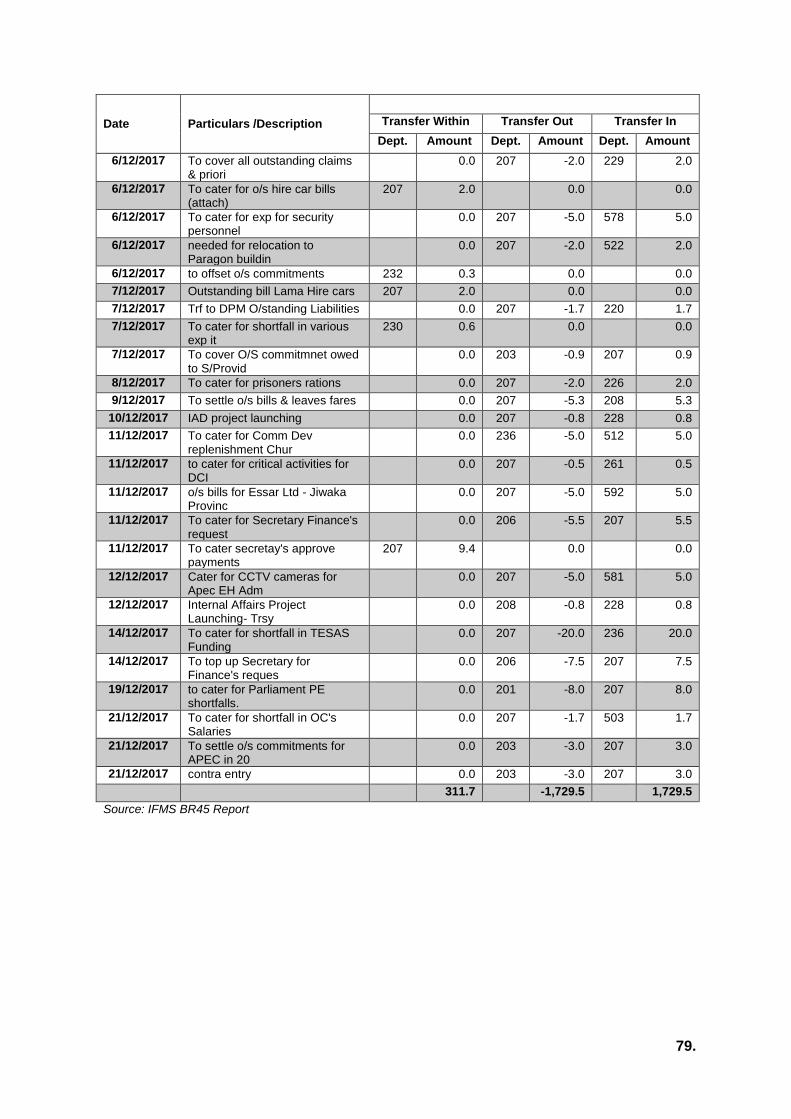
79.
Date Particulars /Description
Transfer Within Transfer Out Transfer In
Dept. Amount Dept. Amount Dept. Amount
6/12/2017 To cover all outstanding claims & priori
0.0 207 -2.0 229 2.0
6/12/2017 To cater for o/s hire car bills (attach)
207 2.0 0.0 0.0
6/12/2017 To cater for exp for security personnel
0.0 207 -5.0 578 5.0
6/12/2017 needed for relocation to Paragon buildin
0.0 207 -2.0 522 2.0
6/12/2017 to offset o/s commitments 232 0.3 0.0 0.0
7/12/2017 Outstanding bill Lama Hire cars 207 2.0 0.0 0.0
7/12/2017 Trf to DPM O/standing Liabilities 0.0 207 -1.7 220 1.7
7/12/2017 To cater for shortfall in various exp it
230 0.6 0.0 0.0
7/12/2017 To cover O/S commitmnet owed to S/Provid
0.0 203 -0.9 207 0.9
8/12/2017 To cater for prisoners rations 0.0 207 -2.0 226 2.0
9/12/2017 To settle o/s bills & leaves fares 0.0 207 -5.3 208 5.3
10/12/2017 IAD project launching 0.0 207 -0.8 228 0.8
11/12/2017 To cater for Comm Dev replenishment Chur
0.0 236 -5.0 512 5.0
11/12/2017 to cater for critical activities for DCI
0.0 207 -0.5 261 0.5
11/12/2017 o/s bills for Essar Ltd - Jiwaka Provinc
0.0 207 -5.0 592 5.0
11/12/2017 To cater for Secretary Finance's request
0.0 206 -5.5 207 5.5
11/12/2017 To cater secretay's approve payments
207 9.4 0.0 0.0
12/12/2017 Cater for CCTV cameras for Apec EH Adm
0.0 207 -5.0 581 5.0
12/12/2017 Internal Affairs Project Launching- Trsy
0.0 208 -0.8 228 0.8
14/12/2017 To cater for shortfall in TESAS Funding
0.0 207 -20.0 236 20.0
14/12/2017 To top up Secretary for Finance's reques
0.0 206 -7.5 207 7.5
19/12/2017 to cater for Parliament PE shortfalls.
0.0 201 -8.0 207 8.0
21/12/2017 To cater for shortfall in OC's Salaries
0.0 207 -1.7 503 1.7
21/12/2017 To settle o/s commitments for APEC in 20
0.0 203 -3.0 207 3.0
21/12/2017 contra entry 0.0 203 -3.0 207 3.0
311.7 -1,729.5 1,729.5
Source: IFMS BR45 Report
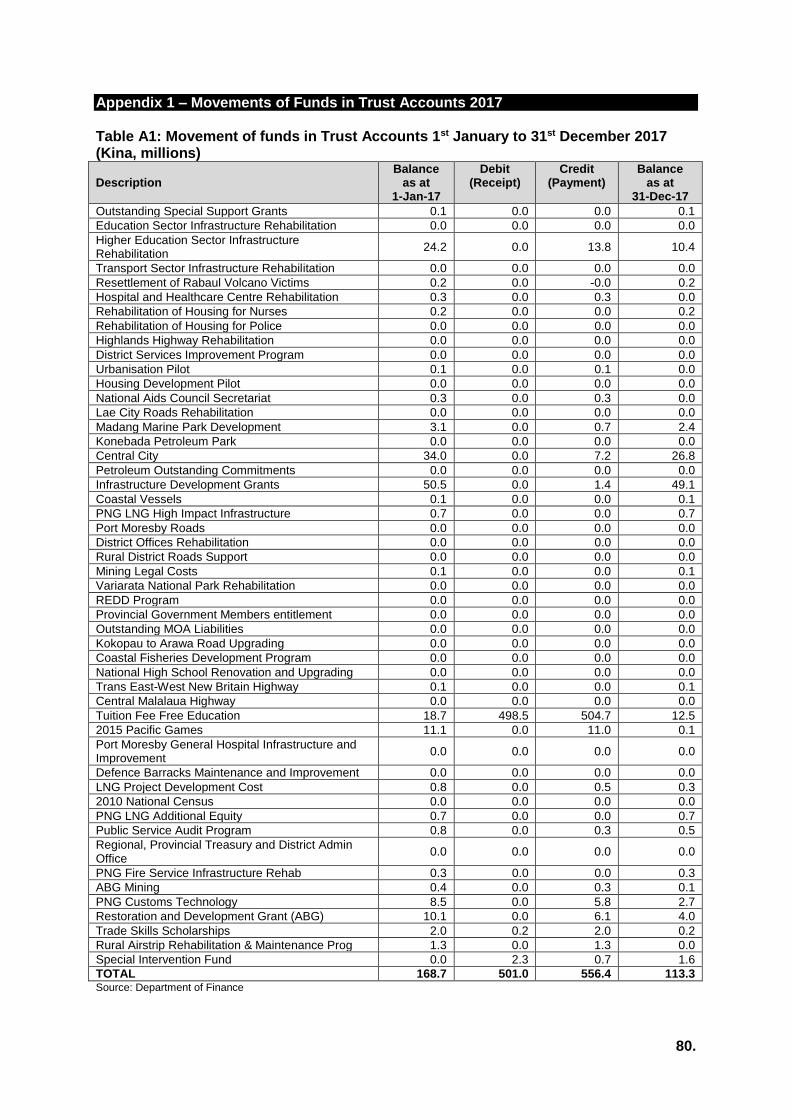
80.
Appendix 1 – Movements of Funds in Trust Accounts 2017 Table A1: Movement of funds in Trust Accounts 1st January to 31st December 2017 (Kina, millions)
Description Balance
as at 1-Jan-17
Debit (Receipt)
Credit (Payment)
Balance as at
31-Dec-17
Outstanding Special Support Grants 0.1 0.0 0.0 0.1
Education Sector Infrastructure Rehabilitation 0.0 0.0 0.0 0.0
Higher Education Sector Infrastructure Rehabilitation
24.2 0.0 13.8 10.4
Transport Sector Infrastructure Rehabilitation 0.0 0.0 0.0 0.0
Resettlement of Rabaul Volcano Victims 0.2 0.0 -0.0 0.2
Hospital and Healthcare Centre Rehabilitation 0.3 0.0 0.3 0.0
Rehabilitation of Housing for Nurses 0.2 0.0 0.0 0.2
Rehabilitation of Housing for Police 0.0 0.0 0.0 0.0
Highlands Highway Rehabilitation 0.0 0.0 0.0 0.0
District Services Improvement Program 0.0 0.0 0.0 0.0
Urbanisation Pilot 0.1 0.0 0.1 0.0
Housing Development Pilot 0.0 0.0 0.0 0.0
National Aids Council Secretariat 0.3 0.0 0.3 0.0
Lae City Roads Rehabilitation 0.0 0.0 0.0 0.0
Madang Marine Park Development 3.1 0.0 0.7 2.4
Konebada Petroleum Park 0.0 0.0 0.0 0.0
Central City 34.0 0.0 7.2 26.8
Petroleum Outstanding Commitments 0.0 0.0 0.0 0.0
Infrastructure Development Grants 50.5 0.0 1.4 49.1
Coastal Vessels 0.1 0.0 0.0 0.1
PNG LNG High Impact Infrastructure 0.7 0.0 0.0 0.7
Port Moresby Roads 0.0 0.0 0.0 0.0
District Offices Rehabilitation 0.0 0.0 0.0 0.0
Rural District Roads Support 0.0 0.0 0.0 0.0
Mining Legal Costs 0.1 0.0 0.0 0.1
Variarata National Park Rehabilitation 0.0 0.0 0.0 0.0
REDD Program 0.0 0.0 0.0 0.0
Provincial Government Members entitlement 0.0 0.0 0.0 0.0
Outstanding MOA Liabilities 0.0 0.0 0.0 0.0
Kokopau to Arawa Road Upgrading 0.0 0.0 0.0 0.0
Coastal Fisheries Development Program 0.0 0.0 0.0 0.0
National High School Renovation and Upgrading 0.0 0.0 0.0 0.0
Trans East-West New Britain Highway 0.1 0.0 0.0 0.1
Central Malalaua Highway 0.0 0.0 0.0 0.0
Tuition Fee Free Education 18.7 498.5 504.7 12.5
2015 Pacific Games 11.1 0.0 11.0 0.1
Port Moresby General Hospital Infrastructure and Improvement
0.0 0.0 0.0 0.0
Defence Barracks Maintenance and Improvement 0.0 0.0 0.0 0.0
LNG Project Development Cost 0.8 0.0 0.5 0.3
2010 National Census 0.0 0.0 0.0 0.0
PNG LNG Additional Equity 0.7 0.0 0.0 0.7
Public Service Audit Program 0.8 0.0 0.3 0.5
Regional, Provincial Treasury and District Admin Office
0.0 0.0 0.0 0.0
PNG Fire Service Infrastructure Rehab 0.3 0.0 0.0 0.3
ABG Mining 0.4 0.0 0.3 0.1
PNG Customs Technology 8.5 0.0 5.8 2.7
Restoration and Development Grant (ABG) 10.1 0.0 6.1 4.0
Trade Skills Scholarships 2.0 0.2 2.0 0.2
Rural Airstrip Rehabilitation & Maintenance Prog 1.3 0.0 1.3 0.0
Special Intervention Fund 0.0 2.3 0.7 1.6
TOTAL 168.7 501.0 556.4 113.3 Source: Department of Finance

81.
Appendix 2 – Movements of Funds for DSIP Trust Accounts Table A2 below shows the movements of funds for each of the 89 DSIP subsidiary Trust Accounts
Table A2: Movement of funds in DSIP Trust Accounts 1st January to 31st December, 2017 (Kina, millions)
District Balance as
at 1-Jan-17
DSIP Debits
(Receipts)
Non DSIP
Deposits
Credits
(Payments)
Balance as at
31-Dec -2017
Abau 0 0 0 0 0
Goilala 0 0 0 0 0
Kairuku Hiri 0 0 0 0 0
Rigo 0 0 0 0 0
Gazelle 0 0 0 0 0
Kokopo 0 0 0 0 0
Pomio 0 0 0 0 0
Rabaul 0 0 0 0 0
Ambunti-Drekikir 0 0 0 0 0
Angoram 0 0 0 0 0
Maprik 0 0 0 0 0
Wewak 0 0 0 0 0
Wosera-Gawi 0 0 0 0 0
Yangogoru-Saussia 0 0 0 0 0
Daulo 0 0 0 0 0
Goroka 0 0 0 0 0
Henganofi 0 0 0 0 0
Kainantu 0 0 0 0 0
Lufa 0 0 0 0 0
Obura-Wanenara 0 0 0 0 0
Okapa 0 0 0 0 0
Unggai-Bena 0 0 0 0 0
Kandep 0 0 0 0 0
Kompiam-Ambun 0 0 0 0 0
Lagaip-Porgera 0 0 0 0 0
Wabag 0 0 0 0 0
Wapenamanda 0 0 0 0 0
Kerema 0 0 0 0 0
Kikori 0 0 0 0 0
Bogia 0 0 0 0 0
Madang 0 0 0 0 0
Middle Ramu 0 0 0 0 0
Raikos 0 0 0 0 0
Sumkar 0 0 0 0 0
Usino-Bundi 0 0 0 0 0
Manus 0 0 0 0 0
Alotau / Rabaraba 0 0 0 0 0
Esa'ala 0 0 0 0 0
Kiriwina 0 0 0 0 0
Samarai Murua 0 0 0 0 0
Bulolo 0 0 0 0 0
Finschaffen 0 0 0 0 0
Huon Gulf 0 0 0 0 0
Kabwum 0 0 0 0 0
Lae 0 0 0 0 0
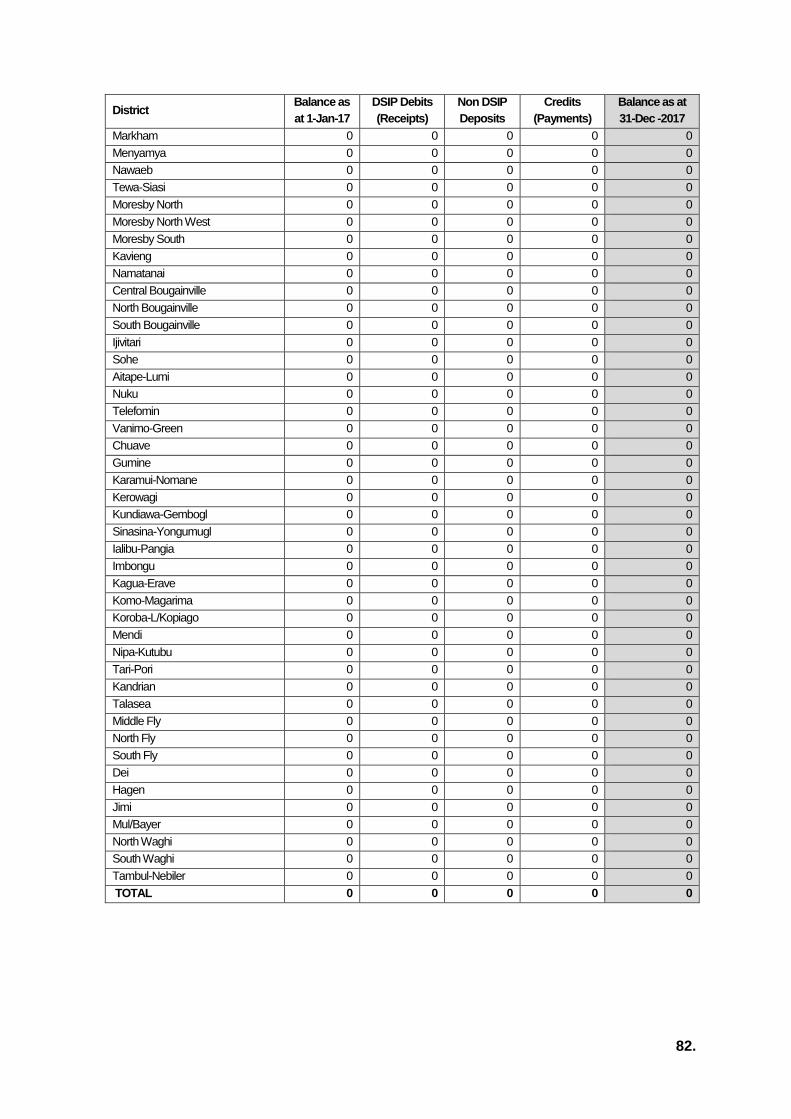
82.
District Balance as
at 1-Jan-17
DSIP Debits
(Receipts)
Non DSIP
Deposits
Credits
(Payments)
Balance as at
31-Dec -2017
Markham 0 0 0 0 0
Menyamya 0 0 0 0 0
Nawaeb 0 0 0 0 0
Tewa-Siasi 0 0 0 0 0
Moresby North 0 0 0 0 0
Moresby North West 0 0 0 0 0
Moresby South 0 0 0 0 0
Kavieng 0 0 0 0 0
Namatanai 0 0 0 0 0
Central Bougainville 0 0 0 0 0
North Bougainville 0 0 0 0 0
South Bougainville 0 0 0 0 0
Ijivitari 0 0 0 0 0
Sohe 0 0 0 0 0
Aitape-Lumi 0 0 0 0 0
Nuku 0 0 0 0 0
Telefomin 0 0 0 0 0
Vanimo-Green 0 0 0 0 0
Chuave 0 0 0 0 0
Gumine 0 0 0 0 0
Karamui-Nomane 0 0 0 0 0
Kerowagi 0 0 0 0 0
Kundiawa-Gembogl 0 0 0 0 0
Sinasina-Yongumugl 0 0 0 0 0
Ialibu-Pangia 0 0 0 0 0
Imbongu 0 0 0 0 0
Kagua-Erave 0 0 0 0 0
Komo-Magarima 0 0 0 0 0
Koroba-L/Kopiago 0 0 0 0 0
Mendi 0 0 0 0 0
Nipa-Kutubu 0 0 0 0 0
Tari-Pori 0 0 0 0 0
Kandrian 0 0 0 0 0
Talasea 0 0 0 0 0
Middle Fly 0 0 0 0 0
North Fly 0 0 0 0 0
South Fly 0 0 0 0 0
Dei 0 0 0 0 0
Hagen 0 0 0 0 0
Jimi 0 0 0 0 0
Mul/Bayer 0 0 0 0 0
North Waghi 0 0 0 0 0
South Waghi 0 0 0 0 0
Tambul-Nebiler 0 0 0 0 0
TOTAL 0 0 0 0 0

83.