Embed Size (px)
Citation preview
FINAL ACQUISITION REPORT
For the
DALRYMPLE 3D MARINE SEISMIC SURVEY
Conducted by
3D OIL LIMITED
In The Exploration Licence Area
T/41P BASS BASIN
TASMANIA
SURVEY START DATE 29th January 2011 SURVEY COMPLETION DATE 3rd February 2011
Volume 1 Seismic and Navigation QA
Compiled by Drew Murray Ray Doughty
February 2011
The format, scope and content of this report were developed by ENQUEST Pty. Ltd. and, as such, remain the property of that company. No copies of this document shall be made without the explicit written permission of ENQUEST Pty. Ltd.

3D Oil Limited Dalrymple 3D Marine Seismic Survey
Copyright © 2011 Enquest Pty Ltd Volume 1 Page 2 of 44
1 INTRODUCTION ....................................................................................................................... 4
1.1 OBJECTIVES .................................................................................................................... 4
1.2 SURVEY PARAMETERS ................................................................................................... 4
1.3 ACQUISITION PARAMETERS .......................................................................................... 4
1.4 LOCATION MAP ................................................................................................................ 6
1.5 LINE CO-ORDINATES ...................................................................................................... 7
1.6 PROGRAM MAP ............................................................................................................... 8
2 SYNOPSIS ................................................................................................................................ 9
2.1 OVERVIEW ....................................................................................................................... 9
2.2 SURVEY PRODUCTION BY LINE .................................................................................. 10
2.3 SURVEY INFILL PRODUCTION BY LINE ....................................................................... 11
2.4 SURVEY TOTAL ............................................................................................................... 11
2.5 STATISTICAL SUMMARY ................................................................................................ 11
2.6 DAILY AND CUMULATIVE FULL FOLD KILOMETRES .................................................. 12
2.7 ACQUISITION SPEED .................................................................................................... 12
2.8 TECHNICAL SUMMARY ................................................................................................. 13
2.9 SEISMIC SPECIFICATIONS ........................................................................................... 17
2.10 VESSEL ........................................................................................................................... 19
2.11 CREW LIST ..................................................................................................................... 19
2.12 VESSEL SPECIFICATIONS ............................................................................................ 21
2.13 HEALTH SAFETY ENVIRONMENT ................................................................................ 23
2.14 SAFETY SUMMARY ....................................................................................................... 23
2.15 RECOMMENDATIONS & CONCLUSION ....................................................................... 24
3 NAVIGATION ........................................................................................................................... 25
3.1 METHODOLOGY ............................................................................................................ 25
3.2 TIDES CURRENTS AND FEATHER ............................................................................... 25
3.3 SOURCE AND STREAMER GEOMETRY ...................................................................... 25
3.4 ORCA INTEGRATED NAVIGATION SYSTEM ................................................................ 26

3D Oil Limited Dalrymple 3D Marine Seismic Survey
Copyright © 2011 Enquest Pty Ltd Volume 1 Page 3 of 44
3.5 BINNING AND COVERAGE ............................................................................................ 27
3.6 ONBOARD PROCESSING .............................................................................................. 28
3.7 INDEPENDENT PROCESSING ...................................................................................... 28
3.8 PRE-PLOTS. GEODETIC PARAMETERS ...................................................................... 29
3.9 CALIBRATIONS AND VERIFICATIONS .......................................................................... 30
3.10 GLOBAL POSITIONING SYSTEMS ................................................................................ 32
3.11 RELATIVE GPS (RGPS) ................................................................................................. 34
3.12 ECHO SOUNDER ........................................................................................................... 35
3.13 HEADING SENSORS ...................................................................................................... 35
3.14 DIGICOURSE ACOUSTIC SYSTEM ............................................................................... 36
3.15 VELOCITY OF SOUND MEASUREMENT DEVICES ..................................................... 38
3.16 CURRENT METER .......................................................................................................... 38
4 ENVIRONMENT ...................................................................................................................... 39
4.1 WEATHER ....................................................................................................................... 39
4.2 TIDES, CURRENT AND FEATHER ................................................................................. 39
4.3 NAVIGATION HAZARDS ................................................................................................. 39
4.4 ENVIRONMENTAL .......................................................................................................... 39
4.5 CETACEAN REPORTING ............................................................................................... 39
4.6 FISHING .......................................................................................................................... 39
4.7 CORAL REEFS ............................................................................................................... 40
4.8 CONCLUSION ................................................................................................................. 40
5 INSTRUMENT TESTS ............................................................................................................. 40
6 DIARY ...................................................................................................................................... 41
7 PGS GEOPHYSICAL CONVENTIONS AND TERMINOLOGY .............................................. 43
8 LINE AND SHOT POINT NUMBER CONVENTIONS ............................................................. 43
9 DESCRIPTION OF LINE LOG CONTENTS ........................................................................... 43
3D Oil Limited Dalrymple 3D Marine Seismic Survey
Copyright © 2011 Enquest Pty Ltd Volume 1 Page 4 of 44
1 INTRODUCTION
1.1 OBJECTIVES
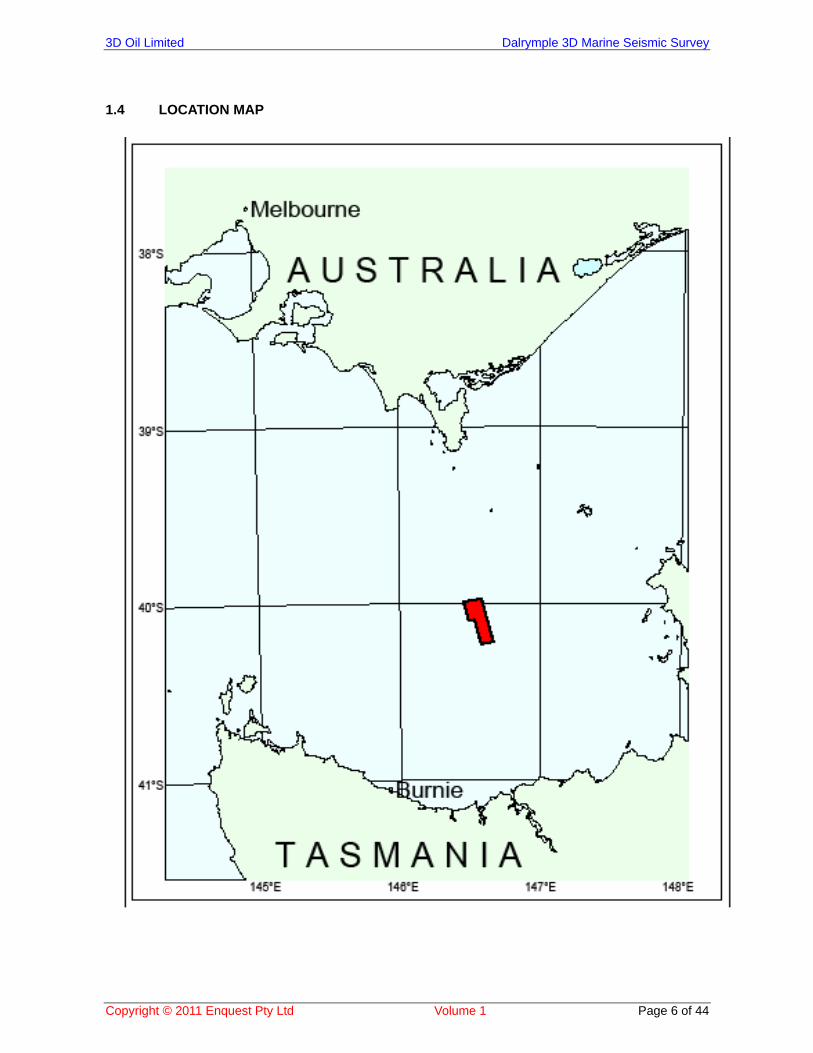
3D Oil Ltd contracted PGS to carry out a high quality 3D seismic survey of some 264 full fold square kilometres over the Dalrymple 3D survey area, in exploration permit area T/41P, Offshore Bass Basin, Tasmania
The seismic survey vessel was the Ramform Sterling manned and operated by PGS.
Seismic operations were supervised by Drew Murray of Enquest.
Navigation positioning operations were supervised by Ray Doughty of Enquest.
Marine Mammal activity was monitored by Fiona Macknight of Enquest
1.2 SURVEY PARAMETERS
The following is a summary of the survey parameters: Survey type 3D Client 3D Oil Pty Ltd Survey name Dalrymple 3D MSS SP interval 18.75m Source 2 x 3090 in³. Bolt 1900 LLXT Streamer Length 12 x 5100 metres Groups 12 x 408 Positioning Primary SkyFix.XP, SDGPS Orbit and Clock corrected Secondary StarFix.HP,DGPS Water depth 65 to 75 metres Number of sail lines 19 Survey surface area 263.78km² Contractor PGS Vessel R/V Ramform Sterling Client Representation Enquest Pty. Limited
1.3 ACQUISITION PARAMETERS
General Survey Details Survey type 3D Marine Seismic acquisition Client 3D Oil LtdCountry / Blocks Australia / Bass Basin Project Name Dalrymple 3D Technique Single vessel, Dual source, multiple streamers Full-fold Programme size 263.78 km2 preplot Line direction 165° / 345° Nominal line change 3.0 hours Number of sail lines 19 (pre plot) Average line length 23.5 km Approximate water depth 75 - 65m charted
3D Oil Limited Dalrymple 3D Marine Seismic Survey
Copyright © 2011 Enquest Pty Ltd Volume 1 Page 5 of 44
Source Source type Bolt 1900 LLXT Shot interval 18.75m flip-flop i.e. 37.5m per source Number Sources 2 Source depth 6m +/- 1.0m Volume 2 x 3090 cu.in Air pressure 2000 psi Source separation 50m Peak-peak 121.5bar m P/b ratio 200100 Gun drop out See Appendix Gunspecs Max timing error +/- 1.5 ms Streamer Streamer type PGS RDH Solid Number of streamers 12 Streamer separation 100m Streamer length 5100m No of groups 12 x 408Group Interval 12.5m Group length 12.5m Streamer depth 7m +/- 1m Near offset 130 m Spacing of birds Every 300 metres (see Streamer Diagrams) Nominal fold 68 Recording Recording type Hydroscience SeaTRAK Mark11 24 Bit Sample rate 2ms Recording length 6.0 seconds Low Cut Filter 4.6 Hz 6 dB/OCTHigh Cut Filter 206 Hz 276 dB/OCT Data format SEGD QC processing Uniseis Media 3592
3D Oil Limited Dalrymple 3D Marine Seismic Survey
Copyright © 2011 Enquest Pty Ltd Volume 1 Page 6 of 44
1.4 LOCATION MAP
3D Oil Limited Dalrymple 3D Marine Seismic Survey
Copyright © 2011 Enquest Pty Ltd Volume 1 Page 7 of 44
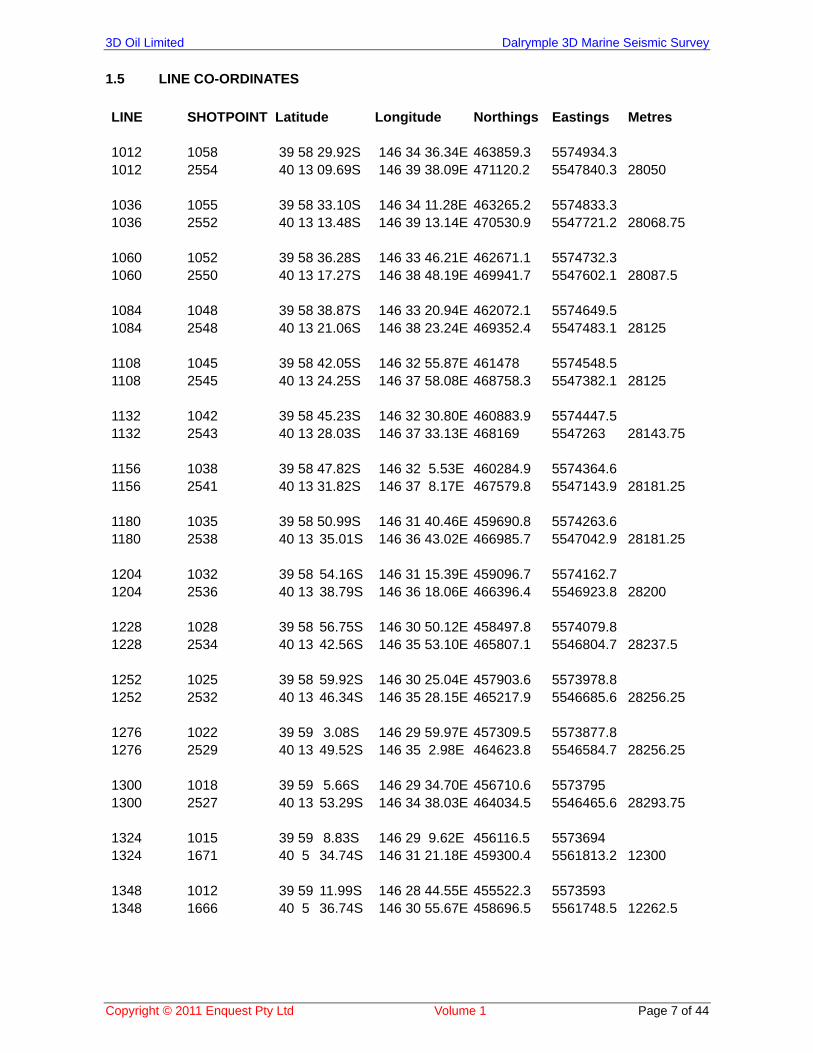
1.5 LINE CO-ORDINATES
LINE SHOTPOINT Latitude Longitude Northings Eastings Metres 1012 1058 39 58 29.92S 146 34 36.34E 463859.3 5574934.3 1012 2554 40 13 09.69S 146 39 38.09E 471120.2 5547840.3 28050 1036 1055 39 58 33.10S 146 34 11.28E 463265.2 5574833.3 1036 2552 40 13 13.48S 146 39 13.14E 470530.9 5547721.2 28068.75 1060 1052 39 58 36.28S 146 33 46.21E 462671.1 5574732.3 1060 2550 40 13 17.27S 146 38 48.19E 469941.7 5547602.1 28087.5 1084 1048 39 58 38.87S 146 33 20.94E 462072.1 5574649.5 1084 2548 40 13 21.06S 146 38 23.24E 469352.4 5547483.1 28125 1108 1045 39 58 42.05S 146 32 55.87E 461478 5574548.5 1108 2545 40 13 24.25S 146 37 58.08E 468758.3 5547382.1 28125 1132 1042 39 58 45.23S 146 32 30.80E 460883.9 5574447.5 1132 2543 40 13 28.03S 146 37 33.13E 468169 5547263 28143.75 1156 1038 39 58 47.82S 146 32 5.53E 460284.9 5574364.6 1156 2541 40 13 31.82S 146 37 8.17E 467579.8 5547143.9 28181.25 1180 1035 39 58 50.99S 146 31 40.46E 459690.8 5574263.6 1180 2538 40 13 35.01S 146 36 43.02E 466985.7 5547042.9 28181.25 1204 1032 39 58 54.16S 146 31 15.39E 459096.7 5574162.7 1204 2536 40 13 38.79S 146 36 18.06E 466396.4 5546923.8 28200 1228 1028 39 58 56.75S 146 30 50.12E 458497.8 5574079.8 1228 2534 40 13 42.56S 146 35 53.10E 465807.1 5546804.7 28237.5 1252 1025 39 58 59.92S 146 30 25.04E 457903.6 5573978.8 1252 2532 40 13 46.34S 146 35 28.15E 465217.9 5546685.6 28256.25 1276 1022 39 59 3.08S 146 29 59.97E 457309.5 5573877.8 1276 2529 40 13 49.52S 146 35 2.98E 464623.8 5546584.7 28256.25 1300 1018 39 59 5.66S 146 29 34.70E 456710.6 5573795 1300 2527 40 13 53.29S 146 34 38.03E 464034.5 5546465.6 28293.75 1324 1015 39 59 8.83S 146 29 9.62E 456116.5 5573694 1324 1671 40 5 34.74S 146 31 21.18E 459300.4 5561813.2 12300 1348 1012 39 59 11.99S 146 28 44.55E 455522.3 5573593 1348 1666 40 5 36.74S 146 30 55.67E 458696.5 5561748.5 12262.5
3D Oil Limited Dalrymple 3D Marine Seismic Survey
Copyright © 2011 Enquest Pty Ltd Volume 1 Page 8 of 44
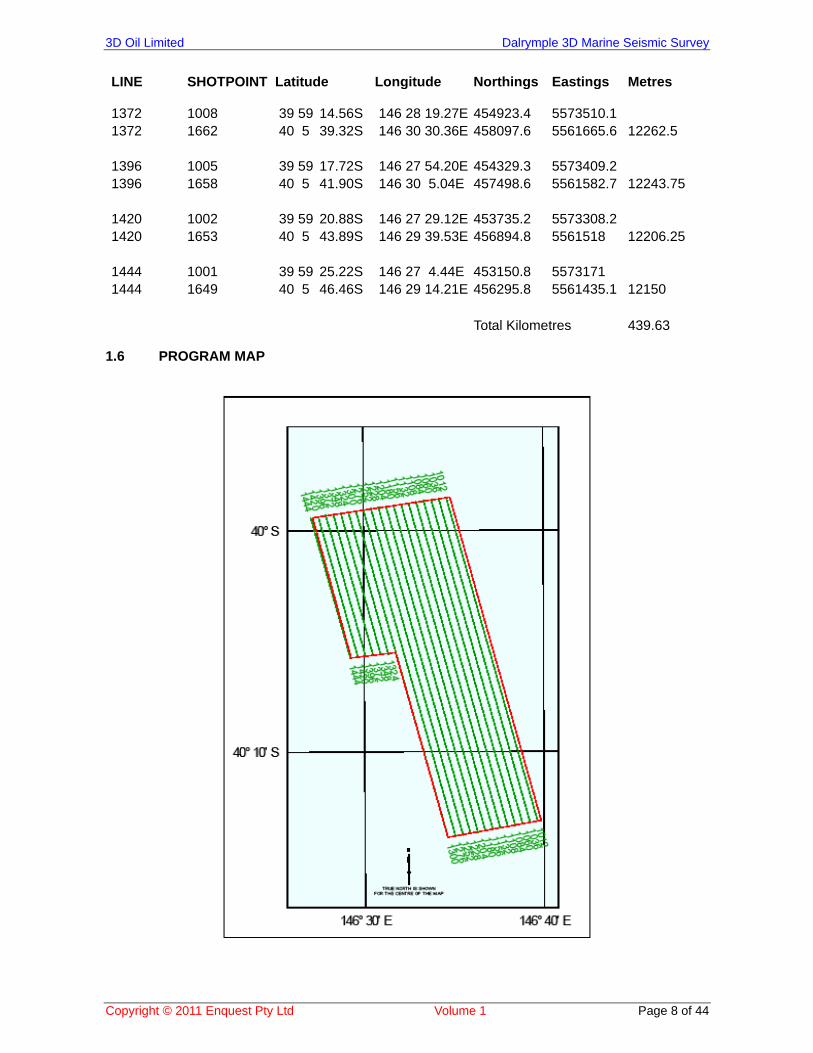
LINE SHOTPOINT Latitude Longitude Northings Eastings Metres 1372 1008 39 59 14.56S 146 28 19.27E 454923.4 5573510.1 1372 1662 40 5 39.32S 146 30 30.36E 458097.6 5561665.6 12262.5 1396 1005 39 59 17.72S 146 27 54.20E 454329.3 5573409.2 1396 1658 40 5 41.90S 146 30 5.04E 457498.6 5561582.7 12243.75 1420 1002 39 59 20.88S 146 27 29.12E 453735.2 5573308.2 1420 1653 40 5 43.89S 146 29 39.53E 456894.8 5561518 12206.25 1444 1001 39 59 25.22S 146 27 4.44E 453150.8 5573171 1444 1649 40 5 46.46S 146 29 14.21E 456295.8 5561435.1 12150 Total Kilometres 439.63
1.6 PROGRAM MAP
3D Oil Limited Dalrymple 3D Marine Seismic Survey
Copyright © 2011 Enquest Pty Ltd Volume 1 Page 9 of 44
2 SYNOPSIS
2.1 OVERVIEW
The survey consisted of 19 pre-plotted lines with a total of 263.78 full fold square kilometres over the Dalrymple 3D survey area located in the Bas Basin, offshore Tasmania, Australia. A final total of 439.9875 full fold kilometres of surface coverage equivalent to 263.9925 full fold square kilometres were recorded. The vessel used was the R/V Ramform Sterling, operated by PGS. The streamers, recording system and navigation performed exceptional well. The workboat was used extensively for any streamer work, reducing down time appreciably. The vessel departed Sydney harbour on the 25th of January 2011 and made her way to Botany Bay to take on fuel. Conditions were clear and fair for the transit the east coast of Australia and the vessel made a speed of around 16 knots. A planned rendezvous with the Ocean Dynasty was delayed due to poor visibility at Lakes Entrance. A heavy sea mist made movement in the small harbour problematic. To give the Dynasty time to catch up the Sterling slowed at 1117hrs on the 26th and started laying streamers. Configuration changes (removing 900 metres of streamer) and re-ballasting were carried out on streamers #01 and #12 before deployment. Streamer #02 deployment commenced in the early afternoon followed by streamer #11 at 2030hrs. At midnight reconfiguration and deployment of streamers continues. Streamer deployment continued throughout the 27th. The vessel passed to the south east of Deal Island in the Kent Group without difficulty. At 0645hrs a shark fishing vessel, Marian H, with fishing gear in the water was investigated by the Ocean Dynasty and the Sterling altered course to starboard to avoid the vessel and fishing gear. The workboat was deployed in the morning to replace a failed module. The whole workboat exercise taking less than 1 hour to complete. Late in the afternoon a brief spell of rough weather slowed deployment due to streamer #05 popping to the surface in the swell. At midnight 9 of 12 streamers had been deployed. Streamer deployment continued through the 28th with small adjustments and calibrations being carried out as required. The work boat was deployed at 1517hrs to replace a module and was back onboard at 1710hrs. Streamer #07 was deployed at 2100hrs and the doors set wide. Front end adjustments were carried out to set the front of all the streamers level. With 12 streamers in the water, streamer adjustments take some time and at midnight the front end adjustments were still being carried out. January 29th 2011, Source arrays had been deployed by 0418hrs and final streamer adjustments were finalised by 0617hrs. A test line was recorded to check all systems and further adjustments were made to get the geometry of the source and arrays correct. The vessel started towards line 1228 while a bubble test was carried out to check all array elements followed by a cycle test. All systems looked good and the first line got underway at 1005hrs local. A sippican probe was deployed during the line and a TSDip carried out after the line. The line change from sequence 001 to 002 was extended due to the survey layout with the vessel having to do both a slight tear drop turn and a run down on to the start of line 1444. The vessel can complete a normal turn with 5100m streamers in 3.0 hrs. A tear drop turn was needed to get on to line 1204 which extended the line change time by 5 min. There were little to no current and feather angles were low. At midnight line 1204 was in production Acquisition continued throughout January 30th with only one hang up when the source array #01 failed during line sequence 005. The line was terminated and the vessel turned to pick up line 1396 while repairs were being carried out on the source. Line 1180 sequence 005 was finally completed
3D Oil Limited Dalrymple 3D Marine Seismic Survey
Copyright © 2011 Enquest Pty Ltd Volume 1 Page 10 of 44
on February third as sequence 020. Once the source was repaired, acquisition continued without further problems. At the end of the day the vessel was on a line change to line 1372. A good days recording without mishap on January 31st. Weather conditions remained fair and the streamers remained at 7.0 metres. On February 1st weather conditions remained fair during the morning deteriorating in the early afternoon with winds gusting to 35 knots. The winds were associated with a frontal system that moved through Bass Strait. The conditions caused some streamer control problems and with further poor weather conditions forecast the streamers were set to 8.0 metres for sequence 015 and remained there for the rest of the survey. The combination of wind and sea required the bow thruster to be engaged to help maintain the vessels heading during sequence 015. Separations between arrays #1 and #2 were also affected by the conditions. Conditions remained variable throughout the evening. At midnight the vessel was on a line change to line 3DODA111276P1. Conditions remained variable though out February 2nd with wind a swell causing difficulties with streamer noise and control. Tail buoy jerk was evident on all streamers with random swell noise causing noise spikes. Stacked data was clean and all noise stacked out. Streamers remained at 8.0 metres. The final full line was acquired at 2241 hrs local and the vessel started the turn to pick up the southern portion of line 1108 missed on sequence 005 due to an array failure. Sequence 020, line 1180P2 was acquired on February 3rd and the vessel picked up the source arrays while heading for the geographical midway point, 146° 7.5' East, between the Dalrymple survey area and Origin Energy's Chappell survey area. This was reached at 1101 hrs local time.
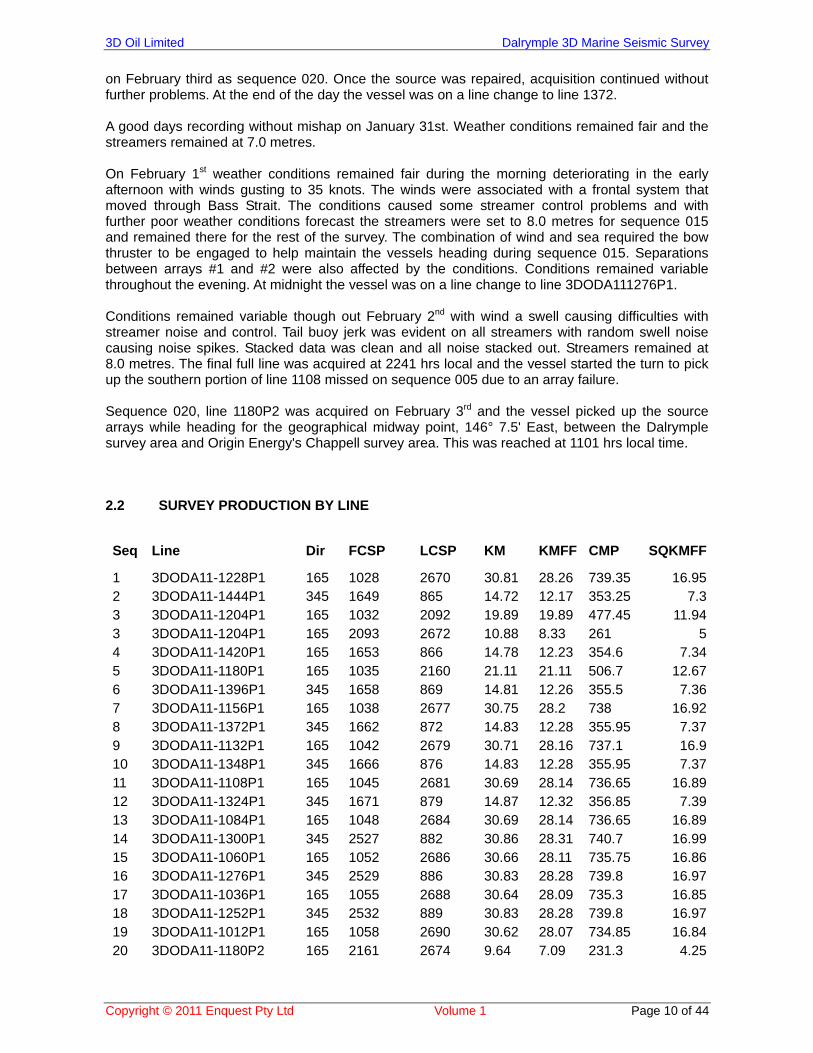
2.2 SURVEY PRODUCTION BY LINE
Seq Line Dir FCSP LCSP KM KMFF CMP SQKMFF
1 3DODA11-1228P1 165 1028 2670 30.81 28.26 739.35 16.952 3DODA11-1444P1 345 1649 865 14.72 12.17 353.25 7.33 3DODA11-1204P1 165 1032 2092 19.89 19.89 477.45 11.943 3DODA11-1204P1 165 2093 2672 10.88 8.33 261 54 3DODA11-1420P1 165 1653 866 14.78 12.23 354.6 7.345 3DODA11-1180P1 165 1035 2160 21.11 21.11 506.7 12.676 3DODA11-1396P1 345 1658 869 14.81 12.26 355.5 7.367 3DODA11-1156P1 165 1038 2677 30.75 28.2 738 16.928 3DODA11-1372P1 345 1662 872 14.83 12.28 355.95 7.379 3DODA11-1132P1 165 1042 2679 30.71 28.16 737.1 16.910 3DODA11-1348P1 345 1666 876 14.83 12.28 355.95 7.3711 3DODA11-1108P1 165 1045 2681 30.69 28.14 736.65 16.8912 3DODA11-1324P1 345 1671 879 14.87 12.32 356.85 7.3913 3DODA11-1084P1 165 1048 2684 30.69 28.14 736.65 16.8914 3DODA11-1300P1 345 2527 882 30.86 28.31 740.7 16.9915 3DODA11-1060P1 165 1052 2686 30.66 28.11 735.75 16.8616 3DODA11-1276P1 345 2529 886 30.83 28.28 739.8 16.9717 3DODA11-1036P1 165 1055 2688 30.64 28.09 735.3 16.8518 3DODA11-1252P1 345 2532 889 30.83 28.28 739.8 16.9719 3DODA11-1012P1 165 1058 2690 30.62 28.07 734.85 16.8420 3DODA11-1180P2 165 2161 2674 9.64 7.09 231.3 4.25
3D Oil Limited Dalrymple 3D Marine Seismic Survey
Copyright © 2011 Enquest Pty Ltd Volume 1 Page 11 of 44
2.3 SURVEY INFILL PRODUCTION BY LINE
There was no infill on this survey
2.4 SURVEY TOTAL
Total Survey Production - Prime
KM KMFF CMP SQKMFF 488.4375 439.9875 11722.5000 263.9925
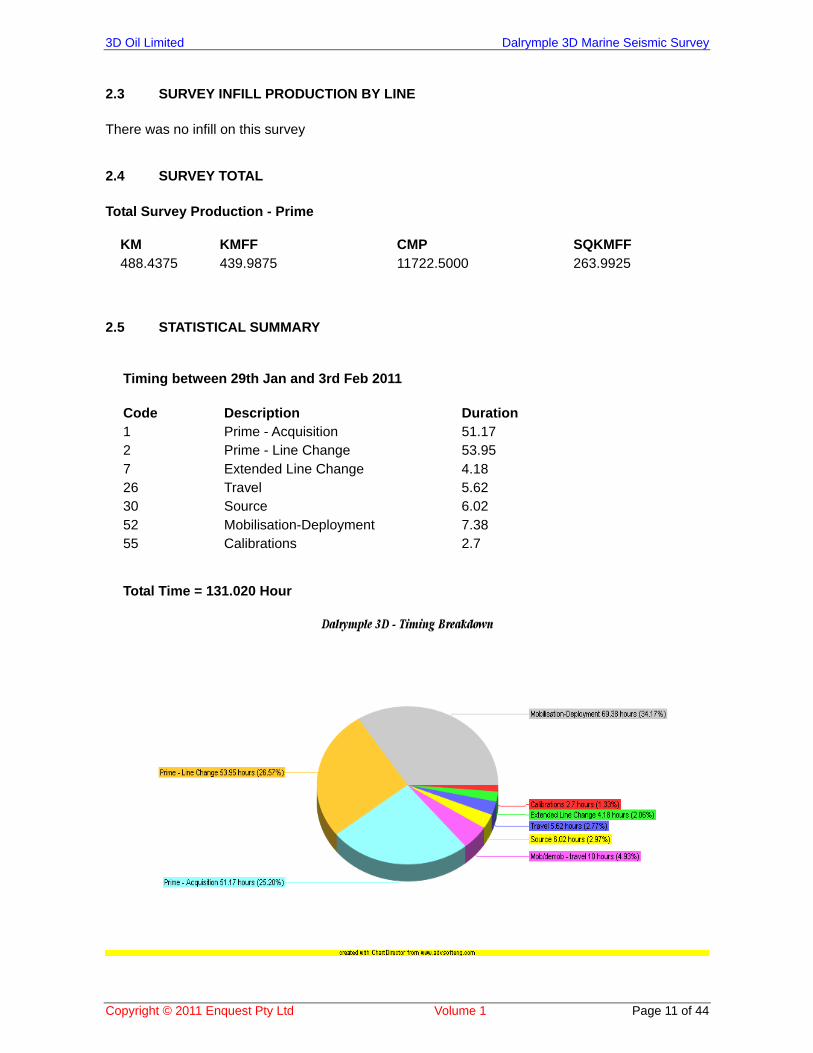
2.5 STATISTICAL SUMMARY
Timing between 29th Jan and 3rd Feb 2011 Code Description Duration 1 Prime - Acquisition 51.17 2 Prime - Line Change 53.95 7 Extended Line Change 4.18 26 Travel 5.62 30 Source 6.02 52 Mobilisation-Deployment 7.38 55 Calibrations 2.7 Total Time = 131.020 Hour
3D Oil Limited Dalrymple 3D Marine Seismic Survey
Copyright © 2011 Enquest Pty Ltd Volume 1 Page 12 of 44
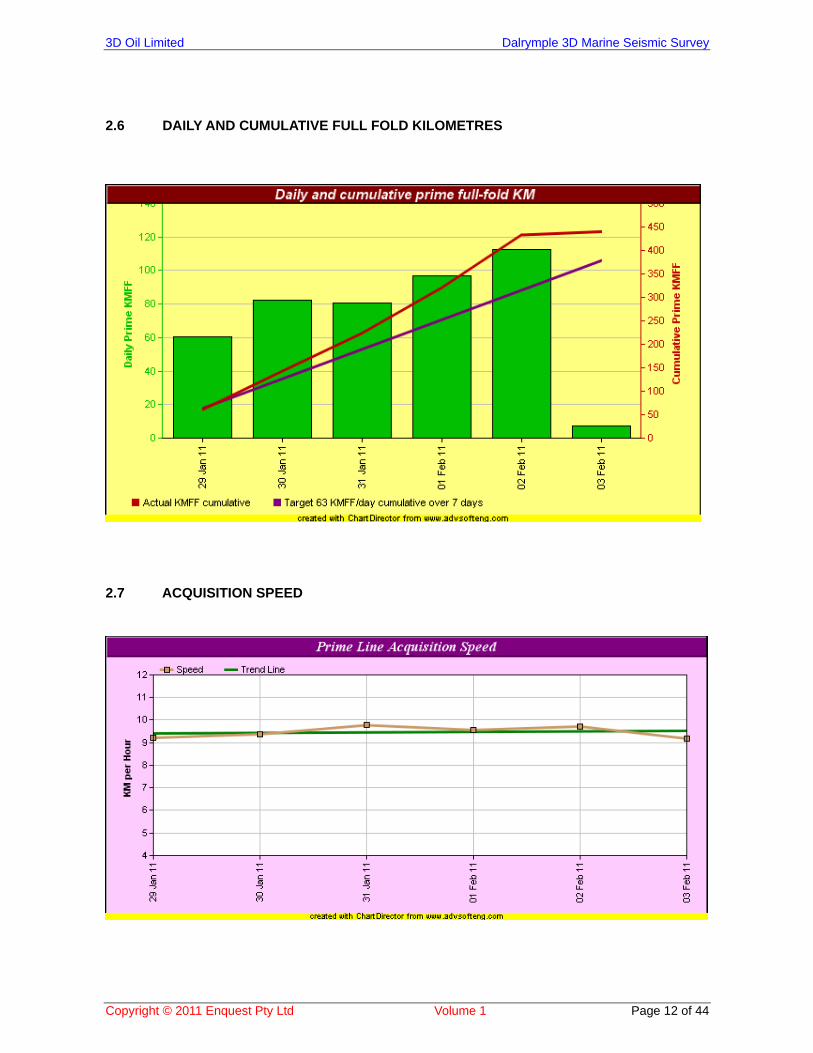
2.6 DAILY AND CUMULATIVE FULL FOLD KILOMETRES
2.7 ACQUISITION SPEED
3D Oil Limited Dalrymple 3D Marine Seismic Survey
Copyright © 2011 Enquest Pty Ltd Volume 1 Page 13 of 44
2.8 TECHNICAL SUMMARY
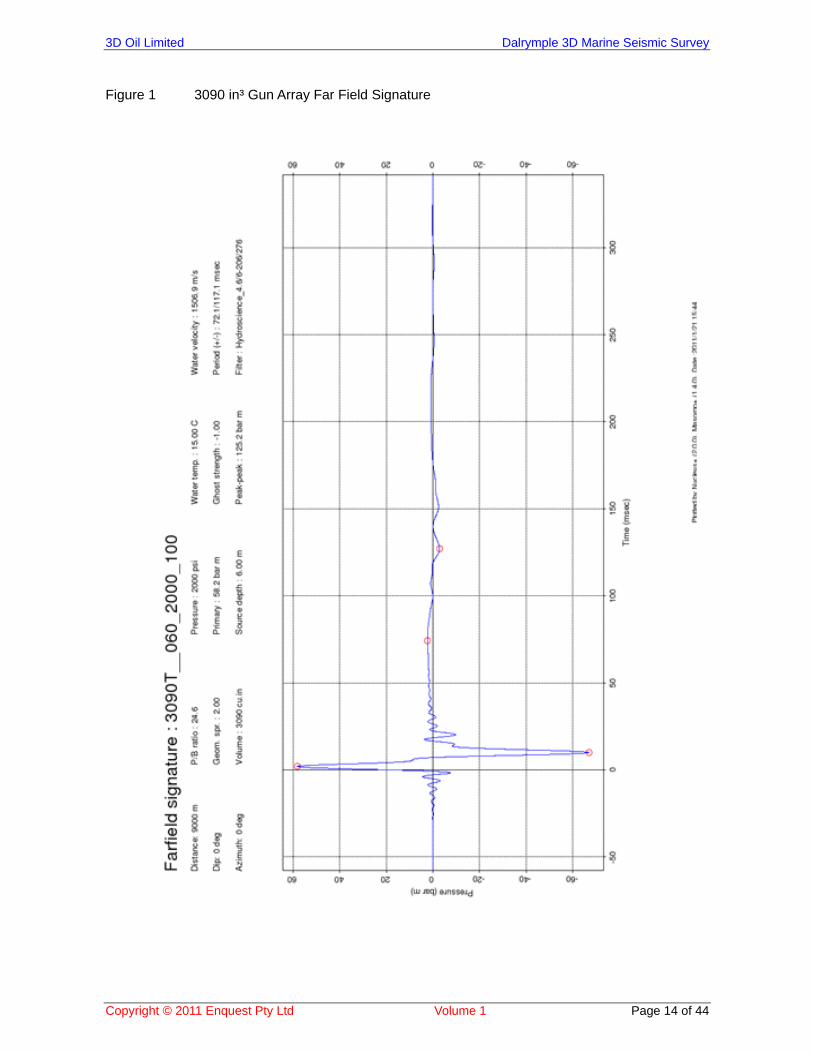
The following is a brief description of individual equipment performance throughout the survey Recording Instruments For this survey the Ramform Sterling deployed 12 gel streamers interfaced to the Hydroscience SeaTRAK Mark11 24 Bit Digital recording system. The PGS system provided a comprehensive array of real time on screen displays, showing, Real time movie image of RMS values in microbars for all streamers & all channels, together with graphical display of minimum, maximum and average values per shot, Real-time shot record displays for all shots, all streamers (cycled), with point & click ability for interactive analysis of data and header values. All displays could be manipulated to improve data quality control. A full set of daily tests was automatically carried out each day showing the recording system and streamer were within contract specification. The system operated faultlessly during the survey proving to be robust and operator friendly. Observer’s reports were manually entered into a PGS database that became part of the EOL observers report for each line. Faults from the recording system and array logging system were automatically generated at the completion of each line. The quality of the Observers logs was acceptable. There could have been more detail regarding streamer control and weather observations in regard to the streamer and data. Streamer The PGS RDH Solid streamers worked remarkably well. Time was taken at the start of the survey to get the ballast right and any faults repaired. This paid off in the long run with the need for very little streamer work other than the normal maintenance of birds, acoustics and tail buoys. Streamer depths were maintained at 7 metres for the first 16 sequences. The streamer was then set to 8 metres for the final 4 sequences, to reduce swell noise and improve streamer depth control. All variations in streamer depths were noted in the streamer depth log. Noise levels on the data were monitored closely during QC processing. Energy Source The energy source utilised for this survey consisted of two Bolt 1900 LLXT, 3090 in³ arrays, fired alternately. Each array is composed of identically tuned Bolt 1900 LLXT sub-arrays operating at 2000 psi air pressure. The signature produced by the array composed of three sub-arrays has the same shape as that produced by a single sub-array while the overall acoustic output of the array is determined by the number of sub-arrays employed. A near-field hydrophone is mounted about 1 m above each gun station (one phone is used per cluster), depth transducers are mounted front and tail of each sub array, and a high pressure transducer is mounted at the aft end of the sub array to monitor high pressure air supply. All the data from these sensors are transmitted to the vessel for input into the onboard systems and recording to tape. The drop out spec was generated by PGS. A total of 6.2 hours were lost to the source arrays. The 3090 in³ array was used throughout the survey. A rigorous maintenance schedule was maintained on the array strings and individual elements were replaced at the specified time regardless of their performance. The Ramform Sterling has three LMF compressors with a capacity of 1660 SCFM. Two compressors maintained air pressure with the other one normally being rotated through to allow maintenance to be carried out.
3D Oil Limited Dalrymple 3D Marine Seismic Survey
Copyright © 2011 Enquest Pty Ltd Volume 1 Page 14 of 44
Figure 1 3090 in³ Gun Array Far Field Signature
3D Oil Limited Dalrymple 3D Marine Seismic Survey
Copyright © 2011 Enquest Pty Ltd Volume 1 Page 15 of 44
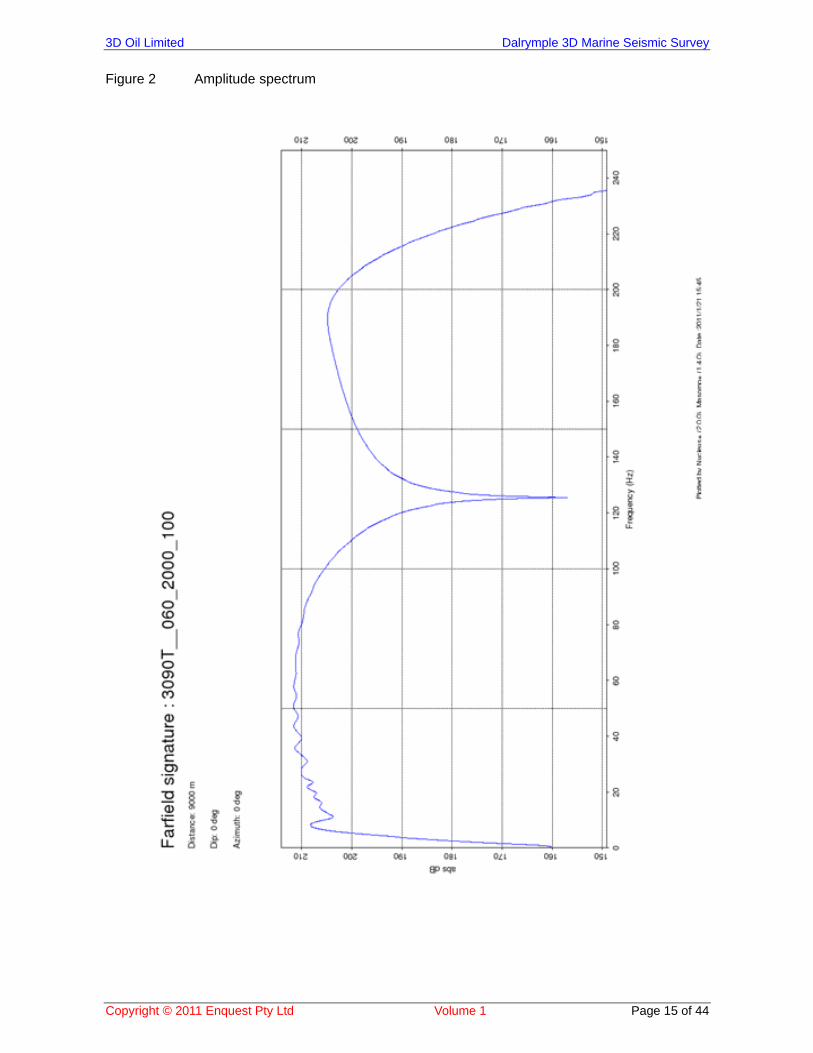
Figure 2 Amplitude spectrum
3D Oil Limited Dalrymple 3D Marine Seismic Survey
Copyright © 2011 Enquest Pty Ltd Volume 1 Page 16 of 44
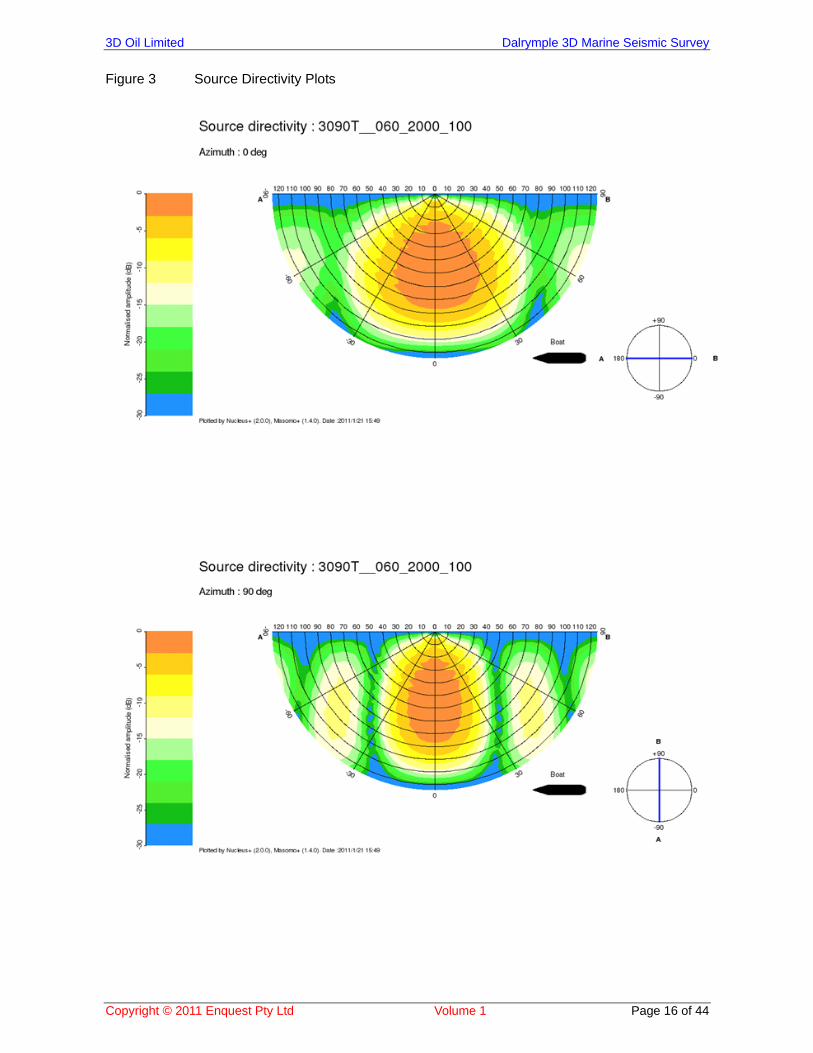
Figure 3 Source Directivity Plots
3D Oil Limited Dalrymple 3D Marine Seismic Survey
Copyright © 2011 Enquest Pty Ltd Volume 1 Page 17 of 44
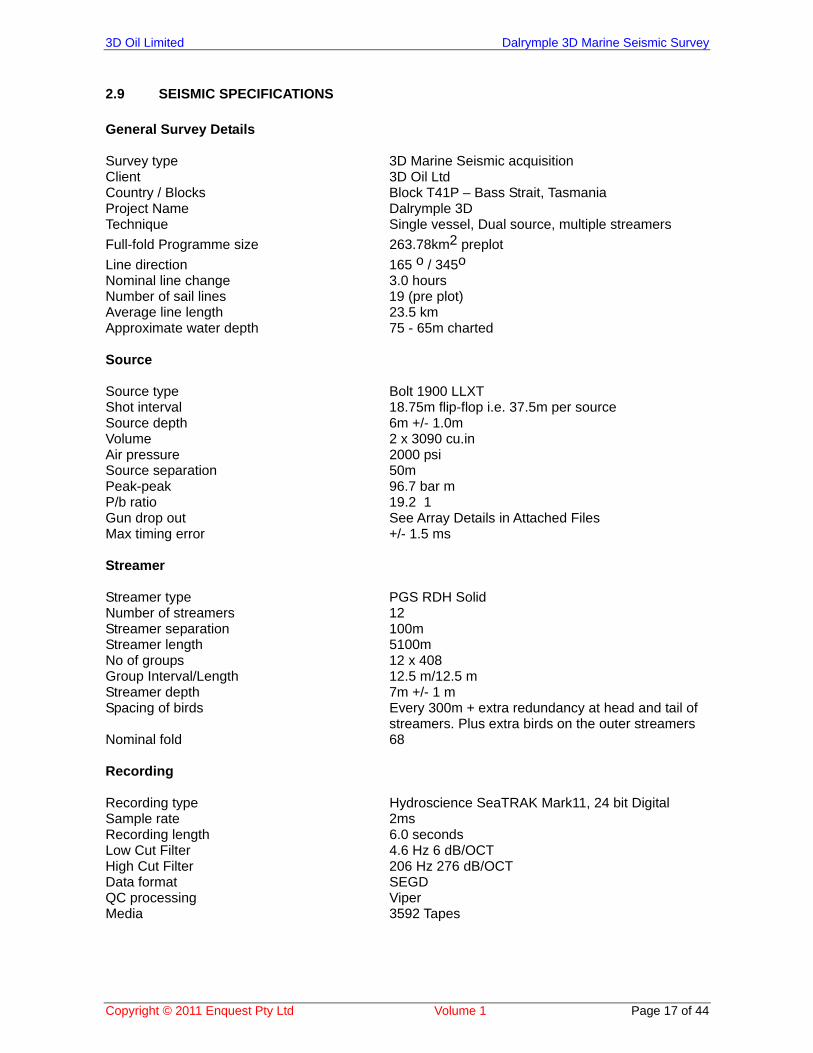
2.9 SEISMIC SPECIFICATIONS
General Survey Details Survey type 3D Marine Seismic acquisition Client 3D Oil Ltd Country / Blocks Block T41P – Bass Strait, Tasmania Project Name Dalrymple 3D Technique Single vessel, Dual source, multiple streamers
Full-fold Programme size 263.78km2 preplot
Line direction 165 o / 345o
Nominal line change 3.0 hours Number of sail lines 19 (pre plot) Average line length 23.5 km Approximate water depth 75 - 65m charted Source Source type Bolt 1900 LLXT Shot interval 18.75m flip-flop i.e. 37.5m per source Source depth 6m +/- 1.0m Volume 2 x 3090 cu.in Air pressure 2000 psi Source separation 50m Peak-peak 96.7 bar m P/b ratio 19.2 1 Gun drop out See Array Details in Attached Files Max timing error +/- 1.5 ms Streamer Streamer type PGS RDH Solid Number of streamers 12 Streamer separation 100m Streamer length 5100m No of groups 12 x 408 Group Interval/Length 12.5 m/12.5 m Streamer depth 7m +/- 1 m Spacing of birds Every 300m + extra redundancy at head and tail of streamers. Plus extra birds on the outer streamers Nominal fold 68 Recording Recording type Hydroscience SeaTRAK Mark11, 24 bit Digital Sample rate 2ms Recording length 6.0 seconds Low Cut Filter 4.6 Hz 6 dB/OCT High Cut Filter 206 Hz 276 dB/OCT Data format SEGD QC processing Viper Media 3592 Tapes
3D Oil Limited Dalrymple 3D Marine Seismic Survey
Copyright © 2011 Enquest Pty Ltd Volume 1 Page 18 of 44
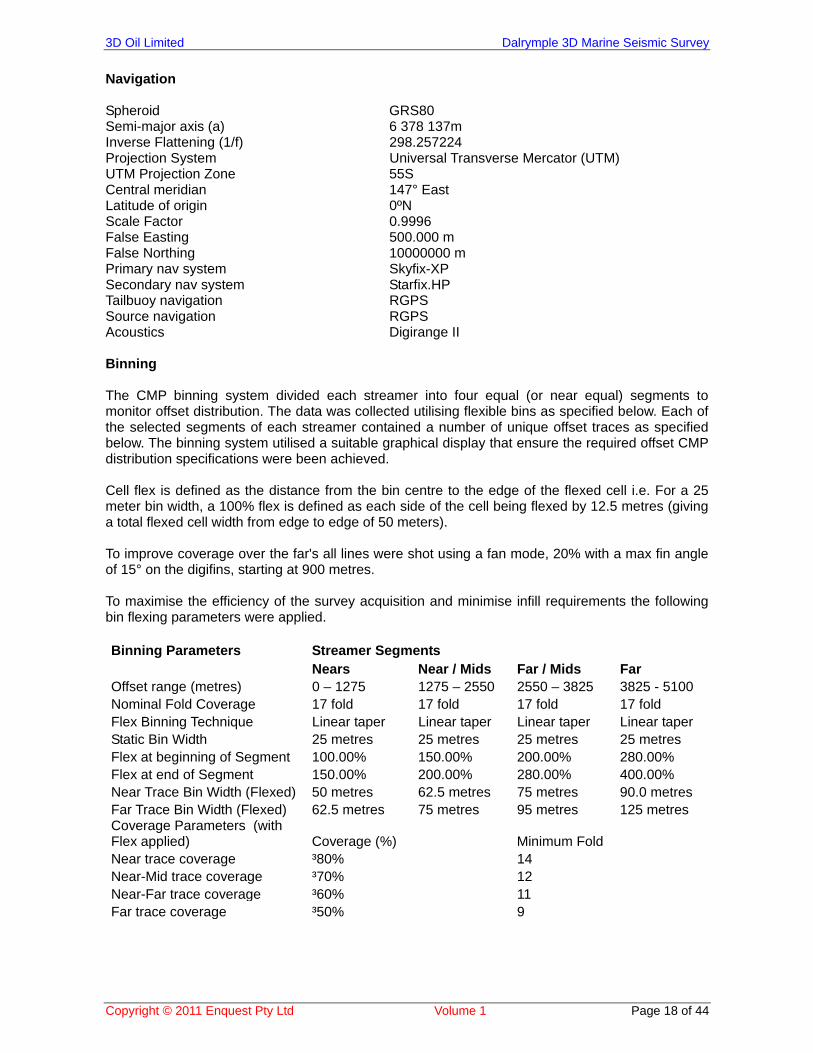
Navigation Spheroid GRS80 Semi-major axis (a) 6 378 137m Inverse Flattening (1/f) 298.257224 Projection System Universal Transverse Mercator (UTM) UTM Projection Zone 55S Central meridian 147° East Latitude of origin 0ºN Scale Factor 0.9996 False Easting 500.000 m False Northing 10000000 m Primary nav system Skyfix-XP Secondary nav system Starfix.HP Tailbuoy navigation RGPS Source navigation RGPS Acoustics Digirange II Binning The CMP binning system divided each streamer into four equal (or near equal) segments to monitor offset distribution. The data was collected utilising flexible bins as specified below. Each of the selected segments of each streamer contained a number of unique offset traces as specified below. The binning system utilised a suitable graphical display that ensure the required offset CMP distribution specifications were been achieved. Cell flex is defined as the distance from the bin centre to the edge of the flexed cell i.e. For a 25 meter bin width, a 100% flex is defined as each side of the cell being flexed by 12.5 metres (giving a total flexed cell width from edge to edge of 50 meters). To improve coverage over the far's all lines were shot using a fan mode, 20% with a max fin angle of 15° on the digifins, starting at 900 metres. To maximise the efficiency of the survey acquisition and minimise infill requirements the following bin flexing parameters were applied. Binning Parameters Streamer Segments Nears Near / Mids Far / Mids Far Offset range (metres) 0 – 1275 1275 – 2550 2550 – 3825 3825 - 5100 Nominal Fold Coverage 17 fold 17 fold 17 fold 17 fold Flex Binning Technique Linear taper Linear taper Linear taper Linear taper Static Bin Width 25 metres 25 metres 25 metres 25 metres Flex at beginning of Segment 100.00% 150.00% 200.00% 280.00% Flex at end of Segment 150.00% 200.00% 280.00% 400.00% Near Trace Bin Width (Flexed) 50 metres 62.5 metres 75 metres 90.0 metres Far Trace Bin Width (Flexed) 62.5 metres 75 metres 95 metres 125 metres Coverage Parameters (with Flex applied) Coverage (%) Minimum Fold Near trace coverage ³80% 14 Near-Mid trace coverage ³70% 12 Near-Far trace coverage ³60% 11Far trace coverage ³50% 9
3D Oil Limited Dalrymple 3D Marine Seismic Survey
Copyright © 2011 Enquest Pty Ltd Volume 1 Page 19 of 44
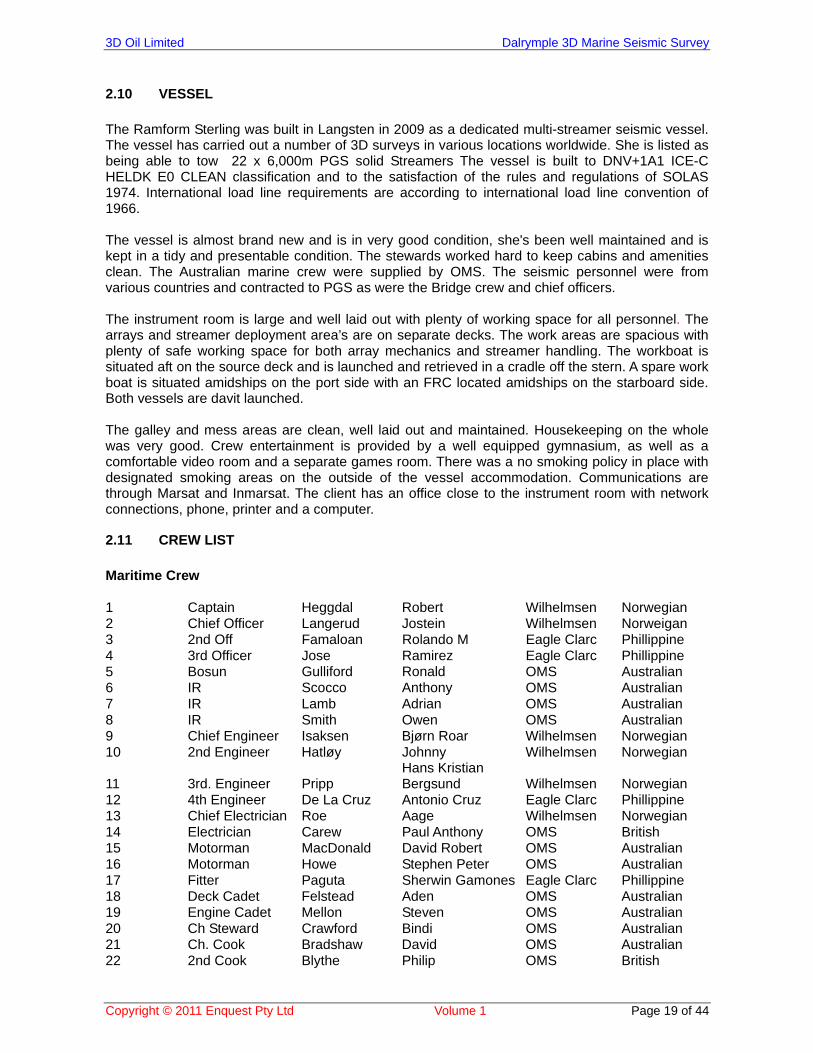
2.10 VESSEL
The Ramform Sterling was built in Langsten in 2009 as a dedicated multi-streamer seismic vessel. The vessel has carried out a number of 3D surveys in various locations worldwide. She is listed as being able to tow 22 x 6,000m PGS solid Streamers The vessel is built to DNV+1A1 ICE-C HELDK E0 CLEAN classification and to the satisfaction of the rules and regulations of SOLAS 1974. International load line requirements are according to international load line convention of 1966. The vessel is almost brand new and is in very good condition, she's been well maintained and is kept in a tidy and presentable condition. The stewards worked hard to keep cabins and amenities clean. The Australian marine crew were supplied by OMS. The seismic personnel were from various countries and contracted to PGS as were the Bridge crew and chief officers. The instrument room is large and well laid out with plenty of working space for all personnel. The arrays and streamer deployment area’s are on separate decks. The work areas are spacious with plenty of safe working space for both array mechanics and streamer handling. The workboat is situated aft on the source deck and is launched and retrieved in a cradle off the stern. A spare work boat is situated amidships on the port side with an FRC located amidships on the starboard side. Both vessels are davit launched. The galley and mess areas are clean, well laid out and maintained. Housekeeping on the whole was very good. Crew entertainment is provided by a well equipped gymnasium, as well as a comfortable video room and a separate games room. There was a no smoking policy in place with designated smoking areas on the outside of the vessel accommodation. Communications are through Marsat and Inmarsat. The client has an office close to the instrument room with network connections, phone, printer and a computer.
2.11 CREW LIST
Maritime Crew 1 Captain Heggdal Robert Wilhelmsen Norwegian2 Chief Officer Langerud Jostein Wilhelmsen Norweigan 3 2nd Off Famaloan Rolando M Eagle Clarc Phillippine 4 3rd Officer Jose Ramirez Eagle Clarc Phillippine 5 Bosun Gulliford Ronald OMS Australian 6 IR Scocco Anthony OMS Australian 7 IR Lamb Adrian OMS Australian 8 IR Smith Owen OMS Australian 9 Chief Engineer Isaksen Bjørn Roar Wilhelmsen Norwegian 10 2nd Engineer Hatløy Johnny Wilhelmsen Norwegian
11 3rd. Engineer Pripp Hans Kristian Bergsund Wilhelmsen Norwegian
12 4th Engineer De La Cruz Antonio Cruz Eagle Clarc Phillippine 13 Chief Electrician Roe Aage Wilhelmsen Norwegian 14 Electrician Carew Paul Anthony OMS British 15 Motorman MacDonald David Robert OMS Australian 16 Motorman Howe Stephen Peter OMS Australian 17 Fitter Paguta Sherwin Gamones Eagle Clarc Phillippine 18 Deck Cadet Felstead Aden OMS Australian 19 Engine Cadet Mellon Steven OMS Australian 20 Ch Steward Crawford Bindi OMS Australian 21 Ch. Cook Bradshaw David OMS Australian 22 2nd Cook Blythe Philip OMS British
3D Oil Limited Dalrymple 3D Marine Seismic Survey
Copyright © 2011 Enquest Pty Ltd Volume 1 Page 20 of 44
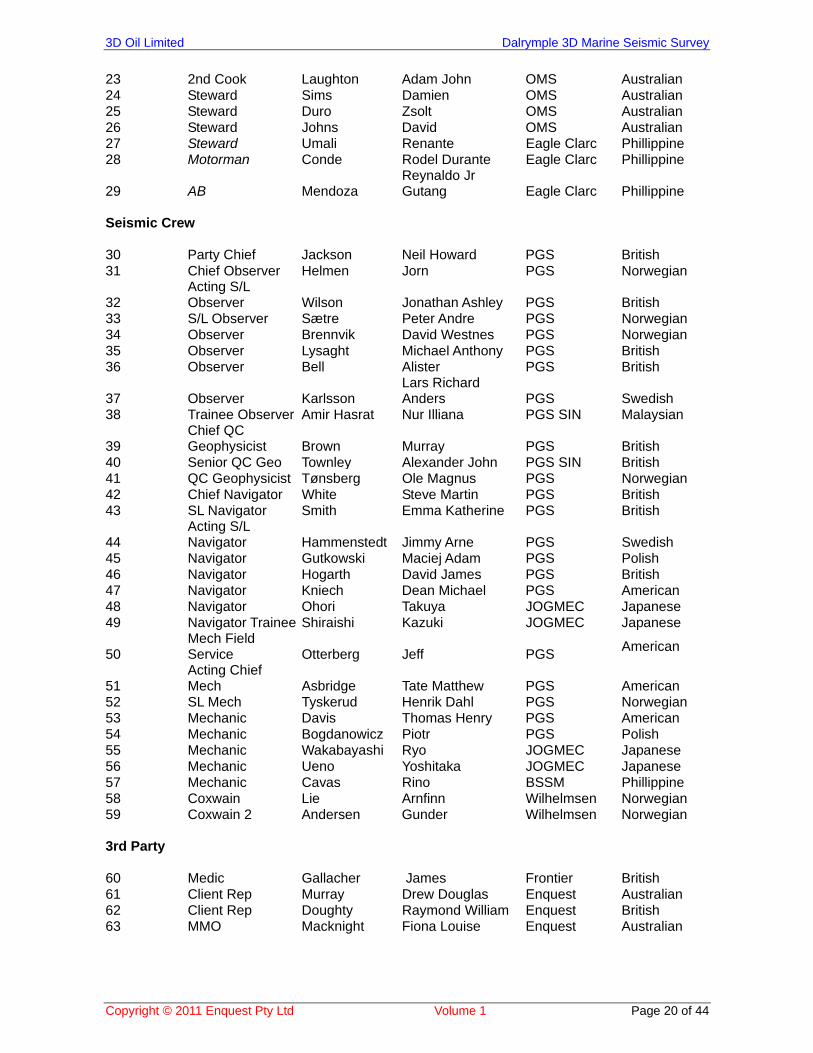
23 2nd Cook Laughton Adam John OMS Australian 24 Steward Sims Damien OMS Australian 25 Steward Duro Zsolt OMS Australian 26 Steward Johns David OMS Australian 27 Steward Umali Renante Eagle Clarc Phillippine 28 Motorman Conde Rodel Durante Eagle Clarc Phillippine
29 AB Mendoza Reynaldo Jr Gutang Eagle Clarc Phillippine
Seismic Crew 30 Party Chief Jackson Neil Howard PGS British 31 Chief Observer Helmen Jorn PGS Norwegian
32 Acting S/L Observer Wilson Jonathan Ashley PGS British
33 S/L Observer Sætre Peter Andre PGS Norwegian 34 Observer Brennvik David Westnes PGS Norwegian 35 Observer Lysaght Michael Anthony PGS British 36 Observer Bell Alister PGS British
37 Observer Karlsson Lars Richard Anders PGS Swedish
38 Trainee Observer Amir Hasrat Nur Illiana PGS SIN Malaysian
39 Chief QC Geophysicist Brown Murray PGS British
40 Senior QC Geo Townley Alexander John PGS SIN British41 QC Geophysicist Tønsberg Ole Magnus PGS Norwegian 42 Chief Navigator White Steve Martin PGS British 43 SL Navigator Smith Emma Katherine PGS British
44 Acting S/L Navigator Hammenstedt Jimmy Arne PGS Swedish
45 Navigator Gutkowski Maciej Adam PGS Polish 46 Navigator Hogarth David James PGS British 47 Navigator Kniech Dean Michael PGS American 48 Navigator Ohori Takuya JOGMEC Japanese 49 Navigator Trainee Shiraishi Kazuki JOGMEC Japanese
50 Mech Field Service Otterberg Jeff PGS
American
51 Acting Chief Mech Asbridge Tate Matthew PGS American
52 SL Mech Tyskerud Henrik Dahl PGS Norwegian 53 Mechanic Davis Thomas Henry PGS American 54 Mechanic Bogdanowicz Piotr PGS Polish 55 Mechanic Wakabayashi Ryo JOGMEC Japanese 56 Mechanic Ueno Yoshitaka JOGMEC Japanese 57 Mechanic Cavas Rino BSSM Phillippine 58 Coxwain Lie Arnfinn Wilhelmsen Norwegian 59 Coxwain 2 Andersen Gunder Wilhelmsen Norwegian 3rd Party 60 Medic Gallacher James Frontier British 61 Client Rep Murray Drew Douglas Enquest Australian 62 Client Rep Doughty Raymond William Enquest British 63 MMO Macknight Fiona Louise Enquest Australian
3D Oil Limited Dalrymple 3D Marine Seismic Survey
Copyright © 2011 Enquest Pty Ltd Volume 1 Page 21 of 44
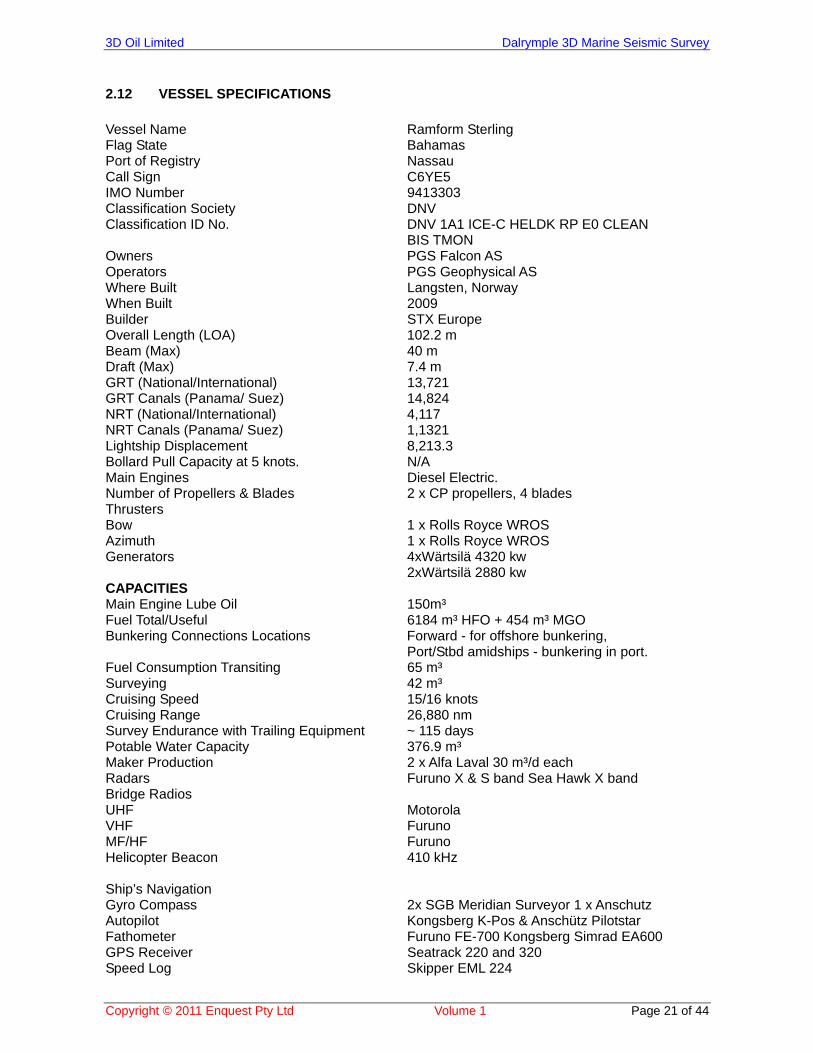
2.12 VESSEL SPECIFICATIONS
Vessel Name Ramform Sterling Flag State Bahamas Port of Registry Nassau Call Sign C6YE5 IMO Number 9413303 Classification Society DNV Classification ID No. DNV 1A1 ICE-C HELDK RP E0 CLEAN BIS TMON Owners PGS Falcon AS Operators PGS Geophysical AS Where Built Langsten, Norway When Built 2009 Builder STX Europe Overall Length (LOA) 102.2 m Beam (Max) 40 m Draft (Max) 7.4 m GRT (National/International) 13,721 GRT Canals (Panama/ Suez) 14,824 NRT (National/International) 4,117 NRT Canals (Panama/ Suez) 1,1321 Lightship Displacement 8,213.3 Bollard Pull Capacity at 5 knots. N/A Main Engines Diesel Electric. Number of Propellers & Blades 2 x CP propellers, 4 blades Thrusters Bow 1 x Rolls Royce WROS Azimuth 1 x Rolls Royce WROS Generators 4xWärtsilä 4320 kw 2xWärtsilä 2880 kw CAPACITIES Main Engine Lube Oil 150m³ Fuel Total/Useful 6184 m³ HFO + 454 m³ MGO Bunkering Connections Locations Forward - for offshore bunkering, Port/Stbd amidships - bunkering in port. Fuel Consumption Transiting 65 m³ Surveying 42 m³ Cruising Speed 15/16 knots Cruising Range 26,880 nm Survey Endurance with Trailing Equipment ~ 115 days Potable Water Capacity 376.9 m³ Maker Production 2 x Alfa Laval 30 m³/d each Radars Furuno X & S band Sea Hawk X band Bridge Radios UHF Motorola VHF Furuno MF/HF Furuno Helicopter Beacon 410 kHz Ship’s Navigation Gyro Compass 2x SGB Meridian Surveyor 1 x Anschutz Autopilot Kongsberg K-Pos & Anschütz Pilotstar Fathometer Furuno FE-700 Kongsberg Simrad EA600 GPS Receiver Seatrack 220 and 320 Speed Log Skipper EML 224
3D Oil Limited Dalrymple 3D Marine Seismic Survey
Copyright © 2011 Enquest Pty Ltd Volume 1 Page 22 of 44
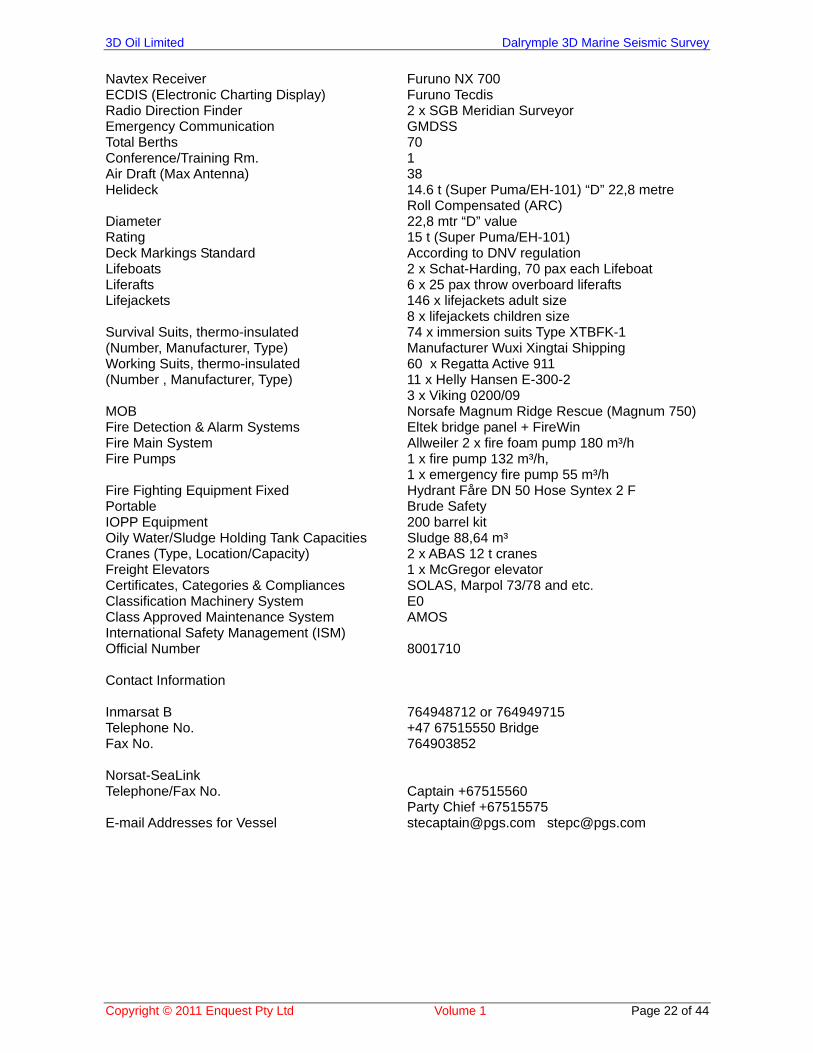
Navtex Receiver Furuno NX 700 ECDIS (Electronic Charting Display) Furuno Tecdis Radio Direction Finder 2 x SGB Meridian Surveyor Emergency Communication GMDSS Total Berths 70 Conference/Training Rm. 1 Air Draft (Max Antenna) 38 Helideck 14.6 t (Super Puma/EH-101) “D” 22,8 metre Roll Compensated (ARC) Diameter 22,8 mtr “D” value Rating 15 t (Super Puma/EH-101) Deck Markings Standard According to DNV regulation Lifeboats 2 x Schat-Harding, 70 pax each Lifeboat Liferafts 6 x 25 pax throw overboard liferafts Lifejackets 146 x lifejackets adult size 8 x lifejackets children size Survival Suits, thermo-insulated 74 x immersion suits Type XTBFK-1 (Number, Manufacturer, Type) Manufacturer Wuxi Xingtai Shipping Working Suits, thermo-insulated 60 x Regatta Active 911 (Number , Manufacturer, Type) 11 x Helly Hansen E-300-2 3 x Viking 0200/09 MOB Norsafe Magnum Ridge Rescue (Magnum 750) Fire Detection & Alarm Systems Eltek bridge panel + FireWin Fire Main System Allweiler 2 x fire foam pump 180 m³/h Fire Pumps 1 x fire pump 132 m³/h, 1 x emergency fire pump 55 m³/h Fire Fighting Equipment Fixed Hydrant Fåre DN 50 Hose Syntex 2 F Portable Brude Safety IOPP Equipment 200 barrel kit Oily Water/Sludge Holding Tank Capacities Sludge 88,64 m³ Cranes (Type, Location/Capacity) 2 x ABAS 12 t cranes Freight Elevators 1 x McGregor elevator Certificates, Categories & Compliances SOLAS, Marpol 73/78 and etc. Classification Machinery System E0 Class Approved Maintenance System AMOS International Safety Management (ISM) Official Number 8001710 Contact Information Inmarsat B 764948712 or 764949715 Telephone No. +47 67515550 Bridge Fax No. 764903852 Norsat-SeaLink Telephone/Fax No. Captain +67515560 Party Chief +67515575 E-mail Addresses for Vessel [email protected] [email protected]
3D Oil Limited Dalrymple 3D Marine Seismic Survey
Copyright © 2011 Enquest Pty Ltd Volume 1 Page 23 of 44
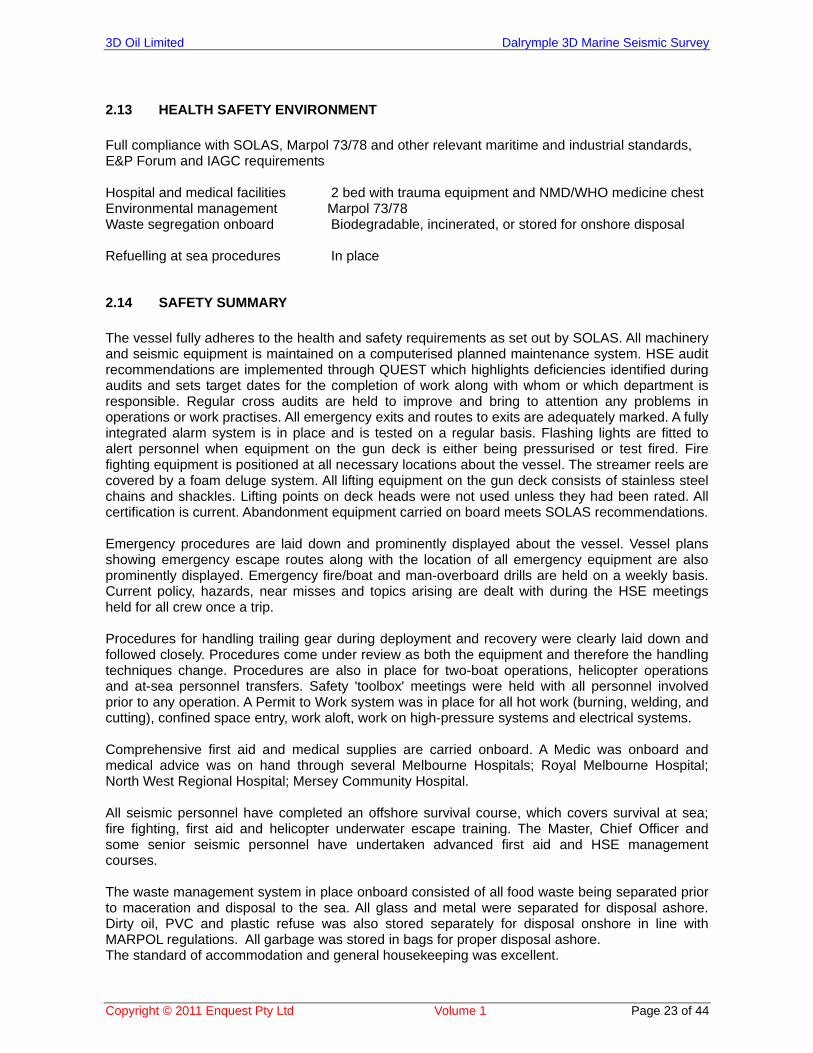
2.13 HEALTH SAFETY ENVIRONMENT
Full compliance with SOLAS, Marpol 73/78 and other relevant maritime and industrial standards, E&P Forum and IAGC requirements Hospital and medical facilities 2 bed with trauma equipment and NMD/WHO medicine chest Environmental management Marpol 73/78 Waste segregation onboard Biodegradable, incinerated, or stored for onshore disposal Refuelling at sea procedures In place
2.14 SAFETY SUMMARY
The vessel fully adheres to the health and safety requirements as set out by SOLAS. All machinery and seismic equipment is maintained on a computerised planned maintenance system. HSE audit recommendations are implemented through QUEST which highlights deficiencies identified during audits and sets target dates for the completion of work along with whom or which department is responsible. Regular cross audits are held to improve and bring to attention any problems in operations or work practises. All emergency exits and routes to exits are adequately marked. A fully integrated alarm system is in place and is tested on a regular basis. Flashing lights are fitted to alert personnel when equipment on the gun deck is either being pressurised or test fired. Fire fighting equipment is positioned at all necessary locations about the vessel. The streamer reels are covered by a foam deluge system. All lifting equipment on the gun deck consists of stainless steel chains and shackles. Lifting points on deck heads were not used unless they had been rated. All certification is current. Abandonment equipment carried on board meets SOLAS recommendations. Emergency procedures are laid down and prominently displayed about the vessel. Vessel plans showing emergency escape routes along with the location of all emergency equipment are also prominently displayed. Emergency fire/boat and man-overboard drills are held on a weekly basis. Current policy, hazards, near misses and topics arising are dealt with during the HSE meetings held for all crew once a trip. Procedures for handling trailing gear during deployment and recovery were clearly laid down and followed closely. Procedures come under review as both the equipment and therefore the handling techniques change. Procedures are also in place for two-boat operations, helicopter operations and at-sea personnel transfers. Safety 'toolbox' meetings were held with all personnel involved prior to any operation. A Permit to Work system was in place for all hot work (burning, welding, and cutting), confined space entry, work aloft, work on high-pressure systems and electrical systems. Comprehensive first aid and medical supplies are carried onboard. A Medic was onboard and medical advice was on hand through several Melbourne Hospitals; Royal Melbourne Hospital; North West Regional Hospital; Mersey Community Hospital. All seismic personnel have completed an offshore survival course, which covers survival at sea; fire fighting, first aid and helicopter underwater escape training. The Master, Chief Officer and some senior seismic personnel have undertaken advanced first aid and HSE management courses. The waste management system in place onboard consisted of all food waste being separated prior to maceration and disposal to the sea. All glass and metal were separated for disposal ashore. Dirty oil, PVC and plastic refuse was also stored separately for disposal onshore in line with MARPOL regulations. All garbage was stored in bags for proper disposal ashore. The standard of accommodation and general housekeeping was excellent.
3D Oil Limited Dalrymple 3D Marine Seismic Survey
Copyright © 2011 Enquest Pty Ltd Volume 1 Page 24 of 44
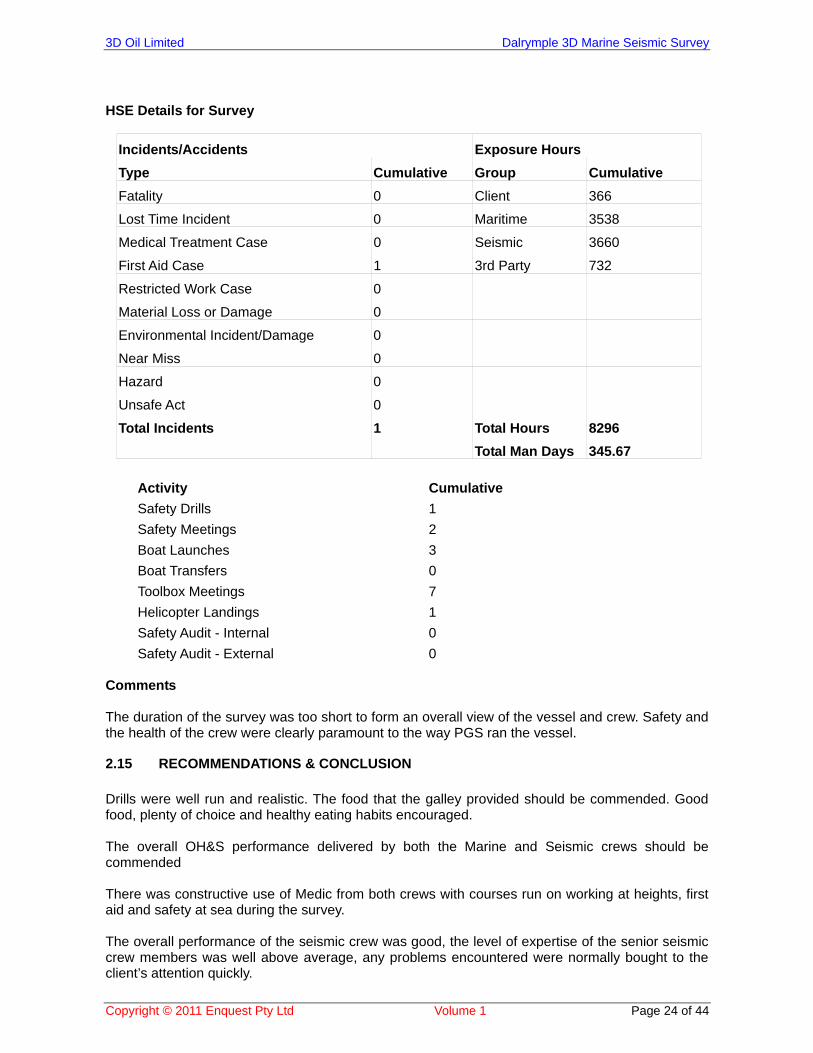
HSE Details for Survey
Incidents/Accidents Exposure Hours
Type Cumulative Group Cumulative
Fatality 0 Client 366
Lost Time Incident 0 Maritime 3538
Medical Treatment Case 0 Seismic 3660
First Aid Case 1 3rd Party 732
Restricted Work Case 0
Material Loss or Damage 0
Environmental Incident/Damage 0
Near Miss 0
Hazard 0
Unsafe Act 0
Total Incidents 1 Total Hours 8296
Total Man Days 345.67
Activity Cumulative
Safety Drills 1
Safety Meetings 2
Boat Launches 3
Boat Transfers 0
Toolbox Meetings 7
Helicopter Landings 1
Safety Audit - Internal 0
Safety Audit - External 0 Comments The duration of the survey was too short to form an overall view of the vessel and crew. Safety and the health of the crew were clearly paramount to the way PGS ran the vessel.
2.15 RECOMMENDATIONS & CONCLUSION
Drills were well run and realistic. The food that the galley provided should be commended. Good food, plenty of choice and healthy eating habits encouraged. The overall OH&S performance delivered by both the Marine and Seismic crews should be commended There was constructive use of Medic from both crews with courses run on working at heights, first aid and safety at sea during the survey. The overall performance of the seismic crew was good, the level of expertise of the senior seismic crew members was well above average, any problems encountered were normally bought to the client’s attention quickly.
3D Oil Limited Dalrymple 3D Marine Seismic Survey
Copyright © 2011 Enquest Pty Ltd Volume 1 Page 25 of 44
3 NAVIGATION
3.1 METHODOLOGY
The prospect of 19 sail lines was divided into two swathes of line azimuth 164.99º, and 344.99° Grid. Pre survey the total sail line kilometres was computed as 439.631 Line 3DODA111180P1005 was aborted early with gun communication problems, therefore a total of 20 sequences were recorded. The line run out was 136 shot points, or 2550 metres. The line turning circle diameter was set at 4000 metre radius. This gave a mean turnaround time of 3.2 hours. The front end of streamer, and array separation were carefully set at deployment. On deployment completion separations were within 10% of intended, with the streamer front ends parallel. At the clients request the steered point for each sail line was the centre of the front of the near mid offsets.
3.2 TIDES CURRENTS AND FEATHER
Any tide, or localised current observed in the project area had no, or very little effect on data acquisition as can be seen from feather angles recorded, and no infill requirements. To emphasise the above, the mean vessel water, and bottom speed was considered unusually constant, with very small crab angles experienced throughout the survey period. The mostly benign sea conditions experienced for the majority of the survey contributed to the resultant zero infill. A Nortek current meter was employed. The instrument displayed previous vessel tracks with associated current vectors. The machine a most useful aid to operations in anticipating feather, and when making turns onto lines. The magnitude of currents observed confirmed all that is said above. Vessel speed and start of line observed weather conditions for each sequence are available in the following file supplied with this report R.Sterling.3D 0il-_12 Strm.NAV Stats
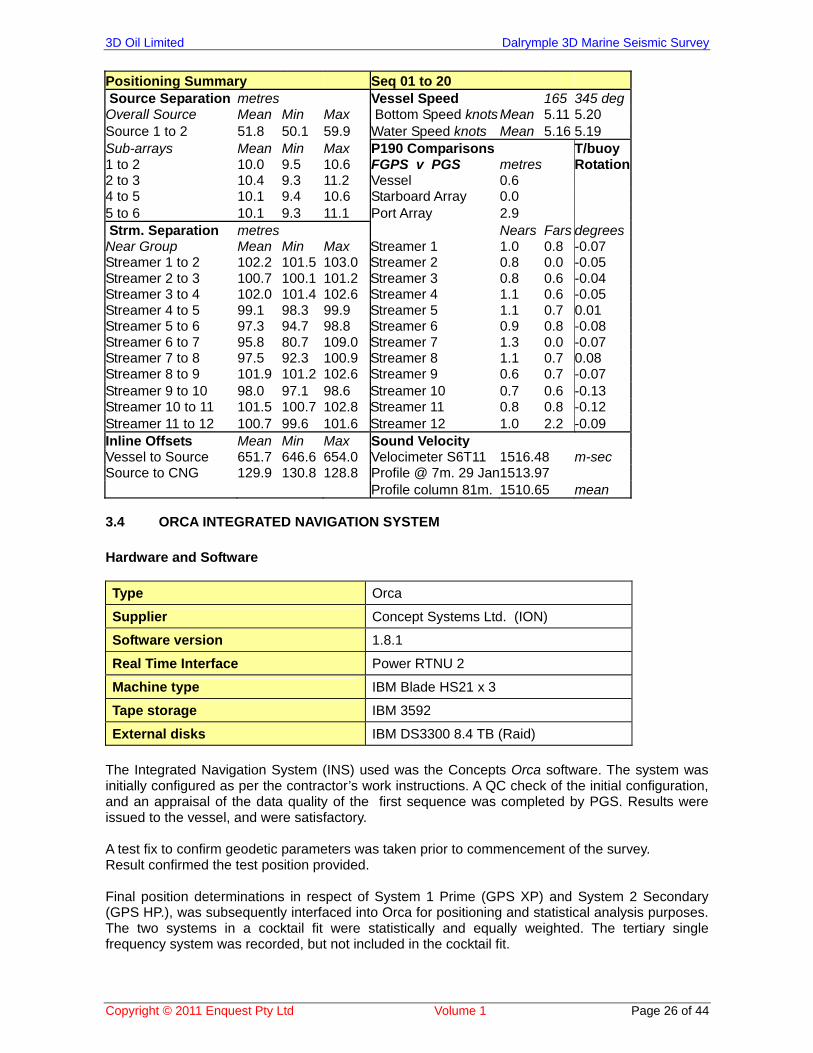
3.3 SOURCE AND STREAMER GEOMETRY
Throughout the survey the vessel to source, and source to streamer geometry was consistent. The mean inline offset from the source to the streamers was 129.8 metres. The average source separation on a line, by line basis was within 10% of 50m, with a survey mean of 51.8m. The gun string separation tolerance of 10% around 10 metres was kept. The front end mean streamer separations were within 5% of 100 metres. The DigiFin Fan Mode was employed from 900 metres along the streamers. The effect on the separations commenced at approximately 1100 metres. The Fan Mode was set at 1.2. A summary of the line by line observed inter-source and streamer measurements, for each line, are available in the following file supplied with this report R.Sterling.3D 0il-_12 Strm.NAV Stats Table 1 Brief Positioning Summary
3D Oil Limited Dalrymple 3D Marine Seismic Survey
Copyright © 2011 Enquest Pty Ltd Volume 1 Page 26 of 44
Positioning Summary Seq 01 to 20 Source Separation metres Vessel Speed 165 345 deg Overall Source Mean Min Max Bottom Speed knots Mean 5.11 5.20 Source 1 to 2 51.8 50.1 59.9 Water Speed knots Mean 5.16 5.19 Sub-arrays Mean Min Max P190 Comparisons T/buoy 1 to 2 10.0 9.5 10.6 FGPS v PGS metres Rotation 2 to 3 10.4 9.3 11.2 Vessel 0.6 4 to 5 10.1 9.4 10.6 Starboard Array 0.0 5 to 6 10.1 9.3 11.1 Port Array 2.9 Strm. Separation metres Nears Fars degrees Near Group Mean Min Max Streamer 1 1.0 0.8 -0.07 Streamer 1 to 2 102.2 101.5 103.0 Streamer 2 0.8 0.0 -0.05 Streamer 2 to 3 100.7 100.1 101.2 Streamer 3 0.8 0.6 -0.04 Streamer 3 to 4 102.0 101.4 102.6 Streamer 4 1.1 0.6 -0.05 Streamer 4 to 5 99.1 98.3 99.9 Streamer 5 1.1 0.7 0.01 Streamer 5 to 6 97.3 94.7 98.8 Streamer 6 0.9 0.8 -0.08 Streamer 6 to 7 95.8 80.7 109.0 Streamer 7 1.3 0.0 -0.07 Streamer 7 to 8 97.5 92.3 100.9 Streamer 8 1.1 0.7 0.08 Streamer 8 to 9 101.9 101.2 102.6 Streamer 9 0.6 0.7 -0.07 Streamer 9 to 10 98.0 97.1 98.6 Streamer 10 0.7 0.6 -0.13 Streamer 10 to 11 101.5 100.7 102.8 Streamer 11 0.8 0.8 -0.12 Streamer 11 to 12 100.7 99.6 101.6 Streamer 12 1.0 2.2 -0.09 Inline Offsets Mean Min Max Sound Velocity Vessel to Source 651.7 646.6 654.0 Velocimeter S6T11 1516.48 m-sec Source to CNG 129.9 130.8 128.8 Profile @ 7m. 29 Jan 1513.97 Profile column 81m. 1510.65 mean
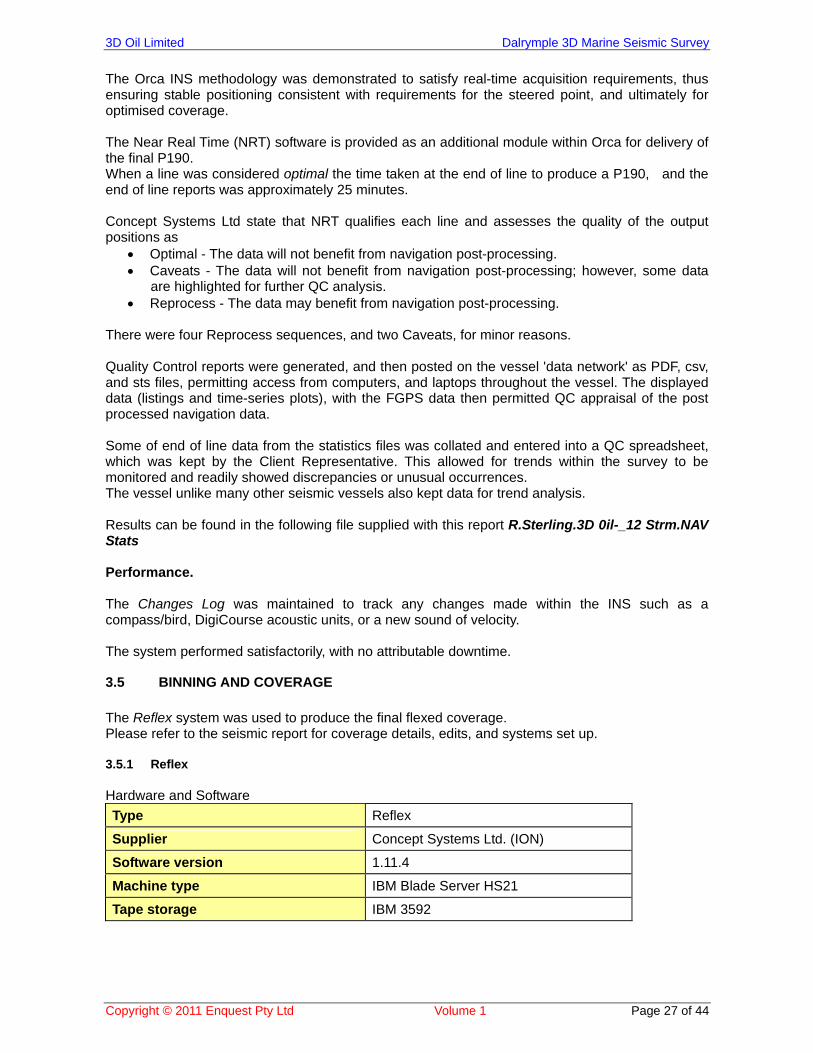
3.4 ORCA INTEGRATED NAVIGATION SYSTEM
Hardware and Software
Type Orca
Supplier Concept Systems Ltd. (ION)
Software version 1.8.1
Real Time Interface Power RTNU 2
Machine type IBM Blade HS21 x 3
Tape storage IBM 3592
External disks IBM DS3300 8.4 TB (Raid)
The Integrated Navigation System (INS) used was the Concepts Orca software. The system was initially configured as per the contractor’s work instructions. A QC check of the initial configuration, and an appraisal of the data quality of the first sequence was completed by PGS. Results were issued to the vessel, and were satisfactory. A test fix to confirm geodetic parameters was taken prior to commencement of the survey. Result confirmed the test position provided. Final position determinations in respect of System 1 Prime (GPS XP) and System 2 Secondary (GPS HP.), was subsequently interfaced into Orca for positioning and statistical analysis purposes. The two systems in a cocktail fit were statistically and equally weighted. The tertiary single frequency system was recorded, but not included in the cocktail fit.
3D Oil Limited Dalrymple 3D Marine Seismic Survey
Copyright © 2011 Enquest Pty Ltd Volume 1 Page 27 of 44
The Orca INS methodology was demonstrated to satisfy real-time acquisition requirements, thus ensuring stable positioning consistent with requirements for the steered point, and ultimately for optimised coverage. The Near Real Time (NRT) software is provided as an additional module within Orca for delivery of the final P190. When a line was considered optimal the time taken at the end of line to produce a P190, and the end of line reports was approximately 25 minutes. Concept Systems Ltd state that NRT qualifies each line and assesses the quality of the output positions as
Optimal - The data will not benefit from navigation post-processing. Caveats - The data will not benefit from navigation post-processing; however, some data
are highlighted for further QC analysis. Reprocess - The data may benefit from navigation post-processing.
There were four Reprocess sequences, and two Caveats, for minor reasons. Quality Control reports were generated, and then posted on the vessel 'data network' as PDF, csv, and sts files, permitting access from computers, and laptops throughout the vessel. The displayed data (listings and time-series plots), with the FGPS data then permitted QC appraisal of the post processed navigation data. Some of end of line data from the statistics files was collated and entered into a QC spreadsheet, which was kept by the Client Representative. This allowed for trends within the survey to be monitored and readily showed discrepancies or unusual occurrences. The vessel unlike many other seismic vessels also kept data for trend analysis. Results can be found in the following file supplied with this report R.Sterling.3D 0il-_12 Strm.NAV Stats Performance. The Changes Log was maintained to track any changes made within the INS such as a compass/bird, DigiCourse acoustic units, or a new sound of velocity. The system performed satisfactorily, with no attributable downtime.
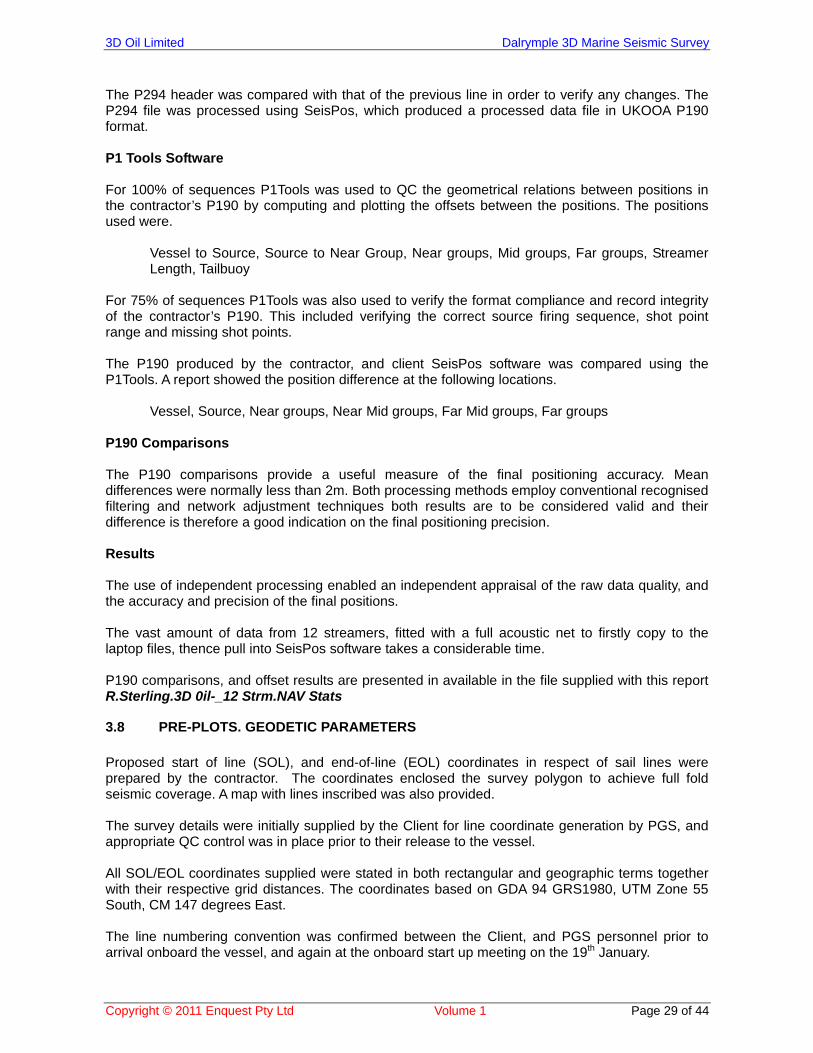
3.5 BINNING AND COVERAGE
The Reflex system was used to produce the final flexed coverage. Please refer to the seismic report for coverage details, edits, and systems set up. 3.5.1 Reflex Hardware and Software
Type Reflex
Supplier Concept Systems Ltd. (ION)
Software version 1.11.4
Machine type IBM Blade Server HS21
Tape storage IBM 3592
3D Oil Limited Dalrymple 3D Marine Seismic Survey
Copyright © 2011 Enquest Pty Ltd Volume 1 Page 28 of 44
The real-time binning was configured to display unflexed coverage in a separate window for each of the four offset groups simultaneously. Existing coverage, a minimum of the nearest two adjacent lines were imported into the online database prior to commencing each line. The offline binning system used the final processed and approved P1/90 data. The flexed coverage was appraised by inspecting electronic displays on the Reflex system. Coverage files were sent to the Client on a regular basis for inspection, and ultimately final coverage decision making. There were no infill requirements, as project coverage specifications were met
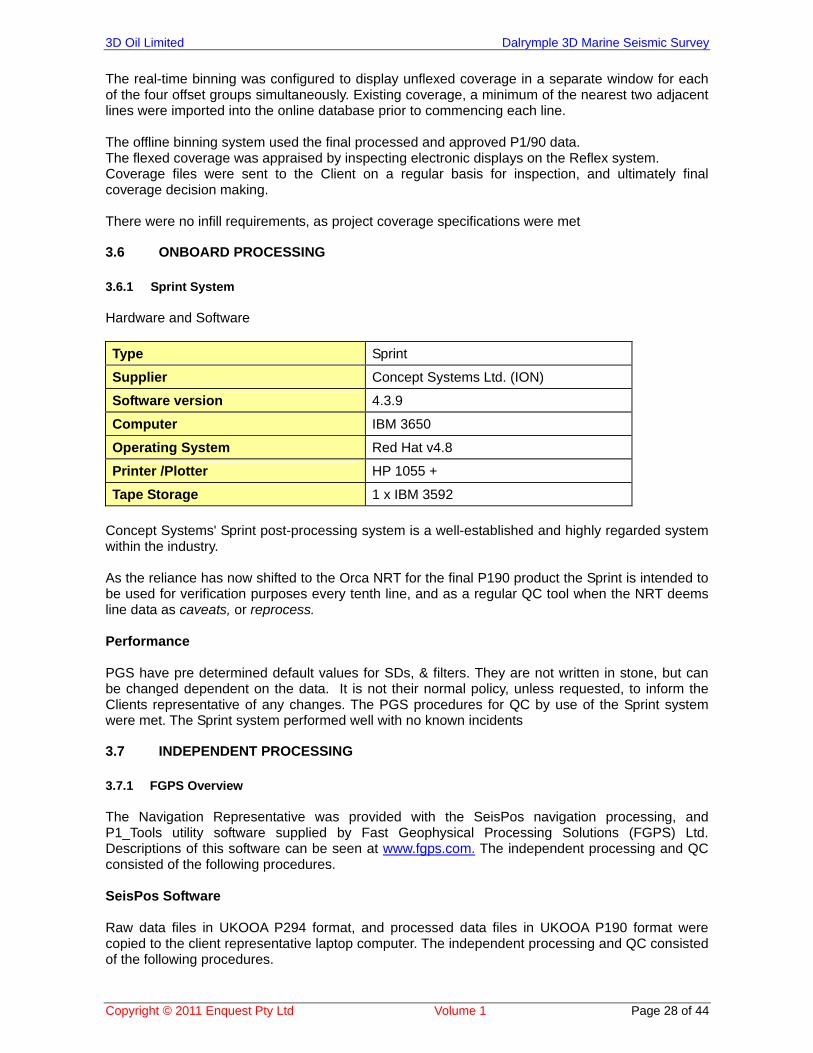
3.6 ONBOARD PROCESSING
3.6.1 Sprint System Hardware and Software
Type Sprint
Supplier Concept Systems Ltd. (ION)
Software version 4.3.9
Computer IBM 3650
Operating System Red Hat v4.8
Printer /Plotter HP 1055 +
Tape Storage 1 x IBM 3592
Concept Systems' Sprint post-processing system is a well-established and highly regarded system within the industry. As the reliance has now shifted to the Orca NRT for the final P190 product the Sprint is intended to be used for verification purposes every tenth line, and as a regular QC tool when the NRT deems line data as caveats, or reprocess. Performance PGS have pre determined default values for SDs, & filters. They are not written in stone, but can be changed dependent on the data. It is not their normal policy, unless requested, to inform the Clients representative of any changes. The PGS procedures for QC by use of the Sprint system were met. The Sprint system performed well with no known incidents
3.7 INDEPENDENT PROCESSING
3.7.1 FGPS Overview The Navigation Representative was provided with the SeisPos navigation processing, and P1_Tools utility software supplied by Fast Geophysical Processing Solutions (FGPS) Ltd. Descriptions of this software can be seen at www.fgps.com. The independent processing and QC consisted of the following procedures. SeisPos Software Raw data files in UKOOA P294 format, and processed data files in UKOOA P190 format were copied to the client representative laptop computer. The independent processing and QC consisted of the following procedures.
3D Oil Limited Dalrymple 3D Marine Seismic Survey
Copyright © 2011 Enquest Pty Ltd Volume 1 Page 29 of 44
The P294 header was compared with that of the previous line in order to verify any changes. The P294 file was processed using SeisPos, which produced a processed data file in UKOOA P190 format. P1 Tools Software For 100% of sequences P1Tools was used to QC the geometrical relations between positions in the contractor’s P190 by computing and plotting the offsets between the positions. The positions used were.
Vessel to Source, Source to Near Group, Near groups, Mid groups, Far groups, Streamer Length, Tailbuoy
For 75% of sequences P1Tools was also used to verify the format compliance and record integrity of the contractor’s P190. This included verifying the correct source firing sequence, shot point range and missing shot points. The P190 produced by the contractor, and client SeisPos software was compared using the P1Tools. A report showed the position difference at the following locations.
Vessel, Source, Near groups, Near Mid groups, Far Mid groups, Far groups P190 Comparisons The P190 comparisons provide a useful measure of the final positioning accuracy. Mean differences were normally less than 2m. Both processing methods employ conventional recognised filtering and network adjustment techniques both results are to be considered valid and their difference is therefore a good indication on the final positioning precision. Results The use of independent processing enabled an independent appraisal of the raw data quality, and the accuracy and precision of the final positions. The vast amount of data from 12 streamers, fitted with a full acoustic net to firstly copy to the laptop files, thence pull into SeisPos software takes a considerable time. P190 comparisons, and offset results are presented in available in the file supplied with this report R.Sterling.3D 0il-_12 Strm.NAV Stats
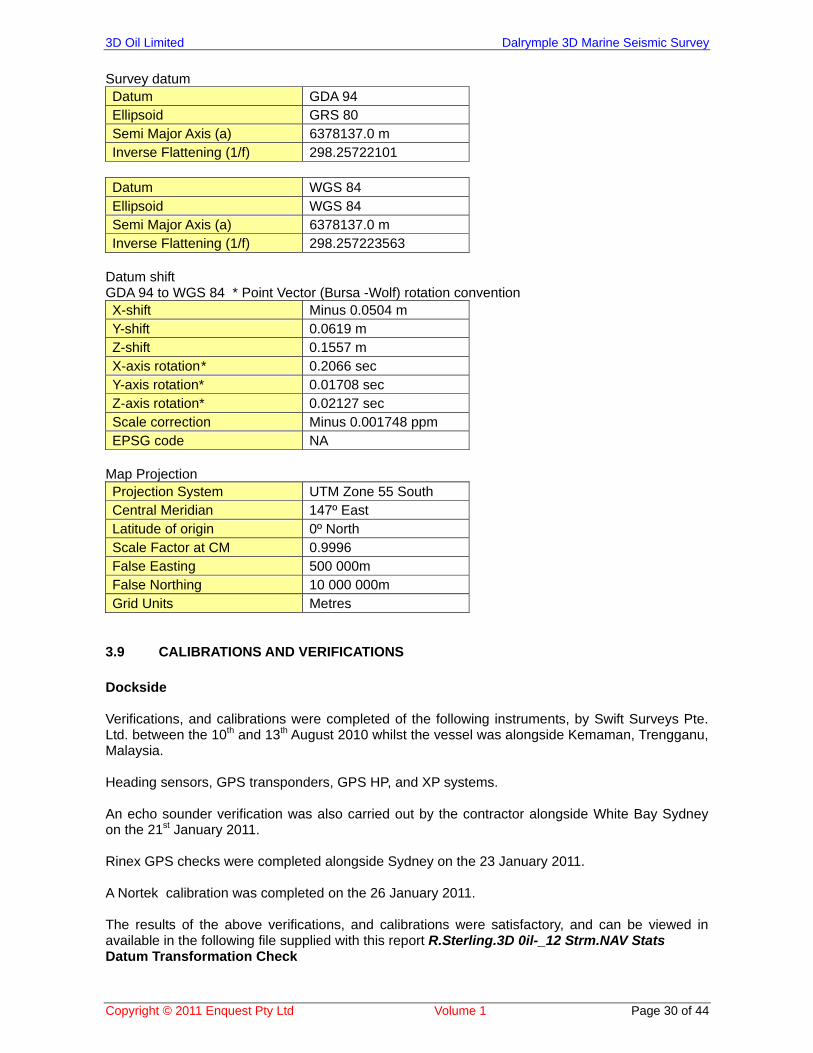
3.8 PRE-PLOTS. GEODETIC PARAMETERS
Proposed start of line (SOL), and end-of-line (EOL) coordinates in respect of sail lines were prepared by the contractor. The coordinates enclosed the survey polygon to achieve full fold seismic coverage. A map with lines inscribed was also provided. The survey details were initially supplied by the Client for line coordinate generation by PGS, and appropriate QC control was in place prior to their release to the vessel. All SOL/EOL coordinates supplied were stated in both rectangular and geographic terms together with their respective grid distances. The coordinates based on GDA 94 GRS1980, UTM Zone 55 South, CM 147 degrees East. The line numbering convention was confirmed between the Client, and PGS personnel prior to arrival onboard the vessel, and again at the onboard start up meeting on the 19th January.
3D Oil Limited Dalrymple 3D Marine Seismic Survey
Copyright © 2011 Enquest Pty Ltd Volume 1 Page 30 of 44
Survey datum Datum GDA 94 Ellipsoid GRS 80 Semi Major Axis (a) 6378137.0 m Inverse Flattening (1/f) 298.25722101
Datum WGS 84 Ellipsoid WGS 84 Semi Major Axis (a) 6378137.0 m Inverse Flattening (1/f) 298.257223563
Datum shift GDA 94 to WGS 84 * Point Vector (Bursa -Wolf) rotation convention X-shift Minus 0.0504 m Y-shift 0.0619 m Z-shift 0.1557 m X-axis rotation * 0.2066 sec Y-axis rotation* 0.01708 sec Z-axis rotation* 0.02127 sec Scale correction Minus 0.001748 ppm EPSG code NA
Map Projection Projection System UTM Zone 55 South Central Meridian 147º East Latitude of origin 0º North Scale Factor at CM 0.9996 False Easting 500 000m False Northing 10 000 000m Grid Units Metres
3.9 CALIBRATIONS AND VERIFICATIONS
Dockside Verifications, and calibrations were completed of the following instruments, by Swift Surveys Pte. Ltd. between the 10th and 13th August 2010 whilst the vessel was alongside Kemaman, Trengganu, Malaysia. Heading sensors, GPS transponders, GPS HP, and XP systems. An echo sounder verification was also carried out by the contractor alongside White Bay Sydney on the 21st January 2011. Rinex GPS checks were completed alongside Sydney on the 23 January 2011. A Nortek calibration was completed on the 26 January 2011. The results of the above verifications, and calibrations were satisfactory, and can be viewed in available in the following file supplied with this report R.Sterling.3D 0il-_12 Strm.NAV Stats Datum Transformation Check
3D Oil Limited Dalrymple 3D Marine Seismic Survey
Copyright © 2011 Enquest Pty Ltd Volume 1 Page 31 of 44
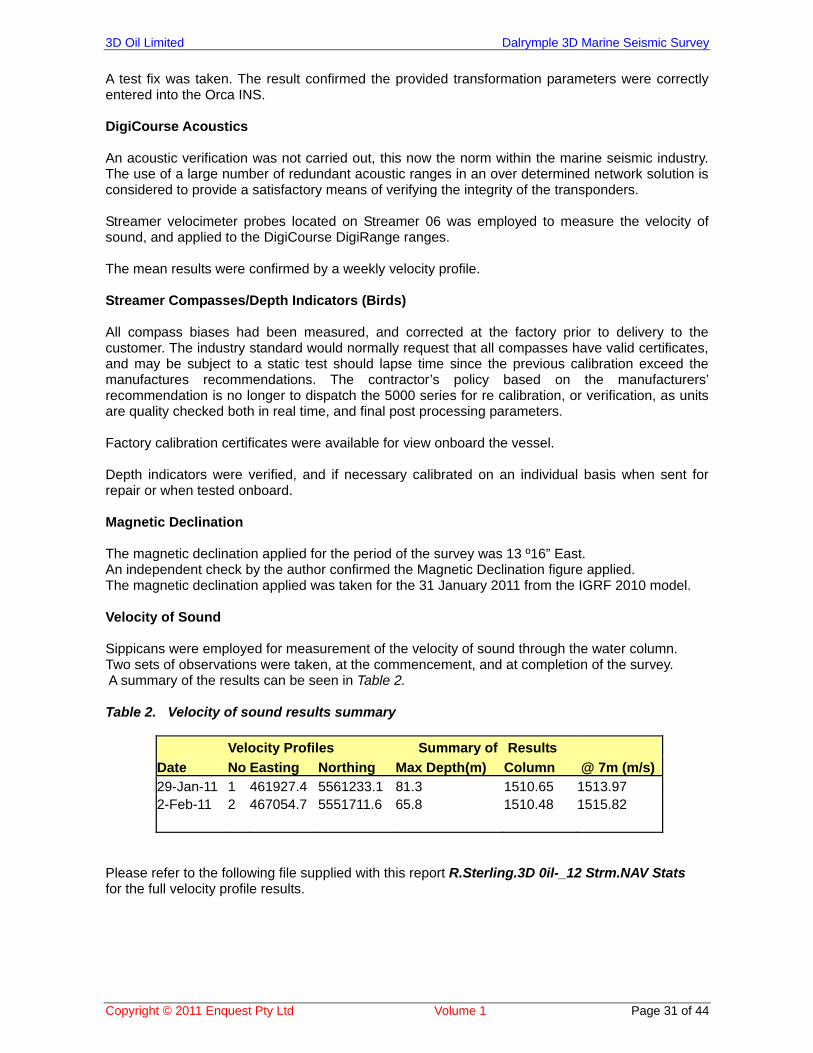
A test fix was taken. The result confirmed the provided transformation parameters were correctly entered into the Orca INS. DigiCourse Acoustics An acoustic verification was not carried out, this now the norm within the marine seismic industry. The use of a large number of redundant acoustic ranges in an over determined network solution is considered to provide a satisfactory means of verifying the integrity of the transponders. Streamer velocimeter probes located on Streamer 06 was employed to measure the velocity of sound, and applied to the DigiCourse DigiRange ranges. The mean results were confirmed by a weekly velocity profile. Streamer Compasses/Depth Indicators (Birds) All compass biases had been measured, and corrected at the factory prior to delivery to the customer. The industry standard would normally request that all compasses have valid certificates, and may be subject to a static test should lapse time since the previous calibration exceed the manufactures recommendations. The contractor’s policy based on the manufacturers’ recommendation is no longer to dispatch the 5000 series for re calibration, or verification, as units are quality checked both in real time, and final post processing parameters. Factory calibration certificates were available for view onboard the vessel. Depth indicators were verified, and if necessary calibrated on an individual basis when sent for repair or when tested onboard. Magnetic Declination The magnetic declination applied for the period of the survey was 13 º16” East. An independent check by the author confirmed the Magnetic Declination figure applied. The magnetic declination applied was taken for the 31 January 2011 from the IGRF 2010 model. Velocity of Sound Sippicans were employed for measurement of the velocity of sound through the water column. Two sets of observations were taken, at the commencement, and at completion of the survey. A summary of the results can be seen in Table 2. Table 2. Velocity of sound results summary
Velocity Profiles Summary of Results
Date No Easting Northing Max Depth(m) Column @ 7m (m/s)29-Jan-11 1 461927.4 5561233.1 81.3 1510.65 1513.97 2-Feb-11 2 467054.7 5551711.6 65.8 1510.48 1515.82
Please refer to the following file supplied with this report R.Sterling.3D 0il-_12 Strm.NAV Stats for the full velocity profile results.
3D Oil Limited Dalrymple 3D Marine Seismic Survey
Copyright © 2011 Enquest Pty Ltd Volume 1 Page 32 of 44
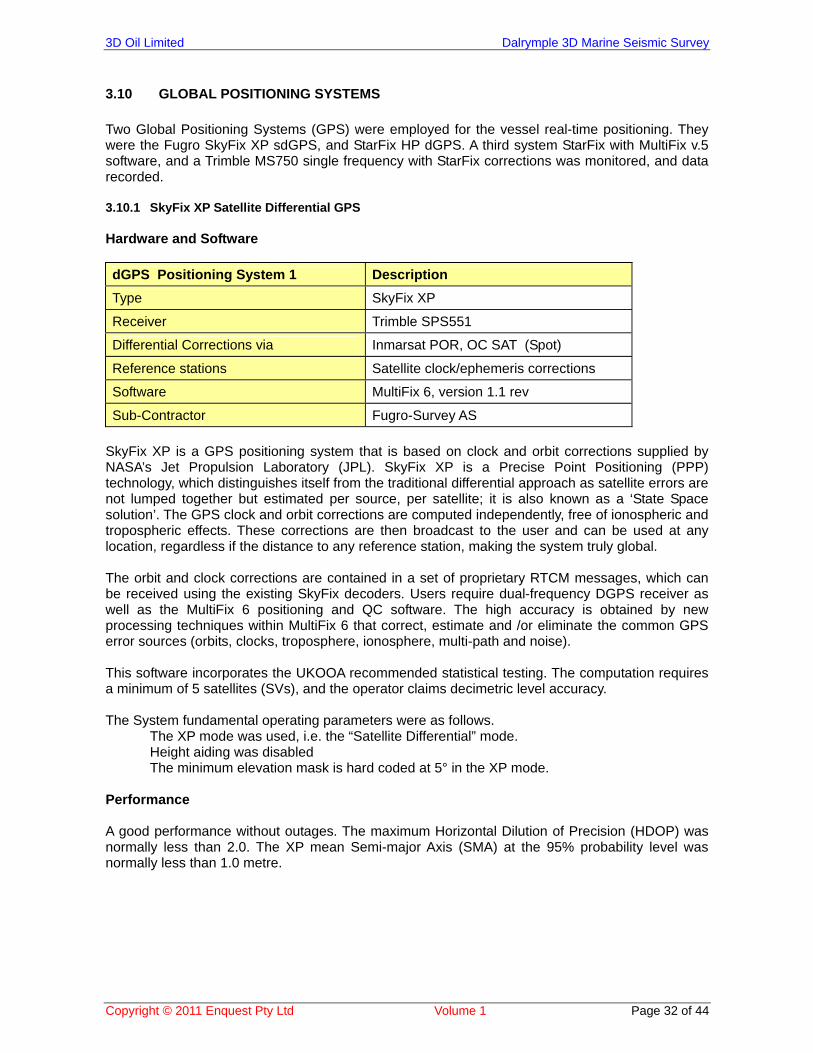
3.10 GLOBAL POSITIONING SYSTEMS
Two Global Positioning Systems (GPS) were employed for the vessel real-time positioning. They were the Fugro SkyFix XP sdGPS, and StarFix HP dGPS. A third system StarFix with MultiFix v.5 software, and a Trimble MS750 single frequency with StarFix corrections was monitored, and data recorded. 3.10.1 SkyFix XP Satellite Differential GPS Hardware and Software
dGPS Positioning System 1 Description
Type SkyFix XP
Receiver Trimble SPS551
Differential Corrections via Inmarsat POR, OC SAT (Spot)
Reference stations Satellite clock/ephemeris corrections
Software MultiFix 6, version 1.1 rev
Sub-Contractor Fugro-Survey AS
SkyFix XP is a GPS positioning system that is based on clock and orbit corrections supplied by NASA’s Jet Propulsion Laboratory (JPL). SkyFix XP is a Precise Point Positioning (PPP) technology, which distinguishes itself from the traditional differential approach as satellite errors are not lumped together but estimated per source, per satellite; it is also known as a ‘State Space solution’. The GPS clock and orbit corrections are computed independently, free of ionospheric and tropospheric effects. These corrections are then broadcast to the user and can be used at any location, regardless if the distance to any reference station, making the system truly global. The orbit and clock corrections are contained in a set of proprietary RTCM messages, which can be received using the existing SkyFix decoders. Users require dual-frequency DGPS receiver as well as the MultiFix 6 positioning and QC software. The high accuracy is obtained by new processing techniques within MultiFix 6 that correct, estimate and /or eliminate the common GPS error sources (orbits, clocks, troposphere, ionosphere, multi-path and noise). This software incorporates the UKOOA recommended statistical testing. The computation requires a minimum of 5 satellites (SVs), and the operator claims decimetric level accuracy. The System fundamental operating parameters were as follows.
The XP mode was used, i.e. the “Satellite Differential” mode. Height aiding was disabled The minimum elevation mask is hard coded at 5° in the XP mode.
Performance A good performance without outages. The maximum Horizontal Dilution of Precision (HDOP) was normally less than 2.0. The XP mean Semi-major Axis (SMA) at the 95% probability level was normally less than 1.0 metre.
3D Oil Limited Dalrymple 3D Marine Seismic Survey
Copyright © 2011 Enquest Pty Ltd Volume 1 Page 33 of 44
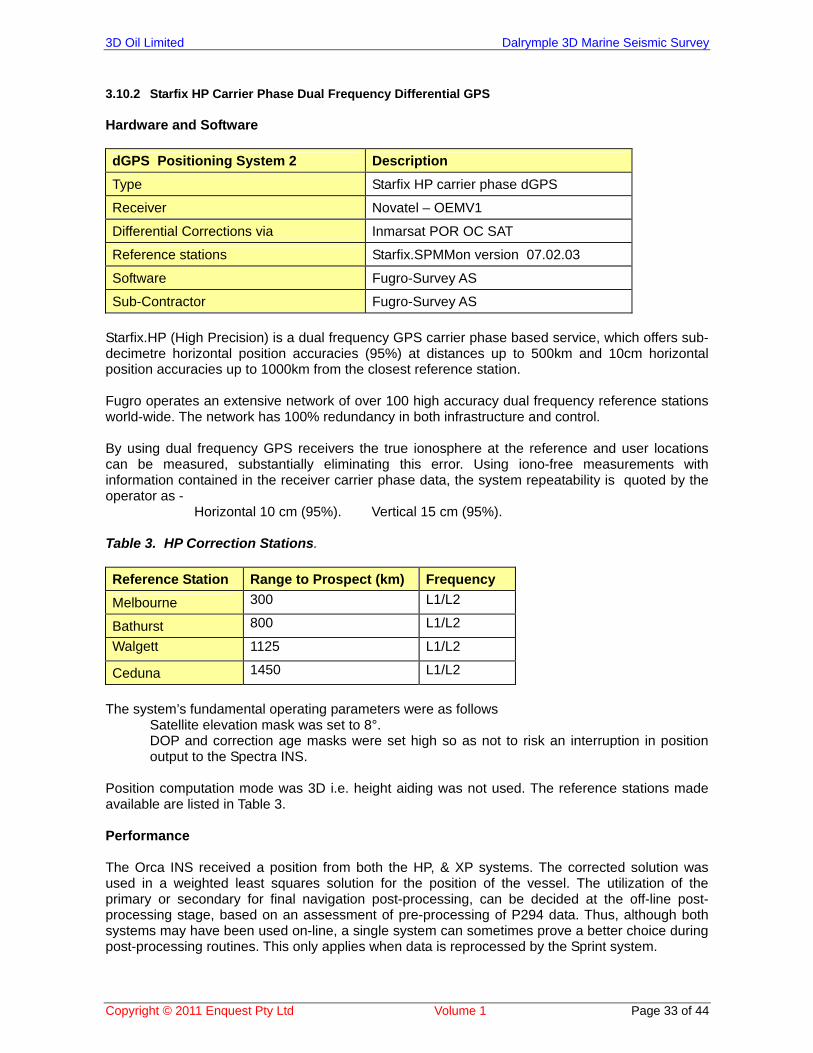
3.10.2 Starfix HP Carrier Phase Dual Frequency Differential GPS Hardware and Software
dGPS Positioning System 2 Description
Type Starfix HP carrier phase dGPS
Receiver Novatel – OEMV1
Differential Corrections via Inmarsat POR OC SAT
Reference stations Starfix.SPMMon version 07.02.03
Software Fugro-Survey AS
Sub-Contractor Fugro-Survey AS
Starfix.HP (High Precision) is a dual frequency GPS carrier phase based service, which offers sub-decimetre horizontal position accuracies (95%) at distances up to 500km and 10cm horizontal position accuracies up to 1000km from the closest reference station. Fugro operates an extensive network of over 100 high accuracy dual frequency reference stations world-wide. The network has 100% redundancy in both infrastructure and control. By using dual frequency GPS receivers the true ionosphere at the reference and user locations can be measured, substantially eliminating this error. Using iono-free measurements with information contained in the receiver carrier phase data, the system repeatability is quoted by the operator as -
Horizontal 10 cm (95%). Vertical 15 cm (95%). Table 3. HP Correction Stations.
Reference Station Range to Prospect (km) Frequency
Melbourne 300 L1/L2
Bathurst 800 L1/L2
Walgett 1125 L1/L2
Ceduna 1450 L1/L2
The system’s fundamental operating parameters were as follows
Satellite elevation mask was set to 8°. DOP and correction age masks were set high so as not to risk an interruption in position output to the Spectra INS.
Position computation mode was 3D i.e. height aiding was not used. The reference stations made available are listed in Table 3. Performance The Orca INS received a position from both the HP, & XP systems. The corrected solution was used in a weighted least squares solution for the position of the vessel. The utilization of the primary or secondary for final navigation post-processing, can be decided at the off-line post-processing stage, based on an assessment of pre-processing of P294 data. Thus, although both systems may have been used on-line, a single system can sometimes prove a better choice during post-processing routines. This only applies when data is reprocessed by the Sprint system.
3D Oil Limited Dalrymple 3D Marine Seismic Survey
Copyright © 2011 Enquest Pty Ltd Volume 1 Page 34 of 44
The blight on the performance of the HP system was sequence 008. A reboot was required at the start of line, and resulted in a settling period. The XP system was employed by Sprint when the line was reprocessed The mean radial distance between the systems for each line was less than 1.0 metre. The maximum Horizontal Dilution of Precision (HDOP) for the StarFix and SkyFix XP was normally less than 2.0. The XP mean Semi-major Axis (SMA) at the 95% probability level was normally less than 1.0 metres. A small number of the statistics available are presented in available in the following file supplied with this report R.Sterling.3D 0il-_12 Strm.NAV Stats
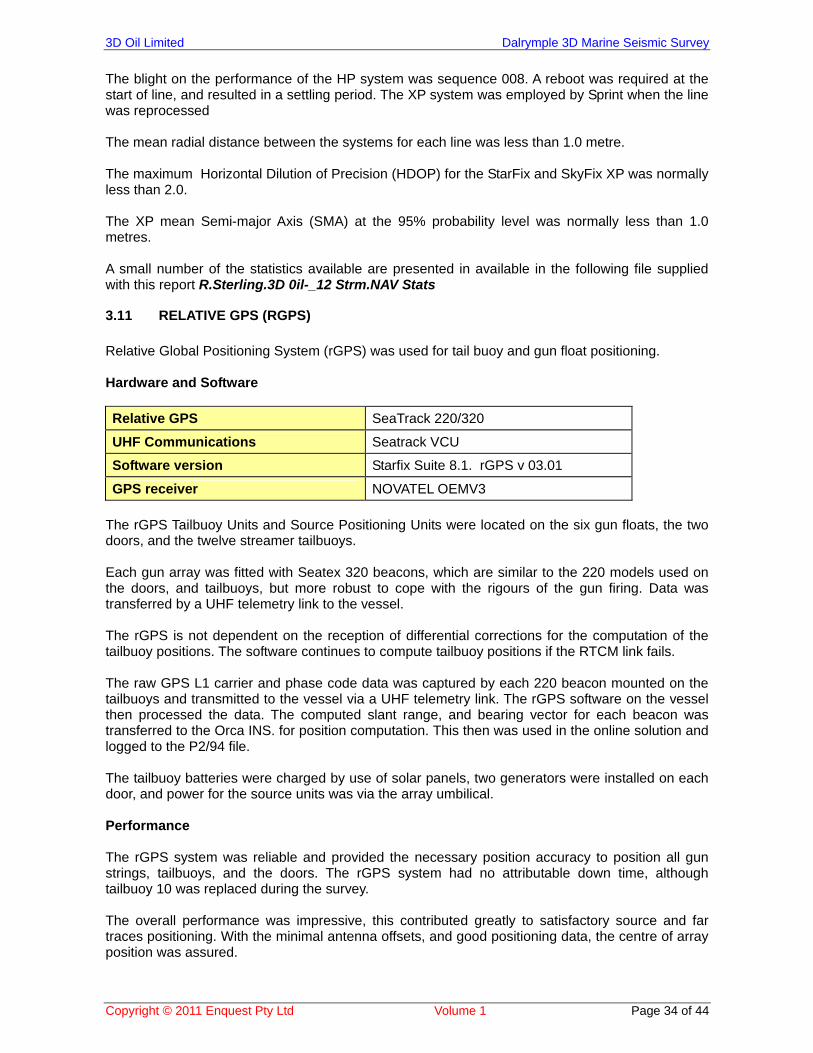
3.11 RELATIVE GPS (RGPS)
Relative Global Positioning System (rGPS) was used for tail buoy and gun float positioning. Hardware and Software
Relative GPS SeaTrack 220/320
UHF Communications Seatrack VCU
Software version Starfix Suite 8.1. rGPS v 03.01
GPS receiver NOVATEL OEMV3
The rGPS Tailbuoy Units and Source Positioning Units were located on the six gun floats, the two doors, and the twelve streamer tailbuoys. Each gun array was fitted with Seatex 320 beacons, which are similar to the 220 models used on the doors, and tailbuoys, but more robust to cope with the rigours of the gun firing. Data was transferred by a UHF telemetry link to the vessel. The rGPS is not dependent on the reception of differential corrections for the computation of the tailbuoy positions. The software continues to compute tailbuoy positions if the RTCM link fails. The raw GPS L1 carrier and phase code data was captured by each 220 beacon mounted on the tailbuoys and transmitted to the vessel via a UHF telemetry link. The rGPS software on the vessel then processed the data. The computed slant range, and bearing vector for each beacon was transferred to the Orca INS. for position computation. This then was used in the online solution and logged to the P2/94 file. The tailbuoy batteries were charged by use of solar panels, two generators were installed on each door, and power for the source units was via the array umbilical. Performance The rGPS system was reliable and provided the necessary position accuracy to position all gun strings, tailbuoys, and the doors. The rGPS system had no attributable down time, although tailbuoy 10 was replaced during the survey. The overall performance was impressive, this contributed greatly to satisfactory source and far traces positioning. With the minimal antenna offsets, and good positioning data, the centre of array position was assured.
3D Oil Limited Dalrymple 3D Marine Seismic Survey
Copyright © 2011 Enquest Pty Ltd Volume 1 Page 35 of 44
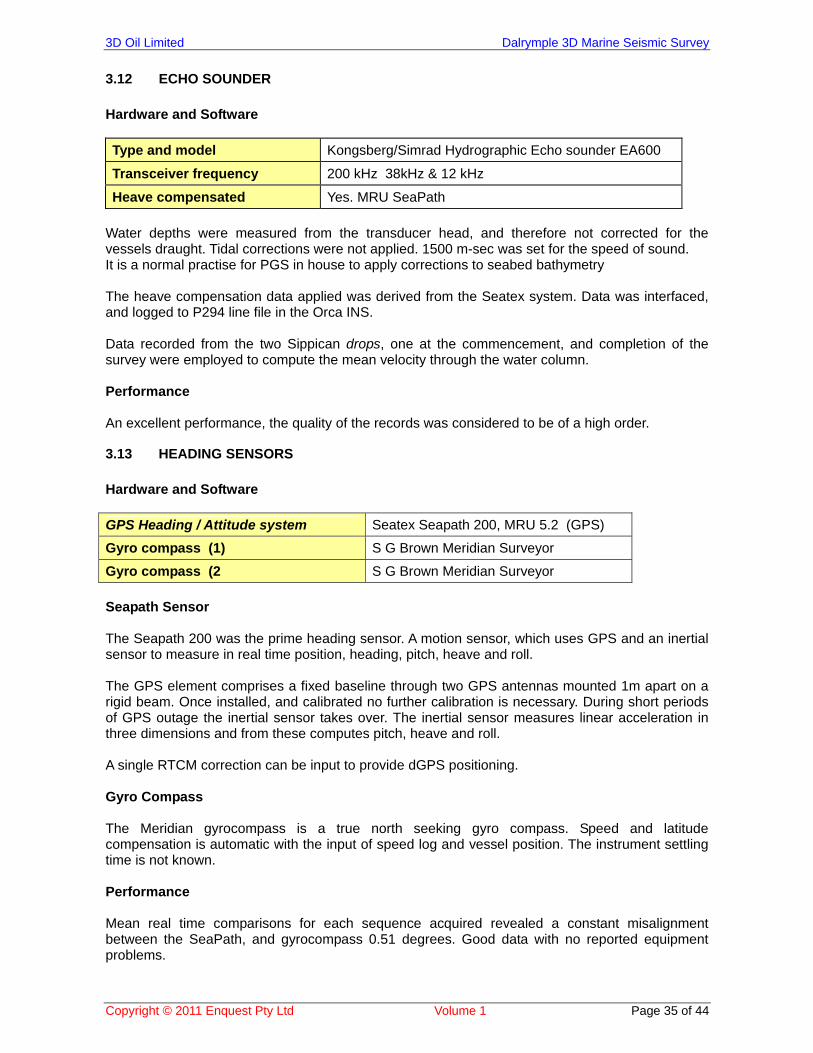
3.12 ECHO SOUNDER
Hardware and Software
Type and model Kongsberg/Simrad Hydrographic Echo sounder EA600
Transceiver frequency 200 kHz 38kHz & 12 kHz
Heave compensated Yes. MRU SeaPath
Water depths were measured from the transducer head, and therefore not corrected for the vessels draught. Tidal corrections were not applied. 1500 m-sec was set for the speed of sound. It is a normal practise for PGS in house to apply corrections to seabed bathymetry The heave compensation data applied was derived from the Seatex system. Data was interfaced, and logged to P294 line file in the Orca INS. Data recorded from the two Sippican drops, one at the commencement, and completion of the survey were employed to compute the mean velocity through the water column. Performance An excellent performance, the quality of the records was considered to be of a high order.
3.13 HEADING SENSORS
Hardware and Software
GPS Heading / Attitude system Seatex Seapath 200, MRU 5.2 (GPS)
Gyro compass (1) S G Brown Meridian Surveyor
Gyro compass (2 S G Brown Meridian Surveyor
Seapath Sensor The Seapath 200 was the prime heading sensor. A motion sensor, which uses GPS and an inertial sensor to measure in real time position, heading, pitch, heave and roll. The GPS element comprises a fixed baseline through two GPS antennas mounted 1m apart on a rigid beam. Once installed, and calibrated no further calibration is necessary. During short periods of GPS outage the inertial sensor takes over. The inertial sensor measures linear acceleration in three dimensions and from these computes pitch, heave and roll. A single RTCM correction can be input to provide dGPS positioning. Gyro Compass The Meridian gyrocompass is a true north seeking gyro compass. Speed and latitude compensation is automatic with the input of speed log and vessel position. The instrument settling time is not known. Performance Mean real time comparisons for each sequence acquired revealed a constant misalignment between the SeaPath, and gyrocompass 0.51 degrees. Good data with no reported equipment problems.
3D Oil Limited Dalrymple 3D Marine Seismic Survey
Copyright © 2011 Enquest Pty Ltd Volume 1 Page 36 of 44
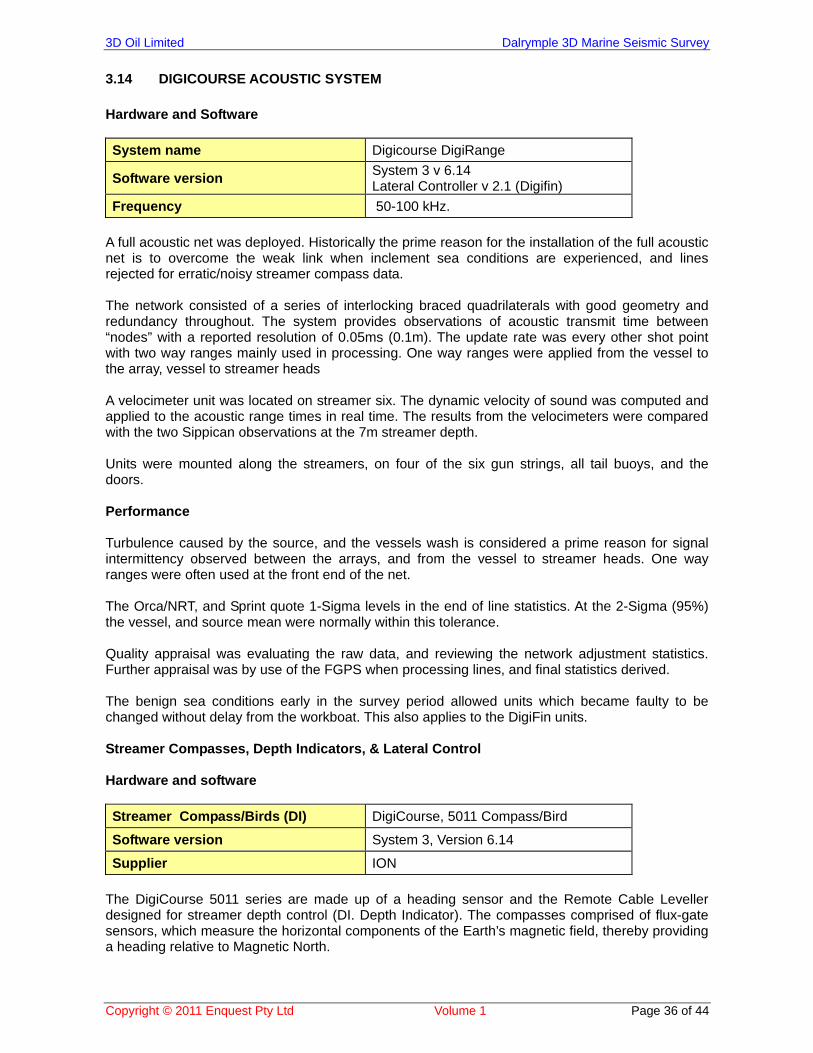
3.14 DIGICOURSE ACOUSTIC SYSTEM
Hardware and Software
System name Digicourse DigiRange
Software version System 3 v 6.14 Lateral Controller v 2.1 (Digifin)
Frequency 50-100 kHz.
A full acoustic net was deployed. Historically the prime reason for the installation of the full acoustic net is to overcome the weak link when inclement sea conditions are experienced, and lines rejected for erratic/noisy streamer compass data. The network consisted of a series of interlocking braced quadrilaterals with good geometry and redundancy throughout. The system provides observations of acoustic transmit time between “nodes” with a reported resolution of 0.05ms (0.1m). The update rate was every other shot point with two way ranges mainly used in processing. One way ranges were applied from the vessel to the array, vessel to streamer heads A velocimeter unit was located on streamer six. The dynamic velocity of sound was computed and applied to the acoustic range times in real time. The results from the velocimeters were compared with the two Sippican observations at the 7m streamer depth. Units were mounted along the streamers, on four of the six gun strings, all tail buoys, and the doors. Performance Turbulence caused by the source, and the vessels wash is considered a prime reason for signal intermittency observed between the arrays, and from the vessel to streamer heads. One way ranges were often used at the front end of the net. The Orca/NRT, and Sprint quote 1-Sigma levels in the end of line statistics. At the 2-Sigma (95%) the vessel, and source mean were normally within this tolerance. Quality appraisal was evaluating the raw data, and reviewing the network adjustment statistics. Further appraisal was by use of the FGPS when processing lines, and final statistics derived. The benign sea conditions early in the survey period allowed units which became faulty to be changed without delay from the workboat. This also applies to the DigiFin units. Streamer Compasses, Depth Indicators, & Lateral Control Hardware and software
Streamer Compass/Birds (DI) DigiCourse, 5011 Compass/Bird
Software version System 3, Version 6.14
Supplier ION
The DigiCourse 5011 series are made up of a heading sensor and the Remote Cable Leveller designed for streamer depth control (DI. Depth Indicator). The compasses comprised of flux-gate sensors, which measure the horizontal components of the Earth’s magnetic field, thereby providing a heading relative to Magnetic North.
3D Oil Limited Dalrymple 3D Marine Seismic Survey
Copyright © 2011 Enquest Pty Ltd Volume 1 Page 37 of 44
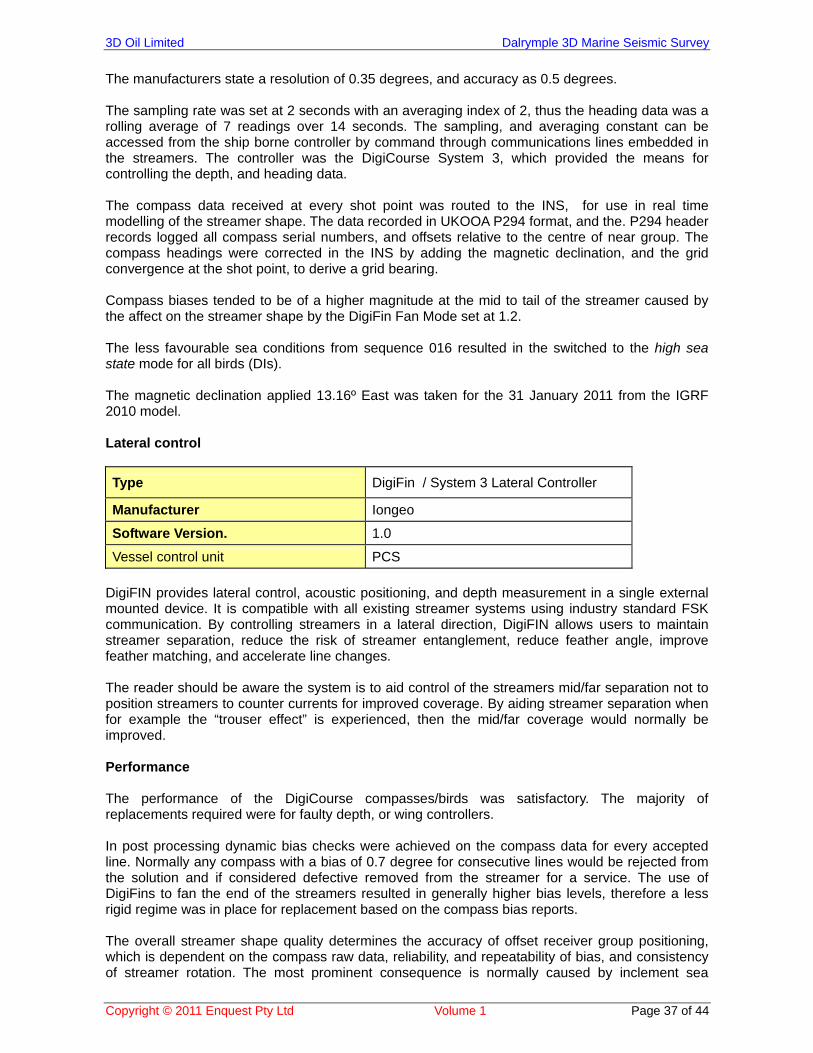
The manufacturers state a resolution of 0.35 degrees, and accuracy as 0.5 degrees. The sampling rate was set at 2 seconds with an averaging index of 2, thus the heading data was a rolling average of 7 readings over 14 seconds. The sampling, and averaging constant can be accessed from the ship borne controller by command through communications lines embedded in the streamers. The controller was the DigiCourse System 3, which provided the means for controlling the depth, and heading data. The compass data received at every shot point was routed to the INS, for use in real time modelling of the streamer shape. The data recorded in UKOOA P294 format, and the. P294 header records logged all compass serial numbers, and offsets relative to the centre of near group. The compass headings were corrected in the INS by adding the magnetic declination, and the grid convergence at the shot point, to derive a grid bearing. Compass biases tended to be of a higher magnitude at the mid to tail of the streamer caused by the affect on the streamer shape by the DigiFin Fan Mode set at 1.2. The less favourable sea conditions from sequence 016 resulted in the switched to the high sea state mode for all birds (DIs). The magnetic declination applied 13.16º East was taken for the 31 January 2011 from the IGRF 2010 model. Lateral control
Type DigiFin / System 3 Lateral Controller
Manufacturer Iongeo
Software Version. 1.0
Vessel control unit PCS
DigiFIN provides lateral control, acoustic positioning, and depth measurement in a single external mounted device. It is compatible with all existing streamer systems using industry standard FSK communication. By controlling streamers in a lateral direction, DigiFIN allows users to maintain streamer separation, reduce the risk of streamer entanglement, reduce feather angle, improve feather matching, and accelerate line changes. The reader should be aware the system is to aid control of the streamers mid/far separation not to position streamers to counter currents for improved coverage. By aiding streamer separation when for example the “trouser effect” is experienced, then the mid/far coverage would normally be improved. Performance The performance of the DigiCourse compasses/birds was satisfactory. The majority of replacements required were for faulty depth, or wing controllers. In post processing dynamic bias checks were achieved on the compass data for every accepted line. Normally any compass with a bias of 0.7 degree for consecutive lines would be rejected from the solution and if considered defective removed from the streamer for a service. The use of DigiFins to fan the end of the streamers resulted in generally higher bias levels, therefore a less rigid regime was in place for replacement based on the compass bias reports. The overall streamer shape quality determines the accuracy of offset receiver group positioning, which is dependent on the compass raw data, reliability, and repeatability of bias, and consistency of streamer rotation. The most prominent consequence is normally caused by inclement sea
3D Oil Limited Dalrymple 3D Marine Seismic Survey
Copyright © 2011 Enquest Pty Ltd Volume 1 Page 38 of 44
conditions, and high dynamics inducing noisy/erratic compass observations, and not effectively filtered (real time averaging). The increase in the sea state at the later stages of the survey was reflected in the more noisy compass data. Streamer rotations (misclosures) were monitored to ensure that the magnetic declination adopted was appropriate for the survey. Streamer rotation is the dynamic correlation of the far receiver groups’ position derived by a compass traverse, and a tail end network solution. The mean recorded rotation was less than 0.3 degrees, a good indication that the front end positioning was sound, and the Magnetic Declination applied was correct. There were no magnetic anomalies observed within the survey area.
3.15 VELOCITY OF SOUND MEASUREMENT DEVICES
Two instruments were used for velocity of sound observations. Two Sippican drops from the Ramform Sterling at the start, and end of the survey. A velocimeter installed on streamer six. The second method for the observation of the velocity of sound was by the use of a DigiCourse velocimeter unit mounted in the vicinity of S6T11. The velocity of sound was measured by “direct time of flight” method. The dynamic speed of sound computed was applied, and converted the DigiCourse DigiRange acoustic range times. The result were compared with the Sippican result at 7m water depth. Performance No problems were seen, or reported with the Instruments. The velocity profile results, and the mean velocity of sound for each line produced by the velocimeters can be viewed in the following file supplied with this report R.Sterling.3D 0il-_12 Strm.NAV Stats
3.16 CURRENT METER
A Nortek Acoustic Doppler Current Profiler (ADCP) was used continuously during the survey. The Instrument consists of three sonar transducers at 120° angular spacing which transmit acoustic energy and receives the resultant reflected energy from water born particles. By measuring the Doppler shift on the received energy it is possible to derive the water flow at the target area. Normally the transducers are orientated vertically by 25º. By segmenting the time of the acoustic returns the current can be measured at different ranges and therefore different depths. The orientation and movement is corrected by interface of the vessel heading, speed, gyro compass, and position. The Nortek current meter is normally used to display previous vessel tracks with associated current vectors. This is a useful aid to operations in anticipating feather and planning line changes. A further useful application is in anticipating streamer movement during periods when streamer depths are variable e.g. during deployment and maintenance. For calibration purposes the vessel sails for ten minutes in one direction, then ten minutes on the reciprocal course. The recorded files are used by the Nortek system to calculate any corrections required due to errors such as orientation of the sensor head. This operation was not witnessed on this survey, but was completed prior to the survey. Performance A most useful, and underrated tool, and is recommended for any future survey. No problems were reported, or seen with the onboard system.
3D Oil Limited Dalrymple 3D Marine Seismic Survey
Copyright © 2011 Enquest Pty Ltd Volume 1 Page 39 of 44
4 ENVIRONMENT
4.1 WEATHER
Weather conditions were sent to the vessel on a regular basis through Offshore Weather Services. Weather conditions for the survey period were generally good with a consistent 2 to 3 metre swell from the south west. Conditions on February 1 had been deteriorating throughout the morning and the streamer was set at 8.0 metres for sequence 015 and all subsequent sequences. The survey period was too short to detect any weather pattern.
4.2 TIDES, CURRENT AND FEATHER
The survey was conducted in 75.0 metre depth. There was little to no tidal or current effect on this survey. Feather angles were low.
4.3 NAVIGATION HAZARDS
The survey is located in an area with water depths ranging from 73m to 75m. No shallows, obstructions or hazards were expected in the area.
4.4 ENVIRONMENTAL
In keeping with modern survey practice environmental protection played an important role in the operating practices of PGS, in line with Origin's own environmental concerns and the contract requirements. Survey operations were carried out under procedures designed to minimise any environmental impact at all times. There was no off shore refuelling during the survey. Great care was taken to follow International Maritime Regulations with regard to the disposal of garbage and waste. The Ramform Sterling is equipped with an incinerator and such items that could be burnt were. Ash from the incinerator was collected and stored for disposal ashore. Putrescibles were macerated and discharged over the side in compliance with MARPOL regulations. Garbage that was unsuitable for burning was segregated and stored on board the vessel for proper disposal ashore. In addition the ship operates a garbage separation scheme to separate plastics, glass and metal waste. Hazardous wastes such as lithium batteries and chemicals were stored for proper disposal under the manufacturer’s guidelines. The overall environmental performance of the crew was up to modern industry standards with no garbage disposal to the sea.
4.5 CETACEAN REPORTING
The survey was carried out outside of the known whale migration period. All watch keepers were instructed to keep watch for any Cetaceans. A dedicated MMO was engaged for the survey and has submitted a separate report for the survey. On all lines, the acoustic energy source was gradually brought up to maximum capacity over a 35-minute period (soft start) to give sufficient notice to any marine life that might have been in the area.
4.6 FISHING
There was no fishing activity in the area. The Ramform Sterling broadcast the position and intent during the day. A notice to mariners regarding the time and place of the survey was posted prior to the start of survey.
3D Oil Limited Dalrymple 3D Marine Seismic Survey
Copyright © 2011 Enquest Pty Ltd Volume 1 Page 40 of 44
4.7 CORAL REEFS
There are no shallow reefs shown in charts of the survey area and none were observed during the course of the survey.
4.8 CONCLUSION
The Ramform Sterling and associated operations had no detrimental impact on the local environment during the seismic survey. The only discharges into the sea were sewage waste, which fell within MARPOL guidelines.
5 INSTRUMENT TESTS
The Daily tests consist of 10 files which can be recorded to Tape or outputted as a text file. The Tests can be run either manually or from the default scripts on the gAS recording system. These tests were as follows Standard gAS Instrument tests run and recorded daily and monthly * Field Capacitance * Field Noise * Field Cut Off * Field Impulse * Instrument noise * Instrument common mode * Instrument distortion * Instrument crosstalk * Instrument gain/phase * Instrument pulse The consistency of the instrument tests throughout the survey verified the system. Comparing results from all the instrument tests showed that the system was stable and in specification throughout the survey.
3D Oil Limited Dalrymple 3D Marine Seismic Survey
Copyright © 2011 Enquest Pty Ltd Volume 1 Page 41 of 44
6 DIARY
January 26th 2011 Start Category Comment
000000 MO Ramform Sterling in transit from Sydney, Australia to the 3D Oil deployment area in Bass Strait.
100000 MO Nortek temperature and current probe deployed. Deployment of streamers #1 and #12 continued through the day.
January 27th 2011 Start Category Comment 000000 MO Streamers number 1, 2, 11,& 12 out and set to 17 metres 054500 MO Streamer deployment continues. January 28th 2011 Start Category Comment 000000 MO Streamer deployment and adjustments through out the day January 29th 2011 Start Category Comment 000000 MO Streamers deployed and set out on their marks. 023700 MO Deploying source arrays. 062400 MO Running a test line. 070500 MO Running bubble test. 084000 MO Cycle Test 090600 MO Vessel running towards line 3DODA111228P1001 100500 PR Recording line 3DODA111228P1001 132600 PR Line change to line 1444162600 SB Line change extended due to survey shape. 171000 PR Recording line 3DODA111444P1002 184600 PR Line change to line 1204 214600 SB Line change extended due to tear drop turn. 215100 PR Recording line 3DODA111204P1003 January 30th 2011 Start Category Comment 000000 PR Recording line 3DODA111204P1003 011100 PR Line change to line 3DODA111420P1004 041100 SB Line change extended due to survey layout. 044900 PR Recording line 3DODA111420P1004 062400 PR Line change to line 3DODA111180P1005092400 SB Line change extended due to survey layout 093200 PR Recording line 3DODA111180P1005 115100 DT Line change on to line 1396 while source array #01 was being repaired 151200 PR Recording line 3DODA111396P1006 164500 PR Line change to line 3DODA111156P1007 194500 SB Extended line change due to survey shape194600 PR Recording line 3DODA111156P1007 225900 PR Line change to line 3DODA111372P1008 January 31st 2011 Start Category Comment 000000 PR Line change to line 3DODA111372P1008 015900 SB Line change extended due to survey layout 023000 PR Recording line 3DODA111372P1008
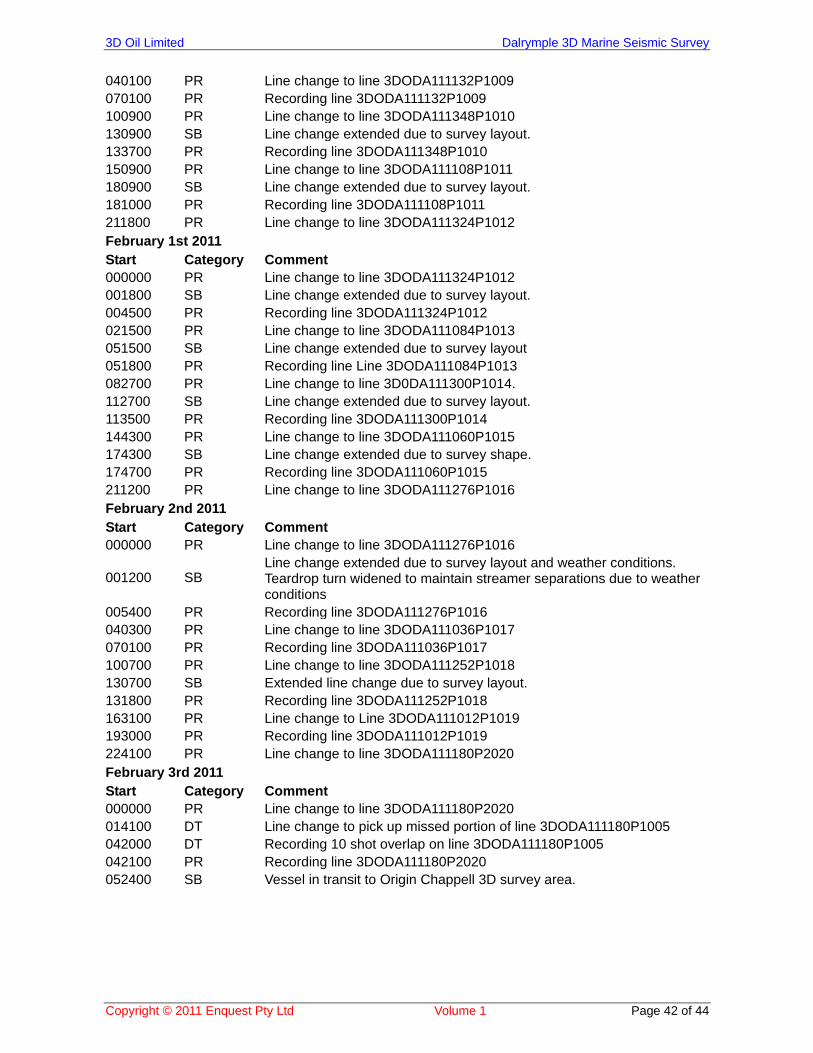
3D Oil Limited Dalrymple 3D Marine Seismic Survey
Copyright © 2011 Enquest Pty Ltd Volume 1 Page 42 of 44
040100 PR Line change to line 3DODA111132P1009 070100 PR Recording line 3DODA111132P1009 100900 PR Line change to line 3DODA111348P1010130900 SB Line change extended due to survey layout.133700 PR Recording line 3DODA111348P1010 150900 PR Line change to line 3DODA111108P1011 180900 SB Line change extended due to survey layout. 181000 PR Recording line 3DODA111108P1011 211800 PR Line change to line 3DODA111324P1012 February 1st 2011 Start Category Comment 000000 PR Line change to line 3DODA111324P1012 001800 SB Line change extended due to survey layout. 004500 PR Recording line 3DODA111324P1012 021500 PR Line change to line 3DODA111084P1013051500 SB Line change extended due to survey layout 051800 PR Recording line Line 3DODA111084P1013 082700 PR Line change to line 3D0DA111300P1014. 112700 SB Line change extended due to survey layout. 113500 PR Recording line 3DODA111300P1014 144300 PR Line change to line 3DODA111060P1015 174300 SB Line change extended due to survey shape. 174700 PR Recording line 3DODA111060P1015 211200 PR Line change to line 3DODA111276P1016 February 2nd 2011 Start Category Comment 000000 PR Line change to line 3DODA111276P1016
001200 SB Line change extended due to survey layout and weather conditions. Teardrop turn widened to maintain streamer separations due to weather conditions
005400 PR Recording line 3DODA111276P1016040300 PR Line change to line 3DODA111036P1017 070100 PR Recording line 3DODA111036P1017 100700 PR Line change to line 3DODA111252P1018 130700 SB Extended line change due to survey layout. 131800 PR Recording line 3DODA111252P1018 163100 PR Line change to Line 3DODA111012P1019 193000 PR Recording line 3DODA111012P1019 224100 PR Line change to line 3DODA111180P2020 February 3rd 2011 Start Category Comment 000000 PR Line change to line 3DODA111180P2020 014100 DT Line change to pick up missed portion of line 3DODA111180P1005 042000 DT Recording 10 shot overlap on line 3DODA111180P1005 042100 PR Recording line 3DODA111180P2020 052400 SB Vessel in transit to Origin Chappell 3D survey area.
3D Oil Limited Dalrymple 3D Marine Seismic Survey
Copyright © 2011 Enquest Pty Ltd Volume 1 Page 43 of 44
7 PGS GEOPHYSICAL CONVENTIONS AND TERMINOLOGY
Glossary Active Active streamer section
BCU Bird Compass Unit, Digicourse series depth / compass unit
LAUM Streamer electronics module
dGPS Differential Global Positioning System. Satellite navigation systems
MOB Man overboard boat. A fast rescue craft designed for emergencies
SeaTRAK MarkII Data acquisition, streamer interface and recording system
Inmarsat B Telecom satellite communication system
DNP Do Not Process. Data acquired but not accepted.
rGPS Relative GPS system used for positioning source and tailbuoys
SPU Source Positioning Unit. rGPS units situated on sub-arrays
ORCA Real Time navigation system
SeisQC Seismic processing system
ION DigiSHOT Digital energy source timing system
SPRINT Navigation QC system
8 LINE AND SHOT POINT NUMBER CONVENTIONS
Line/Job prefix 3DODA11. Sail Line Format Sail line numbers had the format 3DODA-xxxxyy-zzz, where 3DODA = ORIGIN ENERGY survey identifier
11 = Year of acquisition xxxx = Sail line number yy = P, Primary, R, Reshoot or I, Infill zzz = sequence number Shot Point numbers Incremented to the South Decremented to the North.
9 DESCRIPTION OF LINE LOG CONTENTS
The following provides details of the data recorded for each line in the Observers Line Logs. All items appear on the individual Line Logs found on the CD accompanying this report. Line Statistics Seq. Sequence number of line (Order in which lines were shot) Sail Line Client specified line number Date Date on which line was started Dir. Nominal line heading Start Time Time of start of line, local time
3D Oil Limited Dalrymple 3D Marine Seismic Survey
Copyright © 2011 Enquest Pty Ltd Volume 1 Page 44 of 44
End Time Time of end of line, local time. SOL Start of line column heading EOL End of line column heading FSP First Shotpoint LSP Last Shotpoint KM Total kilometres recorded KMFF Total kilometres full fold CMP Common mid point SQKMFF Square Kilometres Full Fold Vessel Speed Vessels speed in knots at the start and end of the line. Environment Wind Speed Average wind speed in knots Wind Dir. Average direction of wind Water Depth Water depth below the transducer at the start and end of line Swell Average swell height at the Start and End of line. Sea State Sea conditions i.e. slight, moderate or rough at BOL/EOL Streamers SOL noise Ambient RMS streamer noise calculated at start of line EOL noise Ambient RMS streamer noise calculated at end of line Bad Channels The number of defective channels on the streamer.
These can be classed as bad for several reasons, dead, noisy, spiking, leaking etc.
Feather The angle the streamer deviates off the line heading, negative numbers indicate port, positive numbers indicate starboard Summary Status Whether line complete or incomplete Comments General summary of line quality and any particular aspect of the line which may require special attention. Bad Records The number of bad shots or records on the line.
FINAL ACQUISITION REPORT
For the
DALRYMPLE 3D MARINE SEISMIC SURVEY
Conducted by
3D OIL LIMITED
In The Exploration Licence Area
T/41P BASS BASIN
TASMANIA
SURVEY START DATE 29th January 2011 SURVEY COMPLETION DATE 3rd February 2011
Volume 2 Marine Mammal Observations and Compliance
Compiled by Fiona Macknight
February 2011
The format, scope and content of this report were developed by ENQUEST Pty. Ltd. and, as such, remain the property of that company. No copies of this
document shall be made without the explicit written permission of ENQUEST Pty. Ltd.
3D Oil Limited Dalrymple 3D Marine Seismic Survey
Copyright © 2011 Enquest Pty Ltd Volume 2 Page 2 of 19
1 EXECUTIVE SUMMARY ........................................................................................................... 3
2 INTRODUCTION ....................................................................................................................... 4
2.1 CETACEAN MONITORING PROGRAM............................................................................ 4
2.2 ENVIRONMENTAL APPROVALS AND PERMITS ............................................................ 6
2.3 VESSEL SPECIFICATIONS AND SEISMIC CONFIGURATION ....................................... 6
3 METHODOLOGY ...................................................................................................................... 6
3.1 CETACEAN MONITORING ............................................................................................... 6
3.2 SPECIES IDENTIFICATION .............................................................................................. 6
3.3 CALIBRATION OF RANGE FINDING BINOCULARS ....................................................... 7
3.4 ENVIRONMENTAL AND METEOROLOGICAL DATA ....................................................... 7
3.5 OTHER MARINE FAUNA .................................................................................................. 7
3.6 SEISMIC PROTOCOL ....................................................................................................... 8
3.7 NAMES, QUALIFICATIONS AND EXPERIENCE OF MARINE MAMMAL OBSERVER ... 8
4 RESULTS .................................................................................................................................. 9
4.1 SIGHTING DATA ............................................................................................................... 9
4.2 VISUAL OBSERVATIONS OVERVIEW ............................................................................. 9
4.3 MITIGATION ACTION DUE TO MARINE MAMMALS ....................................................... 9
4.4 SEISMIC OVERVIEW ........................................................................................................ 9
4.5 SOFT STARTS ................................................................................................................ 10
4.6 OTHER MARINE FAUNA ................................................................................................ 10
5 DISCUSSION ........................................................................................................................... 11
6 REFERENCES ........................................................................................................................ 12
7 APPENDIX 1 - SEWPAC REFERRAL DECISION .................................................................. 13
8 APPENDIX 2 - MARINE MAMMAL SIGHTING SUMMARY ................................................... 17
3D Oil Limited Dalrymple 3D Marine Seismic Survey
Copyright © 2011 Enquest Pty Ltd Volume 2 Page 3 of 19
1 EXECUTIVE SUMMARY
This report presents results of the marine mammal monitoring and observation program
undertaken as part of the Dalrymple 3D Seismic Acquisition Survey - commissioned by 3D Oil
Limited and conducted by an experienced marine mammal observer between 26th January and 3rd
February 2011.
A total of 14 sightings of marine mammals were reported. This included 6 sightings of common
dolphins (Delphinis delphis), 1 sighting of unidentified small cetaceans (USC) and 6 sightings of fur
seals (Arctocephalus spp.). One sighting of a ‘species of concern’ was reported but could not be
positively identified and is logged as an unidentified large cetacean. However, it remained beyond
the observation zone and no mitigation action as per the EPBC Policy Statement 2.1 was required.
The total survey hours was 203.02 hrs with production extending for 51.17 hrs. Visual
observations were conducted for a total of 102.58hrs across a total of eight days (incl.
Deployment). This represents 50.53% of total survey hours.
Throughout the duration of the survey a high level of communication between the observers,
seismic operators and marine crews on board the vessels ensured the Department of
Sustainability, Environment, Water, Population and Communities (SEWPAC) Policy Statement for
minimising acoustic disturbance to marine mammals was implemented and consistent with the
environmental objectives for 3D Oil Limited.
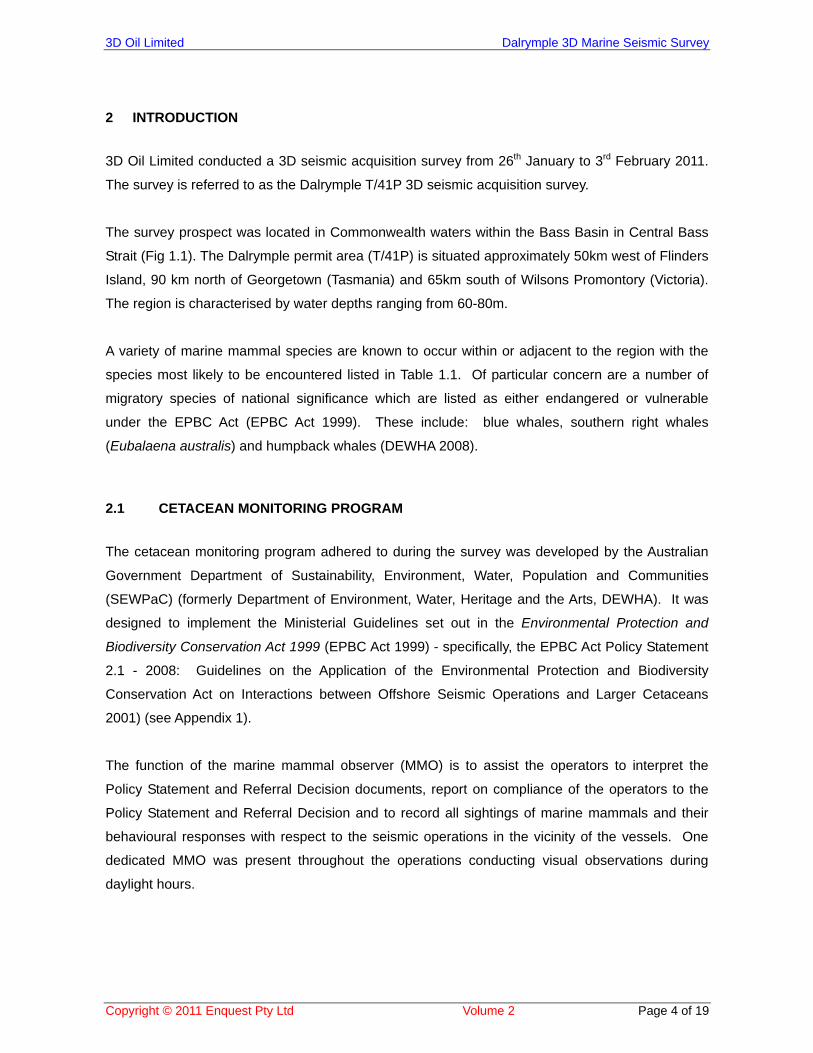
3D Oil Limited Dalrymple 3D Marine Seismic Survey
Copyright © 2011 Enquest Pty Ltd Volume 2 Page 4 of 19
2 INTRODUCTION
3D Oil Limited conducted a 3D seismic acquisition survey from 26th January to 3rd February 2011.
The survey is referred to as the Dalrymple T/41P 3D seismic acquisition survey.
The survey prospect was located in Commonwealth waters within the Bass Basin in Central Bass
Strait (Fig 1.1). The Dalrymple permit area (T/41P) is situated approximately 50km west of Flinders
Island, 90 km north of Georgetown (Tasmania) and 65km south of Wilsons Promontory (Victoria).
The region is characterised by water depths ranging from 60-80m.
A variety of marine mammal species are known to occur within or adjacent to the region with the
species most likely to be encountered listed in Table 1.1. Of particular concern are a number of
migratory species of national significance which are listed as either endangered or vulnerable
under the EPBC Act (EPBC Act 1999). These include: blue whales, southern right whales
(Eubalaena australis) and humpback whales (DEWHA 2008).
2.1 CETACEAN MONITORING PROGRAM
The cetacean monitoring program adhered to during the survey was developed by the Australian
Government Department of Sustainability, Environment, Water, Population and Communities
(SEWPaC) (formerly Department of Environment, Water, Heritage and the Arts, DEWHA). It was
designed to implement the Ministerial Guidelines set out in the Environmental Protection and
Biodiversity Conservation Act 1999 (EPBC Act 1999) - specifically, the EPBC Act Policy Statement
2.1 - 2008: Guidelines on the Application of the Environmental Protection and Biodiversity
Conservation Act on Interactions between Offshore Seismic Operations and Larger Cetaceans
2001) (see Appendix 1).
The function of the marine mammal observer (MMO) is to assist the operators to interpret the
Policy Statement and Referral Decision documents, report on compliance of the operators to the
Policy Statement and Referral Decision and to record all sightings of marine mammals and their
behavioural responses with respect to the seismic operations in the vicinity of the vessels. One
dedicated MMO was present throughout the operations conducting visual observations during
daylight hours.
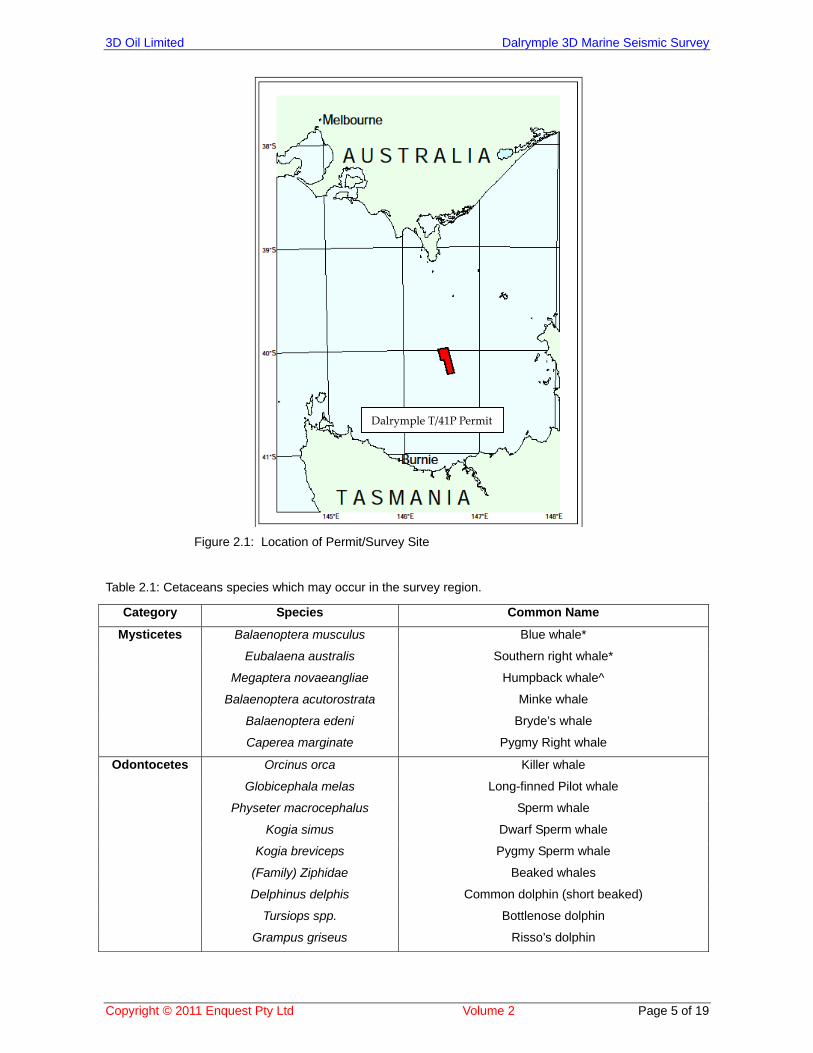
3D Oil Limited Dalrymple 3D Marine Seismic Survey
Copyright © 2011 Enquest Pty Ltd Volume 2 Page 5 of 19
Figure 2.1: Location of Permit/Survey Site
Table 2.1: Cetaceans species which may occur in the survey region.
Category Species Common Name
Mysticetes Balaenoptera musculus Blue whale*
Eubalaena australis Southern right whale*
Megaptera novaeangliae Humpback whale^
Balaenoptera acutorostrata Minke whale
Balaenoptera edeni Bryde’s whale
Caperea marginate Pygmy Right whale
Odontocetes Orcinus orca Killer whale
Globicephala melas Long-finned Pilot whale
Physeter macrocephalus Sperm whale
Kogia simus Dwarf Sperm whale
Kogia breviceps Pygmy Sperm whale
(Family) Ziphidae Beaked whales
Delphinus delphis Common dolphin (short beaked)
Tursiops spp. Bottlenose dolphin
Grampus griseus Risso’s dolphin
Dalrymple T/41P Permit
3D Oil Limited Dalrymple 3D Marine Seismic Survey
Copyright © 2011 Enquest Pty Ltd Volume 2 Page 6 of 19
2.2 ENVIRONMENTAL APPROVALS AND PERMITS
The legislative framework regarding seismic surveys is subject to Commonwealth and State
legislation, Industry Procedures and Guidelines and International Treaties and Obligations. For
details of the legislative framework please refer to the T/41P – Dalrymple 3D Seismic Acquisition
Environment Plan (3D Oil Limited, 2011). Permits required for operations were provided by the
Department of Sustainability, Environment, Water, Population and Communities (SEWPaC) and
incorporate the EPBC Act Policy Statement 2.1 – September 2008 and are included in Appendix 1.
2.3 VESSEL SPECIFICATIONS AND SEISMIC CONFIGURATION
The survey was conducted by the M/V Ramform Sterling which is a custom built seismic vessel
owned and operated by PGS Geophysical. The seismic equipment used to conduct the survey
comprised a towed dual source acoustic array with 12 receiver cables with a total length of 5100m.
The support vessel was the M/V Ocean Dynasty. For a more detailed description of the seismic
design and specifications refer to the T/41P Dalrymple 3D Seismic Acquisition Survey, Bass Strait
Australia - Final Supervision Report (Enquest 2011).
3 METHODOLOGY
3.1 CETACEAN MONITORING
An experienced cetacean observer conducted continuous visual observations during daylight hours
(0530-2130hrs) from the source vessel M/V Ramform Sterling. Scanning of the sea surface was
conducted both with the naked eye and range finding binoculars (Bushnell 7x50) which are fitted
with a compass and reticule to enable bearing and distance to a sighting to be recorded. The
observer concentrated their search (but not limited to) a 3000m radius of the acoustic source
(Appendix 1).
3.2 SPECIES IDENTIFICATION
Visual and behavioural cues were used to obtain a positive identification of marine mammals to
species level wherever possible. Marine mammal identification guides were also used (APPEA
2004; Carwardine, 2000). If a positive species identification could not be made, sightings were
logged as either unidentified small cetacean (USC), unidentified medium cetacean (UMC) or
unidentified large cetacean (ULC).
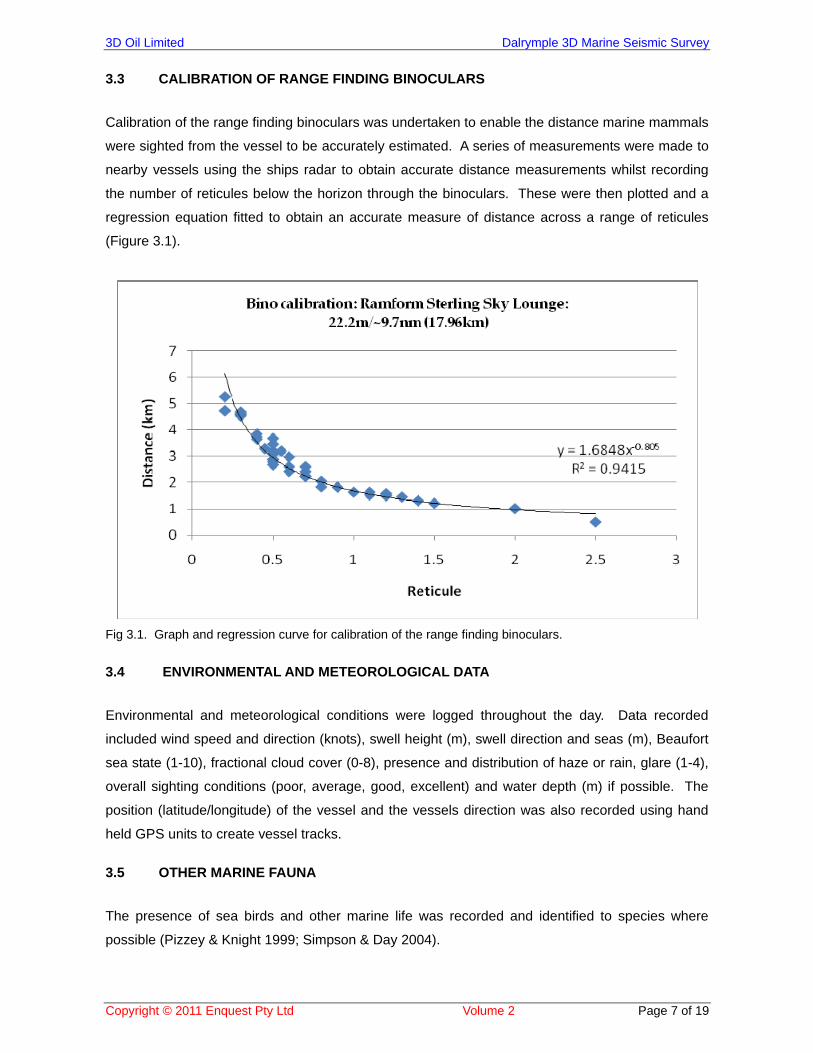
3D Oil Limited Dalrymple 3D Marine Seismic Survey
Copyright © 2011 Enquest Pty Ltd Volume 2 Page 7 of 19
3.3 CALIBRATION OF RANGE FINDING BINOCULARS
Calibration of the range finding binoculars was undertaken to enable the distance marine mammals
were sighted from the vessel to be accurately estimated. A series of measurements were made to
nearby vessels using the ships radar to obtain accurate distance measurements whilst recording
the number of reticules below the horizon through the binoculars. These were then plotted and a
regression equation fitted to obtain an accurate measure of distance across a range of reticules
(Figure 3.1).
Fig 3.1. Graph and regression curve for calibration of the range finding binoculars.
3.4 ENVIRONMENTAL AND METEOROLOGICAL DATA
Environmental and meteorological conditions were logged throughout the day. Data recorded
included wind speed and direction (knots), swell height (m), swell direction and seas (m), Beaufort
sea state (1-10), fractional cloud cover (0-8), presence and distribution of haze or rain, glare (1-4),
overall sighting conditions (poor, average, good, excellent) and water depth (m) if possible. The
position (latitude/longitude) of the vessel and the vessels direction was also recorded using hand
held GPS units to create vessel tracks.
3.5 OTHER MARINE FAUNA
The presence of sea birds and other marine life was recorded and identified to species where
possible (Pizzey & Knight 1999; Simpson & Day 2004).
3D Oil Limited Dalrymple 3D Marine Seismic Survey
Copyright © 2011 Enquest Pty Ltd Volume 2 Page 8 of 19
3.6 SEISMIC PROTOCOL
Prior to commencement of any seismic activity a soft start was performed. A soft start corresponds
to the gradual ‘ramping up’ of the acoustic source. It is a requirement of the SEWPaC Guidelines
that a soft start occur for a minimum of 30 minutes prior to the start of any high energy acoustic
source (Appendix 1). During line turns all the acoustic sources were inactive except for one airgun
which would remain ‘cycling’ providing a low-level background acoustic source designed to deter
cetaceans from approaching the vessel. If a marine mammal (listed in the SEWPaC Guidelines –
species of concern) was sighted within the 2000m exclusion zone during production the acoustic
source would power down i.e. only a single airgun was in operation. If the marine mammal
approached within 500m and/or overt changes to behaviour was observed within the 3000m
mitigation zone of the acoustic source all airguns would cease operation. To ensure the soft start
complied with the 30 minute minimum time all soft starts were programmed to a minimum of 35
minutes.
3.7 NAMES, QUALIFICATIONS AND EXPERIENCE OF MARINE MAMMAL OBSERVER
Fiona Macknight has postgraduate qualifications as a marine biologist and her area of expertise
relates to acoustic communication in cetaceans and the effects of anthropogenic noise of both
acoustic and surface behaviours. She has been involved in numerous population and acoustic
surveys of humpback whales since 1996, which include collaborative research programs with the
University of Queensland, University of New South Wales and the Scripps Institute of
Oceanography. She has also been an observer during boat and aerial surveys of Antarctic pack-
ice seals during marine science voyagers for the Australian Antarctic Division. Between 2000 and
2004 Fiona was a tutor for the Centre for Conservation Biology (Univ of Qld) and has been a
lecturer in marine mammal biology for blue Planet Learning as well as providing interpretation talks
during whale watch cruises. Fiona has extensive experience as an MMO having completed over
25 seismic surveys and has more than 700 sea days experience as an MMO.
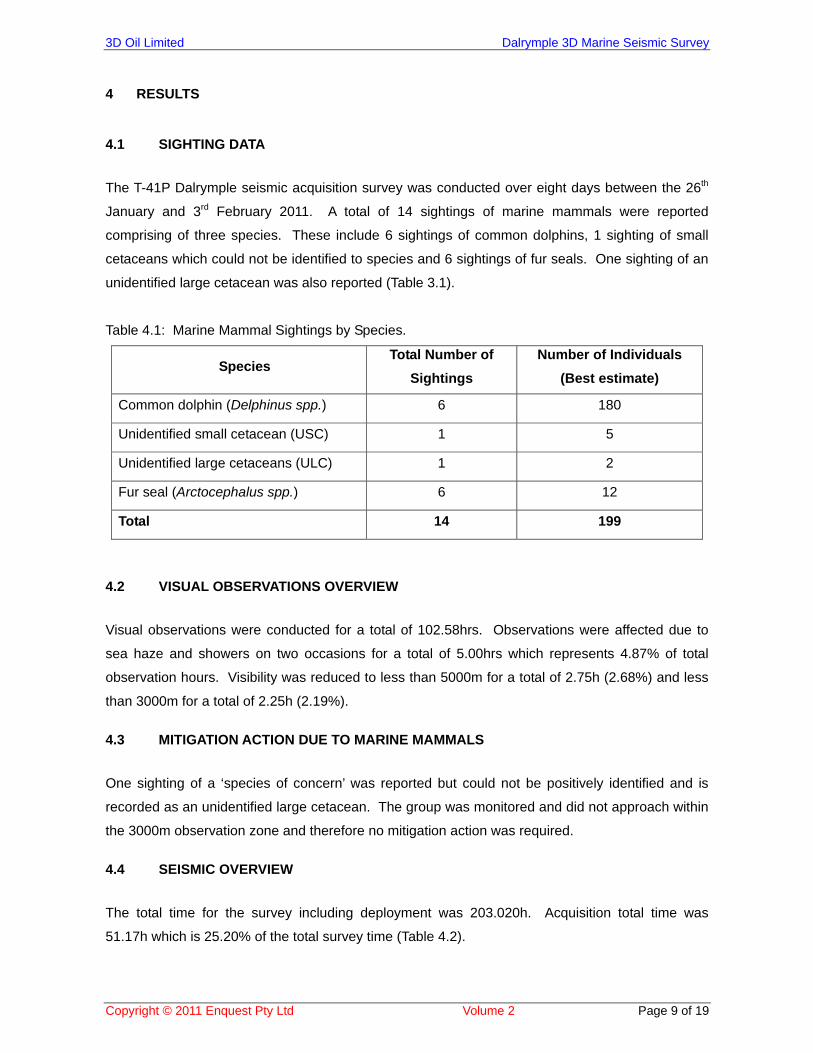
3D Oil Limited Dalrymple 3D Marine Seismic Survey
Copyright © 2011 Enquest Pty Ltd Volume 2 Page 9 of 19
4 RESULTS
4.1 SIGHTING DATA
The T-41P Dalrymple seismic acquisition survey was conducted over eight days between the 26th
January and 3rd February 2011. A total of 14 sightings of marine mammals were reported
comprising of three species. These include 6 sightings of common dolphins, 1 sighting of small
cetaceans which could not be identified to species and 6 sightings of fur seals. One sighting of an
unidentified large cetacean was also reported (Table 3.1).
Table 4.1: Marine Mammal Sightings by Species.
Species Total Number of
Sightings
Number of Individuals
(Best estimate)
Common dolphin (Delphinus spp.) 6 180
Unidentified small cetacean (USC) 1 5
Unidentified large cetaceans (ULC) 1 2
Fur seal (Arctocephalus spp.) 6 12
Total 14 199
4.2 VISUAL OBSERVATIONS OVERVIEW
Visual observations were conducted for a total of 102.58hrs. Observations were affected due to
sea haze and showers on two occasions for a total of 5.00hrs which represents 4.87% of total
observation hours. Visibility was reduced to less than 5000m for a total of 2.75h (2.68%) and less
than 3000m for a total of 2.25h (2.19%).
4.3 MITIGATION ACTION DUE TO MARINE MAMMALS
One sighting of a ‘species of concern’ was reported but could not be positively identified and is
recorded as an unidentified large cetacean. The group was monitored and did not approach within
the 3000m observation zone and therefore no mitigation action was required.
4.4 SEISMIC OVERVIEW
The total time for the survey including deployment was 203.020h. Acquisition total time was
51.17h which is 25.20% of the total survey time (Table 4.2).
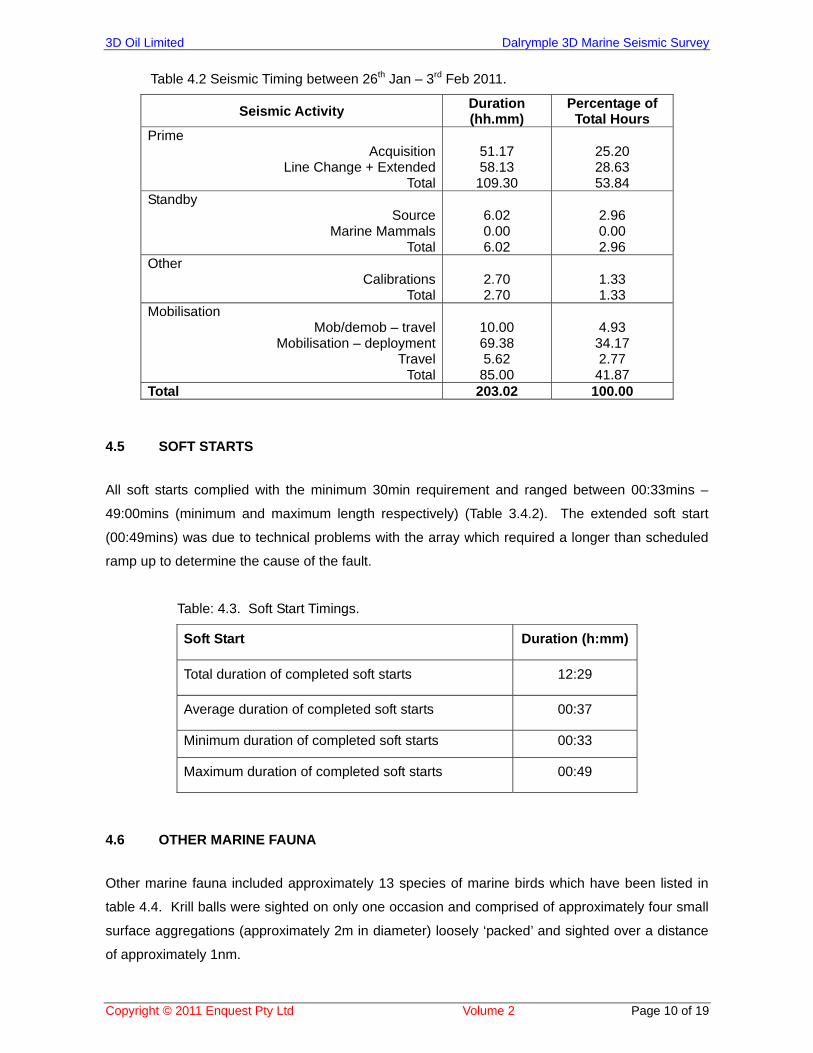
3D Oil Limited Dalrymple 3D Marine Seismic Survey
Copyright © 2011 Enquest Pty Ltd Volume 2 Page 10 of 19
Table 4.2 Seismic Timing between 26th Jan – 3rd Feb 2011.
Seismic Activity Duration (hh.mm)
Percentage of Total Hours
Prime Acquisition
Line Change + ExtendedTotal
51.17 58.13
109.30
25.20 28.63 53.84
Standby Source
Marine MammalsTotal
6.02 0.00 6.02
2.96 0.00 2.96
Other Calibrations
Total
2.70 2.70
1.33 1.33
Mobilisation Mob/demob – travel
Mobilisation – deploymentTravel
Total
10.00 69.38 5.62
85.00
4.93
34.17 2.77
41.87 Total 203.02 100.00
4.5 SOFT STARTS
All soft starts complied with the minimum 30min requirement and ranged between 00:33mins –
49:00mins (minimum and maximum length respectively) (Table 3.4.2). The extended soft start
(00:49mins) was due to technical problems with the array which required a longer than scheduled
ramp up to determine the cause of the fault.
Table: 4.3. Soft Start Timings.
Soft Start Duration (h:mm)
Total duration of completed soft starts 12:29
Average duration of completed soft starts 00:37
Minimum duration of completed soft starts 00:33
Maximum duration of completed soft starts 00:49
4.6 OTHER MARINE FAUNA
Other marine fauna included approximately 13 species of marine birds which have been listed in
table 4.4. Krill balls were sighted on only one occasion and comprised of approximately four small
surface aggregations (approximately 2m in diameter) loosely ‘packed’ and sighted over a distance
of approximately 1nm.
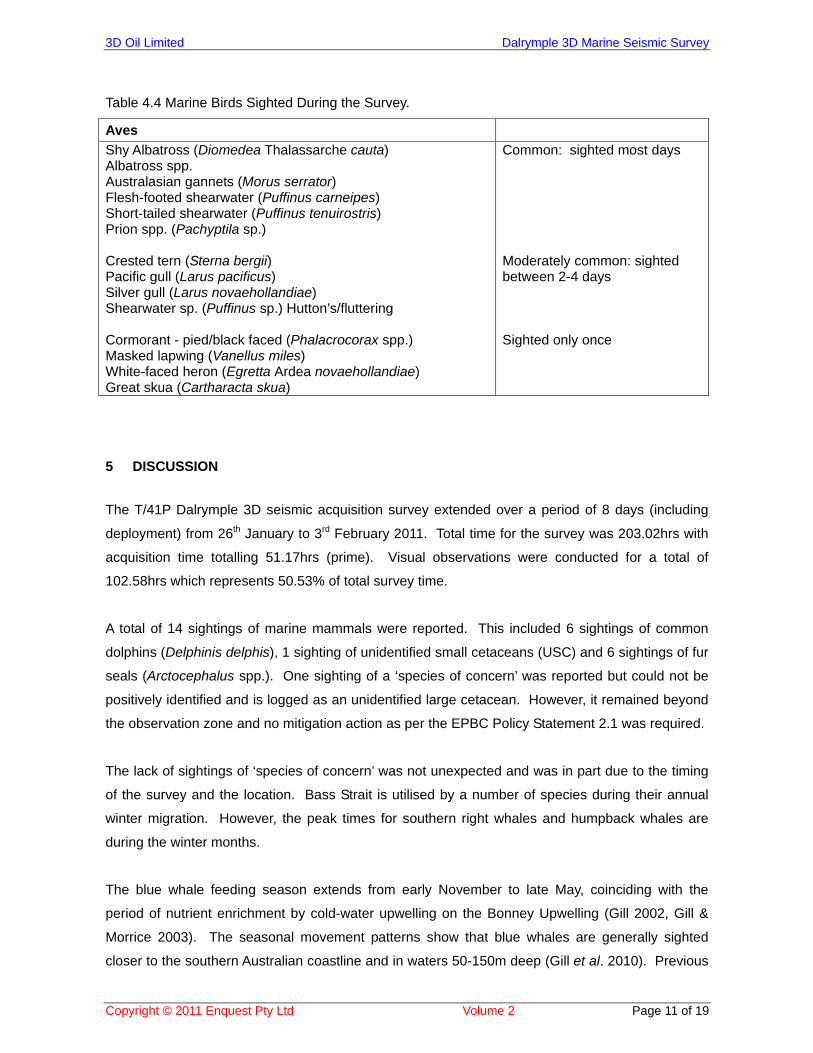
3D Oil Limited Dalrymple 3D Marine Seismic Survey
Copyright © 2011 Enquest Pty Ltd Volume 2 Page 11 of 19
Table 4.4 Marine Birds Sighted During the Survey.
Aves
Shy Albatross (Diomedea Thalassarche cauta) Albatross spp. Australasian gannets (Morus serrator) Flesh-footed shearwater (Puffinus carneipes) Short-tailed shearwater (Puffinus tenuirostris) Prion spp. (Pachyptila sp.) Crested tern (Sterna bergii) Pacific gull (Larus pacificus) Silver gull (Larus novaehollandiae) Shearwater sp. (Puffinus sp.) Hutton’s/fluttering Cormorant - pied/black faced (Phalacrocorax spp.) Masked lapwing (Vanellus miles) White-faced heron (Egretta Ardea novaehollandiae) Great skua (Cartharacta skua)
Common: sighted most days Moderately common: sighted between 2-4 days Sighted only once
5 DISCUSSION
The T/41P Dalrymple 3D seismic acquisition survey extended over a period of 8 days (including
deployment) from 26th January to 3rd February 2011. Total time for the survey was 203.02hrs with
acquisition time totalling 51.17hrs (prime). Visual observations were conducted for a total of
102.58hrs which represents 50.53% of total survey time.
A total of 14 sightings of marine mammals were reported. This included 6 sightings of common
dolphins (Delphinis delphis), 1 sighting of unidentified small cetaceans (USC) and 6 sightings of fur
seals (Arctocephalus spp.). One sighting of a ‘species of concern’ was reported but could not be
positively identified and is logged as an unidentified large cetacean. However, it remained beyond
the observation zone and no mitigation action as per the EPBC Policy Statement 2.1 was required.
The lack of sightings of ‘species of concern’ was not unexpected and was in part due to the timing
of the survey and the location. Bass Strait is utilised by a number of species during their annual
winter migration. However, the peak times for southern right whales and humpback whales are
during the winter months.
The blue whale feeding season extends from early November to late May, coinciding with the
period of nutrient enrichment by cold-water upwelling on the Bonney Upwelling (Gill 2002, Gill &
Morrice 2003). The seasonal movement patterns show that blue whales are generally sighted
closer to the southern Australian coastline and in waters 50-150m deep (Gill et al. 2010). Previous
3D Oil Limited Dalrymple 3D Marine Seismic Survey
Copyright © 2011 Enquest Pty Ltd Volume 2 Page 12 of 19
surveys have not reported any sightings of blue whales within this region (refer 3D Oil Limited
Environmental Plan 2010).
All seismic operations complied with the EPBC Policy Statement 2.1 (September 2008) and the
Referral Decision specific to the T/41P Dalrymple seismic acquisition survey.
6 REFERENCES
APPEA (2004). SEARCH Australian Whales and Dolphins V.1. AES Applied Ecology Solutions
Pty Ltd. Database.
Carwardine, M. (2000). Whales Dolphins and Porpoises. Dorling Kinderley Handbooks.
DEWHA (2008). Environmental Protection and Biodiversity Conservation Act (1999). Online
Protected Matters Database.
Gill P. C. (2002). A blue whale (Balaenoptera musculus) feeding ground in a southern Australian
coastal upwelling zone. Journal of Cetacean Research and Management Vol.4. Pp:179-
184.
Gill P. C., Morrice M. G., Page B., Pirzl R., Levings A. H., Coyne M. (2010). Blue whale habitat
selection and within-season distribution in a regional upwelling system off southern
Australia. Mar Ecol Prog Ser. Vol 421 Pp:243-263.
Pizzey, G. & Knight, F. (1999). Field guide to the birds of Australia. Angus and Robertson, Sydney.
Simpson K. & Day N. (2004). Field Guide to the Birds of Australia. 7th Edn. Viking, Penguin Group
Australia. Pp:382.
3D Oil Limited (2010). T/41P – Dalrymple 3D Seismic Acquisition Survey Environment Plan.
Pp:79.

3D Oil Limited Dalrymple 3D Marine Seismic Survey
Copyright © 2011 Enquest Pty Ltd Volume 2 Page 13 of 19
7 APPENDIX 1 - SEWPaC Referral Decision
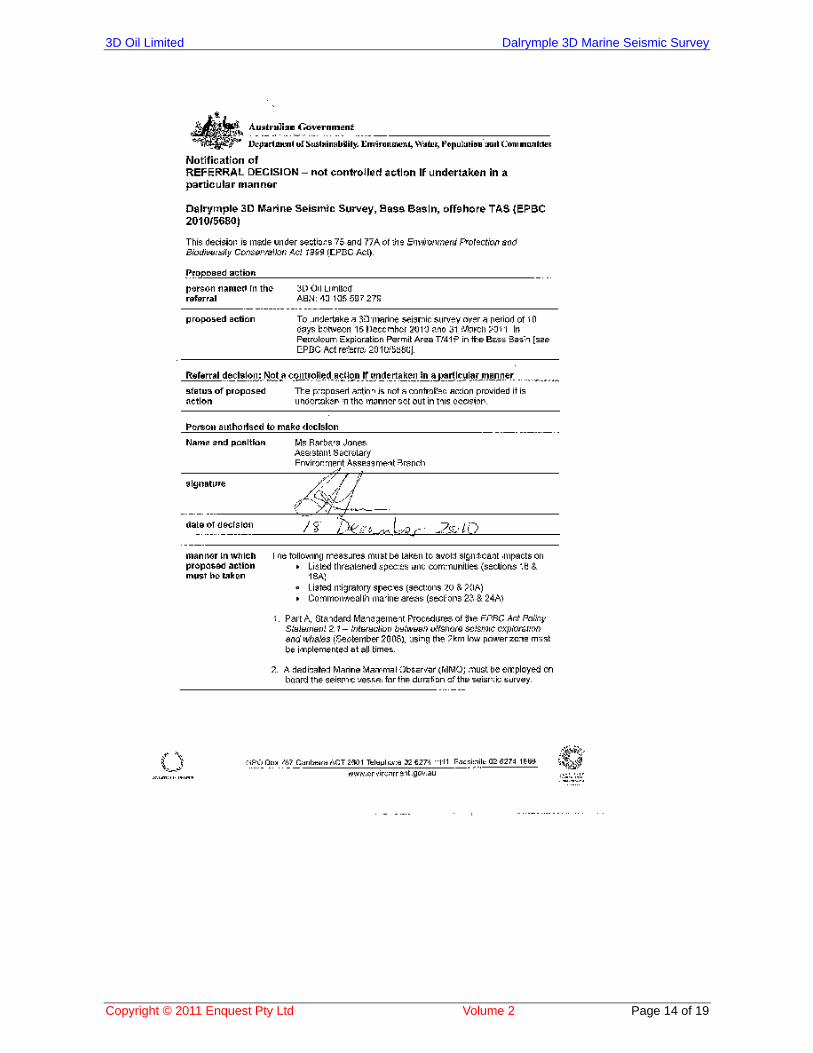
3D Oil Limited Dalrymple 3D Marine Seismic Survey
Copyright © 2011 Enquest Pty Ltd Volume 2 Page 14 of 19
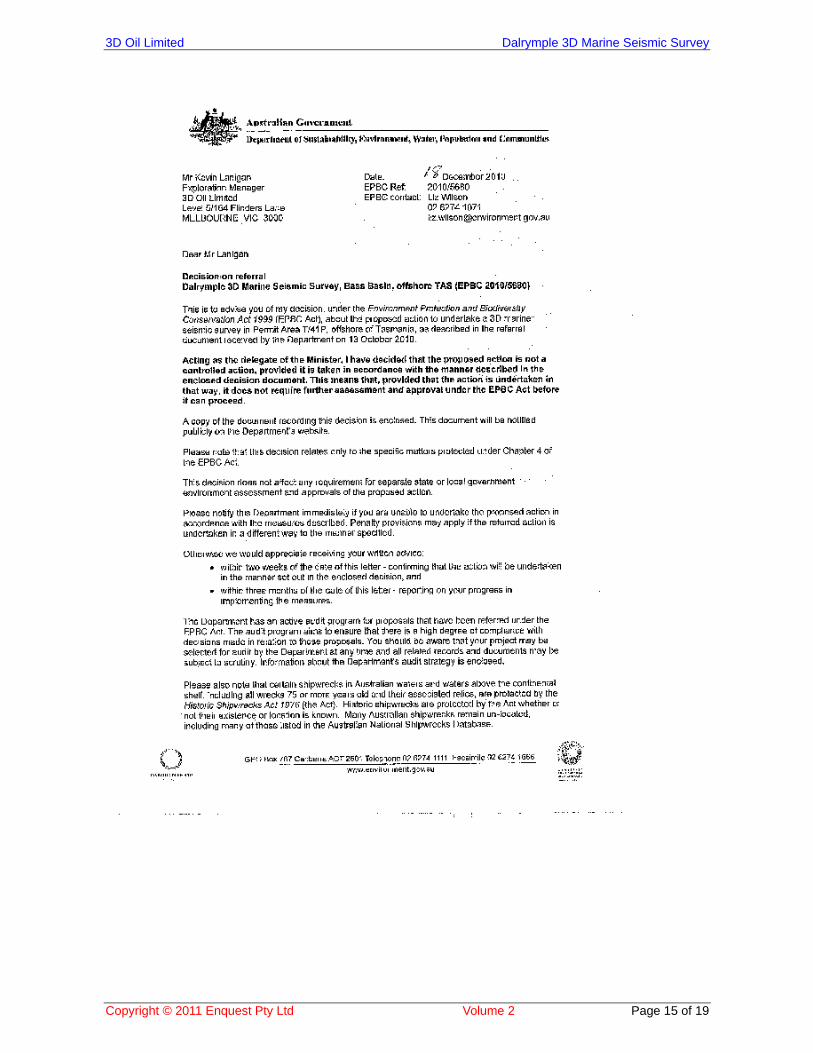
3D Oil Limited Dalrymple 3D Marine Seismic Survey
Copyright © 2011 Enquest Pty Ltd Volume 2 Page 15 of 19
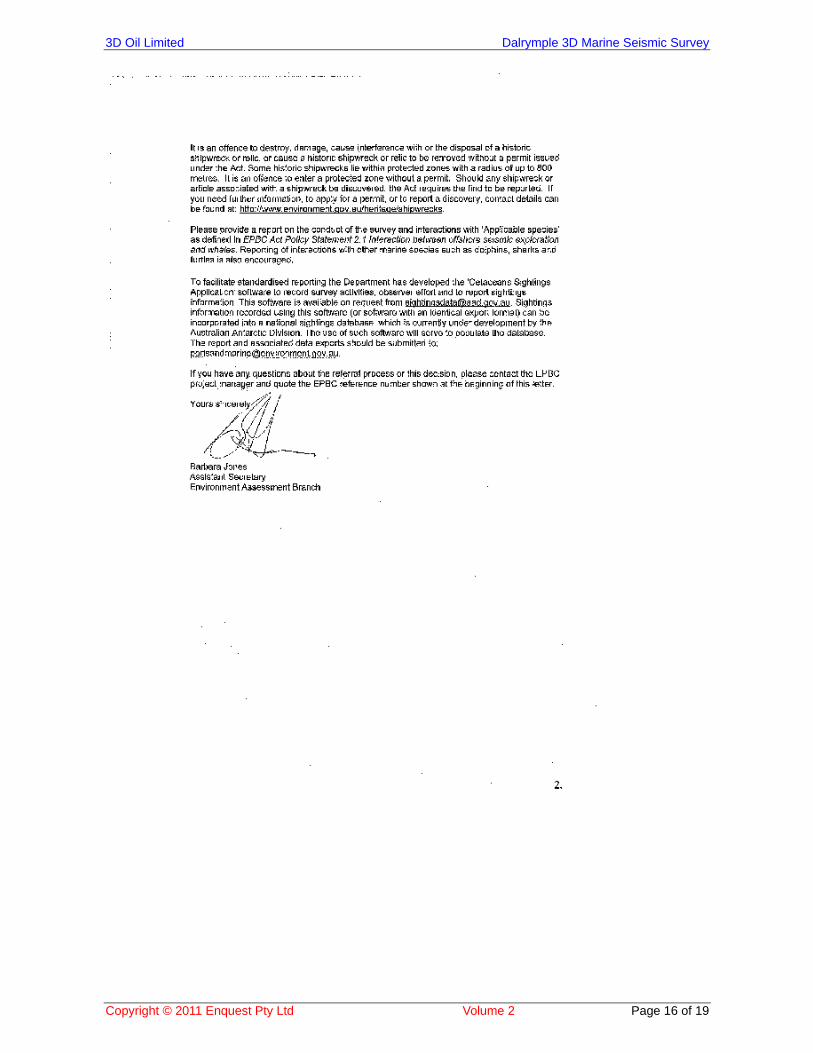
3D Oil Limited Dalrymple 3D Marine Seismic Survey
Copyright © 2011 Enquest Pty Ltd Volume 2 Page 16 of 19

3D Oil Limited Dalrymple 3D Marine Seismic Survey
Copyright © 2011 Enquest Pty Ltd Volume 2 Page 17 of 19
8 APPENDIX 2 - Marine Mammal Sighting Summary
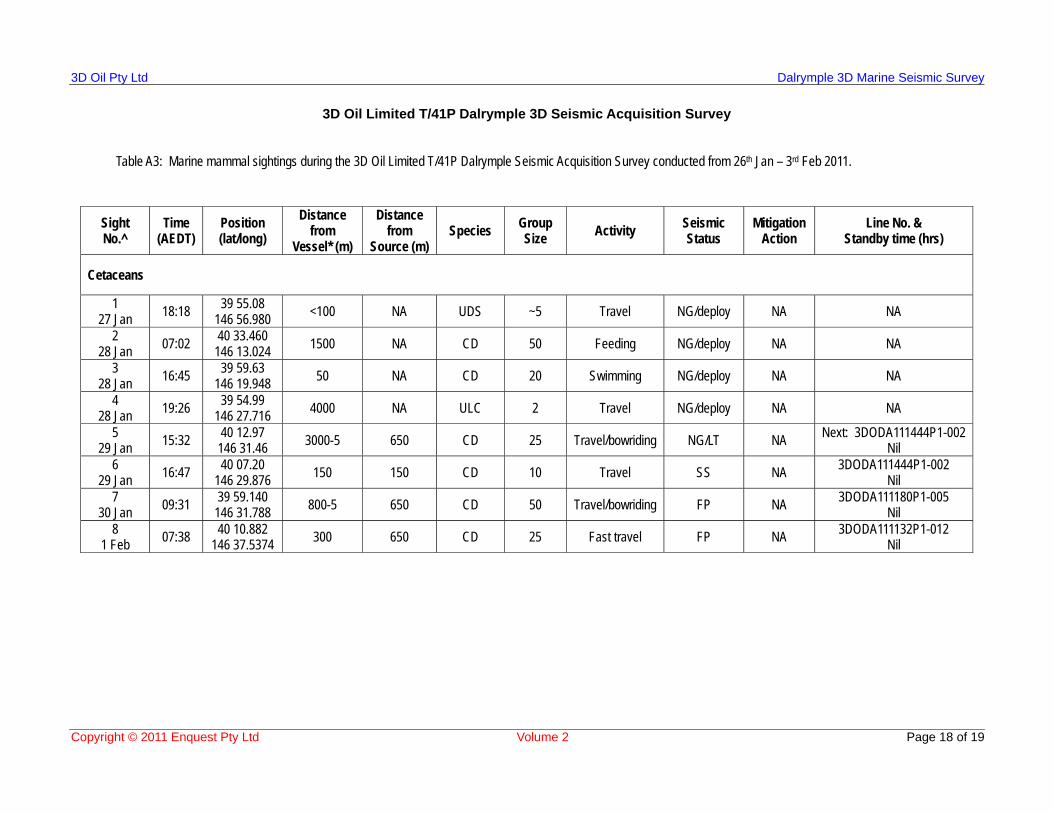
3D Oil Pty Ltd Dalrymple 3D Marine Seismic Survey
Copyright © 2011 Enquest Pty Ltd Volume 2 Page 18 of 19
3D Oil Limited T/41P Dalrymple 3D Seismic Acquisition Survey
Table A3: Marine mammal sightings during the 3D Oil Limited T/41P Dalrymple Seismic Acquisition Survey conducted from 26th Jan – 3rd Feb 2011.
Sight No.^
Time (AEDT)
Position (lat/long)
Distance from
Vessel* (m)
Distance from
Source (m) Species
Group Size
Activity Seismic Status
Mitigation Action
Line No. & Standby time (hrs)
Cetaceans
1 27 Jan 18:18 39 55.08
146 56.980 <100 NA UDS ~5 Travel NG/deploy NA NA
2 28 Jan 07:02 40 33.460
146 13.024 1500 NA CD 50 Feeding NG/deploy NA NA
3 28 Jan 16:45 39 59.63
146 19.948 50 NA CD 20 Swimming NG/deploy NA NA
4 28 Jan 19:26 39 54.99
146 27.716 4000 NA ULC 2 Travel NG/deploy NA NA
5 29 Jan 15:32 40 12.97
146 31.46 3000-5 650 CD 25 Travel/bowriding NG/LT NA Next: 3DODA111444P1-002 Nil
6 29 Jan 16:47 40 07.20
146 29.876 150 150 CD 10 Travel SS NA 3DODA111444P1-002 Nil
7 30 Jan 09:31 39 59.140
146 31.788 800-5 650 CD 50 Travel/bowriding FP NA 3DODA111180P1-005 Nil
8 1 Feb 07:38 40 10.882
146 37.5374 300 650 CD 25 Fast travel FP NA 3DODA111132P1-012 Nil
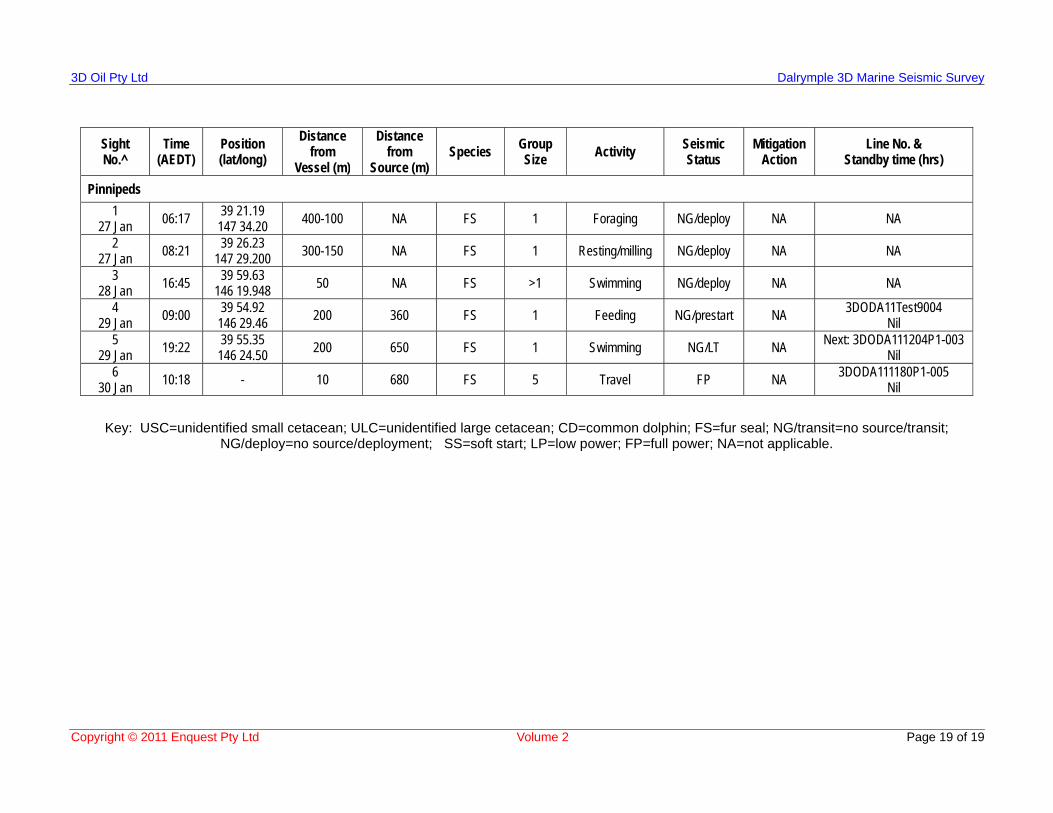
3D Oil Pty Ltd Dalrymple 3D Marine Seismic Survey
Copyright © 2011 Enquest Pty Ltd Volume 2 Page 19 of 19
Key: USC=unidentified small cetacean; ULC=unidentified large cetacean; CD=common dolphin; FS=fur seal; NG/transit=no source/transit; NG/deploy=no source/deployment; SS=soft start; LP=low power; FP=full power; NA=not applicable.
Sight No.^
Time (AEDT)
Position (lat/long)
Distance from
Vessel (m)
Distance from
Source (m) Species
Group Size
Activity Seismic Status
Mitigation Action
Line No. & Standby time (hrs)
Pinnipeds
1 27 Jan 06:17 39 21.19
147 34.20 400-100 NA FS 1 Foraging NG/deploy NA NA
2 27 Jan 08:21 39 26.23
147 29.200 300-150 NA FS 1 Resting/milling NG/deploy NA NA
3 28 Jan 16:45 39 59.63
146 19.948 50 NA FS >1 Swimming NG/deploy NA NA
4 29 Jan 09:00 39 54.92
146 29.46 200 360 FS 1 Feeding NG/prestart NA 3DODA11Test9004 Nil
5 29 Jan 19:22 39 55.35
146 24.50 200 650 FS 1 Swimming NG/LT NA Next: 3DODA111204P1-003 Nil
6 30 Jan 10:18 - 10 680 FS 5 Travel FP NA 3DODA111180P1-005
Nil


![Acquisition and Final - Copy2003[1]](https://img.pdfslide.us/doc/110x75/577d33c81a28ab3a6b8bbbde/acquisition-and-final-copy20031.jpg)