Embed Size (px)
Citation preview
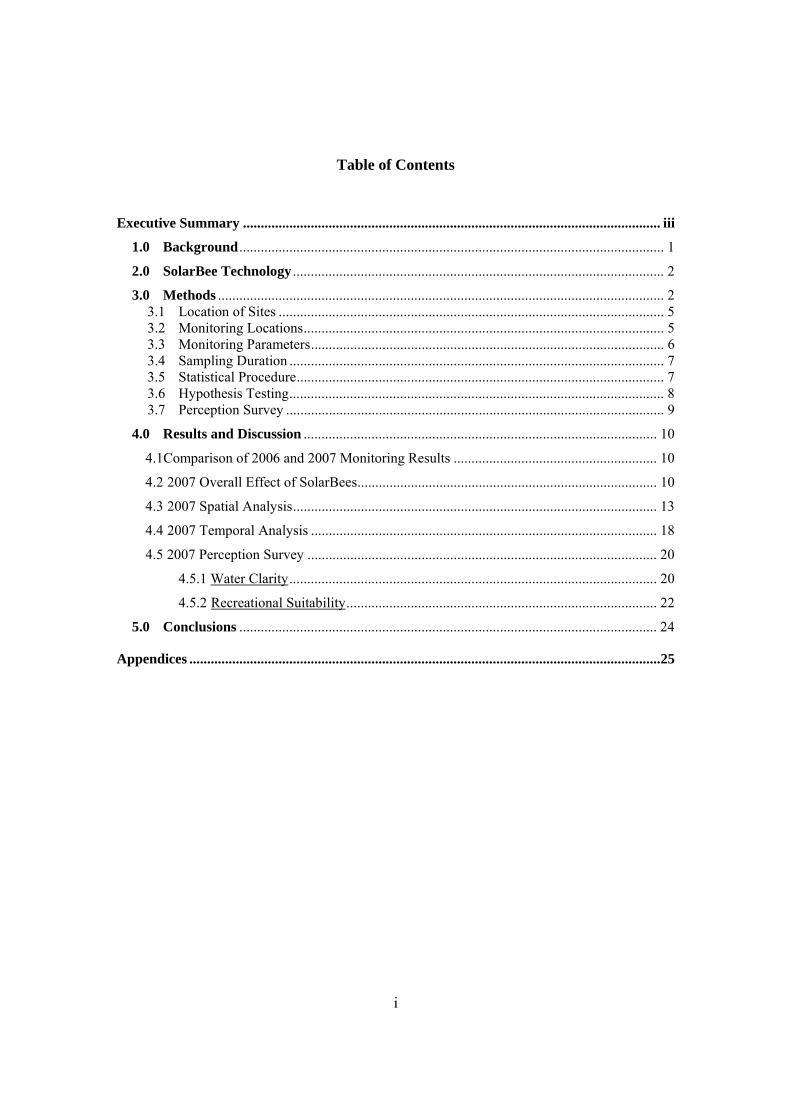
Conesus Lake SolarBee Pilot Test
2007 Monitoring Program Results
Prepared for: Livingston County Planning Department
Prepared by:
EcoLogic, LLC and Dr. Isidro Bosch
October, 2007
REPORT
i
Table of Contents
Executive Summary ..................................................................................................................... iii 1.0 Background ....................................................................................................................... 1 2.0 SolarBee Technology ........................................................................................................ 2 3.0 Methods ............................................................................................................................. 2
3.1 Location of Sites ............................................................................................................ 5 3.2 Monitoring Locations..................................................................................................... 5 3.3 Monitoring Parameters................................................................................................... 6 3.4 Sampling Duration ......................................................................................................... 7 3.5 Statistical Procedure....................................................................................................... 7 3.6 Hypothesis Testing......................................................................................................... 8 3.7 Perception Survey .......................................................................................................... 9
4.0 Results and Discussion ................................................................................................... 10 4.1Comparison of 2006 and 2007 Monitoring Results ......................................................... 10 4.2 2007 Overall Effect of SolarBees.................................................................................... 10 4.3 2007 Spatial Analysis...................................................................................................... 13 4.4 2007 Temporal Analysis ................................................................................................. 18 4.5 2007 Perception Survey .................................................................................................. 20
4.5.1 Water Clarity....................................................................................................... 20 4.5.2 Recreational Suitability....................................................................................... 22 5.0 Conclusions ..................................................................................................................... 24
Appendices ....................................................................................................................................25

ii
Table of Contents (continued)
List of Tables
Table 1. Summary of 2007 hypothesis testing results. Table 2. Monitoring parameters and sample design summary. Table 3. Summary statistics of measured parameters, Conesus Lake, summer 2007. Table 4. Results of repeated measures ANOVA (turbidity, TSS, Chlorophyll-a, and
phycocyanin) and one sided T-test (macrophytes and metaphyton) on grouped SolarBee and Reference sites.
Table 5. Second order polynomial summary statistics for regressions of transect data. R-square is the statistical measure of how well a regression line approximates the data points. Table 6. Results of trend analysis for each water quality variable over time at SolarBee sites and
Reference locations.
List of Figures
Figure 1. North End SolarBee and Reference Locations. Figure 2. Sacketts Harbor SolarBee and Reference Locations. Figure 3. Example of second order polynomial relationship. Figure 4. Second order polynomial regressions for chlorophyll-a, phycocyanin and turbidity at
transects from Sacketts Harbor in August 2007. Figure 5. Second order polynomial regressions for chlorophyll-a, at transects from the North
End in July 2007. Figure 6. Temporal plots of phycocyanin and chlorophyll-a at both the North End and Sacketts Harbor locations in 2007. Figure 7. 2006 and 2007 water quality perception survey results. Figure 8. 2006 and 2007 recreation usability perception survey results.
iii
Executive Summary
The Conesus Lake Watershed Council agreed to implement a pilot test of SolarBee units in
Conesus Lake, Livingston County NY during the recreational seasons of 2006 and 2007. Funds
for the pilot tests were contributed by Livingston County, the Conesus Lake Association, the
Town of Geneseo, the Town of Livonia, the Town of Groveland and the Town of Conesus.
Financial support to Livingston County from the Finger Lakes-Lake Ontario Watershed
Protection Alliance was directed to the pilot test as well. Other community volunteers and
contractors supported this effort, notably Professor Sid Bosch of SUNY-Geneseo and his students
David Hoekstra, Lindsey Campana, and Jose Rios, Professor Gregg Hartvigsen of SUNY-
Geneseo, and the Livingston County Sheriff’s Office Marine Patrol. Special thanks to the Project
Team: Don Wetzel, George Coolbaugh, Jack Baldwin, and Gene Bolster.
Conesus Lake, the western-most of New York’s Finger Lakes, exhibits degraded water quality
conditions. Phosphorus loading and in-lake concentrations are high, and the lake supports
abundant macrophytes, phytoplankton, and macroalgae/metaphyton. Elevated bacteria counts,
visible sediment plumes, rising chloride concentrations, and proliferation of exotic species are
other impairments to the lake’s ecology and recreational use. Pump Systems International (PSI)
was contracted to install three solar-powered mixing devices (SolarBee®) in nearshore areas of
Conesus Lake to test their effectiveness in improving lake water quality conditions: turbidity,
abundance of algae and cyanobacteria, bacterial abundance, metaphyton, and macrophytes.
The Conesus Lake SolarBee pilot test described in this document was designed to test specific
hypotheses related to the manufacturer’s claims of improved water quality and conditions brought
about by the machines in Conesus Lake. The interpretations and conclusions are specific to
Conesus Lake and may not be applicable to other lakes.
Three units were installed by PSI in Conesus Lake between April 20 and April 23, 2006. The
units were left in the lake over the winter and re-started in April 2007. Researchers from area
colleges collaborated with Livingston County Planning Department in designing a monitoring
program to test hypotheses that reflect specific impairments of Conesus Lake. The resulting
water quality monitoring program and public perception survey were conducted in treatment and
reference areas of Conesus Lake in 2006 and 2007.
iv
Monitoring was conducted by faculty and students from SUNY-Geneseo. The investigators
measured selected water quality parameters in the field and collected water samples for
laboratory analysis of other parameters. This team assayed metaphyton density by digital
photography and surveyed macrophyte biomass and species composition using quadrat sampling
techniques. Water chemistry analyses were completed in a certified laboratory at SUNY-
Brockport. A public perception survey was conducted concurrently with the water quality and
biological sampling programs.
Results of the first year (2006) monitoring program indicated that the solar-powered mixing
devices did not result in statistically significant improvements for the majority of parameters
measured. However, some parameters did show improvement in regions of the lake adjacent to
the solar-powered mixing devices; notably, turbidity and metaphyton levels in the northern basin
of the lake were lower (indicating improved water quality) as compared with reference areas. The
measured improvement was supported by public perception of clearer water. The magnitude of
improvement was small compared with the variability in these parameters typically measured in
Conesus Lake, both spatially and temporally. The conclusion of the 2006 effort was that the
SolarBee units did not appear to be an effective alternative for consistent improvements to
nearshore areas of Conesus Lake.
The localized improvements in water clarity and reductions in metaphyton cover reported in 2006
were sufficient for the project partners to authorize a second year of deployment and monitoring.
Most of the parameters measured in 2006 were measured again in 2007, with the exception of
bacteria.
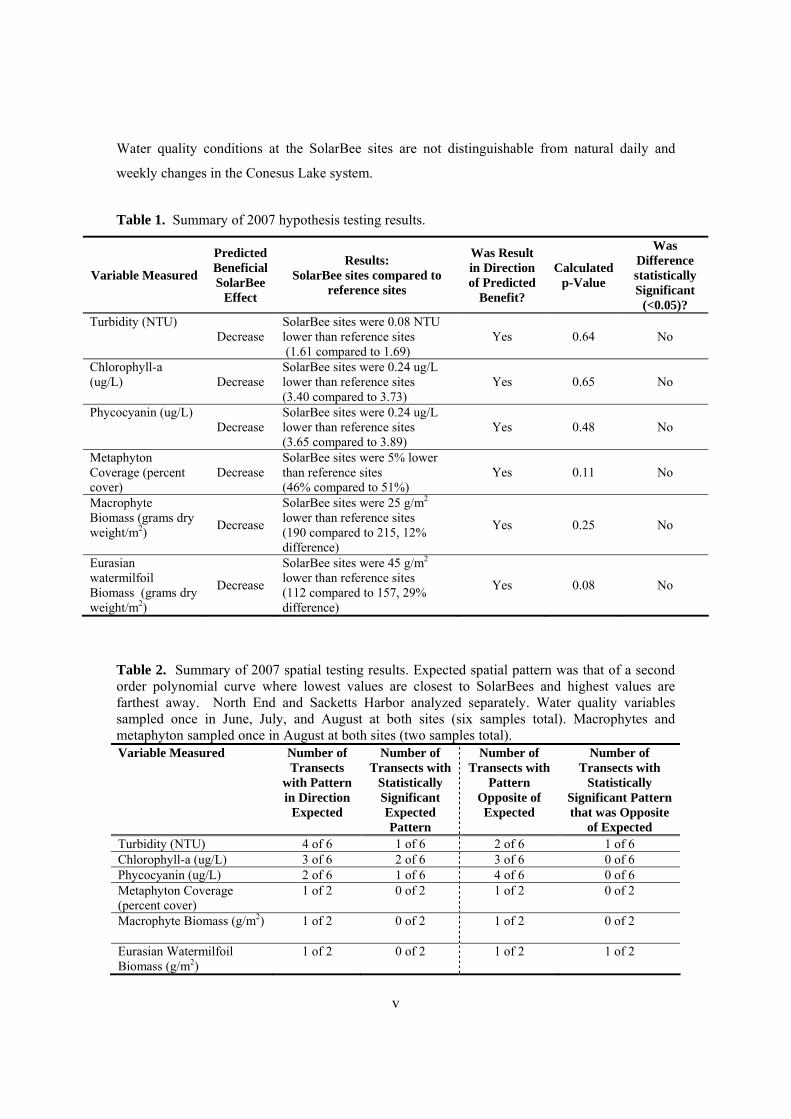
Results of the 2007 program were very similar to 2006. Overall, there were no statistically
significant differences between sites where SolarBees were deployed and reference locations
(Table 1). The improvements in turbidity and metaphyton at the northern SolarBee location noted
in 2006 were not apparent in 2007. There were also no consistent spatial or temporal patterns
associated with the SolarBees in 2007 (Table 2). There were statistically significant differences
in the transect data at one site (Sacketts Harbor) for one month (August). In addition, there were
subtle effects noted for certain variables, suggesting a slight improvement. However, these subtle
effects were not statistically significant and therefore cannot be attributed to the SolarBee units.
v
Water quality conditions at the SolarBee sites are not distinguishable from natural daily and
weekly changes in the Conesus Lake system.
Table 1. Summary of 2007 hypothesis testing results.
Variable Measured
Predicted Beneficial SolarBee
Effect
Results: SolarBee sites compared to
reference sites
Was Result in Direction of Predicted
Benefit?
Calculated p-Value
Was Difference statistically Significant
(<0.05)? Turbidity (NTU)
Decrease SolarBee sites were 0.08 NTU lower than reference sites (1.61 compared to 1.69)
Yes 0.64 No
Chlorophyll-a (ug/L) Decrease
SolarBee sites were 0.24 ug/L lower than reference sites (3.40 compared to 3.73)
Yes 0.65 No
Phycocyanin (ug/L) Decrease
SolarBee sites were 0.24 ug/L lower than reference sites (3.65 compared to 3.89)
Yes 0.48 No
Metaphyton Coverage (percent cover)
Decrease SolarBee sites were 5% lower than reference sites (46% compared to 51%)
Yes 0.11 No
Macrophyte Biomass (grams dry weight/m2) Decrease
SolarBee sites were 25 g/m2
lower than reference sites (190 compared to 215, 12% difference)
Yes 0.25 No
Eurasian watermilfoil Biomass (grams dry weight/m2)
Decrease
SolarBee sites were 45 g/m2
lower than reference sites (112 compared to 157, 29% difference)
Yes 0.08 No
Table 2. Summary of 2007 spatial testing results. Expected spatial pattern was that of a second order polynomial curve where lowest values are closest to SolarBees and highest values are farthest away. North End and Sacketts Harbor analyzed separately. Water quality variables sampled once in June, July, and August at both sites (six samples total). Macrophytes and metaphyton sampled once in August at both sites (two samples total). Variable Measured Number of
Transects with Pattern in Direction
Expected
Number of Transects with
Statistically Significant Expected Pattern
Number of Transects with
Pattern Opposite of Expected
Number of Transects with
Statistically Significant Pattern that was Opposite
of Expected Turbidity (NTU) 4 of 6 1 of 6 2 of 6 1 of 6 Chlorophyll-a (ug/L) 3 of 6 2 of 6 3 of 6 0 of 6 Phycocyanin (ug/L) 2 of 6 1 of 6 4 of 6 0 of 6 Metaphyton Coverage (percent cover)
1 of 2 0 of 2 1 of 2 0 of 2
Macrophyte Biomass (g/m2)
1 of 2 0 of 2 1 of 2 0 of 2
Eurasian Watermilfoil Biomass (g/m2)
1 of 2 0 of 2 1 of 2 1 of 2
EcoLogic LLC Page 1 of 30 10/30/2007
Conesus Lake SolarBee Pilot Test: Year Two
1.0 Background
A pilot test was initiated in 2006 to determine if SolarBee water circulation devices could
noticeably improve the condition of selected nearshore areas of Conesus Lake. The units were
proposed as a means to help mitigate the impairments caused by the watershed loading and
resulting productivity levels: algal blooms, macrophyte growth, elevated coliform bacteria, and
metaphyton.
In the spring of 2006, three SolarBee units were placed in sheltered coves in littoral areas along
the northern and western shorelines of Conesus Lake. These nearshore areas exhibit reduced
water circulation during periods of calm weather. Significant impairment results from
proliferation of metaphyton (visible patches of filamentous algae) among the extensive
macrophyte beds that characterize the lake’s nearshore areas.
Monitoring occurred through the recreational season of 2006 in order to evaluate the
effectiveness of the SolarBees in improving conditions at nearshore areas. A public perception
survey was also conducted. The results of the 2006 monitoring effort indicated that the units did
not consistently improve water clarity, or reduce the abundance of bacteria, algae, or
cyanobacteria. There were, however, positive results for some important parameters. These
effects were small compared with the variation typical of lake conditions. The conclusion of the
2006 effort was that the SolarBee units were not likely to be an effective alternative for
improving conditions in Conesus Lake. The localized improvements in nearshore conditions
documented in 2006 were sufficient for the project partners to authorize a second year of
deployment and monitoring.
As a result of dialogue among the project partners and SUNY scientists, it was determined that
the 2007 monitoring program would focus on key indicator parameters; these parameters include
water clarity (as measured by turbidity), macrophyte biomass, metaphyton coverage, chlorophyll-
a (measure of green algae), and phycocyanin (measure of cyanobacteria). It was also decided that
statistical testing would serve as the basis for differentiating natural variation from the effects of
the devices. If, for a second year, the effect of SolarBees could not be statistically differentiated
EcoLogic LLC Page 2 of 30 10/30/2007
from background variability, the conclusion would be reached that the SolarBee units are not
effective in Conesus Lake.
2.0 SolarBee Technology
SolarBee units utilize an array of solar panels to capture solar energy and convert it to electrical
energy. The electrical energy is sent to a small motor that drives an impeller assembly. Rotation
of the impeller assembly induces subtle water flow upward through a flexible tube. The tube is set
below the water surface at a depth that can be adjusted for optimal conditions. Water drawn from
deeper in the water column is brought to the surface where it gently mixes with the water near the
surface.
The net effect of the SolarBee is to increase water circulation. This is accomplished by increasing
both direct and induced flow. According to the manufacturers, the increased circulation will
improve water quality by enhancing natural biological and chemical processes.
3.0 Methods
The three SolarBee units deployed in Conesus Lake in 2006 remained in the lake over the winter,
although they were not active. The machines were reactivated in April 2007 and moored close to
their original locations (Figures 1 and 2). An extensive monitoring program was conducted in
treatment and reference areas to address two related questions: do the machines affect water
quality in a significant way, and if so, what is the spatial extent of the effect. Researchers from
area colleges collaborated with Livingston County Planning Department and its consultant in
designing a monitoring program to provide the data and information needed to answer these
questions.
EcoLogic LLC Page 3 of 30 10/30/2007
SolarBee
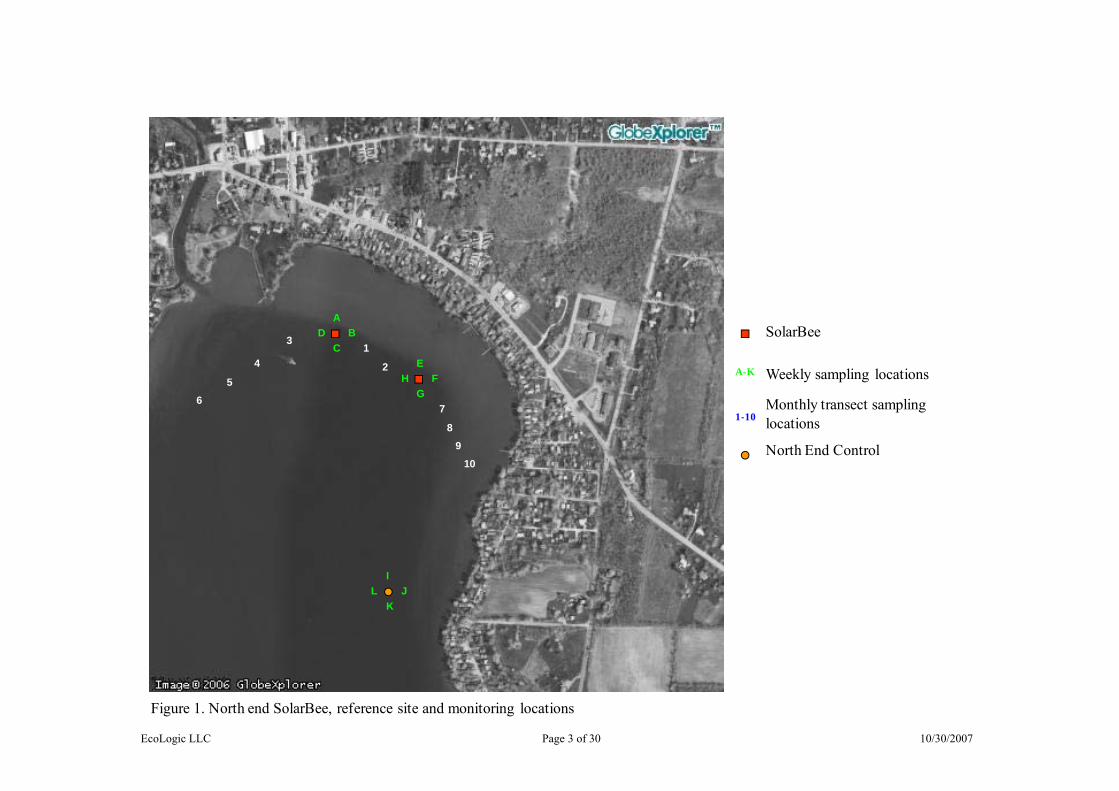
Figure 1. North end SolarBee, reference site and monitoring locations
North End Control
AB
CD
EF
GH
IJ
KL
1
2
3
4
56
7
89
10
A-K Weekly sampling locations
1-10Monthly transect sampling locations
EcoLogic LLC Page 4 of 30 10/30/2007
M
N
O
P
14
1312
11
15
1617
18
QR
ST
SolarBee
Sacketts Control
M-T Weekly sampling locations
11-18Monthly transect sampling locations
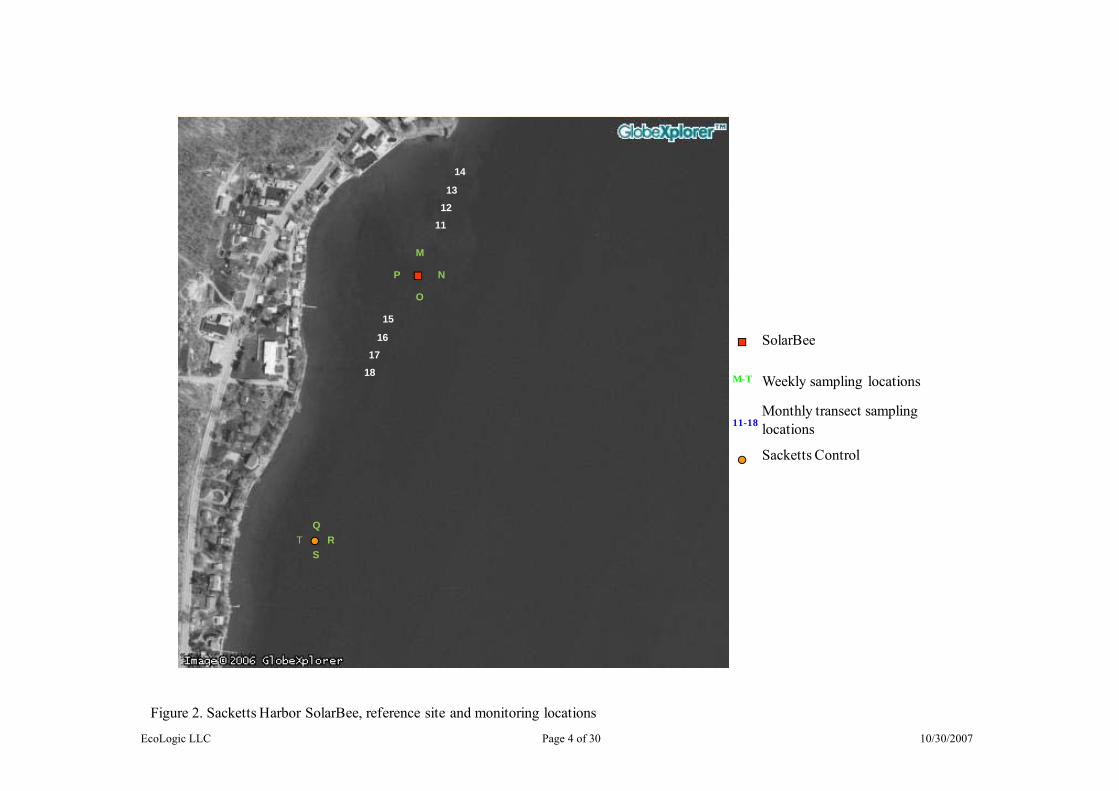
Figure 2. Sacketts Harbor SolarBee, reference site and monitoring locations
EcoLogic LLC Page 5 of 30 10/30/2007
The monitoring program extended from May 22 – August 21, 2007. Researchers and students
from SUNY-Geneseo measured some parameters in the field and collected water samples for
laboratory analysis of other parameters. This team assayed metaphyton density using digital
photography techniques. The Geneseo researchers surveyed macrophyte biomass and species
composition using their standard quadrat sampling techniques. Water chemistry analyses were
completed in certified laboratories at SUNY-Brockport. A public perception survey was
conducted concurrently with the water quality and biological sampling programs.
3.1 Location of Sites
Two SolarBees were located along the north shore of the lake and one in Sacketts Harbor.
The locations of the SolarBee sites were the same in both 2006 and 2007. The north end
units were placed along the northern shoreline near Vitale Park, in approximately seven
feet of water, and approximately 700 feet from shore. The units were roughly 900 feet
from one another. The Sacketts Harbor unit was located north of Wadsworth Cove in
about seven feet of water and approximately 450 feet from shore. The spatial coordinates
for these locations were:
Northend west unit N 42.83239 degrees W 077.70512 degrees Northend east unit N 42.83151 degrees W 077.69885 degrees Sacketts Harbor unit N 42.79273 degrees W 077.71989 degrees
3.2 Monitoring Locations
Sampling design during 2007 was comparable to the 2006 program; that is, treatment and
reference sites are in the same locations. The sampling design used a reference/treatment
and transect approach as there are no historical data at spatial and temporal scales
adequate for a before /after design. Reference sites were the same as 2006 and were
located outside of the projected area of influence of the mixing devices, in regions of
comparable water depth.
Reference/treatment samples were collected in replicates of four. Location of replicates
was typically evenly spaced around a 25m radius from the units or center point of
reference sites (Figure 1 and 2). This allowed for an estimation of variance around the
units/reference. Transect sampling was also completed at points 50m, 100m, 150m, and
200m away from either side of SolarBee units (note: macrophyte and metaphyton
EcoLogic LLC Page 6 of 30 10/30/2007
sampling terminated at 150m from the unit) (Figure 1 and 2). This transect length
encompassed the probable zone of influence of the units. It should be noted that the
vendor does not make any claims regarding spatial gradient associated with the
SolarBees. Spatial analysis was carried out based on observations of turbidity in 2006.
Transects were roughly parallel to the shoreline at the 5 ft. depth contour in order to
minimize the effect of water depth on parameters (this is particularly of concern with the
macrophyte measurements).
3.3 Monitoring Parameters
The parameters evaluated during the field assessment program are directly related to the
impairments evident in Conesus Lake: metaphyton, algae, macrophytes, and water clarity
(Table 3). Turbidity is the primary indicator of water clarity; phycocyanin is the indicator
of cyanobacteria; and chlorophyll-a is an indicator of algal abundance. Total suspended
solids were also collected to help explain any documented clearing/turbidity events.
Water samples were collected at a water depth of 1-meter below the surface in replicates
of four around a 25 m radius located at each site weekly from mid-May through August.
In addition, samples were collected along transects on a monthly basis in June, July, and
August.
Metaphyton was sampled once near the time of peak density at the end of July. Samples
(digital images) were collected from quadrats within a radius of 25 m around the
SolarBees and the two reference sites, and also at two transects at each SolarBee site at
points 50m, 100m, and 150m away on either side of the SolarBee units.
Macrophytes were collected once in mid-August, which was near the peak biomass time
based on observations by the field team. Four replicates quadrat samples were collected
around a 25m radius around each SolarBee unit and at each reference site. Samples were
also collected along transects; three replicates along each of two transects with points at
50m, 100m, and 150m, on either site of the SolarBees. For each quadrat the dry biomass
of all species in the quadrat was determined.
EcoLogic LLC Page 7 of 30 10/30/2007
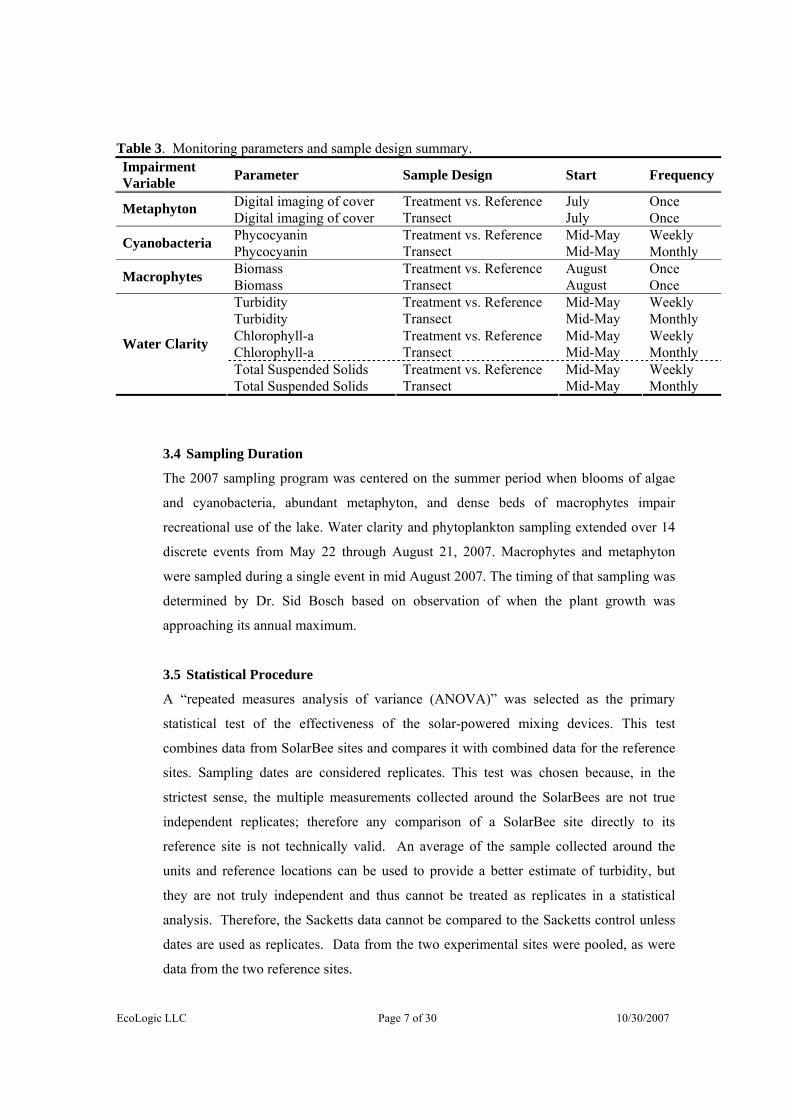
Table 3. Monitoring parameters and sample design summary. Impairment Variable Parameter Sample Design Start Frequency
Digital imaging of cover Treatment vs. Reference July Once Metaphyton Digital imaging of cover Transect July Once Phycocyanin Treatment vs. Reference Mid-May Weekly Cyanobacteria Phycocyanin Transect Mid-May Monthly Biomass Treatment vs. Reference August Once Macrophytes Biomass Transect August Once Turbidity Treatment vs. Reference Mid-May Weekly Turbidity Transect Mid-May Monthly Chlorophyll-a Treatment vs. Reference Mid-May Weekly Chlorophyll-a Transect Mid-May Monthly Total Suspended Solids Treatment vs. Reference Mid-May Weekly
Water Clarity
Total Suspended Solids Transect Mid-May Monthly
3.4 Sampling Duration
The 2007 sampling program was centered on the summer period when blooms of algae
and cyanobacteria, abundant metaphyton, and dense beds of macrophytes impair
recreational use of the lake. Water clarity and phytoplankton sampling extended over 14
discrete events from May 22 through August 21, 2007. Macrophytes and metaphyton
were sampled during a single event in mid August 2007. The timing of that sampling was
determined by Dr. Sid Bosch based on observation of when the plant growth was
approaching its annual maximum.
3.5 Statistical Procedure
A “repeated measures analysis of variance (ANOVA)” was selected as the primary
statistical test of the effectiveness of the solar-powered mixing devices. This test
combines data from SolarBee sites and compares it with combined data for the reference
sites. Sampling dates are considered replicates. This test was chosen because, in the
strictest sense, the multiple measurements collected around the SolarBees are not true
independent replicates; therefore any comparison of a SolarBee site directly to its
reference site is not technically valid. An average of the sample collected around the
units and reference locations can be used to provide a better estimate of turbidity, but
they are not truly independent and thus cannot be treated as replicates in a statistical
analysis. Therefore, the Sacketts data cannot be compared to the Sacketts control unless
dates are used as replicates. Data from the two experimental sites were pooled, as were
data from the two reference sites.
EcoLogic LLC Page 8 of 30 10/30/2007
A second order polynomial test was applied to evaluate the spatial extent of any influence
of the devices on ambient water quality conditions. This analysis assumes that
improvements would be more pronounced close to the units and would diminish with
distance. Note, however, that the vendor made no claims of an expected gradient in water
quality conditions with distance from the units.
Finally, a linear regression of water quality conditions over the course of the summer
2007 monitoring period was applied to evaluate whether conditions at the test sites
improved over time.
3.6 Hypothesis Testing
The overall hypothesis to be tested is that SolarBees positively affect lake condition
where the units are present. To test this hypothesis, specific variables that are important
to Conesus Lake impairment were measured. The hypotheses used to test the specific
claims presented in the SolarBee proposal developed for Conesus Lake were:
(1) Water clarity (as measured by turbidity)
a. There is a statistically significant increase in water clarity (lower turbidity) in treatment areas.
b. There is a statistically significant decrease in water clarity (increase in turbidity) with distance from SolarBee units.
(2) Abundance of algae and cyanobacteria (as measured by chlorophyll-a and phycocyanin)
a. There is a statistically significant reduction in the abundance of algae and/or cyanobacteria in treatment areas.
b. There is a statistically significant increase in the abundance of algae and/or cyanobacteria with distance from SolarBee units.
(3) Metaphyton a. There is a statistically significant reduction in percent cover of metaphyton in
treatment areas. b. There is a statistically significant increase in percent cover of metaphyton
with distance from SolarBee units. (4) Macrophytes
a. Treatment areas have statistically significant reduced biomass of macrophyte and Eurasian watermilfoil as compared to reference sites.
b. There is a statistically significant increase in biomass of macrophytes and Eurasian watermilfoil with distance from SolarBee units.
Note: Hypotheses were tested at an alpha level of 0.05 that was decided on by the Conesus Lake Watershed Council in consultation with the project biostatistician, Dr. Gregg Hartvigsen of SUNY Geneseo. The alpha level represents the probability of making a Type 1 error; that is, concluding that the SolarBees are effective in Conesus Lake when improvements were due to chance.
EcoLogic LLC Page 9 of 30 10/30/2007
3.7 Perception Survey
The objective of the Conesus Lake perception survey was to gather data regarding how
the general public viewed water quality conditions in regions of Conesus Lake both
within and outside of the zone of influence of the mixing devices. This survey was
designed to be similar to lake surveys used by natural resource management agencies in
several states (New York, Vermont, and Minnesota).
A total of 138 perception surveys were completed between July and early September,
2007. Similar to the 2006 surveys, the majority were completed in July and August.
Four zones were identified for the perception survey. These zones were:
• Zone 1 – SolarBee treatment area at northern basin (North SolarBee)
• Zone 2 – Control adjacent to northern basin (North reference)
• Zone 3 – SolarBee treatment area at western shoreline (Sacketts Harbor
SolarBee)
• Zone 4 – Control adjacent to western basin (Sacketts Harbor reference)
EcoLogic LLC Page 10 of 30 10/30/2007
4.0 Results and Discussion
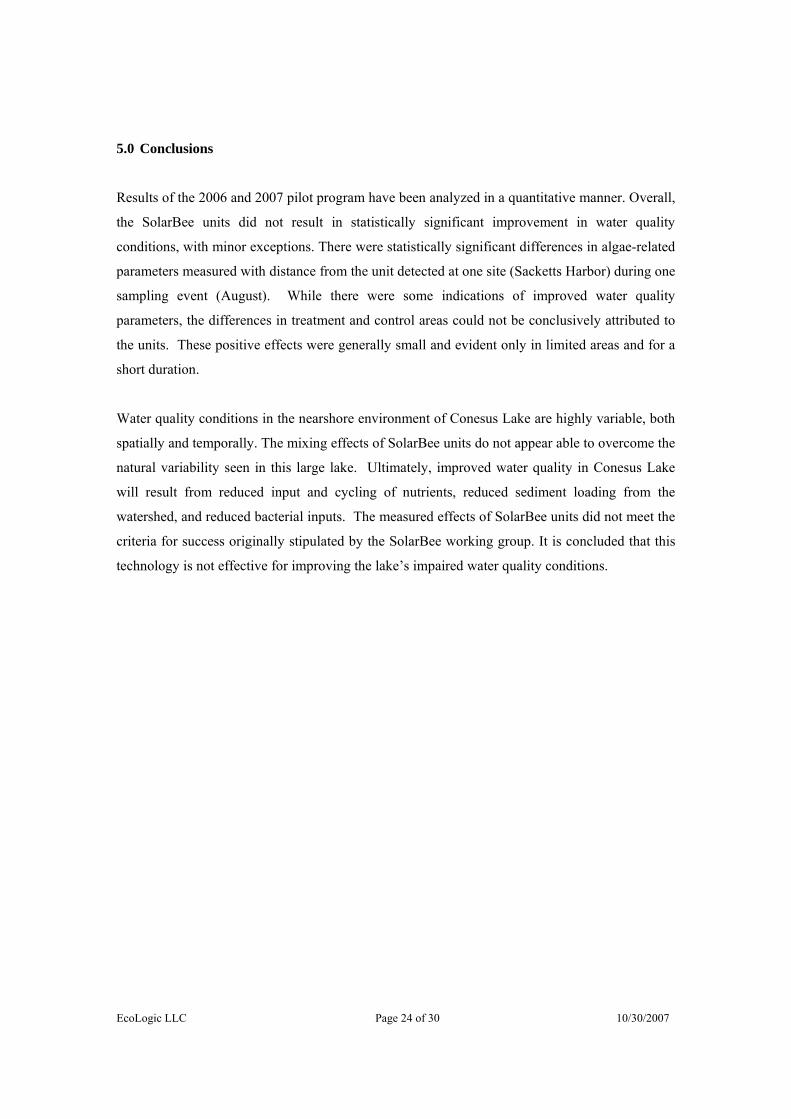
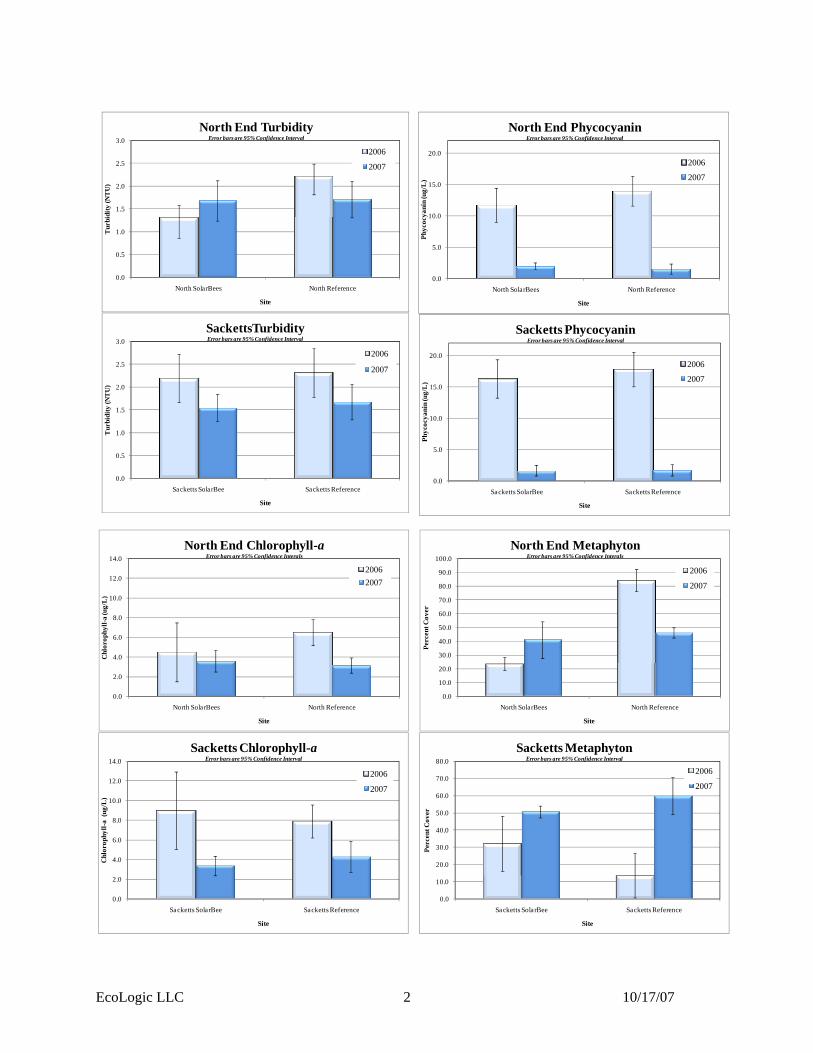
4.1 Comparison of 2006 and 2007 Monitoring Results
The side-by-side comparisons of 2006 and 2007 results in Appendix 1 demonstrate the
spatial and interannual variability in water quality conditions in Conesus Lake. For
example, turbidity, metaphyton and macrophytes at the northern SolarBee sites were
lower than at reference site in 2006, but were essentially identical in 2007. Phycocyanin
concentrations were an order of magnitude lower at all sites in 2007. Macrophyte growth
was also lower at all but one site in 2007.
4.2 2007 Overall Effect of SolarBees
The pilot test of SolarBee units in Conesus Lake was designed to test specific hypotheses
related to the manufacturer’s claims of improved water quality and conditions brought
about by the machines. Results of the first year of the pilot testing (2006) indicated that
the SolarBee units were not effective at significantly improving quality in areas they were
deployed due to the dominant effect of lake variability. There were some subtle positive
effects associated with the units, therefore a second year of monitoring was conducted.
It was determined prior to the 2007 monitoring period that SolarBees would be
considered a viable solution to the lake’s water quality problems if they met the following
criteria;
1. They produced improved water quality conditions near the units as compared to reference sites distant from the units. Improvement would be determined by statistical testing at an alpha level of 0.05.
2. Any statistically significant improvements were of a magnitude that would be readily noticeable by lake users.
3. Any statistically significant improvements were also spatially and temporally robust; i.e., the area around the units exhibiting improved water quality conditions was large enough and their duration long enough to justify the expense of the remedial measure.
Summary statistics for the individual sites are presented in Table 4. Monitoring result for
SolarBee sites were compared to reference locations using a repeated measures ANOVA
for water quality variables that were sampled weekly (turbidity, TSS, chlorophyll-a, and
phycocyanin) and a single sided t-test for biotic variables collected during a single
sampling event (metaphyton and macrophytes).
EcoLogic LLC Page 11 of 30 10/30/2007
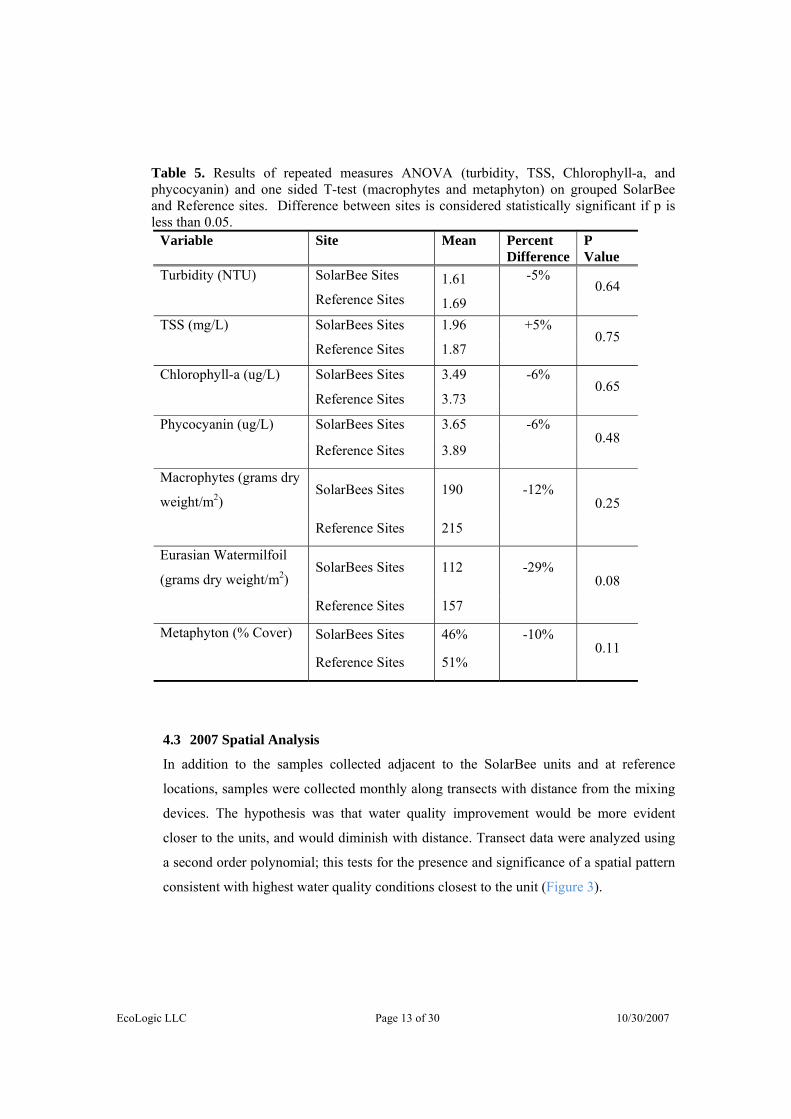
The results of these analyses are shown in Table 5. The table shows the mean values for
SolarBee and reference sites, the difference between the SolarBee sites and reference
sites, and the p-value from the statistical tests of significance (a p-value less than 0.05
indicates the difference between sites was statistically significant). Eurasian watermilfoil
exhibited the largest overall difference between SolarBee and reference sites (29% lower
milfoil biomass at SolarBee sites) but the result was not statistically significant (p-value=
0.08). The reduction in milfoil was limited to a very small area. Similarly, differences
between variables at grouped SolarBee locations and reference sites were small and not
statistically significant (p-value range 0.75 to 0.11). None of the differences between
SolarBee site and reference locations were statistically significant (p > 0.05 for all tests).
In addition to the pre-determined statistical testing, the spatial and temporal patterns were
examined to evaluate whether the units were exerting localized effects. Additional
analyses were completed using a second order polynomial analysis to detect spatial
patterns, and a linear regression was used to identify temporal patterns.
EcoLogic LLC Page 12 of 30 10/30/2007
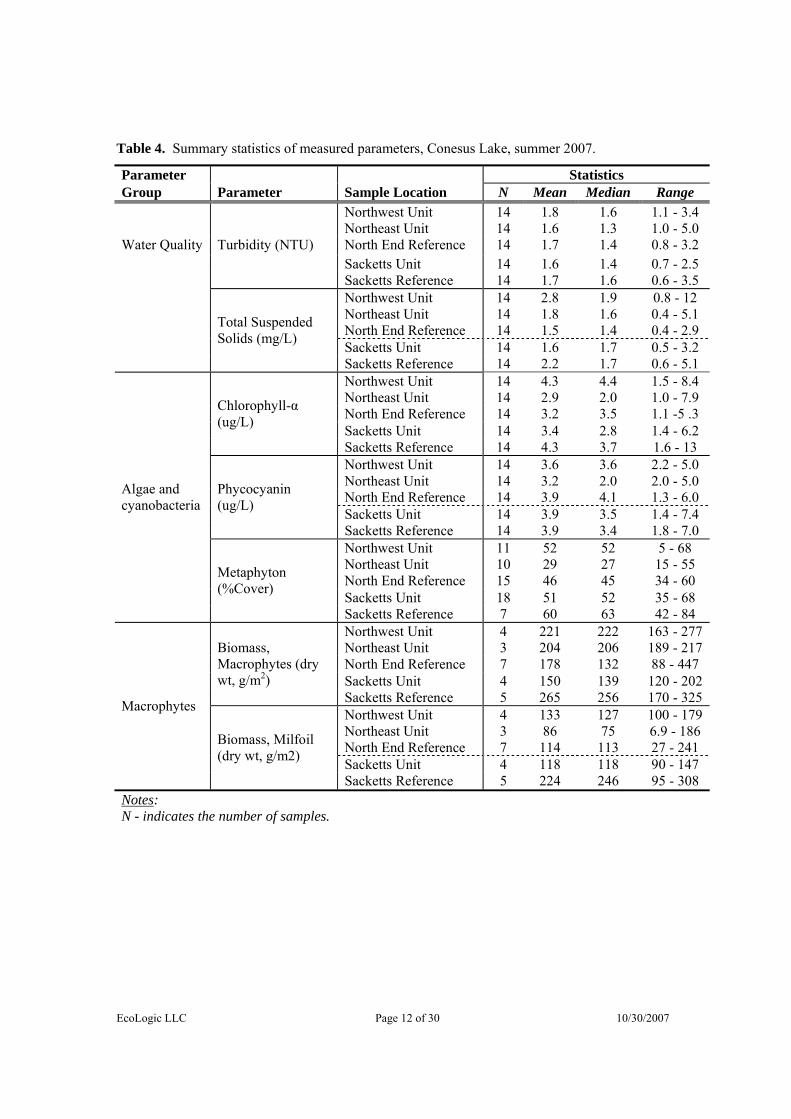
Table 4. Summary statistics of measured parameters, Conesus Lake, summer 2007.
Parameter Statistics Group Parameter Sample Location N Mean Median Range
Northwest Unit Northeast Unit
14 14
1.8 1.6
1.6 1.3
1.1 - 3.4 1.0 - 5.0
North End Reference 14 1.7 1.4 0.8 - 3.2 Sacketts Unit 14 1.6 1.4 0.7 - 2.5
Water Quality Turbidity (NTU)
Sacketts Reference 14 1.7 1.6 0.6 - 3.5 Northwest Unit Northeast Unit
14 14
2.8 1.8
1.9 1.6
0.8 - 12 0.4 - 5.1
North End Reference 14 1.5 1.4 0.4 - 2.9 Sacketts Unit 14 1.6 1.7 0.5 - 3.2
Total Suspended Solids (mg/L)
Sacketts Reference 14 2.2 1.7 0.6 - 5.1 Northwest Unit Northeast Unit
14 14
4.3 2.9
4.4 2.0
1.5 - 8.4 1.0 - 7.9
North End Reference 14 3.2 3.5 1.1 -5 .3 Sacketts Unit 14 3.4 2.8 1.4 - 6.2
Chlorophyll-α (ug/L)
Sacketts Reference 14 4.3 3.7 1.6 - 13 Northwest Unit Northeast Unit
14 14
3.6 3.2
3.6 2.0
2.2 - 5.0 2.0 - 5.0
North End Reference 14 3.9 4.1 1.3 - 6.0 Sacketts Unit 14 3.9 3.5 1.4 - 7.4
Phycocyanin (ug/L)
Sacketts Reference 14 3.9 3.4 1.8 - 7.0 Northwest Unit Northeast Unit
11 10
52 29
52 27
5 - 68 15 - 55
North End Reference 15 46 45 34 - 60 Sacketts Unit 18 51 52 35 - 68
Algae and cyanobacteria
Metaphyton (%Cover)
Sacketts Reference 7 60 63 42 - 84 Northwest Unit Northeast Unit
4 3
221 204
222 206
163 - 277 189 - 217
North End Reference 7 178 132 88 - 447 Sacketts Unit 4 150 139 120 - 202
Biomass, Macrophytes (dry wt, g/m2)
Sacketts Reference 5 265 256 170 - 325 Northwest Unit Northeast Unit
4 3
133 86
127 75
100 - 179 6.9 - 186
North End Reference 7 114 113 27 - 241 Sacketts Unit 4 118 118 90 - 147
Macrophytes
Biomass, Milfoil (dry wt, g/m2)
Sacketts Reference 5 224 246 95 - 308 Notes: N - indicates the number of samples.
EcoLogic LLC Page 13 of 30 10/30/2007
Table 5. Results of repeated measures ANOVA (turbidity, TSS, Chlorophyll-a, and phycocyanin) and one sided T-test (macrophytes and metaphyton) on grouped SolarBee and Reference sites. Difference between sites is considered statistically significant if p is less than 0.05.
Variable Site Mean Percent Difference
P Value
Turbidity (NTU) SolarBee Sites 1.61 -5%
Reference Sites 1.69 0.64
TSS (mg/L) SolarBees Sites 1.96 +5%
Reference Sites 1.87 0.75
Chlorophyll-a (ug/L) SolarBees Sites 3.49 -6%
Reference Sites 3.73 0.65
Phycocyanin (ug/L) SolarBees Sites 3.65 -6%
Reference Sites 3.89 0.48
Macrophytes (grams dry
weight/m2) SolarBees Sites 190 -12%
Reference Sites 215
0.25
Eurasian Watermilfoil
(grams dry weight/m2) SolarBees Sites 112 -29%
Reference Sites 157
0.08
Metaphyton (% Cover) SolarBees Sites 46% -10%
Reference Sites 51% 0.11
4.3 2007 Spatial Analysis
In addition to the samples collected adjacent to the SolarBee units and at reference
locations, samples were collected monthly along transects with distance from the mixing
devices. The hypothesis was that water quality improvement would be more evident
closer to the units, and would diminish with distance. Transect data were analyzed using
a second order polynomial; this tests for the presence and significance of a spatial pattern
consistent with highest water quality conditions closest to the unit (Figure 3).
EcoLogic LLC Page 14 of 30 10/30/2007
R² = 0.933
0123456789
10
-200 -150 -100 -50 0 50 100 150 200
Var
iabl
e Res
ult
Distance (m) From SolarBee Unit
Example of Hypothesized Second Order Polynomial Pattern
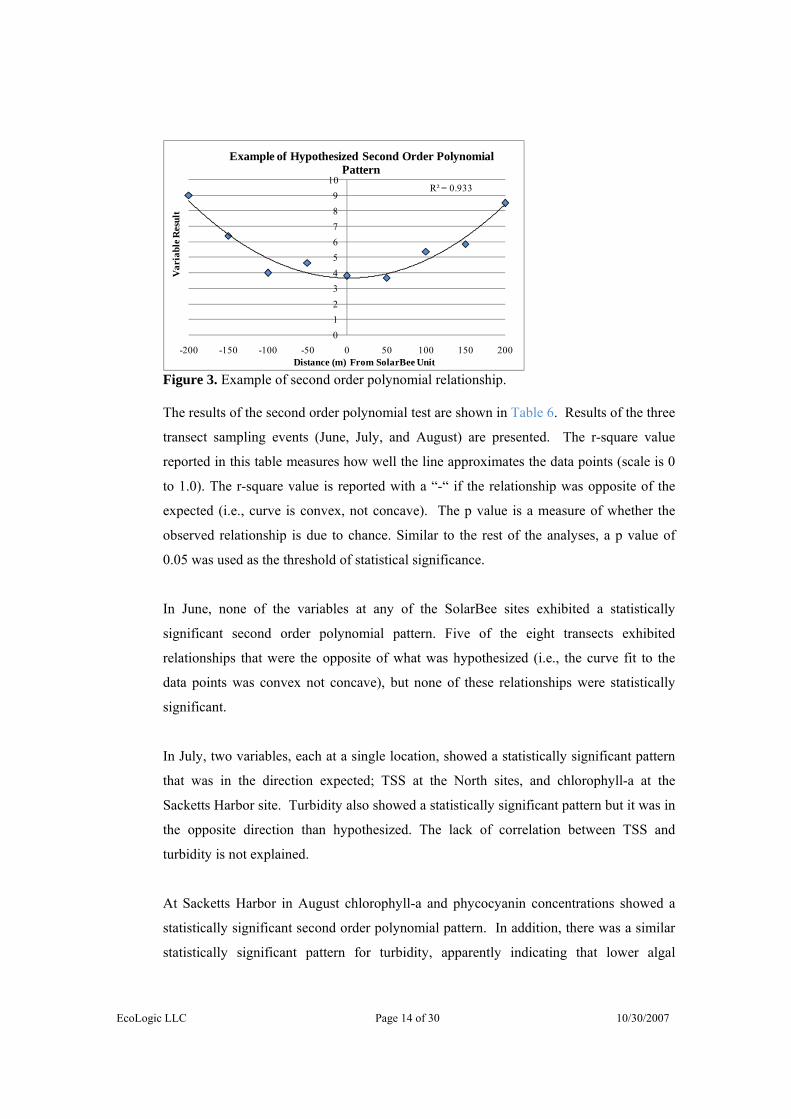
Figure 3. Example of second order polynomial relationship.
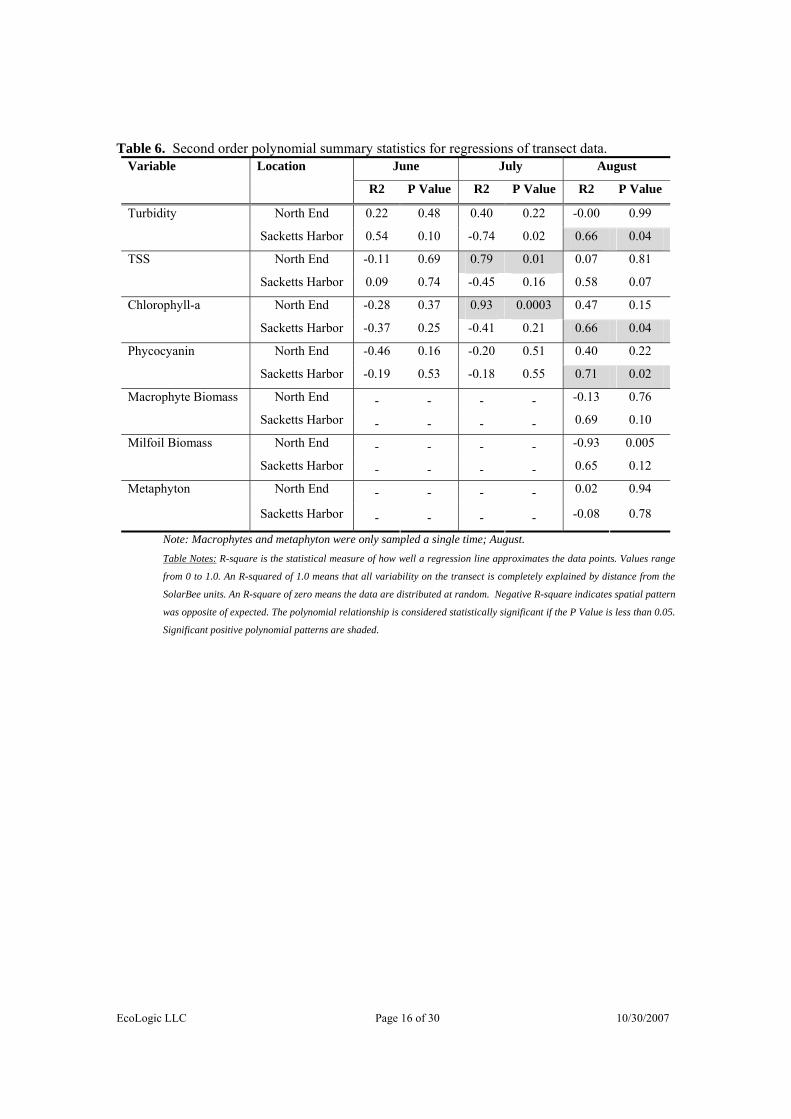
The results of the second order polynomial test are shown in Table 6. Results of the three
transect sampling events (June, July, and August) are presented. The r-square value
reported in this table measures how well the line approximates the data points (scale is 0
to 1.0). The r-square value is reported with a “-“ if the relationship was opposite of the
expected (i.e., curve is convex, not concave). The p value is a measure of whether the
observed relationship is due to chance. Similar to the rest of the analyses, a p value of
0.05 was used as the threshold of statistical significance.
In June, none of the variables at any of the SolarBee sites exhibited a statistically
significant second order polynomial pattern. Five of the eight transects exhibited
relationships that were the opposite of what was hypothesized (i.e., the curve fit to the
data points was convex not concave), but none of these relationships were statistically
significant.
In July, two variables, each at a single location, showed a statistically significant pattern
that was in the direction expected; TSS at the North sites, and chlorophyll-a at the
Sacketts Harbor site. Turbidity also showed a statistically significant pattern but it was in
the opposite direction than hypothesized. The lack of correlation between TSS and
turbidity is not explained.
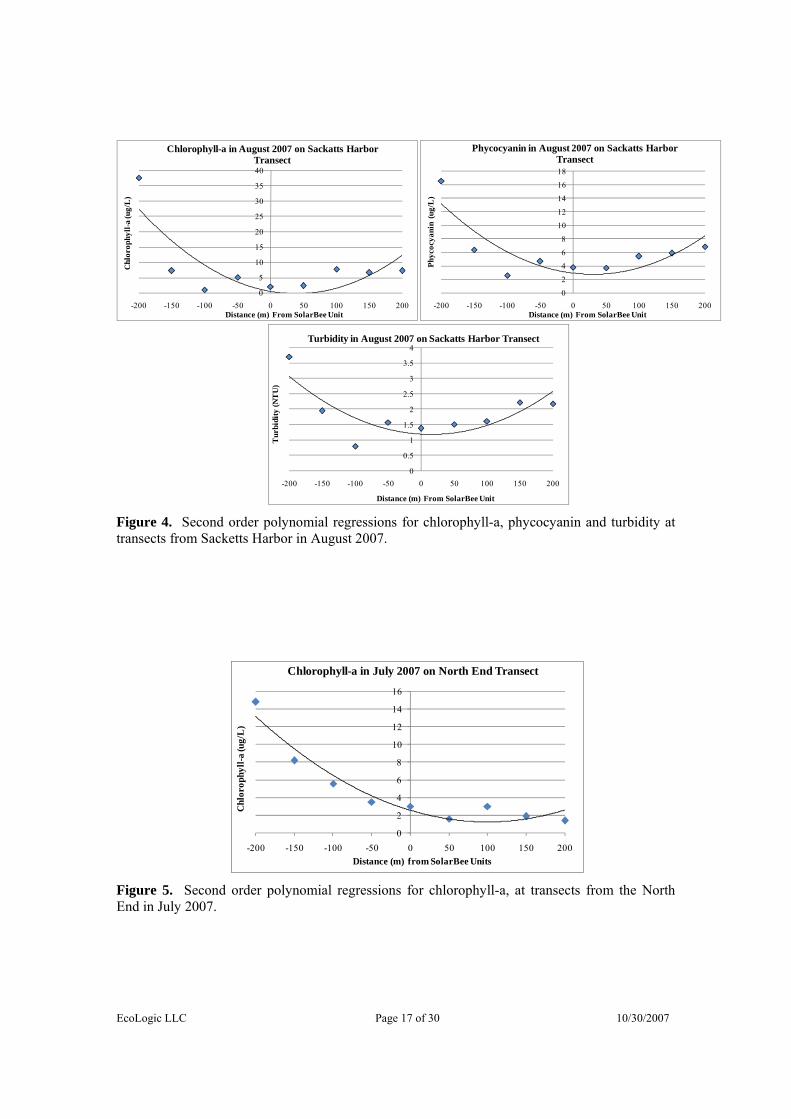
At Sacketts Harbor in August chlorophyll-a and phycocyanin concentrations showed a
statistically significant second order polynomial pattern. In addition, there was a similar
statistically significant pattern for turbidity, apparently indicating that lower algal
EcoLogic LLC Page 15 of 30 10/30/2007
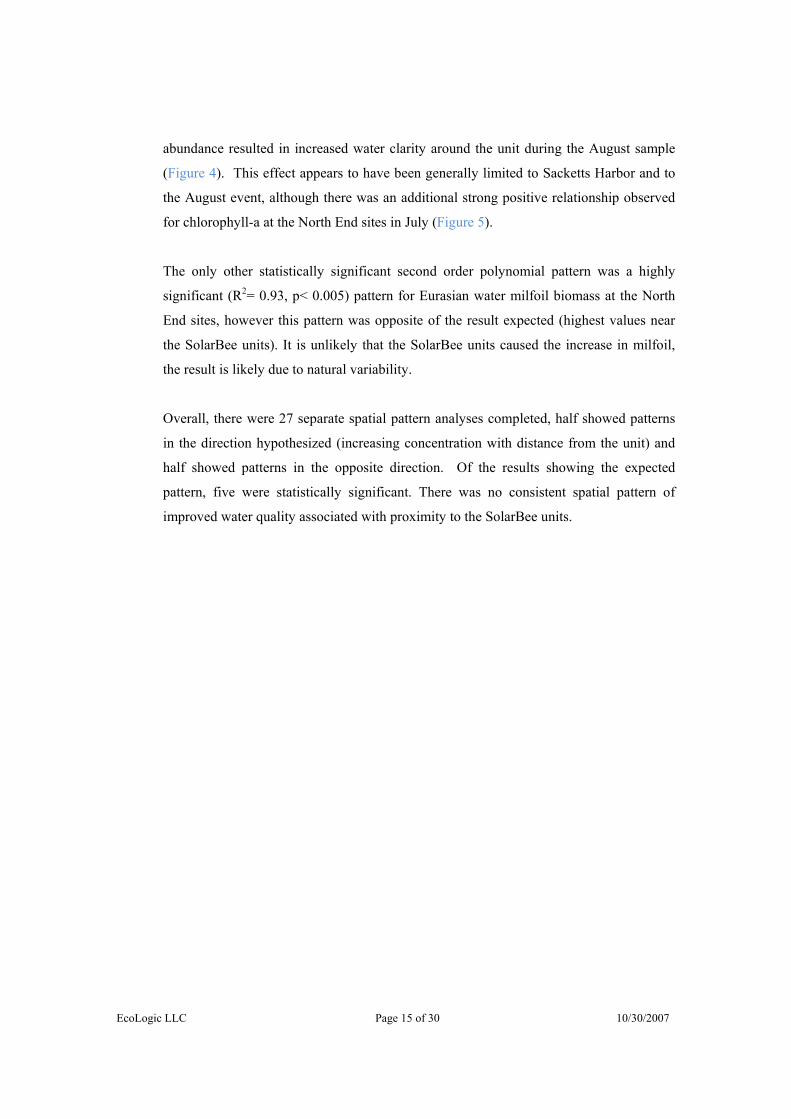
abundance resulted in increased water clarity around the unit during the August sample
(Figure 4). This effect appears to have been generally limited to Sacketts Harbor and to
the August event, although there was an additional strong positive relationship observed
for chlorophyll-a at the North End sites in July (Figure 5).
The only other statistically significant second order polynomial pattern was a highly
significant (R2= 0.93, p< 0.005) pattern for Eurasian water milfoil biomass at the North
End sites, however this pattern was opposite of the result expected (highest values near
the SolarBee units). It is unlikely that the SolarBee units caused the increase in milfoil,
the result is likely due to natural variability.
Overall, there were 27 separate spatial pattern analyses completed, half showed patterns
in the direction hypothesized (increasing concentration with distance from the unit) and
half showed patterns in the opposite direction. Of the results showing the expected
pattern, five were statistically significant. There was no consistent spatial pattern of
improved water quality associated with proximity to the SolarBee units.
EcoLogic LLC Page 16 of 30 10/30/2007
Table 6. Second order polynomial summary statistics for regressions of transect data. June July August Variable Location
R2 P Value R2 P Value R2 P Value
North End 0.22 0.48 0.40 0.22 -0.00 0.99 Turbidity
Sacketts Harbor 0.54 0.10 -0.74 0.02 0.66 0.04
North End -0.11 0.69 0.79 0.01 0.07 0.81 TSS
Sacketts Harbor 0.09 0.74 -0.45 0.16 0.58 0.07
North End -0.28 0.37 0.93 0.0003 0.47 0.15 Chlorophyll-a
Sacketts Harbor -0.37 0.25 -0.41 0.21 0.66 0.04
North End -0.46 0.16 -0.20 0.51 0.40 0.22 Phycocyanin
Sacketts Harbor -0.19 0.53 -0.18 0.55 0.71 0.02
North End - - - - -0.13 0.76 Macrophyte Biomass
Sacketts Harbor - - - - 0.69 0.10
North End - - - - -0.93 0.005 Milfoil Biomass
Sacketts Harbor - - - - 0.65 0.12
North End - - - - 0.02 0.94 Metaphyton
Sacketts Harbor - - - - -0.08 0.78
Note: Macrophytes and metaphyton were only sampled a single time; August. Table Notes: R-square is the statistical measure of how well a regression line approximates the data points. Values range
from 0 to 1.0. An R-squared of 1.0 means that all variability on the transect is completely explained by distance from the
SolarBee units. An R-square of zero means the data are distributed at random. Negative R-square indicates spatial pattern
was opposite of expected. The polynomial relationship is considered statistically significant if the P Value is less than 0.05.
Significant positive polynomial patterns are shaded.
EcoLogic LLC Page 17 of 30 10/30/2007
0
0.5
1
1.5
2
2.5
3
3.5
4
-200 -150 -100 -50 0 50 100 150 200
Tur
bidi
ty (N
TU
)
Distance (m) From SolarBee Unit
Turbidity in August 2007 on Sackatts Harbor Transect
0
5
10
15
20
25
30
35
40
-200 -150 -100 -50 0 50 100 150 200
Chl
orop
hyll-
a (u
g/L
)
Distance (m) From SolarBee Unit
Chlorophyll-a in August 2007 on Sackatts Harbor Transect
0
2
4
6
8
10
12
14
16
18
-200 -150 -100 -50 0 50 100 150 200
Phyc
ocya
nin
(ug/
L)
Distance (m) From SolarBee Unit
Phycocyanin in August 2007 on Sackatts Harbor Transect
Figure 4. Second order polynomial regressions for chlorophyll-a, phycocyanin and turbidity at transects from Sacketts Harbor in August 2007.
0
2
4
6
8
10
12
14
16
-200 -150 -100 -50 0 50 100 150 200
Chl
orop
hyll-
a (u
g/L
)
Distance (m) from SolarBee Units
Chlorophyll-a in July 2007 on North End Transect
Figure 5. Second order polynomial regressions for chlorophyll-a, at transects from the North End in July 2007.
EcoLogic LLC Page 18 of 30 10/30/2007
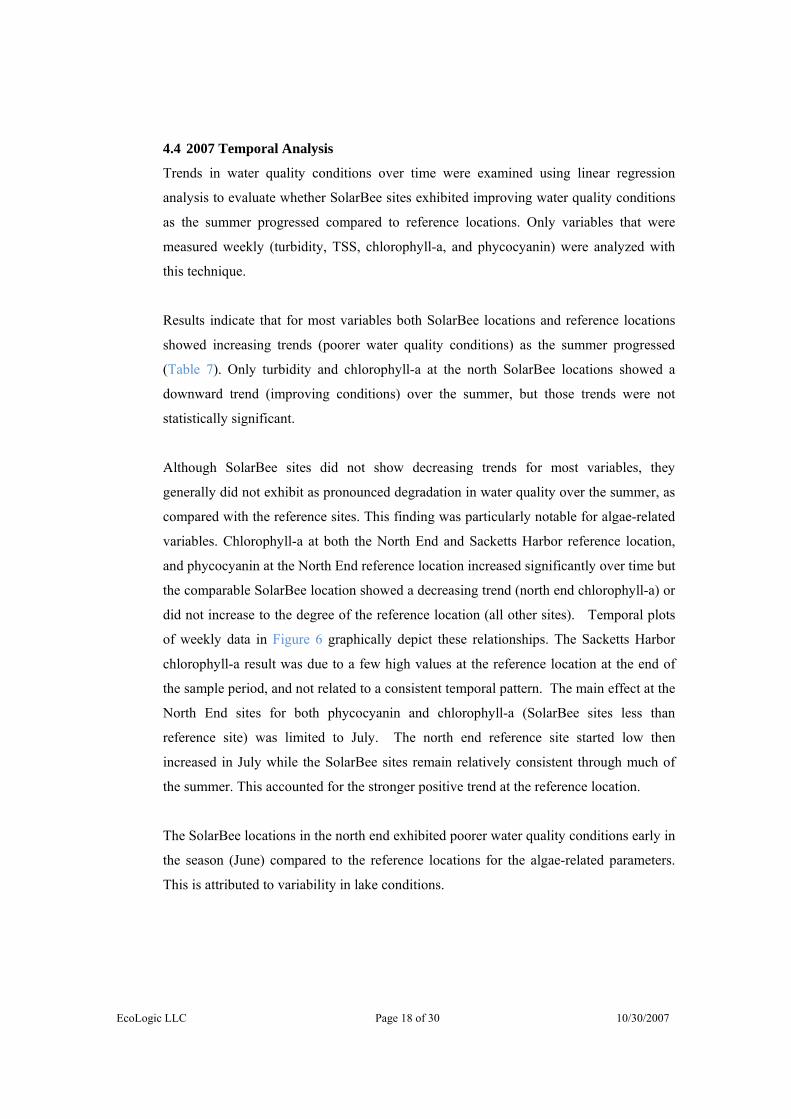
4.4 2007 Temporal Analysis
Trends in water quality conditions over time were examined using linear regression
analysis to evaluate whether SolarBee sites exhibited improving water quality conditions
as the summer progressed compared to reference locations. Only variables that were
measured weekly (turbidity, TSS, chlorophyll-a, and phycocyanin) were analyzed with
this technique.
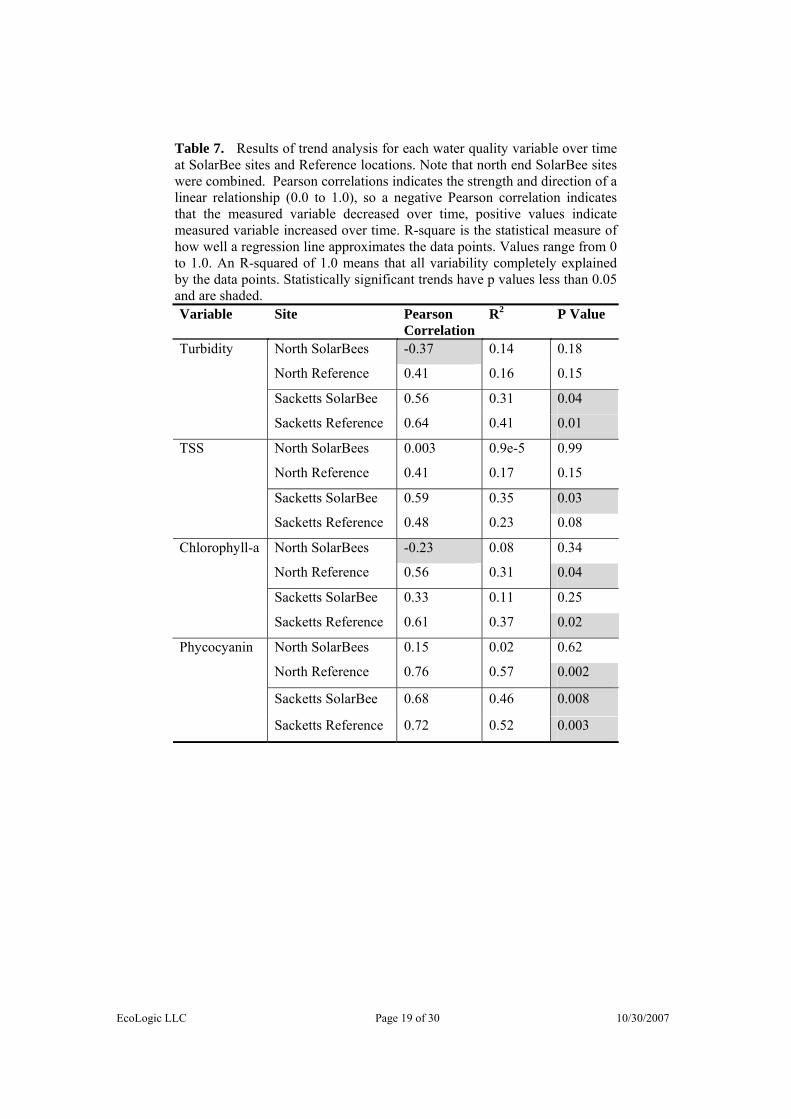
Results indicate that for most variables both SolarBee locations and reference locations
showed increasing trends (poorer water quality conditions) as the summer progressed
(Table 7). Only turbidity and chlorophyll-a at the north SolarBee locations showed a
downward trend (improving conditions) over the summer, but those trends were not
statistically significant.
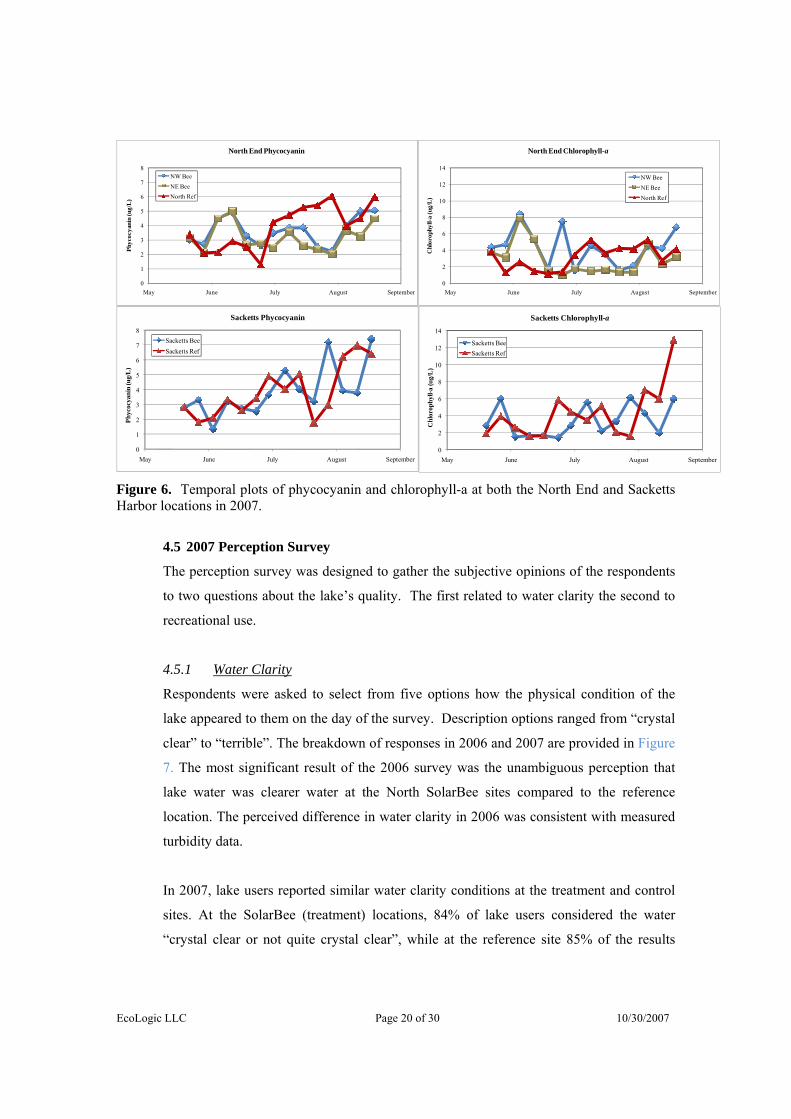
Although SolarBee sites did not show decreasing trends for most variables, they
generally did not exhibit as pronounced degradation in water quality over the summer, as
compared with the reference sites. This finding was particularly notable for algae-related
variables. Chlorophyll-a at both the North End and Sacketts Harbor reference location,
and phycocyanin at the North End reference location increased significantly over time but
the comparable SolarBee location showed a decreasing trend (north end chlorophyll-a) or
did not increase to the degree of the reference location (all other sites). Temporal plots
of weekly data in Figure 6 graphically depict these relationships. The Sacketts Harbor
chlorophyll-a result was due to a few high values at the reference location at the end of
the sample period, and not related to a consistent temporal pattern. The main effect at the
North End sites for both phycocyanin and chlorophyll-a (SolarBee sites less than
reference site) was limited to July. The north end reference site started low then
increased in July while the SolarBee sites remain relatively consistent through much of
the summer. This accounted for the stronger positive trend at the reference location.
The SolarBee locations in the north end exhibited poorer water quality conditions early in
the season (June) compared to the reference locations for the algae-related parameters.
This is attributed to variability in lake conditions.
EcoLogic LLC Page 19 of 30 10/30/2007
Table 7. Results of trend analysis for each water quality variable over time at SolarBee sites and Reference locations. Note that north end SolarBee sites were combined. Pearson correlations indicates the strength and direction of a linear relationship (0.0 to 1.0), so a negative Pearson correlation indicates that the measured variable decreased over time, positive values indicate measured variable increased over time. R-square is the statistical measure of how well a regression line approximates the data points. Values range from 0 to 1.0. An R-squared of 1.0 means that all variability completely explained by the data points. Statistically significant trends have p values less than 0.05 and are shaded. Variable Site Pearson
CorrelationR2 P Value
North SolarBees -0.37 0.14 0.18
North Reference 0.41 0.16 0.15
Sacketts SolarBee 0.56 0.31 0.04
Turbidity
Sacketts Reference 0.64 0.41 0.01
North SolarBees 0.003 0.9e-5 0.99
North Reference 0.41 0.17 0.15
Sacketts SolarBee 0.59 0.35 0.03
TSS
Sacketts Reference 0.48 0.23 0.08
North SolarBees -0.23 0.08 0.34
North Reference 0.56 0.31 0.04
Chlorophyll-a
Sacketts SolarBee 0.33 0.11 0.25
Sacketts Reference 0.61 0.37 0.02
North SolarBees 0.15 0.02 0.62
North Reference 0.76 0.57 0.002
Sacketts SolarBee 0.68 0.46 0.008
Phycocyanin
Sacketts Reference 0.72 0.52 0.003
EcoLogic LLC Page 20 of 30 10/30/2007
0
1
2
3
4
5
6
7
8
May June July August September
Phyc
ocya
nin
(ug/
L)
North End Phycocyanin
NW BeeNE BeeNorth Ref
0
1
2
3
4
5
6
7
8
May June July August September
Phyc
ocya
nin
(ug/
L)
Sacketts Phycocyanin
Sacketts BeeSacketts Ref
0
2
4
6
8
10
12
14
May June July August September
Chl
orop
hyll-
a (u
g/L
)
North End Chlorophyll-a
NW BeeNE BeeNorth Ref
0
2
4
6
8
10
12
14
May June July August September
Chl
orop
hyll-
a (u
g/L
)
Sacketts Chlorophyll-a
Sacketts BeeSacketts Ref
Figure 6. Temporal plots of phycocyanin and chlorophyll-a at both the North End and Sacketts Harbor locations in 2007.
4.5 2007 Perception Survey
The perception survey was designed to gather the subjective opinions of the respondents
to two questions about the lake’s quality. The first related to water clarity the second to
recreational use.
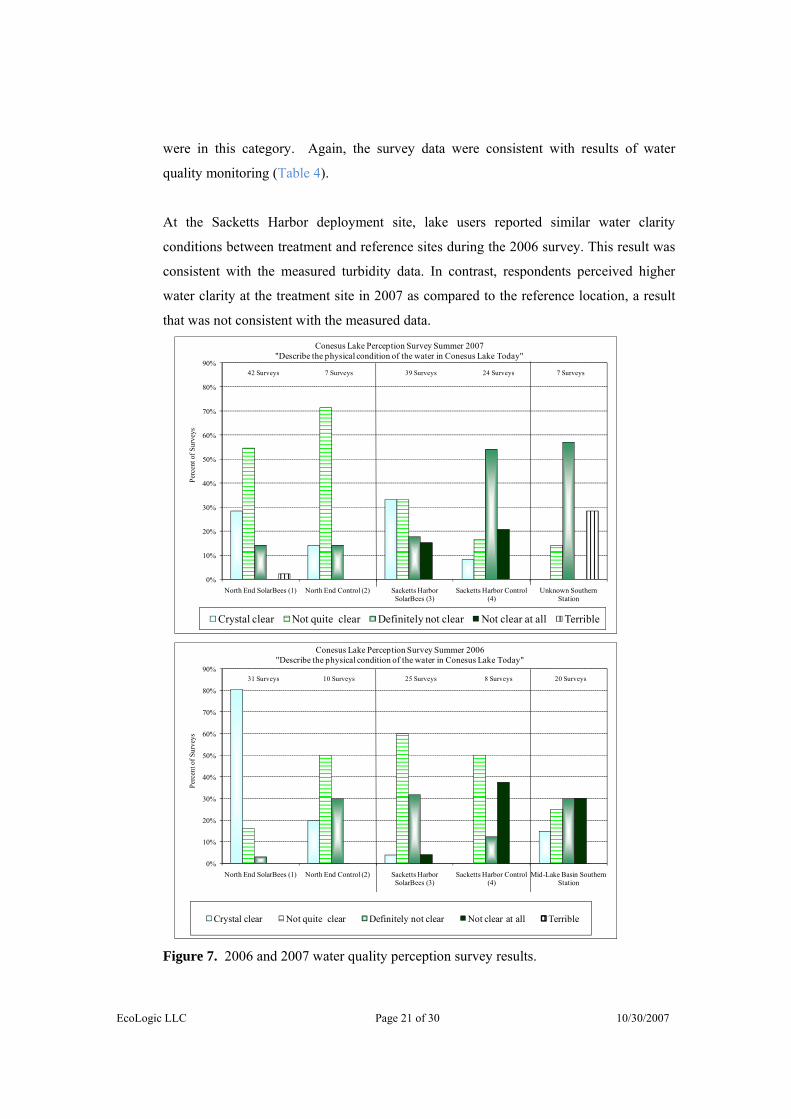
4.5.1 Water Clarity
Respondents were asked to select from five options how the physical condition of the
lake appeared to them on the day of the survey. Description options ranged from “crystal
clear” to “terrible”. The breakdown of responses in 2006 and 2007 are provided in Figure
7. The most significant result of the 2006 survey was the unambiguous perception that
lake water was clearer water at the North SolarBee sites compared to the reference
location. The perceived difference in water clarity in 2006 was consistent with measured
turbidity data.
In 2007, lake users reported similar water clarity conditions at the treatment and control
sites. At the SolarBee (treatment) locations, 84% of lake users considered the water
“crystal clear or not quite crystal clear”, while at the reference site 85% of the results
EcoLogic LLC Page 21 of 30 10/30/2007
were in this category. Again, the survey data were consistent with results of water
quality monitoring (Table 4).
At the Sacketts Harbor deployment site, lake users reported similar water clarity
conditions between treatment and reference sites during the 2006 survey. This result was
consistent with the measured turbidity data. In contrast, respondents perceived higher
water clarity at the treatment site in 2007 as compared to the reference location, a result
that was not consistent with the measured data.
0%
10%
20%
30%
40%
50%
60%
70%
80%
90%
North End SolarBees (1) North End Control (2) Sacketts Harbor SolarBees (3)
Sacketts Harbor Control (4)
Unknown Southern Station
Perc
ent o
f Sur
veys
Conesus Lake Perception Survey Summer 2007"Describe the physical condition of the water in Conesus Lake Today"
Crystal clear Not quite clear Definitely not clear Not clear at all Terrible
42 Surveys 7 Surveys 39 Surveys 24 Surveys 7 Surveys
0%
10%
20%
30%
40%
50%
60%
70%
80%
90%
North End SolarBees (1) North End Control (2) Sacketts Harbor SolarBees (3)
Sacketts Harbor Control (4)
Mid-Lake Basin Southern Station
Perc
ent o
f Sur
veys
Conesus Lake Perception Survey Summer 2006"Describe the physical condition of the water in Conesus Lake Today"
Crystal clear Not quite clear Definitely not clear Not clear at all Terrible
31 Surveys 10 Surveys 25 Surveys 8 Surveys 20 Surveys
Figure 7. 2006 and 2007 water quality perception survey results.
EcoLogic LLC Page 22 of 30 10/30/2007
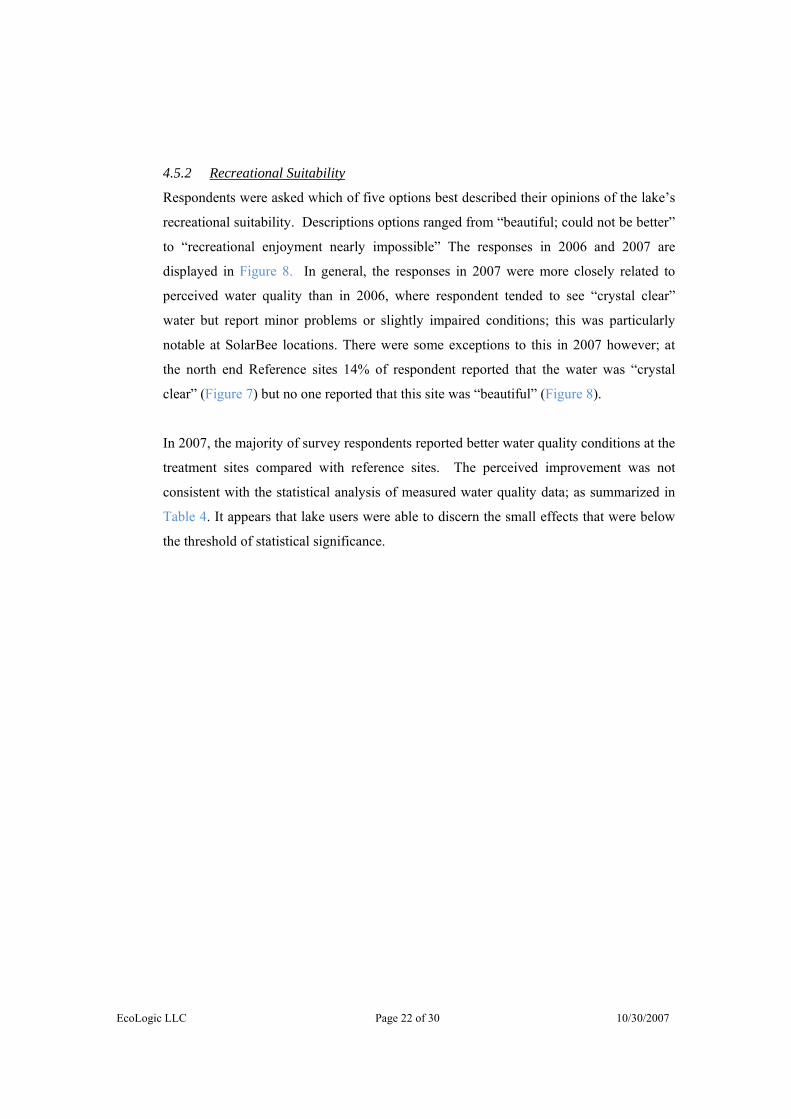
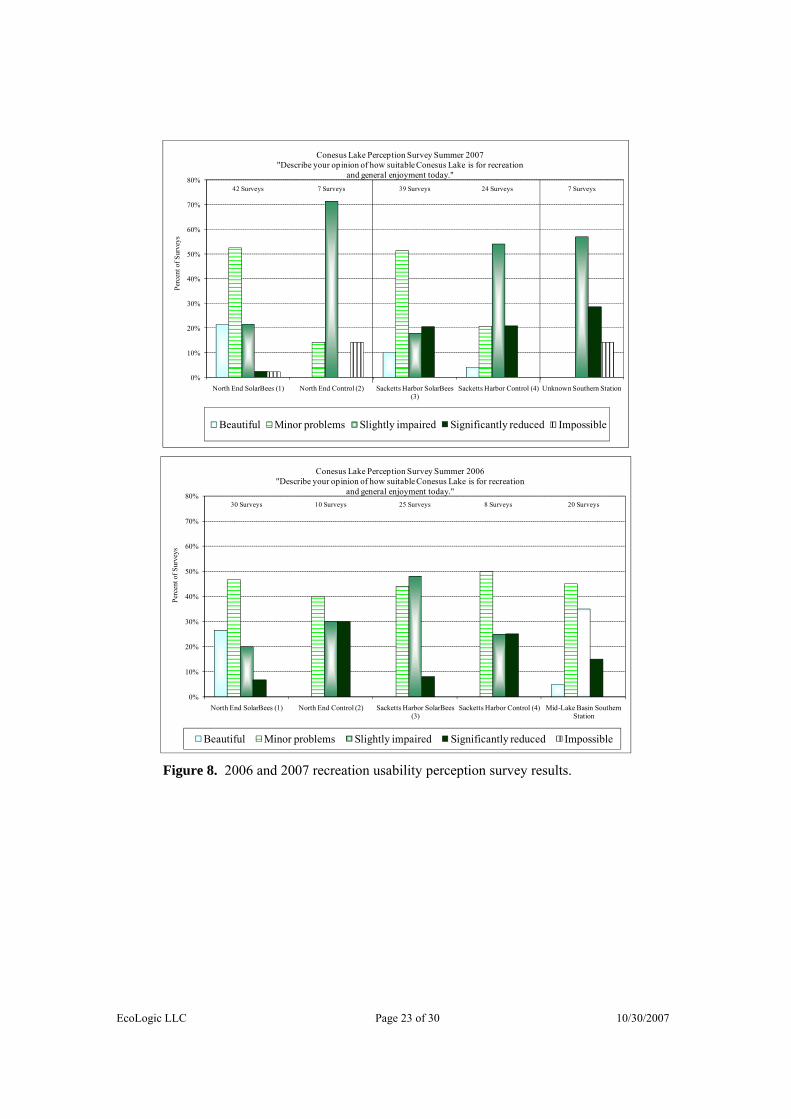
4.5.2 Recreational Suitability
Respondents were asked which of five options best described their opinions of the lake’s
recreational suitability. Descriptions options ranged from “beautiful; could not be better”
to “recreational enjoyment nearly impossible” The responses in 2006 and 2007 are
displayed in Figure 8. In general, the responses in 2007 were more closely related to
perceived water quality than in 2006, where respondent tended to see “crystal clear”
water but report minor problems or slightly impaired conditions; this was particularly
notable at SolarBee locations. There were some exceptions to this in 2007 however; at
the north end Reference sites 14% of respondent reported that the water was “crystal
clear” (Figure 7) but no one reported that this site was “beautiful” (Figure 8).
In 2007, the majority of survey respondents reported better water quality conditions at the
treatment sites compared with reference sites. The perceived improvement was not
consistent with the statistical analysis of measured water quality data; as summarized in
Table 4. It appears that lake users were able to discern the small effects that were below
the threshold of statistical significance.
EcoLogic LLC Page 23 of 30 10/30/2007
0%
10%
20%
30%
40%
50%
60%
70%
80%
North End SolarBees (1) North End Control (2) Sacketts Harbor SolarBees (3)
Sacketts Harbor Control (4) Unknown Southern Station
Perc
ent o
f Sur
veys
Conesus Lake Perception Survey Summer 2007"Describe your opinion of how suitable Conesus Lake is for recreation
and general enjoyment today."
Beautiful Minor problems Slightly impaired Significantly reduced Impossible
42 Surveys 7 Surveys 39 Surveys 24 Surveys 7 Surveys
0%
10%
20%
30%
40%
50%
60%
70%
80%
North End SolarBees (1) North End Control (2) Sacketts Harbor SolarBees (3)
Sacketts Harbor Control (4) Mid-Lake Basin Southern Station
Perc
ent o
f Sur
veys
Conesus Lake Perception Survey Summer 2006"Describe your opinion of how suitable Conesus Lake is for recreation
and general enjoyment today."
Beautiful Minor problems Slightly impaired Significantly reduced Impossible
30 Surveys 10 Surveys 25 Surveys 8 Surveys 20 Surveys
Figure 8. 2006 and 2007 recreation usability perception survey results.
EcoLogic LLC Page 24 of 30 10/30/2007
5.0 Conclusions
Results of the 2006 and 2007 pilot program have been analyzed in a quantitative manner. Overall,
the SolarBee units did not result in statistically significant improvement in water quality
conditions, with minor exceptions. There were statistically significant differences in algae-related
parameters measured with distance from the unit detected at one site (Sacketts Harbor) during one
sampling event (August). While there were some indications of improved water quality
parameters, the differences in treatment and control areas could not be conclusively attributed to
the units. These positive effects were generally small and evident only in limited areas and for a
short duration.
Water quality conditions in the nearshore environment of Conesus Lake are highly variable, both
spatially and temporally. The mixing effects of SolarBee units do not appear able to overcome the
natural variability seen in this large lake. Ultimately, improved water quality in Conesus Lake
will result from reduced input and cycling of nutrients, reduced sediment loading from the
watershed, and reduced bacterial inputs. The measured effects of SolarBee units did not meet the
criteria for success originally stipulated by the SolarBee working group. It is concluded that this
technology is not effective for improving the lake’s impaired water quality conditions.

EcoLogic LLC Page 25 of 30 10/30/2007
Appendices
1. 2006-2007 Summary Figures
2. Perception Survey Report

EcoLogic LLC 1 10/17/07
Appendix 1
Summary Graphs of 2006 and 2007 Results
EcoLogic LLC 2 10/17/07
0.0
0.5
1.0
1.5
2.0
2.5
3.0
North SolarBees North Reference
Tur
bidi
ty (N
TU
)
Site
North End Turbidity Error bars are 95% Confidence Interval
2006
2007
0.0
0.5
1.0
1.5
2.0
2.5
3.0
Sacketts SolarBee Sacketts Reference
Tur
bidi
ty (N
TU
)
Site
SackettsTurbidityError bars are 95% Confidence Interval
2006
2007
0.0
5.0
10.0
15.0
20.0
North SolarBees North Reference
Phyc
ocya
nin
(ug/
L)
Site
North End PhycocyaninError bars are 95% Confidence Interval
2006
2007
0.0
5.0
10.0
15.0
20.0
Sacketts SolarBee Sacketts Reference
Phyc
ocya
nin
(ug/
L)
Site
Sacketts PhycocyaninError bars are 95% Confidence Interval
2006
2007
0.0
2.0
4.0
6.0
8.0
10.0
12.0
14.0
North SolarBees North Reference
Chl
orop
hyll-
a (u
g/L
)
Site
North End Chlorophyll-aError bars are 95% Confidence Interals
20062007
0.0
2.0
4.0
6.0
8.0
10.0
12.0
14.0
Sacketts SolarBee Sacketts Reference
Chl
orop
hyll-
a (u
g/L
)
Site
Sacketts Chlorophyll-aError bars are 95% Confidence Interval
2006
2007
0.0
10.0
20.0
30.0
40.0
50.0
60.0
70.0
80.0
90.0
100.0
North SolarBees North Reference
Perc
ent C
over
Site
North End MetaphytonError bars are 95% Confidence Interals
2006
2007
0.0
10.0
20.0
30.0
40.0
50.0
60.0
70.0
80.0
Sacketts SolarBee Sacketts Reference
Perc
ent C
over
Site
Sacketts MetaphytonError bars are 95% Confidence Interval
2006
2007
EcoLogic LLC 3 10/17/07
0.0
100.0
200.0
300.0
400.0
500.0
600.0
700.0
800.0
North SolarBees North Reference
Bio
mas
ss (g
/m2)
Site
North End MacrophytesError bars are 95% Confidence Interals
2006
2007
0.0
100.0
200.0
300.0
400.0
500.0
600.0
Sacketts SolarBee Sacketts Reference
Bio
mas
s (G
/m2)
Site
Sacketts MacrophytesError bars are 95% Confidence Interval
2006
2007
0.0
100.0
200.0
300.0
400.0
500.0
600.0
700.0
800.0
North SolarBees North Reference
Bio
mas
s (g/
m2)
Site
North End MilfoilError bars are 95% Confidence Interval
2006
2007
0.0
50.0
100.0
150.0
200.0
250.0
300.0
350.0
400.0
450.0
500.0
Sacketts SolarBee Sacketts Reference
Bio
mas
s (g/
m2)
Site
Sacketts MilfoilError bars are 95% Confidence Interval
20062007

EcoLogic LLC Page 1 of 14 10/25/2007
Appendix 2
2007 Perception Survey Report
EcoLogic LLC Page 2 of 14 10/25/2007
Table of Contents
1. Program Design .............................................................................................................. 3
2. Survey Results ................................................................................................................. 5
2.1 Respondent Summary ....................................................................................................... 5 2.2 Observation Point Summary ............................................................................................. 6 2.3 Water Quality Opinion Summary ..................................................................................... 8
2.3.1 Physical Condition ................................................................................................. 9 2.3.2 Recreational Suitability ........................................................................................ 10
Attachment 1 ........................................................................................................................ 14
List of Tables:
Table 1. Temporal distribution of user perception surveys, 2006 and 2007. Table 2. Solarbee observation zones defined for the user perception surveys. Table 3. Distribution of perception surveys by locations. Table 4. Respondents’ self-identification in relation to the lake. Table 5. Observation point from which surveys were conducted. Table 6. Water depth and distance from shore summary. Table 7. Comparison of wording of Question C – Physical Condition – from the 2006 and
2007 surveys. Table 8. Comparison of wording of Question D – Recreational Suitability – from the 2006
and 2007 surveys. List of Figures:
Figure 1. Perception Survey opinions about the physical condition of Conesus Lake. Figure 2. Perception Survey opinions about the suitability of Conesus Lake for recreational
uses.
EcoLogic LLC Page 3 of 14 10/25/2007
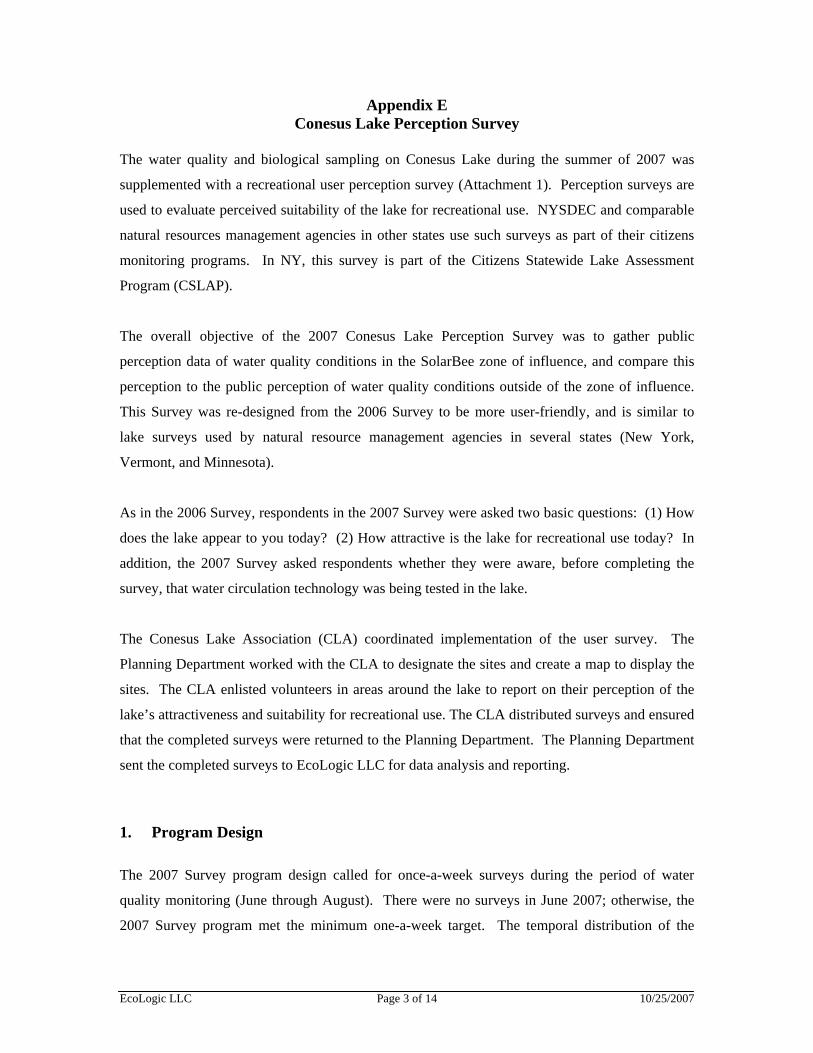
Appendix E Conesus Lake Perception Survey
The water quality and biological sampling on Conesus Lake during the summer of 2007 was
supplemented with a recreational user perception survey (Attachment 1). Perception surveys are
used to evaluate perceived suitability of the lake for recreational use. NYSDEC and comparable
natural resources management agencies in other states use such surveys as part of their citizens
monitoring programs. In NY, this survey is part of the Citizens Statewide Lake Assessment
Program (CSLAP).
The overall objective of the 2007 Conesus Lake Perception Survey was to gather public
perception data of water quality conditions in the SolarBee zone of influence, and compare this
perception to the public perception of water quality conditions outside of the zone of influence.
This Survey was re-designed from the 2006 Survey to be more user-friendly, and is similar to
lake surveys used by natural resource management agencies in several states (New York,
Vermont, and Minnesota).
As in the 2006 Survey, respondents in the 2007 Survey were asked two basic questions: (1) How
does the lake appear to you today? (2) How attractive is the lake for recreational use today? In
addition, the 2007 Survey asked respondents whether they were aware, before completing the
survey, that water circulation technology was being tested in the lake.
The Conesus Lake Association (CLA) coordinated implementation of the user survey. The
Planning Department worked with the CLA to designate the sites and create a map to display the
sites. The CLA enlisted volunteers in areas around the lake to report on their perception of the
lake’s attractiveness and suitability for recreational use. The CLA distributed surveys and ensured
that the completed surveys were returned to the Planning Department. The Planning Department
sent the completed surveys to EcoLogic LLC for data analysis and reporting.
1. Program Design
The 2007 Survey program design called for once-a-week surveys during the period of water
quality monitoring (June through August). There were no surveys in June 2007; otherwise, the
2007 Survey program met the minimum one-a-week target. The temporal distribution of the
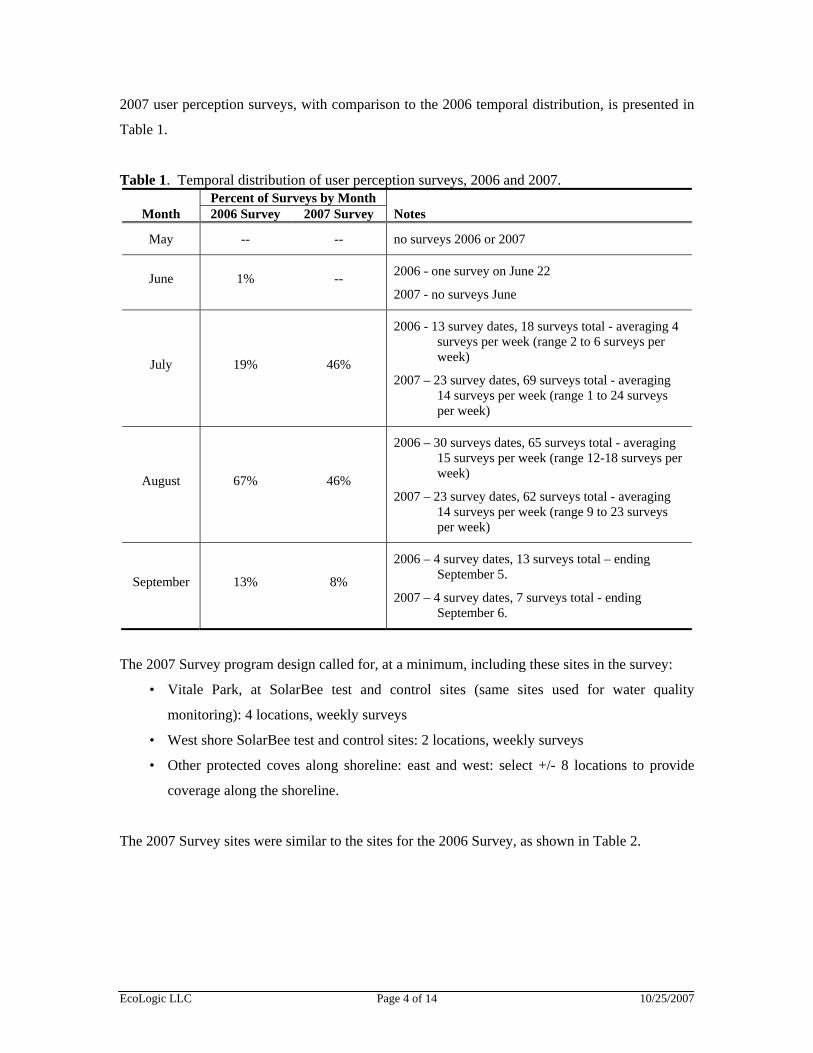
EcoLogic LLC Page 4 of 14 10/25/2007
2007 user perception surveys, with comparison to the 2006 temporal distribution, is presented in
Table 1.
Table 1. Temporal distribution of user perception surveys, 2006 and 2007. Percent of Surveys by Month
Month 2006 Survey 2007 Survey Notes
May -- -- no surveys 2006 or 2007
June 1% -- 2006 - one survey on June 22
2007 - no surveys June
July 19% 46%
2006 - 13 survey dates, 18 surveys total - averaging 4 surveys per week (range 2 to 6 surveys per week)
2007 – 23 survey dates, 69 surveys total - averaging 14 surveys per week (range 1 to 24 surveys per week)
August 67% 46%
2006 – 30 surveys dates, 65 surveys total - averaging 15 surveys per week (range 12-18 surveys per week)
2007 – 23 survey dates, 62 surveys total - averaging 14 surveys per week (range 9 to 23 surveys per week)
September 13% 8%
2006 – 4 survey dates, 13 surveys total – ending September 5.
2007 – 4 survey dates, 7 surveys total - ending September 6.
The 2007 Survey program design called for, at a minimum, including these sites in the survey:
• Vitale Park, at SolarBee test and control sites (same sites used for water quality
monitoring): 4 locations, weekly surveys
• West shore SolarBee test and control sites: 2 locations, weekly surveys
• Other protected coves along shoreline: east and west: select +/- 8 locations to provide
coverage along the shoreline.
The 2007 Survey sites were similar to the sites for the 2006 Survey, as shown in Table 2.
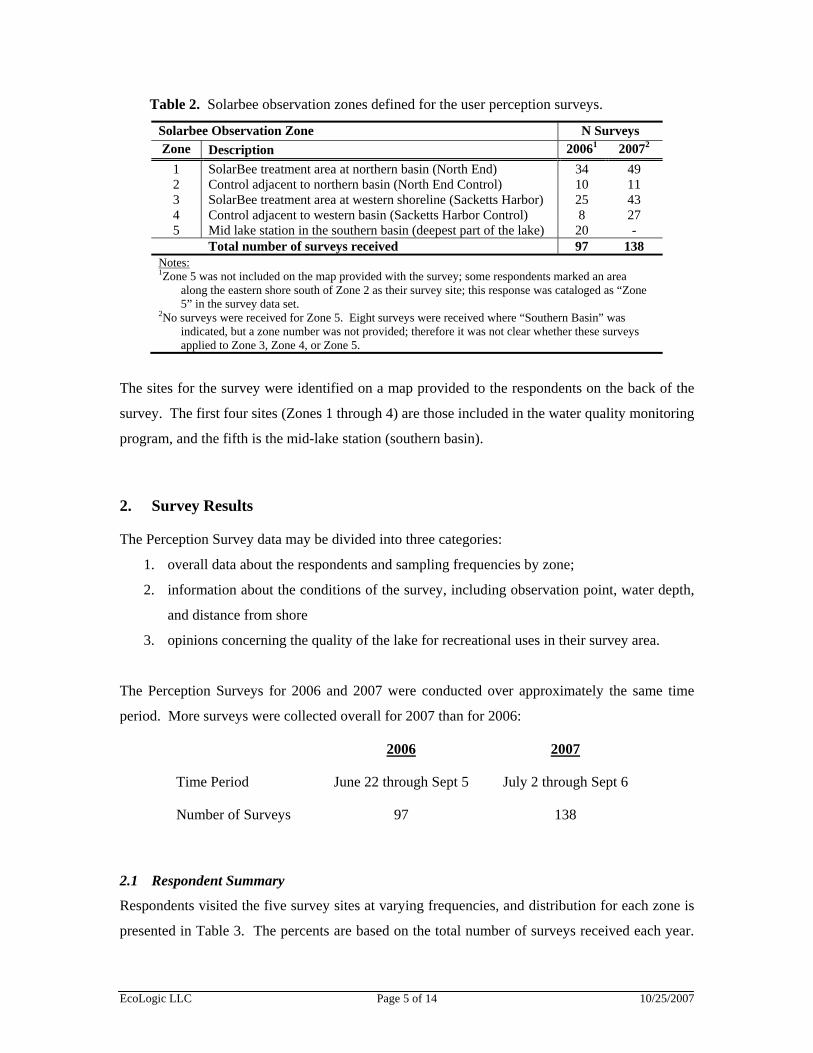
EcoLogic LLC Page 5 of 14 10/25/2007
Table 2. Solarbee observation zones defined for the user perception surveys.
Solarbee Observation Zone N Surveys Zone Description 20061 20072
1 SolarBee treatment area at northern basin (North End) 34 49 2 Control adjacent to northern basin (North End Control) 10 11 3 SolarBee treatment area at western shoreline (Sacketts Harbor) 25 43 4 Control adjacent to western basin (Sacketts Harbor Control) 8 27 5 Mid lake station in the southern basin (deepest part of the lake) 20 - Total number of surveys received 97 138
Notes: 1Zone 5 was not included on the map provided with the survey; some respondents marked an area
along the eastern shore south of Zone 2 as their survey site; this response was cataloged as “Zone 5” in the survey data set.
2No surveys were received for Zone 5. Eight surveys were received where “Southern Basin” was indicated, but a zone number was not provided; therefore it was not clear whether these surveys applied to Zone 3, Zone 4, or Zone 5.
The sites for the survey were identified on a map provided to the respondents on the back of the
survey. The first four sites (Zones 1 through 4) are those included in the water quality monitoring
program, and the fifth is the mid-lake station (southern basin).
2. Survey Results
The Perception Survey data may be divided into three categories:
1. overall data about the respondents and sampling frequencies by zone;
2. information about the conditions of the survey, including observation point, water depth,
and distance from shore
3. opinions concerning the quality of the lake for recreational uses in their survey area.
The Perception Surveys for 2006 and 2007 were conducted over approximately the same time
period. More surveys were collected overall for 2007 than for 2006:
2006 2007
Time Period June 22 through Sept 5 July 2 through Sept 6
Number of Surveys 97 138
2.1 Respondent Summary
Respondents visited the five survey sites at varying frequencies, and distribution for each zone is
presented in Table 3. The percents are based on the total number of surveys received each year.
EcoLogic LLC Page 6 of 14 10/25/2007
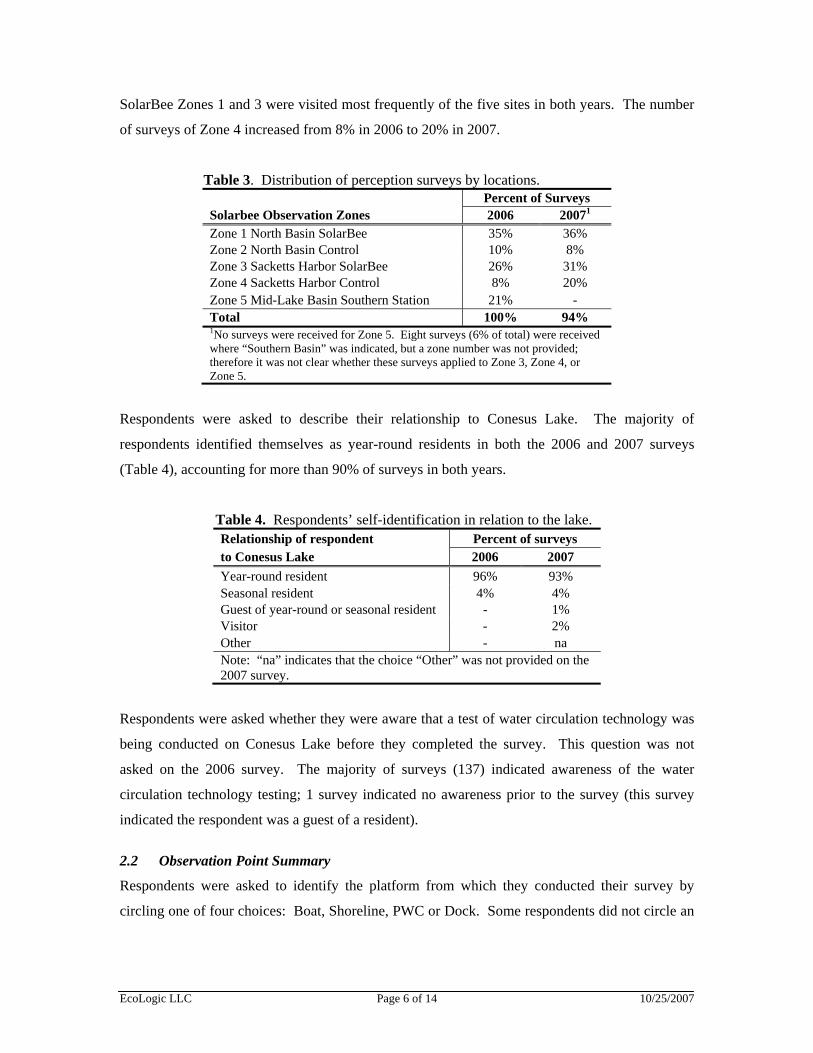
SolarBee Zones 1 and 3 were visited most frequently of the five sites in both years. The number
of surveys of Zone 4 increased from 8% in 2006 to 20% in 2007.
Table 3. Distribution of perception surveys by locations. Percent of Surveys Solarbee Observation Zones 2006 20071 Zone 1 North Basin SolarBee 35% 36% Zone 2 North Basin Control 10% 8% Zone 3 Sacketts Harbor SolarBee 26% 31% Zone 4 Sacketts Harbor Control 8% 20% Zone 5 Mid-Lake Basin Southern Station 21% - Total 100% 94% 1No surveys were received for Zone 5. Eight surveys (6% of total) were received where “Southern Basin” was indicated, but a zone number was not provided; therefore it was not clear whether these surveys applied to Zone 3, Zone 4, or Zone 5.
Respondents were asked to describe their relationship to Conesus Lake. The majority of
respondents identified themselves as year-round residents in both the 2006 and 2007 surveys
(Table 4), accounting for more than 90% of surveys in both years.
Table 4. Respondents’ self-identification in relation to the lake. Relationship of respondent Percent of surveys to Conesus Lake 2006 2007 Year-round resident 96% 93% Seasonal resident 4% 4% Guest of year-round or seasonal resident - 1% Visitor - 2% Other - na Note: “na” indicates that the choice “Other” was not provided on the 2007 survey.
Respondents were asked whether they were aware that a test of water circulation technology was
being conducted on Conesus Lake before they completed the survey. This question was not
asked on the 2006 survey. The majority of surveys (137) indicated awareness of the water
circulation technology testing; 1 survey indicated no awareness prior to the survey (this survey
indicated the respondent was a guest of a resident).
2.2 Observation Point Summary
Respondents were asked to identify the platform from which they conducted their survey by
circling one of four choices: Boat, Shoreline, PWC or Dock. Some respondents did not circle an
EcoLogic LLC Page 7 of 14 10/25/2007
option, accounting for 4% of the 2006 and 5% of 2007 surveys. Evaluation of these data was
based on the number of surveys with circled choices (Table 5).
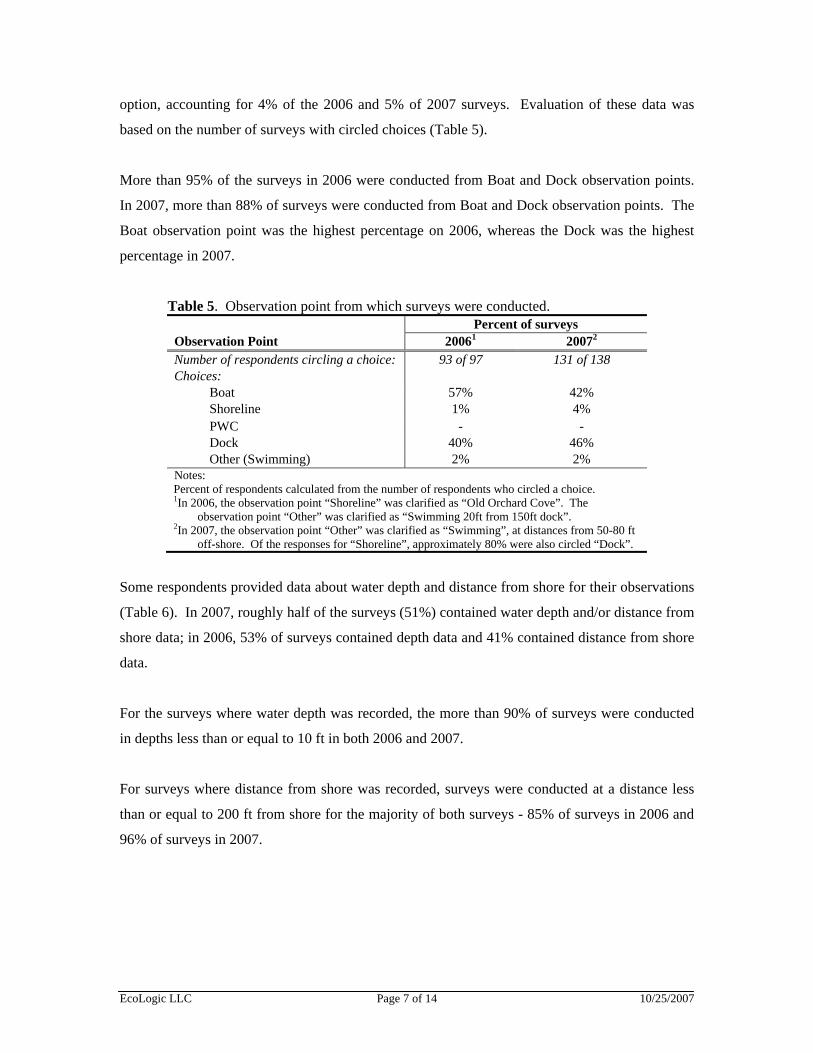
More than 95% of the surveys in 2006 were conducted from Boat and Dock observation points.
In 2007, more than 88% of surveys were conducted from Boat and Dock observation points. The
Boat observation point was the highest percentage on 2006, whereas the Dock was the highest
percentage in 2007.
Table 5. Observation point from which surveys were conducted. Percent of surveys Observation Point 20061 20072 Number of respondents circling a choice: 93 of 97 131 of 138 Choices:
Boat 57% 42% Shoreline 1% 4% PWC - - Dock 40% 46% Other (Swimming) 2% 2%
Notes: Percent of respondents calculated from the number of respondents who circled a choice. 1In 2006, the observation point “Shoreline” was clarified as “Old Orchard Cove”. The
observation point “Other” was clarified as “Swimming 20ft from 150ft dock”. 2In 2007, the observation point “Other” was clarified as “Swimming”, at distances from 50-80 ft
off-shore. Of the responses for “Shoreline”, approximately 80% were also circled “Dock”.
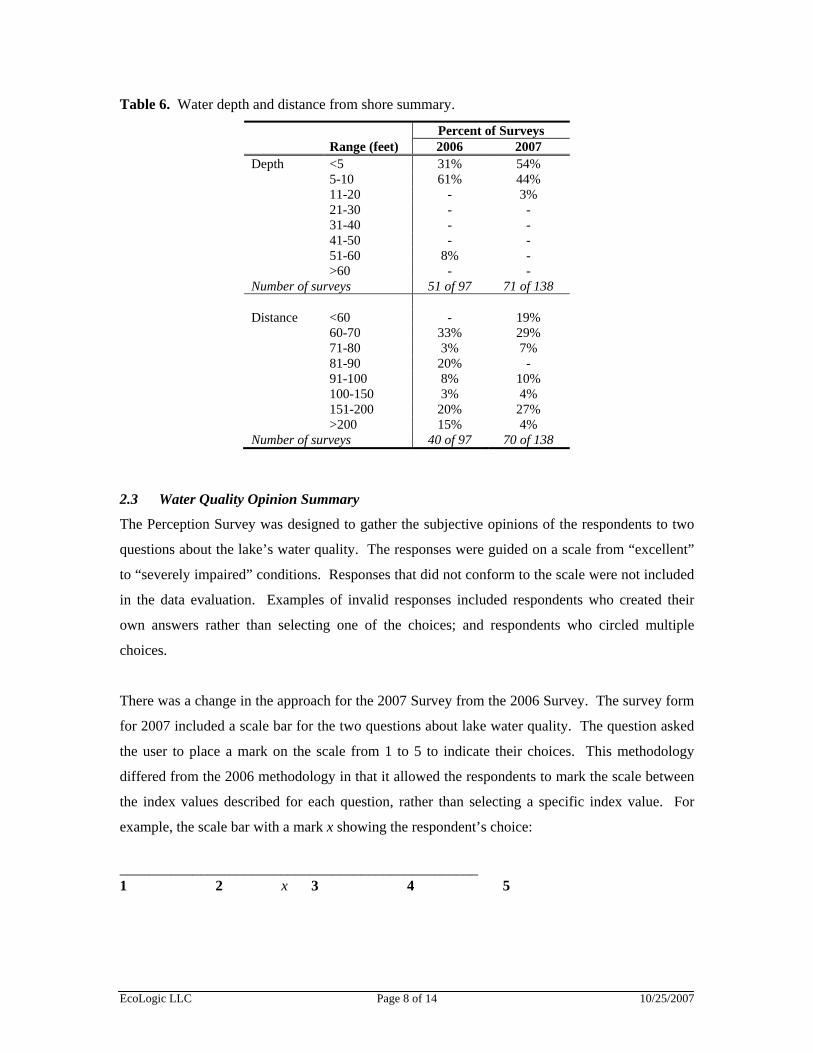
Some respondents provided data about water depth and distance from shore for their observations
(Table 6). In 2007, roughly half of the surveys (51%) contained water depth and/or distance from
shore data; in 2006, 53% of surveys contained depth data and 41% contained distance from shore
data.
For the surveys where water depth was recorded, the more than 90% of surveys were conducted
in depths less than or equal to 10 ft in both 2006 and 2007.
For surveys where distance from shore was recorded, surveys were conducted at a distance less
than or equal to 200 ft from shore for the majority of both surveys - 85% of surveys in 2006 and
96% of surveys in 2007.
EcoLogic LLC Page 8 of 14 10/25/2007
Table 6. Water depth and distance from shore summary.
Percent of Surveys Range (feet) 2006 2007 Depth <5 31% 54% 5-10 61% 44% 11-20 - 3% 21-30 - - 31-40 - - 41-50 - - 51-60 8% - >60 - - Number of surveys 51 of 97 71 of 138 Distance <60 - 19% 60-70 33% 29% 71-80 3% 7% 81-90 20% - 91-100 8% 10% 100-150 3% 4% 151-200 20% 27% >200 15% 4% Number of surveys 40 of 97 70 of 138
2.3 Water Quality Opinion Summary
The Perception Survey was designed to gather the subjective opinions of the respondents to two
questions about the lake’s water quality. The responses were guided on a scale from “excellent”
to “severely impaired” conditions. Responses that did not conform to the scale were not included
in the data evaluation. Examples of invalid responses included respondents who created their
own answers rather than selecting one of the choices; and respondents who circled multiple
choices.
There was a change in the approach for the 2007 Survey from the 2006 Survey. The survey form
for 2007 included a scale bar for the two questions about lake water quality. The question asked
the user to place a mark on the scale from 1 to 5 to indicate their choices. This methodology
differed from the 2006 methodology in that it allowed the respondents to mark the scale between
the index values described for each question, rather than selecting a specific index value. For
example, the scale bar with a mark x showing the respondent’s choice:
_________________________________________________ 1 2 x 3 4 5
EcoLogic LLC Page 9 of 14 10/25/2007
In 2007, the respondent placed a mark between index numbers on the scale bar on 19 of the 138
surveys, resulting in ambiguous responses. For this analysis, these ambiguous responses were
treated in the same manner as the ambiguous responses in the 2006 surveys were treated. In
2006, the ambiguous data (e.g., where a respondent circled multiple choices or created their own
choices) were excluded from the analyses. The ambiguous data represented less than 5% of the
2006 data set, and 14% of the 2007 data set.
2.3.1 Physical Condition
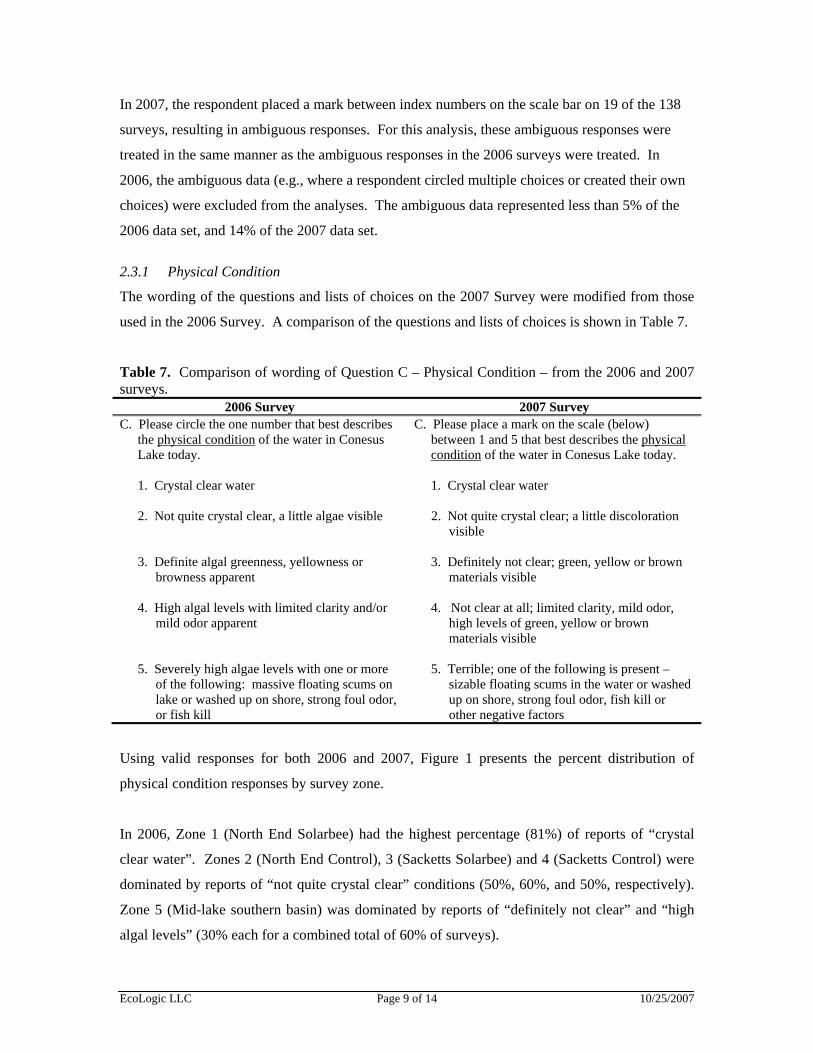
The wording of the questions and lists of choices on the 2007 Survey were modified from those
used in the 2006 Survey. A comparison of the questions and lists of choices is shown in Table 7.
Table 7. Comparison of wording of Question C – Physical Condition – from the 2006 and 2007 surveys.
2006 Survey 2007 Survey C. Please circle the one number that best describes
the physical condition of the water in Conesus Lake today.
C. Please place a mark on the scale (below) between 1 and 5 that best describes the physical condition of the water in Conesus Lake today.
1. Crystal clear water
1. Crystal clear water
2. Not quite crystal clear, a little algae visible 2. Not quite crystal clear; a little discoloration visible
3. Definite algal greenness, yellowness or
browness apparent
3. Definitely not clear; green, yellow or brown materials visible
4. High algal levels with limited clarity and/or mild odor apparent
4. Not clear at all; limited clarity, mild odor, high levels of green, yellow or brown materials visible
5. Severely high algae levels with one or more
of the following: massive floating scums on lake or washed up on shore, strong foul odor, or fish kill
5. Terrible; one of the following is present – sizable floating scums in the water or washed up on shore, strong foul odor, fish kill or other negative factors
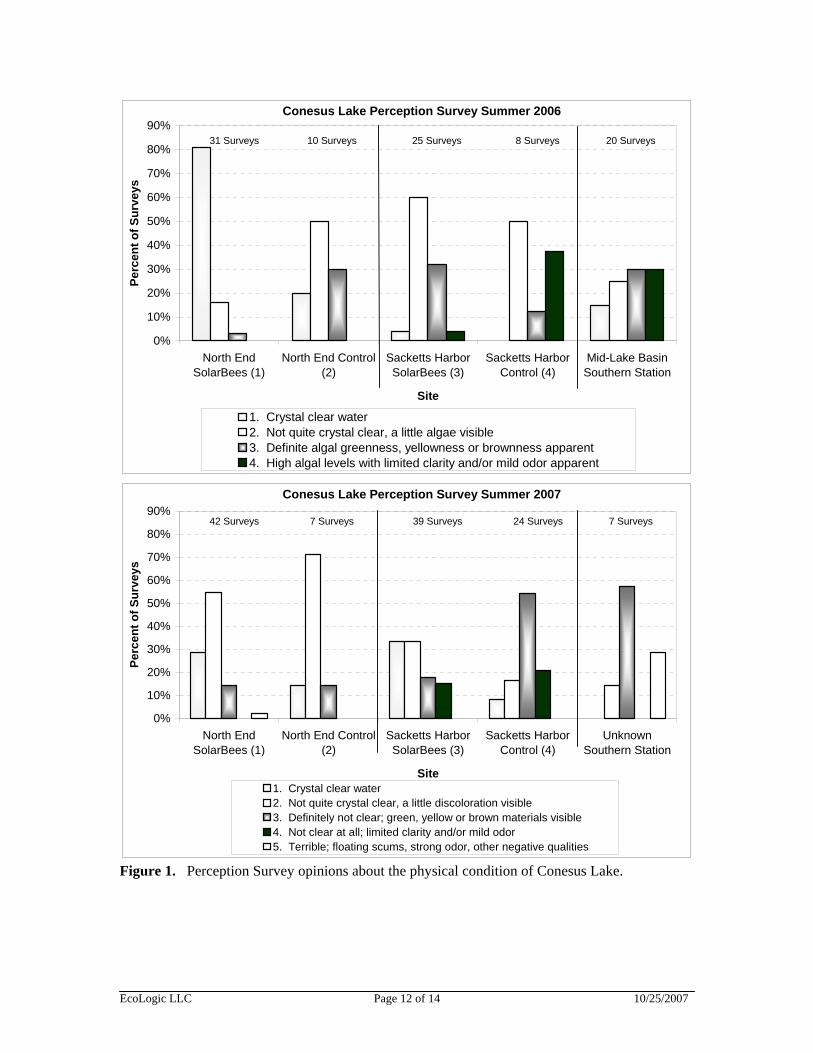
Using valid responses for both 2006 and 2007, Figure 1 presents the percent distribution of
physical condition responses by survey zone.
In 2006, Zone 1 (North End Solarbee) had the highest percentage (81%) of reports of “crystal
clear water”. Zones 2 (North End Control), 3 (Sacketts Solarbee) and 4 (Sacketts Control) were
dominated by reports of “not quite crystal clear” conditions (50%, 60%, and 50%, respectively).
Zone 5 (Mid-lake southern basin) was dominated by reports of “definitely not clear” and “high
algal levels” (30% each for a combined total of 60% of surveys).
EcoLogic LLC Page 10 of 14 10/25/2007
In 2007, Zones 1 and 2 were dominated by reports of “not quite clear” (55% and 71%
respectively). Zone 3 was dominated by reports of “crystal clear” and “not quite clear” (33%
each for a combined total of 66% of surveys). Zone 4 and the Unknown Southern Basin station
were dominated by reports of “not clear at all” (54% and 57%, respectively).
2.3.2 Recreational Suitability
The wording of the questions and lists of choices on the 2007 Survey were modified from those
used in the 2006 Survey. A comparison of the questions and lists of choices is shown in Table 8.
Table 8. Comparison of wording of Question D – Recreational Suitability – from the 2006 and 2007 surveys.
2006 Survey 2007 Survey D. Please circle the one number that best describes
your opinion of how suitable Conesus Lake is for recreation and your general enjoyment today.
D. Please place a mark on the scale (below) between 1 and 5 that best describes your opinion of how suitable Conesus Lake is for recreation and your general enjoyment today.
1. Beautiful, could not be any nicer
1. Beautiful; could not be any nicer
2. Very minor aesthetic problems, excellent for swimming, boating, enjoyment.
2. Very minor aesthetic issues; excellent for swimming, boating, general enjoyment
3. Swimming and aesthetic enjoyment slightly
impaired because of algae levels.
3. Swimming and general enjoyment slightly impaired because of water discoloration, odor or other water-related issues.
4. Desire to swim and level of enjoyment of the
lake substantially reduced because of algae levels.
4. Desire to swim and level of enjoyment of the lake significantly reduced because of water discoloration, odors, or other water quality-related issues
5. Swimming and aesthetic enjoyment nearly
impossible because of algae levels. 5. Swimming and enjoyment of the lake nearly
impossible because of water discoloration, odors, or other water quality-related issues
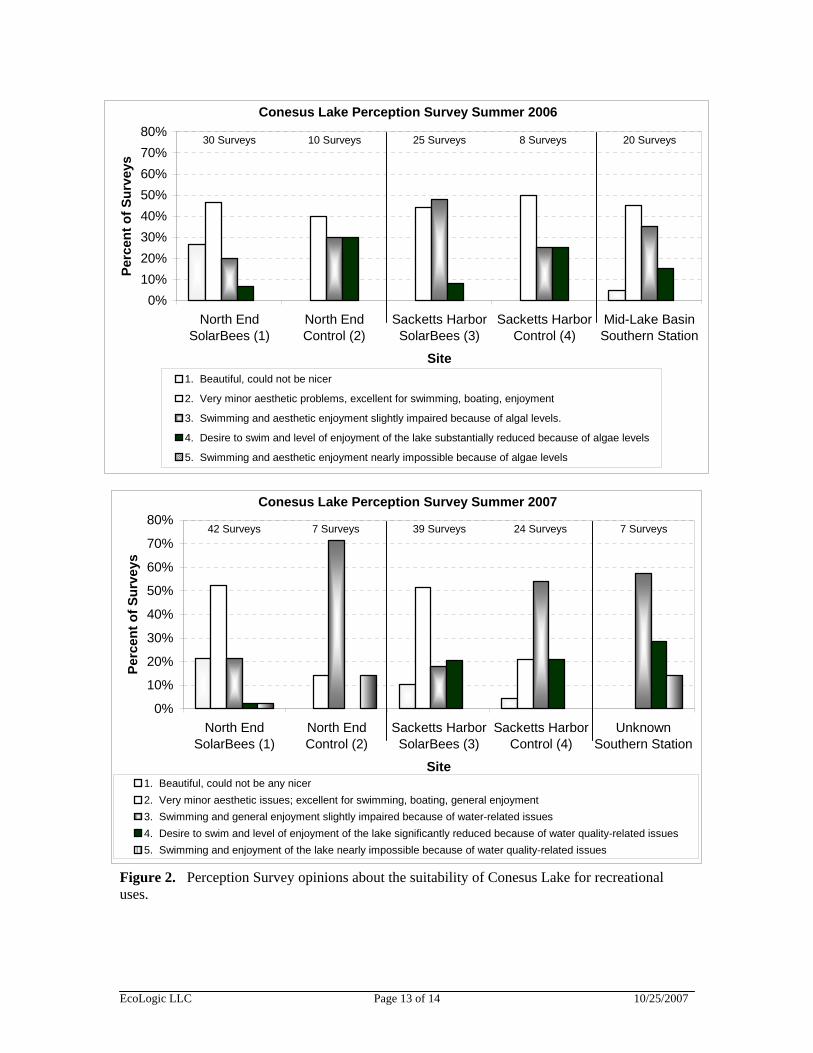
Using valid responses for both 2006 and 2007, Figure 2 presents the percent distribution of
recreational suitability responses by survey zone.
In 2006, 40% to 50% of respondents in all five zones indicated very minor aesthetic problems,
and that the site was excellent for swimming, boating and enjoyment. Of the five zones, Zone 1
(North End Solarbee) received the highest percentage (27%) of responses indicating the site was
beautiful and could not be nicer. Zone 3 (Sacketts SolarBee) received the highest percentage
(48%) of responses indicating enjoyment was slightly impaired because of algal levels. Zone 2
EcoLogic LLC Page 11 of 14 10/25/2007
(North End Control) received the highest percentage (30%) of responses indicating enjoyment of
the lake was substantially reduced because of algal levels. None of the zones were classified as
being too impaired for swimming or aesthetic enjoyment due to algal levels.
In 2007, Zones 1 (North End Solarbee) and 3 (Sacketts Solarbee) were reported with “beautiful”
to “minor aesthetic issues” for recreational uses (74% and 62%, respectively). Zones 2 (North
End Control) and 4 (Sacketts Control) reports were dominated by “slightly impaired” reports
(71% and 54%, respectively). The Unknown Southern Station was dominated by reports of
“slightly impaired” (57%) and “significantly reduced” or “nearly impossible” enjoyment (43%).
EcoLogic LLC Page 12 of 14 10/25/2007
Figure 1. Perception Survey opinions about the physical condition of Conesus Lake.
Conesus Lake Perception Survey Summer 2006
0%
10%
20%
30%
40%
50%
60%
70%
80%
90%
North EndSolarBees (1)
North End Control(2)
Sacketts HarborSolarBees (3)
Sacketts HarborControl (4)
Mid-Lake BasinSouthern Station
Site
Perc
ent o
f Sur
veys
1. Crystal clear water2. Not quite crystal clear, a little algae visible3. Definite algal greenness, yellowness or brownness apparent4. High algal levels with limited clarity and/or mild odor apparent
31 Surveys 10 Surveys 25 Surveys 8 Surveys 20 Surveys
Conesus Lake Perception Survey Summer 2007
0%
10%
20%
30%
40%
50%
60%
70%
80%
90%
North EndSolarBees (1)
North End Control(2)
Sacketts HarborSolarBees (3)
Sacketts HarborControl (4)
UnknownSouthern Station
Site
Perc
ent o
f Sur
veys
1. Crystal clear water2. Not quite crystal clear, a little discoloration visible3. Definitely not clear; green, yellow or brown materials visible4. Not clear at all; limited clarity and/or mild odor5. Terrible; floating scums, strong odor, other negative qualities
42 Surveys 7 Surveys 39 Surveys 24 Surveys 7 Surveys
EcoLogic LLC Page 13 of 14 10/25/2007
Figure 2. Perception Survey opinions about the suitability of Conesus Lake for recreational uses.
Conesus Lake Perception Survey Summer 2006
0%10%20%30%40%50%60%70%80%
North EndSolarBees (1)
North EndControl (2)
Sacketts HarborSolarBees (3)
Sacketts HarborControl (4)
Mid-Lake BasinSouthern Station
Site
Perc
ent o
f Sur
veys
1. Beautiful, could not be nicer
2. Very minor aesthetic problems, excellent for swimming, boating, enjoyment
3. Swimming and aesthetic enjoyment slightly impaired because of algal levels.
4. Desire to swim and level of enjoyment of the lake substantially reduced because of algae levels
5. Swimming and aesthetic enjoyment nearly impossible because of algae levels
30 Surveys 10 Surveys 25 Surveys 8 Surveys 20 Surveys
Conesus Lake Perception Survey Summer 2007
0%
10%
20%
30%
40%
50%
60%
70%
80%
North EndSolarBees (1)
North EndControl (2)
Sacketts HarborSolarBees (3)
Sacketts HarborControl (4)
UnknownSouthern Station
Site
Perc
ent o
f Sur
veys
1. Beautiful, could not be any nicer2. Very minor aesthetic issues; excellent for swimming, boating, general enjoyment3. Swimming and general enjoyment slightly impaired because of water-related issues4. Desire to swim and level of enjoyment of the lake significantly reduced because of water quality-related issues5. Swimming and enjoyment of the lake nearly impossible because of water quality-related issues
42 Surveys 7 Surveys 39 Surveys 24 Surveys 7 Surveys