Embed Size (px)
Citation preview

Fin 4201/8001 1
Ratios
Measure strength of various firm aspects Informational needs of creditors and investors Facilitate time-series or cross-sectional analysis Five types
• Activity
• Liquidity
• Debt and solvency
• Profitability
• Valuation

Fin 4201/8001 2
Activity Ratios
1) Inventory turnover – COGS /Avg.Inventory
2) Receivables turn – Sales / avg.Receivables
3) Working Capital turn – Sales / Avg.Working Capital
4) Fixed Assets turn – Sales / Avg.Fixed Assets
5) Total Assets turn – Sales / Avg. Total Assets

Fin 4201/8001 3
Examples from handout
1 Inventory Turnover 4.55
Cost of goods sold 2142
Average Inventory 471
Avg. no. of days inventory in stock 80
2 Receivables turnover 10.76
Sales 4063
Average Receivables 378
Avg. no. of days receivables are outstanding 34

Fin 4201/8001 4
Examples from handout
3 Working capital turnover 18.26
Sales406
3
Average working capital 223
4 Fixed assets turnover 2.60
Sales406
3
Average fixed assets156
3

Fin 4201/8001 5
Examples from handout
5 Total assets turnover 1.21
Sales406
3
Avg. total assets334
8

Fin 4201/8001 6
Liquidity Ratios
1) Current – Current Asset / Current Liability
2) Quick – $+securities+AR / Current Liability
3) Cash – $+securities / Current Liability
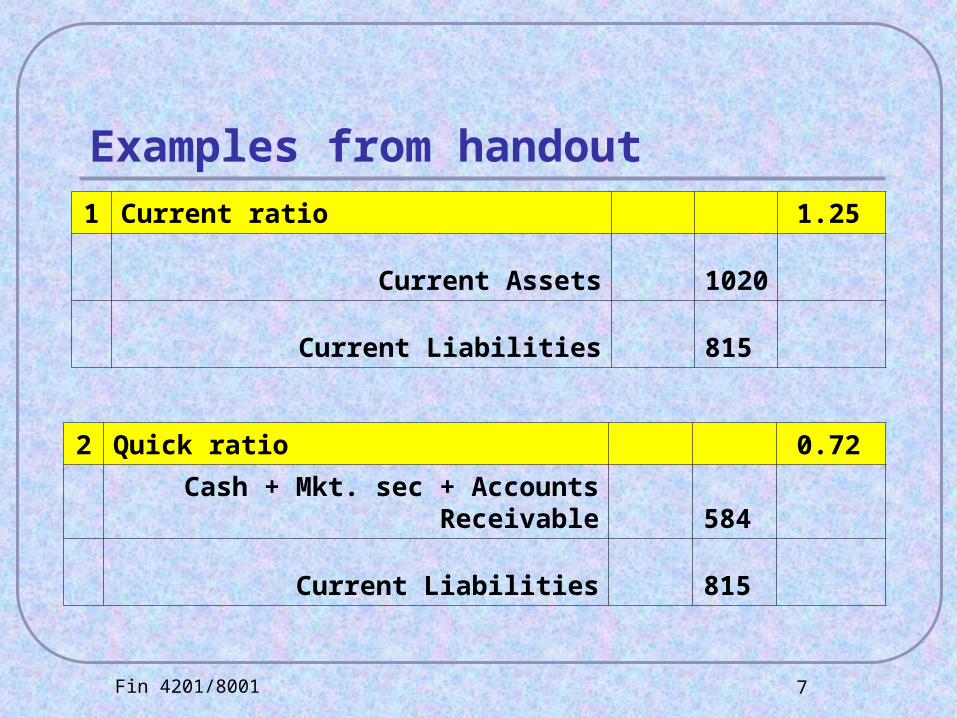
Fin 4201/8001 7
Examples from handout
1 Current ratio 1.25
Current Assets102
0
Current Liabilities 815
2 Quick ratio 0.72
Cash + Mkt. sec + Accounts Receivable 584
Current Liabilities 815

Fin 4201/8001 8
Examples from handout
3 Cash Ratio 0.23
Cash + Mkt. sec 190
Current Liabilities815

Fin 4201/8001 9
Debt and Solvency Ratios
1) Long-term Debt to CapitalLong-term debt + other long-term liab. / Total capital (debt + equity)
2) Long-term Debt to EquityLong-term debt + other long-term liab. / Total capital (debt + equity)
3) Times Interest EarnedEBIT / Interest Expense

Fin 4201/8001 10
Examples from handout
1Long-term Debt to total capital (no deferred tax or CL) 0.54
Long-term debt 1226
Total capital (Long-term debt plus SH's eqty) 2268
Long-term Debt to total capital (no CL) 0.60
Long-term debt plus deferred tax 1547
Total capital 2589

Fin 4201/8001 11
Examples from handout
2 Long-term Debt to equity 1.18
Long-term debt 1226
Total equity 1042
Long-term Debt to equity 1.48
Long-term debt plus deferred tax 1547
Total equity 1042

Fin 4201/8001 12
Examples from handout
3 Times Interest earned 6.92
EBIT 595
Interest expenses 86

Fin 4201/8001 13
Profitability Ratios
1) Gross Margin – Gross Profit / Sales
2) Operating Margin – Operating Income / Sales
3) Margin before Interest and Tax – EBIT / Sales
4) Pre-tax Margin – EBT / Sales
5) Profit Margin – Net Income / Sales
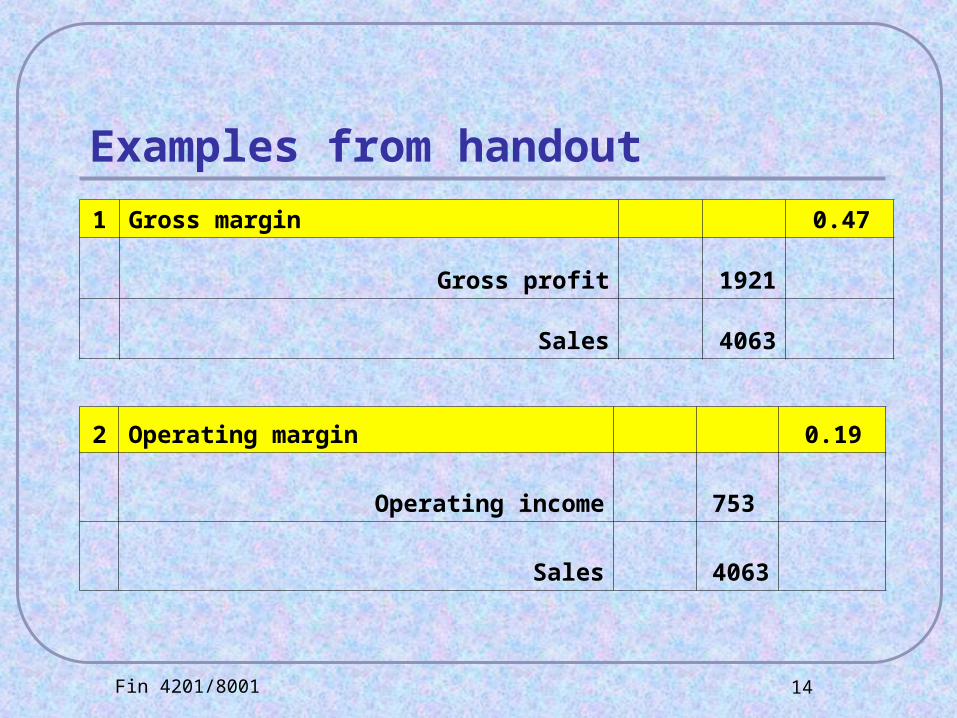
Fin 4201/8001 14
Examples from handout
1 Gross margin 0.47
Gross profit192
1
Sales406
3
2 Operating margin 0.19
Operating income 753
Sales406
3

Fin 4201/8001 15
Examples from handout
3 Margin before interest and tax 0.15
EBIT 595
Sales406
3
4 Pre-tax margin 0.14
EBT 557
Sales406
3

Fin 4201/8001 16
Examples from handout
5 Profit margin 0.08
Net Income 341
Sales406
3

Fin 4201/8001 17
Valuation Ratios
1) Price to Earnings (P/E) – Price / EPS2) Price to Book (P/B) – Price / Book value per share3) Price to Tangible Book – Price / Total Assets –
Intangibles - Goodwill
Valuation Analysis
Price (December, 1998) $62
Number of shares 180 mn
EPS (Net Income / No. of shares) $1.89
Book value (SH’s value / No. of shares) $5.79
Tangible assets per share $16

Fin 4201/8001 18
Examples from handout
1 P/E Ratio 32.73
Price per share 62
EPS per share 1.89
2 Price to book value 10.71
Price per share 62
Book Value per share 5.79
Book Value = Sh's equity / no. of shares

Fin 4201/8001 19
Examples from handout
3 Price to Tangible Assets 3.88
Price per share 62
Tangible assets per share 16

Fin 4201/8001 20
Other stuff not covered here, but may want to address in report/presentation
Return on Invested Capital (ROIC) – NOPLAT/ Invested Capital covered with spreadsheet later
Return on Assets (ROA) – Net income + After-tax interest / Avg. Total Assets
Return on Equity (ROE) – Net Income / Avg. Total equity

Fin 4201/8001 21
Other stuff not covered here, but may want to address in report/presentation
DuPont system
• 2 is greatest when no leverage
• 1*2*3 = profit margin
• 4 = asset turnover
• 3 * 4 = ROA (does not depend on leverage)
• 5 = leverage ratio – boosts ROE only if ROA>cost capital
(5) (4) (3) (2) (1)
Equity
Assets*
Assets
Sales*
Sales
EBIT*
EBIT
ProfitPretax *
ProfitPretax
NetProfitROE

Fin 4201/8001 22
Just because
Return on equity (ROE) 0.36
Net Income 341
Average total equity 948
OR
Profit margin 0.08
Total asset turnover 1.21
Financial leverage 3.53
Note some rounding error 0.35

Fin 4201/8001 23
Still more ratios
PEG – PE ratio / Earnings growthevaluates if price of growth is being realized
Enterprise value / EBITDA(market cap + total debt – Total cash) / EBITDAgood for comparisons if high level of debt or high level of cash
Fixed asset spending / Depreciationhigher may reveal long term planning, but needs to cover at least 3 years