Embed Size (px)
Citation preview

Fin 4200 Project
Jessi Sagner
11/15/11

All Option information is outlined in appendix A
Option Strategy
The strategy I chose was to go long 1 call and 1 put at the same strike price, but different times
to maturity. This is similar to a straddle except the times to maturity are different. I have named it the
“ladle” strategy because the scenario graph (included in the appendix) resembles a soup ladle. For the
strategy I went long a $65 November Call Option and long a $65 December Put Option. This would be a
good neutral risk strategy because there is limited loss (because both the put and call carry a limited
loss), some limited gains when the put is in the money, and unlimited gains when the call is in the
money. This strategy allows people who are risk averse to break even as soon as the stock price rises to
above $79.32 (the current stock price) and to make a profit as soon as the stock price drops to about
$48 as the graph illustrates. All loses in between those two numbers are limited. Also, the delta of this
strategy is 92.45% showing that the overall portfolio is deep in the money and would be a wise a
strategy to pursue.
Graph in Appendix B
Black Scholes Formula
a. Determining Volatility
My calculated historical volatility from 40 days of data came out to 35%. I also calculated the
implied volatilities of eight options using Derivagem . The calculated volatilities are shown in the table
below:
Maturity Month Type of Option Strike Price Implied Volatility
November Call $90 (Out of the Money) 32.61%
November Call $65 (In the Money) 84.63%
November Put $55 (Out of the Money) 73.21%
November Put $87.5 (In the Money) 32.65%
December Call $85 (Out of the Money) 25.75%
December Call $80 (At the Money) 29.12%
December Put $65 (Out of the Money) 43.34%
December Put $87.5 (In the Money) 26.56%
Most of the volatilities are between 25% and 45%, however there are two major outliers
(73.21% and 84.63%) which are taken from a November call and put option respectively. I believe the
main cause for these inconsistencies are how far from “at the money” they are compared to the other
options. While most of the options have strike prices within about $10 from the stock price these two
options are $15 and $25 from the stock price. The reason that the out of the money put option in
November has a much higher volatility than the out of the money put option in December is because
dividends will be paid in November.

My calculated historical volatility seems to be relatively accurate with respect to the majority of
the implied volatilities (which lay between 25% and 45%). The historical number of 35% is exactly in the
middle of these to numbers, which leads me to believe it is a good measure of comparison when
deciding what percentage to use to calculate my option prices.
The average of these implied volatilities and my historical calculation comes out to 42.5%. I have
chosen to discard the biggest outlier (84.63%) which gives me a new average of 37.23%. Because my
historical volatility was accurate and right in the middle of the majority of the volatilities, I feel this
average is much more likely volatility and I feel more comfortable using the average without the major
outlier.
b. Pricing Options
The following table illustrates the calculated option price versus the actual option price. An
explanation of the information is found below.
Maturity Month
Type of Option
Strike Price Black-Scholes
Option Price
Market Option Price
Difference in Black-Scholes vs. Market
Price
November Call $90 (Out of the Money)
$.11 $.07 $.04
November Call $65 (In the Money)
$14.01 $14.55 -$.54
November Put $55 (Out of the Money)
$.0000009 $.03 -$.03
November Put $87.5 (In the Money)
$21.00 $22.5 -$1.5
December Call $85 (Out of the Money)
$1.31 $.79 $.52
December Call $80 (At the Money)
$2.94 $2.63 $.35
December Put $65 (Out of the Money)
$.105 $.51 -$.405
December Put $87.5 (In the Money)
$11.46 $11.55 -$.09
I used Derivagem to calculate option prices and compared those to the actual option prices. The
difference between the calculated and actual option prices can lead us to some observations about
using the Black Scholes Method to price options. Some consistencies found when pricing these options
are as follows: all puts were undervalued; all “in the money” options were undervalued; all out of the
money call options (including the “at the money” because in reality it is slightly “out of the money”)
were over-valued. With those biases being stated, the formula still comes within an acceptably accurate
range (all but one are within $1 from the actual price) and can be a reliable source for option pricing –
especially when one keeps in mind the small biases the formula creates.

Binomial Option Pricing & Early Exercise
Maturity Month
Type of Option
Strike Price Black Scholes Option Price
Market Option Price
Binomial Option Price
Difference Between B.S.
and BOPM
November Call $90 (Out of the Money)
$.11 $.07 $.11
$0
November Call $65 (In the Money)
$14.01 $14.55 $14.01 $0
November Put $55 (Out of the Money)
$.0000009 $.03 $.0000006 $.0000003
November Put $87.5 (In the Money)
$21.54 $22.5 $21.55 $.01
December Call $85 (Out of the Money)
$1.31 $.79 $1.30 $.01
December Call $80 (At the Money)
$2.94 $2.63 $2.95
$.01
December Put $65 (Out of the Money)
$.105 $.51 $.104 $.001
December Put $87.5 (In the Money)
$11.46 $11.55 $11.47 $.01
I used 500 steps to calculate the option price using the Binomial Option Pricing Method. The calculated
Binomial Option Prices are basically equivalent to the ones calculated using the Black-Scholes method.
The value of early exercise was determined up to the tenth step only.
There is a very small difference (if any) between all of the Black-Scholes option prices versus the
Binomial Option Pricing Method Option prices. Because BOPM takes in to consideration dividends while
Black-Scholes does not, the ‘slim-to-none’ differences between the two show that there was no case in
which it was best to exercise the option early
The Greeks
The following is a brief description of what each of the Greek symbols measure with respect to options.
Delta: measures the amount of change in the value of an option due to a change in the value of the
stock.
Gamma: measures the amount of change in delta due to a change in the value of the stock.
Vega: measures the change in the value of an option due to a change in volatility.

Theta: measures the change in the value of an option due to a change in time.
Rho: measures the change in a value of an option due to a change in interest rate.
Please refer to the appendix C to see the full set of examples of these “Greek” graphs calculated from
my options. Graphs for Volatility and Time to Maturity are in appendix D. The general shapes of all of
these graphs are described below.
Graphing Delta:
When the asset price is out of the money (both for calls and puts) delta moves to zero. This is because
when an option is out of the money it will expire worthless and no matter what it the value of the call
will not change as the asset price changes as long as the asset price remains out of the money. As the
asset price moves to at the money, delta increases to .5 (for calls) or decreases to -.5 (for puts). The
reason for the .5 is because the stock has about a 50/50 chance of moving either to in the money of out
of the money so the option value is somewhat receptive to changes in the underlying stock price. In the
money options consist of a delta of about 1 (or -1 for puts). As an option moves in the money it is very
likely that it will end up being exercised, as the option gets deeper in the money the option value gets
greater and greater, so, the value of the option is receptive to changes in stock price creating a larger
delta (1).
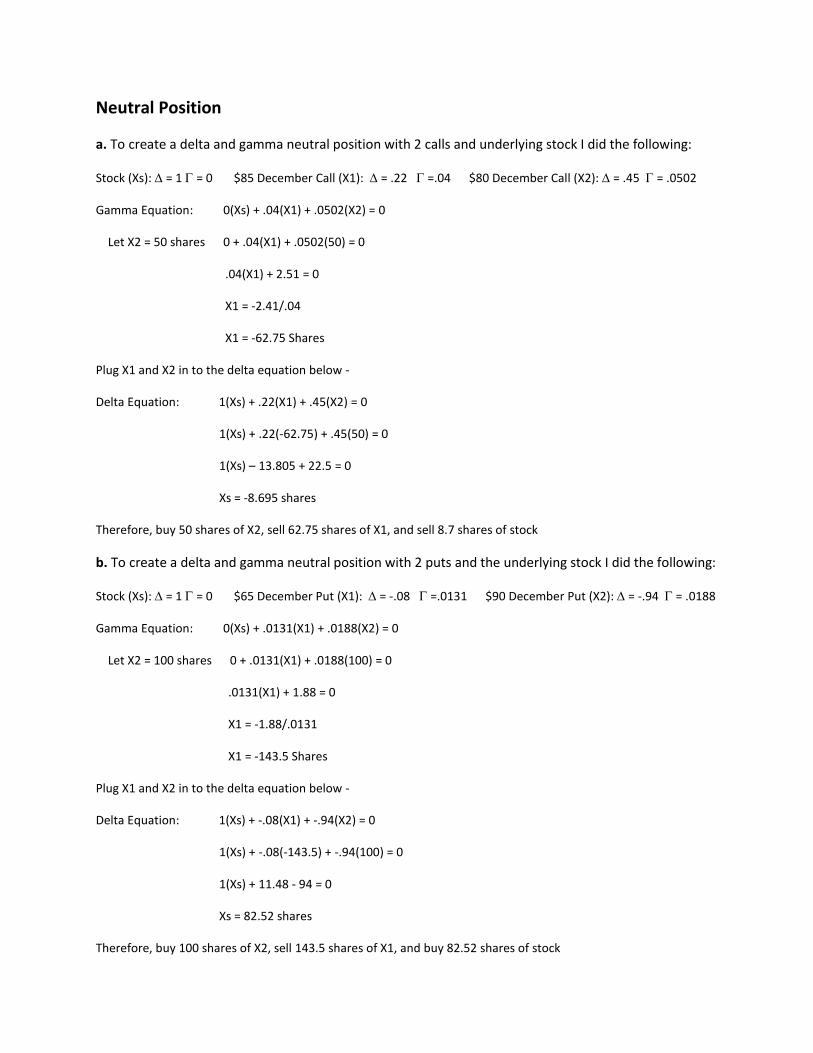
Graphing Gamma:
When an option is either very deep out of the money, or very deep in the money, gamma is zero. This is
because delta does not change at those two points. When you are already deep in the money it doesn’t
matter if you go even deeper, you still have a delta of one. The same is true for deep out of the money,
it doesn’t matter how deep or “shallow” you go, delta is still zero. Delta does change though when an
option price nears the strike price (is at the money). This causes a peak in the gamma graph at the
money. As the option moves away from the strike price in either direction gamma begins to decrease
because delta is less responsive to changes in underlying stock price.
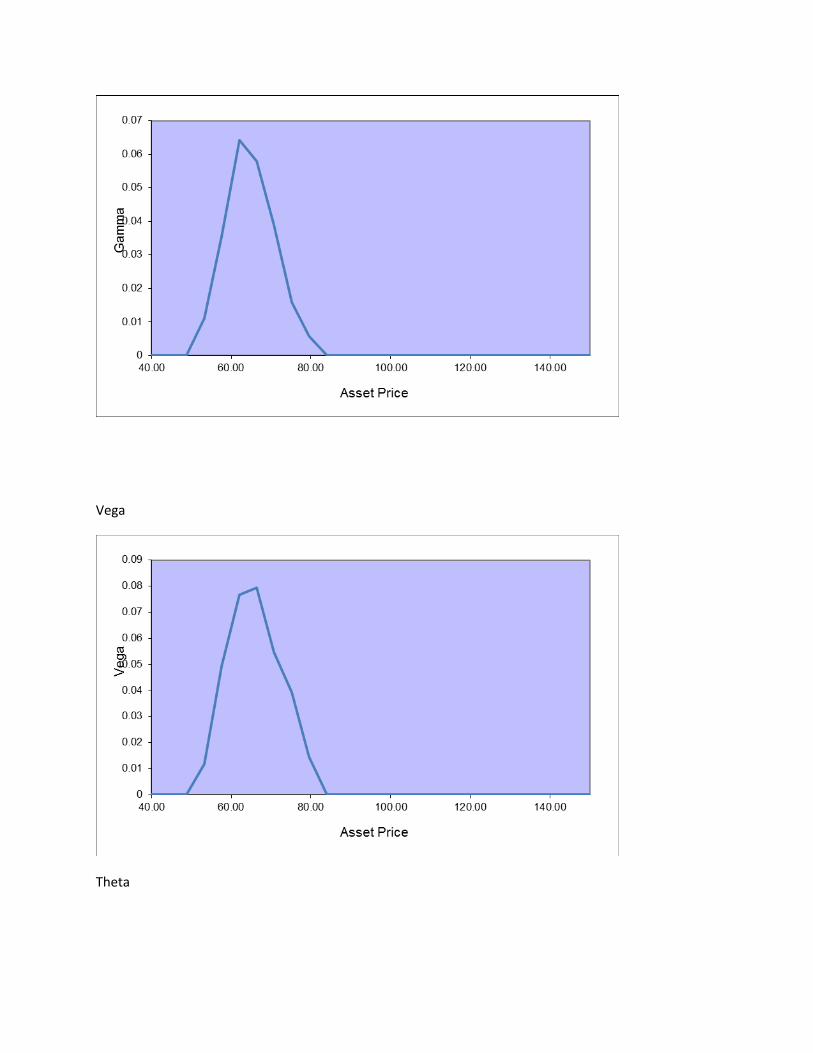
Graphing Vega:
As volatility increases, the most affected options are at the money. This is because as volatility increases
or decreases option price is very affected and can fluctuate in either direction, causing a large vega.
When a call option is out of the money, it doesn’t matter how far out of the money it is because you
have downside protection so therefore vega goes right to zero. In the money call options are affected a
little bit more than out of the money options because as volatility increases you have unlimited gains,
but you could also be moving out of the money creating a loss. So, the change in the value of an in the
money call option is relatively sensitive to a change in volatility, but not nearly as much so as at the
money options are. The opposite argument is true for in and out of the money puts.

Graphing Theta:
As time changes, the most affected options are at the money. When you have an at the money option it
experiences the greatest time decay leading to a large theta. Out of the money calls and in the money
puts experience very little time decay (it takes a very short amount of time to go from a small strike
price to zero) so their theta is near zero. For in the money calls and out of the money puts theta is
between the previous two scenarios. Each day the option gets closer to exercise (and in the case of ITM
calls/OTM puts they will be exercised) the more value it is losing because of time decay and time value
of money. So a shorter time for ITM options is better because you want to exercise and get the money
from the position instead of letting the option lose value.
Graphing Rho:
Out of the money options tend to have a rho around zero. This is because changing interest rates don’t
really affect OTM options since you wouldn’t exercise them regardless of the interest rate. As you move
to at the money and then further in the money, and options rho increases in the absolute sense (puts
move from zero to larger negative numbers all the way to -1). The more money you have (the more in
the money your option is) the more it will grow with respect to interest rates. So the deeper in the
money the option is the more sensitive it is to changes in interest rates which in turn increases the
option’s rho.
Volatility:
The volatility versus option price graph of at, in, and, out of the money options shows a direct
relationship between option price and volatility. As the option price increases so does volatility. The out
of the money option does not increase in price until it hits about 30% volatility and then has a constant
slop until 50% at which point it takes off and the option price increases drastically. As the option price is
increases it is become less and less out of the money which is why it becomes affected by volatility. The
in the money option has a constant volatility until about 33% at which point the graph slowly increases
with the option price. When an option becomes more in the money it is more sensitive to changes in
volatility which is why as the price increases so does volatility. The at the money option has a straight
slope and does not falter as option price increases. As an at the money call option price increases it
continually becomes closer to in the money which is why the graph increases at a constant rate.
Time to Maturity:
All three types of options show an increase in option price over time – some of these (OTM)
shows a slower increase, but an increase none the less. As you increase time to maturity all options
become more valuable. The reason behind this is when you increase time to maturity you increase all
the opportunities you have to exercise your option. With American options you not only have your
expiration date on which you can exercise, but every day in between. So with every gained opportunity
(day, hour, minute, second) you get an increase in that options value.
Neutral Position
a. To create a delta and gamma neutral position with 2 calls and underlying stock I did the following:
Stock (Xs): = 1 = 0 $85 December Call (X1): = .22 =.04 $80 December Call (X2): = .45 = .0502
Gamma Equation: 0(Xs) + .04(X1) + .0502(X2) = 0
Let X2 = 50 shares 0 + .04(X1) + .0502(50) = 0
.04(X1) + 2.51 = 0
X1 = -2.41/.04
X1 = -62.75 Shares
Plug X1 and X2 in to the delta equation below -
Delta Equation: 1(Xs) + .22(X1) + .45(X2) = 0
1(Xs) + .22(-62.75) + .45(50) = 0
1(Xs) – 13.805 + 22.5 = 0
Xs = -8.695 shares
Therefore, buy 50 shares of X2, sell 62.75 shares of X1, and sell 8.7 shares of stock
b. To create a delta and gamma neutral position with 2 puts and the underlying stock I did the following:
Stock (Xs): = 1 = 0 $65 December Put (X1): = -.08 =.0131 $90 December Put (X2): = -.94 = .0188
Gamma Equation: 0(Xs) + .0131(X1) + .0188(X2) = 0
Let X2 = 100 shares 0 + .0131(X1) + .0188(100) = 0
.0131(X1) + 1.88 = 0
X1 = -1.88/.0131
X1 = -143.5 Shares
Plug X1 and X2 in to the delta equation below -
Delta Equation: 1(Xs) + -.08(X1) + -.94(X2) = 0
1(Xs) + -.08(-143.5) + -.94(100) = 0
1(Xs) + 11.48 - 94 = 0
Xs = 82.52 shares
Therefore, buy 100 shares of X2, sell 143.5 shares of X1, and buy 82.52 shares of stock

Arbitrage Strategy
This arbitrage consists of a December out of the money call option, underlying stock, and the
riskless security. S =$ 79.32 x = $85 C = $1.31 R = .99 t = .0833
The following formula proves the arbitrage strategy:
C = S- XR^-t
1.31 = 79.32 – 85(.0=99)^-.0833
1.31 = [79.32 – 85.07] -1
1.31 = -79.32 + 85.07
1.
31 < 5.75
Arbitrage Table:
This arbitrage only makes sense if you have a very bearish view on the market. You begin with a
negative cash flow because the option is out of the money to begin with. If stock price at maturity (St)
ends up greater than the strike price (x) your total cash flow is zero. This is because you only receive the
difference between St and x, and x from lending at the risk free rate, while you have to pay someone
back the stock price at maturity because you used it to short sell the stock at time zero. However, if the
stock price at maturity is less than the strike price you end up with a positive cash flow. The positive
cash flow is a result of paying St for short selling the stock at time zero and gaining back x from lending it
at time zero.
This isn’t a very good arbitrage because you begin with a negative cash flow and in one scenario end up
with a zero cash flow at time T (maturity). So, unless you are sure that the market will go down it would
be unwise to pursue this arbitrage strategy.
0 St>x 90>85 St<x 60<85
Buy Call -1.31 90-85 = 5 0
Short Sell Stock 79.32 -90 -60
Lend XR^-t -85.07 85 85
Total: -7.06 0 15

Appendix:
A.
Chosen Option's Information
1 2 3 4 5 6 7 8
Expiration Month November November November November December December December December
Option Type Call Call Put Put Call Call Put Put
Strike Price $90 $65 $55 $100 $85 $80 $65 $90
in/at/out Out In Out In In At Out In
Option Price $0.07 $14.55 $0.03 $22.50 $0.79 $2.63 $0.51 $11.55
Delta 0.02 0.92 -0.01 -0.99 0.22 0.45 -0.08 -0.94
Gamma 0.0125 0.0151 0.0051 0.004 0.04 0.0502 0.0131 0.0188
Vega 0.0084 0.0197 0.0025 0.0163 0.0774 0.1017 0.0402 0.0297
Theta 0.0109 0.0723 0.0069 0.0103 0.0283 0.0411 0.0226 0.0093
Rho 0.0581 1.5052 -0.0183 -2.3998 1.6174 3.5535 -0.7064 -5.5719
Interest Rate 0.00% 0.00% 0.00% 0.00% 0.05% 0.05% 0.05% 0.05%
Dividends 0.55 0.55 0.55 0.55 0 0 0 0

B.
Option Strategy Scenario Graph

C.
December $90 Put (In the Money)
Delta
Gamma

Vega
Theta

Rho

C.
December $85 Call Option:
Delta
Gamma
Vega

Theta
Rho

C.
December $85 Call Option:
Delta
Gamma
Vega

Theta
Rho

C.
December $80 Call (At the Money)
Delta
Gamma

Vega
Theta

Rho
C.
December $65 Put (Out of the Money)
Delta
Gamma
Vega
Theta

Rho
C.

Delta vs. Asset Price Graphs
Delta vs. Asset Price $65 December Put (out of the money)
Delta vs. Asset Price $90 December Put (in the money)

Delta vs. Asset Price $80 December Call (at the money)
Delta vs. Asset Price $85 December Call (out of the money)
0
0.1
0.2
0.3
0.4
0.5
0.6
0.7
0.8
0.9
1
65.00 70.00 75.00 80.00 85.00 90.00 95.00
Delta
Asset Price

D.
December $65 Put – Out of the Money
Option Price vs. Time to Expiration
Option Price vs. Volatility
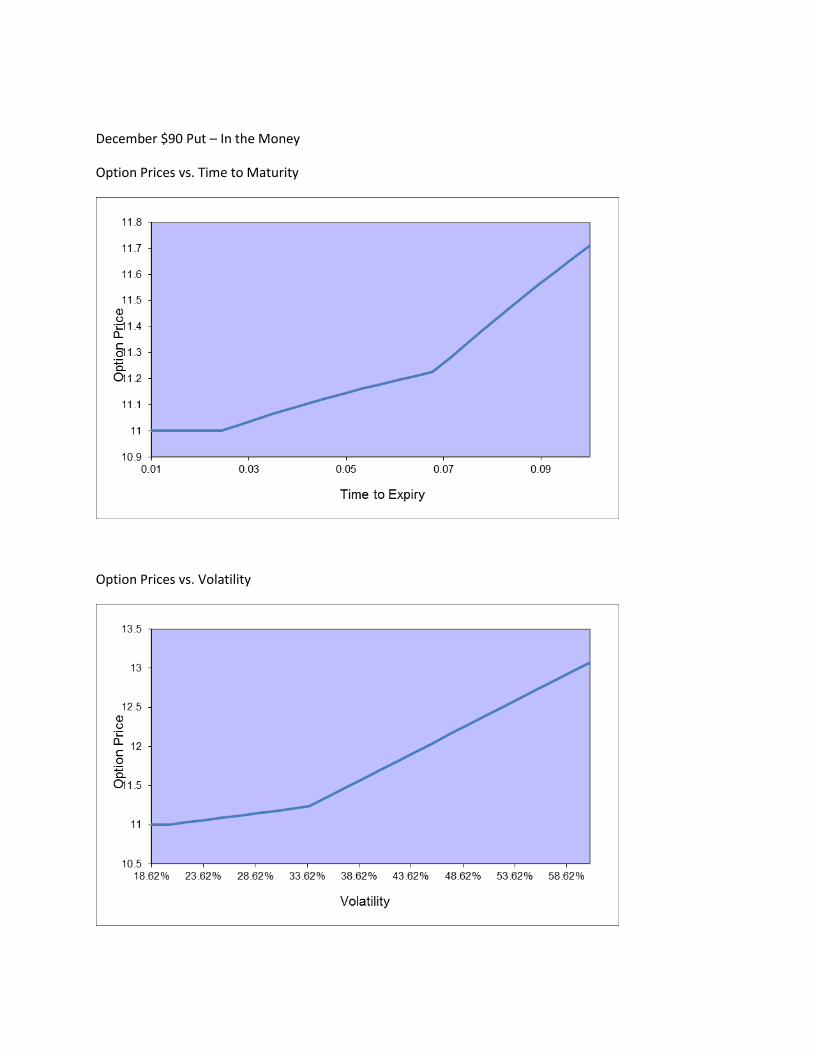
December $90 Put – In the Money
Option Prices vs. Time to Maturity
Option Prices vs. Volatility

December $80 Call – At the Money
Option Prices vs. Time to Maturity
Option Prices vs. Volatility