Embed Size (px)
Citation preview

DOCUMENT RESUME
ED 376 079 SE 055 351
AUTHOR Grandy, Jerilee
TITLE Trends in SAT Scores and Other Characteristics ofExaminees Planning To Major in Mathematics, Science,or Engineering. Research Report.
INSTITUTION Educational Testing Service, Princeton, N.J.
SPONS AGENCY National Science Foundation, Washington, D.C.
REPORT NO ETS-RR-89-24PUB DATE Apr 89NOTE 409p.
PUB TYPE Reports Research/Technical (143)Tests /Evaluation Instruments (160)
EDRS PRICE MF01/PC17 Plus Postage.
DESCRIPTORS Engineering Education; High Schools; *High SchoolSeniors; *Majors (Students); *MathematicsAchievement; Mathematics Education; *RacialDifferences; Science Education; *Sex Differences
IDENTIFIERS *Scholastic Aptitude Test
ABSTRACTThis study analyzed data from the Scholastic Aptitude
Test (SAT) taken between 1977 and 1988 to study trends in thenumbers, test scores, and other characteristics of high schoolseniors planning to major - math, science, or engineering, and tocompare these data with comparable data from examinees planning to
major in other fields. Results indicated that: (1) the totaltest-taking population declined in number until 1983 and has since
been increasing; (2) the percentage of examinees who planned to majorin math, science, or engineering increased from 24% to 29% of the
examinee population; (3) in 1988 examinees planning to major in math,science, or engineering obtained a mean verbal score 18 points higherand a mean mathematics score 31 points higher than the population
average; (4) among students planning to major in math, science, orengineering, the mean mathematics score declined until 1981,increased until 1985, and declined thereafter; (5) among examineeswho identify themselves as white and who plan to major in math,science, or engineering, there has been a differences of nearly astandard deviation between the mean mathematics scores of males andfemales; sex differences were not as great among black examinees; and(6) among examinees who identified themselves as black and who planto major in math, science, or engineering, the mean mathematics scorefor males rose 18 points, and the mean for females rose 20 points.Appendices include Student Descriptive Questionnaires and definitionsof major field categories in Science and Non-Science Tables. (MKR)
***********************************************************************
Reproductions supplied by EDRS are the best that can be madefrom the original document. *
***********************************************************************
RES
ARCH
0cr,
N-C/
CI
RE
ORT
RR-89-24
TRENDS IN SAT SCORES AND OTHER CHARACTERISTICSOF EXAMINEES PLANNING TO MAJOR IN
MATHEMATICS, SCIENCE, OR ENGINEERING
'PERMISSION TO REPRODUCE THISMATERIAL HAS BEEN GRANTED BY
R Cc, Ley
TO THE EDUCATIONAL RESOURCESINFORMATION CENTER (ERICI.-
Jerilee Grandy
U S DEPARTMENT OF EDUCATIONOffice of Educational Research and improvement
EDUCATIONAL RESOURCES INFORMATION''\ CENTER (ERIC)l',Thls document has been reproduced as
receivedrig
dfr7trn the person or orgaruzan on
C. Minor Changes have been made to .mproyereproduction quality
Pomts or view or opauons stated rn INS docu"rent do not necessarily represent othc,a,OE RI position or policy
Educational Testing ServicePrinceton, New Jersey
April 1989
BEST COPY AVAILABLE

Trends in SAT Scores and Other Characteristics of ExamineesPlanning to Major in Mathematics, Science, or Engineering
Jerilee GrandyEducational Testing Service
March 1989
The research reported herein was funded by the NationalScience Foundation. Points of view or opinions stated do notnecessarily represent official opinions or policies of theNational Science Foundation or Educational Testing Service.
Copyright © 1989 by Educational Testing Service
3
CONTENTS
ABSTRACT
BACKGROUND
PURPOSE
METHOD
Major Field Definitions
Variables Analyzed
RESULTS
Trends in the Examinee Population
Numbers and Percentages of Examinees Planningto Major in Math, Science, and Engineering
Test Scores of Examinees Planning to Majorin Math, Science, and Engineering
Page
2
5
6
6
9
10
10
12
16
Other Characteristics of Examinees Planningto Major in Math, Science, and Engineering 22
Comparisons with Examinees Planning to Majorin Non-science Fields 23
Results for Subpopulations 27
Relationships between Field of Study, TestScores, and Educational Aspirations 38
REFERENCES 42
TABLES 43
APPENDICES 200
4
ABSTRACT
This study analyzed data from the Scholastic Aptitude Test(SAT) taken by high school seniors between 1977 and 1988. Itspurpose was to study trends in the numbers, test scores, andother characteristics of examinees planning to major in math,science, or engineering, and to compare these data withcomparable data from examinees planning to major in other fields.
The major findings were as follows:
1. The total test-taking population declined in number until1983 and has since been increasing. The average SAT Verbal scorealso declined until 1981, then increased until 1986. Between1986 and 1988 the Verbal mean declined 3 points. The meanMathematics score declined until 1981 but rose 10 points from1981 to 1988.
2. Between 1977 and 1988, the percentage of examinees whoplanned to major in math, science, or engineering increased from24% to 29% of the examinee population. In recent years, thenumbers planning to major in psychology and in the socialsciences have shown especially large increases.
3. In 1988, examinees planning to major in math, science, orengineering obtained a mean Verbal score 18 points higher thanthe population average and a mean Mathematics score 31 pointshigher. Means for specific fields varied considerably.Examinees planning to major in physics, for example, obtained amean Mathematics score 145 points above average, while thoseplanning to major in sociology obtained a mean 44 points belowthe population average.
4. Among students planning to major in math, science, orengineering, the mean Verbal score declined until 1983, roseslightly in the next two years, and declined 5 points between1985 and 1988. The mean Mathematics score declined until 1981,increased until 1985, and declined thereafter. Between 1987 and1988, the mean Mathematics score dropped 6 points.
5. Among examinees who identify themselves as White and whoplan to major in math, science, or engineering, there has been adifference of nearly a standard deviation between the meanMathematics scores of males and females. The scores of femalesdo not appear to be "catching up" with the scores of males. Sexdifferences are not as great among Black examinees as among Whiteexaminees.
6. Among examinees who identify themselves as Black and whoplan to major in math, science, or engineering, the meanMathematics score for males rose 18 points between 1977 and 1988,and the mean for females rose 20 points during that period.
1
BACKGROUND
High school seniors who take the Scholastic Aptitude 'Test
(SAT) constitute a large population, many of whom become college
freshmen shortly thereafter. While not all college students have
taken the SAT and not all SAT takers become college students,
there is sufficient overlap between SAT examinees and the
college-going population to warrant serious study of the
approximately one million high school seniors who take the SAT
each year.
One advantage to studying the population of SAT examinees is
that about 90% complete all or part of a background questionnaire
entitled the Student Descriptive Questionnaire (SDQ) in which
they specify the major field in which they intend to major. This
information enables the researcher to follow trends in numbers of
students planning to major in specific fields as well as trends
in their test scores and other background data.
While there is no guarantee that examinees will actually
major in the fields they specify, the choices they make when they
take the SAT provide an indication of their interests at that
time and reflect the decisions they have made thus far regarding
their educational futures.
This report is the second in a series of ETS reports based
on studies funded by the National Science Foundation to provide
information for the NSF biennial publication entitled Science and
Engineering Indicators. The first report presented trends from
1975 to 1986 in SAT data for seniors planning to major in math,
science, or engineering, and it compared the data for those
2 6
studentil with corresponding data for students planning to major
in other fields (Grandy, 1987). The 1987 report also presented
data separately for White males, White females, Black males, and
Black females. Because of their relatively small numbers, dat
for members of other ethnic groups were not analyzed separately.
The reader should keep in mind that some students do not
answer the question on ethnic identity. The number as well as
the characteristics of such students varies from year to year.
Furthermore, we know that the average test scores of the members
of any particular ethnic group who answer the ethnicity question
are different from the average test scores of the same ethnic
group omitting the ethnicity Question. This issue has been
discussed at some length by Wainer (1988). Interpretations of
"trends" in the scores of any particular group must be qualified
as trends in the scores of a self-identified group. When we
speak of trends in the SAT Verbal score means of Black female
examinees, therefore, we refer more specifically to trends in the
SAT Verbal score means of those students who identify themselves
as Black females. The simpler wording is used throughout this
report, but the issue of non-response should always be kept in
mind when interpreting statistics for subgroups.
3

Highlights from the 1987 report were as follows:
1. The number of examinees planning to major in math,
science, and engineering increased until 1983 and showed a slight
decline thereafter. Aerospace and electrical engineering as well
as international relations showed steadily increasing interest,
while interest in majoring in computer science rose sharply until
1983 and then declined 49% between 1983 and 1986.
2. Examinees planning to major in math, science, and
engineering in 1986 obtained SAT Verbal scores averaging 19
points higher than the average for all examinees, although the
means varied greatly depending upon the specific major field
choice.
3. The average SAT Mathematics scores of examinees planning
to major in math, science, and engineering in 1986 were 38 points
higher than the average for all test takers. There was
considerable variation in the math aptitudes of examinees
planning to study math, science, and engineering. The highest
means were obtained consistently by those planning to major in
physics. Those planning to major in agriculture, child psycholo-
gy, general psychology, social psychology, sociology, law
forcement, and miscellaneous social sciences all had averages
nsistently below the mean for the examinee population.
4. Examinees intending to study pre-medicine, classics,
comparative literature, philosophy, classical languages, Chinese,
Latin, Russian, education of the gifted and talented, and
mathematics education had higher means in SAT Mathematics than
those interested in math, science, and engineering.
5. The Verbal and Mathematics scores of examinees interested
in computer science declined 26 and 40 points respectively
between 1977 and 1986.
6. In 1986, there were still more male than female examinees
interested in math, science, and engineering, and females did not
seem to be catching up with males in terms of their interest in
majoring in these fields.
7. Female examinees planning to major in electrical,
mechanical, and civil engineering had higher average SAT
Mathematics scores than male examinees interested in these
fields.
8. Mean SAT Mathematics scores of examinees who identified
themselves as Black and indicated that they plan to major in
math, science, and engineering rose considerably between 1977 and
1986, especially among those planning to major in mathematics or
statistics.
PURPOSE
The purpose of the present study was to add two more years
of data to the earlier analyses and to answer the following
questions:
1. How have examinees' interests in majoring in math,
science, and engineering changed since 1977?
2. How have test scores and other characteristics of
examinees planning to major in math, science, and engineering
changed since 1977?
3. How do examinees planning to major in math, science, and
5
engineering currently compare with examinees planning to major in
various other fields?
4. How do male and female examinees currently differ in
their interest in majoring in math, science, and engineering, and
how have these differences changed since 1977?
5. How do male and female examinees planning to major in
math, scicace, and engineering currently differ in their test
scores and other characteristics, and how have these differences
changed since 1977?
6. How have Black examinees changed since 1977 in their
interest in majoring in math, science, and engineering and in
their test scores and background characteristics?
METHOD
The analyses included data on all high school seniors who
too.< the SAT from 1977 to 1988.
Major Field Definitions
When examinees register to take the SAT, approximately 90%
of them voluntarily fill out the SDQ which asks, among other
things, in what field they intend to major. That question was
first asked in 1975. In 1976 and again in 1986, the College
Board revised the SDQ and changed many of the major fields. An
unsuccessful attempt in 1976 to translate the major field codes
so that those used in 1975 would be comparable to those in
subsequent years resulted in the major field codes for 1976 being
deleted from the files. Between 1975 and 1977, the definitions
of many major fields changed enough to make trend analyses that
included the 1975 data questionable. We have, therefore,
6
10

excluded 1975 data from the present study.
In 1986, the College Board again revised the major fields,
adding many new ones and rewording old ones. Appendices A and B
show the two versions of the SDQ, one for 1977 to 1985, and the
other for 1986 onward. The major field codes are listed at the
end of each SDQ. A major task in our previous study was to make
the two versions of major field categories comparable and to map
them on to the fields recognized by the National Science Founda-
tion (NSF).
The major fields defining math, science, and engineering for
this study were consistent with those published by NSF (1983) in
their Survey of Graduate Science and Engineering Students and
Postdoctorates. The analyses broke down math, science, and
engineering into ten different fields, with some of these being
further divided into more detailed subfields as follows:
1. Mathematics and Statistics
2. Computer Science
3. Physical Sciences
a. Astronomyb. Chemistryc. Physics
4. Architecture and Environmental Engineering
5. Engineering
a. Aerospace Engineeringb. Electrical Engineeringc. Chemical Engineeringd. Mechanical Engineeringe. Civil Engineeringf. Other or unspecified Engineering
7

6. Life Sciences
a. Agricultureb. Biological Sciences
7. Earth and Environmental Sciences
8. Psychology
a. Child Psychologyb. General Psychologyc. Social Psychology
9. Social Sciences
a. Economicsb. International Relationsc. Law Enforcementd. Political Sciencee. Sociologyf. Other Social Sciences
10. Interdisciplinary, unspecified, and other sciences
The non-science categories consisted generally of major
fields attracting more than 3,000 examinees. Very small fields,
such as philosophy, were grouped with similar small fields
composing larger categories, such as "humanities." This study
used the following non-science categories:
1. Pre-medicine2. Other health fields3. Prelaw4. Humanities5. History and culture6. Foreign languages7. Studio and performing arts8. Communications9. Business
10. Education11. Vocational Fields12. Other/missing/undecided
The reader may wish to combine the data for foreign
languages with humanities and possibly the data from history and
culture as well. It was not practical to break down each
8

category into all of its constituents, even though the results
might have been of interest to specialists in those areas.
The last category contained primarily those who did not
respond to the question on major field preference and those who
marked "undecided." There was a minute number of "other" major
fields not included in the first eleven categories.
Appendix C defines the correspondence between major fields
listed in the SDQ and the major field categories as they appear
in the tables for math, science, and engineering. Appendix D
shows the correspondence for non-science major fields.
Variables Analyzed
This study reports trends from 1977 to 1988 in the following
variables:
1. Number selecting each major field;2. Percentage selecting each major field;3. Mean and standard deviation of SAT Verbal score;4. Mean and standard deviation SAT Mathematics score;5. Mean self-reported high school grade in mathematics
(through 1985 only);6. Mean self-reported rank in high school class;7. Percentage who intend eventually to receive a graduate
degree.
Prior to 1986, the SDQ asked for the student's grade
averages in various broad subject areas, such as English,
Mathematics, and Physical Sciences. Beginning in 1986, these
questions were changed so that they are no longer comparable to
the earlier questions. Because only three years' data are
available on the new questions, they have not been included in
this study, though we have reproduced the "grade in mathematics"
data from 1977 to 1985. Trends in grades from 1986 onwards will
be added to the analyses in future studies.
9 1
Analyses included trends in all of these variables for White
males, White females, Black males, Black females, "other"
students, and all examinees combined. Analyses of the smaller
ethnic groups would have produced unstable results because the
numbers were so small. The "other" group simply contained all
examinees who answered the major field question but were either
members of a smaller ethnic group or did not respond to the
ethnic identity question. In combination, their data are aot
especially meaningful, but they are included so that the totals
for all examinees "add up."
RESULTS
The Tables in this report contain the detailed analyses.
The findings discussed here are ones that have been of major
interest. The reader is encouraged to examine the tables
cate -illy because they contain far more detailed information than
ae report can possibly cover.
Trends in the examinee population
The number of high school seniors taking the SAT was greater
in 1988 than at any time in the previous eleven years. What was
seen as a decline in the test-taking population after 1981 proved
to be temporary. By 1984 the number began to rise, and in the
five years from 1983 to 1988, the number of seniors taking the
SAT increased by nearly 18%.
The SAT population can be expected to grow when the
population of high school seniors grows or when a larger than
usual proportion of the senior class takes the SAT. In the
latter case, there are likely to be more low-scoring examinees
10
14
taking the test than there are in years when only a small portion
of the senior class takes it. Consequently, as the SAT
population increases in numbers, the average test score may
decline. (See Beaton, Hilton, and Schrader, 1977.)
Trends over the past eleven years provide a rough fit to
this inverse relationship between population size and Verbal
score average. Between 1977 and 1981, the SAT population
increased by a small amount (1.4%), and SAT Verbal scores
declined 5 points. After 1981, the population decreased for two
years and Verbal scores rose a point or two. From 1983 to 1988,
the population increased, but the Verbal scores first rose then
declined. In the last two years, the population has grown by
13.4%, and the Verbal score average has declined 3 points.
Differences in the trends of the four ethnicity-by-sex
subgroups were considerable. The average Verbal score of White
male examinees increased from 1980 to 1986 and then remained
constant. Among White female examinees, the Verbal scores first
increased and then declined 4 points in the past year. The
Verbal scores of Black male examinees increased 20 points from
1980 to 1986, then declined 4 points, and rose again to an all-
time high. The Verbal scores of Black female examinees showed a
steady rise of 22 points between 1981 and 1988. These trends
cannot be explained by fluctuations in the growth of the SAT
population because each ethnicity-by-sex subgroup showed a
decline followed'by an increase in numbers. The trends may,
however, be affected by unknown patterns in non-response to the
ethnicity item.
1111111111111VAIM..
11
SAT Mathematics scores, in contrast to the Verbal scores,
showed a continuing upward trend for the population as a whole.
While the Mathematics score average declined between 1977 and
1981 as the population increased, it rose 10 points after that
time. Even in the past two years, when the test-taking
population increased so greatly and the average Verbal score
declined, the average Mathematics score rose one more point.
The rise in Mathematics scores was quite large for Black
students. After 1978, when Mathematics scores were at their
lowest for Black students, the average Mathematics score for
Black male examinees increased 23 points by 1988. Among Black
female examinees, it increased 29 points. The scores of White
female examinees increased 10 points between 1982 and 1988, but
the average score for White male examinees increased until 1987
and then declined 2 points in the last year.
The inverse relationship of population size to test score
may apply in the absense of other interventions. Both the test
scores and the numbers of Black examinees have risen considerably
in recent years, suggesting that curricular changes and special
enrichment programs may be responsible for the trends observed in
the scores obtained by these subpopulations.
Numbers and percentages of examinees planning to major in math,
science, and engineering
In terms of absolute numbers, a greater number of examinees
planned to major in math, science, and engineering in 1988 than
at any time over the previous eleven years. In 1979 the figure
was under 240,000; by 1988 it had risen to over 330,000. This
12
16
increase was not so dramatic as it might appear, however, because
there was also an increase in the total number of examinees
taking the SAT during those years, from just under 980,000 to
more than 1.13 million. A more meaningful statistic to observe
over time, therefore, is the percentage of total test-takers who
chose math, science, and engineering. That percentage increased
from 24% in 1977 to 31% in 1983. It then declined slightly over
the next two years but increased to 29% in 1988. Overall,
therefore, between 1977 and 1988, examinees showed increasing
interest in majoring in math, science, and engineering.
Interest in the individual areas of math, science, and
engineering followed different trends. The area attracting the
most students--engineering--showed increasing interest from 1977
to 1982. After that time, the percentage of students planning to
study engineering leveled off at about 10% of the total examinee
population.
The percentages of examinees planning to major in
architecture and environmental engineering, psychology, and
social sciences all showed increases over the eleven year period.
Interest in math and statistics steadily declined from 1.3% of
the examinee population in 1977 to only 0.6% in 1988.
Examinees planning to study computer science rapidly
increased in number until 1983 and decreased just as rapidly
thereafter. The proportion of the examinee population choosing
computer science rose from 1.3% in 1977 to a maximum of 7.5% in
1983 and decreased to 2.7% by 1988.
Interest in the physical sciences remained about constant,
with only slight fluctuations in numbers over the eleven-year
13

period. About 0.8% of the examinee population indicated, each
year, that they planned to major in one of the physical sciences.
Examining the individual science fields in closer detail, we
find that among the physical sciences, chemistry has consistently
attracted more students than have physics or astronomy. In
recent years, however, students have shown increasing interest in
astronomy and declining interest in chemistry. Interest in
physics has remained about constant.
Within the life sciences, there was a declining interest in
majoring in agriculture from 1977 to 1985, but since that time
numbers have risen. Selection of a major in the biological
sciences also declined until 1985 and then rose. In 1988, 2.4%
of the examinee population chose biological sciences.
Psychology and all of the social sciences have been
attracting increasing numbers of students in recent years. The
number of examinees planning to major in general psychology
(which includes experimental and clinical) has doubled since
1983. The number choosing child psychology rose 41% in the last
two years. Social psychology, which had maintained fairly
constant numbers from 1977 to 1985, declined in interest in 1986
but has been increasing since that time.
In 1988, the social sciences overall attracted more than 5%
of the examinee population. Interest in international relations
has grown steadily over the eleven-year period, with numbers more
than tripling during that time. With the exception of
international relations, most of the social sciences declined in
popularity by about 1983, but since that time, students have
14 8
shown increasing interest in economics, law enforcement,
political science, and sociology. The number planning to major
in law enforcement has more than tripled since 1982. Those
interested in sociology have nearly doubled since 1983, and the
number selecting economics has grown 37% since 1983.
The two remaining science fields- -architecture and
environmental engineering, and earth and environmental science- -
declined in interest until 1984 but attracted increasing numbers
of examinees in the last four years. In both fields, numbers
rose 72% between 1984 and 1988.
In 1988, nearly one-fifth of the examinees planning to major
in engineering did not indicate a specific area of engineering.
For the present analyses, statistics on those students were
included with "other" engineering. About one-half of the "other"
engineering category consisted of these students. The remaining
half consisted of students planning to study computer
engineering, bioengineering, architectural engineering, and other
engineering specialities.
Interest in majoring in aerospace engineering has outpaced
interest in all other engineering fields over the past eleven
years. Of the five largest engineering fields--aerospace,
electrical, chemical, mechanical, and civil- -aerospace
engineering now leads in popularity among SAT examinees. In
1988, over 22,000 examinees planned to select this major. In
fact, of all major fields in math, science, and engineering, only
computer science, biological sciences, and general psychology
attracted more students in 1988 than did aerospace engineering.
The number choosing electrical engineering increased until
1985 and has since declined. Some students who might have
selected electrical engineering in the past, however, may have
chosen computer engineering after 1985 because computer
engineering was added as a new field on the SDQ in 1986, and the
analysis reported here included it with "other" engineering.
The numbers selecting chemical and mechanical engineering
both increased until 1982 and have declined since that year. In
1988, only 5% of all examinees planning to study engineering
chose chemical engineering.
Test scores of examinees planning to major in math, science, and
engineering
The mean SAT Veroal scores of all students planning to major
in math, science, and engineering declined until 1983, rose
slightly in the next two years, and declined 5 points between
1985 and 1988. In the SAT population as a whole, however, the
average score dropped 3 points in the same three years. Thus,
the decline for students planning to study math, science, and
engineering probably reflects the decline shown for the entire
population.
The 1988 Verbal score average for all examinees planning to
major in math, science, and engineering was 446. Among all
examinees who took the SAT that year, the mean was only 428.
Thus, examinees planning to major in math, science, and
engineering obtained average Verbal scores 18 points higher than
the average for all examinees. That year, the range in the means
among examinees planning to major in different areas of math,
science, and engineering was 159 points, which is about one and
16
one half standard deviations. This suggests that the population
who plan to study math, science, and engineering is quite
heterogeneous with respect to verbal auility. Those planning to
major in law enforcement obtained the lowest mean score, name'y,
380; those interested in physics obtained the highest mean,
namely, 539.
The trends in SAT Mathematics scores among students planning
to major in math, science, and engineering were very similar to
the trends in their Verbal scores. The average score reached a
low of 507 in 1979 through 1981, then rose to 514 by 1985. Since
that time, however, the mean score dropped back down to 507.
Between 1987 and 1988, it declined 6 points. The following table
shows the extent of the decline in SAT Mathematics score averages
between 1987 and 1988, for each intended major field within math,
science, and engineering:
ScoreField change
Math/statistics - 6
Computer science - 6
Astronomy -18Chemistry - 9Physics -17
Arch./env. eng. - 2
Aerospace eng. - 6Electrical eng. - 9Chemical eng. - 6Mechanical eng. - 5Civil eng. - 4Other, unspec. eng. - 6
ScoreField change
Agriculture + 3
Biological Sci. - 2
Earth/env. sci. - 1
Child psych. + 3General psych. - 3Social psych. + 7
Economics -10International rel. - 4Law enforcement + 1
Political science - 2Sociology + 4Other soc. sci. + 7
Interdisc.,other,or unspecified sci. - 3
17 21
The mean Mathematics scores in 1988 also varied considerably
among the specific science areas, ranging from only 410 for law
enforcement to 621 for physics. In fact, the highest Mathematics
scores have always been obtained by those planning to major in
physics. The lowest scores have been earned by those planning to
study law enforcement. In general, the science fields demanding
the greatest quantitative skills attract examinees with the
highest Mathematics scores, so it is important to realize that
not all areas of science attract students who are mathematically
inclined. The population planning to study math, science, and
engineering is heterogeneous with respect to mathematical as well
as verbal aptitude.
Figure 1 shows trends in SAT Mathematics score averages over
the past eleven years for examinees planning to major in the four
most quantitative areas: physical sciences, mathematics and
statistics, engineering, and computer science. The lowest curve
shows the trend for all SAT-takers.
18

Mean SAT Math Scores By Intended Major Field(Highly Quantitative Sciences)
620
610
600 .--------
590 :7 ---__ (Physical Sci. .',,,--
--____ ___________ --- -- ,,,,/580
570M Math/Stat.-Ie 560a
n 550
S 540AT 530
M 520at 510 -
500 -Sc 490 -or 480e
470
460
450
440
430
420
1977 1978 1979 1980 1981 1982 1983 1984 1985 1986 1987 1988
Test Yearr
Engineering
Comp. Sci.
All test-takers
Figure 1
From the graph we see that among all test takers, the SAT
Mathematics score average reached a minimum in 1981, when the
mean was 466. It has since risen to 476. Examinees planning to
major in the most quantitative sciences and engineering scored
consistently above the population mean. Those interested in
computer science, however, show rapidly declining Mathematics
scores. The curve for that group appears to be converging with
19 93
the population mean.
The other three major field areas shown in the graph--math
and statistics, physical sciences, and engineering--all show an
S-shaped trend. Score averages first declined, then rose, and in
the last year or two, declined again.
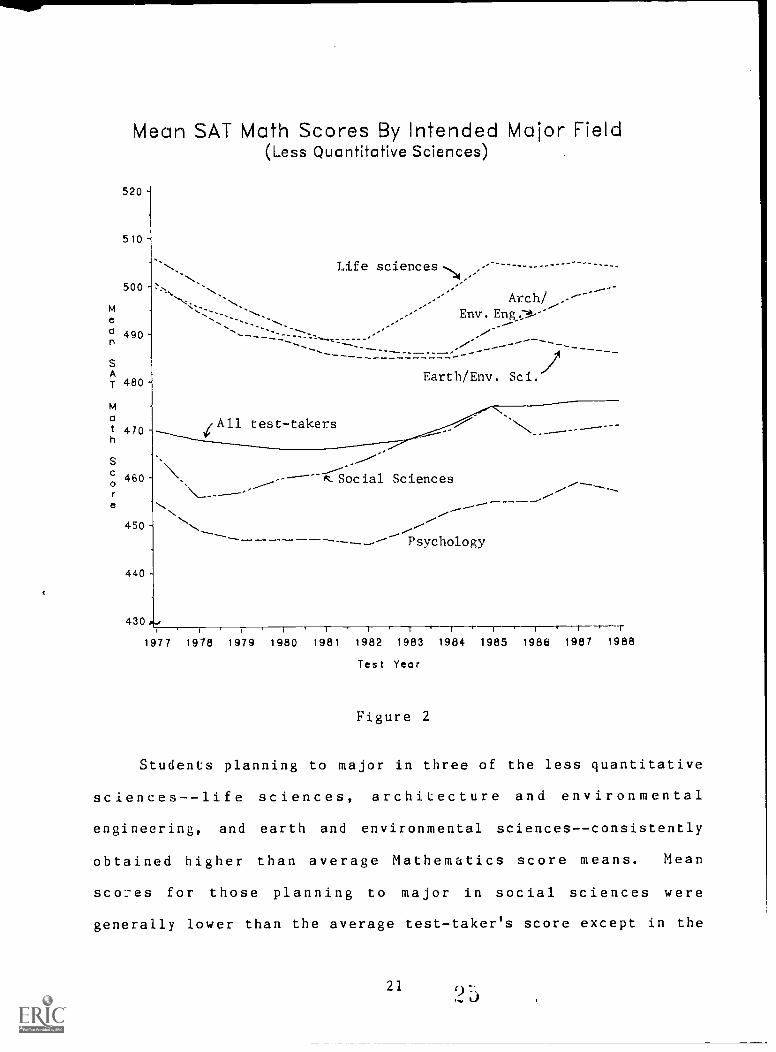
Figure 2 shows the trends for examinees planning to major in
sciences that typically do not demand as much quantitative skill
as the fields just discussed.
20 0 4
Mean SAT Math Scores By Intended Major Field(Less Quantitative Sciences)
520
510
500
M
a 490n
SA
M
a
h
S
0
480 -
470 -
460
450
440
430
Life sciences ..., ......................
----,-/ Arch/ ..-------
..--
Env. Eng.y.---,-- ..-..... --
Earth/Env. Sci.
All test-takers
& Social Sciences
........ Psychology
1977 1978 1979 1980 1981 1982 1983 1984 1985 1986 1987 1988
Test Year
Figure 2
Students planning to major in three of the less quantitative
sciences--life sciences, architecture and environmental
engineering, and earth and environmental sciences--consistently
obtained higher than average Mathematics score means. Mean
sco:es for those planning to major in social sciences were
generally lower than the average test-taker's score except in the
21
years from 1983 to 1985 when their scores were comparable to the
population mean. Examinees planning to major in psychology
consistently scored 15 or more points below the population
average.
Other characteristics of examinees planning to major in math
science, and engineering
This study also analyzed the examinee's self-reported grade
average in mathematics (from 1977 to 1985), rank in class, and
educational aspirations.
The mean grade in mathematics showed virtually no change
over the years for which it was available. There is no
assurance, however, that grades are comparable from year to year
because grades, unlike test scores, are not equated over time.
Perhaps because of grade inflation and deflation as well as other
factors, trends in grades are difficult to interpret.
Comparisons of grade averages within the same year, across
groups, are somewhat more meaningul to interpret. Among students
planning to major in math, science, and engineering, mathematics
grades were consistently higher each year than the mean for the
entire population. Examinees planning to major in psychology or
social sciences, however, obtained lower than average grades in
mathematics just as they obtained lower than average SAT
Mathematics scores.
The mean rank in class gives a different perpective on
achievement, presumably integrating both the verbal and
quantitative components of learning. Furthermore, it is a
measure that is not affected by grade inflation. Among all
22
examinees planning to major in math, science, and engineering,
the mean rank in class remained remarkably unchanged at about the
75th percentile over the past eleven years. The highest ranks
were maintained among those interested in the physical sciences,
especially physics, and in chemical engineering, mathematics,
economics, and international relations. These were all fields
attracting examinees with high grades and test scores as well.
Of those examinees planning to major in math, science, and
engineering, 60 to 63% each year over the past eleven years
indicated that they intended to obtain more than a bachelor's
degree. Among the specific major fields, those fields attracting
examinees with the highest aspirations tended to be the same
fields that attracted examinees with the highest test scores and
class ranks. In 11:88, 87% of the prospective physics majors
intended to obtain a graduate degree. On the other hand, only
37% of those interested in law enforcement and only 33:: of those
planning to study agriculture planned to attend graduate school.
Comparisons with examinees planning to major in non-science
fields
The analyses discussed above indicated that the percentage
of SAT examinees planning to major in math, science, and
engineering was highest in 1983. At that time slightly more than
31.2% expressed an interest in math, science, and engineering.
By 1986, that figure had dropped to 28.5%, but by 1988, it had
again risen to 29.2%.
Among the non-science fields there was a considerable
increase in interest in majoring in business. Here the figures
23

doubled, from 11.3% in 1977 to 21.7% in 1988. Interest in
majoring in education increased over the past four years, from
3.8% of the SAT population in 1984 to 6.1% in 1988. Other
fields, such as communications, also increased in popularity, but
their numbers remained too small to have any noticeable effect on
population statistics as a whole.
Student interest in pre-medicine showed a decline after
1984. Interest in other health fields declined from 11.4% to
7.6% of the SAT population in the past ten years.
It is perhaps unexpected that the SAT Verbal scores of
prospective math, science, and engineering students should be
higher than the average for test-takers as a whole, but this has
consistently been the case. As we noted earlier, the mean Verbal
score for all SAT examinees in 1988 was 428; for those planning
to major in math, science, and engineering, the mean was 446..
If we rank order the average SAT Verbal scores for the broad
major field groupings used in this study, we obtain the
following:
24

FieldMeanSATV
*Interdisc/other sci. 527Humanities 515
*Physical sciences 512History/culture 491Foreign languages 479Pre-medicine 474
*Math/statistics 468Prelaw 460
*Life sciences 459*Engineering 454*Earth/environ sci. 452*Social sciences 448Communications 447
*Psychology 433Studio/perf. arts 429ALL TEST-TAKERS 428
*Arch/environ eng. 426"Other" /undecided 417Other health 407Education 407Business 406
*Computer science 405Vocational 387
The areas marked with an asterisk ('*') are included in
math, science, and engineering. Architecture and environmental
engineering and computer science were the only math, science, and
engineering fields that attracted students with mean Verbal
scores lower than the aver--. for all test-takers. The category
designated as "interdisciplinary /other sciences" consisted of a
small number (fewer than 3,000) of examinees who chose
unspecified physical or biological sciences. These students
apparently intended to major in a science field but had not yet
decided on a specific area of science.
The mean SAT Mathematics score in 1988 for examinees
planning to major in math, science, and engineering was 507. The
average for examinees overall was 476. The following table rank
25

orders the intended major fields by mean SAT Mathematics score:
FieldMeanSATM
*Interdisc/other sci. 597
*Math/statistics 596*Physical sciences 584*Engineering 548Pre-medicine 534Humanities 510
*Life sciences 504*Arch/environ eng. 500Foreign languages 499History/culture 492Prelaw 490
*Earth/environ sci . 486*Computer science 479ALL TEST-TAKERS 476*Social sciences 471"Other" /undecided 463Business 461
Communications 461
*Psychology 457Other health 452Studio/perf. arts 449Education 442Vocational 433
There was a number of areas outside of the sciences that
attracted examinees with high mathematical aptitude. Students
interested in pre-medicine averaged 534, and students entering
the humanities averaged 510. Foreign languages, history and
culture, and pre-law also attracted examinees with higher than
average Mathematics scores.
Grades in math, as we might expect, were also higher for
examinees planning to major in math, science, and engineering.
In 1985, the average overall self-reported math grade was 2.85
(on a 4-point scale), while the average for examinees planning to
major in math, science, and engineering was 3.02. Overall math
grade was not available after 1985.
26
a f)
Self-reported mean rank in class was also higher than
average for examinees planning to major in math, science, and
engineering.
A greater than average percentage of examinees planning to
study math, science, and engineering indicated that they plan
ultimately to obtain a graduate degree. In 1988, 63% of all SAT
examinees planned to earn a graduate degree compared with only
56% of the total SAT population.
Among the non-sciences, less than half of all students
intending to major in studio and performing arts, communications,
business, education, or vocational fields planned to do graduate
work. On the other hand, 97% of those intending to major in pre-
medicine planned to go to medical or graduate school, and 85% of
the examinees headed for pre-law intended to go beyond their
bachelor's degree. Of those intending to study humanities,
languages, and history, 64% indicated that they planned to
continue to graduate school, and 63% of those interested in other
health fields also anticipated doing graduate study.
Results for subpopulations
All of the analyses reported thus far were also conducted
separately for White males, White females, Black males, and Llack
females. Because of the extensive quantity of information that
might be compared and the limited ex nt of this report, only the
major findings will be summarized here. Details can be deduced
from the tables.
We noted earlier an increasing trend in the number (and
percentage) of examinees planning to major in math, science, and
27

engineering until about 1983, after which time the numbers began
to decline. Trend data for each of the four subpopulations
suggests that after 1985, the percentage of male examinees
continued to decline but not the percentage of female examinees.
Females, especially Black females, showed increasing interest in
majoring in math, science, and engineering after 1985. Figure 3
below compares these trends for the four groups studied.
50-
P40-
e
30-
F
X
T.
ee
20
10
0
Percent of SAT Examinees Planning toMajor in Math, Science or Engineering
White males
R Black males
-------
Black females
White females/1
1977 1978 1979 1980 1981 1982 1983
Test Year
Figure 3
28
1984 1985 1986 1987 1988
We can see from the graph that math, science, and
engineering have consistently attracted fewer female than male
examinees over the past eleven years. Before 1985, an increasing
attraction to math, science, and engineering affected students of
both races and sexes. Beginning in 1985, that interest began to
increasing interest again, and by 1987, so did White female
examinees. Interest among male examinees, however, both White
and Black, continued a gradual decline. While White males are
still the group most attracted to the sciences, they appear to be
showing the greatest decline in interest. White females
currently are the group least attracted to math, science, and
engineering.
Among White examinees planning to major in math, science,
and engineering, the trends in SAT Verbal scores between 1977 and
1988 were different for male and female examinees. The scores
for White males dropped to a minimum in 1980 then rose 13 points
to a maximum in 1987, finally dropping one point by 1988. The
scores for White females dropped to a minimum in 1983-84,
increased only 5 points by 1985, then dropped 7 points by 1988.
In 1988, the mean Verbal score of White females planning to major
in math, science, and engineering was lower than it had been in
the previous eleven years studied. Furthermore, prior to 1984,
females planning to major in math, science, and engineering
obtained higher mean Verbal scores than males; beginning in 1984,
the score averages of males were higher. In 1988, White males
obtained an average Verbal score 9 points higher than the average
for White females.
Mean Verbal scores for Black examinees planning to major in
29
3

math, science, and engineering showed an increase of 17 points
for males and 6 points for females over the past eleven years.
The scores fluctuated considerably over that period but appear to
be increasing overall.
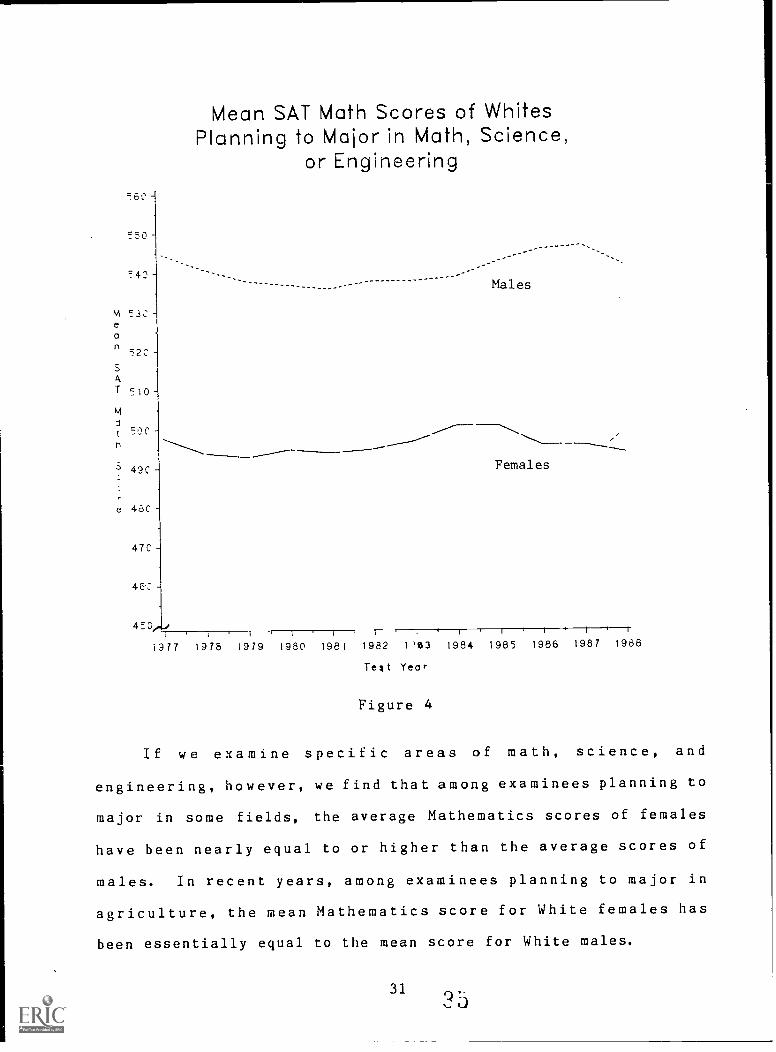
Among White examinees planning to major in math, science,
and engineering during the past eleven years, there has been
nearly half a standard deviation difference between the mean SAT
Mathematics scores of male and female examinees. The greatest
difference (51 points) was in 1987; the least was in 1984 (38
points). The trends for male and female examinees shown in
Figure 4 do not suggest that the Mathematics scores of females
are "catching up" with the scores of males.
30 34
MIL
56C -
550 -
M 53Ce
an
M
a
520
510
50C
49C
e 480
47C
46.0
450
1977
Mean SAT Math Scores of WhitesPlanning to Major in Math, Science,
or Engineering
I---------
Males
Females
1975 1979 1980 1981 1982 1'63 1984 1985 1986 1987 1988
Tea t Yearr
Figure 4
If we examine specific areas of math, science, and
engineering, however, we find that among examinees planning to
major in some fields, the average Mathematics scores of females
have been nearly equal to or higher than the average scores of
males. In recent years, among examinees planning to major in
agriculture, the mean Mathematics score for White females has
been essentially equal to the mean score for White males.
31'35
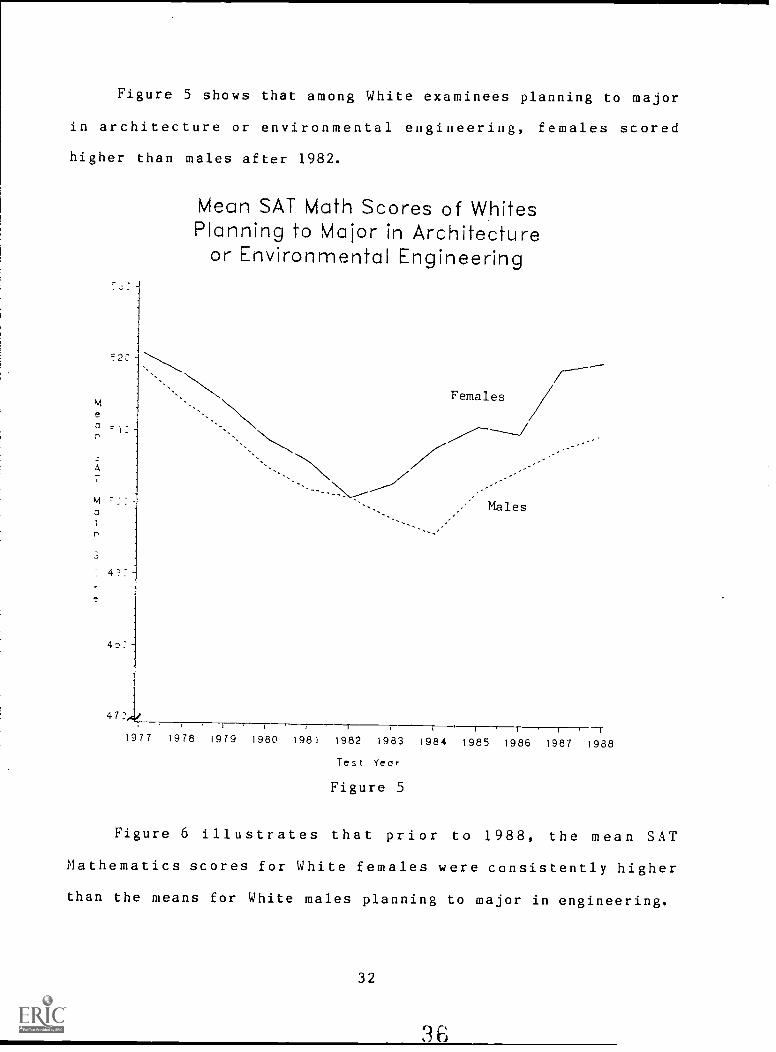
Figure 5 shows that among White examinees planning to major
in architecture or environmental engineering, females scored
higher than males after 1982.
:52C
a
Ma
4a
47:`
Mean SAT Math Scores of WhitesPlanning to Major in Architecture
or Environmental Engineering
Females
Males
1977 1978 1979 1980 1981 1982 1983 1984 1985 1986 1987 1988
Test Year
Figure 5
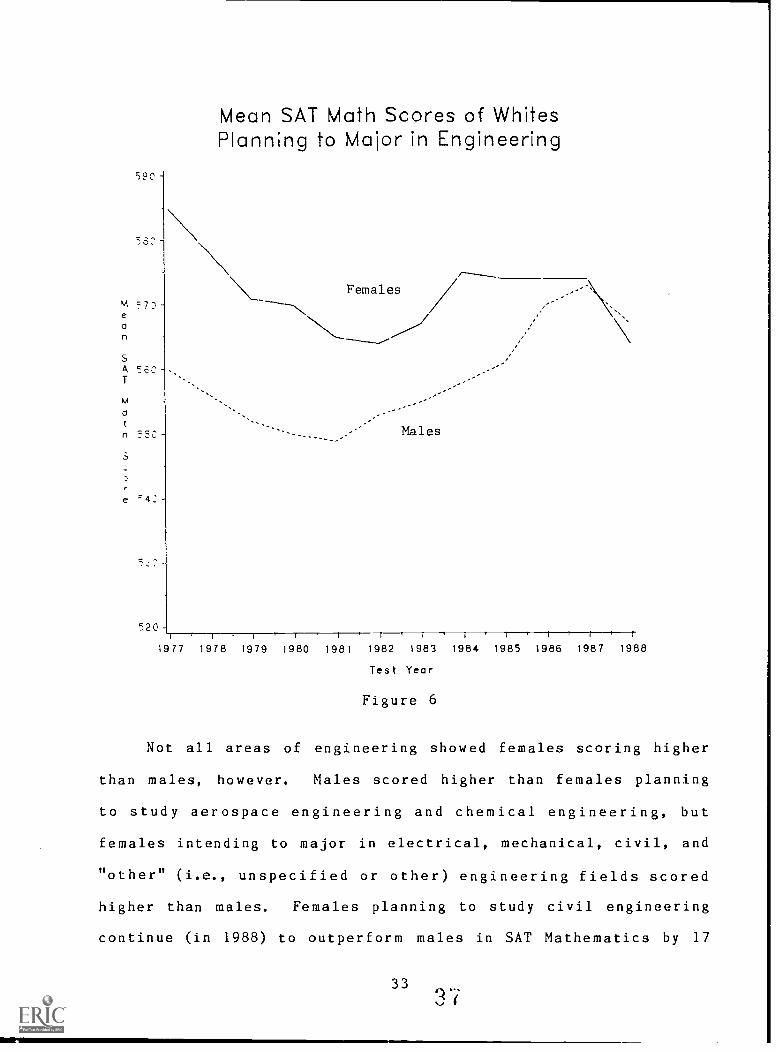
Figure 6 illustrates that prior to 1988, the mean SAT
Mathematics scores for White females were consistently higher
than the means for White males planning to major in engineering.
32
590
M 77)ean
S
A ."CCT
a
17-5C
e =4:
7.20-
Mean SAT Math Scores of WhitesPlanning to Major in Engineering
1977 1978 1979 1980 1981 1982 1983 1984 1985 1986 1987 1988
Test Year
Figure 6
Not all areas of engineering showed females scoring higher
than males, however. Males scored higher than females planning
to study aerospace engineering and chemical engineering, but
females intending to major in electrical, mechanical, civil, and
"other" (i.e., unspecified or other) engineering fields scored
higher than males. Females planning to study civil engineering
continue (in 1988) to outperform males in SAT Mathematics by 17
3337

points.
Sex differences among Black examinees are similar to the
differences noted among White examinees. Figure 7 shows eleven
year trends for Black examinees planning to major in math,
science, and engineering.
42:
41'2
3
4
J
7:
c;
Mean SAT Math Scores of BlacksPlanning to Major in Math, Science,
or Engineering
Males
----- _ -
Females
'4:,;,/1 I I I 1 '-- , .
1977 1978 1979 1980 1981 1982 1983 1984 1985 1986 1987 1988
Test Year
Figure 7
Among Black examinees planning to major in math, science,
and engineering, mean SAT Mathematics scores showed an increase
34
over the past eleven years. The trend for females has been
irregular, probably because of the small numbers of Black females
planning to major in these areas. In 1985, for example, fewer
than 11,000 Black females planned to major in math, science, and
engineering, and in 1977, the number was just over 8,000.
The gap between the scores of male and female examinees in
1984 was only 24 points; in 1988, the gap was 31 points. Still,
the difference in the mean Mathematics scores of male and female
B'ack examinees is only about a fourth of a standard deviation.
This is a smaller sex difference for Black examinees than for
White examinees.
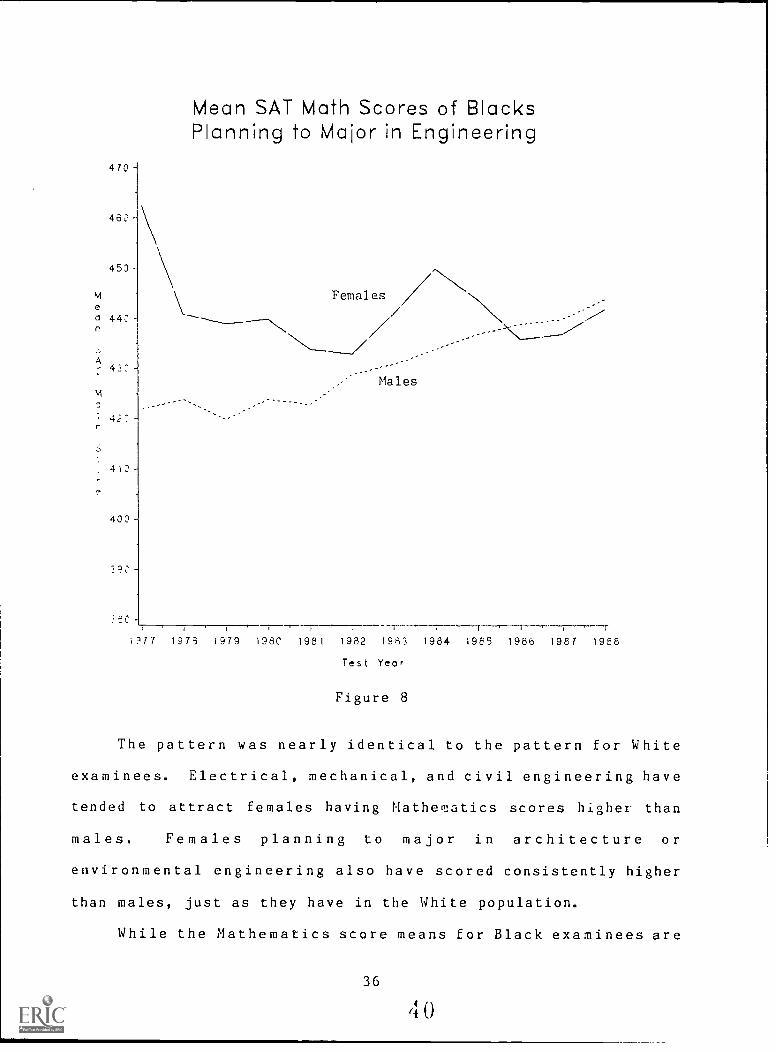
Figure 8 shows that among Black examinees planning to major
in engineering, females scored higher than males, on the average,
until 1986.
3539
470-
453
ea 44:r
A 43; -
1/41
42:r
413
403
3 9 C
Mean SAT Math Scores of BlacksPlanning to Major in Engineering
I ?7 7
Females
Males
r1973 1979 198C 1981 1982 1933 1984 1985 1986 1987 1988
Test Year
Figure 8
The pattern was nearly identical to the pattern for White
examinees. Electrical, mechanical, and civil engineering have
tended to attract females having Mathematics scores higher than
males. Females planning to major in architecture or
environmental engineering also have scored consistently higher
than males, just as they have in the White population.
While the Mathematics score means for Black examinees are
36
4 'N

still a standard deviation lower than the means for White
examinees, the average for Black examinees planning to major in
math, science, and engineering has risen considerably over the
past eleven years. Between 1977 and 1988, the mean for Black
males rose steadily from 400 to 418; for Black females, the mean
increased from 367 to 387. No increase has occurred for White
examinees.
While trends in grade average are not very useful, their
relative rank orderings within the same year generally are
useful. Comparing male and female examinees, research generally
shows that within the same population, males tend to obtain
higher test scores, while females obtain higher grades (Clark and
Grandy, 1984). In fact, when test scores are held constant,
women's grades are higher than men's, whether at the high school
or college level. Conversely, if grades are held constant, men's
test scores are higher than women's. When we analyze the grades
and SAT scores of examinees planning to major in specific fields,
we find that these patterns generally seem to hold.
In 1985 (the most recent year for which there are self-
reported grades in mathematics recorded on the examinee's
record), the average grade for females was higher than the
average grade for males for every intended field of study within
math, science, and engineering. It should be noted that the
average math gra,le for all examinees interested in math, science,
and engineering was very slightly higher for males than for
females. This is probably because the proportions of males and
females distribute differently over the science fields, with
37 II

females tending towards the less quantitative sciences, such as
psychology, and males tending towards engineering. Nevertheless,
for each and every intended major field, female examinees
reported higher math grade averages than did male examinees.
The last variable to compare across subgroups is the educa-
tional aspirations of examinees planning to major in math,
science, and engineering. Over the eleven-year period, a greater
percentage of females than males aspired to earn a graduate
degree, and that percentage showed an increase among White
females. In 1988, 68% of both White and Black female examinees
reported that they planned to earn a graduate degree. Among
White males, the number was 59%, and among Black males, the
figure was 56%.
Relationships between field of study, test scorest and
educational aspirations
One interesting observation is an apparent association
between test scores and educational aspirations. Such an
association is not in itself surprising, i.e., we would expect
the more academically able students to plan to do graduate work.
While it is not surprising, it is worth noting that some fields
attract examinees with higher educational aspirations than do
other fields, and those same fields attract examinees with high
test scores. Consider the mean test scores and the percentage of
examinees planning to obtain a graduate degree for each detailed
major field included in this study.
follows:
38
In 1988, they were as
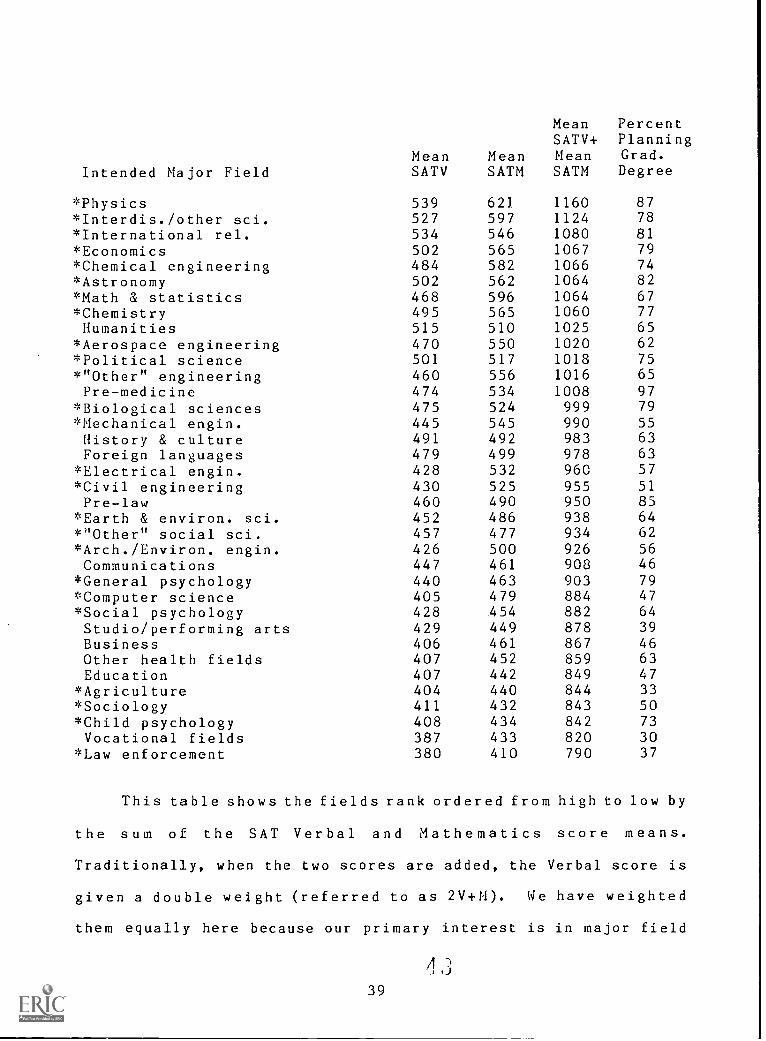
Intended Major FieldMeanSATV
MeanSATM
MeanSATV+MeanSATM
PercentPlanningGrad.Degree
*Physics 539 621 1160 87
*Interdis./other sci. 527 597 1124 78*International rel. 534 546 1080 81
*Economics 502 565 1067 79*Chemical engineering 484 582 1066 74
*Astronomy 502 562 1064 82
*Math & statistics 468 596 1064 67*Chemistry 495 565 1060 77Humanities 515 510 1025 65
*Aerospace engineering 470 550 1020 62*Political science 501 517 1018 75
*"Other" engineering 460 556 1016 65Pre-medicine 474 534 1008 97*Biological sciences 475 524 999 79
*Mechanical engin. 445 545 990 55History & culture 491 492 983 63Foreign languages 479 499 978 63
*Electrical engin. 428 532 960 57
*Civil engineering 430 525 955 51
Pre-law 460 490 950 85*Earth & environ. sci. 452 486 938 64*"Other" social sci. 457 477 934 62
*Arch./Environ. engin. 426 500 926 56Communications 447 461 908 46
*General psychology 440 463 903 79*Computer science 405 479 884 47*Social psychology 428 .454 882 64Studio/performing arts 429 449 878 39Business 406 461 867 46Other health fields 407 452 859 63Education 407 442 849 47
*Agriculture 404 440 844 33*Sociology 411 432 843 50*Child psychology 408 434 842 73Vocational fields 387 433 820 30
*Law enforcement 380 410 790 37
This table shows the fields rank ordered from high to low by
the sum of the SAT Verbal and Mathematics score means.
Traditionally, when the two scores are added, the Verbal score is
given a double weight (referred to as 2V+M). We have weighted
them equally here because our primary interest is in major field
439
selection, and it is reasonable to assume that a student's choice
of major field depends on qu'antitative skills to at least as
great an extent as verbal skills.
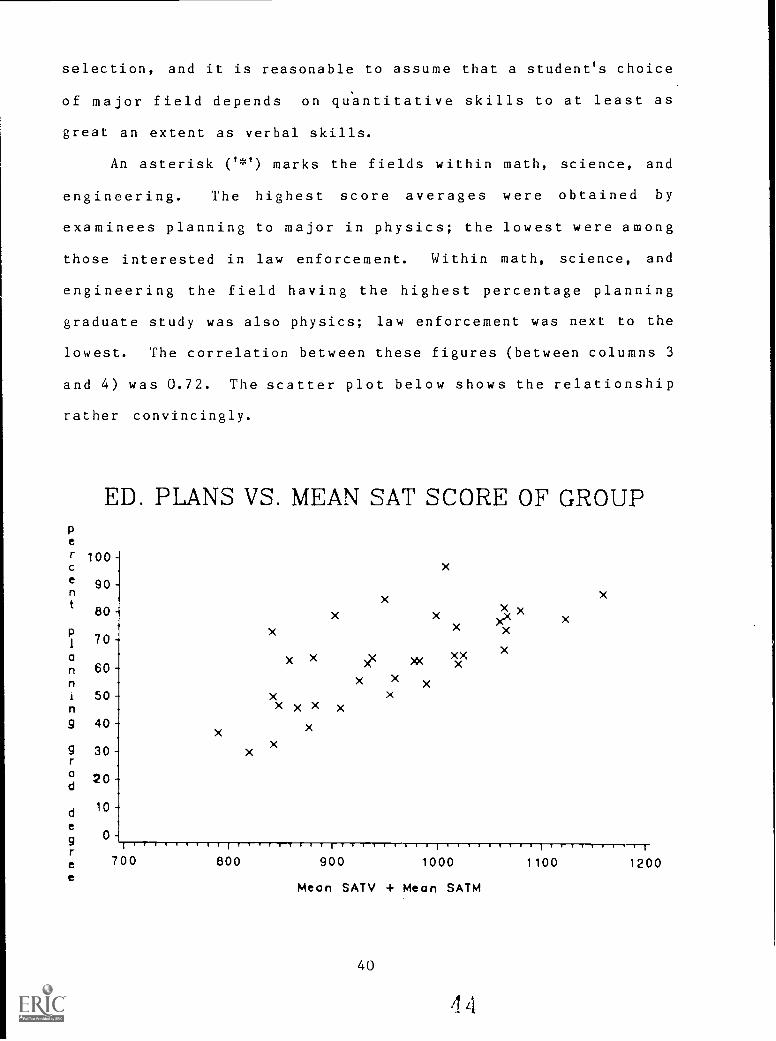
An asterisk ('*1) marks the fields within math, science, and
engineering. The highest score averages were obtained by
examinees planning to major in physics; the lowest were among
those interested in law enforcement. Within math, science, and
engineering the field having the highest percentage planning
graduate study was also physics; law enforcement was next to the
lowest. The correlation between these figures (between columns 3
and 4) was 0.72. The scatter plot below shows the relationship
rather convincingly.
ED. PLANS VS. MEAN SAT SCORE OF GROUPPerce
nt
p1
annin9
9r
d
de
9ree
100 -
90 -
80 -
70 -
60 -
50
40 -
30
20 -,
10 -
0
700
x
x
X
xX x
xx
X
X
x
x
x
1(x
x
Xx
x
xx
>IXXXx
X
)).("
X
xx
x
I IT
800
111,7900
1
10001
1100I
1200
Mean SATV + Mean SATM
40

These relationships suggest that the academic field of study
chosen by students depends to a great extent on their verbal and
mathematical skills as well as their ability and willingness to
pursue many years of formal education. One of the conclusions
implied by the data is that high school seniors do have some
understanding of the relative difficulty of the various major
fields and the amount of education demanded by them. Because
they complete the SDQ before taking the SAT, we know from these
data that students must have fairly accurate knowledge of their
own verbal and mathematical skills before they take the SAT and
are already making choices about their major field of study and
the amount of education they plan ultimately to obtain.
Otherwise, we would not expect to find such consistency among
test scores, educational plans, and major field choices.

REFERENCES
Beaton, A.E., Hilton, T.L. & Schrader, W.B. (1977). Changes in
the verbal abilities of high school seniors, college
entrants, and SAT candidates between 1960 and 1972.
New York: College Entrance Examination Board.
Clark, M. J. and Grandy, J. (1984). Sex differences in the
academic performance of Scholastic Aptitude Test takers.College Board Report No. 84-8. N.Y.: College Entrance
Examination Board.
Grandy, J. (1987). Ten-Year Trends in SAT Scores and Other
Characteristics of High School Seniors Taking the SAT and
Planning to Study Mathematics, Science, or Engineering.
ETS Research Report No. RR-87-49. Princeton, NJ:Educational Testing Service.
National Science Foundation (1983). Academic Science/Engineering:Graduate Enrollment and Support, Fall 1983. Surveys of
Science Resources Series, Detailed Statistical Tables.
Washington, D. C.: National Science Foundation.
Wainer, H. (1988). How accurately can we assess changes in
minority performance on the SAT? American Psychologist,43, 774-778.
42
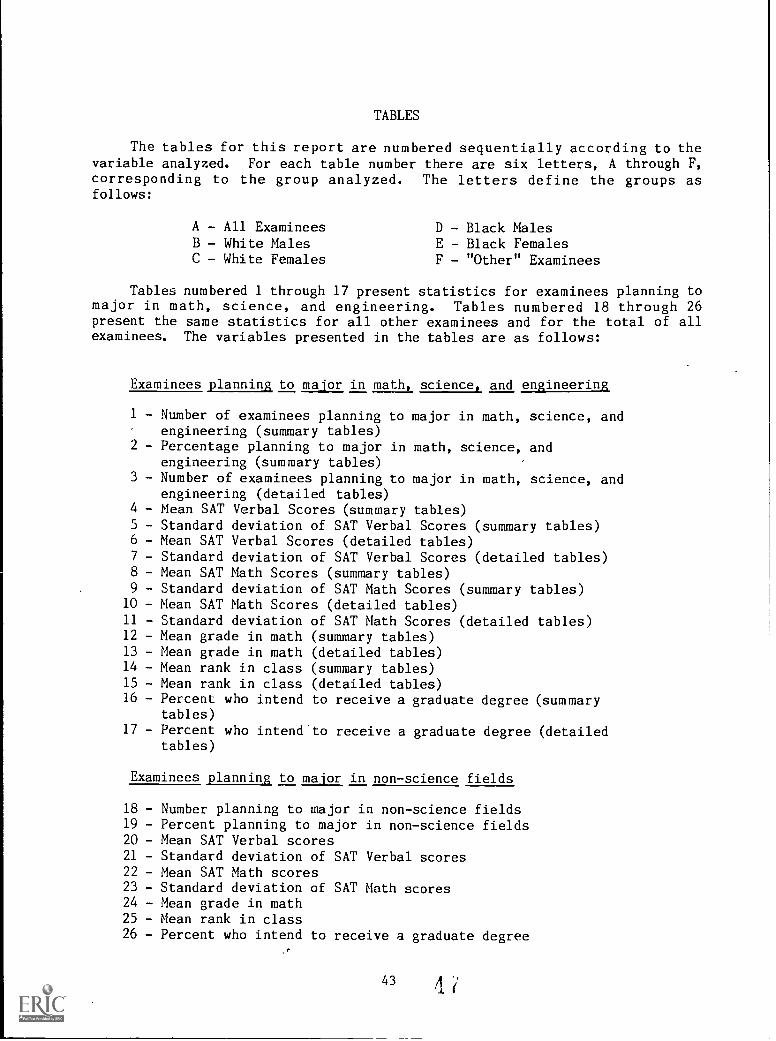
TABLES
The tables for this report are numbered sequentially according to thevariable analyzed. For each table number there are six letters, A through F,corresponding to the group analyzed. The letters define the groups asfollows:
A - All ExamineesB - White MalesC - White Females
D - Black MalesE - Black FemalesF - "Other" Examinees
Tables numbered 1 through 17 present statistics for examinees planning tomajor in math, science, and engineering. Tables numbered 18 through 26present the same statistics for all other examinees and for the total of allexaminees. The variables presented in the tables are as follows:
Examinees planning to major in math, science, and engineering
1 - Number of examinees planning to major in math, science, andengineering (summary tables)
2 - Percentage planning to major in math, science, andengineering (summary tables)
3 - Number of examinees planning to major in math, science, andengineering (detailed tables)
4 - Mean SAT Verbal Scores (summary tables)5 - Standard deviation of SAT Verbal Scores (summary tables)6 - Mean SAT Verbal Scores (detailed tables)7 - Standard deviation of SAT Verbal Scores (detailed tables)8 - Mean SAT Math Scores (summary tables)9 - Standard deviation of SAT Math Scores (summary tables)10 - Mean SAT Math Scores (detailed tables)11 - Standard deviation of SAT Math Scores (detailed tables)12 - Mean grade in math (summary tables)13 - Mean grade in math (detailed tables)14 - Mean rank in class (summary tables)15 - Mean rank in class (detailed tables)16 - Percent who intend to receive a graduate degree (summary
tables)17 - Percent who intend.to receive a graduate degree (detailed
tables)
Examinees planning to major in non-science fields
18 - Number planning to major in non-science fields19 - Percent planning to major in non-science fields20 - Mean SAT Verbal scores21 - Standard deviation of SAT Verbal scores22 - Mean SAT Math scores23 - Standard deviation of SAT Math scores24 - Mean grade in math25 - Mean rank in class26 - Percent who intend to receive a graduate degree
43 4
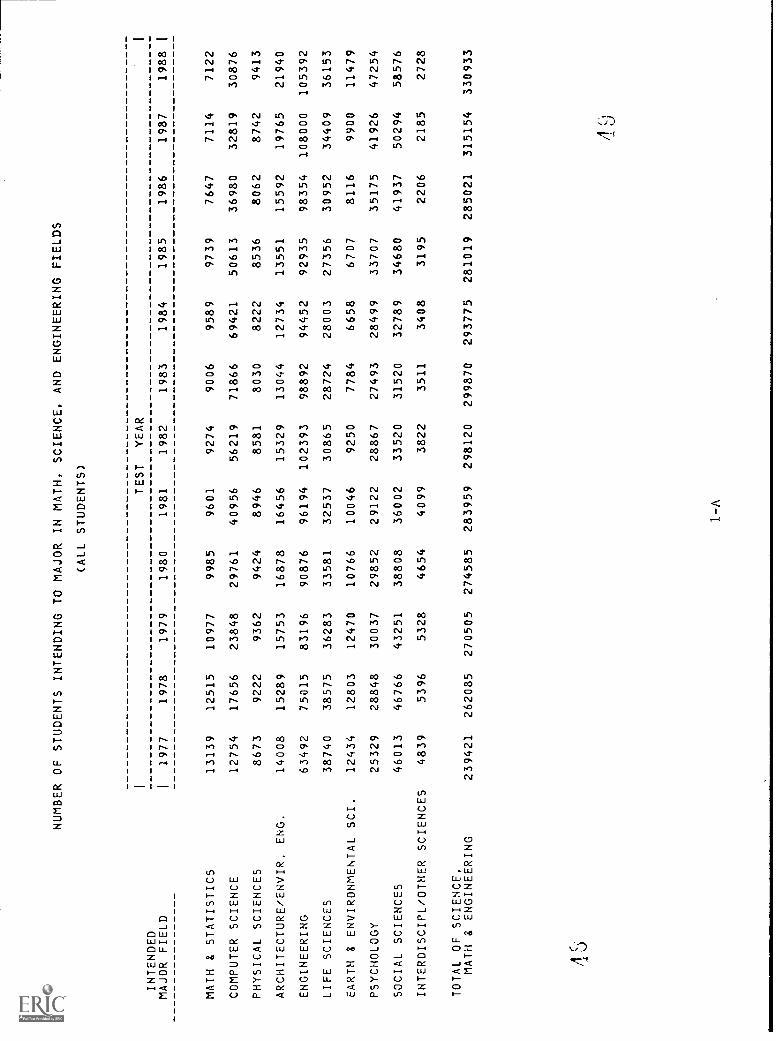
NUMBER OF STUDENTS INTENDING TO MAJOR IN MATH, SCIENCE, AND ENGINEERING FIELDS
(ALL STUDENTS)
INTENDED
TEST
YEAR
MAJOR FIELD
I1977
1978
1979
1980
1981
1982
1983
1984
1985
1986
1987
1988
MATH & STATISTICS
13139
12515
10977
9985
9601
9274
9006
9589
9739
7647
7114
7122
COMPUTER SCIENCE
12754
17656
23848
29761
40956
56219
71866
69421
50613
36980
32819
30876
PHYSICAL SCIENCES
8673
9222
9362
9424
8946
8581
8030
8222
8536
8062
8742
9413
ARCHITECTURE/ENVIR. ENG.
14008
15289
15753
16878
16456
15329
13044
12734
13551
15592
19765
21940
ENGINEERING
63492
75015
83196
90876
96194
102393
98892
94452
92935
98354
108000
105392
LIFE SCIENCES
38740
38575
36283
33581
32537
30865
28724
28003
27356
30952
34409
36153
EARTH & ENVIRONMENTAL SCI
12434
12803
12470
10766
10046
9250
7784
6658
6707
8116
9900
11479
PSYCHOLOGY
25329
28848
30037
29852
29122
28867
27493
28499
33707
35175
41926
47254
SOCIAL SCIENCES
46013
46766
43251
38808
36002
33520
31520
32789
34680
41937
50294
58576
INTERDISCIPL/OTHER SCIENCES
4839
5396
5328
4654
4099
3822
3511
3408
3195
2206
2185
2728
TOTAL OF SCIENCE,
MATH & ENGINEERING
239421
262085
270505
274585
283959
298120
299870
293775
281019
285021
315154
330933
1lb
I
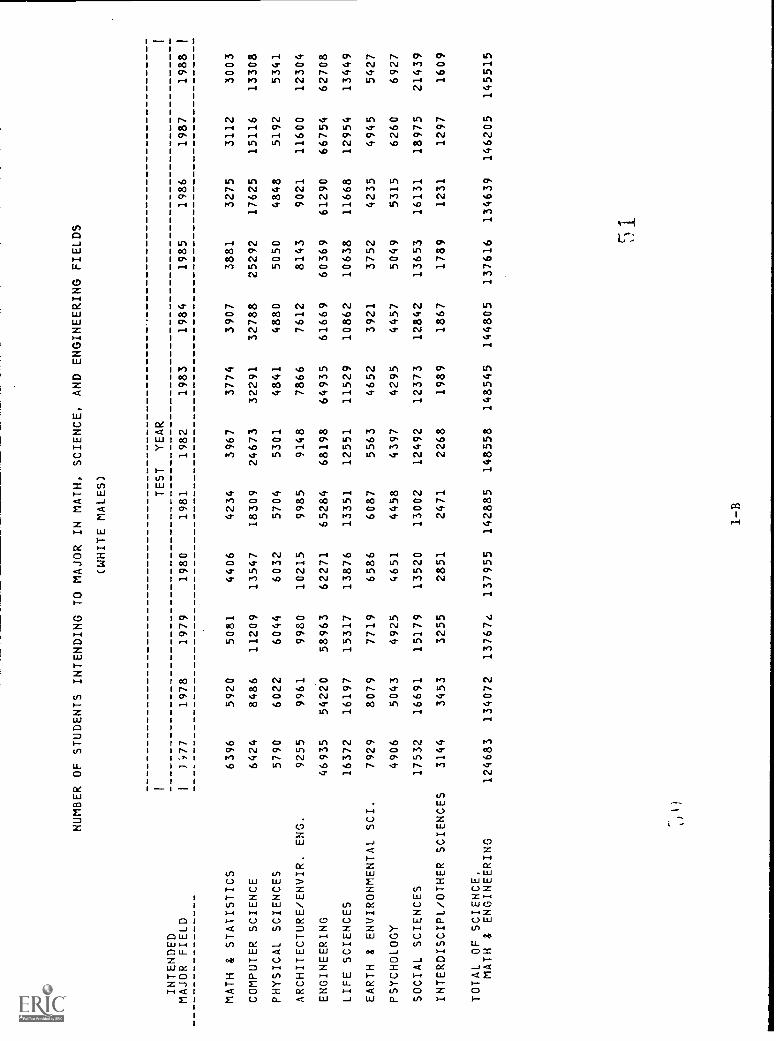
NUMBER OF STUDENTS INTENDING
I
INTENDED
TO MAJOR IN MATH, SCIENCE, AND ENGINEERING FIELDS
(WHITE MALES)
TEST
YEAR
I
MAJOR FIELD
IJt77
1978
1979
1980
1981
1982
1983
1984
1985
1986
1987
1988
I
MATH & STATISTICS
6396
5920
5081
4406
4234
3967
3774
3907
3881
3275
3112
3003
COMPUTER SCIENCE
6424
8486
11209
13547
18309
24673
32291
32788
25292
17625
15116
13308
PHYSICAL SCIENCES
5790
6022
6044
6032
5704
5301
4841
4880
5050
4848
5192
5341
ARCHITECTURE/ENVIR. ENG.
9255
9961
9980
10215
9985
9148
7866
7612
8143
9021
11600
12304
ENGINEERING
46935
54220
58963
62271
65284
68198
64935
61669
60369
61290
66754
62708
LIFE SCIENCES
16372
16197
15317
13876
13351
12551
11529
10862
10638
11668
12954
13449
EARTH & ENVIRONMENTAL SCI.
7929
8079
7719
6586
6087
5563
4652
3921
3752
4235
4945
5427
PSYCHOLOGY
4906
5043
4925
4651
4458
4397
4295
4457
5049
5315
6260
6927
SOCIAL SCIENCES
17532
16691
15179
13520
13002
12492
12373
12842
13653
16131
18975
21439
INTERDISCIPL/OTHER SCIENCES
3144
3453
3255
2851
2471
2268
1989
1867
1789
1231
1297
1609
TOTAL OF SCIENCE,
MATH & ENGINEERING
124683
134072
137674
137955
142885
148558
148545
144805
137616
134639
146205
145515
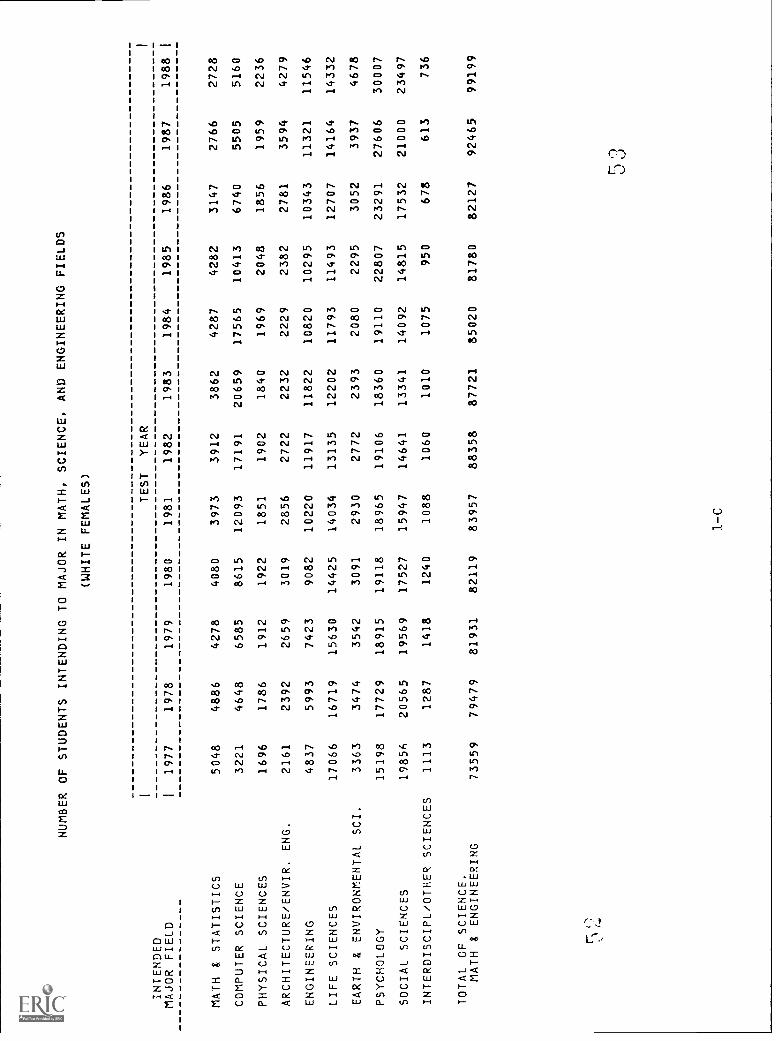
NUMBER OF STUDENTS INTENDING TO MAJOR IN MATH, SCIENCE, AND ENGINEERING FIELDS
INTENDED
(WHITE FEMALES)
TEST
YEAR
MAJOR FIELD
11977
1978
1979
1980
1981
1982
1983
1984
1985
1986
1987
1988
MATH & STATISTICS
5048
4886
4278
4080
3973
3912
3862
4287
4282
3147
2766
2728
COMPUTER SCIENCE
3221
4648
6585
8615
12093
17191
20659
17565
10413
6740
5505
5160
PHYSICAL SCIENCES
1696
1786
1912
1922
1851
1902
1840
1969
2048
1856
1959
2236
ARCHITECTURE/ENVIR. ENG.
2161
2392
2659
3019
2856
2722
2232
2229
2382
2781
3594
4279
ENGINEERING
4837
5993
7423
9082
10220
11917
11822
10820
10295
10343
11321
11546
LIFE SCIENCES
17066
16719
15630
14425
14034
13135
12202
11793
11493
12707
14164
14332
EARTH & ENVIRONMENTAL SCI.
3363
3474
3542
3091
2930
2772
2393
2080
2295
3052
3937
4678
PSYCHOLOGY
15198
17729
18915
19118
18965
19106
18360
19110
22807
23291
27606
30007
SOCIAL SCIENCES
19856
20565
19569
17527
15947
14641
13341
14092
14815
17532
21000
23497
INTERDISCIPL/OTHER SCIENCES
1113
1287
1418
1240
1088
1060
1010
1075
950
678
613
736
TOTAL CF SCIENCE.
MATH & ENGINEERING
73559
79479
81931
82119
83957
88358
87721
85020
81780
82127
92465
99199
4)
1
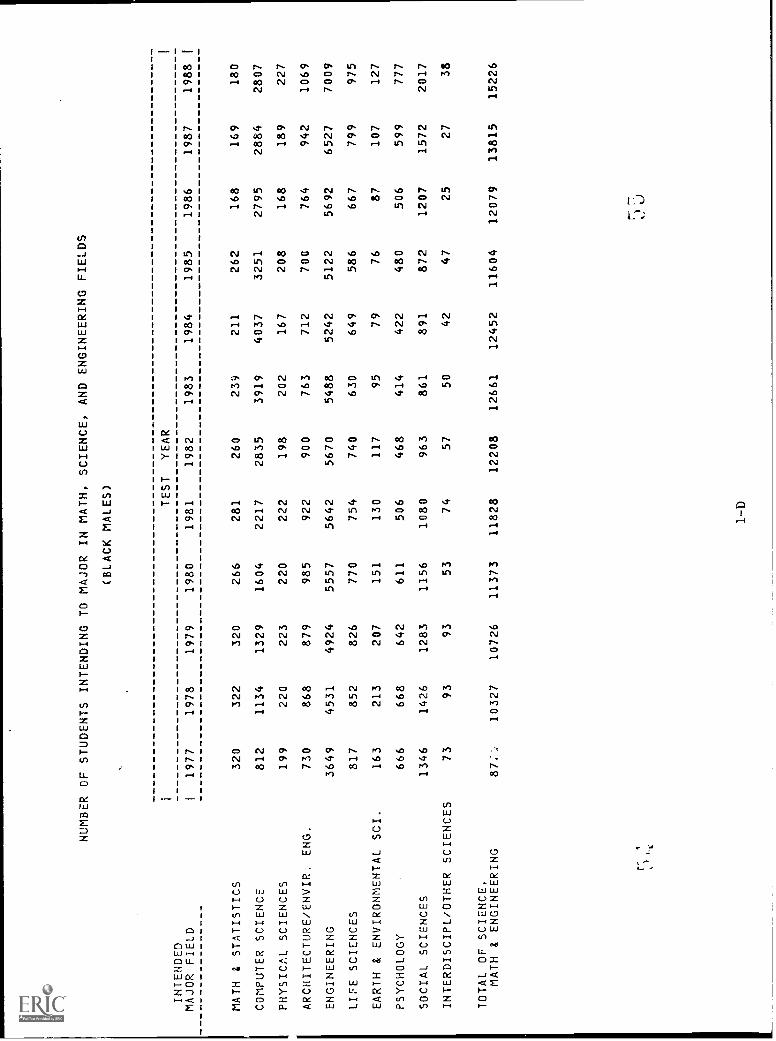
NUMBER 1
INTENDED
OF STUDENTS INTENDING TO MAJOR IN MATH,
(BLACK MALES)
TEST
SCIENCE,
YEAR
AND ENGINEERING
FIELDS
MAJOR FIELD
I1977
1978
1979
1980
1981
1982
1983
1984
1985
1986
1987
1988
MATH & STATISTICS
320
322
320
266
281
260
239
211
262
168
169
180
COMPUTER SCIENCE
812
1134
1329
1604
2217
2835
3919
4037
3251
2795
2884
2807
PHYSICAL SCIENCES
199
220
223
220
222
198
202
167
208
168
189
227
ARCHITECTURE/ENVIR. ENG.
730
868
879
985
922
900
763
712
700
764
942
1069
ENGINEERING
3649
4531
4924
5557
5642
5670
5488
5242
5122
5692
6527
7009
LIFE SCIENCES
817
852
826
770
754
740
630
649
586
667
799
975
EARTH & ENVIRONMENTAL SCI.
163
213
207
151
117
95
79
76
87
107
127
PSYCHOLOGY
666
668
642
611
506
468
414
422
480
506
599
777
SOCIAL SCIENCES
1346
1426
1283
1156
1080
963
861
891
872
1207
1572
2017
INTERDISCIPL/OTHER SCIENCES
73
93
93
53
74
57
50
42
47
25
27
38
TOTAL OF SCIENCE.
MATH & ENGINEERING
37,
10327
10726
11373
11828
12208
12661
12452
11604
12079
13815
15226
r
I
NUMBER OF STUDENTS INTENDING TO MAJOR IN MATH, SCIENCE, AND
ENGINEERING FIELDS
(BLACK FEMALES)
TEST
YEAR
INTENDED
MAJOR FIELD
I1977
1978
1979
1980
1981
1982
1983
1984
1985
1986
1987
1988
MATH & STATISTICS
404
385
343
321
263
258
234
268
320
215
216
216
COMPUTER SCIENCE
750
1112
1449
1896
2760
3678
4964
4890
3637
3360
3284
3411
PHYSICAL SCIENCES
138
180
162
174
151
158
161
184
165
130
146
202
ARCHITECTURE/ENVIR. ENG.
214
269
302
339
339
323
224
236
247
261
333
409
ENGINEERING
750
1010
1289
1655
1791
2074
1992
1958
1841
2306
2613
2817
LIFE SCIENCES
914
947
866
915
912
890
848
945
878
1134
1166
1288
EARTH & ENVIRONMENTAL SCI.
58
87
73
68
79
69
53
44
47
46
66
113
PSYCHOLOGY
2182
2619
2655
2589
2321
2050
1701
1711
1972
2150
2741
3514
SOCIAL SCIENCES
2749
3106
2804
2474
2132
1824
1480
1437
1542
2198
2747
3432
INTERDISCIPL/OTHER SCIENCES
57
76
49
69
51
51
45
40
49
29
20
28
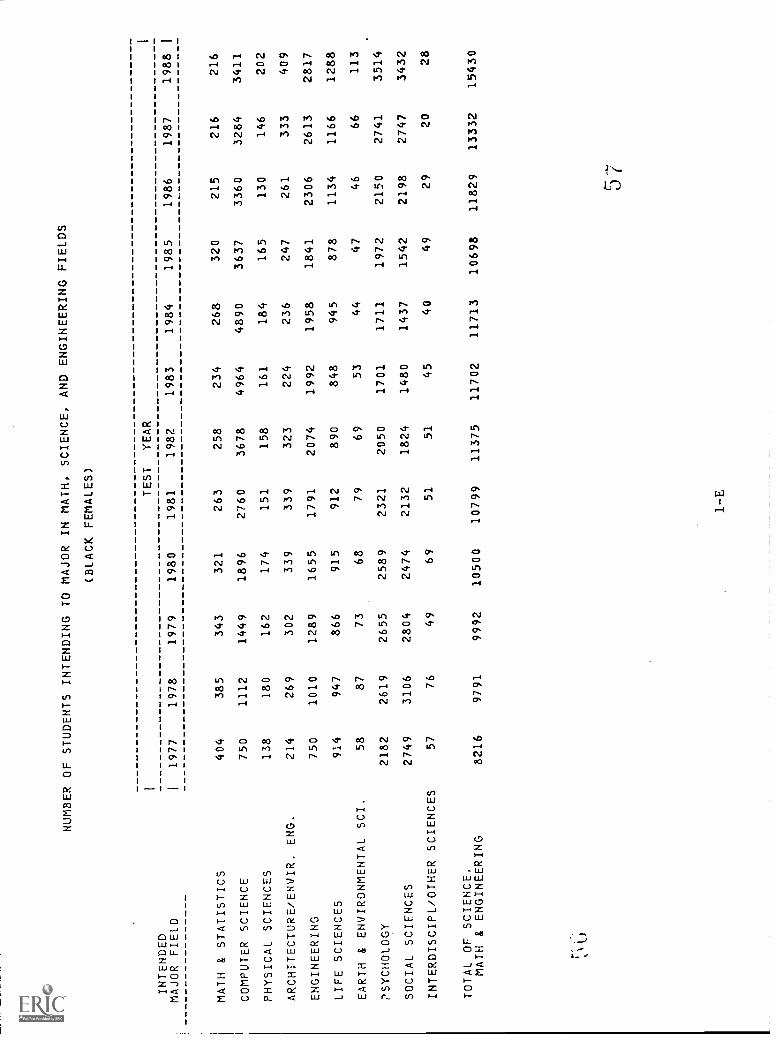
TOTAL OF SCIENCE,
MATH & ENGINEERING
8216
9791
9992
10500
10799
11375
11702
11713
10698
11829
13332
15430
I

NUMBER OF STUDENTS INTENDING TO MAJOR IN MATH, SCIENCE, AND
ENGINEERING FIELDS
(OTHER STUDENTS)
INTENDED
TEST
YEAR
MAJOR FIELD
I1977
1978
1979
1980
1981
1982
1983
1984
1985
1986
1987
1988
MAIN & STATISTICS
971
1002
955
912
850
877
897
916
994
842
851
995
COMPUTER SCIENCE
1547
2276
3276
4099
5577
7842
10033
10141
8020
6460
6030
6190
PHYSICAL SCIENCES
850
1014
1021
1076
1018
1022
986
1022
1065
1060
1256
1407
ARCHITECTURE/ENVIR. ENG.
1648
1799
1933
2320
2354
2236
1959
1945
2079
2765
3296
3879
ENGINEERING
7321
9261
10597
12311
13257
14534
14655
14763
15308
18723
20785
21312
LIFE SCIENCES
3571
3860
3644
3595
3486
3549
3515
3754
3761
4776
5326
6109
EARTH & iNVIRONMENTAL SCI.
921
950
929
870
820
729
591
534
537
696
845
1134
PSYCHOLOGY
2377
2789
2900
2883
2872
2846
2723
2799
3399
3913
4720
6029
SOCIAL SCIENCES
4530
4978
4416
4131
3841
3600
3465
3527
3798
4869
6000
8191
INTERDISCIPL/OTHER SCIENCES
452
487
513
441
415
386
417
384
360
243
228
317
TOTAL OF SCIENCE,
MATH & ENGINEERING
24188
28416
30184
32638
34490
37621
39241
39785
39321
44347
49337
55563
r
I

PERCENT OF STUDENTS INTENDING TO MAJOR IN MATH, SCIENCE, AND ENGINEERING FIELDS
(ALL STUDENTS)
INTENDED
TEST
YEAR
MAJOR FIELD
I1977
1978
1979
1980
1981
1982
1983
1984
1985
1986
1987
1988
MATH & STATISTICS
1.34
1.27
1.11
1.01
0.97
0.94
0.94
0.99
1.00
0.76
0.66
0.63
COMPUTER SCIENCE
1.30
1.79
2.41
3.00
4.12
5.69
7.47
7.20
5.18
3.70
3.04
2.72
PHYSICAL SCIENCES
0.89
0.93
0.94
0.95
0.90
0.67
0.83
0.85
0.87
0.81
0.81
0.83
ARCHITECTURE/ENVIR. ENG.
1.43
1.55
1.59
1.70
1.66
1.55
1.36
1.32
1.39
1.56
1.83
1.93
ENGINEERING
6.48
7.59
8.39
9.17
9.68
10.37
10.28
9.79
9.51
9.83
10.00
9.29
LIFE SCIENCES
3.96
3.90
3.66
3.39
3.28
3.13
2.99
2.90
2.80
3.09
3.18
3.19
EARTH & ENVIRONMENTAL SCI.
1.27
1.29
1.26
1.09
1.01
0.94
0.81
0.69
0.69
0.81
0.92
1.01
PSYCHOLOGY
2.59
2.92
3.03
3.01
2.93
2.92
2.0f.,
2.95
3.45
3.51
3.88
4.17
SOCIAL SCIENCES
4.70
4.73
4.36
3.92
3.62
3.39
3.28
3.40
3.55
4.19
4.66
5.16
INTERDISCIPL/OTHER SCIENCES
0.49
0.55
0.54
0.47
0.41
0.39
0.36
0.35
0.33
0.22
0.20
0.24
TOTAL OF SCIENCE,
MATH & ENGINEERING
24.45
26.50
27.29
27.71
28.58
30.19
31.16
30.46
28.75
28.48
29.17
29.17
PERCENTS ARE BASED
ON A TOTAL N OF:
979273
988927
991257
990787
993385
987449
962210
964550
977357
1000747
1080426
1134364
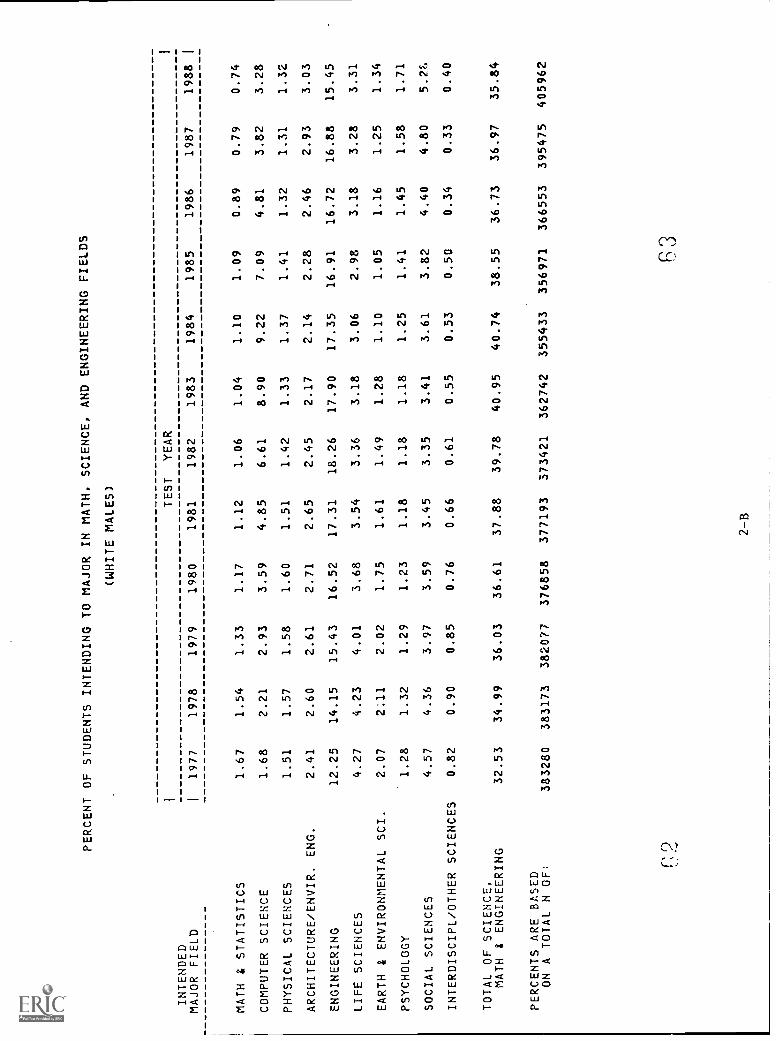
PERCENT OF STUDENTS INTENDING TO MAJOR IN MATH, SCIENCE,
AND ENGINEERING FIELDS
(WHITE MALES)
I
TEST
YEAR
INTENDED
i
MAJOR FIELD
I1977
1978
1979
1980
1981
1982
1983
1984
1985
1986
1987
1988
i
MATH & STATISTICS
1.67
1.54
1.33
1.17
1.12
1.06
1.04
1.10
1.09
0.89
0.79
0.74
COMPUTER SCIENCE
1.68
2.21
2.93
3.59
4.85
6.61
8.90
9.22
7.09
4.81
3.82
3.28
PHYSICAL SCIENCES
1.51
1.57
1.58
1.60
1.51
1.42
1.33
1.37
1.41
1.32
1.31
1.32
ARCHITECTURE/ENVIR. ENG.
2.41
2.60
2.61
2.71
2.65
2.45
2.17
2.14
2.28
2.46
2.93
3.03
ENGINEERING
12.25
14.15
15.43
16.52
17.31
18.26
17.90
17.35
16.91
16.72
16.88
15.45
LIFE SCIENCES
4.27
4.23
4.01
3.68
3.54
3.36
3.18
3.06
2.98
3.18
3.28
3.31
EARTH & ENVIRONMENTAL SCI.
2.07
2:11
2.02
1.75
1.61
1.49
1.28
1.10
1.05
1.16
1.25
1.34
PSYCHOLOGY
1.28
1.32
1.29
1.23
1.18
1.18
1.18
1.25
1.41
1.45
1.58
1.71
SOCIAL SCIENCES
4.57
4.36
3.97
3.59
3.45
3.35
3.41
3.61
3.82
4.40
4.80
5.2f,
INTERDISCIPL/OTHER SCIENCES
0.82
0.90
0.85
0.76
0.66
0.61
0.55
0.53
0.50
0.34
0.33
0.40
TOTAL OF SCIENCE,
MATH & ENGINEERING
32.53
34.99
36.03
36.61
37.88
39.78
40.95
40.74
38.55
36.73
36.97
35.84
PERCENTS ARE BASED
ON A TOTAL N OF:
383280
383173
382077
376858
377193
373421
362742
355433
356971
366553
395475
405962
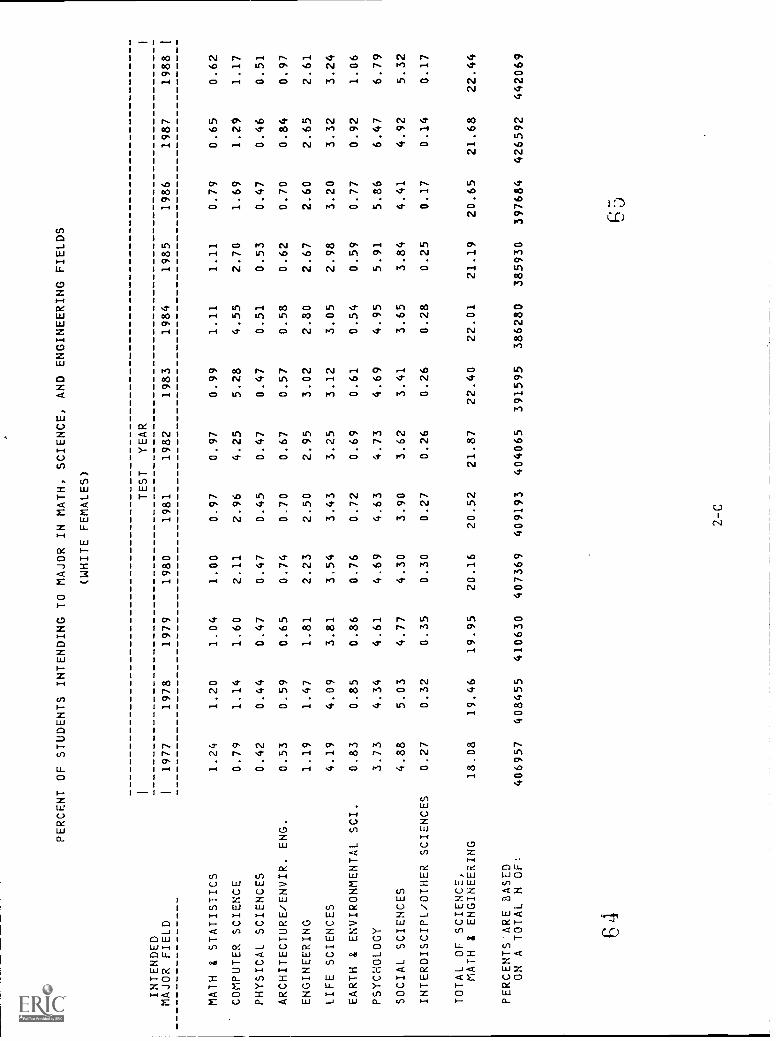
PERCENT OF STUDENTS INTENDING TO MAJOR IN MATH, SCIENCE, AND ENGINEERING FIELDS
(WHITE FEMALES)
TEST
YEAR
INTENDED
1
MAJOR FIELD
I1977
1978
1979
1980
1981
1982
1983
1984
1985
1986
1987
1988
1
MATH & STATISTICS
1.24
1.20
1.04
1.00
0.97
0.97
0.99
1.11
1.11
0.79
0.65
0.62
COMPUTER SCIENCE
0.79
1.14
1.60
2.11
2.96
4.25
5.28
4.55
2.70
1.69
1.29
1.17
PHYSICAL SCIENCES
0.42
0.44
0.47
0.47
0.45
0.47
0.47
0.51
0.53
0.47
0.46
0.51
ARCHITECTURE/ENVIR. ENG.
0.53
0.59
0.65
0.74
0.70
0.67
0.57
0.58
0.62
0.70
0.84
0.97
ENGINEERING
1.19
1.47
1.81
2.23
2.50
2.95
3.02
2.80
2.67
2.60
2.65
2.61
LIFE SCIENCES
4.19
4.09
3.81
3.54
3.43
3.25
3.12
3.05
2.98
3.20
3.32
3.24
EARTH & ENVIRONMENTAL SCI.
0.83
0.85
0.86
0.76
0.72
0.69
0.61
0.54
0.59
0.77
0.92
1.06
PSYCHOLOGY
3.73
4.34
4.61
4.69
4.63
4.73
4.69
4.95
5.91
5.86
6.47
6.79
SOCIAL SCIENCES
4.88
5.03
4.77
4.30
3.90
3.62
3.41
3.65
3.84
4.41
4.92
5.32
INTERDISCIPL/OTHER SCIENCES
0.27
0.32
0.35
0.30
0.27
0.26
0.26
0.28
0.25
0.17
0.14
0.17
TOTAL OF SCIENCE,
MATH & ENGINEERING
18.08
19.46
19.95
20.16
20.52
21.87
22.40
22.01
21.19
20.65
21.68
22.44
PERCENTS ARE BASED
ON A TOTAL N OF:
406957
408455
410630
407369
409193
404065
391595
386280
385930
397684
426592
442069
E4
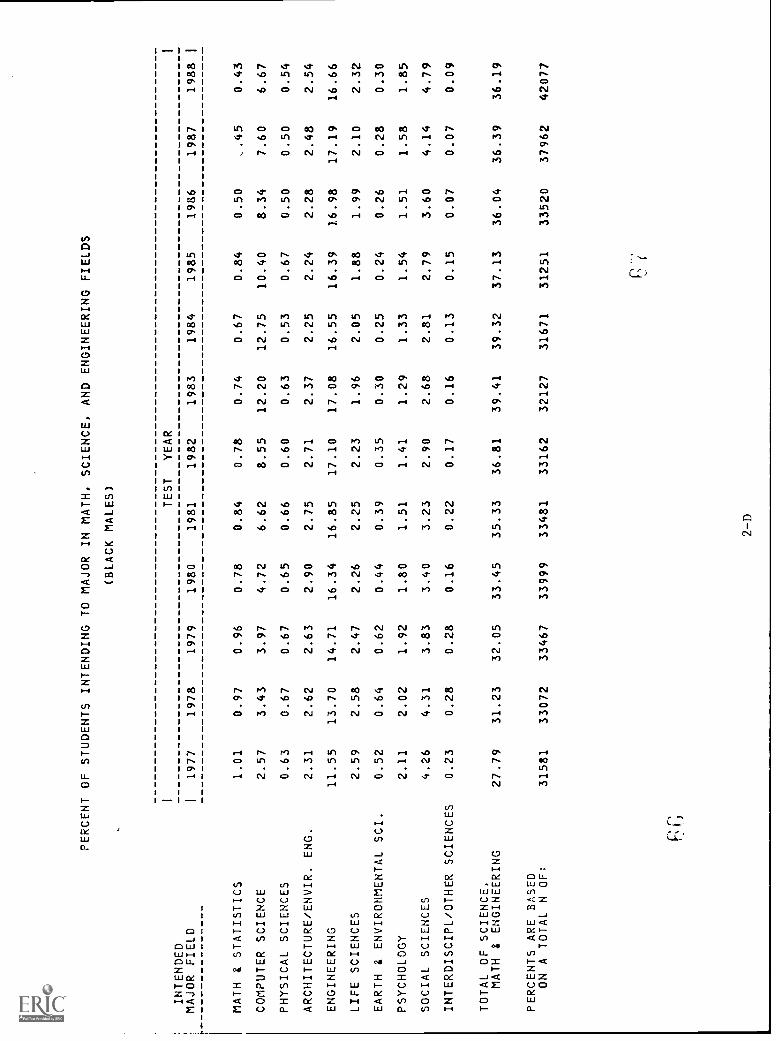
PERCENT OF STUDENTS INTENDING TO MAJOR IN MATH,
(BLACK MALES)
ITEST
INTENDED
SCIENCE,
YEAR
AND ENGINEERING FIELDS
I
MAJOR FIELD
I1977
1978
1979
1980
1981
1982
1983
1984
1985
1986
1987
1988
I
MATH & STATISTICS
1.01
0.97
0.96
0.78
0.84
0.78
0.74
0.67
0.84
0.50
,.45
0.43
COMPUTER SCIENCE
2.57
3.43
3.97
4.72
6.62
8.55
12.20
12.75
10.40
8.34
7.60
6.67
PHYSICAL SCIENCES
0.63
0.67
0.67
0.65
0.66
0.60
0.63
0.53
0.67
0.50
0.50
0.54
ARCHITECTURE/ENVIR. ENG.
2.31
2.62
2.63
2.90
2.75
2.71
2.37
2.25
2.24
2.28
2.48
2.54
ENGINEERING
11.55
13.70
14.71
16.34
16.85
17.10
17.08
16.55
16.39
16.98
17.19
16.66
LIFE SCIENCES
2.59
2.58
2.47
2.26
2.25
2.23
1.96
2.05
1.88
1.99
2.10
2.32
EARTH & ENVIRONMENTAL SCI.
0.52
0.64
0.62
0.44
0.39
0.35
0.30
0.25
0.24
0.26
0.28
0.30
PSYCHOLOGY
2.11
2.02
1.92
1.80
1.51
1.41
1.29
1.33
1.54
1.51
1.58
1.85
SOCIAL SCIENCES
4.26
4.31
3.83
3.40
3.23
2.90
2.68
2.81
2.79
3.60
4.14
4.79
INTERDISCIPL/OTHER SCIENCES
0.23
0.28
0.28
0.16
0.22
0.17
0.16
0.13
0.15
0.07
0.07
0.09
TOTAL OF SCIENCE,
MATH & ENGINEERING
27.79
31.23
32.05
33.45
35.33
36.81
39.41
39.32
37.13
36.04
36.39
36.19
PERCENTS ARE BASED
ON A TOTAL N OF:
31581
33072
33467
33999
33481
33162
32127
31671
31251
33520
37962
42077

INTENDED
PERCENT OF STUDENTS INTENDING TO MAJOR IN MATH, SCIENCE, AND ENGINEERING FIELDS
(BLACK FEMALES)
TEST
YEAR
MAJOR FIELD
I1977
1978
1979
1980
1981
1982
1983
1984
1985
1986
1987
1988
MATH & STATISTICS
0.84
0.78
0.69
0.63
0.52
0.52
0.48
0.56
0.67
0.44
0.40
0.36
COMPUTER SCIENCE
1.57
2.25
2.90
3.71
5.47
7.44
10.28
10.23
7.66
6.82
6.07
5.68
PHYSICAL SCIENCES
0.29
0.36
0.32
0.34
0.30
0.32
0.33
0.39
0.35
0.26
0.27
0.34
ARCHITECTURE/ENVIR. ENG.
0.45
0.54
0.60
0.66
0.67
0.65
0.46
0.49
0.52
0.53
0.62
0.68
ENGINEERING
1.57
2.04
2.58
3.24
3.55
4.20
4.12
4.10
3.87
4.68
4.83
4.69
LIFE SCIENCES
1.91
1.91
1.73
1.79
1.81
1.80
1.76
1.98
1.85
2.30
2.15
2.15
EARTH & ENVIRONMENTAL SCI.
0.12
0.18
0.15
0.13
0.16
0.14
0.11
0.09
0.10
0.09
0.12
0.19
PSYCHOLOGY
4.56
5.29
5.30
5.06
4.60
4.15
3.52
3.58
4.15
4.36
5.06
5.85
SOCIAL SCIENCES
5.74
6.28
5.60
4.84
4.22
3.69
3.06
3.01
3.25
4.46
5.07
5.72
INTERDISCIPL/OTHER SCIENCES
0.12
0.15
0.10
0.13
0.10
0.10
0.09
0.08
0.10
0.06
0.04
0.05
TOTAL OF SCIENCE,
MATH & ENGINEERING
17.15
19.79
19.96
20.54
21.39
23.02
24.23
24.52
22.52
24.00
24.62
25.70
PERCENTS ARE BASED
ON A TOTAL N OF:
47900
49481
50049
51128
50494
49409
48294
47778
47511
49283
54145
60033
69
I
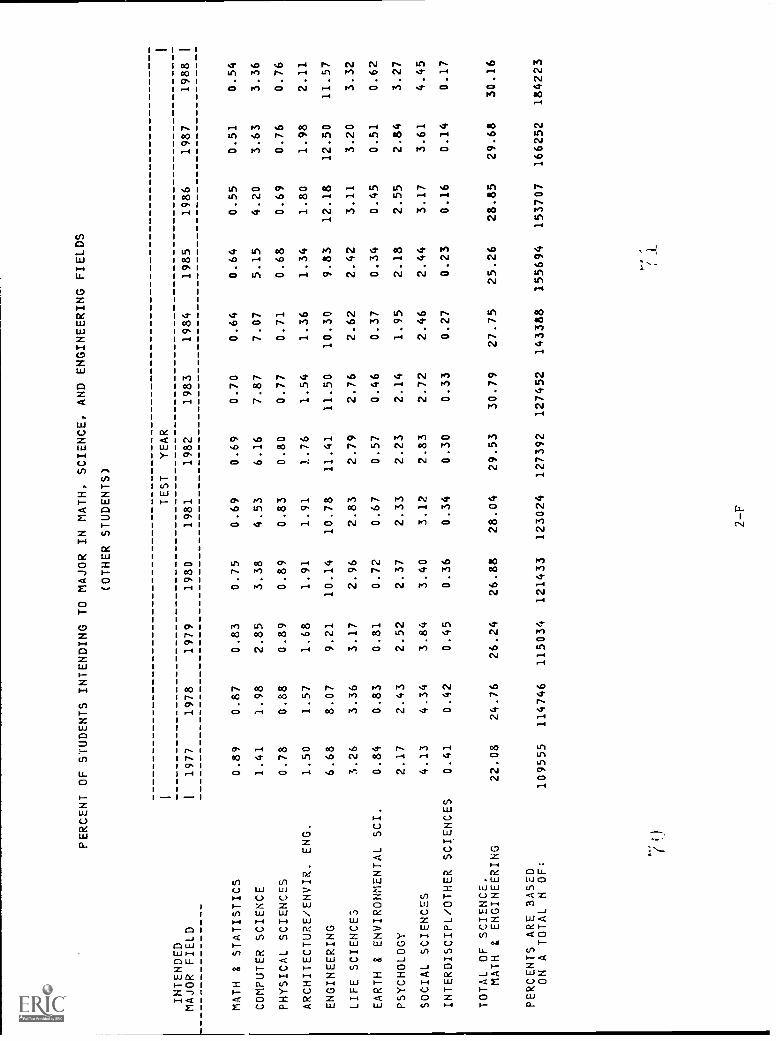
PERCENT OF STUDENTS INTENDING TO MAJOR IN MATH, SCIENCE,
(OTHER STUDENTS)
1
TEST
YEAR
INTENDED
AND ENGINEERING FIELDS
1
MAJOR FIELD
I1977
1978
1979
1980
1981
1982
1983
1984
1985
1986
1987
1988
1
MATH & STATISTICS
0.89
0.87
0.83
0.75
0.69
0.69
0.70
0.64
0.64
0.55
0.51
0.54
COMPUTER SCIENCE
1.41
1.98
2.85
3.38
4.53
6.16
7.87
7.07
5.15
4.20
3.63
3.36
PHYSICAL SCIENCES
0.78
0.88
0.89
0.89
0.83
0.80
0.77
0.71
0.68
0.69
0.76
0.76
ARCHITECTURE/ENVIR. ENG.
1.50
1.57
1.68
1.91
1.91
1.76
1.54
1.36
1.34
1.80
1.98
2.11
ENGINEERING
6.68
8.07
9.21
10.14
10.78
11.41
11.50
10.30
9.83
12.18
12.50
11.57
LIFE 5CIENCE3
3.26
3.36
3.17
2.96
2.83
2.79
2.76
2.62
2.42
3.11
3.20
3.32
EARTH & ENVIRONMENTAL SCI.
0.84
0.83
0.81
0.72
0.67
0.57
0.46
0.37
0.34
0.45
0.51
0.62
PSYCHOLOGY
2.17
2.43
2.52
2.37
2.33
2.23
2.14
1.95
2.18
2.55
2.84
3.27
SOCIAL SCIENCES
4.13
4.34
3.84
3.40
3.12
2.83
2.72
2.46
2.44
3.17
3.61
4.45
INTERDISCIPL/OTHER SCIENCES
0.41
0.42
0.45
0.36
0.34
0.30
0.33
0.27
0.23
0.16
0.14
0.17
TOTAL OF SCIENCE.
MATH & ENGINEERING
22.08
24.76
26.24
26.88
28.04
29.53
30.79
27.75
25.26
28.85
29.68
30.16
PERCENTS ARE BASED
ON A TOTAL N OF:
109555
114746
115034
121433
123024
127392
127452
143388
155694
153707
166252
184223
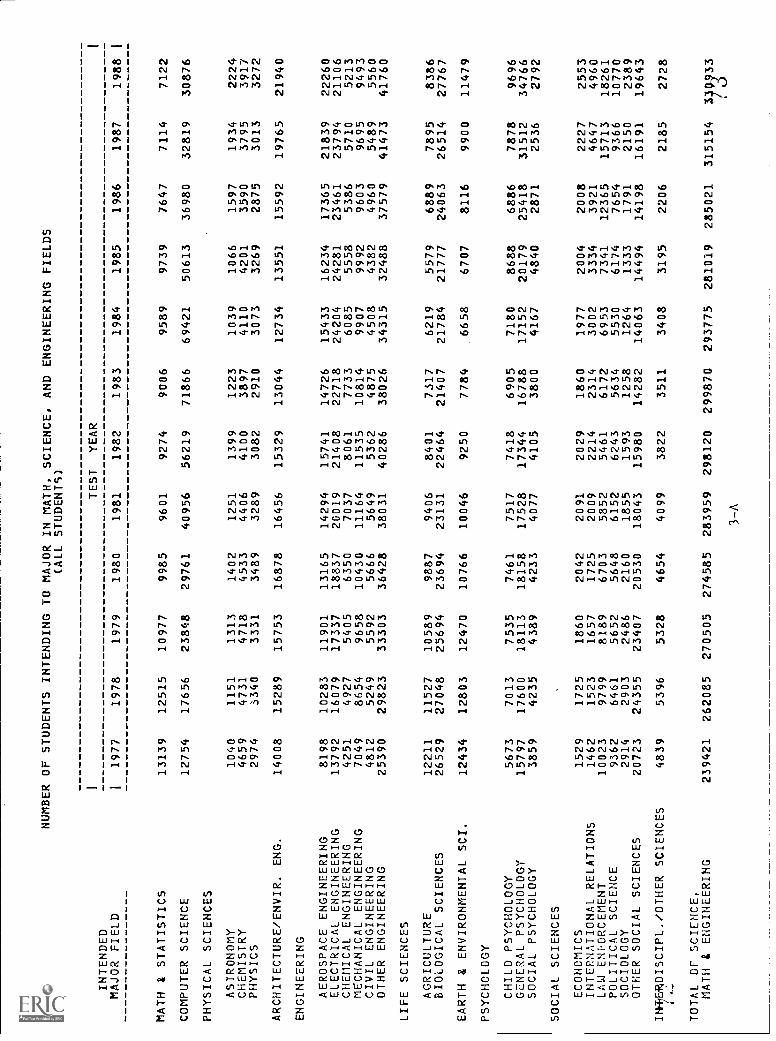
NUMBER OF STUDENTS INTENDING TO MAJOR IN MATH, SCIENCE, AND ENGINEERING FIELDS
(ALL STUDENTS)
ITEST
YEAR
INTENDED
1
MAJOR FIELD
1977
1978
1979
1980
1981
1982
1983
1984
1985
1986
1987
1988
1
MATH & STATISTICS
13139
12515
10977
9985
9601
9274
9006
9589
9739
7647
7114
7122
COMPUTER SCIENCE
12754
17656
23848
29761
40956
56219
71866
69421
50613
36980
32819
30876
PHYSICAL SCIENCES
ASTRONOMY
1040
1151
1313
1402
1251
1399
1223
1039
1066
1597
1934
2224
CHEMISTRY
4659
4731
4718
4533
4406
4100
3897
4110
4201
3590
3795
3917
PHYSICS
2974
3340
3331
3489
3289
3082
2910
3073
3269
2875
3013
3272
ARCHITECTURE/ENVIR. ENG.
14008
15289
15753
16878
16456
15329
13044
12734
13551
15592
19765
21940
ENGINEERING
AEROSPACE ENGINEERING
8198
10283
11901
13165
14294
15741
14726
15433
16234
17365
21839
22260
ELECTRICAL ENGINEERING
13792
16079
17337
18837
20019
21408
22718
24204
24281
23461
23794
21106
CHEMICAL ENGINEERING
4251
4927
5405
6350
7037
8061
7733
6085
5558
5386
5710
5213
MECHANICAL ENGINEERING
7049
8654
9658
10430
11164
11535
10814
9907
9992
9603
9695
9493
CIVIL ENGINEERING
4812
5249
5592
5666
5649
5362
4875
4508
4382
4960
5489
5560
OTHER ENGINEERING
25390
29823
33303
36428
38031
40286
38026
34315
32488
37579
41473
41760
LIFE SCIENCES
AGRICULTURE
12211
11527
10589
9887
9406
8401
7317
6219
5579
6889
7895
8386
BIOLOGICAL SCIENCES
26529
27048
25694
23694
23131
22464
21407
21784
21777
24063
26514
27767
EARTH & ENVIRONMENTAL SCI.
12434
12803
12470
10766
10046
9250
7784
6658
6707
8116
9900
11479
PSYCHOLOGY
CHILD PSYCHOLOGY
5673
7013
7535
7461
7517
7418
6905
7180
8688
6886
7878
9696
GENERAL PSYCHOLOGY
15797
17600
18113
18158
17528
17344
16788
17152
20179
25418
31512
34766
SOCIAL PSYCHOLOGY
3859
4235
4389
4233
4077
4105
3800
4167
4840
2871
2536
2792
SOCIAL SCIENCES
ECONOMICS
1529
1725
1860
2042
2091
2029
1860
1977
2004
2008
2227
2553
INTERNATIONAL RELATIONS
1462
1523
1657
1725
2009
2214
2314
3002
3334
3921
4647
4960
LAW ENFORCEMENT
10023
9799
8189
6703
5852
5461
6172
6953
7341
12365
15713
18261
POLITICAL SCIENCE
9362
6461
5652
5648
6152
6243
5634
5530
6174
7654
9366
10770
SOCIOLOGY
2914
2903
2486
2160
1855
1593
1258
1264
1333
1791
2150
2389
OTHER SOCIAL SCIENCES
20723
24355
23407
20530
18043
15980
14282
14063
14494
14198
16191
19643
IM+EADISCIPL./OTHER SCIENCES
4839
5396
5328
4654
4099
3822
3511
3408
3195
2206
2185
2728
TOTAL OF SCIENCE,
MATH & ENGINEERING
239421
262085
270505
274585
283959
298120
299870
293775
281019
285021
315154
3p333
3-A

NUMBER OF STUDENTS INTENDING TO MAJOR IN MATH, SCIENCE, AND ENGINEERING FIELDS
(WHITE MALES)
ITEST
YEAR
INTENDED
MAJOR FIELD
11977
1978
1979
1980
1981
1982
1983
1984
1985
MATH & STATISTICS
6396
5920
5081
4406
4234
3967
3774
3907
3881
COMPUTER SCIENCE
6424
8486
11209
13547
18309
24673
32291
32788
25292
PHYSICAL SCIENCES
ASTRONOMY
742
778
850
926
852
925
823
631
664
CHEMISTRY
2733
2687
2651
2495
2429
2116
1913
2009
2069
PHYSICS
2315
2557
2543
2611
2423
2260
2105
2240
2317
ARCHITECTURE/ENVIR. ENG.
9255
9961
9980
10215
9985
9148
7866
7612
8143
ENGINEERING
AEROSPACE ENGINEERING
6385
7747
8798
9595
10346
1158E
10788
11134
11730
ELECTRICAL ENGINEERING
10408
11816
12517
13040
13687
14279
14764
15550
15396
CHEMICAL ENGINEERING
2847
3174
3342
3795
4100
4609
4347
3422
3124
MECHANICAL ENGINEERING
5513
6720
7386
7827
8355
8384
7947
7164
7175
CIVIL ENGINEERING
3479
3828
3944
3872
3869
3576
3275
2951
2883
OTHER ENGINEERING
18303
20935
22976
24142
24927
25765
23814
21448
20061
LIFE SCIENCES
AGRICULTURE
5992
5853
5557
5052
4871
4426
3916
3395
3023
BIOLOGICAL SCIENCES
10380
10344
9760
8824
8480
8125
7613
7467
7615
EARTH & ENVIRONMENTAL SCI.
7929
8079
7719
6586
6087
5563
4652
3921
3752
PSYCHOLOGY
CHILD PSYCHOLOGY
416
500
500
475
457
400
426
434
460
GENERAL PSYCHOLOGY
3731
3807
3680
3515
3356
3325
3188
3325
3784
SOCIAL PSYCHOLOGY
759
736
745
661
645
672
681
698
805
SOCIAL SCIENCES
ECONOMICS
859
894
1007
1057
1082
1028
920
1010
1007
INTERNATIONAL RELATIONS
480
485
506
505
620
633
693
880
949
LAW ENFORCEMENT
5708
5517
4671
3791
3320
3266
3722
4210
4467
POLITICAL SCIENCE
4636
3090
2571
2613
2939
2955
2652
2568
2948
SOCIOLOGY
458
439
374
310
281
254
227
189
214
OTHER SOCIAL SCIENCES
5391
6266
6050
5244
4760
4356
4159
3985
4068
INTERDISCIPL./OTHER SCIENCES
3144
3453
3255
2851
2471
2268
1989
1867
1789
TOTAL OF SCIENCE,
MATH & ENGINEERING
124683
134072
137672
137955
142885
148558
148545
144805
137616
1986
3275
17625
1018
1800
2030
9021
12022
14000
2999
6735
3330
22204
3578
8090
4235
293
4566
456
1050
1076
6202
3550
299
3954
1231
134639
1987
3112
15116
1195
1876
2121
11600
15079
13747
3164
6735
3674
24355
4047
8907
4945
305
5654
301
1191
1198
7535
4299
298
4454
1297
146205
1
1988
1
3003
13308
1261
1890
2190
12304
14699
11685
2756
6373
3539
23656
4294
9155
5427
500
6023
404
1265
1237
8488
4695
390
5364
1609
145515
3-B

NUMBER OF STUDENTS INTENDING TO MAJOR IN MATH,
(WHITE FEMALES)
1TEST
INTENDED
MAJOR FIELD
11977
1978
1979
1980
1981
MATH & STATISTICS
5048
4886
4278
4080
3973
COMPUTER SCIENCE
3221
4648
6585
8615
12093
PHYSICAL SCIENCES
ASTRONOMY
171
220
268
253
221
CHEMISTRY
1253
1257
1339
1317
1253
PHYSICS
272
309
305
352
377
ARCHITECTURE/ENVIR. ENG.
2161
2392
2659
3019
2856
ENGINEERING
AEROSPACE ENGINEERING
426
629
779
933
1336
ELECTRICAL ENGINEERING
357
427
599
766
904
CHEMICAL ENGINEERING
666
839
991
1237
1483
MECHANICAL ENGINEERING
228
322
428
580
614
CIVIL ENGINEERING
380
372
443
472
516
OTHER ENGINEERING
2780
3404
4183
5094
5667
LIFE SCIENCES
AGRICULTURE
5102
4581
4037
3817
3616
BIOLOGICAL SCIENCES
11964
12138
11593
10608
10418
EARTH & ENVIRONMENTAL SCI.
3363
3474
3542
3091
2930
PSYCHOLOGY
CHILD PSYCHOLOGY
3844
4702
5165
5175
5272
GENERAL PSYCHOLOGY
9022
10431
11036
11227
11016
SOCIAL PSYCHOLOGY
2332
2596
2714
2716
2677
SOCIAL SCIENCES
ECONOMICS
386
454
502
580
596
INTERNATIONAL RELATIONS
748
791
866
905
1025
LAW ENFORCEMENT
2828
2650
2193
1729
1467
POLITICAL SCIENCE
3159
2179
1987
1905
2088
SOCIOLOGY
1619
1610
1397
1229
1112
OTHER SOCIAL SCIENCES
11116
12881
12624
11179
9659
INTERDISCIPL./OTHER SCIENCES
1113
1287
1418
1240
1088
C)
TOTAL OF SCIENCE,
MATH & ENGINEERING
73559
79479
81931
82119
83957
SCIENCE, AND ENGINEERING FIELDS
YEAR
1982
1983
1984
1985
3912
3862
4287
4282
17191
20659
17565
10413
302
229
235
252
1281
1283
1361
1356
319
328
373
440
2722
2232
2229
2382
1178
1137
1237
1319
1112
1371
1443
1369
1786
1841
1360
1220
705
s
635
629
644
528
455
451
410
6608
6383
5700
5333
3128
2668
2196
2014
10007
9534
9597
9479
2772
2393
2080
2295
5356
5073
5326
6565
11047
10808
11041
13148
2703
2479
2743
3094
593
568
561
591
1168
1191
1618
1877
1243
1415
1567
1664
2208
1987
2026
2157
928
721
756
802
8501
7459
7564
7724
1060
1010
1075
950
88358
87721
85020
81780
1986
3147
6740
356
1124
376
2781
1517
1122
1163
588
437
5516
2595
10112
3052
5174
16184
1933
481
2166
3442
2777
1031
7635
678
82127
1987
2766
5505
393
1212
354
3594
2021
1154
1211
569
480
5886
3045
11119
3937
5837
19977
1792
495
2637
4432
3368
1298
8770
613
92465
1988
2728
5160
508
1282
446
4279
2393
990
1069
618
452
6024
3080
11252
4678
6865
21335
1807
560
2705
4937
3935
1303
10057
736
f
99199
3-C
l
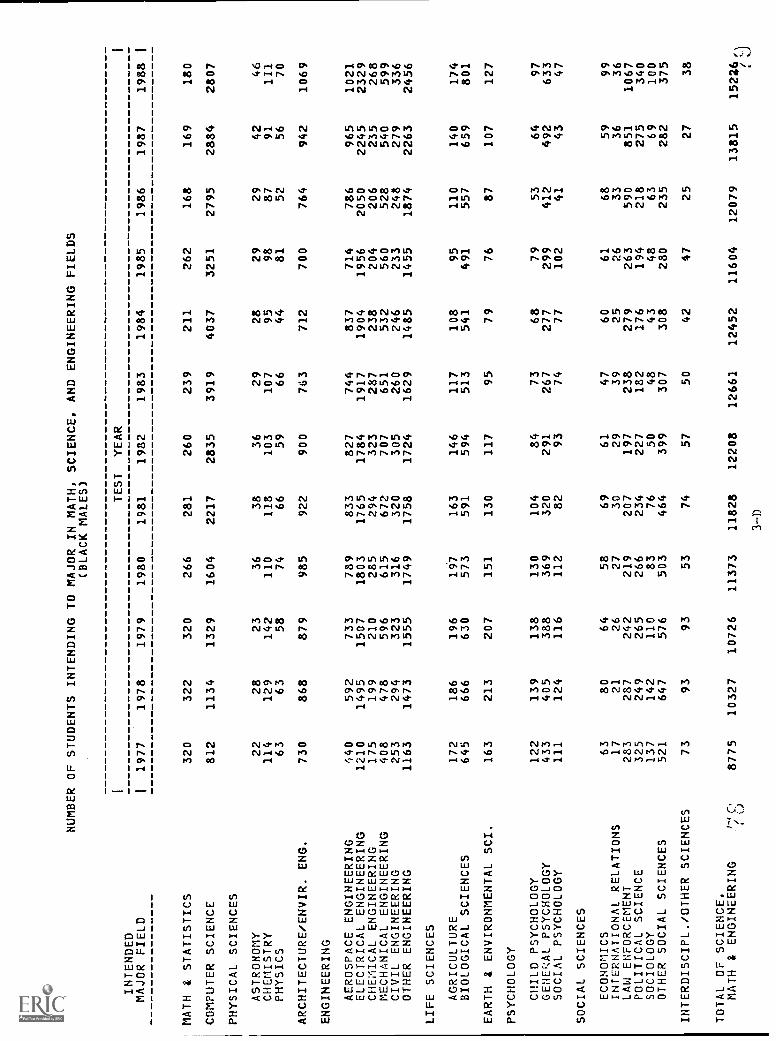
NUMBER OF STUDENTS INTENDING TO MAJOR IN MATH,
(BLACK MALES)
1TEST
INTENDED
MAJOR FIELD
11977
1978
1979
1980
1981
MATH & STATISTICS
320
322
320
266
281
COMPUTER SCIENCE
812
1134
1329
1604
2217
PHYSICAL SCIENCES
ASTRONOMY
22
28
23
36
38
CHEMISTRY
114
129
142
110
118
PHYSICS
63
63
58
74
66
ARCHITECTURE/ENVIR. ENG.
730
868
879
985
922
ENGINEERING
AEROSPACE ENGINEERING
e440
592
733
789
833
ELECTRICAL ENGINEERING
1210
1495
1507
1803
1765
CHEMICAL ENGINEERING
175
199
210
285
294
MECHANICAL ENGINEERING
408
478
596
615
672
CIVIL ENGINEERING
253
294
323
316
320
OTHER ENGINEERING
1163
1473
1555
1749
1758
LIFE SCIENCES
AGRICULTURE
172
186
196
197
163
BIOLOGICAL SCIENCES
645
666
630
573
591
EARTH & ENVIRONMENTAL SCI.
163
213
207
151
130
PSYCHOLOGY
CHILD PSYCHOLOGY
122
139
138
130
104
GENF:AL PSYCHOLOGY
433
405
388
369
320
SOCIAL PSYCHOLOGY
111
124
116
112
82
SOCIAL SCIENCES
ECONOMICS
63
80
64
58
69
INTERNATIONAL RELATIONS
17
21
26
27
30
LAW ENFORCEMENT
283
287
242
219
207
POLITICAL SCIENCE
325
249
265
266
234
SOCIOLOGY
137
142
110
83
76
OTHER SOCIAL SCIENCES
521
647
576
503
464
INTERDISCIPL./OTHER SCIENCES
73
93
93
53
74
TOTAL OF SCIENCE,
MATH & ENGINEERING
8775
10327
10726
11373
11828
SCIENCE,
YEAR
1982
260
2835
36
103
59
900
827
1784
323
707
305
1724
146
594
117
84
29193
6129
197
22750
399
57
12208
AND ENGINEERING FIELDS
1983
1984
1985
239
211
262
3919
4037
3251
29
28
29
107
95
98
66
44
81
763
712
700
744
837
714
1917
1904
1956
287
238
204
651
532
560
260
246
233
1629
1485
1455
117
108
95
513
541
491
95
79
76
73
68
79
267
277
299
74
77
102
47
60
61
39
25
26
238
279
263
182
176
194
48
43
48
307
308
280
50
42
47
12661
12452
11604
1986
168
2795 29
8752
764
786
2050
206
528
248
1874
110
557 87
53
41241
68
33
590
21863
235
25
12079
1987
169
2884
42 91
56
942
965
2245
235
540
279
2263
140
659
107
64
49243
59
36
851
275
69
282
27
13815
1988
180
2807 46
111
70
1069
1021
2329
268
599
336
2456
174
801
127
97
63347
99
36
1067
340
100
375
38
152Z6f
(
3-0

NUMBER OF STUDENTS INTENDING TO MAJOR IN MATH,
(BLACK FEMALES)
ITEST
INTENDED
MAJOR FIELD
11977
1978
1979
1980
1981
MATH & STATISTICS
404
385
343
321
263
COMPUTER SCIENCE
750
1112
1449
1896
2760
PHYSICAL SCIENCES
ASTRONOMY
98
810
7CHEMISTRY
114
149
137
145
123
PHYSICS
15
23
17
19
21
ARCHITECTURE/ENVIR. ENG.
214
269
302
339
339
ENGINEERING
AEROSPACE ENGINEERING
35
61
87
102
99
ELECTRICAL ENGINEERING
122
150
221
281
330
CHEMICAL ENGINEERING
124
160
184
235
261
MECHANICAL ENGINEERING
39
64
68
94
111
CIVIL ENGINEERING
66
78
111
133
120
OTHER ENGINEERING
364
497
618
810
870
LIFE SCIENCES
AGRICULTURE
89
70
84
76
70
BIOLOGICAL SCIENCES
825
877
782
839
842
EARTH & ENVIRONMENTAL SCI.
58
87
73
68
79
PSYCHOLOGY
CHILD PSYCHOLOGY
791
968
1009
978
895
GENERAL PSYCHOLOGY
1070
1301
1272
1252
1132
SOCIAL PSYCHOLOGY
321
350
374
359
294
SOCIAL SCIENCES
ECONOMICS
26
44
47
59
58
INTERNATIONAL RELATIONS
45
42
40
52
45
LAW ENFORCEMENT
274
312
261
255
244
POLITICAL SCIENCE
408
341
289
287
279
SOCIOLOGY
420
402
350
299
222
OTHER SOCIAL SCIENCES
1576
1965
1817
1522
1284
INTERD6WPL./OTHER SCIENCES
57
76
49
69
51
TOTAL OF SCIENCE,
MATH & ENGINEERING
8216
9791
9992
10500
10799
SCIENCE,
YEAR
1982
258
3678 5
131 22
323
122
418
287
149
138
960
57
833
69
782
993
275 5069
171
268
211
1055
51
11375
AND ENGINEERING FIELDS
1983
1984
1985
....
234
268
320
4964
4890
3637
610
3136
146
142
19
28
20
224
236
247
117
142
141
405
498
482
311
253
243
126
127
118
92
93
70
941
845
787
46
57
55
802
888
823
53
44
47
612
617
707
877
853
984
212
241
281
50
32
42
74
67
74
193
204
205
241
233
263
117
123
134
805
778
824
45
40
49
11702
11713
10698
1986
215
3360
11
10415
261
148
558
243
118
108
1131
83
1051 46
558
1445
147
5983
830
296
206
724
29
11829
1987
216
3284
13
120 13
333
184
595
261
135
119
1319 75
1091 66
750
1844
147 5290
1117
361
245
882
20
13332
3-E
I
1988
1
216
3411 28
146
28
409
229
597
297
131
130
1433
91
1197
113
957
2389
168
66
134
1343
448
264
1177
28
8 I.
15430
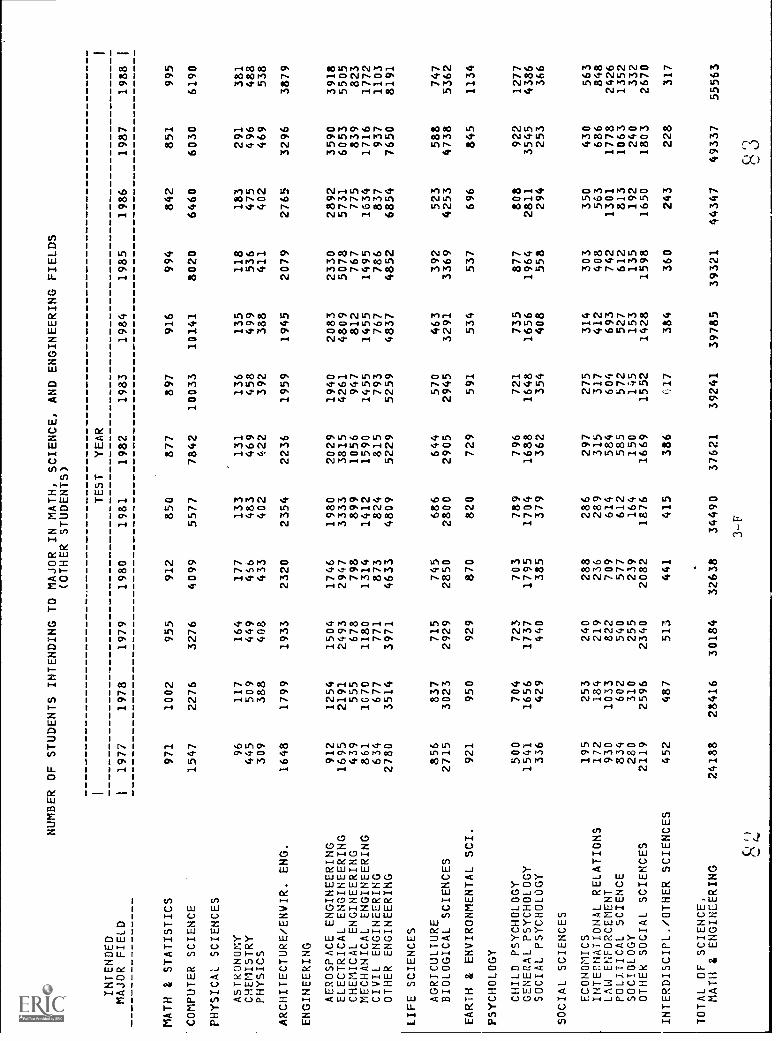
NUMBER OF STUDENTS INTENDING TO MAJOR IN MATH, SCIENCE, AND ENGINEERING FIELDS
(OTHER STUDENTS)
INTENDED
MAJOR FIELD
MATH & STATISTICS
COMPUTER SCIENCE
PHYSICAL SCIENCES
ASTRONOMY
CHEMISTRY
PHYSICS
ARCHITECTURE/ENVIR. ENG.
ENGINEERING
AEROSPACE ENGINEERING
ELECTRICAL ENGINEERING
CHEMICAL ENGINEERING
MECHANICAL ENGINEERING
CIVIL ENGINEERING
OTHER ENGINEERING
LIFE SCIENCES
AGRICULTURE
BIOLOGICAL SCIENCES
EARTH & ENVIRONMENTAL SCI.
PSYCHOLOGY
CHILD PSYCHOLOGY
GENERAL PSYCHOLOGY
SOCIAL PSYCHOLOGY
SOCIAL SCIENCES
ECONOMICS
INTERNATIONAL RELATIONS
LAW ENFORCEMENT
POLITICAL SCIENCE
SOCIOLOGY
OTHER SOCIAL SCIENCES
INTERDISCIPL. /OTHER SCIENCES
TOTAL OF SCIENCE,
MATH & ENGINEERING
1 11977
971
1547 96
445
309
1648
912
1695
439
861
634
2780
856
2715
921
500
1541
336
195
172
930
834
280
2119
452
24188
1978
1002
2276
117
509
388
1799
1254
2191
555
1G70
677
3514
837
3023
950
704
1656
429
253
184
1033
602
310
2596
487
28416
1979
955
3276
164
449
408
1933
1504
2493
678
1180
771
3971
715
2929
929
723
1737
440
240
219
822
540
255
2340
513
30184
1980
912
4099
177
456
433
2320
1746
2947
798
1314
873
4633
745
2850
870
703
1795
385
288
236
709
577
239
2082
441
32638
TEST
1981
850
5577
133
483
402
2354
1980
3333
899
1412
824
4809
686
2800
820
789
1704
379
286
289
614
612
164
1876
415
34490
YEAR
1982
877
7842
131
469
422
2236
2029
3815
1056
1590
815
5229
644
2905
729
796
1688
362
297
315
584
585
150
1669
386
37621
1983
897
10033
136
458
392
1959
1940
4261
947
1455
793
5259
570
2945
591
721
1648
354
275
317
604
572
145
1552
(i17
39241
1984
916
10141
135
499
388
1945
2083
4809
812
1455
767
4837
463
3291
534
735
1656
408
314
412
693
527
153
1428
384
39785
1985
994
8020
118
536
411
2079
2330
5078
767
1495
786
4852
392
3369
537
877
1964
558
303
408
742
612
135
1598
360
39321
1986
842
6460
183
475
402
2765
2892
5731
775
1634
837
6854
523
4253
696
808
2811
294
350
563
1301
813
192
1650
243
44347
1987
851
6030
291
496
469
3296
3590
6053
839
1716
937
7650
588
4738
845
922
3545
253
430
686
1778
1063
240
1803
228
49337
1988
995
6190
381
488
538
3879
3918
5505
823
1772
1103
8191
747
5362
1134
1277
4386
366
563
848
2426
1352
332
2670
317
55563
3-F
1
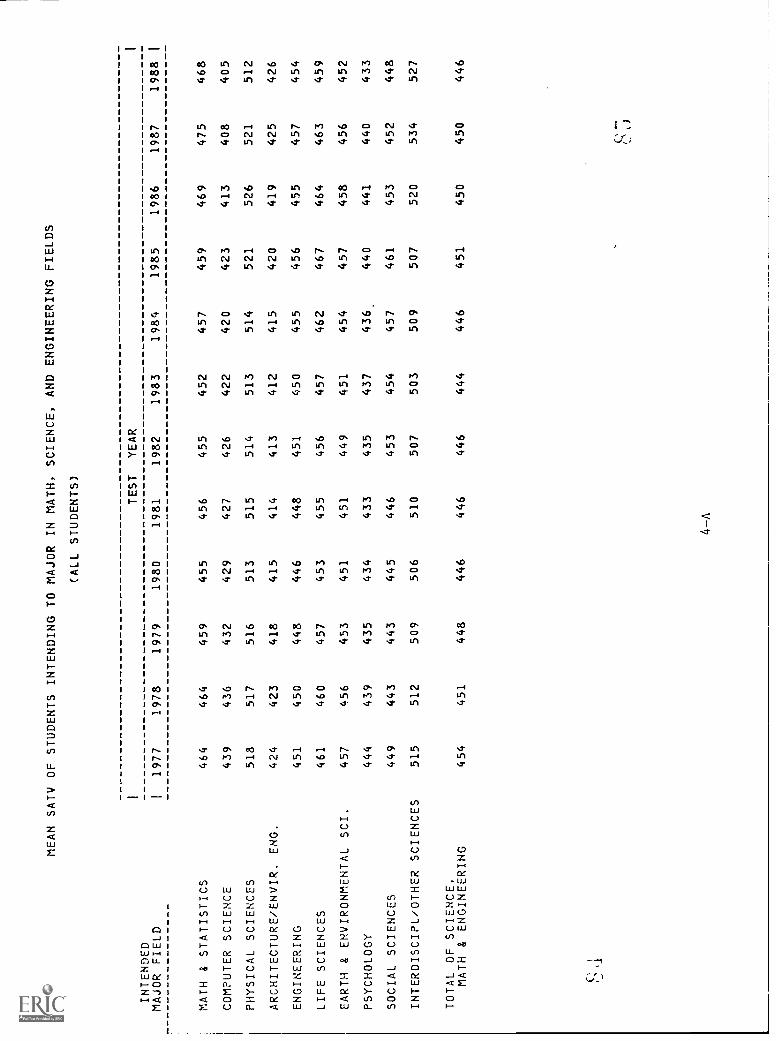
MEAN SATV OF STUDENTS INTENDING TO MAJOR IN MATH, SCIENCE, AND ENGINEERING FIELDS
(ALL STUDENTS)
TEST
YEAR
INTENDED
MAJOR FIELD
I1977
1978
1979
1980
1981
1982
1983
1984
1985
1986
1987
1988
MATH & STATISTICS
464
464
459
455
456
455
452
457
459
469
475
468
COMPUTER SCIENCE
439
436
432
429
427
426
422
420
423
413
408
405
PHYSICAL SCIENCES
518
517
516
513
515
514
513
514
521
526
521
512
ARCHITECTURE/ENVIR. ENG.
424
423
418
415
414
413
412
415
420
419
425
426
ENGINEERING
451
450
448
446
448
451
450
455
456
455
457
454
LIFE SCIENCES
461
460
457
453
455
456
457
462
467
464
463
459
EARTH & ENVIRONMENTAL SCI.
457
456
453
451
451
449
451
454
457
458
456
452
PSYCHOLOGY
444
439
435
434
433
435
437
436.
440
441
440
433
SOCIAL SCIENCES
449
443
443
445
446
453
454
457
461
453
452
448
INTERDISCIPL/OTHER SCIENCES
515
512
509
506
510
507
503
509
507
520
534
527
TOTAL OF SCIENCE,
MATH & ENGINEERING
454
451
448
446
446
446
444
446
451
450
450
446
F5
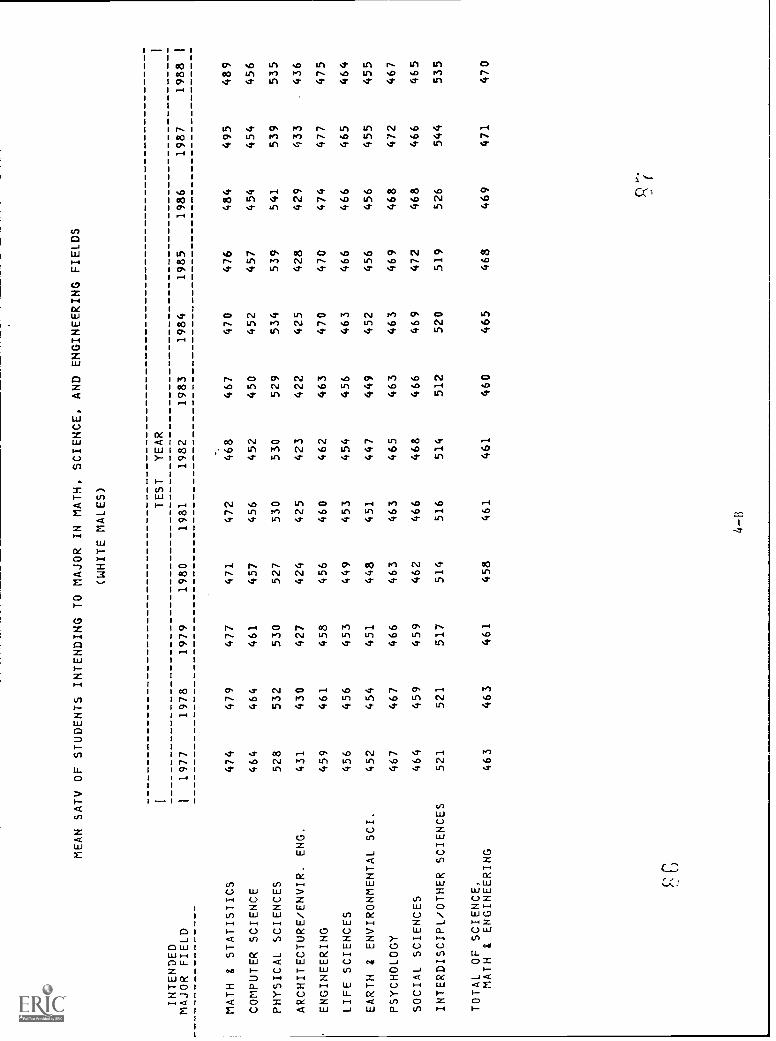
MEAN SATV OF STUDENTS INTENDING TO MAJOR IN MATH, SCIENCE, AND ENGINEERING FIELDS
(WHITE MALES)
INTENDED
TEST
YEAR
MAJOR FIELD
I1977
1978
1979
1980
1981
1982
1983
1984
1985
1986
1987
1988
MATH 8 STATISTICS
474
479
477
471
472
468
467
470
476
484
495
489
COMPUTER SCIENCE
464
464
461
457
456
452
450
452
457
454
454
456
PHYSICAL SCIENCES
528
532
530
527
530
530
529
534
539
541
539
535
ARCHITECTURE/ENVIR. ENG.
431
430
427
424
425
423
422
425
428
429
433
436
ENGINEERING
459
461
458
456
460
462
463
470
470
474
477
475
LIFE SCIENCES
456
456
453
449
453
454
456
463
466
466
465
464
EARTH I ENVIRONMENTAL SCI.
452
454
451
448
451
447
449
452
456
456
455
455
PSYCHOLOGY
467
467
466
463
463
465
463
463
469
468
472
467
SOCIAL SCIENCES
464
459
459
462
466
468
466
469
472
468
466
465
INTERDISCIPL/OTHER SCIENCES
521
521
517
514
516
514
512
520
519
526
544
535
TOTAL OF SCIENCE,
MATH & ENGINEERING
463
463
461
458
461
461
460
465
468
469
471
470
I
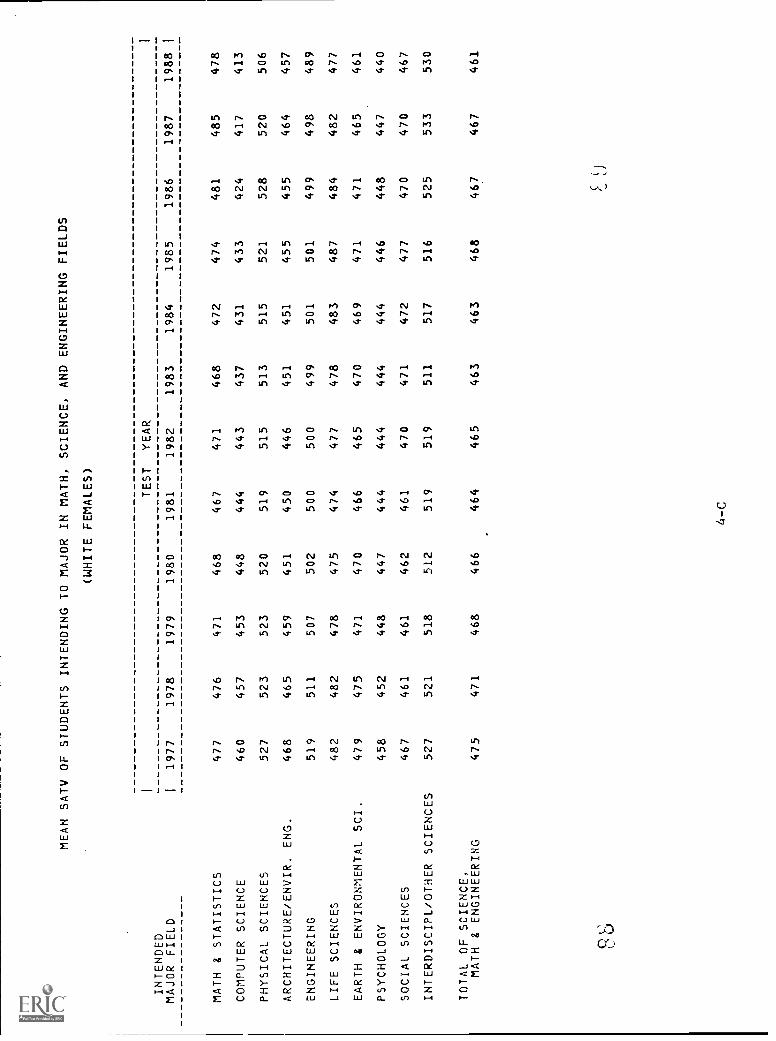
MEAN SATV OF STUDENTS INTENDING TO MAJOR IN MATH, SCIENCE, AND ENGINEERING FIELDS
(WHITE FEMALES)
TEST
YEAR
INTENDED
MAJOR FIELD
I1977
1978
1979
1980
1981
1982
1983
1984
1985
1986
1987
1988
MATH & STATISTICS
477
476
471
468
467
471
468
472
474
481
485
478
COMPUTER SCIENCE
460
457
453
448
444
443
437
431
433
424
417
413
PHYSICAL SCIENCES
527
523
523
520
519
515
513
515
521
528
520
506
ARCHITECTURE/ENVIR. ENG.
468
465
459
451
450
446
451
451
455
455
464
457
ENGINEERING
519
511
507
502
500
500
499
501
501
499
498
489
LIFE SCIENCES
482
482
478
475
474
477
478
483
487
484
482
477
EARTH & ENVIRONMENTAL SCI.
479
475
471
470
466
465
470
469
471
471
465
461
PSYCHOLOGY
458
452
448
447
444
444
444
444
446
448
447
440
SOCIAL SCIENCES
467
461
461
462
461
470
471
472
477
470
470
467
INTERDISCIPL/OTHER SCIENCES
527
521
518
512
519
519
511
517
516
525
533
530
TOTAL OF SCIENCE,
MATH & ENGINEERING
475
471
468
466
464
465
463
463
468
467
467
461
I
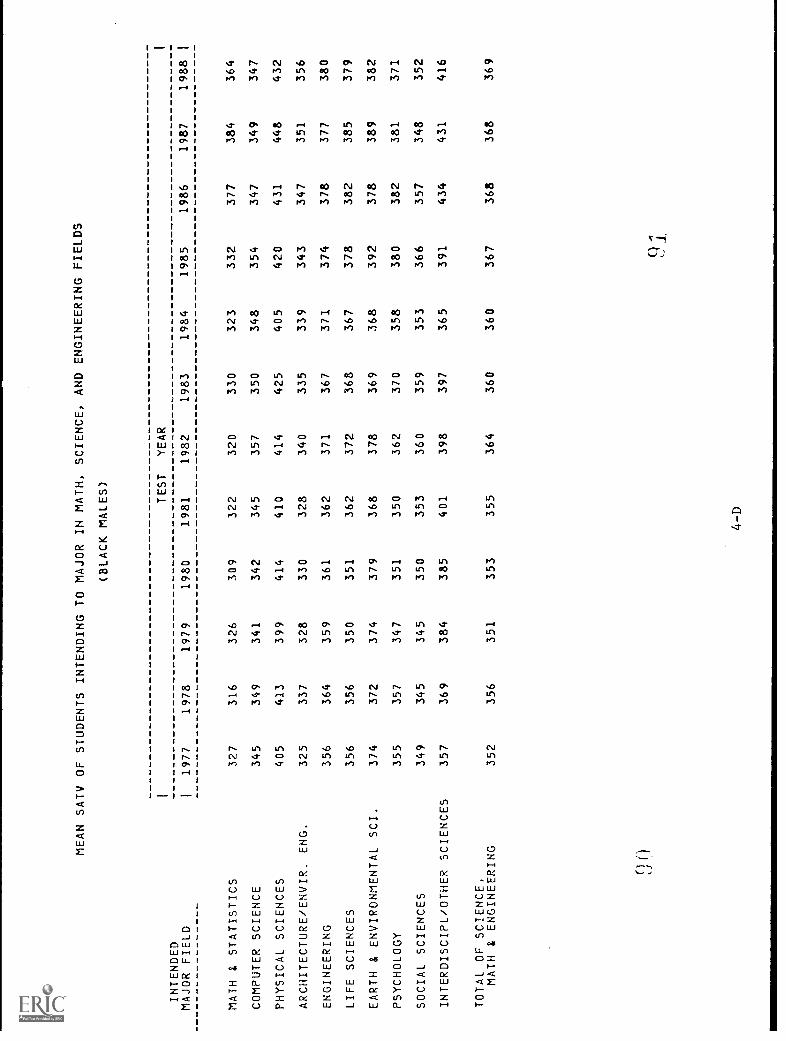
MEAN SATV
1
INTENDED
MAJOR FIELD
1
MATH & STATISTICS
COMPUTER SCIENCE
PHYSICAL SCIENCES
ARCHITECTURE/ENVIR. ENG.
ENGINEERING
LIFE SCIENCES
EARTH & ENVIRONMENTAL SCI.
PSYCHOLOGY
SOCIAL SCIENCES
INTERDISCIPL/OTHER SCIENCES
TOTAL OF SCIENCE,
MATH & ENGINEERING
OF STUDENTS
1977
1978
327
316
345
349
405
413
325
337
356
364
356
356
374
372
355
357
349
345
357
369
352
356
INTENDING TO MAJOR IN MATH,
(BLACK MALES)
TEST
1979
1980
1981
326
309
322
341
342
345
399
414
410
328
330
328
359
361
362
350
351
362
374
379
368
347
351
350
345
350
353
384
385
401
351
353
355
SCIENCE,
YEAR
1982
320
357
414
340
371
372
378
362
360
398
364
AND ENGINEERING FIELDS
1983
1984
1985
330
323
332
350
348
354
425
405
420
335
339
343
367
371
374
368
367
378
369
368
392
370
358
380
359
353
366
397
365
391
360
360
367
1986
377
347
431
347
378
382
378
382
357
434
368
1987
384
349
448
351
377
385
389
381
348
431
368
1988
364
347
432
356
380
379
382
371
352
416
369
1

MEAN SATV OF STUDENTS
INTENDING TO MAJOR
(BLACK
IN MATH,
FEMALES)
SCIENCE,
AND
ENGINEERING FIELDS
ITEST
YEAR
INTENDED
MAJOR FIELD
I1977
1978
1979
1980
1981
1982
1983
1984
1985
1986
1987
1988
MATH & STATISTICS
336
344
326
328
336
331
350
345
344
365
384
384
COMPUTER SCIENCE
334
338
327
331
331
338
331
330
329
323
320
317
PHYSICAL SCIENCES
372
380
382
383
387
393
388
386
410
410
420
403
ARCHITECTURE/ENVIR. ENG.
353
359
351
341
344
340
354
352
362
365
370
371
ENGINEERING
411
400
395
392
386
393
394
392
388
384
387
386
LIFE SCIENCES
370
368
369
370
373
380
382
385
393
386
395
386
EARTH & ENVIRONMENTAL SCI.
398
394
393
372
372
389
385
398
393
378
396
400
PSYCHOLOGY
354
350
345
346
348
354
356
361
366
374
371
364
SOCIAL SCIENCES
33:
333
329
330
331
347
353
351
354
341
345
348
INTERDISCIPL/OTHER SCIENCES
361
353
344
357
384
369
387
386
383
438
426
437
TOTAL OF SCIENCE,
MATH & ENGINEERING
351
351
347
349
349
357
354
354
358
357
359
357
I
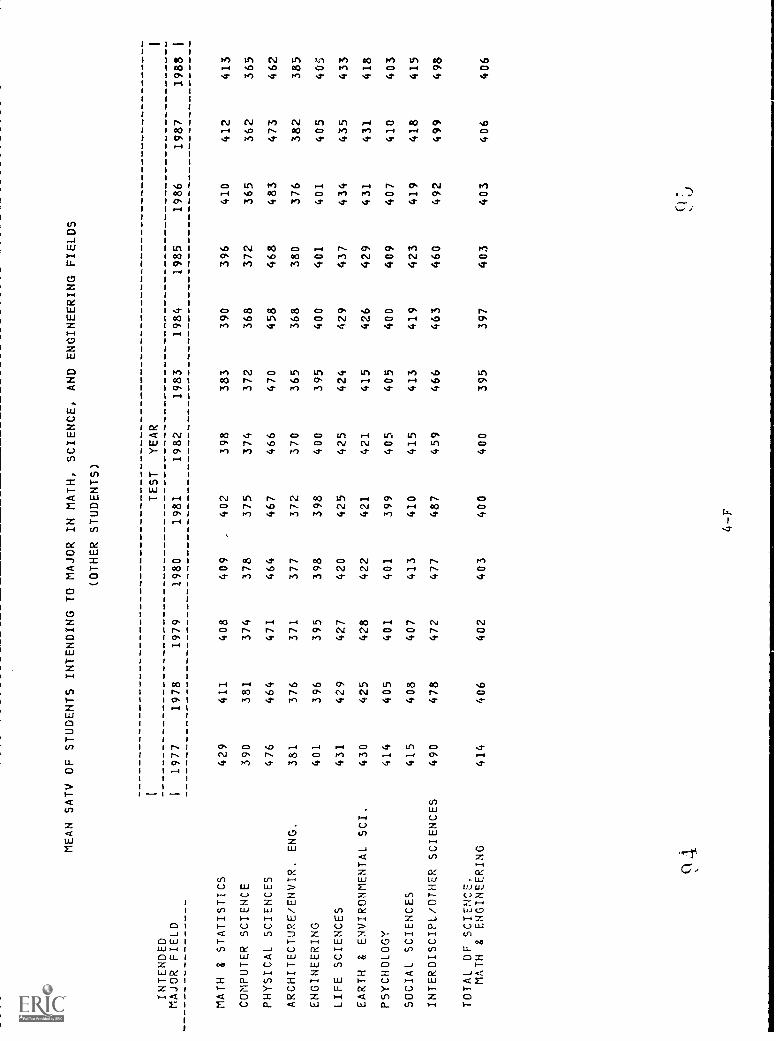
MEAN SATV OF STUDENTS
I
INTENDED
INTENDING TO MAJOR IN MATH,
(OTHER STUDENTS)
TEST
SCIENCE,
YEAR
AND ENGINEERING FIELDS
I
MAJOR FIELD
I1977
1978
1979
1980
1981
1982
1983
1984
1985
1986
1987
1988
I
MATH & STATISTICS
429
411
408
409
402
398
383
390
396
410
412
413
COMPUTER SCIENCE
390
381
374
378
375
374
372
368
372
365
362
365
PHYSICAL SCIENCES
476
464
471
464
467
466
470
458
468
483
473
462
ARCHITECTURE/ENVIR. ENG.
381
376
371
377
372
370
365
368
380
376
382
385
ENGINEERING
401
396
395
398
398
400
395
400
401
401
405
405
LIFE SCIENCES
431
429
427
420
425
425
424
429
437
434
435
433
EARTH & ENVIRONMENTAL SCI.
430
425
428
422
421
421
415
426
429
431
431
418
PSYCHOLOGY
414
405
401
401
399
405
405
400
409
407
410
403
SOCIAL SCIENCES
415
408
407
413
410
415
413
419
423
419
418
415
INTERDISCIPL/OTHER SCIENCES
490
478
472
477
487
459
466
463
460
492
499
498
TOTAL OF SCIENCE,
MATH & ENGINEERING
414
406
402
403
400
400
395
397
403
403
406
406
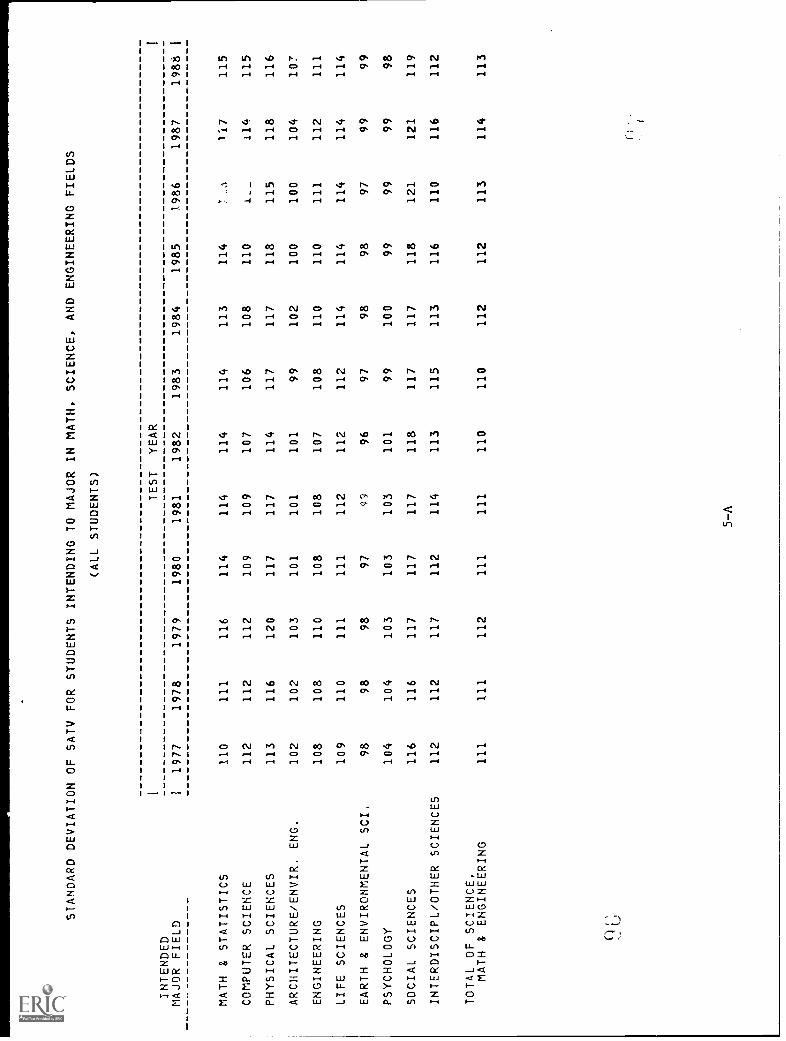
STANDARD DEVIATION OF SATV FOR STUDENTS INTENDING TO MAJOR IN MATH, SCIENCE, AND ENGINEERING FIELDS
(ALL STUDENTS)
TEST
YEAR
INTENDED
MAJOR FIELD
I1977
1978
1979
1980
1981
1982
1983
1984
1985
1986
1987
1986
MATH & STATISTICS
110
111
116
114
114
114
114
113
114
1,
117
115
COMPUTER SCIENCE
112
112
112
109
109
107
106
108
110
I__
114
115
PHYSICAL SCIENCES
113
116
120
117
117
114
117
117
118
115
118
116
ARCHITECTURE/ENVIR
ENG.
102
102
103
101
101
101
99
102
100
100
104
107
ENGINEERING
108
108
110
108
108
107
108
110
110
111
112
111
LIFE SCIENCES
109
110
111
111
112
112
112
114
114
114
114
114
EARTH & ENVIRONMENTAL SCI.
98
98
98
97
Qg
96
97
98
98
97
99
99
PSYCHOLOGY
104
104
103
103
103
101
99
100
99
99
99
98
SOCIAL SCIENCES
116
116
117
117
117
118
117
117
118
121
121
119
INTERDISCIPL/OTHER SCIENCES
112
112
117
112
114
113
115
113
116
110
116
112
TOTAL OF SCIENCE,
MATH & ENGINEERING
111
111
112
111
111
110
110
112
112
113
114
113
C.)
f
I
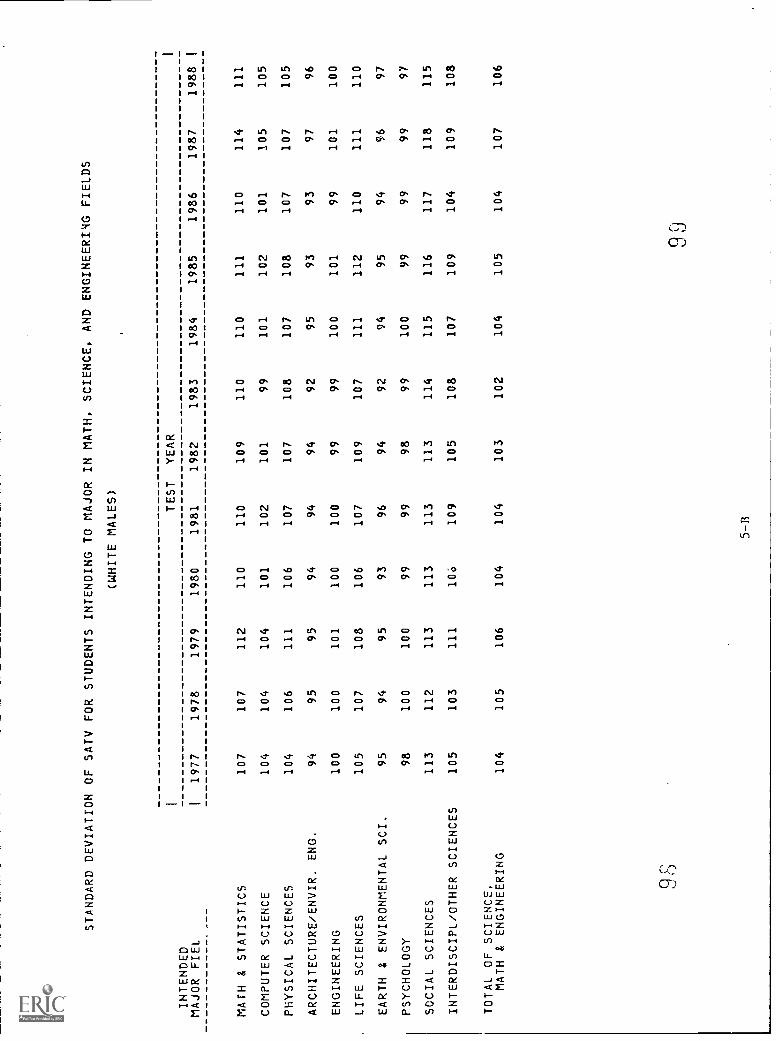
STANDARD DEVIATION OF SATV FOR STUDENTS INTENDING TO MAJOR IN MATH, SCIENCE,
AND ENGINEERING FIELDS
(WHITE MALES)
INTENDED
MAJOR FIEL
MATH & STATISTICS
COMPUTER SCIENCE
PHYSICAL SCIENCES
ARCHITECTURE/ENVIR. ENG.
ENGINEERING
LIFE SCIENCES
EARTH & ENVIRONMENTAL SCI.
PSYCHOLOGY
SOCIAL SCIENCES
INTERDISCIPL/OTHER SCIENCES
TOTAL OF SCIENCE,
MATH & ENGINEERING
11977
107
104
104
94
100
105 95
98
113
105
104
1978
107
104
106 95
100
107 94
100
112
103
105
1979
112
104
111 95
101
108
95
100
113
111
106
1980
110
101
106
94
100
106 93 99
113
10a
104
TEST
1981
110
102
107 94
100
107
96
99
113
109
104
YEAR
1982
109
101
107 94
99
109
94
98
113
105
103
1983
110 99
108 92
99
107 92 99
114
108
102
1984
110
101
107 95
100
111
94
100
115
107
104
1985
111
102
108 93
101
112 95
99
116
109
105
1986
110
101
107 93
99
110 94
99
117
104
104
1987
114
105
107
97
101
111 96
99
118
109
107
1988
111
105
105
96
100
110
97 97
115
108
106

INTENDED
STANDARD DEVIATION OF SATV FOR STUDENTS INTENDING TO MAJOR IN MATH, SCIENCE, AND ENGINEERINGFIELDS
(WHITE FEMALES)
TEST
YEAR
MAJOR FIELD
I1977
1978
1979
1980
1981
1982
1983
1984
1985
1986
1987
1988
MATH & STATISTICS
97
97
101
100
100
99
99
99
100
98
98
98
COMPUTER SCIENCE
98
98
97
96
96
95
94
94
96
100
99
102
PHYSICAL SCIENCES
107
109
115
112
110
106
108
106
110
108
107
105
ARCHITECTURE/ENVIR. ENG.
99
100
100
99
98
97
95
98
97
96
100
96
ENGINEERING
99
97
99
99
99
97
95
95
96
96
96
98
LIFE SCIENCES
103
103
103
105
106
106
104
106
106
106
105
106
EARTH & ENVIRONMENTAL SCI.
98
97
98
97
98
93
96
99
98
95
98
96
PSYCHOLOGY
96
97
96
97
96
95
93
95
94
94
94
92
SOCIAL SCIENCES
104
106
107
108
107
109
107
108
109
112
111
110
INTERDISCIPL/OTHER SCIENCES
110
107
108
109
108
105
107
106
110
105
110
106
TOTAL OF SCIENCE,
MATH & ENGINEERING
103
103
104
104
103
102
101
103
103
104
104
103
100
101
I
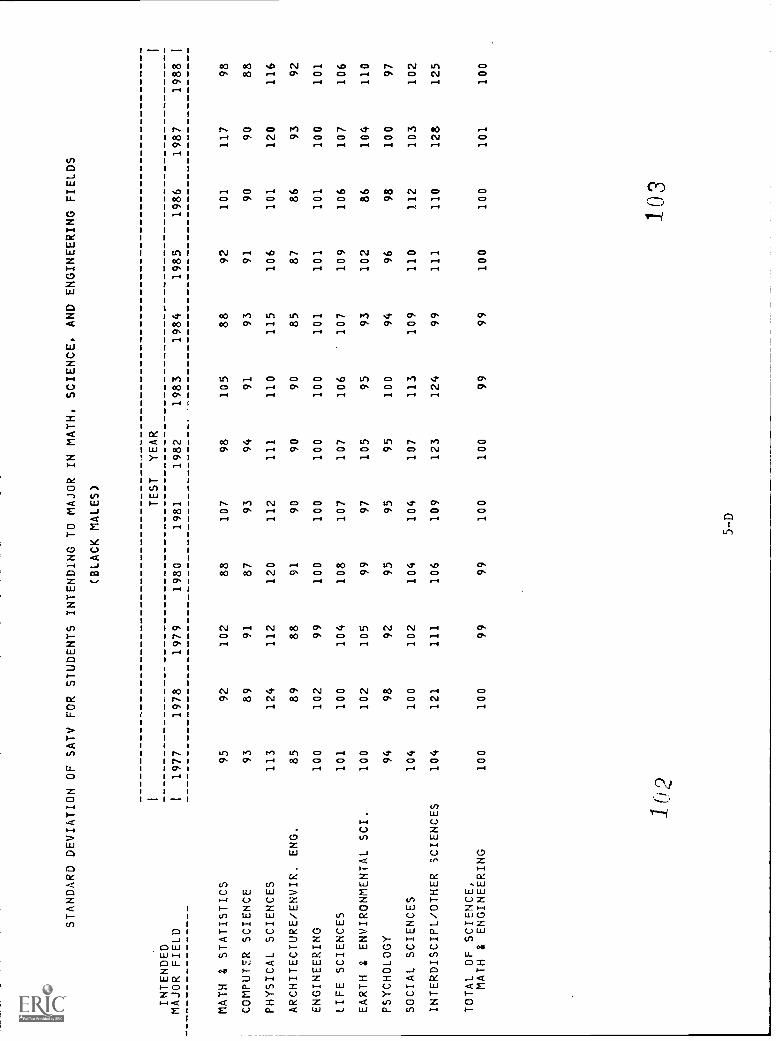
STANDARD DEVIATION OF SATV FOR STUDENTS INTENDING TO MAJOR IN MATH, SCIENCE, AND ENGINEERING FIELDS
(BLACK MALES)
INTENDED
TEST
YEAR
MAJOR FIELD
I1977
1978
1979
1980
1981
1982
1983
1984
1985
1986
1987
1988
MATH 8 STATISTICS
95
92
102
88
107
98
105
88
92
101
117
98
COMPUTER SCIENCE
93
89
91
87
93
94
91
93
91
90
90
88
PHYSICAL SCIENCES
113
124
112
120
112
111
110
115
106
101
120
116
ARCHITECTURE/ENVIR. ENG.
85
89
88
91
90
90
90
85
87
86
93
92
ENGINEERING
100
102
99
100
100
100
100
101
101
101
100
101
LIFE SCIENCES
101
100
104
108
107
107
106
107
109
106
107
106
EARTH a ENVIRONMENTAL SCI.
100
102
105
99
97
105
95
93
102
86
104
110
PSYCHOLOGY
94
98
92
95
95
95
100
94
96
98
100
97
SOCIAL SCIENCES
104
100
102
104
104
107
113
109
110
112
103
102
INTERDISCIPL/OTHER SCIENCES
104
121
111
106
109
123
124
99
111
110
128
125
TOTAL OF SCIENCE,
MATH 8 ENGINEERING
100
100
99
99
100
100
99
99
100
100
101
100
102
103
I
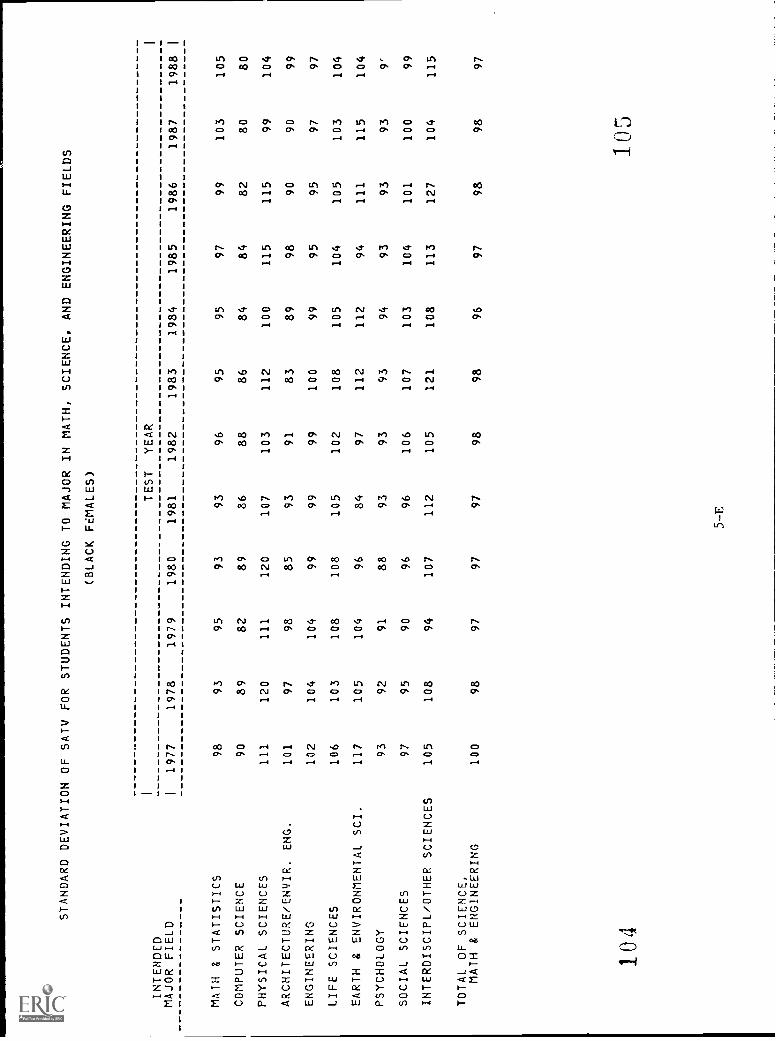
STANDARD DEVIATION OF SATV
I
INTENDED
FOR STUDENTS
INTENDING TO MAJOR IN MATH,
(BLACK FEMALES)
TEST
YEAR
SCIENCE, AND ENGINEERING FIELDS
I
MAJOR FIELD
I1977
1978
1979
1980
1981
1982
1983
1984
1985
1986
1987
1988
I
MATH & STATISTICS
98
93
95
93
93
96
95
95
97
99
103
105
COMPUTER SCIENCE
90
89
82
89
86
88
86
84
84
82
80
80
PHYSICAL SCIENCES
111
120
111
120
107
103
112
100
115
115
99
104
ARCHITECTURE/ENVIR
ENG.
101
97
98
85
93
91
83
89
98
90
90
99
ENGINEERING
102
104
104
99
99
99
100
99
95
95
97
97
LIFE SCIENCES
106
103
108
108
105
102
108
105
104
105
103
104
EARTH & ENVIRONMENTAL SCI.
117
105
104
96
84
97
112
112
94
111
115
104
PSYCHOLOGY
93
92
91
88
93
93
93
94
93
93
93
9'
SOCIAL SCIENCES
97
95
90
96
96
106
107
103
104
101
100
99
INTERDISCIPL/OTHER SCIENCES
105
108
94
107
112
105
121
108
113
127
104
115
TOTAL OF SCIENCE,
MATH & ENGINEERING
100
98
97
97
97
98
98
96
97
98
98
97
104
105
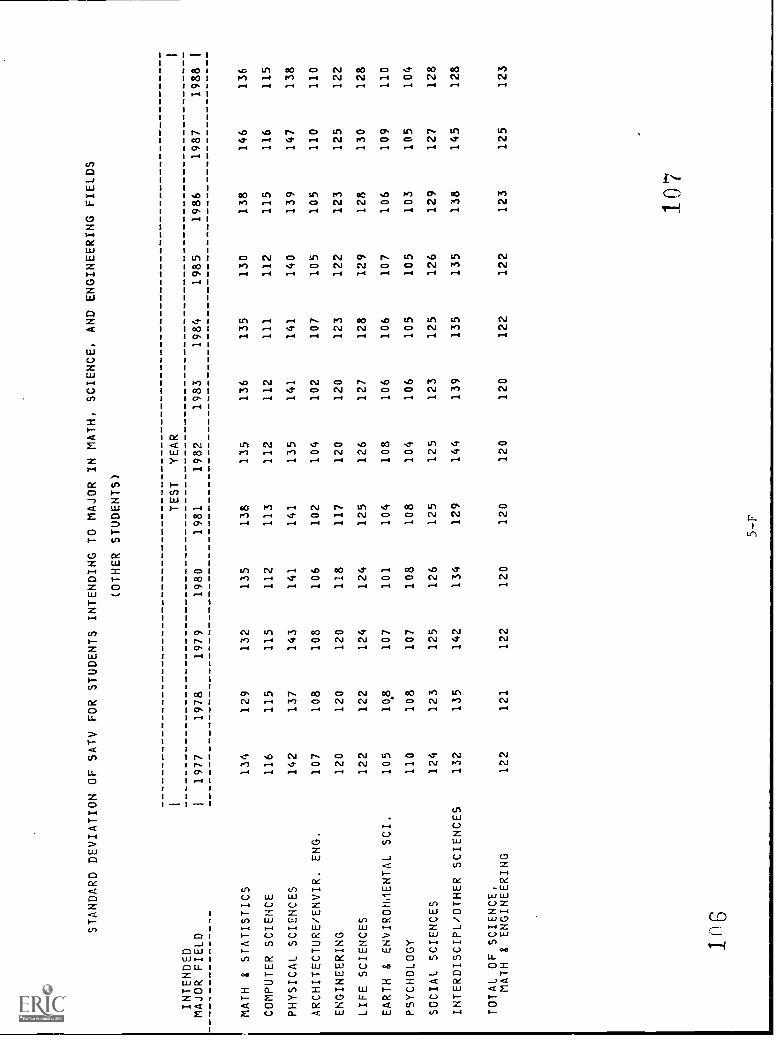
STANDARD DEVIATION OF SATV FOR STUDENTS INTENDING TO
IN MATH, SCIENCE, AND ENGINEERING FIELDS
(OTHER STUDENTS)
INTENDED
TEST
YEAR
MAJOR FIELD
I1977
1978
1979
1980
1981
1982
1983
1984
1985
1986
1987
1988
MATH & STATISTICS
134
129
132
135
138
135
136
135
130
138
146
136
COMPUTER SCIENCE
116
115
115
112
113
112
112
111
112
115
116
115
PHYSICAL SCIENCES
142
137
143
141
141
135
141
141
140
139
147
138
ARCHITECTURE/ENVIR. ENG.
107
108
108
106
102
104
102
107
105
105
110
110
ENGINEERING
120
120
120
118
117
120
120
123
122
123
125
122
LIFE SCIENCES
122
122
124
124
125
126
127
128
129
128
130
128
EARTH & ENVIRONMENTAL SCI.
105
108
107
101
104
108
106
106
107
106
109
110
PSYCHOLOGY
110
108
107
108
108
104
106
105
105
103
105
104
SOCIAL SCIENCES
124
123
125
126
125
125
123
125
126
129
127
128
INTERDISCIPL/OTHER SCIENCES
132
135
142
134
129
144
139
135
135
138
145
128
TOTAL OF SCIENCE,
MATH & ENGINEERING
122
121
122
120
120
120
120
122
122
123
125
123
107
I
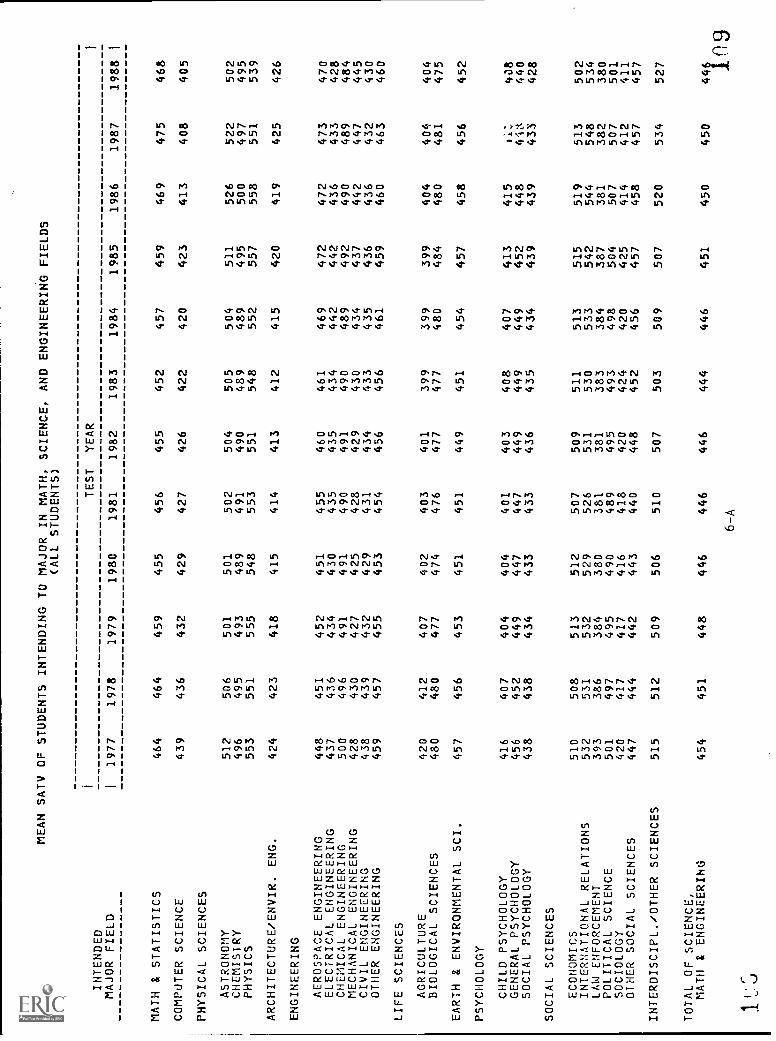
MEAN SATV OF STUDENTS INTENDING TO MAJOR IN MATH,
(ALL STUDENTS)
TEST
INTENDED
SCIENCE,
YEAR
AND ENGINEERING FIELDS
MAJOR FIELD
I1977
1978
1979
1980
1981
1982
1983
1984
1985
1986
1987
1988
MATH 8 STATISTICS
464
464
459
455
456
455
452
457
459
469
475
468
COMPUTER SCIENCE
439
436
432
429
427
426
422
420
423
413
408
405
PHYSICAL SCIENCES
ASTRONOMY
512
506
501
501
502
504
505
504
511
526
522
502
CHEMISTRY
496
495
493
489
491
490
489
489
495
500
497
495
PHYSICS
553
551
555
548
553
551
548
552
557
558
551
539
ARCHITECTURE/ENVIR. ENG.
424
423
418
415
414
413
412
415
420
419
425
426
ENGINEERING
AEROSPACE ENGINEERING
448
451
452
451
455
460
461
469
472
472
473
470
ELECTRICAL ENGINEERING
437
436
434
430
435
435
434
442
442
436
433
428
CHEMICAL ENGINEERING
500
496
491
491
490
491
490
489
492
490
489
484
MECHANICAL ENGINEERING
428
430
427
425
428
429
430
434
437
442
447
445
CIVIL ENGINEERING
438
439
432
429
431
434
433
435
436
436
432
430
OTHER ENGINEERING
459
457
455
453
454
456
456
461
459
460
463
460
LIFE SCIENCES
AGRICULTURE
420
412
407
402
403
401
399
399
399
404
404
404
BIOLOGICAL SCIENCES
480
480
477
474
476
477
477
480
484
480
481
475
EARTH & ENVIRONMENTAL SCI.
457
456
453
451
451
449
451
454
457
458
456
452
PSYCHOLOGY
CHILD PSYCHOLOGY
416
407
404
404
401
403
408
407
413
415
ti:
408
GENERAL PSYCHOLOGY
456
452
449
447
447
449
449
449
452
448
4ie.
440
SOCIAL PSYCHOLOGY
438
438
434
433
433
436
435
434
439
439
433
428
SOCIAL SCIENCES
ECONOMICS
510
508
513
512
507
509
511
513
515
519
513
502
INTERNATIONAL RELATIONS
532
531
532
529
526
531
530
533
542
544
548
534
LAW ENFORCEMENT
393
386
384
380
381
381
383
384
387
381
382
380
POLITICAL SCIENCE
501
497
495
490
489
495
493
498
504
507
507
501
SOCIOLOGY
420
417
417
416
418
420
424
420
425
414
412
411
OTHER SOCIAL SCIENCES
447
444
442
443
440
448
452
456
457
458
457
457
INTERDISCIPL./OTHER SCIENCES
515
512
509
506
510
507
503
509
507
520
534
527
TOTAL OF SCIENCE,
MATH & ENGINEERING
454
451
448
446
446
446
444
446
451
450
450
441
6-A
I 09
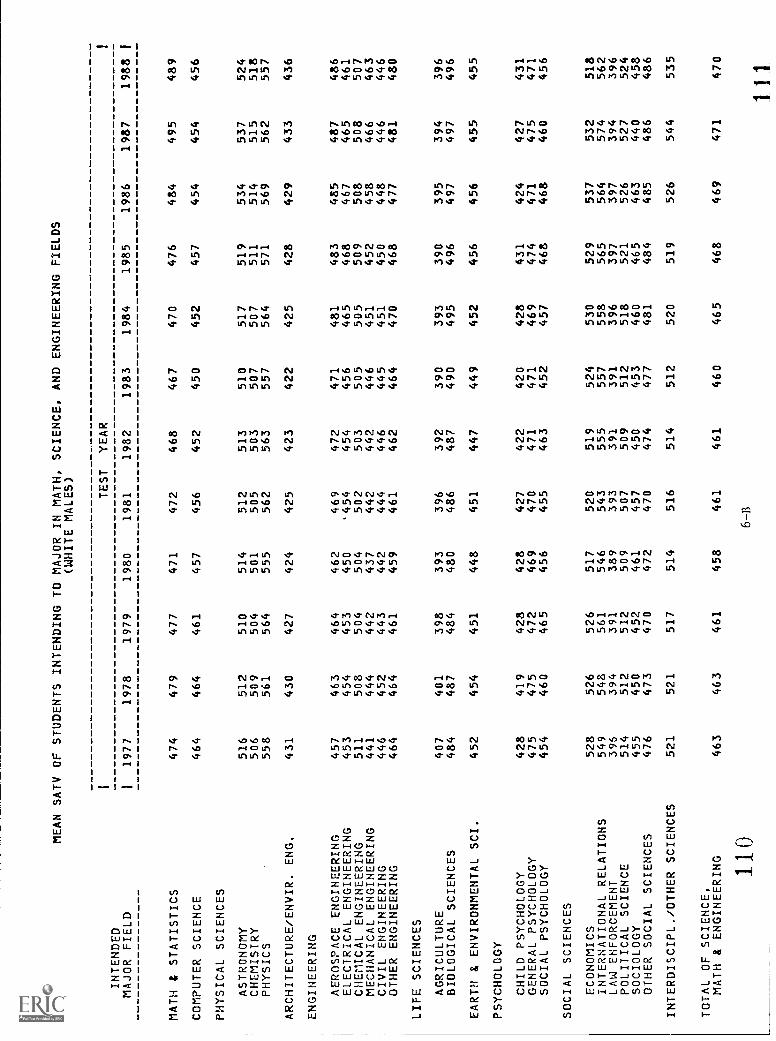
MEAN SATV OF STUDENTS INTENDING TO MAJOR IN MATH,
(WHITE MALES)
TEST
INTENDED
MAJOR FIELD
11977
1978
1979
1980
1981
MATH t STATISTICS
474
479
477
471
472
COMPUTER SCIENCE
464
464
461
457
456
PHYSICAL SCIENCES
ASTRONOMY
516
512
510
514
512
CHEMISTRY
506
509
504
501
505
PHYSICS
558
561
564
555
562
ARCHITECTURE/ENVIR. ENG.
431
430
427
424
425
ENGINEERING
AEROSPACE ENGINEERING
457
463
464
462
469
ELECTRICAL ENGINEERING
453
454
453
450
'454
CHEMICAL ENGINEERING
511
508
504
504
502
MECHANICAL ENGINEERING
441
444
442
437
442
CIVIL ENGINEERING
446
452
443
442
444
OTHER ENGINEERING
464
464
461
459
461
LIFE SCIENCES
AGRICULTURE
407
401
398
393
396
BIOLOGICAL SCIENCES
484
487
484
480
486
EARTH & ENVIRONMENTAL SCI.
452
454
451
448
451
PSYCHOLOGY
CHILD PSYCHOLOGY
428
419
428
428
427
GENERAL PSYCHOLOGY
475
475
472
469
470
SOCIAL PSYCHOLOGY
454
460
465
456
455
SOCIAL SCIENCES
ECONOMICS
528
526
526
517
520
INTERNATIONAL RELATIONS
549
548
561
546
543
LAW ENFORCEMENT
396
394
391
389
393
POLITICAL SCIENCE
514
512
512
509
507
SOCIOLOGY
455
450
452
461
457
OTHER SOCIAL SCIENCES
476
473
470
472
470
INTERDISCIPL./OTHER SCIENCES
521
521
517
514
516
TOTAL OF SCIENCE,
MATH & ENGINEERING
463
463
461
458
461
SCIENCE,
YEAR
1982
468
452
513
503
563
423
472
454
503
442
446
462
392
487
447
422
471
463
519
555
391
509
450
474
514
461
AND ENGINEERING FIELDS
1983
1984
1985
467
470
476
450
452
457
510
517
519
507
507
511
557
564
571
422
425
428
471
481
483
456
465
468
505
505
509
446
451
452
445
451
450
464
470
468
390
393
390
490
495
496
449
452
456
420
428
431
471
469
474
452
457
468
524
530
529
557
558
565
391
396
397
512
518
521
453
460
465
477
481
484
512
520
519
460
465
468
1986
484
454
534
514
569
429
485
467
508
458
448
477
395
497
456
424
471
468
537
564
397
526
463
485
526
469
1987
495
454
537
515
562
433
487
465
508
466
446
481
394
497
455
427
475
460
532
574
394
527
440
486
544
471
1988
489
456
524
518
557
436
486
461
507
463
446
480
396
496
455
431
471
456
518
562
396
524
458
486
535
470
11 0
6-B
1 1
1

MEAN SATV OF STUDENTS INTENDING TO MAJOR IN MATH,
(WHITE FEMALES)
TEST
SCIENCE,
YEAR
AND ENGINEERING FIELDS
INTENDED
MAJOR FIELD
I1977
1978
1979
1980
1981
1982
1983
1984
1985
1986
1987
MATH & STATISTICS
477
476
471
468
467
471
468
472
474
481
485
COMPUTER SCIENCE
460
457
453
448
444
443
437
431
433
424
417
PHYSICAL SCIENCES
ASTRONOMY
539
523
513
512
519
517
522
517
530
536
329
CHEMISTRY
514
510
512
507
504
505
499
501
507
511
505
PHYSICS
581
575
579
573
570
552
564
565
559
568
560
ARCHITECTURE/ENVIR. ENG.
468
465
459
451
450
446
451
451
455
455
464
ENGINEERING
AEROSPACE ENGINEERING
498
491
485
486
485
490
495
501
496
499
496
ELECTRICAL ENGINEERING
515
504
508
501
501
496
498
500
499
488
488
CHEMICAL ENGINEERING
541
535
526
525
521
520
515
517
520
510
510
MECHANICAL ENGINEERING
485
486
482
477
485
481
475
474
484
482
480
CIVIL ENGINEERING
512
499
491
489
477
488
480
480
491
486
471
OTHER ENGINEERING
520
513
511
503
501
501
499
502
502
502
503
LIFE SCIENCES
AGRICULTURE
BIOLOGICAL SCIENCES
445
498
438
498
432
494
428
492
427
490
427
493
426
493
424
496
426
500
430
498
430
496
EARTH & ENVIRONMENTAL SCI.
479
475
471
470
466
465
470
469
471
471
465
PSYCHOLOGY
CHILD PSYCHOLOGY
437
428
425
424
418
417
421
419
424
426
426
GENERAL PSYCHOLOGY
469
464
460
457
456
456
456
456
458
455
453
SOCIAL PSYCHOLOGY
453
451
447
447
445
444
443
442
444
443
439
SOCIAL SCIENCES
ECONOMICS
526
524
534
537
520
525
521
522
524
531
520
INTERNATIONAL RELATIONS
536
541
538
543
537
541
538
539
546
550
553
LAW ENFORCEMENT
413
401
399
396
393
388
400
393
396
397
402
POLITICAL SCIENCE
516
514
513
508
502
510
506
505
513
513
512
SOCIOLOGY
450
444
444
441
439
441
441
438
440
431
433
OTHER SOCIAL SCIENCES
463
460
457
456
453
460
464
465
467
466
466
INTERDISCIPL./OTHER SCIENCES
527
521
518
512
519
519
511
517
516
525
533
TOTAL OF SCIENCE,
MATH & ENGINEERING
475
471
468
466
464
465
463
463
468
467
467
6-C
1988
478
413
499
498
536
457
484
478
504
478
470
493
429
490
461
420
447
437
513
541
397
504
420
469
530
461
1 3
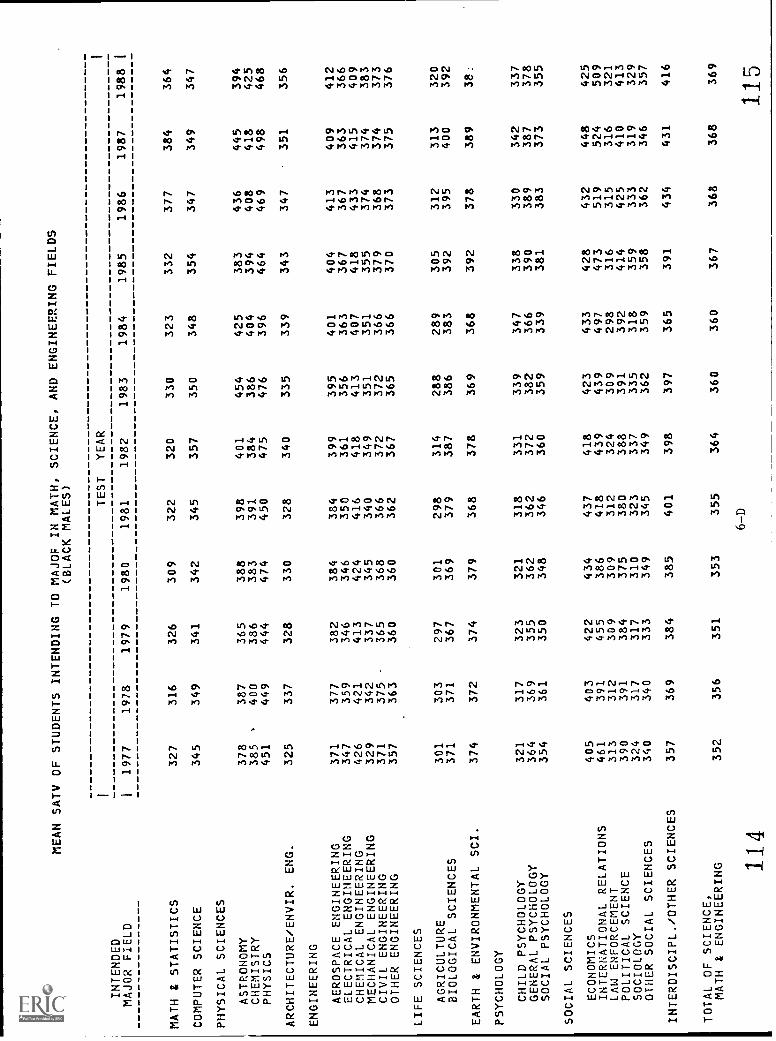
MEAN SATV OF STUDENTS INTENDING TO MAJOF IN MATH,
(BLACK MALES)
TEST
INTENDED
SCIENCE,
YEAR
AND ENGINEERING FIELDS
MAJOR FIELD
1977
1978
1979
1980
1981
1982
1983
1984
1985
1986
1987
1988
MATH & STATISTICS
327
316
326
309
322
320
330
323
332
377
384
364
COMPUTER SCIENCE
345
349
341
342
345
357
350
348
354
347
349
347
PHYSICAL SCIENCES
ASTRONOMY
378
387
365
388
398
401
454
425
383
436
445
394
CHEMISTRY
385
400
386
383
391
384
386
404
394
408
418
425
PHYSICS
451
449
444
474
450
475
476
396
464
469
498
468
ARCHITECTURE/ENVIR. ENG.
325
337
328
330
328
340
335
339
343
347
351
356
ENGINEERING
AEROSPACE ENGINEERING
371
377
382
384
384
399
395
401
404
413
409
412
ELECTRICAL ENGINEERING
347
359
346
346
350
361
356
363
367
367
363
366
CHEMICAL ENGINEERING
426
421
413
424
416
418
413
407
418
433
415
409
MECHANICAL ENGINEERING
329
342
337
345
340
349
351
351
355
374
374
383
CIVIL ENGINEERING
371
375
365
368
366
372
372
366
379
368
374
373
OTHER ENGINEERING
357
363
360
360
362
367
365
366
370
373
375
376
LIFE SCIENCES
AGRICULTURE
301
303
297
301
298
314
288
289
305
312
313
320
BIOLOGICAL SCIENCES
371
371
367
369
379
387
386
383
392
395
400
392
EARTH & ENVIRONMENTAL SCI.
374
372
374
379
368
378
369
368
392
378
389
38:
PSYCHOLOGY
CHILD PSYCHOLOGY
321
317
323
321
318
331
339
347
338
330
342
337
GENERAL PSYCHOLOGY
364
369
355
362
362
372
382
366
390
389
387
378
SOCIAL PSYCHOLOGY
354
361
350
348
346
360
359
339
381
383
373
355
SOCIAL SCIENCES
ECONOMICS
405
403
422
434
437
418
423
433
428
432
448
425
INTERNATIONAL RELATIONS
461
391
455
386
418
439
439
497
473
519
524
509
LAW ENFORCEMENT
313
312
309
309
312
324
309
298
316
315
316
321
POLITICAL SCIENCE
390
391
384
375
380
388
391
392
414
425
410
413
SOCIOLOGY
324
317
317
310
323
337
335
318
359
333
319
329
OTHER SOCIAL SCIENCES
340
340
333
349
345
349
362
359
358
362
346
357
INTERDISCIPL./OTHER SCIENCES
357
369
384
385
401
398
397
365
391
434
431
416
TOTAL OF SCIENCE,
MATH & ENGINEERING
352
356
351
353
355
364
360
360
367
368
368
369
6-D
114
115
I
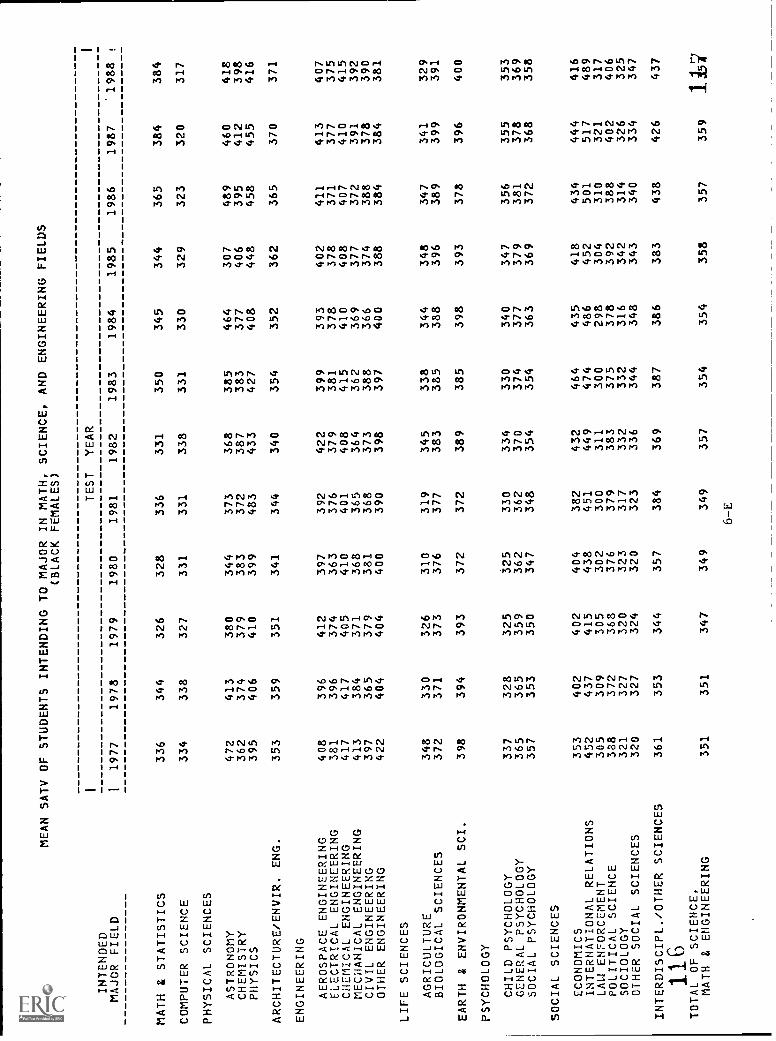
MEAN SATV OF STUDENTS INTENDING TO MAJOR IN MATH, SCIENCE, AND ENGINEERING
FIELDS
(BLACK FEMALES)
INTENDED
MAJOR FIELD
MATH & STATISTICS
COMPUTER SCIENCE
PHYSICAL SCIENCES
ASTRONOMY
CHEMISTRY
PHYSICS
ARCHITECTURE/ENVIR. ENG.
ENGINEERING
AEROSPACE ENGINEERING
ELECTRICAL ENGINEERING
CHEMICAL ENGINEERING
MECHANICAL ENGINEERING
CIVIL ENGINEERING
OTHER ENGINEERING
LIFE SCIENCES
AGRICULTURE
BIOLOGICAL SCIENCES
EARTH & ENVIRONMENTAL SCI.
PSYCHOLOGY
CHILD PSYCHOLOGY
GENERAL PSYCHOLOGY
SOCIAL PSYCHOLOGY
SOCIAL SCIENCES
ECONOMICS
INTERNATIONAL RELATIONS
LAW ENFORCEMENT
POLITICAL SCIENCE
SOCIOLOGY
OTHER SOCIAL SCIENCES
INTERDISCIPL./OTHER SCIENCES
116
TOTAL OF SCIENCE,
MATH & ENGINEERING
TEST
YEAR
I1977
1978
1979
1980
1981
1982
1983
1984
1985
1986
1987
336
344
326
328
336
331
350
345
344
365
384
334
338
327
331
331
338
331
330
329
323
320
472
413
380
344
373
368
385
464
307
489
460
362
374
379
383
372
387
383
377
406
395
412
395
406
410
399
483
433
427
408
448
458
455
353
359
351
341
344
340
354
352
362
365
370
408
396
412
397
392
422
399
393
402
411
413
381
396
374
363
376
379
381
378
378
371
377
417
417
405
410
401
408
415
410
408
407
410
413
384
371
368
365
364
362
369
377
372
391
397
365
379
381
368
373
388
366
374
388
378
422
404
404
400
390
398
397
400
388
384
384
348
330
326
310
319
345
338
344
348
347
341
372
371
373
376
377
383
385
388
396
389
399
398
394
393
372
372
389
385
398
393
378
396
337
328
325
325
330
334
330
340
347
356
355
365
365
359
362
362
370
374
377
379
381
378
357
353
350
347
348
354
354
363
369
372
368
353
402
402
404
382
432
464
435
418
434
444
452
437
415
438
451
449
474
486
452
501
517
305
309
305
302
300
311
300
298
304
310
321
388
372
368
376
379
383
375
378
392
388
402
321
327
320
323
317
332
332
316
342
314
326
320
327
324
320
323
336
344
348
343
340
334
361
353
344
357
384
369
387
386
383
438
426
351
351
347
349
349
357
354
354
358
357
359
6-E
1988
384
317
418
398
416
371
407
375
415
392
390
381
329
391
400
353
369
358
416
489
317
406
325
347
437
15i
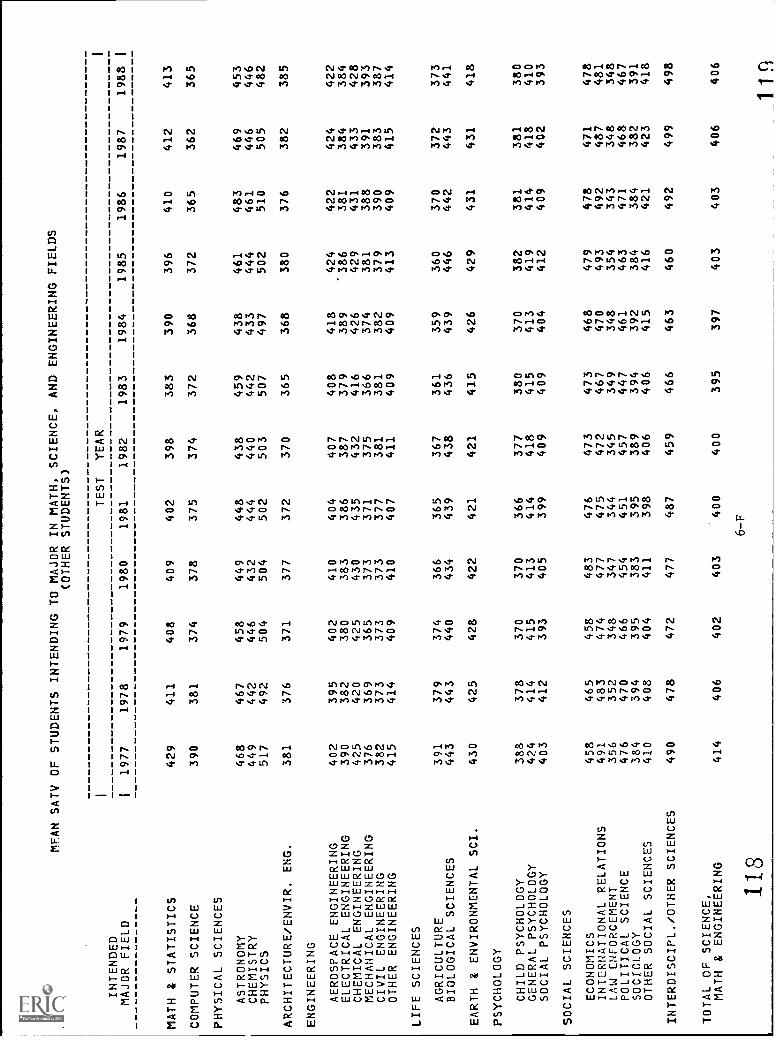
MEAN SATV OF STUDENTS INTENDING TO MAJOR IN MATH,
(OTHER STUDENTS)
TEST
INTENDED
SCIENCE,
YEAR
AND ENGINEERING FIELDS
MAJOR FIELD
I1977
1978
1979
1980
1981
1982
1983
1984
1985
1986
1987
1988
MATH & STATISTICS
429
411
408
409
402
398
383
390
396
410
412
413
COMPUTER SCIENCE
390
381
374
378
375
374
372
368
372
365
362
365
PHYSICAL SCIENCES
ASTRONOMY
468
467
458
449
448
438
459
438
461
483
469
453
CHEMISTRY
449
442
446
432
444
440
442
433
444
461
446
446
PHYSICS
517
492
504
504
502
503
507
497
502
510
505
482
ARCHITECTURE/ENVIR. ENG.
381
376
371
377
370
365
368
380
376
382
385
ENGINEERING
AEROSPACE ENGINEERING
402
395
402
410
407
408
418
424
422
424
422
ELECTRICAL ENGINEERING
390
382
380
383
386
387
379
389
386
381
384
384
CHEMICAL ENGINEERING
425
420
425
430
435
432
416
426
429
431
433
428
MECHANICAL ENGINEERING
376
369
365
373
371
375
366
374
381
388
391
393
CIVIL ENGINEERING
382
373
373
373
377
381
381
382
379
390
383
387
OTHER ENGINEERING
415
414
409
410
407
411
409
409
413
409
415
414
LIFE SCIENCES
AGRICULTURE
391
379
374
366
365
367
361
359
360
370
372
373
BIOLOGICAL SCIENCES
443
443
440
434
439
438
436
439
446
442
443
441
EARTH 8 ENVIRONMENTAL SCI.
430
425
428
422
421
421
415
426
429
431
431
418
PSYCHOLOGY
CHILD PSYCHOLOGY
388
378
370
370
366
377
380
370
382
381
381
380
GENERAL PSYCHOLOGY
424
414
415
413
414
418
415
413
419
414
418
410
SOCIAL PSYCHOLOGY
403
412
393
405
399
409
409
404
412
409
402
393
SOCIAL SCIENCES
ECONOMICS
458
465
458
483
476
473
473
468
479
478
471
478
INTERNATIONAL RELATIONS
491
483
474
477
475
472
467
470
493
492
487
481
LAN ENFORCEMENT
356
352
348
347
344
345
349
348
354
343
348
348
POLITICAL SCIENCE
476
470
466
454
451
457
447
461
463
471
468
467
SOCIOLOGY
384
394
395
383
395
389
394
392
384
384
382
391
OTHER SOCIAL SCIENCES
410
408
404
411
398
406
406
415
416
421
423
418
INTERDISCIPL./OTHER SCIENCES
490
478
472
477
487
459
466
463
460
492
499
498
TOTAL OF SCIENCE,
MATH & ENGINEERING
414
406
402
403
400
400
395
397
403
403
406
406
118
6-F
I
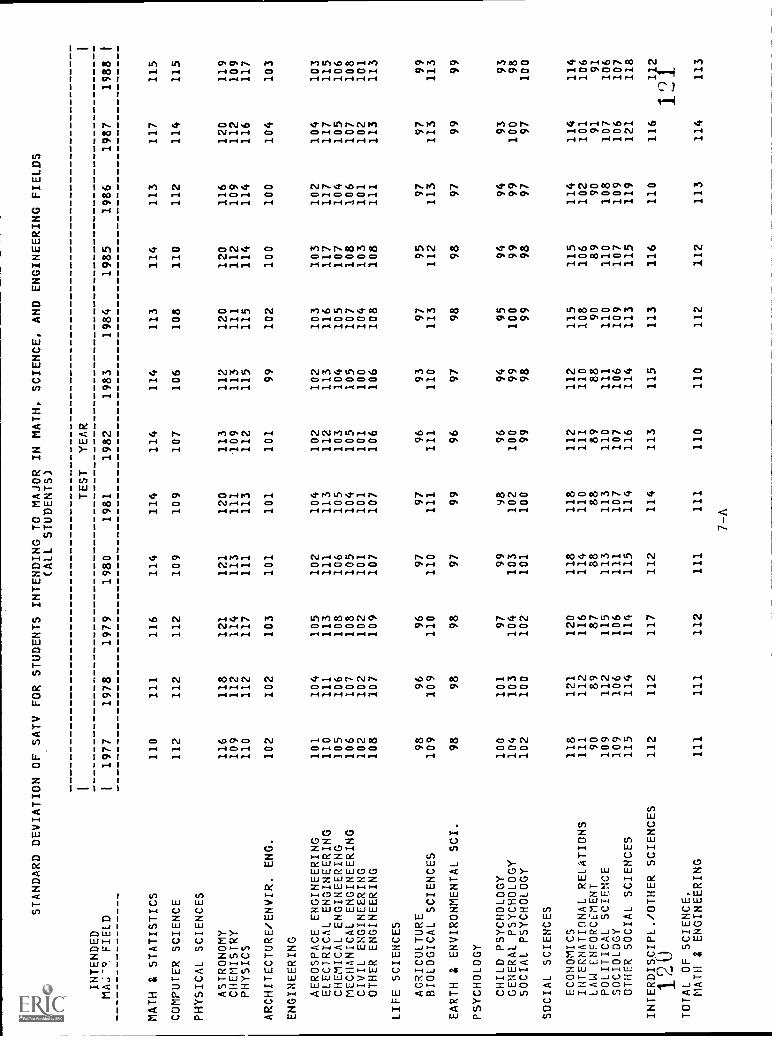
STANDARD DEVIATION OF SATV FOR STUDENTS INTENDING TO MAJOR IN MATH, SCIENCE, AND ENGINEERING FIELDS
(ALL STUDENTS)
INTENDED
MA.;-°. FIELD
MATH & STATISTICS
COMPUTER SCIENCE
PHYSICAL SCIENCES
ASTRONOMY
CHEMISTRY
PHYSICS
ARCHITECTURE/ENVIR. ENG.
ENGINEERING
AEROSPACE ENGINEERING
ELECTRICAL ENGINEERING
CHEMICAL ENGINEERING
MECHANICAL ENGINEERING
CIVIL ENGINEERING
OTHER ENGINEERING
LIFE SCIENCES
AGRICULTURE
BIOLOGICAL SCIENCES
EARTH & ENVIRONMENTAL SCI.
PSYCHOLOGY
CHILD PSYCHOLOGY
GENERAL PSYCHOLOGY
SOCIAL PSYCHOLOGY
SOCIAL SCIENCES
ECONOMICS
INTERNATIONAL RELATIONS
LAW ENFORCEMENT
POLITICAL SCIENCE
SOCIOLOGY
OTHER SOCIAL SCIENCES
INTERDISCIPL./OTHER SCIENCES
120
TOTAL OF SCIENCE,
MATH 4 ENGINEERING
1TEST
YEAR
11977
1978
1979
1980
1981
1982
1983
1984
1985
1986
1987
110
111
116
114
114
114
114
113
114
113
117
112
112
112
109
109
107
106
108
110
112
114
116
118
121
121
120
113
112
120
120
116
120
109
112
114
113
111
109
113
111
112
109
112
110
112
117
111
113
112
115
115
114
114
116
102
102
103
101
101
101
99
102
100
100
104
101
104
105
102
104
102
102
103
103
102
104
110
111
113
111
113
112
113
116
117
117
117
]05
106
108
106
105
103
104
105
107
104
105
106
107
108
105
104
105
105
107
108
106
107
102
102
102
101
101
101
100
104
103
101
102
108
107
109
107
107
106
106
108
108
111
113
98
96
96
97
97
96
93
97
95
97
97
109
109
110
110
111
111
110
113
112
113
113
98
98
98
97
99
96
97
98
98
97
99
100
101
97
99
98
96
94
95
94
94
93
104
103
104
103
102
100
99
100
99
99
100
102
100
102
101
100
99
98
99
98
97
97
118
121
120
118
118
112
112
115
115
114
114
111
112
116
114
110
111
110
108
106
102
101
90
89
87
88
88
89
88
90
89
90
91
109
112
115
113
113
110
111
110
110
108
107
109
106
106
111
107
107
106
109
107
109
106
115
114
114
115
114
116
114
113
115
119
121
112
112
117
112
114
113
115
113
116
110
116
111
111
112
111
111
110
110
112
112
113
114
7-A
1988
1
115
115
119
109
117
103
103
115
106
108
101
113 99
113 99
9398
100
114
106
91
106
107
118
112
1 ° 1 113
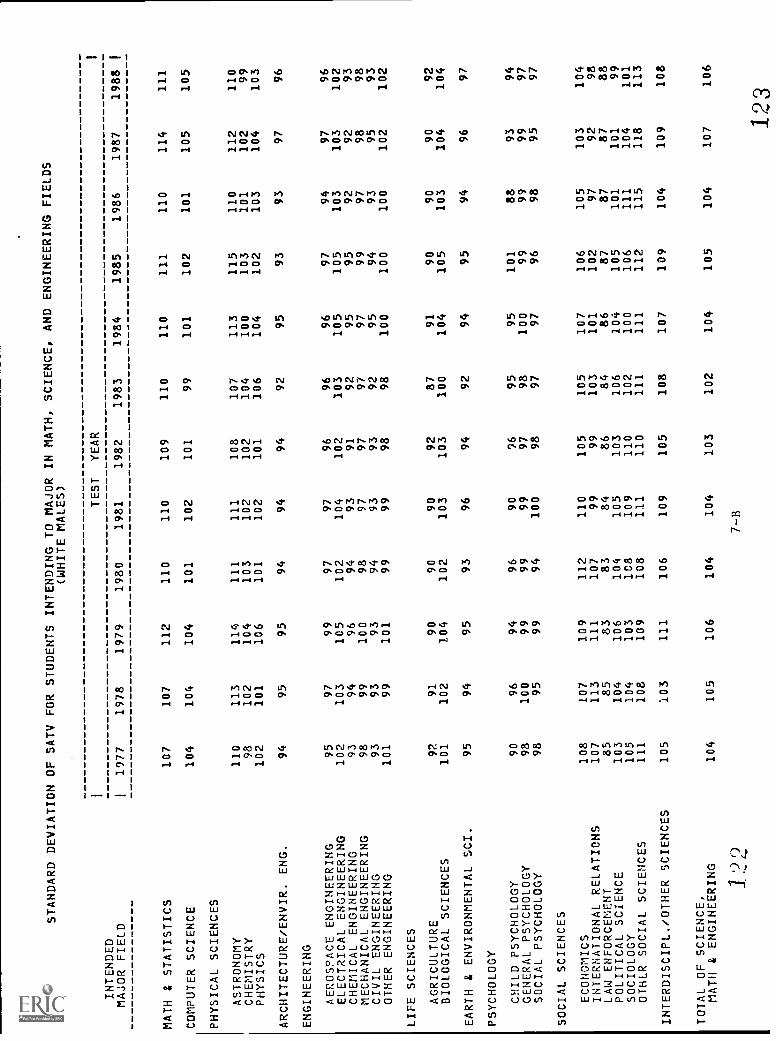
STANDARD DEVIATION OF SATV FOR STUDENTS INTENDING TO MAJOR IN MATH, SCIENCE, AND
ENGINEERING FIELDS
INTENDED
MAJOR FIELD
MATH & STATISTICS
COMPUTER SCIENCE
PHYSICAL SCIENCES
ASTRONOMY
CHEMISTRY
PHYSICS
ARCHITECTURE/ENVIR. ENG.
ENGINEERING
AEROSPACE ENGINEERING
ELECTRICAL ENGINEERING
CHEMICAL ENGINEERING
MECHANICAL ENGINEERING
CIVIL ENGINEERING
OTHER ENGINEERING
LIFE SCIENCES
AGRICULTURE
BIOLOGICAL SCIENCES
EARTH & ENVIRONMENTAL SCI.
PSYCHOLOGY
CHILD PSYCHOLOGY
GENERAL PSYCHOLOGY
SOCIAL PSYCHOLOGY
SOCIAL SCIENCES
ECONOMICS
INTERNATIONAL RELATIONS
LAW ENFORCEMENT
POLITICAL SCIENCE
SOCIOLOGY
OTHER SOCIAL SCIENCES
INTERDISCIPL./OTHER SCIENCES
TOTAL OF SCIENCE,
MATH & ENGINEERING
122
(WHITE MALES)
TEST
YEAR
11977
1978
1979
1980
1981
1982
1983
1984
1985
1986
1987
1988
107
107
112
110
110
109
110
110
111
110
114
111
104
104
104
101
101
99
101
102
101
105
105
110
113
114
111
111
108
107
113
115
110
112
110
98
102
104
103
102
102
104
100
103
101
102
99
102
101
106
101
102
101
106
104
102
103
104
103
94
95
95
94
94
94
92
95
93
93
97
96
95
97
99
97
97
96
96
96
97
94
97
96
102
103
105
102
104
102
103
105
105
103
103
102
93
94
96
94
93
91
92
95
95
92
92
93
98
99
100
98
97
97
97
97
99
97
98
98
93
93
93
94
93
93
92
95
94
93
95
93
101
99
101
99
99
98
98
100
100
100
102
102
92
91
90
90
90
92
87
91
90
90
90
92
101
102
104
102
103
103
100
104
105
103
104
104
95
94
95
93
96
94
92
94
95
94
96
97
90
96
94
96
90
96
95
95
101
88
93
94
98
100
99
99
99
97
98
100
99
99
99
97
98
95
99
94
100
98
97
97
96
98
95
97
108
107
109
112
110
105
105
107
106
105
103
104
107
113
111
107
99
99
103
101
102
97
92
98
85
85
83
83
84
86
84
86
87
87
87
88
103
104
106
104
105
103
106
104
105
101
101
99
105
104
103
108
109
110
102
100
106
111
104
101
111
108
109
108
111
110
111
111
112
115
118
113
105
103
111
106
109
105
108
107
109
104
109
108
104
105
106
104
104
103
102
104
105
104
107
106
7-B
123

STANDARD DEVIATION OF SATV FOR STUDENTS INTENDING TO MAJOR
(WHITE FEMALES)
TEST
INTENDED
MAJOR FIELD
11977
1978
1979
1980
1981
MATH & STATISTICS
97
97
101
100
100
COMPUTER SCIENCE
98
98
97
96
96
PHYSICAL SCIENCES
ASTRONOMY
110
117
115
116
120
CHEMISTRY
104
104
111
109
104
PHYSICS
100
108
115
106
110
ARCHITECTURE/ENVIR. ENG.
99
100
100
99
98
ENGINEERING
AEROSPACE ENGINEERING
103
103
101
101
104
ELECTRICAL ENGINEERING
102
103
105
102
106
CHEMICAL ENGINEERING
98
97
97
97
97
MECHANICAL ENGINEERING
102
96
100
102
98
CIVIL ENGINEERING
100
98
96
95
96
OTHER ENGINEERING
95
94
97
97
97
LIFE SCIENCES
AGRICULTURE
95
94
94
96
97
BIOLOGICAL SCIENCES
102
102
102
103
105
EARTH & ENVIRONMENTAL SCI.
98
97
98
97
98
PSYCHOLOGY
CHILD PSYCHOLOGY
92
94
90
93
92
GENERAL PSYCHOLOGY
97
96
97
97
96
SOCIAL PSYCHOLOGY
96
95
94
96
93
SOCIAL SCIENCES
ECONOMICS
105
112
111
108
106
INTERNATIONAL RELATIONS
104
98
101
104
102
LAW ENFORCEMENT
90
88
85
86
85
POLITICAL SCIENCE
99
101
103
100
103
SOCIOLOGY
95
92
94
100
94
OTHER SOCIAL SCIENCES
101
104
104
104
104
INTERDISCIPL./OTHER SCIENCES
110
107
108
109
108
TOTAL OF SCIENCE.
MATH & ENGINEERING
103
103
104
104
103
IN MATH,
YEAR
1982 99
95
104
102
115
97 97
101 93
1019795
95
104
93
919594
10299
85
100 96
107
105
102
SCIENCE, AND ENGINEERING FIELDS
1983
1984
1985
1986
99
99
100
98
94
94
96
100
110
114
115
112
102
101
105
102
114
103
112
111
95
98
97
96
93
96
97
97
100
99
103
102
92
91
93
92
92
97
95
97
95
91
99
92
94
93
95
95
91
97
96
96
1..i
104
103
104
96
99
98
95
89
91
90
90
93
95
94
94
93
94
94
92
102
99
106
97
96
99
95
92
86
86
86
86
98
99
101
100
94
99
98
97
104
104
105
111
107
106
110
105
101
103
103
104
1987 98
99
113
102
108
100
93
102
94 9093
96
95
103
98
909494
10490
889799
111
110
104
1
1988
I
98
102
10899
113
96
96
104
969798 98
100
104
96
88 9295
979466 9798
109
106
103
7-C
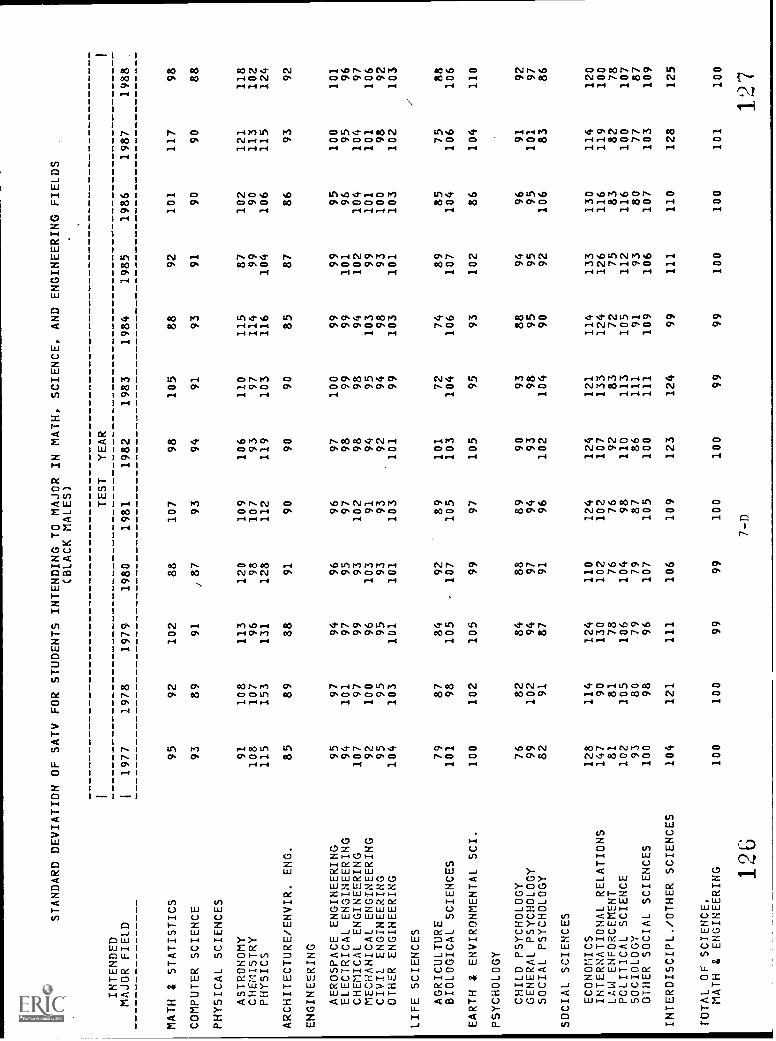
STANDARD DEVIATION OF SATV FOR STUDENTS INTENDING TO MAJOR
(BLACK MALES)
1TEST
INTENDED
MAJOR FIELD
11977
1978
1979
1980
1981
MATH & STATISTICS
95
92
102
88
107
COMPUTER SCIENCE
93
89
91
)87
93
PHYSICAL SCIENCES
ASTRONOMY
91
108
113
120
109
CHEMISTRY
108
107
96
98
107
PHYSICS
115
153
131
128
112
ARCHITECTURE/ENVIR. ENG.
85
89
88
91
90
ENGINEERING
AEROSPACE ENGINEERING
95
97
94
96
96
ELECTRICAL ENGINEERING
94
101
97
95
97
CHEMICAL ENGINEERING
107
97
99
93
102
MECHANICAL ENGINEERING
92
100
96
103
91
CIVIL ENGINEERING
95
95
95
93
93
OTHER ENGINEERING
104
103
101
101
103
LIFE SCIENCES
AGRICULTURE
79
87
84
92
89
BIOLOGICAL SCIENCES
101
98
105
-107
105
EARTH & ENVIRONMENTAL SCI.
100
102
105
99
97
PSYCHOLOGY
CHILD PSYCHOLOGY
76
82
84
88
89
GENERAL PSYCHOLOGY
99
102
94
97
94
SOCIAL PSYCHOLOGY
82
91
87
91
96
SOCIAL SCIENCES
ECONOMICS
128
114
124
110
124
INTERNATIONAL RELATIONS
147
90
130
102
102
LAW ENFORCEMENT
81
81
78
76
76
POLITICAL SCIENCE
102
105
106
104
98
SOCIOLOGY
93
80
79
79
87
OTHER SOCIAL SCIENCES
100
98
96
107
105
INTERDISCIPL./OTHER SCIENCES
104
121
111
106
109
TOTAL OF SCIENCE,
MATH & ENGINEERING
100
100
99
99
100
IN MATH,
YEAR
1982 98
94
10693
119
90
9798
98
9492
101
101
103
105
9093
102
124
10792
11086
100
123
100
SCIENCE, AND ENGINEERING FIELDS
1983
1984
1985
1986
105
88
92
101
91
93
91
90
110
115
87
102
97
114
99
90
103
116
104
106
90
85
87
86
100
99
99
95
99
99
101
96
98
94
102
104
95
103
99
101
94
98
93
100
99
103
101
103
72
74
89
85
104
106
107
104
95
93
102
86
93
88
94
96
98
95
95
95
104
90
92
106
121
114
133
130
133
124
126
116
83
72
75
83
113
105
112
116
111
91
93
80
111
109
106
107
124
99
111
110
99
99
100
100
1987
117 90
121
113
115
93
10095
104
101 98
102
75
106
104
91
10183
114
119
82
10077
103
128
101
1988 98
88
118
102
124 92
101
9697
106
92
103
--"
88
106
110 92
97
86
120
100
78
107
87
109
125
100
126
7-D
127
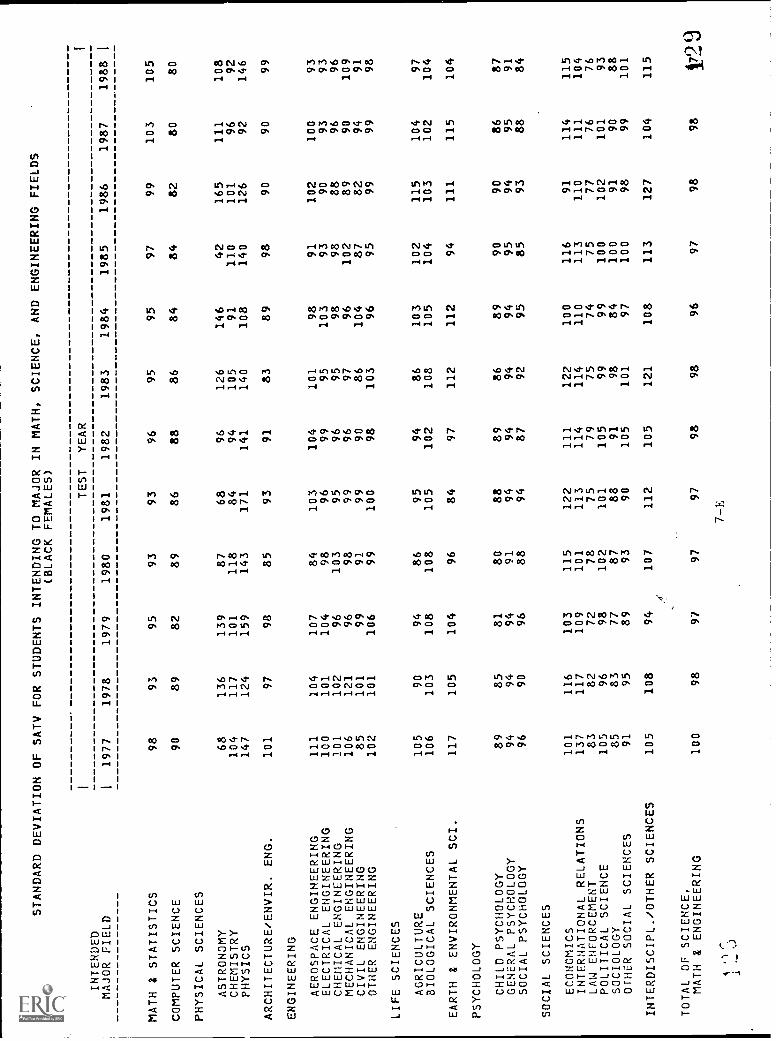
STANDARD DEVIATION OF SATV FOR STUDENTS
INTENDED
MAJOR FIELD
11977
1978
1979
MATH & STATISTICS
98
93
95
COMPUTER SCIENCE
90
89
82
PHYSICAL SCIENCES
ASTRONOMY
68
136
139
CHEMISTRY
104
117
101
PHYSICS
147
124
159
ARCHITECTURE/ENVIR. ENG.
101
97
98
ENGINEERING
AEROSPACE ENGINEERING
111
104
107
ELECTRICAL ENGINEERING
100
101
104
CHEMICAL ENGINEERING
101
102
96
MECHANICAL ENGINEERING
106
121
96
CIVIL ENGINEERING
85
101
99
OTHER ENGINEERING
102
101
106
LIFE SCIENCES
AGRICULTURE
105
90
94
BIOLOGICAL SCIENCES
106
103
108
EARTH & ENVIRONMENTAL SCI.
117
105
104
PSYCHOLOGY
CHILD PSYCHOLOGY
89
85
81
GENERAL PSYCHOLOGY
94
94
94
SOCIAL PSYCHOLOGY
96
90
96
SOCIAL SCIENCES
ECONOMICS
101
116
103
INTERNATIONAL RELATIONS
137
117
109
LAW ENFORCEMENT
83
82
72
POLITICAL SCIENCE
105
96
98
SOCIOLOGY
85
83
77
OTHER SOCIAL SCIENCES
91
95
89
INTERDISCIPL./OTHER SCIENCES
105
108
94
TOTAL OF SCIENCE,
MATH & ENGINEERING
100
98
97
INTENDING TO MAJOR
(BLACK FEMALES)
TEST
1980
1981
93
93
89
86
87
68
118
84
143
171
85
93
84
103
98
96
103
95
98
99
91
99
99
100
86
95
108
105
96
84
80
88
91
94
88
94
115
122
101
113
78
75
102
101
87
88
93
90
107
112
97
97
IN MATH,
YEAR
1982 96
88 9694
141 91
104 99
96969098 94
102
97
899487
111
114
79
10591
105
105 98
SCIENCE, AND ENGINEERING FIELDS
1983
1984
1985
1986
95
95
97
99
86
84
84
82
126
146
42
165
105
91
110
101
140
108
140
126
83
89
98
90
101
98
91
102
95
103
93
90
95
98
98
88
97
96
102
89
86
104
87
82
103
96
95
99
86
103
102
115
108
105
104
103
112
112
94
111
86
89
90
90
94
94
95
94
92
95
85
93
122
100
116
91
114
110
113
110
75
74
75
77
99
99
100
102
98
84
100
91
101
97
100
98
121
108
113
127
98
96
97
98
1987
103
80
111
9692 90
100
93
9690 9499
104
102
115
86 95
88
114
111 76
1019099
104
98
7-E
1988
1
105
80
10892
146
99
9393
96
1099198 97
104
104 8791
84
115
104769388
101
115 1729
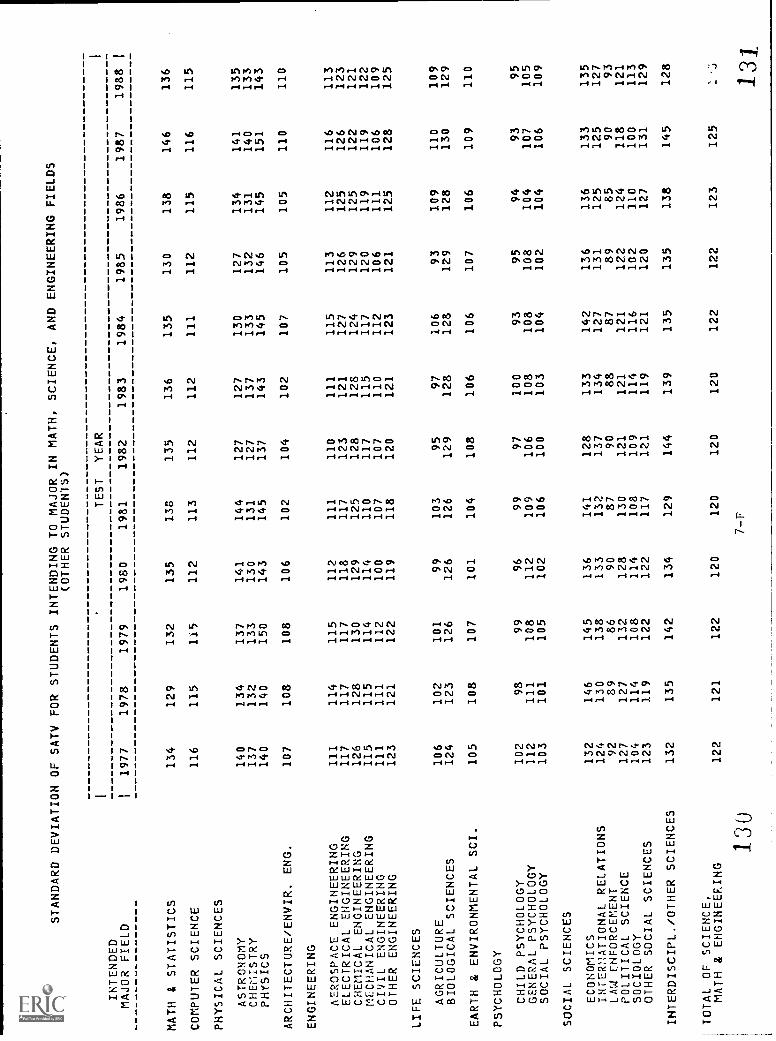
STANDARD DEVIATION OF SATV FOR STUDENTS
INTENDED
MAJOR FIELD
11977
1978
1979
MATH & STATISTICS
134
129
132
COMPUTER SCIENCE
116
115
115
PHYSICAL SCIENCES
ASTRONOMY
140
134
137
CHEMISTRY
137
132
133
PHYSICS
140
140
150
ARCHITECTURE/ENVIR. ENG.
107
108
108
ENGINEERING
AEROSPACE ENGINEERING
111
114
115
ELECTRICAL ENGINEERING
117
117
117
CHEMICAL ENGINEERING
126
128
130
MECHANICAL ENGINEERING
115
115
114
CIVIL ENGINEERING
111
111
112
OTHER ENGINEERING
123
121
122
LIFE SCIENCES
AGRICULTURE
106
102
101
BIOLOGICAL SCIENCES
124
123
126
EARTH & ENVIRONMENTAL SCI.
105
108
107
PSYCHOLOGY
CHILD PSYCHOLOGY
102
98
99
GENERAL PSYCHOLOGY
112
111
108
SOCIAL PSYCHOLOGY
103
101
105
SOCIAL SCIENCES
ECONOMICS
132
146
145
INTERHATIONAL RELATIONS
124
130
138
LAW ENFORCEMENT
92
89
86
POLITICAL SCIENCE
127
127
132
SOCIOLOGY
104
114
108
OTHER SOCIAL SCIENCES
123
119
122
INTERDISCIPL./OTHER SCIENCES
132
135
142
TOTAL OF SCIENCE,
MATH & ENGINEERING
122
121
122
INTENDING TO MAJOR
(OTHER STUDENTS)
TEST
1980
1981
135
112
113
141
144
130
131
143
145
106
102
112
111
118
117
129
125
114
110
100
107
119
118
99
103
126
126
101
104
96
99
112
109
102
106
136
141
133
132
90
87
128
130
114
108
122
117
134
129
120
120
IN MATH,
YEAR
1982
135
112
127
127
137
104
110
123
128
117
107
120 95
129
108
97
106
100
128
13790
121
109
121
144
120
SCIENCE, AND ENGINEERING FIELDS
1983
1984
1985
1986
136
135
130
138
112
111
112
115
127
130
127
134
137
133
132
131
143
145
146
145
102
107
105
105
111
115
113
112
121
127
126
125
128
124
129
125
115
117
120
119
110
112
106
111
121
123
121
125
97
106
93
109
128
128
129
128
106
106
107
106
100
93
95
94
108
108
108
104
103
104
102
104
133
142
136
136
134
127
131
125
88
87
89
85
121
121
122
124
114
116
102
110
119
121
120
127
139
135
135
138
120
122
122
123
1987
146
116
141
140
151
110
116
126
122
119
106
128
110
130
109
93
107
106
133
12590
118
100
131
145
125
I
1988
1
136
115
135
133
143
110
113
123
121
122
109
125
109
129
110 95
105
109
135
127 93
121
113
129
128
130
7-F
13]

MEAN SATM OF STUDENTS INTENDING TO MAJOR IN MATH, SCIENCE, AND ENGINEERNG FIELDS
(ALL STUDENTS)
TEST
YEAR
INTENDED
MAJOR FIELD
I1977
1978
1979
1980
1981
1982
1983
1984
1985
1986
1987
1988
MATH & STATISTICS
588
585
580
577
569
572
578
578
593
602
596
COMPUTER SCIENCE
529
522
517
513
507
502
497
496
501
489
485
479
PHYSICAL SCIENCES
595
590
586
585
580
582
583
583
587
598
597
584
ARCHITECTURE/ENVIR. ENG.
506
501
496
492
489
487
486
486
491
494
498
500
ENGINEERING
550
543
540
538
537
540
543
546
548
553
555
548
LIFE SCIENCES
500
496
493
490
489
489
494
499
505
504
505
504
EARTH & ENVIRONMENTAL SCI.
501
495
490
489
486
485
485
485
487
489
487
486
PSYCHOLOGY
455
449
447
447
447
446
449
453
455
455
459
457
SOCIAL SCIENCES
465
456
457
460
461
464
468
470
475
469
470
471
INTERDISCIPL/OTHER SCIENCES
593
585
578
574
575
572
572
575
575
589
600
597
TOTAL OF SCIENCE,
MATH & ENGINEERING
514
509
507
507
507
508
509
511
514
513
513
507
132
8-A
133

MEAN SATM OF STUDENTS INTENDING TO MAJOR IN MATH, SCIENCE, AND ENGINEERNG FIELDS
INTENDED
MAJOR FIELD
I
MATH & STATISTICS
COMPUTER SCIENCE
PHYSICAL SCIENCES
ARCHITECTURE/ENVIR. ENG.
ENGINEERING
LIFE
CIENCES
EARTh & ENVIRONMENTAL SCI.
PSYCHOLOGY
SOCIAL SCIENCES
INTERDISCIPL/OTHER SCIENCES
TOTAL OF SCIENCE,
MATH & ENGINEERING
134
(WHIE MALES)
TEST
YEAR
1)77
1978
1979
1980
1981
1982
1983
1984
1985
1986
1987
1988
617
617
614
608
604
600
601
605
608
621
633
626
567
562
554
551
544
540
534
533
540
538
541
537
614
612
606
605
599
605
605
606
609
617
617
610
519
514
510
505
502
501
498
496
502
505
508
510
560
556
552
550
549
553
555
558
561
570
573
567
517
510
505
502
503
502
505
509
514
518
516
517
510
505
500
499
497
496
494
493
497
501
498
498
502
495
496
491
491
492
490
489
495
501
504
501
500
490
490
493
494
494
492
492
497
496
497
497
610
605
596
592
590
591
591
593
591
601
615
610
545
541
538
537
536
538
538
539
543
546
547
542
2t..7
8 -B
1
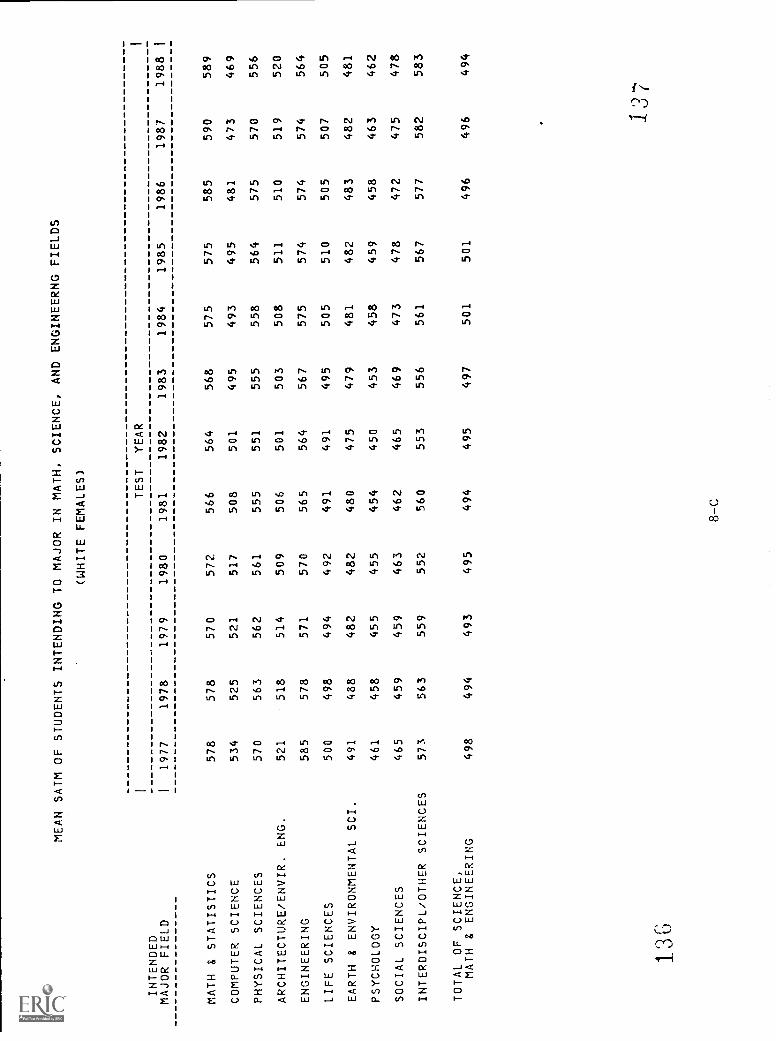
MEAN SATM OF STUDENTS INTENDING TO MAJOR IN MATH, SCIENCE, AND
ENGINEERNG FIELDS
(WHITE FEMALES)
TEST
YEAR
INTENDED
MAJOR FIELD
I1977
1978
1979
1980
1981
1982
1983
1984
1985
1986
1987
1988
MATH & STATISTICS
578
578
570
572
566
564
568
575
575
585
590
589
COMPUTER SCIENCE
534
525
521
517
508
501
495
493
495
481
473
469
PHYSICAL SCIENCES
570
563
562
561
555
551
555
558
564
575
570
556
ARCHITECTURE/ENVIR. ENG.
521
518
514
509
506
501
503
508
511
510
519
520
ENGINEERING
585
578
571
570
565
564
567
575
574
574
574
564
LIFE SCIENCES
500
498
494
492
491
491
495
505
510
505
507
505
EARTH & ENVIRONMENTAL SCI.
491
488
482
482
480
475
479
481
482
483
482
481
PSYCHOLOGY
461
458
455
455
454
450
453
458
459
458
463
462
SOCIAL SCIENCES
465
459
459
463
462
465
469
473
478
472
475
478
INTERDISCIPL/OTHER SCIENCES
573
563
559
552
560
553
556
561
567
577
582
583
TOTAL OF SCIENCE,
MATH & ENGINEERING
498
494
493
495
494
495
497
501
501
496
496
494
13
8-C
I

MEAN SATM OF STUDENTS
I
INTENDED
INTENDING TO MAJOR IN MATH,
(BLACK MALES)
TEST
SCIENCE, AND ENGINEERNG FIELDS
YEAR
I
MAJOR FIELD
I1977
1978
1979
1980
1981
1982
1983
1984
1985
1986
1987
1988
I
MATH & STATISTICS
429
411
418
404
420
415
428
430
437
479
494
478
COMPUTER SCIENCE
399
396
395
393
399
400
399
401
403
396
395
396
PHYSICAL SCIENCES
464
451
453
456
455
457
473
449
467
469
492
477
ARCHITECTURE/ENVIR. ENG.
379
389
382
382
382
390
386
389
389
394
397
405
ENGINEERING
422
424
420
424
423
429
431
434
437
439
440
444
LIFE SCIENCES
386
386
387
385
392
395
400
397
406
41)9
411
413
EARTH & ENVIRONMENTAL SCI.
385
384
395
395
380
401
392
382
394
405
415
402
PSYCHOLOGY
369
364
367
366
366
368
369
375
389
390
389
386
SOCIAL SCIENCES
365
359
369
368
371
373
373
363
383
375
367
369
INTERDISCIPL/OTHER SCIENCES
402
418
427
436
450
446
433
420
445
452
477
470
TOTAL OF SCIENCE,
MATH & ENGINEERING
400
401
402
404
406
410
411
411
417
417
417
418
133
8-D
139
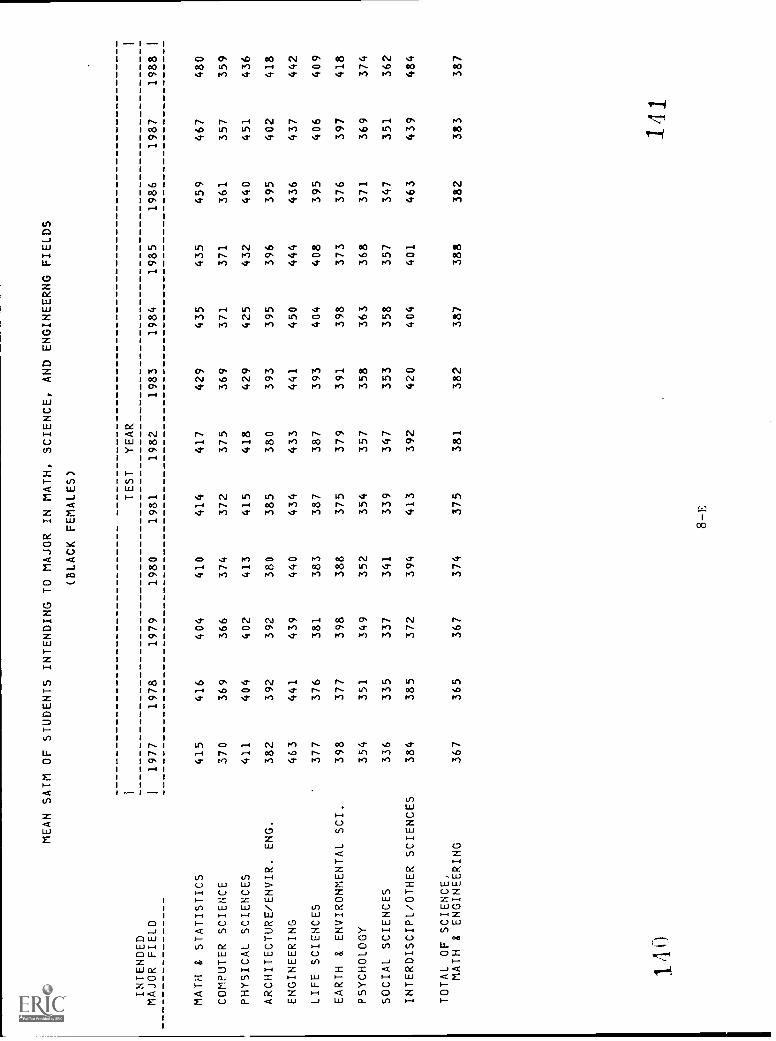
INTENDED
MEAN SATM OF STUDENTS INTENDING TO MAJOR IN MATH, SCIENCE, AND ENGINEERNG FIELDS
(BLACK FEMALES)
TEST
YEAR
MAJOR FIELD
I1977
1978
1979
1980
1981
1982
1983
1984
1985
1986
1987
1988
MATH & STATISTICS
415
416
404
410
414
417
429
435
435
459
467
480
COMPUTER SCIENCE
370
369
366
374
372
375
369
371
371
361
357
359
PHYSICAL SCIENCES
411
404
402
413
415
418
429
425
432
440
451
436
ARCHITECTURE/ENVIR. ENG.
382
392
392
380
385
380
393
395
396
395
402
418
ENGINEERING
463
441
439
440
434
433
441
450
444
436
437
442
LIFE SCIENCES
377
376
381
383
387
387
393
404
408
395
406
409
EARTH & ENVIRONMENTAL SCI.
398
377
398
388
375
379
391
398
373
376
397
418
PSYCHOLOGY
354
351
349
352
354
357
358
363
368
371
369
374
SOCIAL SCIENCES
336
335
337
341
339
347
353
358
357
347
351
362
INTERDISCIPL/OTHER SCIENCES
384
385
372
394
413
392
420
404
401
463
439
484
TOTAL OF SCIENCE,
MATH & ENGINEERING
367
365
367
374
375
381
382
387
388
382
383
387
110
8-E
141
I
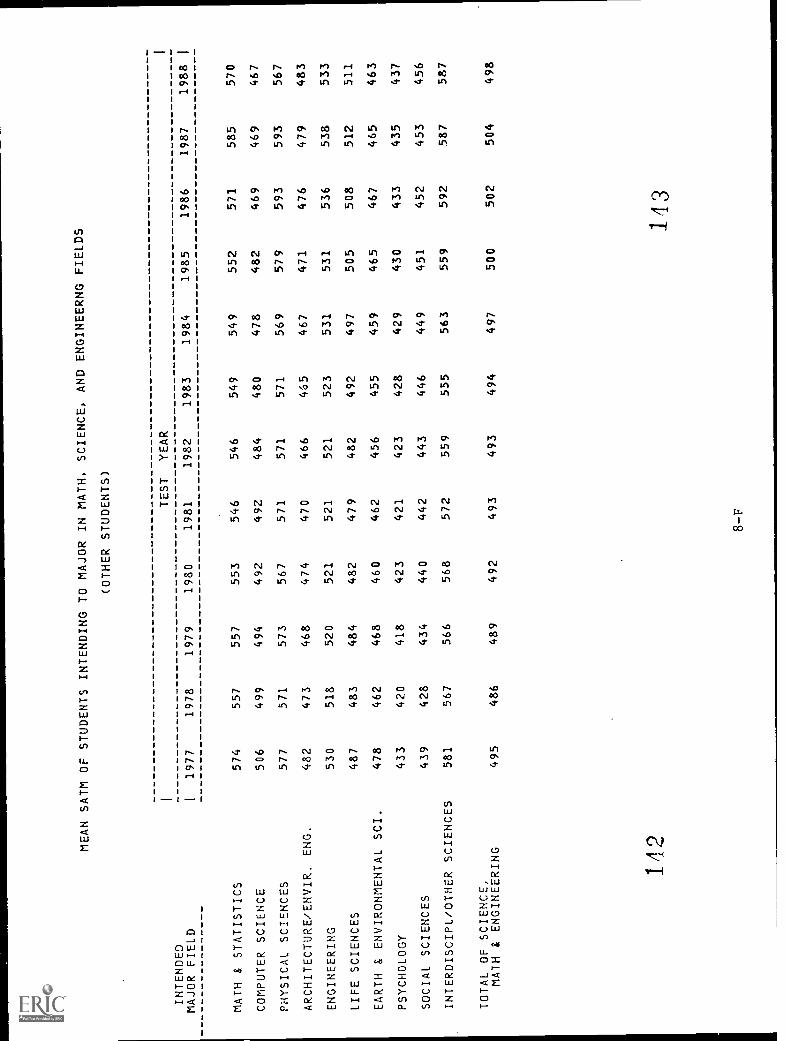
MEAN SATM OF STUDENTS INTENDING TO MAJOR IN
MATH, SCIENCE, AND ENGINEERNG FIELDS
(OTHER STUDENTS)
TEST
YEAR
INTENDED
MAJOR FIELD
I1977
1978
1979
1980
1981
1982
1983
1984
1985
1986
1987
1988
MATH & STATISTICS
574
557
557
553
546
546
549
549
552
571
585
570
COMPUTER SCIENCE
506
499
494
492
492
484
480
478
482
469
469
467
PHYSICAL SCIENCES
577
571
573
567
571
571
571
569
579
593
593
567
ARCHITECTURE/ENVIR. ENG.
482
473
468
474
470
466
465
467
471
476
479
483
ENGINEERING
530
518
520
521
521
521
523
531
531
536
538
533
LIFE SCIENCES
487
483
484
482
479
482
492
497
505
508
512
511
EARTH & ENVIRONMENTAL SCI.
478
462
468
460
462
456
455
459
465
467
465
463
PSYCHOLOGY
433
420
418
423
421
423
428
429
430
433
435
437
SOCIAL SCIENCES
439
428
434
440
443
446
449
451
452
453
456
INTERDISCIPL/OTHER SCIENCES
581
567
566
568
572
559
555
563
559
592
587
587
TOTAL OF SCIENCE.
MATH & ENGINEERING
495
486
489
492
493
493
494
497
500
502
504
498
I
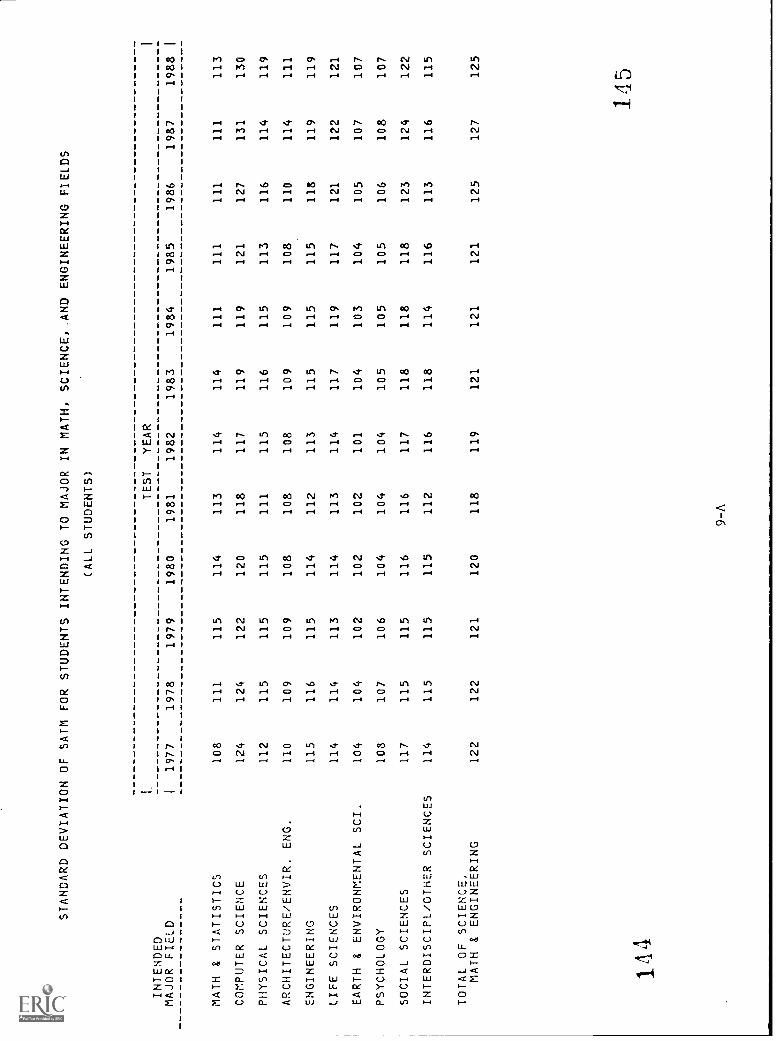
STANDARD DEVIATION OF SATM
INTENDED
MAJOR FIELD
11977
MATH & STATISTICS
108
COMPUTER SCIENCE
124
PHYSICAL SCIENCES
112
ARCHITECTURE/ENVIR
ENG.
110
ENGINEERING
115
LIFE SCIENCES
114
EARTH & ENVIRONMENTAL SCI.
104
PSYCHOLOGY
108
SOCIAL SCIENCES
117
INTERDISCIPL/OTHER SCIENCES
114
TOTAL OF SCIENCE,
MATH & ENGINEERING
122
FOR STUDENTS
1978
1979
111
115
124
122
115
115
109
109
116
115
114
113
104
102
107
106
115
115
115
115
122
121
INTENDING
(ALL
1980
114
120
115
108
114
114
102
104
116
115
120
TO MAJOR
STUDENTS)
TEST
1981
113
118
111
108
112
113
102
104
116
112
118
IN MATH,
YEAR
1982
114
117
115
108
113
114
101
104
117
116
119
SCIENCE, AND ENGINEERING FIELDS
1983
1984
1985
1986
114
111
111
111
119
119
121
127
116
115
113
116
109
109
108
110
115
115
115
118
117
119
117
121
104
103
104
105
105
105
105
106
118
118
118
123
118
114
116
113
121
121
121
125
1987
111
131
114
114
119
122
107
108
124
116
127
1
1988
1
113
130
119
111
119
121
107
107
122
115
125
145
1A4
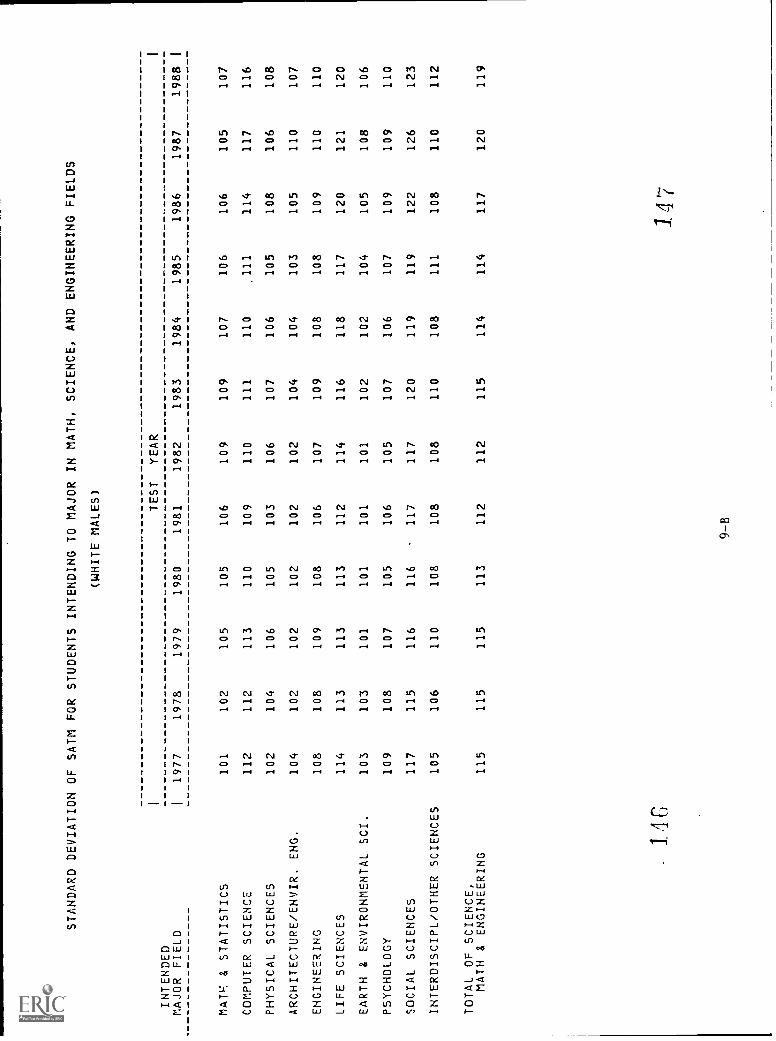
STANDARD DEVIATION OF SATM FOR STUDENTS INTENDING TO MAJOR IN MATH, SCIENCE, AND ENGINEERING FIELDS
(WHITE MALES)
INTENDED
TEST
YEAR
MAJOR FIELD
I1977
1978
1979
1980
1981
1982
1983
1984
1985
1986
1987
1988
MAW. & STATISTICS
101
102
105
105
106
109
109
107
106
106
105
107
COMPUTER SCIENCE
112
112
113
110
109
110
111
110
.111
114
117
116
PHYSICAL SCIENCES
102
104
106
105
103
106
107
106
105
108
106
108
ARCHITECTURE/ENVIR. ENG.
104
102
102
102
102
102
104
104
103
105
110
107
ENGINEERING
108
108
109
108
106
107
109
108
108
109
110
110
LIFE SCIENCES
114
113
113
113
112
114
116
118
117
120
121
120
EARTH & ENVIRONMENTAL SCI.
103
103
101
101
101
101
102
102
104
105
108
106
PSYCHOLOGY
109
108
107
105
106
105
107
106
107
109
109
110
SOCIAL SCIENCES
117
115
116
116
117
117
120
119
119
122
126
123
INTERDISCIPL /OTHER SCIENCES
105
106
110
108
108
108
110
108
111
108
110
112
TOTAL OF SCIENCE,
MATH & ENGINEERING
115
115
115
113
112
112
115
114
114
117
120
119
116
9-B
147
I
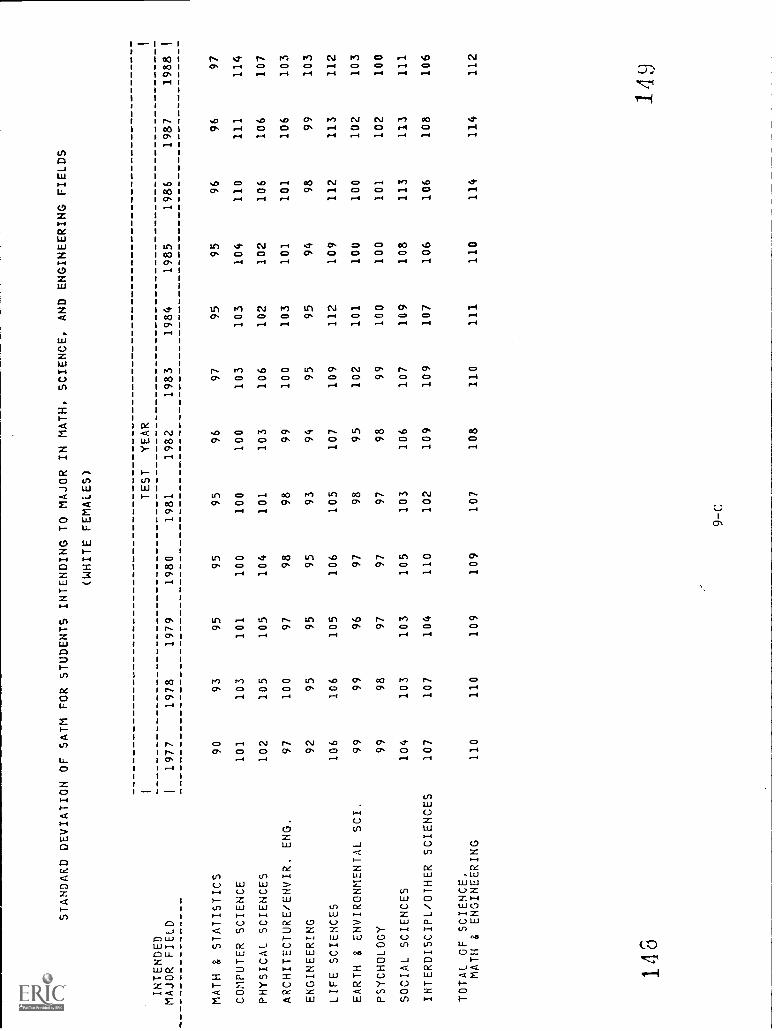
STANDARD DEVIATION OF SATM FOR STUDENTS INTENDING TO MAJOR IN MATH, SCIENCE, AND ENGINEERING FIELDS
(WHITE FEMALES)
TEST
YEAR
INTENDED
MAJOR FIELD
I1977
1978
1979
1980
1981
1982
1983
1984
1985
1986
1987
1988
MATH & STATISTICS
90
93
95
95
95
96
97
95
95
96
96
97
COMPUTER SCIENCE
101
103
101
100
100
100
103
103
104
110
111
114
PHYSICAL SCIENCES
102
105
105
104
101
103
106
102
102
106
106
107
ARCHITECTURE /ENVIR. ENG.
97
100
97
98
98
99
100
103
101
101
106
103
ENGINEERING
92
95
95
95
93
94
95
95
94
98
99
103
LIFE SCIENCES
106
106
105
106
105
107
109
112
109
112
113
112
EARTH & ENVIRONMENTAL SCI.
99
99
96
97
98
95
102
101
IOU
100
102
103
PSYCHOLOGY
99
98
97
97
97
98
99
100
100
101
102
100
SOCIAL SCIENCES
104
103
103
105
103
106
107
109
108
113
113
111
INTERDISCIPL/OTHER SCIENCES
107
107
104
110
102
109
109
107
106
106
108
106
TOTAL OF SCIENCE,
MATH & ENGINEERING
110
110
109
109
107
108
110
111
110
114
114
112
148
149
9-C
I
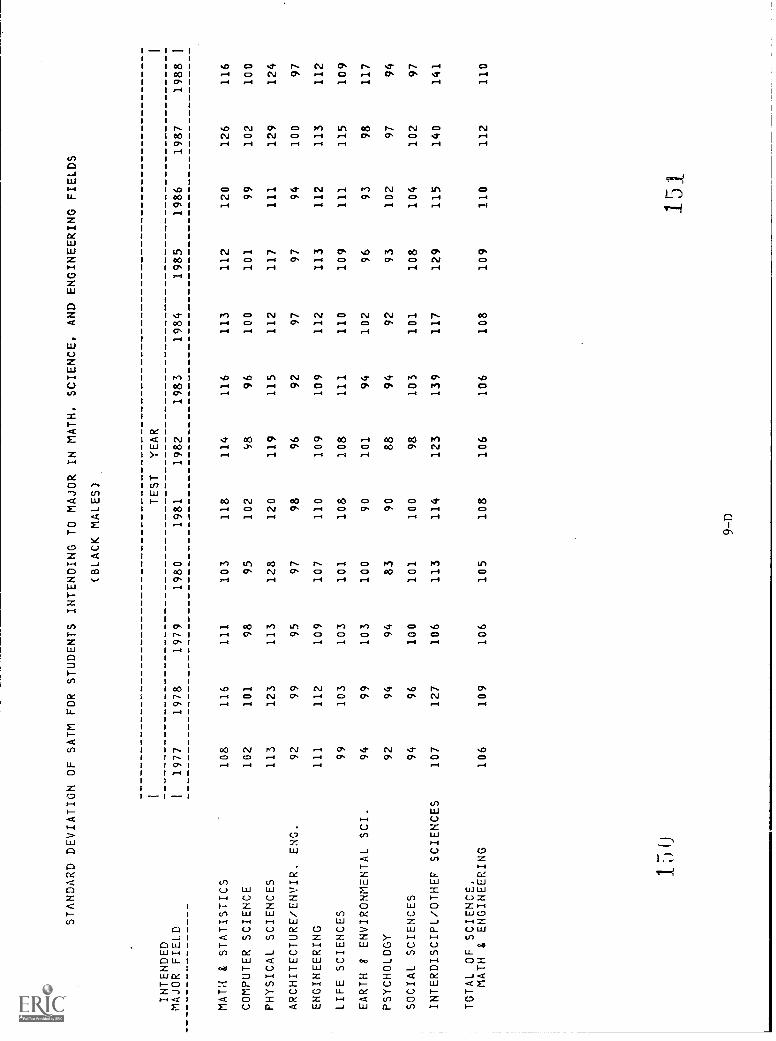
STANDARD DEVIATION OF SATM FOR STUDENTS INTENDING TO MAJOR IN MATH, SCIENCE, AND ENGINEERING FIELDS
(BLACK MALES)
INTENDED
TEST
YEAR
MAJOR FIELD
I1977
1978
1979
1980
1981
1982
1983
1984
1985
1986
1987
1988
MATT & STATISTICS
108
116
111
103
118
114
116
113
112
120
126
116
COMPUTER SCIENCE
102
101
98
95
102
98
96
100
101
99
102
100
PHYSICAL SCIENCES
113
123
113
128
120
119
115
112
117
111
129
124
ARCHITECTURE/ENVIR. ENG.
92
99
95
97
98
96
92
97
97
94
100
97
ENGINEERING
111
112
109
107
110
109
109
112
113
112
113
112
LIFE SCIENCES
99
103
103
101
108
108
111
110
109
111
115
109
EARTH 8
ENVIRONMENTAL SCI.
94
99
103
100
90
101
94
102
96
93
98
117
PSYCHOLOGY
92
94
94
83
90
88
94
92
93
102
97
94
SOCIAL SCIENCES
94
96
100
101
100
98
103
101
108
104
102
97
INTERDISCIPL/OTHEF SCIENCES
107
127
106
113
114
123
139
117
129
115
140
141
TOTAL OF SCIENCE,
MATH & ENGINEERING
106
109
106
105
108
106
106
108
109
110
112
110
I
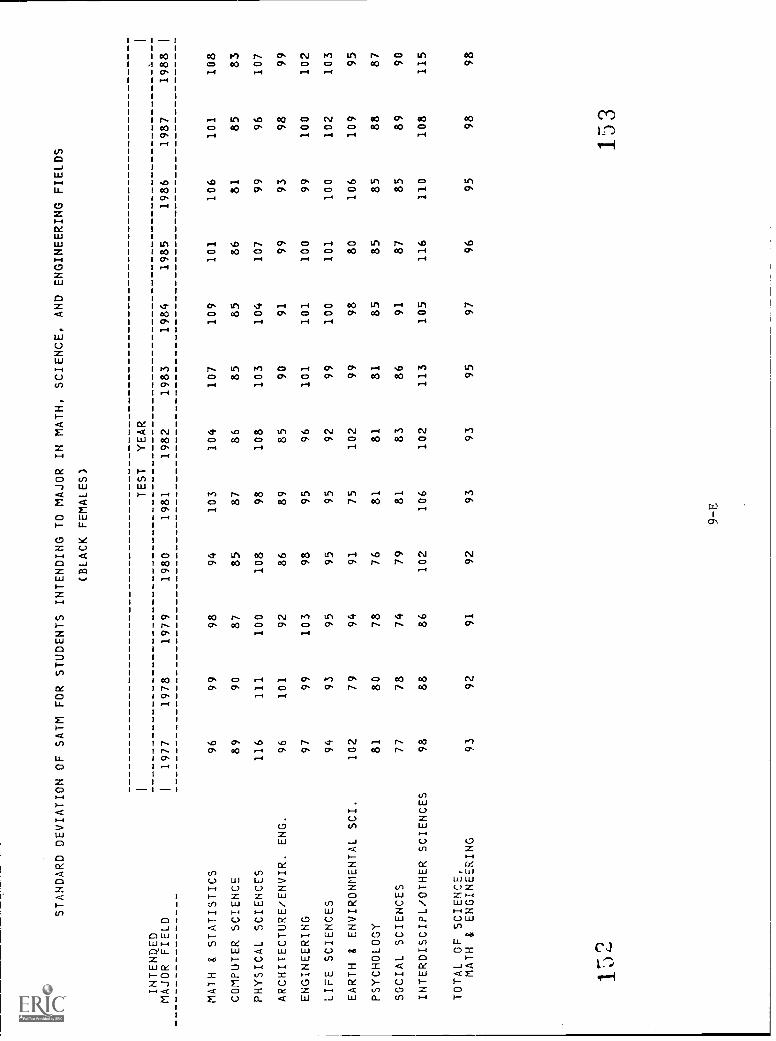
STANDARD DEVIATION OF SATM FOR STUDENTS INTENDING TO MAJOR
(BLACK FEMALES)
IN MATH,
SCIENCE, AND ENGINEERING FIELDS
1TEST
YEAR
1
INTENDED
MAJOR FIELD
11977
1978
1979
1980
1981
1982
1983
1984
1985
1986
1987
1988
1
MATH & STATISTICS
96
99
98
94
103
104
107
109
101
106
101
108
COMPUTER SCIENCE
89
90
87
85
87
86
85
85
86
81
85
83
PHYSICAL SCIENCES
116
111
100
108
98
108
103
104
107
99
96
107
ARCHITECTURE/ENVIR. ENG.
96
101
92
86
89
85
90
91
99
93
98
99
ENGINEERING
97
99
103
98
95
96
101
101
100
99
100
102
LIFE SCIENCES
94
93
95
95
95
92
99
100
101
100
102
103
EARTH & ENVIRONMENTAL SCI.
102
79
94
91
75
102
99
98
80
106
109
95
PSYCHOLOGY
81
80
78
76
81
81
81
85
85
85
88
87
SOCIAL SCIENCES
77
78
74
79
81
83
86
91
87
85
89
90
INTERDISCIPL/OTHER SCIENCES
98
88
86
102
106
102
113
105
116
110
108
115
TOTAL OF SCIENCE,
MATH & ENGINEERING
93
92
91
92
93
93
95
97
96
95
98
98
153
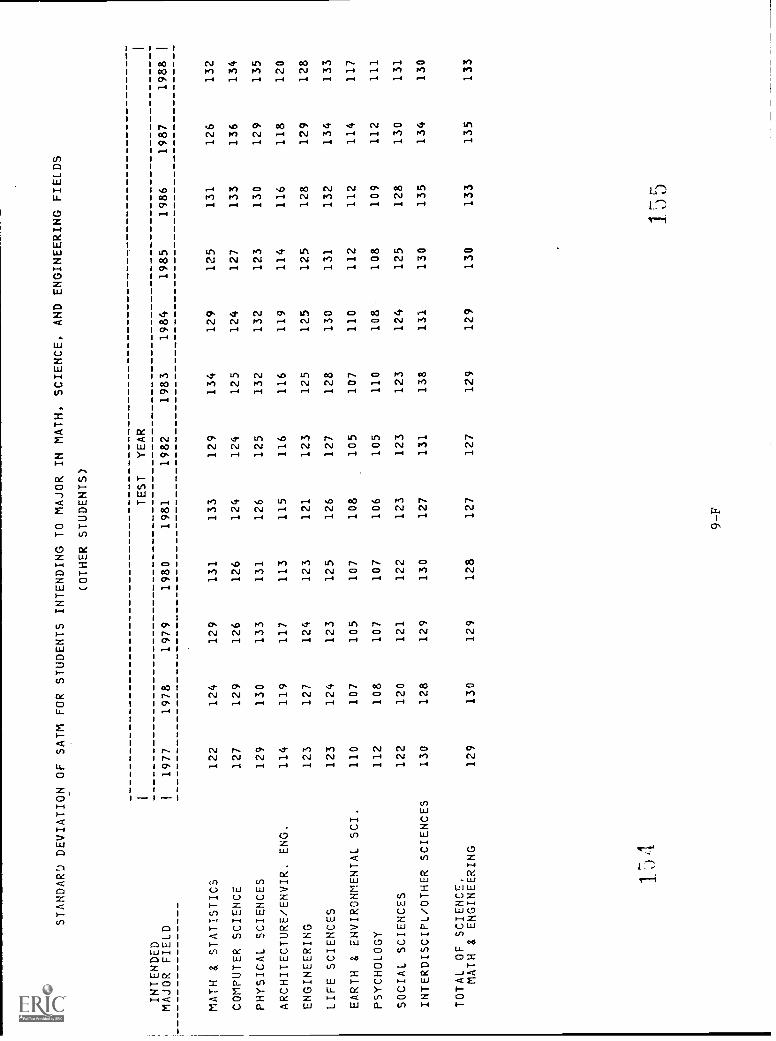
STANDARD DEVIATION OF SATM FOR STUDENTS INTENDING TO MAJOR IN MATH,
SCIENCE, AND ENGINEERING FIELDS
(OTHER STUDENTS)
INTENDED
TEST
YEAR
MAJOR FIELD
I1977
1978
1979
1980
1981
1982
1983
1984
1985
1986
1987
1988
MATH & STATISTICS
122
124
129
131
133
129
134
129
125
131
126
132
COMPUTER SCIENCE
127
129
126
126
124
124
125
124
127
133
136
134
PHYSICAL SCIENCES
129
130
133
131
126
125
132
132
123
130
129
135
ARCHITECTURE/ENVIR. ENG.
114
119
117
113
115
116
116
119
114
116
118
120
ENGINEERING
123
127
124
123
121
123
125
125
125
128
129
128
LIFE SCIENCES
123
124
123
125
126
127
128
130
131
132
134
133
EARTH & ENVIRONMENTAL SCI.
110
107
105
107
108
105
107
110
112
112
114
117
PSYCHOLOGY
112
108
107
107
106
105
110
108
108
109
112
111
SOCIAL SCIENCES
122
120
121
122
123
123
123
124
125
128
130
131
INTERDISCIPL/OTHER SCIENCES
130
128
129
130
127
131
138
131
130
135
134
130
TOTAL OF SCIENCE,
MATH & ENGINEERING
129
130
129
128
127
127
129
129
130
133
135
133
1 5
/1
9-F
1 5
5
I
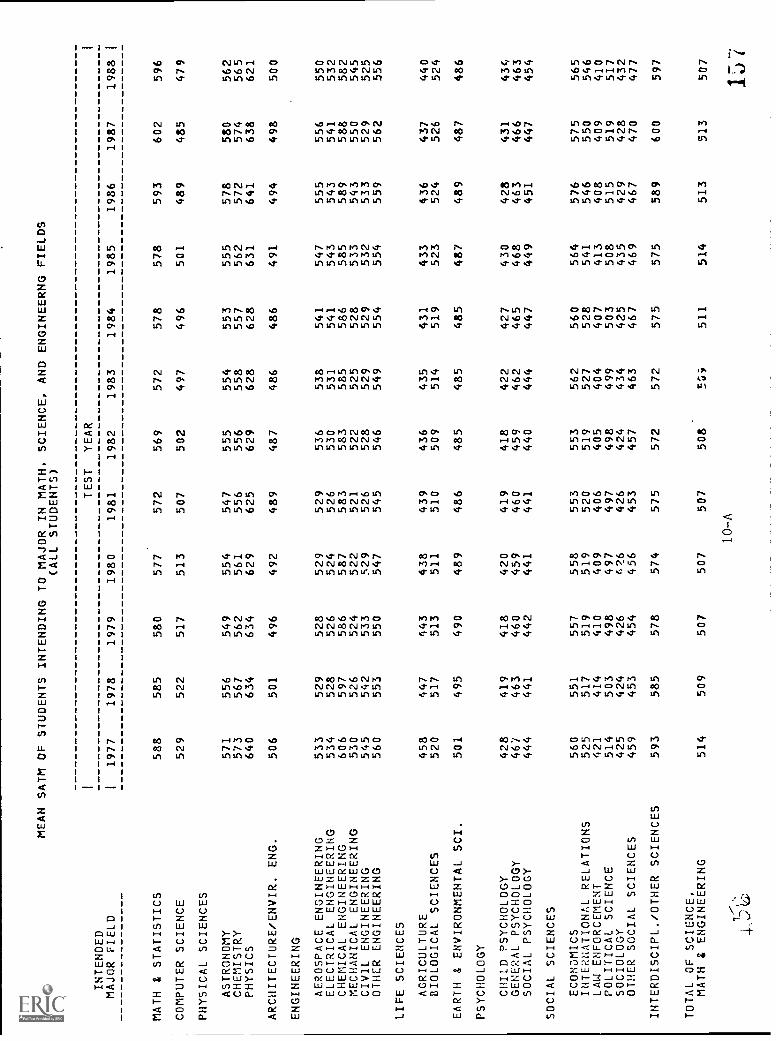
MEAN SATM OF STUDENTS INTENDING TO MAJOR IN MATH,
(ALL STUDENTS)
TEST
INTENDED
SCIENCE, AND ENGINEERNG FIELDS
YEAR
MAJOR FIELD
I1977
1978
1979
1980
1981
1982
1983
1984
1985
1986
1987
1988
MATH & STATISTICS
588
585
580
577
572
569
572
578
578
593
602
596
COMPUTER SCIENCE
529
522
517
513
507
502
497
496
501
489
485
479
PHYSICAL SCIENCES
ASTRONOMY
571
556
549
554
547
555
554
553
555
578
580
562
CHEMISTRY
573
567
562
561
556
556
558
557
562
572
574
565
PHYSICS
640
634
634
629
625
629
628
628
631
641
638
621
ARCHITECTURE/ENVIR. ENG.
506
501
496
492
489
487
486
486
491
494
498
500
ENGINEERING
AEROSPACE ENGINEERING
533
529
528
529
529
536
538
541
547
555
556
550
ELECTRICAL ENGINEERING
534
528
526
524
526
530
531
541
543
543
541
532
CHEMICAL ENGINEERING
606
597
586
587
583
583
585
586
585
589
588
582
MECHANICAL ENGINEERING
530
526
524
522
521
522
525
528
533
543
550
545
CIVIL ENGINEERING
545
542
533
529
526
528
529
529
532
533
529
525
OTHER ENGINEERING
560
553
550
547
545
546
549
554
554
559
562
556
LIFE SCIENCES
AGRICULTURE
458
447
443
438
439
436
435
431
433
436
437
440
BIOLOGICAL SCIENCES
520
517
513
511
510
509
514
519
523
524
526
524
EARTH & ENVIRONMENTAL SCI.
501
495
490
489
486
485
485
485
487
489
487
486
PSYCHOLOGY
CHILD PSYCHOLOGY
428
419
418
420
419
418
422
427
430
428
431
434
GENERAL PSYCHOLOGY
467
463
460
459
460
459
462
465
468
463
466
463
SOCIAL PSYCHOLOGY
444
441
442
441
441
440
444
447
449
451
447
454
SOCIAL SCIENCES
ECONOMICS
560
551
557
558
553
553
562
560
564
576
575
565
INTERNATIONAL RELATIONS
525
517
519
519
520
519
527
528
541
546
550
546
LAW ENFORCEMENT
421
414
410
409
406
405
404
407
413
408
409
410
POLITICAL SCIENCE
514
503
498
497
497
498
499
503
508
515
519
517
SOCIOLOGY
425
424
426
4?6
426
424
434
425
435
429
428
432
OTHER SOCIAL SCIENCES
459
453
454
456
453
457
463
467
469
467
470
477
INTERDISCIPL./OTHER SCIENCES
593
585
578
574
575
572
572
575
575
589
600
597
TOTAL OF SCIENCE,
MATH & ENGINEERING
514
509
507
507
507
508
5rii
511
514
513
513
507
10-A
15
I
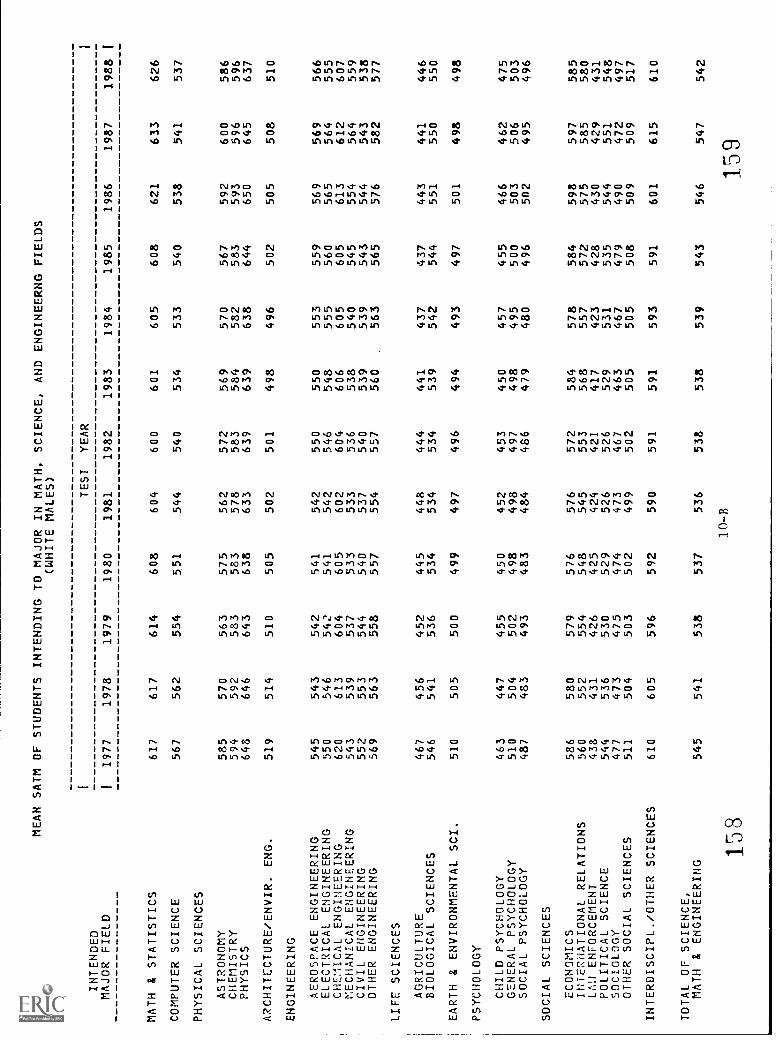
MEAN SATM OF STUDENTS
1
INTENDED
INTENDING TO MAJOR IN MATH,
(WHITE MALES)
TEST
SCIENCE, AND ENGINEERNG FIELDS
YEAR
MAJOR FIELD
I1977
1978
1979
1980
1982
1983
1984
1985
1986
1987
1988
MATH & STATISTICS
617
617
614
608
604
600
601
605
608
621
633
626
COMPUTER SCIENCE
567
562
554
551
544
540
534
533
540
538
541
537
PHYSICAL SCIENCES
ASTRONOMY
585
570
563
575
562
572
569
570
567
592
600
586
CHEMISTRY
594
592
583
583
578
583
584
582
583
593
596
596
PHYSICS
648
646
643
638
633
639
639
638
644
650
645
637
ARCHITECTURE/ENVIR. ENG.
519
514
510
505
502
501
498
496
502
505
508
510
ENGINEERING
AEROSPACE ENGINEERING
545
543
542
541
542
550
550
553
559
569
569
566
ELECTRICAL ENGINEERING
550
546
542
541
542
546
548
555
560
565
564
555
CHEMCAL ENGINEERING
620
613
604
605
602
604
606
605
605
613
612
607
MECHANICAL ENGINEERING
543
539
537
533
533
536
538
540
545
554
564
559
CIVIL ENGINEERING
552
553
544
540
537
540
539
539
543
544
543
538
OTHER ENGINEERING
569
563
558
557
554
557
560
563
565
576
582
577
LIFE SCIENCES
AGRICULTURE
467
456
452
445
448
444
441
437
437
443
441
446
BIOLOGICAL SCIENCES
546
541
536
534
534
534
539
542
544
551
550
550
EARTH & ENVIRONMENTAL SCI.
510
505
500
499
497
496
494
493
497
501
498
498
PSYCHOLOGY
CHILD PSYCHOLOGY
463
447
455
450
452
453
450
457
455
466
462
475
GENERAL PSYCHOLOGY
510
504
502
498
498
497
498
495
500
503
506
503
SOCIAL PSYCHOLOGY
487
483
493
483
484
486
479
480
496
502
495
496
SOCIAL SCIENCES
ECONOMICS
586
580
579
576
576
572
584
578
584
598
597
585
INTERNATIONAL RELATIONS
560
552
554
548
545
553
568
557
572
575
585
580
LAN ENFORCEMENT
438
431
426
425
424
421
417
423
428
430
429
431
POLITICAL SCIENCE
SOCIOLOGY
544
477
536
473
530
475
529
474
526
473
526
467
529
463
531
467
535
479
544
490
551
472
548
497
OTHER SOCIAL SCIENCES
511
504
503
502
499
502
505
505
508
509
509
517
INTERDISCIPL./OTHER SCIENCES
610
605
596
592
590
591
591
593
591
601
615
610
TOTAL OF SCIENCE,
MATH & ENGINEERING
545
541
538
537
536
538
538
539
543
546
547
542
10-B
158
159
1
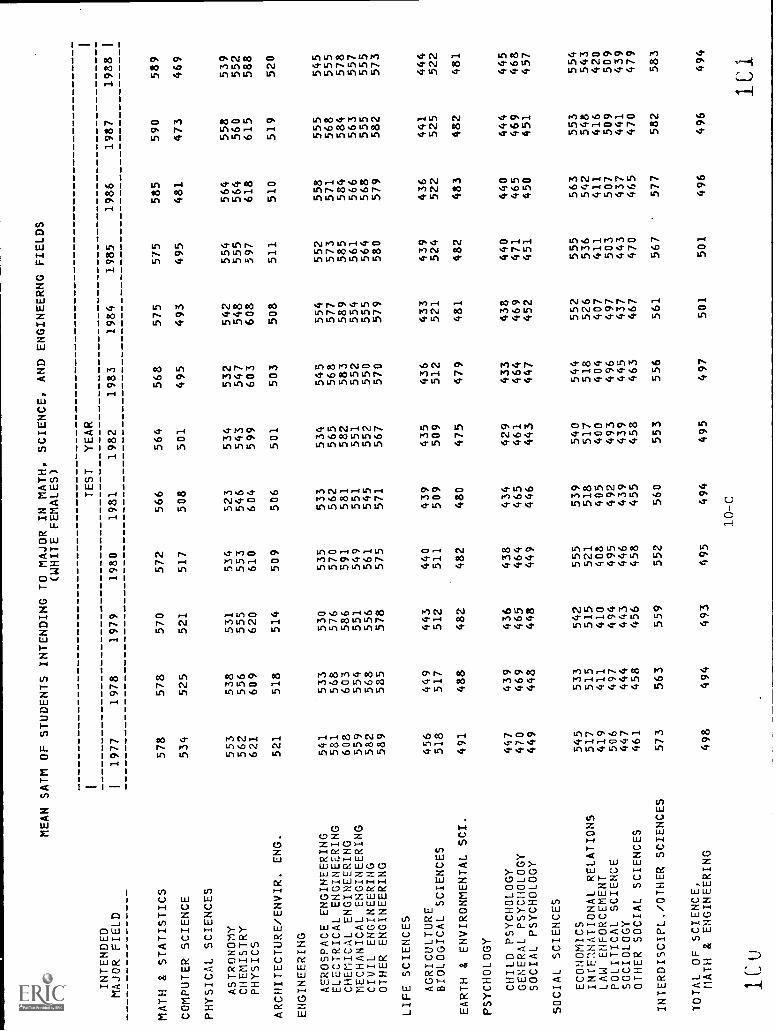
MEAN SATM OF STUDENTS
INTENDED
INTENDING TO MAJOR IN MATH,
(WHITE FEMALES)
TEST
SCIENCE, AND ENGINEERNG FIELDS
YEAR
MAJOR FIELD
1977
1978
1979
1980
1981
1982
1983
1984
1985
1986
1987
1988
MATH & STATISTICS
578
578
570
572
566
564
568
575
575
585
590
589
COMPUTER SCIENCE
534
525
521
517
508
501
495
493
495
481
473
469
PHYSICAL SCIENCES
ASTRONOMY
553
538
531
534
523
534
532
542
554
564
558
539
CHEMISTRY
562
556
555
553
546
543
547
548
555
564
560
552
PHYSICS
621
609
620
610
604
599
603
608
597
618
615
588
ARCHITECTURE/ENVIR. ENG.
521
518
514
509
506
501
503
508
511
510
519
520
ENGINEERING
AEROSPACE ENGINEERING
541
533
530
535
533
534
545
554
552
558
555
545
ELECTRICAL ENGINEERING
581
568
576
570
562
565
568
577
573
571
568
555
CHEMICAL ENGINEERING
608
603
586
591
581
582
583
589
585
584
584
578
MECHANICAL ENGINEERING
559
554
551
549
551
551
552
554
561
566
563
557
CIVIL ENGINEERING
582
568
556
561
545
552
550
555
564
568
555
555
OTHER ENGINEERING
589
585
578
575
571
567
570
579
580
579
582
573
LIFE SCIENCES
AGRICULTURE
456
449
443
440
439
435
436
433
439
436
441
444
BIOLOGICAL SCIENCES
518
517
512
511
509
509
512
521
524
522
525
522
EARTH & ENVIRONMENTAL SCI.
491
488
482
482
480
475
479
481
482
483
482
481
PSYCHOLOGY
CHILD PSYCHOLOGY
447
439
436
438
434
429
433
438
440
440
444
445
GENERAL PSYCHOLOGY
470
469
465
464
465
461
464
469
471
465
469
468
SOCIAL PSYCHOLOGY
449
448
448
449
446
443
447
452
451
450
451
457
SOCIAL SCIENCES
ECONOMICS
545
533
542
555
539
540
544
552
555
563
553
554
INTENATIONAL RELATIONS
517
515
515
521
518
517
518
526
536
542
548
543
LAW ENFORCEMENT
419
411
410
408
405
400
404
407
411
411
416
420
POLITICAL SCIENCE
506
497
494
495
492
493
496
497
503
507
509
509
SOCIOLOGY
447
444
443
446
439
439
445
437
443
437
441
439
OTHER SOCIAL SCIENCES
461
458
456
458
455
458
463
467
470
465
470
479
INTERDISCIPL./OTHER SCIENCES
573
563
559
552
560
553
556
561
567
577
582
583
TOTAL OF SCIENCE,
MATH & ENGINEERING
498
494
493
495
494
495
497
501
501
496
496
494
10-C
1CU
C I

MEAN SATM OF STUDENTS INTENDING TO MAJOR IN MATH,
(BLACK MALES)
TEST
INTENDED
MAJOR FIELD
11977
1978
1979
1980
1981
MATH & STATISTICS
429
411
418
404
420
COMPUTER SCIENCE
399
396
395
393
399
PHYSICAL SCIENCES
ASTRONOMY
432
414
385
412
435
CHEMISTRY
439
447
445
442
444
PHYSICS
519
476
500
500
487
ARCHITECTURE/ENVIR. ENG.
379
389
382
382
382
ENGINEERING
AEROSPACE ENGINEERING
420
425
427
430
434
ELECTRICAL ENGINEERING
410
414
407
408
410
CHEMICAL ENGINEERING
511
494
488
493
479
MECHANICAL ENGINEERING
397
406
400
407
405
CIVIL ENGINEERING
443
443
431
445
429
OTHER ENGINEERING
426
425
427
428
427
LIFE SCIENCES
AGRICULTURE
347
343
338
348
343
BIOLOGICAL SCIENCES
396
398
402
397
406
EARTH & ENVIRONMENTAL SCI.
385
384
395
395
380
PSYCHOLOGY
CHILD PSYCHOLOGY
347
328
340
347
344
GENERAL PSYCHOLOGY
377
377
376
377
375
SOCIAL PSYCHOLOGY
361
363
368
355
358
SOCIAL SCIENCES
ECONOMICS
435
475
467
457
460
INTERNATIONAL RELATIONS
435
432
425
422
427
LAW ENFORCEMENT
338
331
330
331
340
POLITICAL SCIENCE
395
386
396
385
388
SOCIOLOGY
334
327
342
318
340
OTHER SOCIAL SCIENCES
358
352
365
370
364
INTERDISCIPL./OTHER SCIENCES
402
418
427
436
450
TOTAL OF SCIENCE,
MATH & ENGINEERING
400
401
402
404
406
SCIENCE, AND ENGINEERNG FIELDS
YEAR
1982
1983
1984
1985
415
428
430
437
400
399
401
403
441
467
441
430
431
454
454
440
513
506
442
513
390
386
389
389
444
442
446
455
419
422
428
431
481
491
489
486
409
416
419
416
437
431
433
441
429
431
430
436
347
319
328
337
406
419
410
419
401
392
382
394
345
333
373
355
375
382
381
401
369
355
354
383
446
481
441
464
460
426
451
468
336
337
316
335
389
393
394
423
354
350
322
371
367
371
371
376
446
433
420
445
410
411
411
417
1986
479
396
44450
513
394
461
429
495
436
426
436
350
421
405
354
397
374
463
485
340
422
361
380
452
417
1987
494
395
470
473
538
397
459
430
488
441
425
439
338
426
415
370
393
380
488
499
341
412
338
368
477
417
1988
I
478
396
442
465
520
405
462
432
495
450
430
443
358
425
402
356
390
398
434
488
344
411
348
379
470
418
162
10-D
163

MEAN SATM OF STUDENTS INTENDING TO MAJOR IN MATH, SCIENCE, AND ENGINEERNG FIELDS
(BLACK FEMALES)
TEST
YEAR
INTENDED
MAJOR FIELD
MATH & STATISTICS
COMPUTER SCIENCE
PHYSICAL SCIENCES
ASTRONOMY
CHEMISTRY
PHYSICS
ARCHITECTURE/ENVIR. ENG.
ENGINEERING
AEROSPACE ENGINEERING
ELECTRICAL ENGINEERING
CHEMICAL ENGINEERING
MECHANICAL ENGINEERING
CIVIL ENGINEERING
OTHER ENGINEERING
LIFE SCIENCES
AGRICULTURE
BIOLOGICAL SCIENCES
EARTH & ENVIRONMENTAL SC!.
PSYCHOLOGY
CHILD PSYCHOLOGY
GENERAL PSYCHOLOGY
SOCIAL PSYCHOLOGY
SOCIAL SCIENCES
ECONOMICS
INTERNATIONAL REL!TIONS
LAW ENFORCEMENT
POLITICAL SCIENCE
SOCIOLOGY
OTHER SOCIAL SCIENCES
INTERDISCIPL./OTHER SCIENCES
TOTAL OF SCIENCE,
MATH & ENGINEERING
11977
415
370
454
404
439
382
449
433
469
482
469
468
355
379
398
340
363
358
373
416
316
375
326
330
384
367
1978
416
369
420
398
434
392
420
436
463
427
407
445
324
380
377
335
363
353
393
396
317
363
329
332
385
365
1979
404
366
355
401
431
392
433
415
440
416
440
450
346
385
,98
339
355
351
391
399
319
361
332
334
372
367
1980
410
374
362
414
428
380
414
418
456
424
423
450
328
388
388
340
363
346
410
417
320
370
337
334
394
374
1981
414
372
364
403
500
385
421
431
446
421
422
436
340
391
375
342
365
349
390
425
316
370
330
333
413
375
1982
417
375
346
420
425
380
429
422
451
411
417
438
358
389
379
346
367
351
416
417
331
373
338
338
392
381
1983
429
369
400
424
474
393
438
429
459
422
434
443
339
396
391
341
370
356
433
426
320
362
341
348
420
382
1984
435
371
460
418
451
395
428
442
466
435
416
460
380
406
398
348
374
359
445
459
324
376
327
354
404
387
1985
435
371
330
429
468
396
440
438
463
434
422
446
348
412
373
354
379
367
418
426
321
384
350
349
401
388
1986
459
361
473
427
508
395
444
430
458
429
441
434
360
398
376
356
376
378
428
452
328
384
327
340
463
382
1987
467
357
452
443
517
402
449
431
461
454
436
432
352
409
397
352
377
363
456
467
335
394
337
340
439
383
10-E
1988
480
359
438
430
461
418
437
442
476
455
445
434
350
413
418
364
378
377
432
469
339
405
340
360
484
387
1C

MEAN SATM OF STUDENTS INTENDING TO MAJOR IN MATH,
(OTHER STUDENTS)
1TEST
INTENDED
SCIENCE, AND ENGINEERNG FIELDS
YEAR
MAJOR FIELD
I1977
1978
1979
1980
1981
1982
1983
1984
1985
1986
1987
1988
MATH & STATISTICS
574
557
557
553
546
546
549
549
552
571
585
570
COMPUTER SCIENCE
506
499
494
492
492
484
480
478
482
469
469
467
PHYSICAL SCIENCES
ASTRONOMY
534
535
537
511
527
520
529
519
528
551
552
539
CHEMISTRY
550
548
550
538
538
533
545
541
557
569
572
543
PHYSICS
629
613
613
620
625
629
617
622
623
640
641
608
ARCHITECTURE/ENVIR. ENG.
482
473
468
474
470
466
465
467
471
476
479
483
ENGINEERING
AEROSPACE ENGINEERING
502
493
501
506
501
499
507
515
519
528
530
522
ELECTRICAL ENGINEERING
520
508
511
515
522
524
520
537
536
534
538
533
CHEMICAL ENGINEERING
585
566
568
564
574
563
560
572
568
570
573
569
MECHANICAL ENGINEERING
507
492
499
504
497
498
499
504
517
533
535
527
CIVIL ENGINEERING
532
525
522
513
514
511
521
520
516
516
508
508
OTHER ENGINEERING
543
533
532
530
527
528
531
533
534
539
543
538
LIFE SCIENCES
AGRICULTURE
436
.416
421
414
405
411
419
405
408
417
423
422
BIOLOGICAL SCIENCES
504
501
499
499
497
498
506
510
516
519
523
523
EARTH & ENVIRONMENTAL SCI.
478
462
468
460
462
456
455
459
465
467
465
463
PSYCHOLOGY
CHILD PSYCHOLOGY
409
393
390
392
395
398
405
400
404
398
407
414
GENERAL PSYCHOLOGY
444
432
431
434
434
435
439
442
443
443
443
444
SOCIAL PSYCHOLOGY
419
416
413
430
417
420
425
427
427
432
423
433
SOCIAL SCIENCES
ECONOMICS
545
531
550
549
551
554
566
551
556
577
569
571
INTERNATIONAL RELATIONS
500
467
488
482
498
489
508
490
515
522
514
518
LAW ENFORCEMENT
385
378
375
381
372
373
379
373
384
379
381
389
POLITICAL SCIENCE
490
481
479
475
474
475
463
482
473
486
493
496
SOCIOLOGY
405
415
422
410
424
409
437
426
418
419
423
428
OTHER SOCIAL SCIENCES
433
424
428
435
431
430
432
442
440
446
453
457
INTERDISCIPL./OTHER SCIENCES
581
567
566
568
572
559
555
563
559
592
587
587
TOTAL OF SCIENCE,
MATH & ENGINEERING
495
486
489
492
493
493
494
497
500
502
504
498
10-F
166
167
1

STANDARD DEVIATION OF SATM FOR STUDENTS INTENDING TO MAJOR IN
MATH, SCIENCE, AND ENGINEERING FIELDS
(ALL STUDENTS)
INTENDED
MAJOR FIELD
MATH 8 STATISTICS
COMPUTER SCIENCE
PHYSICAL SCIENCES
ASTRONOMY
CHEMISTRY
PHYSICS
ARCHITECTURE/ENVIR. ENG.
ENGINEERING
AEROSPACE ENGINEERING
ELECTRICAL ENGINEERING
CHEMICAL ENGINEERING
MECHANICAL ENGINEERING
CIVIL ENGINEERING
OTHER ENGINEERIN3
LIFE SCIENCES
AGRICULTURE
BIOLOGICAL SCIENCES
EARTH 8 ENVIRONMENTAL SCI.
PSYCHOLOGY
CHILD PSYCHOLOGY
GENERAL PSYCHOLOGY
SOCIAL PSYCHOLOGY
SOCIAL SCIENCES
ECONOMICS
INTE2NATIONAL RELATIONS
LAW ENFORCEMENT
POLITICAL SCIENCE
SOCIOLOGY
OTHER SOCIAL SCIENCES
INTERDISCIPL./OTHER SCIENCES
TOTAL OF SCIENCE,
MATH & ENGINEERING
1 11977
108
124
116
110 99
110
111
119 97
116
106
113
104
113
104
103
109
105
117
111 98
114
108
116
114
122
1978
111
124
121
112
104
109
112
121
102
116
107
114
102
112
104
103
107
102
119
111 96
117
105
114
115
122
1979
115
122
120
112
102
109
112
120
103
116
108
113
101
111
102
99
106
104
114
109 93
117
107
113
115
121
1980
114
120
120
111
103
108
111
121
101
113
107
112
99
112
102
99
105
102
116
110
92
115
107
113
115
120
TEST
1981
113
118
117
10897
108
109
118
102
112
105
111
101
111
102
98
105
102
116
106
94
115
104
113
112
118
YEAR
1982
114
117
116
111
103
108
110
120
102
113
107
111
100
113
101
97
104
102
115
10893
114
103
113
116
119
1983
114
119
118
111
107
109
111
123
104
114
108
113
100
115
104
99
105
103
113
10993
116
107
115
118
121
1984
111
119
122
110
104
109
110
121
102
115
109
113
101
116
103
100
105
105
113
10995
115
107
115
114
121
1985
111
121
120
109
101
108
109
121
104
114
109
113
102
114
104
99
105
104
118
105
96
115
105
115
116
121
1986
111
127
121
112
104
110
111
124
105
115
111
118
102
119
105
100
107
105
115
10797
117
112
120
113
125
1987
111
131
121
111
103
114
112
125
106
115
113
121
106
119
107
102
108
107
117
106
101
117
111
122
116
127
1988
113
130
125
113
112
111
113
125
108
115
111
121
105
119
107
101
10108
120
106
100
115
112
121
115
125
11-A
1 /T (.)
1
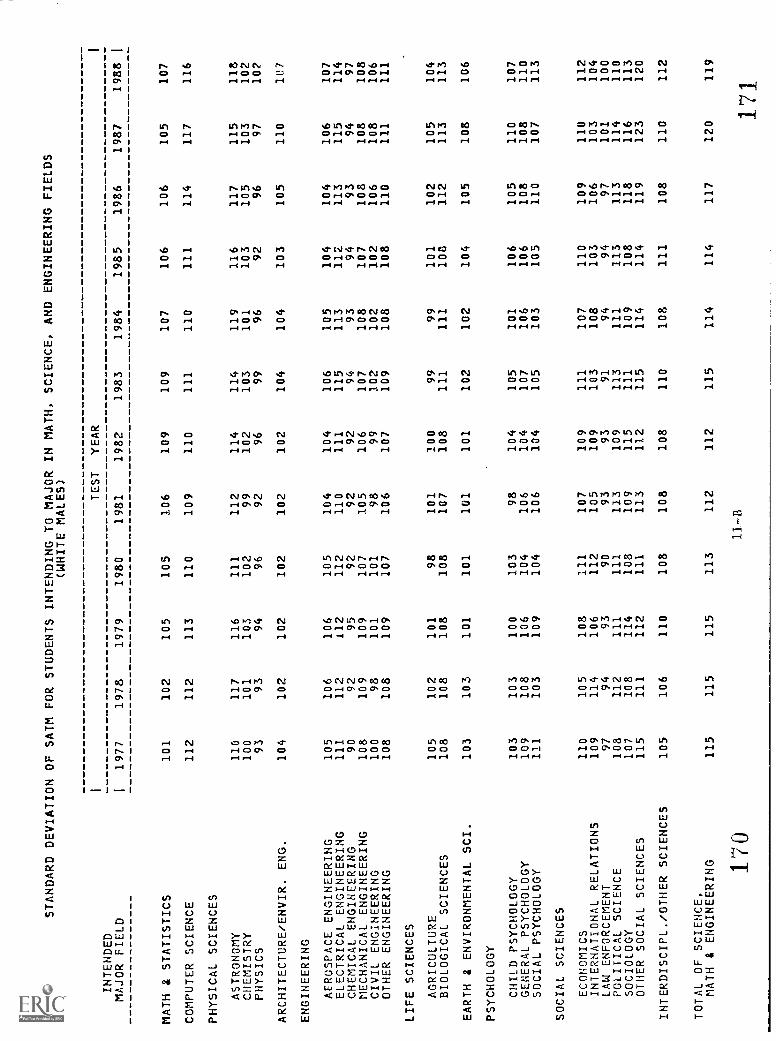
STANDARD DEVIATION OF SATM FOR STUDENTS
INTENDED
MAJOR FIELD
11977
1978
1979
MATH & STATISTICS
101
102
105
COMPUTER SCIENCE
112
112
113
PHYSICAL SCIENCES
ASTRONOMY
110
117
116
CHEMISTRY
100
101
103
PHYSICS
93
93
94
ARCHITECTURE/ENVIR. ENG.
104
102
102
ENGINEERING
AEROSPACE ENGINEERING
105
106
106
ELECTRICAL ENGINEERING
111
112
112
CHEMICAL ENGINEERING
90
92
95
MECHANICAL ENGINEERING
108
109
109
CIVIL ENGINEERING
100
98
101
OTHER ENGINEERING
108
108
109
LIFE SCIENCES
AGRICULTURE
105
102
101
BIOLOGICAL SCIENCES
108
108
108
EARTH & ENVIRONMENTAL SCI.
103
103
101
PSYCHOLOGY
CHILD PSYCHOLOGY
103
103
100
GENERAL PSYCHOLOGY
109
108
106
SOCIAL PSYCHOLOGY
111
103
109
SOCIAL SCIENCES
ECONOMICS
110
105
108
INTERNATIONAL RELATIONS
109
114
106
LAW ENFORCEMENT
97
94
93
POLITICAL SCIENCE
108
112
111
SOCIOLOGY
107
108
114
OTHER SOCIAL SCIENCES
115
111
112
/NTERDISCIPL./OTHER SCIENCES
105
106
110
TOTAL OF SCIENCE,
MATH & ENGINEERING
115
115
115
INTENDING TO MAJOR
(WHITE MALES)
TEST
1980
1981
105
106
110
109
111
112
102
99
96
92
102
102
105
104
112
110
92
92
107
105
101
98
107
106
98
101
108
107
101
101
103
98
104
106
104
106
111
107
112
105
90
93
111
113
108
109
111
113
108
108
113
112
IN MATH,
YEAR
1982
109
110
114
10296
102
104
111 92
10699
107
100
108
101
104
104
104
109
109 93
109
115
112
108
112
SCIENCE, AND ENGINEERING FIELDS
1983
1984
1985
1986
109
107
106
106
111
110
111
114
114
119
116
117
103
101
103
105
99
96
92
96
104
104
103
105
106
105
104
104
115
113
112
113
94
93
94
93
107
108
107
108
102
102
102
106
109
108
108
110
99
99
101
102
111
111
108
112
102
102
104
105
105
101
106
105
107
106
106
108
105
103
105
110
111
107
110
109
103
108
103
106
91
94
94
97
113
111
113
113
111
109
108
118
115
114
114
119
110
108
111
108
115
114
114
117
1987
105
117
115
10397
110
106
11594
108
108
111
105
113
108
110
108
107
110
103
101
114
116
123
110
120
1988
107
116
118
102
107
1t7
107
11497
108
106
111
104
113
106
107
110
113
112
104
100
110
113
120
112
119
170
171
1
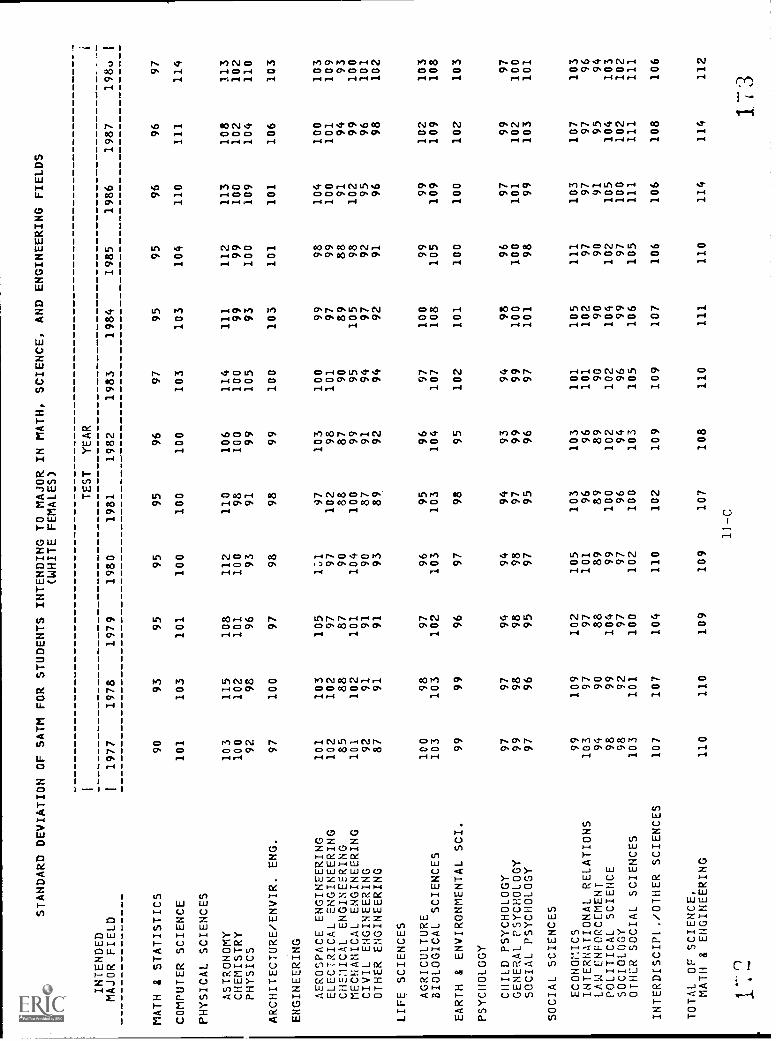
STANDARD DEVIATION OF SATM FOR STUDENTS INTENDING TO MAJOR
(WHITE FEMALES)
TEST
INTENDED
MAJOR FIELD
11977
1978
1979
1980
1981
MATH & STATISTICS
90
93
95
95
95
COMPUTER SCIENCE
101
103
101
100
100
PHYSICAL SCIENCES
ASTRONOMY
103
115
108
112
110
CHEMISTRY
100
102
101
100
98
PHYSICS
92
98
96
93
91
ARCHITECTURE/ENVIR. ENG.
97
100
97
98
98
ENGINEERING
AEROSPACE ENGINEERING
101
103
105
131
97
ELECTRICAL ENGINEERING
102
102
97
97
102
CHElICAL ENGINEERING
85
88
87
90
88
MECHANICAL ENGINEERING
101
102
101
104
100
CIVIL ENGINEERING
92
91
91
90
87
OTHER ENGINEERING
87
91
91
93
89
LIFE SCIENCES
AGRICULTURE
100
98
97
96
95
BIOLOGICAL SCIENCES
103
103
102
103
103
EARTH & ENVIRONMENTAL SCI.
99
99
96
97
98
PSYCHOLOGY
CHILD PSYCHOLOGY
97
97
94
94
94
GENERAL PSYCHOLOGY
99
98
98
98
97
SOCIAL PSYCHOLOGY
97
96
95
97
95
SOCIAL SCIENCES
ECONOMICS
99
109
102
105
103
INTERNATIONAL RELATIONS
103
97
97
101
96
LAW ENFORCEMENT
94
90
88
89
89
POLITICAL SCIENCE
98
99
104
99
100
SOCIOLOGY
98
92
97
97
96
OTHER SOCIAL SCIENCES
103
101
100
102
100
INTERDISCIPt./OTHER SCIENCES
107
107
104
110
102
TOTAL OF SCIENCE.
MATH & ENGINEERING
110
110
109
109
107
IN MATH,
YEAR
1982
96
100
106
10099
99
10398
87 99
9192
96
104
95
93 99
96
10396
89
102
94
103
109
108
SCIENCE, AND ENGINEERING FIELDS
1983
1984
1985
1986
97
95
95
96
103
103
104
110
114
111
112
113
100
99
99
100
105
93
100
109
100
103
101
101
100
99
98
104
101
97
99
100
90
89
88
91
95
105
98
102
94
97
92
95
94
92
91
96
97
100
99
99
107
108
105
109
102
101
100
100
94
98
96
97
99
100
100
101
97
101
98
99
101
105
111
103
101
102
97
97
90
90
90
91
102
104
102
105
96
99
97
100
105
106
105
111
109
107
106
106
110
111
110
114
1987 96
111
108
102
104
106
100
101 9499
9698
102
109
102
99
102
103
1079795
104
102
111
108
114
198.,
97
114
1.13
102
110
103
103
10993
100
101
102
103
108
103
97
100
101
1039694
103
102
111
106
112
11-C
1': 2
113
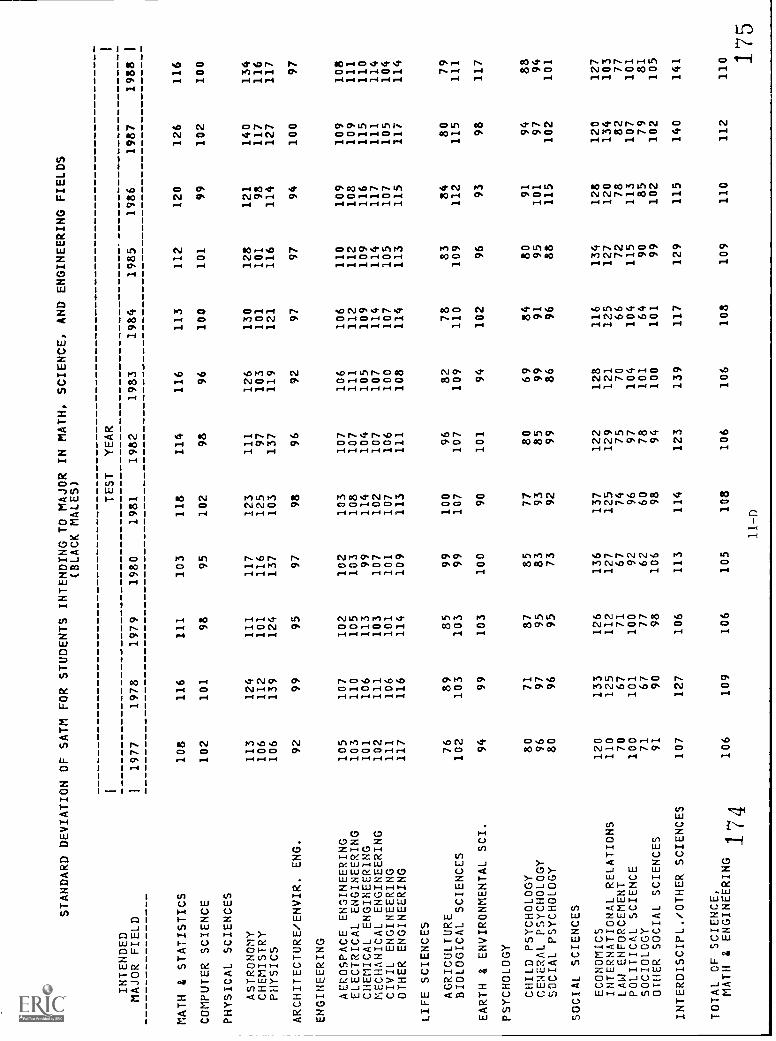
STANDARD DEVIATION OF SATM FOR STUDENTS INTENDING TO MAJOR IN MATH, SCIENCE, AND ENGINEERING FIELDS
(BLACK MALES)
INTENDED
MAJOR FIELD
MATH & STATISTICS
COMPUTER SCIENCE
PHYSICAL SCIENCES
ASTRONOMY
CHEMISTRY
PHYSICS
ARCHITECTURE/ENVIR. ENG.
ENGINEERING
AEROSPACE ENGINEERING
ELECTRICAL ENGINEERING
CHEMICAL ENGINEERING
MECHANICAL ENGINEERING
CIVIL ENGINEERING
OTHER ENGINEERING
LIFE SCIENCES
AGRICULTURE
BIOLOGICAL SCIENCES
EARTH & ENVIRONMENTAL SCI.
PSYCHOLOGY
CHILD PSYCHOLOGY
GENERAL PSYCHOLOGY
SOCIAL PSYCHOLOGY
SOCIAL SCIENCES
ECONOMICS
INTERNATIONAL RELATIONS
LAW ENFORCEMENT
POLITICAL SCIENCE
SOCIOLOGY
OTHER SOCIAL SCIENCES
INTERDISCIPL./OTHER SCIENCES
TOTAL OF SCIENCE,
MATH & ENGINEERING
I74
ITEST
YEAR
I1977
1978
1979
1980
1981
1982
1983
1984
1985
1986
1987
1988
108
116
111
103
118
114
116
113
112
120
126
116
102
101
98
95
102
98
96
100
101
99
102
100
113
124
111
117
123
111
126
130
128
121
140
134
106
112
101
116
125
97
103
101
101
98
117
116
106
139
124
137
103
137
119
121
116
114
127
117
92
99
95
97
98
96
92
97
97
94
100
97
105
107
102
102
103
107
106
106
110
109
109
108
103
110
105
103
108
107
111
112
112
108
109
111
101
106
113
99
114
104
105
109
109
116
115
110
102
111
103
107
102
107
107
114
114
117
111
114
111
106
101
101
107
106
100
107
105
107
105
104
117
116
114
109
113
111
108
114
113
115
117
114
76
89
85
99
100
96
82
78
83
84
80
79
102
103
103
99
107
107
109
110
109
112
115
111
94
99
103
100
90
101
94
102
96
93
98
117
80
71
87
85
77
80
69
84
80
91
94
88
96
97
95
83
93
85
99
91
95
101
97
94
80
96
95
73
92
99
86
96
88
115
102
101
120
133
126
136
137
122
128
116
134
128
120
127
110
125
112
127
125
129
121
125
127
120
134
103
70
67
71
67
74
75
70
66
72
78
82
77
100
101
100
92
96
97
104
104
115
113
107
101
71
67
77
62
60
78
101
64
90
85
79
81
91
90
98
106
98
94
100
101
99
102
102
105
107
127
106
113
114
123
139
117
129
115
140
141
106
109
106
105
108
106
106
108
109
110
112
110
11-D
175
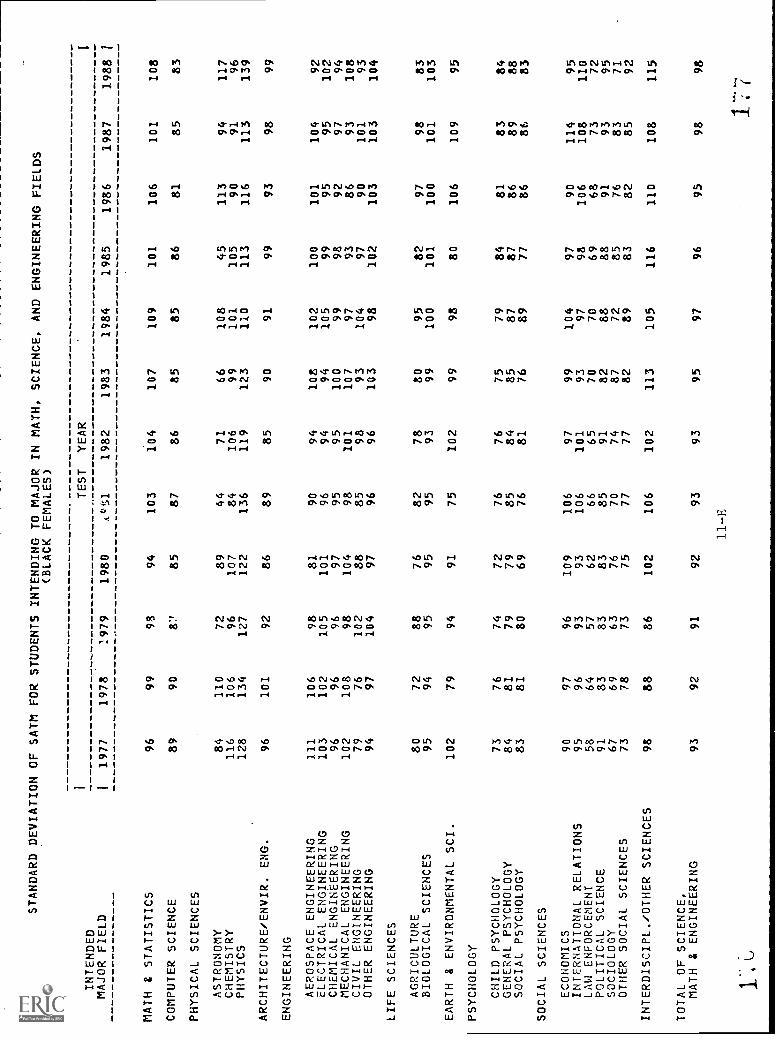
STANDARD DEVIATION OF SATM FOR STUDENTS INTENDING TO MAJOR IN MATH, SCIENCE, AND ENGINEERING FIELDS
(BLACK FEMALES)
INTENDED
MAJOR FIELD
MATH & STATISTICS
COMPUTER SCIENCE
PHYSICAL SCIENCES
ASTRONOMY
CHEMISTRY
PHYSICS
ARCHITECTURE/ENVIR. ENG.
ENGINEERING
AEROSPACE ENGINEERING
ELECTRICAL ENGINEERING
CHEMICAL ENGINEERING
MECHANICAL ENGINEERING
CIVIL ENGINEERING
OTHER ENGINEERING
LIFE SCIENCES
AGRICULTURE
BIOLOGICAL SCIENCES
EARTH & ENVIRONMENTAL SCI.
PSYCHOLOGY
CHILD PSYCHOLOGY
GENERAL PSYCHOLOGY
SOCIAL PSYCHOLOGY
SOCIAL SCIENCES
ECONOMICS
INTERNATIONAL RELATIONS
LAW ENFORCEMENT
POLITICAL SCIENCE
SOCIOLOGY
OTHER SOCIAL SCIENCES
INTERDISCIPL./OTHER SCIENCES
TOTAL OF SCIENCE,
MATH & ENGINEERING
1 11977 96
89
84
116
128
96
111
10396
102 79
94
80 95
102 73
8483
909558
916773
98
93
1978
99
90
110
106
134
101
106
10296
108
76 97
72 94
79
76
8181
97
966483
69
78
88
92
1979
93
87
7296
127 92
98
1059698
102
104
8895
94
7479
80
96935783
63
73
86
91
1980 94
85
89
107
122
86
81
101 97
104
8897
76
95
91
7279
69
109 9362
837675
102
92
TEST
&o.t1
103
87
44
84
136
89
90
9695
98
8596
8295
75
7685
76
106
106
6685
70
77
106 93
YEAR
1982
104
86
71
106
119
85
949495
101 98
96
78 93
102
7684
81
97
101 65
9174
77
102
93
1983
107
85
6699
123
90
10894
100
107 93
103
80 99
99
75
85 76
9993
7082
8782
113
95
1984
109
85
108
101
110 91
102
105 99
97
104 98
95
100 98
798789
10497
7088
7289
105
97
1985
101
86 45
105
113
99
100 99989397
102
82
101
80
8487 77
979869
88
85
83
116
96
1986
106
81
11390
116 93
101 9592
86 90
103
97
100
106
818686
90
106
68 91
7682
110 95
1987
101
85
94
91
113
98
10495
9793
101
103
98
101
109
83
89
86
114
108
73
9383
85
108
98
1988
I
108 83
11796
139
99
92
10294
10893
104
83
103
95
84
8883 95
110 72
957192
115
98
11E
1.
u1
7 7

STANDARD DEVIATION OF SATM FOR STUDENTS INTENDING TO MAJOR IN MATH, SCIENCE, AND
ENGINEERING FIELDS
(OTHER STUDENTS)
INTENDED
MAJOR FIELD
MATH & STATISTICS
COMPUTER SCIENCE
PHYSICAL SCIENCES
ASTRONOMY
CHEMISTRY
PHYSICS
ARCHITECTURE/ENVIR. ENG.
ENGINEERING
AEROSPACE ENGINEERING
ELECTRICAL ENGINEERING
CHEMICAL ENGINEERING
MECHANICAL ENGINEERING
CIVIL ENGINEERING
OTHER ENGINEERING
LIFE SCIENCES
AGRICULTURE
BIOLOGICAL SCIENCES
EARTH & ENVIRONMENTAL SCI.
PSYCHOLOGY
CHILD PSYCHOLOGY
GENERAL PSYCHOLOGY
SOCIAL PSYCHOLOGY
SOCIAL SCIENCES
ECONOMICS
INTERNATIONAL RELATIONS
LAW ENFORCEMENT
POLITICAL SCIENCE
SOCIOLOGY
OTHER SOCIAL SCIENCES
INTERDISCIPL./OTHER SCIENCES
TOTAL OF SCIENCE,
MATH &
ENGINEERIN1
g
TEST
YEAR
1977
1978
1979
1980
1981
1982
1983
1984
1985
1986
1987
1988
122
124
129
131
133
129
134
129
125
131
126
132
127
129
126
126
124
124
125
124
127
133
136
134
140
123
131
129
125
119
129
132
128
129
135
135
125
126
129
125
124
122
126
126
116
131
125
129
114
125
127
118
107
107
126
121
117
115
115
130
114
119
117
113
115
116
116
119
114
116
118
120
120
121
121
123
115
117
118
119
120
121
123
123
126
130
127
128
124
128
130
130
131
132
132
132
105
119
110
114
112
115
119
112
120
120
115
120
126
126
125
120
119
121
125
126
124
126
127
125
118
127
124
119
119
119
120
118.
120
117
117
114
121
124
122
121
120
122
123
123
123
127
132
131
112
101
101
102
105
102
108
108
110
105
118
111
122
123
123
124
124
126
126
128
128
130
132
131
110
107
105
107
108
105
107
110
112
112
114
117
102
101
100
94
100
99
104
96
101
98
99
102
115
110
109
110
108
108
111
110
110
110
114
112
106
99
107
102
103
99
106
108
106
105
107
116
123
135
120
120
125
128
117
119
127
117
126
130
115
119
125
112
118
121
118
115
118
122
121
126
93
96
86
90
90
87
91
88
95
90
94
100
124
124
123
120
121
120
120
122
121
121
120
123
108
111
114
108
108
101
118
115
106
121
120
122
118
115
117
120
116
117
115
120
119
125
129
128
130
128
129
130
127
131
138
131
130
135
134
130
129
130
129
128
127
127
129
129
130
133'
135
133
11-F
179
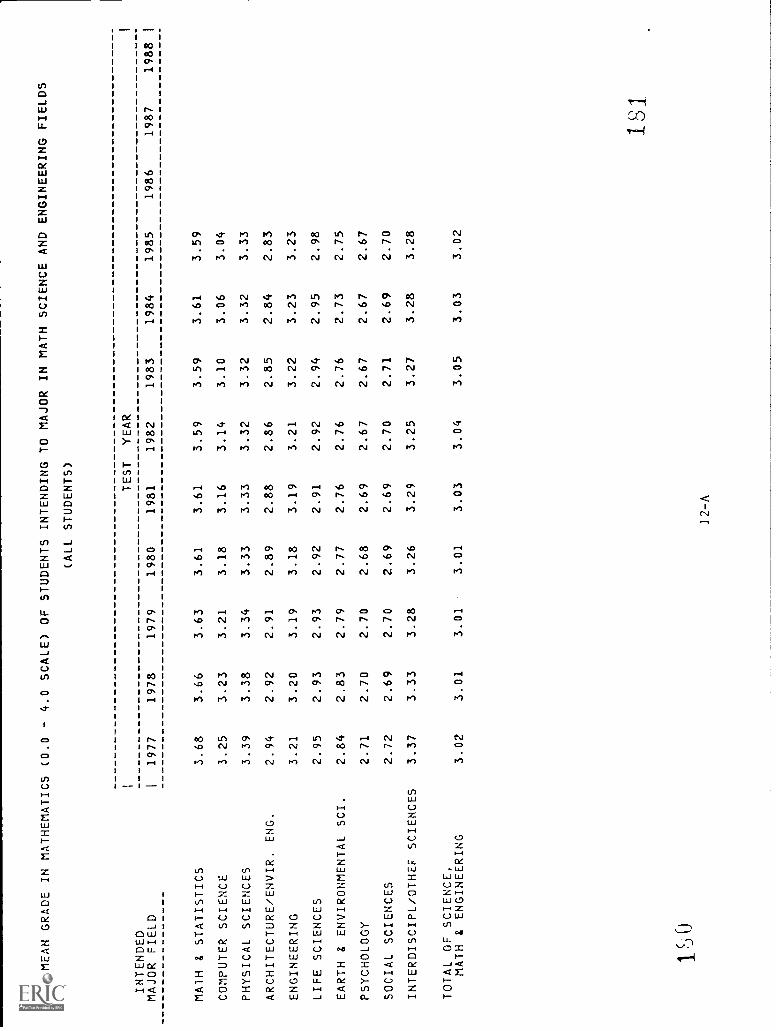
MEAN GRADE IN MATHEMATICS
INTENDED
MAJOR FIELD
I
MATH & STATISTICS
COMPUTER SCIENCE
PHYSICAL SCIENCES
ARCHITECTURE/ENVIR. ENG.
ENGINEERING
LIFE SCIENCES
EARTH & ENVIRONMENTAL SCI.
PSYCHOLOGY
SOCIAL SCIENCES
INTERDISCIPL /OTHEF SCIENCES
TOTAL OF SCIENCE.
MATH & ENGINEERING
(0.0
1977
3.68
3.25
3.39
2.94
3.21
2.95
2.84
2.71
2.72
3.37
3.02
- 4.0 SCALE) OF STUDENTS
(ALL
1978
1979
1980
3.66
3.63
3.61
3.23
3.21
3.18
3.38
3.34
3.33
2.92
2.91
2.89
3.20
3.19
3.18
2.93
2.93
2.92
2.83
2.79
2.77
2.70
2.70
2.68
2.69
2.70
2.69
3.33
3.28
3.26
3.01
3.01
3.01
INTENDING TO MAJOR
STUDENTS)
TEST
YEAR
1981
1982
3.61
3.59
3.16
3.14
3.33
3.32
2.88
2.86
3.19
3.21
2.91
2.92
2.76
2.76
2.69
2.67
2.69
2.70
3.29
3.25
3.03
3.04
IN MATH SCIENCE AND ENGINEERING FIELDS
1983
1984
1985
1986
1987
3.59
3.61
3.59
3.10
3.06
3.04
3.32
3.32
3.33
2.85
2.84
2.83
3.22
3.23
3.23
2.94
2.95
2.98
2.76
2.73
2.75
2.67
2.67
2.67
2.71
2.69
2.70
3.27
3.28
3.28
3.05
3.03
3.02
1988
181_
12-A
I
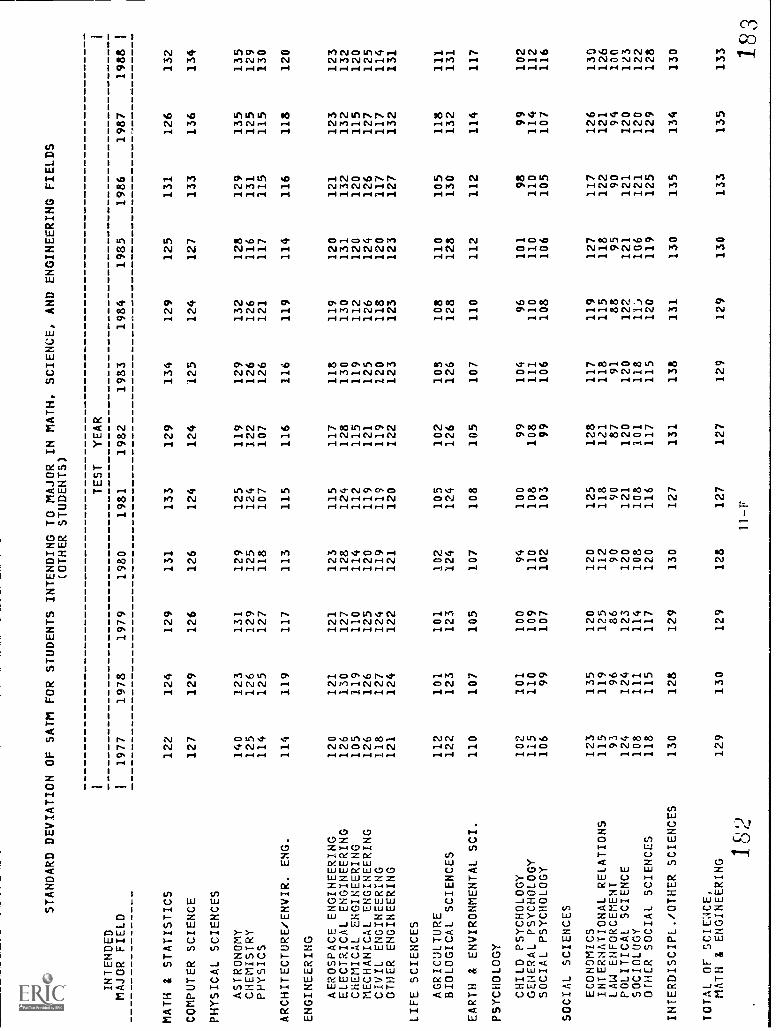
STANDARD DEVIATION OF SATM FOR STUDENTS INTENDING TO MAJOR
(OTHER STUDENTS)
TEST
INTENDED
IN MATH,
YEAR
SCIENCE, AND ENGINEERING FIELDS
MAJOR FIELD
I1977
1978
1979
1980
1981
1982
1983
1984
1985
1986
1987
1988
i
MATH & STATISTICS
122
124
129
131
133
129
134
129
125
131
126
132
COMPUTER SCIENCE
127
129
126
126
124
124
125
124
127
133
136
134
PHYSICAL SCIENCES
ASTRONOMY
140
123
131
129
125
119
129
132
128
129
135
135
CHEMISTRY
125
126
129
125
124
122
126
126
116
131
125
129
PHYSICS
114
125
127
118
107
107
126
121
117
115
115
130
ARCHITECTURE/ENVIR. ENG.
114
119
117
113
115
116
116
119
114
116
118
120
ENGINEERING
AEROSPACE ENGINEERING
120
121
121
123
115
117
118
119
120
121
123
123
ELECTRICAL ENGINEERING
126
130
127
128
124
128
130
130
131
132
132
132
CHEMICAL ENGINEERING
105
119
110
114
112
115
119
112
120
120
115
120
MECHANICAL ENGINEERING
126
126
125
120
119
121
125
126
124
126
127
125
CIVIL ENGINEERING
118
127
124
119
119
119
120
118
120
117
117
114
OTHER ENGINEERING
121
124
122
121
120
122
123
123
123
127
132
131
LIFE SCIENCES
AGRICULTURE
112
101
101
102
105
102
103
108
110
105
118
111
BIOLOGICAL SCIENCES
122
123
123
124
124
126
126
128
128
130
132
131
EARTH & ENVIRONMENTAL SCI.
110
107
105
107
108
105
107
110
112
112
114
117
PSYCHOLOGY
CHILD PSYCHOLOGY
102
101
100
94
100
99
104
96
101
98
99
102
GENERAL PSYCHOLOGY
115
110
109
110
108
108
111
110
110
110
114
112
SOCIAL PSYCHOLOGY
106
99
107
102
103
99
106
108
106
105
107
116
SOCIAL SCIENCES
ECONOMICS
123
135
120
120
125
128
117
119
127
117
126
130
INTERNATIONAL RELATIONS
115
119
125
112
118
121
118
115
118
122
121
126
LAW ENFORCEMENT
93
96
86
90
90
87
91
88
95
90
94
100
POLITICAL SCIENCE
124
124
123
120
121
120
120
122
121
121
120
123
SOCIOLOGY
108
111
114
108
108
101
118
11.)
106
121
120
122
OTHER SOCIAL SCIENCES
118
115
117
120
116
117
115
120
119
125
129
128
INTERDISCIPL./OTHER SCIENCES
130
128
129
130
127
131
138
131
130
135
134
130
TOTAL OF SCIENCE,
MATH & ENGINEERING
129
130
129
128
127
127
129
129
130
133
135
133
1 8
;)11
-F16
3

MEAN GRADE IN MATHEMATICS
INTENDED
MAJOR FIELD
I
MAIH & STATISTICS
COMPUTER SCIENCE
PHYSICAL SCIENCES
ARCHITECTURE/ENVIR. ENG.
ENGINEERING
LIFE SCIENCES
EARTH & ENVIRONMENTAL SCI.
PSYCHOLOGY
SOCIAL SCIENCES
INTERDISCIPL /OTHUF SCIENCES
TOTAL OF SCIENCE,
MATH & ENGINEERING
(0.0
1977
3.68
3.25
3.39
2.94
3.21
2.95
2.84
2.71
2.72
3.37
3.02
- 4.0 SCALE) OF STUDENTS
(ALL
1978
1979
1980
3.66
3.63
3.61
3.23
3.21
3.18
3.38
3.34
3.33
2.92
2.91
2.89
3.20
3.19
3.18
2.93
2.93
2.92
2.83
2.79
2.77
2.70
2.70
2.68
2.69
2.70
2.69
3.33
3.28
3.26
3.01
3.01
3.01
INTENDING TO MAJOR IN MATH SCIENCE AND ENGINEERING FIELDS
STUDENTS)
TEST
YEAR
1981
1982
1983
1984
1985
1986
1987
3.61
3.59
3.59
3.61
3.59
3.16
3.14
3.10
3.06
3.04
3.33
3.32
3.32
3.32
3.33
2.88
2.86
2.85
2.84
2.83
3.19
3.21
3.22
3.23
3.23
2.91
2.92
2.94
2.95
2.98
2.76
2.76
2.76
2.73
2.75
2.69
2.67
2.67
2.67
2.67
2.69
2.70
2.71
2.69
2.70
3.29
3.25
3.27
3.28
3.28
3.03
3.04
3.05
3.03
3.02
184
12-A
1988
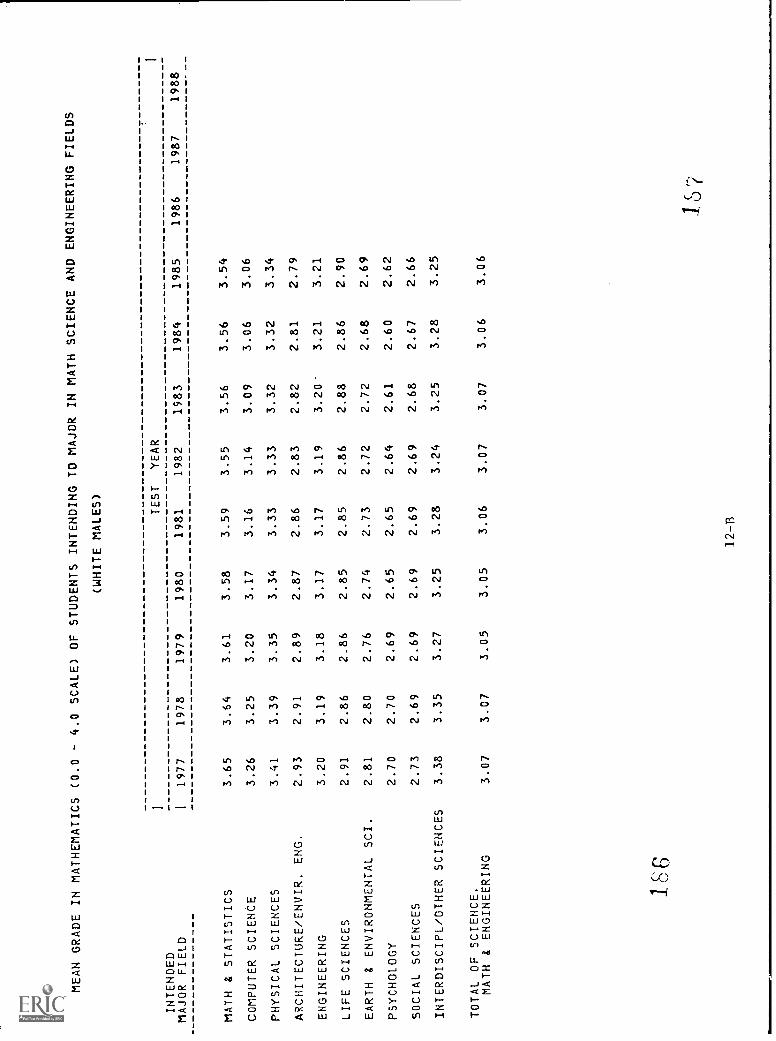
MEAN GRADE IN MATHEMATICS
INTENDED
MAJOR FIELD
I
MATH & STATISTICS
COMPUTER SCIENCE
PHYSICAL SCIENCES
ARCHITECTURE/ENVIR. ENG.
ENGINEERING
LIFE SCIENCES
EARTH & ENVIRONMENTAL SCI.
PSYCHOLOGY
SOCIAL SCIENCES
INTERDISCIPL/OTHER SCIENCES
TOTAL OF SCIENCE,
MATH & ENGINEERING
(0.0
1977
3.65
3.26
3.41
2.93
3.20
2.91
2.81
2.70
2.73
3.38
3.07
- 4.0 SCALE) OF STUDENTS INTENDING TO MAJOR
(WHITE MALES)
TEST
YEAR
1978
1979
1980
1981
1982
3.64
3.61
3.58
3.59
3.55
3.25
3.20
3.17
3.16
3.14
3.39
3.35
3.34
3.33
3.33
2.91
2.89
2.87
2.86
2.83
3.19
3.18
3.17
3.17
3.19
2.86
2.86
2.85
2.85
2.86
2.80
2.76
2.74
2.73
2.72
2.70
2.69
2.65
2.65
2.64
2.69
2.69
2.69
2.69
2.69
3.35
3.27
3.25
3.28
3.24
3.07
3.05
3.05
3.06
3.07
IN MATH SCIENCE AND ENGINEERING FIELDS
1983
1984
1985
1986
1987
3.56
3.56
3.54
3.09
3.06
3.06
3.32
3.32
3.34
2.82
2.81
2.79
3.20'
3.21
3.21
2.88
2.86
2.90
2.72
2.68
2.69
2.61
2.60
2.62
2.68
2.67
2.66
3.25
3.28
3.25
3.07
3.06
3.06
1988
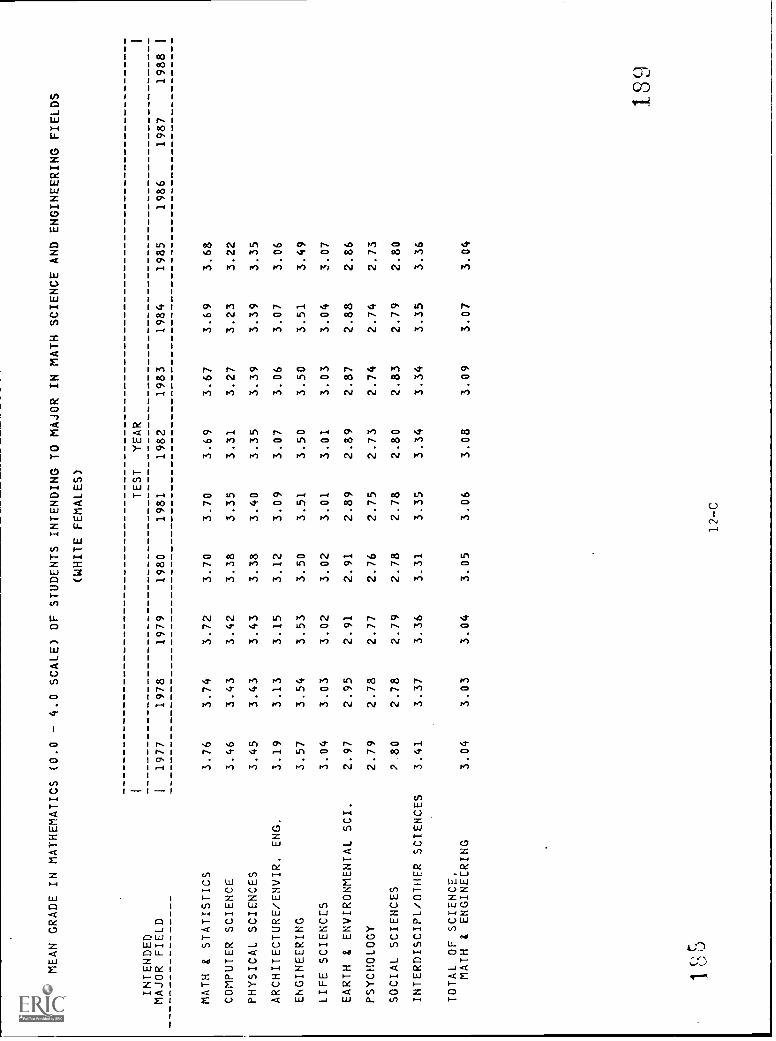
MEAN GRADE IN MATHEMATICS
INTENDED
MAJOR FIELD
I
MATH & STATISTICS
COMPUTER SCIENCE
PHYSICAL SCIENCES
ARCHITECTURE/ENVIR. ENG.
ENGINEERING
LIFE SCIENCES
EARTH & ENVIRONMENTAL SCI.
PSYCHOLOGY
SOCIAL SCIENCES
INTERDISCIPL/OTHER SCIENCES
TOTAL OF SCIENCE,
MATH & ENGINEERING
(0.0
1977
3.76
3.46
3.45
3.19
3.57
3.04
2.97
2.79
7.80
3.41
3.04
- 4.0 SCALE) OF STUDENTS INTENDING TO MAJOR IN MATH SCIENCE AND ENGINEERING FIELDS
(WHITE FEMALES)
TEST
YEAR
1978
1979
1980
1981
1982
1983
1984
1985
1986
1987
3.74
3.72
3.70
3.70
3.69
3.67
3.69
3.68
3.43
3.42
3.38
3.35
3.31
3.27
3.23
3.22
3.43
3.43
3.38
3.40
3.35
3.39
3.39
3.35
3.13
3.15
3.12
3.09
3.07
3.06
3.07
3.06
3.54
3.53
3.50
3.51
3.50
3.50
3.51
3.49
3.03
3.02
3.02
3.01
3.01
3.03
3.04
3.07
2.95
2.91
2.91
2.89
2.89
2.87
2.88
2.86
2.78
2.77
2.76
2.75
2.73
2.74
2.74
2.73
2.78
2.79
2.78
2.78
2.80
2.83
2.79
2.80
3.37
3.36
3.31
3.35
3.34
3.34
3.35
3.36
3.03
3.04
3.05
3.06
3.08
3.09
3.07
3.04
1988
189
12-C
I
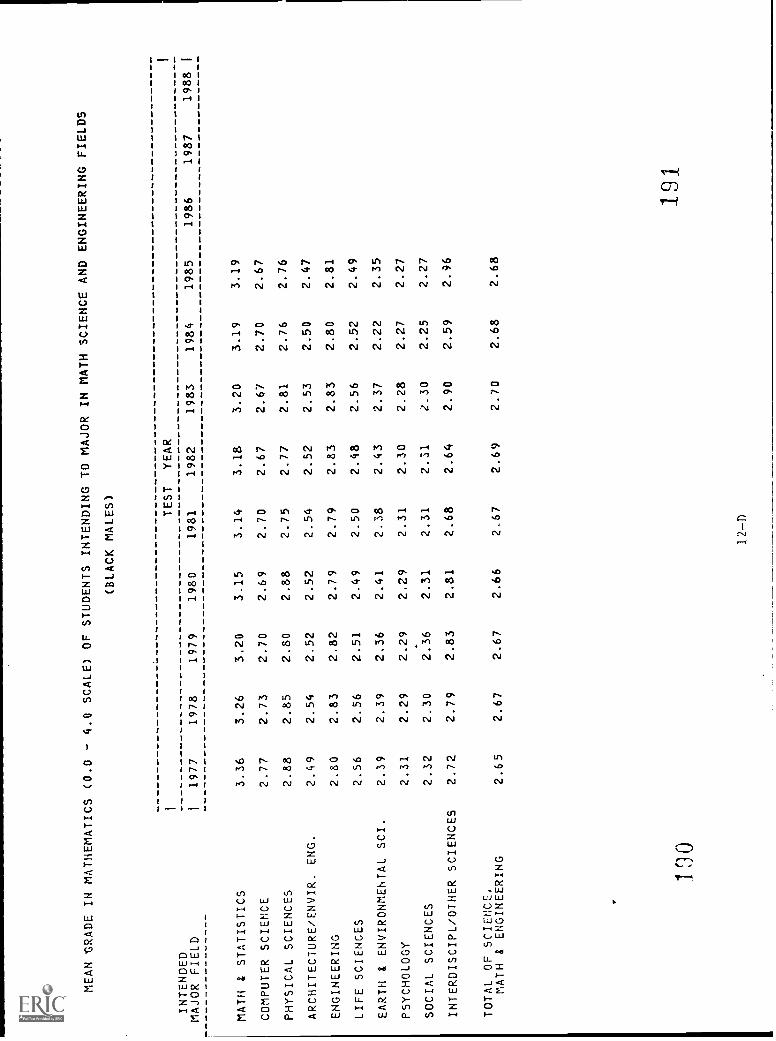
MEAN GRADE IN MATHEMATICS
INTENDED
MAJOR FIELD
I
MATH & STATISTICS
COMPUTER SCIENCE
PHYSICAL SCIENCES
ARCHITECTURE/ENVIR. ENG.
ENGINEERING
LIFE SCIENCES
EARTH & ENVIRONMENTAL SCI.
PSYCHOLOGY
SOCIAL SCIENCES
INTERDISCIPL/OTHER SCIENCES
TOTAL OF SCIENCE,
MATH & ENGINEERING
(0.0
1977
3.36
2.77
2.88
2.49
2.80
2.56
2.39
2.31
2.32
2.72
2.65
- 4.0 SCALE) OF STUDENTS INTENDING TO MAJOR IN MATH
SCIENCE AND ENGINEERING FIELDS
(BLACK MALES)
TEST
YEAR
1978
1979
1980
1981
1982
1983
1984
1985
1986
1987
3.26
3.20
3.15
3.14
3.18
3.20
3.19
3.19
2.73
2.70
2.69
2.70
2.67
2.67
2.70
2.67
2.85
2.80
2.88
2.75
2.77
2.81
2.76
2.76
2.54
2.52
2.52
2.54
2.52
2.53
2.50
2.47
2.83
2.82
2.79
2.79
2.83
2.83
2.80
2.81
2.56
2.51
2.49
2.50
2.48
2.56
2.52
2.49
2.39
2.36
2.41
2.38
2.43
2.37
2.22
2.35
2.29
2.29
2.29
2.31
2.30
2.28
2.27
2.27
2.30
2.36
2.31
2.31
2.31
2.30
2.25
2.27
2.79
2.83
2.81
2.68
2.64
2.90
2.59
2.96
2.67
2.67
2.66
2..67
2.69
2.70
2.68
2.68
1988
1 r.
)019
1
I
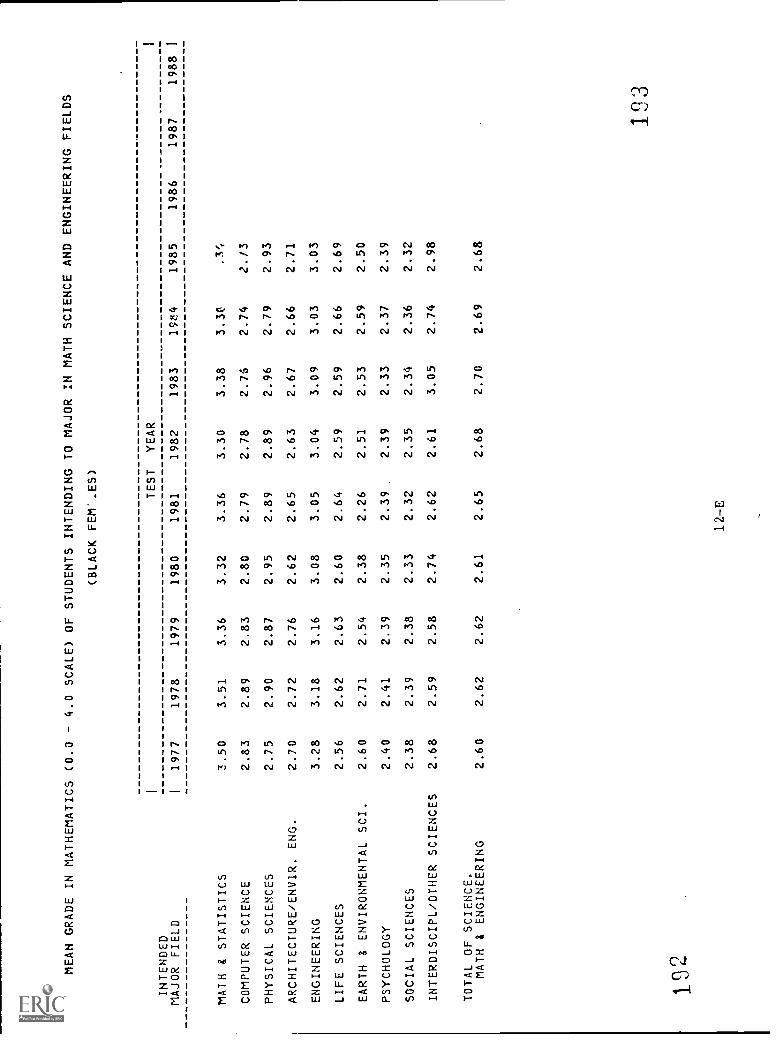
MEAN GRADE IN MATHEMATICS
INTENDED
MAJOR FIELD
I
MATH & STATISTICS
COMPUTER SCIENCE
PHYSICAL SCIENCES
ARCHITECTURE/ENVIR. ENG.
ENGINEERING
LIFE SCIENCES
EARTH & ENVIRONMENTAL SCI.
PSYCHOLOGY
SOCIAL SCIENCES
INTERDISCIPL/OTHER SCIENCES
TOTAL OF SCIENCE.
MATH & ENGINEERING
(0.0
1977
3.50
2.83
2.75
2.70
3.28
2.56
2.60
2.40
2.38
2.68
2.60
- 4.0 SCALE) OF STUDENTS
(BLACK
1978
1979
1980
3.51
3.36
3.32
2.89
2.83
2.80
2.90
2.87
2.95
2.72
2.76
2.62
3.18
3.16
3.08
2.62
2.63
2.60
2.71
2.54
2.38
2.41
2.39
2.35
2.39
2.38
2.33
2.59
2.58
2.74
2.62
2.62
2.61
INTENDING TO MAJOR IN MATH SCIENCE AND ENGINEERING FIELDS
FEW.ES)
TEST
YEAR
1981
1982
1983
1984
1985
1986
1987
3.36
3.30
3.38
3.30
2.79
2.78
2.76
2.74
2.13
2.89
2.89
2.96
2.79
2.93
2.65
2.63
2.67
2.66
2.71
3.05
3.04
3.09
3.03
3.03
2.64
2.59
2.59
2.66
2.69
2.26
2.51
2.53
2.59
2.50
2.39
2.39
2.33
2.37
2.39
2.32
2.35
2.34
2.36
2.32
2.61
3.05
2.74
2.98
2.68
2.70
2.69
2.68
1988
193
12-E
I
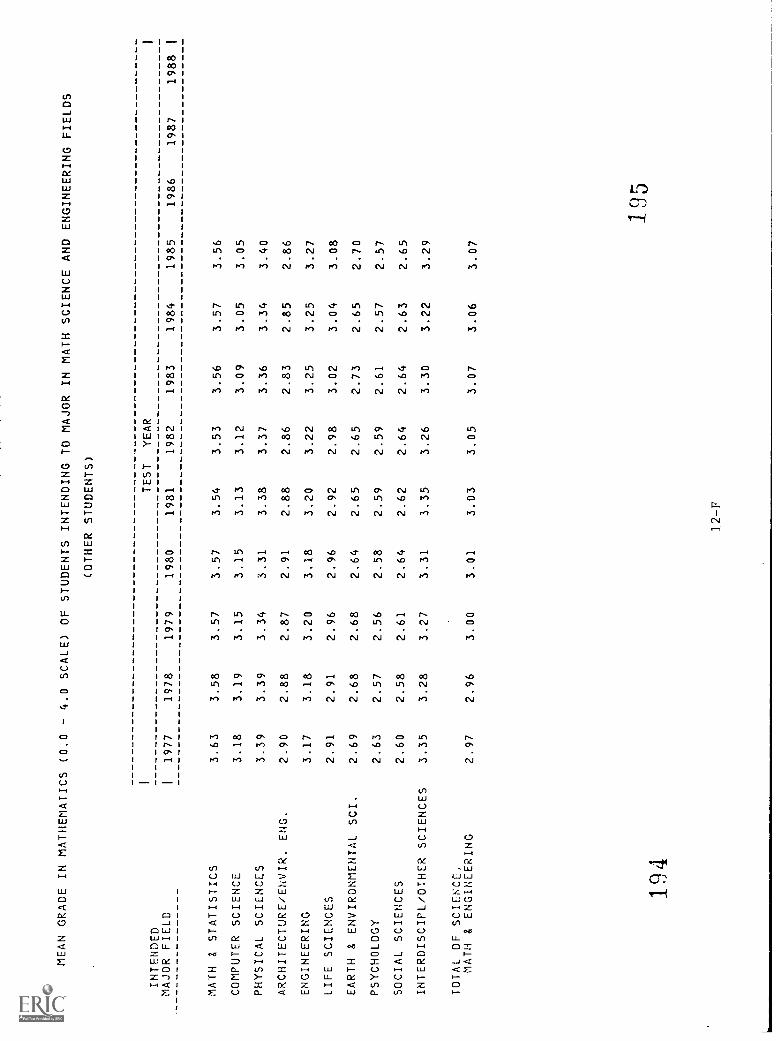
MEAN GRADE IN MATHEMATICS
INTENDED
MAJOR FIELD
I
MATH 8 STATISTICS
COMPUTER SCIENCE
PHYSICAL SCIENCES
ARCHITECTURE/ENVIR. ENG.
ENGINEERING
LIFE SCIENCES
EARTH & ENVIRONMENTAL SCI.
PSYCHOLOGY
SOCIAL SCIENCES
INTERDISCIPL/OTHER SCIENCES
TOTAL OF SCIENCE,
MATH & ENGINEERING
(0.0
1977
3.63
3.18
3.39
2.90
3.17
2.91
2.69
2.63
2.60
3.35
2.97
- 4.0 SCALE) OF STUDENTS INTENDING TO MAJOR
(OTHER STUDENTS)
TEST
YEAR
1978
1979
1980
1981
1982
3.58
3.57
3.57
3.54
3.53
3.19
3.15
3.15
3.13
3.12
3.39
3.34
3.31
3.38
3.37
2.88
2.87
2.91
2.88
2.86
3.18
3.20
3.18
3.20
3.22
2.91
2.96
2.96
2.92
2.98
2.68
2.68
2.64
2.65
2.65
2.57
2.56
2.58
2.59
2.59
2.58
2.61
2.64
2.62
2.64
3.28
3.27
3.31
3.35
3.26
2.96
3.00
3.01
3.03
3.05
IN MATH SCIENCE AND ENGINEERING FIELDS
1983
1984
1985
1986
1987
3.56
3.57
3.56
3.09
3.05
3.05
3.36
3.34
3.40
2.83
2.85
2.86
3.25
3.25
3.27
3.02
3.04
3.08
2.73
2.65
2.70
2.61
2.57
2.57
2.64
2.63
2.65
3.30
3.22
3.29
3.07
3.06
3.07
1988
194
12-F
195
I
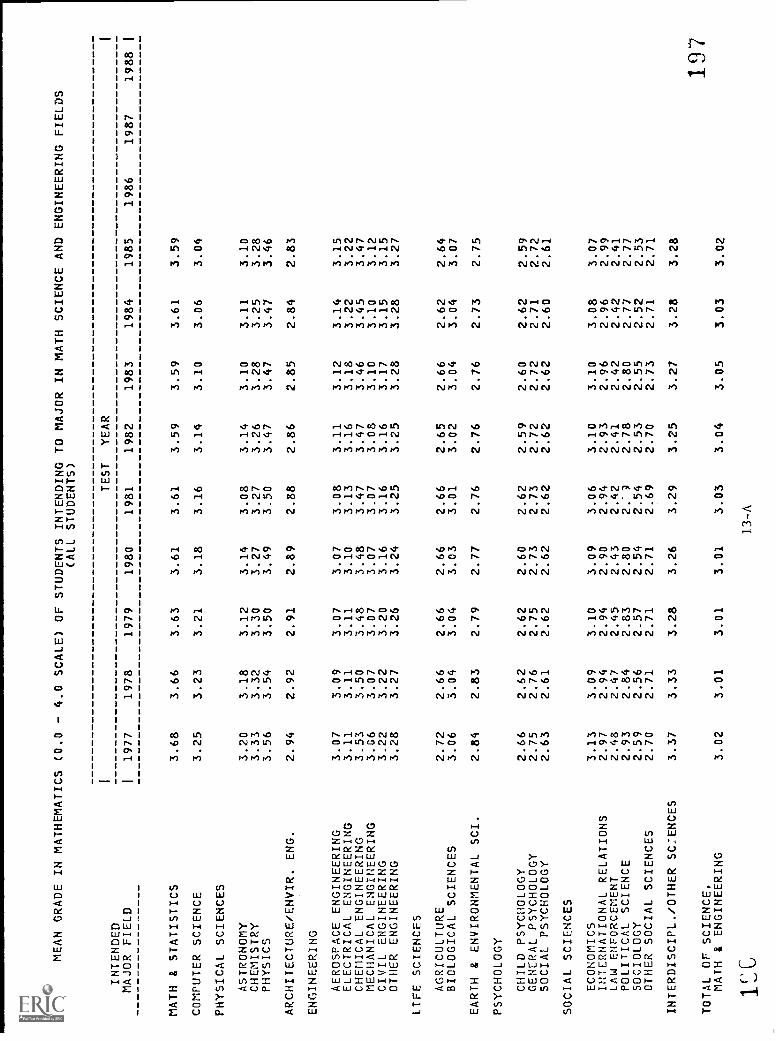
MEAN GRADE IN MATHEMATICS
I
INTENDED
MAJOR FIELD
I
MATH & STATISTICS
COMPUTER SCIENCE
PHYSICAL SCIENCES
ASTRONOMY
CHEMISTRY
PHYSICS
ARCHITECTURE/ENVIR. ENG.
ENGINEERING
AEROSPACE ENGINEERING
ELECTRICAL ENGINEERING
CHEMICAL ENGINEERING
MECHANICAL ENGINEERING
CIVIL ENGINEERING
OTHER ENGINEERING
LIFE SCIENCES
AGRICULTURE
BIOLOGICAL SCIENCES
EARTH & ENVIRONMENTAL SCI.
PSYCHOLOGY
CHILD PSYCHOLOGY
GENERAL PSYCHOLOGY
SOCIAL PSYCHOLOGY
SOCIAL SCIENCES
ECONOMICS
INTERNATIONAL RELATIONS
LAW ENFORCEMENT
POLITICAL SCIENCE
SOCIOLOGY
OTHER SOCIAL SCIENCES
INTERDISCIPL./OTHER SCIENCES
TOTAL OF SCIENCE.
MATH & ENGINEERING
(0.0
1977
3.68
3.25
3.20
3.33
3.56
2.94
3.07
3.11
3.53
3.06
3.22
3.28
2.72
3.06
2.84
2.66
2.75
2.63
3.13
2.97
2.48
2.93
2.59
2.70
3.37
3.02
- 4.0 SCALE) OF STUDENTS INTENDING TO MAJOR IN MATH SCIENCE AND ENGINEERING FIELDS
(ALL STUDENTS)
TEST
YEAR
1978
1979
1980
1981
1982
1983
1984
1985
1986
1987
3.66
3.63
3.61
3.61
3.59
3.59
3.61
3.59
3.23
3.21
3.18
3.16
3.14
3.10
3.06
3.04
3.18
3.12
3.14
3.08
3.14
3.10
3.11
3.10
3.32
3.30
3.27
3.27
3.26
3.28
3.25
3.28
3.54
3.50
3.49
3.50
3.47
3.47
3.47
3.46
2.92
2.91
2.89
2.88
2.86
2.85
2.84
2.83
3.09
3.07
3.07
3.08
3.11
3.12
3.14
3.15
3.11
3.11
3.10
3.13
3.16
3.18
3.22
3.22
3.50
3.48
3.48
3.47
3.47
3.46
3.45
3.47
3.07
3.07
3.07
3.07
3.08
3.10
3.10
3.12
3.22
3.20
3.16
3.16
3.16
3.17
3.15
3.15
3.27
3.26
3.24
3.25
3.25
3.28
3.28
3.27
2.66
2.66
2.66
2.66
2.65
2.66
2.62
2.64
3.04
3.04
3.03
3.01
3.02
3.04
3.04
3.07
2.83
2.79
2.77
2.76
2.76
2.76
2.73
2.75
2.62
2.62
2.60
2.62
2.59
2.60
2.62
2.59
2.76
2.75
2.73
2.73
2.72
2.72
2.71
2.72
2.61
2.62
2.62
2.62
2.62
2.62
2.60
2.61
3.09
3.10
3.09
3.06
3.10
3.10
3.08
3.07
2.94
2.94
2.90
2.94
2.93
2.96
2.96
2.99
2.47
2.45
2.43
2.42
2.41
2.42
2.42
2.41
2.84
2.83
2.80
2.'3
2.78
2.80
2.77
2.77
2.56
2.57
2.54
2.54
2.53
2.55
2.52
2.53
2.71
2.71
2.71
2.69
2.70
2.73
2.71
2.71
3.33
3.28
3.26
3.29
3.25
3.27
3.28
3.28
3.01
3.01
3.01
3.03
3.04
3.05
3.03
3.02
13-A
I
1988
197

MEAN GRADE IN MATHEMATICS
INTENDED
MAJOR FIELD
i
MATH & STATISTICS
COMPUTER SCIENCE
PHYSICAL SCIENCES
ASTRONOMY
CHEMISTRY
PHYSICS
ARCHITECTURE/ENVIR. ENG.
ENGINEERING
AEROSPACE ENGINEERING
ELECTRICAL ENGINEERING
CHEMICAL ENGINEERING
MECHANICAL ENGINEERING
CIVIL ENGINEERING
OTHER ENGINEERING
LIFE SCIENCES
AGRICULTURE
BIOLOGICAL SCIENCES
EARTH & ENVIRONMENTAL SCI.
PSYCHOLOGY
CHILD PSYCHOLOGY
GENERAL PSYCHOLOGY
SOCIAL PSYCHOLOGY
SOCIAL SCIENCES
ECONOMICS
INTERNATIONAL RELATIONS
LAW ENFORCEMENT
POLITICAL SCIENCE
SOCIOLOGY
OTHER SOCIAL SCIENCES
INTERDISCIPL./OTHER SCIENCES
TOTAL OF SCIENCE,
MATH & ENGINEERING
(0.0
1977
3.65
3.26
3.21
3.32
3.57
2.93
3.09
3.13
3.54
3.08
3.20
3.26
2.69
3.03
2.81
2.54
2.73
2.61
3.15
2.97
2.46
2.95
2.64
2.75
3.38
3.07- 4.0 SCALE) OF STUDENTS INTENDING TO MAJOR IN
MATH SCIENCE AND ENGINEERING FIELDS
(WHITE MALES)
TEST
YEAR
1978
1979
1980
1981
1982
1983
1984
1985
1986
1987
3.64
3.61
3.58
3.59
3.55
3.56
3.56
3.54
3.25
3.20
3.17
3.16
3.14
3.09
3.06
3.06
3.20
3.11
3.17
3.08
3.14
3.09
3.07
3.11
3.30
3.28
3.25
3.25
3.26
3.24
3.22
3.26
3.55
3.51
3.50
3.50
3.47
3.47
3.48
3.47
2.91
2.89
2.87
2.86
2.83
2.82
2.81
2.79
3.11
3.09
3.09
3.09
3.13
3.13
3.16
3.17
3.14
3.12
3.12
3.14
3.16
3.18
3.22
3.22
3.49
3.45
3.47
3.46
3.46
3.47
3.45
3.46
3.09
3.07
3.07
3.07
3.08
3.10
3.10
3.12
3.22
3.19
3.16
3.15
3.17
3.16
3.15
3.14
3.25
3.23
3.21
3.21
3.21
3.24
3.25
3.24
2.62
2.64
2.63
2.64
2.64
2.63
2.60
2.62
3.00
2.99
2.98
2.97
2.98
3.00
2.98
3.01
2.80
2.76
2.74
2.73
2.72
2.72
2.68
2.69
2.55
2.53
2.51
2.51
2.53
2.52
2.53
2.52
2.75
2.71
2.68
2.68
2.66
2.64
2.63
2.63
2.54
2.66
2.61
2.60
2.58
2.52
2.55
2.59
3.12
3.08
3.02
3.04
3.07
3.10
3.11
3.07
2.95
2.88
2.89
2.89
2.89
2.98
2.97
2.96
2.45
2.42
2.41
2.42
2.39
2.39
2.40
2.41
2.86
2.83
2.82
2.79
2.78
2.80
2.77
2.76
2.54
2.47
2.42
2.49
2.52
2.37
2.46
2.52
2.76
2.77
2.76
2.72
2.74
2.74
2.73
2.72
3.35
3.27
3.25
3.28
3.24
3.25
3.28
3.25
3.07
3.05
3.05
3.06
3.07
3.07
3.06
3.06
1988
198
13-B
199
I
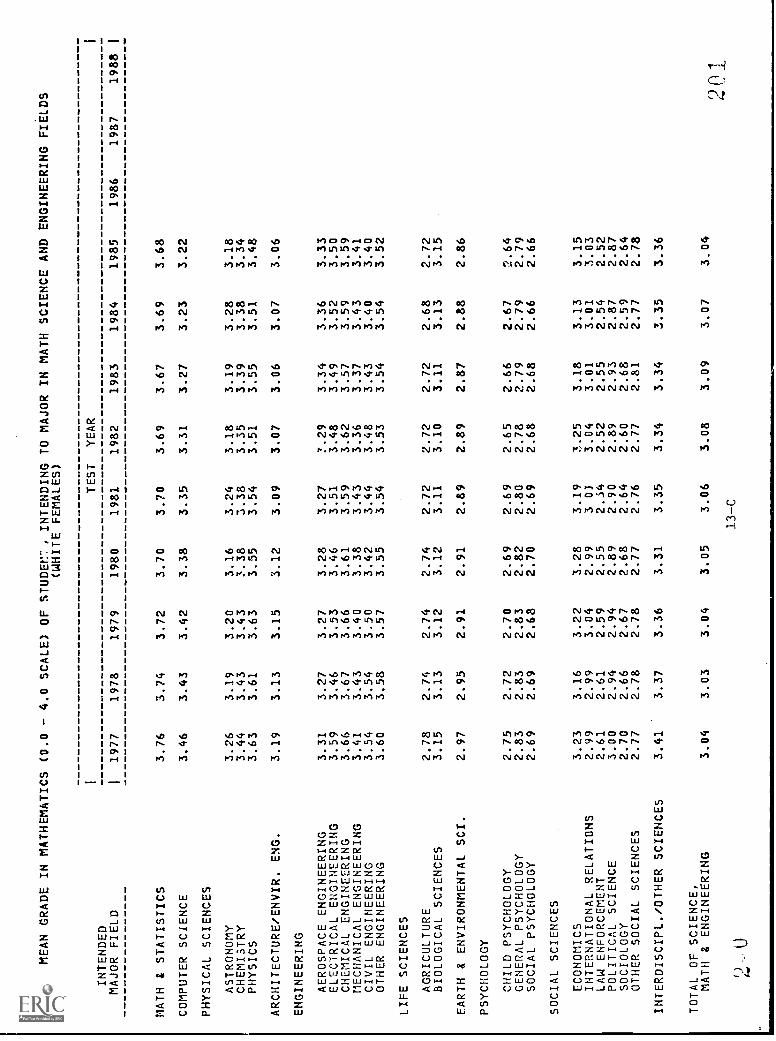
MEAN GRADE IN MATHEMATICS
I
INTENDED
MAJOR FIELD
1
(0.0
1977
MATH & STATISTICS
3.76
COMPUTER SCIENCE
3.46
PHYSICAL SCIENCES
ASTRONOMY
3.26
CHEMISTRY
3.44
PHYSICS
3.63
ARCHITECTURE/ENVIR. ENG
3.19
ENGINEERING
AEROSPACE ENGINEERING
3.31
ELECTRICAL ENGINEERING
3.59
CHEMICAL ENGINEERING
3.66
MECHANICAL ENGINEERING
3.41
CIVIL ENGINEERING
3.54
OTHER ENGINEERING
3.60
LIFE SCIENCES
AGRICULTURE
2.78
BIOLOGICAL SCIENCES
3.15
EARTH & ENVIRONMENTAL SCI.
2.97
PSYCHOLOGY
CHILD PSYCHOLOGY
2.75
GENERAL PSYCHOLOGY
2.83
SOCIAL PSYCHOLOGY
2.69
SOCIAL SCIENCES
ECONOMICS
3.23
INTERNATIONAL RELATIONS
2.99
LAW ENFORCEMENT
2.61
POLITICAL SCIENCE
3.00
SOCIOLOGY
2.70
OTHER SOCIAL SCIENCES
2.77
INTERDISCIPL./OTHER SCIENCES
3.41
TOTAL OF SCIENCE,
MATH & ENGINEERING
3.04
20
- 4.0 SCALE) OF STUDEM7, INTENDING TO MAJOR IN MATH SCIENCE AND ENGINEERING FIELDS
(WHITE FEMALES)
TEST
YEAR
1
1978
3.74
3.43
3.19
3.43
3.61
3.13
3.27
3.46
3.67
3.43
3.54
3.58
2.74
3.13
2.95
2.72
2.83
2.69
3.16
2.99
2.61
2.94
2.66
2.78
3.37
3.03
1979
3.72
3.42
3.20
3.43
3.63
3.15
3.27
3.53
3.66
3.40
3.50
3.57
2.74
3.12
2.91
2.70
2.83
2.68
3.22
3.04
2.59
2.94
2.67
2.78
3.36
3.04
1980
3.70
3.38
3.16
3.38
3.55
3.12
3.28
3.46
3.61
3.38
3.42
3.55
2.74
3.12
2.91
2.69
2.82
2.70
3.28
2.99
2.55
2.89
2.68
2.77
3.31
3.05
1981
3.70
3.35
3.24
3.38
3.54
3.09
3.27
3.51
3.59
3.43
3.44
3.54
2.72
3.11
2.89
2.69
2.80
2.69
3.19
3 0]
2.34
2.90
2.64
2.76
3.35
3.06
1982
3.69
3.31
3.18
3.35
3.51
3.07
?.29
3.48
3.62
3.36
3.48
3.53
2.72
3.10
2.89
2.65
2.78
2.68
3,25
3.04
2.52
2.89
2.60
2.77
3.34
3.08
1983
3.67
3.27
3.19
3.39
3.55
3.06
3.34
3.49
3.57
3.37
3.43
3.54
2.72
3.11
2.87
2.66
2.79
2.68
3.18
3.01
2.55
2.93
2.68
2.81
3.34
3.09
1984
3.69
3.23
3.28
3.38
3.51
3.07
3.36
3.52
3.59
3.43
3.40
3.54
2.68
3.13
2.88
2.67
2.79
2.66
3.13
3.01
2.54
2.87
2.59
2.77
3.35
3.07
1985
3.68
3.22
3.18
3.34
3.48
3.06
3.33
3.50
3.59
3.41
3.40
3.52
2.72
3.15
2.86
2.64
2.79
2.66
3.15
3.03
2.52
2.87
2.64
2.78
3.36
3.04
1986
1987
13-C
1988
1
201
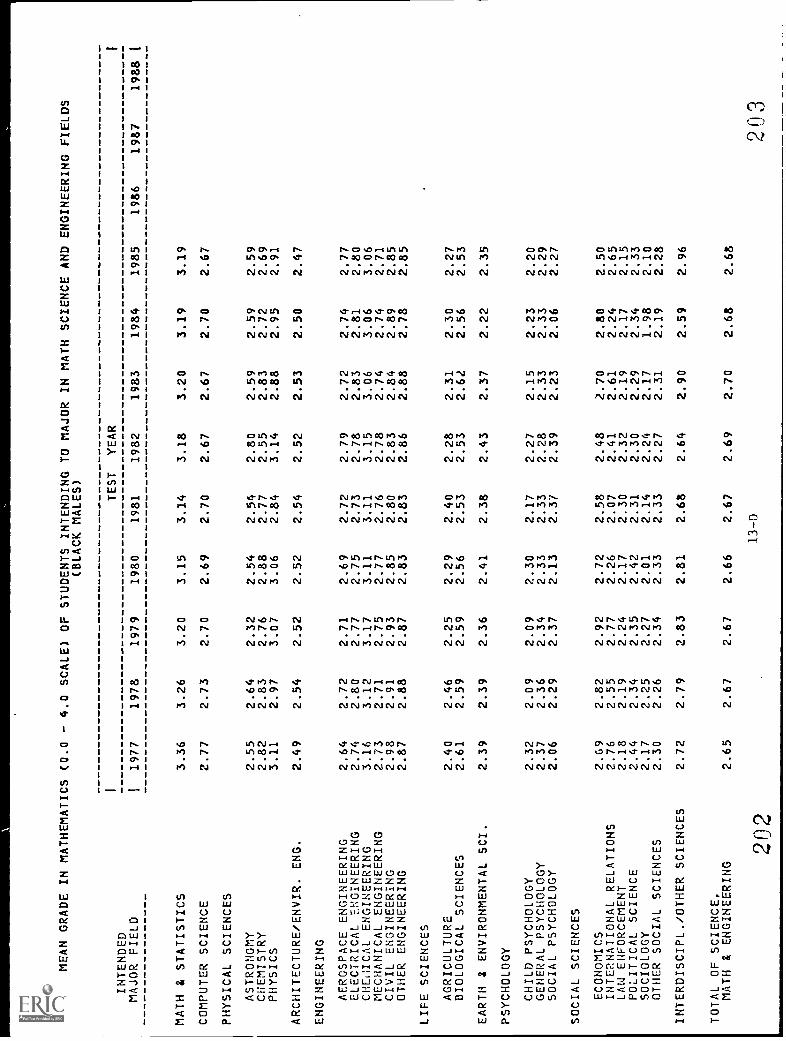
MEAN GRADE IN MATHEMATICS
1
INTENDED
MAJOR FIELD
1
MATH & STATISTICS
COMPUTER SCIENCE
PHYSICAL SCIENCES
ASTRONOMY
CHEMISTRY
PHYSICS
ARCHITECTURE/ENVIR. ENG.
ENGINEERING
AEROSPACE ENGINEERING
ELECTRICAL ENGINEERING
CHEMICAL ENGINEERING
MECHANICAL ENGINEERING
CIVIL ENGINEERING
OTHER ENGINEERING
LIFE SCIENCES
AGRICULTURE
BIOLOGICAL SCIENCES
EARTH & ENVIRONMENTAL SCI.
PSYCHOLOGY
CHILD PSYCHOLOGY
GENERAL PSYCHOLOGY
SOCIAL PSYCHOLOGY
SOCIAL SCIENCES
ECONOMICS
INTERNATIONAL RELATIONS
LAW ENFORCEMENT
POLITICAL SCIENCE
SOCIOLOGY
OTHER SOCIAL SCIENCES
INTERDISCIPL./OTHER SCIENCES
TOTAL OF SCIENCE,
MATH & ENGINEERING
(0.0
1977
3.36
2.77
2.55
2.82
3.11
2.49
2.64
2.74
3.16
2.73
2.98
2.87
2.40
2.61
2.39
2.32
2.37
2.06
2.69
2.76
2.18
2.44
2.17
2.30
2.72
2.65
- 4.0 SCALE) OF STUDENTS INTENDING TO MAJOR
(BLACK MALES)
TEST
YEAR
1978
1979
1980
1981
1982
3.26
3.20
3.15
3.14
3.18
2.73
2.70
2.69
2.70
2.67
2.64
2.32
2.54
2.54
2.80
2.83
2.76
2.88
2.77
2.55
2.97
3.07
3.06
2.84
3.14
2.54
2.52
2.52
2.54
2.52
2.72
2.71
2.69
2.72
2.79
2.80
2.77
2.75
2.73
2.78
3.12
3.17
3.11
3.11
3.15
2.71
2.75
2.77
2.76
2.78
2.91
2.93
2.85
2.80
2.83
2.88
2.87
2.83
2.83
2.86
2.46
2.25
2.29
2.40
2.28
2.59
2.59
2.56
2.53
2.53
2.39
2.36
2.41
2.38
2.43
2.09
2.09
2.30
2.17
2.27
2.36
2.34
2.33
2.33
2.28
2.29
2.37
2.13
2.37
2.39
2.82
2.92
2.72
2.58
2.48
2.55
2.77
2.26
2.07
2.41
2.19
2.24
2.17
2.30
2.32
2.34
2.35
2.42
2.31
2.30
2.25
2.27
2.01
2.14
2.24
2.26
2.34
2.33
2.33
2.27
2.79
2.83
2.81
2.68
2.64
2.67
2.67
2.66
2.67
2.69
IN MATH SCIENCE AND ENGINEERING FIELDS
1983
1984
1985
1986
1987
3.20
3.19
3.19
2.67
2.70
2.67
2.59
2.59
2.59
2.83
2.72
2.69
2.88
2.95
2.91
2.53
2.50
2.47
2.72
2.74
2.77
2.83
2.81
2.80
3.06
3.06
3.06
2.74
2.74
2.71
2.84
2.89
2.85
2.88
2.78
2.85
2.31
2.30
2.27
2.62
2.56
2.53
2.37
2.22
2.35
2.15
2.23
2.20
2.33
2.33
2.29
2.23
2.06
2.27
2.70
2.80
2.50
2.61
2.24
2.65
2.19
2.17
2.15
2.29
2.34
2.33
2.17
1.98
2.10
2.31
2.19
2.28
2.90
2.59
2.96
2.70
2.68
2.68
202
13-D
203
1988
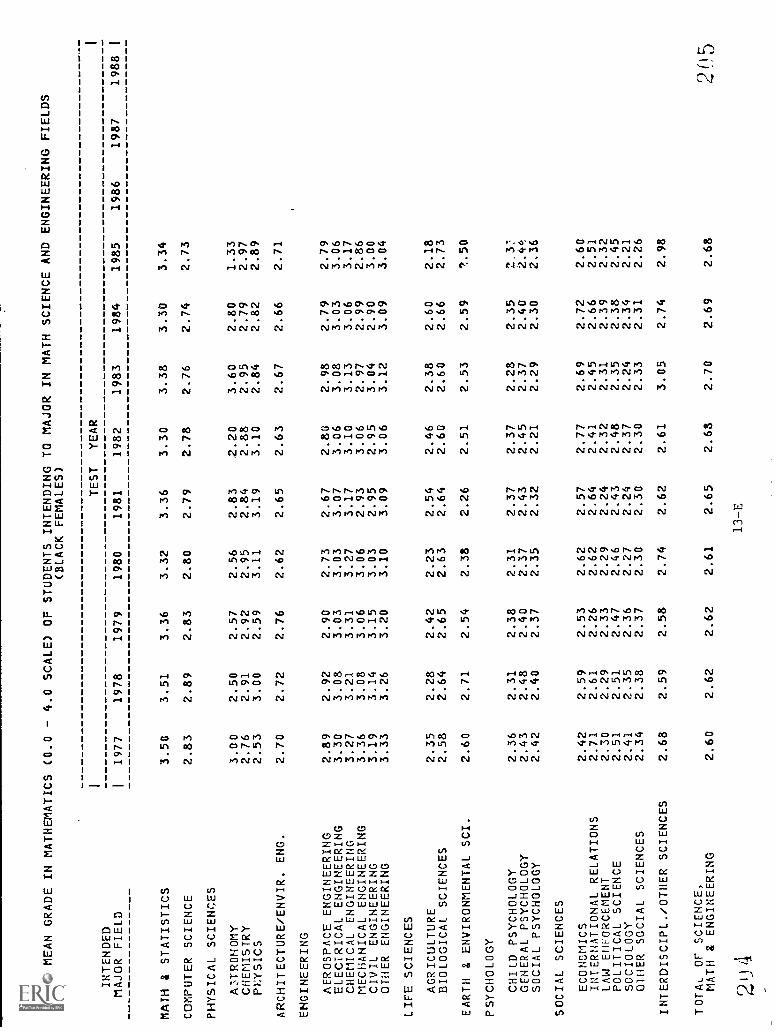
MEAN GRADE IN MATHEMATICS
1
INTENDED
MAJOR FIELD
1
MATH & STATISTICS
COMPUTER SCIENCE
PHYSICAL SCIENCES
A:TRONOMY
CHEMISTRY
PF:YSICS
ARCHITECTURE/ENVIR. ENG.
ENGINEERING
AEROSPACE ENGINEERING
ELECTRICAL ENGINEERING
CHEMICAL ENGINEERING
MECHANICAL ENGINEERING
CIVIL ENGINEERING
OTHER ENGINEERING
LIFE SCIENCES
AGRICULTURE
BIOLOGICAL SCIENCES
EARTH & ENVIRONMENTAL SCI.
PSYCHOLOGY
CHILD PSYCHOLOGY
GENERAL PSYCHOLOGY
SOCIAL PSYCHOLOGY
SOCIAL SCIENCES
ECONOMICS
INTERNATIONAL RELATIONS
LAW ENFORCEMENT
POLITICAL SCIENCE
SOCIOLOGY
OTHER SOCIAL SCIENCES
INTERDISCIPL./OTHER SCIENCES
TOTAL Or SCIENCE,
MATH & ENGINEERING
(0.0
1977
3.50
2.83
3.00
2.76
2.53
2.70
2.89
3.30
3.27
3.36
3.19
3.33
2.35
2.58
2.60
2.36
2.43
2.42
2.42
2.71
2.30
2.51
2.41
2.34
2.68
2.60
- 4.0 SCALE) OF STUDENTS INTENDING TO MAJOR IN MATH SCIENCE AND ENGINEERING
FIELDS
(BLACK FEMALES)
TEST
YEAR
1978
1979
1980
1981
1982
1983
1984
1985
1986
1987
3.51
3.36
3.32
3.36
3.30
3.38
3.30
3.34
2.89
2.83
2.80
2.79
2.78
2.76
2.74
2.73
2.50
2.57
2.56
2.83
2.20
3.60
2.80
1.33
2.91
2.92
2.95
2.84
2.88
2.95
2.79
2.97
3.00
2.59
3.11
3.19
3.10
2.84
2.82
2.89
2.72
2.76
2.62
2.65
2.63
2.67
2.66
2.71
2.92
2.90
2.73
2.67
2.80
2.98
2.79
2.79
3.08
3.03
3.03
3.07
3.06
3.08
3.03
3.06
3.21
3.31
3.27
3.17
3.10
3.13
3.06
3.17
3.08
3.06
3.06
2.93
3.06
2.97
2.99
2.86
3.14
3.15
3.03
2.95
2.95
3.04
2.90
3.00
3.26
3.20
3.10
3.09
3.06
3.12
3.09
3.04
2.28
2.42
2.23
2.54
2.46
2.38
2.60
2.18
2.64
2.65
2.63
2.64
2.60
2.60
2.66
2.73
2.71
2.54
2.38
2.26
2.51
2.53
2.59
1.50
2.31
2.38
2.31
2.37
2.37
2.28
2.35
2.3.7
2.48
2.40
2.37
2.43
2.45
2.37
2.40
2.4c
2.40
2.37
2.35
2.32
2.21
2.29
2.30
2,36
2.59
2.53
2.62
2.57
2.77
2.69
2.72
2.60
2.61
2.26
2.62
2.64
2.41
2.45
2.66
2.51
2.29
2.33
2.29
2.24
2.32
2.31
2.39
2.32
2.51
2.47
2.46
2.43
2.48
2.35
2.38
2.45
2.35
2.36
2.27
2.24
2.37
2.24
2.34
2.21
2.38
2.37
2.30
2.30
2.30
2.33
2.31
2.26
2.59
2.58
2.74
2.62
2.61
3.05
2.74
2.98
2.62
2.62
2.61
2.68
2.70
2.69
2.68
2'±
413-E
1
1988
2 5
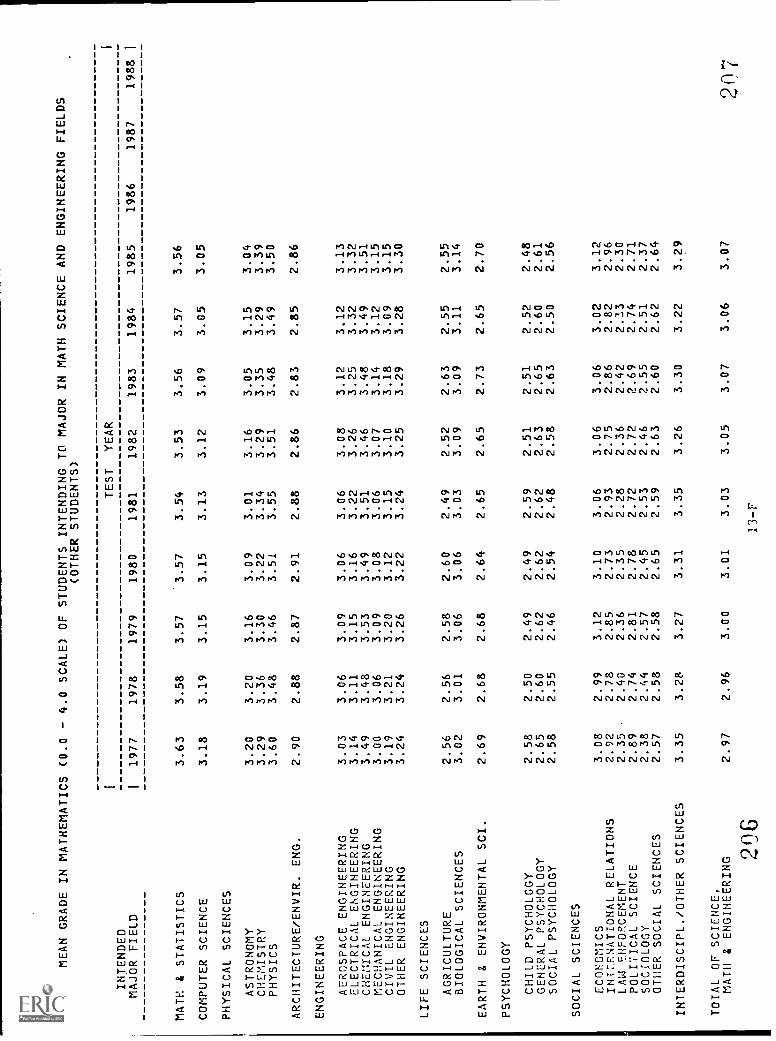
MEAN GRADE IN MATHEMATICS
INTENDED
MAJOR FIELD
1
(0.0
1977
MATH & STATISTICS
3.63
COMPUTER SCIENCE
3.18
PHYSICAL SCIENCES
ASTRONOMY
3.20
CHEMISTRY
3.29
PHYSICS
3.60
ARCHITECTURE/ENVIR. ENG.
2.90
ENGINEERING
AEROSPACE ENGINEERING
3.03
ELECTRICAL ENGINEERING
3.14
CHEMICAL ENGINEERING
3.49
MECHANICAL ENGINEERING
3.00
CIVIL ENGINEERING
3.19
OTHER ENGINEERING
3.24
LIFE SCIENCES
AGRICULTURE
2.56
BIOLOGICAL SCIENCES
3.02
EARTH & ENVIRONMENTAL SCI.
2.69
PSYCHOLOGY
CHILD PSYCHOLOGY
2.58
GENERAL PSYCHOLOGY
2.65
SOCIAL PSYCHOLOGY
2.58
SOCIAL SCIENCES
ECONOMICS
3.08
INTZTENATIONAL RELATIONS
2.92
LAW ENFORCEMENT
2.35
POLIVICAL SCIENCE
2.89
SOCIOLOGY
2.38
OTHER SOCIAL SCIENCES
2.57
INTERDISCIPL./OTHER SCIENCES
3.35
TOTAL OF SCIENCE,
MATH & ENGINEERING
2.97
206
- 4.0 SCALE) OF STUDENTS INTENDING TO MAJOR IN MATH SCIENCE AND ENGINEERING FIELDS
(OTHER STUDENTS)
TEST
YEAR
1978
3.58
3.19
3.20
3.36
3.48
2.88
3.06
3.11
3.48
3.06
3.21
3.24
2.56
3.01
2.68
2.50
2.60
2.55
2.99
2.78
,
2.40
2.74
2.44
2.58
3.28
2.96
1979
3.57
3.15
3.16
3.30
3.46
2.87
3.09
3.15
3.53
3.09
3.20
3.26
2.58
3.06
2.68
2.49
2.62
2.46
3.12
2.85
2.36
2.81
2.57
2.58
3.27
3.00
1980
3.57
3.15
3.09
3.22
3.51
2.91
3.06
3.16
3.49
3.08
3.12
3.22
2.60
3.06
2.64
2.49
2.62
2.54
3.10
2.73
2.35
2.78
2.45
2.65
3.31
3.01
1981
3.54
3.13
3.01
3.34
3.55
2.88
3.06
3.22
3.51
3.06
3.15
3.24
2.49
3.03
2.65
2.59
2.62
2.48
3.06
2.93
2.28
2.72
2.53
2.59
3.35
3.03
1982
3.53
3.12
3.16
3.29
3.51
2.86
3.08
3.26
3.46
3.07
3.10
3.25
2.52
3.09
2.65
2.51
2.63
2.58
3.06
2.75
2.36
2.72
2.46
2.63
3.26
3.05
1983
3.56
3.09
3.05
3.35
3.48
2.83
3.12
3.25
3.48
3.14
3.18
3.29
2.63
3.09
2.73
2.51
2.65
2.63
3.06
2.86
2.42
2.69
2.55
2.60
3.30
3.07
1984
3.57
3.05
3.15
3.29
3.49
2.85
3.12
3.32
3.49
3.12
3.09
3.28
2.55
3.11
2.65
2.52
2.60
2.50
3.02
2.82
2.33
2.74
2.51
2.62
3.22
3.06
1985
3.56
3.05
3.04
3.39
3.50
2.86
3.13
3.32
3.51
3.15
3.15
3.30
2.55
3.14
2.70
2.48
2.61
2.56
3.12
2.96
2.30
2.71
2.37
2.64
3.29
3.07
1986
1987
13-F
1988
1
2fl7
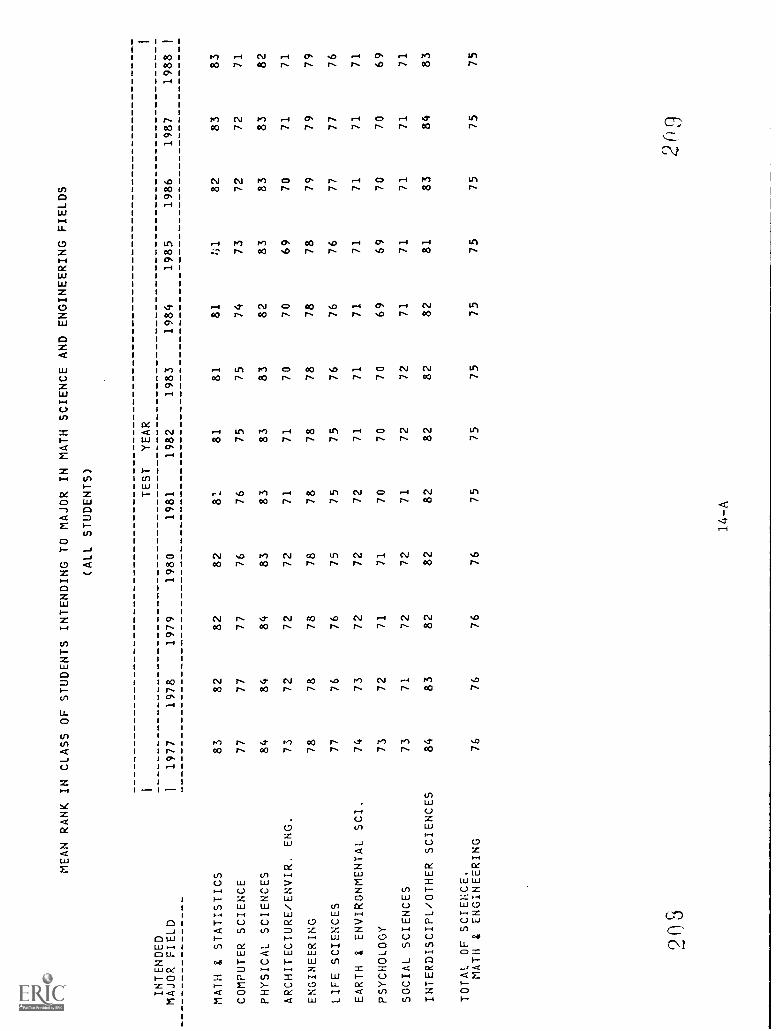
MEAN RANK IN CLASS OF STUDENTS INTENDING TO MAJOR IN MATH SCIENCE AND ENGINEERING FIELDS
INTENDED
MAJOR FIELD
MATH & STATISTICS
COMPUTER SCIENCE
PHYSICAL SCIENCES
ARCHITECTURE/ENVIR. ENG.
ENGINEERING
LIFE SCIENCES
EARTH & ENVIRONMENTAL SCI.
PSYCHOLOGY
SOCIAL SCIENCES
INTERDISCIPL/OTHER SCIENCES
TOTAL OF SCIENCE.
MATH & ENGINEERING
11977 83
77
84 73
78
77
74
73
73
84 76
1978
82 77
84 72
78
76
73
72 71
83 76
1979 82
77
84
72 78
76
72
71
72
82
76
(ALL
1980
82 76
83 72
78
75
72
71 72
82
76
STUDENTS.)
TEST
1981
8.
76
83
71
78
75
72
70
71
82 75
YEAR
1982
81 75
83
71
78
75
71
70 72
82
75
1983 81
75
83 70
78
76
71
70
72
82 75
1984
81 74
82
70
78
76
71
69 71
82
75
1985
1;1
73
83
69 78
76
71
69
71
81 75
1986 82
72 83
70
79
77
71
70
71
83 75
1987 83
72
83
71
79
77
71
70 71
84 75
1988 83 71
82
71
79
76
71
69
71
83 75
208
14-A
20
9
1
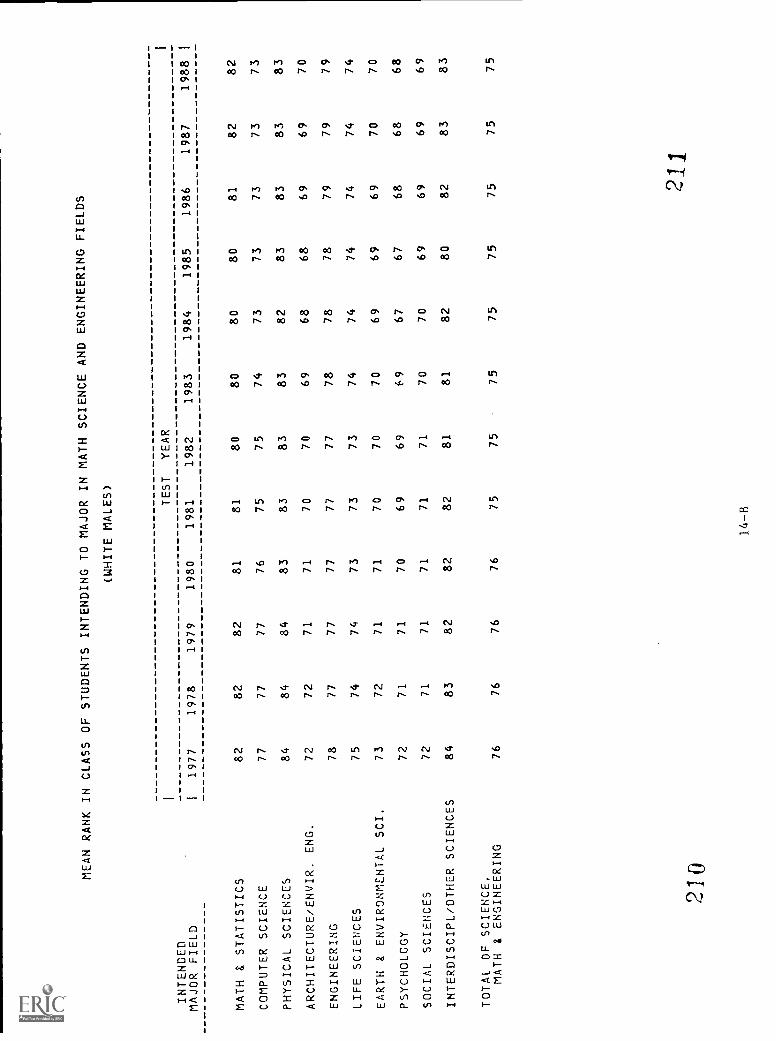
MEAN RANK
INTENDED
MAJOR FIELD
MATH & STATISTICS
COMPUTER SCIENCE
PHYSICAL SCIENCES
ARCHITECTURE/ENVIR. ENG.
ENGINEERING
LIFE SCIENCES
EARTH & ENVIRONMENTAL SCI.
PSYCHOLOGY
SOCIAL SCIENCES
INTERDISCIPL/OTHER SCIENCES
TOTAL OF SCIENCE,
MATH & ENGINEERING
IN CLASS
1 11977
82 77
84
72 78
75
73
72
72
84 76
OF STUDENTS INTENDING TO MAJOR IN MATH SCIENCE
AND ENGINEERING FIELDS
(WHITE MALES)
TEST
YEAR
1978
1979
1980
1981
1982
1983
1984
1985
1986
82
82
81
81
80
80
80
80
81
77
77
76
75
75
74
73
73
73
84
84
83
83
83
83
82
83
83
72
71
71
70
70
69
68
68
69
77
77
77
77
77
78
78
78
79
74
74
73
73
73
74
74
74
74
72
71
71
70
70
70
69
69
69
71
71
70
69
69
69
67
67
68
71
71
71
71
71
70
70
69
69
83
82
82
82
81
81
82
80
82
76
76
76
75
75
75
75
75
75
1987 82 73
83
69
79
74
70 68
69
83 75
1988 82
73
83
70
79
74
70
68
69
83 75
1
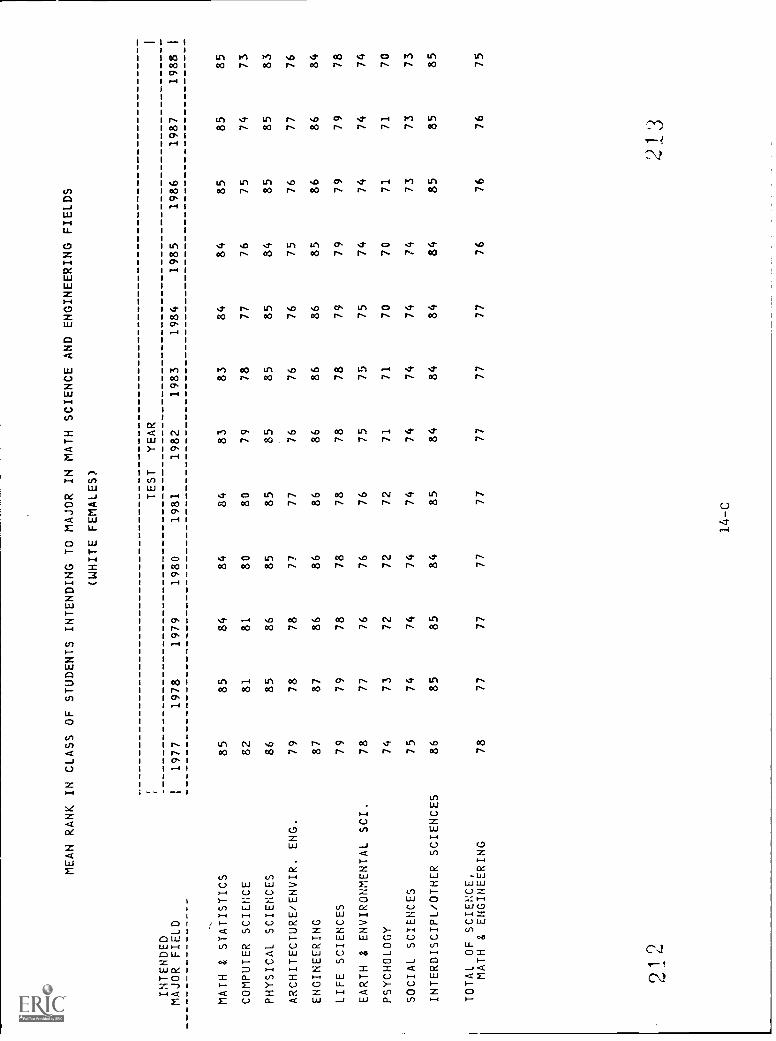
INTENDED
MEAN RANK IN CLASS OF STUDENTS INTENDING TO MAJOR IN MATH SCIENCE AND ENGINEERING FIELDS
(WHITE FEMALES)
TEST
YEAR
MAJOR FIELD
1977
1978
1979
1980
1981
1982
1983
1984
1985
1986
1987
1988
MATH & STATISTICS
85
85
84
84
84
83
83
84
84
85
85
85
COMPUTER SCIENCE
82
81
81
80
80
79
78
77
76
75
74
73
PHYSICAL SCIENCES
86
85
86
85
85
85
85
85
84
85
85
83
ARCHITECTURE/ENVIR. ENG.
79
78
78
77
77
76
76
76
75
76
77
76
ENGINEERING
87
87
86
86
86
86
86
86
85
86
86
84
LIFE SCIENCES
79
79
78
78
78
78
78
79
79
79
79
78
EARTH & ENVIRONMENTAL SCI.
78
77
76
76
76
75
75
75
74
74
74
74
PSYCHOLOGY
74
73
72
72
72
71
71
70
70
71
71
70
SOCIAL SCIENCES
75
74
74
74
74
74
74
74
74
73
73
73
INTERDISCIPL/OTHER SCIENCES
86
85
85
84
85
84
84
84
84
85
85
85
TOTAL OF SCIENCE,
MATH & ENGINEERING
78
77
77
77
77
77
77
77
76
76
76
75
212
213
I
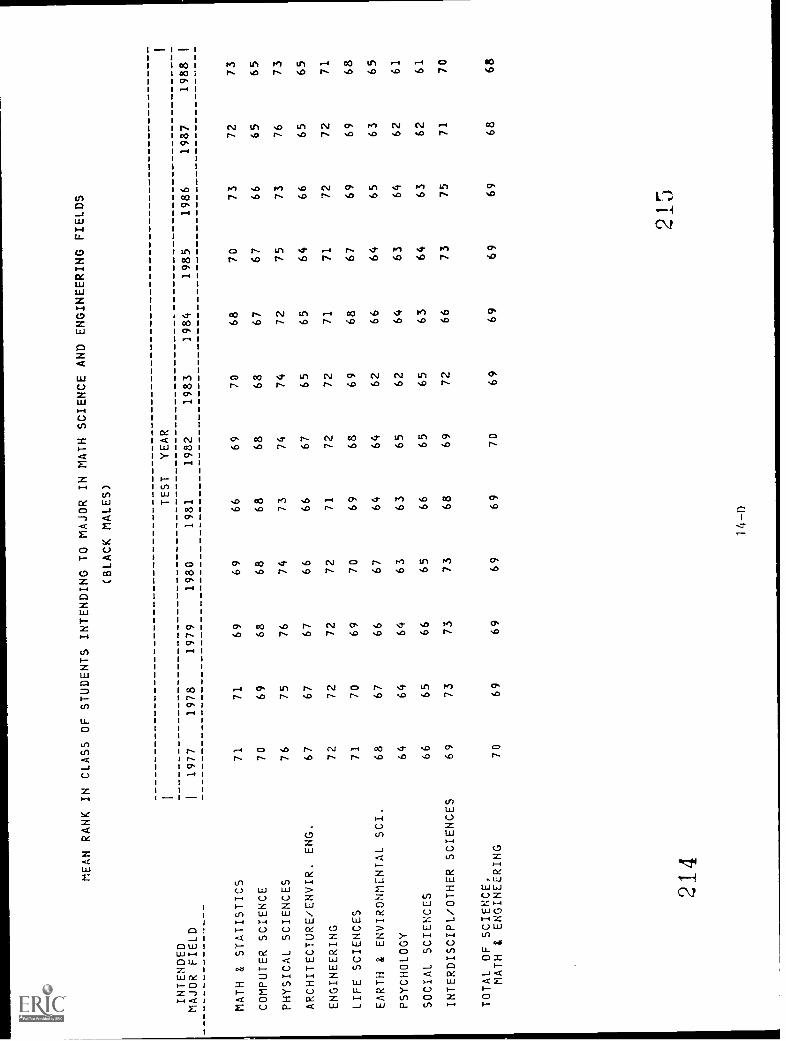
MEAN RANK
INTENDED
IN CLASS OF STUDENTS INTENDING TO MAJOR IN MATH SCIENCE
AND ENGINEERING FIELDS
(BLACK MALES)
TEST
YEAR
1
MAJOR FIELD
1977
1978
1979
1980
1981
1982
1983
1984
1985
1986
1987
1988
I
MATH & STATISTICS
71
71
69
69
66
69
70
68
70
73
72
73
COMPUTER SCIENCE
70
69
68
68
68
68
68
67
67
66
65
65
PHYSICAL SCIENCES
76
75
76
74
73
74
74
72
75
73
76
73
ARCHITECTURE/ENVIR. ENG.
67
67
67
66
66
67
65
65
64
66
65
65
ENGINEERING
72
72
72
72
71
72
72
71
71
72
72
71
LIFE SCIENCES
71
70
69
70
69
68
69
68
67
69
69
68
EARTH & ENVIRONMENTAL SCI.
68
67
66
67
64
64
62
66
64
65
63
65
PSYCHOLOGY
64
64
64
63
63
65
62
64
63
64
62
61
SOCIAL SCIENCES
66
65
66
65
66
65
65
63
64
63
62
61
INTERDISCIPL/OTHER SCIENCES
69
73
73
73
68
69
72
66
73
75
71
70
TOTAL OF SCIENCE.
MATH & ENGINEERING
70
69
69
69
69
70
69
69
69
69
68
68
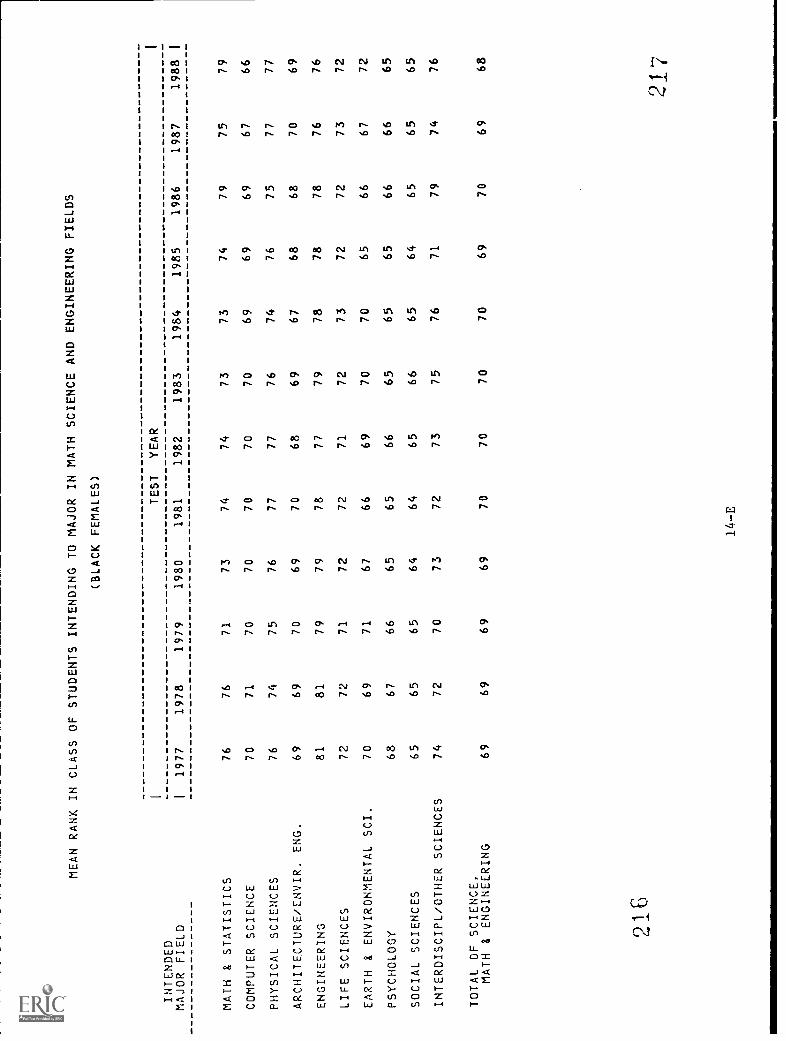
MEAN RANK
INTENDED
IN CLASS OF STUDENTS INTENDING TO MAJOR IN MATH SCIENCE AND ENGINEERING FIELDS
(BLACK FEMALES)
ITEST
YEAR
MAJOR FIELD
I1977
1978
1979
1980
1981
1982
1983
1984
1985
1986
1987
1988
MATH & STATISTICS
76
76
71
73
74
74
73
73
74
79
75
79
COMPUTER SCIENCE
70
71
70
70
70
70
70
69
69
69
67
66
PHYSICAL SCIENCES
76
74
75
76
77
77
76
74
76
75
77
77
ARCHITECTURE/ENVIR. ENG.
69
69
70
69
70
68
69
67
68
68
70
69
ENGINEERING
81
81
79
79
78
77
79
78
78
78
76
76
LIFE SCIENCES
72
72
71
72
72
71
72
73
72
72
73
72
EARTH & ENVIRONMENTAL SCI.
70
69
71
67
66
69
70
70
65
66
67
72
PSYCHOLOGY
68
67
66
65
65
66
65
65
65
66
66
65
SOCIAL SCIENCES
65
65
65
64
64
65
66
65
64
65
65
65
INTERDISCIPL/OTHER SCIENCES
74
72
70
73
72
73
75
76
71
79
74
76
TOTAL OF SCIENCE,
MATH & ENGINEERING
69
69
69
69
70
70
70
70
69
70
69
68
216
217
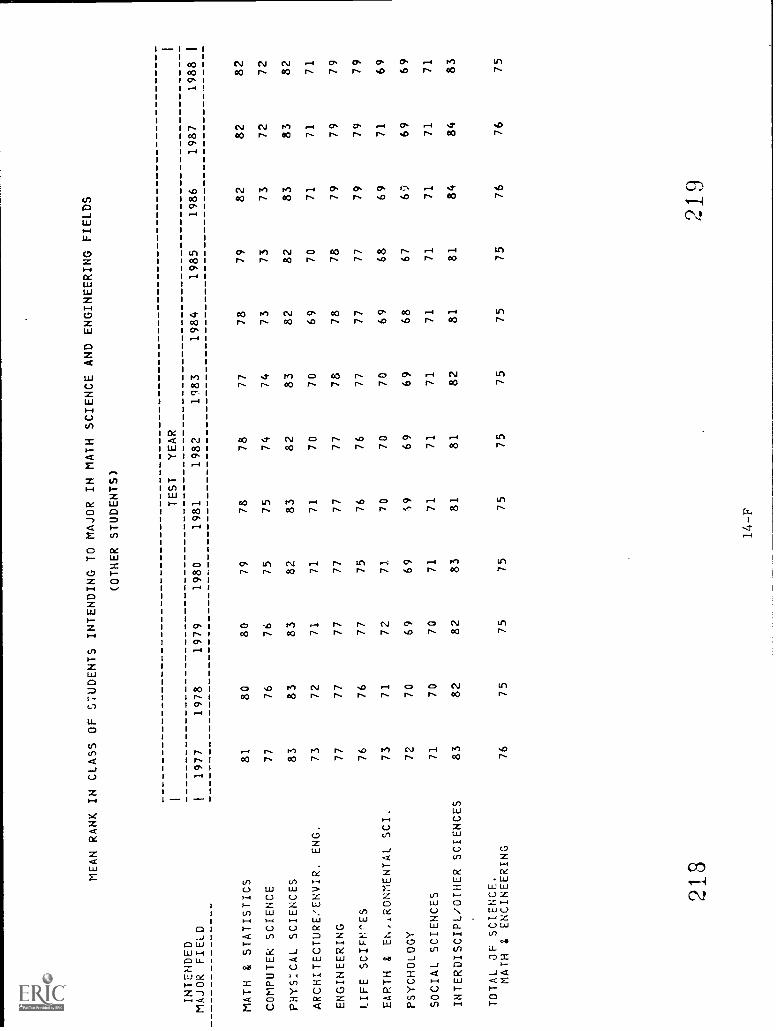
MEAN RANK IN CLASS OF STUDENTS INTENDING TO MAJOR IN MATH
SCIENCE AND ENGINEERING FIELDS
(OTHER STUDENTS)
INTENDED
TEST
YEAR
MAJOR FIELD
I1977
1978
1979
1980
1981
1982
1983
1984
1985
1986
1987
1988
MATH & STATISTICS
81
80
80
79
78
78
77
78
79
82
82
82
COMPUTEN SCIENCE
77
76
76
75
75
74
74
73
73
73
72
72
PHYSICAL SCIENCES
83
83
83
82
83
82
83
82
82
83
83
82
ARCHITECTURUENVIR. ENG.
73
72
71
71
71
70
70
69
70
71
71
71
ENGINEERING
77
77
77
77
77
77
78
78
78
79
79
79
LIFE SCIFrr!ES
76
76
77
75
76
76
77
77
77
79
79
79
EARTH & EN,,RONMENTAL SCI.
73
71
72
7].
70
70
70
69
68
69
71
69
PSYCHOLOGY
72
70
69
69
PO
69
69
68
67
69
69
69
SOCIAL SCIENCES
71
70
70
71
71
71
71
71
71
71
71
71
INTERDISCIPL/OTHER SCIENCES
83
82
82
83
81
81
82
81
81
84
84
83
TOTAL OF SCIENCE.
MATH & ENCINEERING
76
75
75
75
75
75
75
75
75
76
76
75
213
219
I

MEAN RANK IN CLASS OF STUDENTS INTENDING TO MAJOR IN MATH SCIENCE AND ENGINEERING FIELDS
(ALL STUDENTS)
TEST
YEAR
INTENDED
MAJOR FIELD
1977
1978
1979
1980
1981
1982
1983
1984
1985
1986
1987
1988
I
MATH & STATISTICS
83
82
82
82
81
81
81
81
81
82
83
83
COMPUTER SCIENCE
77
77
77
76
76
75
75
74
73
72
72
71
PHYSICAL SCIENCES
ASTRONOMY
81
79
79
79
79
79
78
78
78
80
81
80
CHEMISTRY
83
83
83
83
82
82
82
81
82
82
82
82
PHYSICS
87
87
87
86
86
86
85
85
85
85
85
84
ARCHITECTURE/ENVIR. ENG.
73
72
72
72
71
71
70
70
69
70
71
71
ENGINEERING
AEROSPACE ENGINEERING
76
76
76
76
76
77
77
78
78
79
79
79
ELECTRICAL ENGINEERING
76
75
75
75
76
76
77
77
77
78
78
77
CHEMICAL ENGINEERING
86
86
85
86
85
85
85
85
85
85
85
84
MECHANICAL ENGINEERING
74
74
74
74
74
74
75
74
75
76
77
77
CIVIL ENGINEERING
78
78
77
77
77
76
76
76
76
76
76
76
OTHER ENGINEERING
80
80
79
79
79
79
80
80
79
80
80
80
LIFE SCIENCES
AGRICULTURE
71
69
69
68
68
68
68
67
67
67
67
67
BIOLOGICAL SCIENCES
80
79
79
79
78
78
79
79
79
79
79
79
EARTH & ENVIRONMENTAL SCI.
74
73
72
72
72
71
71
71
71
71
71
71
PSYCHOLOGY
CHILD PSYCHOLOGY
71
68
68
68
67
67
67
67
66
67
67
67
GENERAL PSYCHOLOGY
74
73
73
72
72
71
71
71
70
71
70
70
SOCIAL PSYCHOLOGY
71
70
70
70
69
69
68
68
68
68
68
68
SOCIAL SCIENCES
ECONOMICS
82
81
81
81
80
80
81
80
80
81
80
80
INTERNATIONAL RELATIONS
82
82
82
81
81
81
82
81
81
82
82
82
LAW ENFORCEMENT
64
63
62
61
61
61
61
61
60
62
62
62
POLITICAL SCIENCE
79
78
77
77
76
76
76
76
76
77
77
76
SOCIOLOGY
70
69
69
68
68
67
67
66
66
66
67
66
OTHER SOCIAL SCIENCES
73
72
72
72
71
72
72
72
71
71
71
72
INTERDISCIPL./OTF
,:',TENCES
84
83
82
82
82
82
82
82
81
83
84
83
TOTAL OF SCIENCE,
MATH & ENGINEERING
76
76
76
76
75
75
75
75
75
75
75
75
15-A
2;[
1

MEAN RANK IN CLASS OF STUDENTS INTENDING TO MAJOR IN MATH SCIENCE AND ENGINEERING FIELDS
(WHITE MALES)
INTENDED
TEST
YEAR
I
MAJOR FIELD
I1977
1978
1979
1980
1982
1983
1984
1985
1986
1987
1988
I
MATH & STATISTICS
82
82
82
81
81
80
80
80
80
81
82
82
COMPUTER SCIENCE
77
77
77
76
75
75
74
73
73
73
73
73
PHYSICAL SCIENCES
ASTRONOMY
81
79
79
80
78
79
78
78
77
80
81
80
CHEMISTRY
83
83
82
82
82
82
81
80
81
82
82
82
PHYSICS
87
87
87
86
85
86
85
85
86
85
85
84
ARCHITECTURE/ENVIR. ENG.
72
72
71
71
70
70
69
68
68
69
69
70
ENGINEERING
AEROSPACE ENGINEERING
77
76
76
76
76
77
77
78
78
79
79
79
ELECTRICAL ENGINEERING
76
75
75
76
76
76
77
77
77
78
78
77
CHEMICAL ENGINEERING
86
86
85
85
85
85
85
85
85
85
85
84
MECHANICAL ENGINEERING
74
74
74
74
74
74
75
74
75
76
77
77
CIVIL ENGINEERING
77
78
77
76
76
76
76
76
75
76
76
75
OTHER ENGINEERING
79
79
78
78
78
78
79
79
78
79
80
79
LIFE SCIENCES
AGRICULTURE
69
68
68
67
67
67
66
66
66
66
66
65
BIOLOGICAL SCIENCES
79
78
77
77
77
77
77
77
77
78
78
78
EARTH & ENVIRONMENTAL SCI.
73
72
71
71
70
70
70
69
69
69
70
70
PSYCHOLOGY
CHILD PSYCHOLOGY
66
65
66
64
64
63
63
64
60
65
64
65
GENERAL PSYCHOLOGY
73
72
72
71
70
69
70
68
68
68
68
69
SOCIAL PSYCHOLOGY
69
70
70
70
68
68
67
66
66
68
67
68
SOCIAL SCIENCES
ECONOMICS
82
81
81
79
79
79
80
80
79
80
79
79
INTERNATIONAL RELATIONS
83
82
81
81
80
82
82
80
81
81
82
82
LAW ENFORCEMENT
62
61
61
60
60
59
59
59
59
60
61
61
POLITICAL SCIENCE
79
78
77
77
76
76
76
75
75
77
77
76
SOCIOLOGY
69
67
68
68
67
67
67
62
64
67
66
67
OTHER SOCIAL SCIENCES
74
73
73
73
72
73
73
72
71
71
71
72
INTERDISCIPL./OTHER SCIENCES
84
83
82
82
82
81
81
82
80
82
83
83
TOTAL OF SCIENCE,
MATH & ENGINEERING
76
76
76
76
75
75
75
75
75
75
75
75
415-B
223

MEAN RANK IN CLASS OF STUDENTS INTENDING TO MAJOR IN MATH SCIENCE AND ENGINEERING FIELDS
(WHITE FEMALES)
TEST
YEAR
INTENDED
MAJOR FIELD
i1977
1978
1979
1980
1981
1982
1983
1984
1985
1986
1987
1988
MATH & STATISTICS
85
85
84
84
84
83
83
84
84
85
85
85
COMPUTER SCIENCE
82
81
81
80
80
79
78
77
76
75
74
73
PHYSICAL SCIENCES
ASTRONOMY
84
81
81
81
82
82
81
83
83
83
82
82
CHEMISTRY
86
85
86
85
85
84
84
84
84
85
85
84
PHYSICS
89
88
89
88
89
87
88
88
86
88
87
85
ARCHITECTURE/ENVIR. ENG
79
78
78
77
77
76
76
76
75
76
77
76
ENGINEERING
AEROSPACE ENGINEERING
82
82
81
81
81
82
83
83
82
84
84
83
ELECTRICAL ENGINEERING
87
84
86
85
85
85
86
86
85
86
85
83
CHEMICAL ENGINEERING
90
90
89
89
69
89
89
88
88
88
88
87
MECHANICAL ENGINEERING
82
83
83
82
83
82
82
82
83
82
82
83
CIVIL ENGINEERING
87
85
85
84
84
83
83
83
84
84
83
82
OTHER ENGINEERING
87
88
87
87
86
86
86
87
86
87
86
85
LIFE SCIENCES
AGRICULTURE
73
71
71
70
70
70
70
70
69
69
70
69
BIOLOGICAL SCIENCES
82
81
81
81
80
80
81
81
81
81
81
81
EARTH & ENVIRONMENTAL SCI.
78
77
76
76
76
75
75
75
74
74
74
74
PSYCHOLOGY
CHILD PSYCHOLOGY
72
70
69
69
68
68
68
67
67
68
68
68
GENERAL PSYCHOLOGY
76
75
74
74
73
73
73
72
72
72
72
71
SOCIAL PSYCHOLOGY
72
72
71
72
71
70
69
69
69
68
69
68
SOCIAL SCIENCES
ECONOMICS
84
82
84
84
83
82
82
82
82
83
82
82
INTERNATIONAL RELATIONS
83
83
84
82
82
83
83
82
83
83
83
83
LAW ENFORCEMENT
68
66
66
65
64
65
65
65
63
64
65
65
POLITICAL SCIENCE
82
80
80
79
79
79
79
78
78
79
79
78
SOCIOLOGY
72
71
71
70
69
69
69
68
68
68
68
67
OTHER SOCIAL SCIENCES
74
74
73
73
73
73
74
73
72
72
72
73
INTERDISCIPL./OTHER SCIENCES
86
85
85
84
85
84
84
84
84
85
85
85
TOTAL OF SCIENCE,
MATH & ENGINEERING
78
77
77
77
77
77
77
77
76
76
76
75
15-C
r)
r.,-
2
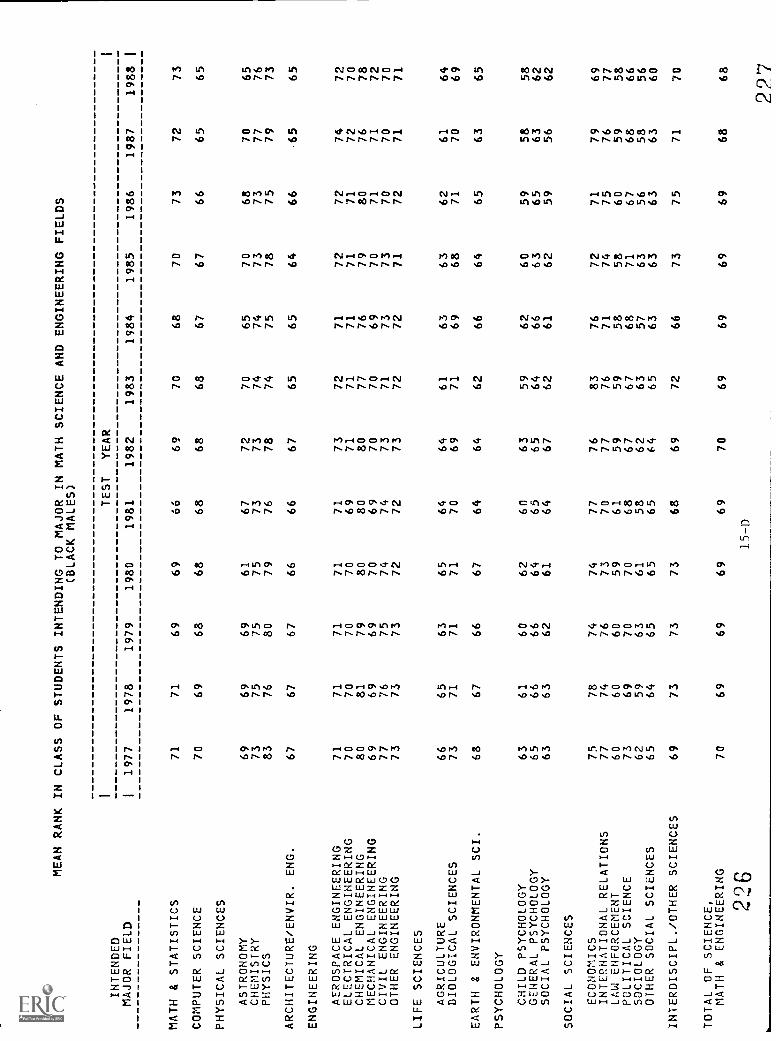
MEAN RANK IN CLASS OF STUDENTS INTENDING TO MAJOR IN MATH SCIENCE AND ENGINEERINGFIELDS
(BLACK MALES)
INTENDED
ITEST
YEAR
MAJOR FIELD
I1977
1978
1979
1980
1981
1982
1983
1984
1985
1986
1987
1988
MATH & STATISTICS
71
71
69
69
66
69
70
68
70
73
72
73
COMPUTER SCIENCE
70
69
68
68
68
68
68
67
67
66
65
65
PHYSICAL SCIENCES
ASTRONOMY
69
69
69
61
67
72
70
65
70
68
70
65
CHEMISTRY
73
75
75
75
73
73
74
74
73
73
77
76
PHYSICS
83
76
80
79
76
78
74
75
78
75
79
73
ARCHITECTURE/ENVIR. ENG.
67
67
67
66
66
67
65
65
64
66
-65
65
ENGINEERING
AEROSPACE ENGINEERING
71
71
71
71
71
73
72
71
72
72
74
72
ELECTRICAL ENGINEERING
70
70
70
70
69
71
71
71
71
71
72
70
CHEMICAL ENGINEERING
80
81
79
80
80
80
77
76
79
80
76
78
MECHANICAL ENGINEERING
69
69
69
70
69
70
70
69
70
71
71
72
CIVIL ENGINEERING
77
76
75
74
74
73
71
73
73
70
70
70
OTHER ENGINEERING
73
73
73
72
72
73
72
72
71
72
71
71
LIFE SCIENCES
AGRICULTURE
66
65
63
65
64
64
61
63
63
62
61
64
BIOLOGICAL SCIENCES
73
71
71
71
70
69
71
69
68
71
70
69
EARTH & ENVIRONMENTAL SCI.
68
67
66
67
64
64
62
66
64
65
63
65
PSYCHOLOGY
CHILD PSYCHOLOGY
63
61
60
62
60
63
59
62
60
59
58
58
GENERAL PSYCHOLOGY
65
66
66
64
65
65
64
66
63
65
63
62
SOCIAL PSYCHOLOGY
63
63
62
61
64
67
62
61
62
59
56
62
SOCIAL SCIENCES
ECONOMICS
75
78
74
74
77
76
83
76
72
71
79
69
INTERNATIONAL RELATIONS
77
74
76
73
70
77
76
71
74
75
76
77
LAW ENFORCEMENT
60
60
60
59
61
59
59
58
58
60
59
58
POLITICAL SCIENCE
73
69
70
70
68
67
67
68
71
67
68
66
SOCIOLOGY
62
59
63
61
58
62
63
57
63
56
58
56
OTHER SOCIAL SCIENCES
65
64
65
65
65
64
65
63
63
63
63
60
INTERDISCIPL./OTHER SCIENCES
69
73
73
73
68
69
72
66
73
75
71
70
TOTAL OF SCIENCE,
MATH & ENGINEERING
70
69
69
69
69
70
69
69
69
69
68
68
226
15-D
227
1
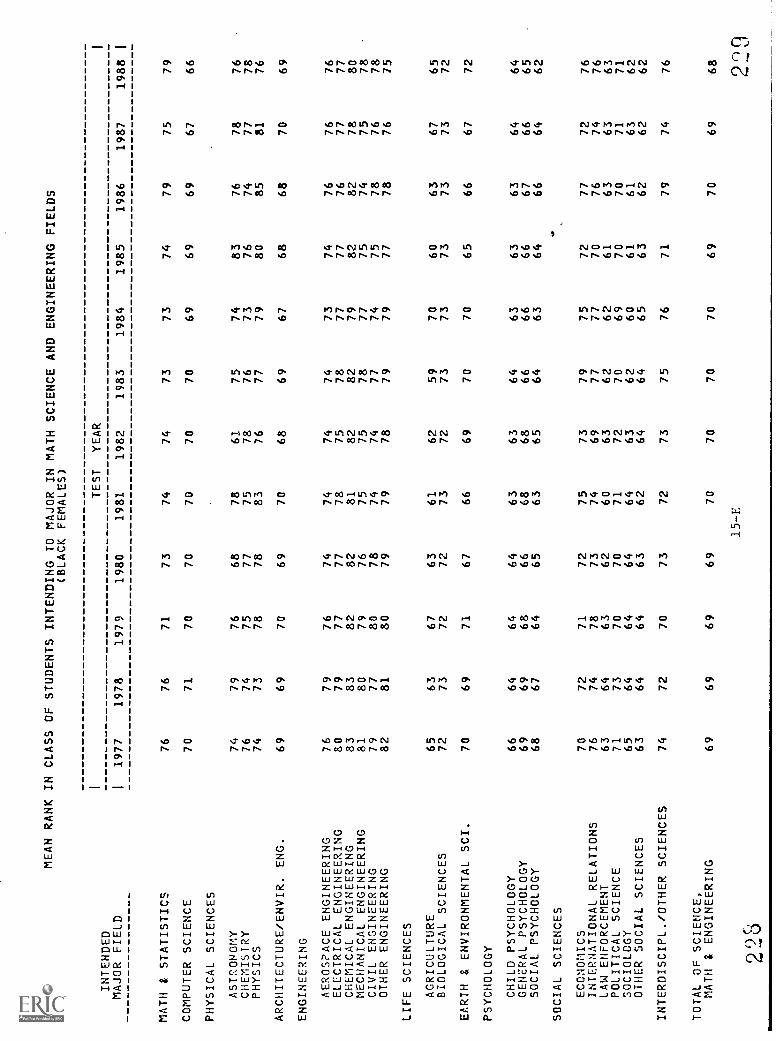
MEAN RANK IN CLASS OF STUDENTS INTENDING TO MAJOR IN MATH SCIENCE
AND ENGINEERING FIELDS
INTENDED
(BLACK FEMALES)
TEST
YEAR
MAJOR FIELD
I1977
1978
1979
1980
1982
1983
1984
1985
1986
1987
1988
I
MATH & STATISTICS
76
76
71
73
74
74
73
73
74
79
75
79
COMPUTER SCIENCE
70
71
70
70
70
70
70
69
69
69
67
66
PHYSICAL SCIENCES
ASTRONOMY
74
79
76
68
78
61
75
74
83
76
78
76
CHEMISTRY
76
74
75
77
75
78
76
73
76
74
77
78
PHYSICS
74
73
78
78
83
76
77
79
80
85
81
76
ARCHITECTURE/ENVIR. ENG.
69
69
70
69
70
68
69
67
68
68
70
69
ENGINEERING
AEROSPACE ENGINEERING
76
79
76
74
74
74
74
73
74
76
76
76
ELECTRICAL ENGINEERING
80
79
77
77
78
75
78
77
77
76
77
77
CHEMICAL ENGINEERING
83
83
82
82
81
82
82
79
82
82
78
80
MECHANICAL ENGINEERING
81
80
79
76
75
75
78
77
75
74
75
78
CIVIL ENGINEERING
79
77
80
78
74
74
77
74
75
78
76
78
OTHER ENGINEERING
82
81
80
79
79
78
79
79
77
78
76
75
LIFE SCIENCES
AGRICULTURE
65
63
67
63
61
62
59
70
60
63
67
65
BIOLOGICAL SCIENCES
72
73
72
72
73
72
73
73
73
73
73
72
EARTH & ENVIRONMENTAL SCI.
70
69
71
67
66
69
70
70
65
66
67
72
PSYCHOLOGY
CHILD PSYCHOLOGY
66
64
64
64
63
63
64
63
63
63
64
64
GENERAL PSYCHOLOGY
69
69
68
66
68
68
66
66
66
67
66
65
SOCIAL PSYCHOLOGY
68
67
64
65
63
65
64
63
64
66
64
62
SOCIAL SCIENCES
ECONOMICS
70
72
71
72
75
73
79
75
72
77
72
76
INTERNATIONAL RELATIONS
76
74
78
73
74
69
77
77
70
76
74
76
LAW ENFORCEMENT
63
64
63
62
60
63
62
62
61
63
63
63
POLITICAL SCIENCE
71
73
70
70
71
72
70
69
70
70
71
71
SOCIOLOGY
65
64
64
64
64
63
62
60
61
61
63
62
OTHER SOCIAL SCIENCES
63
64
64
63
62
64
64
65
63
62
62
62
INTERDISCIPL./OTHER SCIENCES
74
72
70
73
72
73
75
76
71
79
74
76
TOTAL OF SCIENCE,
MATH & ENGINEERING
69
69
69
69
70
70
70
70
69
70
69
68
15-E
22 s
229
1

MEAN RANK IN CLASS OF STUDENTS INTENDING TO MAJOR IN MATH SCIENCE AND
ENGINEERING FIELDS
(OTHER STUDENTS)
INTENDED
MAJOR FIELD
MATH & STATISTICS
COMPUTER SCIENCE
PHYSICAL SCIENCES
ASTRONOMY
CHEMISTRY
PHYSICS
ARCHITECTURE/ENVIR. ENG.
ENGINEERING
AEROSPACE ENGINEERING
ELECTRICAL ENGINEERING
CHEMICAL ENGINEERING
MECHANICAL ENGINEERING
CIVIL ENGINEERING
OTHER ENGINEERING
LIFE SCIENCES
AGRICULTURE
BIOLOGICAL SCIENCES
EARTH & ENVIRONMENTAL SCI.
PSYCHOLOGY
CHILD PSYCHOLOGY
GENERAL PSYCHOLOGY
SOCIAL PSYCHOLOGY
SOCIAL SCIENCES
ECONOMICS
INTERNATIONAL RELATIONS
LAW ENFORCEMENT
POLITICAL SCIENCE
SOCIOLOGY
OTHER SOCIAL SCIENCES
INTERDISCIPL./OTHER SCIENCES
TOTAL CF SCIENCE,
MATH & ENGINEERING
230
1 11977 81 77
80
8188 73
75
76
8574
7779 6879
73 717269
82
806379
67 71
83
76
1978 80
76
818385 72
75
7585
74 7779
6678
71 67
7169
828062
78
69
70
82 75
1979
80 76
7882
86 71
767684
75
7779 6879
72 66
7168
81 7762
767070
82 75
1980 79
75 75
82 85
71
76 76
84 74
7779
66 78
71
667068
82 79
61
776671
83 75
TEST
1981 78
75
788285
71
75
7784
73
7678 6578
70 667166
82
79 6075
7070
81 75
YEAR
1982 78
74
768185 70
75
7884
73 75
78 6479
70 66
7068
81 78
6175
6670
81 75
1983
77 74
7782
86 70
76
7783
73
7779 67
79
70
65 7069
83
80
6073
66 71
82 75
1984 78
73 77
81 85
69 7778
84 737579
65 79
69
656968
80775975
6771
81 75
1985 79
73
7882
84 70
777883
747679 6579
68 6569
67
8180
60 74
66 70
81 75
1986
82 73
7983
86 71
797984
767780 6780
69 65
7070
82
80 62
76 6672
84
76
1987 82
72
7882
86 71
797985 777779
6880 71
67
7066
82 79
62
7669
71
84 76
1988
82 72
808185 71
787984
7777 79
6680
69 6669
67
82
80 62
76
6771
83
15-F
1
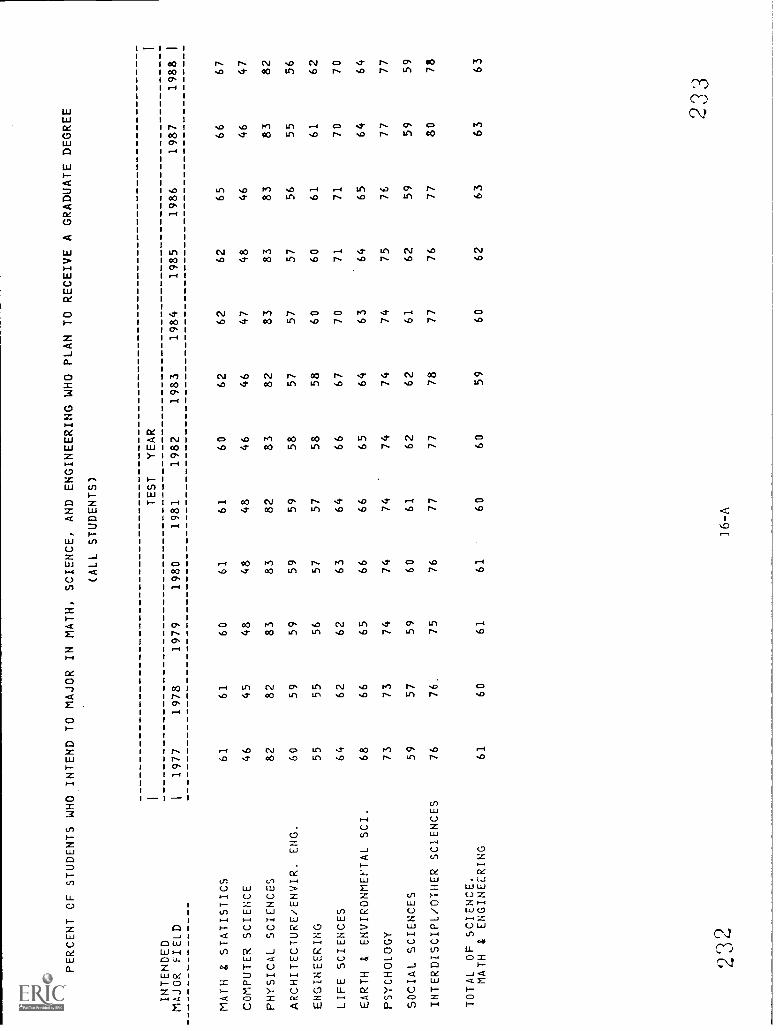
PERCENT OF STUDENTS WHO INTEND TO MAJOR IN MATH, SCIENCE, AND ENGINEERING WHO
PLAN TO RECEIVE A GRADUATE DEGREE
(ALL STUDENTS)
TEST
YEAR
INTENDED
MAJOR FIELD
I1977
1978
1979
1980
1981
1982
1983
1984
1985
1986
1987
1988
MATH & STATISTICS
61
61
60
61
61
60
62
62
62
65
66
67
COMPUTER SCIENCE
46
45
48
48
48
46
46
47
48
46
46
47
PHYSICAL SCIENCES
82
82
83
83
82
83
82
83
83
83
83
82
ARCHITECTURE/ENVIR. ENG.
60
59
59
59
59
58
57
57
57
56
55
56
ENGINEERING
55
55
56
57
57
58
58
60
60
61
61
62
LIFE SCIENCES
64
62
62
63
64
66
67
70
71
71
70
70
EARTH &
ENVIRONMErTAL SCI.
68
66
65
66
66
65
64
63
64
65
64
64
PSYCHOLOGY
73
73
74
74
74
74
74
74
75
76
77
77
SOCIAL SCIENCES
59
57
59
60
61
62
62
61
62
59
59
59
INTERDISCIPL/OTHER SCIENCES
76
76.
75
76
77
77
78
77
76
77
80
78
TOTAL OF SCIENCE.
MATH & ENGINEERING
61
60
61
61
60
60
59
60
62
63
63
63
233
16-A
1

PERCENT OF STUDENTS WHO INTEND TO MAJOR IN MATH,
SCIENCE, AND ENGINEERING WHO PLAN
TO RECEIVE A GRADUATE DEGREE
(WHITE MALES)
INTENDED
MAJOR 'FIELD
MATH & STATISTICS
COMPUTER SCIENCE
PHYSICAL SCIENCES
ARCHITECTURE/ENVIR. ENG.
ENGINEERING
LIFE SCIENCES
EARTH & ENVIRONMENTAL SCI.
PSYCHOLOGY
SOCIAL SCIENCES
INTERDISCIPL/OTHER SCIENCES
TOTAL OF SCIENCE.
MATH & ENGINEERING
11977 66 49
84
58
52 64
67
79 60
78 60
1978 65
49
84 57
52
62 65
79 57
76 58
1979 63 51
84
57 53
60
64
80 57
75 58
1980 63
50
85
57 54
61
65
80 59
76 58
TEST
1981 64
49
83
57
54
61
64
79 60 76
58
YEAR
1982 62
48
85 55
55
62 62
79
60 77 57
1983 63
47
83 54
56
63
62
79 58
78 57
1984 64
47
84 55
57
64 61
79
57 77
57
1985 63
48
83 53
57
66
60 79
57 76
58
1986 66
47
84
53 59
66
62
80 55
77 59
1987 66
47
84
51
58
64
60
79 53
80 59
1988 66
48
82 52
58
63 59
77 53
76 59
234
235
I
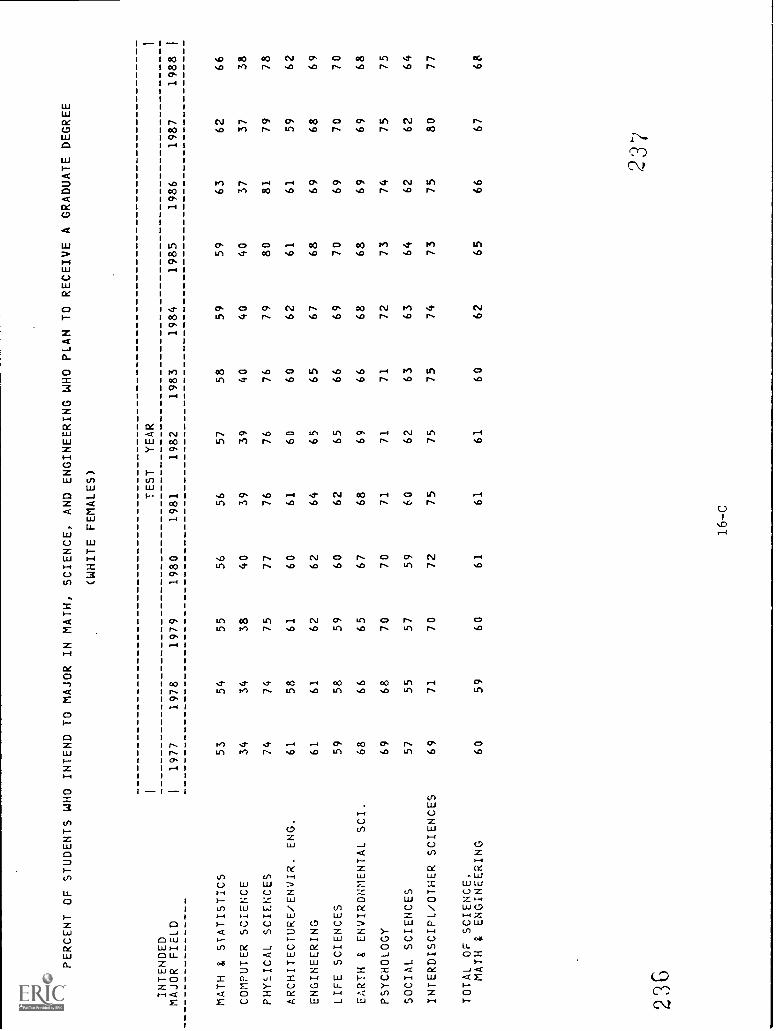
PERCENT OF STUDENTS WHO 1
INTENDED
INTEND TO MAJOR
IN MATH,
SCIENCE, AND ENGINEERING WHO PLAN TO
(WHITE FEMALES)
TEST
YEAR
RECEIVE A GRADUATE DEGREE
1
MAJOR FIELD
11977
1978
1979
1980
1981
1982
1983
1984
1985
1986
1987
1988
1
MATH & STATISTICS
53
54
55
56
56
57
58
59
59
63
62
66
COMPUTER SCIENCE
34
34
38
40
39
39
40
40
40
37
37
38
PHYSICAL SCIENCES
74
74
75
77
76
76
76
79
80
81
79
78
ARCHITECTURE/ENVIR. ENG.
61
58
61
60
61
60
60
62
61
61
59
62
ENGINEERING
61
61
62
62
64
65
65
67
68
69
68
69
LIFE SCIENCES
59
58
59
60
62
65
66
69
70
69
70
70
EARTH & ENVIRONMENTAL SCI.
68
66
65
67
68
69
66
68
68
69
69
68
PSYCHOLOGY
69
68
70
70
71
71
71
72
73
74
75
75
SOCIAL SCIENCES
57
55
57
59
60
62
63
63
64
62
62
64
INTERDISCIPL/OTHER SCIENCES
69
71
70
72
75
75
75
74
73
75
80
77
TOTAL OF SCIENCE,
MATH & ENGINEERING
60
59
60
61
61
61
60
62
65
66
67
68
236
16-C
23?
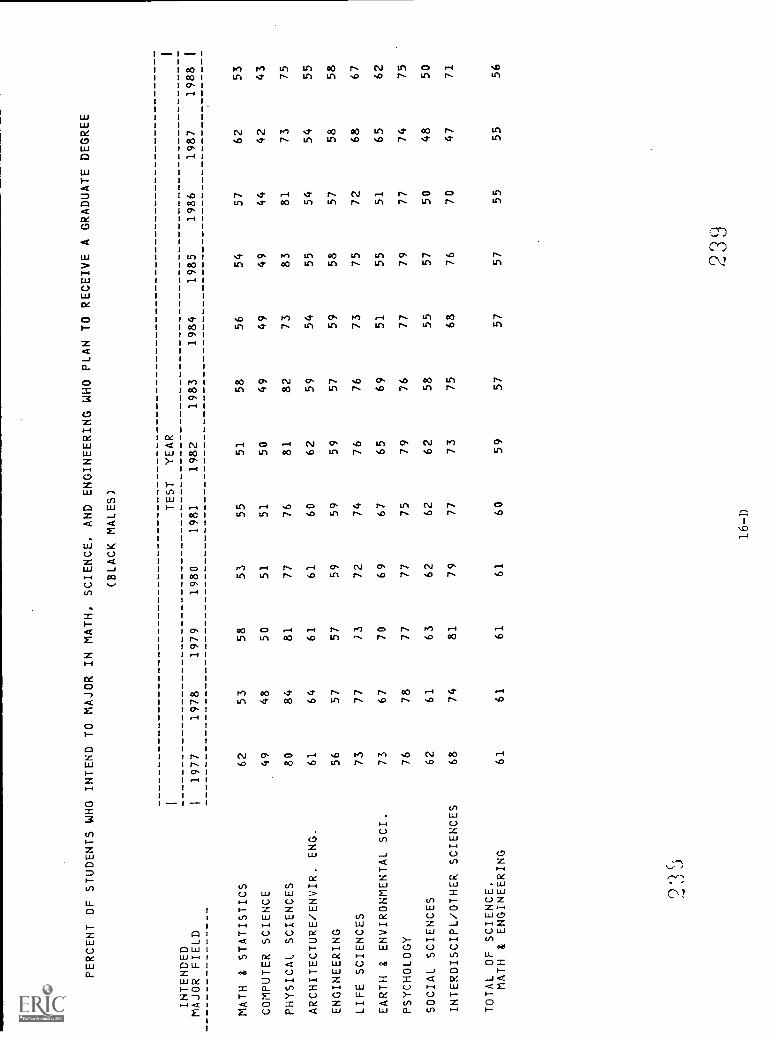
PERCENT OF STUDENTS WHO I
INTENDED
INTEND TO MAJOR
IN MATH,
SCIENCE, AND ENGINEERING WHO
(BLACK MALES)
TEST
YEAR
PLAN TO RECEIVE A GRADUATE DEGREE
I
MAJOR FIELD
11977
1978
1979
1980
1981
1982
1983
1984
1985
1986
1987
1988
I
MATH & STATISTICS
62
53
58
53
55
51
58
56
54
57
62
53
COMPUTER SCIENCE
49
48
50
51
51
50
49
49
49
44
42
43
PHYSICAL SCIENCES
80
84
81
77
76
81
82
73
83
81
73
75
ARCHITECTURE/ENVIR. ENG.
61
64
61
61
60
62
59
54
55
54
54
55
ENGINEERING
56
57
57
59
59
59
57
59
58
57
58
58
LIFE SCIENCES
73
77
73
72
74
76
76
73
75
72
68
67
EARTH & ENVIRONMENTAL SCI.
73
67
70
69
67
65
69
51
55
51
65
62
PSYCHOLOGY
76
78
77
77
75
79
76
77
79
77
74
75
SOCIAL SCIENCES
62
61
63
62
62
62
58
55
57
50
48
50
INTERDISCIPL/OTHER SCIENCES
68
74
81
79
77
73
75
68
76
70
47
71
TOTAL OF SCIENCE,
MATH & ENGINEERING
61
61
61
61
60
59
57
57
57
55
55
56
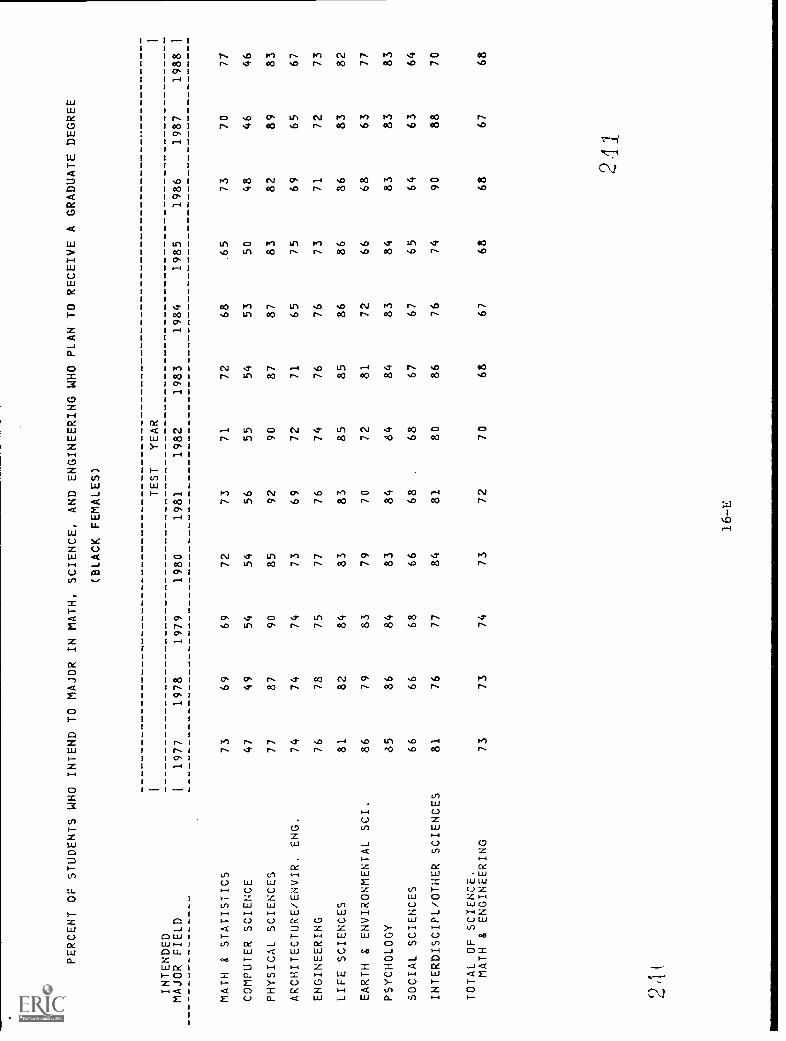
PERCENT OF STUDENTS WHO INTEND TO MAJOR IN MATH, SCIENCE, AND ENGINEERING WHO PLAN TO RECEIVE A GRADUATE DEGREE
INTENDED
(BLACK FEMALES)
TEST
YEAR
MAJOR FIELD
1977
1978
1979
1980
1981
1982
1983
1984
1985
1986
1987
1988
MATH & STATISTICS
73
69
69
72
73
71
72
68
.65
73
70
77
COMPUTER SCIENCE
47
49
54
54
56
55
54
53
50
48
46
46
PHYSICAL SCIENCES
77
87
90
85
92
90
87
87
83
82
89
83
ARCHITECTURE/ENVIR. ENG.
74
74
74
73
69
72
71
65
75
69
65
67
ENGINEERING
76
78
75
77
76
74
76
76
73
71
72
73
LIFE SCIENCES
81
82
84
83
83
85
85
86
86
86
83
82
EARTH & ENVIRONMENTAL SCI.
86
79
83
79
70
72
81
72
66
68
63
77
PSYCHOLOGY
85
86
84
83
84
64
84
83
84
83
83
83
SOCIAL SCIENCES
66
66
68
66
68
68
67
67
65
64
63
64
INTERDISCIPL/OTHER SCIENCES
81
76
77
84
81
80
86
76
74
90
88
70
TOTAL OF SCIENCE,
MATH & ENGINEERING
73
73
74
73
72
70
68
67
68
68
67
68
211
21(
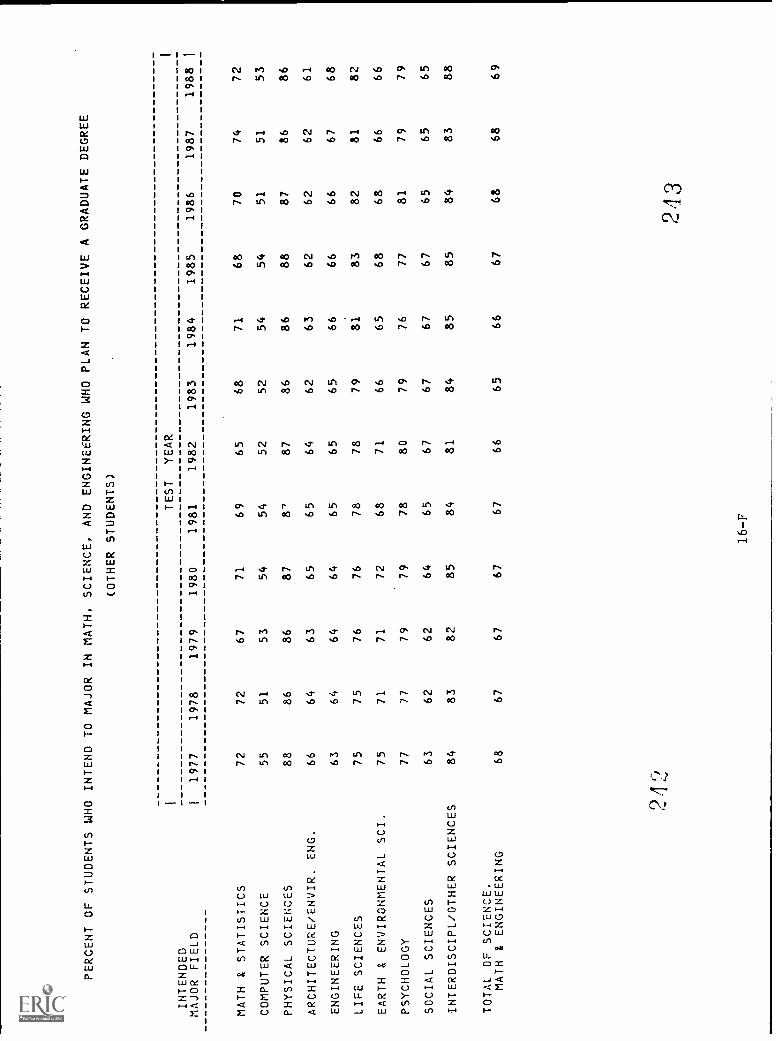
PERCENT OF STUDENTS WHO INTEND TO MAJOR IN MATH, SCIENCE, AND ENGINEERING
WHO PLAN TO RECEIVE A GRADUATE DEGREE
(OTHER STUDENTS)
INTENDED
TEST
YEAR
MAJOR FIELD
I1977
1978
1979
1980
1981
1982
1983
1984
1985
1986
1987
1988
MATH & STATISTICS
72
72
67
71
69
65
68
71
68
70
74
72
COMPUTER SCIENCE
55
51
53
54
54
52
52
54
54
51
51
53
PHYSICAL SCIENCES
88
86
86
87
8'
87
86
86
88
87
86
86
ARCHITECTURE/ENVIR. ENG.
66
64
63
65
65
64
62
63
62
62
62
61
ENGINEERING
63
64
64
64
65
65
65
66
66
66
67
68
LIFE SCIENCES
75
75
76
76
78
78
79
81
83
82
81
82
EARTH & ENVIRONMENTAL SCI.
75
71
71
72
68
71
66
65
68
68
66
66
PSYCHOLOGY
77
77
79
79
78
80
79
76
77
81
79
79
SOCIAL SCIENCES
63
62
62
64
65
67
67
67
67
65
65
65
INTERDISCIPL/OTHER SCIENCES
84
83
82
85
84
81
84
85
85
84
83
88
TOTAL OF SCIENCE.
MATH & ENGINEERING
68
67
67
67
67
66
65
66
67
68
68
69
I

PERCENT OF STUDENTS WHO INTEND TO MAJOR IN MATH,
INTENDED
MAJOR FIELD
11977
1978
1979
MATH & STATISTICS
61
61
60
COMPUTER SCIENCE
46
45
48
PHYSICAL SCIENCES
ASTRONOMY
85
83
81
CHEMISTRY
76
77
77
PHYSICS
91
89
91
ARCHITECTURE/ENVIR. ENG.
60
59
59
ENGINEERING
AEROSPACE ENGINEERING
56
55
57
ELECTRICAL ENGINEERING
47
47
49
CHEMICAL ENGINEERING
74
73
73
MECHANICAL ENGINEERING
48
47
48
CIVIL ENGINEERING
52
53
53
OTHER ENGINEERING
58
58
59
LIFE SCIENCES
AGRICULTURE
39
31
31
BIOLOGICAL SCIENCES
74
74
73
EARTH & ENVIRONMENTAL SCI.
68
66
65
PSYCHOLOGY
CHILD PSYCHOLOGY
70
68
70
GENERAL PSYCHOLOGY
75
75
76
SOCIAL PSYCHOLOGY
69
68
70
SOCIAL SCIENCES
ECONOMICS
80
79
79
INTERNATIONAL RELATIONS
78
80
80
LAW ENFORCEMENT
29
28
27
POLITICAL SCIENCE
82
77
78
SOCIOLOGY
52
52
53
OTHER SOCIAL SCIENCES
59
60
61
INTERDISCIPL./OTHER SCIENCES
76
76
75
TOTAL OF SCIENCE,
MATH & ENGINEERING
61
60
61
SCIENCE, AND ENGINEERING WHO PLAN TO RECEIVE A GRADUATE DEGREE
(ALL STUDENTS)
TEST
YEAR
1980
1981
1982
1983
1984
1985
1986
1987
61
61
60
62
62
62
65
66
48
48
46
46
47
48
46
46
82
82
82
83
82
83
86
85
79
77
78
76
77
77
78
78
90
89
90
88
90
90
89
88
59
59
58
57
57
57
56
55
57
59
60
60
61
62
63
62
49
51
52
53
56
56
57
58
74
74
73
73
74
75
75
75
50
49
49
49
50
53
53
54
55
54
54
53
55
55
51
50
60
60
61
61
63
63
65
65
31
32
32
31
32
33
31
31
74
75
77
78
79
80
81
80
66
66
65
64
63
64
65
64
71
71
69
69
71
71
72
72
76
76
76
77
77
77
78
79
69
71
71
71
71
73
67
64
78
81
81
82
81
81
81
78
80
81
80
81
80
82
82
82
27
27
28
27
26
27
33
35
78
77
76
77
78
77
76
75
54
51
53
53
54
55
50
52
62
61
62
63
63
64
61
60
76
77
77
78
77
76
77
80
61
60
60
59
60
62
63
63
1988
67
47
82
77
87 56
62
577455
5165
3379
64
73
7964
79
81
3775
5062
78
63
21.L
417-A
0
1
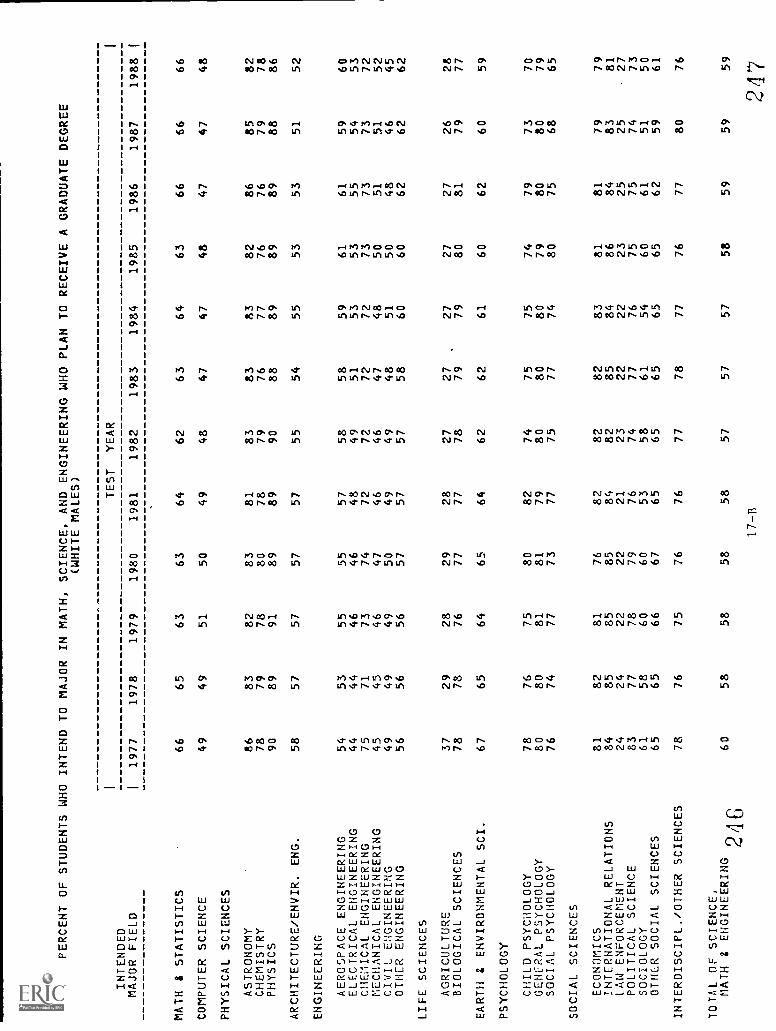
PERCENT OF STUDENTS WHO
INTENDED
INTEND TO MAJOR IN MATH,
SCIENCE, AND ENGINEERING WHO PLAN TO RECEIVE A GRADUATE DEGREE
(WHITE MALES)
TEST
YEAR
MAJOR FIELD
1977
1978
1979
1980
1981
1982
1983
1984
1985
1986
1987
1988
MATH & STATISTICS
66
65
63
63
64
62
63
64
63
66
66
66
COMPUTER SCIENCE
49
49
51
50
49
48
47
47
48
47
47
48
PHYSICAL SCIENCES
ASTRONOMY
86
83
82
83
81
83
83
83
82
86
85
82
CHEMISTRY
78
79
78
80
78
79
76
77
76
76
79
78
PHYSICS
90
89
91
89
89
90
88
89
89
89
88
86
ARCHITECTURE/ENVIR. ENG.
58
57
57
57
57
55
54
55
53
53
51
52
ENGINEERING
AEROSPACE ENGINEERING
54
53
55
55
57
58
58
59
61
61
59
60
ELECTRICAL ENGINEERING
44
44
46
46
48
49
51
53
53
55
54
53
CHEMICAL ENGINEERING
75
71
73
74
72
72
72
72
73
73
73
72
MECHANICAL ENGINEERING
45
45
46
47
46
46
47
48
50
51
51
52
CIVIL ENGINEERING
49
49
49
50
49
49
48
51
50
48
46
45
OTHER ENGINEERING
56
56
56
57
57
57
58
60
60
62
62
62
LIFE SCIENCES
AGRICULTURE
37
29
28
29
28
27
27
27
27
27
26
28
BIOLOGICAL SCIENCES
78
78
76
77
77
78
79
79
80
81
79
77
EARTH & ENVIRONMENTAL SCI.
67
65
64
65
64
62
62
61
60
62
60
59
PSYCHOLOGY
CHILD PSYCHOLOGY
78
76
75
80
82
74
75
75
74
79
73
70
GENERAL PSYCHOLOGY
80
80
81
81
79
80
80
80
79
80
80
79
SOCIAL PSYCHOLOGY
76
74
77
73
77
75
77
74
80
75
68
65
SOCIAL SCIENCES
ECONOMICS
81
82
81
76
82
82
82
83
81
81
79
79
INTERNATIONAL RELATIONS
84
85
85
85
84
82
85
84
86
84
83
81
LAW ENFORCEMENT
24
24
22
22
21
23
22
22
23
25
25
27
POLITICAL SCIENCE
83
77
78
79
76
74
77
76
75
75
74
73
SOCIOLOGY
61
58
60
60
53
58
61
54
60
61
51
50
OTHER SOCIAL SCIENCES
65
65
66
67
65
65
65
65
65
62
59
61
INTERDISCIPL./OTHER SCIENCES
78
76
75
76
76
77
78
77
76
77
80
76
TOTAL OF SCIENCE,
MATH Y ENGINEERING
246
60
58
58
58
58
57
57
57
58
59
59
59
17-B
247
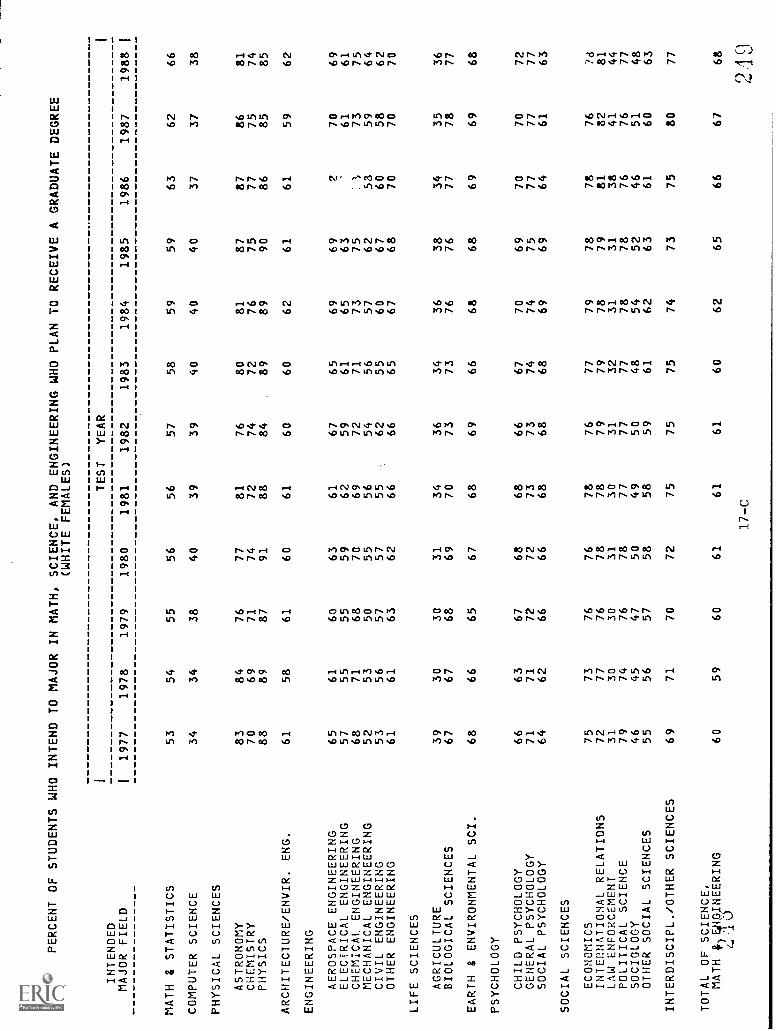
PERCENT OF STUDENTS WHO I
INTENDED
MAJOR FIELD
1
MATH 8 STATISTICS
COMPUTER SCIENCE
PHYSICAL SCIENCES
ASTRONOMY
CHEMISTRY
PHYSICS
ARCHITECTURE/ENVIR. ENG.
ENGINEERING
AEROSPACE ENGINEERING
ELECTRICAL ENGINEERING
CHEMICAL. ENGINEERING
MECHANICAL ENGINEERING
CIVIL ENGINEERING
OTHER ENGINEERING
LIFE SCIENCES
AGRICULTURE
BIOLOGICAL SCIENCES
EARTH & ENVIRONMENTAL SCI.
PSYCHOLOGY
CHILD PSYCHOLOGY
GENERAL PSYCHOLOGY
SOCIAL PSYCHOLOGY
SOCIAL SCIENCES
ECONOMICS
INTERNATIONAL RELATIONS
LAW ENFORCEMENT
POLITICAL SCIENCE
SOCIOLOGY
OTHER SOCIAL SCIENCES
INTERDISCIPL./OTHER SCIENCES
TOTAL OF SCIENCE,
MATH i)y@INEERING
t...LL)
INTEND TO MAJOR IN MATH,
1977
1978
1979
53
54
55
34
34
38
83
84
76
70
69
71
88
89
87
61
58
61
65
61
60
57
55
55
68
71
68
52
53
50
53
56
57
61
61
63
39
30
30
67
67
68
68
66
65
66
63
67
71
71
72
64
62
66
75
73
76
72
77
76
31
30
30
79
74
76
46
45
47
55
56
57
69
71
70
60
59
60
SCIENCE, AND ENGINEERING WHO PLAN TO RECEIVE A GRADUATE DEGREE
(WHITE FEMALES)
TEST
YEAR
1980
1981
1982
1983
1984
1985
1986
1987
56
56
57
58
59
59
63
62
40
39
39
40
40
40
37
37
77
81
76
80
81
87
87
86
74
72
74
72
76
75
77
75
91
88
84
.89
89
90
86
85
60
61
60
60
62
61
61
59
63
61
67
65
69
69
270
59
62
59
61
65
63
61
70
69
72
71
73
75
..1
73
55
56
54
56
57
62
58
59
57
55
62
55
60
67
60
58
62
66
66
65
67
68
70
70
31
34
36
34
36
38
34
35
69
70
73
73
76
76
77
78
67
68
69
66
68
68
69
69
68
68
66
67
70
69
70
70
72
73
73
74
74
75
77
77
66
68
68
68
69
69
64
61
76
78
76
77
79
78
78
76
78
78
79
79
78
79
81
82
31
30
31
32
31
31
38
41
78
77
77
77
78
78
76
76
50
49
50
48
54
52
46
51
58
58
59
61
62
63
61
60
72
75
75
75
74
73
75
80
61
61
61
60
62
65
66
67
1988
66
38
817485
62
69
6175646270
3677
68
72
7763 76
81 44
774863
77
68
17-C
2.19
1
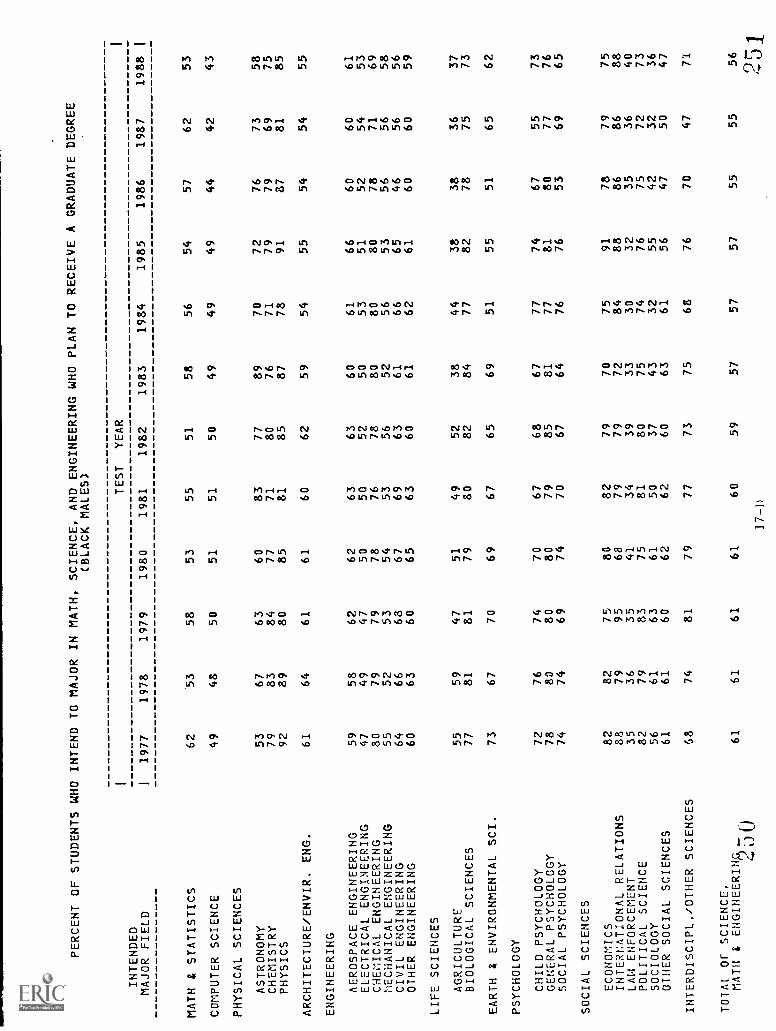
PERCENT OF STUDENTS WHO INTEND TO MAJOR IN MATH, SCIENCE,
AND ENGINEERING WHO PLAN TO RECEIVE A GRADUATE DEGREE
(BLACK MALES)
INTENDED
MAJOR FIELD
MATH & STATISTICS
COMPUTER SCIENCE
PHYSICAL SCIENCES
ASTRONOMY
CHEMISTRY
PHYSICS
ARCHITECTURE/ENVIR. ENG.
ENGINEERING
AEROSPACE ENGINEERING
ELECTRICAL ENGINEERING
CHEMICAL ENGINEERING
MECHANICAL ENGINEERING
CIVIL ENGINEERING
OTHER ENGINEERING
LIFE SCIENCES
AGRICULTURE
BIOLOGICAL SCIENCES
EARTH & ENVIRONMENTAL SCI.
PSYCHOLOGY
CHILD PSYCHOLOGY
GENERAL PSYCHOLOGY
SOCIAL PSYCHOLOGY
SOCIAL SCIENCES
ECONOMICS
INTERNATIONAL RELATIONS
LAN ENFORCEMENT
POLITICAL SCIENCE
SOCIOLOGY
OTHER SOCIAL SCIENCES
INTERDISCIPL./OTHER SCIENCES
TOTAL or SCIENCE,
MATH & ENGINEERINA
5 0
TEST
YEAR
I1977
1978
1979
1980
1981
1982
1983
1984
1985
1986
1987
1988
I
62
53
58
53
55
51
58
56
54
57
62
53
49
48
50
51
51
50
49
49
49
44
42
43
53
67
63
60
83
77
89
70
72
76
73
58
79
83
84
77
71
80
76
71
79
79
69
75
92
89
80
85
81
85
87
78
91
87
81
85
61
64
61
61
60
62
59
54
55
54
54
55
59
58
62
62
63
63
60
61
66
60
60
61
47
49
47
50
50
52
50
53
51
52
54
53
80
79
79
78
76
78
80
80
80
78
71
69
55
52
53
54
53
56
52
56
53
56
56
58
64
66
68
67
69
63
61
66
65
46
56
56
60
63
60
65
63
60
61
62
61
60
60
59
55
59
47
51
49
52
38
44
38
38
36
37
77
81
81
79
80
82
84
77
82
78
75
73
73
67
70
69
67
65
69
51
55
51
65
62
72
76
74
70
67
68
67
77
74
67
55
73
78
80
80
80
79
85
81
77
81
80
77
76
74
74
69
74
70
67
64
76
76
53
69
65
82
82
75
80
82
79
70
75
91
78
79
75
88
79
95
68
79
79
72
84
88
86
86
88
35
36
35
41
34
39
33
30
32
35
36
40
82
79
83
75
81
80
75
74
76
75
72
73
56
61
63
61
50
37
43
32
55
42
32
36
61
61
60
62
62
60
63
61
56
47
50
47
68
74
81
79
77
73
75
68
76
70
47
71
61
61
61
61
60
59
57
57
57
55
55
56
17 -D
25 1

PERCENT OF STUDENTS WHO INTEND TO MAJOR IN MATH, SCIENCE, AND
ENGINEERING WHO PLAN TO RECEIVE A GRADUATE DEGREE
(BLACK FEMALES)
TEST
YEAR
INTENDED
MAJOR FIELD
MATH & STATISTICS
COMPUTER SCIENCE
PHYSICAL SCIENCES
ASTRONOMY
CHEMISTRY
PHYSICS
ARCHITECTURE/ENVIR. ENG.
aNGINEERING
AEROSPACE ENGINEERING
ELECTRICAL ENGINEERING
CHEMICAL ENGINEERING
MECHANICAL ENGINEERING
CIVIL ENGINEERING
OTHER ENGINEERING
LIFE SCIENCES
AGRICULTURE
BIOLOGICAL SCIENCES
EARTH & ENVIRONMENTAL SCI.
PSYCHOLOGY
CHILD PSYCHOLOGY
GENERAL PSYCHOLOGY
SOCIAL PSYCHOLOGY
SOCIAL SCIENCES
ECONOMICS
INTERNATIONAL RELATIONS
LAW ENFORCEMENT
POLITICAL SCIENCE
SOCIOLOGY
OTHER SOCIAL SCIENCES
IHTERDISCIPL./OTHER SCIENCES
TOTAL OF SCIENCE,
MATH & ENGINEERING
11977 73
47
83 78
71
74
76 65
83
83 6878
7482 86
828882 70
95
6186 64
61
81 73
1978'
69
49
10088
78
74 84
7081
65
81 79
4784 79
82 88
86 74
87 58.
82
63
65
76 73
1979 69
54
1009018
74
86 72
8068
7176 73
85
83 82
8682 74
86 59
81 60
67
77 74
1980
72 54
78
8682
73 706584
778079
6085
79
79
8780 78
83 54
82 61
65
84 73
1981 73 56
100 90
100 69
766982 73
7478
5585 70
808884 8185
598360
66
81 72
1982 71
55 67
91
86 72 73
69
82 73
7475
73
86 72
80
8788 89
89
5783 65
63
80 70
1983 72
54
80
8789 71
81
718377
7675
6786
81 81
87
78 89
8653 78
6363
86 68
1984 68
53 71
88
86 65
78 71
83 717479
6887
72 808582
81 79
5683
5065 76
67
1985 65
50
10082
89 75 68
71
80 69
7075 62
87 66
81
8680 6483
5181 5863
74
68
1986 73
48
91
79
100
69 696982 647171
6088 68
82
85
71
80 84
637948 60
90
68
1987 70
46 91
88
100 65
717082
647372 6984
63
8283 77
7486
62 7952
56
88
67
1988 77
46
84
80 92
67
76
7081
71 6772
6184
77
8084 76
82
86
59 79
54
61
70
68
2 5
217-E
(-)
t.."
1

PERCENT OF STUDENTS WHO INTEND TO MAJOR IN MATH,
INTENDED
MAJOR FIELD
11977
1978
1979
MATH & STATISTICS
72
72
67
COMPUTER SCIENCE
55
51
53
PHYSICAL SCIENCES
ASTRONOMY
91
91
87
CHEMISTRY
83
81
79
PHYSICS
94
91
93
ARCHITECTURE/ENVIR. ENG.
66
64
63
ENGINEERING
AEROSPACE ENGINEERING
61
62
63
ELECTRICAL ENGINEERING
57
57
58
CHEMICAL ENGINEERING
79
79
79
MECHANICAL ENGINEERING
57
56
57
CIVIL ENGINEERING
62
67
65
OTHER ENGINEERING
67
67
68
LIFE SCIENCES
'
AGRICULTURE
48
41
45
BIOLOGICAL SCIENCES
82
83
83
EARTH & ENVIRONMENTAL SCI.
75
71
71
PSYCHOLOGY
CHILD PSYCHOLOGY
71
72
77
GENERAL PSYCHOLOGY
80
81
82
SOCIAL PSYCHOLOGY
73
74
71
SOCIAL SCIENCES
ECONOMICS
84
82
79
INTERjATIONAL RELATIONS
86
81
82
LAW ENFORCEMENT
34
37
33
POLITICAL SCIENCE
84
83
83
SOCIOLOGY
56
59
55
OTHER SOCIAL SCIENCES
63
62
63
INTERDISCIPL./OTHER SCIENCES
84
83
82
TOTAL OF SCIENCE,
MATH & ENGINEERING
68
67
67
SCIENCE, AND ENGINEERING WHO PLAN TO
RECEIVE A GRADUATE DEGREE
(OTHER STUDENTS)
TEST
YEAR
1980
1981
1982
1983
1984
1985
1986
1987
71
69
65
68
71
68
70
74
54
54
52
52
54
54
51
51
86
85
86
86
83
85
82
82
84
82
82
83
81
84
85
82
92
93
92
89
92
93
93
92
65
65
64
62
63
62
62
62
63
64
65
66
67
66
68
68
58
60
61
60
64
62
63
64
78
83
77
76
80
79
79
80
61
60
57
56
56
62
59
62
65
65
61
66
63
64
61
56
67
68
69
68
69
70
70
72
42
44
43
41
39
47
46
46
83
84
85
85
86
87
86
85
72
68
71
66
65
68
68
66
77
73
75
74
73
72
79
75
82
80
83
81
79
80
82
81
73
74
78
77
72
76
73
68
84
82
86
90
81
86
86
81
78
80
79
78
77
84
82
81
29
33
34
32
32
31
39
44
79
81
81
79
85
80
80
78
60
55
53
63
64
59
59
58
65
65
68
67
68
68
64
68
85
84
81
84
85
85
84
83
67
67
66
65
66
67
68
68
1988
72 53
838291
61
68
6479
62 6072 39
86 66 76
80 64
8279 46
80 5866
88 69
254
17-F
2 55

NUMBER OF STUDENTS INTENDING TO MAJOR IN NON-SCIENCE FIELDS
INTENDED
(ALL
STUDENTS) TEST
YEAR
MAJOR FIELD
11977
1978
1979
1980
1981
1982
1983
1984
1985
1986
1987
1988
PRE-MEDICINE
32505
31239
32035
32726
34289
34286
34661
37379
37836
35490
36855
34677
OTHER HEALTH FIELDS
106724
112399
106202
96302
92359
89050
88262
88527
82979
78445
82979
86091
PRELAW
19825
32329
30332
29958
29711
29891
29205
28973
29257
27757
31870
36683
HUMANITIES
18247
18514
18259
17287
16467
15978
14554
.14018
14755
13596
14454
15889
HISTORY & CULTURE
7172
6227
5777
5140
4767
4665
4299
3925
4268
3985
4483
5231
FOREIGN LANGUAGES
8420
8255
8085
7348
7382
7041
6588
6698
7054
7429
7949
8636
STUDIO/PERFORMING ARTS
55966
62967
67212
63152
59255
54475
48615
45859
47704
52852
61818
66955
COMMUNICATIONS
23482
27004
30332
31440
32397
31094
30360
30749
31703
37772
45727
51275
BUSINESS
110139
139904
155724
161019
159910
160266
153145
157108
173049
199710
231099
245826
EDUCATION
61271
60237
55167
51547
48330
41495
36495
36559
37835
46524
59173
69677
VOCATIONAL FIELDS
28271
31935
33517
32738
33835
34376
33451
31554
27925
27367
32438
34174
OTHER/MISSING/UNDECIDED
267530
195832
178110
187545
190724
186712
182705
189426
201973
184799
156427
148317
TOTAL OF
NON SCIENCE FIELDS
739852
726842
720752
716202
709426
689329
662340
670775
696338
715726
765272
803431
TOTAL OF ALL EXAMINEES
979273
988927
991257
990787
993385
987449
962210
964550
977357
1000747
1080426
1134364
2-3
18-A
1
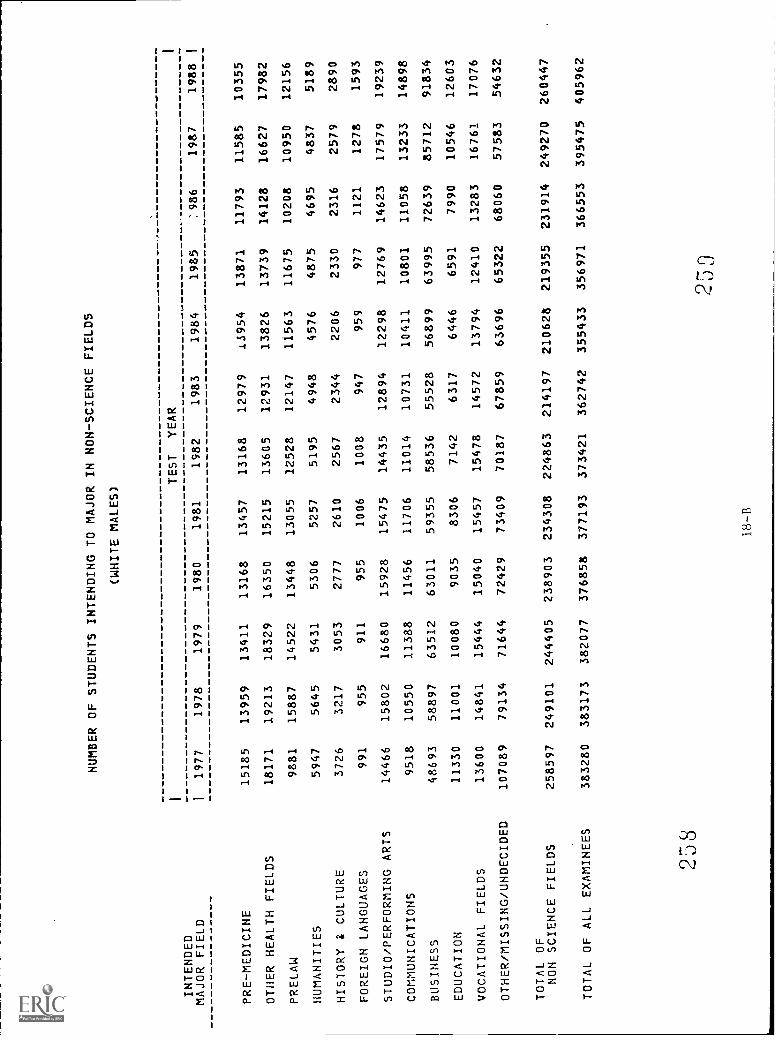
NUMBER OF STUDENTS INTENDING TO MAJOR IN NON-SCIENCE FIELDS
(WHITE MALES)
INTENDED
TEST
YEAR
MAJOR FIELD
I1977
1978
1979
1980
1981
1982
1983
1984
1985
:986
1987
1988
PRE-MEDICINE
15185
13959
13411
13168
13457
13168
12979
13954
13871
11793
11585
10355
OTHER HEALTH FIELDS
18171
19213
18329
16350
15215
13605
12931
13826
13739
14128
16627
17982
PRELAW
9881
15887
14522
13448
13055
12528
12147
11563
11675
10208
10950
12156
HUMANITIES
5947
5645
5431
5306
5257
5195
4948
4576
4875
4695
4837
5189
HISTORY & CULTURE
3726
3217
3053
2777
2610
2567
2344
2206
2330
2316
2579
2890
FOREIGN LANGUAGES
991
955
911
955
1006
1008
947
959
977
1121
1278
1593
STUDIO/PERFORMING ARTS
14466
15802
16680
15928
15475
14435
12894
12298
12769
14623
17579
19239
COMMUNICATIONS
9518
10550
11388
11456
11706
11014
10731
10411
10801
11058
13233
14898
BUSINESS
48693
58897
63512
63011
59355
58536
55528
56899
63995
72639
85712
91834
EDUCATION
11330
11001
10080
9035
8306
7142
6317
6446
6591
7990
10546
12603
VOCATIONAL FIELDS
13600
14841
15444
15040
15457
15478
14572
13794
12410
13283
16761
17076
OTHER/MISSING/UNDECIDED
107089
79134
71644
72429
73409
70187
67859
63696
65322
68060
57583
54632
TOTAL OF
NON SCIENCE FIELDS
258597
249101
244405
238903
234308
224863
214197
210628
219355
231914
249270
260447
TOTAL OF ALL EXAMINEES
383280
383173
382077
376858
377193
373421
362742
355433
356971
366553
395475
405962
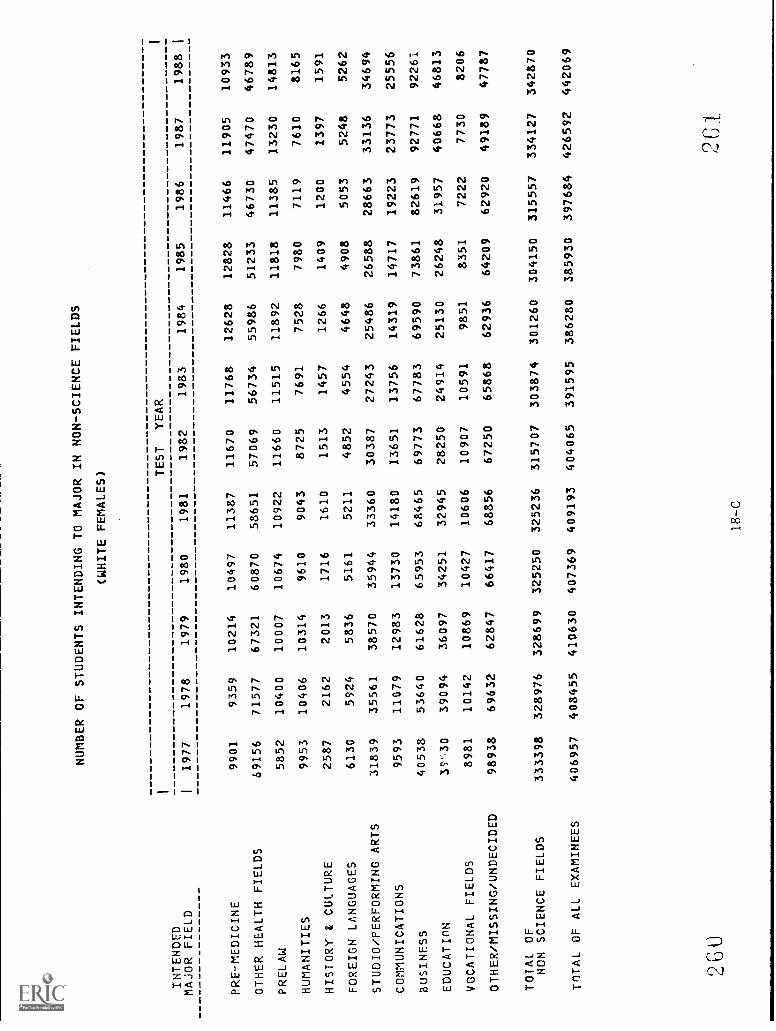
NUMBER OF STUDENTS INTENDING TO MAJOR IN NON-SCIENCE
FIELDS
(WHITE FEMALES)
INTENDED
TEST
YEAR
MAJOR FIELD
1977
1978
1979
1980
1981
1982
1983
1984
1985
1986
1987
1988
PRE-MEDICINE
9901
9359
10214
10497
11387
11670
11768
12628
12828
11466
11905
10933
OTHER HEALTH FIELDS
69156
71577
67321
60870
58651
57069
56734
55986
51233
46730
47470
46789
PRELAW
5852
10400
10007
10674
10922
11660
11515
11892
11818
11385
13230
14813
HUMANITIES
9953
10406
10314
9610
9043
8725
7691
7528
7980
7119
7610
8165
HISTORY & CULTURE
2587
2162
2013
1716
1610
1513
1457
1266
1409
1200
1397
1591
FOREIGN LANGUAGES
6130
5924
5836
5161
5211
4852
4554
4648
4908
5053
5248
5262
STUDIO/PERFORMING ARTS
31839
35561
38570
35944
33360
30387
27243
25486
26588
28663
33136
34694
COMMUNICATIONS
9593
11079
12983
13730
14180
13651
13756
14319
14717
19223
23773
25556
BUSINESS
40538
53640
61628
65953
68465
69773
67783
69590
73861
82619
92771
92261
EDUCATInN
39,30
39094
36097
34251
32945
28250
24914
25130
26248
31957
40668
46813
VOCATIONAL FIELDS
8981
10142
10869
10427
10606
10907
10591
9851
8351
7222
7730
8206
OTHER/MISSING/UNDECIDED
98938
69632
62847
66417
68856
67250
65868
62936
64209
62920
49189
47787
TOTAL OF
NON SCIENCE FIELDS
333398
328976
328699
325250
325236
315707
303874
301260
304150
315557
334127
342870
TOTAL OF ALL EXAMINEES
406957
408455
410630
407369
409193
404065
391595
386280
385930
397684
426592
442069
260
18-C
-U..
I

INTENDED
MAJOR FIELD
PRE-MEDICINE
OTHER HEALTH FIELDS
PRELAW
HUMANITIES
HISTORY & CULTURE
FOREIGN LANGUAGES
STUDIO/PERFORMING ARTS
COMMUNICATIONS
BUSINESS
EDUCATION
VOCATIONAL FIELDS
OTHER/MISSING/UNDECIDED
TOTAL OF
HON SCIENCE FIELDS
TOTAL OF ALL EXAMINEES
1 1
NUMBER OF STUDENTS
1977
1978
1979
1116
1068
1037
1516
1692
1689
897
1127
1189
343
378
377
261
253
196
59
56
65
1930
2334
2255
1133
1433
1544
4085
5219
5769
1858
1804
1666
1399
1611
1766
8209
5770
5188
22806
22745
22741
31581
33072
33467INTENDING TO MAJOR IN NON-SCIENCE FIELDS
(BLACK MALES)
TEST
YEAR
1980
1981
1982
1983
1984
1079
1047
1020
1053
1094
1442
1392
1213
1230
1209
1074
1022
995
969
979
308
298
266
221
235
180
150
137
115
92
56
59
55
41
41
2112
1821
1670
1500
1358
1528
1509
1478
1262
1257
5849
5489
5422
4847
4967
1380
1161
912
785
720
1740
1850
1794
1852
1783
5878
5855
5992
5591
5484
22626
21653
20954
19466
19219
33999
33481
33162
32127
31671
1985
1030
1117
888
207
115
48
1248
1240
5885
664
1528
5677
19647
31251
1986
956
1150
882
175
101
80
1368
1390
7292
878
1605
5564
21441
33520
1987
1129
1403
1052
178
-112
76
1639
1526
8958
1018
2022
5034
24147
37962
1
1988
1
1074
1605
1315
244
127
103
1756
1772
10471
1197
2168
5019
26851
42077
(-ti
263
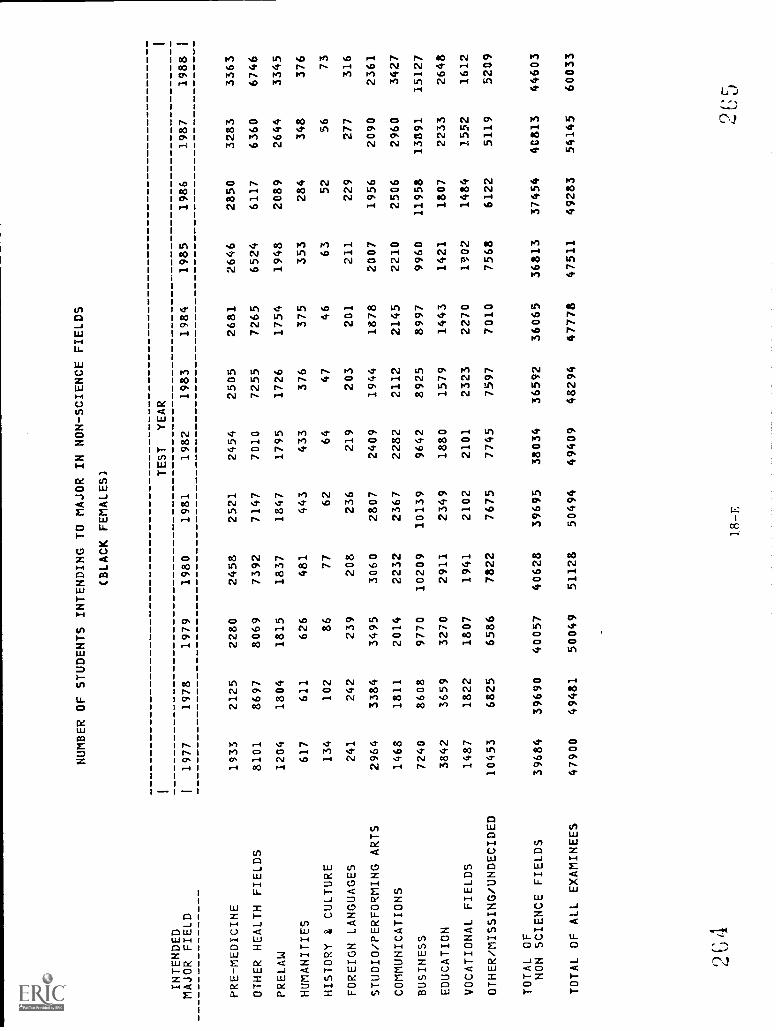
NUMBER OF STUDENTS INTENDING TO MAJOR IN NON-SCIENCE FIELDS
(BLACK FEMALES)
INTENDED
TEST
YEAR
MAJOR FIELD
I1977
1978
1979
1980
1981
1982
1983
1984
1985
1986
1987
1988
PRE-MEDICINE
1933
2125
2280
2458
2521
2454
2505
2681
2646
2850
3283
3363
OTHER HEALTH FIELDS
8101
8697
8069
7392
7147
7010
7255
7265
6524
6117
6360
6746
PRELAW
1204
1804
1815
1837
1847
1795
1726
1754
1948
2089
2644
3345
HUMANITIES
617
611
626
481
443
433
376
375
353
284
348
376
HISTORY & CULTURE
134
102
86
77
62
64
47
46
63
52
56
73
FOREIGN LANGUAGES
241
242
239
208
236
219
203
201
211
229
277
316
STUDIO/PERFORMING ARTS
2964
3384
3495
3060
2807
2409
1944
1878
2007
1956
2090
2361
COMMUNICATIONS
1468
1811
2014
2232
2367
2282
2112
2145
2210
2506
2960
3427
BUSINESS
7240
8608
9770
10209
10139
9642
8925
8997
9960
11958
13891
15127
EDUCATION
3842
3659
3270
2911
2349
1880
1579
1443
1421
1807
2233
2648
VOCATIONAL FIELDS
1487
1822
1807
1941
2102
2101
2323
2270
1302
1484
1552
1612
OTHER/MISSING/UNDECIDED
10453
6825
6586
7822
7675
7745
7597
7010
7568
6122
5119
5209
TOTAL OF
NON SCIENCE FIELDS
39684
39690
40057
40628
39695
38034
36592
36065
36813
37454
4C813
44603
TOTAL OF ALL EXAMINEES
47900
49481
50049
51128
50494
49409
48294
47778
47511
49283
54145
60033
4)
18-E
2
I

NUMBER OF STUDENTS INTENDING TO MAJOR IN NON-SCIENCE FIELDS
(OTHER STUDENTS)
INTENDED
TEST
YEAR
MAJOR FIELD
I1977
1978
1979
1980
1981
1982
1983
1984
1985
1986
1987
1988
PRE-MEDICINE
4370
4728
5093
5524
5877
5974
6356
7022
7461
8425
8953
8952
OTHER HEALTH FIELDS
9780
11220
10794
10248
9954
10153
10112
10241
10366
10320
11119
12969
PRELAW
1991
3111
2799
2925
2865
2913
2848
2785
2928
3193
3994
5054
HUMANITIES
1387
1474
1511
1582
1426
1359
1318
1304
1340
1323
1481
1915
HISTORY 8 CULTURE
464
493
42S
390
335
384
336
315
351
316
339
550
FOREIGN LANGUAGES
999
1078
1034
968
870
.907
843
849
910
946
1070
1362
STUDIO/PERFORMING ARTS
4767
5886
6212
6108
5792
5574
5034
4839
5092
6242
7374
8905
COMMUNICATIONS
1770
2131
2403
2494
2635
2669
2499
2617
2735
3595
4235
5622
BUSINESS
9883
13540
15045
15997
16462
16893
16062
16655
19348
25202
29767
36133
EDUCATION
4311
4679
4054
3970
3569
3311
2900
2820
2911
3892
4708
6416
VOCATIONAL FIELDS
2804
3519
3631
3590
3820
4096
4113
3856
3734
3773
4373
5112
OTHER/MISSING/UNDECIDED
42841
34471
31845
34999
34929
35538
35790
50300
59197
42133
39502
35670
TOTAL OF
NON SCIENCE FIELDS
85367
86330
84850
88795
88534
89771
88211
103603
116373
109360
116915
128660
TOTAL OF ALL EXAMINEES
109555
114746
115034
121433
123024
127392
127452
143388
155694
153707
166252
184223
266
267
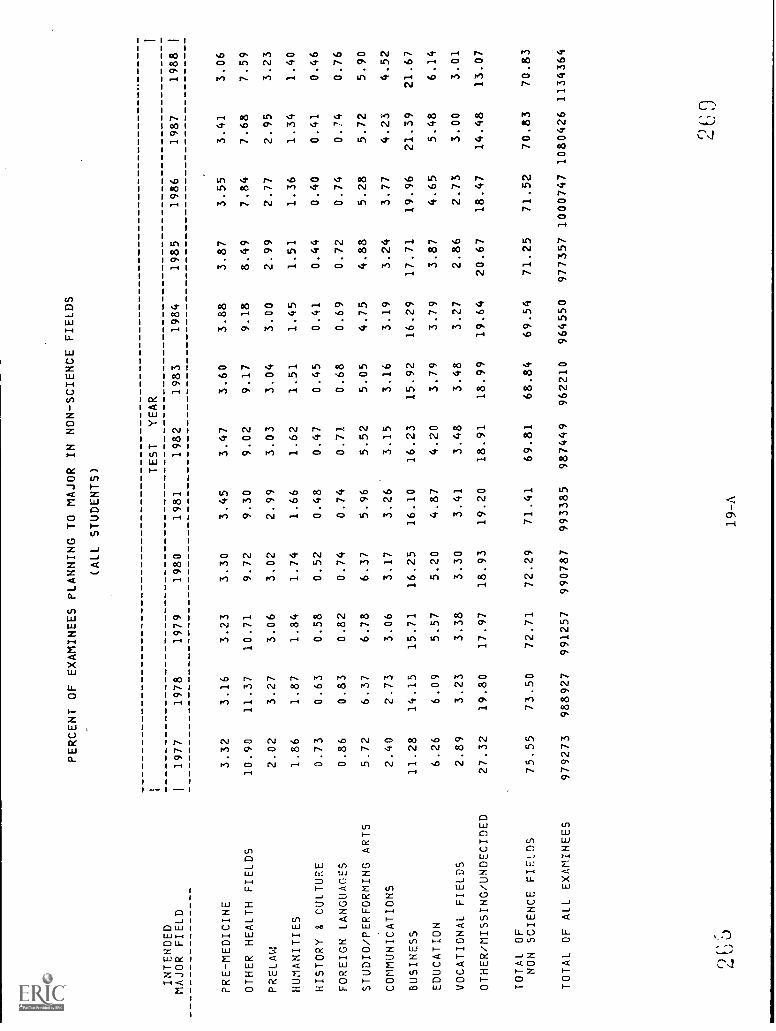
PERCENT OF EXAMINEES PLANNING TO MAJOR IN NON-SCIENCE FIELDS
(ALL STUDENTS)
INTENDED
MAJOR FIELD
PRE-MEDICINE
OTHER HEALTH FIELDS
PRELAW
HUMANITIES
HISTORY & CULTURE
FOREIGN LANGUAGES
STUDIO/PERFORMING ARTS
COMMUNICATIONS
BUSINESS
EDUCATION
VOCATIONAL FIELDS
OTHER/MISSING/UNDECIDED
TOTAL OF
NON SCIENCE FIELDS
TOTAL OF ALL EXAMINEES
11977
3.32
10.90
2.02
1.86
0.73
0.86
5.72
2.40
11.28
6.26
2.89
27.32
75.55
979273
1978
3.16
11.37
3.27
1.87
0.63
0.83
6.37
2.73
14.15
6.09
3.23
19.80
73.50
988927
1979
3.23
10.71
3.06
1.84
0.58
0.82
6.78
3.06
15.71
5.57
3.38
17.97
72.71
991257
1980
3.30
9.72
3.02
1.74
0.52
0.74
6.37
3.17
16.25
5.20
3.30
18.93
72.29
990787
1981
3.45
9.30
2.99
1.66
0.48
0.74
5.96
3.26
16.10
4.87
3.41
19.20
71.41
993385
TEST
YEAR
1982
1983
3.47
3.60
9.02
9.17
3.03
3.04
1.62
1.51
0.47
0.45
0.71
0.68
5.52
5.05
3.15
3.16
16.23
15.92
4.20
3.79
3.48
3.48
18.91
18.99
69.81
68.84
987449
962210
1984
3.88
9.18
3.00
1.45
0.41
0.69
4.75
3.19
16.29
3.79
3.27
19.64
69.54
964550
1985
3.87
8.49
2.99
1.51
0.44
0.72
4.88
3.24
17.71
3.87
2.86
20.67
71.25
977357
1986
3.55
7.84
2.77
1.36
0.40
0.74
5.28
3.77
19.96
4.65
2.73
18.47
71.52
1000747
1987
3.41
7.68
2.95
1.34
0.41
0.74
5.72
4.23
21.39
5.48
3.00
14.48
70.83
1080426
1988
3.06
7.59
3.23
1.40
0.46
0.76
5.90
4.52
21.67
6.14
3.01
13.07
70.83
1134364

PERCENT OF EXAMINEES PLANNING TO MAJOR IN NON-SCIENCE FIELDS
(WHITE MALES)
INTENDED
TEST
YEAR
MAJOR FIELD
I1977
1978
1979
1980
1981
1982
1983
1984
1985
1986
1987
1988
PRE-MEDICINE
3.96
3.64
3.51
3.49
3.57
3.53
3.58
3.93
3.89
3.22
2.93
2.55
OTHER HEALTH FIELDS
4.74
5.01
4.80
4.34
4.03
3.64
3.56
3.89
3.85
3.85
4.20
4.43
PRELAW
2.58
4.15
3.80
3.57
3.46
3.35
3.35
3.25
3.27
2.78
2.77
2.99
HUMANITIES
1.55
1.47
1.42
1.41
1.39
1.39
1.36
1.29
1.37
1.28
1.22
1.28
HISTORY & CULTURE
0.97
0.84
0.80
0.74
0.69
0.69
0.65
0.62
0.65
0.63
0.65
0.71
FOREIGN LANGUAGES
0.26
0.25
0.24
0.25
0.27
0.27
0.26
0.27
0.27
0.31
0.32
0.39
STUDIO/PERFORMING ARTS
3.77
4.12
4.37
4.23
4.10
3.87
3.55
3.46
3.58
3.99
4.45
4.74
COMMUNICATIONS
2.48
2.75
2.98
3.04
3.10
2.95
2.96
2.93
3.03
3.02
3.35
3.67
BUSINESS
12.70
15.37
16.62
16.72
15.74
15.68
15.31
16.01
17.93
19.82
21.67
22.62
EDUCATION
2.96
2.87
2.64
2.40
2.20
1.91
1.74
1.81
1.85
2.18
2.67
3.10
VOCATIONAL FIELDS
3.55
3.87
4.04
3.99
4.10
4.14
4.02
3.88
3.48
3.62
4.24
4.21
OTHER/MISSING/UNDECIDED
27.94
20.65
18.75
19.22
19.46
18.80
18.71
17.92
18.30
18.57
14.56
13.46
TOTAL OF
NON SCIENCE FIELDS
67.47
65.01
63.97
63.39
62.12
60.22
59.05
59.26
61.45
63.27
63.03
64.16
TCIAL OF ALL EXAMINEES
383280
383173
382077
376858
377193
373421
362742
355433
356971
366553
395475
405962
270
1 9-B
271
I

PERCENT OF E>AMINEES PLANNING TO MAJOR IN NON-SCIENCE FIELDS
(WHITE FEMALES)
INTENDED
TEST
YEAR
MAJOR FIELD
11977
1978
1979
1980
1981
1982
1983
1984
1985
1986
1987
1988
PRE-MEDICINE
2.43
2.29
2.49
2.58
2.78
2.89
3.01
3.27
3.32
2.88
2.79
2.47
OTHER HEALTH FIELDS
16.99
17.52
16.39
14.94
14.33
14.12
14.49
14.49
13.28
11.75
11.13
10.58
PRELAW
1.44
2.55
2.44
2.62
2.67
2.89
2.94
3.08
3.06
2.86
3.10
3.35
HUMANITIES
2.45
2.55
2.51
2.36
2.21
2.16
1.96
1.95
2.07
1.79
1.78
1.85
HISTORY & CULTUFE
0.64
0.53
0.49
0.42
0.39
0.37
0.37
0.33
0.37
0.30
0.33
0.36
FOREIGN LANGUAGES
1.51
1.45
1.42
1.27
1.27
1.20
1.16
1.20
1.27
1.27
1.23
1.19
STUDIO/PERFORMING ARTS
7.82
8.71
9.39
8.82
8.15
7.52
6.96
6.60
6.89
7.21
7.77
7.85
COMMUNICATIONS
2.36
2.71
3.16
3.37
3.47
3.38
3.51
3.71
3.81
4.83
5.57
5.78
BUSINESS
9.96
13.13
15.01
16.19
16.73
17.27
17.31
18.02
19.14
20.78
21.75
20.87
EDUCATION
9.81
9.57
8.79
8.41
8.05
6.99
6.36
6.51
6.80
8.04
9.53
10.59
VOCATIONAL FIELDS
2.21
2.48
2.65
2.56
2.59
2.70
2.70
2.55
2.16
1.82
1.81
1.86
OTHER/MISSING/UNDECIDED
24.31
17.05
15.31
16.30
16.33
16.64
16.82
16.29
16.64
15.82
11.53
10.81
TOTAL OF
NON SCIENCE FIELDS
81.92
80.54
80.05
79.84
79.48
78.13
77.60
77.99
78.81
79.35
78.32
77.56
TOTAL OF ALL EXAMINEES
406957
408455
410630
407369
409193
404065
391595
386280
335930
397684
426592
442069
I
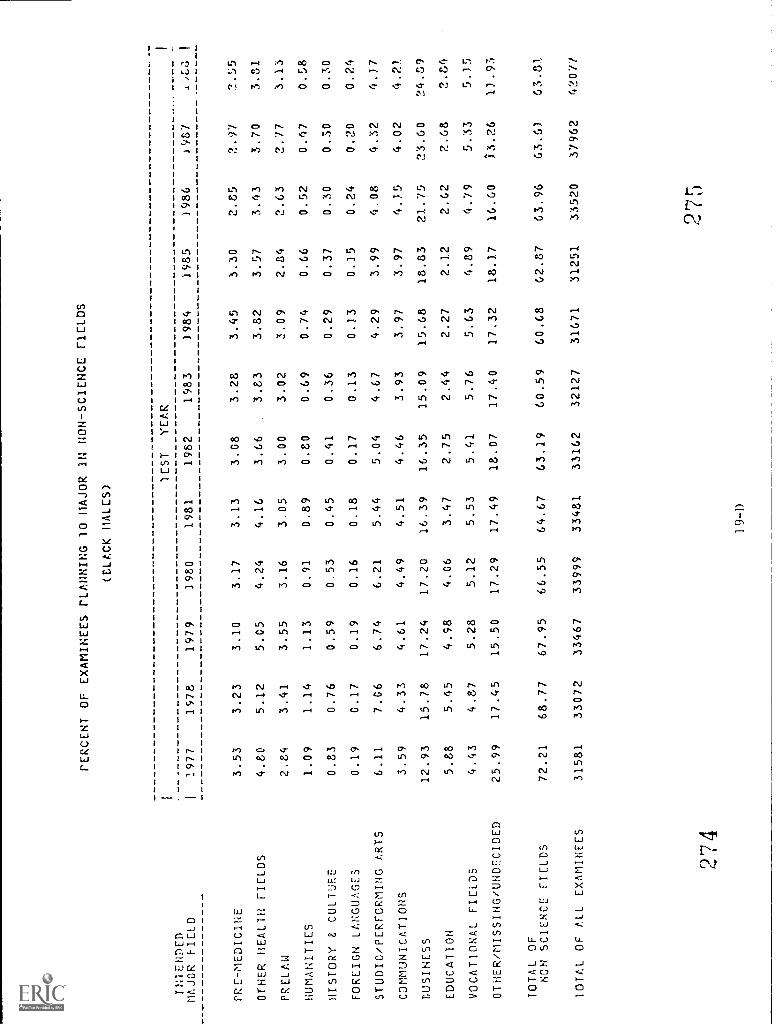
INTENDED
MAJOR FIELD
PRE-MEDICINE
OTHER HEALTH FIELDS
PRELAW
HUMANITIES
HISTORY & CULTURE
FOREIGN LANGUAGES
STUDIO/PERFORMING ARTS
COMMUNICATIONS
BUSINESS
EDUCATION
VOCATIONAL FIELDS
OTHER/MISSING/UNDECIDED
TOTAL OF
NON SCIENCE FIELDS
TOTAL OF ALL EXAMINEES
1 1
PERCENT OF
1977
1578
3.53
3.23
4.80
5.12
2.84
3.41
1.09
1.14
0.83
0.76
0.19
0.17
6.11
7.C6
3.59
4.33
12.93
15.78
5.88
5.45
4.43
4.87
25.99
17.45
72.21
68.77
31581
33072EXAMINEES PLANNING 10 HAJOR IN NON-SCIENCE naps
(BLACK MALES)
1CST
YEAR
1979
)980
1981
1982
1983
1984
3.10
3.17
3.13
3.08
3.28
3.45
5.C5
4.24
4.16
3.66
3.83
3.82
3.55
3.16
3.05
3.00
3.02
3.09
1.13
0.91
0.89
0.80
0.69
0.74
0.59
0.53
0.45
0.41
0.36
0.29
0.19
0.16
0.18
0.17
0.13
0.13
6.74
6.21
5.44
5.04
4.67
4.29
4.61
4.49
4.51
4.46
3.93
3.97
17.24
17.20
16.39
16.35
15.09
15.68
4.58
4.06
3.47
2.75
2.44
2.27
5.28
5.12
5.53
5.41
5.76
5.63
15.50
17.29
17.49
18.07
17.40
17.32
67.95
66.55
64.67
63.19
60.59
60.68
33467
33999
33481
33162
32127
31671
1985
3.30
3.57
2.84
0.66
0.37
0.15
3.99
3.97
18.83
2.12
4.89
18.17
62.87
31251
1986
2.85
3.43
2.63
0.52
0.30
0.24
4.08
4.15
21.75
2.62
4.79
16.60
63.96
33520
)987
2.17
3.70
2.77
0.47
0.30
0.20
4.32
4.02
23.60
2.08
5.33
13.26
63.0
37962
1
l'.4",3
I
?.55
3.81
3.15
0.58
0.30
0.24
4.17
4.21
24.89
2.84
5.15
11.93
63.81.
4207/
274
1 9 -1)
275
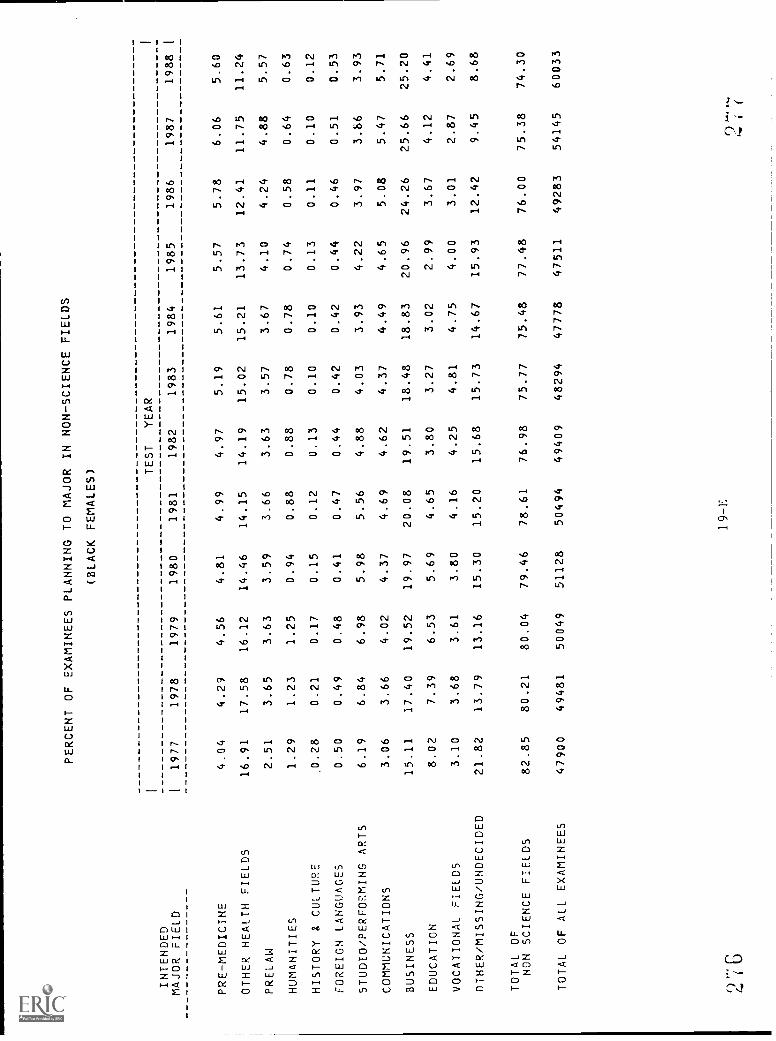
PERCENT OF EXAMINEES PLANNING TO MAJOR IN NON-SCIENCE FIELDS
INTENDED
(BLACK
FEMALES) TEST
YEAR
MAJOR FIELD
I1977
1978
1979
1980
1981
1982
1983
1984
1985
1986
1987
1988
PRE-MEDICINE
4.04
4.29
4.56
4.81
4.97
5.19
5.61
5.57
5.78
6.06
5.60
OTHER HEALTH FIELDS
16.91
17.58
16.12
14.46
14.15
14.19
15.02
15.21
13.73
12.41
11.75
11.24
PRELAW
2.51
3.65
3.63
3.59
3.66
3.63
3.57
3.67
4.10
4.24
4.88
5.57
HUMANITIES
1.29
1.23
1.25
0.94
0.88
0.88
0.78
0.78
0.74
0.58
0.64
0.63
HISTORY & CULTURE
,0.28
0.21
0.17
0.15
0.12
0.13
0.10
0.10
0.13
0.11
0.10
0.12
FOREIGN LANGUAGES
0.50
0.49
0.48
0.41
0.47
0.44
0.42
0.42
0.44
0.46
0.51
0.53
STUDIO/PERFORMING ARTS
6.19
6.84
6.98
5.98
5.56
4.88
4.03
3.93
4.22
3.97
3.86
3.93
COMMUNICATIONS
3.06
3.66
4.02
4.37
4.69
4.62
4.37
4.49
4.65
5.08
5.47
5.71
BUSINESS
15.11
17.40
19.52
19.97
20.08
19.51
18.48
18.83
20.96
24.26
25.66
25.20
EDUCATION
8.02
7.39
6.53
5.69
4.65
3.80
3.27
3.02
2.99
3.67
4.12
4.41
VOCATIONAL FIELDS
3.10
3.68
3.61
3.80
4.16
4.25
4.81
4.75
4.00
3.01
2.87
2.69
OTHER/MISSING/UNDECIDED
21.82
13.79
13.16
15.30
15.20
15.68
15.73
14.67
15.93
12.42
9.45
8.68
TOTAL OF
NON SCIENCE FIELDS
82.85
80.21
80.04
79.46
78.61
76.98
75.77
75.48
77.48
76.00
75.38
74.30
TOTAL OF ALL EXAMINEES
47900
49481
50049
51128
50494
49409
48294
47778
47511
49283
54145
60033
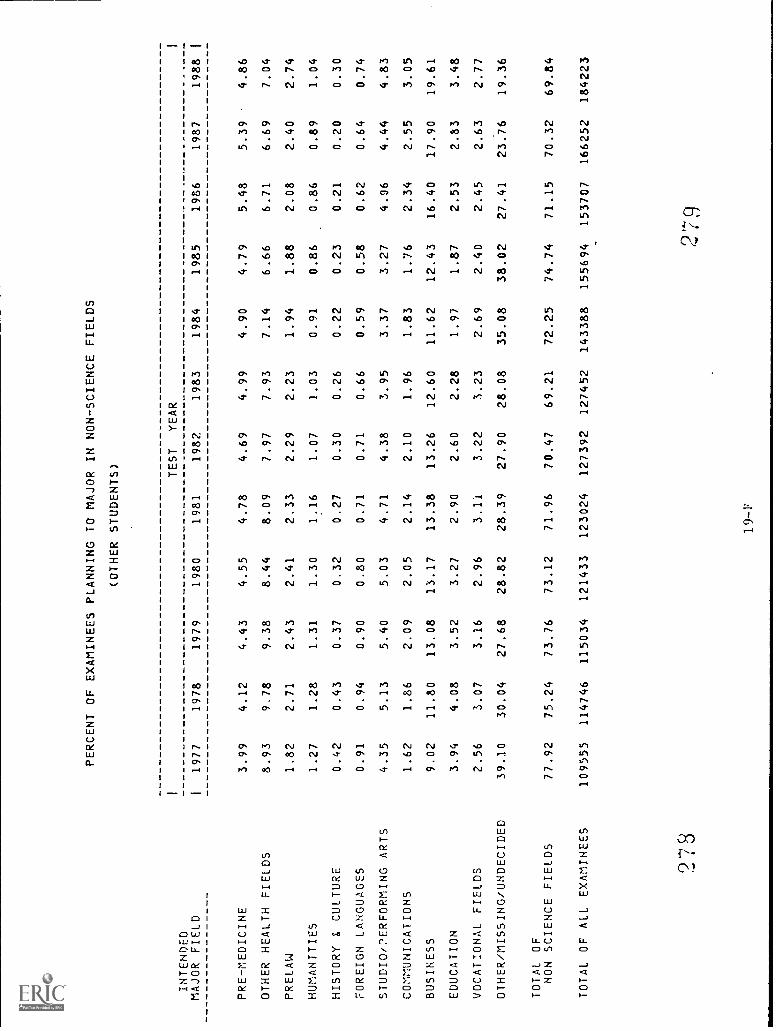
PERCENT OF EXAMINEES PLANNING TO MAJOR IN NON-SCIENCE FIELDS
(OTHER STUDENTS)
INTENDED
TEST
YEAR
MAJOR FIELD
I1977
1978
1979
1980
1981
1982
1983
1984
1985
1986
1987
1988
PRE-MEDICINE
3.99
4.12
4.43
4.55
4.78
4.69
4.99
4.90
4.79
5.48
5.39
4.86
OTHER HEALTH FIELDS
8.93
9.78
9.38
8.44
8.09
7.97
7.93
7.14
6.66
6.71
6.69
7.04
PRELAW
1.82
2.71
2.43
2.41
2.33
2.29
2.23
1.94
1.88
2.08
2.40
2.74
HUMANITIES
1.27
1.28
1.31
1.30
1.16
1.07
1.03
0.91
0.86
0.86
0.89
1.04
HISTORY & CULTURE
0.42
0.43
0.37
0.32
0.27
0.30
0.26
0.22
0.23
0.21
0.20
0.30
FOREIGN LANGUAGES
0.91
0.94
0.90
0.80
0.71
0.71
0.66
0.59
0.58
0.62
0.64
0.74
STUDIO/?ERFORMING ARTS
4.35
5.13
5.40
5.03
4.71
4.38
3.95
3.37
3.27
4.06
4.44
4.83
COMMUNICATIONS
1.62
1.86
2.09
2.05
2.14
2.10
1.96
1.83
1.76
2.34
2.55
3.05
BUSINESS
9.02
11.80
13.08
13.17
13.38
13.26
12.60
11.62
12.43
16.40
17.90
19.61
EDUCATION
3.94
4.08
3.52
3.27
2.90
2.60
2.28
1.97
1.87
2.53
2.83
3.48
VOCATIONAL FIELDS
2.56
3.07
3.16
2.96
3.11
3.22
3.23
2.69
2.40
2.45
2.63
2.77
OTHER/MISSING/UNDECIDED
39.10
30.04
27.68
28.82
28.39
27.90
28.08
35.08
38.02
27.41
23.76
19.36
TOTAL OF
NON SCIENCE FIELDS
77.92
75.24
73.76
73.12
71.96
70.47
69.21
72.25
74.74
71.15
70.32
69.84
TOTAL OF ALL EXAMINEES
109555
114746
115034
121433
123024
127392
127452
143388
155694
153707
166252
184223
978
279
I

MEAN SATV OF STUDENTS INTENDING TO
MAJOR IN NON-SCIENCE FIELDS
(ALL STUDENTS)
INTENDED
MAJOR FIELD
PRE-MEDICINE
OTHER HEALTH FIELDS
PRELAW
HUMANITIES
HISTORY & CULTURE
FOREIGN LANGUAGES
STUDIO/PERFORMING ARTS
COMMUNICATIONS
BUSINESS
EDUCATION
VOCATIONAL FIELDS
OTHER/MISSING/UNDECIDED
TOTAL OF
NON SCIENCE FIELDS
TOTAL OF ALL EXAMINEES
1 11977
492
415
471
496
478
480
427
459
402
399
395
415
421
429
1978
490
413
476
496
476
475
422
451
401
395
389
418
421
429
1979
488
412
471
496
478
475
418
448
400
391
387
415
419
427
1980
484
410
468
496
481
471
417
444
399
388
384
408
415
424
1981
484
407
467
496
482
472
418
443
398
390
383
408
415
424
TEST
YEAR
1982
484
408
468
501
485
475
418
446
401
393
384
410
417
426
1983
482
405
466
504
490
478
420
445
402
393
381
407
416
425
1984
482
405
465
508
494
482
420
446
403
397
382
410
418
426
1985
486
409
469
516
497
f:86
424
452
407
403
385
417
423
431
1986
482
408
467
520
498
488
428
451
406
407
382
424
424
431
1987
480
408
465
525
497
489
431
452
407
408
385
415
422
430
1988
474
407
460
515
491
479
429
447
406
407
387
417
421
428
280
20- A
2S I
I

INTENDED
MAJOR FIELD
PRE-MEDICINE
OTHER HEALTH FIELDS
PRELAW
HUMANITIES
HISTORY & CULTURE
FOREIGN LANGUAGES
STUDIO/PERFORMING ARTS
COMMUNICATIONS
BUSINESS
EDUCATION
VOCATIONAL FIELDS
OTHER/MISSING/UNDECIDED
TOTAL OF
NON SCIENCE FIELDS
TOTAL OF ALL EXAMINEES
1 1
MEAN SATV OF STUDENTS
1977
1978
1979
507
509
510
440
442
443
486
492
490
504
509
510
477
473
476
499
494
498
443
442
441
461
458
455
420
417
416
393
390
385
417
414
412
421
425
423
434
437
435
443
446
444
INTENDING TO MAJOR IN NON-SCIENCE FIELDS
(WHITE MALES)
TEST
YEAR
1980
1981
1982
1983
1984
506
507
505
502
506
443
442
440
437
439
488
488
488
484
487
508
509
511
512
521
479
482
483
487
494
492
497
499
507
437
441
440
440
444
451
454
456
455
457
415
416
418
418
421
382
385
387
385
391
409
411
411
410
415
417
418
419
416
418
431
433
434
432
436
441
443
444
444
448
1985
509
439
492
531
498
509
447
461
424
398
417
422
439
450
1986
507
436
492
534
499
512
451
461
425
405
408
436
441
451
1987
509
434
492
539
498
519
455
461
427
406
409
429
439
451
1
1918
1
505
436
492
533
495
501
454
461
429
413
411
430
441
451
292
283
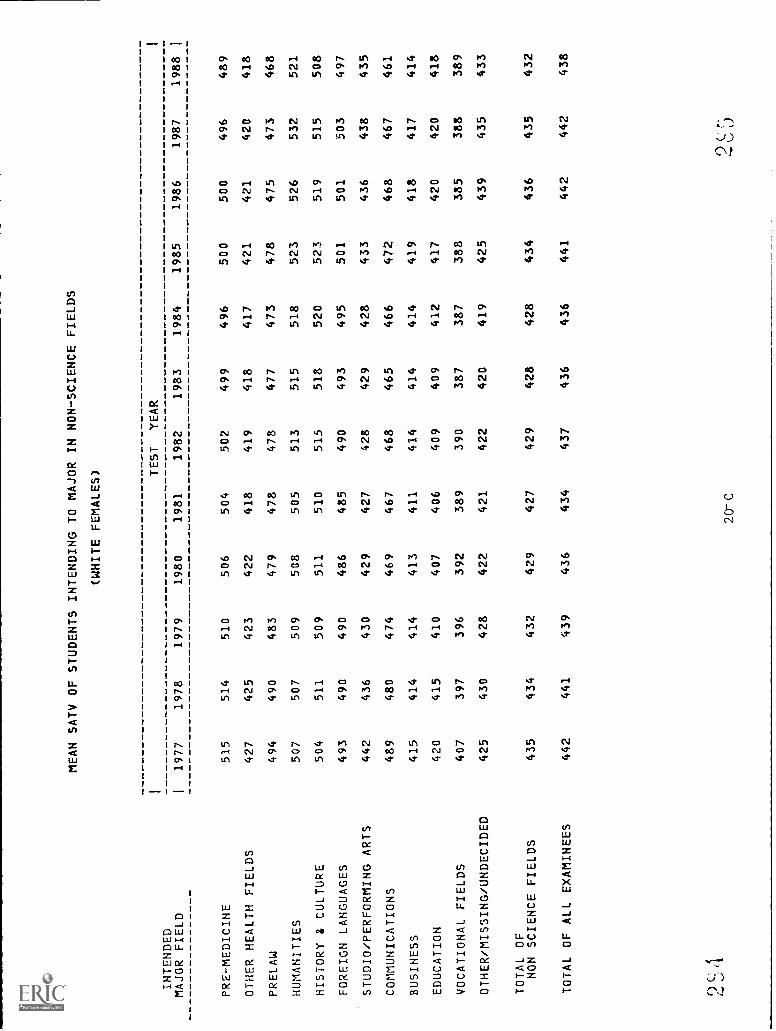
MEAN SATV OF STUDENTS INTENDING TO MAJOR IN NON-SCIENCE FIELDS
(WHITE FEMALES)
INTENDED
MAJOR FIELD
PRE-MEDICINE
OTHER HEALTH FIELDS
PRELAW
HUMANITIES
HISTORY & CULTURE
FOREIGN LANGUAGES
STUDIO/PERFORMING ARTS
COMMUNICATIONS
BUSINESS
EDUCATION
VOCATIONAL FIELDS
OTHER/MISSING/UNDECIDED
TOTAL OF
NON SCIENCE FIELDS
TOTAL OF ALL EXAMINEES
11977
515
427
494
507
504
493
442
489
415
420
407
425
435
442
1978
514
425
490
507
511
490
436
480
414
415
397
430
434
441
1979
510
423
483
509
509
490
430
474
414
410
396
428
432
439
1980
506
422
479
508
511
486
429
469
413
407
392
422
429
436
1981
504
418
478
505
510
485
427
467
411
406
389
421
427
434
TEST
YEAR
1982
502
419
478
513
515
490
428
468
414
409
390
422
429
437
1983
499
418
477
515
518
493
429
465
414
409
387
420
428
436
1984
496
417
473
518
520
495
428
466
414
412
387
419
428
436
1985
500
421
478
523
523
501
433
472
419
417
388
425
434
441
1986
500
421
475
526
519
501
436
468
418
420
385
439
436
442
1987
496
420
473
532
515
503
438
467
417
420
388
435
435
442
1988
489
418
468
521
508
497
435
461
414
418
389
433
432
438
20-C
90
1

MEAN SATV OF STUDENTS INTENDING TO MAJOR IN NON-SCIENCE FIELDS
(BLACK MALES)
INTENDED
TEST
YEAR
MAJOR FIELD
1977
1978
1979
1980
1981
1982
1983
1984
1985
1986
1987
1988
PRE-MEDICINE
409
409
404
407
415
425
409
417
419
423
416
418
OTHER HEALTH FIELDS
342
338
348
341
345
349
346
351
351
360
355
358
PRELAW
377
377
384
384
381
395
389
389
398
397
400
402
HUMANITIES
342
350
343
347
351
362
365
377
389
405
422
430
HISTORY & CULTURE
335
323
328
332
325
352
354
354
346
369
392
382
FOREIGN LANGUAGES
397
388
371
373
389
402
377
417
407
413
364
374
STUDIO/PERFORMING ARTS
316
316
318
316
321
323
323
335
337
342
351
359
COMMUNICATIONS
340
343
332
339
339
346
344
349
353
355
355
362
BUSINESS
324
326
323
320
325
330
327
333
338
341
343
347
EDUCATION
284
283
278
278
281
283
283
290
291
298
300
313
VOCATIONAL FIELDS
310
305
307
306
312
316
314
312
320
323
327
333
OTHER/MISSING/UNDECIDED
352
346
34?0
334
336
342
342
346
346
360
340
344
TOTAL OF
NON SCIENCE FIELDS
338
334
332
330
334
340
339
344
347
352
348
353
TOTAL OF ALL EXAMINEES
342
341
338
338
342
349
347
350
354
358
355
358
2S6
20-D
287
I

MEAN SATV OF STUDENTS INTENDING TO MAJOR IN NON-SCIENCE FIELDS
INTENDED
(F .ACK
FEMALES) TEST
YEAR
MAJOR FIELD
I1977
1978
1979
1980
1981
1982
1983
1984
1985
1986
1987
1988
PREIIEDICINE
393
392
386
386
387
392
39
38P
397
398
394
392
OTHER HEALTH FIELDS
315
316
314
314
310
320
3..'
15
320
324
330
330
PRELAW
370
368
363
361
360
368
370
366
368
380
380
378
HUMANITIES
363
353
354
360
370
373
394
398
390
400
433
429
HISTORY & CULTURE
344
326
356
349
345
370
388
378
359
396
367
389
FOREIGN LANGUAGES
397
387
388
390
'O1
414
408
426
414
414
408
STUDIO/PERFORMING ARTS
314
317
312
314
314
322
321
321
328
338
349
349
COMMUNICATIONS
366
361
360
355
365
360
361
367
375
377
374
BUSINESS
305
308
309
308
309
317
318
320
325
330
337
337
EDUCATION
298
298
295
293
296
300
306
310
317
323
328
VOCATIONAL FIELDS
289
288
284
289
286
292
297
296
300
300
305
307
OTHER/MISSING/UNDECIDED
341
340
337
331
330
334
340
338
344
359
344
345
TOTAL OF
NON SCIENCE FIELDS
326
325
323
323
322
330
331
332
338
344
347
347
TOTAL OF ALL EXAMINEES
330
330
328
328
328
336
337
337
342
347
350
350
288
20-E
2SU
I
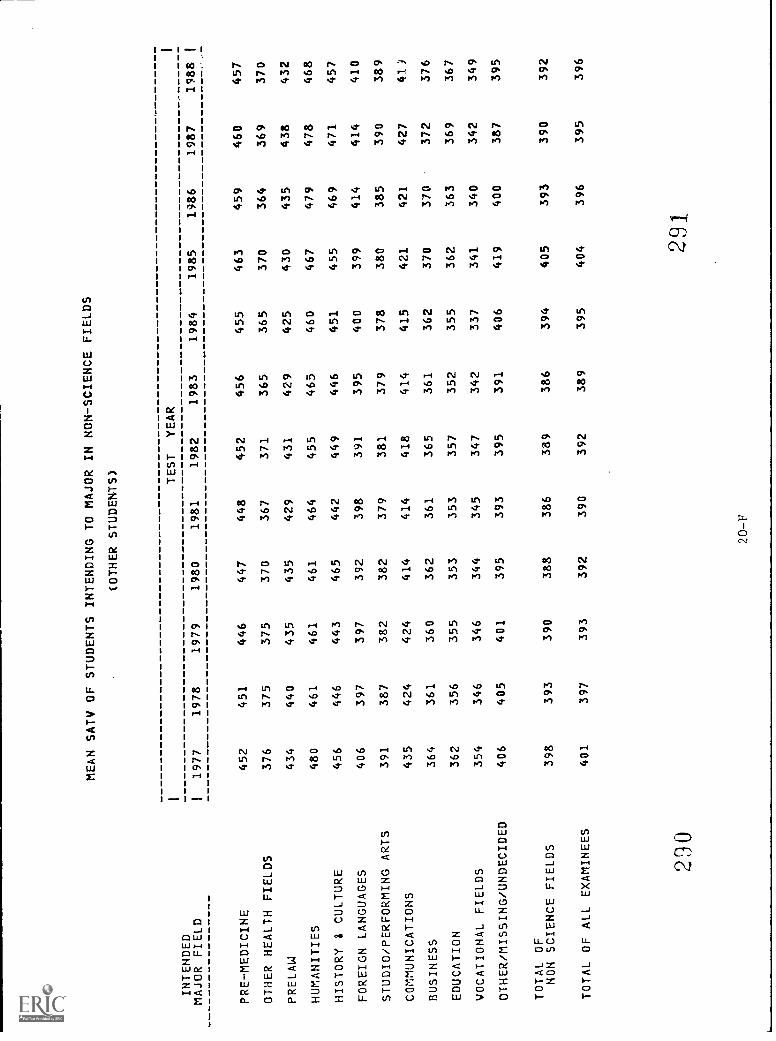
MEAN SATV OF STUDENTS INTENDING TO MAJOR IN NON-SCIENCE FIELDS
(OTHER STUDENTS)
INTENDED
TEST
YEAR
MAJOR FIELD
I1977
1978
1979
1980
1981
1982
1983
1984
1985
1986
1987
1988
PRE-MEDICINE
452
451
446
447
448
452
456
455
463
459
460
457
OTHER HEALTH FIELDS
376
375
375
370
371
365
365
370
364
369
370
PRELAW
434
440
435
435
431
429
425
430
435
438
432
HUMANITIES
480
461
461
461
455
465
460
467
479
478
468
HISTORY & CULTURE
456
446
443
465
442
449
446
451
455
469
471
457
FOREIGN LANGUAGES
406
397
397
392
398
391
395
400
399
414
414
410
STUDIO/PERFORMING ARTS
391
387
382
382
379
381
379
378
380
385
390
389
COMMUNICATIONS
435
424
424
414
414
418
414
415
421
421
427
413
BUSINESS
364
361
360
362
361
365
361
362
370
370
372
376
EDUCATION
362
356
355
353
353
357
352
355
362
363
369
367
VOCATIONAL FIELDS
354
346
346
344
345
347
342
337
341
340
342
349
OTHER/MISSING/UNDECIDED
406
405
401
395
393
395
391
406
419
400
387
395
TOTAL OF
NON SCIENCE FIELDS
398
393
390
388
386
389
386
394
405
393
390
392
TOTAL OF ALL EXAMINEES
401
397
393
392
390
392
389
395
404
396
395
396
290
291
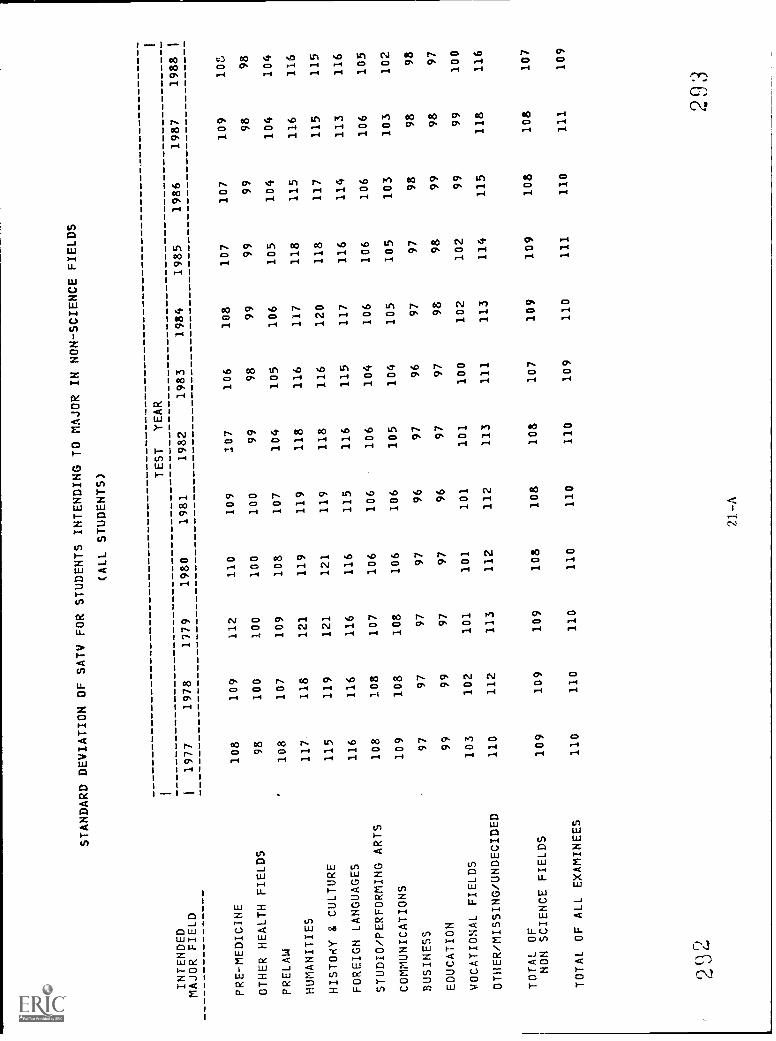
STANDARD DEVIATION OF SATV
FOR STUDENTS INTENDING TO
MAJOR IN NON-SCIENCE FIELDS
(ALL STUDENTS)
INTENDED
TEST
YEAR
MAJOR FIELD
I1977
1978
1979
1980
1981
1982
1983
1984
1985
1986
1987
1988
PRE-MEDICINE
108
109
112
110
109
107
106
108
107
107
109
10fL
OTHER HEALTH FIELDS
98
100
100
100
100
99
98
99
99
99
98
98
PRELAW
108
107
109
108
107
104
105
106
105
104
104
104
HUMANITIES
117
118
121
119
119
118
116
117
118
115
116
116
HISTORY & CULTURE
115
119
121
121
119
118
116
120
118
117
115
115
FOREIGN LANGUAGES
116
116
116
116
115
116
115
117
116
114
113
116
STUDIO/PERFORMING ARTS
108
108
107
106
106
106
104
106
106
106
106
105
COMMUNICATIONS
109
108
108
106
106
105
104
105
105
103
103
102
BUSINESS
97
97
97
97
96
97
96
97
97
98
98
98
EDUCATION
99
99
97
97
96
97
97
98
98
99
98
97
VOCATIONAL FIELDS
103
102
101
101
101
101
100
102
102
99
99
100
OTHER/MISSING/UNDECIDED
110
112
113
112
112
113
111
113
114
115
118
116
TOTAL OF
NON SCIENCE FIELDS
109
109
109
108
108
108
107
109
109
108
108
107
TOTAL OF ALL EXAMINEES
110
110
110
110
110
110
109
110
111
110
111
109
2 '3
221-A
2 9
:3
I
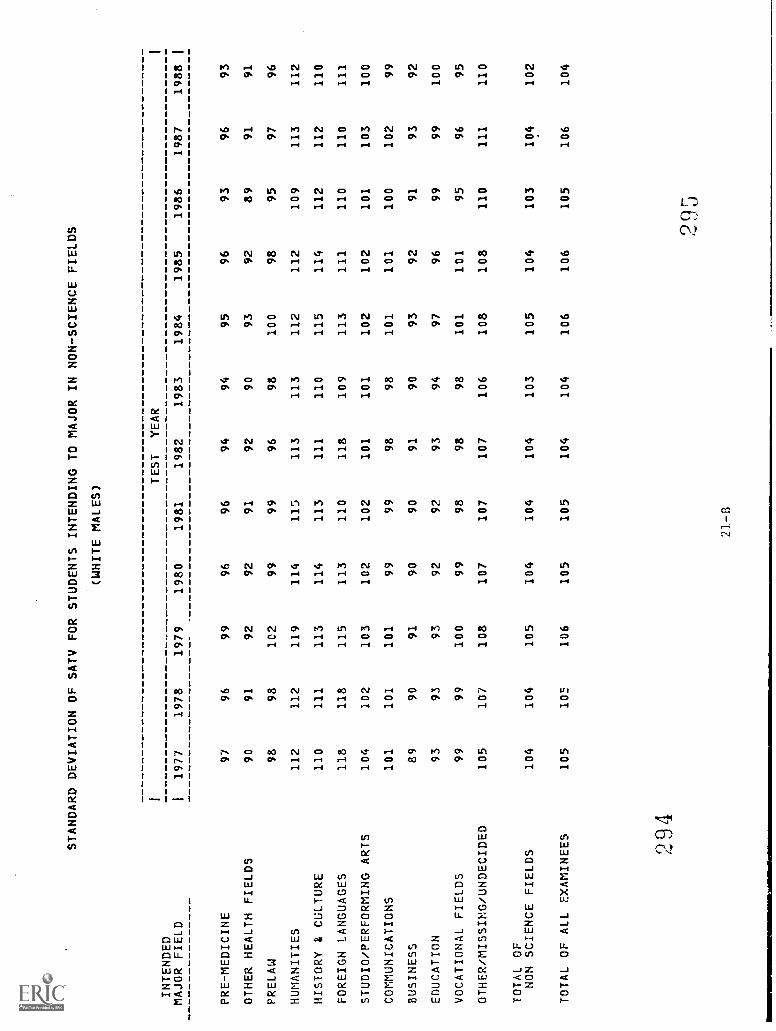
STANDARD DEVIATION OF SATV FOR STUDENTS INTENDING TO MAJOR IN NON-SCIENCE FIELDS
(WHITE MALES)
ITEST
YEAR
INTENDED
MAJOR FIELD
I1977
1978
1979
1980
1981
1982
1983
1984
1985
1986
1987
1988
PRE-MEDICINE
97
96
99
96
96
94
94
95
96
93
96
93
OTHER HEALTH FIELDS
90
91
92
92
91
92
90
93
92
89
91
91
PRELAW
98
98
102
99
99
96
98
100
98
95
97
96
HUMANITIES
112
112
119
114
115
113
113
112
112
109
113
112
HISTORY & CULTURE
110
111
113
114
113
111
110
115
114
112
112
110
FOREIGN LANGUAGES
118
118
115
113
110
118
109
113
111
110
110
111
STUDIO/PERFORMING ARTS
104
102
103
102
102
101
101
102
102
101
103
100
COMMUNICATIONS
101
101
101
99
99
98
98
101
101
100
102
99
BUSINESS
89
90
91
90
90
91
90
93
92
91
93
92
EDUCATION
93
93
93
92
92
93
94
97
96
99
99
100
VOCATIONAL FIELDS
99
99
100
99
98
98
98
101
101
95
96
95
OTHER/MISSING/UNDECIDED
105
107
108
107
107
107
106
108
108
110
111
110
TOTAL OF
NON SCIENCE FIELDS
104
104
105
104
104
104
103
105
104
103
104
102
TOTAL OF ALL EXAMINEES
105
105
106
105
105
104
104
106
106
105
106
104
294
21. -B
?95
1
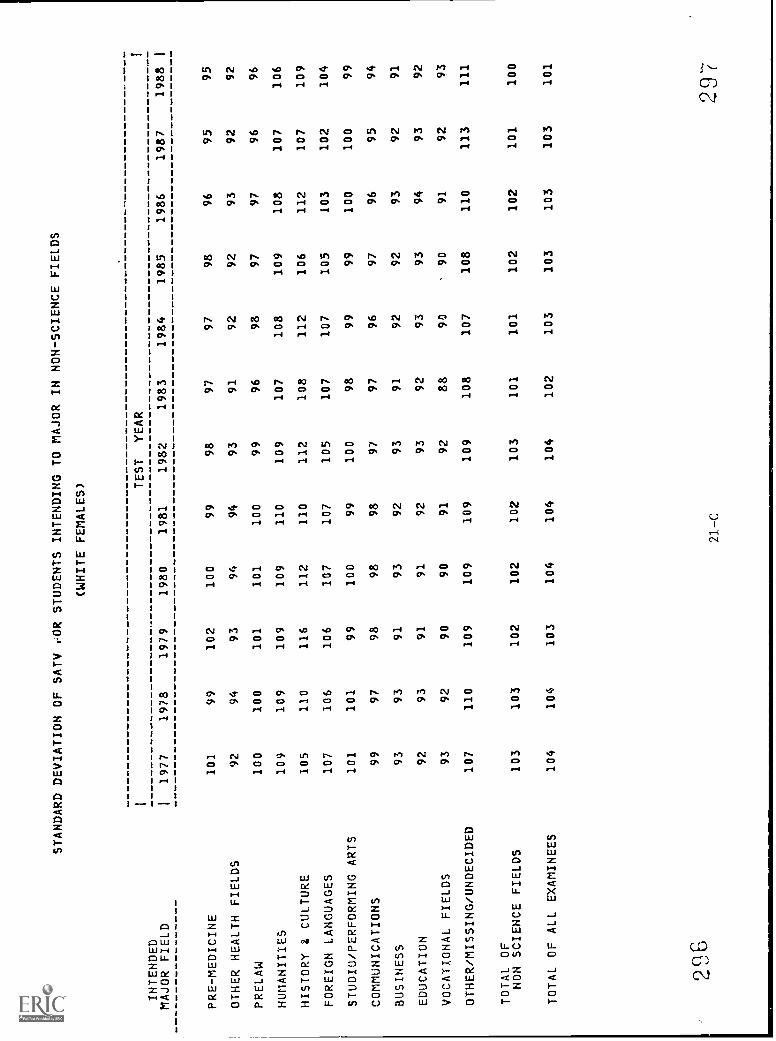
STANDARD DEVIATION OF SATV rOR STUDENTS INTENDING TO MAJOR IN NON-SCIENCE FIELDS
(WHITE FEMALES)
INTENDED
MAJOR FIELD
PRE-MEDICINE
OTHER HEALTH FIELDS
PRELAW
HUMANITIES
HISTORY & CULTURE
FOREIGN LANGUAGES
STUDIO/PERFORMING ARTS
COMMUNICATIONS
BUSINESS
EDUCATION
VOCATIONAL FIELDS
OTHER/MISSING/UNDECIDED
TOTAL OF
NON SCIENCE FIELDS
TOTAL OF ALL EXAMINEES
1 11977
101
92
100
109
105
107
101 99
93
92
93
107
103
104
1978 99 94
100
109
110
106
101
97
93
93
92
110
103
104
1979
102
93
101
109
116
106
99
98
91
91
90
109
102
103
1980
100 94
101
109
112
107
100 98
93 91
90
109
102
104
1981
99 94
100
110
110
107 99
98
92
92
91
109
102
104
TEST
YEAR
1982 98
93
99
109
112
105
100
97
93 93
92
109
103
104
1983
97
91 96
107
108
107 98
97 91
92
88
108
101
102
1984
97
92
98
108
112
107
99
96
92
93
90
107
101
103
1985 98
92
97
109
106
105
99
97
92 93
'90
108
102
103
1986 96
93
97
108
112
103
100 96 93
94
91
110
102
103
1987 95
92
96
107
107
102
100 95
92 93
92
113
101
103
1988 95
92 96
106
109
104 99
94
91
92
93
111
100
101
296
21-C
297
1
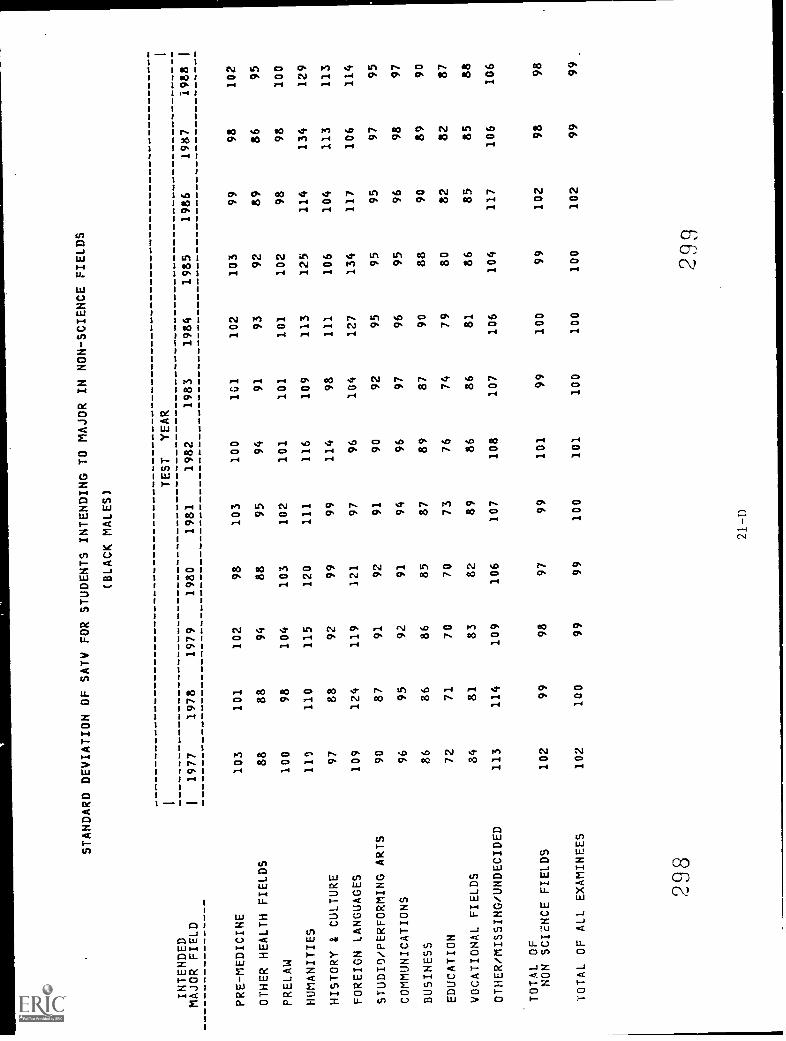
STANDARD DEVIATION OF SATV FOR STUDENTS INTENDING TO MAJOR
IN NON-SCIENCE FIELDS
(BLACK MALES)
INTENDED
1TEST
YEAR
1
MAJOR FIELD
I1977
1978
1979
1980
1981
1982
1983
1984
1985
1986
1987
1988
I
PRE-MEDICINE
103
101
102
98
103
100
101
102
103
99
98
102
OTHER HEALTH FIELDS
88
88
94
88
95
94
91
93
92
89
86
95
PRELAW
100
98
104
103
102
101
101
101
102
98
98
100
HUMANITIES
110
110
115
120
111
116
109
113
125
114
134
129
HISTORY & CULTURE
97
88
92
99
99
114
98
111
106
104
113
113
FOREIGN LANGUAGES
109
124
119
121
97
96
104
127
134
117
106
114
STUDIO/PERFORMING ARTS
90
87
91
92
91
90
92
95
95
95
97
95
COMMUNICATIONS
96
95
92
91
94
96
97
96
95
96
98
97
BUSINESS
86
86
86
85
87
89
87
90
88
90
89
90
EDUCATION
72
71
70
70
73
76
74
79
80
82
82
87
VOCATIONAL FIELDS
84
81
83
82
89
86
86
81
86
85
85
88
OTHER/MISSING/UNDECIDED
113
114
109
106
107
108
107
106
104
117
106
106
TOTAL OF
NON SCIENCE FIELDS
102
99
98
97
99
101
99
100
99
102
98
98
TOTAL OF ALL EXAMINEES
102
100
99
99
100
101
100
100
100
102
99
99
298
21-D
299

STANDARD DEVIATION OF SATV FOR STUDENTS INTENDING TO MAJOR
IN NON-SCIENCE FIELDS
(BLACK FEMALES) TEST
YEAR
INTENDED
MAJOR FIELD
I1977
1978
1979
1980
1981
1982
1983
1984
1985
1986
1987
1988
I
PRE-MEDICINE
101
100
100
100
100
102
99
97
100
98
98
99
OTHER HEALTH FIELDS
85
85
84
85
84
87
84
83
85
86
86
87
PRELAW
98
100
98
99
99
100
98
97
97
98
94
94
HUMANITIES
108
105
112
111
116
112
115
114
125
116
120
120
HISTORY & CULTURE
105
99
106
103
97
127
142
132
107
132
99
115
FOREIGN LANGUAGES
111
108
114
101
106
114
111
115
118
113
104
116
STUDIO/PERFORMING ARTS
92
88
86
91
89
93
90
92
93
93
94
97
COMMUNICATIONS
99
98
98
94
94
99
95
95
97
98
95
96
BUSINESS
81
80
79
80
81
86
85
84
86
87
86
86
EDUCATION
80
79
76
78
78
83
85
84
86
82
83
88
VOCATIONAL FIELDS
76
74
68
77
72
76
76
74
76
77
74
81
OTHER/MISSING/UNDECIDED
108
108
109
107
105
106
105
13
105
115
109
108
TOTAL OF
NON SCIENCE FIELDS
97
94
93
94
94
97
95
04
96
98
95
95
TOTAL OF ALL EXAMINEES
98
95
94
95
95
98
97
95
97
98
96
96
3(1,0
21-E
3111
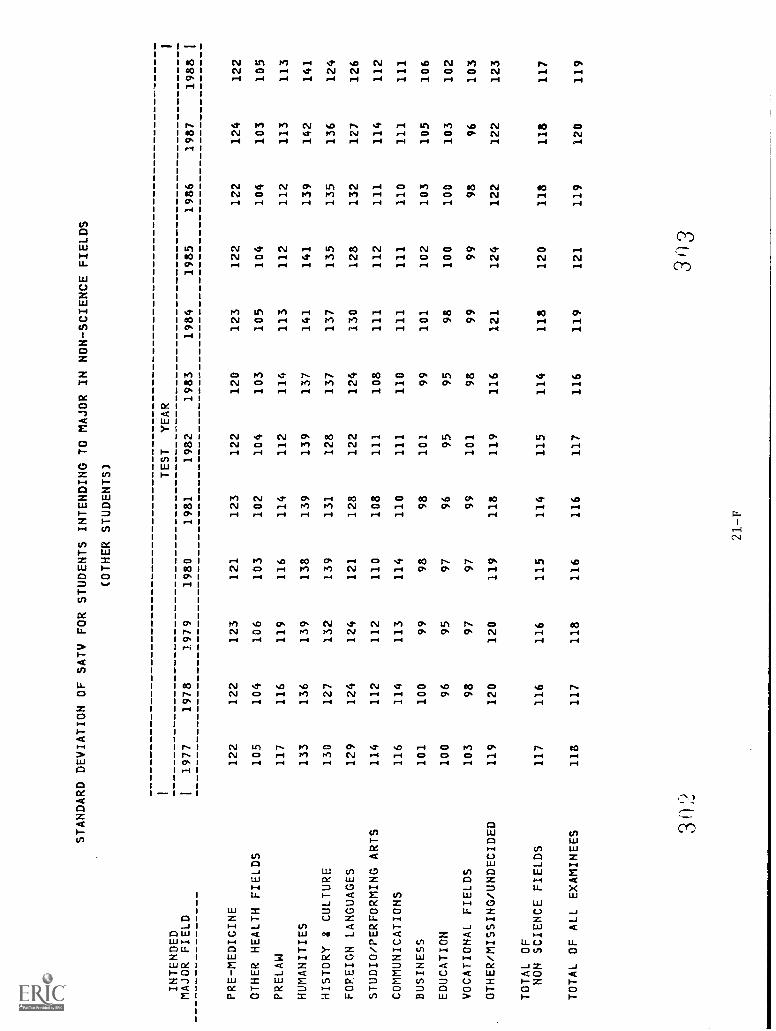
STANDARD DEVIATION OF SATV FOR STUDENTS INTENDING TO MAJOR IN NON-SCIENCE FIELDS
(OTHER STUDENTS)
1TEST
YEAR
INTENDED
MAJOR FIELD
11977
1978
1979
1980
1981
1982
1983
1984
1985
1986
PRE-MEDICINE
122
122
123
121
123
122
120
123
122
122
OTHER HEALTH FIELDS
105
104
106
103
102
104
103
105
104
104
PRELAW
117
116
119
116
114
112
114
113
112
112
HUMANITIES
133
136
139
138
139
139
137
141
141
139
HISTORY & CULTURE
130
127
132
139
131
128
137
137
135
135
FOREIGN LANGUAGES
129
124
124
121
128
122
124
130
128
132
STUDIO/PERFORMING ARTS
114
112
112
110
108
111
108
111
112
111
COMMUNICATIONS
116
114
113
114
110
111
110
111
111
110
BUSINESS
101
100
99
98
98
101
99
101
102
103
EDUCATION
100
96
95
97
96
95
95
98
100
100
VOCATIONAL FIELDS
103
98
97
97
99
101
98
99
99
98
OTHER/MISSING/UNDECIDED
119
120
120
119
118
119
116
121
124
122
TOTAL OF
NON SCIENCE FIELDS
117
116
116
115
114
115
114
118
120
118
TOTAL OF ALL EXAMINEES
118
117
118
116
116
117
116
119
121
119
1987
124
103
113
142
136
127
114
111
105
103
96
122
118
120
1988
122
105
113
141
124
126
112
111
106
102
103
123
117
119
1
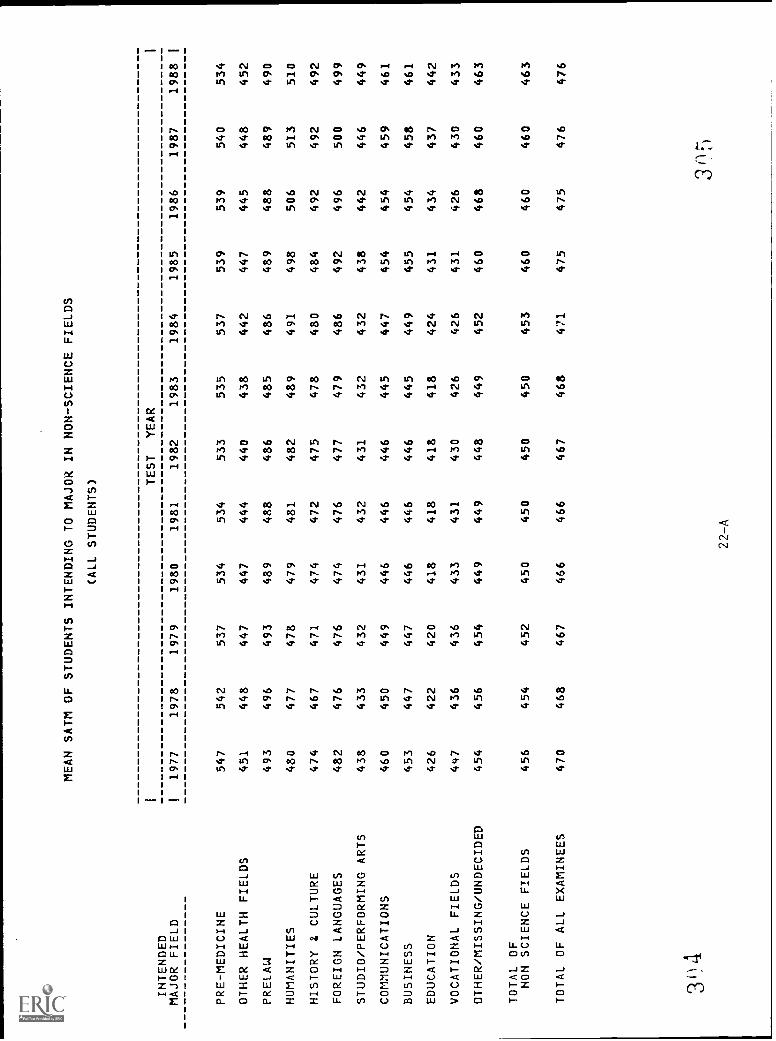
MEAN SATM OF STUDENTS INTENDING TO MAJOR IN NON-SCIENCE FIELDS
(ALL STUDENTS)
INTENDED
MAJOR FIELD
PRE-MEDICINE
OTHER HEALTH FIELDS
PRELAW
HUMANITIES
HISTORY 2,
CULTURE
FOREIGN LANGUAGES
STUDIO/PERFORMING ARTS
COMMUNICATIONS
BUSINESS
EDUCATION
VOCATIONAL FIELDS
OTHER/MISSING/UNDECIDED
TOTAL OF
NON SCIENCE FIELDS
TOTAL OF ALL EXAMINEES
11977
547
451
493
480
474
482
438
460
453
426
447
454
456
470
1978
542
448
496
477
467
476
433
450
447
422
436
456
454
468
1979
537
447
493
478
471
476
432
449
447
420
436
454
452
467
1980
534
447
489
479
474
474
431
446
446
418
433
449
450
466
1981
534
444
488
481
472
476
432
446
446
418
431
449
450
466
TEST 1982
533
440
486
482
475
477
431
446
446
418
430
448
450
467
YEAR
1983
535
438
485
489
478
479
432
445
445
418
426
449
450
468
1984
537
442
486
491
480
486
432
447
449
424
426
452
453
471
1985
539
447
489
498
484
492
438
454
455
431
431
460
460
475
1986
539
445
488
506
492
496
442
454
454
434
426
468
460
475
1987
540
448
489
513
492
500
446
459
458
437
430
460
460
476
1988
534
452
490
510
492
499
449
461
461
442
433
463
463
476
3f t4
22-A
3 n.
,-;
1
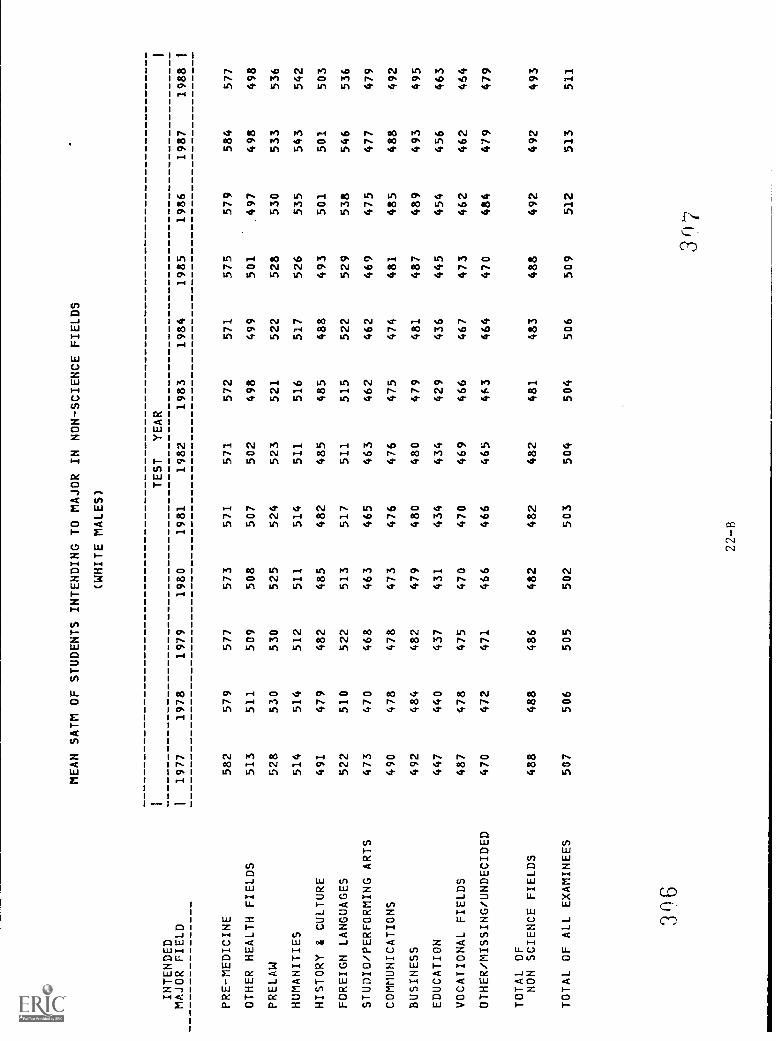
MEAN SATM OF STUDENTS INTENDING TO MAJOR IN NON-SCIENCE FIELDS
(WHITE MALES)
INTENDED
MAJOR FIELD
PRE-MEDICINE
OTHER HEALTH FIELDS
PRELAW
HUMANITIES
HISTORY & CULTURE
FOREIGN LANGUAGES
STUDIO/PERFORMING ARTS
COMMUNICATIONS
BUSINESS
EDUCATION
VOCATIONAL FIELDS
OTHER/MISSING/UNDECIDED
TOTAL OF
NON SCIENCE FIELDS
TOTAL OF ALL EXAMINEES
1 11977
582
513
528
514
491
522
473
490
492
447
487
470
488
507
1978
579
511
530
514
479
510
470
478
484
440
478
472
488
506
1979
577
509
530
512
482
522
468
478
482
437
475
471
486
505
1980
573
508
525
511
485
513
463
473
479
431
470
466
482
502
1981
571
507
524
514
482
517
465
476
480
434
470
466
482
503
TEST 1982
571
502
523
511
485
511
463
476
480
434
469
465
482
504
YEAR
1983
572
498
521
516
485
515
462
475
479
429
466
4F3
481
504
1984
571
499
522
517
488
522
462
474
481
436
467
464
483
506
1985
575
501
528
526
493
529
469
481
487
445
473
470
488
509
1986
579
.497
530
535
501
538
475
485
489
454
462
484
492
512
1987
584
498
533
543
501
546
477
488
493
456
462
479
492
513
1
1988
I
577
498
536
542
503
536
479
492
495
463
464
479
493
511
306
22-B
307

MEAN SATM OF STUDENTS INTENDING TO MAJOR IN NON-SCIENCE FIELDS
(WHITE FEMALES)
!NTENDED
MAJOR FIELD
PRE-MEDICINE
OTHER HEALTH FIELDS
PRELAW
HUMANITIES
HISTORY & CULTURE
FOREIGN LANGUAGES
STUDIO/PERFORMING ARTS
COMMUNICATIONS
BUSINESS
EDUCATION
VOCATIONAL FIELDS
OTHER/MISSING/UNDECIDED
TOTAL OF
NON SCIENCE FIELDS
TOTAL OF ALL EXAMINEES
11977
542
451
491
473
473
487
442
463
443
439
434
453
453
461
1978
542
450
490
472
476
485
438
458
442
436
424
456
452
460
1979
535
448
485
475
475
482
435
455
442
432
424
453
450
458
1980
535
449
483
475
478
480
435
452
444
430
423
450
449
458
1981
533
445
484
474
480
481
434
453
443
428
419
450
448
458
TEST
YEAR
1982
529
442
481
478
478
482
432
451
443
428
417
449
447
458
1983
532
440
480
484
484
485
433
448
442
427
415
450
448
459
1984
535
445
483
488
486
491
433
452
446
433
416
450
451
462
1985
535
450
485
492
491
498
439
460
452
439
415
456
456
466
1986
536
447
484
496
495
500
440
458
450
440
408
470
458
465
1987
537
449
487
504
491
504
443
464
451
443
412
465
458
466
1988
536
454
489
502
490
505
446
466
455
446
418
467
460
468
3)8
22-C
3'19
I
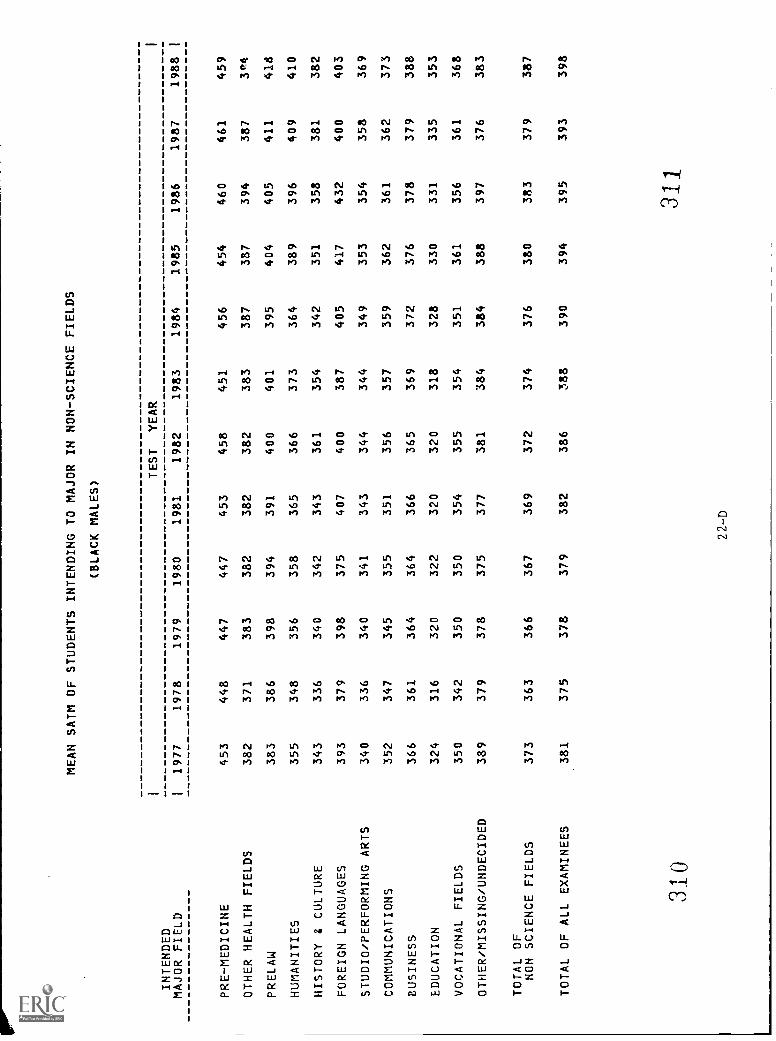
MEAN SATM OF STUDENTS INTENDING TO MAJOR IN NON-SCIENCE FIELDS
(BLACK MALES)
INTENDED
MAJOR FIELD
PRE-MEDICINE
OTHER HEALTH FIELDS
PRELAW
HUMANITIES
HISTORY & CULTURE
FOREIGN LANGUAGES
STUDIO/PERFORMING ARTS
COMMUNICATIONS
BUSINESS
EDUCATION
VOCATIONAL FIELDS
OTHER/MISSING/UNDECIDED
TOTAL OF
NON SCIENCE FIELDS
TOTAL OF ALL EXAMINEES
1 11977
453
382
383
355
343
393
340
352
366
324
350
389
373
381
1978
448
371
386
348
336
379
336
347
361
316
342
379
363
375
1979
447
383
398
356
340
398
340
345
364
320
350
378
366
378
1980
447
382
394
358
342
375
341
355
364
322
350
375
367
379
1981
453
382
391
365
343
407
343
351
366
320
354
377
369
382
TEST
YEAR
1982
458
382
400
366
361
400
344
356
365
320
355
381
372
386
1983
451
383
401
373
354
387
344
357
369
318
354
384
374
388
1984
456
387
395
364
342
405
349
359
372
328
351
384
376
390
1985
454
387
404
389
351
417
353
362
376
330
361
388
380
394
1986
460
394
405
396
358
432
354
361
378
331
356
397
383
395
1987
461
387
411
409
381
400
358
362
379
335
361
376
379
393
1
1988
1
459
3P.4
418
410
382
403
369
373
388
353
368
383
387
398
3 _0
22-D
311
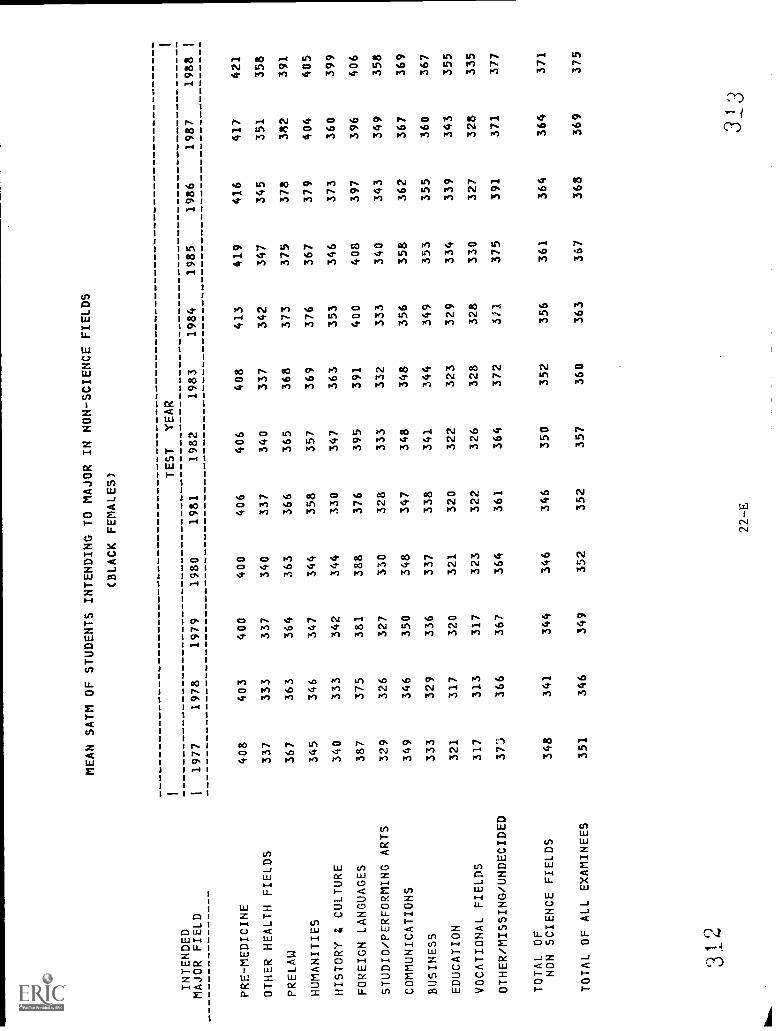
MEAN SATM OF STUDENTS INTENDING TO MAJOR IN NON-SCIENCEFIELDS
(BLACK FEMALES)
INTENDED
TEST
YEAR
MAJOR FIELD
I1977
1978
1979
1980
1981
1982
1983
1984
1985
1986
1987
1988
PRE-MEDICINE
408
403
400
400
406
406
408
413
419
416
417
421
OTHER HEALTH FIELDS
337
333
337
340
337
340
337
342
347
345
351
358
PRELAW
367
363
364
363
366
365
368
373
375
378
382
391
HUMANITIES
345
346
347
344
358
357
369
376
367
379
404
405
HISTORY & CULTURE
340
333
342
344
330
347
363
353
346
373
360
399
FOREIGN LANGUAGES
387
375
381
388
376
395
391
400
408
397
396
406
STUDIO/PERFORMING ARTS
329
326
327
330
328
333
332
333
340
343
349
358
COMMUNICATIONS
349
346
350
348
347
348
348
356
358
362
367
369
BUSINESS
333
329
336
337
338
341
344
349
353
355
360
367
EDUCATION
321
317
320
321
320
322
323
329
334
339
343
355
VOCATIONAL FIELDS
317
313
317
323
322
326
328
328
330
327
328
335
OTHER/MISSING/UNDECIDED
373
366
367
364
361
364
372
3/1
375
391
371
377
TOTAL OF
NON SCIENCE FIELDS
348
341
344
346
346
350
352
356
361
364
364
371
TOTAL OF ALL EXAMINEES
351
346
349
352
352
357
360
363
367
368
369
375
312
22-E
313
I
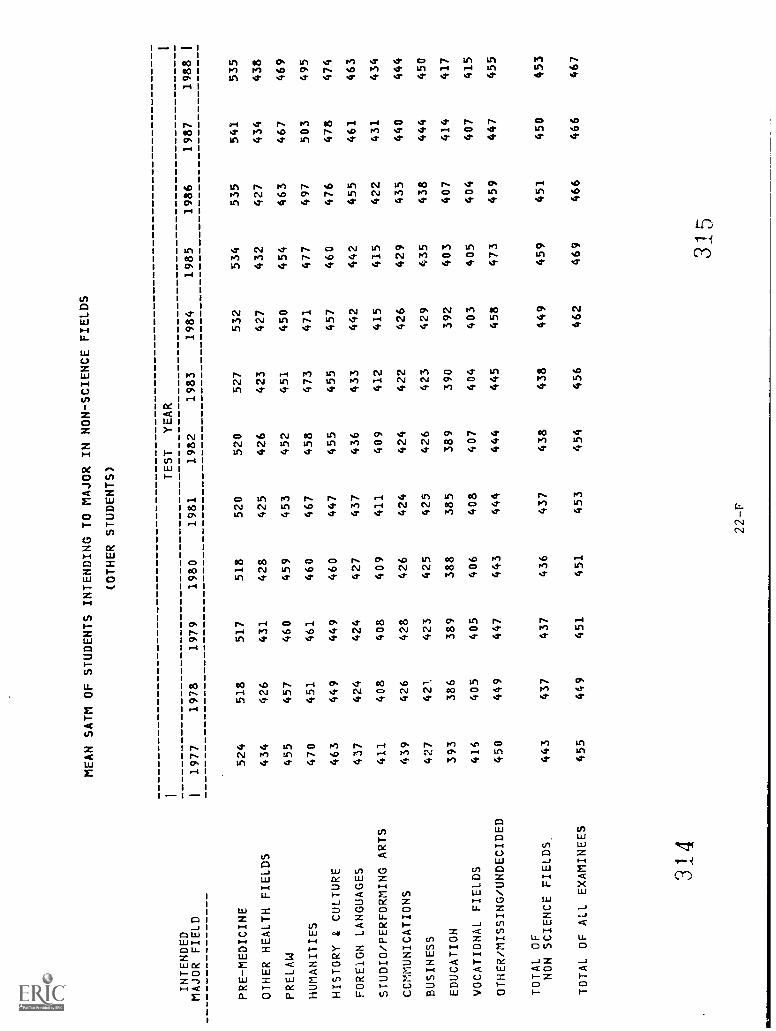
MEAN SATM OF STUDENTS INTENDING TO MAJOR IN NON-SCIENCE
FIELDS
(OTHER STUDENTS)
INTENDED
TEST
YEAR
MAJOR FIELD
I1977
1978
1979
1980
1981
1982
1983
1984
1985
1986
1987
1988
PRE-MEDICINE
524
518
517
518
520
520
527
532
534
535
541
535
OTHER HEALTH FIELDS
434
426
431
428
425
426
423
427
432
427
434
438
PRELAW
455
457
460
459
453
452
451
450
454
463
467
469
HUMANITIES
470
451
461
460
467
458
473
471
477
497
503
495
HISTORY & CULTURE
463
449
449
460
447
455
455
457
460
476
478
474
FOREIGN LANGUAGES
437
424
424
427
437
436
433
442
442
455
461
463
STUDIO/PERFORMING ARTS
411
408
408
409
411
409
412
415
415
422
431
434
COMMUNICATIONS
439
426
428
426
424
424
422
426
429
435
440
444
BUSINESS
427
421.
423
425
425
426
423
429
435
438
444
450
EDUCATION
393
386
389
388
385
389
390
392
403
407
414
417
VOCATIONAL FIELDS
416
405
405
406
408
407
404
403
405
404
407
415
OTHER/MISSING/UNDECIDED
450
449
447
443
444
444
445
458
473
459
447
455
TOTAL OF
NON SCIENCE FIELDS.
443
437
437
436
437
438
438
449
459
451
450
453
TOTAL OF ALL EXAMINEES
455
449
451
451
453
454
456
462
469
466
466
467
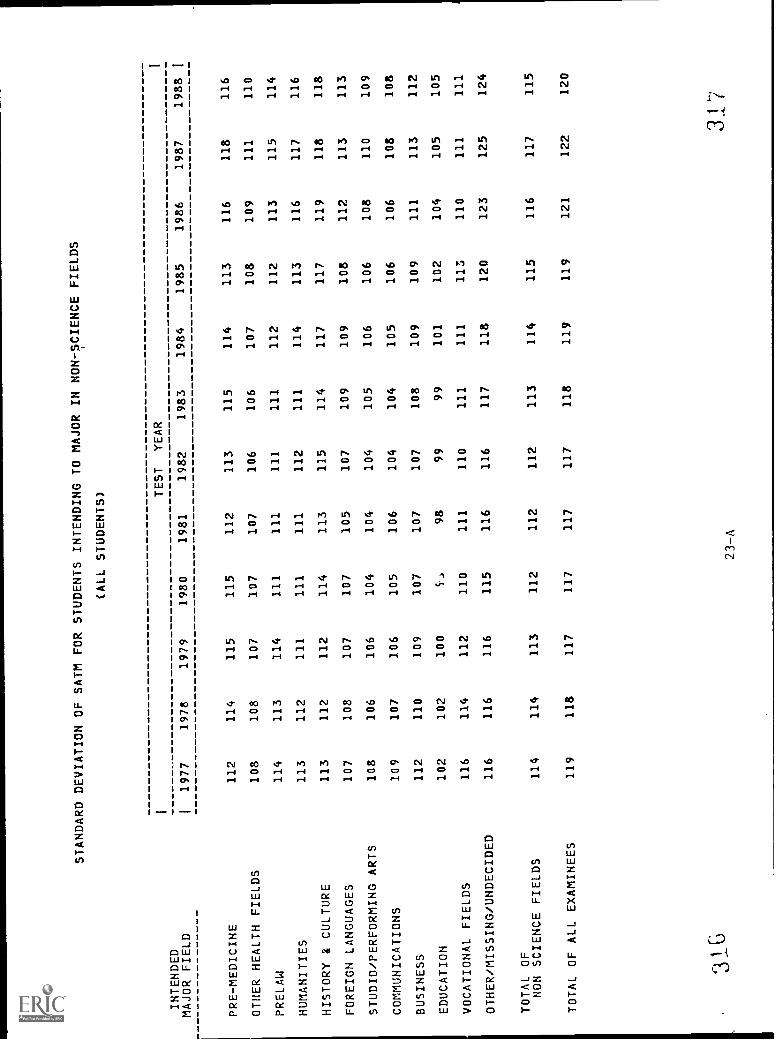
STANDARD DEVIATION OF SATM FOR STUDENTS INTENDING TO MAJOR IN NON-SCIENCE
FIELDS
(ALL STUDENTS)
INTENDED
TEST
YEAR
MAJOR FIELD
I1977
1978
1979
1980
1981
1982
1983
1984
1985
1986
1987
1988
PRE-MEDICINE
112
114
115
115
112
113
115
114
113
116
118
116
OTHER HEALTH FIELDS
108
108
107
107
107
106
106
107
108
109
111
110
PRELAW
114
113
114
111
111
111
111
112
112
113
115
114
HUMANITIES
113
112
111
111
111
112
111
114
113
116
117
116
HISTORY 8 CULTURE
113
112
112
114
113
115
114
117
117
119
118
118
FOREIGN LANGUAGES
107
108
107
107
105
107
109
109
108
112
113
113
STUDIO/PERFORMING ARTS
108
106
106
104
104
104
105
106
106
108
110
109
COMMUNICATIONS
109
107
106
105
106
104
104
105
106
106
108
108
BUSINESS
112
110
109
107
107
107
108
109
109
111
113
112
EDUCATION
102
102
100
4_)
98
99
99
101
102
104
105
105
VOCATIONAL FIELDS
116
114
112
110
111
110
111
111
113
110
111
111
OTHER/MISSING/UNDECIDED
116
116
116
115
116
116
117
118
120
123
125
124
TOTAL OF
NON SCIENCE FIELDS
114
114
113
112
112
112
113
114
115
116
117
115
TOTAL OF ALL EXAMINEES
119
118
117
117
117
117
118
119
119
121
122
120
23-A
317
I

STANDARD DEVIATION OF SATM FOR STUDENTS INTENDING TO MAJOR IN NON-SCIENCE
FIELDS
(WHITE MALES)
INTENDED
TEST
YEAR
MAJOR FIELD
I1977
1978
1979
1980
1981
1982
1983
1984
1985
1986
1987
1988
ORE-MEDICINE
99
101
102
101
99
101
102
102
101
101
103
101
OTHER HEALTH FIELDS
104
105
104
105
105
104
106
105
105
105
108
107
PRELAW
107
106
106
105
104
104
107
107
106
106
108
107
HUMANITIES
114
111
114
112
112
111
111
115
112
117
117
116
HISTORY & CULTURE
111
110
111
112
111
116
113
116
116
117
117
117
FOREIGN LANGUAGES
113
113
114
114
111
115
113
114
110
116
116
113
STUDIO/PERFORMING ARTS
110
108
108
107
107
107
108
108
108
111
113
112
COMMUNICATIONS
107
105
105
103
105
103
105
106
106
108
111
109
BUSINESS
106
105
105
103
104
104
105
106
106
108
111
109
EDUCATION
104
103
102
98
100
102
101
104
106
111
112
113
VOCATIONAL FIELDS
112
111
110
108
108
111
110
112
108
109
109
OTHER/MISSING/UNDECIDED
115
114
114
113
114
115
115
116
117
120
122
121
TOTAL OF
NON SCIENCE FIELDS
114
112
112
111
111
112
113
113
113
115
116
114
TOTAL OF ALL EXAMINEES
117
116
116
115
114
115
117
117
117
119
120
118
318
319
I
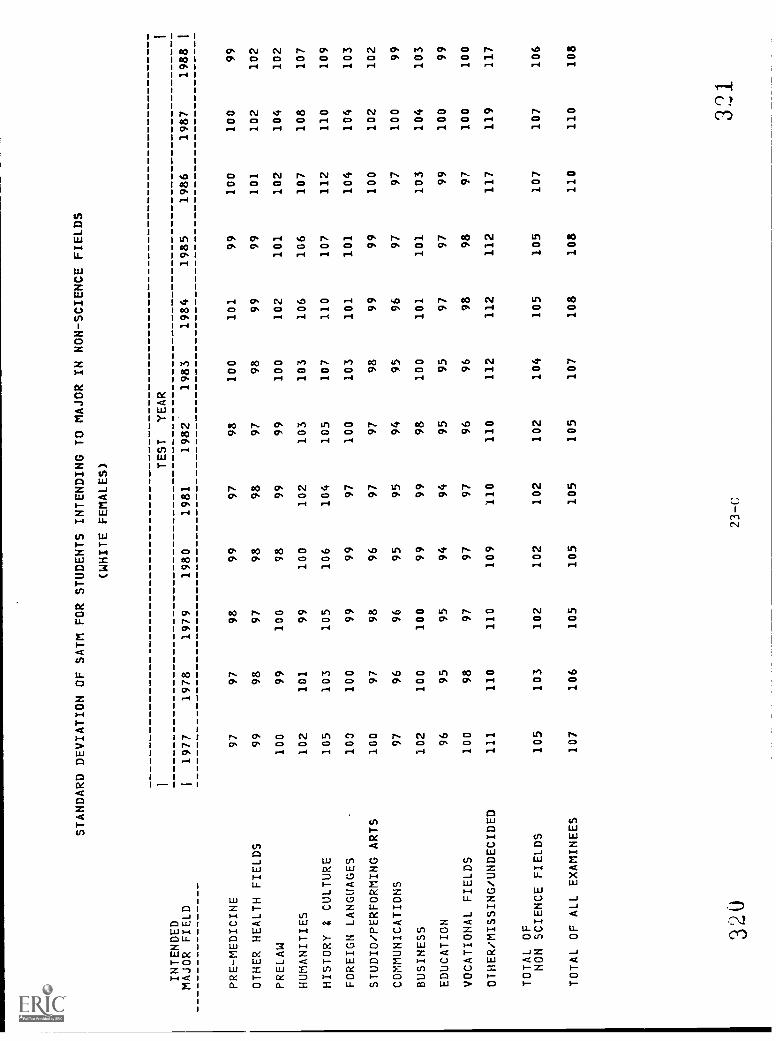
STANDARD DEVIATION OF SATM FOR STUDENTS INTENDING TO MAJOR IN NON-SCIENCE FIELDS
(WHITE FEMALES)
INTENDED
MAJOR FIELD
PRE-MEDICINE
OTHER HEALTH FIELDS
PRELAW
HUMANITIES
HISTORY & CULTURE
FOREIGN LANGUAGES
STUDIO/PERFORMING ARTS
COMMUNICATIONS
BUSINESS
EDUCATION
VOCATIONAL FIELDS
OTHER/MISSING/UNDECIDED
TOTAL OF
NON SCIENCE FIELDS
TOTAL OF ALL EXAMINEES
11977 97
99
100
102
105
100
100 97
102
96
100
111
105
107
1978
97
98
99
101
103
100 97
96
100 95
98
110
103
106
1979 98
97
100 99
105 99
98
96
100 95
97
110
102
105
1980 99
98 98
100
106
99 96
95
99
94
97
109
102
105
1981 97 98
99
102
104 97
97
95
99
94 97
110
102
105
TEST
YEAR
1982 98
97
99
103
105
100
97
94
98
95 96
110
102
105
1983
100
98
100
103
107
103
98 95
100 95
96
112
104
107
1984
101 99
102
106
110
101
99
96
101 97
98
112
105
108
1985
99
99
101
106
107
101
99
97
101 97
98
112
105
108
1986
100
101
102
107
112
104
100
97
103
99
97
117
107
110
1987
100
102
104
108
110
104
102
100
104
100
100
119
107
110
1
1988
1
99
102
102
107
109
103
102
99
103
99
100
117
106
108
32U
23-C
321

STANDARD DEVIATION OF SATM FOR STUDENTS INTENDING TO MAJOR IN NON-SCIENCE FIELDS
(BLACK MALES)
ITEST
YEAR
INTENDED
I
MAJOR FIELD
I1977
1978
1979
1980
1981
1982
1983
1984
1985
1986
1987
1988
I
PRE-MEDICINE
106
106
107
104
108
106
107
105
110
111
113
108
OTHER HEALTH FIELDS
96
94
97
95
100
99
101
99
102
98
95
99
PRELAW
93
95
98
94
99
96
97
97
101
97
100
100
HUMANITIES
91
91
96
97
97
96
87
96
111
101
114
121
HISTORY & CULTURE
82
76
78
88
95
90
84
78
96
87
101
115
FOREIGN LANGUAGES
94
97
107
108
99
101
99
96
102
115
102
113
STUDIO/PERFORMING ARTS
79
80
81
79
84
80
81
86
88
90
92
93
COMMUNICATIONS
85
83
80
84
85
86
84
86
85
89
92
91
BUSINESS
88
92
89
88
91
91
90
93
93
93
96
96
EDUCATION
68
70
69
69
73
69
69
79
80
76
86
90
VOCATIONAL FIELDS
84
83
85
81
91
87
86
86
91
87
92
92
OTHER/MISSING/UNDECIDED
114
114
109
107
110
109
110
111
112
122
111
111
TOTAL OF
NON SCIENCE FIELDS
101
99
97
96
100
99
99
101
102
104
102
101
TOTAL OF ALL EXAMINEES
103
104
101
100
104
104
104
105
106
108
108
106
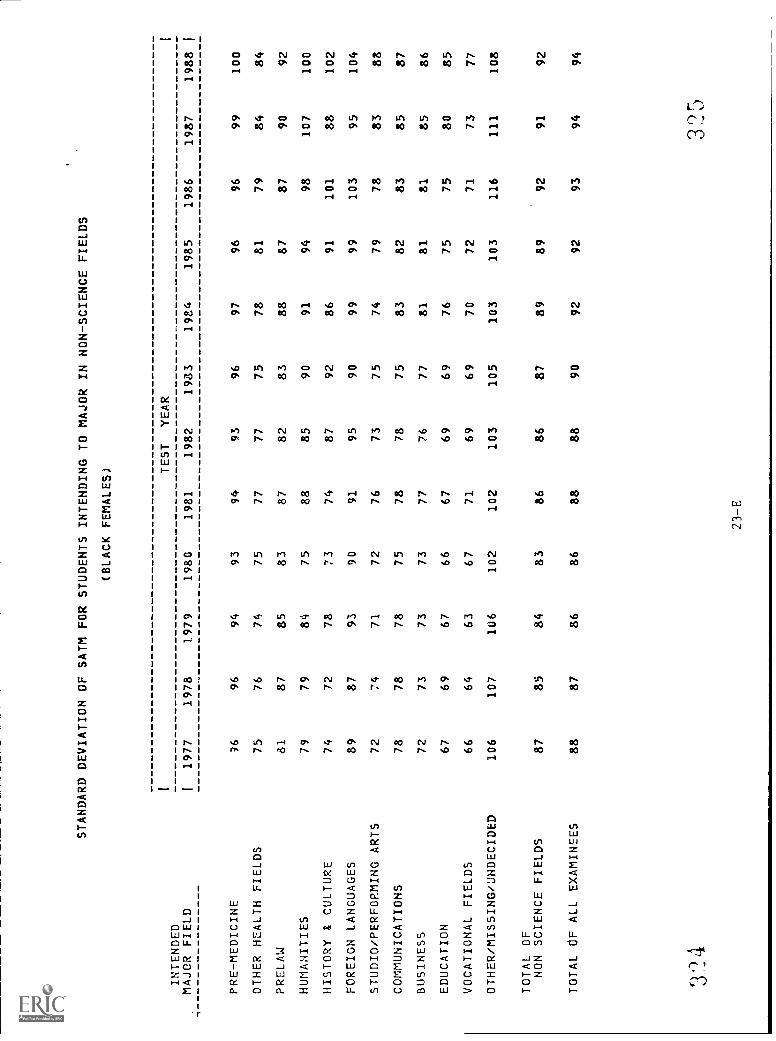
STANDARD DEVIATION OF SATM FOR STUDENTS INTENDING TO MAJOR IN NON-SCIENCE FIELDS
(BLACK FEMALES)
INTENDED
ITEST
YEAR
1
MAJOR FIELD
I1977
1978
1979
1980
1981
1982
1933
1984
1985
1986
1987
1988
I
PRE-MEDICINE
36
96
94
93
94
93
96
97
96
96
99
100
OTHER HEALTH FIELDS
75
76
74
75
77
77
75
78
81
79
84
84
PRELAW
81
87
85
83
87
82
83
88
87
87
90
92
HUMANITIES
79
79
84
75
88
85
90
91
94
98
107
100
HISTORY 8 CULTURE
74
72
78
73
74
87
92
86
91
101
88
102
FOREIGN LANGUAGES
89
87
93
90
91
95
90
99
99
103
95
104
STUDIO/PERFORMING ARTS
72
74
71
72
76
73
75
74
79
78
83
88
COMMUNICATIONS
78
78
78
75
78
78
75
83
82
83
85
87
BUSINESS
72
73
73
73
77
76
77
81
81
81
85
86
EDUCATION
67
69
67
66
67
69
69
76
75
75
80
85
VOCATIONAL FIELDS
66
64
63
67
71
69
69
70
72
71
73
77
OTHER/MISSING/UNDECIDED
106
107
106
102
102
103
105
103
103
116
111
108
TOTAL OF
NON SCIENCE FIELDS
87
85
84
83
86
86
87
89
89
92
91
92
TOTAL OF ALL EXAMINEES
88
87
86
86
88
88
90
92
92
93
94
94
3''
43
2
23-F,
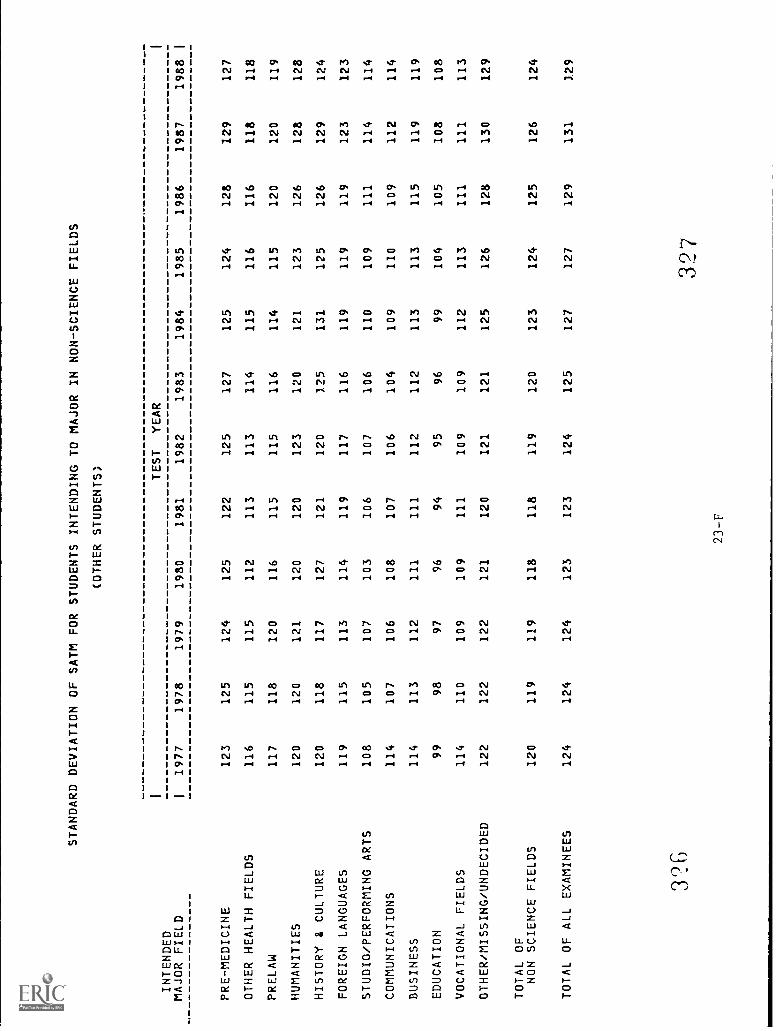
STANDARD DEVIATION OF SATM FOR STUDENTS INTENDING TO MAJOR IN NON-SCIENCE FIELDS
(OTHER STUDENTS;
INTENDED
MAJOR FIELD
PRE-MEDICINE
OTHER HEALTH FIELDS
PRELAW
HUMANITIES
HISTORY & CULTURE
FOREIGN LANGUAGES
STUDIO/PERFORMING ARTS
COMMUNICATIONS
BUSINESS
EDUCATION
VOCATIONAL FIELDS
OTHER/MISSING/UNDECIDED
TOTAL OF
NON SCIENCE FIELDS
TOTAL OF ALL EXAMINEES
I 11977
123
116
117
120
120
119
108
114
114 99
114
122
120
124
1978
125
115
118
120
118
115
105
107
113
98
110
122
119
124
1979
124
115
120
121
117
113
107
106
112
97
109
122
119
124
1980
125
112
116
120
127
114
103
108
111
96
109
121
118
123
1981
122
113
115
120
121
119
106
107
111
94
111
120
118
123
TEST 1982
125
113
115
123
120
117
107
106
112
95
109
121
119
124
YEAR
1983
127
114
116
120
125
116
106
104
112
96
109
121
120
125
1984
125
115
114
121
131
119
110
109
113
99
112
125
123
127
1985
124
116
115
123
125
119
109
110
113
104
113
126
124
127
1986
128
116
120
126
126
119
111
109
115
105
111
128
125
129
1987
129
118
120
128
129
123
114
112
119
108
111
130
126
131
1988
127
118
119
128
124
123
114
114
119
108
113
129
124
129
1
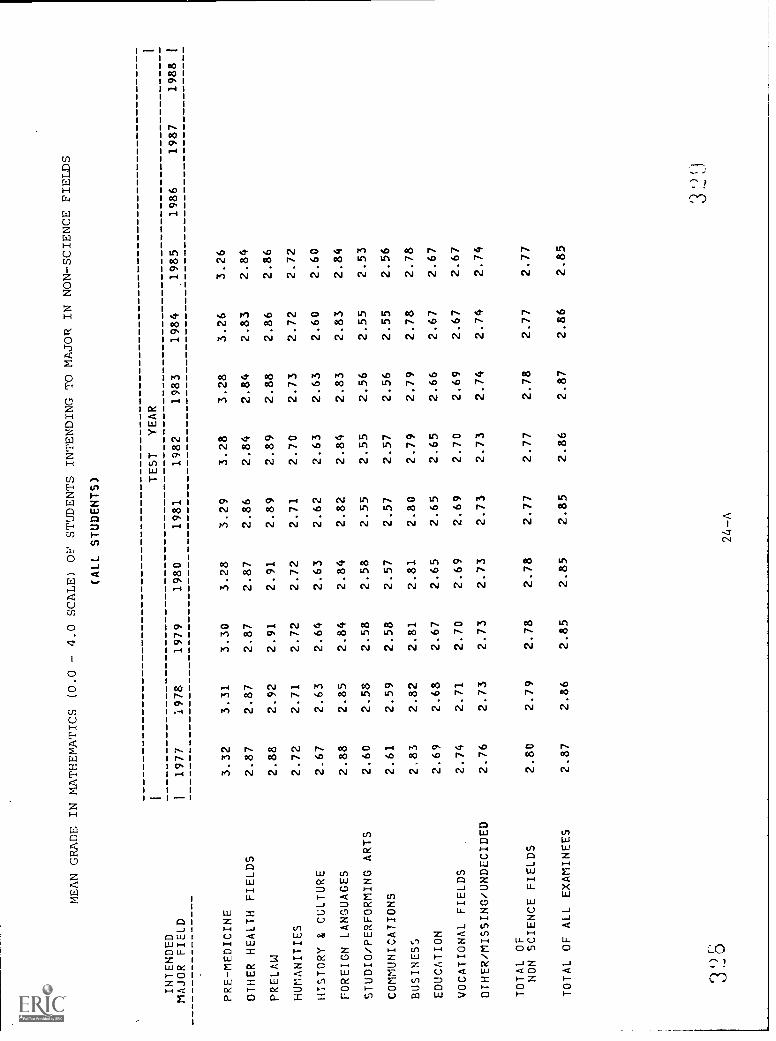
MEAN GRADE IN MATHEMATICS (0.0 - 4.0 SCALE) OF STUDENTS
INTENDING TO MAJOR IN NON-SCIENCE FIELDS
INTENDED
MAJOR FIELD
PRE-MEDICINE
OTHER HEALTH FIELDS
PRELAW
HUMANITIES
HISTORY 8 CULTURE
FOREIGN LANGUAGES
STUDIO/PERFORMING ARTS
COMMUNICATIONS
BUSINESS
EDUCATION
VOCATIONAL FIELDS
OTHER/MISSING/UNDECIDED
TOTAL OF
NON SCIENCE FIELDS
TOTAL OF ALL EXAMINEES
1977
3.32
2.87
2.88
2.72
2.67
2.88
2.60
2.61
2.83
2.69
2.74
2.76
2.80
2.87
1978
3.31
2.87
2.92
2.71
2.63
2.85
2.58
2.59
2.82
2.68
2.71
2.73
2.79
2.86
1979
3.30
2.87
2.91
2.72
2.64
2.84
2.58
2.58
2.81
2.67
2.70
2.73
2.78
2.85
(ALL
1980
3.28
2.87
2.91
2.72
2.63
2.84
2.58
2.57
2.81
2.65
2.69
2.73
2.78
2.85
STUDENTS) TEST
YEAR
1981
1982
3.29
3.28
2.86
2.84
2.89
2.89
2.71
2.70
2.62
2.63
2.82
2.84
2.55
2.55
2.57
2.57
2.80
2.79
2.65
2.65
2.69
2.70
2.73
2.73
2.77
2.77
2.85
2.86
1983
3.28
2.84
2.88
2.73
2.63
2.83
2.56
2.56
2.79
2.66
2.69
2.74
2.78
2.87
1984
3.26
2.83
2.86
2.72
2.60
2.83
2.55
2.55
2.78
2.67
2.67
2.74
2.77
2.86
1985
3.26
2.84
2.86
2.72
2.60
2.84
2.53
2.56
2.78
2.67
2.67
2.74
2.77
2.85
1986
1987
3,)(
24 -A
1988
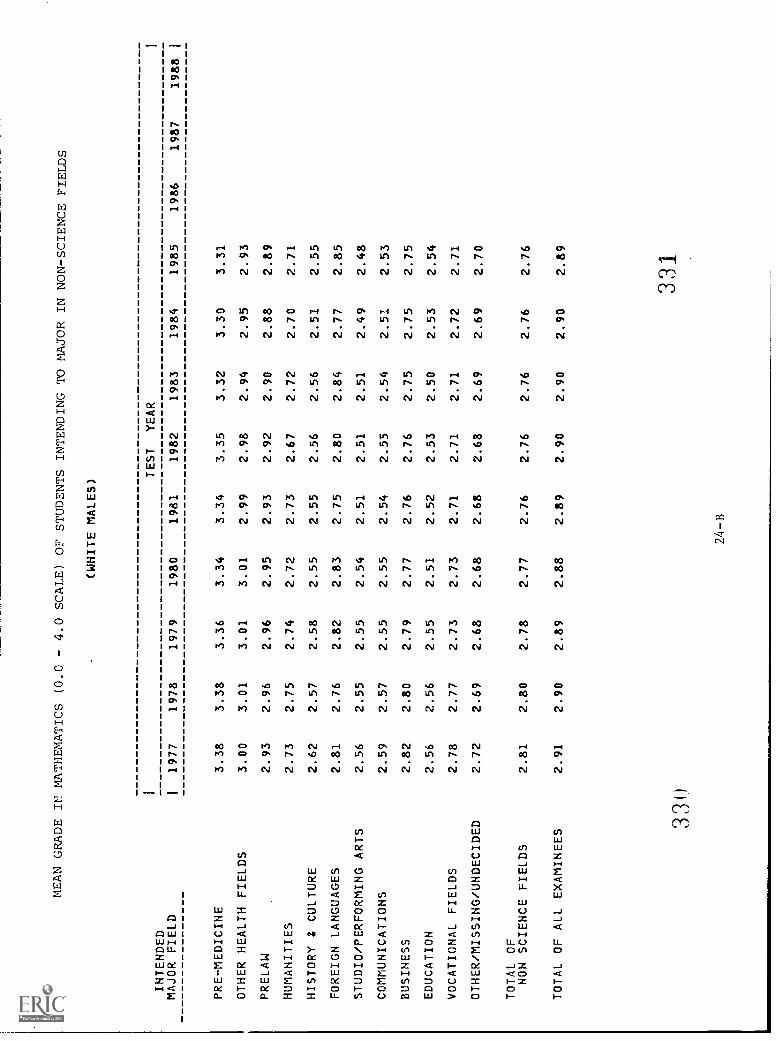
MEAN GRADE
INTENDED
MAJOR FIELD
PRE-MEDICINE
OTHER HEALTH FIELDS
PRELAW
HUMANITIES
HISTORY & CULTURE
FOREIGN LANGUAGES
STUDIO/PERFORMING ARTS
COMMUNICATIONS
BUSINESS
EDUCATION
VOCATIONAL FIELDS
OTHER/MISSING/UNDECIDED
TOTAL OF
NON SCIENCE FIELDS
TOTAL OF ALL EXAMINEES
IN MATHEMATICS (0.0
I 11977
1978
3.38
3.38
3.00
3.01
2.93
2.96
2.73
2.75
2.62
2.57
2.81
2.76
2.56
2.55
2.59
2.57
2.82
2.80
2.56
2.56
2.78
2.77
2.72
2.69
2.81
2.80
2.91
2.90
- 4.0
1979
3.36
3.01
2.96
2.74
2.58
2.82
2.55
2.55
2.79
2.55
2.73
2.68
2.78
2.89
SCALE) OF STUDENTS INTENDING TO MAJOR IN NON-SCIENCEFIELDS
(WHITE MALES)
TEST
YEAR
1980
1981
1982
1983
1984
1985
1986
3.34
3.34
3.35
3.32
3.30
3.31
3.01
2.99
2.98
2.94
2.95
2.93
2.95
2.93
2.92
2.90
2.88
2.89
2.72
2.73
2.67
2.72
2.70
2.71
2.55
2.55
2.56
2.56
2.51
2.55
2.83
2.75
2.80
2.84
2.77
2.85
2.54
2.51
2.51
2.51
2.49
2.48
2.55
2.54
2.55
2.54
2.51
2.53
2.77
2.76
2.76
2.75
2.75
2.75
2.51
2.52
2.53
2.50
2.53
2.54
2.73
2.71
2.71
2.71
2.72
2.71
2.68
2.68
2.68
2.69
2.69
2.70
2.77
2.76
2.76
2.76
2.76
2.76
2.88
2.89
2.90
2.90
2.90
2.89
1987
1
1988
1
33l
24-B
331
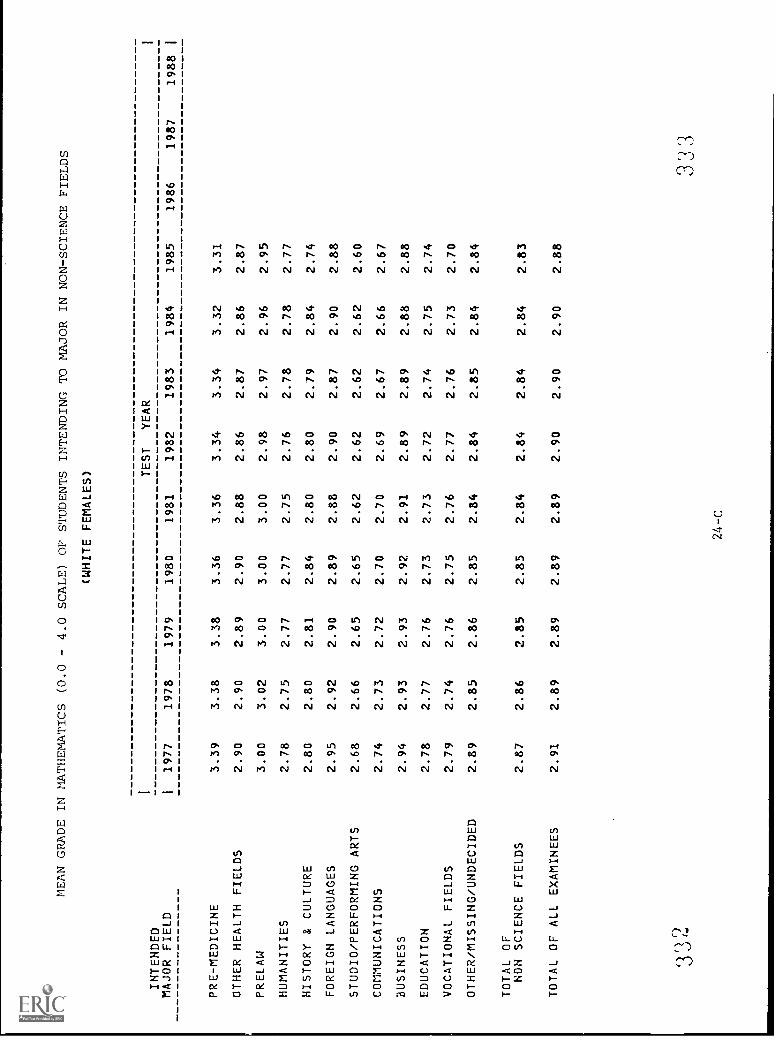
MEAN GRADE
INTENDED
MAJOR FIELD
PRE-MEDICINE
OTHER HEALTH FIELDS
PRELAW
HUMANITIES
HISTORY & CULTURE
FOREIGN LANGUAGES
STUDIO/PERFORMING ARTS
COMMUNICATIONS
BUSINESS
EDUCATION
VOCATIONAL FIELDS
OTHER/MISSING/UNDECIDED
TOTAL OF
NON SCIENCE FIELDS
TOTAL OF ALL EXAMINEES
IN MATHEMATICS (0.0
I 11977
1978
3.39
3.38
2.90
2.90
3.00
3.02
2.78
2.75
2.80
2.80
2.95
2.92
2.68
2.66
2.74
2.73
2.94
2.93
2.78
2.77
2.79
2.74
2.89
2.85
2.87
2.86
2.91
2.89
- 4.0
1979
3.38
2.89
3.00
2.77
2.81
2.90
2.65
2.72
2.93
2.76
2.76
2.86
2.85
2.89
SCALE) OF STUDENTS INTENDING TO MAJOR IN NON-SCIENCE FIELDS
(WHITE FEMALES) TEST
YEAR
1980
1981
1982
1983
1984
1985
1986
3.36
3.36
3.34
3.34
3.32
3.31
2.90
2.88
2.86
2.87
2.86
2.87
3.00
3.00
2.98
2.97
2.96
2.95
2.77
2.75
2.76
2.78
2.78
2.77
2.84
2.80
2.80
2.79
2.84
2.74
2.89
2.88
2.90
2.87
2.90
2.88
2.65
2.62
2.62
2.62
2.62
2.60
2.70
2.70
2.69
2.67
2.66
2.67
2.92
2.91
2.89
2.89
2.88
2.88
2.73
2.73
2.72
2.74
2.75
2.74
2.75
2.76
2.77
2.76
2.73
2.70
2.85
2.84
2.84
2.85
2.84
2.84
2.85
2.84
2.84
2.84
2.84
2.83
2.89
2.89
2.90
2.90
2.90
2.88
1987
3,32
3 ',3
:1
24-C
1988
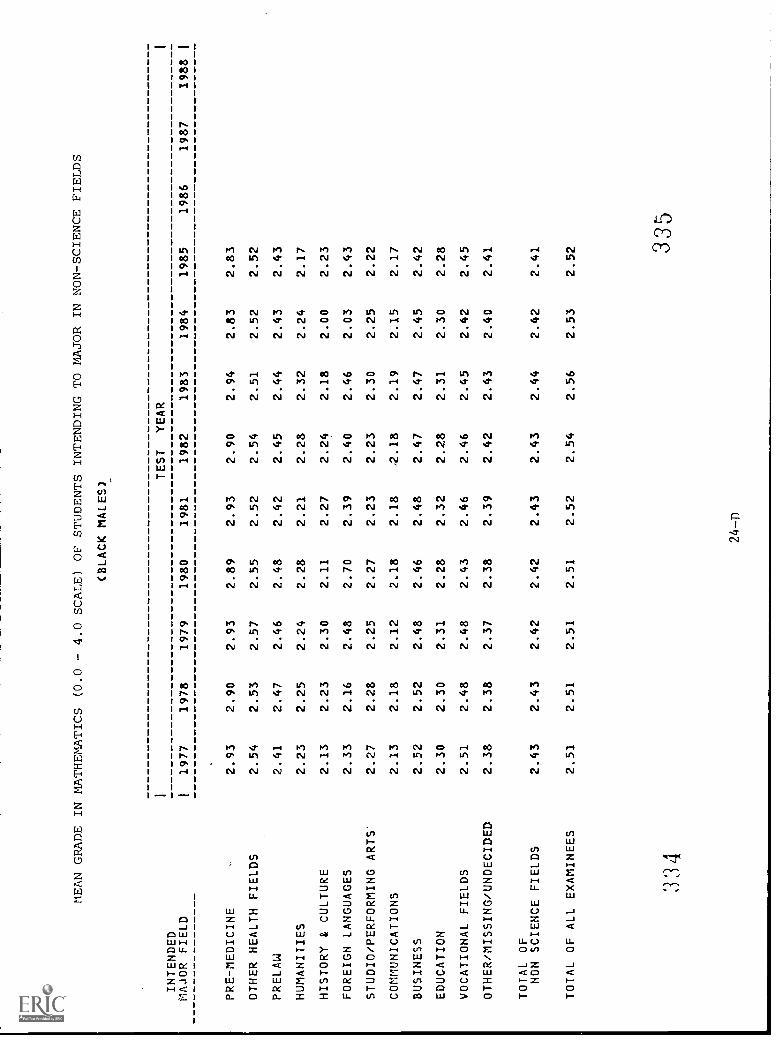
MEAN GRADE
INTENDED
MAJOR FIELD
PRE-MEDICINE
OTHER HEALTH FIELDS
PRELAW
HUMANITIES
HISTORY & CULTURE
FOREIGN LANGUAGES
STUDIO/PERFORMING ARTS
COMMUNICATIONS
BUSINESS
EDUCATION
VOCATIONAL FIELDS
OTHER/MISSING/UNDECIDED
TOTAL OF
NON SCIENCE FIELDS
TOTAL OF ALL EXAMINEES
IN MATHEMATICS (0.0
I1977
1978
2.93
2.90
2.54
2.53
2.41
2.47
2.23
2.25
2.13
2.23
2.33
2.16
2.27
2.28
2.13
2.18
2.52
2.52
2.30
2.30
2.51
2.48
2.38
2.38
2.43
2.43
2.51
2.51
- 4.0
1979
2.93
2.57
2.46
2.24
2.30
2.48
2.25
2.12
2.48
2.31
2.48
2.37
2.42
2.51
SCALE) OF STUDENTS INTENDING TO MAJOR IN NON-SCIENCE FIELDS
(BLACK MALES)
TEST
YEAR
1980
1981
1982
1983
1984
1985
1986
1987
2.89
2.93
2.90
2.94
2.83
2.83
2.55
2.52
2.54
2.51
2.52
2.52
2.48
2.42
2.45
2.44
2.43
2.43
2.28
2.21
2.28
2.32
2.24
2.17
2.11
2.27
2.24
2.18
2.00
2.23
2.70
2.39
2.40
2.46
2.03
2.43
2.27
2.23
2.23
2.30
2.25
2.22
2.18
2.18
2.18
2.19
2.15
2.17
2.46
2.48
2.47
2.47
2.45
2.42
2.28
2.32
2.28
2.31
2.30
2.28
2.43
2.46
2.46
2.45
2.42
2.45
2.38
2.39
2.42
2.43
2.40
2.41
2.42
2.43
2.43
2.44
2.42
2.41
2.51
2.52
2.54
2.56
2.53
2.52
1988
334
335
I
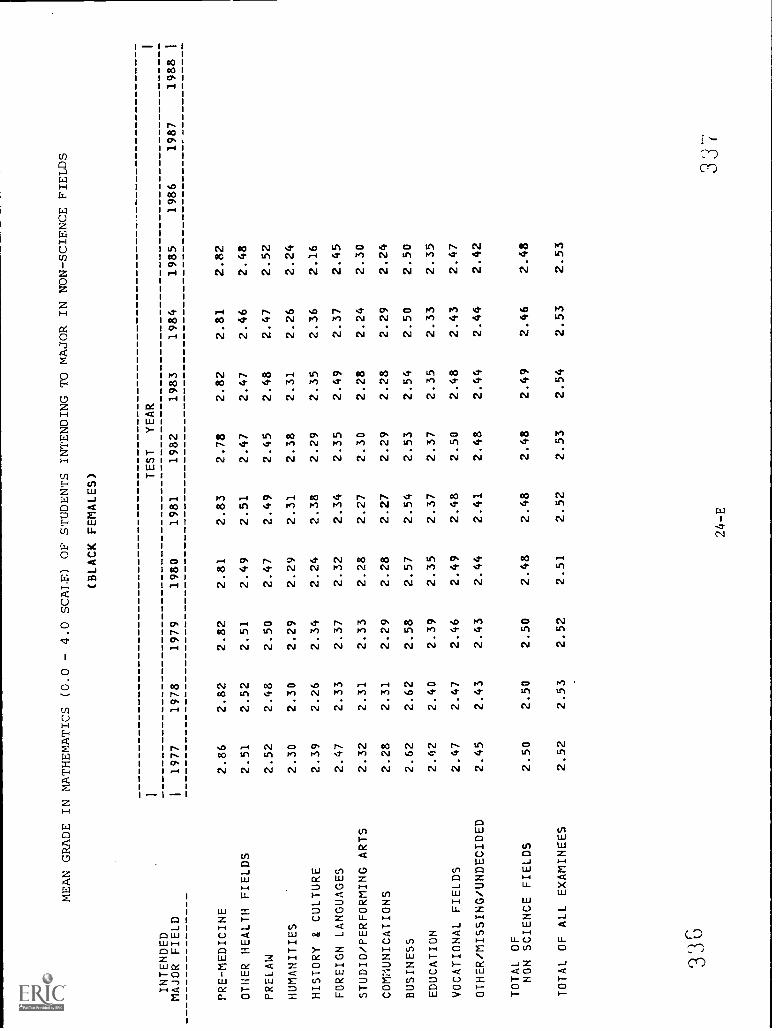
MEAN GRADE
INTENDED
MAJOR FIELD
PRE-MEDICINE
OTHER HEALTH FIELDS
PRELAW
HUMANITIES
HISTORY & CULTURE
FOREIGN LANGUAGES
STUDIO/PERFORMING ARTS
COMMUNICATIONS
BUSINESS
EDUCATION
VOCATIONAL FIELDS
OTHER/MISSING/UNDECIDED
TOTAL OF
NON SCIENCE FIELDS
TOTAL OF ALL EXAMINEES
IN MATHEMATICS (0.0
I I1977
1978
2.86
2.82
2.51
2.52
2.52
2.48
2.30
2.30
2.39
2.26
2.47
2.33
2.32
2.31
2.28
2.31
2.62
2.62
2.42
2.40
2.47
2.47
2.45
2.43
2.50
2.50
2.52
2.53
- 4.0
1979
2.82
2.51
2.50
2.29
2.34
2.37
2.33
2.29
2.58
2.39
2.46
2.43
2.50
2.52
SCALE) OF STUDENTS INTENDING TO MAJOR IN NON-SCIENCE FIELDS
(BLACK FEMALES) TEST
YEAR
1980
1981
1982
1983
1984
1985
1986
2.81
2.83
2.78
2.82
2.81
2.82
2.49
2.51
2.47
2.47
2.46
2.48
2.47
2.49
2.45
2.48
2.47
2.52
2.29
2.31
2.38
2.31
2.26
2.24
2.24
2.38
2.29
2.35
2.36
2.16
2.32
2.34
2.35
2.49
2.37
2.45
2.28
2.27
2.30
2.28
2.24
2.30
2.28
2.27
2.29
2.28
2.29
2.24
2.57
2.54
2.53
2.54
2.50
2.50
2.35
2.37
2.37
2.35
2.33
2.35
2.49
2.48
2.50
2.48
2.43
2.47
2.44
2.41
2.48
2.44
2.44
2.42
2.48
2.48
2.48
2.49
2.46
2.48
2.51
2.52
2.53
2.54
2.53
2.53
1987
I
1988
I
3 '3
G24
-E0Jcl J (--
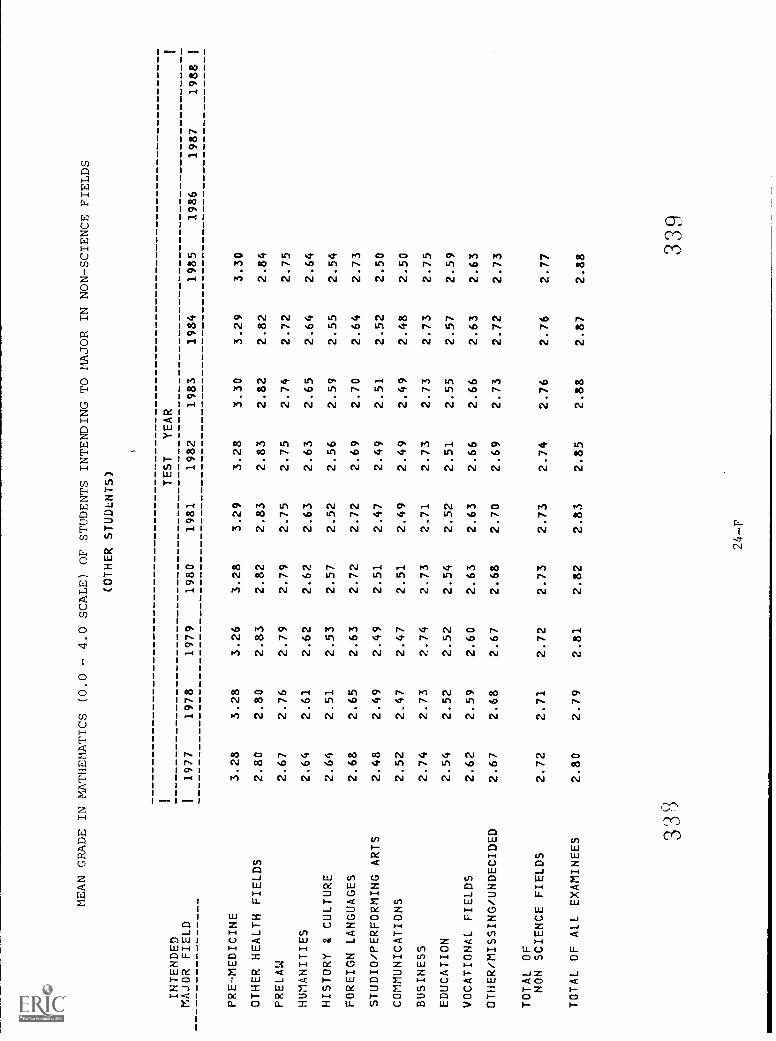
MEAN GRADE IN MATHEMATICS (0.0
1
INTENDED
MAJOR FIELD
I1977
1978
PRE-MEDICINE
3.28
3.28
OTHER HEALTH FIELDS
2.80
2.80
PRELAW
2.67
2.76
HUMANITIES
2.64
2.61
HISTORY & CULTURE
2.64
2.51
FOREIGN LANGUAGES
2.68
2.65
STUDIO/PERFORMING ARTS
2.48
2.49
COMMUNICATIONS
2.52
2.47
BUSINESS
2.74
2.73
EDUCATION
2.54
2.52
VOCATIONAL FIELDS
2.62
2.59
OTHER/MISSING/UNDECIDED
2.67
2.68
TOTAL OF
NON SCIENCE FIELDS
2.72
2.71
TOTAL OF ALL EXAMINEES
2.80
2.79
- 4.0
1979
3.26
2.83
2.79
2.62
2.53
2.63
2.49
2.47
2.74
2.52
2.60
2.67
2.72
2.81
SCALE) OF STUDENTS INTENDING TO MAJOR IN NON-SCIENCE FIELDS
(OTHER STUDLNTS) TEST
YEAR
1980
1981
1982
1983
1984
1985
1986
3.28
3.29
3.28
3.30
3.29
3.30
2.82
2.83
2.83
2.82
2.82
2.84
2.79
2.75
2.75
2.74
2.72
2.75
2.62
2.63
2.63
2.65
2.64
2.64
2.57
2.52
2.56
2.59
2.55
2.54
2.72
2.72
2.69
2.70
2.64
2.73
2.51
2.47
2.49
2.51
2.52
2.50
2.51
2.49
2.49
2.49
2.48
2.50
2.73
2.71
2.73
2.73
2.73
2.75
2.54
2.52
2.51
2.55
2.57
2.59
2.63
2.63
2.66
2.66
2.63
2.63
2.68
2.70
2.69
2.73
2.72
2.73
2.73
2.73
2.74
2.76
2.76
2.77
2.82
2.83
2.85
2.88
2.87
2.88
1987
1988
33L
$33
9
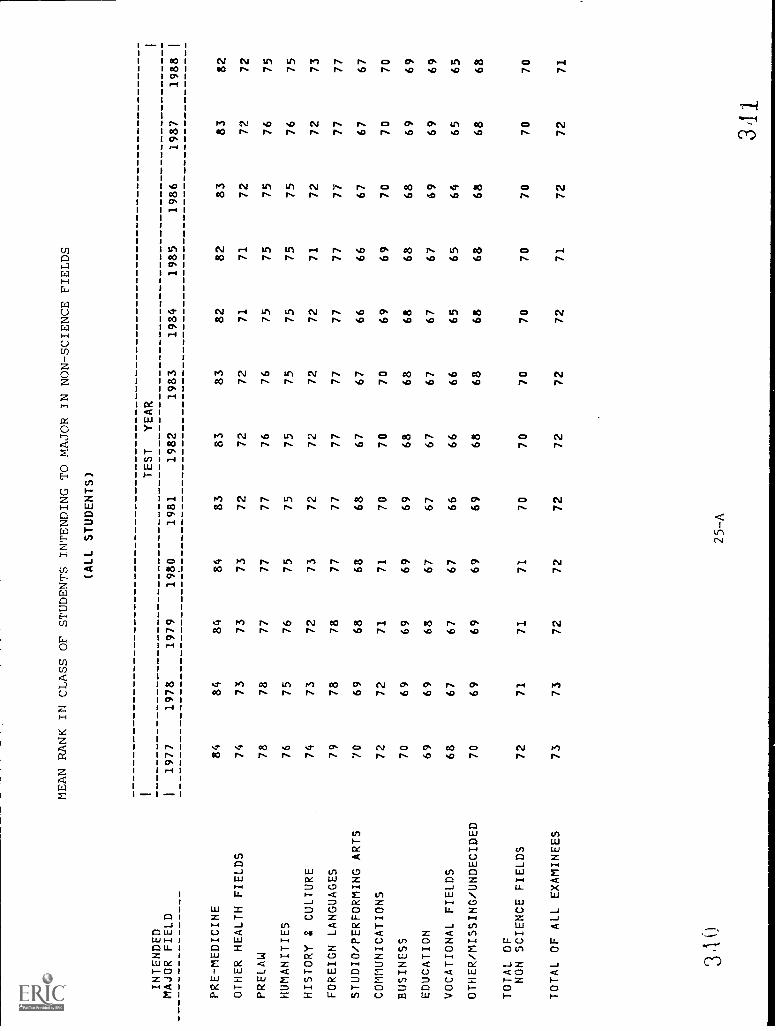
MEAN RANK IN CLASS OF STUDENTS INTENDING TO MAJOR IN NON-SCIENCE FIELDS
INTENDED
MAJOR FIELD
PRE-MEDICINE
OTHER HEALTH FIELDS
PRELAW
HUMANITIES
HISTORY & CULTURE
FOREIGN LANGUAGES
STUDIO/PERFORMING ARTS
COMMUNICATIONS
BUSINESS
EDUCATION
VOCATIONAL FIELDS
OTHER/MISSING/UNDECIDED
TOTAL OF
NON SCIENCE FIELDS
TOTAL OF ALL EXAMINEES
I 11977
84
74
78
76
74
79
70
72
70
69
68
70
72
73
1978
84
73
78
75
73
78
69
72
69 69
67
69
71
73
1979
84 73
77
76 72
78
68
71
69
68
67
69
71
72
(ALL
1980
84
73
77
75 73
77
68
71
69
67
67
69
71
72
STUDENTS) TEST
1981
1982
83
83
72
72
77
76
75
75
72
72
77
77
68
67
70
70
69
68
67
67
66
66
69
68
70
70
72
72
YEAR
1983
83 72
76
75
72
77
67
70
68
67
66
68
70
72
1984
82
71
75
75
72
77
66
69
68
67
65
68
70
72
1985
82
71
75
75
71
77
66
69
68
67
65
68
70
71
1986
83
72
75
75
72
77
67
70
68 69
64
68
70
72
1987
83
72
76
76
72
77
67
70
69
69
65
68
70
72
1988
82
72
75
75
73
77
67
70
69
69
65
68
70
71
310
25-A
311
1
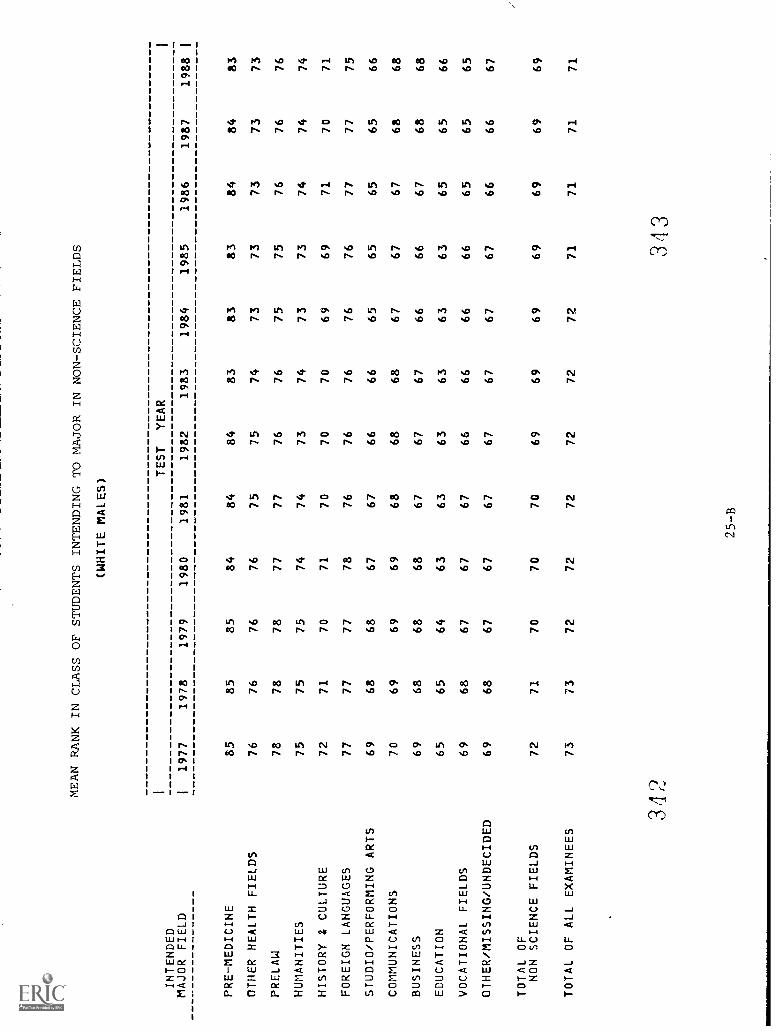
MEAN RANK IN CLASS OF STUDENTS INTENDING TO MAJOR IN NON-SCIENCE FIELDS
(WHITE MALES)
INTENDED
MAJOR FIELD
PRE-MEDICINE
OTHER HEALTH FIELDS
PRELAW
HUMANITIES
HISTORY & CULTURE
FOREIGN LANGUAGES
STUDIO/PERFORMING ARTS
COMMUNICATIONS
BUSINESS
EDUCATION
VOCATIONAL FIELDS
OTHER/MISSING/UNDECIDED
TOTAL OF
NON SCIENCE FIELDS
TOTAL OF ALL EXAMINEES
I 11977 85
76
78
75
72
77
69
70
69
65
69
69
72
73
1978
85 76
78
75
71
77
68
69
68
65
68
68
71
73
1979
85
76
78
75
70
77
68
69
68
64
67
67
70
72
1980 84
76
77
74
71
78
67
69
68
63 67
67
70
72
1981
84
75
77
74
70
76
67
68
67
63
67
67
70
72
TEST
1982
84 75
76
73
70
76
66
68
67
63
66
67
69
72
YEAR
1983
83
74
76
74
70
76
66
68
67
63
66
67
69
72
1984
83
73
75
73
69
76
65
67
66
63
66
67
69
72
1985
83
73
75
73
69
76
65
67
66
63
66
67
69
71
1986 84
73
76
74
71
77
65
67
67
65
65
66
69
71
1987
84
73
76
74
70
77
65
68
68
65
65
66
69
71
1988
83
73
76
74
71
75
66
68
68
66 65
67
69
71
34,
3 43
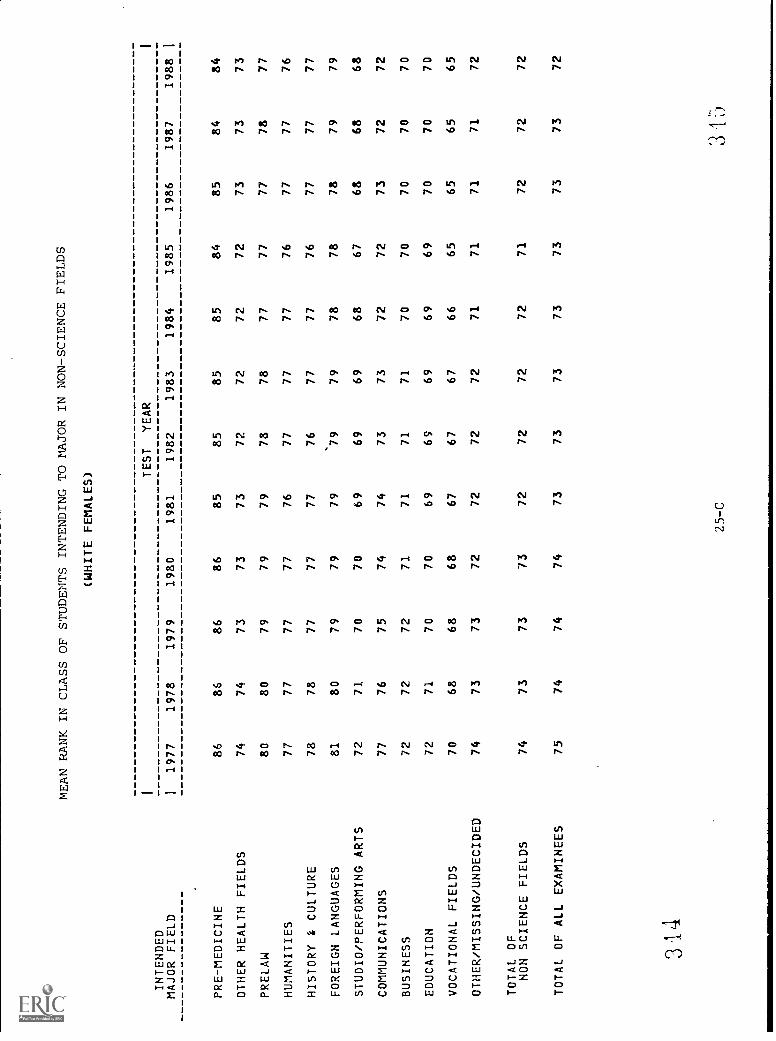
INTENDED
MAJOR FIELD
PRE-MEDICINE
OTHER HEALTH FIELDS
PRELAW
HUMANITIES
HISTORY & CULTURE
FOREIGN LANGUAGES
STUDIO/PERFORMING ARTS
COMMUNICATIONS
BUSINESS
EDUCATION
VOCATIONAL FIELDS
OTHER/MISSING/UNDECIDED
TOTAL OF
NON SCIENCE FIELDS
TOTAL OF ALL EXAMINEES
MEAN RANK IN CLASS OF STUDENTS INTENDING TO MAJOR IN NON-SCIENCE
FIELDS
(WHITE FEMALES)
1TEST
YEAR
11977
1978
1979
1980
1981
1982
1983
1984
1985
86
86
86
86
85
85
85
85
84
74
74
73
73
73
72
72
72
72
80
80
79
79
79
78
78
77
77
77
77
77
77
76
77
77
77
76
78
78
77
77
77
76
77
77
76
81
80
79
79
79
`79
79
78
78
72
71
70
70
69
69
69
68
67
77
76
75
74
74
73
73
72
72
72
72
72
71
71
71
71
70
70
72
71
70
70
69
69
69
69
69
70
68
68
68
67
67
67
66
65
74
73
73
72
72
72
72
71
71
74
73
73
73
72
72
72
72
71
75
74
74
74
73
73
73
73
73
1986
85 73
77
77
77
78
68
73 70
70
65
71
72 73
1987 84
73 78
77
77
79
68
72 70
70
65
71
72 73
1988
84
73 77
76
77
79
68
72
70
70 65
72
72 72
3 '1
4
25-C
3 :1
5
1
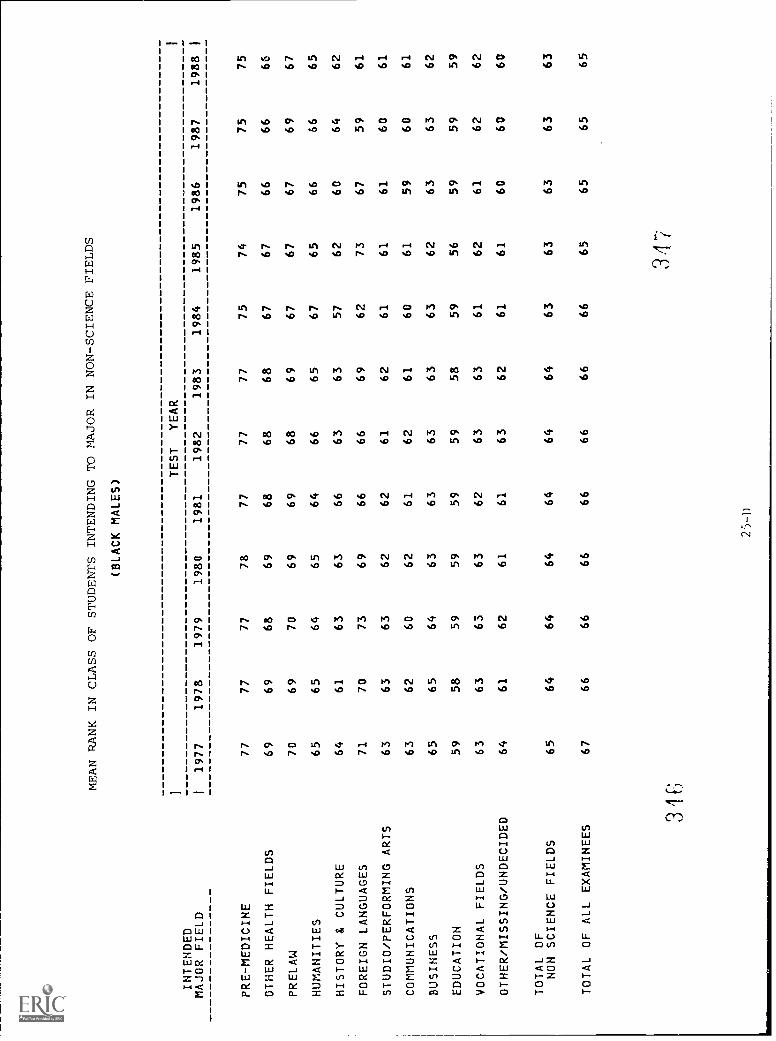
INTENDED
MAJOR FIELD
PRE-MEDICINE
OTHER HEALTH FIELDS
PRELAW
HUMANITIES
HISTORY & CULTURE
FOREIGN LANGUAGES
STUDIO/PERFORMING ARTS
COMMUNICATIONS
BUSINESS
EDUCATION
VOCATIONAL FIELDS
OTHER/MISSING/UNDECIDED
TOTAL OF
NON SCIENCE FIELDS
TOTAL OF ALL EXAMINEES
1 1
MEAN RANK IN CLASS OF STUDENTS INTENDING TO MAJOR IN
NON-SCIENCE FIELDS
(BLACK MALES)
TEST
YEAR
1977
1978
1979
1980
1981
1982
1983
1984
1985
77
77
77
78
77
77
77
75
74
69
69
68
69
68
68
68
67
67
70
69
70
69
69
68
69
67
67
65
65
64
65
64
66
65
67
65
64
61
63
63
66
63
63
57
62
71
70
73
69
66
66
69
62
73
63
63
63
62
62
61
62
61
61
63
62
60
62
61
62
61
60
61
65
65
64
63
63
63
63
63
62
59
58
59
59
59
59
58
59
56
63
63
63
63
62
63
63
61
62
64
61
62
61
61
63
62
61
61
65
64
64
64
64
64
64
63
63
67
66
66
66
66
66
66
66
65
1986 75
66
67
66
60 67
61
59
63
59
61 60
63
65
1987 75
66
69
66
64
59 60
60
63
59
62 60
63
65
1988 75
66 67
65
62
61
61 61
62
59
62
60
63 65
3 '1
1;
31
1
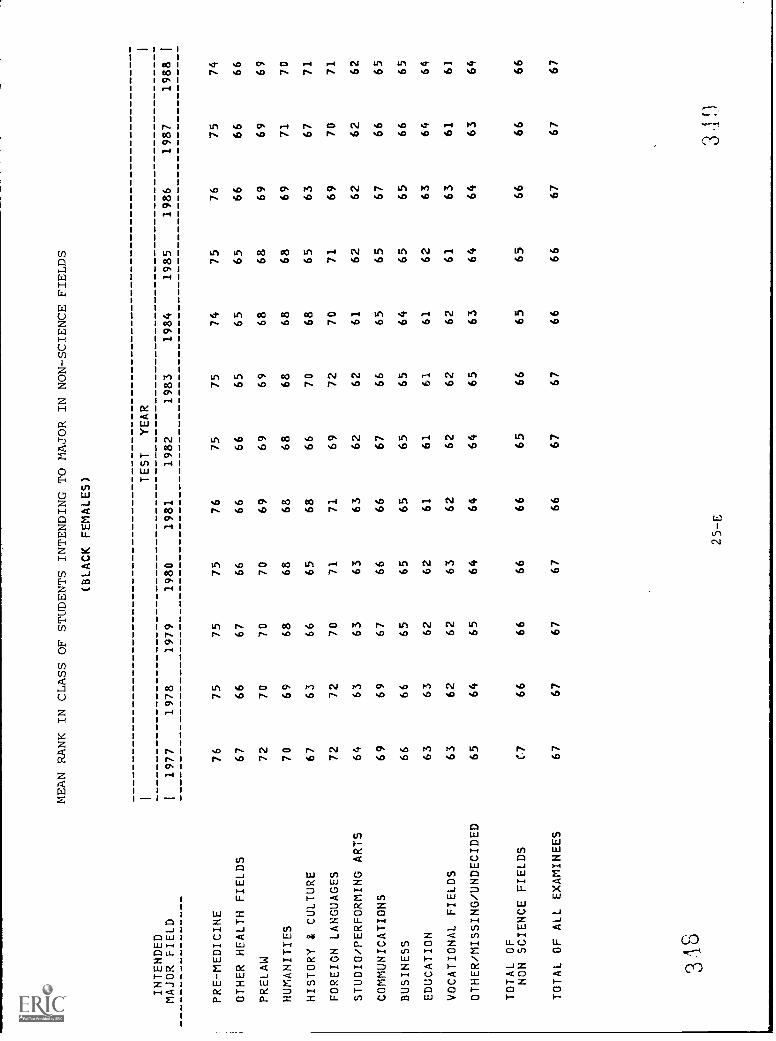
INTENDED
MAJOR FIELD
PRE-MEDICINE
OTHER HEALTH FIELDS
PRELAW
HUMANITIES
HISTORY & CULTURE
FOREIGN LANGUAGES
STUDIO/PERFORMING ARTS
COMMUNICATIONS
BUSINESS
EDUCATION
VOCATIONAL FIELDS
OTHER/MISSING/UNDECIDED
TOTAL OF
NON SCIENCE FIELDS
TOTAL OF ALL EXAMINEES
MEAN RANK IN CLASS OF STUDENTS INTENDING TO MAJOR IN NON-SCIENCE FIELDS
(BLACK FEMALES)
1TEST
YEAR
11977
1978
1979
1980
1981
1982
1983
1984
1985
76
75
75
75
76
75
75
74
75
67
66
67
66
66
66
65
65
65
72
70
70
70
69
69
69
68
68
70
69
68
68
68
68
68
68
68
67
63
66
65
68
66
70
68
65
72
72
70
71
71
69
72
70
71
64
63
63
63
63
62
62
61
62
69
69
67
66
66
67
66
65
65
66
66
65
65
65
65
65
64
65
63
63
62
62
61
61
61
61
62
63
62
62
63
62
62
62
62
61
65
64
65
64
64
64
65
63
64
(.7
66
66
66
66
65
66
65
65
67
67
67
67
66
67
67
66
66
1986 76
66
69
69
63
69 62
67
65
63
63
64 66
67
1987 75
66
69 71
67
70
62
66
66
64
61 63
66
67
I
1988
1
74
66
69 70
71
71
62
65
65
64
6]
64
66
67
3/1B
25-E
3.1
.1
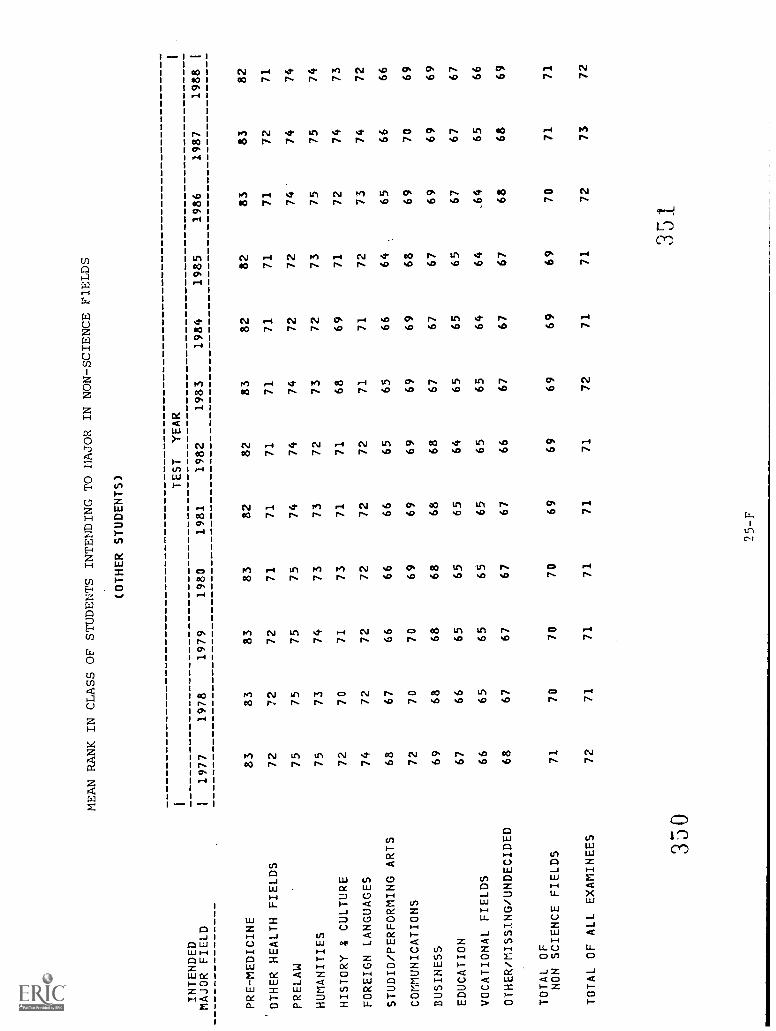
INTENDED
MEAN RANK IN CLASS OF STUDENTS INTENDING TO
MAJOR IN NON-SCIENCE FIELDS
(OTHER STUDENTS)
ITEST
YEAR
MAJOR FIELD
I1977
1978
1979
1980
1981
1982
1983
1984
1985
1986
1987
1988
PRE-MEDICINE
83
83
83
83
82
82
83
82
82
83
83
82
OTHER HEALTH FIELDS
72
72
72
71
71
71
71
71
71
71
72
71
PRELAW
75
75
75
75
74
74
74
72
72
74
74
74
HUMANITIES
75
73
74
73
73
72
73
72
73
75
75
74
HISTORY 8 CULTURE
72
70
71
73
71
71
68
69
71
72
74
73
FOREIGN LANGUAGES
74
72
72
72
72
72
71
71
72
73
74
72
STUDIO/PERFORMING ARTS
68
67
66
66
66
65
65
66
64
65
66
66
COMMUNICATIONS
72
70
70
69
69
69
69
69
68
69
70
69
BUSINESS
69
68
68
68
68
68
67
67
67
69
69
69
EDUCATION
67
66
65
65
65
64
65
65
65
67
67
67
VOCATIONAL FIELDS
66
65
65
65
65
65
65
64
64
.64
65
66
OTHER/MISSING/UNDECIDED
68
67
67
67
67
66
67
67
67
68
68
69
TOTAL OF
NON SCIENCE FIELDS
71
70
70
70
69
69
69
69
69
70
71
71
TOTAL OF ALL EXAMINEES
72
71
71
71
71
71
72
71
71
72
73
72
350
351
I

PERCENT OF STUDENTS INTENDING NOT TO MAJOR IN SCIENCE WHO PLAN TO RECEIVE A GRADUAGE DEGREE
(ALL STUDENTS)
INTENDED
MAJOR FIELD
PRE-MEDICINE
OTHER HEALTH FIELDS
PRELAW
HUMANITIES
HISTORY & CULTURE
FOREIGN LANGUAGES
STUDIO/PERFORMING ARTS
COMMUNICATIONS
BUSINESS
EDUCATION
VOCATIONAL FIELDS
OTHER/MISSING/UNDECIDED
TOTAL OF
NON SCIENCE FIELDS
TOTAL OF ALL EXAMINEES
1 11977
98
47
87
59
61
57
39
45
36
43
29
43
49
53
1978
98
49
87
58
59
56 38
44
36
43
29
41
49
52
1979 98
52
87
58
58
56 37
45
37
43
29
41
49
52
1980 98
54
87
60
60
58 38
44
39
43
29
43
50
53
1981 98
54
86
60
60
60
38
45
40
43
30
43
50
54
TEST
YEAR
1982
98
53
87 61
61
61
38
45
41
42
29
44
50
54
1983
98
53
86 62
62
61
37
44
41
42
29
44
51
54
1984 98
54
85
63
60
61 37
45
42
42 30
45
52 55
1985 98
58
86
63
62
62 37
46
43
43 31
46
52
56
1986
98
59
85
65
63
61
37
45
43
44
27
45
51
55
1987 98
60
86 65
63
63
37
45
43
45
26
44
51
55
1988
97
63
85
65
63
63 39
46
46
47 30
47
53
56
352
26-A
353

PERCENT OF STUDENTS INTENDING NOT TO MAJOR IN SCIENCE WHO PLAN TO RECEIVE A GRADUATE DEGREE
(WHITE MALES)
INTENDED
TEST
YEAR
MAJOR FIELD
I1977
1978
1979
1980
1981
1982
1983
1984
1985
1986
1987
1988
PRE-MEDICINE
99
99
99
99
99
9F.
99
98
98
98
98
98
OTHER HEALTH FIELDS
82
83
82
84
83
82
81
79
79
78
75
74
PRELAW
89
89
88
88
88
88
87
87
88
86
86
87
HUMANITIES
65
65
65
67
65
66
65
65
66
67
66
68
HISTORY & CULTURE
61
59
58
59
58
59
60
58
61
60
59
60
FOREIGN LANGUAGES
69
70
67
70
70
69
70
69
70
68
71
64
STUDIO/PERFORMING ARTS
48
45
44
43
43
42
41
42
41
39
39
41
COMMUNICATIONS
41
40
40
40
40
40
39
39
41
40
40
40
BUSINESS
42
41
42
43
44
45
45
46
46
45
46
48
EDUCATION
42
40
39
38
38
37
38
39
40
42
42
45
VOCATIONAL FIELDS
33
31
31
30
31
31
31
32
32
26
25
27
OTHER/MISSING/UNDECIDED
43
40
39
41
41
42
42
42
44
42
41
42
TOTAL OF
NON SCIENCE FIELDS
56
55
54
54
54
54
54
55
55
52
51
52
TOTAL OF ALL EXAMINEES
58
56
56
56
56
56
55
56
56
55
54
55
354
!":
1.1
%./
I

PERCENT OF STUDENTS INTENDING NOT TO MAJOR IN SCIENCE WHO PLANTO RECEIVE A GRADUATE DEGREE
(WHITE FEMALES)
INTENDED
MAJOR FIELD
PRE-MEDICINE
OTHER HEALTH FIELDS
PRELAW
HUMANITIES
HISTORY & CULTURE
FOREIGN LANGUAGES
STUDIO/PERFORMING ARTS
COMMUNICATIONS
BUSINESS
EDUCATION
VOCATIONAL FIE.:S
OTHER/MISSING/UNDECIDED
TOTAL OF
NON SCIENCE FIELDS
TOTAL OF ALL EXAMINEES
1 11977 98
34
84 53
60
53
34
44
24
43 22
39
40
45
1978 97
37
85 53
59
53 33
43 25
43
22
38 41
45
1979
97
39
84 53
59
53
33
44
28
44 22
38
42
46
1980 98
42
85 55
62
55
33
43
31
43
22
40
43 47
1981 98
43
85 57
64
57
34
44 33
43
23
42 44
48
TEST
YEAR
1982 98
43
86 58
63 59
34
43
34
43
22
42 45
49
1983 98
43
86 59
65 59
34
45
35
41
23
43 45
49
1984 98
45
85
62 65
60
34
45 36
43
24
45
47
51
1985 98
49
84 61
66 61
34
47
37
43
24
45 48
52
1986 98
50
84
63
67
61
34
45 37
44
22
46
48 52
1987 98
53
85 63
68
62
35
45
37
45 23
46
48
52
1988 98
56
84 63
69
63
36
46 40
47
28
49 50
54
26-C
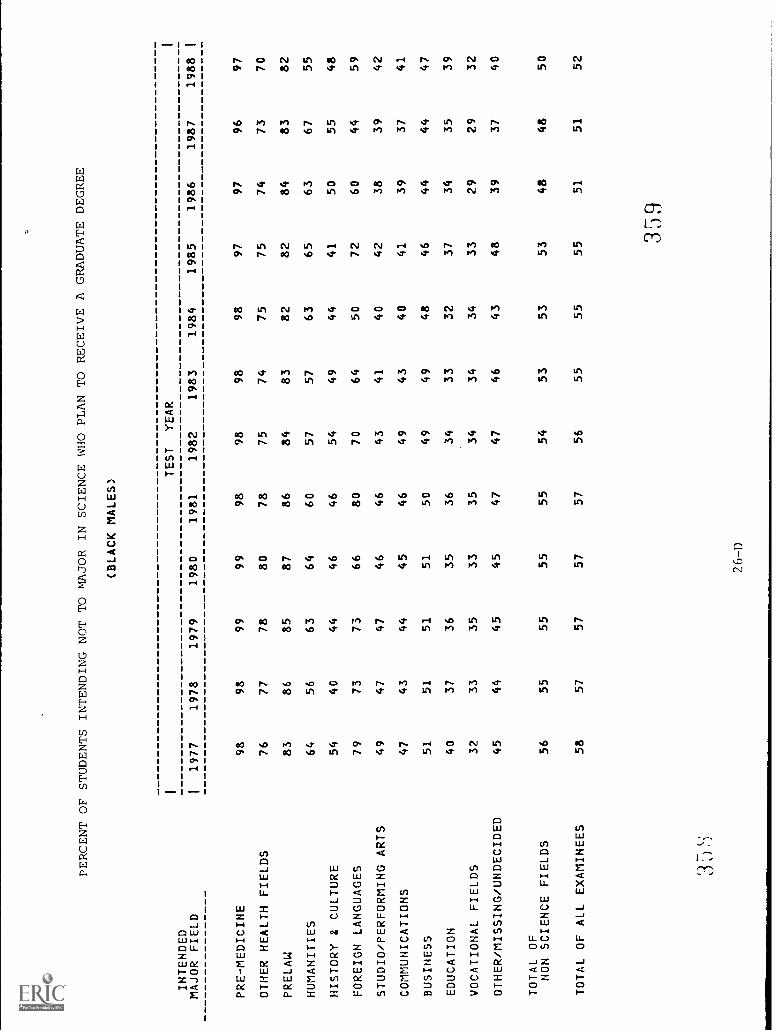
PERCENT OF STUDENTS INTENDING NOT TO MAJOR IN SCIENCE WHO PLAN TO
RECEIVE A GRADUATE DEGREE
(BLACK MALES)
INTENDED
MAJOR FIELD
PRE-MEDICINE
OTHER HEALTH FIELDS
PRELAW
HUMANITIES
HISTORY & CULTURE
FOREIGN LANGUAGES
STUDIO/PERFORMING ARTS
COMMUNICATIONS
BUSINESS
EDUCATION
VOCATIONAL FIELDS
OTHER/MISSING/UNDECIDED
TOTAL OF
NON SCIENCE FIELDS
TOTAL OF ALL EXAMINEES
1 11977 98
76
83 64
54
79
49
47 51
40
32
45
56
58
1978
98
77
86
56 40
73
47
43
51 37
33
44
55
57
1979
99
78
85
63 44
73
47
44
51
36 35
45 55
57
1980 99
80
87
64 46
66
46
45
51 35
33
45
55
57
1981 98
78
86
60 46
80 46
46
50
36 35
47 55
57
TEST
YEAR
1982 98
75
84 57
54
70
43
49 49
34
34
47
54 56
1983 98
74
83
57
49
64
41 43
49
33
34
46 53
55
1984
98
75
82
63
44 50
40
40
48
32 34
43 53
55
1985
97
75
82 65
41
72
42 41
46
37
33
48 53
55
1986 97
74
84 63
50
60 38
39
44
34
29
39
48 51
1987 96
73
83
67
55
44 39
37
44
35
29
37
48 51
I
1988
1
97
70
82 55
48
59
42
41
47
39
32
40
50
52
3 59
26-D
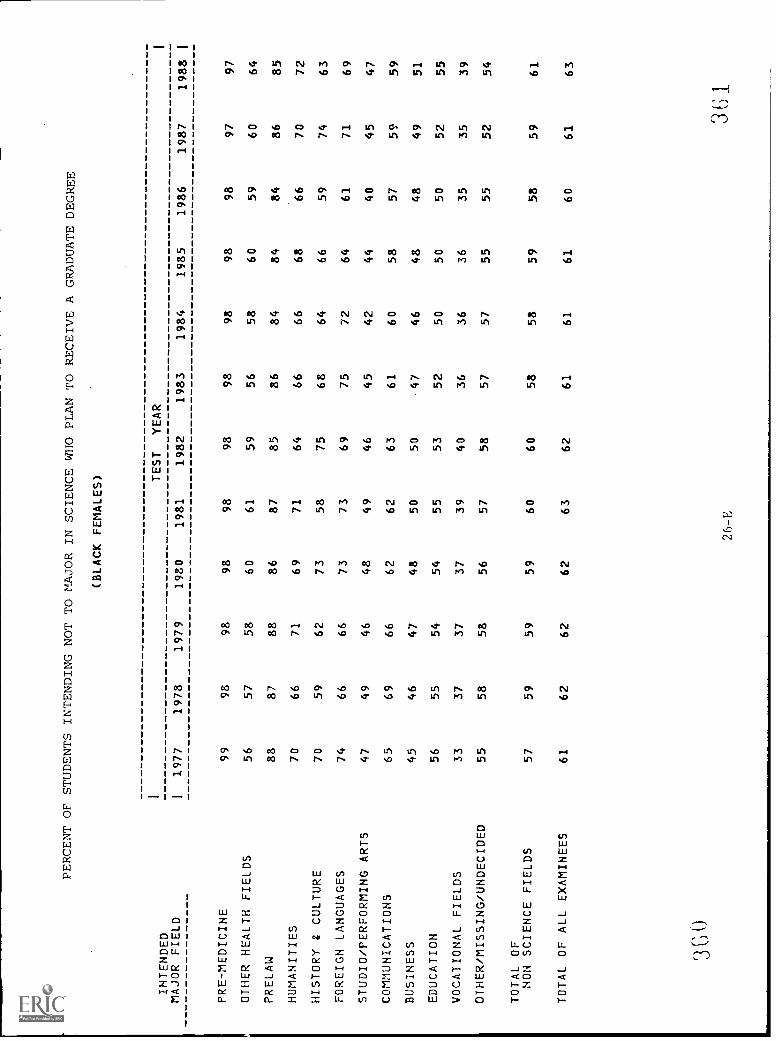
PERCENT OF STUDENTS INTENDING NOT TO MAJOR IN SCIENCE WHO PLAN TO RECEIVE A GRADUATE DEGREE
(BLACK FEMALES)
INTENDED
TEST
YEAR
MAJOR FIELD
I1977
1978
1979
1980
1981
1982
1983
1984
1985
1986
1987
1988
PRE-MEDICINE
99
98
98
98
98
98
98
98
98
98
97
97
OTHER HEALTH FIELDS
56
57
58
60
61
59
56
58
60
59
60
64
PRELAW
88
87
88
86
87
85
86
84
84
84
86
85
HUMANITIES
70
66
71
69
71
64
66
66
68
66
70
72
HISTORY & CULTURE
70
59
62
73
58
75
68
64
66
59
74
63
FOREIGN LANGUAGES
74
66
66
73
73
69
75
72
64
61
71
69
STUDIO/PERFORMING ARTS
47
49
46
48
49
46
45
42
44
40
45
47
COMMUNICATIONS
65
69
66
62
62
63
61
60
58
57
59
59
BUSINESS
45
46
47
48
50
50
47
46
48
48
49
51
EDUCATION
56
55
54
54
55
53
52
50
50
50
52
55
VOCATIONAL FIELDS
33
37
37
37
39
40
36
36
36
35
35
39
OTHER/MISSING/UNDECIDED
55
58
58
56
57
58
57
57
55
55
52
54
TOTAL OF
NON SCIENCE FIELDS
57
59
59
59
60
60
58
58
59
58
59
61
TOTAL OF ALL EXAMINEES
61
62
62
62
63
62
61
61
61
60
61
63
3G 0
26-E
n
1
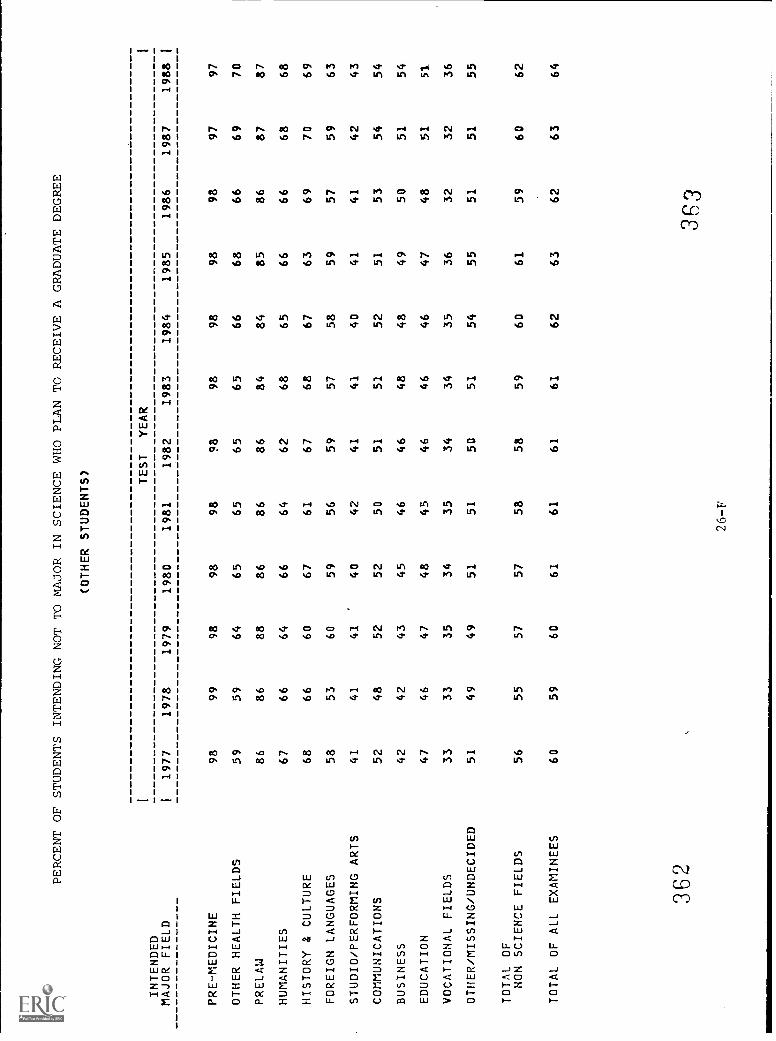
PERCENT OF STUDENTS INTENDING NOT TO MAJOR IN SCIENCE WHO PLAN TO RECEIVE A GRADUATE DEGREE
(OTHER STUDENTS)
INTENDED
MAJOR FIELD
PRE-MEDICINE
OTHER HEALTH FIELDS
PRELAW
HUMANITIES
HISTORY & CULTURE
FOREIGN LANGUAGES
STUDIO/PERFORMING ARTS
COMMUNICATIONS
BUSINESS
EDUCATION
VOCATIONAL FIELDS
OTHER/MISSING/UNDECIDED
TOTAL OF
NON SCIENCE FIELDS
TOTAL OF ALL EXAMINEES
I 11977 98
59
86 67
68
58
41
52
42
47
33
51
56
60
1978
99
59
86
66
66
53
41
48
42
46 33
49
55
59
1979 98
64
88 64
60
60
41
52
43
47
35
49
57
60
1980 98
65
86
66 67
59
40
52
45
48
34
51
57
61
1981 98
65
86 64
61
56
42
50
46
45
35
51
58
61
TEST 1982
98
65
86 62
67
59
41
51
46
46
34
50
58
61
YEAR
1983
98
65
84
68
68
57 41
51
48
46 34
51
59 61
1984 98
66
84
65
67
58 40
52
48
46
35
54 60
62
1985 98
68
85
66
63 59
41
51
49
47 36
55
61
63
1986 98
66
86
66
69
57 41
53
50
48
32
51
59
62
1987 97
69
87 68
70
59
42
54
51
51
32
51
60
63
I
1988
1
97
70
87
68
69
63
43
54
54
51 36
55
62
64

Appendix A
Student Descriptive Questionnaire: 1977 - 1985
3,54
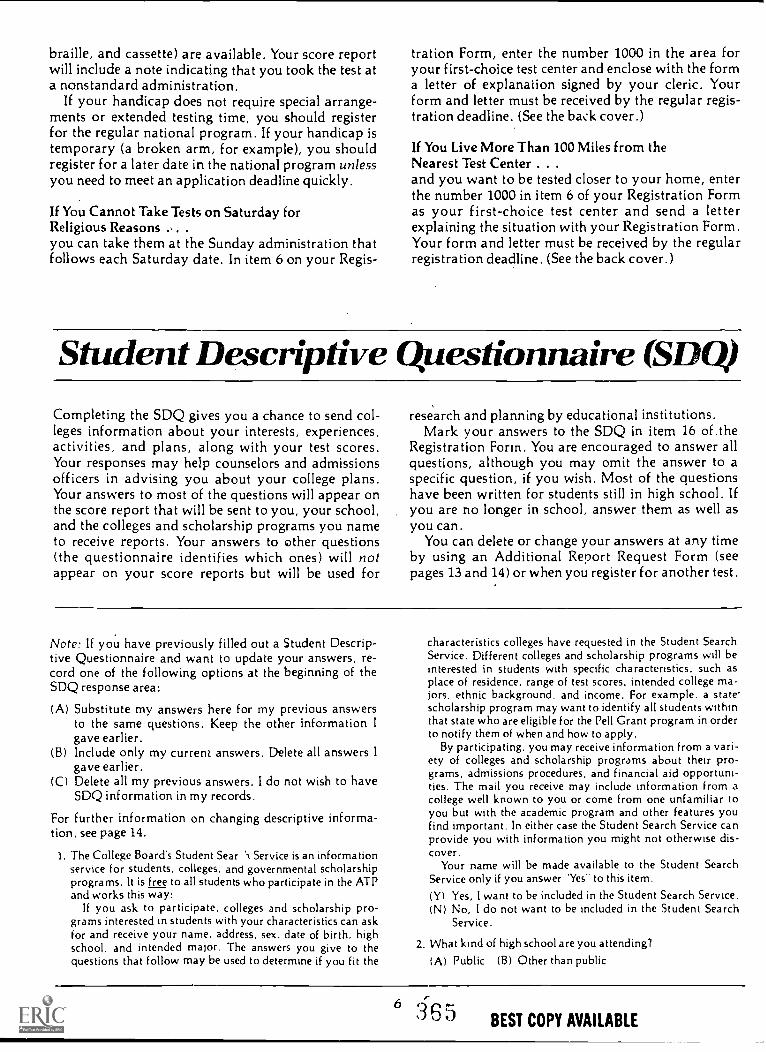
braille, and cassette) are available. Your score reportwill include a note indicating that you took the test ata nonstandard administration.
If your handicap does not require special arrange-ments or extended testing time, you should registerfor the regular national program. If your handicap istemporary (a broken arm, for example), you shouldregister for a later date in the national program unlessyou need to meet an application deadline quickly.
If You Cannot Take Tests on Saturday forReligious Reasons .
you can take them at the Sunday administration thatfollows each Saturday date. In item 6 on your Regis-
tration Form, enter the number 1000 in the area foryour first-choice test center and enclose with the forma letter of explanation signed by your cleric. Yourform and letter must be received by the regular regis-tration deadline. (See the back cover.)
If You Live More Than 100 Miles from theNearest Test Center . . .
and you want to be tested closer to your home, enterthe number 1000 in item 6 of your Registration Formas your first-choice test center and send a letterexplaining the situation with your Registration Form.Your form and letter must be received by the regularregistration deadline. (See the back cover.)
Student Descriptive Questionnaire (SDO)Completing the SDQ gives you a chance to send col-leges information about your interests, experiences,activities, and plans, along with your test scores.Your responses may help counselors and admissionsofficers in advising you about your college plans.Your answers to most of the questions will appear onthe score report that will be sent to you, your school,and the colleges and scholarship programs you nameto receive reports. Your answers to other questions(the questionnaire identifies which ones) will notappear on your score reports but will be used for
research and planning by educational institutions.Mark your answers to the SDQ in item 16 of the
Registration Form. You are encouraged to answer allquestions, although you may omit the answer to aspecific question, if you wish. Most of the questionshave been written for students still in high school. Ifyou are no longer in school, answer them as well asyou can.
You can delete or change your answers at any timeby using an Additional Report Request Form (seepages 13 and 14) or when you register for another test.
Note: If you have previously filled out a Student Descrip-tive Questionnaire and want to update your answers, re-cord one of the following options at the beginning of theSDQ response area:
(A) Substitute my answers here for my previous answersto the same questions. Keep the other information Igave earlier.
(B) Include only my current answers. Delete all answers Igave earlier.
(C) Delete all my previous answers. I do not wish to haveSDQ information in my records.
For further information on changing descriptive informa-tion, see page 14.
1. The College Board's Student Sear Service is an informationservice for students, colleges, and governmental scholarshipprograms. It is free to all students who participate in the ATPand works this way:
If you ask to participate, colleges and scholarship pro-grams interested in students with your characteristics can askfor and receive your name. address, sex, date of birth, highschool, and intended major. The answers you give to thequestions that follow may be used to determine if you fit the
characteristics colleges have requested in the Student SearchService. Different colleges and scholarship programs will beinterested in students with specific characteristics, such asplace of residence. range of test scores, intended college ma-jors, ethnic background, and income. For example. a state-scholarship program may want to identify all students withinthat state who are eligible for the Pell Grant program in orderto notify them of when and how to apply.
By participating, you may receive information from a vari-ety of colleges and scholarship programs about their pro-grams, admissions procedures, and financial aid opportuni-ties. The mail you receive may include information from acollege well known to you or come from one unfamiliar toyou but with the academic program and other features youfind important. In either case the Student Search Service canprovide you with information you might not otherwise dis-cover.
Your name will be made available to the Student SearchService only if you answer -Yes- to this item.(Y) Yes, I want to be included in the Student Search Service.(N) No, I do not want to be included in the Student Search
Service.
2. What kind of high school are you attending?
(A) Public (B) Other than public
6 3 6 5 BEST COPY AVAILABLE

3. Which of the following best describes your present highschool program?(A) Academic or college preparatory (B) General(C) Career-oriented (business, vocational, industrial arts)(D) Other
4. About how many students are there in your high schoolclass?
(A) Fewer than 100 (B) 100-249 (C) 250-499(D) 500-749 (E) 750 or more
5. What is your most recent high school class rank? (For exam-ple, if you are 15th in a class of 100, you are in the secondtenth.) If you do not know your rank or rank is not used inyour school, give your best estimate.(A) Highest tenthst top fifth(B) Second tenth(C) Second fifth
(D) Middle fifth(E) Fourth fifth(F) Lowest fifth
Questions 6 through 11 ask you to blacken the letter corre-sponding to the total years of study you expect to completein certain subject areas. Include in the total only coursesyou have taken since beginning the ninth grade and thoseyou expect to complete before graduation from highschool. Count less than a full year in a subject as a fullyear. Do not count a. repeated year of the same course asan additional year of study.
(A) One year or the equivalent(B) Two years or the equivalent(C) Three years or the equivalent(D) Four years or the equivalent(E) More than four years or the equivalent(F) I will not take any courses in the subject area.
6. English
7. Mathematics
8. Foreign Languages
9. Biological Sciences (for example, biology. botany, or zoology)
10. Physical Sciences (for example, chemistry, physics, or earthscience)
11. Social Studies (for example, history, government, or geogra-phy)
For each of the subject areas in questions 12 through 17,blacken the latest year-end or midyear grade you receivedsince beginning the ninth grade. For example, if you are asenior and have not taken biology or any other biologicalscience since your sophomore year, indicate ''sat year-endgrade. If you are a junior and have completed the first halfof the year in an English course, indicate that midyeargrade.
If you received the grade in an advanced, accelerated, orhonors course, also blacken the letter H.
(A) Excellent (usually 90-100 or A)(B) Good (usually 80-89 or B)(C) Fair (usually 70-79 or C)(D) Passing (usually 60-69 or D)(F) Failing (usually 59 or below or F)(G) Only "pass-fail" grades were assigned and I received a
pass.(H) The grade reported was in an advanced, accelerated, or
honors course.
12. English
13. Mathematics
14. Foreign Languages
15. Biological Sciences
16. Physical Sciences
17. Social Studies
18. Will you have completed advanced high school or college-level work before entering college? If so, mark the letter foreach field in which you plan to apply for advanced place-ment, credit-by-examination, or exemption from requiredcourses.
(A) English (E) Physical Sciences(B) Mathematics (F) Social Studies(C) Foreign Languages (G) Art Music(D) Biological Sciences
19. On the average, how many hours per week do you work in apart-time job? (Exclude vacations.)
(A) None(B) Less than 6 hours(C) 6 to 10 hours(D) 11 to 15 hours
(El 16 to 20 hours(F) 21 to 25 hours(0) 26 to 30 hours(HI More than 30 hours
20. How much have you participated in community or churchgroups while in high school?
(A) I have not been a member of any community or churchgroup.
(B) I have belonged to one or two groups but have not par-ticipated actively.
(C) I have participated actively in one or two groups buthave not held any major offices (for example, president,chairman, or treasurer).
(D) I have participated actively in more than two groups buthave not held any major offices.
(E) I have participated actively and have held a major officein at least one community or church group.
21. How much have you participated in athletics in or out of highschool?
(A)(B)(C)
(D)
(E)
I have not participated in athletics.I have participated in individual or intramural athletics.I have been on one or more varsity teams but have notearned a varsity letter.I have earned one or more varsity letters in a singlesport.I have earned varsity letters in more than one sport.
22. How much have you participated in clubs and organizationsin high school?
(A) I have not been a member of any club or organization.(B) I have belonged to some organizations but have not held
any major offices (for example, president, editor. orclass or school representative).
(C) I have held one or two major offices.(D) I have held three or four major offices.(E) l have held five or more major offices.
23. During your high school years how many honors or awards(for example, essay contest. debating tournament, sciencefair, music, art or theater competition. or membership in ascholastic honors group) have you received?
(A) None (B) One or two )C) Three or four(D) Five or six (E) Seven or more
7 3C6
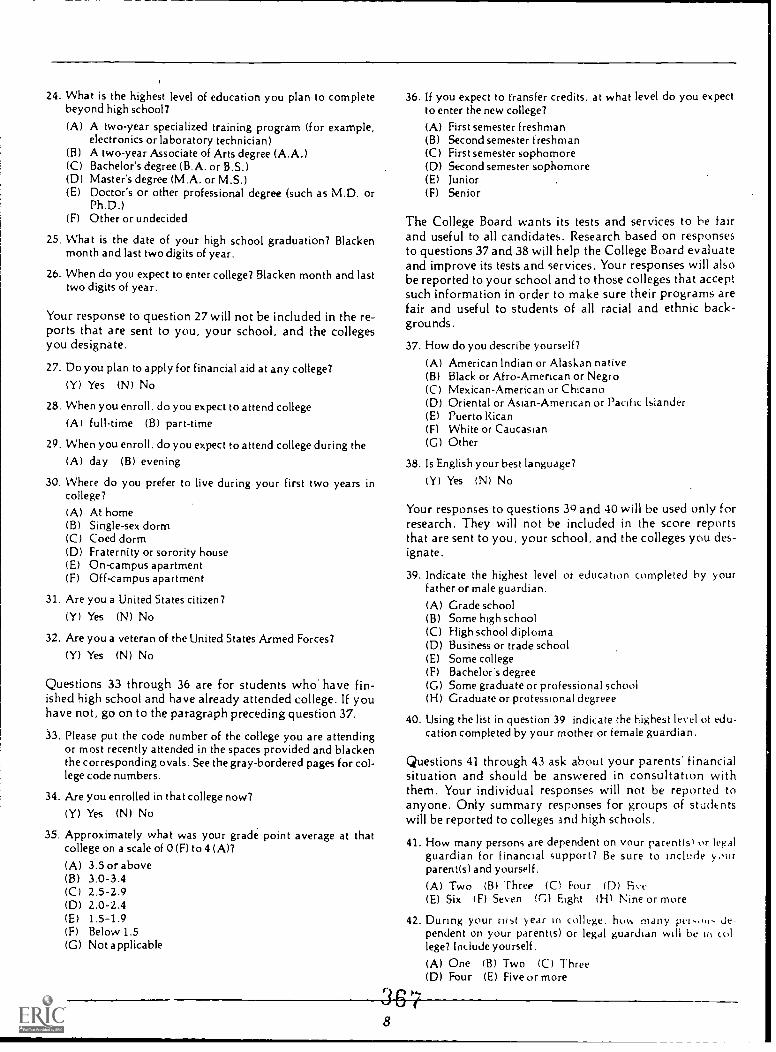
24. What is the highest level of education you plan to completebeyond high school?
(A) A two-year specialized training program (for example,electronics or laboratory technician)
(B) A two-year Associate of Arts degree (A.A.)(C) Bachelor's degree (B.A. or B.S.)(D) Master's degree (M.A. or M.S.)(E) Doctor's or other professional degree (such as M.D. or
Ph.D.)(F) Other or undecided
25. What is the date of your high school graduation? Blackenmonth and last two digits of year.
26. When do you expect to enter college? Blacken month and lasttwo digits of year.
Your response to question 27 will not be included in the re-ports that are sent to you, your school, and the collegesyou designate.
27. Do you plan to apply for financial aid at any college?(Y) Yes (N) No
28. When you enroll, do you expect to attend college
(A) full-time (B) part-time
29. When you enroll, do you expect to attend college during the
(A) day (B) evening
30. Where do you prefer to live during your first two years incollege?
(A)(B)(C)(D)(E)(F)
At homeSingle-sex dormCoed dormFraternity or sorority houseOn-campus apartmentOff-campus apartment
31. Are you a United States citizen?
(Y) Yes (N) No
32. Are you a veteran of the United States Armed Forces?
(Y) Yes (N) No
Questions 33 through 36 are for students who' have fin-ished high school and have already attended college. If youhave not, go on to the paragraph preceding question 37.
33. Please put the code number of the college you are attendingor most recently attended in the spaces provided and blackenthe corresponding ovals. See the gray-bordered pages for col-lege code numbers.
34. Are you enrolled in that college now?
(Y) Yes (N) No
35. Approximately what was your grade point average at thatcollege on a scale of 0 (F) to 4 (A)?
(A) 3.5 or above(B) 3.0-3.4(C) 2.5-2.9(D) 2.0-2.4(E) 1.5-1.9(F) Below 1.5(G) Not applicable
36. If you expect to Transfer credits, at what level do you expectto enter the new college?
(A) First semester freshman(B) Second semester freshman(C) First semester sophomore(D) Second semester sophomore(E) Junior(F) Senior
The College Board wants its tests and services to he fairand useful to all candidates. Research based on responsesto questions 37 and 38 will help the College Board evaluateand improve its tests and services. Your responses will alsobe reported to your school and to those colleges that acceptsuch information in order to make sure their programs arefair and useful to students of all racial and ethnic back-grounds.
37. How do you describe yourself?
(A) American Indian or Alaskan native(B) Black or Afro-American or Negro(C) Mexican-American or Chicano(D) Oriental or Asian-American or Pacific blander(E) Puerto Rican(F) White or Caucasian(G) Other
38. Is English your best language?
(Y) Yes (N) No
Your responses to questions 39 and 40 will be used only forresearch. They will not be included in the score reportsthat are sent to you. your school, and the colleges you des-ignate.
39. Indicate the highest level of education completed by yourfather or male guardian.
(A) Grade school(B) Some high school(C) High school diploma(D) Business or trade school(E) Some college(F) Bachelor's degree(G) Some graduate or professional school(H) Graduate or professional degreee
40. Using the list in question 39 indicate the highest level of edu-cation completed by your mother or female guardian.
Questions 41 through 43 ask about your parents' financialsituation and should be answered in consultation withthem. Your individual responses will not be reported toanyone. Only summary responses for groups of stockistswill be reported to colleges and high schools,
41. How many persons are dependent on your parent(s) or legalguardian for financial support? Be sure to include ysurparent(s) and yourself.
(A) Two (B) Three (C) Four (0) Ave(E) Six (F) Seven (C) Eight (H) Nine or more
42. During your rust year in college. how many dependent on your parent(s) or legal guardian will be ill college? Include yourself.
(A) One (B) Two (C) Three(D) Four (E) Five or more
8
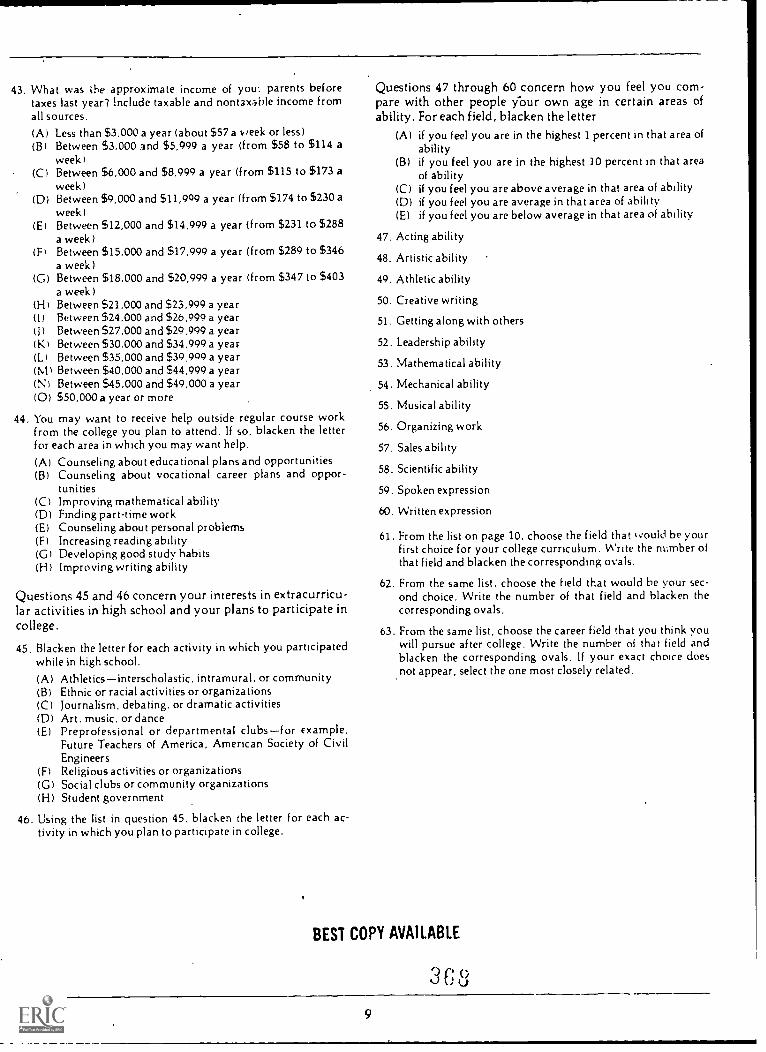
43. What was the approximate income of you parents beforetaxes last year? Include taxable and nontaxable income fromall sources.
(A)(B)
(C)
(D)
(E)
(F)
(G)
Less than $3,000 a year (about $57 a week or less)Between $3,000 and $5,999 a year (from $58 to $114 aweek)Between $6,000 and $8,999 a year (from $115 to $173 aweek)Between $9,000 and $11,999 a year (from $174 to $230 aweek)Between $12,000 and $14,999 a year (from $231 to $288a week )Between $15,000 and $17,999 a year (from $289 to $346a week)Between $18,000 and $20,999 a year (from $347 to $403a week)Between $21,000 and $23,999 a yearBetween $24,000 and $26.999 a yearBetween $27.000 and $29,999 a yearBetween $30.000 and $34,999 a yearBetween $35,000 and $39.999 a yearBetween $40,000 and $44,999 a yearBetween $45,000 and $49,000 a year$50,000 a year or more
44. You may want to receive help outside regular course workfrom the college you plan to attend. If so, blacken the letterfor each area in which you may want help.
(A)(B)
(C)(D)(E)(F)(G)(H)
Counseling about educational plans and opportunitiesCounseling about vocational career plans and oppor-tunitiesImproving mathematical abilityFinding part-time workCounseling about personal problemsIncreasing reading abilityDeveloping good study habitsImproving writing ability
Questions 45 and 46 concern your interests in extracurricu-lar activities in high school and your plans to participate incollege.
45. Blacken the letter for each activity in which you participatedwhile in high school.(A) Athleticsinterscholastic, intramural, or community(B) Ethnic or racial activities or organizations(C) Journalism, debating, or dramatic activities(D) Art, music, or dance(E) Preprofessional or departmental clubsfor example,
Future Teachers of America, American Society of CivilEngineers
(F) Religious activities or organizations(G) Social clubs or community organizations(H) Student government
46. Using the list in question 45, blacken the letter for each ac-tivity in which you plan to participate in college.
Questions 47 through 60 concern how you feel you com-pare with other people y'our own age in certain areas ofability. For each field, blacken the letter
(A) if you feel you are in the highest 1 percent in that area ofability
(B) if you feel you are in the highest 10 percent in that areaof ability
(C) if you feel you are above average in that area of ability(D) if you feel you are average in that area of ability(E) if you feel you are below average in that area of ability
47. Acting ability
48. Artistic ability
49. Athletic ability
50. Creative writing
51. Getting along with others
52. Leadership ability
53. Mathematical ability
54. Mechanical ability
55. Musical ability
56. Organizing work
57. Sales ability
58. Scientific ability
59. Spoken expression
60. Written expression
61. From the list on page 10. choose the field that %vould be yourfirst choice for your college curriculum. lA'rt te the number ofthat field and blacken the corresponding ovals.
62. From the same list, choose the field that would he your sec-ond choice. Write the number of that field and blacken thecorresponding ovals.
63. From the same list, choose the career field that you think youwill pursue after college. Write the number of that field andblacken the corresponding ovals. If your exact choice doesnot appear, select the one most closely related.
BEST COPY AVAILABLE
0 0U
9

Fields of Study in Two- and Four-Year Colleges and Career Choices
100 AGRICULTURE101 agncuture economics102 agronomy. held crops103 animal science104 dory Wince106 terming, ranching108 ?en and game. wildlife
management107 tool science104 horticulturet01 landscaPril110 sot sconces
121 ARCHITECTURE ANDENVIRONMENTAL DESIGN
126 arctutiwure127 city owning128 urban development
150 ART151 all heldry152 commercial153 clang',154 tauten design155 graphic ensI55 interior decorating157 museum *Ott156 photography159 pnnling160 Nude al
175 SIOLOOICAL SCIENCES176 bectenclogy177 biochemistry178 beiogy179 0009nylea160 botany181 ecology152 manse bet.;Y
1113 physiology184 =racy
200201202203
204205206
207206209210211212213
SUSINESS AND COMMERCEISCCOvntingadviellaingppeneas management and
administrationcourt reportingfinance and Pantinghotel and restaurant
administrationindustrial managementmarket rigpersonnel wOrkreal MaleSINS and retailinguscretenal studomtransportation and commerce
225 COMMUNICATIONS226 blm
227 purnaaarn2211 radio and teievison
2818 COMPUTER SCIENCE ANDSYSTEMS ANALYSIS
291 computer sconce252 dell pecceas.ng363 syMerns erselyem
Eft EDUCATION271 agricultural education777 an education278 bus/rose education219 due development an4 nursery
Ilducalion3140 college teaching211 oducattorqi oommatrabon282 education 01 stows:ins' Children243 education of the Cleat2114 *ducats>, 011M rrontaly
retarded255 elementary education216 general eduCallon247 guclancs couneisling288 health educetion289 tome economics education290 industnet ant education291 risuarC education292 phyticai educator,293 recreation294 secondary education295 speech therapy284 rotational Pads and edustroi
education
323 ENGINEERING326 aerospace and aeronautical
engineering327 agriculturo engineering326 rw-condrtioning engineering329 architectural engineering330 ceramic iangmeenrn331 Comical engineenrig332 errs angineenrig333 oonstructen and trarociortatson334 drafting335 evactroal engineering336 engines/mg ode337 engineering dour
soconmwmg ecmnce.328 incluonai arid minicamera
engineering340 industrial laboratory lecnrsOlOgy341 instrumentaton technology342 materials science343 mechanical engineenng344 metallurgical engineering345 mining and mineral erigmeenrig$48 navel architecture and menne
engineering347 mediae, lectinology345 peiroleum engineering349 ptratica technology350 quality control teciinoogy351 surveying352 tomtit engmeenng
371 ENGLISH AND U1ERATURE371 creative girding377 Enseyo371 kieraturs371 agreed
440401402403404
439426427429429
431432433434
ETHNIC STUDIESAmerican Indian sludsseNees studioMencanArroricen NudesSpenrels-Amencan Risks
POREIGN LANGUAGESCleeetcal languagesEselein language*FrenchGarmaninitypreunWtranislatingMayanovershotRumenSpanish
410 FORESTRY ANDCONSERVATION
479 GEOGRAPHY
500 HEALTH AND MEDICALPROFESSIONS
501 dental assisting502 dental hygiene503 dental technology504 heath and safety505 laboratory technology506 medical assisting507 medical records librarian508 medical technology509 nursing--iprecticel510 nursingregistered511 occupational therapy512 optometry513 pharmacy514 physical thersOr515 predenineryidentestry516 prerrodomrrodoine517 pie medicin
you co-1aq mocbc,n,5111 raclidogy and X-ray technology
550 HISTORY AND CULTUPIES561 Amencen552 ancient553 area and regenai564 European
175 HOME ECONOMICS576 Caddlan and leateel1577 tamiy relations578 food and ninriten579 infant and child can540 institution management
LiSRARY SCIENCE
425 MATHEMATICS626 mastics
140 MitLITARY SCIENCE661 c sconce862 merchant manna653 military sconcearmy564 naval Scasesoe
369BEST COPY AVAILABLE
rrt MSC175 competition and INsory677 retrumental music
music hooey571 woes
700 PHOLOSONIT AND RELIGION701 nerealry702 proosopny703 religion704 Moto; y
72$ PHYSICAL SCIENCES726 aoronomy727 cimenotry728 earth Krain011
721 90:407y730 4141410:4010gy731 oceanography132 pAyScal sconces733 physics
750 PSYCHOLOGY751 crod psychology752 esper.rnenlr psycnoogy753 gene's. psychology754 sCoal psychology
771 SOCIAL SCIENCES776 anInroposny777 correction acIminotralion
economics779 hie science710 fOreln 'env*re 1 go.omment servicerponics742 maintnal 'Notions763 interntlenad relators714 are enlOiCementr
0:401 10414100765 points, 'Kenos7118 preisistee787 public administration784 scow wen789 sociology
*CO THEATER ARTS801 acting802 canal803 :mist904 d+41144 era
1125 TRADE AND VOCATIONAL826 amine hotting827 autornot,.. mainienthes526 aviation rniunlenano829 building constructionPO carpentry13 I cosmetology132 mortuary service
900 OTHER
994 UNDECIDED
10

Appendix B
Student Descriptive Questionnaire: 1986
kJ

Student Descriptive Questionnaire (SDQ)Refer to the questions in this section, the Student De-
scriptive Questionnaire, to complete pages 2 and 3 ofyour Registration Form.
Although completing the SDQ is voluntary, it enablesyou to send colleges information about your interests,activities, and plans, along with your test scores. Yourresponses may help counselors and admissions officersto advise you about your college plans. Your answers tomost questions will appear on the score reports that willbe sent to you, your high school, and colleges andscholarship programs you name to receive reports.Your answers to other questions (the questionnaire iden-tifies which ones) will not appear on any score reportsbut will be used for research and planning by educa-tional institutions. You are encouraged to answer allquestions, but you may skip any question you wish.Most of the questions are addressed to students still inhigh school It you are no longer in school, answer themas well as you can.
This SDQ was introduced in 1985-86 If you have notconipleted the SDQ for any test date since October
1985, you should answer this SDQ because earlier in-formation will not appear on score reports.
Making Changes in Your SDQYou need to complete this SDO only once. If you reg-
ister for a subsequent test date, you can change thoseanswers that you want updated. However, you must an-swer the entire question because your new answer willcompletely replace your previous answer. For example,if you have taken a calculus course since the last timeyou answered the SDQ and want to update your SDOby including this information, you must record all yourprevious math courses as well as calculus, even thoughyou recorded these courses the first time you answeredthe SDO. Your previous answers to all other questionswill contin- ie to be reported as they were to high schoolsand colleges.
You can make changes in your SDQ at any time bycalling College Board ATP, 609-771-7600
1 Ind,cate the total number of years ofnigh school courses (in grades 9through 12) you have taken or plan totake :n each of the subjects listed be-low If yOu have not taken any coursein a subject and do not plan to takeone in high school. fill in the oval in the."None.' column. If you repeat acourse count it only once If one (ormore) of the courses Is an advancedplacement. accelerated or honorscourse NI in the oval in the "Honors"column.
In
Arts and Music (for example, art. mu-sic, art history. dance theater)
English (for example. composition.grammar, or literature)
Foreign and Classical LanguagesMathematicsNatural Sciences (for example. biol-
ogy chemistry, or physics)Social Sciences and History (for exam-
ple history, government, or geogra-phy)
questions 2-5, using the same guide-'ines as in question 1. Indicate the totalnumber of years you have taken or planto take the specific courses listed.
Coo?, grit
2. Foreign and Classical Languages
FrenchGermanGreekHebrewItalianLatinRussianSpanishOther language courses
3. Mathematics
AlgebraGeometryTrigonometryPrecalculusCalculusComputer MathOther mathematics courses
4. Natural Sciences
BiologyChemistryGeology or related Earth or
SciencesPhysicsOther science courses
Space
5 Social Sciences and History
U S HistoryU S Government or CivicsEuropean HistoryWorld History or CulturesAncient HistoryAnthropologyEconomicsGeographyPsychologySociologyOther social science or h'story courses
6. Please enter the average grade forall courses you have already taken ineach subject
If only pass-fail grades were as-signed and you received a passinggrade. fill in the oval in the 'Passcolumn Do not fill in a grade oval ifyou fill in a "Pass" oval
A or excellent (usually 90-100)B or good (usually 80.89)C or fair (usually 70.79)0 or passing (usually 60-69)E or F or failing (usually 59 or below)Pass
Arts and MusicEnglishForeign and Classical LanguagesMathematicsNatural SciencesSocial Sciences and Hstory
1986 by College Entrance Exam.nat,on Board and Educalonai resr.ng Service An r ghts reserved 1 1
371

For gLiest ons 7 through 9 please provideinformation about the content of someof your high school courses and re-lated activities out of class. (You maymark more than one in each sublect area )
7 English coursework or experience
a American Literatureb. British Literaturec Compositiond Grammare Literature of a country other than
the United States or Britainf Literature of different historical
per odsg Speak-rig and listening skillsn English as a second language
8 Art and Music coursework or expe-riencea I have had no coursework or expe-
rience in this area.b. Acting or the production of a playc Art history or art appreciationd. Dancee Drama or theater for appreciationf Music nistory, theory, or appreci-
ationg Mus o. instrumental or vocal per-
formancen Photography or Hmrnaking
Studio art and design
9 Computer coursework or exper.ence
a I naive had no ccursework or expe-rience ri this area
b Corrput,Jr teracy. awareness, orappeciation
c Data processingd. Computer programming (BASIC.
COBOL. FORTRAN, PASCAL.etc )
e Use of the computer to solve mathproblems
Use of the computer to solve probeterns in the social sciences
g Use of the computer to solve prob-lems in the natural sciences
n Use of the computer in Englishcourses
Word processing (use of the com-puter in writing letters or prepar-ing papers)
12
10. Please indicate your cumulativegrade point average for all academicsubjects in high school
A + (97-100)A (93-96)A - (90-92)8 + (87-89)B (83-86)B- (80-82)C+ (77-79)C (73-76)C - (70-72)D+ (67-69)D (65-66)E or F (below 65)
11. What Is your most recent highschool class rank? (For example. ifyou are 15th in a class of 100. you arein the second tenth ) If you do notknow your rank, please check withyour high school guidance counselorIf rank is not used in your school, giveyour best estimate.
a. Highest tenth I in theb Second tenth top fifthc. Second fifthd Middle fifthe Fourth fifthf Lowest fifth
12 In addition to regular class work, manystudents are involved in activities thatreflect their abilities and interestsThese include community service andinvolvement, extracurricular and out-of-school activities, and individual en-deavors. Indicate in which gradesyou participated or will participateIn the activities listed below.
If you held a major office or positionof leadership in an activity (for exam-ple, class president, varsity team cap-tain. officer of a statewide organ-ization), fill in the oval in the "Officer"column Remember to include activi-ties and accomplishments that are notschool sponsored as well as your ex-tracurricular activities.
If you have received an award orspecial recognition for achievement inan activity (for example, school prizefor music or writing, varsity letter, re-gional science fair prize, state orches-tra), fill in the oval in the columnmarked "Award."
Academic honor societyArt activityAthletics Intramural. junior varsity. or
community sportsAthletics Varsity or amateur-level
sportsCareer - oriented activity (for example.
Future Teachers of America. FutureFarmers of America, Future Home-makers)
Community or service activity if.-ample, volunteer work. neigrhood clean-up or patrol groupScouting, 4-H. Key Club)
Computer activity (for example. a urier's group, computer club. learn.ngto use a computer on your own)
Dance activityDebating or public speakingEthnic or cross-cultural activity (for ex
ample, Black student organ.zat noHispanic club, international folkdancing)
Foreign exchange or study ahroariprogram
Foreign language activityGovernment or political actiu-ty (fnr Pk
ample, student government hcnnrsCouncil. working on a political campaign. human rights or civil rightsactivity in your community)
Journalism or l,terary activity (fnr ex_ample, creat:ve writing, yearhnekschool newspaper. communit.:newspaper)
Junior Reserve Officers Training CornsMusic Instrumental (for example h
school band, community orchestrasolo work)
Music Vocal (for example. glee clubchorus. solo work)
Religious activity or organ-zationScience or mathematics activity
example, math club, ecolnc,,,environmental group science lairprotect)
School-spirit activity (for examplecheerleading. drill team)
Theater activity (for example. car%nity or school production, ac!stage crew)
Work. Cooperative work programWork Part-time job. not school raiatelOther activity not listed
I have not participated in any of trioabove activities.
13. Please indicate the sports in whichyou have participated. (Youmark up to six sports )
I have not participated in any son'a. Archeryb. Badmintonc. Baseballd Basketballe Bowlingf; Boxingg. Cross-countryh. Diving
FencingField hockey
k. Football
Im
GolfGymnast ics
n Handball(continued in next

o Horseback ridingp Ice hockeyq. Lacrosser. Paddleballs. Racquetballt. Rifleryu. Rowing (crew)v. Rugbyw Sailingx. Skiingy. Skin divingz. Soccer0 Softball1. Squash2 Swimming3. Table tennis4 Tennis5. Track and field6 Volleyball7. Water polo8 ..nestling9 Other
Questions 14 through 19 ask about thekind of college or university you are inter-ested in attending during your first year incollege. There are no "right" or "wrong"answers, and you may mark as many pref-erences as you like. If you do not have anidea about the kind of college or universityyou'd like to attend, fill in the last oval,"Undecided."
14 What type(s) of institution are youinterested in attending? (You maymark more than one.)
a A four-year college or universityb. A two-year community or junior
collegec. A vocational/technical schoold. Undecided
15. Which of the following are you con-sidering? (You may mark more thanone.)
a. A public university, state college, orcommunity college
b. A private university, college, or ju-nior college (not religiously affil-iated)
c. A private, religiously affiliated uni-versity, college, or junior college
d Undecided
16. What size college(s) are you think-ing of attending? (You may markmore than one.)
a.b.
c.a.e.
f.
Less than 1,000 studentsAbout 1,000 to 5,000 studentsAbout 5,000 to 10,000 studentsAbout 10,000 to 20,000 studentsMore than 20,000 studentsUndecided
17. What college setting(s) do you pre-fer? (You may mark more than one.)
a. Large city or metropolitan areab. Medium-size cityc. Small city or townd. Suburban communitye. Ruralf. Undecided
18. Where would you like to go to col-lege? (You may mark more than one.)
a. Close to homeb. In my home statec. In a state bordering mined. Beyond states bordering minee. Outside the United Statesf. Undecided
19. What type(s) of college are youconsidering? (You may mark morethan one.)
a. All women or all menb. Coeducationalc. Undecided
20. What is the highest level of *duds-tion you plan to complete beyondhigh school? (Mark only one.)
a. Specialized training or certificateprogram
b. Two-year associate of arts or sci-ences degree (such as AA, AAS,or AS)
c. Bachelor's degree (such as BA orBS)
d. Master's degree (such as MA,MBA, or MS)
e. Doctoral or related degree (suchas PhD, JD, MD, DVM)
OtherUndecided
f.
g
A list of both general (bold type) and spe-cific majors or areas of study in college ison page 15. Related areas or majors areindicated in parentheses. Although you donot need to know what your "major" in col-lege will be, we would like you to mark thesubject area or areas that interest you. Inquestions 21, 23, 24, 25, and 26 you mayindicate the specific or general areas ofstudy that you are considering. If you havenone, please fill in number 999 (Un-decided).
21. Indicate the major or area of studythat is your first choice. Write in thecode number and fill in the appropriateoval under each digit.
22. How certain are you about your firstchoice of major or area of study?
Very certainFairly certainNot certain
BES1 COPY AVAILABLE
373
23-26. Indicate up to four other majorsor areas of study that Interest you.
27. The College Board sponsors variousservices and publications to help stu-dents and their families plan for col-lege. Occasionally, we may want to no-tify you of these opportunities. Wouldyou and your family like to receiveannouncements about these ser-vices and publications?
YesNo
28. Is your parent's address the sameas your mailing address on thisRegistration Form?
YesNo
29. Some colleges allow well-preparedstudents to skip required introductorycourses and take advanced course-work instead. This exemption is some-times based upon the results of testssuch as Advanced Placement Exami-nations, Achievement Tests, and testsof the College-Level Examination Pro-gram. Some colleges give their ownplacement or "credit by examination"tests. Mark each subject area inwhich you plan to apply for ad-vanced placement, credit by exami-nation, or exemption from courses.a.b.c.d.e.f.
gh.i.
k.I.
ArtBiologyChemistryComputer ScienceEnglishForeign LanguagesHumanitiesMathematicsMusicPhysicsSocial StudiesI don't plan to apply for exemptionfrom these courses
30. You may want to receive help outsideregular coursework from the collegeyou plan to attend. If so, indicateeach area In which you may wanthelp.
a.b.
c.
d.
e.
Developing educational plansDeveloping vocational/career or
placement plansDeveloping better study skillsImproving mathematical skillsImproving reading skillsImproving writing skillsI don't plan to ask for help in these
areas.
13
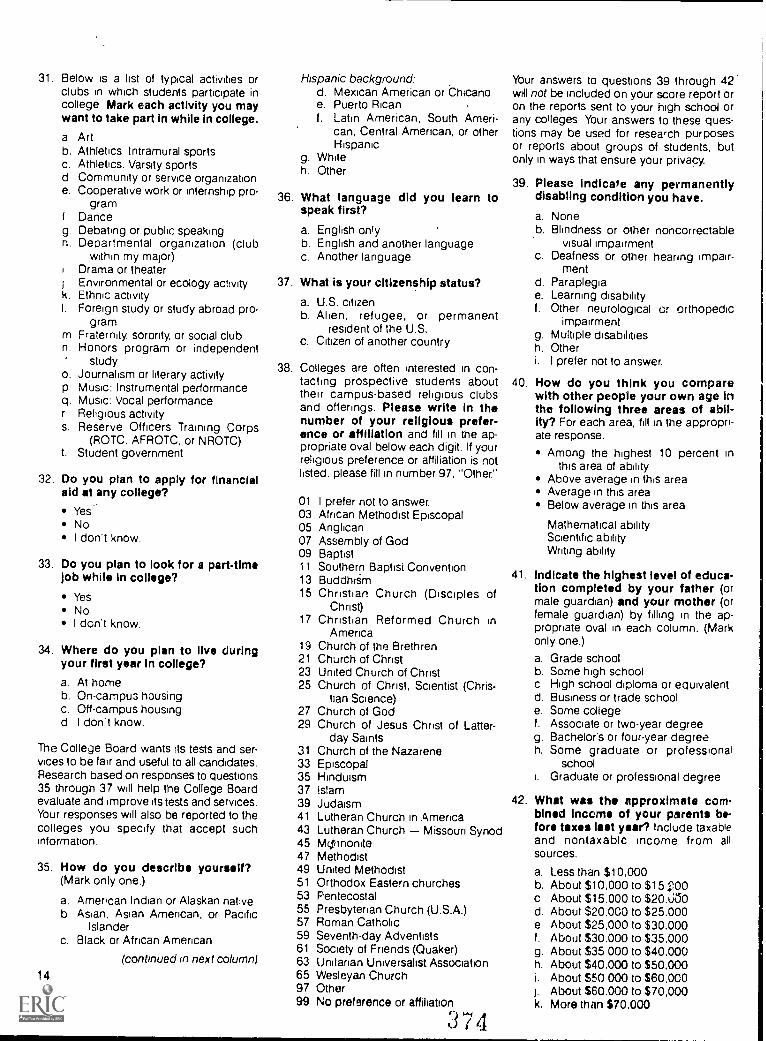
31. Below is a list of typical activities orclubs in which students participate incollege Mark each activity you maywant to take part in while in college.
a Artb. Athletics Intramural sportsc. Athletics. Varsity sportsd Community or service organizatione. Cooperative work or internship pro-
gramf Danceg. Debating or public speakingn. Departmental organization (club
within my map)Drama or theaterEnvironmental or ecology activity
k. Ethnic activityI. Foreign study or study abroad pro-
gramm Fraternity, sorority, or social clubn. Honors program or independent
studyo. Journalism or literary activityp Music: Instrumental performanceq. Music: Vocal performancer Religious activitys. Reserve Officers Training Corps
(ROTC. AFROTC, or NROTC)t. Student government
32. Do you plan to apply for financialaid at any college?
YesNoI don't know.
33. Do you plan to look for a part-timeJob while In college?
YesNoI don't know.
34. Where do you plan to live duringyour first year In college?
a. At homeb. On-campus housingc. Off-campus housingd I don't know.
The College Board wants its tests and ser-vices to be fair and useful to all candidates.Research based on responses to questions35 through 37 will help the College Boardevaluate and improve its tests and services.Your responses will also be reported to thecolleges you specify that accept suchinformation.
35. How do you describe yourself?(Mark only one.)
a. American Indian or Alaskan nativeb Asian, Asian American, or Pacific
Islanderc. Black or African American
(continued in next column)14
Hispanic background:d. Mexican American or Chicanoe. Puerto Ricanf. Latin American, South Ameri-
can, Central American, or otherHispanic
g. Whiteh. Other
36. What language did you learnspeak first?
a. English onlyb. English and another languagec. Another language
Your answers to questions 39 through 42MI not be included on your score report oron the reports sent to your high school orany colleges Your answers to these ques-tions may be used for research purposesor reports about groups of students, butonly in ways that ensure your privacy.
39. Please indicate any permanentlyto disabling condition you have.
a. Noneb. Blindness or other noncorrectable
visual impairmentc. Deafness or other hearing impair-
mentd. Paraplegiae. Learning disabilityf. Other neurological or orthopedic
impairmentMultiple disabilitiesOther
i. I prefer not to answer.
40. How do you think you comparewith other people your own age inthe following three areas of abil-ity? For each area, fill in the appropri-ate response.
37. What is your citizenship status?
a. U.S. citizenb. Alen, refugee, or permanent
resident of the U.S.c. Citizen of another country
38. Colleges are often interested in con-tacting prospective students abouttheir campus-based religious clubsand offerings. Please write In thenumber of your religious prefer-ence or affiliation and fill in the ap-propriate oval below each digit. If yourreligious preference or affiliation is notlisted, please fill in number 97, "Other."
01 I prefer not to answer.03 African Methodist Episcopal05 Anglican07 Assembly of God09 Baptist11 Southern Baptist Convention13 BuddhiSm15 Christian. Church (Disciples of
Christ)17 Christian Reformed Church
America19 Church of the Brethren21 Church of Christ23 United Church of Christ25 Church of Christ, Scientist (Chris-
tian Science)27 Church of God29 Church of Jesus Christ of Latter-
day Saints31 Church of the Nazarene33 Episcopal35 Hinduism37 Islam39 Judaism41 Lutheran Church in America43 Lutheran Church Missouri Synod45 Mcpinonite47 Methodist49 United Methodist51 Orthodox Eastern churches53 Pentecostal55 Presbyterian Church (U.S.A.)57 Roman Catholic59 Seventh-day Adventists61 Society of Friends (Quaker)63 Unitarian Universalist Association65 Wesleyan Church97 Other99 No preference or affiliation
9h.
Among the highest 10 percent inthis area of ability
Above average in this areaAverage in this areaBelow average in this area
Mathematical abilityScientific abilityWriting ability
41. Indicate the highest level of educa-tion completed by your father (ormale guardian) and your mother (orfemale guardian) by filling in the ap-inpropnate oval in each column. (Markonly one.)
a. Grade schoolb. Some high schoolc High school diploma or equivalentd. Business or trade schoole. Some collegef. Associate or two-year degreeg. Bachelor's or four-year degreeh. Some graduate or professional
schoolGraduate or professional degree
34
42. What was the approximate com-bined Income of your parents be-fore taxes last year? Include taxableand nontaxablc income from all
sources.
a. Less than $10,000b. About $10,000 to $15 00c About $15.000 to $20.00d. About $20.000 to $25,000e About $25,000 to $30.000f. About $30,000 to $35,000g. About $35 000 to $40,000h. About $40.000 to $50,000i. About $50 000 to $60,000j. About $60,000 to $70,000k. More than $70,000
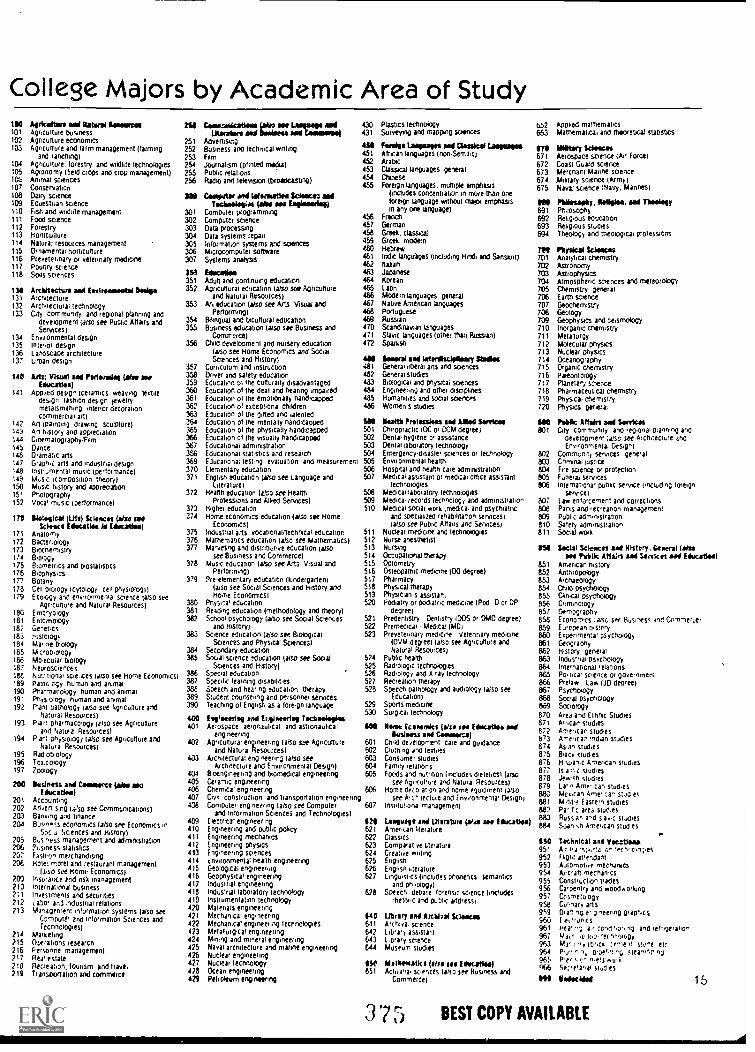
College Majors by Academic Area of Study110101102103
104105103i107108109110111112113114115116117
118
134131132133
134136136137
140
141
142143
144145146147148149150151152
170
171
177173174175176177178179
18018118218318418518618718e189190191t92
193
194
195196197
200
201202203204
205766207208
700210211212213
214215216217218219
Asidcattiet sad Utopia llomiertenAgriculture businessAgriculture economicsAgriculture and farm management (farming
and ranching)Agriculture. forestry and wildlife technologiesAgronomy (held crops and crop management)Animal sciencesConservationDairy scienceEauestrian scienceFish and orndlife managementFood scienceForestryHorticultureNatural resources managementOrnamental horticulturePreveterinary or veterinary medicinePoultry scienceSods sciences
Arcbiteeturs and Environsastal 04raloaArchitectureArchitecture: technologyCity community and regional planning and
development (also see Public Aftairs andServices)
Environmental designInterior designLandscape architecturetuman design
Arts: Visual add !Wendel (atra sotErhocatle4)
Apnea oesign (ceramics weaving textiledesign fashion design jewelrymetaismithing interior decorationcommercial art)
AA ipaintin drawing sculpture)Al history and appreciationCinematography:FilmDanceDramatic artsGraphic arts and industriai designinsnmentai music (performance)Music 'composition theOrY1Music history and appreciationPhotographyVocal music tperlormancel
Bleteilcai (Use) Sciences Oise seeSciesco Edwcatlea 44 Edward*
AnatomyBacteriologyBiochemistryBicnogyBiometrics and biOStatiStiCSBiophysicsBotanyGel biology icytology cd physeiggy)Ecoiogy and enynonmenia science (also sue
Agrcutture and Natural Resources)EmbryologyEntomodgyGeneticsNsloiogyMar lie niofogyMicrobiologyMo ecular biologyNew osoencesNurntionai sciiceS lasso see Home Economics)Paton opal human and animalPhimarolugy human and animalPhysioiony human and animalPant pathology Dino see ficnicunure and
Natural Resources)Pian" pharmaCOiogy te:S0 See Agriculture
and Nature Resouices)Plant onasenogi (arSC see Agriculture and
Natura Resources)RadioniologyTox.cology7ocuogy
IlesIneu an41Cdowerca oleo/*redline)
AccountingAd(ert sng also see CernmurricationS)Banking and financeBusints economics (also see Economics in
Sciences and History)Bus mess management and administrationpcsiness statisticsFashion merchandrtangHoleL motel and restaurant management
Eliso see Home Economics)Insurance and 0514 managementInternational DusineSSInvestments and Securitiesx lbw and industrial relationsManagement infurrnatio systems (also see
Cnmoin and information Sciences andTechnologies)
MarketingNitrations researchPersonne managementRea- estateReCieal.31. tourism and travel1 ansoonlalon and commerce
2W
251252253254255256
344
301302303304305306307
313351352
353
354355
356
357358359360361362363364365366367356369370371
371
373374
375376377
378
379
380381382
383
384385
386387388389390
400401
402
403
404405406407438
409410411412413414415416417418419420421422423471425426427428429
Cdoevoredestlead OW we 14=1iWader* awl Wrlaelts mad
AdvertisingBusiness ana technical writingFilm
Journalism (printed model)Public relationsRadio and tiftevisoco (broadcasting)
Computar art latenatalies Scriesem salTotbablegin IMu law Eallsearli41
Computer programmingCampine( scienceData processingData systems repairtnformation systems and sciencesMicrocomputer softwareSystems analysis
Educ41144Adult and continuing educationAgricultural education (also SOS Agriculture
and Natural Resources)An education (also one Arts Visual and
Performing)&impel and bicultural educationBusiness education (also see Business and
Commerce)Child development and nursery education
(also see Home Economics and SocialSciences and History(
Curriculum and instructionDriver and safety educationEducation or the culturally disadvantagedEducation of the deaf and hearing impairedEducation of the emotionally handicappedEducation of excephonii childrenEducation of the Dated and ialentedEducation of tne mentally handicappedEducation of the physically handicappedEducation of the visually handicappedEducational administrationEducational statistics and researchEJucationar test:rig evaluation and measurementElementary educationEnglish education paso see Language and
Literature)Hearth education (eso see Hearth
Professions and ',fixed Services)Michel educationHome economics education (also see Home
Economics)Industrial arts vocationatnechnical educationMathematics education ta/so see Mathematics)Marketing and distributive education (also
see Business and Commerce)Music education (also see kris Visual and
Perlorming)Pre-elementary education (kmderganent
(LSO see Social Sciences and History andHome Economics)
Physical educationReading education (nethodorogy and theory)Stmool psychology (also see Social Sciences
and History;Science education (also see Biological
Sciences and Physical Sciences)Secondary educationSocial science education (also See Social
Sciences and History)Special educationSpecific learning disabiliesSpeech and sear rag education therapyStudent counseiing and peisonnel servicesTeaching of English as a forego language
EbitaddrIra and EtOetrIng TocbodlegisaAerospace aeronautical and astronautical
engineeringAgricultural engineering (also roe Agriculture
and Nature; Resources)Aichitectuial eng neenn; (also see
Arcntectu,e and Environmental Design)Bioengineering and biomedical engineeringCeramic engineeringChemical engineeringCivn construction and transportation engineeringComputer engineering (also see Compute,
and Information Sciences and Technotoges)Electrical engineeringEngineering and public policyEngineering mechanicsEngineering phySICSEngineeiing sciencesenvironmental health engineeringGeological engineeringGeophysicai engineeringIndustrial engineeringIndushal laboratory technologyInstrumentation technologyMaterials engineeringMechanicai engineeringMechanical engineering lechnologieSMetallurgical engineeringMining and mineral engineeringNaval architecture and marine engineeringNuclear engineeringNuclear lechnolOgyOcean engineeringPetroleum engineering
430431
451451452453454456
456457458459460461462463464465466467468469470471472
4411481482483484485486
MAI501
502503504505506507
506509510
511512513514515516517518513520
521522523
524525526527528
606
607
121621622623624625676627
678
$40641647643644
$88651
Ptastics technologySurveying and maoptrtg soences
Feeslia Laapages add Classical LampoonAfrican languages (nOn.SemiliC)ArabicClassical languages generalChineseForeign languages. maniple emphasis
(includes concentration in mute than oneforeign Language without MaKil emphasisin any one Language)
FrenchGermanGreek. classicalGreta modemHebrewIndic languages (including Hindi and Sansant)ftakanJapaneseKoreanLashModern languages generalNative Arnencan languagesPortugueseRussianScandinavian LanguagesSlavic languages (other than Russian)Spanish
Ismsesl add lalardbciplissey StrandGeneral liberal arts and sciencesGeneral studiesBiological and physical sciencesEngineering and other disciplinesHumanities and social sciencesWomen s studies
Natty Proleasloss aid Mod SwigsCbitopracitc (DC or DCM degree)Dental hygiene or assistanceDental laboratory technologyEmergency-disaster sciences or technologyEnvironmental healthHospital and Neill'', care administrationMedical assistant or medicai office assistant
technologiesMedical laboratory technologiesMedea, records lechnoiogy and administrationMedical SOCial work (media, and psychiatric
and specialized rehabilitation services)(also see Pubic Affairs and Senncts)
Nuclear medicine and technologiesNurse anesthetistNursingOccupational teerk.lyOptometryOsteopathic medicine (DO (degree)PharmacyPhysical therapyPhysician s assstar.Podiatry or poninric medicine (Pod D or DP
degree)Predentistry Dentistry 1005 or DUD degree)Premedical Medical (4401Prevetelinary medicine Vetennary medicine
(DVM degree) (also see Agriculture andNatural Resouices)
Public healthFlagon:pie technologiesRadiology and X ray technologyRecreation therapySpeech pathology and audiology (also see
Education)Sports medicineSurgical technology
Nook Econeridcs (41:41 ado Ellourtlea adlullarti sad Caourer-A)
66,41 de velopment care and guidanceClothing and textilesConsumer studiesFamily relationsFoods and nutrition (includes dietetics) Idso
see Agri:Owe and Naval Resources)Home PC n'aliOn and home equipment (arso
Set In-.' lecture and invironmentar Design)Instiheipria management
LAIIIII/111 and Ltlarabrri (aloe nee Educating)American liter alur eClassicsComparat,ae literatureCreative wiltingEnglishEnglish ineratureLinguisres (includes phonetics semantics
and ph untidy)Speech debate forensic scence finClodeS
rhetoric and public address]
library led Arcldrit SeldomAttch,ri sciencelibrary assistant1.4:vary scienceMuseum %dm
blatbdroatk (aryd Ill Edvestl4(Actuiriai sciences WHO see Business and
Commerce)
tin2663
Applied malnemalicsMathematic/l and theoretical statistics
WM Mary kleacad671 Aerospace science (An Force)672 Coast Guard science673 Merchant Marine science674 Military science (Army)675 Naval science (Navy. Manner)
Pldiablopby, 04441414, and Tbselely691 Phicisonny692 Religious education633 Religious studies694 Theology arid thecuogicai prolessions
100 rbysical fames701 Analytical chemistry702 Astronomy703 Astrophysics701 Atmospheric sciences and meteorology705 Chemistry general706 Earth science707 Geochemistry706 Geology709 Geophysics and seismology710 Inorganic chemistry711 Metallurgy712 Molecular physics7t3 Nuclear physics711 Oceanography715 Organic chemistry716 Ppeontology717 Pianetarn scene718 Pharmaceutical chemistry719 Physcai chemistry720 Physics ortrar
1140
801
802803604005806
607808809810811
851852653654855856857858859860861862863864865866867868869870871822673874875876827878879880881682883684
Nitric Affairs dad SWAGSCity community and ,egOnal panning and
pe,eippenen! ;a5p see 4,00.ecive EndEnvironmenta, Design)
COmmunly seninCtS generalCriminal anticsFire science of protectionFuneral servicesmtemarona puohc service (including foreign
Sere,CelLaw enronernem and correctionsPans and recreation managementPublic administrationSafety administrationSocial work
facial Sae-acts and *eery. General (atmAffairs sad Sinker art Educ404141
American historyAnthropologyArchaeologyChild PsytholhttYConical psychoogyCriminologyDemographyEconomics IaisC see Business ale Comment,Leonean historyEiperimenta1 psychologyGeographyHistory generalIndustrial psychologyInternational i etationsPoi tica' science or govenmentPieta* Law (30 degree)PSychOlOgySocial pSychClogySociologyArea and Ethnic StudiesArian studiesArneican studiesAmetan mdian studiesAsian studiesBut. stud esH wane American scud eSIS am C studiesJess-Sh studiesLa' n Amit,:an studiesMetcan Amer can stud esM da a Easter studiesPar I c area studiesPuss an and Sao: slodieSSpan sh American stud es
95t Air a !ec
953 Aulomon.e mechanics
995545 CoA"ric4inucmlitoCnh tarnad. CeSS
956 na-sperni-elturyoagnyci woodworixng
957958 Cu,nary arts959 Oral ng r g "leering giaptl.cs960 I lei Ironies961 Her "; a r con and reIngieralion963962
969645 her s966 Sent'anai slun.es
Vareekled
3 7 5 BEST COPY AVAILABLE
1411111101.
15
ii
Appendix C
Definitions of Major Field Categories in SCIENCE Tables
0 "7 0tot

Definitions of Major Field Categories in SCIENCE Tables
Major field
(as labeled in table)
MATH & STATISTICS
COMPUTER SCIENCE
PHYSICAL SCIENCES
ASTRONOMY
CHEMISTRY
PHYSICS
Included
Prior to 1986
mathematics
statistics
computer science &
systems analysis
computer science
systems analysis
astronomy
chemistry
physics
(Continued)
Included
in 1986
mathematics
actuarial sciences
applied mathematics
mathematical & theoretical
statistics
computer & information
sciences & technologies
computer programming
computer' science
information systems & sciences
microcomputer software
systems analysis
astronomy
astrophysics
planetary sciences
analytical chemistry
chemistry, general
inorganic chemistry
organic chemistry
physical chemistry
molecular physics
nuclear physics
physics, general
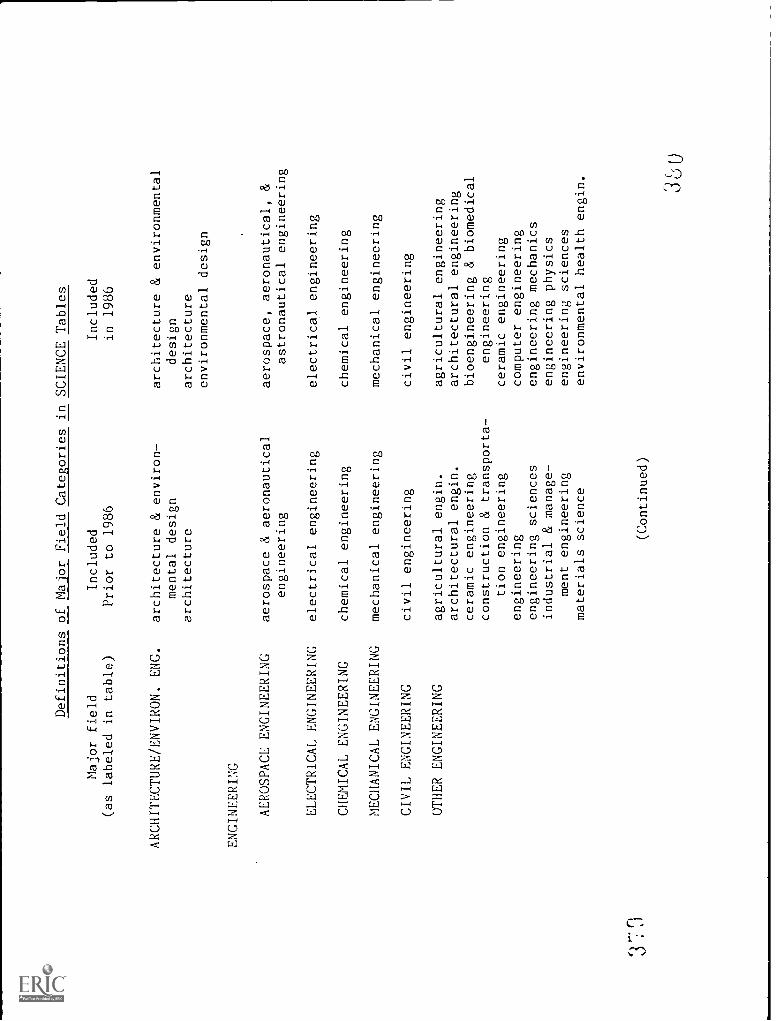
Definitions of Major Field Categories in SCIENCE Tables
Major field
(as labeled in table)
ARCHITECTURE/ENVIRON. ENG.
ENGINEERING
AEROSPACE ENGINEERING
ELECTRICAL ENGINEERING
CHEMICAL ENGINEERING
MECHANICAL ENGINEERING
CIVIL ENGINEERING
OTHER ENGINEERING
Included
Prior to 1986
architecture & environ-
mental design
architecture
aerospace & aeronautical
engineering
electrical engineering
chemical engineering
mechanical engineering
civil engineering
agricultural engin.
architectural engin.
ceramic engineering
construction & transporta-
tion engineering
engineering
engineering sciences
industrial & manage-
ment engineering
materials science
(Continued)
Included
in 1986
architecture & environmental
design
architecture
environmental design
aerospace, aeronautical, &
astronautical engineering
electrical engineering
chemical engineering
mechanical engineering
civil engineering
agricultural engineering
architectural engineering
bioengineering & biomedical
engineering
ceramic engineering
computer engineering
engineering mechanics
engineering physics
engineering sciences
environmental health engin. 3 6
()

Definitions of Major
Major field
(as labeled in table)
OTHER ENGINEERING
(Continued)
LIFE SCIENCES
AGRICULTURE
381
Field Categories in SCIENCE Tables
Included
Prior to 1986
mining and mineral
engineering
metallurgical engineering
naval architecture & marine
engineering
petroleum engineering
textile engineering
materials science
agriculture
agriculture economics
agronomy, field crops
animal science
dairy science
farming, ranching
landscaping
food science
horticulture
soil sciences
(Continued)
Included
in 1986
geological engineering
geophysical engineering
materials engineering
metallurgical engineering
mining and mineral engineering
ocean engineering
naval architecture & marine eng.
nuclear engineering
petroleum engineering
industrial engineering
engineering & engineering
technologies
agriculture & natural
resources
agriculture business
agriculture economics
agriculture & farm management
agriculture, forestry &
wildlife technologies
agronomy
animal sciences
dairy science
equestrian science
food science
horticulture
ornamental horticulture
poultry science
soils science
landscape architecture
382
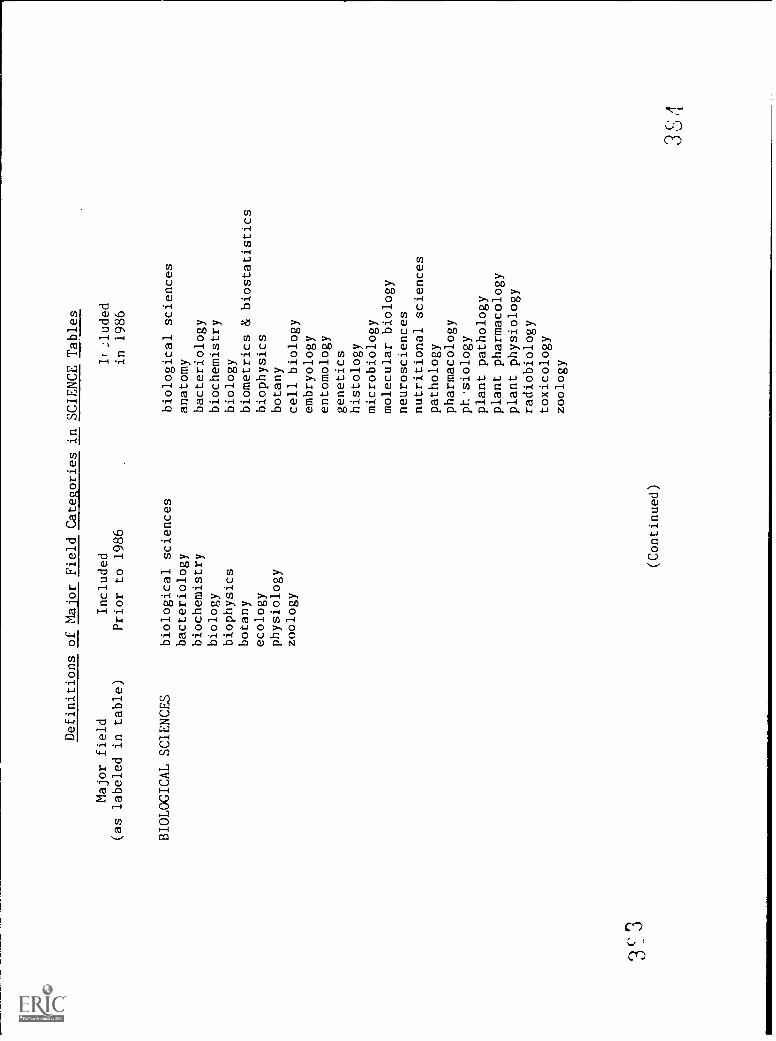
Definitions of Major Field Categories in SCIENCE Tables
Major field
(as labeled in table)
BIOLOGICAL SCIENCES
Included
Prior to 1986
biological sciences
bacteriology
biochemistry
biology
biophysics
botany
ecology
physiology
zoology
(Continued)
Ir:luded
in 1986
biological sciences
anatomy
bacteriology
biochemistry
biology
biometrics & biostatistics
biophysics
botany
cell biology
embryology
entomology
genetics
histology
microbiology
molecular biology
neurosciences
nutritional sciences
pathology
pharmacology
ph.siology
plant pathology
plant pharmacology
plant physiology
radiobiology
toxicology
zoology
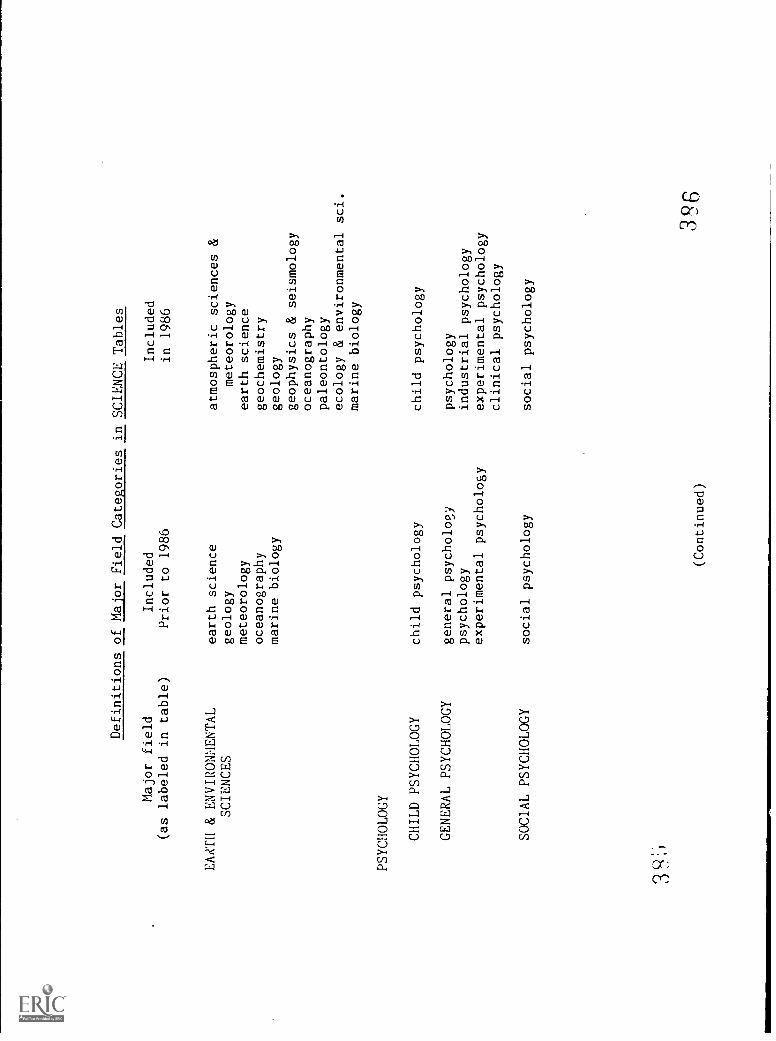
Definitions of Major Field Categories in SCIENCE Tables
Major field
(as labeled in table)
EARTH & ENVIRONMENTAL
SCIENCES
PSYCHOLOGY
CHILD PSYCHOLOGY
GENERAL PSYCHOLOGY
3w
Included
Prior to 1986
earth science
geology
meteorology
oceanography
marine biology
child psychology
general psychology
psychology
experimental psychology
SOCIAL PSYCHOLOGY
social psychology
(Continued)
Included
in 1986
atmospheric sciences &
meteorology
earth science
geochemistry
geology
geophysics & seismology
oceanography
paleontology
ecology & environmental sci.
marine biology
child psychology
psychology
industrial psychology
experimental psychology
clinical psychology
social psychology
396
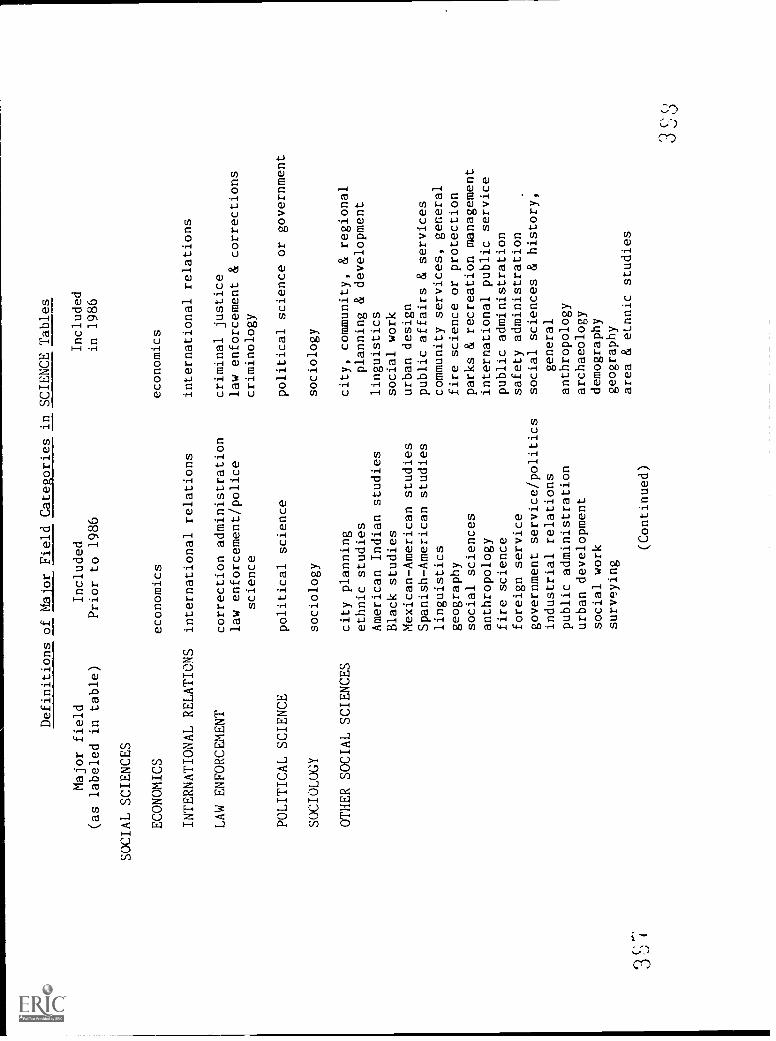
Definitions of Major Field Categories in SCIENCE Tables
Major field
(as labeled in table)
SOCIAL SCIENCES
ECONOMICS
Included
Prior to 1986
economics
INTERNATIONAL RELATIONS
international relations
LAW ENFORCEMENT
POLITICAL SCIENCE
SOCIOLOGY
OTHER SOCIAL SCIENCES
correction administration
law enforcement/police
science
political science
sociology
city planning
ethnic studies
American Indian studies
Black studies
Mexican-American studies
Spanish-American studies
linguistics
geography
social sciences
anthropology
fire science
foreign service
government service/politics
industrial relations
public administration
urban development
social work
surveying
(Continued)
Included
in 1986
economics
international relations
criminal justice
law enforcement & corrections
criminology
political science or government
sociology
city, community, & regional
planning & development
linguistics
social work
urban design
public affairs & services
community services, general
fire science or protection
parks & recreation management
international public service
public administration
safety administration
social sciences & history,
general
anthropology
archaeology
demography
geography
area & elnnic studies
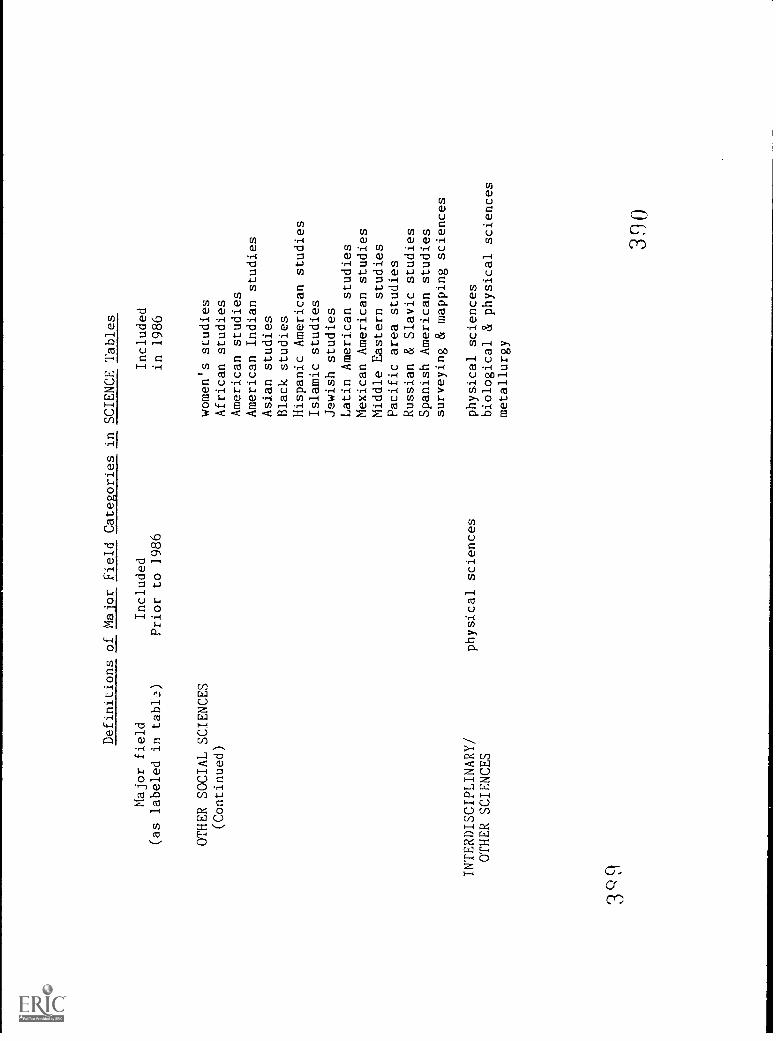
Definitions of Major Field Categories in SCIENCE Tables
Major field
(as labeled in table)
OTHER SOCIAL SCIENCES
(Continued)
INTERDISCIPLINARY/
OTHER SCIENCES
3Q9
Included
Prior to 1986
physical sciences
Included
in 1986
women's studies
African studies
American studies
American Indian studies
Asian studies
Black studies
Hispanic American studies
Islamic studies
Jewish studies
Latin American studies
Mexican American studies
Middle Eastern studies
Pacific area studies
Russian & Slavic studies
Spanish American studies
surveying & mapping sciences
physical sciences
biological & physical sciences
metallurgy
330
Appendix D
Definitions of Major Field Categories in NON-SCIENCE Tables
39/

Definitions of Major Field Categories in NON-SCIENCE Tables
Major field
(as labeled in table)
PRE-MEDICINE
OTHER HEALTH FIELDS
392
Included
Prior to 1986
pre-medicine
predentistry/dentistry
preveterinary medicine/
veterinary medicine
nursing, practical
nursing, registered
physical therapy
speech therapy
health & medical professions
dental assisting
dental hygiene
dental technology
health & safety
laboratory technology
medical assisting
medical records librarian
medical technology
occupational therapy
optometry
pharmacy
radiology & xray technology
(Continued)
Included
in 1986
pre-medicine
predentistry/dentistry
preveterinary medicine/
veterinary medicine
nursing
physical therapy
health professions &
allied services
chiropractic
dental hygiene or assistance
dental laboratory technology
emergency/disaster sciences
or technology
environmental health
hospital & health care
administration
medical assistant or medical
office assistant technology
medical laboratory technology
medical records technology
& administration
medical social work
nuclear medicine & technology
nurse anesthetist
occupational therapy
optometry
393
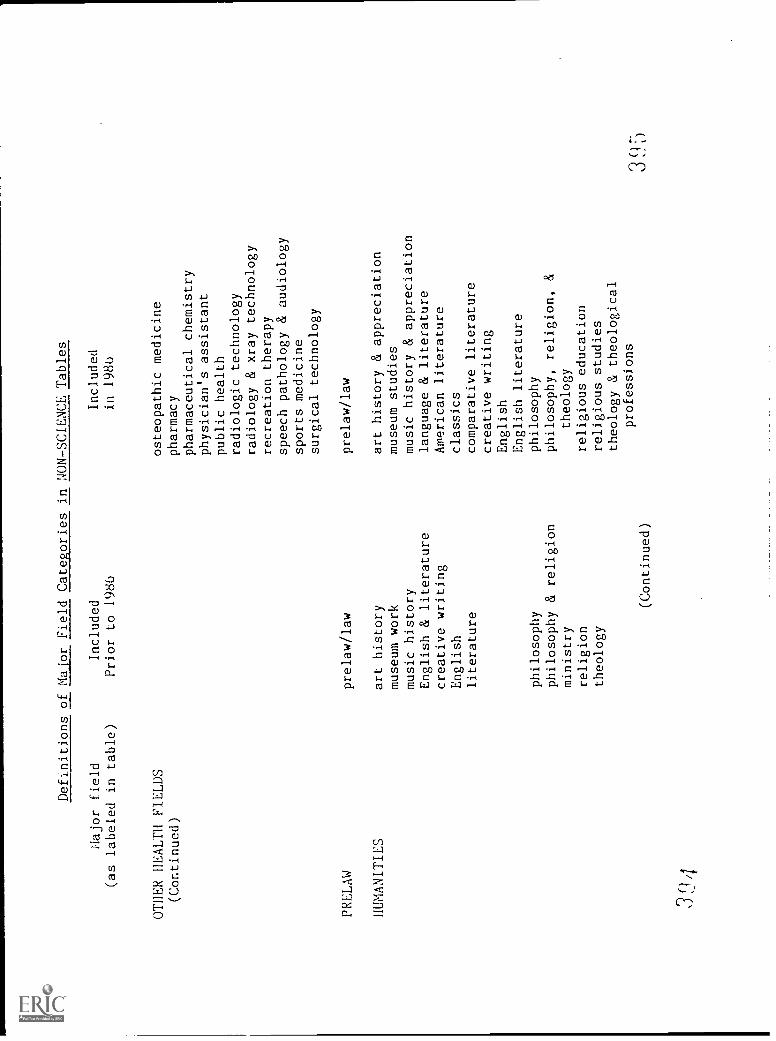
Definitions of Major Field Categories in NON-SCIENCE Tables
Major field
(as labeled in table)
OTHER HEALTH FIELDS
(Continued)
PRELAW
HUMANITIES
394
Included
Prior to 1986
prelaw/law
art history
museum work
music history
English & literature
creative writing
English
literature
philosophy
philosophy & religion
ministry
religion
theology
(Continued)
Included
in 198u
osteopathic medicine
pharmacy
pharmaceutical chemistry
physician's assistant
public health
radiologic technology
radiology & xray technology
recreation therapy
speech pathology & audiology
sports medicine
surgical technology
prelaw/law
art history & appreciation
museum studies
music history & appreciation
language & literature
American literature
classics
comparative literature
creative writing
English
English literature
philosophy
philosophy, religion, &
theology
religious education
religious studies
theology & theological
professions

Definitions of Major Field Categories in NON-SCIENCETables
Major field
(as labeled in table)
HISTORY AND CULTURE
FOREIGN LANGUAGES
396
Included
Prior to 1986
history & cultures
American history
ancient history
area & regional history
European history
French
German
Spanish
foreign languages
classical languages
Eastern languages
interpreting/translating
Italian
Russian
(Continued)
Included
in 1986
American history
European history
history, general
French
German
Spanish
foreign languages & classical
languages
African languages
Arabic
classical languages
Chinese
Greek, classical
Greek, modern
Hebrew
Indic languages
Italian
Japanese
Korean
Latin
modern languages
native American languages
Portuguese
Russian
Scandinavian languages
Slavic languages
397
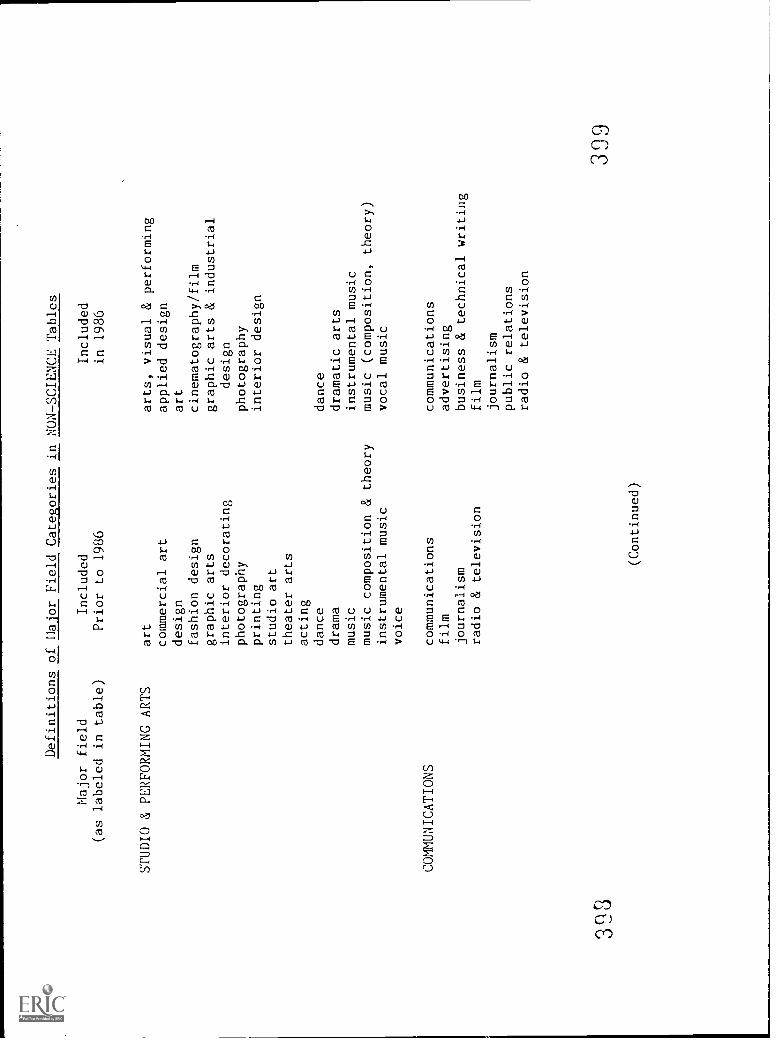
Definitions of Major Field Categories in NON-SCIENCE Tables
Major field
(as labeled in table)
Included
Prior to 1986
STUDIO & PERFORMING ARTS
art
commercial art
design
fashion design
graphic arts
interior decorating
photography
printing
studio art
theater arts
acting
dance
drama
music
music composition & theory
instrumental music
voice
COMMUNICATIONS
3(13
communications
film
journalism
radio & television
(Continued)
Included
in 1986
arts, visual & performing
applied design
art
cinematography/film
graphic arts & industrial
design
photography
interior design
dance
dramatic arts
instrumental music
music (composition, theory)
vocal music
communications
advertising
business & technical writing
film
journalism
public relations
radio & television
399
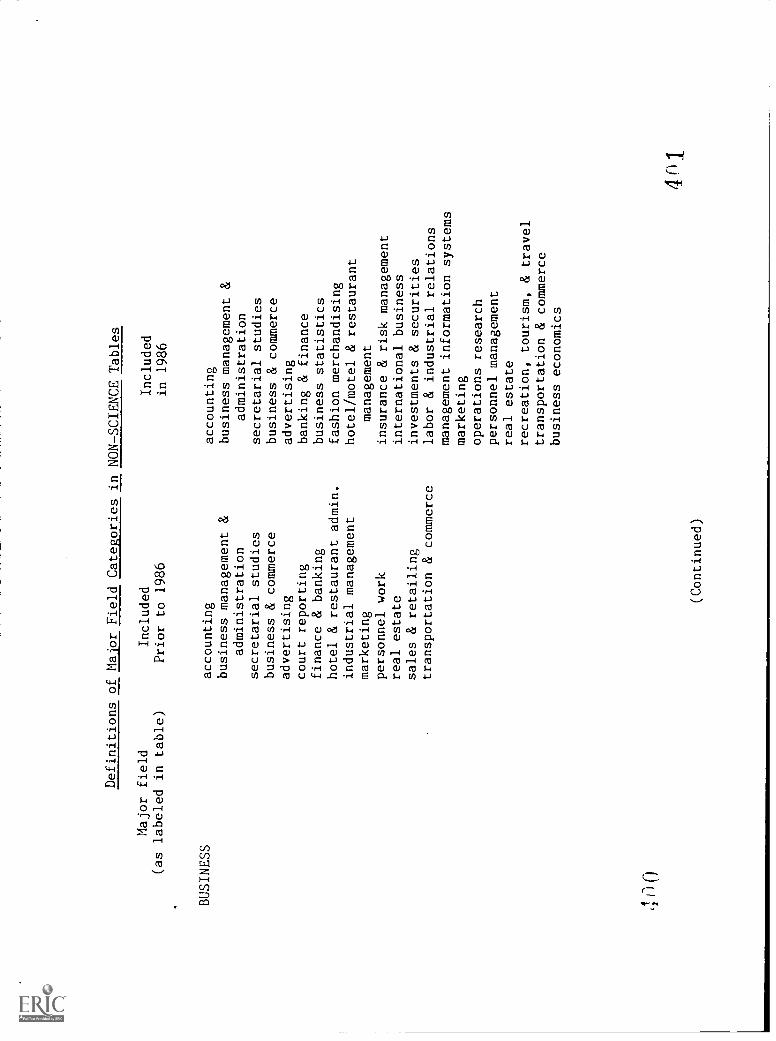
Definitions of Major Field Categories in NON-SCIENCE Tables
Major field
(as labeled in table)
BUSINESS
n
Included
Prior to 1986
accounting
business management &
administration
secretarial studies
business & commerce
advertising
court reporting
finance & banking
hotel & restaurant admin.
industrial management
marketing
personnel work
real estate
sales & retailing
transportation & commerce
(Continued)
Included
in 1986
accounting
business management &
administration
secretarial studies
business & commerce
advertising
banking & finance
business statistics
fashion merchandising
hotel/motel & restaurant
management
insurance & risk management
international business
investments & securities
labor & industrial relations
management information systems
marketing
operations research
personnel management
real estate
recreation, tourism, & travel
transportation & commerce
business economics

Definitions of Major Field Categories in NONSCIENCE Tables
Major field
(as labeled in table)
EDUCATION
Included
Prior to 1986
elementary education
secondary education
education
agricultural education
art education
business education
child development & nursery
education
educational administration
education of exceptional
children
education of the deaf
education of the mentally
retarded
general education
guidance counseling
health education
home economics education
industrial arts educ.
music education
physical education
recreation
speech
vocational trade &
industrial education
(Continued)
Included
in 1986
elementary education
secondary education
education
adu
& continuing educ.
agricultural educatioin
art education
bilingual & bicultural educ.
business education
child development & nursery ed.
curriculum & instruction
driver & safety education
educ. of the culturally
disadvantaged
educ. of the deaf & hearing
impaired
educ. of the emotionally
handicapped
educ. of exceptional children
educ. of gifted & talented
educ. of mentally handicapped
educ. of physically handicapped
educ. of visually handicapped
education administration
educ. statistics & research
educ. testing, evaluation,
& measurement
English education
health education
home economics educ.
403

Definitions of Major Field Categories in NON-SCIENCE Tables
Major field
(as labeled in table)
EDUCATION (Continued)
VOCATIONAL FIELDS
4(14
Included
Prior to 1986
home economics
clothing & textiles
family relations
food & nutrition
infant & child care
institution management
data processing
air-conditioning
engineering
engineering aid
(Continued)
Included
in 1986
industrial arts/voc-tech ed.
math educ.
marketing & distributive ed.
music education
pre-elementary ed.
physical ed.
reading ed.
school psychology
science educ.
social science ed.
special ed.
specific learning disabilities
speech & hearing ed/therapy
student counseling & personnel
services
teaching of English as a
foreign language
home economics
child development, care,
& guidance
clothing & textiles
consumer studies
family relations
foods & nutrition
home decoration & home
equipment
institutional management
4n5

Definitions of Major Field Categories in NON-SCIENCE Tables
Major field
(as labeled in table)
VOCATIONAL FIELDS
(Continued)
OTHER
Included
Prior to 1986
engineering design
drafting
trade & vocational
airline hosting
automotice maintenance
aviation maintenance
building construction
carpentry
cosmetology
mortuary service
industrial laboratory
technology
instrumentation tech.
nuclear technology
plastics technology
quality control tech.
military science
air science
merchant marine
military science--army
naval science
college teaching
library science
forestry/conservation
other
(Continued)
Included
in 1986
architectural technology
data systems repair
technical & vocational
air transportation technology
flight attendant
automotive mechanics
aircraft mechanics
construction trades
carpentry & woodworking
cosmetology
culinary arts
drafting/engineering graphics
electronics
refrigeration
machine tool technology
masonry
plumbing, pipe fitting,
steam fitting
precision metal work
military science
aerospace science
Coast Guard science
merchant marine science
military science--army
naval science
higher education
general & interdisciplinary
studies
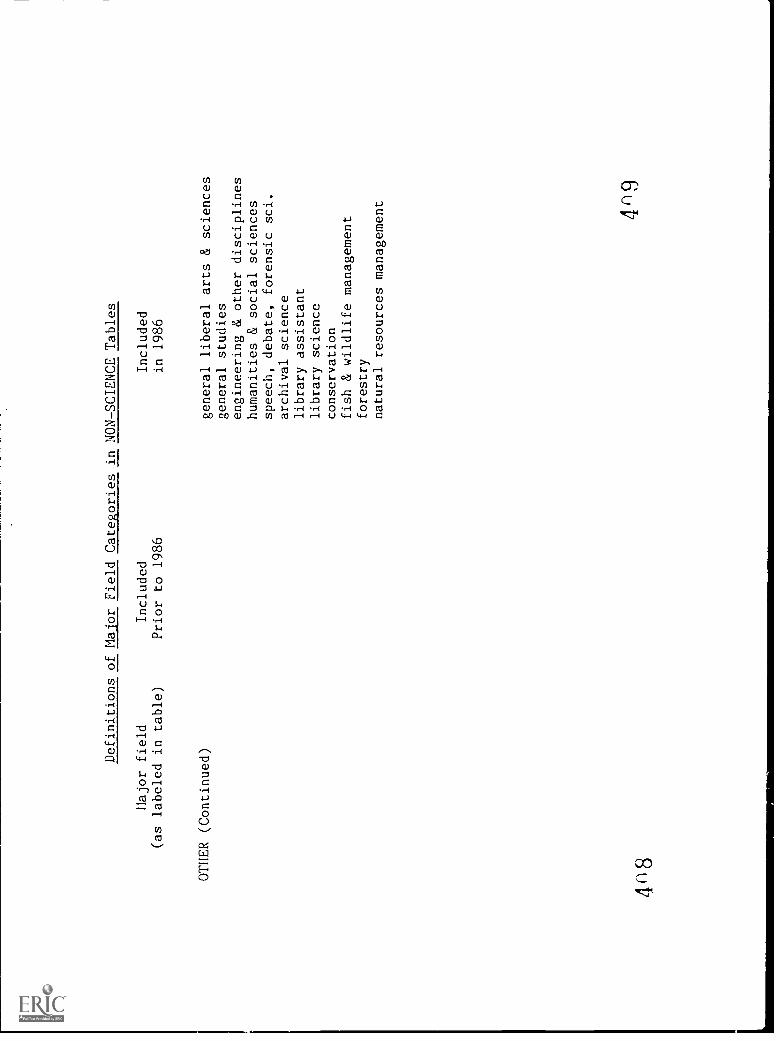
Definitions of Major Field Categories in NON-SCIENCE Tables
Hajor field
Included
Included
(as labeled in table)
Prior to 1986
in 1986
OTHER (Continued)
4118
general liberal arts & sciences
general studies
engineering & other disciplines
humanities & social sciences
speech, debate, forensic sci.
archival science
library assistant
library science
conservation
fish & wildlife management
forestry
natural resources management 41
19