Embed Size (px)
Citation preview
DOCUMENT RESUME
ED 420 708 TM 028 430
AUTHOR Matter, M. KevinTITLE Trust, but Verify: Standard Setting That Honors and
Validates Professional Teacher Judgment. Subtitle: A TenuousTitanic Tale of Testy Testing and Titillating Touchstones (AScreen Play with an Unknown Number of Acts).
PUB DATE 1998-04-00NOTE 51p.; Paper presented at the Annual Meeting of the American
Educational Research Association (San Diego, CA, April13-17, 1998).
PUB TYPE Reports Evaluative (142) Speeches/Meeting Papers (150)EDRS PRICE MF01/PC03 Plus Postage.DESCRIPTORS *Academic Achievement; *Elementary Secondary Education;
Evaluation Methods; *Political Influences; School Districts;*Standards; State Legislation; State Programs; StudentEvaluation; *Testing Programs
IDENTIFIERS *Cherry Creek Schools CO; *Standard Setting
ABSTRACTThe Cherry Creek School district (Englewood, Colorado) is a
growing district of 37,000 students in the Denver area. The 1988 ColoradoState School Finance Act required district-set proficiencies (standards), andforced agreement on a set of values for student knowledge and skills.State-adopted standards added additional requirements for the district.Cherry Creek has a high graduation rate, low dropout rate, and generally highaverage test scores, so that these externally imposed standards were not metwith great enthusiasm. However, staffs have embraced positive features of thestandards and are working toward a high level of student proficiency on thesestandards. The political background in the state and area is traced, and theway Cherry Creek met requirements, making the standards their own isdescribed. Teachers and administrators are invested in the standard systembecause they feel it is their own. A guiding principle in Cherry Creek isstudent growth over time, data that is not provided by most state assessmentprograms. Cherry Creek realizes that it must control its own local assessmentplan, for it cannot depend on the state to provide the information needed toplan interventions in a timely manner. Furthermore, each state legislativesession will probably bring revisions to the state plan. Seven attachmentspresent supplemental information about Cherry Creek's standards, beginningwith the district student achievement objectives, and including some sampleassessment items. (SLD)
********************************************************************************* Reproductions supplied by EDRS are the best that can be made *
* from the original document. *
********************************************************************************
TRUST, BUT VERIFY:Standard Setting that Honors and Validates
Professional Teacher Judgment
Subtitle: A Tenuous Titanic Tale of Testy Testing and Titillating Touchstones[A Screen Play with an Unknown Number of Acts]
PERMISSION TO REPRODUCE ANDDISSEMINATE THIS MATERIAL
HAS BEEN GRANTED BY
TO THE EDUCATIONAL RESOURCESINFORMATION CENTER (ERIC) j
Dr. M. Kevin Matter
U.S. DEPARTMENT OF EDUCATIONOffice of Educational Research and Improvement
EDU TIONAL RESOURCES INFORMATIONCENTER (ERIC)
This document has been reproduced asreceived from the person or organizationoriginating it.
Minor changes have been made toimprove reproduction quality.
Points of view or opinions stated in thisdocument do not necessarily representofficial OERI position or policy.
This paper is prepared for the:Annual Meeting of the American Educational Research Association in San Diego, CA
April 1998
Trust, but Verify:Standard Setting That Honors and Validates Professional Teacher Judgment
Subtitle: A Tenuous Titanic Tale of Testy Testing and Titillating Touchstones[A Screen Play with an Unknown Number of Acts]
Dr. M. Kevin MatterDirector
Office of Assessment & Evaluation
Cherry Creek Schools4700 S. Yosemite Street
Englewood, Colorado 80111(303) 486-4244
FAX (303) 486-4488
We) Paper Presented at Session 15.34Setting Performance Standards at the Local Level: Tales from the Front
1998 Annual Meeting of theAmerican Educational Research Association
San Diego, CA
Acknowledgments
The Cherry Creek Schools standard setting process and the numerous assessmentadministration, processing, and reporting activities described in this paper wereaccomplished through the dedicated and professional efforts of the Office of Assessmentand Evaluation staff. In particular, the creative and thorough work of Dr. Connie Zumpfis greatly appreciated, as well as her leadership in these areas.
MKMEnglewood, ColoradoMarch 1998
The content of this paper is solely the opinion of the author and does not represent officialposition of the Cherry Creek School District or Board policy. No official support by the CherryCreek Schools is intended or should be inferred.
Dr. M Kevin MatterMarch 1998
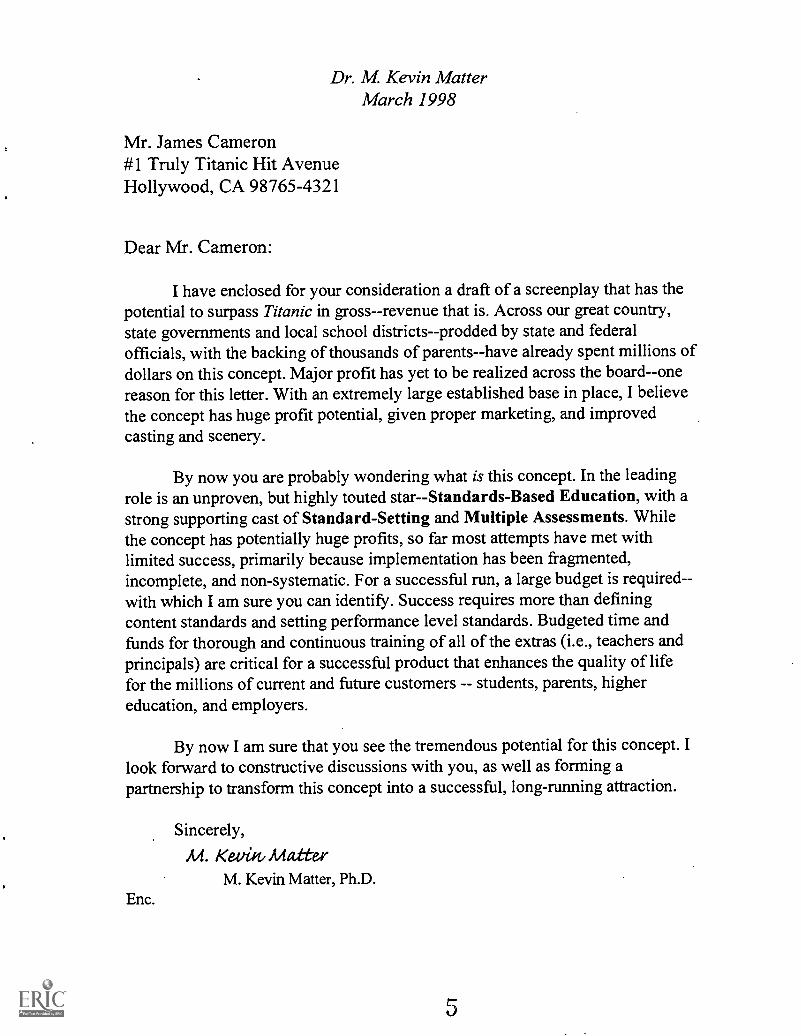
Mr. James Cameron#1 Truly Titanic Hit AvenueHollywood, CA 98765-4321
Dear Mr. Cameron:
I have enclosed for your consideration a draft of a screenplay that has thepotential to surpass Titanic in gross revenue that is. Across our great country,state governments and local school districts--prodded by state and federalofficials, with the backing of thousands of parents--have already spent millions ofdollars on this concept. Major profit has yet to be realized across the board--onereason for this letter. With an extremely large established base in place, I believethe concept has huge profit potential, given proper marketing, and improvedcasting and scenery.
By now you are probably wondering what is this concept. In the leadingrole is an unproven, but highly touted star--Standards-Based Education, with astrong supporting cast of Standard-Setting and Multiple Assessments. Whilethe concept has potentially huge profits, so far most attempts have met withlimited success, primarily because implementation has been fragmented,incomplete, and non-systematic. For a successful run, a large budget is required-with which I am sure you can identify. Success requires more than definingcontent standards and setting performance level standards. Budgeted time andfunds for thorough and continuous training of all of the extras (i.e., teachers andprincipals) are critical for a successful product that enhances the quality of lifefor the millions of current and future customers -- students, parents, highereducation, and employers.
By now I am sure that you see the tremendous potential for this concept. Ilook forward to constructive discussions with you, as well as forming apartnership to transform this concept into a successful, long-running attraction.
Sincerely,
M. Kevin. Ma ttexM. Kevin Matter, Ph.D.
Enc.
PROLOGUE
SettingThe Cherry Creek Schools is a growing, 37,000 student suburban
Denver district. Historic core values include a decentralized, site-baseddecision-making philosophy of "agreement on ends and flexibility onmeans." The 1988 State School Finance Act required district-developedproficiencies (standards), and forced agreement on a set of valued studentknowledge and skills. State-adopted standards added additional "content"requirements.
Cherry Creek has a high graduation rate, low dropout rate, andgenerally high average test scores (ACT, SAT, and ITBS/PLAN). Thus,adoption and integration of these "externally" imposed standards were notmet with a lot of initial enthusiasm. However, staffs have embraced thepositive features of standards and have rapidly moved into ensuringimplementation of the content standards in instruction, and high levels ofstudent proficiency on the standards.
Characters
Time
Location
Synopsis
Everyone is a character, only some are more than others.
Now. Not enough. Too much (on state testing process).
Colorado. But probably coming soon to a district near you.
Can local control and standards survive in the new age ofaccountability and national-international comparisons?
Page I
ACT I
Scene 1 -- July 1997Technology Rules: E-mail, Voice Messages, and Phone Conversations
Joe Hansen and Kevin Matter discuss a proposal for a 1998 Division HAERA symposium on standard setting. Several practitioners from around thecountry are interested in sharing their experiences about practical issues inestablishing performance standards at a local level to assess progress towardmeeting local, state, and national standards. Cherry Creek has used a deliberate,teacher- and principal-involved process to craft standards and define performancelevels, and develop an assessment system focused on student performanceimprovement on district standards. Will new political and community pressuresforce changes in priority or the decision-making process in the Cherry CreekSchools?
Scene 2 -- August 1997Board Conference Room at Cherry Creek Schools, Board Study Session
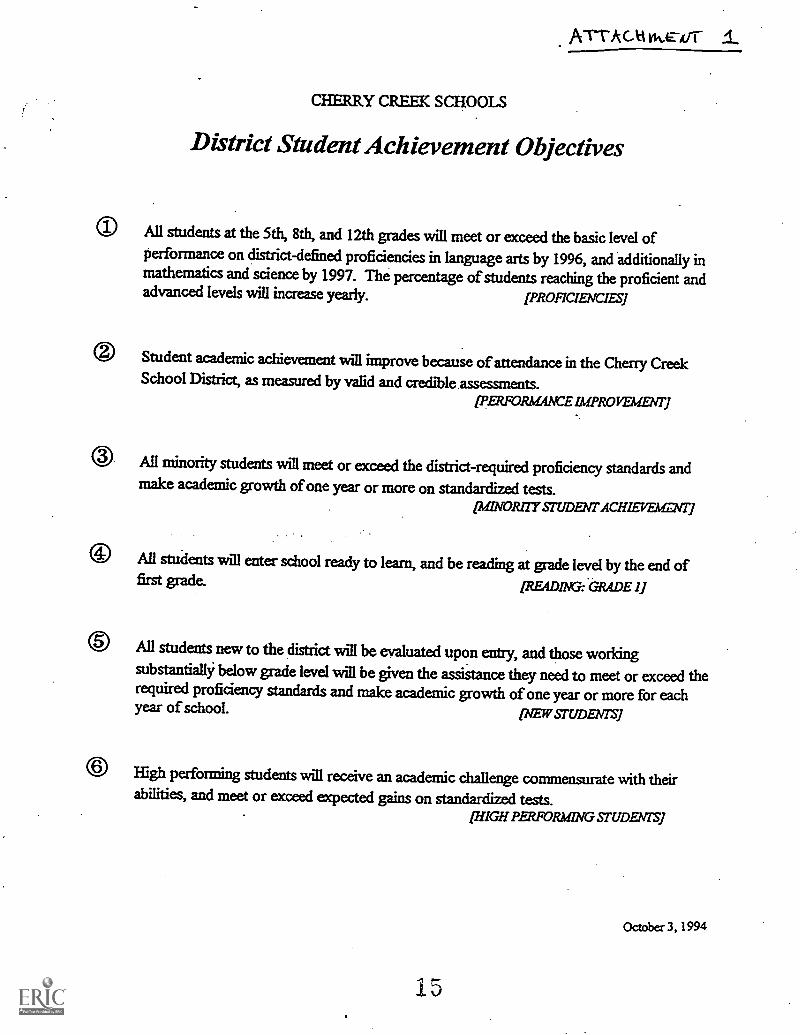
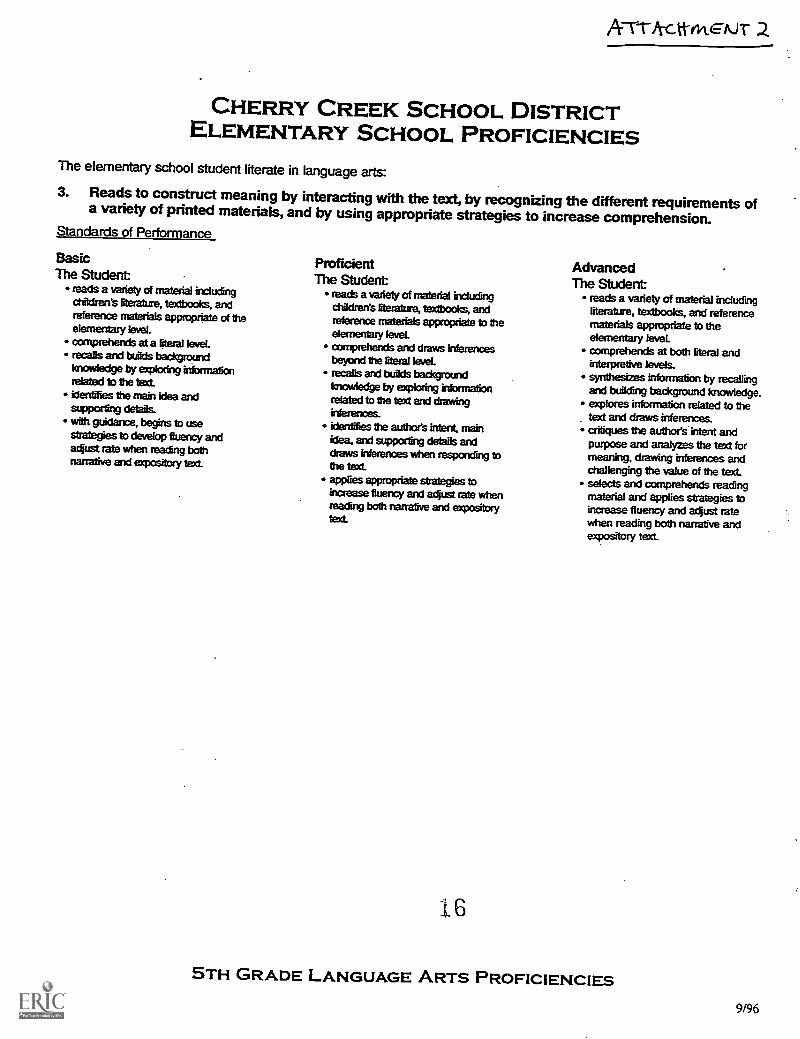
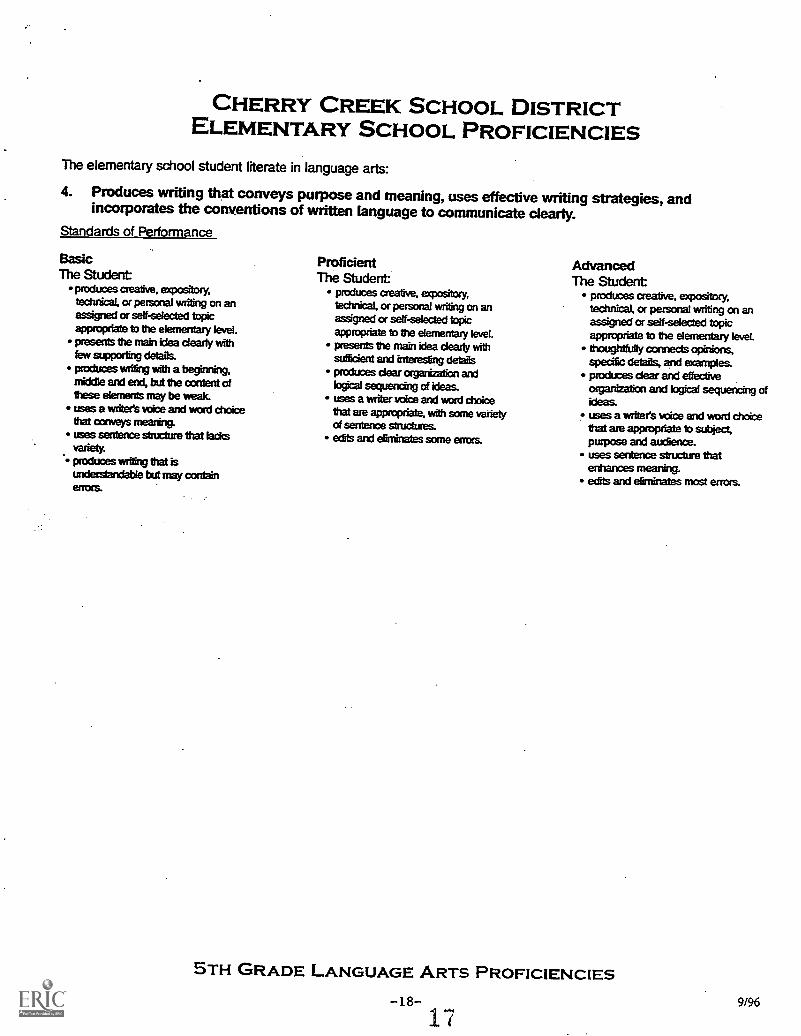
Assessment and Evaluation Office staff present the completed 1997Performance Improvement Report to the Board of Education. The reportsummarizes status on the District Student Achievement Objectives (seeAttachment 1), including the percent of students at the various performancelevels (Advanced, Proficient, Basic, Prebasic) on the reading, writing, andmathematics proficiencies (standards). [Refer to Attachment 2 for a sample.]The performance ratings are made by teachers at the end of the year, usingpredefined descriptions of the performance levels (see Attachment 3). Teachersdetermine proficiency status by rating a student's typical, consistent performance,using multiple pieces of evidence. They compare student performance against thedescriptions of performance, using exemplars of student work, benchmarks, orother indicators that are consistent for all students.
Scene 3 -- September 1997Mission Viejo Elementary School, Board of Education Meeting
The Board of Education, principals, and Curriculum CoordinatingCouncil receive a copy of the Comprehensive Assessment Plan (CAP) draft for
Page 2
7
review and discussion. [Refer to Attachment 4 for a summary of the CAP.] TheCAP's Guiding Principals and proposed assessment plan for 2001-02 stress abalanced set of measures that provide district, state, and national perspectives onstudent performance. The major purposes of assessment are defined asImprovement of Student Learning, Improvement of Instructional Programs,and Public Accountability, Confidence, and Support. No single assessmentresult determines student proficiency, or ensures inclusion in or exclusion fromspecial programs. The major emphasis is on student growth and gain over time,using multiple indicators. The informed professional judgment of teachers is thefoundation of educational decision making for individual students. Standardized,districtwide assessments provide information for teachers to use in calibratingtheir judgments with others, and provide corroborating evidence for proficiencyratings (see Attachment 5).
Scene 4 -- September 1997Doubletree Hotel, Denver
The Colorado Department of Education (CDE) and Colorado Associationof School Executives (CASE) sponsor a workshop for superintendents andassessment staff on strategies for communicating the results of the spring 1997grade 4 Colorado Student Assessment Program (CSAP). The message tocommunicate through the media to parents and community:
Bad is Good! The CSAP results will be low, but that isexpected for a baseline year. Everyone will perform higherin spring of 1998.
The "bad is good" message is problematic and a challenge to presentconvincingly to the media. Although the CSAP is new, reading and writing arenot new content areas for instruction. Also, less than 70 instructional days areavailable between the release date for the 1997 results and the 1998 CSAPadministration. Therefore, any score changes in 1998 are probably only randomvariation and cannot be attributed to instructional or curricular modificationsbased on the 1997 results.
The November 13 statewide CSAP release date is after the elections.However, controversy remains on the issue of when districts will receive theirCSAP reports. Will they need to release the results before November 13 becauseof open records laws? What to do, what to do?
Page 3
Scene 5 -- September and October 1997Assessment Offices Throughout Colorado
Editorials and letters to the editor in the Denver Post and Rocky MountainNews portend low scores on the CSAP. Everyone is expecting the worst. Somewriters note that the groups setting the cut-points for the performance levels werecomprised of teachers and educators (HORROR!), and rumors abound aboutrevisions of the cut-points based upon low student performance on the test.
Scene 6 -- November 1997Trails West Elementary School, Board of Education Meeting
The Cherry Creek Board of Education approves an Accountability andAccreditation Contract, which is submitted to the State Board of Education. Thiscontract, when approved by the State Board, becomes the guiding document forthe process and procedures by which the District accredits each school, to meetState statutes and rules.
ACT II
Scene 1 -- Flashback: Ten years earlierState Capital Building in Denver, and Schools / Central Administration Offices
The 1988 School Finance Act mandates local boards' adoption ofproficiencies in language arts, mathematics, and science. During the 1999-91school year, Cherry Creek develops proficiencies in these areas. A ProficienciesSteering Committee drafts an implementation plan, as well as a plan to assessstudent status on the proficiencies. Baseline proficiency data are collected in thespring of 1992 at grades 3-12 in language arts, mathematics, and science.
Scene 2 -- Spring 1993State Capital Building, Denver
House Bill 93-1313 mandates district adoption of standards that meet or
Page 4
exceed the State's model content standards. A State testing plan is included in thebill, which calls for matrix sampling of students and subjects and a phase-in over3-5 years of grades and areas tested.
Scene 3 -- 1994 through 1996Cherry Creek School District, Schools and Central Administration Offices
Cherry Creek staff review and, if necessary, revise their proficiencies tomeet or exceed the State Content Standards. District staffs develop a plan toassess student performance on their proficiencies and report status to parents andthe community, using the definition of assessment in the law (i.e., assessmentmeans the methods used to collect evidence of what a student knows or is able todo). In Cherry Creek, locally-developed criterion-referenced and performanceassessments have been given for more than fifteen years. These tests had lowstakes for students and schools; thus, the tests were given, but the results were notsystematically used for performance improvement.
The process used to set performance standards (which more clearly defineand communicate levels of student performance) builds upon Cherry Creek'shistorical efforts in assessment and embodies the district's most valuedphilosophies. This standard setting process is more critical than the developmentof the standards because this culminates in high stake repercussions for states,districts, and/or students. Although a generic standard setting process can bedefined, the critical definitions of performance levels must be unique andacceptable to the audience and focus of the standards. Thus, a district should usea standard setting process that blends well with their values, history, philosophy,and community.
Consistent with District philosophy and practice, the process developed to"assess" student performance on the Cherry Creek standards is based oninformed, professional teacher judgment, using data from multiple sources.Although the results from any test can inform this judgment process, the resultsby themselves do not determine student proficiency status. This "proficiencyassessment" system was conceptualized in the late 1980's, prior to the emergenceof the most recent testing and accountability era.
In spring of 1995, Cherry Creek begins using the Achievement Level Tests(ALT). Assessment and Information Systems staff begin initial discussions on anintegrated database, with the support and backing of Instructional Division
Page 5
10
leadership. Assessment and Evaluation (A&E) Office staff reports preliminaryanalyses on the relationship of student scores on specific tests to student"proficiency" status as determined by teachers. This process producesoverlapping performance bands that generally validate and corroborate theholistic teachers' judgment. The intent is to refine yearly the score range thatdescribes a specific performance level (e.g., Basic), as additional data arecollected. Teachers and principals receive reports of "outliers" or atypicalpatterns or relationships, so these anomalies can be investigated and resolved.A&E staff proposes this "performance bands" structure after an unsuccessfulattempt using a more systematic, bookmarking-style process. Teachers wereunable to examine the ALT Reading test and scale and define a range thatdescribes performance on that test for a particular level (e.g., Basic).
Scene 4 -- Flash Forward to Spring 1998CCSD Assessment and Evaluation Office
A&E staff drafts a form for teachers to use in making proficiency ratings. Theformat incorporates multiple validations and describes the ranges on each testthat relates to Advanced-Proficient-Basic-Prebasic performance on that test (seeAttachment 6).
Scene 5 -- June 1996Colorado State Office Building, State Board of Education Meeting
The State Board of Education adopts new rules and regulations on theaccreditation of districts, and for the first time, individual schools. The rulesrequire districts to develop and adopt an Enterprise Contract with the State. Thecontract must include site visitation teams and three-year school improvementplans. Cherry Creek forms an ad-hoc committee to develop its contract.
Scene 6 -- Summer 1997CCSD Administration Building
The ad-hoc Enterprise Accreditation Contract Committee completes itswork and after substantial review and revision, forwards a proposal to the CherryCreek Schools Board of Education for approval.
Page 6
11
ACT III
Scene 1 -- November 1997School District Administration Offices throughout the State
The 1997 grade 4 CSAP (Colorado Student Assessment Program) resultsfor reading and writing are released. Statewide, the percent of students whoscored at or above a proficient level were "low," particularly in writing. TheCherry Creek results are above the State averages, and the reading scores reflectother district assessment data. The Cherry Creek writing results do notcorrespond as well to other district assessment data.
Local and statewide politicians and education critics point to the 1997CSAP results as further evidence that schools are not doing an adequate job.Some legislators remark that schools should not receive additional funding untilCSAP scores improve. Parents in some districts wonder why the CSAP scores aresubstantially different from the results they received previously on norm-referenced tests. Which results are correct? Newspaper articles, editorials, andmedia talk shows focus on the CSAP for several weeks. The low-profile, low-stakes CSAP rapidly becomes the performance indicator for schools and districts.
Scene 2 -- January 1998CCSD Student Achievement Resource Center, District Administrator Meeting
Cherry Creek principals react (overly?) to the CSAP results andprioritizing improvement efforts. Like a snowball rolling down a steep hill, whichsoon becomes an avalanche (yes, the Colorado Avalanche), suggestions(decisions?) are made to reduce mandated district testing, eliminate or discourageoptional testing, and focus on the CSAP. The assessment plan for 1998-99 asproposed in the CAP (Comprehensive Assessment Plan) is quickly revised todenote the new reality of a high-stakes CSAP (see Attachment 7).
Scene 3 -- February 1998CCSD Administration Building
The Superintendent receives a letter from CDE (Colorado Department of
Page 7
12
Education).. The district's Enterprise Accreditation Contract, submitted to CDEin November 1997 in response to current rules, is being held, pendingclarification and simplification of the accreditation process by the State Board ofEducation. District implementation of the new School Improvement Plan andaccreditation process is put on hold until this work is completed by the StateBoard.
EPILOGUE
Scene 1 -- March 1998CCSD Administration Offices, particularly Assessment & Evaluation
The Assessment & Evaluation and Information Systems offices aredealing with a myriad of implementation issues related to collecting andreporting student performance on standards. Many decisions need to be clarifiedand resolved in order to report, document, and maintain a database onproficiencies. [For example, a process must be established for handling multipleperformance ratings for one student on the same proficiency. If a Language Artsteacher assigns "Proficient" status and a Reading teacher assigns "Basic" statusin reading, which is "truth?"]
Cherry Creek teachers and administrators are invested in the systembecause it is ours, not imposed from outside the district. Thus, teachers view thestandard setting process and the resultant performance levels as an important stepin corroborating their proficiency ratings, and valuable in the critical calibrationprocess between teachers (to reduce variation). Standardized, objective pieces ofdata are valued by parents and the community, as external validations of studentperformance.
A critical issue to address and resolve: Balancing the different purposes ofassessments, and maintaining focus on which assessment information will bestserve the needs of Cherry Creek related to student performance improvement onthe proficiencies. Arguments that Cherry Creek should reduce or eliminate norm-or criterion- referenced tests are based on the false assumption that tests provideprecise, reliable, and consistent information at each level--district, school, andindividual student.
Page 8
13
Lesson Learned:Be Not a Fool. Learn From Others.
Do not try to make something precise that is not precise--something exactthat is not exact--something stable that is not stable. The history of stateassessment programs throughout the nation is a tale of instability andinconsistency over time. One of the guiding principles in Cherry Creek'sComprehensive Assessment Plan (CAP) is an emphasis on student growth andgain for the same students or groups over time. This type of data is not providedby most state assessment programs, and probably never will be a focus.
Cherry Creek can--and must--control its local assessment plan. CherryCreek cannot depend upon the State assessment program to provide the dataneeded to diagnose and plan interventions in a timely manner, particularly at astudent level. Cherry Creek cannot depend upon consistency of the Stateassessment program over time. Each legislative session may - -and probably will- -bring revisions to the state testing plan, for the current year or for future years.
Cherry Creek must communicate a clear, compelling message toprincipals, teachers, and parents about the necessity to maintain a comprehensiveassessment system that will provide the data for Improvement of StudentLearning, Improvement of Instructional Programs, and PublicAccountability, Confidence, and Support. If successful, the data will beavailable to inform timely, effective decision-making. If unsuccessful, decisionswill be made using incomplete and insufficient assessment data.
ATTACHMENTS
Attachment 1: District Student Achievement Objectives
Attachment 2: Sample of Writing Proficiency
Attachment 3: Proficiency Rating Scale
Attachment 4: CAP Summary
Attachment 5: Proficiency Ratings Compared with Assessment Results
Attachment 6: Draft of the Multiple Validations Form
Attachment 7: Proposed 1998-99 District Assessment Schedule[\divh \aera98]
Page 9
ATrActi
CHERRY CREEK SCHOOLS
District Student Achievement Objectives
C.) All students at the 5th, 8th, and 12th grades will meet or exceed the basic level ofperformance on district-defined proficiencies in language arts by 1996, and additionally inmathematics and science by 1997. The percentage of students reaching the proficient andadvanced levels will increase yearly. [PROFICIENCIES]
Student academic achievement will improve because of attendance in the Cherry CreekSchool District, as measured by valid and credible assessments.
IPERFORAWICE riteRovEmany
0 All minority students will meet or exceed the district-required proficiency standards andmake academic growth ofone year or more on standardized tests.
[MINORITY STUDENT ACHI
0 All students will enter school ready to learn, and be reading at grade level by the end offirst grade. [READING: GRADE 1]
© All students new to the district will be evaluated upon entry, and those workingsubstantially below grade level will be given the assistance they need to meet or exceed therequired proficiency standards and make academic growth of one year or more for eachyear of school. [NEW STUDENTS]
© Sigh performing students will receivean academic challenge commensurate with theirabilities, and meet or exceed expected gains on standardized tests.
[HIGH PERFORMING STUDIWIS]
October 3, 1994
1 5
AT-t-A-cttot--7ktr 2
CHERRY CREEK SCHOOL DISTRICTELEMENTARY SCHOOL PROFICIENCIES
The elementary school student literate in language arts:
3. Reads to construct meaning by interacting with the text, by recognizing the different requirements ofa variety of printed materials, and by using appropriate strategies to increase comprehension.Standards of Performance
BasicThe Student
reads a variety of material includingchildrent literature, textbooks, andreference materials appropriate of theelementary level.comprehends at a literal level.recalls and builds badcgroundknowledge by exploring informationrelated to the text.identifies the main idea andsupporting details.with guidance, begins to usestrategies to develop fluency andadjust rate when reading bothnarrative and expository text
ProficientThe Student
reads a variety of material includingchildren's literature, textbooks, andreference materials appropriate to theelementary levelcomprehends and draws inferencesbeyond the literal levelrecalls and builds badcgroundknowledge by exploring informationrelated to the text and drawingirdererces.identifies the author's intent, mainidea, and supporting details anddraws inferences when responding tothe text.applies appropriate strategies toincrease fluency and adjust rate whenreacting both narrative and expositorytext
16
AdvancedThe Student
reads a variety of material includingliterature, textbooks, and referencematerials appropriate to theelementary level.comprehends at both literal andinterpretive levels.synthesizes information by recallingand building background knowledge.explores information related to thetext and draws inferences.critiques the author's intent andpurpose and analyzes the text formeaning, drawing inferences andchallenging the value of the text.selects and comprehends readingmaterial and applies strategies toincrease fluency and adjust ratewhen reading both narrative andexpository te:ct.
5TH GRADE LANGUAGE ARTS PROFICIENCIES
9/96
CHERRY CREEK SCHOOL DISTRICTELEMENTARY SCHOOL PROFICIENCIES
The elementary school student literate in language arts:
4. Produces writing that conveys purpose and meaning, uses effective writing strategies, andincorporates the conventions of written language to communicate clearly.
Standards of Performance
BasicThe Student
produces creative, expository,technical, or personal writing on anassigned or self-selected topicappropriate to the elernenbuy level.presents the main idea dearly withfew supporting details.produces writing with a beginning,middle and end, but the content ofthese elements may be weakuses a writer's voice and word choicethat conveys meaning.uses sentence structure that lacksvariety.produces writing that isunderstandable but may containerrors.
ProficientThe Student
produces creative, expository,technical, or personal writing on anassigned or self-selected topicappropriate to the elementary level.presents the main idea dearly withsufficient and interesting detailsproduces dear organizzdion andlogical sequencing of ideas.uses a writer voice and word choicethat are appropriate, with some varietyof sentence stmchres.edits and eliminates some errors.
AdvancedThe Student
produces creative, expository,technical, or personal writing on anassigned or self-selected topicappropriate to the elementary level.thoughtfully connects opinions,specific details, and examples.produces dear and effectiveotganization and logical sequencing ofideas.uses a writer's voice and word choicethat are appropriate to subject,purpose and audience.uses sentence structure thatenhances meaning.edits and eliminates most errors.
5TH GRADE LANGUAGE ARTS PROFICIENCIES
179196
K-12 Proficiency Level Descriptors
ADVANCED
A-TTA-C.tfixavr 3
Performance greatly exceeds proficiency and is clearly exemplary because ofattention to detail and sophistication.Performance meets the criteria at the "advanced" level for the benchmark orstandard at that grade level.Performance greatly exceeds grade level/course expectations.
PROFICIENT
BASIC
Performance demonstrates understanding and application.Performance meets most or all criteria at the "proficient" level for the benchmarkor standard at that grade level.Performance is at or above grade level/course expectations.
Performance reflects a fundamental or rudimentary level of skill; a novice level.Performance meets most or all criteria at the "basic" level forthe benchmark orstandard at that grade level.Performance is below grade level/course expectations.
PREBASIC
Performance reflects an area of concern. Student needs significant assistance.Performance does not yet meet the "basic" level for the benchmark or standard atthat grade level.Performance is significantly below grade level/course expectations.
* At grade levels where there are no benchmarks or exit standards, use the first and third bulletsto judge the level of proficiency performance.
November 6, 1997
18
A-r-t-irctote-ivr-
Cherry Creek SchoolsDedicated to Excellence
ComprehensiveAssessment Plan
--Enhancing Student Growth & Performance--
September 1997
(DISCUSSION DRAFT)
11. 9
CHERRY CREEK SCHOOLS
Comprehensive Assessment Plan
Assessment Team
Maria Foseid, M.A. - Staff Development Coordinator
M. Kevin Matter, Ph.D. - Assessment & Evaluation DirectorNorma Silvers, M.A. - Administrative Assistant
Mary Terch, M.A. - Executive Director of Elementary Education
Paulette Wasserstein, Ed.D. - Assessment & Evaluation ConsultantNola Wellman, Ph.D. - Executive Director of Middle School Education
Connie L. Zumpf, Ph.D. - Assessment & Evaluation Associate
Board of Education
Donald K. Goe, Ed.D. - PresidentGerald N. Weaver, J.D. - Vice President
Joan B. Grady, Ph.D. - TreasurerWendy A. DeBell - Secretary
Richard E. Collier, B.S.E.E. - Ass't Sec.-Treas.
Superintendent of Schools
Robert D. Tschirki, Ph.D.
4700 S. Yosemite StreetEngelwood, Colorado 80111
(303) 486-4233FAX (303) 486-4488
September 1997
Copyright © 1997 Cherry Creek Schools
20
Comprehensive Assessment Plan. HighlightsCherry Creek Schools
Part I: Introduction
The Need for a Comprehensive Assessment Plan
The assessment of student academic progress isessential in maintaining excellence in the CherryCreek School District. Stakeholders of the districtrely on information about the quality of educationprovided to students. The purpose of thisComprehensive Assessment Plan (CAP) is toeffectively and systematically collect andcommunicate student academic progress through theK-12 system. It is intended to provide information atkey points throughout a child's educational journey.In addition, a variety of assessment techniques areused to collect qualitative and quantitativeinformation. These data create a comprehensivepicture of what a student knows and is able to do.
The following Comprehensive Assessment Planaddresses the needs, focuses, and directions from theEducation Summit, Proficiencies Project, and InSearch of Excellence. The document proposes abalanced, purposeful assessment system for the year2002. After describing the proposal for 2002, theplan includes a sequential transition plan from 1997-98 to 2001-02 at all grade levels in each content area.It provides a framework for the collection, analysis,and use of student achievement information.
JO
Part II: Guiding Principles for a Comprehensive Assessment Planfor 2002
The assessments in the Comprehensive AssessmentPlan (CAP) are tools that provide data to helpcomplete a picture of performance and achievementfor a student, a school, and the district. District staffand community members study and use the data totransform it into information. As a performance-improvement organization, the Cherry Creek staff, andcommunity at large, rely upon quality information tomake informed evaluation decisions, choices, orjudgments.
Assessments in the plan, particularly those useddistrictwide, should adhere to a common set of guiding
principles, or shared assumptions about the essentialpurposes served by assessment, quality standards forassessments in the plan, and interpretation, use, andcommunication of assessment results.
The guiding principles provide the basis for the CherryCreek Schools Board Policy on Assessment andEvaluation, currently under review. These guidingprinciples provide a focus for decision making aroundassessment instruments, assessment practices, and useof results.
Guiding Principle 1: Essential Purposes of Assessment
All district assessment decisions originate from a setof well-defined purposes. Simply stated, theoverarching purpose of all assessment activities is toenhance student growth and performance.Specifically, district assessments provide data thatrelate to eight purposes within three general areas:
Improvement of Student Learning
1. Teachers use assessment data to createinstructional focus for their classrooms and forindividual students (including the diagnosis ofspecial needs and decisions about placement inspecial programs).
2. Teachers use assessment data to support andvalidate ratings of student proficiency.
3. Teachers monitor student progress over timethrough CAP assessments.
4. Students and parents use assessment results toassist them in reaching student educational goals,by providing individual and comparativeinformation.
Improvement of Instructional Programs
5. District staff monitor status of the District StudentAchievement Objectives (see Appendix) throughassessment data.
6. School staff use achievement profiles, derivedfrom assessment data, for school improvement.
7. Decision makers use assessment data to evaluateschool and district programs. These data providevaluable insights to curriculum development (i.e.,assessment helps to determine whether certainskills are being taught and learned).
Public Accountability, Confidence, andSupport
8. The Board of Education, school communities, andthe district are informed about the quality ofeducational programs through assessment reports,which provide comparative information aboutdistrict programs and others in the nation.
Assessment and evaluation are processes that evolveand change over time. Therefore, we continually seekto improve the ways in which we assess students andthe means by which we communicate and useassessment results.
22
Guiding Principle 2: Quality Assessment Data
In order for our CAP to provide informationrelevant to the purposes described above,assessments within the system must providequality data. Widely recognized standards ofquality guide the selection of publishers' tests andthe development of standardized district-createdassessments.
Guiding Principle 3: Multiple Indicators
District assessments in the CAP provide distinctkinds of coverage of knowledge and skills and avariety of perspectives on student achievement.
MeaningfulnessTechnical RigorGeneralizabilityCost EffectivenessEquitability/Protection of Students
No single assessment or assessment type provides acomplete picture of what students know and can do.
Guiding Principle 4: "Value-Added" Perspective
The basis for any evaluation of curriculum orinstructional effectiveness in Cherry CreekSchools is the educational value added toindividual students and student groups over time.When we compare school or classroom gains, wemust take into account those pre-existingdemographic factors and levels of prior
knowledge known to influence school performance.By focusing on student growth and gain over time,we measure and report the impact of curriculum andinstruction on student performance regardless ofindividual differences in starting points.
Guiding Principle 5: Communication of Assessment Information
Teachers, principals, parents, and othereducational decision makers understand and useassessment information in order to makeinstructional decisions that result in performance
improvement. To this end, the district providesresources and support for a yearly cycle ofassessment reports, training, and information.
Guiding Principle 6: Informed Teacher Judgments
In Cherry Creek, we support the informedprofessional judgments of our teachers as thefoundation of educational decision making forindividual students. We strive to ensure the
accuracy and consistency in these judgments. To thisend, the district provides assessment feedback that isaccurate, clear, concise, and timely.
23
Nue 4 CAP Highlights September 1997
PART III: Comprehensive Assessment Plan (CAP) for 2002
The assessments in the CAP are tools that providedata to help provide a systematic, comprehensivepicture of performance and achievement for astudent, a school, and the district. Assessments inthe CAP reflect the Guiding Principles outlined inPart II (pp 3-5) of this document. Each purpose ismatched with assessments that provide the mostrelevant and useful data for decisions related tothat purpose. All assessments in the CAP aretechnically sound, and conform to qualitystandards. In order to support informed teacherjudgments, the types of district assessmentactivities K-12 provide teachers with multipleindicators of student performance from severalcomparative perspectives (see below). The timing
of certain assessments in the CAP allows educationaldecision makers to make informed judgments aboutthe educational value added to students and studentgroups over time. Finally, the communication ofassessment results and use are major components ofany assessment decision.
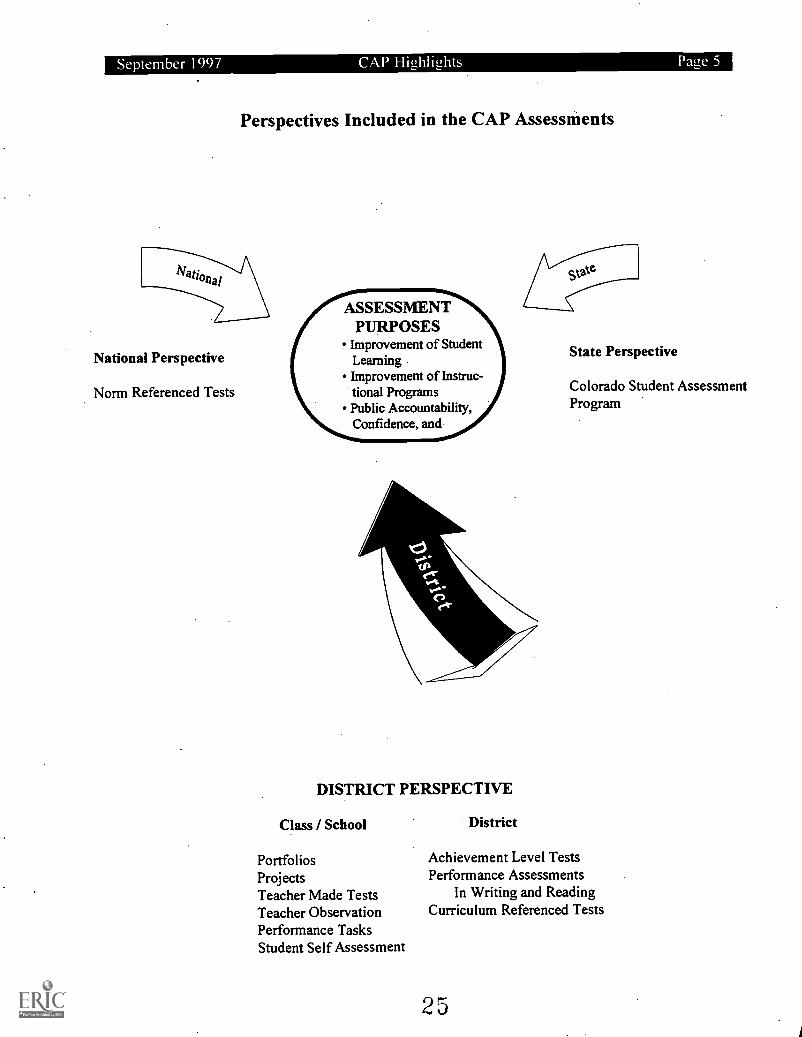
Since assessment data are important to a number ofaudiences (parents, teachers, community, etc.), theplan must provide comparative information valuedby each audience. Therefore, data from assessmentsin the CAP provide relevant performanceinformation from district, state, and nationalperspectives.
CAP Assessments That Provide a District Perspective
The major focus of the CAP is to provideinformation about student progress and programeffectiveness in relation to mastery of districtproficiencies (which are designed to reflect stateand national standards). Assessments that providea predominantly district perspective must bealigned with curriculum objectives andproficiencies. District assessments must also allow
for reliable measurement of student progress ondistrict objectives and proficiencies over time.
Student Proficiency Status Data CollectionAchievement Level TestsPerformance-Based Assessments (PBA's)School and Classroom-Based Assessments
CAP Assessments That Provide a National Perspective
The CAP must provide information that allowsstakeholders to compare the overall performanceof our students with that of students in the nationin essential areas of knowledge and skill. Testswith national reference groups (e.g., the Iowa
Tests of Basic Skills (ITBS), the PLAN, and theACT / SAT), enable an "external look" at ourcurriculum and student performance. Ourstakeholders and district community value thisperspective.
CAP Assessments That Provide a State Perspective
The CAP provides information that allowsstakeholders to assess the overall performance ofour students on state-mandated standards ofknowledge and skill. The Colorado StudentAssessment Program (CSAP) is a state-mandatedcomponent of our district plan, and will eventually
provide an additional perspective on studentachievement. However, the CSAP is currently underdevelopment, and is characterized by change fromyear to year. At this point in time, it is difficult todetermine and plan for the extent to which CSAPwill provide consistent, usable data for our districtplan.
24
September 1997 CAP Highlights Page 5
Perspectives Included in the CAP Assessments
National Perspective
Norm Referenced Tests
ASSESSMENTPURPOSES
Improvement of StudentLearningImprovement of Instruc-tional ProgramsPublic Accountability,Confidence, and
DISTRICT PERSPECTIVE
Class / School
PortfoliosProjectsTeacher Made TestsTeacher ObservationPerformance TasksStudent Self Assessment
District
State Perspective
Colorado Student AssessmentProgram
Achievement Level TestsPerformance Assessments
In Writing and ReadingCurriculum Referenced Tests
25
Page 6 CAP Elit.thliuhts September 1997
District Assessments: The Assessment Program in 1996-97
GRADETEST
K 1 2 3 4 5 6 7 8 9 10 11 12
DISTRICT PERSPECTIVE: Mastery of district proficiertcks/standards
ALT (Reading, Math)objective tests
F/S S S
WRITING PERFORMANCEperformance-based
F/S F/S F/S F/S F/S M F
SCIENCE PROCESSobjective tests
S S S
HEALTH objective tests EOC EOC
PROFICIENCY DATACOLLECTION S S S S S. S S S S S
. ATIO/iiiiiSPEetl:v4;;ikitionalCo anson mJbimation
ITBS (Reading, Math, Language,
Information Usage)objective tests
S S F F F
CogAT (Nonverbal/Spatial)
objective tests
F
NELSON DENNY (Reading )objective tests
F S
PLAN (Reading, Math, Language,
Science) objective testsF
ACT / SAT (Reading, Math, Science)objective & performance-based
X X
,, ATEPERSPECI7Masieiy:Ofstittg ar
STATE ASSESSMENTGrade: 3-Reading; 4-Reading, Writing;
5-Math; 8-Math, Scienceobjective & performance-based
S
F = Fall M = Mid-year S = Spring X = Scheduled dates throughout year EOC = end of courseALT: Achievement Level Tests ROWO: Read On-Write On writing assessmentITBS: Iowa Tests of Basic Skills CogAT: Cognitive Abilities TestACT / SAT: College entrance exams
26
District Assessments: The Proposed Assessments for 2001-02The following assessments are required for all schools in the district.
GRADETEST
K 1 2 3 4 5 6 7 8 9 10 11 12
ip-,,,,::::=,-.1.:-.:,-, -77,34,,:,..-,=,......,:,.,.=, ISIRICTPERS., PEcTIV,Ei,.. at d "1.:i a,TtC '4.:s :tall::-..... .,-
ALT(Reading, Math, Language, middleschool Science)objective tests
S S S S S S S
READING PERFORMANCEperformance-based
X X X
WRITING PERFORMANCEperformance-based
F F F F
.M
.
S
MATH PERFORMANCEperformance-based
X X X
SCIENCE INVESTIGATIONdemonstration
S
PROFICIENCY DATACOLLECTION
S S S S. SS S S
,i; .- ,'-,,,-'-" . 'r..-- ._.....=' .17-v 6-;-:',3.11=1,-%
-t- TIONAEPERSPEtwm:I§raianareomparisair .
ITBS (Reading, Math, Language,
Information Usage)objective tests
F F
PLAN (Reading, Math, Language,Science)
objective tests
F
ACT / SAT' (Reading, Math, Science)objective el performance-based TbtY
. .
CogAT (Nonverbal/Spatial)objective tests
F
. . _
.:7,..........4
74. --,.. . ATE...-,.. .=,-
,, ...,.,=,1;PERSP ast ltatettan
.f,"'"'". <-:
', ' .
STATE ASSESSMENTGrade: 3-Reading;4-Reading, Writing
5-Math; 8-Math, Scienceobjective & performance -based
S S S S
'ACT and SAT not required by the district, but by colleges
F = Fall M = Mid-year S = Spring X = Scheduled dates throughout year
CH
ER
RY
CR
EE
K S
CH
OO
L D
IST
RIC
TA
sses
smen
t Tec
hniq
ue M
atch
ed to
Pur
pose
Ach
ieve
men
t Com
paris
onI
Sta
te.
t>c)
c>c>
c>1
Nat
iona
l.
Dis
tric
t.
Sch
ool /
Cla
ssro
omO
ther
Ach
ieve
men
t Inf
orm
atio
n
Ass
essm
ent T
echn
ique
i:,c>
c)i=
;.
Sta
teT
ests
NR
Tt'i
'es/
PLA
N /
ACT-SAT
Ach
ieve
men
t Lev
el T
ests
Com
pute
rA
dapt
ive
Tes
tsC
RT
Per
for-
man
ceT
ests
Pro
ficie
ncy
Dat
aC
olle
ctio
n
Sch
ool/
Cla
ssro
omA
sses
smen
ts
Gra
deP
oint
Ave
rage
Pro
ficie
ncy
Sta
tus
Cla
ssR
anki
ng
Impr
ovem
ent o
f St
uden
t Lea
rnin
g
1. In
stru
ctio
nal f
ocus
(dia
gnos
es o
f spe
cial
need
s an
d pl
acen
ient
deci
sion
s)
53
33
23
1x
2. S
uppo
rt /
valid
ate
teac
her
judg
men
ts o
fst
uden
t pro
ficie
ncy.
54
23
31
xx
3. M
onito
r in
divi
dual
stud
ent p
rogr
ess
over
time
41
23
xx
4.F
eedb
ack
to s
tude
nts
and pa
rent
s re
late
d to
educ
atio
nal g
oals
51
14
32
12
12
1
Impr
ovem
ent o
f In
stru
ctio
nal P
rogr
ams
5. M
onito
r ac
hiev
emen
ti
of d
istr
ict S
tude
nti
32
23
4I
x
AC
hiev
emen
t Obj
ectiv
es
6.. S
choo
l pro
files
53
14
32
xx
,
7. E
valu
atio
n of
sch
ool
1
and/
or d
istr
ict p
rogr
ams
i3
31
23
23
x1 i
Publ
ic A
ccou
ntab
ility
, Con
fide
nce,
and
Sup
port
1
8. In
form
the
dist
rict,
1
com
mun
ity; a
nd s
choo
l1
2
boar
d ab
out e
duca
tiona
lty
prog
ram
qua
lity
2I
33
Ix
x
CR
T: C
urric
ulum
Ref
eren
ced
Tes
tN
RT
: Nor
m R
efer
ence
d T
est
RA
TIN
G S
CA
LEI =
Bes
t / o
ptim
al te
chni
que
for
that
ass
essm
ent p
urpo
se3
= A
dequ
ate
tech
niqu
e fo
r th
at a
sses
smen
t pur
pose
5 =
Min
imal
ly a
ccep
tabl
e te
chni
que
for
that
ass
essm
ent p
urpo
seB
LAN
K a
Tec
hniq
ue n
ot p
ract
ical
or
appr
opria
te fo
r th
at a
sses
smen
t pur
pose
x =
App
licab
le to
pur
pose
'* In
clud
es p
roje
cts,
por
tfolio
s, e
tc.
CH
ER
RY
CR
EE
K S
CH
OO
L D
IST
RIC
TA
udie
nce
Mat
ched
to P
urpo
se
..A
UD
IEN
CE
.
Ass
essm
ent P
urpo
se%
. ta
tat t
e %
. ith
Stud
ent
Tea
cher
Pare
ntC
ouns
elo
rSc
hool
Dis
tric
tB
oard
of E
duc
Publ
ic
Impr
ovem
ent o
f St
uden
t Lea
rnin
g
I. I
nsir
uctiO
nal f
ocus
(dia
gnos
es o
f sp
ecia
lne
eds
and
plac
emen
t,
deci
sion
s) >
:'
2. S
uisp
ort I
Val
idat
ele
sche
ijudg
men
ts o
fSt
uden
t pro
fici
ency
3 M
onito
r in
divi
dual
stud
ent p
rogr
eiS
over
time
4 Fe
edbi
ck to
:Stu
dent
s.:
..,-:
;.par
ents
rel
ated
to..
educ
atio
nal g
oils
Impr
ovem
ent o
f In
stru
ctio
nal P
rogr
ams
Mon
itor
achi
evem
ent
of d
istr
ict S
tude
ntA
chie
vem
ent O
bjec
tives
6. S
choo
l pro
file
s
7. E
valu
atio
n of
sch
ool
andf
or d
istr
ict p
rogr
ams
Publ
ic A
ccou
ntab
ility
, Con
fide
nce,
and
Sup
port
8 In
form
the
dist
rict
com
mun
ity, a
nd s
choo
lx
xx
x
boar
d ab
out e
duca
tiona
lpr
ogra
m q
ualit
y
30X
= A
sses
smen
t res
ults
fro
m p
urpo
se im
port
ant i
nfor
mat
ion
to a
udie
nce
BL
AN
K =
Ass
essm
ent r
esul
ts f
rom
pur
pose
less
impo
rtan
t to
audi
ence
NO
TE
: Ass
essm
ent d
ata
colle
cted
for
a sp
ecif
ic p
urpo
se is
mor
e/le
ssre
leva
nt o
r im
port
ant t
o m
embe
rsof
par
ticul
ar a
udie
nces
.
31
Pa 2e 10 CAP 1-liuhli2hts September 1997
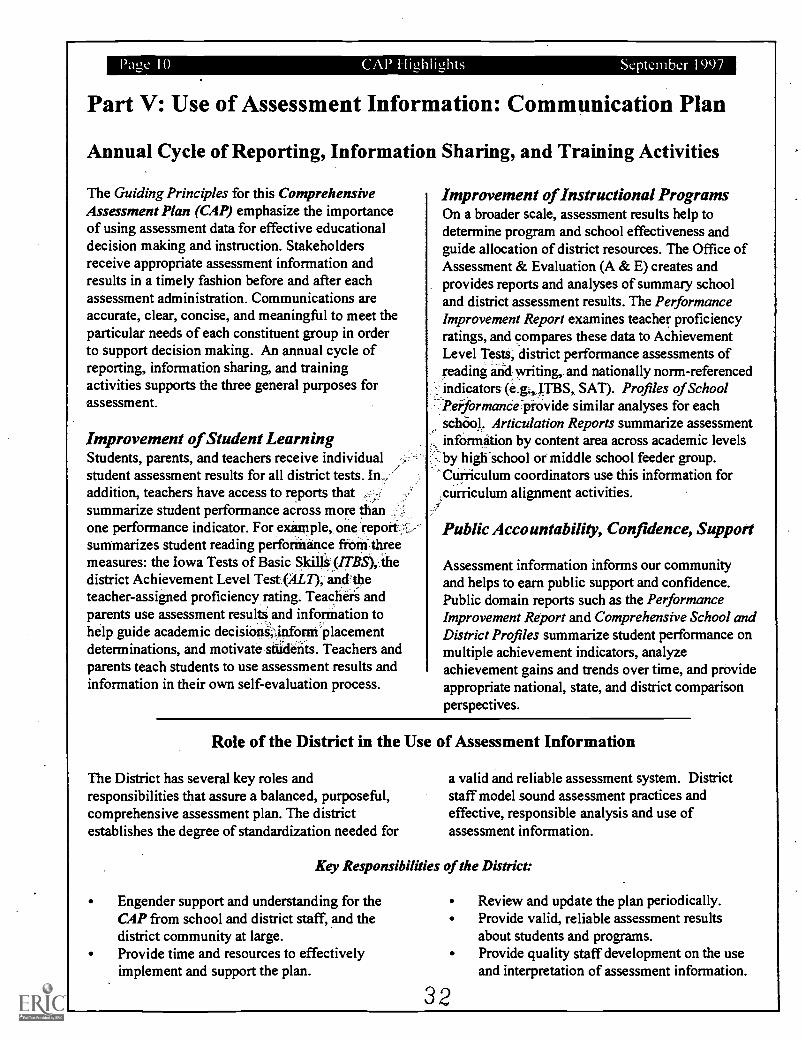
Part V: Use of Assessment Information: Communication Plan
Annual Cycle of Reporting, Information Sharing, and Training Activities
The Guiding Principles for this ComprehensiveAssessment Plan (CAP) emphasize the importanceof using assessment data for effective educationaldecision making and instruction. Stakeholdersreceive appropriate assessment information andresults in a timely fashion before and after eachassessment administration. Communications areaccurate, clear, concise, and meaningful to meet theparticular needs of each constituent group in orderto support decision making. An annual cycle ofreporting, information sharing, and trainingactivities supports the three general purposes forassessment.
Improvement of Student LearningStudents, parents, and teachers receive individualstudent assessment results for all district tests. In,addition, teachers have access to reports thatsummarize student performance across more thanone performance indicator. For example, one;,report;,:,.summarizes student reading performance froMthreemeasures: the Iowa Tests of Basic Skilla'(/TBS),:.thedistrict Achievement Level Test (ALT); andAheteacher-assigned proficiency rating. Teacher's andparents use assessment results and inforthation tohelp guide academic decisionainforni'placementdeterminations, and motivate students. Teachers andparents teach students to use assessment results andinformation in their own self-evaluation process.
Improvement of Instructional ProgramsOn a broader scale, assessment results help todetermine program and school effectiveness andguide allocation of district resources. The Office ofAssessment & Evaluation (A & E) creates andprovides reports and analyses of summary schooland district assessment results. The PerformanceImprovement Report examines teacher proficiencyratings, and compares these data to AchievementLevel Tests, district performance assessments ofreading and writing, and nationally norm-referencedindicators (e.g4,ITBS, SAT). Profiles of School(Performance provide similar analyses for eachschool. Articulation Reports summarize assessmentinformation by content area across academic levelsby high'school or middle school feeder group.Curriculum coordinators use this information for
,curriculum alignment activities.
Public Accountability, Confidence, Support
Assessment information informs our communityand helps to earn public support and confidence.Public domain reports such as the PerformanceImprovement Report and Comprehensive School andDistrict Profiles summarize student performance onmultiple achievement indicators, analyzeachievement gains and trends over time, and provideappropriate national, state, and district comparisonperspectives.
Role of the District in the Use of Assessment Information
The District has several key roles andresponsibilities that assure a balanced, purposeful,comprehensive assessment plan. The districtestablishes the degree of standardization needed for
a valid and reliable assessment system. Districtstaff model sound assessment practices andeffective, responsible analysis and use ofassessment information.
Key Responsibilities of the District:
Engender support and understanding for theCAP from school and district staff, and thedistrict community at large.Provide time and resources to effectivelyimplement and support the plan.
Review and update the plan periodically.Provide valid, reliable assessment resultsabout students and programs.Provide quality staff development on the useand interpretation of assessment information.
32
September 1997 CAP Highlights Pate 11
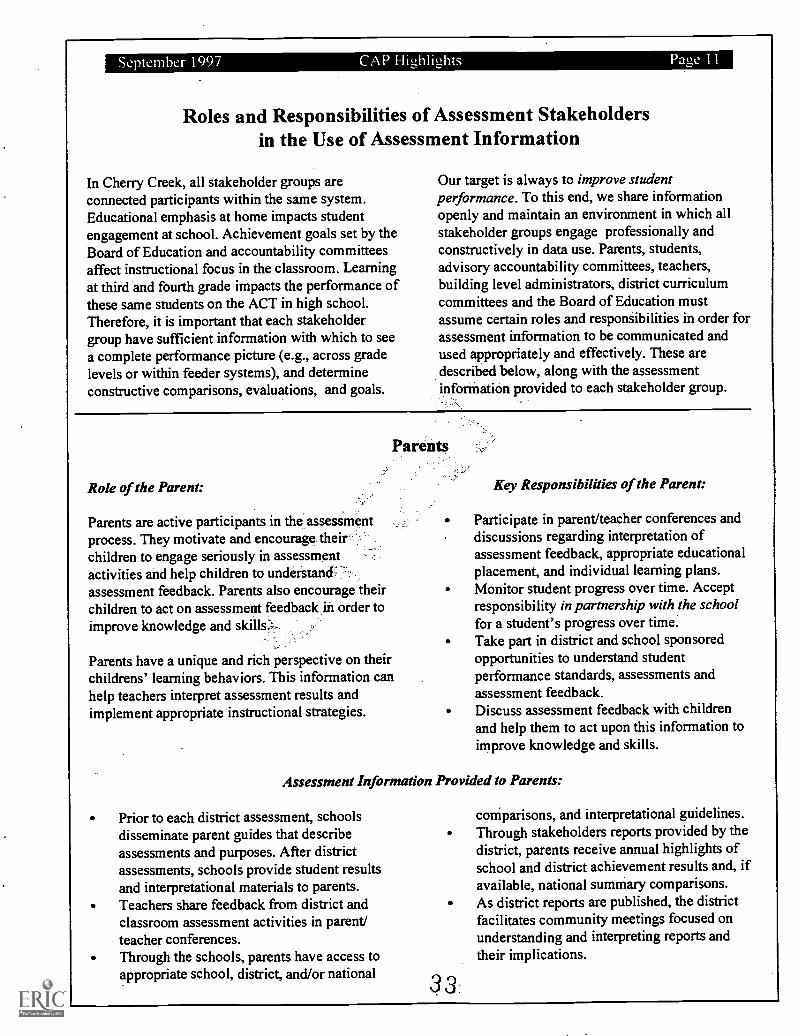
Roles and Responsibilities of Assessment Stakeholdersin the Use of Assessment Information
In Cherry Creek, all stakeholder groups areconnected participants within the same system.Educational emphasis at home impacts studentengagement at school. Achievement goals set by theBoard of Education and accountability committeesaffect instructional focus in the classroom. Learningat third and fourth grade impacts the performance ofthese same students on the ACT in high school.Therefore, it is important that each stakeholdergroup have sufficient information with which to seea complete performance picture (e.g., across gradelevels or within feeder systems), and determineconstructive comparisons, evaluations, and goals.
Our target is always to improve studentperformance. To this end, we share informationopenly and maintain an environment in which allstakeholder groups engage professionally andconstructively in data use. Parents, students,advisory accountability committees, teachers,building level administrators, district curriculumcommittees and the Board of Education mustassume certain roles and responSibilities in order forassessment information to be communicated andused appropriately and effectively. These aredescribed below, along with the assessmentinformation provided to each stakeholder group.
Role of the Parent:
Parents are active participants in the assessmentprocess. They motivate and encourage their'children to engage seriously in assessmentactivities and help children to understand;7:assessment feedback. Parents also encourage theirchildren to act on assessment feedback in order toimprove knowledge and
Parents have a unique and rich perspective on theirchildrens' learning behaviors. This information canhelp teachers interpret assessment results andimplement appropriate instructional strategies.
Rey Responsibilities of the Parent:
Participate in parent/teacher conferences anddiscussions regarding interpretation ofassessment feedback, appropriate educationalplacement, and individual learning plans.Monitor student progress over time. Acceptresponsibility in partnership with the schoolfor a student's progress over time.Take part in district and school sponsoredopportunities to understand studentperformance standards, assessments andassessment feedback.Discuss assessment feedback with childrenand help them to act upon this information toimprove knowledge and skills.
Assessment Information Provided to Parents:
Prior to each district assessment, schoolsdisseminate parent guides that describeassessments and purposes. After districtassessments, schools provide student resultsand interpretational materials to parents.Teachers share feedback from district andclassroom assessment activities in parent/teacher conferences.Through the schools, parents have access toappropriate school, district, and/or national
comparisons, and interpretational guidelines.Through stakeholders reports provided by thedistrict, parents receive annual highlights ofschool and district achievement results and, ifavailable, national summary comparisons.As district reports are published, the districtfacilitates community meetings focused onunderstanding and interpreting reports andtheir implications.
33.
Paoe 17 CAP Highlights September 1997
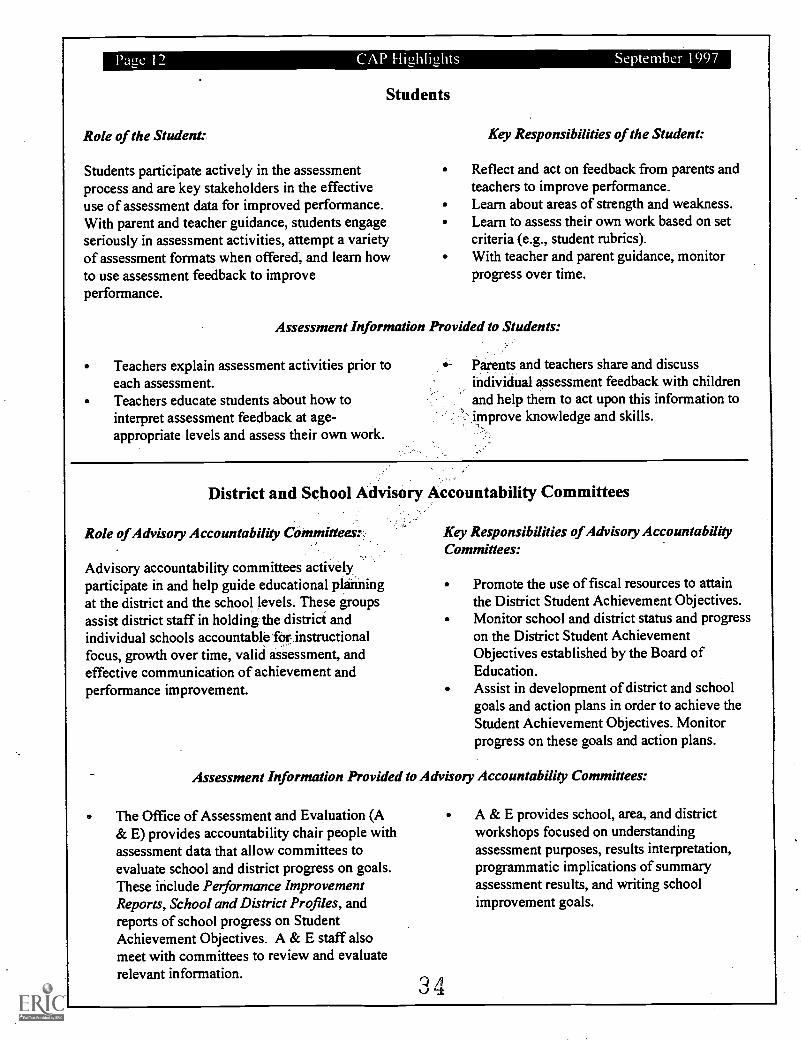
Students
Role of the Student:
Students participate actively in the assessmentprocess and are key stakeholders in the effectiveuse of assessment data for improved performance.With parent and teacher guidance, students engageseriously in assessment activities, attempt a varietyof assessment formats when offered, and learn howto use assessment feedback to improveperformance.
Key Responsibilities of the Student:
Reflect and act on feedback from parents andteachers to improve performance.Learn about areas of strength and weakness.Learn to assess their own work based on setcriteria (e.g., student rubrics).With teacher and parent guidance, monitorprogress over time.
Assessment Information Provided to Students:
Teachers explain assessment activities prior toeach assessment.Teachers educate students about how tointerpret assessment feedback at age-appropriate levels and assess their own work.
Parents and teachers share and discussindividual assessment feedback with childrenand help them to act upon this information toimprove knowledge and skills.
District and School Advisory Accountability Committees
Role of Advisory Accountability Committees:,
Advisory accountability committees activelyparticipate in and help guide educational planningat the district and the school levels. These groupsassist district staff in holding the district andindividual schools accountable for instructionalfocus, growth over time, valid assessment, andeffective communication of achievement andperformance improvement.
Key Responsibilities of Advisory AccountabilityCommittees:
Promote the use of fiscal resources to attainthe District Student Achievement Objectives.Monitor school and district status and progresson the District Student AchievementObjectives established by the Board ofEducation.Assist in development of district and schoolgoals and action plans in order to achieve theStudent Achievement Objectives. Monitorprogress on these goals and action plans.
Assessment Information Provided to Advisory Accountability Committees:
The Office of Assessment and Evaluation (A& E) provides accountability chair people withassessment data that allow committees toevaluate school and district progress on goals.These include Performance ImprovementReports, School and District Profiles, andreports of school progress on StudentAchievement Objectives. A & E staff alsomeet with committees to review and evaluaterelevant information.
34
A & E provides school, area, and districtworkshops focused on understandingassessment purposes, results interpretation,programmatic implications of summaryassessment results, and writing schoolimprovement goals.
September 1997 CAP HiLthliuhts Pale 13
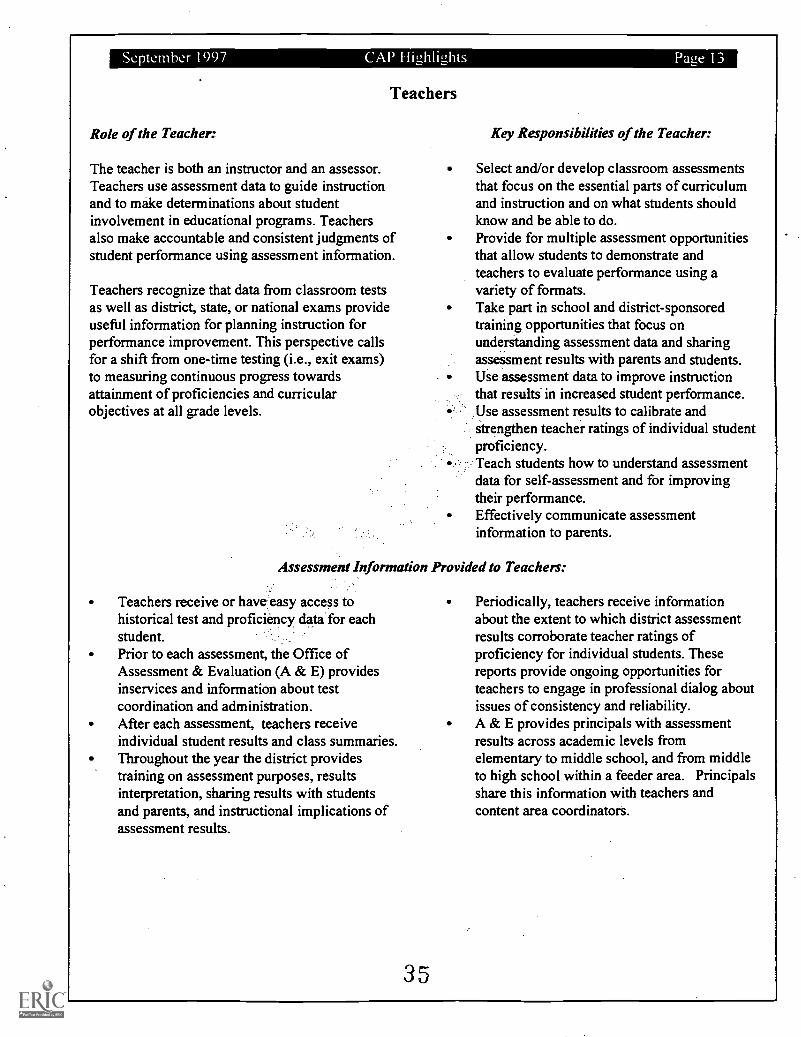
Teachers
Role of the Teacher:
The teacher is both an instructor and an assessor.Teachers use assessment data to guide instructionand to make determinations about studentinvolvement in educational programs. Teachersalso make accountable and consistent judgments ofstudent performance using assessment information.
Teachers recognize that data from classroom testsas well as district, state, or national exams provideuseful information for planning instruction forperformance improvement. This perspective callsfor a shift from one-time testing (i.e., exit exams)to measuring continuous progress towardsattainment of proficiencies and curricularobjectives at all grade levels.
Key Responsibilities of the Teacher:
Select and/or develop classroom assessmentsthat focus on the essential parts of curriculumand instruction and on what students shouldknow and be able to do.Provide for multiple assessment opportunitiesthat allow students to demonstrate andteachers to evaluate performance using avariety of formats.Take part in school and district-sponsoredtraining opportunities that focus onunderstanding assessment data and sharingassessment results with parents and students.Use assessment data to improve instructionthat results in increased student performance.Use assessment results to calibrate andstrengthen teacher ratings of individual studentproficiency.Teach students how to understand assessmentdata for self-assessment and for improvingtheir performance.Effectively communicate assessmentinformation to parents.
Assessment Information Provided to Teachers:
Teachers receive or have easy access tohistorical test and proficiency data for eachstudent.Prior to each assessment, the Office ofAssessment & Evaluation (A & E) providesinservices and information about testcoordination and administration.After each assessment, teachers receiveindividual student results and class summaries.Throughout the year the district providestraining on assessment purposes, resultsinterpretation, sharing results with studentsand parents, and instructional implications ofassessment results.
35
Periodically, teachers receive informationabout the extent to which district assessmentresults corroborate teacher ratings ofproficiency for individual students. Thesereports provide ongoing opportunities forteachers to engage in professional dialog aboutissues of consistency and reliability.A & E provides principals with assessmentresults across academic levels fromelementary to middle school, and from middleto high school within a feeder area. Principalsshare this information with teachers andcontent area coordinators.
Paue 14 CAP Highlights September 1997
Principals and District Administrators
Role of the Building Administrator (Principal):
The building principal assumes leadership foranalysis and use of assessment data, and serves asthe primary assessment information resource forteachers and parents in their school community.
Principals monitor the assessment practices ofteachers and encourage the development andselection of assessments that are integral toinstruction, appropriate, and aligned with thestandards set by the district. Principals establishand maintain priorities for teacher understandingand use of assessment data.
Part of the administrative evaluation and goalsetting process for building principals is todemonstrate the ability to understand and interpretschool assessment results, establish appropriatedata-based goals, and carry out and measure theimpact of action plans.
Key Responsibilities of the BuildingAdministrator:
Use assessment results to guide appropriateinstructional/curricular changes for improvedstudent performance at all levels.Effectively engage teachers in the under-standing and use of assessment information toimprove instruction.Guide the development of data-based goals inthe advisory accountability committee.Communicate and interpret assessmentinformation effectively to parents.Work with teachers to engender a high level ofcompetence and comfort with communicatingassessment feedback with parents and students.Use data provided by the district to facilitateteacher awareness of issues of consistency andreliability in teacher ratings of studentperformance.Ensure appropriate time and resources forassessment staff development. Provideopportunities for teachers to participate indistrict assessment training activities.Participate in district-sponsoredadministrators' inservices on the use andinterpretation of assessment results.Review school assessment data with theirExecutive Director and describeinterpretations and action plans that resultfrom assessment data.
Assessment Information Provided to the Building Administrator:
After each assessment, A & E providesadministrators with summary results forclassrooms, schools, and district.Principals receive assessment data that allowthem to evaluate school progress on StudentAchievement Objectives. These includePerformance Improvement Reports, Schooland District Profiles, and comprehensivenotebooks of each school's assessment data.Principals receive summary information aboutthe extent to which district assessment resultscorroborate teacher ratings of proficiency forstudents. These reports provide ongoingopportunities for school staff to engage inprofessional dialog about issues of consistency
and reliability in the teacher judgment process.A & E provides principals with assessmentresults across academic levels fromelementary to middle school, and from middleto high school within a feeder area. Principalsshare this information with teachers andcontent area coordinators.Throughout the year, A & E providesopportunities for administrator inservicesfocused on appropriate interpretation, use, andprogrammatic implications of summaryassessment results. A & E also providesmaterials and resources for presenting resultsto teachers and parents.
36
September 1997 CAP Flighlitzhts Page 15
Curriculum Coordinating Council (CCC)
Role of the Curriculum Coordinating Council:
The CCC is a committee made up of teachers,content area coordinators, school and districtadministrators, and district staff. In general, theCCC oversees and informs the assessment processfor the district. The council identifies the keyelements of assessment needs and guides the designof district-, school-, and classroom-levelassessments and tasks. The CCC initiates new orrevised district and/or classroom assessments basedon identified needs, guides development andrevision processes, and authorizes implementation.
Key Responsibilities of CCC:
Establish and monitor criteria for assessmentselection, development, and revision.Provide guidance for teachers in selecting ordeveloping their own assessments.Create, maintain, and update banks ofassessments, test items, tasks, and rubrics.Monitor the alignment of assessments with thecurriculum guides and with districtproficiencies and standards.Using assessment data, guide the alignment ofinstructional focus within and across feederareas to ensure consistency.
Assessment Information Provided to the CCC or CCC task forces:
CCC members have access to A & Eassessment library and training resources. A &E also provides resources and people to assistin the selection, development, and revision ofdistrict assessments.CCC members receive assessment data thatallow them to evaluate district and feeder areaprogress on Student Achievement. Objectives.These include Performance ImprovementReports, School and District Profiles, andcomprehensive notebooks of each feederarea's assessment data.
CCC members receive summary informationabout the extent to which district assessmentresults corroborate teacher ratings ofproficiency for students.CCC initiates task forces to respond to definedneeds. Task forces discuss information needswith A & E and receive assessment resourceinformation and data as needed to meet thespecific purpose(s) of the group.
Board of Education
Role of the Board of Education:
The Board of Education creates the vision forperformance improvement for the district. Board-established Student Achievement Objectives guideinstructional focus and provide a template withwhich to monitor growth over time. All districtassessment efforts and activities must support andinform the Board objectives and the goals.
Key Responsibilities of the Board:
Monitor district status and progress on theDistrict Student Achievement Objectives, anddetermine necessary district goals and actionplans in order to achieve them.Allocate fiscal resources to attain the DistrictStudent AChievement Objectives.
Assessment Information Provided to the Board of Education:
The Board receives biannual reports of districtstatus on all standardized assessments andprogress on the District Student Achievement
37
Objectives. Wherever available, reports includenational comparison points.
Page 16 CAP 1-li2hli$2.hts September 1997
Part VI: Staff Development Support for CAP 2002
The long term success of the ComprehensiveAssessment Plan (CAP) for 2002 depends upon theinvolvement and expertise of classroom teachers andbuilding administrators. This component of the CAPmust have adequate prioritization and resources.
A commitment of time and resources is imperativefor effective understanding and use of assessmentinformation by teachers, and efficient districtwideassessment and data collection. The followingexpectations are a priority in the full implementationof the CAP.
Roles of the Offices of Staff Development andAssessment and Evaluation
Staff Development, and Assessment andEvaluation (A & E) Offices jointly organize andimplement the staff development opportunitiesin assessment. A & E provides the expertise inthe area of assessment, measurement, andevaluation by developing the content for theprofessional opportunities and choosing andtraining (when necessary) the instructors for thesessions. The Staff Development Office workswith A & E to coordinate and implement thetraining and support given to the administratorsand Assessment Liaisons (see below).
Teachers and administrators at the appropriategrade levels participate in training, availabledistrictwide, for the following assessment types:
State TestsNorm Referenced Tests (ITBS and PLAN)Achievement Level TestsComputerized Adaptive TestsCurriculum Referenced TestsPerformance AssessmentsPortfolios
Parents, District Advisory AccountabilityCommittee members, and interested publicreceive assessment results and information oninterpretation and use for improvedperformance.
Role of Assessment Liaison
An Assessment Liaison is designated at eachelementary school who serves as dissemination/training agent for the assessment program. Atthe secondary level, an Assessment Team (withan administrative leader) directs this process.The Assessment Liaison, the school principal,and administrative staff are trained in testadministration, interpretation, and reporting.
The Assessment Liaisons facilitate the develop-ment and piloting of new assessments andreporting formats. The Liaisons communicatewith their school's test coordinator for eachassessment.
Assessment Training
Teachers, administrators, counselors, and others(as appropriate) receive staff development in sixareas.
Understanding the purpose and audiencefor each of the assessments given tostudentsUnderstanding the alignment of theassessments with the district proficienciesand curriculaAssessment administration proceduresScoring and analyzing classroom basedassessmentsUtilizing assessment information to refineteaching practices and evaluate programsCommunicating assessment informationto parents, school advisory accountabilitycommittees, and the community
Other stakeholders, especially School Site-Based Decision Making Councils, SchoolAdvisory Accountability Committees, and otherinterested members of the school communityare provided with training in the use ofassessment informa-tion. To reach thecommunity, information about the assessmentand reporting system is disseminated via visualor print media.
Teachers, counselors, and administrators aretrained in the interpretation and use of data,focusing on examining student performanceimprovement over time and across differentassessments.
3V
September 1997 CAP Highlights Pave 17
Part VII: Implications for Implementationof the Comprehensive Assessment Plan for 2002
Ideally, assessments of student learning areintegrated within the daily work of the classroom,not added to the classroom as occasional, extra tasks.These assessments of student learning serve as .abeacon, guiding further learning by continuouslyemphasizing how performance might be improved.Ideal assessments of student learning support eachstudent's growth in the critical ability to self-assessone's own performance according to qualitystandards. Cherry Creek Schools has implementedperformance standards in the form of Proficienciesfor students in grades 5, 8, and 12 in each of the coreareas (reading, literature, writing, mathematics,history, geography, civics, economics, and science).Proficiency standards have also been developed forthe expanded core: the arts, physical education,foreign language, health, and information literacy.
The Cherry Creek Schools ComprehensiveAssessment Plan (CAP) incorporates a variety oftools to measure student learning. It includesclassroom assessments implemented by theclassroom teacher and districtwide assessmentsadministered to all students at the identified gradelevels. The Cherry Creek Schools CAP is intended toincorporate both classroom and district assessments.
Implementation of the CAP will take place over afive year period, from 1997-98 through the 2001-02school year. The accompanying tables identify theessential components of our comprehensiveassessment system, establish a timeline forimplementation, and identify the implications of theprocess. The implementation process will becontinually evaluated, and revised as necessary.
General Considerations
All implementation steps require staffdevelopment. Teachers and administrators needongoing staff development in administering thetests and analyzing the data. Staff developmentis coordinated by the Assessment andEvaluation and Staff Development offices.
A balanced, purposeful assessment system, withproper emphasis on national measures to helpstudents achieve their goals, requirescontinuous, meaningful communication with allaudiences -- the Board of Education, teachers,parents, media, and the general public.
The Assessment Plan is evaluated annually andrevised as needed.
Implementation of the Assessment Plan iscoordinated with the Curriculum CoordinatingCouncil.
State Assessments are incorporated into theAssessment Plan according to state guidelinesand timeline.
Assessments may need to be added to meet therequirements of state legislation, ColoradoDepartment of Education guidelines, or districtneeds for additional data.
Classroom assessments are valued and are ameaningful facet of student evaluation. Districtassessments should validate the results ofclassroom assessment. Teachers andadministrators evaluate discrepancies betweenclassroom and district assessments, and use thatinformation for improvement.
The budgeting and planning for assessmentshould be aligned with curriculum, instruction,staff development, and technology. To beeffective, useful, and informative, districtassessments should have instructional,curricular, staff development, and technologycomponents.
3 3
13.152.0 I CAP Eli!2,1ilitzhts September 1997
Comprehensive Assessment PlanTransition Timeline
TESTS 1997-98 1998-99 1999-00 2000-01 2001-02
Iowa Tests of Basic Skills (ITBS)READING, LANGUAGE, MATH
SCIENCE, SOCIAL STUDIES
PLAN
3,4 Spr.6,7,8 Fall
6,7,8 Fall
10 Fall
3,4, Spr.6,7,8 Fall
6,7,8 Fall
10 Fall
3 Spr.6,7 Fall
6,7 Fall
10 Fall
3,5 Fall6,7 Fall
6,7 Fall
10 Fall
3,5,7 Fall
5,7 Fall
10 Fall
NWEA Achievement Level Tests 69READING, MATH
LANGUAGE SKILLS
SCIENCE
5 Fall-Spr.6,7 Spr.(Pilot)5 Fall-Spr.6,7,8 Spr.(Pilot)6.7,8 Spr.(Pilot)
2 (Spr. Pilot)5 Fall - Spr.,; ,6,7,8 Spr
5 Fall-Spr.6,7,81'Spr.
6,7;8' S
2 (Reading only):3,4,5,6,7,8 ,Spr.
-3,4,5,6,7,8:Spr.
6,7,8 Spr.
2 (Reading only)3,4,5,6,7,8Spr.
3,4,5,6,7,8Spr.
6,7,8 Spr.
2 (Reading only)3,4,5,6,7,8Spr.
3,4,5,6,7,8Spr.
6,7,8 Spr.
State AssessmentREADINGWRITINGMATHSCIENCE
3 ,4 3 ,445
3, 445, 8
3, 44,5, 88
3, 44,5, 88- 7 - -
Science Process (Investigation) 5, 8 5, 8 5, 8 5, 8 5, 8
Math Performance Assessments 6, 7, 8 6, 7, 8 6, 7, 8 6, 7, 8 6, 7, 8
Reading Performance Assessments 47 1 (Develop)8 (Pilot)10 (Develop)
1 (Pilot)84,10 0 (Pilot)
1
8,10
1
8,10
1
8,10
Writing Performance Assessments 0Read On - Write On (ROWO)
Middle School Writing Assessment (MSWA)
High School Writing Assessment (HSWA)
1*
2, 340, 4, 5(Oct.)
70 Winter
110 Spr.
1*
2, 3 0, 4, 5(Oct.)
70 Winter
110 Spr.
1*
2, 3 49, 4, 5(Oct.)
70 Winter
110 Spr.
1*
2, 3 0, 4, 5(Oct.)
740 Winter
110 Spr.
1*
2, 3 0, 4, 5(Oct.)
70 Winter
110 Spr.
OTHERComputerized Adaptive Tests (NWEA)*Cognitive Abilities Test (CogAT)Nelson Denny Reading TestACT* / SAT*Proficiency Data Collection
3-830 Fall9 Fall 11 Spr.11-121,3,5-12 Spr.
3-830 Fall11 Spr.11-121,3,5-12 Spr.
3-830 Fall
11-121,3,5-12 Spr.
3-830 Fall
11-12.1,3,5-12 Spr.
3-830 Fall
11-121,3,5-12 Spr.
*OptionalDistrict Scoring (Reading and Writing Performance Scoring - District Sample only)
40
Iowa Tests of Basic Skills (ITBS) Results for the DistrictSpring 1997 Proficiency Data Collection: READING merged with
Fall 1997 ITBS Results: READING TOTALATV
(Percentages of of students in PB, B, P, and A columns who scored in ITBS Reading Total ranges described on the left.)Percentages rounded to the nearest whole number
Gr. 5 Spring Proficiency Data Collection merged with Gr. 6 Fall ITBS
ITBS Percentile RangesReading Total
Proficiency Data Collection Spring 1997-Reading
Advanced N=426 Proficient N=1543 Basic N=293 Prebasic N=54
91-99 52% 10% 1% 0
76-90 33% 27% 3% 0
51-75 13% 41% 19% 9%
26-50 2% 18% 41% 21%
11-25 0 4% 26% 48%
1-10 0 0% 10% 22%
Gr. 6 Spring Proficiency Data Collection merged with Gr. 7 Fall ITBS
ITBS Percentile RangesReading Total
Proficiency Data Collection Spring 1997-Reading
Advanced N=360 Proficient N=1339I Basic N=715 I Prebasic N=134
91-99 70% 20% 1% 1%
76-90 26% 38% 13% 0%
51-75 4% 33% 33% 8%
26-50 0 8% 39% 43%
11-25 0 1% 11% 34%
1-10 0 0 3% 14%
Gr. 7 Spring Proficiency Data Collection merged with Gr. 8 Fall ITBS
ITBS Percentile RangesReading Total
Proficiency Data Collection Spring 1997-Reading
Advanced N=346 'Proficient N=1196 Basic N=812 I Prebasic N=101
91-99 62% 16% 2% 0
76-90 30% 27% 8% 2%
51-75 9% 42% 37% 14%
26-50 0 12% 37% 35%
11-25 0 2% 13% 33%
1-10 0 0 3% 16%
41
District Achievement Level Test (ALT) Results
DISTRICT SUMMARY RESULTS:MIDDLE SCHOOL
Spring 1997 Proficiency Data Collection merged withSpring 1997 Level Test Results: READING
Grade 6 Spring Proficiency Data Collection merged withSpring Level Test Results
(Numbers represent percentages of students in PB,B, P, and A columns who scored in Level Test reading rangesdescribed on the left)
ALT RITScore Ranges
Reading
Proficiency Data Collection Spring 1997-Reading
Prebasic Basic Proficient Advanced
< 207. . ,
,g-?
,,.. - 16.5
207-212 ',
213-224 14.5...
,_
,. , 7,7 ' 0
225-230 1.5.
>= 231 2' ;',64..,
Percentages rounded to the nearest whole number
Grade 7 Spring Proficiency Data Collection merged with.Spring. Level Test Results
(Numbers represent percentages of students in PB, B, P, and A columns who scored in Level Test reading rangesdescribed on the left)
ALT RIT Proficiency Data Collection Spring 1997-ReadingScore Ranges
Reading Prebasic (PB) Basic (B) Proficient (P) Advanced (A)
<2124 ,
21 2 2
212-217 5
218-228 16 12
229-233 1 6
>= 234 0 2 13Percentages rounded to the nearest whole number
42
District Achievement Level. Test (ALT) Results
DISTRICT SUMMARY RESULTSSpring Proficiency Data Collection merged with Level Test Results: MATH
Grade 3 Spring Proficiency Data Collection merged with Grade 4 Fall Level Test(Numbers represent % of students in PB, B, P, and A columns who scored in Level Test math goal ranges described at left)
ALT RangesNums/Rels
Proficiency Data Collection Spring 1997-Nums/Rels
LO
Prebasic (PB) I Basic (B) I Proficient (P) I Advanced (A)
. 28 5
AV 5 AZ:Z, 32
HI 0 3-""
463
Percentages rounded, to the nearest whole number
ALT Ranges- Geometry
.. i
Proficiency Data Collection Spring .1997-Geometry
.Prebasic (PB) Basic (B) .
.
I: Proficient (P) I ' Advanced (A)
LO 1,- 'Yac,:..51' iSr4
,."f"- 16 1
AV 22 -.,.;.-3,7.----,. .,,, .7. .
34-..,., .. ,
14 :: .
I Ill 0 22!,.,: 1,.r-,, x .,...., -
,N!)!. , P 164,,g
,- 'FP' Or::
Percentages rounded to the nearest whole, number
ALT RangesStatistics
Proficiency Data Collection :Spring 1997-Statistics ' ..
Prebasic (PB)1
I Basic (B).
I Proficient (P) . Advanced (A)
LO 7-;:;2,,-.:eik,..4t.-.., '2-6'..%Tiii. ,
:`','-'"telr,E,frZ,i` 10 0
AV 19410F'``.!.. .--: ..4,-,.2-1,':1'7';'.!-`'=';'1-t.,:41.,,c:t- ,,----.4.----
.i.",
,,, .. ,I.' ,
=.---,r,,v-ol, , ,-,,'..,':-.-,-,,,,,,,-1:.,,
13
HI 11 26:.:.....2f,,,V;',.!,73:''-'4:::ii,.- 4:
-;,',.--:-.. '..,-,-, _ ,-...,,,,,,,--....f:1-0-,r - ,
,,
, ' =,:.,,,,,,F. :.,.
Percentages rounded to the nearest whole number
ALT Ranges*Algebra&Patterns
Proficiency Data Collection Spring 1997-Algebra/Patts
Prebasic (PB) Basic (B) Proficient (P) I Advanced (A)
(*Average Percent of Students in Algebra + Patterns Goal Ranges on the ALT),
LO. :-,.. :,-,
., 3-:,t-, --
., 5 Q:.'*7,:
-,..-19* 3*
AV 14* , .. . ,:::34, :.= : . ;., .- -"IS:-3 9*
HI 3* 16* ..: ..,., ,,,-49* ,7--, L-''': ": ..''-. :88*Percentages rounded to the nearest whole number
43
District Achievement Level Test (ALT) Results
DISTRICT SUMMARY RESULTSSpring Proficiency Data Collection merged with Level Test Results: MATH
Grade 5 Spring Proficiency Data Collection merged with Grade 5 Spring Level Test(Numbers represent % of students in PB, B, P, and A columns who scored in Leyel Test math goal ranges described at left.)
ALT Ranges _ Proficiency Data Collection Spring 1997-Nums/RelsNums/Rels
Preba.sic (PB) I Basic (B) Proficient (P) I Advanced (A)
LO..,.0,44:
10 1
AV 15,_ 5
HI 7 11 .
Percentages rounded to the nearest whole number
ALT Ranges Proficiency Data Collection Spring 1997-GeometryGeometry
Prebasic (PB) I. Basic (B) I. Proficient (P) I Advanced (A)
LO.---
-, 7 1
AV 33.. ,-.4-..
HI,
5 14 - r .-,,t
Percentages rounded to the nearest whole number
ALT Ranges.Statistics
Proficiency Data Collection Spring 1997-Statistics
Prebasic (PB) I Basic (B) Profcient (P) Advanced (A)
LO.-
6 1
AV 32,...,
9
HI 7 29Percentages rounded to the nearest whole number
ALT Ranges*Algebra&Patterns
Proficiency Data Collection Spring 1997-Algebra/Patts
Prebasic (PB) Basic (B) Proficient (P) Advanced (A)
(*Average Percent of Students in Algebra + Patterns Goal Ranges on the ALT)
LO 6 33* 7* 0*
AV 29* 40* 24* 5*
HI 10* 26* 6 .
Percentages rounded to the nearest whole number
44
GR
AD
E 6
RE
AD
ING
MU
LT
IPL
E V
AL
IDA
TIO
NS
Supp
ortin
g T
each
er R
atin
gs o
f St
uden
t Pro
fici
ency
Sch
ool Y
ear
1997
-98
Perf
orm
ance
Lev
els:
The
term
s Pr
ebas
ic, B
asic
, Pro
fici
ent,
and
Adv
ance
d to
des
crib
e a
stud
ent's
ove
rall
com
pete
nce
in a
n ar
ea li
ke m
ath
or r
eadi
ng. H
owev
er, a
stu
dent
's p
erfo
rman
ce o
n any
one
asse
ssm
ent o
r de
mon
stra
tion
may
not
alw
ays
fall
clea
rly
into
one
of
thes
e fo
ur le
vels
. The
gra
phs
incl
ude
over
lapp
ing
shad
ed a
reas
that
acc
omm
odat
e sc
ores
and
dem
onst
ratio
ns th
at f
all "
in b
etw
een.
"PB
=PR
EB
ASI
CB
=B
ASI
CP=
PRO
FIC
IEN
TA
=A
DV
AN
CE
D
CL
ASS
RO
OM
DE
MO
NST
RA
TIO
NS
Perf
orm
ance
/Dem
onst
ratio
nL
abel
eac
h de
mon
stra
tion
on li
nes
to th
e le
ft. O
n th
e gr
aph,
plo
t per
form
ance
leve
ls a
ssig
ned
by th
e te
ache
r.(L
ist H
ere)
1. 2. 3. 4. 5. 6.
Ach
ieve
men
t Lev
el T
est (
AL
T)
Rea
ding
RIT
Sco
re R
ange
s* S
prin
g 19
98*F
rom
the
teac
her's
gui
de R
eadi
ng th
e A
lpha
/Goa
l Cla
ss R
epor
t 199
7-98
. Ple
ase
take
into
acc
ount
an
erro
r ra
nge
of +
or
- ap
prox
imat
ely
2 R
IT p
oint
s.If
a s
tude
nt s
core
s a
213,
her
sco
re r
ange
is b
etw
een
abou
t 211
- 2
15, a
nd o
verl
aps
the
high
end
of
the
Bas
ic r
ange
and
the
low
end
of
the
Prof
icie
nt r
ange
.4-
207
213
225
231
-It
PBB
PP/
AA
Iow
a T
ests
of
Bas
ic S
kills
(IT
BS)
Rea
ding
Com
preh
ensi
on P
erce
ntile
Ran
k R
ange
s* F
all 1
997
*Fro
m s
ugge
stio
ns in
Nat
iona
l Sta
ndar
d Se
tting
for
the
Iow
a T
ests
, Sum
mer
199
6. P
leas
e ta
ke in
to a
ccou
nt a
n er
ror
rang
e of
+ o
r -
appr
oxim
atel
y8
perc
entil
e ra
nks.
If
a st
uden
t's p
erce
ntile
ran
k sc
ore
is 5
0, h
is s
core
ran
ge is
abo
ut 4
2-58
, and
ove
rlap
s th
e hi
gh e
nd o
f th
e B
asic
rang
e an
d th
e lo
w e
ndof
the
Prof
icie
nt r
ange
.
454-
16
5385
-§
PBB
Ff
PA
46
GR
AD
E 7
RE
AD
ING
MU
LT
IPL
E V
AL
IDA
TIO
NS
Supp
ortin
g T
each
er R
atin
gs o
f St
uden
t Pro
fici
ency
Sch
ool Y
ear
1997
-98
Perf
orm
ance
Lev
els:
The
term
s Pr
ebas
ic, B
asic
, Pro
fici
ent,
and
Adv
ance
d to
des
crib
e a
stud
ent's
ove
rall
com
pete
nce
in a
n ar
ea li
ke m
ath
or r
eadi
ng. H
owev
er, a
stu
dent
's p
erfo
rman
ce o
n an
yon
e as
sess
men
t or
dem
onst
ratio
n m
ay n
ot a
lway
s fa
ll cl
earl
y in
to o
ne o
f th
ese
folk
leve
ls. T
he g
raph
s in
clud
e ov
erla
ppin
g sh
aded
are
as th
at a
ccom
mod
ate
scor
es a
ndde
mon
stra
tions
that
fal
l "in
bet
wee
n."
PB=
PRE
BA
SIC
B=
BA
SIC
P=PR
OFI
CIE
NT
A=
AD
VA
NC
ED
Perf
orm
ance
/Dem
onst
ratio
n(L
ist H
ere)
1. 2. 3.
"M31
4. 5. 6.
CL
ASS
RO
OM
DE
MO
NST
RA
TIO
NS
Lab
el e
ach
dem
onst
ratio
n on
line
s to
the
left
. On
the
grap
h, p
lot p
erfo
rman
ce le
vels
ass
igne
d by
the
teac
her.
Ach
ieve
men
t Lev
el T
est (
AL
T)
Rea
ding
RIT
Sco
re R
ange
s* S
prin
g 19
98*F
rom
the
teac
her's
gui
de R
eadi
ng th
e A
lpha
/Goa
l Cla
ss R
epor
t 199
7-98
. Ple
ase
take
into
acc
ount
an
erro
r ra
nge
of +
or
- ap
prox
imat
ely
2 PI
T p
oint
s.If
a s
tude
nt s
core
s a
218,
her
sco
re r
ange
is b
etw
een
abou
t 216
- 2
20, a
nd o
verl
aps
the
high
end
of
the
Bas
ic r
ange
and
the
low
end
of
the
Prof
icie
nt r
ange
.4
212
218
229
234
4
PB61
,
PP/
AA
Iow
a T
ests
of
Bas
ic S
kills
(IT
BS)
Rea
ding
Com
preh
ensi
on P
erce
ntile
Ran
k R
ange
s* F
all 1
997
*Fro
m s
ugge
stio
ns in
Nat
iona
l Sta
ndar
d Se
tting
for
the
Iow
a T
ests
, Sum
mer
199
6. P
leas
e ta
ke in
to a
ccou
nt a
n er
ror
rang
e of
+ o
r -
appr
oxim
atel
y8
perc
entil
e ra
nks.
If
a st
uden
t's p
erce
ntile
ran
k sc
ore
is 5
0, h
is s
core
ran
ge is
abo
ut 4
2-58
, and
ove
rlap
s th
e hi
gh e
nd o
f th
e B
asic
rang
e an
d th
e lo
w e
nd4
7of
the
Prof
icie
nt r
ange
.4
84
1753
854
PBB
PA
GR
AD
E 8
RE
AD
ING
MU
LT
IPL
E V
AL
IDA
TIO
NS
Supp
ortin
g T
each
er R
atin
gs o
f St
uden
t Pro
fici
ency
Sch
ool Y
ear
1997
-98
Perf
orm
ance
Lev
els:
The
term
s Pr
ebas
ic, B
asic
, Pro
fici
ent,
and
Adv
ance
d to
des
crib
e a
stud
ent's
ove
rall
com
pete
nce
in a
n ar
ea li
ke m
ath
or r
eadi
ng. H
owev
er, a
stu
dent
's p
erfo
rman
ce o
n any
one
asse
ssm
ent o
r de
mon
stra
tion
may
not
alw
ays
fall
clea
rly
into
one
of
thes
e fo
ur le
vels
. The
gra
phs
incl
ude
over
lapp
ing
shad
ed a
reas
that
acc
omm
odat
e sc
ores
and
dem
onst
ratio
ns th
at f
all "
in b
etw
een.
"PB
=PR
EB
ASI
CB
=B
ASI
CP=
PRO
FIC
IEN
TA
=A
DV
AN
CE
D
CL
ASS
RO
OM
DE
MO
NST
RA
TIO
NS
Perf
orm
ance
/Dem
onst
ratio
nL
abel
eac
h de
mon
stra
tion
on li
nes
to th
e le
ft. O
n th
e gr
aph,
plo
t per
form
ance
leve
ls a
ssig
ned
by th
e te
ache
r.(L
ist H
ere)
1. 2. 3. 4. 5. 6.
Ach
ieve
men
t Lev
el T
est (
AL
T)
Rea
ding
RIT
Sco
re R
ange
s* S
prin
g 19
98*F
rom
the
teac
her's
gui
de R
eadi
ng th
e A
lpha
/Goa
l Cla
ss R
epor
t 199
7-98
. Ple
ase
take
into
acc
ount
an
erro
r ra
nge
of +
or
- ap
prox
imat
ely
2 R
IT p
oint
s.If
a s
tude
nt s
core
s a
222,
her
sco
re r
ange
is b
etw
een
abou
t 220
- 2
24, a
nd o
verl
aps
the
high
end
of
the
Bas
ic r
ange
and
the
low
end
of
the
Prof
icie
nt r
ange
.4
215
222
234
240
PBB
IP/
AA
Iow
a T
ests
of
Bas
ic S
kills
(IT
BS)
Rea
ding
Com
preh
ensi
on P
erce
ntile
Ran
k R
ange
s* F
all 1
997
*Fro
m s
ugge
stio
ns in
Nat
iona
l Sta
ndar
d Se
tting
for
the
Iow
a T
ests
, Sum
mer
199
6. P
leas
e ta
ke in
to a
ccou
nt a
n er
ror
rang
e of
+ o
r -
appr
oxim
atel
y8
perc
entil
e ra
nks.
If
a st
uden
t's p
erce
ntile
ran
k sc
ore
is 5
0, h
is s
core
ran
ge is
abo
ut 4
2-58
, and
ove
rlap
s th
e hi
gh e
nd o
f th
e B
asic
rang
e an
d th
e lo
w e
ndof
the
Prof
icie
nt r
ange
.4
1853
85
PBB
IP
A
4950
Proposed District Assessment Schedule by Season1998 - 99 A-TrActrowia- 7
1 Proficiency Data Collection
2 ALT (Reading)CogAT*
3 Written RetellIRI (PreBasic & Basic only)CogAT (nonpilot schools)*
ITBSCSAP-ReadingProficiency Data Collection
4 Writing Pretest
:.:i..§.
ITBSCSAP-Reading, Writing
5 ALT (Reading Language, Math)Math Constructed Response Test
..,:m..,
AL Z. - . l Language, Math4.- [math in 98-99 only])SAP-Math
Proficiency Data Collection
6:
ITBSALT (Science) mligq'
....=;:;...%
(Reading, Language, Math,Science)
Proficiency Data Collection
7 ITBS iAtk. :,,,..., Ilm,,N:Na.' ''s:"'v'W; '''
ALT (Reading, Language, Math,Science)
Math Constructed Response TestProficiency Data Collection
8 ITBS *.,V-
..,3.
ALT (Reading, Language, Math,Science)
Reading Performance TestProficiency Data Collection[1999-00: CSAP -Math]
9 Nelson P -..,....r.,:.v.:.e.s.
Proficiency Data CollectionALT (Science)
10 PLAN Proficiency Data Collection
11 ACT / SAT ACT / SATNelson Denny*
ACT / SATHS Writing Assess.Proficiency Data Collection
12 ACT/SAT ACT/SAT ACT/SATProficiency Data Collection
[NOTE: If House Bill 98-1267 is enacted, CSAP would include Grade 5 Math in fall (not spring) and Grade 7Reading & Writing in spring, in addition to Grade 3 Reading and Grade 4 Reading & Writing.]
All optional testing requires discussion with and approval by the Executive Director for the schooL
* CogAT & Nelson Denny Individual results, but no districtor school summary
ITBS: Iowa Tests of Basic Skills ALT: Achievement Level TestsSAT / ACT: college entrance exams PLAN: pre-ACT test CogAT: Cognitive Abilities Test
Administration TimeCSAP: Gr 3: 2 hours Gr 4: 6 hours Gr 5: 4-6 hoursITBS: 5 hours PLAN: 3 hours Nelson-Denny: 1-2 hoursALT: 1 hour/area tested CogAT: 1.5-2.5 hoursMSWA: 2-3 hours HSWA: 2-3 hoursACT/SAT: 4 hours (not during regular school hours)
2/4/98 [tests\plans\cap9899]
L.
U.S. Department of EducationOffice of Educational Research and Improvement (OERI)
National Library of Education (NLE)Educational Resources Information Center (ERIC)
REPRODUCTION RELEASE(Specific Document)
I. DOCUMENT IDENTIFICATION:
rim 09- 3 "LioERIC
Title:
*, "{-nA.4jodd St -14,5-111,t- Va.144-er 11-6 MIS Pre'retad-onot 23 jeeo rt
Author(s): lily, , V,e4 IA) fr\clik #efCorporate Source:
ckeey.nPublication Date:
II. REPRODUCTION RELEASE:
In order to disseminate as widely as possible timely and significant materials of interest to the educational community, documents announced in themonthly abstract journal of the ERIC system, Resources in Education (RIE), are usually made available to users in microfiche, reproduced paper copy,and electronic media, and sold through the ERIC Document Reproduction Service (EDRS). Credit is given to the source of each document, and, ifreproduction release is granted, one of the following notices is affixed to the document.
If permission is granted to reproduce and disseminate the identified document, please CHECK ONE of the following three options and sign at the bottomof the page.
The sample sticker shown below will beaffixed to all Level 1 documents
1
PERMISSION TO REPRODUCE ANDDISSEMINATE THIS MATERIAL HAS
BEEN GRANTED BY
TO THE EDUCATIONAL RESOURCESINFORMATION CENTER (ERIC)
Level 1
Check here for Level 1 release, permitting reproductionand dissemination In microfiche or other ERIC archival
media (e.g.. electronic) end paper copy.
The sample sticker shown below will beaffixed to all Level 2A documents
PERMISSION TO REPRODUCE ANDDISSEMINATE THIS MATERIAL IN
MICROFICHE. AND IN ELECTRONIC MEDIAFOR ERIC COLLECTION SUBSCRIBERS ONLY.
HAS BEEN GRANTED BY
2A
Sa
TO THE EDUCATIONAL RESOURCESINFORMATION CENTER (ERIC)
Level 2A
Check here for Level 2A release, permitting reproductionand dissemination In microfiche end in electronic media
for ERIC archival collection subsalbers only
The sample sticker shown below will beaffixed to all Level 2B documents
PERMISSION TO REPRODUCE ANDDISSEMINATE THIS MATERIAL IN
MICROFICHE ONLY HAS BEEN GRANTED BY
2B
C."TO THE EDUCATIONAL RESOURCES
INFORMATION CENTER (ERIC)
Level 2B
1
Check here for Level 28 release, permittingreproduction and dissemination in microfiche only
Documents will be processed as Indicated provided reproduction quality permits.If permission to reproduce Is granted, but no box Is checked, documents will be processed at Level 1.
I hereby grant to the Educational Resources Information Center (ERIC) nonexclusive permission to reproduce and disseminate this documentas indicated above. Reproduction from the ERIC microfiche or electronic media by persons other than ERIC employees and its systemcontractors requires permission from the copyright holder. Exception Is made for non-profit reproduction by libraries and other service agenciesto satisfy information needs of educators in response to discrete inquiries.
Signhere,4please 0,44-irne,ret,.. ScAaas
1V140 S. Yose...t+e S +1 4-"I LGIA.Joefs (.- 8-a L LI
Printed Name/Position/Title:
Vie UL
E-Mail Address:FI03-"ikt.- '1,91Date:
k(over)
IC Clearinghouse on Assessment and Evaluation
March 20, 1998
Dear AERA Presenter,
Congratulations on being a presenter at AERA'. The ERIC Clearinghouse on Assessment and Evaluationinvites you to contribute to the ERIC database by providing us with a printed copy of your presentation.
University of Maryland1129 Shriver Laboratory
College Park, MD 20742-5701
Tel: (800) 464-3742( 301 ) 405-7449
FAX: (301) 405-8134ericae @ericae.net
http://ericae.net
Abstracts of papers accepted by ERIC appear in Resources in Education (RIE) and are announced to over5,000 organizations. The inclusion of your work makes it readily available to other researchers, provides apermanent archive, and enhances the quality of RIE. Abstracts of your contribution will be accessiblethrough the printed and electronic versions of RIE. The paper will be available through the microfichecollections that are housed at libraries around the world and through the ERIC Document ReproductionService.
We are gathering all the papers from the AERA Conference. We will route your paper to the appropriateclearinghouse. You will be notified if your paper meets ERIC's criteria for inclusion in RIE: contributionto education, timeliness, relevance, methodology, effectiveness of presentation, and reproduction quality.You can track our processing of your paper at http://ericae.net.
Please sign the Reproduction Release Form on the back of this letter and include it with two copies of yourpaper. The Release Form gives ERIC permission to make and distribute copies of your paper. It does notpreclude you from publishing your work. You can drop off the copies of your paper and ReproductionRelease Form at the ERIC booth (424) or mail to our attention at the address below. Please feel free tocopy the form for future or additional submissions.
Mail to: AERA 1998/ERIC AcquisitionsUniversity of Maryland1129 Shriver LaboratoryCollege Park, MD 20742
This year ERIC/AE is making a Searchable Conference Program available on the AERA web page(http://aera.net). Check it out!
Sincyrely,fi
Lawrence M. Rudner, Ph.D.Director, ERIC/AE
'If you are an AERA chair or discussant, please save this form for future use.
C UA
The Catholic University of America