Embed Size (px)
Citation preview
TECH BRIEF
FileMaker Solution Architectures:
Data Modeling, File Architectures and the Relationships Graph
Technical Brief
FileMaker Solution Architectures Page 2 of 29
Table of Contents About this technical brief ................................................................................................................................. 3
Gathering requirements ................................................................................................................................... 3 Establishing a data model ............................................................................................................................ 4
Finding entities .................................................................................................................................................. 4 Listing the attributes for each entity ...................................................................................................... 5 Defining relationships .................................................................................................................................... 6
Creating an Entity Relationship Diagram (ERD) ............................................................................................... 7 Validating the data model ............................................................................................................................ 8 Defining data normalization requirements ................................................................................................... 8 Outlining data flow and solution logic ........................................................................................................ 11 Delineating Interface Requirements ........................................................................................................... 11
File architectures ............................................................................................................................................ 13 The single file solution ................................................................................................................................ 13 The multi-file solution ................................................................................................................................. 13 Data separation and “The Separation Model” ........................................................................................... 13 Data Segmentation .................................................................................................................................... 15 Horizontal segmentation ............................................................................................................................ 16 Vertical segmentation ................................................................................................................................. 16 Multiple interface files ................................................................................................................................ 17 Satellite files ............................................................................................................................................... 17 Utility files ................................................................................................................................................... 17
The Relationships Graph ................................................................................................................................ 19 Approaches to Graph Modeling ................................................................................................................. 20
Model 1 – The Amorphous / Chaotic Model .................................................................................. 20 Model 2 – The Squid / Anchor-Buoy Model ................................................................................... 20 Model 3 – The Modular / Centric Model ........................................................................................... 22 Model 4 – The Flotilla or Satellite Model .......................................................................................... 23 Model 5 – The Procedural Control Model ........................................................................................ 24 Model 6 – The Hybrid Model .................................................................................................................. 26
Beyond ancient wisdom ................................................................................................................................. 28 In conclusion .................................................................................................................................................. 28
About The Author ....................................................................................................................................... 29
FileMaker Solution Architectures Page 3 of 29
About this technical brief The purpose of this brief is to provide a guide to the many options available to you as you design and develop custom business solutions in FileMaker Pro – from initial requirements, to data modeling techniques, to architectural options. The information provided in this technical brief will be useful to intermediate and advanced FileMaker developers who have some grounding in database theory and who are already familiar with basic concepts and programming techniques in FileMaker Pro.
Gathering requirements The first step in developing a useful data model is to take time to understand your audience and their requirements. Even if the solution you’re about to create is relatively simple and may only be intended for your own use, a useful first step is listing the needs it should address and functions it should perform. First, identify the groups, teams, titles, and/or names of the individuals that will be using your solution. Next, set up meetings with these individuals to discuss their needs. When speaking with the different teams and groups that will use the solution, you will most likely notice that they may have different requirements of the solution. Be sure to ask which tasks are most important to each group. Ask questions like these as a guide to gather your requirements:
• What are the primary tasks that the solution should accomplish? • What needs must it address and what functions must it perform? • How many users will the new solution need to serve? • What tasks must be accomplished quickly? • Are there tasks that need to be done in a specific order? • Is the new solution replacing an existing one? If so, why? What do you like or dislike about the
existing solution? Are there specific limitations that you want the new solution to address? Arising from an initial review of requirements, your notes should include statements from users like the ones below:
• At the start of each academic year, we need to more easily track which students have enrolled in which courses at which campuses.
• We need to better track which salespeople are placing orders for which clients for what products
from our inventory. Plus be able to know at what warehouse each inventory item is stored.
• We need to track what cars are delivered to which wrecking yard on a daily basis and what parts are removed for sale. For each car part available for sale, we need to know the name, make, model, color, year, and other specifications.
Clarifying terms The nouns and verbs used in these sentences are very important in helping you create a data model that will meet your users’ needs: Nouns - many of the nouns used will correspond to a tangible entity that will need to be tracked in your solution. Other nouns will refer to attributes of the entities, which we’ll identify in the next section. Verbs – verbs can be used to describe relationships and processes that will need to be created in your solution.
FileMaker Solution Architectures Page 4 of 29
Establishing a data model The data model you create affects the stability, scalability, and maintainability of the database you create. Think of it as the foundation of a house; if the foundation is solid then so is the house, but if the foundation is fragile then it’s a potential house of cards. There are three major building blocks you’ll use to assemble your data model:
1. Entities - An entity is representation of a real world object within your database. Entities are generally considered to be whole and indivisible, like a person for instance, but strictness of entity definitions will vary according to application. For example, in the context of an automobile sales database a vehicle can be considered an entity and treated as an “indivisible whole.” Within the context of a wrecking yard or a spare parts database, the individual parts of the vehicle would be considered the entities.
2. Attributes - An attribute is a descriptor or fact about an entity that can be expected to exist for all members of the particular entity group. For example, a vehicle entity might have attributes like Make, Model, and List Price.
3. Relationships - A relationship is the existence of an association between two or more entities. For example, a vehicle entity may have a related engine entity, or perhaps several different related engine entities depending upon the vehicle’s customization options.
The order listed above is the typical order in which you will address the data model: first entities, next attributes, and finally relationships.
Finding entities The first step towards establishing a viable data model is to draw up a list of entities that will be included in the database. You can do this on paper or with a variety of software programs. The notes that you took during your requirements gathering should be used as the source for the initial data model. Remember that the nouns will most likely relate to entities that should appear in the data model. A statement in your notes may go something like this: At the start of each academic year, we need to more easily track which students have enrolled in which courses at which campuses. … suggests that the solution you create will require you to store data for entities such as:
• Academic Year • Student • Course • Campus
Similarly, a comment by a user to the effect that: We need to better track which salespeople are placing orders for which clients for what products from our inventory. The statement suggests that the solution you create will require you to store data for entities such as:
• Salesperson • Client Contact • Client • Order • Order Items • Product • Inventory
In each of the above examples, the information yielded from a single sentence of user input gives only a small and very likely incomplete picture. You will need to parse a range of requirements, drawing on each to obtain a “rounded picture” of the entities in play.
FileMaker Solution Architectures Page 5 of 29
Bear in mind that many nouns will be synonyms for other nouns (or sub-classes of the same category of entity), so terms such as “prospect,” “client,” “customer,” “buyer,” and “patron” may all be adequately represented by the inclusion of the “Client” entity in your list – or alternatively, represented within a more generalized “Person” entity. Frequently, you will find that your starting list of candidate entities grows quickly, but it can be consolidated and reduced as you confirm that a number of references using different terms actually refer to the same entity. Some nouns, rather than being a synonym for an entity you have already documented, will instead refer to an attribute of an existing entity. Some careful listening and follow-up questioning may be required to make appropriate determinations about distinctions between terms with related meanings, and terms which may refer to an attribute of an entity rather than an entirely new entity.
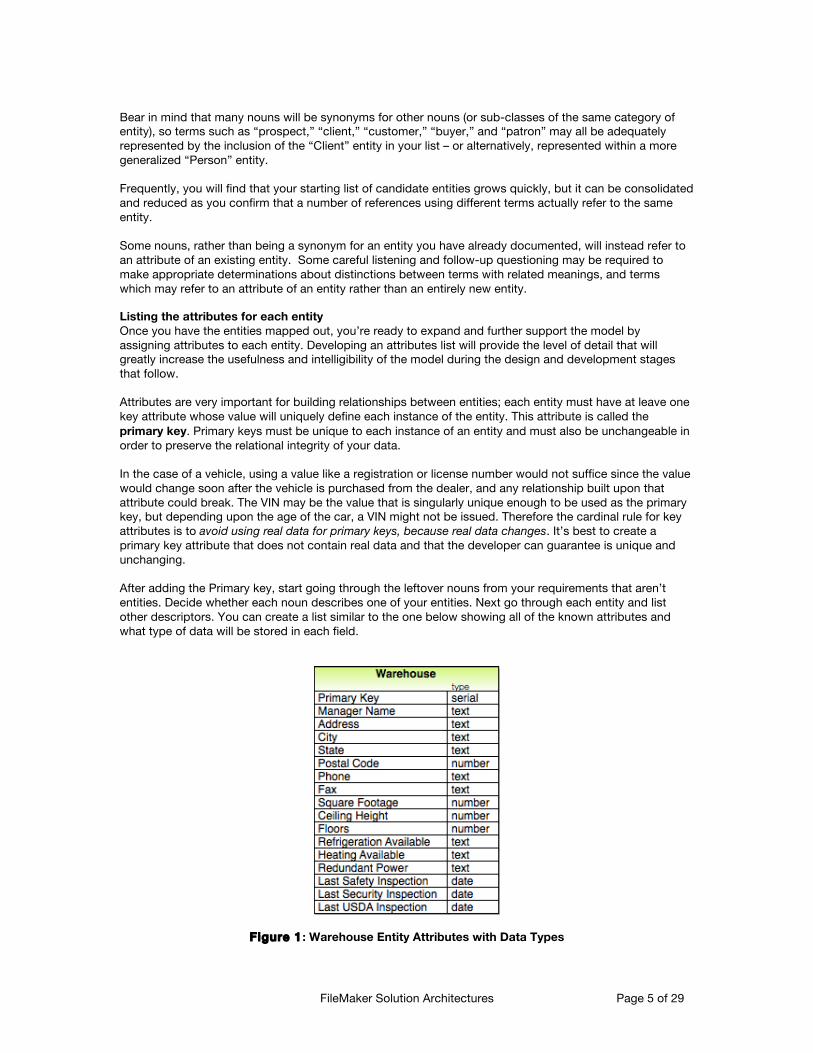
Listing the attributes for each entity Once you have the entities mapped out, you’re ready to expand and further support the model by assigning attributes to each entity. Developing an attributes list will provide the level of detail that will greatly increase the usefulness and intelligibility of the model during the design and development stages that follow. Attributes are very important for building relationships between entities; each entity must have at leave one key attribute whose value will uniquely define each instance of the entity. This attribute is called the primary key. Primary keys must be unique to each instance of an entity and must also be unchangeable in order to preserve the relational integrity of your data. In the case of a vehicle, using a value like a registration or license number would not suffice since the value would change soon after the vehicle is purchased from the dealer, and any relationship built upon that attribute could break. The VIN may be the value that is singularly unique enough to be used as the primary key, but depending upon the age of the car, a VIN might not be issued. Therefore the cardinal rule for key attributes is to avoid using real data for primary keys, because real data changes. It’s best to create a primary key attribute that does not contain real data and that the developer can guarantee is unique and unchanging. After adding the Primary key, start going through the leftover nouns from your requirements that aren’t entities. Decide whether each noun describes one of your entities. Next go through each entity and list other descriptors. You can create a list similar to the one below showing all of the known attributes and what type of data will be stored in each field.
Figure 1 : Warehouse Entity Attributes with Data Types
FileMaker Solution Architectures Page 6 of 29
Note that in the process of listing entity attributes you may find that what you thought were mere attributes of the current entity actually represent another entity within the data model. In Figure 1 for instance, you may realize that the Manager Name attribute already exists as the Name attribute of the Person entity, and the several address related attributes are shared with the Location entity. In this case you can change the Manager Name attribute into a key attribute that stores the primary key for the Person entity. Likewise, you can remove all of the address and phone number fields from the Warehouse entity and instead add Location foreign key attribute. This is an important process and you’ll learn more about it in “Defining data normalization requirements” below.
Defining relationships Whereas nouns typically refer to an entity, verbs commonly refer to relationships. There are three different types of relationships that you should know about when it comes to establishing a data model for your solution:
1. One-to-One 2. One-to-Many 3. Many-to-Many
IMPORTANT: The mechanism that lets us build relationships between entities is key attributes. Every entity should have at least one unique key called the primary key. Relationships are established by storing the primary key of one entity in a special attribute called the foreign key of another entity. One-to-One Relationship – Use a one-to-one relationship to join two entities where each instance of both entities relate to only one instance of the other entity. For example, each student can only have one locker, and each locker only belongs to one student. Therefore, you will create a one-to-one relationship in your data model where each Student entity relates to only one unique Locker entity. One-to-Many Relationship – Use a one-to-many relationship to join one entity to many instances of another entity. For example, one school can have many classrooms, but a classroom can only be in one school. Therefore, you will create a one-to-many relationship in your data model where each School entity relates to many classrooms.
Many-to-Many Relationships – Use many-to-many relationships to join many instances of one entity to many instances of another entity. For example, a student may enroll in many courses, and a course may be attended by many students. Therefore, you will create a many-to-many relationship in your data model where many course entities relate to many students. In most cases with one-to-many relationships, the entity on the many side will contain an attribute that is primary key of the one side entity. For example an Invoice entity has an attribute of the Client the invoice was sent to, but a Client is an entity itself. This relationship is easily created by storing that attribute (the Client’s primary key) in a foreign key field in the Invoice entity. Unfortunately this isn’t the case with many-to-many relationships. For example, using the Student and Course example above, if the Student primary key is stored in the Course foreign key and vice versa, how will we ever get more than one Student in a Course, or allow a Student to attend more than one Course? One method supported by FileMaker is the use of multi-key fields, where more than one key value is entered into the foreign key field – however this method presents some limitations. For most purposes, a many-to-many join may be better accomplished by the creation of a new type of entity, known an associative entity, for the sole purpose of joining multiple instances of two entities. The associative entity is derived from the relationship between the two main entities, so in this case it might be called Enrollment. The Enrollment entity forms the connection between the Student and the Course, and may be contain its own range of attributes (year of study, chosen classes, mode of study, and so on) that are particular to the Enrollment, rather than being attributes of either the Student or the Course. In this scenario, the Enrollment entity contains foreign key attributes for both Student and Course. This in essence turns the many-to-many relationship into two one-to-many relationships. A Student can have many Enrollments, a Class can also have many Enrollments, but each Enrollment belongs to only one Student and one Class.
FileMaker Solution Architectures Page 7 of 29
To establish a list of relationships, you should now consider the verbs in each sentence of your notes, to determine whether they describe the type of connection between nouns in the subject or predicate of the sentence, the business rules that will impact the solution logic, or both. As your assembly of key entities, relationships and process descriptors nears completion, you will be able to begin grouping the entities according to their functional, logical or relational connections. Whenever two nouns that relate to entities appear in the same sentence, you can expect that the corresponding entities should be grouped together. The nouns that appear together most frequently should be grouped most closely. As the information acquired through the processes outlined above begins to take form, it will provide you with a preliminary view of the nature, scale, and scope of the data model for the solution. At this point, you may find it helpful to begin mapping the high-level data requirements (entities and relationships) in the form of an entity relationship diagram, as described in the next section. Creating an Entity Relationship Diagram (ERD) An ERD captures a high-level view of the proposed data model for a solution by providing a graphical representation of both the entities and the relationships between entities. The value of an ERD from the perspective of FileMaker development is its ability to provide a simplified map of the main elements of the data model. With regard to a FileMaker solution, it may be appropriate for the ERD to include representations of data that is to be stored outside the solution (i.e. External SQL Sources, web data, mobile device data, etc.) that will nevertheless have a role in the solution. An effective ERD is generally comprised of three main components:
1. The entities that will be represented by data tables in the solution 2. The principal data relationships between tables 3. The type of each relationship
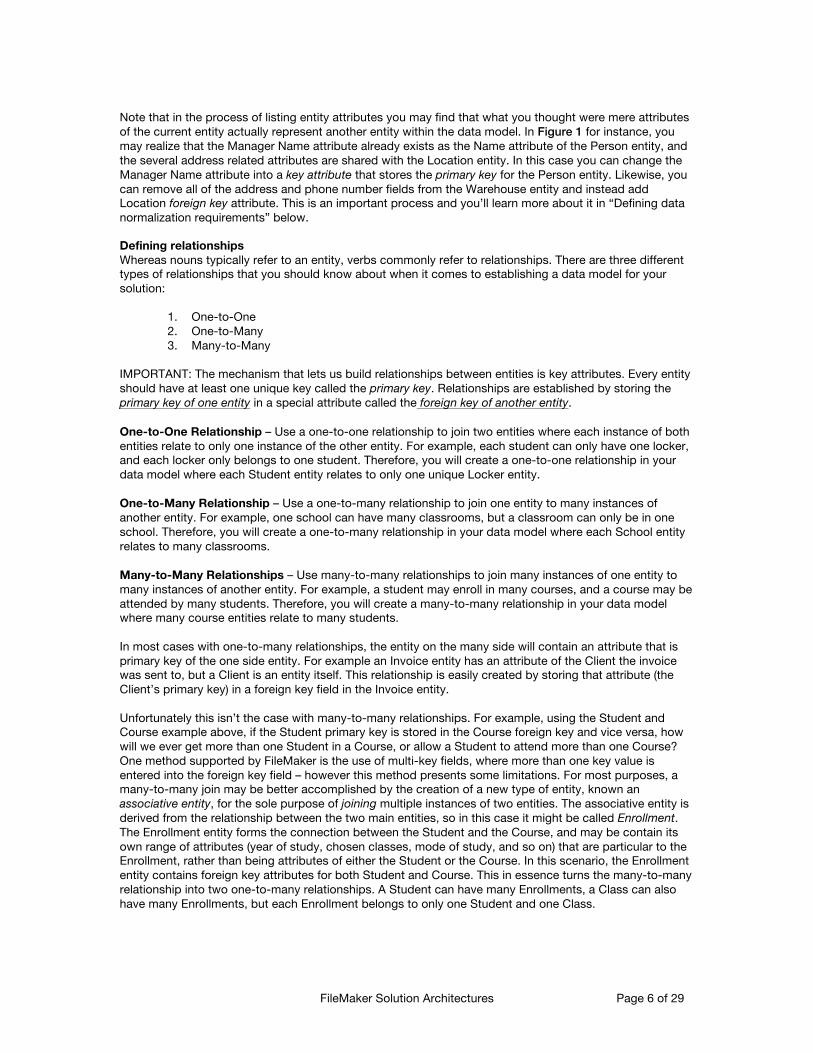
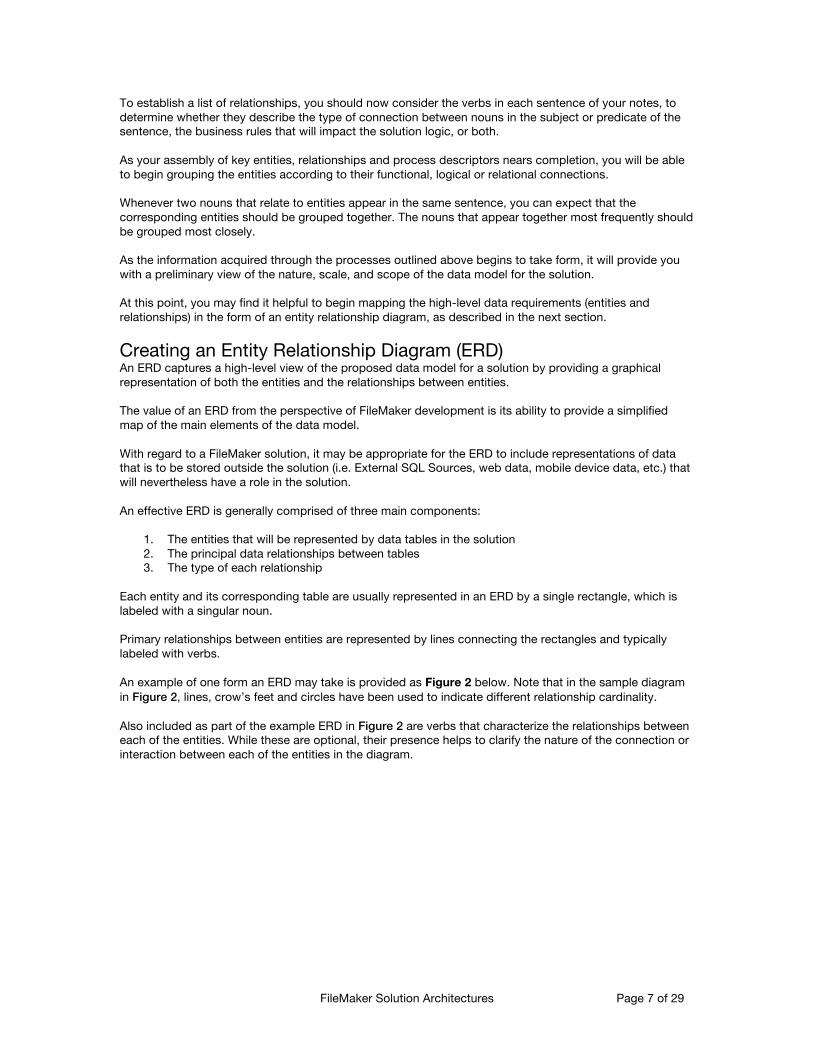
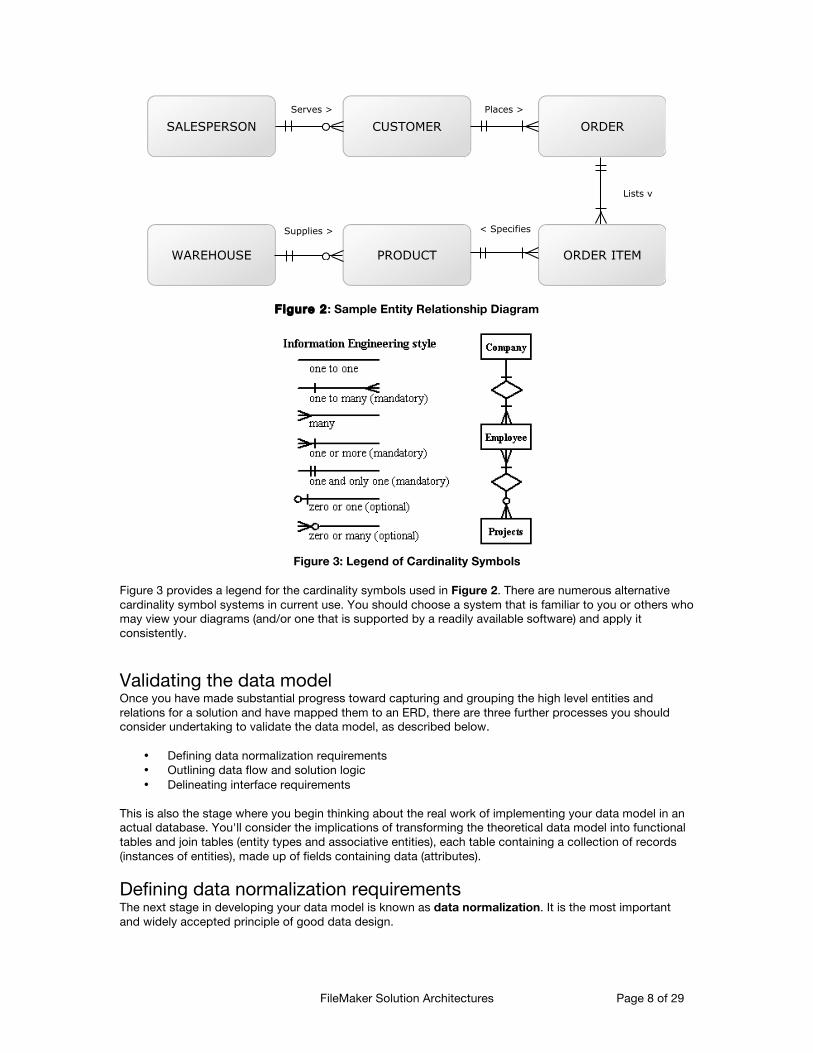
Each entity and its corresponding table are usually represented in an ERD by a single rectangle, which is labeled with a singular noun. Primary relationships between entities are represented by lines connecting the rectangles and typically labeled with verbs. An example of one form an ERD may take is provided as Figure 2 below. Note that in the sample diagram in Figure 2, lines, crow’s feet and circles have been used to indicate different relationship cardinality. Also included as part of the example ERD in Figure 2 are verbs that characterize the relationships between each of the entities. While these are optional, their presence helps to clarify the nature of the connection or interaction between each of the entities in the diagram.
FileMaker Solution Architectures Page 8 of 29
Figure 2 : Sample Entity Relationship Diagram
Figure 3: Legend of Cardinality Symbols
Figure 3 provides a legend for the cardinality symbols used in Figure 2. There are numerous alternative cardinality symbol systems in current use. You should choose a system that is familiar to you or others who may view your diagrams (and/or one that is supported by a readily available software) and apply it consistently. Validating the data model Once you have made substantial progress toward capturing and grouping the high level entities and relations for a solution and have mapped them to an ERD, there are three further processes you should consider undertaking to validate the data model, as described below.
• Defining data normalization requirements • Outlining data flow and solution logic • Delineating interface requirements
This is also the stage where you begin thinking about the real work of implementing your data model in an actual database. You'll consider the implications of transforming the theoretical data model into functional tables and join tables (entity types and associative entities), each table containing a collection of records (instances of entities), made up of fields containing data (attributes). Defining data normalization requirements The next stage in developing your data model is known as data normalization. It is the most important and widely accepted principle of good data design.
SALESPERSON CUSTOMER ORDER
PRODUCTWAREHOUSE
Serves > Places >
Lists v
Supplies >
ORDER ITEM
< Specifies
FileMaker Solution Architectures Page 9 of 29
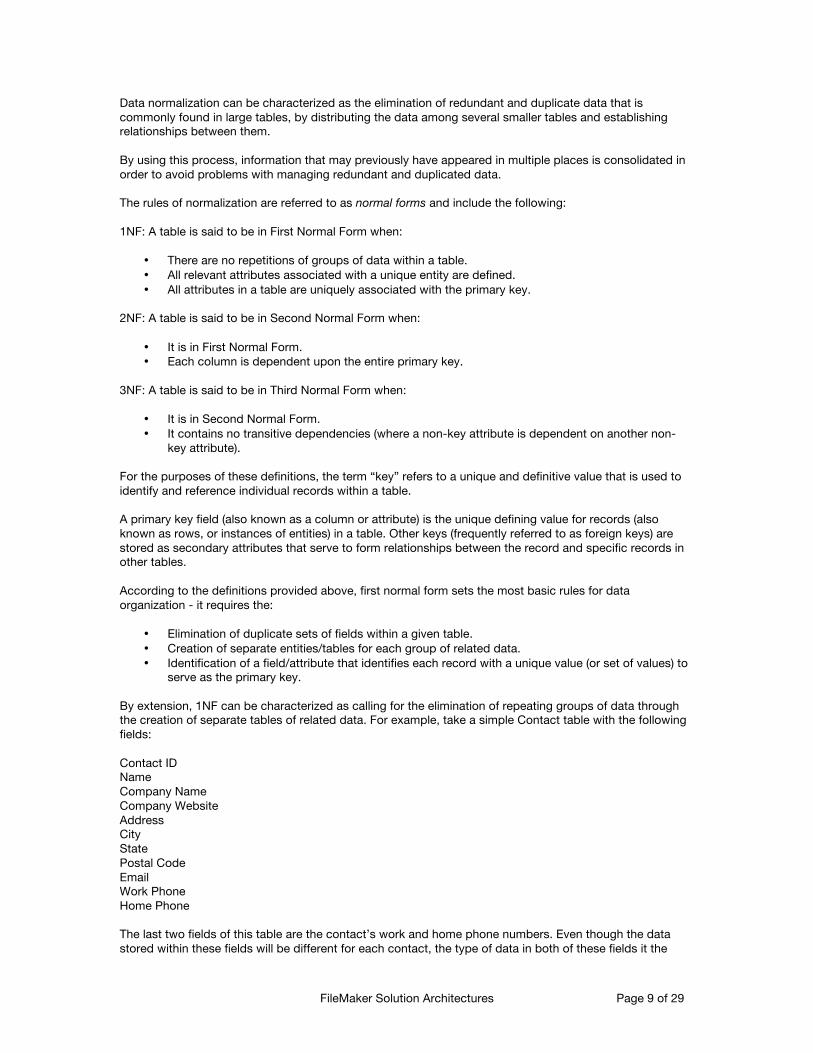
Data normalization can be characterized as the elimination of redundant and duplicate data that is commonly found in large tables, by distributing the data among several smaller tables and establishing relationships between them. By using this process, information that may previously have appeared in multiple places is consolidated in order to avoid problems with managing redundant and duplicated data. The rules of normalization are referred to as normal forms and include the following: 1NF: A table is said to be in First Normal Form when:
• There are no repetitions of groups of data within a table. • All relevant attributes associated with a unique entity are defined. • All attributes in a table are uniquely associated with the primary key.
2NF: A table is said to be in Second Normal Form when:
• It is in First Normal Form. • Each column is dependent upon the entire primary key.
3NF: A table is said to be in Third Normal Form when:
• It is in Second Normal Form. • It contains no transitive dependencies (where a non-key attribute is dependent on another non-
key attribute). For the purposes of these definitions, the term “key” refers to a unique and definitive value that is used to identify and reference individual records within a table. A primary key field (also known as a column or attribute) is the unique defining value for records (also known as rows, or instances of entities) in a table. Other keys (frequently referred to as foreign keys) are stored as secondary attributes that serve to form relationships between the record and specific records in other tables. According to the definitions provided above, first normal form sets the most basic rules for data organization - it requires the:
• Elimination of duplicate sets of fields within a given table. • Creation of separate entities/tables for each group of related data. • Identification of a field/attribute that identifies each record with a unique value (or set of values) to
serve as the primary key.
By extension, 1NF can be characterized as calling for the elimination of repeating groups of data through the creation of separate tables of related data. For example, take a simple Contact table with the following fields: Contact ID Name Company Name Company Website Address City State Postal Code Email Work Phone Home Phone The last two fields of this table are the contact’s work and home phone numbers. Even though the data stored within these fields will be different for each contact, the type of data in both of these fields it the
FileMaker Solution Architectures Page 10 of 29
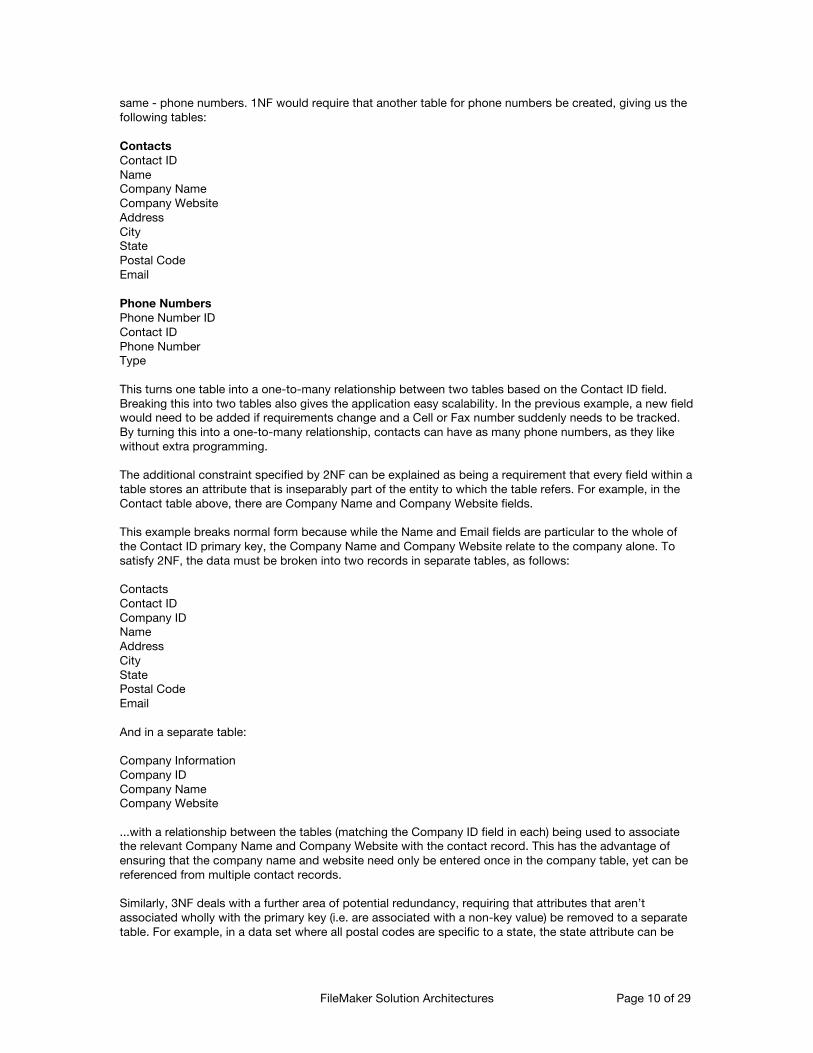
same - phone numbers. 1NF would require that another table for phone numbers be created, giving us the following tables: Contacts Contact ID Name Company Name Company Website Address City State Postal Code Email Phone Numbers Phone Number ID Contact ID Phone Number Type This turns one table into a one-to-many relationship between two tables based on the Contact ID field. Breaking this into two tables also gives the application easy scalability. In the previous example, a new field would need to be added if requirements change and a Cell or Fax number suddenly needs to be tracked. By turning this into a one-to-many relationship, contacts can have as many phone numbers, as they like without extra programming. The additional constraint specified by 2NF can be explained as being a requirement that every field within a table stores an attribute that is inseparably part of the entity to which the table refers. For example, in the Contact table above, there are Company Name and Company Website fields. This example breaks normal form because while the Name and Email fields are particular to the whole of the Contact ID primary key, the Company Name and Company Website relate to the company alone. To satisfy 2NF, the data must be broken into two records in separate tables, as follows: Contacts Contact ID Company ID Name Address City State Postal Code Email And in a separate table: Company Information Company ID Company Name Company Website ...with a relationship between the tables (matching the Company ID field in each) being used to associate the relevant Company Name and Company Website with the contact record. This has the advantage of ensuring that the company name and website need only be entered once in the company table, yet can be referenced from multiple contact records. Similarly, 3NF deals with a further area of potential redundancy, requiring that attributes that aren’t associated wholly with the primary key (i.e. are associated with a non-key value) be removed to a separate table. For example, in a data set where all postal codes are specific to a state, the state attribute can be
FileMaker Solution Architectures Page 11 of 29
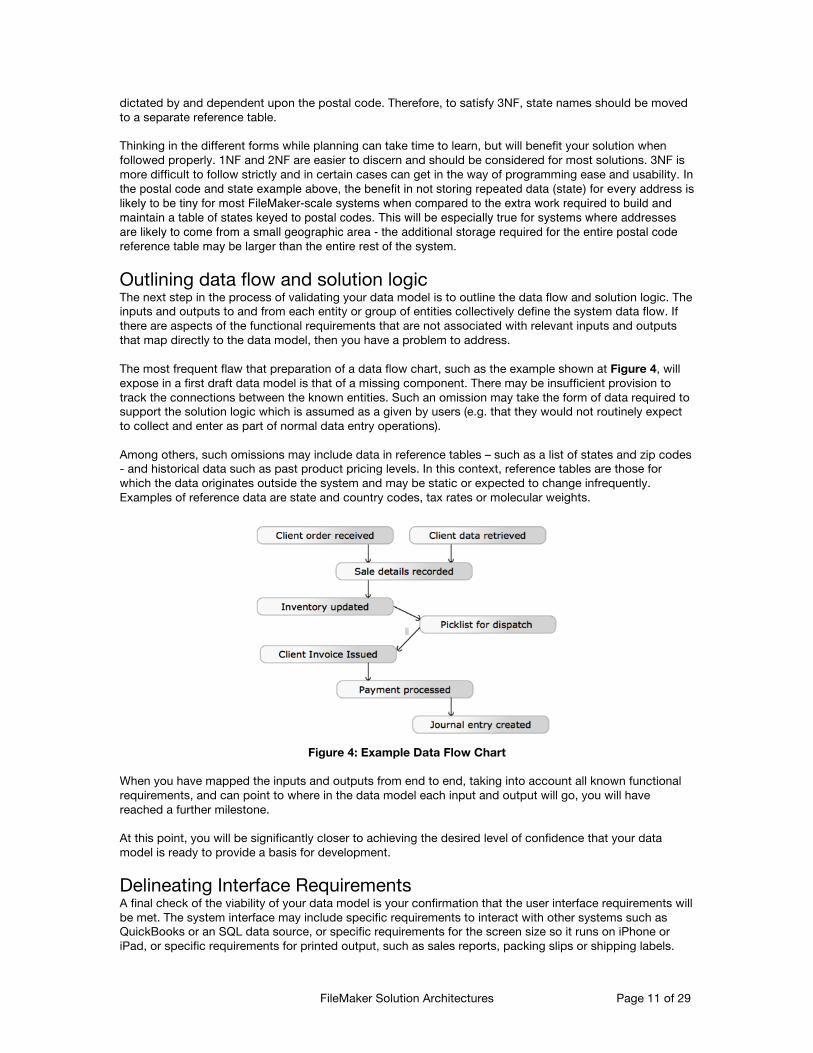
dictated by and dependent upon the postal code. Therefore, to satisfy 3NF, state names should be moved to a separate reference table. Thinking in the different forms while planning can take time to learn, but will benefit your solution when followed properly. 1NF and 2NF are easier to discern and should be considered for most solutions. 3NF is more difficult to follow strictly and in certain cases can get in the way of programming ease and usability. In the postal code and state example above, the benefit in not storing repeated data (state) for every address is likely to be tiny for most FileMaker-scale systems when compared to the extra work required to build and maintain a table of states keyed to postal codes. This will be especially true for systems where addresses are likely to come from a small geographic area - the additional storage required for the entire postal code reference table may be larger than the entire rest of the system. Outlining data flow and solution logic The next step in the process of validating your data model is to outline the data flow and solution logic. The inputs and outputs to and from each entity or group of entities collectively define the system data flow. If there are aspects of the functional requirements that are not associated with relevant inputs and outputs that map directly to the data model, then you have a problem to address. The most frequent flaw that preparation of a data flow chart, such as the example shown at Figure 4, will expose in a first draft data model is that of a missing component. There may be insufficient provision to track the connections between the known entities. Such an omission may take the form of data required to support the solution logic which is assumed as a given by users (e.g. that they would not routinely expect to collect and enter as part of normal data entry operations). Among others, such omissions may include data in reference tables – such as a list of states and zip codes - and historical data such as past product pricing levels. In this context, reference tables are those for which the data originates outside the system and may be static or expected to change infrequently. Examples of reference data are state and country codes, tax rates or molecular weights.
Figure 4: Example Data Flow Chart
When you have mapped the inputs and outputs from end to end, taking into account all known functional requirements, and can point to where in the data model each input and output will go, you will have reached a further milestone. At this point, you will be significantly closer to achieving the desired level of confidence that your data model is ready to provide a basis for development. Delineating Interface Requirements A final check of the viability of your data model is your confirmation that the user interface requirements will be met. The system interface may include specific requirements to interact with other systems such as QuickBooks or an SQL data source, or specific requirements for the screen size so it runs on iPhone or iPad, or specific requirements for printed output, such as sales reports, packing slips or shipping labels.

FileMaker Solution Architectures Page 12 of 29
The first and simplest part of the interface requirements validation is to check off that all data elements mentioned in requirements and user notes, shown in screen mock-ups, and that appear in the screens of earlier systems your solution will replace exist in your lists of key attributes per entity. If this first check exposes any omissions, you can now extend or adjust the data model if required to ensure completeness. A further component of the interface requirements check is to confirm that the data model will support the necessary relationships and relational queries to bring together the various combinations of data that will be required for display within the interface. At this point, your concern is to ensure that all required joins and associative entities are supported and included in the data model. It’s worth noting that your data model need not, and ideally should not, attempt to document every relationship or logical path that will be established in your solution during development. Only the primary data relationships between each entity need be included for the purposes of the model. What is necessary, however, is that all the entities and attributes that will be required to support secondary and ancillary connections and data flows are present and accounted for in the data architecture you have devised. Congratulations! At this point, your data model should be validated, and you’re ready to consider the file architecture of your solution.
FileMaker Solution Architectures Page 13 of 29
File architectures As part of the design process you should determine whether the solution will be within a single file or whether its components will reside in multiple files and, if so, in what configuration. The single file solution The most common FileMaker database architecture is one that places all the components of a solution into a single file. For some users and developers, the single-file solution architecture has become the default position, and for others it is the only approach considered. There are some notable advantages that arise from the adoption of a single file model for a solution’s file architecture. These include:
• File portability and manageability • Simplicity of development and maintenance • Predictability and usability • Inherent structural integrity • Performance considerations • Transparent and unified version control • Improved interoperability and functionality within FileMaker
The first of the potential advantages listed above is perhaps the most immediately obvious – a single file solution has fewer components than a multi-file solution, with only one component to move around, no additional parts to lose track of and only the file’s internal structure to think about. Whether you are deploying to an end-user’s desktop, loading the file on an iOS device to take it on a field trip, or publishing the file via FileMaker Server, it can’t get much simpler. A single file solution architecture also provides simplicity of development and maintenance insofar as there is no need to constantly think about which elements will be required in which files, nor to ensure that data is passed between files appropriately – it’s all just there. Perhaps most significantly, in a single file solution, there is no need to replicate and maintain security settings (accounts or privilege set configurations) in multiple files – it all just works. Just as single file architecture simplifies various aspects of development, it also has similar advantages for the end user. Fewer “moving parts” means fewer things can go wrong. It makes sense to consider the use of single-file architectures for many solutions. However there are a number of situations that may call for the use of multiple files, and some situations where you may deem that there are advantages arising from the use of multiple files that will outweigh these considerations. The multi-file solution Let’s take a look at several of the deployment scenarios where multi-file solutions are common. Each is explained below:
o Data Separation o Data Segmentation o Horizontal Segmentation o Vertical Segmentation o Multiple Interface Files o Satellite Files o Utility Files
Data separation and “The Separation Model” The concept of data separation, or “The Separation Model” as it is known by some proponents, is centered around a file architecture in which the tables holding the data reside in one file, while the user interface and the code that supports it (including the majority of scripts) reside in a separate file. While a basic data
FileMaker Solution Architectures Page 14 of 29
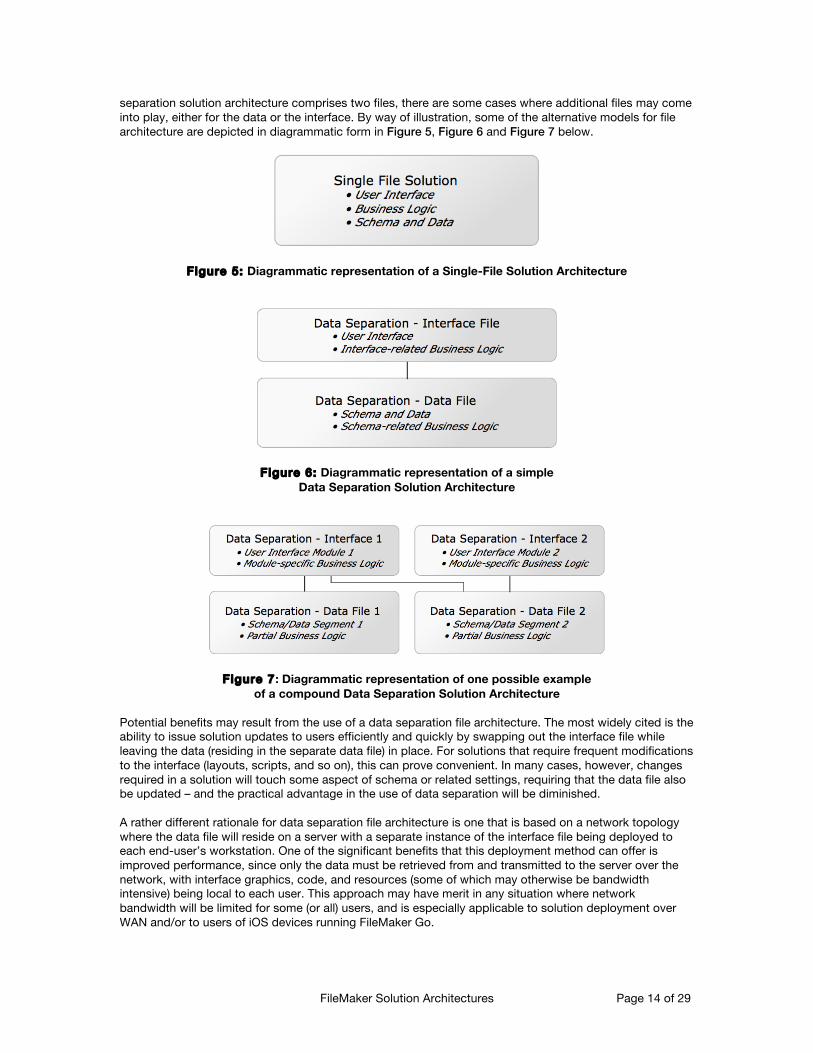
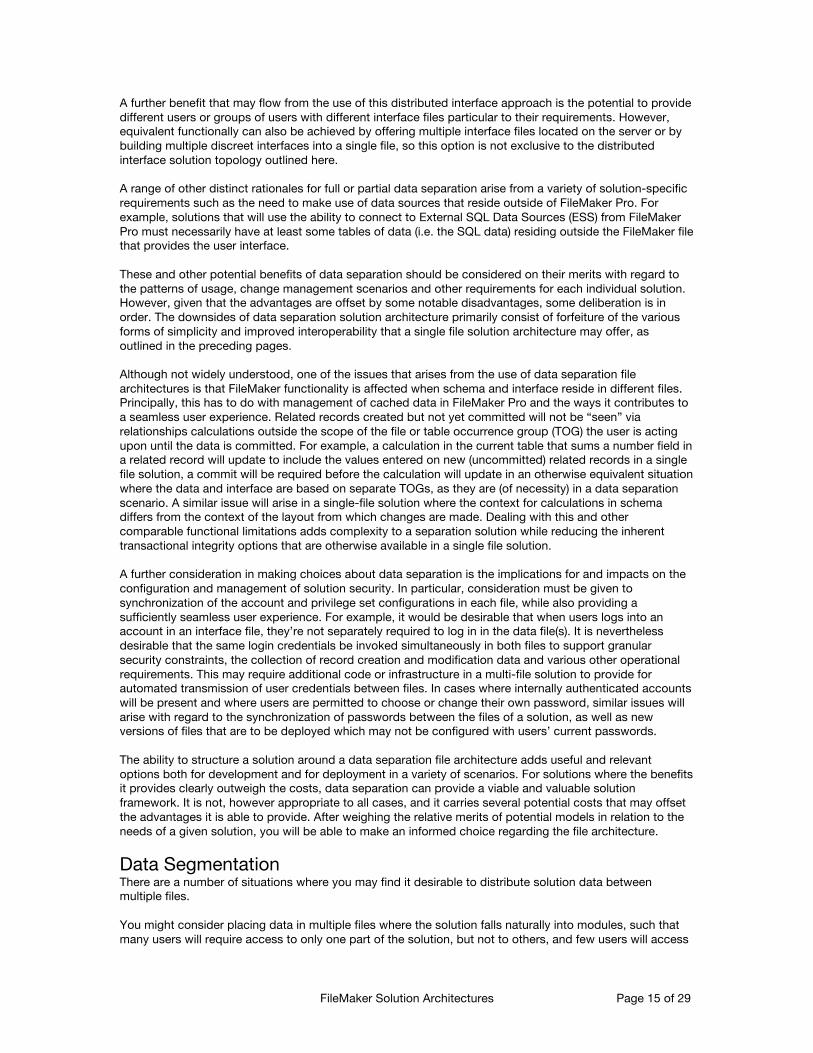
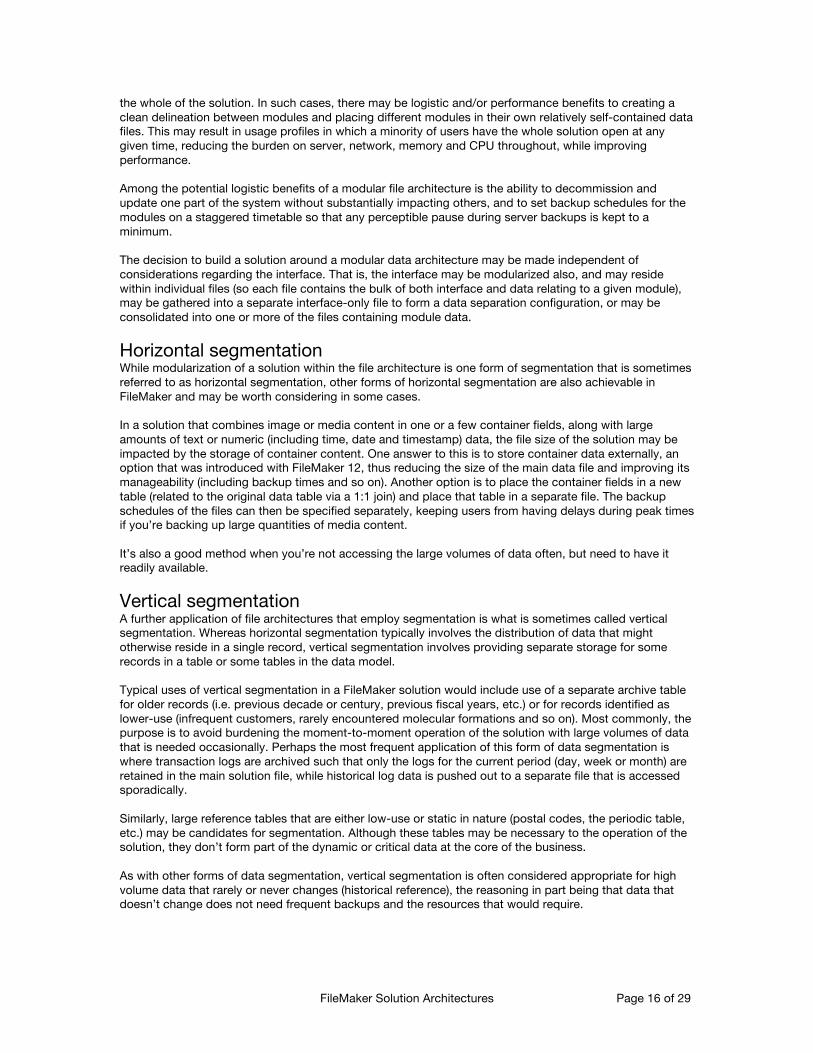
separation solution architecture comprises two files, there are some cases where additional files may come into play, either for the data or the interface. By way of illustration, some of the alternative models for file architecture are depicted in diagrammatic form in Figure 5, Figure 6 and Figure 7 below.
Figure 5: Diagrammatic representation of a Single-File Solution Architecture
Figure 6: Diagrammatic representation of a simple Data Separation Solution Architecture
Figure 7 : Diagrammatic representation of one possible example of a compound Data Separation Solution Architecture
Potential benefits may result from the use of a data separation file architecture. The most widely cited is the ability to issue solution updates to users efficiently and quickly by swapping out the interface file while leaving the data (residing in the separate data file) in place. For solutions that require frequent modifications to the interface (layouts, scripts, and so on), this can prove convenient. In many cases, however, changes required in a solution will touch some aspect of schema or related settings, requiring that the data file also be updated – and the practical advantage in the use of data separation will be diminished. A rather different rationale for data separation file architecture is one that is based on a network topology where the data file will reside on a server with a separate instance of the interface file being deployed to each end-user’s workstation. One of the significant benefits that this deployment method can offer is improved performance, since only the data must be retrieved from and transmitted to the server over the network, with interface graphics, code, and resources (some of which may otherwise be bandwidth intensive) being local to each user. This approach may have merit in any situation where network bandwidth will be limited for some (or all) users, and is especially applicable to solution deployment over WAN and/or to users of iOS devices running FileMaker Go.
FileMaker Solution Architectures Page 15 of 29
A further benefit that may flow from the use of this distributed interface approach is the potential to provide different users or groups of users with different interface files particular to their requirements. However, equivalent functionally can also be achieved by offering multiple interface files located on the server or by building multiple discreet interfaces into a single file, so this option is not exclusive to the distributed interface solution topology outlined here. A range of other distinct rationales for full or partial data separation arise from a variety of solution-specific requirements such as the need to make use of data sources that reside outside of FileMaker Pro. For example, solutions that will use the ability to connect to External SQL Data Sources (ESS) from FileMaker Pro must necessarily have at least some tables of data (i.e. the SQL data) residing outside the FileMaker file that provides the user interface. These and other potential benefits of data separation should be considered on their merits with regard to the patterns of usage, change management scenarios and other requirements for each individual solution. However, given that the advantages are offset by some notable disadvantages, some deliberation is in order. The downsides of data separation solution architecture primarily consist of forfeiture of the various forms of simplicity and improved interoperability that a single file solution architecture may offer, as outlined in the preceding pages. Although not widely understood, one of the issues that arises from the use of data separation file architectures is that FileMaker functionality is affected when schema and interface reside in different files. Principally, this has to do with management of cached data in FileMaker Pro and the ways it contributes to a seamless user experience. Related records created but not yet committed will not be “seen” via relationships calculations outside the scope of the file or table occurrence group (TOG) the user is acting upon until the data is committed. For example, a calculation in the current table that sums a number field in a related record will update to include the values entered on new (uncommitted) related records in a single file solution, a commit will be required before the calculation will update in an otherwise equivalent situation where the data and interface are based on separate TOGs, as they are (of necessity) in a data separation scenario. A similar issue will arise in a single-file solution where the context for calculations in schema differs from the context of the layout from which changes are made. Dealing with this and other comparable functional limitations adds complexity to a separation solution while reducing the inherent transactional integrity options that are otherwise available in a single file solution. A further consideration in making choices about data separation is the implications for and impacts on the configuration and management of solution security. In particular, consideration must be given to synchronization of the account and privilege set configurations in each file, while also providing a sufficiently seamless user experience. For example, it would be desirable that when users logs into an account in an interface file, they’re not separately required to log in in the data file(s). It is nevertheless desirable that the same login credentials be invoked simultaneously in both files to support granular security constraints, the collection of record creation and modification data and various other operational requirements. This may require additional code or infrastructure in a multi-file solution to provide for automated transmission of user credentials between files. In cases where internally authenticated accounts will be present and where users are permitted to choose or change their own password, similar issues will arise with regard to the synchronization of passwords between the files of a solution, as well as new versions of files that are to be deployed which may not be configured with users’ current passwords. The ability to structure a solution around a data separation file architecture adds useful and relevant options both for development and for deployment in a variety of scenarios. For solutions where the benefits it provides clearly outweigh the costs, data separation can provide a viable and valuable solution framework. It is not, however appropriate to all cases, and it carries several potential costs that may offset the advantages it is able to provide. After weighing the relative merits of potential models in relation to the needs of a given solution, you will be able to make an informed choice regarding the file architecture. Data Segmentation There are a number of situations where you may find it desirable to distribute solution data between multiple files. You might consider placing data in multiple files where the solution falls naturally into modules, such that many users will require access to only one part of the solution, but not to others, and few users will access
FileMaker Solution Architectures Page 16 of 29
the whole of the solution. In such cases, there may be logistic and/or performance benefits to creating a clean delineation between modules and placing different modules in their own relatively self-contained data files. This may result in usage profiles in which a minority of users have the whole solution open at any given time, reducing the burden on server, network, memory and CPU throughout, while improving performance. Among the potential logistic benefits of a modular file architecture is the ability to decommission and update one part of the system without substantially impacting others, and to set backup schedules for the modules on a staggered timetable so that any perceptible pause during server backups is kept to a minimum. The decision to build a solution around a modular data architecture may be made independent of considerations regarding the interface. That is, the interface may be modularized also, and may reside within individual files (so each file contains the bulk of both interface and data relating to a given module), may be gathered into a separate interface-only file to form a data separation configuration, or may be consolidated into one or more of the files containing module data. Horizontal segmentation While modularization of a solution within the file architecture is one form of segmentation that is sometimes referred to as horizontal segmentation, other forms of horizontal segmentation are also achievable in FileMaker and may be worth considering in some cases. In a solution that combines image or media content in one or a few container fields, along with large amounts of text or numeric (including time, date and timestamp) data, the file size of the solution may be impacted by the storage of container content. One answer to this is to store container data externally, an option that was introduced with FileMaker 12, thus reducing the size of the main data file and improving its manageability (including backup times and so on). Another option is to place the container fields in a new table (related to the original data table via a 1:1 join) and place that table in a separate file. The backup schedules of the files can then be specified separately, keeping users from having delays during peak times if you’re backing up large quantities of media content. It’s also a good method when you’re not accessing the large volumes of data often, but need to have it readily available. Vertical segmentation A further application of file architectures that employ segmentation is what is sometimes called vertical segmentation. Whereas horizontal segmentation typically involves the distribution of data that might otherwise reside in a single record, vertical segmentation involves providing separate storage for some records in a table or some tables in the data model. Typical uses of vertical segmentation in a FileMaker solution would include use of a separate archive table for older records (i.e. previous decade or century, previous fiscal years, etc.) or for records identified as lower-use (infrequent customers, rarely encountered molecular formations and so on). Most commonly, the purpose is to avoid burdening the moment-to-moment operation of the solution with large volumes of data that is needed occasionally. Perhaps the most frequent application of this form of data segmentation is where transaction logs are archived such that only the logs for the current period (day, week or month) are retained in the main solution file, while historical log data is pushed out to a separate file that is accessed sporadically. Similarly, large reference tables that are either low-use or static in nature (postal codes, the periodic table, etc.) may be candidates for segmentation. Although these tables may be necessary to the operation of the solution, they don’t form part of the dynamic or critical data at the core of the business. As with other forms of data segmentation, vertical segmentation is often considered appropriate for high volume data that rarely or never changes (historical reference), the reasoning in part being that data that doesn’t change does not need frequent backups and the resources that would require.
FileMaker Solution Architectures Page 17 of 29
Multiple interface files Just as some solutions may benefit from a multi-file architecture where the data resides in multiple files, there are also circumstances where it may be of benefit to separate the solution interface into multiple files. One scenario mentioned previously is where a modular solution may be designed to contain the interface for each component within the file where most or all of the data for that module resides. In this scenario, it is sometimes useful to provide a single point of entry for users to log into the solution, where they will be presented with a top level menu offering a choice of the available modules. In other cases, users may only ever have needed to use a single module, and may be able to complete their work in ignorance of the existence of other modules. An alternate scenario that may benefit from the creation of multiple interface files is where different classes of user, while needing access to the same data, have very different functional requirements. Rather than produce a hybrid interface in which the different groups of users are presented with options they don’t need and screens filled with content arranged in ways that are unsuitable for their needs, an elegant alternative is the creation of two separate interfaces, each optimized to the needs of a particular set of users. A further example of the use of multiple interface files is a solution that requires extensive data entry and transactional screens for day-to-day business of an organization, plus a separate interface module that supports reporting, statistical analysis and management information. It’s worth noting that the various file architectural options discussed here can co-exist within the same solution in a variety of combinations according to need. It falls to you as the designer and developer to devise a file architecture that matches the needs of your solution’s users and delivers the required functions in a robust and efficient manner. Satellite files In addition to the file architectures outlined above, some special considerations apply to situations where part of the business of a solution will take place offline. Most commonly, this will occur when laptops or iOS devices (iPad, iPhone, etc.) are taken out on location. In many such cases, this calls for the creation of satellite files that are designed to carry the data or a subset of it and to operate independently of the live or server data. In some cases, a satellite file will be nothing more than a complete copy of the solution that will function in much the same way on the offline device as it does when accessed from the server. Often, however, this won’t be ideal. You may provide a different feature set, and, particularly in the case of iOS devices, a differently designed and configured interface that is tailored to the specific needs of the user in the field. Where offline uses of you solution will involve entry or editing of data, you will need to provide additional functionality to enable the satellite file to synchronize the copy of data (or a sub-set of data) it holds with the data hosted in the master copy of the solution running on the server. Detailed discussion of the uses of satellite files and data synchronization is beyond the scope of this paper; for additional detail, you should consult the FileMaker Go Sync Guide. Utility files A further consideration to keep in mind when devising an appropriate file architecture for your solutions is the range of uses of control files and other utility files to perform ancillary operations and provide specific or specialized functionality. One use of control files is as an intermediary file to perform synchronization of data between satellite files and the main solution database. An advantage of using an intermediary file in this context is that the satellite file can be created with no dependencies on the main solution file so it can operate offline without the delays or errors it would encounter if it were trying unsuccessfully to resolve references to an unavailable host. Instead, the intermediary file can contain references to both the host and the satellite and can therefore be configured to open only on demand and to compare and reconcile data between the satellite and main systems.
FileMaker Solution Architectures Page 18 of 29
As with the example outlined above, control files can be used in any situation that calls for files to be closed selectively. A feature of FileMaker is that it will not allow a file to be closed while other files, which have dependencies to it, remain open. For purposes such as performing an update or changing solution configuration, a separate utility file (one that contains no references to the other files in play) can be used to close files on a user’s workstation, make updates or other changes as required, then reopen the files as needed. Among the many other uses of utility files are:
• data transformation tables that reformat data for reporting or for transfer to or from legacy systems
• special purpose files that display dialogs, progress bars or other system content for use throughout a solution
• “sandbox” files that may contain references to the main solution files, but have more relaxed scripting and layout modification constraints so they will provide advanced users with the ability to build their own layouts and reports, including quick charts, without cluttering or disturbing the critical functions of the main solution files.
A further use of a form of utility file is commonly called a robot – which is in effect a separate FileMaker sub-system configured to run continuously performing a range of designated tasks to automate specific system operations. While some automation requirements can be met via the use of server-side scripts or on-timer scripts that run on users’ workstations, there are some cases where one or more separate robot files performing designated tasks may be advantageous. Among other things, a robot machine will run a full copy of FileMaker Pro and is therefore able to execute scripts that are not constrained to the commands available to FileMaker Server. A separate module designed to run as a robot can be debugged using FileMaker's standard script debugger, which cannot be used to debug server-side scripts (which necessarily runs “headless” so must be debugged using the event and error logs). Moreover one or more robot machines can perform heavy lifting operations. Multiple robots can be brought online as needed for load management or as fallback in case of failure. In addition, failure or error of a complex procedure on a robot workstation will not impact the ongoing operation or available CPU resources of the server or a user’s workstation. The use-cases outlined above – along with numerous other purposes – can be met by the use of files that are not part of the main body of the solution, yet which form a part of the solution with respect to the delivery of the required functionality. FileMaker provides you with a rich source of options to meet solution requirements, but it is up to you to consider and choose the most appropriate configuration of elements – including the most effective file architecture – for each case.
FileMaker Solution Architectures Page 19 of 29
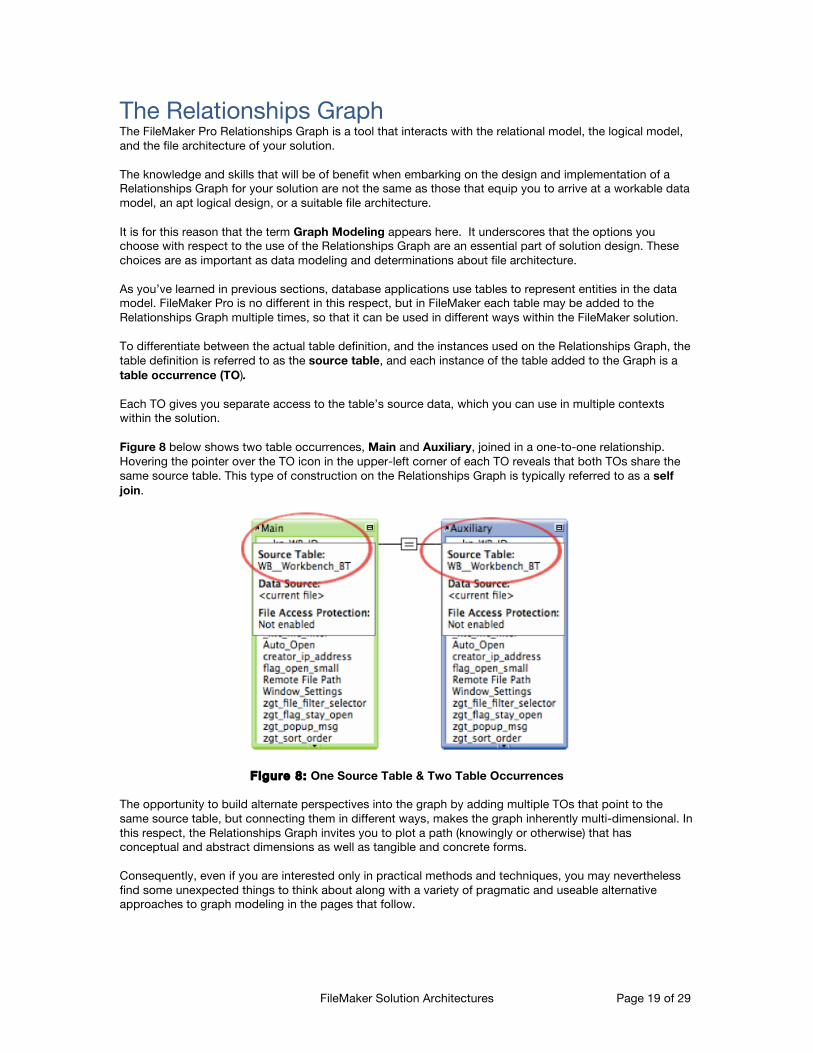
The Relationships Graph The FileMaker Pro Relationships Graph is a tool that interacts with the relational model, the logical model, and the file architecture of your solution. The knowledge and skills that will be of benefit when embarking on the design and implementation of a Relationships Graph for your solution are not the same as those that equip you to arrive at a workable data model, an apt logical design, or a suitable file architecture. It is for this reason that the term Graph Modeling appears here. It underscores that the options you choose with respect to the use of the Relationships Graph are an essential part of solution design. These choices are as important as data modeling and determinations about file architecture. As you’ve learned in previous sections, database applications use tables to represent entities in the data model. FileMaker Pro is no different in this respect, but in FileMaker each table may be added to the Relationships Graph multiple times, so that it can be used in different ways within the FileMaker solution. To differentiate between the actual table definition, and the instances used on the Relationships Graph, the table definition is referred to as the source table, and each instance of the table added to the Graph is a table occurrence (TO). Each TO gives you separate access to the table’s source data, which you can use in multiple contexts within the solution. Figure 8 below shows two table occurrences, Main and Auxiliary, joined in a one-to-one relationship. Hovering the pointer over the TO icon in the upper-left corner of each TO reveals that both TOs share the same source table. This type of construction on the Relationships Graph is typically referred to as a self join.
Figure 8: One Source Table & Two Table Occurrences The opportunity to build alternate perspectives into the graph by adding multiple TOs that point to the same source table, but connecting them in different ways, makes the graph inherently multi-dimensional. In this respect, the Relationships Graph invites you to plot a path (knowingly or otherwise) that has conceptual and abstract dimensions as well as tangible and concrete forms. Consequently, even if you are interested only in practical methods and techniques, you may nevertheless find some unexpected things to think about along with a variety of pragmatic and useable alternative approaches to graph modeling in the pages that follow.
FileMaker Solution Architectures Page 20 of 29
Approaches to Graph Modeling The FileMaker Pro Relationship Graph is a thing unto itself, with no close parallels in other database applications. To work effectively with it, you may find yourself challenged to think differently and to respond with creativity. Fortunately, many FileMaker developers have no problem with that – it is among the attractions FileMaker Pro has in store. Over time, FileMaker developers have developed six common approaches to Graph Modeling that cover various perspectives and techniques for working with the Relationships Graph.
• Model 1 - The Amorphous / Chaotic Model • Model 2 - The Squid / Anchor-Buoy Model • Model 3 - The Modular / Centric Model • Model 4 - The Flotilla or Satellite Model • Model 5 - The Procedural Control Model • Model 6 - The Hybrid Model
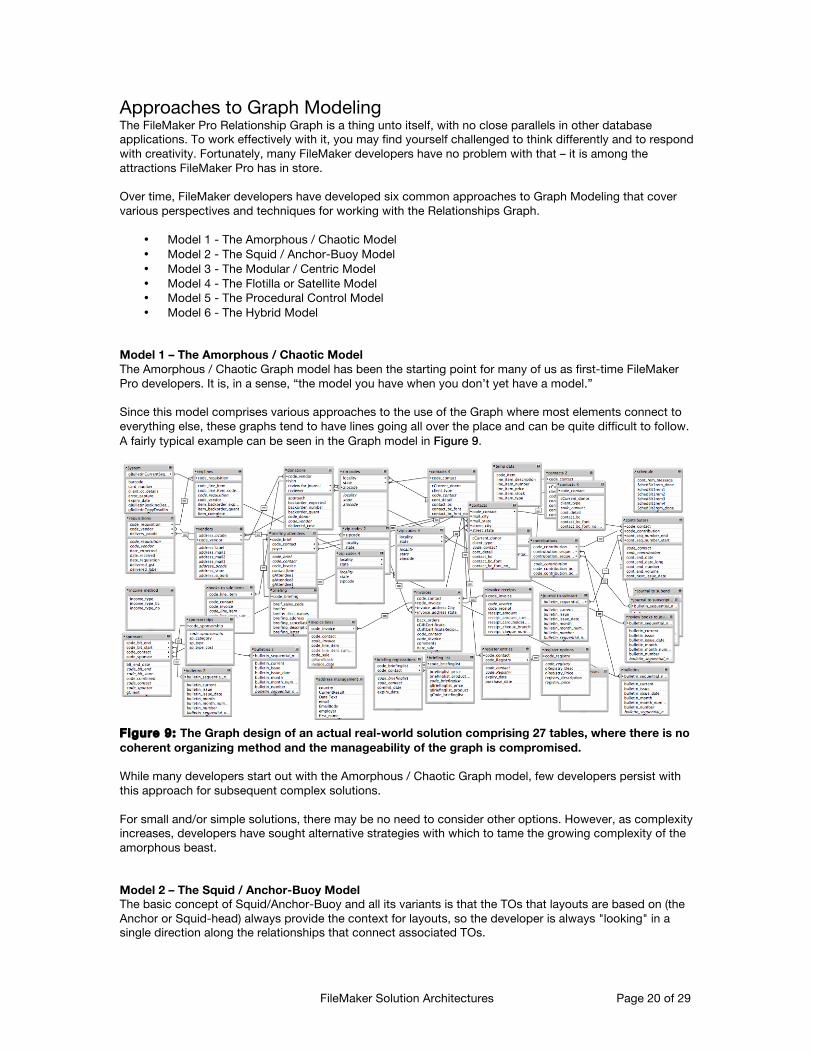
Model 1 – The Amorphous / Chaotic Model The Amorphous / Chaotic Graph model has been the starting point for many of us as first-time FileMaker Pro developers. It is, in a sense, “the model you have when you don’t yet have a model.” Since this model comprises various approaches to the use of the Graph where most elements connect to everything else, these graphs tend to have lines going all over the place and can be quite difficult to follow. A fairly typical example can be seen in the Graph model in Figure 9.
Figure 9: The Graph design of an actual real-world solution comprising 27 tables, where there is no coherent organizing method and the manageability of the graph is compromised. While many developers start out with the Amorphous / Chaotic Graph model, few developers persist with this approach for subsequent complex solutions. For small and/or simple solutions, there may be no need to consider other options. However, as complexity increases, developers have sought alternative strategies with which to tame the growing complexity of the amorphous beast.
Model 2 – The Squid / Anchor-Buoy Model The basic concept of Squid/Anchor-Buoy and all its variants is that the TOs that layouts are based on (the Anchor or Squid-head) always provide the context for layouts, so the developer is always "looking" in a single direction along the relationships that connect associated TOs.
FileMaker Solution Architectures Page 21 of 29
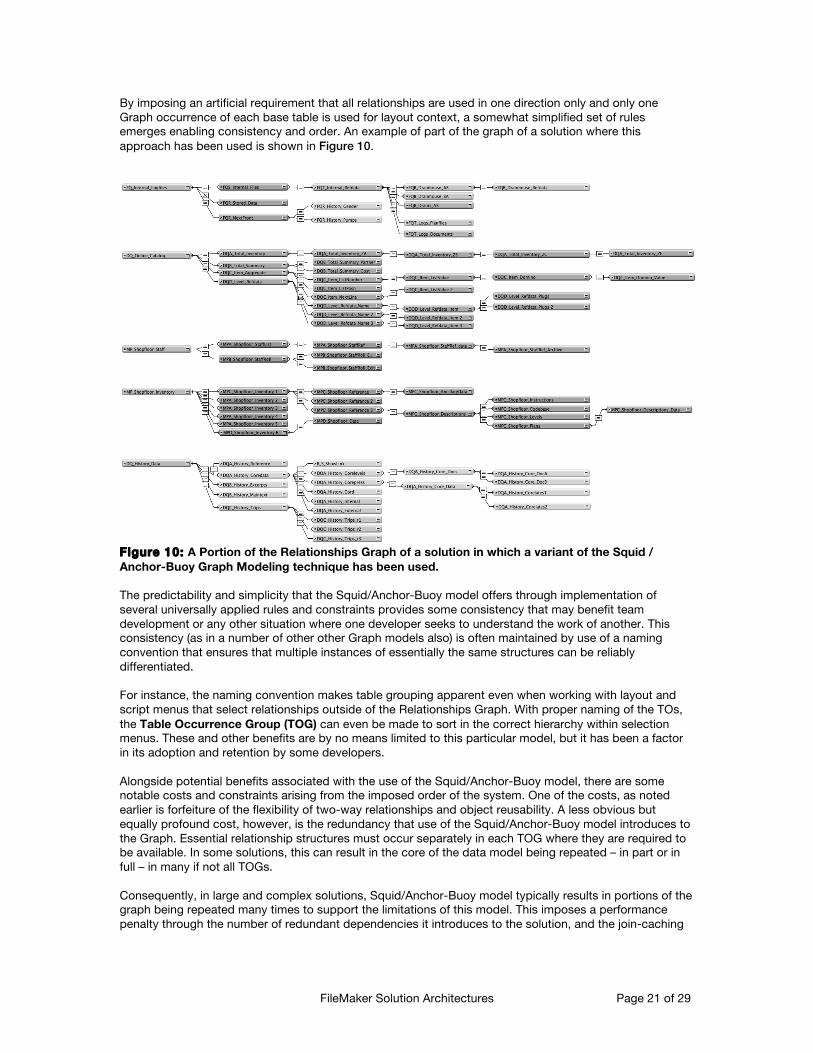
By imposing an artificial requirement that all relationships are used in one direction only and only one Graph occurrence of each base table is used for layout context, a somewhat simplified set of rules emerges enabling consistency and order. An example of part of the graph of a solution where this approach has been used is shown in Figure 10.
Figure 10: A Portion of the Relationships Graph of a solution in which a variant of the Squid / Anchor-Buoy Graph Modeling technique has been used. The predictability and simplicity that the Squid/Anchor-Buoy model offers through implementation of several universally applied rules and constraints provides some consistency that may benefit team development or any other situation where one developer seeks to understand the work of another. This consistency (as in a number of other other Graph models also) is often maintained by use of a naming convention that ensures that multiple instances of essentially the same structures can be reliably differentiated. For instance, the naming convention makes table grouping apparent even when working with layout and script menus that select relationships outside of the Relationships Graph. With proper naming of the TOs, the Table Occurrence Group (TOG) can even be made to sort in the correct hierarchy within selection menus. These and other benefits are by no means limited to this particular model, but it has been a factor in its adoption and retention by some developers. Alongside potential benefits associated with the use of the Squid/Anchor-Buoy model, there are some notable costs and constraints arising from the imposed order of the system. One of the costs, as noted earlier is forfeiture of the flexibility of two-way relationships and object reusability. A less obvious but equally profound cost, however, is the redundancy that use of the Squid/Anchor-Buoy model introduces to the Graph. Essential relationship structures must occur separately in each TOG where they are required to be available. In some solutions, this can result in the core of the data model being repeated – in part or in full – in many if not all TOGs. Consequently, in large and complex solutions, Squid/Anchor-Buoy model typically results in portions of the graph being repeated many times to support the limitations of this model. This imposes a performance penalty through the number of redundant dependencies it introduces to the solution, and the join-caching
FileMaker Solution Architectures Page 22 of 29
burden they carry. It also requires the developer to maintain many redundant instances of similar structural elements. Moreover, adherence and maintenance of the naming convention may be unwieldy. While some developers have adopted the Squid/Anchor-Buoy model and have found it adequate and/or effective for their purposes, others have found themselves in situations where the costs outweighed the benefits or have found themselves less comfortable with the constraints and regimen imposed by this method. Meanwhile, as the essentials of this method were taking shape, developers explored other approaches and methods, leaving no shortage of other options and other approaches available for consideration. Foremost among the alternative models that developers have arrived at in their search for alternative Relationships Graph organizing principles is the method described at Model 3.
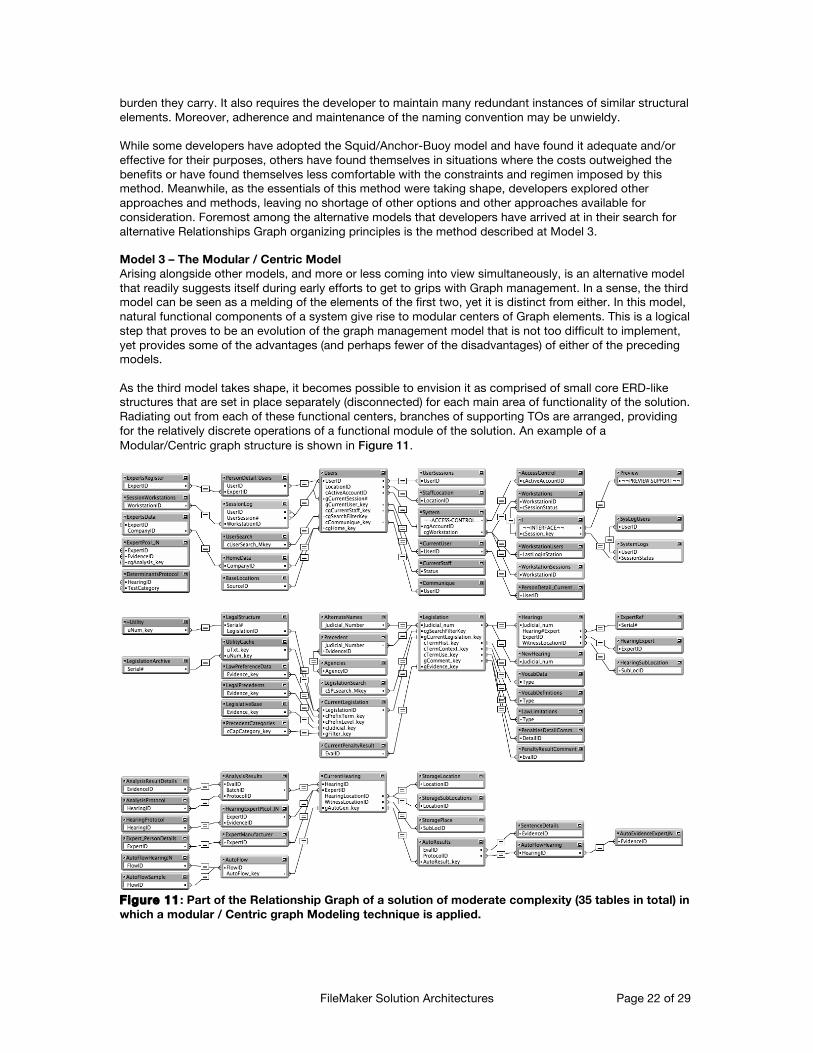
Model 3 – The Modular / Centric Model Arising alongside other models, and more or less coming into view simultaneously, is an alternative model that readily suggests itself during early efforts to get to grips with Graph management. In a sense, the third model can be seen as a melding of the elements of the first two, yet it is distinct from either. In this model, natural functional components of a system give rise to modular centers of Graph elements. This is a logical step that proves to be an evolution of the graph management model that is not too difficult to implement, yet provides some of the advantages (and perhaps fewer of the disadvantages) of either of the preceding models. As the third model takes shape, it becomes possible to envision it as comprised of small core ERD-like structures that are set in place separately (disconnected) for each main area of functionality of the solution. Radiating out from each of these functional centers, branches of supporting TOs are arranged, providing for the relatively discrete operations of a functional module of the solution. An example of a Modular/Centric graph structure is shown in Figure 11.
Figure 11 : Part of the Relationship Graph of a solution of moderate complexity (35 tables in total) in which a modular / Centric graph Modeling technique is applied.
FileMaker Solution Architectures Page 23 of 29
Since many solutions have several areas of overlapping functionality, a Modular/Centric graph model allows a degree of natural separation of graph elements. Each modular center will require a few supporting TOs that point to base tables that have their "home" in another module, but overall the extent of redundancy will be moderate (typically considerably less than for Model 2). Most layouts will be associated with one of the core TOs in the module TOGs; however numerous relationships (particularly those between the core TOs for a module) will be used in both directions. The modular approach introduces flexibility for the developer that is not available in the second model – and the resulting graph structures preserve the manageability of smaller solutions such as the one depicted in Figure 11, while supporting functionality that is considerably more complex than the solutions depicted in either Figure 9 or Figure 10. Moreover, the Modular/Centric approach reduces the ratio of table occurrences to tables. This relieves the solution of some of the caching burden, and at the same time moderates the need for using a strict naming convention. The modest number of table occurrences can be managed adequately with natural or descriptive names, if preferred, in all but the largest of solutions. An additional feature of the Modular/Centric graph modeling approach is that it lends itself well to modularization of other aspects of the solution. For example, should you choose to place billing functionality in a separate file, the TOG associated with billing functions could be located in the other file without affecting the operations of the remainder of the solution. This is the case regardless of where in the file architecture the data tables for the billing function are located. The Modular/Centric approach provides an elegant and efficient framework for many solutions. Its benefits are immediate and enduring. However, its appropriateness depends on being able to identify a natural separation (modularization) of functionality within a given solution. Thus, Model 3 is highly successful in many cases, but may prove cramped and forced in others – particularly where there is a close interaction between all the essentials of a solution. In such cases, a different approach may be called for.
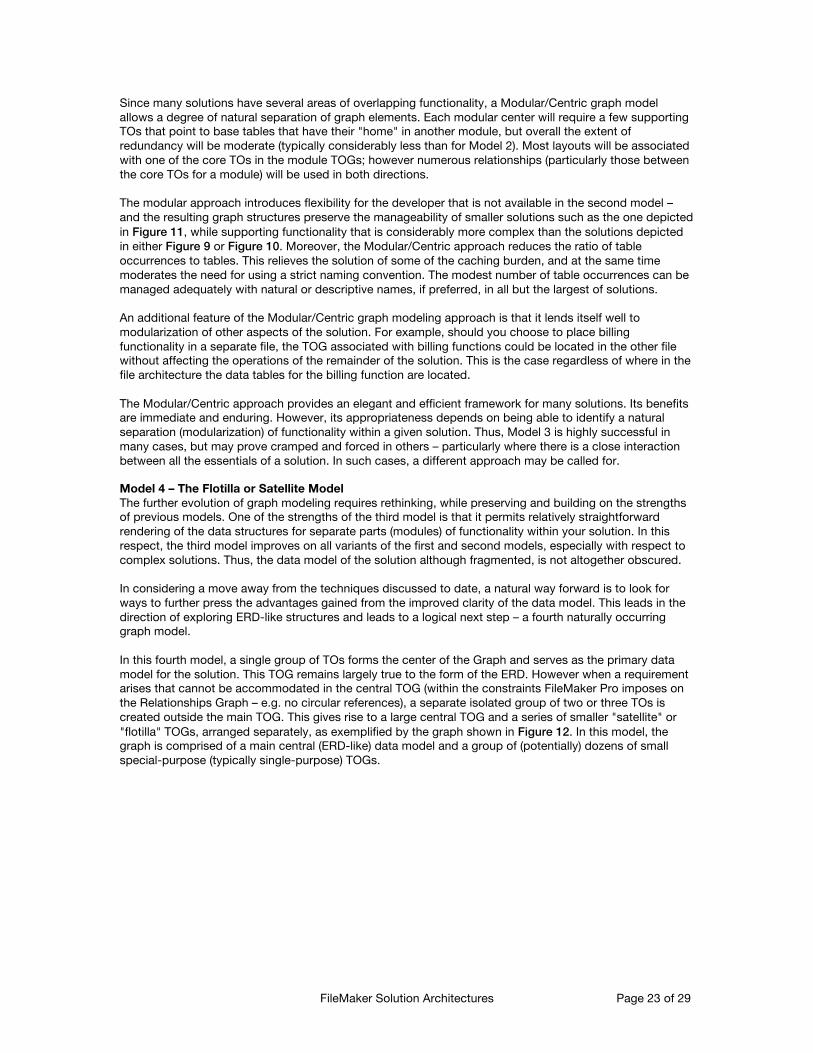
Model 4 – The Flotilla or Satellite Model The further evolution of graph modeling requires rethinking, while preserving and building on the strengths of previous models. One of the strengths of the third model is that it permits relatively straightforward rendering of the data structures for separate parts (modules) of functionality within your solution. In this respect, the third model improves on all variants of the first and second models, especially with respect to complex solutions. Thus, the data model of the solution although fragmented, is not altogether obscured. In considering a move away from the techniques discussed to date, a natural way forward is to look for ways to further press the advantages gained from the improved clarity of the data model. This leads in the direction of exploring ERD-like structures and leads to a logical next step – a fourth naturally occurring graph model. In this fourth model, a single group of TOs forms the center of the Graph and serves as the primary data model for the solution. This TOG remains largely true to the form of the ERD. However when a requirement arises that cannot be accommodated in the central TOG (within the constraints FileMaker Pro imposes on the Relationships Graph – e.g. no circular references), a separate isolated group of two or three TOs is created outside the main TOG. This gives rise to a large central TOG and a series of smaller "satellite" or "flotilla" TOGs, arranged separately, as exemplified by the graph shown in Figure 12. In this model, the graph is comprised of a main central (ERD-like) data model and a group of (potentially) dozens of small special-purpose (typically single-purpose) TOGs.
FileMaker Solution Architectures Page 24 of 29
Figure 12 : The graph structure of a 23-table solution developed using the principles of the Flotilla/Satellite model. The Flotilla/Satellite method represents a significant re-thinking of the way the Relationships Graph supports the functionality of the solution, requiring a more heavily script-driven process model. To support the required functionality via the use of small special-purpose TOs, a number of utility layouts are required and scripts or script triggers invoke these layouts as needed. The Flotilla/Satellite model provides a streamlined, simplified graph that provides an integrated data model. It offers clarity and purposeful order to the graph. There is moderate redundancy (e.g. tables that are represented in the main TOG must also appear as TOs in one or more satellite TOGs to support specific activities such as filtering, value lists, scripted GTRRs, etc.). Typically, the ratio of TOs to tables is lower than the Squid/Anchor-Buoy model and may be lower than the Modular/Centric model, depending on the specific requirements of the solution. The Flotilla/Satellite model can be adapted to serve many purposes, even in some cases supporting the requirements of complex solutions. However, it imposes increased dependence on scripted control of the solution, wherein the context must "hop" from the main layouts to one or more utility layouts for various procedures. Having reached this point in your work with the FileMaker Pro Relationships Graph, you will have acquired a solid understanding of a number of options and possibilities the Graph offers and have a collection of alternative approaches to choose from depending on the needs of a given solution. It may be that with one of the four models discussed so far, the requirements of a majority of solutions could be delivered with reasonable ease. However, the Relationships Graph has more secrets to reveal to those who are willing to be a little adventurous.
Model 5 – The Procedural Control Model In some respects, the preceding model bends the functionality of FileMaker Pro to the will of the developer to make a less-than-obvious model workable. It requires that the developer adopt a tightly scripted and controlled application model where the Graph is supported by other elements to deliver needed functionality and provide process support. This begs the question as to whether there are other innovative application models that permit different approaches to the use of the Graph – and indeed there are. The fifth model of Graph management is in some respects the most difficult to define, as it includes a variety of radically different methods that each have one thing in common – their reliance on process
FileMaker Solution Architectures Page 25 of 29
control (i.e. contrivances in the logic layer of the solution) to deliver the required data and support the interface. Using process controls in place of some or all relationships, the methods grouped together to form this model extend the capabilities of the application in novel ways. Examples of procedural control implementations include an implementation described and demonstrated by Michael Harris of Cerné Systems Inc, and Jonathan Stark's "Ginko" User Defined Data Model demonstrated as proof-of-concept at DevCon 2005:
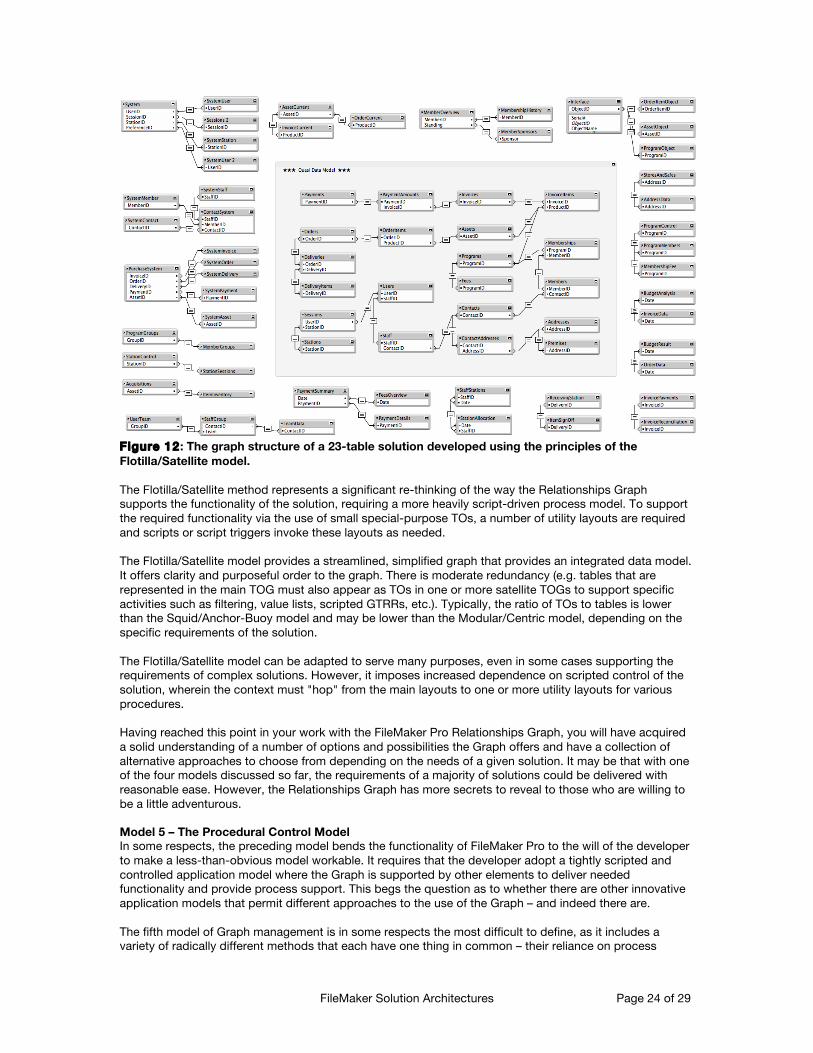
http://www.jonathanstark.com/downloads/Ginko.fp7.zip The first of these implementations (as first described by Michael Harris) has two calculated fields (one stored and one unstored) and a global field in each table. The unstored calculation field evaluates the content of the global using GetField( ) to retrieve the value of any of the other fields in the table. The stored calculation field concatenates all the key field values in the table into a return delimited list. A relationship is created from the unstored field in one table to the stored field in the next and so on, so that all the tables are joined in this way through a cascading array. An example of a graph structure using this approach to support a solution comprising 23 tables is shown in Figure 13.
Figure 13 : The simplified array structure used to enable a Procedural Control implementation adapted from the method described by Michael Harris. Using the calculated key fields and a cascading array of TOs as shown in Figure 13, any relationship can be created programmatically between any two tables by setting the required key designations into the global fields in each of the tables. Thus, relational matches can be created and destroyed in real time via a script that resets the global assignments. This permits relational configurations to be stored as data (an array of key values) and invoked at will by passing the array to a key configuration script. Navigation scripts taking the user to each layout of the solution are therefore also configured to establish the required relationship contexts to support the requirements of the destination layout. Since the examples mentioned above were first widely seen and discussed, numerous other approaches to the use of procedural control as the basis of solution design have emerged. Most notable, the addition of native script triggers to FileMaker Pro 10 extended the scope for solutions to work adaptively through creative use of the script engine. A number of advanced custom function techniques have been published which support virtual list operations, allowing data sets and subsets to be built on-the-fly without requiring supporting relationships. Moreover the inclusion of the ExecuteSQL( ) calculation function in FileMaker 12 further extends the potential to reduce dependence on the Relationships Graph to support the logic and interface of the solution. This enables filtering and delivering data to be written in script and calculation code rather than in relationships on the graph. In implementations of Procedural Control application architecture, the structure and data design of the solution are defined in real time and as needed during the solution processes (typically via script) and the graph becomes a simplified and secondary supporting tool, configured to enable data model interventions which occur elsewhere in the solution. Whereas the Flotilla model required an increased reliance on
FileMaker Solution Architectures Page 26 of 29
scripted controls to manage context and support its graph modeling principle, the procedural control model may rely largely or entirely on run-time scripted processes to determine structure and context at every instant. A defining attribute of the Procedural Control model is that solutions that depend on it introduce an additional layer of abstraction. On fully comprehending and implementing such models, it becomes clear that the graph can be regarded as an enabling tool – it need not define the solution nor dictate the parameters within which the developer or the solution will work. At this point the data model and the functional model of the solution exist outside the graph: perhaps on a whiteboard, in a spreadsheet, or in the developer's head. It is beyond the scope of this paper to fully explore or critique the many implementations of procedural control-based solutions that have emerged over the course of the past decade. However it is sufficient for the purpose at hand merely to acknowledge that such solutions exist and provide a relatively open-ended alternative approach to solution design – and to Graph Modeling. While the approaches grouped together within this model in all their various permutations are revealing, liberating and intriguing, they do impose some stringencies and limitations on the developer. Some implementations involve uses of the FileMaker Pro platform that are somewhat at odds with the mainstream and therefore not widely understood. Moreover, the structures supported in any one implementation of a procedural control based solution are better suited to some solution requirements than others are – and not all of them scale well. Consequently, while this model in all its permutations represents a breakthrough in thinking, the number of solutions relying primarily or exclusively on procedural control implementations remains small.
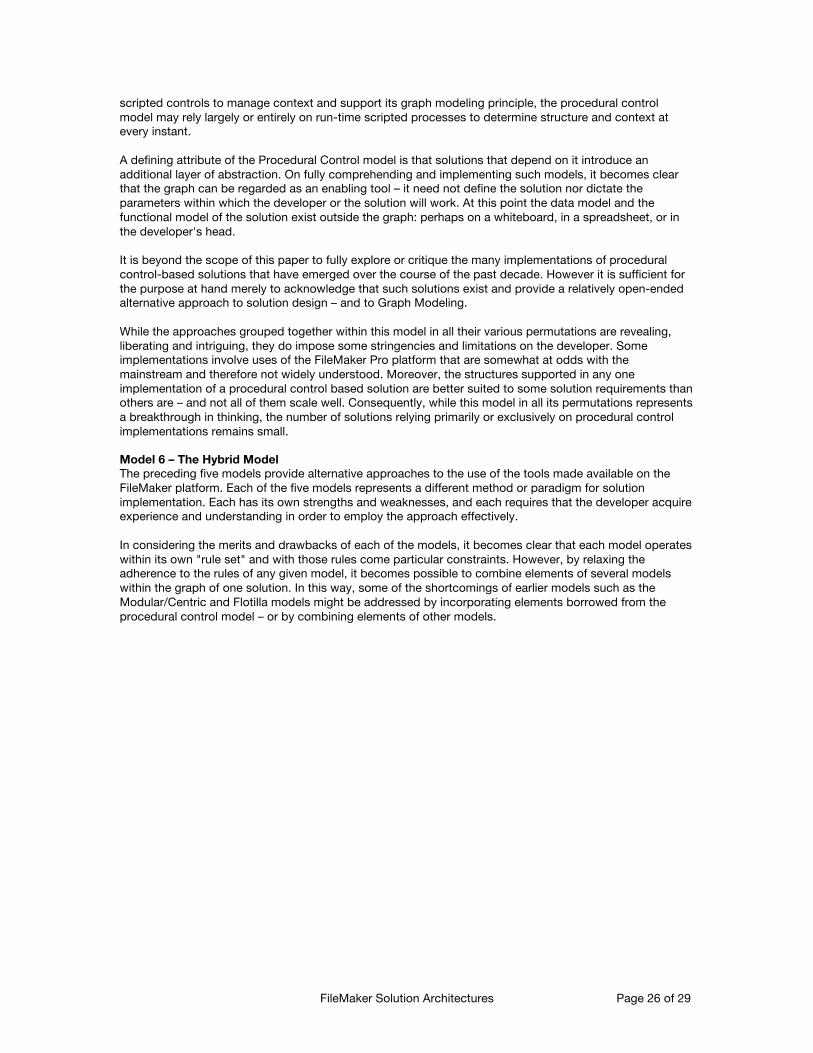
Model 6 – The Hybrid Model The preceding five models provide alternative approaches to the use of the tools made available on the FileMaker platform. Each of the five models represents a different method or paradigm for solution implementation. Each has its own strengths and weaknesses, and each requires that the developer acquire experience and understanding in order to employ the approach effectively. In considering the merits and drawbacks of each of the models, it becomes clear that each model operates within its own "rule set" and with those rules come particular constraints. However, by relaxing the adherence to the rules of any given model, it becomes possible to combine elements of several models within the graph of one solution. In this way, some of the shortcomings of earlier models such as the Modular/Centric and Flotilla models might be addressed by incorporating elements borrowed from the procedural control model – or by combining elements of other models.
FileMaker Solution Architectures Page 27 of 29
Figure 14 : An adaptation of the solution Graph of the Flotilla design from Figure 12, adapted to reduce redundancy by including Procedural Control-like grouping in place of a majority of the original satellite TOGs. For example, in a particular implementation of the Flotilla model, one might arrive at a graph implementation that comprises a main structural group of table occurrences, plus fifty-five small purpose-specific groups, each with at least one associated utility layout. Some analysis might show that five of the purpose-specific TO groups have ongoing roles, but the remaining fifty can be replaced with a single implementation of a procedural control grouping. Doing so significantly reduces the complexity and redundancies of the Graph and the number of utility layouts required, while only marginally impacting the scripting model since the Flotilla model already has a significant reliance on scripted support for processes. This particular hybrid results in a graph design such as the one depicted at Figure 14. However it should be noted that by its nature, hybrid graph modeling can result in a wide variety of combinations and the resulting graphs may be equally varied. With the adoption of a hybrid approach to solution design, the Graph is no longer serving as the defining principle for the solution or the data model. Rather, the developer is drawing on a variety of organizing principles according to the needs of (and best outcomes for) the solution as a whole. Graph methodologies are dictated by the requirements of the solution design rather than the other way around. Although the Hybrid model revisits a selection of principles articulated in earlier models, it does so within a different framework where the orthodoxies of those models no longer determine limits, structures or working processes. Upon embarking on implementations of Hybrid modeled graphs, you may begin to note that though your graphs contain defined structural elements and segments of order that are recognizable as conforming to the patterns of one or more of the various clearly delineated models described previously, no comprehensive organizing principle pervades the entire solution. The graph is highly organized, but the organization arises on a needs basis rather than conforming to a unified set of principles.
FileMaker Solution Architectures Page 28 of 29
Beyond ancient wisdom It goes without saying that each of us acquires new insights and develops new skills with every challenge we overcome. The rapid evolution of the FileMaker product line continues to provide both challenges and opportunities. With that, however, new solutions to old problems have become available, and new features such as native script triggers and SQL calculation capabilities provide enhanced tools for managing logic and process in solutions of all kinds. The first thing to consider when revisiting the options of each model is the way in which each is impacted by recently introduced FileMaker capabilities. Perhaps the most significant impacts have been an increased prevalence of features and techniques that support procedural control and hybrid design approaches, where a proportion of the logic and interface requirements of the solution are delivered via mechanisms that don’t depend (or don’t depend primarily) on the Relationships Graph. While the fundamentals of the available approaches remain, it’s important to recognize that the details continue to evolve, and as the feature set increases, greater use can be made of the flexibility that the FileMaker platform provides. Rather than being constrained to a single view of the Graph, or to a graph-centered view of solution design, the range of alternatives has increased, and hybrid models have increased attractiveness and viability.
In conclusion While there is no necessity to adopt or apply all of the methods outlined in this technical brief, you are encouraged to be aware of them, and to embrace those that are a good fit for your requirements. Applying a broadly based set of perceptions and skills will afford you the flexibility to deal with situations as they arise and to choose techniques to fit the special needs of each case and each solution.
FileMaker Solution Architectures Page 29 of 29
About The Author Ray Cologon, PhD., is the director of NightWing Enterprises, based in Melbourne, Australia, a provider of FileMaker design, consulting and development services to clients worldwide. Ray has been working with FileMaker, both in-house and as an independent contractor, for more than two decades, and is the author of the FileMaker Pro 10 Bible and the FileMaker Pro 9 Bible, as well as several FileMaker, Inc. published white papers and technical briefs. Ray is an award-winning trainer and speaker in Australia and was recipient of the FileMaker, Inc. 2005 FileMaker award for Leadership and Technical Excellence in FileMaker Pro. Ray is also a FileMaker Certified Developer for all versions since FileMaker 7. Contact him at [email protected]. Legal Notices © 2013 FileMaker, Inc. All rights reserved. FileMaker is a trademark of FileMaker, Inc., registered in the U.S. and other countries. The file folder logo is a trademark of FileMaker, Inc. All other trademarks are the property of their respective owners. Product specifications and availability are subject to change without notice. The example companies, organizations, products, domain names, e-mail addresses, logos, people, places and events depicted are purely fictitious, and any resemblance to existing persons and companies is purely coincidental. Product specifications and availability subject to change without notice. THIS DOCUMENT IS PROVIDED "AS IS" WITHOUT WARRANTY OF ANY KIND, AND FILEMAKER DISCLAIMS ALL WARRANTIES, EITHER EXPRESS OR IMPLIED, INCLUDING, BUT NOT LIMITED TO, THE IMPLIED WARRANTIES OF MERCHANTABILITY OR FITNESS FOR A PARTICULAR PURPOSE, OR THE WARRANTY OF NON-INFRINGEMENT. IN NO EVENT SHALL FILEMAKER OR ITS SUPPLIERS BE LIABLE FOR ANY DAMAGES WHATSOEVER INCLUDING DIRECT, INDIRECT, INCIDENTAL, CONSEQUENTIAL, LOSS OF BUSINESS PROFITS, PUNITIVE OR SPECIAL DAMAGES, EVEN IF FILEMAKER OR ITS SUPPLIERS HAVE BEEN ADVISED OF THE POSSIBILITY OF SUCH DAMAGES. SOME STATES DO NOT ALLOW THE EXCLUSION OR LIMITATION OF LIABILITY. FILEMAKER MAY MAKE CHANGES TO THIS DOCUMENT AT ANY TIME WITHOUT NOTICE. THIS DOCUMENT MAY BE OUT OF DATE AND FILEMAKER MAKES NO COMMITMENT TO UPDATE THIS INFORMATION.