Embed Size (px)
Citation preview

CIN No.L17119DN1990PLC000091FILATEX INDIA LIMITEDFIL/SE/2020-21/32 7th November, 2020
National Stock Exchange of India Limited Listing Department5th Floor, Exchange Plaza, C -l, Block-G, Bandra-Kurla Complex, Bandra (E) Mumbai-400 051 Security Symbol: FILATEX
BSE Limited Listing Department25th Floor, Pheroze Jeejeebhoy Towers Dalai Street,Mumbai - 400 001 Security Code: 526227
Sub: Investor Presentation - Q2 & H I FY21
Dear Sirs/ Madam,
Pursuant to Regulation 30(2) of the 5EBI (Listing Obligations and Disclosure Requirements) Regulations, 2015 read with Para A of Part A of Schedule III, please find enclosed herewith the Investor Presentation - Q2 & H I FY21 which we propose to share with Analysts & Investors.
This is for your information and records please.
Thanking you,
Yours faithfully,For FILATEX INDIA LIMITED
COMPANY SECRETARY
Enel.: a/a
C O R P O R A T E O F F IC E R E G D . O F F IC E & W O R K S S U R A T O F F IC E M U M B A I O F F IC E
Bhageria House S. No. 274 Demni Road Bhageria House 321, Maker Chamber ■ V4 3 C o m m u n ity C entre Dadra • 3 96193 R ing Road N arim a n Po in tNew Friends Colony U.T. of-Dadra & Nagar Haveli Surat - 395002 Mumbai - 400021New Delhi • 110025, India India India India
P +91.11.26312503,26848633/44 P +91.260.2668343/8510 P +91.261.4030000 P +91.22.22026005/06F +91.11.26849915 F +91.260.2668344 F +91.261.2310796 F +91.22.22026006E [email protected] E [email protected] E [email protected] E [email protected]
Website: w w w .filatex.com
FILATEX INDIA LIMITEDInvestor PresentationQ2 & H1 FY21
November 2020

FIL | Investor Presentation | Q4 FY 2019-20
Rising to the Challenges
The company is witnessing an improvement in demand as the markets continues to recover from the slowdowncaused by the pandemic. In September 2020, we achieved yarn capacity utilization of above 90%. Our EBIDTA %improved on a YoY basis from 7.69% to 8.77% due to an increase in the share of value-added products like drawntextured yarn.
Going forward, we expect further improvement in margins as the country returns to normalcy post the gradualrelaxation of the lockdown. With the commencement of our DTY project on 31st August 2020, we expect ourEBITDA margins to improve further.
We are currently in the process of setting up a 30 MW captive power plant at our Dahej unit. The project is wellunderway and we are targeting commissioning by April 2021. The annual impact of savings in energy costs, uponcompletion of the project, will be in the magnitude of Rs. 45 to 50 crores annually.
Madhu Sudhan BhageriaChairman & Managing Director

FIL | Investor Presentation | Q4 FY 2019-20
Company Overview
Our mission
02World-Class
Manufacturing Facilities
Tonnes Per AnnumProduction Capacity
(2019-2020)
05Continents
Catered
2500+Team
Members
45+Countries Global
Export
383,000
We are one of India’s Top 5 Manufacturers of Polyester Filament yarns.
We manufacture polyester and polypropylene multifilament yarn and
polyester chips. We have two manufacturing facilities; one at Dadra &
Nagar Haveli and second one at Dahej, equipped with state-of-the-art
modern German machines.
To be one of the leading polyester yarns manufacturer
producing products to international standards, to be
customer focused through stringent quality assurance
and continuous innovation.
Our Vision
FIL | Investor Presentation | Q4 FY 2019-20
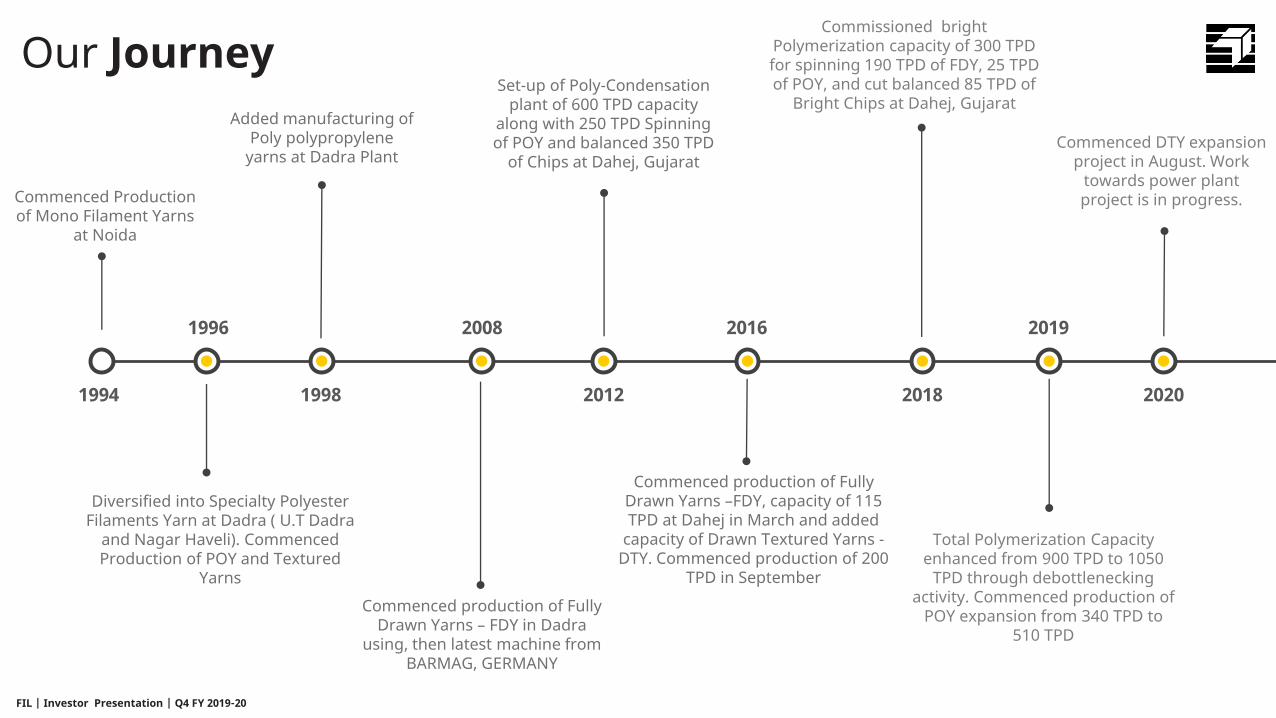
Our Journey
1994
Diversified into Specialty Polyester Filaments Yarn at Dadra ( U.T Dadra
and Nagar Haveli). Commenced Production of POY and Textured
Yarns
Commenced production of Fully Drawn Yarns – FDY in Dadra
using, then latest machine from BARMAG, GERMANY
Commenced production of Fully Drawn Yarns –FDY, capacity of 115 TPD at Dahej in March and added
capacity of Drawn Textured Yarns -DTY. Commenced production of 200
TPD in September
Commenced Production of Mono Filament Yarns
at Noida
Added manufacturing of Poly polypropylene
yarns at Dadra Plant
Set-up of Poly-Condensation plant of 600 TPD capacity
along with 250 TPD Spinning of POY and balanced 350 TPD
of Chips at Dahej, Gujarat
Commissioned bright Polymerization capacity of 300 TPD for spinning 190 TPD of FDY, 25 TPD of POY, and cut balanced 85 TPD of
Bright Chips at Dahej, Gujarat
Total Polymerization Capacity enhanced from 900 TPD to 1050
TPD through debottlenecking activity. Commenced production of
POY expansion from 340 TPD to 510 TPD
1994
20081996 2016
1998 2012 2018
2019
Commenced DTY expansion project in August. Work
towards power plant project is in progress.
2020

FIL | Investor Presentation | Q4 FY 2019-20
Our Products
Polyester ChipsIndustrial intermediate product used to
manufacture Polyester yarns.
Drawn Textured Yarns (DTY)Produced by drawing & heating POY through a texturing process. It is used for manufacturing Fabrics.
Fully Drawn Yarns (FDY)Fully drawn polyester filament yarn is directly
used for producing all kinds of Fabrics specially for children and ladies.
Polyester Partially Oriented Yarns (POY)Intermediate product, post Texturizing used for knitting & weaving different kinds of Fabrics.
Polypropylene Multifilament Crimp YarnsDifferent shades and deniers, the range being
used for Socks, Under Garments and Sports Wear.
Narrow Woven FabricsUsed in manufacture of Carpets, Rugs, Tapes, Ribbons and Zippers

FIL | Investor Presentation | Q4 FY 2019-20
Catering to Diverse End-Uses
Fully Drawn Yarns of Polyester are being used for Home Furnishings, Fashion Fabrics, Terry Towels, Bed Sheets, Curtains & Carpets. Other growing applications are Upholstery Fabrics. Properties of stain resistance make it ideal for carpets.
The preferred material for sportswear is Polyester Yarn. Sports leisure clothing require a fabric that’s not only strong & durable but also abrasion resistant. Ease of washing & corrosion resistance make them easy to maintain with longer usage life.
Polyester is extensively used in apparels –Trousers, Shirts, Suitings& Sarees. PFY is a strong filament that can withstand strong & repetitive movements. Colour fastness is also excellent. It is wear resistant, water resistant, wrinkle resistant and its hydrophobic properties make it ideal for all kinds of apparel.
In these garments, feeling of softness is critical. The Textured Micro Denier have met the expected requirements and are being used in Lingerie, Performance garments -Active wear, Yoga wear, low shrinkage to ensure no seam distortion after washing & soft feel make these yarns ideal choice.
Home Textiles &Furnishings Athleisure Apparel Women Wear &
Inner Wear
Polyester & Polypropylene is used in the components of PPE kits as well as protective masks. Properties such as corrosion resistant, wear resistant and low shrinkage make them and ideal choices to allow longer usage life.
PPE Kits & Protective Masks

FIL | Investor Presentation | Q4 FY 2019-20
Impacting Daily Lives
…through the apparels one wears at home and office
…through the bedsheets, curtains and carpets that makes a house a home
…through the body warmer one wears in the winter for warmth
…through the stuff toys one plays with
…through the car seats that provide
safety while travelling
…through the towel that one uses to dry
oneself
…through the clothes one wears while indulging in
sporting activities ..through the pillow one uses to get a sound sleep after a
busy day at work
...through the quilt one wraps around to get
warmth during winters

FIL | Investor Presentation | Q4 FY 2019-20
Polyester – The Preferred FiberWe believe that polyester will be fibre of the future.
Filatex has focused its future growth plans on polyester filament yarns.
POLYESTER
Affordable Pricing
Highly Durable
Easy Wash Ability
High Colour Retention
Abrasion & Mildew Resistant
Resistant to Stretching and Shrinking
Stain Resistant
Faster Dryness
Blends with Other Fibres
Wrinkle Resilient

FIL | Investor Presentation | Q4 FY 2019-20
World Fibre Production (2008-2018)
2008 % 2018 % CAGR Growth
Natural Fibres
Raw Cotton 23,584 31.40 26,120 23.47 1.03 2,536
Other Natural Fibres 6,971 9.28 6,084 5.47 (1.35) (887)
Total Natural 30,555 40.69 32,204 28.93 0.53 1,649
Synthetic Fibres
Cellulose Fibres 3,464 4.61 6,900 6.20 7.13 3,436
Synthetic Filaments* 25,750 34.29 49,800 44.74 6.82 24,050
Synthetic Staple Fibres 15,331 20.41 22,400 20.13 3.86 7,069
Total Synthetic 44,545 59.31 79,100 71.07 5.91 34,555
Total Fibres 75,100 100% 1,11,304 100% 4.01 36,204
Source: DNFI (in 1000 MT)
5%
66%
10%
19%
CONTRIBUTION TO FIBRE GROWTH IN THE LAST DECADE
Natural Fibres Synthetic Filaments*
Cellulose Fibres Synthetic Staple Fibres
*Polyester Filaments make up 90% of Synthetic Filaments95% of the growth in World Fibre Production in the last decade
has come from Synthetic Fibres alone

FIL | Investor Presentation | Q4 FY 2019-20
Production Process Flow (Dahej)
PTA MEGPOY Partially Oriented Yarns
DTY Draw Texturizing Yarns
FDY Fully Drawn Yarns
125 TPD
Chips
465 TPD
POY
140 TPD
FDY
340 TPD
DTY
100 TPD
Chips
45 TPD
POY
175 TPD
FDY
ESTERFICATION REACTOR -2
PRE POLY REACTOR
FINISHER
ESTERFICATION REACTOR -2
PRE POLY REACTOR
FINISHER
730 TPD 320 TPD
TIO2 BASO4
20 TPD
DTY
PTA Paste Tank
ESTERFICATION REACTOR -1 ESTERFICATION REACTOR -1
PTA MEG
PTA Paste Tank
SEMI DULL STREAM BRIGHT STREAM
10

FIL | Investor Presentation | Q4 FY 2019-20
26.341.2
59.8
84.9
121.5
0
20
40
60
80
100
120
140
2016 2017 2018 2019 2020
PAT (₹ in Crore)
Our Growth
87.5
132.8156.6
216.5 222.1
0
50
100
150
200
250
2016 2017 2018 2019 2020
EBIDTA (₹ in Crore)
1,278.23 1,551.01
1,927.59
2,874.10 2,782.07
2016 2017 2018 2019 2020
Net Revenue (₹ in Crore)
32.755.2
92.7
128.6 122.0
0
20
40
60
80
100
120
140
2016 2017 2018 2019 2020
PBT (₹ in Crore)
CAGR = 21.46% CAGR = 26.08%
CAGR = 39.03% CAGR = 46.61%
(₹ in Crore)
11
FIL | Investor Presentation | Q4 FY 2019-20
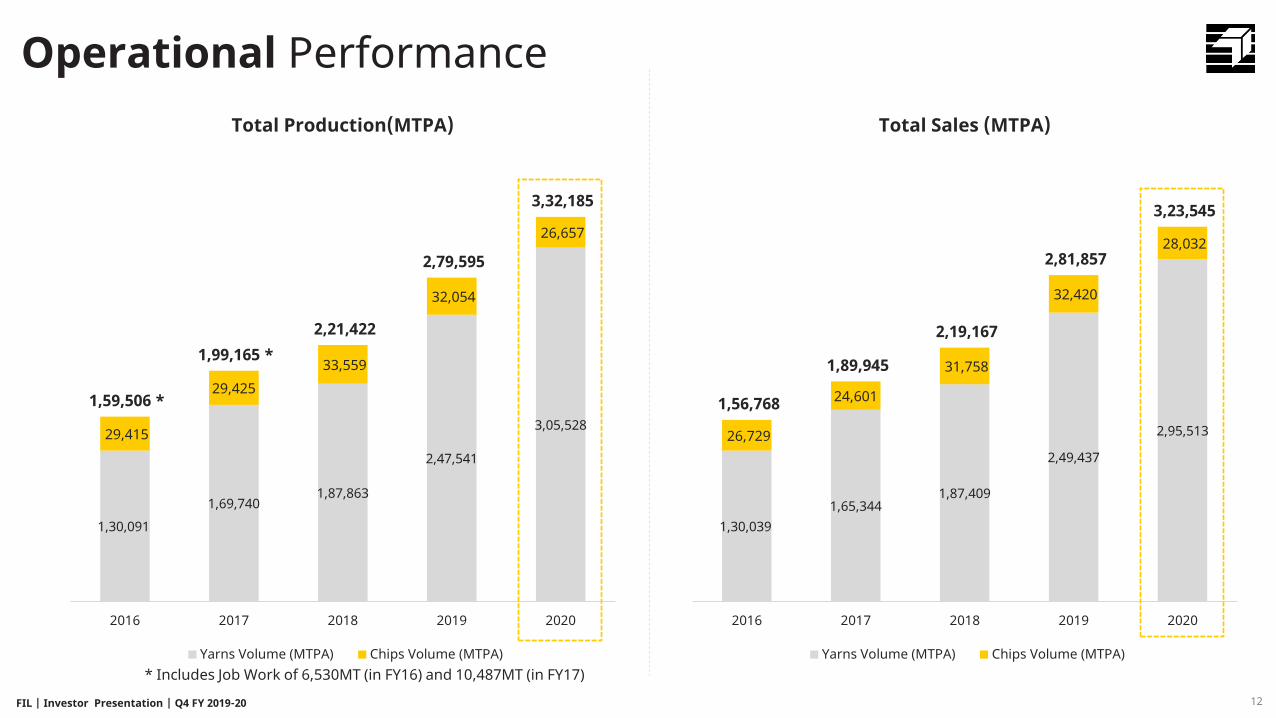
Operational Performance
1,30,0391,65,344
1,87,409
2,49,437
2,95,51326,729
24,601
31,758
32,420
28,032
1,56,768
1,89,945
2,19,167
2,81,857
3,23,545
2016 2017 2018 2019 2020
Total Sales (MTPA)
Yarns Volume (MTPA) Chips Volume (MTPA)
12
1,30,091
1,69,7401,87,863
2,47,541
3,05,52829,415
29,42533,559
32,054
26,657
1,59,506 *
1,99,165 *2,21,422
2,79,595
3,32,185
2016 2017 2018 2019 2020
Total Production(MTPA)
Yarns Volume (MTPA) Chips Volume (MTPA)* Includes Job Work of 6,530MT (in FY16) and 10,487MT (in FY17)

FIL | Investor Presentation | Q4 FY 2019-20
Growth Drivers
Hike in Import Duty▪ Import tax on more than 300 textile products doubled to 20%
that will help improvement in utilization of the existing manufacturing capacity
▪ This will act as a demand stimulant and encourage the domestic synthetic yarn sector by restricting the imports and providing price parity in the domestic market
Exports Opportunity
▪ Cost competitiveness and increase in texturizing machines will open up new export opportunities for the company
▪ New textile policy aims to achieve US$ 300 billion worth of textile exports by 2024-25
Removal of Anti-Dumping Duty on PTA
▪ Removal of anti-dumping duty on raw material will allow the Indian manufacturers to compete domestically and globally in terms of price competitiveness
Scheme for Integrated Textile Parks▪ 40% capital subsidy to a maximum of INR 40 crore on total
project cost on projects approved by government aimed at creating world-class infrastructure for the industry
Recycled Yarn Industry▪ The demand for recycle polyester is increasing rapidly as
leading brands in fast fashion segments are promoting sustainability in textile industry
▪ Increasing demand for recycled yarn coupled with increasing application areas of Polyester yarn is anticipated to accelerate the market growth for foreseeable years
ATUFS
▪ The government would provide credit linked Capital investment subsidy (CIS) under Amended Technology Upgradation Fund Scheme (ATUFS)
▪ The scheme would facilitate augmenting of investment, productivity, quality, employment, exports along with import substitution in the industry
China Factor
▪ Companies looking for alternative sourcing locations to China may increase exports to India, the 2nd largest textile player
▪ Rising labour costs in China▪ Product offering competitive to that of China
IndustryFactors
Government Booster
13

FIL | Investor Presentation | Q4 FY 2019-20
Growth Drivers - Internal(₹ in Crore)
Increase Focus on ExportsWith new texturizing machines coming in, exports ofthe company will increase on account of texturized yarn,being a high-demand product both domestically as wellas globally. Anti-China sentiments will also help boostIndian textured yarn exports globally.
Value-Added ProductsExpansion of DTY from 200 TPD to 400 TPD has beeninstalled and will help improve overall margins of thecompany as it is a value-added product. The company isalso focused on researching and adding new filamentswith niche characteristics to the product portfolio.
Captive Power PlantThe company is setting up of 31.4 MW captive power plant (30 MW Thermal and 1.4 MW Solar). This will help reduce the power cost of the plant in Dahej and result in savings of 45-50 crores annually.
Capex UnfoldingThe company has been expanding rapidly for the past 4-5 years in various streams and in FY21 it expects to capitalize on full capacity and benefit from economies of scale. Full effect of debottlenecking.
14

FIL | Investor Presentation | Q4 FY 2019-20
Global Presence
383,000Total Production Capacity (MTPA)
FY21
45+Countries to which
products are exported
33% Drawn Texturizing Yarn
(DTY) Production is exported
~15%Exports contributionto Revenues in FY20
Corporate OfficeNew Delhi
Manufacturing Facilities Dadra & Nagar Havelli(UT) Dahej (Gujarat)
Marketing Office New Delhi SuratMumbai
Canada
United States
MexicoDominican Republic
South Africa
New Delhi
Sri LankaColumbiaEcuador
PeruBrazil
ArgentinaChile
Kenya
EgyptAlgeriaMorocco
SpainPortugal
United KingdomGermany
ItalyTurkey
Latvia
Poland
IranUzbekistan
NepalBangladesh
Singapore
Indonesia
Thailand
South Korea
Mumbai
Dahej SuratDadra
UAETunisia
BelarusCzech Croatia
SloveniaGreece
AzerbaijanGeorgia
Hong KongIsrael
Paraguay
Vietnam
15

FIL | Investor Presentation | Q4 FY 2019-20
Production Capacities
PRODUCTION CAPACITIES | FY 2020-21
Products (MTPA) Production Captive Net %age
Polyester Chips - Semi Dull 50,400 21,600 28,800 7.5%
Polyester Chips - Bright 36,000 13,000 23,000 6.0%
Polyester POY - Semi Dull 1,83,600 1,44,000 39,600 10.3%
Polyester POY - Bright 16,200 0 16,200 4.2%
Polyester DTY 1,44,000 1200 1,42,800 37.3%
Polypropylene DTY 4,000 0 4,000 1.0%
Polypropylene POY 5,000 4,000 1,000 0.3%
Polyester FDY - Semi Dull 50,400 0 50,400 13.2%
Polyester FDY - Bright 76,000 1,200 74,800 19.5%
Narrow Woven Fabrics 2,400 0 2,400 0.6%
Grand Total 5,68,000 1,85,000 3,83,000 100%
Net Capacity (Post Expansion Net of Captive)
7.5%
6.0%
10.3%
4.2%
37.3%
1.0%
0.3%
13.2%
19.5%
0.6%
16
FIL | Investor Presentation | Q4 FY 2019-20
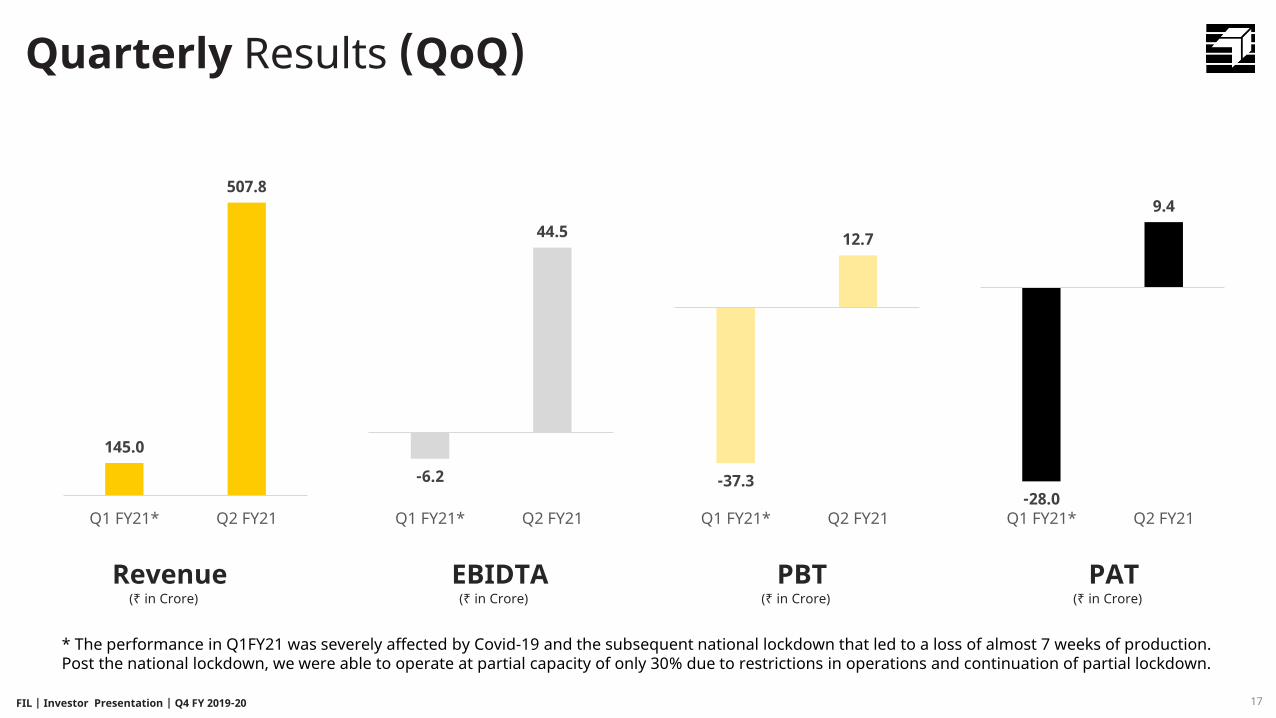
Quarterly Results (QoQ)
-6.2
44.5
Q1 FY21* Q2 FY21-28.0
9.4
Q1 FY21* Q2 FY21
(₹ in Crore)Revenue EBIDTA
(₹ in Crore)PAT
(₹ in Crore)
145.0
507.8
Q1 FY21* Q2 FY21
17
* The performance in Q1FY21 was severely affected by Covid-19 and the subsequent national lockdown that led to a loss of almost 7 weeks of production. Post the national lockdown, we were able to operate at partial capacity of only 30% due to restrictions in operations and continuation of partial lockdown.
-37.3
12.7
Q1 FY21* Q2 FY21
PBT(₹ in Crore)

FIL | Investor Presentation | Q4 FY 2019-20
Quarterly Results (YoY)
52.3
44.5
Q2 FY20 Q2 FY21
61.8
9.4
Q2 FY20 Q2 FY21
(₹ in Crore)Revenue EBIDTA
(₹ in Crore)PAT
(₹ in Crore)
680.2
507.8
Q2 FY20 Q2 FY21
18
33.1
12.7
Q2 FY20 Q2 FY21
PBT(₹ in Crore)

FIL | Investor Presentation | Q4 FY 2019-20
Quarterly Production (QoQ & YoY)
80,220
12,282
67,702
4,066
4,552
5,031
84,286
16,834
72,733
Q2 FY20 Q1 FY21* Q2 FY21
Yarns Chips
73124
16,680
68,951
2948
3,759
6,284
76,072
20,439
75,235
Q2 FY20 Q1 FY21* Q2 FY21
Yarns Chips
Total Production (MTPA)
Total Sales(MTPA)
* The performance in Q1FY21 was severely affected by Covid-19 and the subsequent national lockdown that led to a loss of almost 7 weeks of production. Post the national lockdown, we were able to operate at partial capacity of only 30% due to restrictions in operations and continuation of partial lockdown.

FIL | Investor Presentation | Q4 FY 2019-20
Half-Yearly Results (YoY)
103.7
38.4
H1 FY20 H1 FY21
81.9
-18.6
H1 FY20 H1 FY21
(₹ in Crore)Revenue EBIDTA
(₹ in Crore)PAT
(₹ in Crore)
1,377.0
652.8
H1 FY20 H1 FY21*
20
64.0
-24.6H1 FY20 H1 FY21
PBT(₹ in Crore)

FIL | Investor Presentation | Q4 FY 2019-20
Half-Yearly Production (YoY)
1,42,802
79,984
11,849
9,583
1,54,651
89,567
H1 FY20 H1 FY21
Yarns Chips
1,36,224
85,631
12,374
10,043
1,48,598
95,674
H1 FY20 H1 FY21
Yarns Chips
Total Production (MTPA)
Total Sales(MTPA)

FIL | Investor Presentation | Q4 FY 2019-20
Profit & Loss | Q2 FY20(INR in Crore)1 Q2 FY21 Q1 FY21 QoQ % Q2 FY20 YoY %
Net Revenue from operations (Net of Taxes) 507.8 145.0 250.2 680.2 (25.4)
Other income 1.5 1.0 46.0 2.2 (33.3)
Total Revenue 509.3 146.0 248.8 682.4 (25.4)
Total Expenses 496.6 183.2 171.1 649.3 (23.5)
Cost of materials consumed 373.4 91.5 308.1 584.0 (36.1)
Changes in inventories 14.1 32.3 56.3 (46.4) (130.4)
Employee benefits expense 16.1 8.7 84.8 18.4 (12.4)
Finance cost 18.9 17.8 6.0 9.5 99.1
Depreciation and amortization expense 14.4 14.2 1.6 11.9 21.1
Other expenses 59.7 18.7 219.3 72.0 (17.1)
Profit before exceptional items & tax 12.7 (37.3) 134.0 33.1 (61.7)
Exceptional Items - - -
Profit before tax 12.7 (37.3) 134.0 33.1 (61.7)
Tax expense 3.3 (9.3) 135.4 (28.8) (111.4)
Net profit/(loss) after tax 9.4 (28.0) 133.5 61.8 (84.8)
22
FIL | Investor Presentation | Q4 FY 2019-20
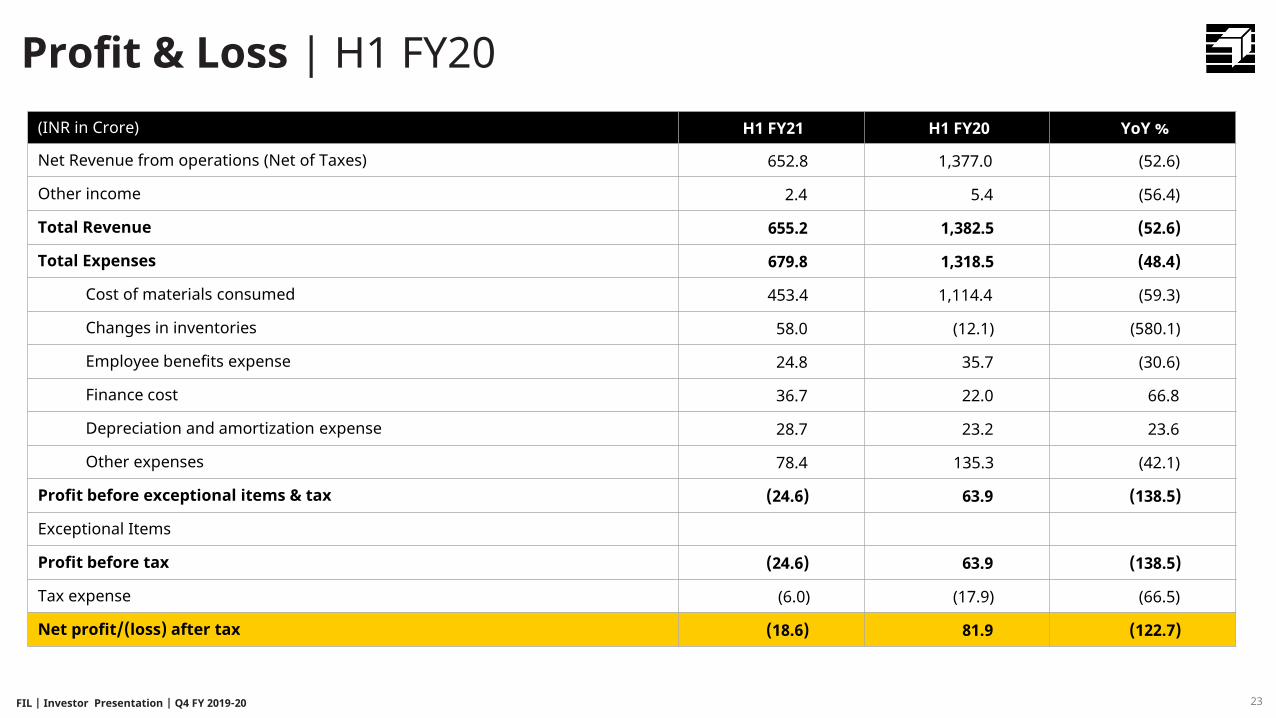
Profit & Loss | H1 FY20(INR in Crore) H1 FY21 H1 FY20 YoY %
Net Revenue from operations (Net of Taxes) 652.8 1,377.0 (52.6)
Other income 2.4 5.4 (56.4)
Total Revenue 655.2 1,382.5 (52.6)
Total Expenses 679.8 1,318.5 (48.4)
Cost of materials consumed 453.4 1,114.4 (59.3)
Changes in inventories 58.0 (12.1) (580.1)
Employee benefits expense 24.8 35.7 (30.6)
Finance cost 36.7 22.0 66.8
Depreciation and amortization expense 28.7 23.2 23.6
Other expenses 78.4 135.3 (42.1)
Profit before exceptional items & tax (24.6) 63.9 (138.5)
Exceptional Items
Profit before tax (24.6) 63.9 (138.5)
Tax expense (6.0) (17.9) (66.5)
Net profit/(loss) after tax (18.6) 81.9 (122.7)
23

FIL | Investor Presentation | Q4 FY 2019-20
Profit & Loss | FY20(INR in Crore) FY20 FY19 YoY %
Net Revenue from operations (Net of Taxes) 2782.1 2874.1 (3.2)%
Other income 12.4 11.8 5.1%
Total Revenue 2794.5 2885.9 (3.2)%
Total Expenses 2672.5 2757.3 (3.1)%
Cost of materials consumed 2255.6 2351.0 (4.1)%
Changes in inventories (41.6) 13.6 (405.9)%
Employee benefits expense 74.7 63.2 18.0%
Finance cost 61.3 54.7 12.1%
Depreciation and amortization expense 51.3 45.0 14.0%
Other expenses 271.3 229.8 18.1%
Profit before exceptional items & tax 122.0 128.6 (5.1)%
Exceptional Items - 2.4 (100.0)%
Profit before tax 122.0 131.0 (6.9)%
Tax expense 0.5 46.1 (98.9)%
Net profit/(loss) after tax 121.5 84.9 43.1%
24

FIL | Investor Presentation | Q4 FY 2019-20
Balance Sheet - Assets| H1 FY21(INR in Crore) 2019-20 2020-21 (H1)
Non-Current Assets 1,217.0 1,219.3
Property, plant and equipment 1,115.3 1,115.7
Capital work-in-progress 66.5 73.6
Other Intangible Assets 0.7 0.9
Financial Assets
Investments 0.0 0.0
Loans and Advances 5.3 0.9
Other non-current assets 28.8 27.9
Tax Assets 0.4 0.3
Current Assets 404.4 492.3
Inventories 171.7 132.4
Financial Assets
Trade receivables 118.6 79.0
Investments - 121.0
Cash and cash equivalents 21.8 55.6
Loans and Advances 1.6 0.6
Other Financial Assets 16.9 14.4
Other current assets 73.8 89.3
Assets classified as held for Sale - -
TOTAL ASSETS 1,621.4 1,711.6
25

FIL | Investor Presentation | Q4 FY 2019-20
Balance Sheet – Equity & Liabilities| H1 FY21(INR in Crore) 2019-20 2020-21 (H1)
EQUITY 594.9 576.6
Equity Share capital 43.9 44.2
Other equity 551.0 532.4
Money received against share warrants - -
LIABILITIES 1,026.5 1,135.0
Non-Current Liabilities 686.9 661.4
Financial liabilities
Borrowings 611.5 592.9
Other financial liabilities 4.4 3.2
Provisions 7.2 8.0
Deferred tax liabilities 37.8 31.8
Other Non-Current Liabilities 26.0 25.5
Current Liabilities 339.6 473.6
Financial liabilities
Borrowings 57.5 5.4
Trade Payables 186.0 332.5
Other financial liabilities 80.7 122.6
Provisions 3.1 9.6
Other Current Liabilities 11.9 3.5
Income Tax Liabilities (net) 0.4 -
Liabilities Directly associated with assets classified as held for sale - -
TOTAL EQUITY AND LIABILITIES 1,621.4 1,711.626

FIL | Investor Presentation | Q4 FY 2019-20
Balance Sheet - Assets| FY20(INR in Crore) 2015-16 2016-17 2017-18 2018-19 2019-20
Non-Current Assets 525.4 665.9 962.0 1,017.8 1,217.0
Property, plant and equipment 492.3 628.4 944.5 927.9 1,115.3
Capital work-in-progress 18.0 5.7 6.4 71.5 66.5
Other Intangible Assets 0.1 0.2 0.4 0.7 0.7
Financial Assets
Investments 0.0 0.1 - 0.0 0.0
Loans and Advances 14.0 0.1 0.7 0.7 5.3
Other non-current assets 1.0 29.7 9.2 16.6 28.8
Tax Assets - 1.8 0.8 0.4 0.4
Current Assets 355.4 386.5 462.0 397.6 404.4
Inventories 98.6 149.1 193.7 172.7 171.7
Financial Assets
Trade receivables 216.4 199.4 170.5 98.7 118.6
Cash and cash equivalents 12.5 14.8 25.6 44.2 21.8
Loans and Advances 21.1 0.5 0.6 1.0 1.6
Other Financial Assets - 0.9 4.2 12.5 16.9
Other current assets 6.8 21.7 67.5 68.5 73.8
Assets classified as held for Sale - 6.9 13.4 - -
TOTAL ASSETS 880.8 1,059.4 1,437.5 1,415.4 1,621.4
27

FIL | Investor Presentation | Q4 FY 2019-20
Balance Sheet – Equity & Liabilities| FY20(INR in Crore) 2015-16 2016-17 2017-18 2018-19 2019-20
EQUITY 209.5 325.0 385.4 472.1 594.9
Equity Share capital 32.0 43.5 43.5 43.5 43.9
Other equity 164.6 281.5 341.9 428.6 551.0
Money received against share warrants 12.9 - - - -
LIABILITIES 671.3 733.9 1,049.7 943.3 1026.5
Non-Current Liabilities 340.6 386.2 614.8 574.6 686.9
Financial liabilities
Borrowings 307.6 336.4 541.6 476.8 611.5
Other financial liabilities - - 7.2 9.1 4.4
Provisions 4.7 5.6 5.2 6.0 7.2
Deferred tax liabilities 23.1 27.8 41.2 58.8 37.8
Other Non-Current Liabilities 5.3 16.4 19.7 23.9 26.0
Current Liabilities 330.7 347.8 434.9 368.7 339.6
Financial liabilities
Borrowings 137.8 143.5 98.5 70.2 57.5
Trade Payables 120.4 111.3 224.1 179.0 186.0
Other financial liabilities 71.5 55.4 102.7 89.0 80.7
Provisions 1.0 1.3 2.3 2.8 3.1
Other Current Liabilities - 36.3 6.2 25.6 11.9
Income Tax Liabilities (net) - - 1.1 2.1 0.4
Liabilities Directly associated with assets classified as held for sale - 0.4 2.4 - -
TOTAL EQUITY AND LIABILITIES 880.8 1,059.4 1,437.5 1,415.4 1621.4
28

FIL | Investor Presentation | Q4 FY 2019-20
This presentation and the accompanying slides (the “Presentation”), which have been prepared by Filatex India Limited (the “Company”),have been prepared solely for information purposes and do not constitute any offer, recommendation or invitation to purchase orsubscribe for any securities, and shall not form the basis or be relied on in connection with any contract or binding commitment what soever. No offering of securities of the Company will be made except by means of a statutory offering document containing detailedinformation about the Company.
This Presentation has been prepared by the Company based on information and data which the Company considers reliable, but theCompany makes no representation or warranty, express or implied, whatsoever, and no reliance shall be placed on, the truth, accuracy,completeness, fairness and reasonableness of the contents of this Presentation. This Presentation may not be all inclusive and may notcontain all of the information that you may consider material. Any liability in respect of the contents of, or any omission from, thisPresentation is expressly excluded.
Certain matters discussed in this Presentation may contain statements regarding the Company’s market opportunity and businessprospects that are individually and collectively forward-looking statements. Such forward-looking statements are not guarantees of futureperformance and are subject to known and unknown risks, uncertainties and assumptions that are difficult to predict. These risks anduncertainties include, but are not limited to, the performance of the Indian economy and of the economies of various internationalmarkets, the performance of the industry in India and world-wide, competition, the company’s ability to successfully implement its strategy,the Company’s future levels of growth and expansion, technological implementation, changes and advancements, changes in revenue,income or cash flows, the Company’s market preferences and its exposure to market risks, as well as other risks. The Company’s actualresults, levels of activity, performance or achievements could differ materially and adversely from results expressed in or implied by thisPresentation. The Company assumes no obligation to update any forward-looking information contained in this Presentation. Any forward-looking statements and projections made by third parties included in this Presentation are not adopted by the Company and the Companyis not responsible for such third party statements and projections.
Disclaimer
29
FIL | Investor Presentation | Q4 FY 2019-20
BSE: 526227 | NSE: FILATEX | ISIN: INE816B01027 | CIN: L17119DN1990PLC000091 W W W . F I L A T E X . C O M
For more information, Please contact
Filatex India Limited BHAGERIA HOUSE, 43 Community Centre, New Friends Colony, New Delhi –110025
Ph: +91-11-26312503 Email: [email protected]
30