Embed Size (px)
Citation preview

FEASIBILITYSTUDY
C I T Y O F S A N D I E G O
FOR A COMMUNITY CHOICE AGGREGATE
JULY 2017 | FINAL DRAFTAPPENDICES

This page intentionally left blank.

APPENDICES TABLE OF CONTENTS
GLOSSARY AND LIST OF ACRONYMS .............................................................................................. i
APPENDIX A: COMMUNITY CHOICE ENERGY IN THE CITY OF SAN DIEGO:
AN INITIAL ASSESSMENT OF PROGRAM PROSPECTS
APPENDIX B: PRIORITY GUIDING PRINCIPLES: CITY OF SAN DIEGO COMMUNITY
CHOICE AGGREGATION (CCA) FEASIBILITY STUDY
APPENDIX C: CCA REGULATORY AND TECHNICAL INFORMATION
IOU CODE OF CONDUCT REGARDING CCAS .................................................................. C-2
CCA IMPLEMENTATION STEPS ....................................................................................... C-3
CUSTOMER NOTIFICATIONS, OPT-OUT, AND ENROLLMENT ....................................... C-7
PHASED-IN IMPLEMENTATION OPTION ........................................................................ C-8
ELECTRONIC COMMUNICATIONS AND COMPLIANCE TESTING ................................... C-8
APPENDIX D: LOAD FORECAST DEVELOPMENT
HISTORICAL CUSTOMER USAGE .................................................................................... D-1
SAN DIEGO MUNICIPAL ACCOUNT USAGE .................................................................... D-6
TEMPERATURE AND ENERGY USAGE CORRELATION ................................................... D-9
CUSTOMER USAGE FORECAST ..................................................................................... D-14
ADJUSTED FORECAST WITH DISTRIBUTED GENERATION .......................................... D-17
APPENDIX E: POWER COST DEVELOPMENT
ENERGY SUPPLY CONSIDERATIONS .............................................................................. E-1
ENERGY SUPPLY COST DEVELOPMENT ...................................................................... E-10
MONTE CARLO ENERGY SUPPLY PORTFOLIO COST ANALYSIS .................................. E-27

APPENDICES TABLE OF CONTENTS (continued)
APPENDIX F: CARBON DIOXIDE EMISSIONS DEVELOPMENT
EMISSION REDUCTION COMPARISON WITH THE CLIMATE ACTION PLAN ................... F-3
EMISSIONS FROM NATURAL GAS GENERATION ........................................................... F-4
CCA GREENHOUSE GAS EMISSIONS REDUCTION POTENTIAL ...................................... F-7
APPENDIX G: SAN DIEGO GAS AND ELECTRIC RATES
SDG&E RESIDENTIAL GENERATION RATES ................................................................... G-2
SDG&E COMMERCIAL AND INDUSTRIAL GENERATION RATES .................................... G-3
BILLING OPTIONS FOR CUSTOMERS ............................................................................ G-10
COST RESPONSIBILITY SURCHARGE AND POWER CHARGE
INDIFFERENCE ADJUSTMENT ...................................................................................... G-10
SUPPLEMENTAL COMMERCIAL AND INDUSTRIAL RATE SCHEDULES ....................... G-11
APPENDIX H: REFERENCE DOCUMENTS
STATE OF CALIFORNIA ................................................................................................... H-1
SDG&E CCA INFORMATION ............................................................................................ H-2
EXISTING AND PAST CCA ACTIVITY ................................................................................ H-2
CCA RESEARCH ............................................................................................................... H-5
CPUC REQUIREMENTS .................................................................................................... H-7

GLOSSARY & LIST OF ACRONYMS This section has been reproduced from the main report for the assistance of the reader. However, terms
and acronyms used only in the Appendices may not appear in this list. Not all terms appearing in this list
are used in the Appendices.
A
AB Assembly Bill
B
Baseline Load allowance used in rate tariffs for San Diego Gas and Electric; refer
to Special Condition 3, Sheet 5:
http://regarchive.sdge.com/tm2/pdf/ELEC_ELEC-SCHEDS_DR.pdf
Baseload The portion of CCA program customers receiving the basic power
supply portfolio based on the specific renewable content scenario: 50%
for the Base Case Scenario and Scenario 2, 80% for Scenarios 3 and 5,
and 100% for Scenario 4.
Bundled Customers Customers receiving generation, transmission, and distribution services
from the incumbent utility.
C
CA California
CAISO California Independent System Operator
CalCCA California Community Choice Association
CAP City of San Diego Climate Action Plan, Adopted by the City Council on
December 15, 2015 by Resolution Number: R-2016-309, Amended by
the City Council on July 12, 2016 by Resolution Number R-2016-762
https://www.sandiego.gov/sustainability/climate-action-plan
CARE California Alternative Rates for Energy
CCA Community Choice Aggregation
CEC California Energy Commission
CI Confidence Interval
City City of San Diego
COS Cost of Service
CPP Critical Peak Pricing
CPUC California Public Utilities Commission
CRS Cost Responsibility Surcharge
CTC Competitive Transition Charge

GLOSSARY
City of San Diego Community Choice Aggregate Feasibility Study Appendices-ii| P a g e
D
DA Direct Access—customers receiving energy from an alternative non-
Investor Owned Utility supplier.
DAM Day Ahead Market
DG Distributed Generation
DR Demand Response
DSM Demand Side Management
DWR-BC Department of Water Resources Bond Charge
E
EDI Electronic Data Interchange
EE Energy Efficiency
EIA Energy Information Administration
EnerNex EnerNex LLC, consultant retained by the City for purposes of this Study
EPRI Electric Power Research Institute
ESP Electric Service Provider excluding Investor Owned Utilities
F
FTE Full Time Equivalent
G
GHG Greenhouse Gas
GWh Gigawatt Hour
I
IMPLAN I/O IMPLAN Group LLC’s Input-Output Multiplier Model
IOU Investor Owned Utility
J
JEDI National Renewable Energy Laboratory Jobs and Economic
Development Impact Model
JPA Joint Powers Authority
K
kW Kilowatts
kWh Kilowatt Hours
GLOSSARY
City of San Diego Community Choice Aggregate Feasibility Study Appendices-iii| P a g e
L
LCE Lancaster Choice Energy
LMP Locational Marginal Prices
LSE Load Serving Entity, including Investor Owned Utilities, Electric Service
Providers, and CCA programs.
LTPP Long Term Procurement Plan
M
MMBTU Million British Thermal Units
MCE MCE Clean Energy formerly Marin Clean Energy
MCSM Monte Carlo Simulation Model
MEA Marin Energy Authority, formed through a Joint Powers Agreement
among municipalities which later established MCE Clean Energy
MMT Millions of Metric Tons
MW Megawatts, represents power or capacity or demand
MWh Megawatt Hours, represents electric energy
N
NPV Net Present Value
NREL National Renewable Energy Laboratory
O
OASIS Open Access Same-time Information System
Opt Out The portion of customers declining to join the Community Choice
Aggregation program. Also referred to as opt-out.
Opt Up The portion of CCA customers selecting 100% renewable portfolio
content energy.
P
PCIA Power Charge Indifference Adjustment
Period CCA fifteen-year timeline evaluated in the study from 2020 through
2035.
PEV Plug-in Electric Vehicle
PG&E Pacific Gas & Electric
POC Report Community Choice Energy in the City of San Diego: An Initial Assessment
of Program Prospects, prepared by Protect Our Communities
Foundation, September 25, 2015.
PPA Purchase Power Agreement
PV Photovoltaic

GLOSSARY
City of San Diego Community Choice Aggregate Feasibility Study Appendices-iv| P a g e
R
RA Resource Adequacy
REC Renewable Energy Certificate or Credit
RPC Renewable Portfolio Content
RPS Renewable Portfolio Standard
RTM Real Time Market
S
SCE Southern California Edison
Scenarios Analyses defined for the feasibility study based on levels of renewable
energy content in the CCA portfolio: Base Case - 50% renewables for
base load customers and 2% opting up to 100% renewable content;
Scenario 2 – 50% renewable content for all customers; Scenario 3 – 80%
renewable content for all customers; Scenario 4 – 100% renewable
content for all customers; and Scenario 5 - 80% renewables for base load
customers and 2% opting up to 100% renewable content.
SDG&E San Diego Gas & Electric, made up of bundled service customers
SEAB City of San Diego Sustainable Energy Advisory Board
Sensitivity Analyses What-if evaluation of the impact on study results based on changes in
the base assumptions: Sensitivity 1 – 6% increase in SDG&E rates;
Sensitivity 2 – 2% decrease in SDG&E rates; Sensitivity 3 – 10% increase
in Power Charge Indifference Adjustment; Sensitivity 4 – 2.5 % decrease
in Power Charge Indifference Adjustment; Sensitivity 5 – 25% Opt Out
Rate, Sensitivity 6 – 15% Opt Out Rate.
State The State of California
Study This City of San Diego Community Choice Aggregate Feasibility Study,
Final Draft, July 2017.
Study Team Collectively Willdan Financial Services and EnerNex LLC, consultants
retained by the City for purposes of this Study
T
TOU Time-of-Use
U
UDC Utility Distribution Company
W
Willdan Willdan Financial Services, consultant retained by the City for purposes
of this Study

APPENDIX A
COMMUNITY CHOICE ENERGY IN THE
CITY OF SAN DIEGO: AN INITIAL ASSESSMENT
OF PROGRAM PROSPECTS

This page intentionally left blank.

APPENDIX A COMMUNITY CHOICE ENERGY IN THE CITY OF SAN DIEGO: AN INITIAL
ASSESSMENT OF PROGRAM PROSPECTS

This page intentionally left blank.

COMMUNITY CHOICEA S S E S S M E N T
September 2015
City of San Diego
Appendix A
City of San Diego Community Choice Aggregate Feasibility Study A-1 | Page

Community Choice Energy
In the City of San Diego:
An Initial Assessment of Program Prospects
Prepared for the City of San Diego
by Protect Our Communities Foundation
September 25, 2015
Appendix A
City of San Diego Community Choice Aggregate Feasibility Study A-2 | Page
i
Background and Scope of Report
The Protect Our Communities Foundation (POC) submits this report to the City of San Diego
with technical appendices provided by Community Choice Partners, Inc. (CCPartners). The
report provides a summary of initial economic modeling and analysis for feasibility of a
Community Choice Aggregation (CCA) program in San Diego along with relevant background
information regarding CCA programs in California.
POC is a 501(c)(3) nonprofit organization incorporated in the State of California with a mission
to defend communities and the natural environment in San Diego County, Imperial County, and
northern Baja California and advance energy and environmental solutions through advocacy
and law.
POC initiated a study of a CCA program for San Diego in early 2014 to assess the prospects for
CCA development in the region. POC engaged CCPartners to draft a feasibility study. To
facilitate the study, the Mayor of San Diego requested and received relevant customer usage
data from San Diego Gas and Electric Company (SDG&E). Pursuant to a contract between
CCPartners and the City, the data was provided to CCPartners for its analysis of customer load
patterns and the development of an analysis to determine whether consumer energy rates
through CCA could be competitive.
CCPartners did not submit a full feasibility study to POC. However, in June 2015, CCPartners
presented POC and the City with a “pro forma” analytical model that may be used to evaluate
financial viability and consumer rates at various program sizes, utilizing multiple cost and load
assumptions. CCPartners also provided two model results with different assumptions about
program design.
As an advocacy organization, POC has supported CCA development in the San Diego region and
believes that successful experiences of CCAs in California to date support an optimistic view of
CCA implementation in other California communities. The intent of this report, however, is to
provide a preliminary feasibility assessment for a potential CCA program in the City of San
Diego, with the recommendation that the City conduct additional and more in‐depth analysis as
a practical next step.
Appendix A
City of San Diego Community Choice Aggregate Feasibility Study A-3 | Page
ii
Table of Contents
Page
1.0 Executive Summary .............................................................................................................. 1
2.0 Introduction to CCA ............................................................................................................. 3
3.0 CCA Program Opportunities and Challenges ....................................................................... 4
4.0 CCA Programs in California .................................................................................................. 5
5.0 The Results of the CCPartners Pro Forma ........................................................................... 8
6.0 Additional Analysis Needed ............................................................................................... 10
7.0 Special Considerations in San Diego .................................................................................. 11
8.0 Next Steps .......................................................................................................................... 13
Appendices
A. Glossary of Terms
B. Sample CCA FAQs
C. MCE and SCP Rate Comparisons and Power Content Label
D. MCE 2015/16 Budget
E. CCPartners City of San Diego CCA Pro Forma Cost of Service Model
(residential/commercial)
F. Sample CCA Risk Matrix
Appendix A
City of San Diego Community Choice Aggregate Feasibility Study A-4 | Page

1
1.0 Executive Summary This report provides a summary of initial economic modeling and analysis of the feasibility of a
Community Choice Aggregation (CCA) program in the City of San Diego, also known as
“Community Choice Energy.” CCA programs permit local governments to purchase and develop
energy resources on behalf of local residents and businesses as an alternative to service from
the incumbent investor‐owned utility. Three CCAs are currently operational in
California.Dozens of other local governments throughout the state are exploring CCA as a
strategy to achieve multiple goals, including to provide broader consumer choice and achieve
renewable energy targets set forth in local Climate Action Plans.
The prospects for CCA programs in California have improved significantly in recent years as a
result of a number of factors:
The success of Marin Clean Energy and Sonoma Clean Power in terms of financial
viability and meeting or exceeding public policy objectives;
Favorable wholesale energy market conditions and relatively low‐cost power;
Recognition that a CCA program can be a self‐supporting option for meeting Climate
Action Plan objectives and other public policy goals;
Reduced cost of renewable power and improvements in renewable technologies;
The development of expertise, best practices, and an expanded vendor base to serve
CCA programs.
Existing CCA programs in California – Marin Clean Energy (MCE), Sonoma Clean Power (SCP) and
Lancaster Choice Energy (LCE) – have been successful in procuring cleaner power at lower
electricity rates, providing innovative services, and supporting local economies with new energy
programs and projects. With somewhat different business strategies, California’s operational
CCAs have so far demonstrated the viability of CCA programs and motivated dozens of
California jurisdictions to investigate the prospects for CCA programs. That said, CCA programs
are not without risks. The success of a CCA depends on strong management, appropriately
hedged supply portfolios and community support.
The initial analysis summarized in this report was performed by Community Choice Partners Inc.
(CCPartners). The analysis indicates favorable financial performance for a City of San Diego CCA
given reasonable assumptions about program design, utility rates, market prices and other
factors. It also identifies a challenge that would need special consideration, namely, the impact
on customer rates resulting from the “stranded costs” that SDG&E might experience if a large
portion of customers within the City of San Diego were to take service from a CCA.
Appendix A
City of San Diego Community Choice Aggregate Feasibility Study A-5 | Page
2
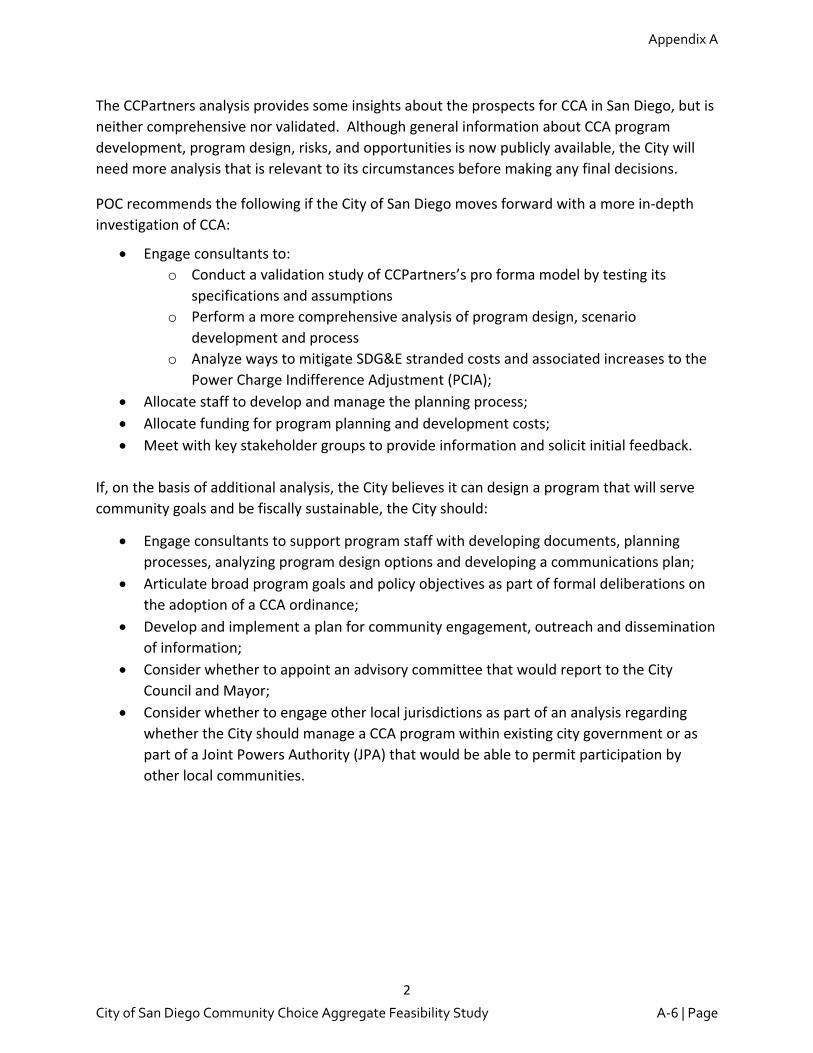
The CCPartners analysis provides some insights about the prospects for CCA in San Diego, but is
neither comprehensive nor validated. Although general information about CCA program
development, program design, risks, and opportunities is now publicly available, the City will
need more analysis that is relevant to its circumstances before making any final decisions.
POC recommends the following if the City of San Diego moves forward with a more in‐depth
investigation of CCA:
Engage consultants to:
o Conduct a validation study of CCPartners’s pro forma model by testing its
specifications and assumptions
o Perform a more comprehensive analysis of program design, scenario
development and process
o Analyze ways to mitigate SDG&E stranded costs and associated increases to the
Power Charge Indifference Adjustment (PCIA);
Allocate staff to develop and manage the planning process;
Allocate funding for program planning and development costs;
Meet with key stakeholder groups to provide information and solicit initial feedback.
If, on the basis of additional analysis, the City believes it can design a program that will serve
community goals and be fiscally sustainable, the City should:
Engage consultants to support program staff with developing documents, planning
processes, analyzing program design options and developing a communications plan;
Articulate broad program goals and policy objectives as part of formal deliberations on
the adoption of a CCA ordinance;
Develop and implement a plan for community engagement, outreach and dissemination
of information;
Consider whether to appoint an advisory committee that would report to the City
Council and Mayor;
Consider whether to engage other local jurisdictions as part of an analysis regarding
whether the City should manage a CCA program within existing city government or as
part of a Joint Powers Authority (JPA) that would be able to permit participation by
other local communities.
Appendix A
City of San Diego Community Choice Aggregate Feasibility Study A-6 | Page

3
2.0 Introduction to CCA
The California Legislature passed AB 117 in 2002 authorizing local jurisdictions to develop CCA
programs that would provide electricity services to local residents and businesses.1 CCA
programs enable local governments to determine the mix of generation resources and related
energy services on behalf of the community. They are distinct from municipal utilities, which
typically own and manage distribution facilities. CCA customers remain customers of the
incumbent utility for distribution and transmission services, as shown in Figure 1. Customers
experience no difference in their energy delivery or billing process.
Figure 1: CCA Power Delivery
(Graphic courtesy of LEAN Energy US)
State law also provides that:
Local governments may create CCA programs with the adoption of an ordinance by the
governing body;
CCA is an “opt‐out” program – customers are automatically enrolled in CCA services but
may choose to remain with the incumbent utility or return to utility service at any time
and they may choose to opt‐out for some accounts and not others;
CCAs must ultimately offer service to all residential customers;
CCAs are subject to the same energy resource policies that apply to the state’s “load
serving entities,” including requirements for renewable portfolio content, resource
adequacy, energy storage and reporting;
1 Appendix A is a Glossary of Terms for terminology used throughout this report. Appendix B is a basic fact sheet about CCA and how it works.
Appendix A
City of San Diego Community Choice Aggregate Feasibility Study A-7 | Page

4
CCA customers must pay a monthly fee called the Power Charge Indifference
Adjustment (PCIA) to assure that customers who remain with the utility are cost‐
indifferent to the CCA serving former utility customers. The CCA must account for this
“exit fee”(also known as a non‐bypassable charge) when designing its own rates.
Although they are not considered regulated public utilities, CCAs are subject to certain
rules and oversight by the California Public Utilities Commission (CPUC);
CCAs are entitled access to utility data regarding customer load by customer class.
3.0 CCA Program Opportunities and Challenges CCA programs offer a number of potential benefits for local communities:
Consumer Choice. CCA programs give consumers an opportunity to choose from among
energy providers. The competition may also spur innovation and a greater variety of
consumer oriented services.
Revenues for Local Economic Development. Revenues from CCA programs remain in the
community, supporting the local economy and jobs. CCA agencies can finance local energy
projects with tax‐exempt bonds and do not have to pay shareholder dividends or large
management salaries, resulting in lower costs and rates.
Environmental Benefits. Local governments can use CCA programs to increase community
reliance on energy supplies with lower greenhouse gas (GHG) emissions. Many local
climate action plans have stressed that a major source of GHG is from power plants that
serve the area’s population, and suggest CCA programs can support progress toward
climate action goals.
New Local Energy Programs. CCA programs can implement energy initiatives, such as
energy efficiency and demand response programs that serve specific community goals.
CCAs may also qualify for substantial funding for such programs from the CPUC.
Rate Stability and Lower Prices. Because CCAs are not profit‐driven, they can promote
strategies, such as demand reduction, that lead to lower and more stable rates over the
long term.
Local Control of Energy Planning and Pricing. CCAs are either public agencies or programs of public agencies with authority to set rates and make decisions about energy services to their customers. As local agencies of government, they are closer to the local public and subject to state laws regarding open processes and transparency. Accordingly, they are more likely to be responsive to local needs and community objectives.
CCA programs also face risks. California law is unclear with regard to the extent to which local governments may be responsible for CCA liabilities. The main risks associated with CCA include:
Appendix A
City of San Diego Community Choice Aggregate Feasibility Study A-8 | Page
5
Market Price Fluctuations. California’s energy markets have been stable for several years, and prices are low. The current buyer’s market is expected to continue for the coming several years because California has excess energy supplies. However, energy markets could change. California law now requires CCAs to hedge their risks by purchasing long term supplies for 65 percent of their supply portfolios by 2021, which could result in higher prices for renewable energy.
Regulatory Risk. In recent years, the CPUC has adopted some proposals for rates and services that have not been favorable to CCAs. Subsequently, regulatory participation by CCAs is essential and must be accounted for as a necessary cost.
Operational and Management Risk. CCA programs operate in complex energy markets and are subject to complicated regulatory requirements. CCA success depends on realistic business strategies and sound management.
Community Outreach and Communication Challenges. Experience in other jurisdictions suggests CCA development and implementation will require communications strategies to assure the program is accepted by local communities and that program design aligns with community goals and expectations. Even with a solid communications strategy, CCA development may meet with opposition. Since passage of SB 790 in 2011, anti‐CCA marketing has subsided to some extent as California statute prohibits utilities from marketing against CCA development.
4.0 CCA Programs in California Currently, California has three operating CCAs, two of which have demonstrated financial
viability, achieved environmental objectives, and provided new services to customers (the third
began operation in May 2015).
The State’s first CCA, Marin Clean Energy, launched in 2010 by serving a portion of Marin County residents and businesses. Today, it serves all of Marin County and unincorporated Napa County, as well as the cities of El Cerrito, Richmond, Benicia, and San Pablo. MCE has purchased electricity from the state’s wholesale market and from local renewable projects. Sonoma’s CCA, Sonoma Clean Power, launched in May 2014 and currently serves all of Sonoma County. It has plans for developing about 90 MW of new renewable power supplies in its service area in partnership with private developers. The City of Lancaster launched Lancaster Choice Energy (LCE) in May 2015 and plans to purchase power from local solar projects, including a 20‐year power‐purchase agreement with sPower recently approved by the Lancaster City Council from the Western Antelope Dry Ranch
Appendix A
City of San Diego Community Choice Aggregate Feasibility Study A-9 | Page

6
project priced at about $55/MWh. Additionally, LCE has announced plans for a large‐scale energy storage project to support greater utilization of locally‐supplied solar energy. Both MCE and SCP are providing energy‐related services such as energy efficiency retrofits, on‐
line energy usage monitoring, community electric vehicle charging stations, on‐bill financing,
and energy storage. MCE and SCP offer customers a 100 percent clean power option sourced
from local renewable resources. SCP and MCE have so far been successful financially, with solid
reserves after making substantial investments in the local community and offering services not
provided by the incumbent utility.
MCE and SCP were established at the county level and are each governed by a Joint Powers
Authority (JPA), which gives them flexibility to add new communities and protects their local
jurisdictions from operational and market risk. LCE is a program of city government. Table 1
summarizes the program elements in California’s three operational CCAs. More information
about these CCAs’ rates, services, financials and greenhouse gas impacts are included in
Appendices C and D.
Appendix A
City of San Diego Community Choice Aggregate Feasibility Study A-10 | Page

7
The success of MCE and SCP has motivated many other California communities to investigate
CCA programs, as shown in Figure 2. Currently, more than 20 counties representing hundreds of
cites are investigating or actively pursuing CCA formation. The County of San Mateo and the
City of San Francisco are among the jurisdictions that are currently planning to launch services
in 2016.
Table 1. Summary of Program Elements ‐ Operational California CCAs
Marin Clean Energy (2010) Sonoma Clean
Power (2014)
Lancaster Choice
Energy (2015)
Customers 165,000 by end of 12/15 ~200,000 56,000 by 10/15
Opt‐Out
Rate
22 percent 11 percent TBD
FY 2015‐16
Budgets
$145,933,097 $165,495,000 $25,000,000
Service
Area
All Marin County; cities of
Richmond, San Pablo, El
Cerrito, Benicia, and
unincorporated Napa Co.
All Sonoma County
and Sonoma
County cities
City of Lancaster
Percentage
RPS
Qualified
50 percent minimum with opt‐
up to 100 percent
33 percent
minimum with
opt‐up to 100
percent
35 percent minimum
with opt‐up to 100
percent
2015
Generation
Rates
On average, 3‐7 percent lower
than PG&E
On average, 6‐9
percent lower than
PG&E; 10‐14
percent less for
low income
customers
On average, 3
percent lower than
Southern California
Edison (SCE)
Appendix A
City of San Diego Community Choice Aggregate Feasibility Study A-11 | Page

8
Figure 2. California Political Jurisdictions with Operational CCAs or that Are Evaluating CCA
(Chart courtesy of LEAN Energy US, dated May 2015)
5.0 The Results of the CCPartners Pro Forma The CCPartners pro forma provides a snapshot of the financial viability of a City of
San Diego CCA program based on certain strategies and using specific assumptions. The
modeling conducted by CCPartners for POC analyzes a City of San Diego CCA program in its first
three years of operation with the following program strategies:
Initial program launch in April 2016;
Initial service offered to 45 percent of residential and medium commercial customers,
and 100 percent of all other commercial customers;
A supply portfolio comprised of 33 percent renewable energy resources with no
unbundled “RECs”;
A net energy metering program that pays $.01 more than retail for local renewable
energy supplies;
$3 million allocated to CCA programs such as energy efficiency, demand response or
feed in tariffs;
Customer generation rates that are 5 percent lower than SDG&E’s, net of the PCIA exit
fee.
Appendix A
City of San Diego Community Choice Aggregate Feasibility Study A-12 | Page

9
According to CCPartners, the model includes the following assumptions:
First year program costs of $9 million for management costs, consulting fees, regulatory
compliance and customer outreach, a cost higher than reported results for MCE and
SCP;
A PCIA “exit fee” (non‐bypassable charge) of $.01/kWh, based on SDG&E’s methodology
for calculating the PCIA (and higher than the current tariffed rate of $.008/kWh);
Wholesale energy prices that are consistent with the 2015 market forecasts of the
California Energy Commission;
Customer demand of approximately 2,600 gigawatt‐hours (GWh) in the first year,
growing to about 3,400 GWh in the second and third years;
Customer load profiles that are derived from and consistent with 2013 SDG&E‐supplied
customer data for 2013;
SDG&E generation rate increases according to an escalator from E3’s GHG calculator;
A 20 percent “opt‐out” rate, higher than either of the actual opt‐out rates in MCE or
SCP;
First year financing for energy purchases and other costs of approximately $50 million
with full repayment within 12 months.
Using these assumptions, the CCPartners pro forma suggests the City’s CCA could offer
generation rates at a 5 percent discount with a product offering that is comparable to SDG&E’s
existing renewable energy portfolio, with the modeled portfolio achieving the state’s
Renewable Portfolio Standard (RPS) 2020 requirements in the CCA’s second year of operation.
The pro forma results suggest the City would have substantial funds for local energy programs
and an adequate reserve at the end of the first year after paying off first year debt. Specifically,
the pro forma shows a fund balance of about $60 million on gross revenues of approximately
$222 million. The fund balance would increase to about $176 million by the third year,
assuming no additional investment in local energy projects or programs. The CCPartners
spreadsheet analysis is provided in Appendix E.
CCPartners also analyzed the financials assuming service to all commercial customers but no
residential customers in the first three years. The results are slightly more advantageous, with
a 10 percent rate discount and a fund balance of $206 million by the third year. This program
design would need to be short‐term because of California’s statutory requirement that the CCA
offer service to all residential customers. Although the law does not provide a timeline for the
service, the City would likely consider including some residential customers in the first three
years of the program to maintain broad public support.
Appendix A
City of San Diego Community Choice Aggregate Feasibility Study A-13 | Page

10
While a comprehensive review of CCPartners modeling results has not been conducted by POC,
the CCPartners financial projections appear to rely on reasonable assumptions. For example,
the opt‐out rate is conservative as it is higher than actual opt‐out rates in operational CCA
jurisdictions. The SDG&E rate assumptions and market prices appear to be based on accepted
forecasts.
The first year margin of about 27 percent is higher than actual margins of existing CCAs, which
have so far been less than 15 percent. However, the lower MCE and SCP results might be
expected since: (1) both CCAs have a higher proportion of more expensive renewable content
in their portfolios than assumed in the CCPartners analysis for San Diego’s program, (2) both
CCAs have made proportionately larger investments in local energy programs and projects that
would have the effect of reducing their respective fund balances, and (3) SDG&E has the
highest generation rates of any IOU in California, while wholesale market and forward prices for
the region are significantly lower than these rates.
The model assumes a launch date of April 2016. This is not realistic and was not realistic at the
time of the model run in June 2015. However, the April 2016 launch date was chosen so that
the model would provide an “apples to apples” generation rate comparison with SDG&E under
current market conditions. A model run with updated information would undoubtedly change
the outcomes, although it is not obvious in which direction.
6.0 Additional Analysis Needed The results from the CCPartners model are preliminary and are not comprehensive. Although a
high level review of the model suggests both its assumptions and results are reasonable in light
of experiences in other jurisdictions, POC has not tested the way the pro forma model
calculates outcomes or verified every assumption. As noted, the model would have to be
updated closer to when the City plans to launch a CCA.
Additionally the energy landscape is evolving in various ways, such as the RPS target moving
above 33 percent, that are not incorporated into the existing model runs.
The pro forma model can estimate rates and financials for different sets of assumptions about
program design, market conditions, and other metrics, but POC has not performed model runs
with different sets of assumptions. Before making any decisions about whether to proceed with
a CCA program, POC advises the City to consider:
Validation of the CCPartners model assumptions – The CCPartners pro forma model
should be reviewed for the accuracy of every model input and assumption regarding, for
example, SDG&E rates, the PCIA, customer load, commodity cost forecasts, congestion
and resource adequacy prices, and program costs. All of the models inputs will affect its
results;
Appendix A
City of San Diego Community Choice Aggregate Feasibility Study A-14 | Page

11
Validation of the CCPartners model’s functionality – POC has not tested the way the
CCPartners model is specified or its analytical rigor, for example, whether the forecast of
the PCIA changes with differing forecasts of load, and whether changed assumptions
regarding supply costs will be accurately reflected in net margin;
Scenario Development on program design: – More analysis is needed regarding
program design options and customer phase‐in strategies, for example: how a
“commercial customer first” program in the first several years might affect financials;
the schedule for phase‐in of various customer classes and regions, portfolio content,
customer services and build‐out strategies; and how partnerships with other regional
communities might affect program viability;
Sensitivity analysis – The CCPartners model should be run for changes in assumptions
regarding, for example, SDG&E rates, program design, opt‐out rates, market prices,
portfolio composition and load by customer class;
Higher renewable energy levels – The CCPartners model assumed a 33 percent
renewable energy supply portfolio, with no unbundled “RECs,” by 2017; based on
comparable rates of renewable energy in the region, the City may wish to analyze higher
levels of renewable energy supply and various strategies for achieving its targets;
Relevance of 2013 load and customer class data – The CCPartners model relies on data
from 2013, with average customer usage escalated according to CEC load growth
forecasts. Because the City could not expect to launch a program before 2017, the City
may wish to update load data for incorporation in any additional analysis.
7.0 Special Considerations in San Diego The City of San Diego’s customers’ energy demand represents almost half of SDG&E’s total
load. This circumstance, which is so far unique for California CCA programs, has implications for
the CCA’s competitiveness, at least in the near‐term. If the City’s CCA were to serve all San
Diego residents and businesses, SDG&E would have substantial “stranded investments” related
to long‐term energy supply commitments. Related costs are allocated to the CCA’s customers
according to state law in the form of an exit fee (non‐bypassable charge) to the CCA’s
customers. The CPUC regulates this exit fee, which the CPUC and utilities refer to as the PCIA.
Even though customers pay the utility the PCIA, the impact of the PCIA on CCA customers must
be considered in any CCA rate analysis to assure CCA customers do not pay more for CCA
service than they would pay for SD&GE service.
Appendix A
City of San Diego Community Choice Aggregate Feasibility Study A-15 | Page

12
CCPartners preliminary analysis suggests that, because of potential increases to the PCIA as it is
currently structured, CCA rates may not be competitive with SDG&E’s if initial customer
enrollment in the CCA is too large without additional regulatory reform related to how the PCIA
is calculated.
This threshold may occur when SDG&E loses more than about 3,500 GWh of load to the CCA.
This is roughly equal to the amount of energy forecasted to be used in 2016 by 80 percent of all
City of San Diego commercial customers. It is also the amount expected to be used in 2016 by
45 percent of the City’s residential and medium commercial load, plus 80 percent of the small
and large commercial load. This represents a substantial CCA customer base in the first three
years of operation.
Not coincidentally, CCPartners modeled initial CCA programs with these characteristics because
the associated customer class demand forecasts came in just under the 3,500 GWh threshold.
Because of the potential cost impact of substantial increases to the PCIA if there is a large
customer shift in the initial phase, a San Diego CCA could not offer full enrollment at
competitive rates to all San Diego customers during the first three years of the program unless
the CCA is able to negotiate some cost mitigations or develop PCIA mitigating program design
strategies.
This circumstance is a challenge that will require additional analysis and some creative thinking
about how to balance SDG&E’s obligation to provide reliable electric services and the CCA’s
need to offer competitive rates. However, it is important to note that the two established CCAs
in California, MCE and SCP, have incrementally added customers over time. This same approach
would occur with a City of San Diego CCA as the PCIA issue is resolved.
If the City decides to move forward, it should engage both SDG&E and the CPUC in early
discussions about how to plan for a transition to full CCA service to all customer categories. For
example, the CCA may be able to purchase excess power supplies from SDG&E at cost rather
than going out into the wholesale market, which would reduce SDG&E’s liability and mitigate
increases to the PCIA. In both modeled scenarios, the fund balance by the second year is
substantial, which could be used to mitigate PCIA impacts. SDG&E may be able to renegotiate
some of its contracts or sell power in wholesale markets to mitigate losses.
CPUC policy already requires that SDG&E develop realistic assumptions about “departing load”
in developing its long and medium term power supply strategies. SDG&E and the City may be
Appendix A
City of San Diego Community Choice Aggregate Feasibility Study A-16 | Page

13
able to agree on procedures to facilitate good planning, such as a notification process or
schedule that provides some assurance to SDG&E regarding its future service obligations.
The City can accommodate this period of transition and mitigate cost impacts by phasing‐in
customer participation. California law does not specify a timeline for offering service to all
residential customers. Any reasonable timeframe may be acceptable, especially if the reason
for postponing expansion of the CCA customer base is to protect customers from higher rates in
a program that requires customers to affirmatively opt‐out.
8.0 Next Steps If the City of San Diego decides to move ahead with the next stage of CCA investigation, it
should:
Engage consultants to conduct a validation study of CCPartners pro forma model results
by testing its specifications and assumptions; perform more comprehensive analysis of
program design, scenario development and process; and analyze ways to mitigate
SDG&E stranded costs and associated increases to the PCIA;
Allocate staff to develop and manage the planning process;
Allocate funding for program planning and development costs;
Meet with key stakeholder groups to provide information and solicit initial feedback.
If, on the basis of additional analysis, the City believes it can design a CCA program that will
serve community goals and be sustainable, the City should:
Engage consultants to support program staff with developing planning documents,
analyzing program design options and developing a communications plan;
Articulate broad program goals and policy objectives as part of formal deliberations on
the adoption of a CCA ordinance;
Develop and implement a plan for community engagement, outreach and dissemination
of information;
Consider whether to appoint an advisory committee that would report to the City
Council and Mayor;
Consider whether to engage other local jurisdictions as part of an analysis regarding
whether the City should manage a CCA program within existing city government or as
part of a JPA that would be able to permit participation by other local communities.
Appendix A
City of San Diego Community Choice Aggregate Feasibility Study A-17 | Page

14
APPENDIX A
GLOSSARY OF TERMS
Term Meaning
Behind‐the‐meter Refers to energy efficiency or electricity generation that takes place on the customer side of the electricity meter rather than on the utility/grid side.
California Public Utilities Commission (CPUC)
California’s State agency in charge of regulating investor‐owned utilities.
Community Choice Aggregation (CCA)
The legal term used in AB 117 and by the CPUC for programs herein referred to as Community Choice Energy. As authorized by statute, CCA allows local governments to pool the municipal, residential and commercial electrical load within their municipalit(ies) for the purpose of procuring and developing power on their behalf.
Demand response Technology that lowers electricity demand (or consumption) in response to shortages in the available supply of electricity.
Direct Access A program that permits utility customers to purchase power supplies from a provider other than the incumbent utility; CCA programs are not considered direct access
Feed‐in tariff A standard power contract, usually for small projects 1MW or less, that requires the utility to pay a set amount for generated renewable electricity for a set number of years, depending on technology.
Greenhouse gas (GHG) A gas that causes the atmosphere to trap heat radiating from the earth. The most common GHG is Carbon Dioxide, though Methane and others have this effect.
MWh (megawatt‐hour) A unit of electrical energy that is produced or consumed= to 1,000 kilowatt hours. Thus, 8,000 kwh = 8 MWh.
Implementation Plan A plan CCAs must present to the CPUC for its certification and review for consistency with state law and CPUC rules
Investor‐owned utility A privately‐owned power distribution company, such as Pacific Gas and Electric (PG&E), that in California is regulated by the CPUC.
Joint powers authority (JPA) An entity permitted under the laws of some states, whereby two or more public authorities (for example, local governments, or special districts) can operate collectively.
Electric Load The amount of electricity a customer or group of customers uses; also referred to as “demand.”
Load‐serving entity A firm or organization that purchases electricity on behalf of any customer or group of customers. Once formed, a CCA is considered a load serving entity.
MW (megawatt) A unit of electrical power equal to 1 million watts that expresses the capacity (or power rating) of power plants or consuming devices. As a unit of capacity, a MW is distinct from a MWH, which is a unit of electricity. For example, a solar plant with a capacity of 1 MW will – running at fully capacity – produce a MWH of electricity in one hour.
Microgrid A local, small scale power grid that can operate independently of or in conjunction with the central utility system.
Appendix A
City of San Diego Community Choice Aggregate Feasibility Study A-18 | Page

15
Net metering A state‐mandated program through which utility customers with behind‐the‐meter renewable generating facilities smaller than 1 MW can receive bill credit for power not used on‐site and delivered to the grid (causing the meter to run backwards).
PCIA or “exit fee”
(nonbypassable charge)
Power Charge Indifference Adjustment (PCIA) is a nonbypassable charge based on stranded costs of utility generation set by the California Public Utilities Commission. It is calculated annually and assessed to customers who take service from an electric generation provider (e.g. CCA) other than the incumbent utility.
Peak load The electrical power demand at that time, over the course of a year and during the day, when electricity consumption is greatest.
Power Purchase Agreement (PPA)
Term for energy supply contract
Renewable energy certificate (REC)
A certificate of proof that one MWh of electricity was generated and delivered to the grid by an eligible renewable energy resource. A REC can be sold together with the underlying energy or “unbundled,” and sold separately.
Renewable portfolio standard (RPS)
Law that requires CA utilities and other load serving entities (including CCAs) to provide an escalating percentage of CA qualified renewable power (culminating at 33 percent by 2020) in their annual energy portfolio.
Community shared solar An arrangement by which many electricity customers in a community may each own a portion of a solar PV generating facility, and therefore receive a share of the electricity and/or revenue it generates.
Smart grid An electricity supply network that uses electronic communications and management systems to respond to changes in system requirements.
Solar PV A solar electricity generating technology in which solar energy is transformed into electricity through a photovoltaic (PV) effect.
Unbundled RECs Renewable energy certificates that verify a purchase of a MWH unit of renewable power where the actual power and the certificate are “unbundled” and sold to different buyers.
(Courtesy of LEAN Energy US)
Appendix A
City of San Diego Community Choice Aggregate Feasibility Study A-19 | Page

16
APPENDIX B
SAMPLE CCA FAQ SHEET: PREPARED FOR SILICON VALLEY/SANTA CLARA (courtesy of LEAN ENERGY US)
Community Choice Energy (CCA) Frequently Asked Questions
What is Community Choice Energy? Community Choice Energy (CCA) is a program that enables
city and county governments to pool (or aggregate) the electricity demand of their communities for the purpose of supplying electricity. A CCA buys and/or develops power on behalf of the residents, business, and government electricity users in its jurisdiction. The electricity continues to be distributed and delivered over the existing electricity lines by the incumbent utility‐which is Pacific Gas and Electric (PG&E) in Northern California.
How will CCA be administered in Silicon Valley/Santa Clara County? The CCA program will be administered by a joint powers agency that serves as a public, non‐profit agency on behalf of municipalities that choose to participate in the CCA. It is important to note that through the JPA structure, the assets and liabilities of the JPA remain separate from those of the County or City general funds. Thus, any surplus funds generated by the CCA will be reinvested back into the community in the form of new energy projects and programs and will not flow back into the general funds of the JPA’s member jurisdictions.
How are CCA’s funded? All CCAs, once they are operational, are completely ratepayer funded and are not subsidized by taxpayer dollars. Ratepayer revenues for electrical generation services currently go to the incumbent utility (PG&E), but would be re‐directed to the CCA program which would become the County’s default provider of electrical generation services.
Why are so many local governments considering CCA? CCAs provide consumer choice where none currently exists and have also resulted in lower electrical generation rates.2 In addition,
2 http://www.mcecleanenergy.org/residential‐rates/
Appendix A
City of San Diego Community Choice Aggregate Feasibility Study A-20 | Page

17
CCAs provide communities with local control over their energy supply, allowing them to increase the amount of electricity procured from renewable sources, such as solar, wind, and geothermal. CCAs can also develop innovative energy programs tailored specifically to their communities and support the development of local renewable energy projects. Finally, CCAs introduce competition into the energy market, which helps drive costs down, stimulate new energy investments, and diversify power choices. Customers in a CCA jurisdiction can choose to stay with the CCA program or return to PG&E’s generation service; customers always have the power to choose.
What are the economic advantages of CCA? In addition to the potential for customer rate savings and the economic value of ratepayer revenues serving our community rather than a utility territory ten times our size, CCAs can aCCAlerate the development of local renewable energy projects and facilitate other energy innovations such as energy efficiency retrofits, home area networks, battery storage and EV charging stations to name a few. This translates into the potential for new local services and consumer benefits as well as significant regional and local job creation. It should be noted that renewable energy facilities provide many more jobs per unit of investment than traditional natural gas and coal plants.3
What are the environmental advantages of CCA? CCAs can choose to purchase from and develop electricity sources that are more heavily weighted towards renewable energy and carbon free power resources. The production and burning of traditional energy sources, such as coal and natural gas, generates large amounts of GHG emissions into the atmosphere. These GHG emissions are a leading cause of pollution and climate change.
How does this relate to my city’s Climate Action Plan? Many cities and counties now have “Climate Action Plans” that outline various measures that the city or county can take to reduce its GHG emissions and conserve natural resources. In Santa Clara County, electricity consumption is a main source of GHG emissions. Joining a CCA is one way jurisdictions in the county can reduce their GHG emissions from electricity and meet their local climate goals.
Has this been done in other areas and what are the results? There are two CCA programs up and running in California: Marin Clean Energy (MCE) in Marin County and Sonoma Clean Power (SCP) in Sonoma County. Both MCE and SCP offer their customers 10‐30 percent more renewable energy than PG&E at prices that are competitive and currently lower than PG&E’s rates. MCE and SCP are now actively procuring and co‐developing in‐State and local renewable resources and offering specialized energy programs designed for their local service areas. A third CCA in the City of Lancaster will begin serving customers in May, 2015 and there are many local governments in California currently investigating CCA’s potential for their communities.
If a CCA is formed in Silicon Valley/Santa Clara County, what is PG&E’s role? If a CCA forms in Santa Clara County, the CCA would be responsible for buying and/or developing all the electricity required to meet the demands of its customers. Customers who choose to opt‐out of the CCA would continue to have PG&E buy their electricity. All customers, whether they are a part of the CCA not, continue to pay PG&E for transmission and distribution services and receive
http://sonomacleanpower.org/for‐my‐home/rates/ 3 Pollin, Robert.2012, Economic prospects‐getting real on jobs and the environment: pipelines, fracking or clean energy?, New Labor Forum 21(3):84‐87.
Appendix A
City of San Diego Community Choice Aggregate Feasibility Study A-21 | Page
18
a single, consolidated bill from PG&E. The only difference between a CCA and PG&E customer’s bill is the source of electricity and line‐item charge for energy generation.
If the power goes out, will PG&E still fix a CCA customer’s outage problem? Yes, PG&E continues to provide the same delivery, line maintenance, and customer services regardless of whether that home or business is part of the CCA program.
If I join a CCA, will my electricity rates go up? A technical study will examine the impacts of a CCA on rates, but so far, CCA electrical rates have generally been 5 ‐ 8 percent lower than PG&E‘s rates. This is dependent on the customer class and the particular CCA option each customer chooses. Current CCAs offer a “default” option that is both cleaner and cheaper than PG&E, as well as a 100% renewable energy option that is slightly more expensive than PG&E’s default product. In addition, CCAs have the added advantage of price stability. While PG&E rates change several times a year, CCA rates generally adjust once per year, offering a measure of rate stability for CCA customers. While there is no guarantee that CCA generation rates will always be lower than PG&E’s generation rates, CCAs do have the advantage of being small, non‐profit agencies that pay no shareholder dividends, high corporate salaries, or income taxes like investor‐owned utilities do.
How does a CCA procure electricity? A CCA must submit a plan to the California Public Utilities Commission (CPUC) that specifies how it will purchase 115 percent of the estimated electricity demand for its area for a period of one year. Once the plan is approved, CCAs negotiate the purchase of electricity for its service area on the open energy market by entering in power purchase agreements (PPAs) with energy providers. These PPAs can be long or short term, depending on the needs of the CCA and type of energy being provided. A CCA can also sponsor a bidding process whereby project developers can bid to build new electricity sources solely for CCA customers. Through a utility service agreement, the power a CCA procures is transmitted over PG&E’s power lines.
Do the electrons purchased or generated by the CCA actually go to my house? No, when we
say that the CCA supplies power to customers, we mean that the CCA puts the same amount of
electricity onto the grid that its customers use. When the individual electrons from all power
resources go onto the grid no one can determine which electrons go where. Think of it as
depositing $100 in one ATM and taking out $100 in another. It’s not the same $100 bill, but it’s
still your money. One can think of electricity in the same way. If you consume 500 kilowatt‐
hours in a month, the CCA must supply 500 kWH to the grid on your behalf. The advantage of a
CCA is that what’s supplied to the grid on your behalf can be both cleaner and less expensive
than what PG&E is putting on the grid.
How is a CCA program set up? Local governments must pass an ordinance to join a CCA
program, and the CCA agency must draft an Implementation Plan that is approved by the CPUC.
This is typically done after an initial technical study to determine the amount of electricity that
will be required and to examine a CCA’s ability to be cost competitive with PG&E. The
Implementation Plan outlines how the CCA will function, how it will set rates, how it will procure
electricity, and how it will carry out all other functions required under CPUC regulations.
Appendix A
City of San Diego Community Choice Aggregate Feasibility Study A-22 | Page

19
I have heard that CCAs are “opt‐out” programs. What does that mean? When a county or city
decides to create or join a CCA, all customers within that jurisdiction are automatically enrolled
in the CCA; the CCA becomes the default provider of electrical supply. However, any customer
can choose to opt‐out and return to the incumbent utility (PG&E) for generation service at any
time (remember: gas service, electric power delivery and customer billing is always provided by
PG&E). State law requires that customers receive several notifications to opt‐out just before
and just after a CCA program launches. At any time after that initial launch period, a CCA
customer can return to the incumbent utility’s service for a small administration fee.
What is the governance structure of a CCA? There is no law regulating how the how the
governing body a CCA should be structured, so each CCA is a little different. Most CCAs are
governed under a Joint Powers Agreement by a Board of Directors. The Board of Directors is
usually comprised of a representative from each member city (and the county) within the CCA
jurisdiction. The Board sets the CCA’s policies and electricity rates. A CCA may also have an
advisory committee made up of representatives from other stakeholder groups, such as local
businesses and community organizations. CCAs also employ a small staff to run the day‐to‐day
operations of the program and interface with CCA customers. As a public agency, the CCA
process is designed to be very transparent with all meetings and information open to the public.
If I installed solar panels on my home or business, would I need a Power Purchase Agreement
to sell our excess energy to a CCA? No. This is called net metering, and the CCA would be able
to offer property owners fair market rates for their excess energy production without a
Purchase Power Agreement, even if that solar installation took place before the CCA launched.
CCAs have been able to offer better net metering rates for customers who generate surplus
electricity, and those customers would automatically be enrolled into a CCA’s net metering
program, unless they choose to opt‐out and remain with PG&E. Larger solar projects that are
“in front of the meter” can also be facilitated under a CCA’s feed‐in‐tariff program which uses a
standard power contract with set prices to buy all the power generated from that facility on
behalf of CCA customers.
Are there other websites/resources I can check out? Yes.
For information about Marin’s CCA program, go to www.mcecleanenergy.com
For information Sonoma’s CCA program, go to www.sonomacleanpower.org.
For general information about CCA, go to www.leanenergyus.org.
I want to learn more about the Silicon Valley Community Choice Energy Partnership. Who can
I contact? For more information and contact information, please visit…..
Appendix A
City of San Diego Community Choice Aggregate Feasibility Study A-23 | Page

20
APPENDIX C
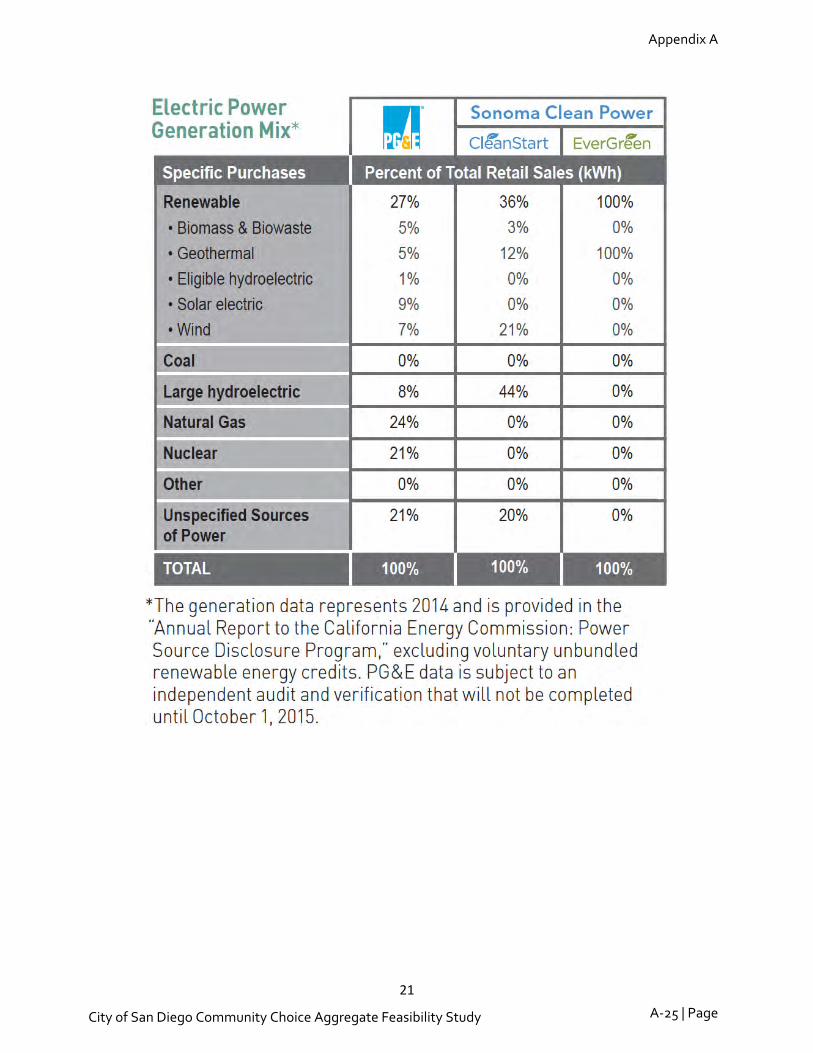
MCE/SCP RATE COMPARISONS AND POWER CONTENT LABELS
Appendix A
City of San Diego Community Choice Aggregate Feasibility Study A-24 | Page
21
Appendix A
City of San Diego Community Choice Aggregate Feasibility Study A-25 | Page

22
APPENDIX D
MCE 2015/2016 OPERATING BUDGET
Appendix A
City of San Diego Community Choice Aggregate Feasibility Study A-26 | Page

CITY
OF SA
N D
IEGO
CO
MM
UN
ITY C
HO
ICE A
GG
REG
ATIO
NProgram
LaunchSH
OR
T TERM
CO
ST OF SER
VIC
E MO
DEL
20162016
20162016
20162016
20162017
2018JA
NFEB
MA
RA
PRM
AY
JUN
Energy R
equirements (M
WH
)LO
AD
AT M
ETER2,643,746
3,394,705
3,409,143
-
-
-
296,190
285,213
284,494
LO
SS AD
JUSTED
LOA
D (LA
L)2,744,078
3,523,601
3,538,588
-
-
-
307,223
295,877
295,204
O
n Peak1,732,169
2,219,956
2,229,398
-
-
-
198,334
187,465
184,448
O
ff Peak1,011,909
1,303,645
1,309,190
-
-
-
108,890
108,413
110,755
B
ILATER
AL C
ON
TRA
CTS &
MA
RK
ET PUR
CH
ASES
On Peak - SP15 (EZG
en)1,795,835
2,282,573
2,292,282
-
-
-
198,238
187,567
184,455
O
ff Peak - SP15 (EZGen)
1,011,718
1,303,404
1,308,948
-
-
-
108,854
108,321
110,805
Market Purchases
108,739
136,355
136,935
-
-
-
12,132
15,445
12,003
Market Sales
172,215
198,731
199,576
-
-
-
12,002
15,456
12,061
RPS C
ategory 1567,084
840,189
843,763
63,009
63,009
63,009
R
PS Category 2
305,353
280,063
281,254
33,928
33,928
33,928
RPS C
ategory 3-
-
-
-
-
-
G
HG
Free-
-
-
-
-
-
E
nergy Prices ($/MW
H)
BA
SE POW
ER PR
ICE
On Peak - SP15 (EZG
en)$40.52
$42.94$45.42
$39.80$40.14
$38.96$37.38
$36.91$36.88
Off Peak - SP15 (EZG
en)$32.52
$34.43$36.35
$33.06$33.16
$32.00$30.53
$28.84$26.49
RPS C
ATEG
OR
Y 1 A
DD
ER$25.00
$25.00$25.00
$25.00$25.00
$25.00$25.00
$25.00$25.00
RPS C
ATEG
OR
Y 2 A
DD
ER$6.00
$6.00$6.00
$6.00$6.00
$6.00$6.00
$6.00$6.00
RPS C
ATEG
OR
Y 3 A
DD
ERC
AR
BO
N FR
EE AD
DER
$3.50$3.50
$3.50$3.50
$3.50$3.50
$3.50$3.50
$3.50E
nergy Costs
ENER
GY
$118,130,103$158,373,736
$168,235,993$0
$0$0
$11,660,087$11,202,360
$10,611,049R
PS & G
HG
FREE A
DD
ERS
$16,009,204$22,685,116
$22,781,601$0
$0$0
$1,778,800$1,778,800
$1,778,800C
AISO
CH
AR
GES &
CO
NG
ESTION
CO
STS$14,735,253
$19,755,143$20,985,336
$0$0
$0$1,454,450
$1,397,354$1,323,596
NET EN
ERG
Y M
ETERIN
G PR
OG
RA
M$679,034
$767,503$794,943
$0$0
$0$45,060
$114,761$151,190
TOTA
L$149,553,593
$201,581,499$212,797,874
$0$0
$0$14,938,398
$14,493,276$13,864,634
RA
Obligations &
Allocations (M
W-M
o)PEA
K M
W (LA
L)5,583
6,949
6,977
-
-
-
655
665
547
PEA
K M
W (C
EC A
DJ. FO
R C
OIN
CID
ENC
E & D
ER)
4,937
6,010
6,034
-
-
-
622
640
488
ZO
NA
L T
OT
AL
(CE
C A
DJ. PE
AK
X 115%
)5,677
6,912
6,939
-
-
-
715
735
562
D
R A
llocation - System-
-
-
-
-
-
-
-
-
D
R A
llocation - San Diego IV
97
105
105
-
-
-
6
11
12
RM
R A
llocation-
-
-
-
-
-
-
-
-
C
AM
Allocation
75
269
1,100
-
-
-
10
8
9
San Diego IV
75
269
1,100
-
-
-
10
8
9
Flex Cap C
ategory 1-
171
1,002
-
-
-
-
-
-
Flex C
ap Category 2
75
98
98
-
-
-
10
8
9
Flex Cap C
ategory 3-
-
-
-
-
-
-
-
-
Z
ON
AL
OB
LIG
AT
ION
(TO
TA
L-R
MR
-CA
M-D
R)
5,505
6,538
5,734
-
-
-
699
716
541
System2,256
2,869
3,003
-
-
-
284
292
223
LC
R - San D
iego IV3,249
3,670
2,731
-
-
-
415
424
318
Flexible
1,268
1,559
735
-
-
-
196
147
92
Category 1
1,008
1,145
319
-
-
-
131
135
87
Category 2
193
323
324
-
-
-
55
4
(1)
Category 3
67
91
92
-
-
-
10
8
5
Generic
4,237
4,979
4,999
-
-
-
503
570
450
Appendix A
City of San Diego Community Choice Aggregate Feasibility Study A-27 | Page

CITY
OF SA
N D
IEGO
CO
MM
UN
ITY C
HO
ICE A
GG
REG
ATIO
NSH
OR
T TERM
CO
ST OF SER
VIC
E MO
DEL
Energy R
equirements (M
WH
)LO
AD
AT M
ETERLO
SS AD
JUSTED
LOA
D (LA
L)O
n PeakO
ff PeakB
ILATER
AL C
ON
TRA
CTS &
MA
RK
ET PUR
CH
ASES
On Peak - SP15 (EZG
en)O
ff Peak - SP15 (EZGen)
Market Purchases
Market Sales
RPS C
ategory 1R
PS Category 2
RPS C
ategory 3G
HG
FreeE
nergy Prices ($/MW
H)
BA
SE POW
ER PR
ICE
On Peak - SP15 (EZG
en)O
ff Peak - SP15 (EZGen)
RPS C
ATEG
OR
Y 1 A
DD
ERR
PS CA
TEGO
RY
2 AD
DER
RPS C
ATEG
OR
Y 3 A
DD
ERC
AR
BO
N FR
EE AD
DER
Energy C
ostsEN
ERG
YR
PS & G
HG
FREE A
DD
ERS
CA
ISO C
HA
RG
ES & C
ON
GESTIO
N C
OSTS
NET EN
ERG
Y M
ETERIN
G PR
OG
RA
MTO
TAL
RA
Obligations &
Allocations (M
W-M
o)PEA
K M
W (LA
L)PEA
K M
W (C
EC A
DJ. FO
R C
OIN
CID
ENC
E & D
ER)
ZO
NA
L T
OT
AL
(CE
C A
DJ. PE
AK
X 115%
)D
R A
llocation - SystemD
R A
llocation - San Diego IV
RM
R A
llocationC
AM
Allocation
San Diego IV
Flex Cap C
ategory 1Flex C
ap Category 2
Flex Cap C
ategory 3Z
ON
AL
OB
LIG
AT
ION
(TO
TA
L-R
MR
-CA
M-D
R)
SystemLC
R - San D
iego IVFlexible
Category 1
Category 2
Category 3
Generic
20162016
20162016
20162016
20172017
20172017
JUL
AU
GSEP
OC
TN
OV
DEC
JAN
FEBM
AR
APR
325,187
291,616
344,171
280,257
262,878
273,741
291,904
268,750
265,019
264,743
337,671
302,906
357,673
290,822
272,579
284,123
303,159
278,951
274,940
274,604
213,859
191,765
226,737
189,723
163,112
176,726
189,198
177,206
170,826
177,276
123,813
111,141
130,936
101,098
109,467
107,397
113,961
101,745
104,114
97,328
235,327
211,004
249,523
189,741
163,188
176,792
189,204
177,114
170,851
177,191
123,823
111,162
130,846
101,013
109,526
107,367
113,924
101,648
104,189
97,297
9,746
8,738
14,068
13,539
11,982
11,086
10,673
10,152
9,990
10,844
31,224
27,997
36,764
13,472
12,118
11,123
10,642
9,964
10,090
10,727
63,009
63,009
63,009
63,009
63,009
63,009
70,016
70,016
70,016
70,016
33,928
33,928
33,928
33,928
33,928
33,928
23,339
23,339
23,339
23,339
-
-
-
-
-
-
-
-
-
-
-
-
-
-
-
-
-
-
-
-
$42.46$43.58
$43.42$43.08
$42.02$41.61
$42.13$42.35
$41.06$39.42
$31.80$33.23
$33.73$35.83
$35.45$36.12
$35.86$36.05
$35.37$31.35
$25.00$25.00
$25.00$25.00
$25.00$25.00
$25.00$25.00
$25.00$25.00
$6.00$6.00
$6.00$6.00
$6.00$6.00
$6.00$6.00
$6.00$6.00
$3.50$3.50
$3.50$3.50
$3.50$3.50
$3.50$3.50
$3.50$3.50
$15,677,445$14,506,594
$17,489,240$12,998,158
$11,784,211$12,200,959
$12,988,352$12,052,291
$11,559,218$10,903,213
$1,778,800$1,778,800
$1,778,800$1,778,800
$1,778,800$1,778,800
$1,890,426$1,890,426
$1,890,426$1,890,426
$1,955,565$1,809,516
$2,181,564$1,621,358
$1,469,933$1,521,917
$1,620,135$1,503,372
$1,441,868$1,360,039
$105,937$124,702
$61,292$57,531
$13,760$4,800
$6,553$9,008
$30,926$48,326
$19,517,748$18,219,612
$21,510,897$16,455,847
$15,046,705$15,506,477
$16,505,466$15,455,097
$14,922,438$14,202,005
667
600
808
594
544
504
530
530
467
585
624
557
719
530
421
336
409
418
399
556
718
640
826
610
484
386
470
480
459
639
-
-
-
-
-
-
-
-
-
-
16
14
19
12
5
3
4
3
3
5
-
-
-
-
-
-
-
-
-
-
8
8
8
7
9
8
8
9
8
9
8
8
8
7
9
8
8
9
8
9
-
-
-
-
-
-
-
-
-
-
8
8
8
7
9
8
8
9
8
9
-
-
-
-
-
-
-
-
-
-
693
618
800
591
471
375
458
468
448
625
285
254
328
242
192
154
195
199
191
265
408
364
471
348
278
222
263
269
257
360
114
100
165
159
161
135
153
155
147
186
107
94
151
106
108
91
103
104
98
123
1
1
5
45
44
37
42
43
41
52
6
5
9
8
8
7
8
8
8
10
579
519
635
431
310
240
305
313
301
439
Appendix A
City of San Diego Community Choice Aggregate Feasibility Study A-28 | Page

CITY
OF SA
N D
IEGO
CO
MM
UN
ITY C
HO
ICE A
GG
REG
ATIO
NSH
OR
T TERM
CO
ST OF SER
VIC
E MO
DEL
Energy R
equirements (M
WH
)LO
AD
AT M
ETERLO
SS AD
JUSTED
LOA
D (LA
L)O
n PeakO
ff PeakB
ILATER
AL C
ON
TRA
CTS &
MA
RK
ET PUR
CH
ASES
On Peak - SP15 (EZG
en)O
ff Peak - SP15 (EZGen)
Market Purchases
Market Sales
RPS C
ategory 1R
PS Category 2
RPS C
ategory 3G
HG
FreeE
nergy Prices ($/MW
H)
BA
SE POW
ER PR
ICE
On Peak - SP15 (EZG
en)O
ff Peak - SP15 (EZGen)
RPS C
ATEG
OR
Y 1 A
DD
ERR
PS CA
TEGO
RY
2 AD
DER
RPS C
ATEG
OR
Y 3 A
DD
ERC
AR
BO
N FR
EE AD
DER
Energy C
ostsEN
ERG
YR
PS & G
HG
FREE A
DD
ERS
CA
ISO C
HA
RG
ES & C
ON
GESTIO
N C
OSTS
NET EN
ERG
Y M
ETERIN
G PR
OG
RA
MTO
TAL
RA
Obligations &
Allocations (M
W-M
o)PEA
K M
W (LA
L)PEA
K M
W (C
EC A
DJ. FO
R C
OIN
CID
ENC
E & D
ER)
ZO
NA
L T
OT
AL
(CE
C A
DJ. PE
AK
X 115%
)D
R A
llocation - SystemD
R A
llocation - San Diego IV
RM
R A
llocationC
AM
Allocation
San Diego IV
Flex Cap C
ategory 1Flex C
ap Category 2
Flex Cap C
ategory 3Z
ON
AL
OB
LIG
AT
ION
(TO
TA
L-R
MR
-CA
M-D
R)
SystemLC
R - San D
iego IVFlexible
Category 1
Category 2
Category 3
Generic
20172017
20172017
20172017
20172017
20182018
MA
YJU
NJU
LA
UG
SEPO
CT
NO
VD
ECJA
NFEB
267,405
276,140
318,538
287,129
340,288
278,439
261,989
274,359
293,146
269,893
277,404
286,535
330,767
298,245
353,638
288,936
271,658
284,764
304,448
280,137
175,760
179,032
209,486
188,815
224,179
188,493
162,561
177,124
190,002
177,960
101,644
107,503
121,281
109,431
129,459
100,443
109,097
107,639
114,446
102,177
175,856
179,039
230,515
207,757
246,708
188,511
162,637
177,191
190,009
177,867
101,558
107,552
121,291
109,451
129,370
100,358
109,156
107,610
114,409
102,080
14,480
11,651
9,547
8,603
13,909
13,452
11,942
11,111
10,719
10,196
14,491
11,706
30,586
27,567
36,349
13,384
12,077
11,148
10,688
10,006
70,016
70,016
70,016
70,016
70,016
70,016
70,016
70,016
70,314
70,314
23,339
23,339
23,339
23,339
23,339
23,339
23,339
23,339
23,438
23,438
-
-
-
-
-
-
-
-
-
-
-
-
-
-
-
-
-
-
-
-
$39.01$39.03
$45.63$46.88
$46.63$44.33
$43.59$45.20
$46.27$45.98
$29.64$27.18
$34.62$36.15
$36.73$37.01
$36.47$36.74
$38.44$37.98
$25.00$25.00
$25.00$25.00
$25.00$25.00
$25.00$25.00
$25.00$25.00
$6.00$6.00
$6.00$6.00
$6.00$6.00
$6.00$6.00
$6.00$6.00
$3.50$3.50
$3.50$3.50
$3.50$3.50
$3.50$3.50
$3.50$3.50
$11,004,803$10,799,767
$16,564,000$15,413,516
$18,645,239$13,304,665
$12,146,686$12,991,986
$14,210,277$13,011,633
$1,890,426$1,890,426
$1,890,426$1,890,426
$1,890,426$1,890,426
$1,890,426$1,890,426
$1,898,467$1,898,467
$1,372,711$1,347,136
$2,066,152$1,922,643
$2,325,760$1,659,591
$1,515,147$1,620,588
$1,772,554$1,623,039
$124,338$160,574
$114,035$131,603
$63,416$59,523
$14,235$4,966
$6,786$9,329
$14,392,278$14,197,904
$20,634,614$19,358,188
$22,924,841$16,914,205
$15,566,495$16,507,966
$17,888,085$16,542,468
624
531
654
591
799
591
543
505
532
532
600
474
612
548
711
527
420
337
410
419
690
546
703
631
818
606
483
387
472
482
-
-
-
-
-
-
-
-
-
-
10
11
16
14
18
12
5
3
4
3
-
-
-
-
-
-
-
-
-
-
8
8
8
7
8
7
99
89
94
98
8
8
8
7
8
7
99
89
94
98
-
-
-
-
-
-
90
81
85
90
8
8
8
7
8
7
9
8
8
9
-
-
-
-
-
-
-
-
-
-
672
526
680
609
791
587
380
295
375
380
286
226
292
262
339
252
200
161
204
209
386
299
388
348
452
335
179
134
170
172
144
92
114
98
171
165
76
59
68
66
132
88
107
92
156
109
21
13
18
15
4
(0)
2
1
6
47
46
39
43
43
8
5
6
5
9
9
9
7
8
8
528
434
565
511
620
422
304
236
306
315
Appendix A
City of San Diego Community Choice Aggregate Feasibility Study A-29 | Page

CITY
OF SA
N D
IEGO
CO
MM
UN
ITY C
HO
ICE A
GG
REG
ATIO
NSH
OR
T TERM
CO
ST OF SER
VIC
E MO
DEL
Energy R
equirements (M
WH
)LO
AD
AT M
ETERLO
SS AD
JUSTED
LOA
D (LA
L)O
n PeakO
ff PeakB
ILATER
AL C
ON
TRA
CTS &
MA
RK
ET PUR
CH
ASES
On Peak - SP15 (EZG
en)O
ff Peak - SP15 (EZGen)
Market Purchases
Market Sales
RPS C
ategory 1R
PS Category 2
RPS C
ategory 3G
HG
FreeE
nergy Prices ($/MW
H)
BA
SE POW
ER PR
ICE
On Peak - SP15 (EZG
en)O
ff Peak - SP15 (EZGen)
RPS C
ATEG
OR
Y 1 A
DD
ERR
PS CA
TEGO
RY
2 AD
DER
RPS C
ATEG
OR
Y 3 A
DD
ERC
AR
BO
N FR
EE AD
DER
Energy C
ostsEN
ERG
YR
PS & G
HG
FREE A
DD
ERS
CA
ISO C
HA
RG
ES & C
ON
GESTIO
N C
OSTS
NET EN
ERG
Y M
ETERIN
G PR
OG
RA
MTO
TAL
RA
Obligations &
Allocations (M
W-M
o)PEA
K M
W (LA
L)PEA
K M
W (C
EC A
DJ. FO
R C
OIN
CID
ENC
E & D
ER)
ZO
NA
L T
OT
AL
(CE
C A
DJ. PE
AK
X 115%
)D
R A
llocation - SystemD
R A
llocation - San Diego IV
RM
R A
llocationC
AM
Allocation
San Diego IV
Flex Cap C
ategory 1Flex C
ap Category 2
Flex Cap C
ategory 3Z
ON
AL
OB
LIG
AT
ION
(TO
TA
L-R
MR
-CA
M-D
R)
SystemLC
R - San D
iego IVFlexible
Category 1
Category 2
Category 3
Generic
20182018
20182018
20182018
20182018
20182018
MA
RA
PRM
AY
JUN
JUL
AU
GSEP
OC
TN
OV
DEC
266,147
265,869
268,543
277,315
319,893
288,351
341,735
279,624
263,104
275,526
276,109
275,772
278,584
287,754
332,174
299,514
355,142
290,165
272,813
285,975
171,552
178,030
176,508
179,794
210,377
189,618
225,133
189,295
163,252
177,878
104,557
97,742
102,076
107,960
121,797
109,896
130,010
100,870
109,561
108,097
171,577
177,945
176,604
179,801
231,495
208,641
247,757
189,313
163,328
177,945
104,632
97,711
101,990
108,009
121,807
109,917
129,920
100,785
109,620
108,067
10,032
10,890
14,542
11,700
9,587
8,640
13,968
13,509
11,993
11,158
10,133
10,773
14,552
11,756
30,716
27,684
36,504
13,441
12,128
11,195
70,314
70,314
70,314
70,314
70,314
70,314
70,314
70,314
70,314
70,314
23,438
23,438
23,438
23,438
23,438
23,438
23,438
23,438
23,438
23,438
-
-
-
-
-
-
-
-
-
-
-
-
-
-
-
-
-
-
-
-
$43.17$41.50
$43.90$46.93
$50.84$49.46
$48.23$42.75
$42.77$43.29
$35.45$33.89
$34.30$33.70
$38.08$37.71
$37.46$35.56
$36.09$37.57
$25.00$25.00
$25.00$25.00
$25.00$25.00
$25.00$25.00
$25.00$25.00
$6.00$6.00
$6.00$6.00
$6.00$6.00
$6.00$6.00
$6.00$6.00
$3.50$3.50
$3.50$3.50
$3.50$3.50
$3.50$3.50
$3.50$3.50
$12,008,109$11,621,196
$12,544,137$13,160,133
$18,464,771$16,277,478
$19,287,345$12,870,129
$12,005,430$12,775,355
$1,898,467$1,898,467
$1,898,467$1,898,467
$1,898,467$1,898,467
$1,898,467$1,898,467
$1,898,467$1,898,467
$1,497,861$1,449,599
$1,564,724$1,641,562
$2,303,249$2,030,412
$2,405,855$1,605,388
$1,497,527$1,593,566
$32,029$50,050
$128,785$166,318
$118,114$136,310
$65,685$61,652
$14,742$5,143
$15,436,465$15,019,312
$16,136,113$16,866,479
$22,784,601$20,342,667
$23,657,351$16,435,636
$15,416,166$16,272,530
469
588
626
533
657
593
802
593
545
507
401
558
602
476
614
550
714
529
422
338
461
642
693
548
706
633
821
609
485
389
-
-
-
-
-
-
-
-
-
-
3
5
10
11
16
14
18
12
5
3
-
-
-
-
-
-
-
-
-
-
89
99
86
94
92
83
93
83
99
89
89
99
86
94
92
83
93
83
99
89
81
90
79
86
84
76
85
75
90
81
8
9
8
8
8
7
8
7
9
8
-
-
-
-
-
-
-
-
-
-
369
537
596
442
598
536
709
514
382
296
199
278
300
237
306
274
355
263
210
168
169
259
296
205
293
262
354
251
172
128
66
96
66
7
31
23
87
90
77
59
17
34
54
2
23
16
72
35
21
13
41
53
4
(0)
2
1
6
47
46
39
8
10
8
5
6
5
9
9
9
7
302
441
530
435
567
513
623
424
305
237
Appendix A
City of San Diego Community Choice Aggregate Feasibility Study A-30 | Page

CITY
OF SA
N D
IEGO
CO
MM
UN
ITY C
HO
ICE A
GG
REG
ATIO
NProgram
LaunchSH
OR
T TERM
CO
ST OF SER
VIC
E MO
DEL
20162016
20162016
20162016
20162017
2018JA
NFEB
MA
RA
PRM
AY
JUN
RA
Prices ($/kW-M
o)SY
STEM$3.46
$3.00$3.09
$0.77$0.56
$0.54$0.59
$0.84$1.63
SAN
DIEG
O IV
$5.17$4.54
$4.78$0.59
$0.38$0.42
$0.44$0.78
$1.72FLEX
AD
DER
$0.00$0.00
$0.00$0.00
$0.00$0.00
$0.00$0.00
$0.00R
A C
ostSY
STEM$7,797,648
$8,609,251$9,282,628
$0$0
$0$166,315
$244,906$362,831
SAN
DIEG
O IV
$16,794,646$16,676,960
$13,041,814$0
$0$0
$180,939$331,968
$547,124FLEX
AD
DER
$0$0
$0$0
$0$0
$0$0
$0TO
TAL C
APA
CITY
CO
ST$24,592,294
$25,286,210$22,324,442
$0$0
$0$347,254
$576,874$909,954
Custom
er Base &
Retail R
atesC
USTO
MER
AC
CO
UN
TSA
gricultural154
137
137
-
-
-
154
146
141
C
omm
ercial/Industrial - Large234
209
209
-
-
-
234
224
216
C
omm
ercial/Industrial - Medium
3,918
3,489
3,489
-
-
-
3,918
3,735
3,608
Com
mercial/Industrial - Sm
all43,800
39,006
39,006
-
-
-
43,800
41,756
40,334
O
utdoor Lighting - Residential
-
-
-
-
-
-
-
-
-
Outdoor Lighting - Sm
all Com
mercial
72
64
64
-
-
-
72
69
66
Residential
209,623
186,682
186,682
-
-
-
209,623
199,844
193,035
Total257,801
229,587
229,587
-
-
-
257,801
245,774
237,400
K
WH
BY
CLA
SS2,643,745,939
3,394,705,030
3,409,143,467
-
-
-
296,189,762
285,212,580
284,494,399
A
gricultural32,716,742
40,863,926
41,037,729
-
-
-
3,819,296
3,514,485
3,602,684
C
omm
ercial/Industrial - Large713,936,062
888,821,637
892,601,993
-
-
-
75,763,706
78,451,373
75,005,605
C
omm
ercial/Industrial - Medium
654,714,656
841,118,602
844,696,067
-
-
-
77,523,000
71,547,576
73,464,501
Com
mercial/Industrial - Sm
all537,984,602
688,830,192
691,759,941
-
-
-
60,949,501
58,517,473
59,016,370
O
utdoor Lighting - Residential
-
-
-
-
-
-
-
-
-
Outdoor Lighting - Sm
all Com
mercial
19,216,627
24,623,950
24,728,681
-
-
-
2,268,043
2,162,866
2,133,135
Residential
685,177,250
910,446,723
914,319,056
-
-
-
75,866,217
71,018,807
71,272,103
Total2,643,745,939
3,394,705,030
3,409,143,467
-
-
-
296,189,762
285,212,580
284,494,399
SD
G&
E CLA
SS AV
ERA
GE W
TD. A
V. R
ATE
Agricultural
$0.08$0.09
$0.09$0.06
$0.06$0.06
$0.06$0.11
$0.11C
omm
ercial/Industrial - Large$0.10
$0.10$0.11
$0.07$0.07
$0.07$0.07
$0.13$0.13
Com
mercial/Industrial - M
edium$0.10
$0.10$0.11
$0.07$0.07
$0.07$0.07
$0.13$0.13
Com
mercial/Industrial - Sm
all$0.10
$0.10$0.10
$0.07$0.07
$0.07$0.07
$0.13$0.13
Outdoor Lighting - R
esidential$0.06
$0.07$0.07
$0.04$0.04
$0.04$0.04
$0.08$0.08
Outdoor Lighting - Sm
all Com
mercial
$0.06$0.07
$0.07$0.04
$0.04$0.04
$0.04$0.08
$0.08R
esidential$0.10
$0.11$0.11
$0.07$0.07
$0.07$0.07
$0.13$0.13
Total$0.11
$0.10$0.11
GR
OSS R
EVEN
UE B
Y C
LASS
Agricultural
$3,021,712$3,571,365
$3,715,262$0
$0$0
$214,545$381,981
$391,568C
omm
ercial/Industrial - Large$81,242,673
$95,695,500$99,551,237
$0$0
$0$5,197,628
$10,413,358$9,955,979
Com
mercial/Industrial - M
edium$73,276,528
$88,348,755$91,908,479
$0$0
$0$5,318,321
$9,496,972$9,751,418
Com
mercial/Industrial - Sm
all$57,842,823
$69,538,281$72,340,098
$0$0
$0$3,999,316
$7,429,292$7,492,631
Outdoor Lighting - R
esidential$0
$0$0
$0$0
$0$0
$0$0
Outdoor Lighting - Sm
all Com
mercial
$1,350,663$1,627,260
$1,692,825$0
$0$0
$98,376$181,515
$179,020R
esidential$77,742,236
$95,924,188$99,789,139
$0$0
$0$5,276,097
$9,556,173$9,590,256
Total$294,476,635
$354,705,350$368,997,040
$0$0
$0$20,104,283
$37,459,291$37,360,871
Appendix A
City of San Diego Community Choice Aggregate Feasibility Study A-31 | Page

CITY
OF SA
N D
IEGO
CO
MM
UN
ITY C
HO
ICE A
GG
REG
ATIO
NSH
OR
T TERM
CO
ST OF SER
VIC
E MO
DEL
RA
Prices ($/kW-M
o)SY
STEMSA
N D
IEGO
IVFLEX
AD
DER
RA
CostSY
STEMSA
N D
IEGO
IVFLEX
AD
DER
TOTA
L CA
PAC
ITY C
OST
Custom
er Base &
Retail R
atesC
USTO
MER
AC
CO
UN
TSA
griculturalC
omm
ercial/Industrial - LargeC
omm
ercial/Industrial - Medium
Com
mercial/Industrial - Sm
allO
utdoor Lighting - Residential
Outdoor Lighting - Sm
all Com
mercial
Residential
TotalK
WH
BY
CLA
SSA
griculturalC
omm
ercial/Industrial - LargeC
omm
ercial/Industrial - Medium
Com
mercial/Industrial - Sm
allO
utdoor Lighting - Residential
Outdoor Lighting - Sm
all Com
mercial
Residential
TotalSD
G&
E CLA
SS AV
ERA
GE W
TD. A
V. R
ATE
Agricultural
Com
mercial/Industrial - Large
Com
mercial/Industrial - M
ediumC
omm
ercial/Industrial - Small
Outdoor Lighting - R
esidentialO
utdoor Lighting - Small C
omm
ercialR
esidentialTotal
GR
OSS R
EVEN
UE B
Y C
LASS
Agricultural
Com
mercial/Industrial - Large
Com
mercial/Industrial - M
ediumC
omm
ercial/Industrial - Small
Outdoor Lighting - R
esidentialO
utdoor Lighting - Small C
omm
ercialR
esidentialTotal
20162016
20162016
20162016
20172017
20172017
JUL
AU
GSEP
OC
TN
OV
DEC
JAN
FEBM
AR
APR
$7.65$9.69
$4.85$1.42
$1.24$1.30
$0.79$0.57
$0.55$0.60
$12.76$16.80
$7.44$1.19
$0.92$1.03
$0.61$0.40
$0.44$0.45
$0.00$0.00
$0.00$0.00
$0.00$0.00
$0.00$0.00
$0.00$0.00
$2,182,688$2,465,350
$1,591,556$345,011
$239,021$199,971
$154,152$114,012
$105,021$160,025
$5,210,202$6,118,913
$3,505,463$415,418
$257,203$227,417
$159,865$106,536
$112,249$161,582
$0$0
$0$0
$0$0
$0$0
$0$0
$7,392,889$8,584,263
$5,097,019$760,429
$496,223$427,388
$314,017$220,548
$217,270$321,607
140
139
139
138
138
137
137
137
137
137
214
213
212
211
210
209
209
209
209
209
3,575
3,557
3,542
3,525
3,514
3,494
3,489
3,489
3,489
3,489
39,967
39,761
39,596
39,405
39,282
39,061
39,006
39,006
39,006
39,006
-
-
-
-
-
-
-
-
-
-
66
65
65
65
64
64
64
64
64
64
191,277
190,294
189,504
188,589
188,002
186,945
186,682
186,682
186,682
186,682
235,239
234,029
233,058
231,933
231,210
229,910
229,587
229,587
229,587
229,587
325,186,767
291,616,056
344,170,618
280,256,627
262,877,764
273,741,366
291,904,393
268,750,107
265,019,446
264,742,575
4,008,410
3,622,027
4,030,008
3,766,641
3,433,683
2,919,509
3,059,837
2,954,991
3,075,667
3,413,792
91,800,209
80,644,746
99,339,532
77,842,048
69,795,037
65,293,807
65,585,828
63,753,453
65,522,673
67,719,689
78,370,030
71,654,571
78,209,604
68,973,855
66,467,462
68,504,058
70,649,082
67,432,832
67,281,628
69,292,195
65,649,508
59,820,927
67,425,713
57,052,029
53,719,388
55,833,693
57,626,798
54,644,897
53,880,431
54,478,344
-
-
-
-
-
-
-
-
-
-
2,122,720
2,102,924
2,101,465
2,130,683
2,096,851
2,097,940
2,257,840
1,595,094
2,108,502
2,027,239
83,235,890
73,770,862
93,064,297
70,491,371
67,365,343
79,092,359
92,725,007
78,368,840
73,150,544
67,811,317
325,186,767
291,616,056
344,170,618
280,256,627
262,877,764
273,741,366
291,904,393
268,750,107
265,019,446
264,742,575
$0.11$0.11
$0.11$0.11
$0.06$0.06
$0.06$0.06
$0.06$0.06
$0.13$0.13
$0.13$0.13
$0.07$0.07
$0.07$0.07
$0.07$0.07
$0.13$0.13
$0.13$0.13
$0.07$0.07
$0.07$0.07
$0.07$0.07
$0.13$0.13
$0.13$0.13
$0.07$0.07
$0.07$0.07
$0.07$0.07
$0.08$0.08
$0.08$0.08
$0.04$0.04
$0.04$0.04
$0.04$0.04
$0.08$0.08
$0.08$0.08
$0.04$0.04
$0.04$0.04
$0.04$0.04
$0.13$0.13
$0.13$0.13
$0.07$0.07
$0.07$0.07
$0.07$0.07
$435,665$393,670
$438,012$409,388
$192,883$164,000
$177,858$171,763
$178,778$198,432
$12,185,235$10,704,498
$13,185,978$10,332,478
$4,788,159$4,479,360
$4,655,796$4,525,720
$4,651,313$4,807,275
$10,402,561$9,511,174
$10,381,266$9,155,346
$4,559,876$4,699,593
$5,015,226$4,786,911
$4,776,178$4,918,903
$8,334,765$7,594,777
$8,560,269$7,243,241
$3,524,899$3,663,633
$3,912,732$3,710,267
$3,658,362$3,698,959
$0$0
$0$0
$0$0
$0$0
$0$0
$178,146$176,484
$176,362$178,814
$90,950$90,997
$101,337$71,592
$94,635$90,987
$11,200,083$9,926,484
$12,522,577$9,485,202
$4,684,906$5,500,458
$6,672,694$5,639,593
$5,264,073$4,879,850
$42,736,454$38,307,088
$45,264,465$36,804,468
$17,841,673$18,598,042
$20,535,643$18,905,846
$18,623,338$18,594,406
Appendix A
City of San Diego Community Choice Aggregate Feasibility Study A-32 | Page

CITY
OF SA
N D
IEGO
CO
MM
UN
ITY C
HO
ICE A
GG
REG
ATIO
NSH
OR
T TERM
CO
ST OF SER
VIC
E MO
DEL
RA
Prices ($/kW-M
o)SY
STEMSA
N D
IEGO
IVFLEX
AD
DER
RA
CostSY
STEMSA
N D
IEGO
IVFLEX
AD
DER
TOTA
L CA
PAC
ITY C
OST
Custom
er Base &
Retail R
atesC
USTO
MER
AC
CO
UN
TSA
griculturalC
omm
ercial/Industrial - LargeC
omm
ercial/Industrial - Medium
Com
mercial/Industrial - Sm
allO
utdoor Lighting - Residential
Outdoor Lighting - Sm
all Com
mercial
Residential
TotalK
WH
BY
CLA
SSA
griculturalC
omm
ercial/Industrial - LargeC
omm
ercial/Industrial - Medium
Com
mercial/Industrial - Sm
allO
utdoor Lighting - Residential
Outdoor Lighting - Sm
all Com
mercial
Residential
TotalSD
G&
E CLA
SS AV
ERA
GE W
TD. A
V. R
ATE
Agricultural
Com
mercial/Industrial - Large
Com
mercial/Industrial - M
ediumC
omm
ercial/Industrial - Small
Outdoor Lighting - R
esidentialO
utdoor Lighting - Small C
omm
ercialR
esidentialTotal
GR
OSS R
EVEN
UE B
Y C
LASS
Agricultural
Com
mercial/Industrial - Large
Com
mercial/Industrial - M
ediumC
omm
ercial/Industrial - Small
Outdoor Lighting - R
esidentialO
utdoor Lighting - Small C
omm
ercialR
esidentialTotal
20172017
20172017
20172017
20172017
20182018
MA
YJU
NJU
LA
UG
SEPO
CT
NO
VD
ECJA
NFEB
$0.86$1.67
$7.88$9.98
$4.99$1.47
$1.28$1.34
$0.81$0.59
$0.81$1.77
$13.15$17.31
$7.66$1.23
$0.95$1.06
$0.63$0.41
$0.00$0.00
$0.00$0.00
$0.00$0.00
$0.00$0.00
$0.00$0.00
$247,176$379,110
$2,301,573$2,613,064
$1,693,947$368,989
$256,431$215,750
$166,209$122,929
$310,887$530,188
$5,095,606$6,015,274
$3,460,508$412,150
$170,480$141,633
$106,671$70,103
$0$0
$0$0
$0$0
$0$0
$0$0
$558,063$909,298
$7,397,180$8,628,338
$5,154,456$781,139
$426,911$357,383
$272,880$193,032
137
137
137
137
137
137
137
137
137
137
209
209
209
209
209
209
209
209
209
209
3,489
3,489
3,489
3,489
3,489
3,489
3,489
3,489
3,489
3,489
39,006
39,006
39,006
39,006
39,006
39,006
39,006
39,006
39,006
39,006
-
-
-
-
-
-
-
-
-
-
64
64
64
64
64
64
64
64
64
64
186,682
186,682
186,682
186,682
186,682
186,682
186,682
186,682
186,682
186,682
229,587
229,587
229,587
229,587
229,587
229,587
229,587
229,587
229,587
229,587
267,405,241
276,140,424
318,537,745
287,129,380
340,287,996
278,439,439
261,989,480
274,358,804
293,145,927
269,893,161
3,295,057
3,496,894
3,926,451
3,566,300
3,984,545
3,742,218
3,422,080
2,926,094
3,072,852
2,967,560
73,553,237
72,803,119
89,923,190
79,403,981
98,218,873
77,337,319
69,559,194
65,441,080
65,864,780
64,024,610
67,080,480
71,307,269
76,767,615
70,552,126
77,327,314
68,526,628
66,242,863
68,658,572
70,949,568
67,719,638
54,863,916
57,283,397
64,307,187
58,900,549
66,665,077
56,682,103
53,537,866
55,959,629
57,871,897
54,877,314
-
-
-
-
-
-
-
-
-
-
2,027,827
2,070,497
2,079,317
2,070,569
2,077,759
2,116,867
2,089,766
2,102,672
2,267,443
1,601,879
66,584,725
69,179,249
81,533,985
72,635,856
92,014,429
70,034,304
67,137,711
79,270,756
93,119,387
78,702,160
267,405,241
276,140,424
318,537,745
287,129,380
340,287,996
278,439,439
261,989,480
274,358,804
293,145,927
269,893,161
$0.11$0.11
$0.11$0.11
$0.11$0.11
$0.06$0.06
$0.06$0.06
$0.14$0.14
$0.14$0.14
$0.14$0.14
$0.07$0.07
$0.07$0.07
$0.14$0.14
$0.14$0.14
$0.14$0.14
$0.07$0.07
$0.07$0.07
$0.13$0.13
$0.13$0.13
$0.13$0.13
$0.07$0.07
$0.07$0.07
$0.09$0.09
$0.09$0.09
$0.09$0.09
$0.04$0.04
$0.05$0.05
$0.09$0.09
$0.09$0.09
$0.09$0.09
$0.04$0.04
$0.05$0.05
$0.14$0.14
$0.14$0.14
$0.14$0.14
$0.07$0.07
$0.07$0.07
$370,581$393,281
$441,591$401,087
$448,125$420,872
$198,914$170,084
$185,024$178,684
$10,102,573$9,999,544
$12,350,995$10,906,176
$13,490,411$10,622,319
$4,937,857$4,645,521
$4,843,386$4,708,069
$9,213,537$9,794,089
$10,544,070$9,690,369
$10,620,945$9,412,166
$4,702,438$4,873,924
$5,217,298$4,979,784
$7,207,566$7,525,418
$8,448,145$7,737,866
$8,757,905$7,446,425
$3,635,102$3,799,535
$4,070,382$3,859,760
$0$0
$0$0
$0$0
$0$0
$0$0
$176,098$179,803
$180,569$179,809
$180,434$183,830
$93,794$94,373
$105,420$74,476
$9,270,971$9,632,221
$11,352,441$10,113,504
$12,811,693$9,751,275
$4,831,376$5,704,497
$6,941,548$5,866,822
$36,341,326$37,524,356
$43,317,811$39,028,811
$46,309,513$37,836,887
$18,399,481$19,287,933
$21,363,059$19,667,595
Appendix A
City of San Diego Community Choice Aggregate Feasibility Study A-33 | Page
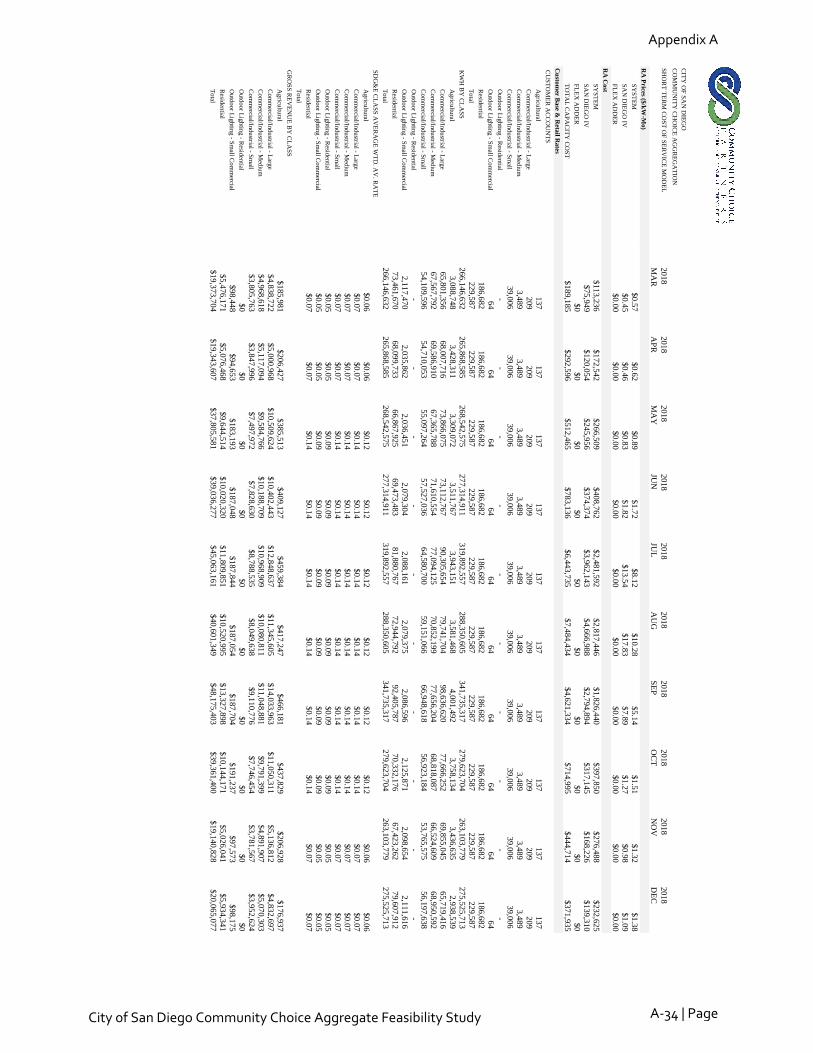
CITY
OF SA
N D
IEGO
CO
MM
UN
ITY C
HO
ICE A
GG
REG
ATIO
NSH
OR
T TERM
CO
ST OF SER
VIC
E MO
DEL
RA
Prices ($/kW-M
o)SY
STEMSA
N D
IEGO
IVFLEX
AD
DER
RA
CostSY
STEMSA
N D
IEGO
IVFLEX
AD
DER
TOTA
L CA
PAC
ITY C
OST
Custom
er Base &
Retail R
atesC
USTO
MER
AC
CO
UN
TSA
griculturalC
omm
ercial/Industrial - LargeC
omm
ercial/Industrial - Medium
Com
mercial/Industrial - Sm
allO
utdoor Lighting - Residential
Outdoor Lighting - Sm
all Com
mercial
Residential
TotalK
WH
BY
CLA
SSA
griculturalC
omm
ercial/Industrial - LargeC
omm
ercial/Industrial - Medium
Com
mercial/Industrial - Sm
allO
utdoor Lighting - Residential
Outdoor Lighting - Sm
all Com
mercial
Residential
TotalSD
G&
E CLA
SS AV
ERA
GE W
TD. A
V. R
ATE
Agricultural
Com
mercial/Industrial - Large
Com
mercial/Industrial - M
ediumC
omm
ercial/Industrial - Small
Outdoor Lighting - R
esidentialO
utdoor Lighting - Small C
omm
ercialR
esidentialTotal
GR
OSS R
EVEN
UE B
Y C
LASS
Agricultural
Com
mercial/Industrial - Large
Com
mercial/Industrial - M
ediumC
omm
ercial/Industrial - Small
Outdoor Lighting - R
esidentialO
utdoor Lighting - Small C
omm
ercialR
esidentialTotal
20182018
20182018
20182018
20182018
20182018
MA
RA
PRM
AY
JUN
JUL
AU
GSEP
OC
TN
OV
DEC
$0.57$0.62
$0.89$1.72
$8.12$10.28
$5.14$1.51
$1.32$1.38
$0.45$0.46
$0.83$1.82
$13.54$17.83
$7.89$1.27
$0.98$1.09
$0.00$0.00
$0.00$0.00
$0.00$0.00
$0.00$0.00
$0.00$0.00
$113,236$172,542
$266,509$408,762
$2,481,592$2,817,446
$1,826,440$397,850
$276,488$232,625
$75,949$120,054
$245,956$374,374
$3,962,143$4,666,988
$2,794,894$317,145
$168,226$139,310
$0$0
$0$0
$0$0
$0$0
$0$0
$189,185$292,596
$512,465$783,136
$6,443,735$7,484,434
$4,621,334$714,995
$444,714$371,935
137
137
137
137
137
137
137
137
137
137
209
209
209
209
209
209
209
209
209
209
3,489
3,489
3,489
3,489
3,489
3,489
3,489
3,489
3,489
3,489
39,006
39,006
39,006
39,006
39,006
39,006
39,006
39,006
39,006
39,006
-
-
-
-
-
-
-
-
-
-
64
64
64
64
64
64
64
64
64
64
186,682
186,682
186,682
186,682
186,682
186,682
186,682
186,682
186,682
186,682
229,587
229,587
229,587
229,587
229,587
229,587
229,587
229,587
229,587
229,587
266,146,632
265,868,585
268,542,575
277,314,911
319,892,557
288,350,605
341,735,317
279,623,704
263,103,779
275,525,713
3,088,748
3,428,311
3,309,072
3,511,767
3,943,151
3,581,468
4,001,492
3,758,134
3,436,635
2,938,539
65,801,356
68,007,716
73,866,075
73,112,767
90,305,654
79,741,704
98,636,620
77,666,252
69,855,045
65,719,416
67,567,792
69,586,910
67,365,788
71,610,554
77,094,125
70,852,199
77,656,204
68,818,087
66,524,609
68,950,592
54,109,596
54,710,053
55,097,264
57,527,036
64,580,700
59,151,066
66,948,618
56,923,184
53,765,575
56,197,638
-
-
-
-
-
-
-
-
-
-
2,117,470
2,035,862
2,036,451
2,079,304
2,088,161
2,079,375
2,086,596
2,125,871
2,098,654
2,111,616
73,461,670
68,099,733
66,867,925
69,473,483
81,880,767
72,944,792
92,405,787
70,332,176
67,423,262
79,607,912
266,146,632
265,868,585
268,542,575
277,314,911
319,892,557
288,350,605
341,735,317
279,623,704
263,103,779
275,525,713
$0.06$0.06
$0.12$0.12
$0.12$0.12
$0.12$0.12
$0.06$0.06
$0.07$0.07
$0.14$0.14
$0.14$0.14
$0.14$0.14
$0.07$0.07
$0.07$0.07
$0.14$0.14
$0.14$0.14
$0.14$0.14
$0.07$0.07
$0.07$0.07
$0.14$0.14
$0.14$0.14
$0.14$0.14
$0.07$0.07
$0.05$0.05
$0.09$0.09
$0.09$0.09
$0.09$0.09
$0.05$0.05
$0.05$0.05
$0.09$0.09
$0.09$0.09
$0.09$0.09
$0.05$0.05
$0.07$0.07
$0.14$0.14
$0.14$0.14
$0.14$0.14
$0.07$0.07
$185,981$206,427
$385,513$409,127
$459,384$417,247
$466,181$437,829
$206,928$176,937
$4,838,722$5,000,968
$10,509,624$10,402,443
$12,848,637$11,345,605
$14,033,963$11,050,311
$5,136,812$4,832,697
$4,968,618$5,117,094
$9,584,766$10,188,709
$10,968,909$10,080,811
$11,048,881$9,791,399
$4,891,907$5,070,303
$3,805,763$3,847,996
$7,497,972$7,828,630
$8,788,535$8,049,638
$9,110,776$7,746,454
$3,781,567$3,952,624
$0$0
$0$0
$0$0
$0$0
$0$0
$98,448$94,653
$183,193$187,048
$187,844$187,054
$187,704$191,237
$97,573$98,175
$5,476,171$5,076,468
$9,644,514$10,020,320
$11,809,851$10,520,995
$13,327,898$10,144,171
$5,026,041$5,934,341
$19,373,704$19,343,607
$37,805,581$39,036,277
$45,063,161$40,601,349
$48,175,403$39,361,400
$19,140,828$20,065,077
Appendix A
City of San Diego Community Choice Aggregate Feasibility Study A-34 | Page

CITY
OF SA
N D
IEGO
CO
MM
UN
ITY C
HO
ICE A
GG
REG
ATIO
NProgram
LaunchSH
OR
T TERM
CO
ST OF SER
VIC
E MO
DEL
20162016
20162016
20162016
20162017
2018JA
NFEB
MA
RA
PRM
AY
JUN
PCIA
CH
AR
GES
Agricultural
$192,343$288,236
$289,462$0
$0$0
$13,520$12,441
$12,754C
omm
ercial/Industrial - Large$5,652,490
$8,376,838$8,412,467
$0$0
$0$358,362
$371,075$354,777
Com
mercial/Industrial - M
edium$5,125,735
$7,927,254$7,960,970
$0$0
$0$366,684
$338,420$347,487
Com
mercial/Industrial - Sm
all$5,503,017
$8,440,957$8,476,858
$0$0
$0$374,839
$359,882$362,951
Outdoor Lighting - R
esidential$0
$0$0
$0$0
$0$0
$0$0
Outdoor Lighting - Sm
all Com
mercial
$195,414$301,743
$303,026$0
$0$0
$13,948$13,302
$13,119R
esidential$5,588,279
$8,580,647$8,617,143
$0$0
$0$412,712
$386,342$387,720
Total$22,257,278
$33,915,675$34,059,926
$0$0
$0$1,540,067
$1,481,463$1,478,807
RA
TE RELIEF
Agricultural
$151,086$178,568
$185,763$0
$0$0
$10,727$19,099
$19,578C
omm
ercial/Industrial - Large$4,062,134
$4,784,775$4,977,562
$0$0
$0$259,881
$520,668$497,799
Com
mercial/Industrial - M
edium$3,663,826
$4,417,438$4,595,424
$0$0
$0$265,916
$474,849$487,571
Com
mercial/Industrial - Sm
all$2,892,141
$3,476,914$3,617,005
$0$0
$0$199,966
$371,465$374,632
Outdoor Lighting - R
esidential$0
$0$0
$0$0
$0$0
$0$0
Outdoor Lighting - Sm
all Com
mercial
$67,533$81,363
$84,641$0
$0$0
$4,919$9,076
$8,951R
esidential$3,887,112
$4,796,209$4,989,457
$0$0
$0$263,805
$477,809$479,513
Total$14,723,832
$17,735,268$18,449,852
$0$0
$0$1,005,214
$1,872,965$1,868,044
CC
A R
EVEN
UE B
Y C
LASS (N
ET OF PC
IA &
RA
TE RELIEF)
Agricultural
$2,678,283$3,104,561
$3,240,037$0
$0$0
$190,297$350,441
$359,236C
omm
ercial/Industrial - Large$71,528,050
$82,533,887$86,161,208
$0$0
$0$4,579,384
$9,521,615$9,103,403
Com
mercial/Industrial - M
edium$64,486,967
$76,004,064$79,352,085
$0$0
$0$4,685,721
$8,683,704$8,916,360
Com
mercial/Industrial - Sm
all$49,447,664
$57,620,410$60,246,235
$0$0
$0$3,424,511
$6,697,945$6,755,049
Outdoor Lighting - R
esidential$0
$0$0
$0$0
$0$0
$0$0
Outdoor Lighting - Sm
all Com
mercial
$1,087,716$1,244,154
$1,305,158$0
$0$0
$79,508$159,137
$156,950R
esidential$68,266,845
$82,547,332$86,182,540
$0$0
$0$4,599,580
$8,692,022$8,723,023
Total$257,495,525
$303,054,408$316,487,262
$0$0
$0$17,559,002
$34,104,864$34,014,021
Cash Flow
Analysis
REV
ENU
E FRO
M O
PERA
TION
SR
evenue - Electricity$223,340,953
$301,911,382$315,109,053
$0$0
$0$0
$0$20,746,079
Less Uncollectible A
ccounts$1,111,149
$1,502,047$1,567,707
$0$0
$0$0
$0-$103,214
Total O
perational Revenue
$222,229,804$300,409,336
$313,541,346$0
$0$0
$0$0
$20,642,864C
OST O
F OPER
ATIO
NS
Wholesale C
omm
odity$142,008,621
$224,718,884$234,681,466
$0$0
$0$0
$0$15,240,591
Net Energy M
etering Program$643,554
$766,776$794,166
$0$0
$0$0
$0$61,957
Retail Services (ED
I/ Billing/ C
ustomer C
are)$3,204,531
$4,132,566$4,132,566
$0$0
$0$386,702
$368,661$356,100
ServicesPersonnel
$4,500,000$4,657,500
$4,820,513$375,000
$375,000$375,000
$375,000$375,000
$375,000O
utreach & C
omm
unications$1,050,000
$1,086,750$1,124,786
$87,500$87,500
$87,500$87,500
$87,500$87,500
Other Professional Services
$2,625,000$2,716,875
$2,811,966$218,750
$218,750$218,750
$218,750$218,750
$218,750G
eneral & A
dministration
$825,000$853,875
$883,761$68,750
$68,750$68,750
$68,750$68,750
$68,750Program
s$3,000,000
$3,105,000$3,213,675
$250,000$250,000
$250,000$250,000
$250,000$250,000
SDG
&E Fees
$2,009,574$1,928,531
$1,928,531$0
$0$463,623
$201,989$187,031
$170,048M
onthly Billing Fees
$534,089$688,761
$688,761$0
$0$0
$64,450$61,444
$59,350C
CA
SR$511,967
$0$0
$0$0
$461,464$21,528
$14,989$3,868
Miscellaneous
$963,518$1,239,770
$1,239,770$0
$0$2,159
$116,010$110,598
$106,830T
otal Operational E
xpenses$159,866,279
$243,966,757$254,391,429
$1,000,000$1,000,000
$1,463,623$1,588,691
$1,555,692$16,828,697
CA
SH FL
OW
S FRO
M O
PER
AT
ING
AC
TIV
ITIE
S$62,363,525
$56,442,579$59,149,917
-$1,000,000-$1,000,000
-$1,463,623-$1,588,691
-$1,555,692$3,814,168
FINA
NC
ING
Deposit from
Financing$50,000,000
$0$0
$50,000,000$0
$0$0
$0$0
Debt Service
Principal$37,500,000
$12,500,000$0
$0$0
$0$0
$0$0
Interest$2,031,250
$20,833$0
$208,333$208,333
$208,333$208,333
$208,333$208,333
Total Debt Service
$39,531,250$12,520,833
$0$208,333
$208,333$208,333
$208,333$208,333
$208,333C
ASH
FLO
WS N
ON
-CA
P FINA
NC
ING
AC
TIV
ITIE
S$10,468,750
-$12,520,833$0
$49,791,667-$208,333
-$208,333-$208,333
-$208,333-$208,333
NE
T C
ASH
FLO
W$72,832,275
$43,921,746$59,149,917
$48,791,667-$1,208,333
-$1,671,956-$1,797,024
-$1,764,026$3,605,834
Appendix A
City of San Diego Community Choice Aggregate Feasibility Study A-35 | Page
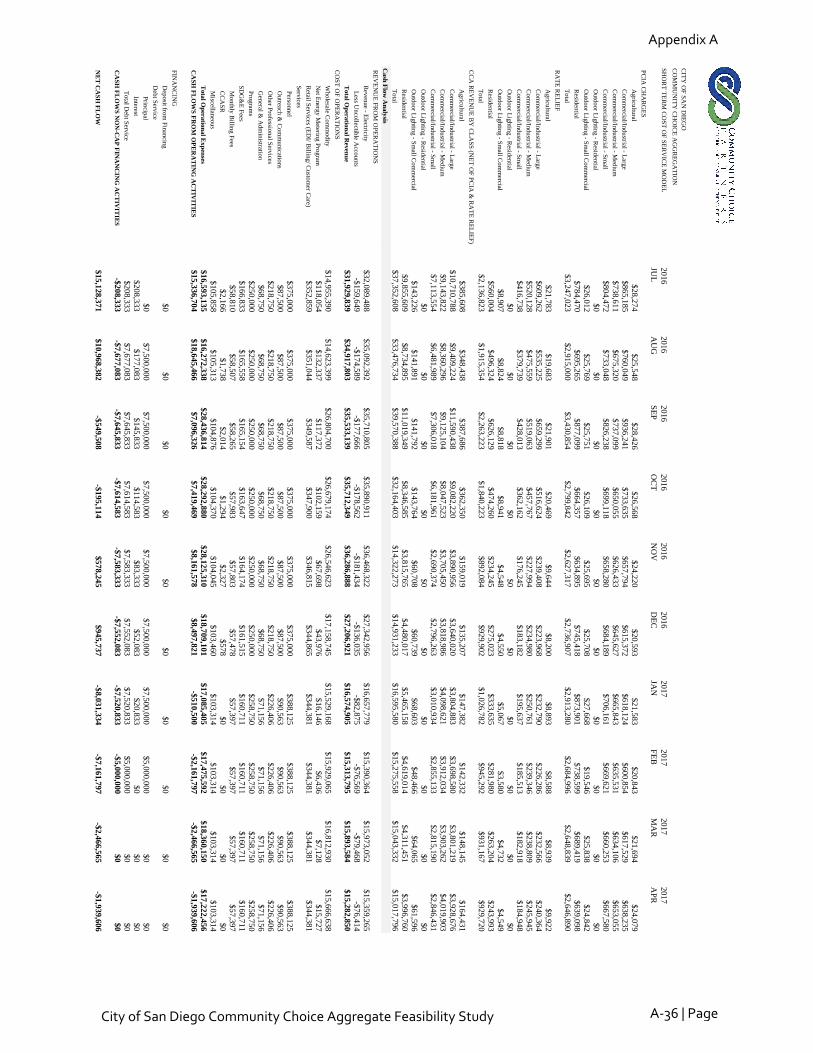
CITY
OF SA
N D
IEGO
CO
MM
UN
ITY C
HO
ICE A
GG
REG
ATIO
NSH
OR
T TERM
CO
ST OF SER
VIC
E MO
DEL
PCIA
CH
AR
GES
Agricultural
Com
mercial/Industrial - Large
Com
mercial/Industrial - M
ediumC
omm
ercial/Industrial - Small
Outdoor Lighting - R
esidentialO
utdoor Lighting - Small C
omm
ercialR
esidentialTotal
RA
TE RELIEF
Agricultural
Com
mercial/Industrial - Large
Com
mercial/Industrial - M
ediumC
omm
ercial/Industrial - Small
Outdoor Lighting - R
esidentialO
utdoor Lighting - Small C
omm
ercialR
esidentialTotal
CC
A R
EVEN
UE B
Y C
LASS (N
ET OF PC
IA &
RA
TE RELIEF)
Agricultural
Com
mercial/Industrial - Large
Com
mercial/Industrial - M
ediumC
omm
ercial/Industrial - Small
Outdoor Lighting - R
esidentialO
utdoor Lighting - Small C
omm
ercialR
esidentialTotal
Cash Flow
Analysis
REV
ENU
E FRO
M O
PERA
TION
SR
evenue - ElectricityLess U
ncollectible Accounts
Total O
perational Revenue
CO
ST OF O
PERA
TION
SW
holesale Com
modity
Net Energy M
etering ProgramR
etail Services (EDI/ B
illing/ Custom
er Care)
ServicesPersonnelO
utreach & C
omm
unicationsO
ther Professional ServicesG
eneral & A
dministration
Programs
SDG
&E Fees
Monthly B
illing FeesC
CA
SRM
iscellaneousT
otal Operational E
xpensesC
ASH
FLO
WS FR
OM
OPE
RA
TIN
G A
CT
IVIT
IES
FINA
NC
ING
Deposit from
FinancingD
ebt ServicePrincipalInterest
Total Debt Service
CA
SH FL
OW
S NO
N-C
AP FIN
AN
CIN
G A
CT
IVIT
IES
NE
T C
ASH
FLO
W
20162016
20162016
20162016
20172017
20172017
JUL
AU
GSEP
OC
TN
OV
DEC
JAN
FEBM
AR
APR
$28,274$25,548
$28,426$26,568
$24,220$20,593
$21,583$20,843
$21,694$24,079
$865,185$760,049
$936,241$733,635
$657,794$615,372
$618,124$600,854
$617,529$638,235
$738,611$675,320
$737,099$650,055
$626,433$645,627
$665,843$635,531
$634,106$653,055
$804,472$733,048
$826,238$699,118
$658,280$684,189
$706,161$669,621
$660,253$667,580
$0$0
$0$0
$0$0
$0$0
$0$0
$26,012$25,769
$25,751$26,109
$25,695$25,708
$27,668$19,546
$25,838$24,842
$784,470$695,265
$877,099$664,357
$634,895$745,418
$873,901$738,599
$689,419$639,098
$3,247,023$2,915,000
$3,430,854$2,799,842
$2,627,317$2,736,907
$2,913,280$2,684,996
$2,648,839$2,646,890
$21,783$19,683
$21,901$20,469
$9,644$8,200
$8,893$8,588
$8,939$9,922
$609,262$535,225
$659,299$516,624
$239,408$223,968
$232,790$226,286
$232,566$240,364
$520,128$475,559
$519,063$457,767
$227,994$234,980
$250,761$239,346
$238,809$245,945
$416,738$379,739
$428,013$362,162
$176,245$183,182
$195,637$185,513
$182,918$184,948
$0$0
$0$0
$0$0
$0$0
$0$0
$8,907$8,824
$8,818$8,941
$4,548$4,550
$5,067$3,580
$4,732$4,549
$560,004$496,324
$626,129$474,260
$234,245$275,023
$333,635$281,980
$263,204$243,993
$2,136,823$1,915,354
$2,263,223$1,840,223
$892,084$929,902
$1,026,782$945,292
$931,167$929,720
$385,608$348,438
$387,686$362,350
$159,019$135,207
$147,382$142,332
$148,145$164,431
$10,710,788$9,409,224
$11,590,438$9,082,220
$3,890,956$3,640,020
$3,804,883$3,698,580
$3,801,219$3,928,676
$9,143,822$8,360,296
$9,125,104$8,047,523
$3,705,450$3,818,986
$4,098,621$3,912,034
$3,903,262$4,019,903
$7,113,554$6,481,989
$7,306,018$6,181,961
$2,690,374$2,796,263
$3,010,934$2,855,133
$2,815,190$2,846,431
$0$0
$0$0
$0$0
$0$0
$0$0
$143,226$141,891
$141,792$143,764
$60,708$60,739
$68,603$48,466
$64,065$61,596
$9,855,609$8,734,895
$11,019,349$8,346,585
$3,815,765$4,480,017
$5,465,158$4,619,014
$4,311,451$3,996,760
$37,352,608$33,476,734
$39,570,388$32,164,403
$14,322,273$14,931,233
$16,595,580$15,275,558
$15,043,332$15,017,796
$32,089,488$35,092,392
$35,710,805$35,890,911
$36,468,322$27,342,956
$16,657,779$15,390,364
$15,973,052$15,359,265
-$159,649-$174,589
-$177,666-$178,562
-$181,434-$136,035
-$82,875-$76,569
-$79,468-$76,414
$31,929,839$34,917,803
$35,533,139$35,712,349
$36,286,888$27,206,921
$16,574,905$15,313,795
$15,893,584$15,282,850
$14,955,390$14,623,399
$26,804,700$26,679,174
$26,546,623$17,158,745
$15,529,168$15,929,065
$16,812,930$15,666,638
$118,054$132,337
$117,372$102,159
$67,698$43,976
$16,146$6,436
$7,128$15,727
$352,859$351,044
$349,587$347,900
$346,815$344,865
$344,381$344,381
$344,381$344,381
$375,000$375,000
$375,000$375,000
$375,000$375,000
$388,125$388,125
$388,125$388,125
$87,500$87,500
$87,500$87,500
$87,500$87,500
$90,563$90,563
$90,563$90,563
$218,750$218,750
$218,750$218,750
$218,750$218,750
$226,406$226,406
$226,406$226,406
$68,750$68,750
$68,750$68,750
$68,750$68,750
$71,156$71,156
$71,156$71,156
$250,000$250,000
$250,000$250,000
$250,000$250,000
$258,750$258,750
$258,750$258,750
$166,833$165,558
$165,154$163,647
$164,174$161,515
$160,711$160,711
$160,711$160,711
$58,810$58,507
$58,265$57,983
$57,803$57,478
$57,397$57,397
$57,397$57,397
$2,166$1,738
$2,014$1,294
$2,327$578
$0$0
$0$0
$105,858$105,313
$104,876$104,370
$104,045$103,460
$103,314$103,314
$103,314$103,314
$16,593,135$16,272,338
$28,436,814$28,292,880
$28,125,310$18,709,101
$17,085,405$17,475,592
$18,360,150$17,222,456
$15,336,704$18,645,466
$7,096,326$7,419,469
$8,161,578$8,497,821
-$510,500-$2,161,797
-$2,466,565-$1,939,606
$0$0
$0$0
$0$0
$0$0
$0$0
$0$7,500,000
$7,500,000$7,500,000
$7,500,000$7,500,000
$7,500,000$5,000,000
$0$0
$208,333$177,083
$145,833$114,583
$83,333$52,083
$20,833$0
$0$0
$208,333$7,677,083
$7,645,833$7,614,583
$7,583,333$7,552,083
$7,520,833$5,000,000
$0$0
-$208,333-$7,677,083
-$7,645,833-$7,614,583
-$7,583,333-$7,552,083
-$7,520,833-$5,000,000
$0$0
$15,128,371$10,968,382
-$549,508-$195,114
$578,245$945,737
-$8,031,334-$7,161,797
-$2,466,565-$1,939,606
Appendix A
City of San Diego Community Choice Aggregate Feasibility Study A-36 | Page

CITY
OF SA
N D
IEGO
CO
MM
UN
ITY C
HO
ICE A
GG
REG
ATIO
NSH
OR
T TERM
CO
ST OF SER
VIC
E MO
DEL
PCIA
CH
AR
GES
Agricultural
Com
mercial/Industrial - Large
Com
mercial/Industrial - M
ediumC
omm
ercial/Industrial - Small
Outdoor Lighting - R
esidentialO
utdoor Lighting - Small C
omm
ercialR
esidentialTotal
RA
TE RELIEF
Agricultural
Com
mercial/Industrial - Large
Com
mercial/Industrial - M
ediumC
omm
ercial/Industrial - Small
Outdoor Lighting - R
esidentialO
utdoor Lighting - Small C
omm
ercialR
esidentialTotal
CC
A R
EVEN
UE B
Y C
LASS (N
ET OF PC
IA &
RA
TE RELIEF)
Agricultural
Com
mercial/Industrial - Large
Com
mercial/Industrial - M
ediumC
omm
ercial/Industrial - Small
Outdoor Lighting - R
esidentialO
utdoor Lighting - Small C
omm
ercialR
esidentialTotal
Cash Flow
Analysis
REV
ENU
E FRO
M O
PERA
TION
SR
evenue - ElectricityLess U
ncollectible Accounts
Total O
perational Revenue
CO
ST OF O
PERA
TION
SW
holesale Com
modity
Net Energy M
etering ProgramR
etail Services (EDI/ B
illing/ Custom
er Care)
ServicesPersonnelO
utreach & C
omm
unicationsO
ther Professional ServicesG
eneral & A
dministration
Programs
SDG
&E Fees
Monthly B
illing FeesC
CA
SRM
iscellaneousT
otal Operational E
xpensesC
ASH
FLO
WS FR
OM
OPE
RA
TIN
G A
CT
IVIT
IES
FINA
NC
ING
Deposit from
FinancingD
ebt ServicePrincipalInterest
Total Debt Service
CA
SH FL
OW
S NO
N-C
AP FIN
AN
CIN
G A
CT
IVIT
IES
NE
T C
ASH
FLO
W
20172017
20172017
20172017
20172017
20182018
MA
YJU
NJU
LA
UG
SEPO
CT
NO
VD
ECJA
NFEB
$23,242$24,666
$27,695$25,155
$28,105$26,396
$24,138$20,639
$21,675$20,932
$693,214$686,144
$847,495$748,355
$925,679$728,878
$655,571$616,760
$620,753$603,410
$632,210$672,046
$723,508$664,930
$728,783$645,840
$624,316$647,083
$668,675$638,234
$672,305$701,953
$788,023$721,770
$816,917$694,585
$656,055$685,732
$709,165$672,469
$0$0
$0$0
$0$0
$0$0
$0$0
$24,849$25,372
$25,480$25,373
$25,461$25,940
$25,608$25,766
$27,785$19,629
$627,538$651,991
$768,430$684,568
$867,204$660,049
$632,750$747,100
$877,618$741,741
$2,673,358$2,762,172
$3,180,632$2,870,151
$3,392,150$2,781,688
$2,618,439$2,743,080
$2,925,671$2,696,415
$18,529$19,664
$22,080$20,054
$22,406$21,044
$9,946$8,504
$9,251$8,934
$505,129$499,977
$617,550$545,309
$674,521$531,116
$246,893$232,276
$242,169$235,403
$460,677$489,704
$527,203$484,518
$531,047$470,608
$235,122$243,696
$260,865$248,989
$360,378$376,271
$422,407$386,893
$437,895$372,321
$181,755$189,977
$203,519$192,988
$0$0
$0$0
$0$0
$0$0
$0$0
$8,805$8,990
$9,028$8,990
$9,022$9,191
$4,690$4,719
$5,271$3,724
$463,549$481,611
$567,622$505,675
$640,585$487,564
$241,569$285,225
$347,077$293,341
$1,817,066$1,876,218
$2,165,891$1,951,441
$2,315,476$1,891,844
$919,974$964,397
$1,068,153$983,380
$328,810$348,951
$391,816$355,877
$397,614$373,432
$164,830$140,940
$154,098$148,818
$8,904,231$8,813,423
$10,885,950$9,612,512
$11,890,211$9,362,325
$4,035,393$3,796,485
$3,980,464$3,869,256
$8,120,650$8,632,338
$9,293,358$8,540,921
$9,361,114$8,295,718
$3,843,000$3,983,144
$4,287,758$4,092,560
$6,174,883$6,447,193
$7,237,715$6,629,202
$7,503,093$6,379,518
$2,797,292$2,923,826
$3,157,698$2,994,303
$0$0
$0$0
$0$0
$0$0
$0$0
$142,444$145,441
$146,060$145,446
$145,951$148,698
$63,496$63,888
$72,364$51,123
$8,179,884$8,498,619
$10,016,389$8,923,261
$11,303,904$8,603,662
$3,957,058$4,672,172
$5,716,853$4,831,740
$31,850,902$32,885,966
$37,971,289$34,207,220
$40,601,887$33,163,354
$14,861,068$15,580,456
$17,369,235$15,987,800
$15,062,651$20,406,944
$30,161,395$34,388,202
$36,155,644$36,704,284
$37,453,260$28,198,542
$17,287,114$16,066,137
-$74,939-$101,527
-$150,057-$171,086
-$179,879-$182,608
-$186,335-$140,291
-$86,006-$79,931
$14,987,713$20,305,417
$30,011,339$34,217,116
$35,975,765$36,521,676
$37,266,926$28,058,250
$17,201,109$15,986,206
$15,108,782$14,475,286
$14,826,003$14,946,628
$27,917,758$27,854,924
$28,015,881$17,635,821
$15,979,171$16,860,384
$33,864$70,562
$126,812$141,333
$125,241$107,675
$70,353$45,498
$16,704$6,661
$344,381$344,381
$344,381$344,381
$344,381$344,381
$344,381$344,381
$344,381$344,381
$388,125$388,125
$388,125$388,125
$388,125$388,125
$388,125$388,125
$401,709$401,709
$90,563$90,563
$90,563$90,563
$90,563$90,563
$90,563$90,563
$93,732$93,732
$226,406$226,406
$226,406$226,406
$226,406$226,406
$226,406$226,406
$234,330$234,330
$71,156$71,156
$71,156$71,156
$71,156$71,156
$71,156$71,156
$73,647$73,647
$258,750$258,750
$258,750$258,750
$258,750$258,750
$258,750$258,750
$267,806$267,806
$160,711$160,711
$160,711$160,711
$160,711$160,711
$160,711$160,711
$160,711$160,711
$57,397$57,397
$57,397$57,397
$57,397$57,397
$57,397$57,397
$57,397$57,397
$0$0
$0$0
$0$0
$0$0
$0$0
$103,314$103,314
$103,314$103,314
$103,314$103,314
$103,314$103,314
$103,314$103,314
$16,682,738$16,085,940
$16,492,907$16,628,053
$29,583,091$29,502,690
$29,626,325$19,221,410
$17,572,191$18,443,361
-$1,695,025$4,219,477
$13,518,432$17,589,063
$6,392,674$7,018,986
$7,640,600$8,836,840
-$371,082-$2,457,155
$0$0
$0$0
$0$0
$0$0
$0$0
$0$0
$0$0
$0$0
$0$0
$0$0
$0$0
$0$0
$0$0
$0$0
$0$0
$0$0
$0$0
$0$0
$0$0
$0$0
$0$0
$0$0
$0$0
$0$0
$0$0
-$1,695,025$4,219,477
$13,518,432$17,589,063
$6,392,674$7,018,986
$7,640,600$8,836,840
-$371,082-$2,457,155
Appendix A
City of San Diego Community Choice Aggregate Feasibility Study A-37 | Page

CITY
OF SA
N D
IEGO
CO
MM
UN
ITY C
HO
ICE A
GG
REG
ATIO
NSH
OR
T TERM
CO
ST OF SER
VIC
E MO
DEL
PCIA
CH
AR
GES
Agricultural
Com
mercial/Industrial - Large
Com
mercial/Industrial - M
ediumC
omm
ercial/Industrial - Small
Outdoor Lighting - R
esidentialO
utdoor Lighting - Small C
omm
ercialR
esidentialTotal
RA
TE RELIEF
Agricultural
Com
mercial/Industrial - Large
Com
mercial/Industrial - M
ediumC
omm
ercial/Industrial - Small
Outdoor Lighting - R
esidentialO
utdoor Lighting - Small C
omm
ercialR
esidentialTotal
CC
A R
EVEN
UE B
Y C
LASS (N
ET OF PC
IA &
RA
TE RELIEF)
Agricultural
Com
mercial/Industrial - Large
Com
mercial/Industrial - M
ediumC
omm
ercial/Industrial - Small
Outdoor Lighting - R
esidentialO
utdoor Lighting - Small C
omm
ercialR
esidentialTotal
Cash Flow
Analysis
REV
ENU
E FRO
M O
PERA
TION
SR
evenue - ElectricityLess U
ncollectible Accounts
Total O
perational Revenue
CO
ST OF O
PERA
TION
SW
holesale Com
modity
Net Energy M
etering ProgramR
etail Services (EDI/ B
illing/ Custom
er Care)
ServicesPersonnelO
utreach & C
omm
unicationsO
ther Professional ServicesG
eneral & A
dministration
Programs
SDG
&E Fees
Monthly B
illing FeesC
CA
SRM
iscellaneousT
otal Operational E
xpensesC
ASH
FLO
WS FR
OM
OPE
RA
TIN
G A
CT
IVIT
IES
FINA
NC
ING
Deposit from
FinancingD
ebt ServicePrincipalInterest
Total Debt Service
CA
SH FL
OW
S NO
N-C
AP FIN
AN
CIN
G A
CT
IVIT
IES
NE
T C
ASH
FLO
W
20182018
20182018
20182018
20182018
20182018
MA
RA
PRM
AY
JUN
JUL
AU
GSEP
OC
TN
OV
DEC
$21,787$24,182
$23,341$24,770
$27,813$25,262
$28,225$26,508
$24,240$20,727
$620,155$640,949
$696,162$689,063
$851,100$751,538
$929,616$731,978
$658,360$619,383
$636,803$655,833
$634,899$674,905
$726,586$667,758
$731,883$648,587
$626,972$649,836
$663,061$670,419
$675,164$704,939
$791,375$724,840
$820,391$697,539
$658,846$688,648
$0$0
$0$0
$0$0
$0$0
$0$0
$25,948$24,948
$24,955$25,480
$25,588$25,481
$25,569$26,051
$25,717$25,876
$692,351$641,817
$630,207$654,764
$771,698$687,480
$870,893$662,857
$635,441$750,277
$2,660,105$2,658,147
$2,684,729$2,773,920
$3,194,160$2,882,358
$3,406,577$2,793,519
$2,629,576$2,754,747
$9,299$10,321
$19,276$20,456
$22,969$20,862
$23,309$21,891
$10,346$8,847
$241,936$250,048
$525,481$520,122
$642,432$567,280
$701,698$552,516
$256,841$241,635
$248,431$255,855
$479,238$509,435
$548,445$504,041
$552,444$489,570
$244,595$253,515
$190,288$192,400
$374,899$391,431
$439,427$402,482
$455,539$387,323
$189,078$197,631
$0$0
$0$0
$0$0
$0$0
$0$0
$4,922$4,733
$9,160$9,352
$9,392$9,353
$9,385$9,562
$4,879$4,909
$273,809$253,823
$482,226$501,016
$590,493$526,050
$666,395$507,209
$251,302$296,717
$968,685$967,180
$1,890,279$1,951,814
$2,253,158$2,030,067
$2,408,770$1,968,070
$957,041$1,003,254
$154,895$171,924
$342,896$363,900
$408,602$371,123
$414,647$389,430
$172,341$147,363
$3,976,631$4,109,970
$9,287,980$9,193,258
$11,355,106$10,026,786
$12,402,648$9,765,817
$4,221,611$3,971,679
$4,083,384$4,205,407
$8,470,629$9,004,369
$9,693,878$8,909,013
$9,764,554$8,653,242
$4,020,340$4,166,952
$2,952,414$2,985,177
$6,447,909$6,732,259
$7,557,734$6,922,316
$7,834,846$6,661,592
$2,933,643$3,066,345
$0$0
$0$0
$0$0
$0$0
$0$0
$67,578$64,973
$149,078$152,215
$152,864$152,221
$152,749$155,624
$66,977$67,391
$4,510,012$4,180,828
$8,532,081$8,864,540
$10,447,660$9,307,465
$11,790,611$8,974,106
$4,139,298$4,887,346
$15,744,914$15,718,279
$33,230,573$34,310,542
$39,615,843$35,688,924
$42,360,055$34,599,811
$15,554,210$16,307,076
$16,712,105$16,075,447
$15,765,143$21,324,876
$31,473,901$35,877,745
$37,721,650$38,293,959
$39,075,264$29,435,712
-$83,145-$79,977
-$78,434-$106,094
-$156,587-$178,496
-$187,670-$190,517
-$194,404-$146,446
$16,628,960$15,995,469
$15,686,709$21,218,782
$31,317,315$35,699,249
$37,533,980$38,103,441
$38,880,860$29,289,266
$18,154,178$16,726,171
$15,593,622$15,261,858
$16,519,793$17,483,298
$29,110,222$27,690,791
$28,213,001$17,088,979
$7,382$16,288
$35,072$73,083
$131,347$146,389
$129,721$111,526
$72,869$47,125
$344,381$344,381
$344,381$344,381
$344,381$344,381
$344,381$344,381
$344,381$344,381
$401,709$401,709
$401,709$401,709
$401,709$401,709
$401,709$401,709
$401,709$401,709
$93,732$93,732
$93,732$93,732
$93,732$93,732
$93,732$93,732
$93,732$93,732
$234,330$234,330
$234,330$234,330
$234,330$234,330
$234,330$234,330
$234,330$234,330
$73,647$73,647
$73,647$73,647
$73,647$73,647
$73,647$73,647
$73,647$73,647
$267,806$267,806
$267,806$267,806
$267,806$267,806
$267,806$267,806
$267,806$267,806
$160,711$160,711
$160,711$160,711
$160,711$160,711
$160,711$160,711
$160,711$160,711
$57,397$57,397
$57,397$57,397
$57,397$57,397
$57,397$57,397
$57,397$57,397
$0$0
$0$0
$0$0
$0$0
$0$0
$103,314$103,314
$103,314$103,314
$103,314$103,314
$103,314$103,314
$103,314$103,314
$19,737,876$18,318,775
$17,205,010$16,911,257
$18,227,456$19,206,003
$30,816,260$29,378,634
$29,862,186$18,712,420
-$3,108,917-$2,323,306
-$1,518,300$4,307,526
$13,089,858$16,493,246
$6,717,720$8,724,807
$9,018,674$10,576,846
$0$0
$0$0
$0$0
$0$0
$0$0
$0$0
$0$0
$0$0
$0$0
$0$0
$0$0
$0$0
$0$0
$0$0
$0$0
$0$0
$0$0
$0$0
$0$0
$0$0
$0$0
$0$0
$0$0
$0$0
$0$0
-$3,108,917-$2,323,306
-$1,518,300$4,307,526
$13,089,858$16,493,246
$6,717,720$8,724,807
$9,018,674$10,576,846
Appendix A
City of San Diego Community Choice Aggregate Feasibility Study A-38 | Page
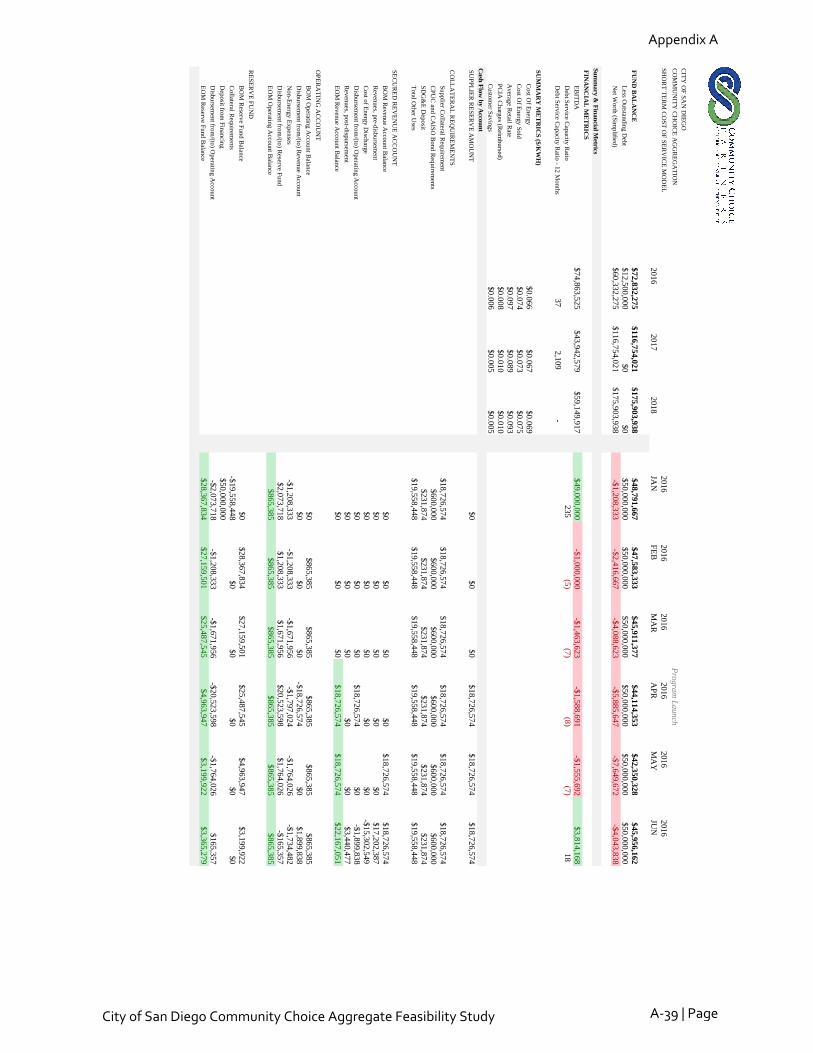
CITY
OF SA
N D
IEGO
CO
MM
UN
ITY C
HO
ICE A
GG
REG
ATIO
NProgram
LaunchSH
OR
T TERM
CO
ST OF SER
VIC
E MO
DEL
20162016
20162016
20162016
20162017
2018JA
NFEB
MA
RA
PRM
AY
JUN
FUN
D B
AL
AN
CE
$72,832,275$116,754,021
$175,903,938$48,791,667
$47,583,333$45,911,377
$44,114,353$42,350,328
$45,956,162Less O
utstanding Debt
$12,500,000$0
$0$50,000,000
$50,000,000$50,000,000
$50,000,000$50,000,000
$50,000,000N
et Worth (Sim
plified)$60,332,275
$116,754,021$175,903,938
-$1,208,333-$2,416,667
-$4,088,623-$5,885,647
-$7,649,672-$4,043,838
Summ
ary & Financial M
etricsFIN
AN
CIA
L M
ET
RIC
SEB
ITDA
$74,863,525$43,942,579
$59,149,917$49,000,000
-$1,000,000-$1,463,623
-$1,588,691-$1,555,692
$3,814,168D
ebt Service Capacity R
atio235
(5)
(7)
(8)
(7)
18
D
ebt Service Capacity R
atio - 12 Months
37
2,109
-
SUM
MA
RY
ME
TR
ICS ($/K
WH
)C
ost Of Energy
$0.066$0.067
$0.069C
ost Of Energy Sold
$0.074$0.073
$0.075A
verage Retail R
ate$0.097
$0.089$0.093
PCIA
Charges (R
eimbursed)
$0.008$0.010
$0.010C
ustomer Savings
$0.006$0.005
$0.005C
ash Flow by A
ccountSU
PPLIER R
ESERV
E AM
OU
NT
$0$0
$0$18,726,574
$18,726,574$18,726,574
CO
LLATER
AL R
EQU
IREM
ENTS
Supplier Collateral R
equirement
$18,726,574$18,726,574
$18,726,574$18,726,574
$18,726,574$18,726,574
CPU
C and C
AISO
Bond R
equirements
$600,000$600,000
$600,000$600,000
$600,000$600,000
SDG
&E D
eposit$231,874
$231,874$231,874
$231,874$231,874
$231,874Total O
ther Uses
$19,558,448$19,558,448
$19,558,448$19,558,448
$19,558,448$19,558,448
SECU
RED
REV
ENU
E AC
CO
UN
TB
OM
Revenue A
ccount Balance
$0$0
$0$0
$18,726,574$18,726,574
Revenues, pre-disbursem
ent$0
$0$0
$0$0
$17,202,387C
ost of Energy Discharge
$0$0
$0$0
$0-$15,302,549
Disbursem
ent from/(to) O
perating Account
$0$0
$0$18,726,574
$0-$1,899,838
Revenues, post-dispursem
ent$0
$0$0
$0$0
$3,440,477EO
M R
evenue Account B
alance$0
$0$0
$18,726,574$18,726,574
$22,167,051
OPER
ATIN
G A
CC
OU
NT
BO
M O
perating Account B
alance$0
$865,385$865,385
$865,385$865,385
$865,385D
isbursement from
/(to) Revenue A
ccount$0
$0$0
-$18,726,574$0
$1,899,838N
on-Energy Expenses-$1,208,333
-$1,208,333-$1,671,956
-$1,797,024-$1,764,026
-$1,734,482D
isbursement from
/(to) Reserve Fund
$2,073,718$1,208,333
$1,671,956$20,523,598
$1,764,026-$165,357
EOM
Operating A
ccount Balance
$865,385$865,385
$865,385$865,385
$865,385$865,385
RESER
VE FU
ND
BO
M R
eserve Fund Balance
$0$28,367,834
$27,159,501$25,487,545
$4,963,947$3,199,922
Collateral R
equirements
-$19,558,448$0
$0$0
$0$0
Deposit from
Financing$50,000,000
Disbursem
ent from/(to) O
perating Account
-$2,073,718-$1,208,333
-$1,671,956-$20,523,598
-$1,764,026$165,357
EOM
Reserve Fund B
alance$28,367,834
$27,159,501$25,487,545
$4,963,947$3,199,922
$3,365,279
Appendix A
City of San Diego Community Choice Aggregate Feasibility Study A-39 | Page

CITY
OF SA
N D
IEGO
CO
MM
UN
ITY C
HO
ICE A
GG
REG
ATIO
NSH
OR
T TERM
CO
ST OF SER
VIC
E MO
DEL
FUN
D B
AL
AN
CE
Less Outstanding D
ebtN
et Worth (Sim
plified)
Summ
ary & Financial M
etricsFIN
AN
CIA
L M
ET
RIC
SEB
ITDA
Debt Service C
apacity Ratio
Debt Service C
apacity Ratio - 12 M
onths
SUM
MA
RY
ME
TR
ICS ($/K
WH
)C
ost Of Energy
Cost O
f Energy SoldA
verage Retail R
atePC
IA C
harges (Reim
bursed)C
ustomer Savings
Cash Flow
by Account
SUPPLIER
RESER
VE A
MO
UN
T
CO
LLATER
AL R
EQU
IREM
ENTS
Supplier Collateral R
equirement
CPU
C and C
AISO
Bond R
equirements
SDG
&E D
epositTotal O
ther Uses
SECU
RED
REV
ENU
E AC
CO
UN
TB
OM
Revenue A
ccount Balance
Revenues, pre-disbursem
entC
ost of Energy Discharge
Disbursem
ent from/(to) O
perating Account
Revenues, post-dispursem
entEO
M R
evenue Account B
alance
OPER
ATIN
G A
CC
OU
NT
BO
M O
perating Account B
alanceD
isbursement from
/(to) Revenue A
ccountN
on-Energy ExpensesD
isbursement from
/(to) Reserve Fund
EOM
Operating A
ccount Balance
RESER
VE FU
ND
BO
M R
eserve Fund Balance
Collateral R
equirements
Deposit from
FinancingD
isbursement from
/(to) Operating A
ccountEO
M R
eserve Fund Balance
20162016
20162016
20162016
20172017
20172017
JUL
AU
GSEP
OC
TN
OV
DEC
JAN
FEBM
AR
APR
$61,084,533$72,052,915
$71,503,407$71,308,293
$71,886,538$72,832,275
$64,800,941$57,639,144
$55,172,579$53,232,973
$50,000,000$42,500,000
$35,000,000$27,500,000
$20,000,000$12,500,000
$5,000,000$0
$0$0
$11,084,533$29,552,915
$36,503,407$43,808,293
$51,886,538$60,332,275
$59,800,941$57,639,144
$55,172,579$53,232,973
$15,336,704$11,145,466
-$403,674-$80,531
$661,578$997,821
-$8,010,500-$7,161,797
-$2,466,565-$1,939,606
74
1
(0)
(0)
0
0
(1)
(1)
-
-
37
10
7
7
8
$18,726,574$18,726,574
$18,726,574$18,726,574
$18,726,574$18,726,574
$19,556,789$19,556,789
$19,556,789$19,556,789
$18,726,574$18,726,574
$18,726,574$18,726,574
$18,726,574$18,726,574
$19,556,789$19,556,789
$19,556,789$19,556,789
$600,000$600,000
$600,000$600,000
$600,000$600,000
$600,000$600,000
$600,000$600,000
$231,874$231,874
$231,874$231,874
$231,874$231,874
$222,523$222,523
$222,523$222,523
$19,558,448$19,558,448
$19,558,448$19,558,448
$19,558,448$19,558,448
$20,379,312$20,379,312
$20,379,312$20,379,312
$22,167,051$24,906,543
$25,484,858$24,648,764
$25,638,641$24,774,388
$23,992,429$22,764,835
$21,197,553$22,632,966
$25,749,870$28,159,519
$29,610,949$28,800,281
$30,239,073$21,941,065
$13,366,859$13,673,032
$12,817,407$12,735,709
-$15,073,443-$14,755,736
-$26,922,072-$26,781,333
-$26,614,321-$17,202,720
-$15,545,314-$15,935,501
-$16,820,058-$15,682,365
-$14,116,904-$19,583,752
-$9,447,162-$7,941,139
-$10,536,820-$10,786,160
-$2,257,185-$945,577
$2,361,888-$129,522
$6,179,969$6,758,285
$5,922,190$6,912,068
$6,047,815$5,265,856
$3,208,046$1,640,764
$3,076,178$2,547,142
$24,906,543$25,484,858
$24,648,764$25,638,641
$24,774,388$23,992,429
$22,764,835$21,197,553
$22,632,966$22,103,931
$865,385$865,385
$865,385$865,385
$865,385$865,385
$865,385$895,673
$895,673$895,673
$14,116,904$19,583,752
$9,447,162$7,941,139
$10,536,820$10,786,160
$2,257,185$945,577
-$2,361,888$129,522
-$1,728,025-$9,193,685
-$9,160,575-$9,126,130
-$9,094,322-$9,058,464
-$9,060,925-$6,540,091
-$1,540,091-$1,540,091
-$12,388,879-$10,390,067
-$286,587$1,184,992
-$1,442,497-$1,727,696
$6,834,028$5,594,515
$3,901,979$1,410,570
$865,385$865,385
$865,385$865,385
$865,385$865,385
$895,673$895,673
$895,673$895,673
$3,365,279$15,754,158
$26,144,224$26,430,812
$25,245,820$26,688,317
$28,416,014$20,761,122
$15,166,607$11,264,628
$0$0
$0$0
$0$0
-$820,864$0
$0$0
$12,388,879$10,390,067
$286,587-$1,184,992
$1,442,497$1,727,696
-$6,834,028-$5,594,515
-$3,901,979-$1,410,570
$15,754,158$26,144,224
$26,430,812$25,245,820
$26,688,317$28,416,014
$20,761,122$15,166,607
$11,264,628$9,854,058
Appendix A
City of San Diego Community Choice Aggregate Feasibility Study A-40 | Page

CITY
OF SA
N D
IEGO
CO
MM
UN
ITY C
HO
ICE A
GG
REG
ATIO
NSH
OR
T TERM
CO
ST OF SER
VIC
E MO
DEL
FUN
D B
AL
AN
CE
Less Outstanding D
ebtN
et Worth (Sim
plified)
Summ
ary & Financial M
etricsFIN
AN
CIA
L M
ET
RIC
SEB
ITDA
Debt Service C
apacity Ratio
Debt Service C
apacity Ratio - 12 M
onths
SUM
MA
RY
ME
TR
ICS ($/K
WH
)C
ost Of Energy
Cost O
f Energy SoldA
verage Retail R
atePC
IA C
harges (Reim
bursed)C
ustomer Savings
Cash Flow
by Account
SUPPLIER
RESER
VE A
MO
UN
T
CO
LLATER
AL R
EQU
IREM
ENTS
Supplier Collateral R
equirement
CPU
C and C
AISO
Bond R
equirements
SDG
&E D
epositTotal O
ther Uses
SECU
RED
REV
ENU
E AC
CO
UN
TB
OM
Revenue A
ccount Balance
Revenues, pre-disbursem
entC
ost of Energy Discharge
Disbursem
ent from/(to) O
perating Account
Revenues, post-dispursem
entEO
M R
evenue Account B
alance
OPER
ATIN
G A
CC
OU
NT
BO
M O
perating Account B
alanceD
isbursement from
/(to) Revenue A
ccountN
on-Energy ExpensesD
isbursement from
/(to) Reserve Fund
EOM
Operating A
ccount Balance
RESER
VE FU
ND
BO
M R
eserve Fund Balance
Collateral R
equirements
Deposit from
FinancingD
isbursement from
/(to) Operating A
ccountEO
M R
eserve Fund Balance
20172017
20172017
20172017
20172017
20182018
MA
YJU
NJU
LA
UG
SEPO
CT
NO
VD
ECJA
NFEB
$51,537,948$55,757,426
$69,275,858$86,864,921
$93,257,595$100,276,581
$107,917,181$116,754,021
$116,382,939$113,925,784
$0$0
$0$0
$0$0
$0$0
$0$0
$51,537,948$55,757,426
$69,275,858$86,864,921
$93,257,595$100,276,581
$107,917,181$116,754,021
$116,382,939$113,925,784
-$1,695,025$4,219,477
$13,518,432$17,589,063
$6,392,674$7,018,986
$7,640,600$8,836,840
-$371,082-$2,457,155
-
-
-
-
-
-
-
-
-
-
10
13
15
37
81
186
495
2,109
-
-
$19,556,789$19,556,789
$19,556,789$19,556,789
$19,556,789$19,556,789
$19,556,789$19,556,789
$19,861,838$19,861,838
$19,556,789$19,556,789
$19,556,789$19,556,789
$19,556,789$19,556,789
$19,556,789$19,556,789
$19,861,838$19,861,838
$600,000$600,000
$600,000$600,000
$600,000$600,000
$600,000$600,000
$600,000$600,000
$222,523$222,523
$222,523$222,523
$222,523$222,523
$222,523$222,523
$222,523$222,523
$20,379,312$20,379,312
$20,379,312$20,379,312
$20,379,312$20,379,312
$20,379,312$20,379,312
$20,684,361$20,684,361
$22,103,931$22,457,636
$22,941,025$25,365,435
$26,179,456$25,552,750
$26,625,500$25,767,943
$24,987,418$23,191,085
$12,086,865$16,921,181
$24,202,692$27,594,448
$29,979,804$29,452,964
$31,055,771$22,627,621
$13,871,862$14,273,398
-$15,142,646-$14,545,848
-$14,952,815-$15,087,961
-$28,043,000-$27,962,599
-$28,086,234-$17,681,319
-$15,995,874-$16,867,045
$508,639-$5,276,180
-$12,634,113-$18,315,133
-$8,559,472-$7,486,327
-$10,038,249-$11,157,457
-$3,001,567-$735,601
$2,900,848$3,384,236
$5,808,646$6,622,668
$5,995,961$7,068,711
$6,211,154$5,430,629
$3,329,247$1,712,808
$22,457,636$22,941,025
$25,365,435$26,179,456
$25,552,750$26,625,500
$25,767,943$24,987,418
$23,191,085$21,574,646
$895,673$895,673
$895,673$895,673
$895,673$895,673
$895,673$895,673
$895,673$927,022
-$508,639$5,276,180
$12,634,113$18,315,133
$8,559,472$7,486,327
$10,038,249$11,157,457
$3,001,567$735,601
-$1,540,091-$1,540,091
-$1,540,091-$1,540,091
-$1,540,091-$1,540,091
-$1,540,091-$1,540,091
-$1,576,316-$1,576,316
$2,048,731-$3,736,089
-$11,094,022-$16,775,042
-$7,019,381-$5,946,235
-$8,498,157-$9,617,365
-$1,393,902$840,716
$895,673$895,673
$895,673$895,673
$895,673$895,673
$895,673$895,673
$927,022$927,022
$9,854,058$7,805,327
$11,541,416$22,635,438
$39,410,480$46,429,861
$52,376,096$60,874,253
$70,491,618$71,580,471
$0$0
$0$0
$0$0
$0$0
-$305,049$0
-$2,048,731$3,736,089
$11,094,022$16,775,042
$7,019,381$5,946,235
$8,498,157$9,617,365
$1,393,902-$840,716
$7,805,327$11,541,416
$22,635,438$39,410,480
$46,429,861$52,376,096
$60,874,253$70,491,618
$71,580,471$70,739,755
Appendix A
City of San Diego Community Choice Aggregate Feasibility Study A-41 | Page
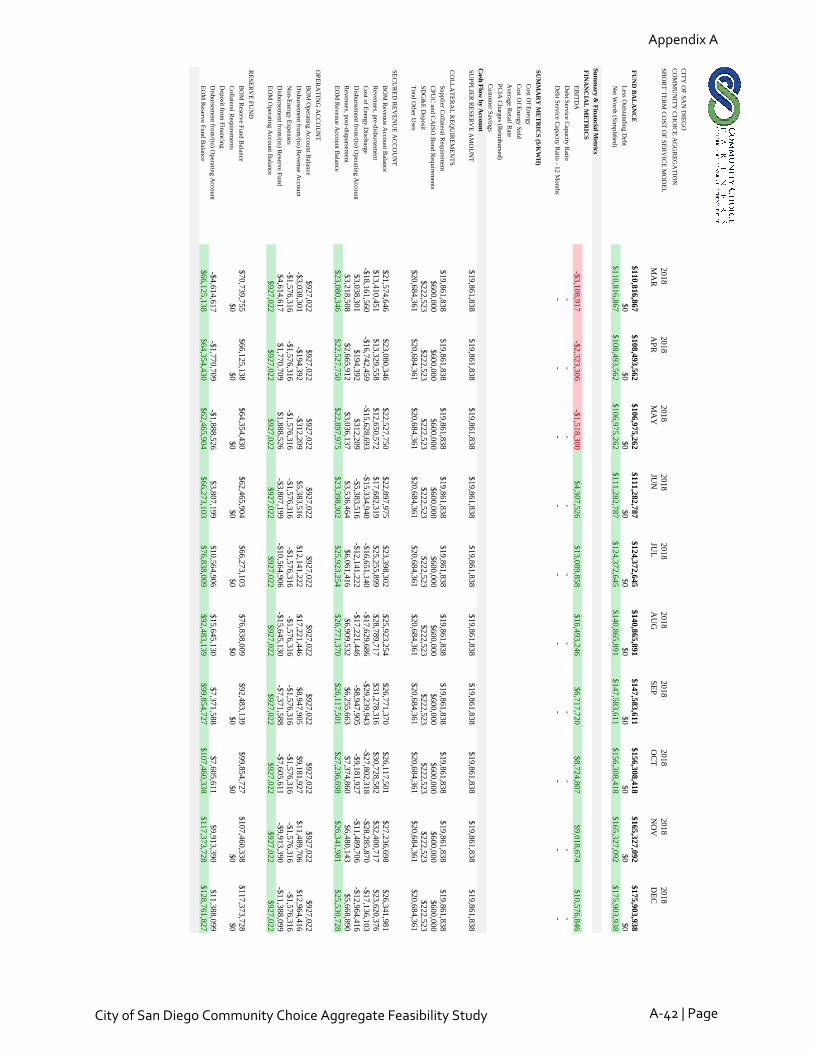
CITY
OF SA
N D
IEGO
CO
MM
UN
ITY C
HO
ICE A
GG
REG
ATIO
NSH
OR
T TERM
CO
ST OF SER
VIC
E MO
DEL
FUN
D B
AL
AN
CE
Less Outstanding D
ebtN
et Worth (Sim
plified)
Summ
ary & Financial M
etricsFIN
AN
CIA
L M
ET
RIC
SEB
ITDA
Debt Service C
apacity Ratio
Debt Service C
apacity Ratio - 12 M
onths
SUM
MA
RY
ME
TR
ICS ($/K
WH
)C
ost Of Energy
Cost O
f Energy SoldA
verage Retail R
atePC
IA C
harges (Reim
bursed)C
ustomer Savings
Cash Flow
by Account
SUPPLIER
RESER
VE A
MO
UN
T
CO
LLATER
AL R
EQU
IREM
ENTS
Supplier Collateral R
equirement
CPU
C and C
AISO
Bond R
equirements
SDG
&E D
epositTotal O
ther Uses
SECU
RED
REV
ENU
E AC
CO
UN
TB
OM
Revenue A
ccount Balance
Revenues, pre-disbursem
entC
ost of Energy Discharge
Disbursem
ent from/(to) O
perating Account
Revenues, post-dispursem
entEO
M R
evenue Account B
alance
OPER
ATIN
G A
CC
OU
NT
BO
M O
perating Account B
alanceD
isbursement from
/(to) Revenue A
ccountN
on-Energy ExpensesD
isbursement from
/(to) Reserve Fund
EOM
Operating A
ccount Balance
RESER
VE FU
ND
BO
M R
eserve Fund Balance
Collateral R
equirements
Deposit from
FinancingD
isbursement from
/(to) Operating A
ccountEO
M R
eserve Fund Balance
20182018
20182018
20182018
20182018
20182018
MA
RA
PRM
AY
JUN
JUL
AU
GSEP
OC
TN
OV
DEC
$110,816,867$108,493,562
$106,975,262$111,282,787
$124,372,645$140,865,891
$147,583,611$156,308,418
$165,327,092$175,903,938
$0$0
$0$0
$0$0
$0$0
$0$0
$110,816,867$108,493,562
$106,975,262$111,282,787
$124,372,645$140,865,891
$147,583,611$156,308,418
$165,327,092$175,903,938
-$3,108,917-$2,323,306
-$1,518,300$4,307,526
$13,089,858$16,493,246
$6,717,720$8,724,807
$9,018,674$10,576,846
-
-
-
-
-
-
-
-
-
-
-
-
-
-
-
-
-
-
-
-
$19,861,838$19,861,838
$19,861,838$19,861,838
$19,861,838$19,861,838
$19,861,838$19,861,838
$19,861,838$19,861,838
$19,861,838$19,861,838
$19,861,838$19,861,838
$19,861,838$19,861,838
$19,861,838$19,861,838
$19,861,838$19,861,838
$600,000$600,000
$600,000$600,000
$600,000$600,000
$600,000$600,000
$600,000$600,000
$222,523$222,523
$222,523$222,523
$222,523$222,523
$222,523$222,523
$222,523$222,523
$20,684,361$20,684,361
$20,684,361$20,684,361
$20,684,361$20,684,361
$20,684,361$20,684,361
$20,684,361$20,684,361
$21,574,646$23,080,346
$22,527,750$22,897,975
$23,398,302$25,923,254
$26,771,370$26,117,501
$27,236,698$26,341,981
$13,410,451$13,329,558
$12,650,572$17,682,319
$25,255,899$28,789,717
$31,278,316$30,728,582
$32,400,717$23,620,376
-$18,161,560-$16,742,459
-$15,628,693-$15,334,940
-$16,651,140-$17,629,686
-$29,239,943-$27,802,318
-$28,285,870-$17,136,103
$3,038,301$194,392
$312,209-$5,383,516
-$12,141,222-$17,221,446
-$8,947,905-$9,181,927
-$11,489,706-$12,964,416
$3,218,508$2,665,912
$3,036,137$3,536,464
$6,061,416$6,909,532
$6,255,663$7,374,860
$6,480,143$5,668,890
$23,080,346$22,527,750
$22,897,975$23,398,302
$25,923,254$26,771,370
$26,117,501$27,236,698
$26,341,981$25,530,728
$927,022$927,022
$927,022$927,022
$927,022$927,022
$927,022$927,022
$927,022$927,022
-$3,038,301-$194,392
-$312,209$5,383,516
$12,141,222$17,221,446
$8,947,905$9,181,927
$11,489,706$12,964,416
-$1,576,316-$1,576,316
-$1,576,316-$1,576,316
-$1,576,316-$1,576,316
-$1,576,316-$1,576,316
-$1,576,316-$1,576,316
$4,614,617$1,770,709
$1,888,526-$3,807,199
-$10,564,906-$15,645,130
-$7,371,588-$7,605,611
-$9,913,390-$11,388,099
$927,022$927,022
$927,022$927,022
$927,022$927,022
$927,022$927,022
$927,022$927,022
$70,739,755$66,125,138
$64,354,430$62,465,904
$66,273,103$76,838,009
$92,483,139$99,854,727
$107,460,338$117,373,728
$0$0
$0$0
$0$0
$0$0
$0$0
-$4,614,617-$1,770,709
-$1,888,526$3,807,199
$10,564,906$15,645,130
$7,371,588$7,605,611
$9,913,390$11,388,099
$66,125,138$64,354,430
$62,465,904$66,273,103
$76,838,009$92,483,139
$99,854,727$107,460,338
$117,373,728$128,761,827
Appendix A
City of San Diego Community Choice Aggregate Feasibility Study A-42 | Page

39
APPENDIX F
SAMPLE CCA RISK MATRIX, PREPARED FOR THE CITY OF BENICIA
In 2014, the City of Benicia retained MRW & Associates, LLC to examine the risks associated with joining MCE and review the “Marin Clean Energy Applicant Analysis for the City of Benicia” as part of its due diligence related to participation in MCE.
Description of Risk
Magnitude or Importance of Risk
Procurement Risks
Volume Risk: Uncertainty in load can cause under‐ or over‐procurement
Medium
Future Price Risk: MCE cannot procure power for incremental customers at competitive costs
Medium
Expansion of CCA: Can current contract accommodate all new customers?
Low
Contract Renewal: MCE cannot procure power at competitive prices at end of current agreement
High
Regulatory and Policy Risks
Adverse CPUC Decisions: Exit Fees and bonding costs may be higher than expected
Medium
MCE’s lack of low‐income ratepayer policy
Low
Benicia’s interests may not always align with that of other JPA members
Medium
Customer Cost Risks
PG&E Exit Fees: Who bears risk of changes in exit fees?
High
Uncertainty in Departing Load Fees: How much must customers pay to exit CCA after opt‐out period ends?
Low
MCE Pricing Commitment: Will MCE meet or beat PG&E’s rates?
High
MCE Pricing Commitment: Will MCE guarantee CARE customers won’t pay more with MCE than they would have with PG&E?†
High
Appendix A
City of San Diego Community Choice Aggregate Feasibility Study A-43 | Page

40
City‐Specific Risks
Supplier Guarantees: City must provide guarantees to power suppliers
Low
New Generation Guarantees: City must provide support to obtain financing for new generation
Low
Financial liability if MCE fails
Low
Appendix A
City of San Diego Community Choice Aggregate Feasibility Study A-44 | Page

APPENDIX B
PRIORITY GUIDING PRINCIPLES: CITY OF SAN DIEGO
COMMUNITY CHOICE AGGREGATION (CCA)
FEASIBILITY STUDY

This page intentionally left blank.

APPENDIX B PRIORITY GUIDING PRINCIPLES: CITY OF SAN DIEGO COMMUNITY CHOICE
AGGREGATION (CCA) FEASIBILITY STUDY

This page intentionally left blank.

Priority Guiding Principles: City of San Diego Community Choice Aggregation (CCA) Feasibility Study Adopted December 10, 2015 by the City of San Diego Sustainable Energy Advisory Board Recommended Guiding Principles 1. Model CCA launch as an opt-out program to optimize the purchasing power of the CCA. 2. Consider available information including the third party sponsored CCA feasibility study funded by Protect Our Communities Foundation. To the extent deemed necessary, consider findings of the current CCA feasibility study funded by a third party non profit regarding the cost-benefit relative to business as usual and other relevant consumer cost competitive factors such as effect of utility stranded costs on ratepayers. 3. Evaluate economic development potential of CCA. The following economic development potential factors should be evaluated in the CCA feasibility study:
a) Use of local labor with an emphasis on investment in under-resourced communities; b) Consideration for livable wage and benefits, and training and certification requirements; c) Any impacts on current job market, and establishment of a jobs transition program for
anyone negatively impacted by CCA establishment; and d) Sourcing from local businesses and supplier contracting policy.
Evaluative criteria for power purchasing and investment should include benefit of these factors. 4. Evaluate ability of CCA to achieve greenhouse gas emission reduction targets. City of San Diego is setting forth goals to achieve state and federal requirements for greenhouse gas reductions. Achieving these goals is a critical benefit to citizens of San Diego. 5. Evaluate a resource plan that follows the state loading order with an emphasis on local implementation. The CCA program should encourage local energy efficiency programs and distributed generation renewable energy sources. The CCA program should promote and enhance consumers’ ability to meet their own energy needs through investment in building- and site-based renewable energy and energy storage on homes, businesses and integrated into the utility distribution system. 6. Evaluate ability to achieve 100 percent local renewables by 2035. The CCA program should develop a strategy to make San Diego a net energy producer. The ideal is that distributed generation (rooftop and parking lot solar), energy efficiency, and compatible storage are heavily promoted to push electric energy up out of the neighborhoods into the rest of the local grid, storage, and eventually out of the City. Local energy use and generation goals will be set and data will be monitored by official community planning area and customer class to measure progress in achievement of goals and to ensure incentives and resources are provided equitably to all communities throughout the city. 7. Evaluate a business and implementation phase-in plan to achieve targets identified to the Recommended Minimum Performance Table (below). Evaluate plans similar to “Sonoma Clean Power” CCA that phase-in geographic areas, customers use groups and locally generated renewable energy resources to achieve the goal of producing all CCA energy from renewables generated within and on developed land or land designated for urban development within the City of San Diego CCA boundary.
Appendix B
City of San Diego Community Choice Aggregate Feasibility Study B-1 | Page
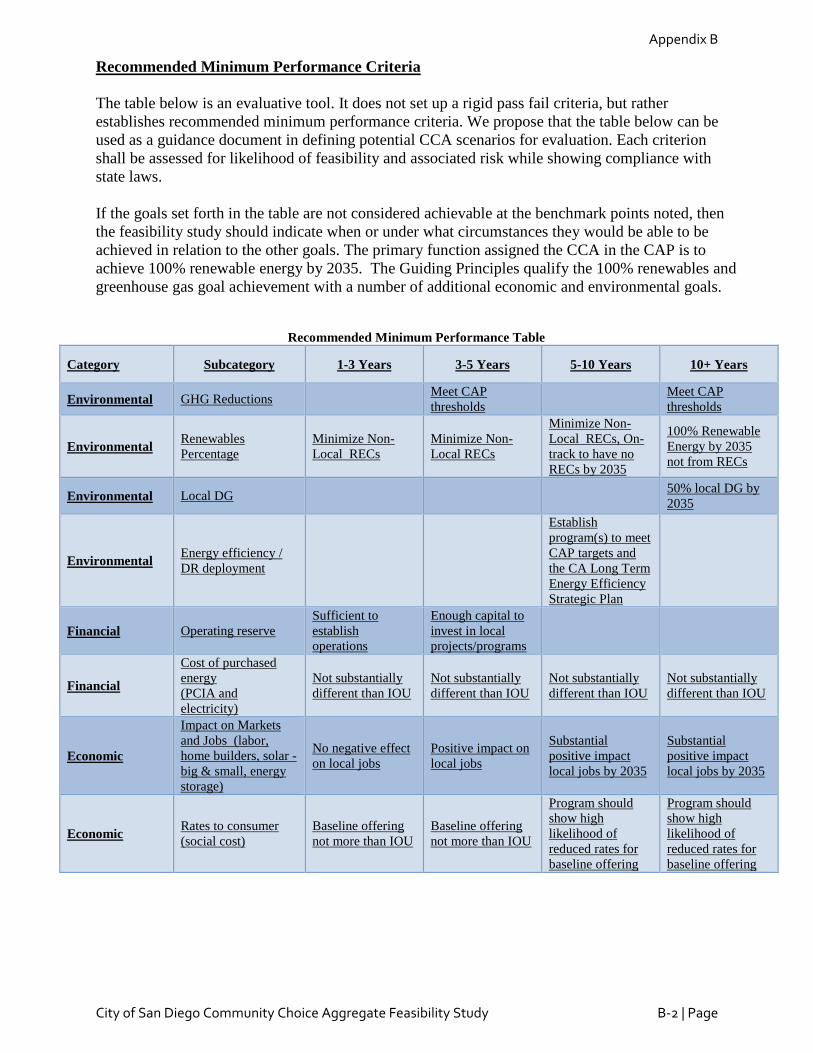
Recommended Minimum Performance Criteria The table below is an evaluative tool. It does not set up a rigid pass fail criteria, but rather establishes recommended minimum performance criteria. We propose that the table below can be used as a guidance document in defining potential CCA scenarios for evaluation. Each criterion shall be assessed for likelihood of feasibility and associated risk while showing compliance with state laws. If the goals set forth in the table are not considered achievable at the benchmark points noted, then the feasibility study should indicate when or under what circumstances they would be able to be achieved in relation to the other goals. The primary function assigned the CCA in the CAP is to achieve 100% renewable energy by 2035. The Guiding Principles qualify the 100% renewables and greenhouse gas goal achievement with a number of additional economic and environmental goals.
Recommended Minimum Performance Table
Category Subcategory 1-3 Years 3-5 Years 5-10 Years 10+ Years
Environmental GHG Reductions Meet CAP thresholds
Meet CAP thresholds
Environmental Renewables Percentage
Minimize Non-Local RECs
Minimize Non-Local RECs
Minimize Non-Local RECs, On-track to have no RECs by 2035
100% Renewable Energy by 2035 not from RECs
Environmental Local DG 50% local DG by 2035
Environmental Energy efficiency / DR deployment
Establish program(s) to meet CAP targets and the CA Long Term Energy Efficiency Strategic Plan
Financial Operating reserve Sufficient to establish operations
Enough capital to invest in local projects/programs
Financial
Cost of purchased energy (PCIA and electricity)
Not substantially different than IOU
Not substantially different than IOU
Not substantially different than IOU
Not substantially different than IOU
Economic
Impact on Markets and Jobs (labor, home builders, solar -big & small, energy storage)
No negative effect on local jobs
Positive impact on local jobs
Substantial positive impact local jobs by 2035
Substantial positive impact local jobs by 2035
Economic Rates to consumer (social cost)
Baseline offering not more than IOU
Baseline offering not more than IOU
Program should show high likelihood of reduced rates for baseline offering
Program should show high likelihood of reduced rates for baseline offering
Appendix B
City of San Diego Community Choice Aggregate Feasibility Study B-2 | Page

APPENDIX C
CCA REGULATORY AND TECHNICAL INFORMATION

This page intentionally left blank.

APPENDIX C CCA REGULATORY AND TECHNICAL INFORMATION
CCAs were authorized by Assembly Bill (AB) 117a with additional details codified in California Public
Utilities Commission (CPUC) Code Section 366.2(c)(3)b. AB 117 authorized customers to aggregate their
electrical loads as members of their local community with community choice aggregators. Section
366.2(c)(3) provided additional guidance with regulatory oversight provided by the CPUC. A summary of
key requirements of Section 366.2(c)(3) is provided in the Table C-1 below.
Table C-1: CPUC Code Section 366.2(c)(3) Requirements
Customers may aggregate their loads through a public process with community choice
aggregators, if each customer is given an opportunity to opt-out of his or her community’s
aggregation program.
The implementation of a CCA program shall not result in a shifting of costs between the
customers of the community choice aggregator and the bundled service customers of an
electrical corporation.
A CCA shall be solely responsible for all generation procurement activities on behalf of the
CCA’s customers
If a public agency seeks to serve as a CCA, it shall offer the opportunity to purchase
electricity to all residential customers within its jurisdiction.
Under a CCA, customer participation may not require a positive written declaration, but
each customer shall be informed of his or her right to opt-out of the CCA.
A CCA establishing electrical load aggregation pursuant to this section shall develop an
implementation plan detailing the process and consequences of aggregation.
All electrical corporations shall cooperate fully with any CCAs that investigate, pursue, or
implement CCA programs.
An entity authorized to be a CCA that elects to implement a CCA program within its
jurisdiction pursuant to this chapter, shall do so by ordinance.
Two or more entities authorized to be a CCA, may participate as a group in a CCA program
pursuant to this chapter, through a joint powers agencyc
a Assembly Bill No. 117, CHAPTER 838 Electrical restructuring: aggregation. An act to amend Sections 218.3, 366, 394, and
394.25 of, and to add Sections 331.1, 366.2, and 381.1 to, the Public Utilities Code, relating to public utilities.
http://www.leginfo.ca.gov/pub/01-02/bill/asm/ab_0101-0150/ab_117_bill_20020924_chaptered.pdf b https://leginfo.legislature.ca.gov/faces/codes_displaySection.xhtml?sectionNum=366.2&lawCode=PUC c Joint Powers Agency may be established pursuant to Chapter 5 (commencing with Section 6500) of Division 7 of Title 1 of the
Government Code

APPENDIX C
City of San Diego Community Choice Aggregate Feasibility Study C-2| P a g e
A CCA shall have an operating service agreement with the electrical corporation prior to
furnishing electric service to consumers within its jurisdiction.
The CCA shall register with the CPUC, which may require additional information to ensure
compliance with basic consumer protection rules and other procedural matters.
An electrical corporation shall recover from the CCA any costs reasonably attributable to
the CCA, as determined by the CPUC
Nothing in this subdivision is intended to modify, or prohibit the use of, charges funding
programs for the benefit of low-income customers.
For the City CCA program, the formal SDG&E relationship is contractually-based after implementation
of CCA Service Agreements with SDG&E. Additionally, the services provided by SDG&E to the CCA have
fees associated with them.d IOUs have specific documented rules and processes that define their
relationships with CCAs that were developed to satisfy both their legislative and regulatory
responsibilities. SDG&E has postede their CCA rules and other CCA information including:
• SDG&E Rule 27 Community Choice Aggregation Rulesf
• Community Choice Aggregation Cost Responsibility Surcharge (CRS)g
• Community Choice Aggregation Open Seasonh
• Transportation of Electric Power for Community Choice Aggregation Customeri
• Information Release to Community Choice Aggregatorj
• Frequently asked questions about San Diego Gas & Electric and community choice aggregationk
The City CCA program will be required to understand these rules and follow the prescribed processes to
ensure that the establishment of the CCA proceeds smoothly.
IOU CODE OF CONDUCT REGARDING CCAs
The CPUC has also established a Code of Conductl governing the treatment of CCAs by IOUs, committing
the CPUC to expedited resolution of CCA complaints and requiring collaborative comparison of retail
d SDG&E Schedule CCA Transportation of Electric Power for Community Choice Aggregation Customers:
http://regarchive.sdge.com/tm2/pdf/ELEC_ELEC-SCHEDS_CCA.pdf e SDG&E CCA Homepage: http://www.sdge.com/community-choice-aggregation f Rule 27 Community Choice Aggregation Rules: http://regarchive.sdge.com/tm2/pdf/ELEC_ELEC-RULES_ERULE27.pdf g Schedule CCA-CRS Community Choice Aggregation Cost Responsibility Surcharge:
http://regarchive.sdge.com/tm2/pdf/ELEC_ELEC-SCHEDS_CCA-CRS.pdf h Rule 27.2 Community Choice Aggregation Open Season: http://regarchive.sdge.com/tm2/pdf/ELEC_ELEC-
RULES_ERULE_27_2.pdf i Schedule CCA Transportation of Electric Power for Community Choice Aggregation Customer:
http://regarchive.sdge.com/tm2/pdf/ELEC_ELEC-SCHEDS_CCA.pdf j Schedule CCA-INFO Information Release to Community Choice Aggregator: http://regarchive.sdge.com/tm2/pdf/ELEC_ELEC-
SCHEDS_CCA-INFO.pdf k Frequently asked questions about San Diego Gas & Electric and community choice aggregation:
http://www.sdge.com/sites/default/files/documents/954815352/community-choice-aggregation-faq.pdf?nid=4166 l Decision 12-12-036, December 20, 2012 - Decision Adopting a Code of Conduct and Enforcement Mechanisms Related to
Utility Interactions with Community Choice Aggregators, Pursuant to Senate Bill 790:
http://www.cpuc.ca.gov/WorkArea/DownloadAsset.aspx?id=2572

APPENDIX C
City of San Diego Community Choice Aggregate Feasibility Study C-3| P a g e
electricity rates. These rules and procedures were intended to provide CCAs the ability to compete on an
equal basis with other LSEs, and to prevent IOUs from using their position or market power to undermine
the CCAs. The Code of Conduct rules are summarized in the Table C-2 below.
Table C-2: Summary of CPUC’s IOU Code of Conduct Regarding CCAs
IOU Required Code of Conduct CPUC Obligations IOU and CCA Required
Collaboration
No lobbying against a CCA except
through a shareholder funded
independent marketing division
functionally and physically
separate from the ratepayer utility
operations
A complaint filed by an existing
or prospective CCA alleging a
violation of an electrical
corporation’s obligation shall be
resolved in no more than 180
days following the filing of the
complaint although this
deadline may be extended under
certain circumstances.
Jointly prepared annual
neutral, complete, and
accurate written
comparison of IOU and CCA
average tariffs for each
customer class, sample bills
and generation portfolio
contents. Refrain from speaking on behalf of
CCA a program (or appearing to)
or making any statement relating
to CCA rates or terms and
conditions of service that is untrue
or misleading
Shall not discriminate between
own customers and those of a
CCA
May not refuse to make economic
sales of excess electricity to a CCA
Maintain a log of all complaints
submitted in writing relating to
services provided for the CCA and
CCA customers
CCA IMPLEMENTATION STEPS
The City CCA program will need to coordinate formation of the CCA with SDG&E. Necessary and
recommended steps for the CCA to perform in collaboration with SDG&E are summarized in the Table
C-3 below. Footnotes have been added to reference the rules and guidance discussed previously in this
Appendix C as well as other documents and references pertinent to fulfilling these CCA implementation
steps.

APPENDIX C
City of San Diego Community Choice Aggregate Feasibility Study C-4| P a g e
Table C-3: CCA Implementation Steps
CCA Implementation Steps
1. Sign a CCA Non-Disclosure Agreement (this was completed by the City to facilitate this Study)
2. Pass local ordinance authorizing CCA
3. File a CCA declaration with SDG&Em
4. Develop a detailed implementation plan
5. Make final determination by CCA stakeholders on whether to proceed with the CCA and approve
CCA implementation through a City ordinance
6. File the Implementation Plan with CPUC
7. Participate in Open Seasonn by filing a Binding Notice of Intent (BNI) with SDG&E to vintage the
Cost Responsibility Surcharge (CRS)o impact on CCA customers
8. Complete and confirm a Participant Information Form (PIF) with SDG&E
9. Complete and confirm an Electronic Funds Transfer Agreement with SDG&E
10. Develop and execute a CCA Service Agreement with SDG&E
11. Submit a DUNS number and complete SDG&E credit forms
12. Develop the Electronic Data Interchange (EDI) Trading Partner Profiles and execute an EDI Trading
Partner Agreement with SDG&Ep
13. Conduct and successfully complete EDI & compliance testing with SDG&Eq
14. Set up billing procedures for customers and with SDG&E
15. Activate a customer service center to process customer inquiries and opt-out requests as well as
handling service requests
16. Set up a voice response unit with SDG&E to facilitate opt-out notifications and customer inquiries
17. Provide mass enrollment information to SDG&E
18. Conduct a waiting period
19. Conduct pre-enrollment customer notifications of automatic enrollment, opt-out opportunity and
mechanism, and terms and conditions of service
m SCE Example CCA Declaration: https://www.sce.com/wps/wcm/connect/0ca1b19b-a7f9-423a-b86c-
68e4b2e970c5/081015_CCADeclaration_Form14770.pdf?MOD=AJPERES n Rule 27.2 Community Choice Aggregation Open Season: http://regarchive.sdge.com/tm2/pdf/ELEC_ELEC-
RULES_ERULE_27_2.pdf o SDG&E Schedule CCA-CRS, Community Choice Aggregation Cost Responsibility Surcharge:
http://regarchive.sdge.com/tm2/pdf/ELEC_ELEC-SCHEDS_CCA-CRS.pdf p SDG&E Trading Partner Agreement UDC Billing: http://www.sdge.com/documents/trading-partner-agreement-udc-billing q SDG&E Electronic Data Interchange Information: http://www.sdge.com/customer-choice/esp-information/electronic-data-
interchange-information

APPENDIX C
City of San Diego Community Choice Aggregate Feasibility Study C-5| P a g e
CCA Implementation Steps
20. Perform mass enrollment in phases; each mass enrollment conducted once per enrollment phase
21. Conduct post-enrollment customer notifications of automatic enrollment, opt-out opportunity
and mechanism, and terms and conditions of service; each post-enrollment notification conducted
once per enrollment phase
22. Pay SDG&E service fees and non-energy costs
One of the first steps to becoming a CCA is the development and filing of a CCA Implementation Plan
with the CPUC. PUC Section 366.2(c)r describes the requirements for a CCA Implementation Plan and is
provided here, in part, for reference:
“…(3) A community choice aggregator establishing electrical load aggregation pursuant
to this section shall develop an implementation plan detailing the process and
consequences of aggregation. The implementation plan, and any subsequent changes
to it, shall be considered and adopted at a duly noticed public hearing. The
implementation plan shall contain all of the following:
(A) An organizational structure of the program, its operations, and its funding.
(B) Ratesetting and other costs to participants.
(C) Provisions for disclosure and due process in setting rates and allocating costs
among participants.
(D) The methods for entering and terminating agreements with other entities.
(E) The rights and responsibilities of program participants, including, but not
limited to, consumer protection procedures, credit issues, and shutoff
procedures.
(F) Termination of the program.
(G) A description of the third parties that will be supplying electricity under the
program, including, but not limited to, information about financial, technical,
and operational capabilities.
(4) A community choice aggregator establishing electrical load aggregation shall
prepare a statement of intent with the implementation plan. Any community choice
load aggregation established pursuant to this section shall provide for the following:
(A) Universal access.
(B) Reliability.
r https://leginfo.legislature.ca.gov/faces/codes_displaySection.xhtml?sectionNum=366.2&lawCode=PUC

APPENDIX C
City of San Diego Community Choice Aggregate Feasibility Study C-6| P a g e
(C) Equitable treatment of all classes of customers.
(D) Any requirements established by state law or by the commission concerning
aggregated service, including those rules adopted by the commission pursuant to
paragraph (3) of subdivision (b) of Section 8341 for the application of the
greenhouse gases emission performance standard to community choice
aggregators.
(5) In order to determine the cost-recovery mechanism to be imposed on the community
choice aggregator pursuant to subdivisions (d), (e), and (f) that shall be paid by the
customers of the community choice aggregator to prevent shifting of costs, the
community choice aggregator shall file the implementation plan with the commission,
and any other information requested by the commission that the commission
determines is necessary to develop the cost-recovery mechanism in subdivisions (d), (e),
and (f).
(6) The commission shall notify any electrical corporation serving the customers
proposed for aggregation that an implementation plan initiating community choice
aggregation has been filed, within 10 days of the filing.
(7) Within 90 days after the community choice aggregator establishing load
aggregation files its implementation plan, the commission shall certify that it has
received the implementation plan, including any additional information necessary to
determine a cost-recovery mechanism. After certification of receipt of the
implementation plan and any additional information requested, the commission shall
then provide the community choice aggregator with its findings regarding any cost
recovery that must be paid by customers of the community choice aggregator to
prevent a shifting of costs….”
The CPUC cannot approve or deny the CCA Implementation Plan but will certify that it complies with
PUC Section 366.2(c)(3) requirements. The California Energy Commission (CEC) Public Interest Energy
Research (PIER) Program Community Choice Aggregation Pilot Project Appendix G Guidebook Section
3.0 Developing a Community Choice Aggregation Implementation Plans provides guidance for
developing a CCA Implementation Plan. Additionally, other CCA Implementation Plans are publicly
available for reference:
• Lancaster Choice Energyt
• Marin Clean Energyu
• Sonoma Clean Powerv
s Reference California Energy Commission (CEC) Public Interest Energy Research (PIER) Program Community Choice Aggregation
Pilot Project Appendix G Guidebook Section 3.0 Developing a Community Choice Aggregation Implementation Plan:
http://www.energy.ca.gov/2009publications/CEC-500-2009-003/CEC-500-2009-003.PDF t City of Lancaster CCA Implementation Plan: http://www.cityoflancasterca.org/home/showdocument?id=24349 u https://www.mcecleanenergy.org/wp-content/uploads/2016/06/Implementation_Plan_w-Resolution__JPA_10.4.12-
Richmond-Revised_1.22.13.pdf v https://sonomacleanpower.org/wp-content/uploads/2015/01/2015-SCP-Implementation-Plan.pdf

APPENDIX C
City of San Diego Community Choice Aggregate Feasibility Study C-7| P a g e
• County of Los Angeles Community Choice Energy Business Planw
• Inland Choice Power Community Choice Aggregation Business Planx
• San Jose Clean Energy Community Choice Aggregation Business Plany
CUSTOMER NOTIFICATIONS, OPT-OUT, AND ENROLLMENT
PUC Section 366.2(c)(3) contains several requirements regarding CCA customer notifications,
enrollment, and the right to opt-out of CCA service:
• Under community choice aggregation, customer participation may not require a positive written
declaration, but each customer shall be informed of his or her right to opt-out of the community
choice aggregation program.
• Following adoption of aggregation through the ordinance the program shall allow any retail
customer to opt-out and to continue to be served as a bundled service customer by the existing
electrical corporation, or its successor in interest.
• Once enrolled in the aggregated entity, any ratepayer that chooses to opt-out within 60 days or
two billing cycles of the date of enrollment may do so without penalty and shall be entitled to
receive default service
• The community choice aggregator shall fully inform participating customers at least twice within
two calendar months, or 60 days, in advance of the date of commencing automatic enrollment.
Notifications may occur concurrently with billing cycles. Following enrollment, the aggregated
entity shall fully inform participating customers for not less than two consecutive billing cycles.
Notification may include, but is not limited to, direct mailings to customers, or inserts in water,
sewer, or other utility bills. Any notification shall inform customers of both of the following:
o That they are to be automatically enrolled and that the customer has the right to opt-out
of the community choice aggregator without penalty.
o The terms and conditions of the services offered.
• The community choice aggregator may request the commission to approve and order the
electrical corporation to provide the notification required…in the electrical corporation’s
normally scheduled monthly billing process
o the electrical corporation shall be entitled to recover from the community choice
aggregator all reasonable incremental costs it incurs related to the notification or
notifications.
• Each notification shall also include a mechanism by which a ratepayer may opt-out of community
choice aggregated service.
• If an existing customer moves the location of his or her electric service within the jurisdiction of
the community choice aggregator, the customer shall retain the same subscriber status as prior
to the move, unless the customer affirmatively changes his or her subscriber status.
w http://file.lacounty.gov/green/cms1_247381.pdf x https://www.cvag.org/library/pdf_files/enviro/CCA_CVAG_WRCOG_SBCOG_Final_Feasibility_Study%20_12_08_16.pdf y http://www.sanjoseca.gov/DocumentCenter/View/65896

APPENDIX C
City of San Diego Community Choice Aggregate Feasibility Study C-8| P a g e
PHASED-IN IMPLEMENTATION OPTION
SDG&E Rule 27z details the CCA Specialized Service Request needed to utilize a phased-in approach. The
associated SDG&E fees are detailed in SDG&E Schedule CCAaa including the Mass Enrollment fee per
event of $3,600 and an additional $2,160 per phase.
ELECTRONIC COMMUNICATIONS AND COMPLIANCE TESTING
Communications with IOUs are vital to ensuring successful transactions related to electric meter reading
and billing. IOUs utilize the EDIbb standard to facilitate the electronic communications and data exchange
with CCAs. As part of the process of working with SDG&E to establish the CCA, SDG&E must conduct
EDI testing to ensure that operational data exchange is functioning prior to the CCA commencing service.
z Rule 27 Community Choice Aggregation Rules: http://regarchive.sdge.com/tm2/pdf/ELEC_ELEC-RULES_ERULE27.pdf aa Schedule CCA Transportation of Electric Power for Community Choice Aggregation Customer:
http://regarchive.sdge.com/tm2/pdf/ELEC_ELEC-SCHEDS_CCA.pdf bb SDG&E Electronic Data Interchange (EDI) Information: http://www.sdge.com/customer-choice/esp-information/electronic-
data-interchange-information

APPENDIX D
LOAD FORECAST DEVELOPMENT

This page intentionally left blank.

APPENDIX D LOAD FORECAST DEVELOPMENT
Appendix D provides further discussion and detail of the methodology and assumptions used in the
analysis of historical load data and the forecasting of future City CCA program load over the Study period.
HISTORICAL CUSTOMER USAGE
To assess CCA feasibility and plan for CCA operations, the City obtained energy usage information for its
potential customers from SDG&E through its CCA information tariff “Schedule CCA-INFO.”1 SDG&E
provided aggregate customer and usage data for years 2013 to 2015, including:
1. Proportional share of energy efficiency funds for the City CCA program’s proposed service area,
as defined in the California Public Utility Commission (CPUC) energy efficiency policy manual;
2. Public Goods Charge customer payments by city code;
3. Most recent 5-year average coincident load factors by rate class;
4. Most recent 5-year average non-coincident load factors by rate class;
5. Mapping of customer rate schedule to rate class;
6. Monthly aggregated participation data already tracked for energy efficiency programs and
reported to the CPUC;
7. Distribution loss factors for primary and secondary level of service;
8. Dynamic load profiles;
9. Aggregate annual usage (kWh) by customer class, rate class, city code, rate schedule, zip code,
and climate zone;
10. Aggregate monthly usage (kWh) by customer class, rate class, city code, rate schedule, zip code,
and climate zone;
11. Number of accounts in each rate schedule within the City CCA program’s service area;
12. Direct Access vs. bundled aggregate annual usage by customer class and city code;
13. Direct Access vs. bundled monthly usage by rate class;
14. Non-residential customer specific information consisting of account name, account number,
service address, mailing address, and e-mail address for all accounts, within the City CCA
program’s service area; and
15. Customer specific information: account number, meter number, monthly kWh usage, time-of-
use (TOU) usage consumption and maximum monthly demand (where applicable), billing days,
and rate schedule, for all accounts within the CCA’s service area.2
The data provided by SDG&E was reviewed and analyzed and forms the basis for the load forecast used
within this Study. This load forecast provides the foundation for the CCA feasibility analysis.
1 SDG&E Schedule CCA-INFO: Information Release to Community Choice Aggregators
http://regarchive.sdge.com/tm2/pdf/ELEC_ELEC-SCHEDS_CCA-INFO.pdf 2 SDG&E declined to provide the number of DA customers and load by customer class; therefore, the data presented
pertaining to DA customers could only be analyzed on an annual energy basis.

APPENDIX D
City of San Diego Community Choice Aggregate Feasibility Study D-2| P a g e
The analysis of SDG&E-provided load data focused on bundled customers with the assumption that
Direct Access customers would continue with their current Electric Service Provider (ESP) and either
opt-out of the CCA or be excluded from CCA enrollment.
For this Study, the total load within the City CCA program’s service area was analyzed to determine the
load profile for a 24-hour period for each month. SDG&E supplied load profiles3 corresponding to the
date range of the CCA-INFO data. Hourly load profiles provide the hourly customer usage by rate class
based on the monthly usage for that rate class. The rate class categories for this Study are summarized
in Table D-1.
Table D-1: Customer Categories
Customer Category Electricity
Demand
(kW/day)
Large Commercial/Industrial > 20kW
Small Commercial/Industrial <= 20kW
Outdoor Lighting N/A
Large Agricultural > 20kW
Small Agricultural <= 20kW
Residential N/A
Residential Outdoor Lighting N/A
Figures D-1 and D-2 illustrate the average demand by hour, in kW (and thus the average energy usage by
hour, in kWh) for each of the aggregated rate classes by month for both weekdays and
weekends/holidays, respectively. Because of the different demand characteristics associated with
weekdays and weekends/holidays, these data results are analyzed separately. This data does not include
the Direct Access customers and represents the entire pool of bundled customers—those participating
in the CCA and those opting out of the CCA.
3 SDG&E Customer Load Profiles: http://www.sdge.com/customer-choice/customer-load-profiles/customer-load-profiles
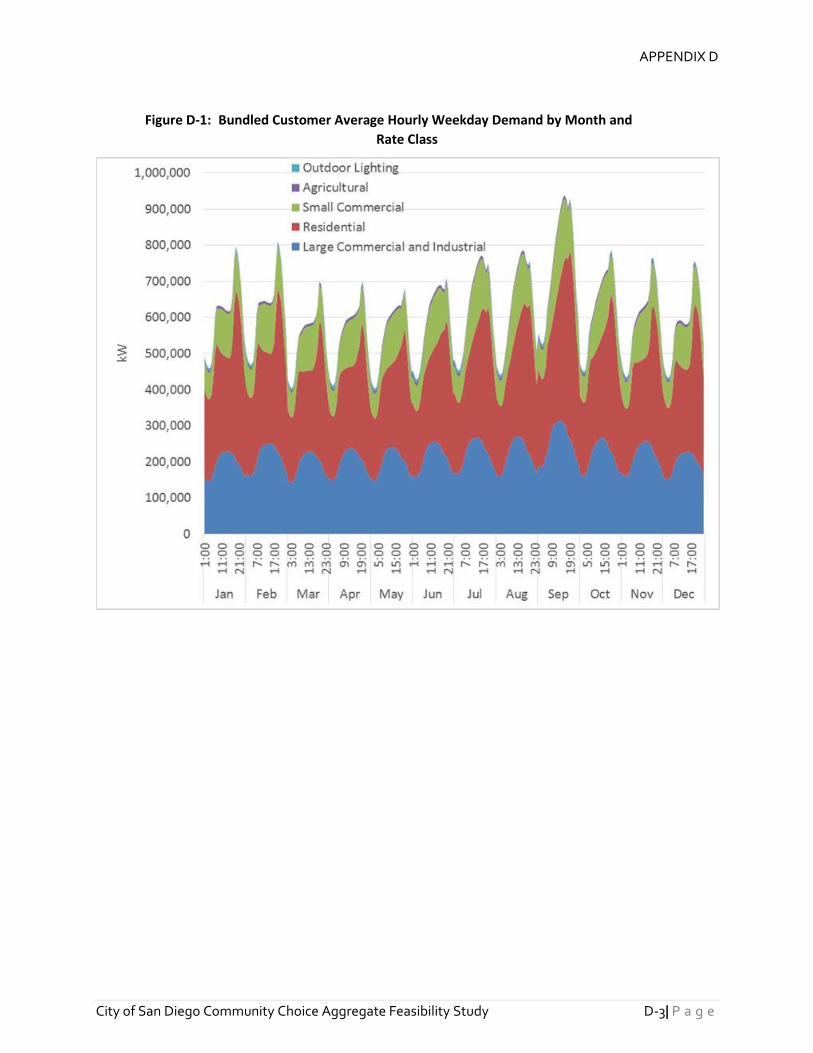
APPENDIX D
City of San Diego Community Choice Aggregate Feasibility Study D-3| P a g e
Figure D-1: Bundled Customer Average Hourly Weekday Demand by Month and
Rate Class

APPENDIX D
City of San Diego Community Choice Aggregate Feasibility Study D-4| P a g e
Figure D-2: Bundled Customer Average Hourly Weekend/Holiday Demand by
Month and Rate Class
The evaluation of historic SDG&E load data provided a baseline for forecasting future consumption. To
develop a forecast of future usage, the Monte Carlo simulation model (MCSM) was used to statistically
analyze the range of energy usage as well as power supply costs (power supply cost forecasting
methodology is discussed in further detail in Appendix E). Using the historic baseline data, the MCSM
analyzed the statistical range of possible outcomes and developed confidence intervals for the expected
range of energy usage and demand for each hour of each month.
Analysis of the historical average demand and standard
deviation for every given hour of every given day of every
given month (with differentiation between weekdays and
weekends), was used to develop a 95% probability or
confidence that the demand will be within “confidence
interval” range above or below the average. This specified
range (low end to high end) is the confidence interval, and it
is expressed in percentages. Put another way, this equates to
an expectation, with 95% confidence, that demand within
The historical maximum
peak demand and minimum
demand fall outside of the
95% confidence interval
range.

APPENDIX D
City of San Diego Community Choice Aggregate Feasibility Study D-5| P a g e
any given hour will be between the low end of the range and the high end of the range, based on historical
sample data.
Figures D-3 and D-4 combine the individual rate classes together to illustrate the maximum, minimum,
and average demand for each hour of each month for the bundled customers in the City CCA program’s
service area, while once again separating weekdays (Figure D-3) from weekends/holidays (Figure D-4). In
addition to maximum, minimum and average demand, these Figures also illustrate the 95% confidence
interval (CI) around the average derived from the Monte Carlo simulation (+95% CI and -95% CI).
The upper band 95% CI represents a 95% statistical probability that the demand for any given hour will
be equal to or less than the upper band 95% CI. Comparison of the 95% CI range to the maximum and
minimum demand shows that the maximum demand peaks and minimum demand lows fall outside of
the 95% confidence interval range. The statistically-based load profile generated by the MCSM
represents the range of the likeliest outcomes and quantifies the chance of actual demand falling outside
of the predicted range. These data indicate that, for both weekdays and weekend/holiday time periods,
significant demand variability exists from May through October, with less variability during winter and
early spring.
Figure D-3: Bundled Customer Weekday Minimum, Average and Maximum
Estimated Demand

APPENDIX D
City of San Diego Community Choice Aggregate Feasibility Study D-6| P a g e
Figure D-4: Bundled Customer Weekend/Holiday Maximum, Average and
Minimum Estimated Demand
Multiple factors will likely influence changes in load profile shapes and predictability, including:
• Customer-owned solar photovoltaic (PV) distributed generation installations have the effect of
lowering overall demand and increasing the intermittency and variability of demand served by
the LSE as clouds and other factors influence the output of the solar panels. As more customers
adopt rooftop solar PV, changes in profile shapes may be more dramatic.
• Plug-in electric vehicles (PEVs) can draw as much electricity as the rest of the home and have
the effect of dramatically increasing customer electric demand. Utilities are developing specific
PEV rate structures to incentivize customers to charge their vehicles at certain times of day. As
more customers adopt PEVs and LSEs implement PEV rate structures, profile shapes will be
impacted.
SAN DIEGO MUNICIPAL ACCOUNT USAGE
The City had originally considered multiple phasing-in options of various customer classes, including a
phasing in of City of San Diego municipal accounts (those paid by the City). Using the historical SDG&E
load data, an analysis was performed to determine the electricity demand for municipal accounts.
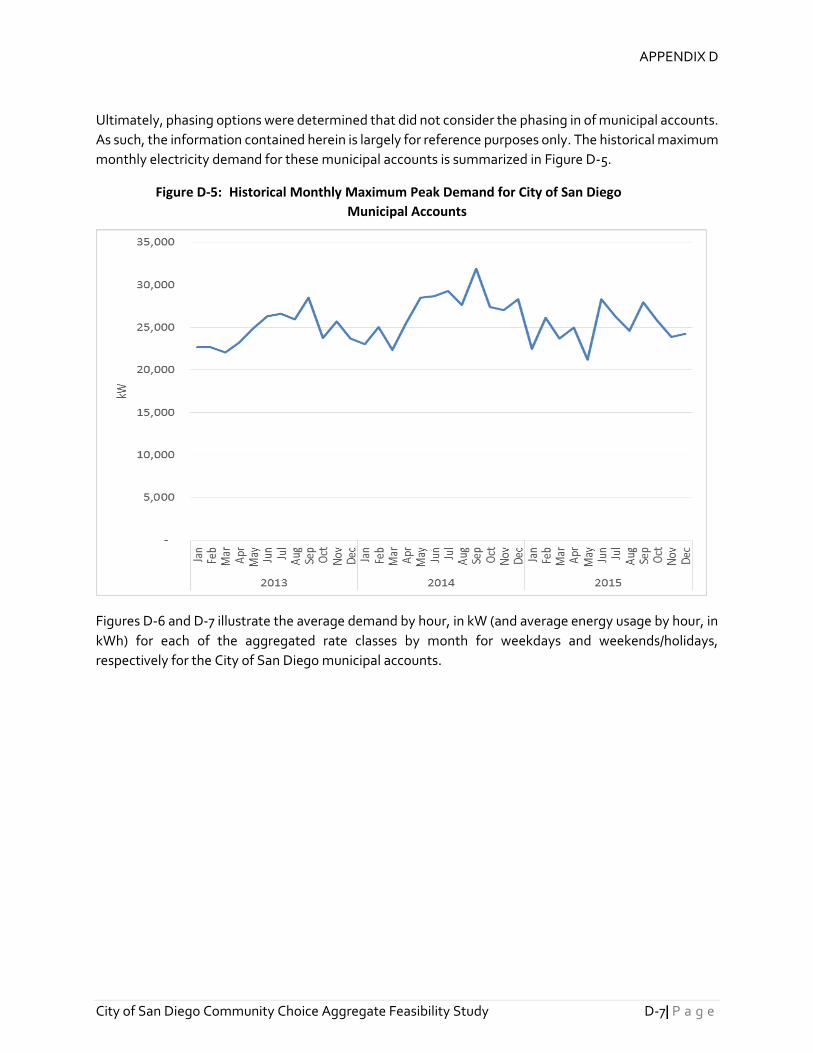
APPENDIX D
City of San Diego Community Choice Aggregate Feasibility Study D-7| P a g e
Ultimately, phasing options were determined that did not consider the phasing in of municipal accounts.
As such, the information contained herein is largely for reference purposes only. The historical maximum
monthly electricity demand for these municipal accounts is summarized in Figure D-5.
Figure D-5: Historical Monthly Maximum Peak Demand for City of San Diego
Municipal Accounts
Figures D-6 and D-7 illustrate the average demand by hour, in kW (and average energy usage by hour, in
kWh) for each of the aggregated rate classes by month for weekdays and weekends/holidays,
respectively for the City of San Diego municipal accounts.

APPENDIX D
City of San Diego Community Choice Aggregate Feasibility Study D-8| P a g e
Figure D-6: Average Hourly Weekday Demand for City of San Diego Municipal
Accounts by Month and Rate Class

APPENDIX D
City of San Diego Community Choice Aggregate Feasibility Study D-9| P a g e
Figure D-7: Average Hourly Weekend/Holiday Demand for City of San Diego
Municipal Accounts by Month and Rate Class
TEMPERATURE AND ENERGY USAGE CORRELATION
Temperature and humidity are large drivers of energy usage in California because a significant source of
usage is air conditioning. Hot weather increases air conditioning usage and humidity levels impact the
efficiency, and thus the energy use, of air conditioning systems. As a result, power procurement planners
must look closely at weather forecasts to refine energy and capacity forecasts. Figures D-8 and D-9
illustrate the electric consumption by end-use for SDG&E’s Commercial customers for the Coastal and
Inland Regions, respectively. Figure D-10 shows this same consumption data for all Residential
customers.
According to the U.S. Department of Energy, approximately 6% of electricity produced in the U.S. is used
for air conditioning.4 San Diego’s relatively mild climate attributes to its proportional use of power for
air conditioning. A very small portion of usage goes to heating. And although cooling load is significant
in the area, in some parts of the country, Commercial and Residential customer classes might see a larger
portion of their usage attributable to cooling and air conditioning load.
4 U.S. Department of Energy website: https://energy.gov/energysaver/air-conditioning

APPENDIX D
City of San Diego Community Choice Aggregate Feasibility Study D-10| P a g e
Figure D-8: SDG&E Commercial Electricity Usage, Coastal Region5
Figure D-9: SDG&E Commercial Electricity Usage, Inland Region6
5 Itron California Commercial End Use Survey, 2006: http://capabilities.itron.com/CeusWeb/ChartsSF/Default2.aspx 6 Ibid.

APPENDIX D
City of San Diego Community Choice Aggregate Feasibility Study D-11| P a g e
Figure D-10: SDG&E Residential Class Electricity Usage, All Regions7
For the purposes of this Study, the MCSM assumes a similar range and frequency of temperatures as was
encountered during years 2013-2015. Therefore, the temperature variation is embedded in the historical
peak demand and usage data received by SDG&E.
Statistically, SDG&E customer usage can be correlated to temperature as illustrated in Table D-2. The
results indicate that, at temperatures over 70° F, temperature and electricity usage are correlated. The
analysis included the effect of humidity on energy demand, using what is known as “wet bulb” analysis
that incorporates both outdoor air temperature and dew point depression.8 The results indicate a low
correlation between energy use and humidity, likely due to San Diego’s relatively dry climate.
7 California Energy Commission - 2009 California Residential Appliance Saturation Study
http://www.energy.ca.gov/2010publications/CEC-200-2010-004/CEC-200-2010-004-ES.PDF 8 Shortcut to calculating wet bulb temperature: http://theweatherprediction.com/habyhints/170/

APPENDIX D
City of San Diego Community Choice Aggregate Feasibility Study D-12| P a g e
Table D-2: Temperature to Electricity Usage Correlation9
Weekday Weekend / Holiday
Month Dry Bulb Correlation Wet Bulb Correlation Dry Bulb
Correlation
Wet Bulb
Correlation
1 0.33 0.14 0.11 0.09
2 0.31 0.11 0.26 0.25
3 0.38 0.08 0.40 0.12
4 0.51 0.12 0.36 0.40
5 0.61 0.08 0.61 0.63
6 0.64 0.63 0.59 0.59
7 0.66 0.63 0.54 0.50
8 0.81 0.80 0.76 0.75
9 0.83 0.82 0.73 0.73
10 0.56 0.58 0.76 0.33
11 0.62 0.19 0.49 0.16
12 0.38 0.14 0.32 0.10
Temp Dry Bulb Correlation Wet Bulb Correlation Dry Bulb
Correlation
Wet Bulb
Correlation
<70○ Fahrenheit 0.20 0.28 0.13 0.30
>=70○ Fahrenheit 0.63 0.13 0.61 0.17
Figure D-11 illustrates weekday usage variability relative to temperature and Figure D-12 illustrates
weekend/holiday electricity usage variability relative to temperature for bundled customers. In both
Figures, usage rises more sharply at temperatures above 70° F.
9 National Oceanic and Atmospheric Administration (http://gis.ncdc.noaa.gov/map/viewer/#app=cdo) and wet bulb
temperature derivation (http://theweatherprediction.com/habyhints/170/)

APPENDIX D
City of San Diego Community Choice Aggregate Feasibility Study D-13| P a g e
Figure D-11: Weekday Bundled Electricity Usage Variability for Temperature

APPENDIX D
City of San Diego Community Choice Aggregate Feasibility Study D-14| P a g e
Figure D-12: Weekend / Holiday Bundled Electricity Usage Variability for
Temperature
This discussion on temperature and energy usage correlation is intended to illustrate one of the
considerations for forecasting near-term CCA load forecasts. Medium and short term PPAs can be
purchased if the weather forecast is predicting hotter or more humid weather than expected.
Additionally, if the weather forecast is for cooler or less humid than expected, excess energy already
procured by the CCA can be sold. Otherwise, excess energy will need to be sold through CAISO markets
and shortfall energy will need to be purchased through CAISO markets.
Because the results of this demand and temperature analysis showed relatively low correlation, this
Study did not consider the effect of possibly rising energy needs associated with a potentially warmer
climate.
CUSTOMER USAGE FORECAST
The Study relied on the annual electricity usage for SDG&E’s entire service territory from 2001 to 2015,
as reported in the U.S. Department of Energy’s Energy Information Administration’s Form EIA-826,10 to
develop a curve fit forecast of electric energy consumption through 2035. Using the historical SDG&E-
provided data for 2013-2015 and the EIA-826 data, the load growth shape (slope of the curve) was
extrapolated to the subset of bundled customer energy consumption within the City of San Diego as
shown in Figure D-13. The green curve labeled “CCA Usage Forecast” is the baseline forecast for electric
10 DOE Energy Information Agency, Form EIA-826Monthly SDG&E Delivery & Sales 2010-2015:
http://www.eia.gov/electricity/data/eia826/
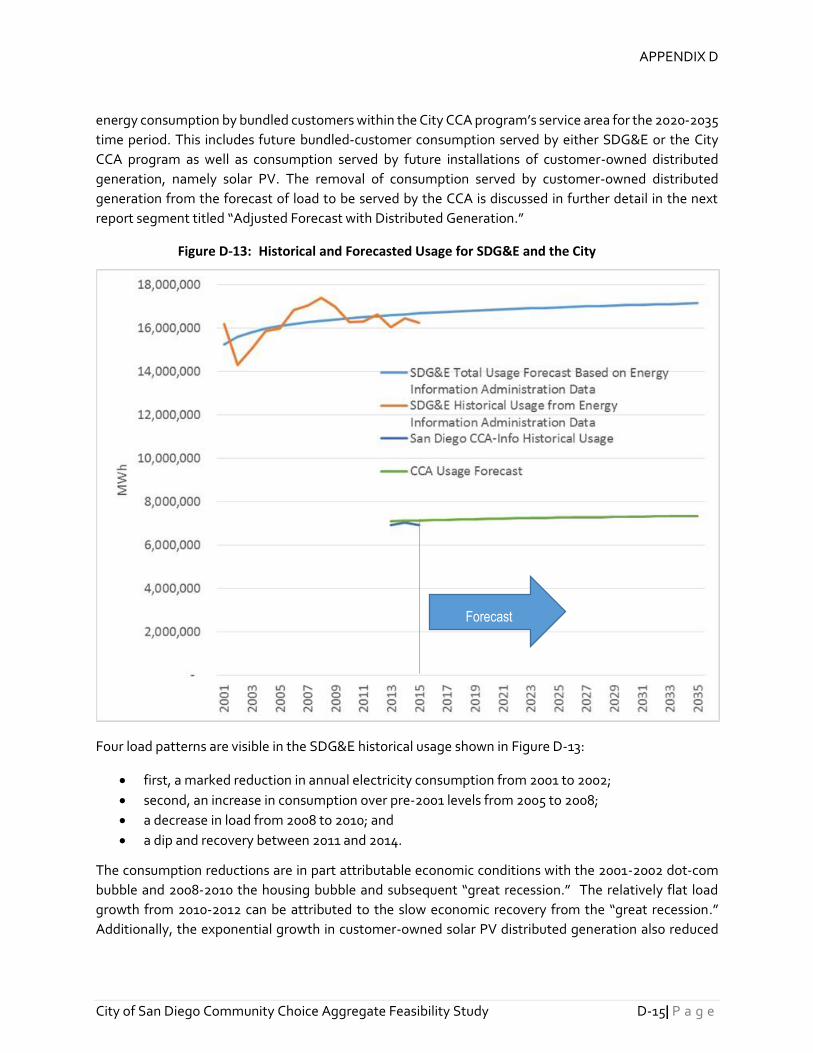
APPENDIX D
City of San Diego Community Choice Aggregate Feasibility Study D-15| P a g e
energy consumption by bundled customers within the City CCA program’s service area for the 2020-2035
time period. This includes future bundled-customer consumption served by either SDG&E or the City
CCA program as well as consumption served by future installations of customer-owned distributed
generation, namely solar PV. The removal of consumption served by customer-owned distributed
generation from the forecast of load to be served by the CCA is discussed in further detail in the next
report segment titled “Adjusted Forecast with Distributed Generation.”
Figure D-13: Historical and Forecasted Usage for SDG&E and the City
Four load patterns are visible in the SDG&E historical usage shown in Figure D-13:
• first, a marked reduction in annual electricity consumption from 2001 to 2002;
• second, an increase in consumption over pre-2001 levels from 2005 to 2008;
• a decrease in load from 2008 to 2010; and
• a dip and recovery between 2011 and 2014.
The consumption reductions are in part attributable economic conditions with the 2001-2002 dot-com
bubble and 2008-2010 the housing bubble and subsequent “great recession.” The relatively flat load
growth from 2010-2012 can be attributed to the slow economic recovery from the “great recession.”
Additionally, the exponential growth in customer-owned solar PV distributed generation also reduced
Forecast

APPENDIX D
City of San Diego Community Choice Aggregate Feasibility Study D-16| P a g e
the electricity usage served by SDG&E. Other factors contributing to the relatively flat load growth from
2010-2015 include energy efficiency inroads for existing housing stock, appliances, and light bulbs—
progressing from incandescent to compact fluorescent and now to light emitting diode (LED) bulbs.
In addition to these factors contributing to lower electricity consumption, there are also factors that
contribute to increasing electricity demand including:
• Plug-in Electric Vehicles
• Proliferation of consumer electronics including smart phones and tablet computers–although
there is now emphasis on better energy efficiency for these devices
• Economic growth
To check the reasonableness of CCA Usage Forecast used within the Study, it was compared it to the
SDG&E Long Term Procurement Plan (LTPP)11, including SDG&E’s Draft 2014 LTPP Table A-2 (Energy),12
as well as the CPUC Order Instituting Rulemaking to Integrate and Refine Procurement Policies and
Consider Long-Term Procurement Plans.13 Figure D-14 compares the SDG&E Draft 2014 LTPP and the
CCA Usage Forecast depicted in Figure D-13.
11 SDG&E Long Term Procurement Plan Proceeding, Docket Number: R.12-03-014, Filing Date: Thursday, March 22, 2012:
http://www.sdge.com/regulatory-filing/3520/long-term-procurement-plan-proceeding 12 SDG&E’s Draft 2014 Long-Term Procurement Plan: https://www.sdge.com/sites/default/files/regulatory/PUBLIC-SDGE-
Bundled-Plan.pdf 13 CPUC Order Instituting Rulemaking to Integrate and Refine Procurement Policies and Consider Long-Term Procurement Plans
Rulemaking 13-12-010: https://apps.cpuc.ca.gov/apex/f?p=401:56:0::NO:RP,57,RIR:P5_PROCEEDING_SELECT:R1312010
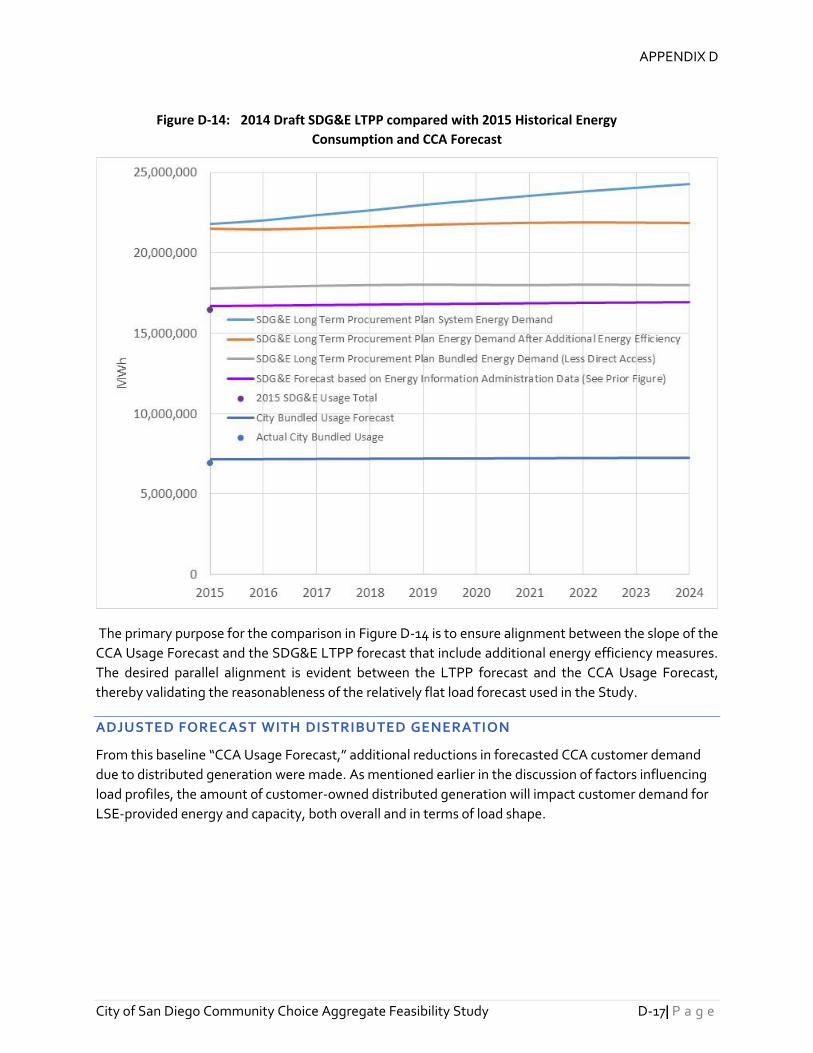
APPENDIX D
City of San Diego Community Choice Aggregate Feasibility Study D-17| P a g e
Figure D-14: 2014 Draft SDG&E LTPP compared with 2015 Historical Energy
Consumption and CCA Forecast
The primary purpose for the comparison in Figure D-14 is to ensure alignment between the slope of the
CCA Usage Forecast and the SDG&E LTPP forecast that include additional energy efficiency measures.
The desired parallel alignment is evident between the LTPP forecast and the CCA Usage Forecast,
thereby validating the reasonableness of the relatively flat load forecast used in the Study.
ADJUSTED FORECAST WITH DISTRIBUTED GENERATION
From this baseline “CCA Usage Forecast,” additional reductions in forecasted CCA customer demand
due to distributed generation were made. As mentioned earlier in the discussion of factors influencing
load profiles, the amount of customer-owned distributed generation will impact customer demand for
LSE-provided energy and capacity, both overall and in terms of load shape.

APPENDIX D
City of San Diego Community Choice Aggregate Feasibility Study D-18| P a g e
Looking at the historical trend, the California Solar Initiative’s currently connected data set14 shows that
within the City of San Diego, there has been nearly exponential growth in customer-owned solar PV
installed capacity since 1999. This trend is illustrated in Figure D-15.
Figure D-15: California Solar Initiative Incentivized Customer-Owned Solar PV in
the City of San Diego
To understand the impact of customer-owned solar PV distributed generation in San Diego, a generation
profile was developed using the National Renewable Energy Laboratory’s (NREL’s) PVWatts calculator.15
Figures D-16 and D-17 illustrate the load served by customer-owned solar PV distributed generation, over
and above the load currently served by SDG&E for weekdays and weekends/holidays, respectively. The
red curve on top of the green curve represents the total level of energy demanded by customers,
including that served by solar PV generation.
14 California Distributed Generation Statistics Currently Interconnected Data Set (Current as of Aug. 30, 2016):
http://www.californiadgstats.ca.gov/ 15 National Renewable Energy Laboratory (NREL) PVWatts® Calculator http://pvwatts.nrel.gov/

APPENDIX D
City of San Diego Community Choice Aggregate Feasibility Study D-19| P a g e
Figure D-16: Average Weekday City of San Diego Bundled Demand, Served by
SDG&E and Served by Customer-Owned PV
Figure D-17: Average Weekend/Holiday City of San Diego Bundled Demand, Served
by SDG&E and Served by Customer-Owned PV

APPENDIX D
City of San Diego Community Choice Aggregate Feasibility Study D-20| P a g e
Over the load forecast horizon, expansion of customer-owned solar PV is expected to continue, reducing
electric energy demand served by either SDG&E or the CCA. With respect to the CCA load forecast, the
question becomes how will customer-owned solar PV impact future loads. To answer this, the historical
San Diego-specific solar PV installation data from California Distributed Generation Statistics16 (formerly
California Solar Statistics) was extrapolated into a forecast for 2020-2035 as illustrated in Figure D-18.
Figure D-18: Customer Owned Solar PV Projection through 2035
Table D-3 includes the minimum, average, upper bound 95% confidence interval, and maximum load
forecasts for 2020-2035. For each forecast, the “Net Simulated Annual MWh” column removes from the
“Simulated Annual MWh” column the energy produced by the installations of solar PV distributed
generation to estimate the net load that would be served by the LSE (SDG&E or the City CCA program).
This net load forecast illustrates that less and less LSE-provided power will be sold over time as solar PV
distributed generation continues to proliferate. Under no forecast is a future year’s net load projected to
be higher than year 2020.
16 California Distributed Generation Statistics: http://www.californiadgstats.ca.gov/
Forecast

APPENDIX D
City of San Diego Community Choice Aggregate Feasibility Study D-21| P a g e
Table D-3: Distributed Generation Adjusted Customer Usage Forecast
Minimum Average 95% CI Maximum
Year Net
Simulated
Month
MWh
Simulated
Month
MWh
Net
Simulated
Month
MWh
Simulated
Month
MWh
Net
Simulated
Month
MWh
Simulated
Month
MWh
Net
Simulated
Month
MWh
Simulated
Month
MWh
2020 7,087,871 7,187,191 7,117,801 7,216,409 7,129,503 7,216,771 7,147,447 7,245,645
2021 7,059,693 7,182,264 7,086,807 7,209,345 7,098,102 7,209,345 7,117,198 7,240,004
2022 7,043,373 7,188,665 7,074,154 7,219,150 7,086,700 7,219,150 7,108,377 7,253,669
2023 7,025,019 7,193,274 7,063,426 7,230,447 7,077,799 7,230,447 7,100,016 7,265,765
2024 7,035,430 7,224,777 7,071,428 7,259,531 7,084,168 7,259,531 7,104,618 7,291,144
2025 7,005,424 7,212,815 7,036,459 7,242,997 7,048,318 7,242,997 7,063,939 7,269,051
2026 7,000,604 7,228,916 7,032,092 7,258,511 7,044,270 7,258,511 7,060,759 7,286,946
2027 6,995,457 7,242,391 7,026,422 7,270,167 7,038,783 7,270,167 7,059,388 7,300,978
2028 7,005,412 7,264,396 7,037,275 7,294,165 7,050,206 7,294,165 7,070,926 7,325,561
2029 6,988,348 7,256,771 7,015,320 7,283,299 7,026,284 7,283,299 7,042,480 7,310,325
2030 6,979,918 7,257,910 7,014,284 7,291,482 7,026,740 7,291,482 7,046,320 7,321,843
2031 6,983,958 7,271,071 7,013,005 7,298,152 7,024,550 7,298,152 7,043,294 7,325,459
2032 7,005,261 7,298,666 7,036,775 7,328,989 7,048,259 7,328,989 7,062,802 7,355,753
2033 6,993,430 7,286,082 7,026,548 7,317,417 7,040,691 7,317,417 7,063,522 7,350,782
2034 7,000,402 7,293,358 7,034,491 7,325,790 7,047,360 7,325,790 7,065,132 7,353,889
2035 7,008,934 7,300,539 7,038,361 7,328,088 7,050,004 7,328,088 7,066,162 7,354,998
Figure D-19 shows the effect of customer-owned distributed generation on the amount of energy served
by an LSE within the City CCA program’s service area (either SDG&E or the CCA). The bottom set of four
lines represent the Net Load Forecast Trend, compared to the top four lines that represent the forecast
without the removal of load served by distributed generation. This Figure illustrates while the overall
demand for energy within the City is expected to rise across the forecast period, the effect of distributed
generation reduces the amount of energy sold by the LSEs. Note that this trend is affecting all LSEs in
California and would not be unique to a potential CCA in San Diego.

APPENDIX D
City of San Diego Community Choice Aggregate Feasibility Study D-22| P a g e
Figure D-19: Load Forecast and Net Load Forecast
The following Appendix E discusses how the Net Load Forecast was used to develop power procurement
costs, including additional detail regarding Monte Carlo-style hourly simulations of load.
Net Load
Forecast Trend

APPENDIX E
POWER COST DEVELOPMENT

This page intentionally left blank.

APPENDIX E POWER COST DEVELOPMENT
Appendix E discusses energy supply considerations as well as additional detail and discussion regarding
the methodology and assumptions used to develop the power supply costs for each supply Scenario
within the Study.
ENERGY SUPPLY CONSIDERATIONS
As discussed in the main body of this report, a core goal for the City CCA program is to develop an energy
supply portfolio with lower greenhouse gas (GHG) emissions and at a faster rate than SDG&E’s energy
supply portfolio is forecast to offer. In addition, the City CCA program would prioritize the development
of local renewable resources with diverse energy options for customers. Most other CCAs have similar
goals. For example, Lancaster Clean Energy decided to develop the initial CCA energy portfolio with a
renewables component at 35% in their first year in order to exceed the California Public Utility
Commission’s (CPUC’s) 2020 Renewable Portfolio Standard (RPS) goal of 33%. Lancaster Clean Energy’s
plan is to expand renewable supply resources over time. Because the location of Lancaster is very
conducive to local solar and regional wind generation resources, this CCA is well situated to meet its
supply needs with local renewable resources.
The energy supply portfolio for a Load Serving Entity (LSE) in California, whether IOU or CCA, is typically
comprised of three primary sources:
1. Self-supplied generation from assets the LSE owns (or contractually controls) and operates;
2. Power Purchase Agreement (PPA)-procured generation through bi-lateral contracts with
independent power producers;
3. California Independent System Operator (CAISO) day-ahead and real-time market purchases.
LSEs develop multi-year integrated resource plans to evaluate energy resources; and these plans
incorporate a host of demand-side and supply-side drivers, including the integration of energy efficiency
programs and objectives. A well-executed integrated resource plan results from a tested and rigorous
planning process. The primary goal is to assess a full range of resource alternatives under a variety of
scenarios to provide reliable service to customers at the lowest possible cost. There may be other
important goals at play as well, such as resource diversity, environmental stewardship, and energy
independence, among others.
The primary components or tasks involved with integrated resource planning are:
1. Identify and prioritize the planning goals to be achieved and identify any supply-side or demand-
side planning constraints;
2. Identify, discuss, and confirm the assumptions used for all aspects of the IRP with technical
experts and relevant stakeholders;
APPENDIX E
City of San Diego Community Choice Aggregate Feasibility Study E-2| P a g e
3. Model and evaluate—from operational, economic, and financial perspectives—the various
supply-side and demand-side options, under a variety of future scenarios, to develop a resource
plan that best achieves stated goals and objectives at the least-possible cost;
4. Receive and use diverse stakeholder feedback and communicate the planning process so the
process is understood and endorsed;
5. Communicate the results of the plan so that they are understood and endorsed and the plan can
move forward.
The resulting integrated resource plan provides guidance and direction to energy supply managers for
procurement activities over the planning time horizon. Generally, these integrated resource plans are
updated on a regular basis. For most utilities facing changing load patterns, shortfalls or overages of
available generation, susceptibility to volatile market prices, or other cost drivers that may be difficult to
quantify over a longer-term, these plans are updated every one or two years.
In general, for any electric energy demand to be served, specific power products must be procured.
Because electric energy is currently not readily stored at a large scale, electricity production is matched
to electric consumption instantaneously. The nature of the electric system is that it is managed to be self-
balancing—that is, dispatchable generation resources will move to match load, either increasing or
decreasing in real time. The specific power products are designed to keep the system in balance and
allocate costs fairly; and they have different characteristics depending on type (such as energy- or
capacity-related), specific services (such as ancillary services), and taking into consideration market costs
(CASIO uplift charges, for example).
Managing an energy supply portfolio is an exercise in forecasting demand requirements under various
scenarios and identifying the types of energy supply portfolio resources needed to most cost-effectively
meet the requirements over a specific period. Most LSEs use a risk management approach for energy
supply which is designed to seek a combination of fixed and variable cost options while identifying and
quantifying the associated risks. Risk is mitigated through diversified supply technologies, sizes, and
locations as well as contract terms, lengths, and timing. Managing an energy supply portfolio is an active,
daily responsibility. An LSE can manage this activity internally or can outsource this function to a third-
party supplier.
Mitigating risk for a supply portfolio is more difficult when the supply comes predominately from a single,
specific generation source (such as a or a single plant) or a single type of generation that may be subject
at the same time to conditions affecting their output (such as several wind farms located in the same
geographic region). In the case of the power supply portfolio options explored in this Study, renewable
energy is providing between half and all of the energy supply. While geothermal generation has
predictable output like fossil fuel generation, solar and wind generation is intermittent. The forecast
accuracy for wind and solar generation is getting better, but when customer-side and supply-side
renewable generation output varies from expectations, it often results in both high and low CAISO prices.
The high adoption rates for customer-owned solar PV distributed generation as well as large numbers of
utility-scale renewable resources increase exposure to CAISO price spikes and troughs, particularly under
the following conditions:
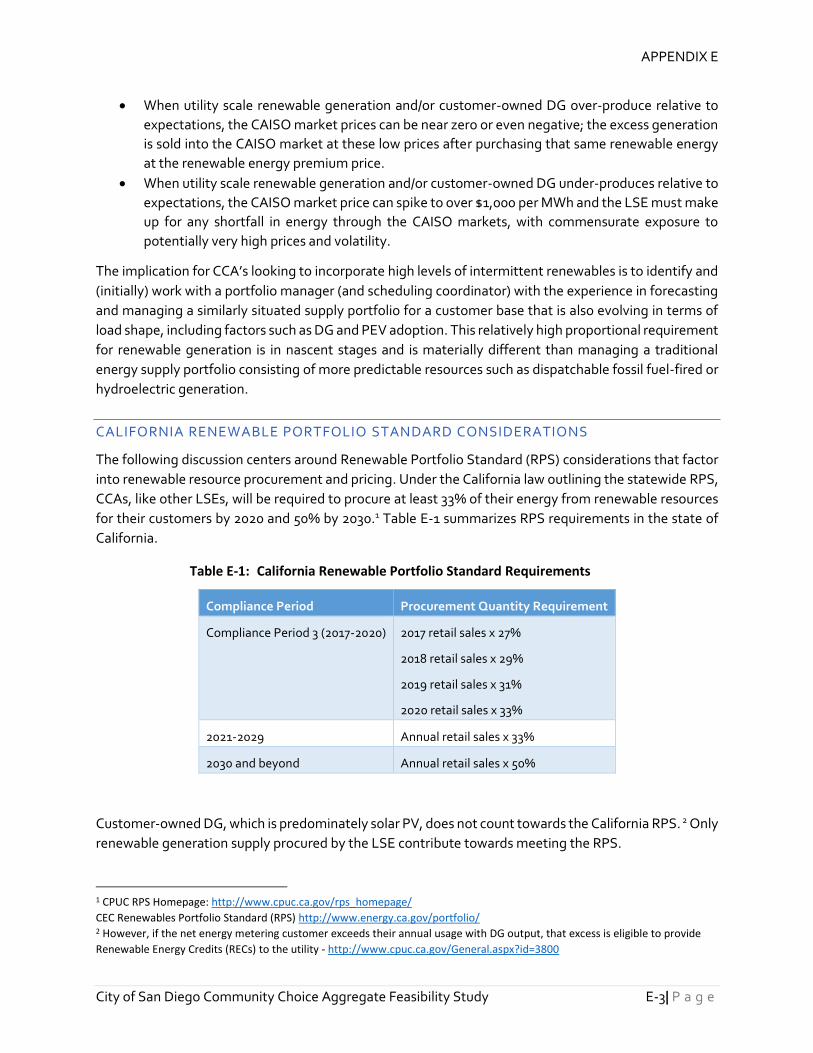
APPENDIX E
City of San Diego Community Choice Aggregate Feasibility Study E-3| P a g e
• When utility scale renewable generation and/or customer-owned DG over-produce relative to
expectations, the CAISO market prices can be near zero or even negative; the excess generation
is sold into the CAISO market at these low prices after purchasing that same renewable energy
at the renewable energy premium price.
• When utility scale renewable generation and/or customer-owned DG under-produces relative to
expectations, the CAISO market price can spike to over $1,000 per MWh and the LSE must make
up for any shortfall in energy through the CAISO markets, with commensurate exposure to
potentially very high prices and volatility.
The implication for CCA’s looking to incorporate high levels of intermittent renewables is to identify and
(initially) work with a portfolio manager (and scheduling coordinator) with the experience in forecasting
and managing a similarly situated supply portfolio for a customer base that is also evolving in terms of
load shape, including factors such as DG and PEV adoption. This relatively high proportional requirement
for renewable generation is in nascent stages and is materially different than managing a traditional
energy supply portfolio consisting of more predictable resources such as dispatchable fossil fuel-fired or
hydroelectric generation.
CALIFORNIA RENEWABLE PORTFOLIO STANDARD CONSIDERATIONS
The following discussion centers around Renewable Portfolio Standard (RPS) considerations that factor
into renewable resource procurement and pricing. Under the California law outlining the statewide RPS,
CCAs, like other LSEs, will be required to procure at least 33% of their energy from renewable resources
for their customers by 2020 and 50% by 2030.1 Table E-1 summarizes RPS requirements in the state of
California.
Table E-1: California Renewable Portfolio Standard Requirements
Compliance Period Procurement Quantity Requirement
Compliance Period 3 (2017-2020) 2017 retail sales x 27%
2018 retail sales x 29%
2019 retail sales x 31%
2020 retail sales x 33%
2021-2029 Annual retail sales x 33%
2030 and beyond Annual retail sales x 50%
Customer-owned DG, which is predominately solar PV, does not count towards the California RPS. 2 Only
renewable generation supply procured by the LSE contribute towards meeting the RPS.
1 CPUC RPS Homepage: http://www.cpuc.ca.gov/rps_homepage/
CEC Renewables Portfolio Standard (RPS) http://www.energy.ca.gov/portfolio/ 2 However, if the net energy metering customer exceeds their annual usage with DG output, that excess is eligible to provide
Renewable Energy Credits (RECs) to the utility - http://www.cpuc.ca.gov/General.aspx?id=3800

APPENDIX E
City of San Diego Community Choice Aggregate Feasibility Study E-4| P a g e
Another aspect of the RPS that will impact CCA energy supply portfolios are the Portfolio Content
Categories shown in Table E-2. Category 3 Renewable Energy Credits (RECs) are “unbundled,” i.e., not
associated with the actual purchase of renewable energy. Category 3 RECs are being phased out from
RPS qualification. For 2017-2020, a maximum of 10% of the RPS requirement can be satisfied by Category
3 RECs. However, RPS contracts in excess of the RPS requirement could be comprised of Category 3
RECs.
Table E-2: RPS Portfolio Content Categories
RPS Portfolio Content Categories3 Requirements
Category 1 procurement is: Procurement of Energy and RECs delivered
to a California balancing authority (CBA) without substituting electricity
from another source
2017-2020 Minimum 75% of quantity
requirement
Category 2 procurement is: Procurement of Energy and RECs that
cannot be delivered to a CBA without substituting electricity from
another source
Category 3 procurement is: Procurement of unbundled RECs only, or
RECs that do not meet the conditions for Category 1 and 2
2017-2020 Maximum of 10% of
quantity requirement
The following formulaic examples illustrate how these categories impact supply using the contracted
2014 and 2020 RPS quantities cited for SDG&E:
• 31.6% of total energy supply from RPS-compliant renewable energy resources contracted for in
2014
o 21.7% RPS requirement x 15% maximum Category 3 RECs = 3.25% of total energy supply
can be comprised of Category 3 RECs
o Excess RPS-compliant energy supply that could be Category 3 RECs: 31.6% actual 2014
RPS-compliant supply – 21.7% RPS requirement = additional 9.9% of total energy supply
o 3.25% + 9.9% = maximum of 13.15% of total energy supply provided by Category 3 RECs
• 43.1% of total energy supply from RPS-compliant renewable energy resources currently under
contract for 2020
o 33% RPS requirement x 10% maximum Category 3 RECs = 3.3% of total energy supply
can be comprised of Category 3 RECs
o Excess RPS-compliant energy supply that could be Category 3 RECs: 43.1% RPS-
compliant supply under contract – 33% RPS requirement = additional 10.1% of total
energy supply
o 3.3% + 10.1% = maximum of 13.4% of total energy supply provided by Category 3 RECs
3 CPUC 33% RPS Procurement Rules: http://www.cpuc.ca.gov/RPS_Procurement_Rules_33/

APPENDIX E
City of San Diego Community Choice Aggregate Feasibility Study E-5| P a g e
• Assumed 43.1% of total energy supply from RPS-compliant renewable energy resources
currently under contract for 2021
o 33% RPS requirement x 0% maximum Category 3 RECs = 0% of total energy supply can
be comprised of Category 3 RECs
o Excess RPS-compliant energy supply that could be Category 3 RECs: 43.1% RPS-
compliant supply assumed to be under contract for 2021 – 33% RPS requirement =
additional 10.1% of total supply portfolio
o 0% + 10.1% = maximum of 10.1% of total energy supply provided by Category 3 RECs
POWER PURCHASE AGREEMENT CONSIDERATIONS
In terms of CCAs, PPAs typically are long-term contracts to purchase energy from either conventional
fossil fuel-fired or utility scale renewable generation resources owned by independent power producers.
Typically, independent power producers will enter contractual agreements for approximately 80% of
their capacity to cover their operations and maintenance cost and then trade in the CAISO market to
achieve their profit margin.
In general, long-term PPAs spanning multiple years are used to meet demand requirements that are
predictable (for example, the base load portion of an energy supply portfolio occurring in all forecast
scenarios). The price for the PPA energy can take a number of forms, but typically either it is set at a
known price that may escalate at a known escalation rate, or it is tied (indexed) to another market pricing
indicator, such as the price of natural gas. Longer-term PPAs generally tend to be at a fixed volume and
fixed price which provides for cost certainty and stability over the contract term. Other supply contracts
are procured for a shorter time frame (e.g. quarterly or monthly) when load forecasts become more
accurate and other market conditions are better known or anticipated (i.e. prices are trending up or
trending down). These shorter-term supply contracts are used to “shape” the supply profile to better
match the forecasted demand.
Typically, shorter-term markets are used to procure the final supply requirements within the month,
week, day, or hour. The CAISO provides markets for the day ahead and real time short-term energy
products as well as third-party suppliers in the wholesale market. The Day-Ahead CAISO market is the
forum to finalize the load forecast and either procure the additional energy required or sell any excess
available from the supply portfolio. The Real-Time market then balances the day-of supply and demand
and these are settled at the CAISO real-time market clearing price for purchase and sale.
In California, purchasing of energy is typically implemented with long-term PPAs. From the National
Renewable Energy Laboratory’s Power Purchase Agreement Checklist for State and Local Governments4,
advantages of PPAs to the City CCA program to purchase renewable energy include:
• No/low up-front cost5;
4 Power Purchase Agreement Checklist for State and Local Governments https://financere.nrel.gov/finance/content/power-
purchase-agreement-checklist-state-and-local-governments 5 The no/low up-front cost advantage assumes a solid credit capacity. There may be situations depending on how the CCA is
formed that require some credit capability be extended to the CCA Entity in order to participate in PPA as well as CAISO
markets.

APPENDIX E
City of San Diego Community Choice Aggregate Feasibility Study E-6| P a g e
• Ability for a tax-exempt entity, like the City, to enjoy lower electricity prices thanks to savings
passed on from federal tax incentives to the system owner; and
• A reasonably predictable cost of electricity over 15–25 years.
For the City CCA program, considerations for possible alternatives to PPAs include owning, leasing, or
entering into partnerships to build renewable generation plants. Purchasing renewable generation would
require financing, while leasing of solar generation is possible without up-front costs.
The power supply costs modeled in this Study do not include the costs for constructing City CCA
program-owned or leased renewable generation facilities. Instead, a forecast of PPA pricing is used as
the supply cost basis for this Study.
RESOURCE ADEQUACY CONSIDERATIONS
Two primary commodities—energy and capacity—comprise power procurement transactions in
California. The energy commodity is traded through PPAs and the CAISO. The capacity commodity is
purchased through bilateral agreements and typically solicited through a Request for Offer (RFO) process.
Energy and capacity are often provided through the same PPA.
To ensure reliable grid operation, all LSEs including CCAs must provide reserve capacity. Thus, a CCA will
need to plan, procure, and coordinate reserve capacity with the CPUC, the California Energy Commission
(CEC), and CAISO. To do so, the CCA and its scheduling coordinator must file forms with the CPUC
Energy Division, CEC, and CAISO to verify that the CCA meets the reserve requirements of the Resource
Adequacy (RA) program. The RA program is a mandatory planning and procurement process to verify
that adequate resource capacity is available to serve all customers in real time. These RA requirements
impact the amount of supply a CCA must procure as well as compliance activities, which impact CCA load
and price forecasts.
The RA program requires that LSEs, including CCA’s, meet obligations including a Planning Reserve
Margin. The RA program establishes deliverability criteria as well as system and local capacity
requirements. The RA program also establishes rules for "counting" resources to meet resource adequacy
obligations. Resources counted for RA purposes must be available to the CAISO for the full counted
capacity. RA requirements under CAISO tariff provisions are intended to complement the State of
California's efforts to implement resource adequacy programs.
The CPUC requires LSEs to demonstrate in both monthly and annual filings that they have purchased
capacity commitments, or RA, of no less than 115% of their monthly peak demand. These purchase
requirements are intended to secure sufficient commitments from actual, physical resources to ensure
system reliability. The CPUC’s RA program annually establishes minimum capacity obligation
requirements for CPUC jurisdictional LSEs on a one year-ahead basis at both the system and local level.
The key RA obligation is that a resource counted as “RA capacity” must either deliver energy to the LSE
or bid into the CAISO energy markets or be available to produce electricity when needed. Each day, the
CAISO runs a day-ahead integrated network model and dispatches resources efficiently to meet
expected demand. All capacity designated as RA capacity can be scheduled to deliver energy by the
CAISO if needed to maintain reliability. The RA program requires LSEs to submit filings with the CPUC

APPENDIX E
City of San Diego Community Choice Aggregate Feasibility Study E-7| P a g e
on a year-ahead basis (due in October) and twelve month-ahead filings (due monthly) during the
compliance year.
The RA process is not a static, unchanging set of procedures. Rather it’s an evolving program with new
procedures which may need to be completed by the City CCA program6. Currently, the CAISO conducts
an annual and monthly RA planning process that requires LSEs, through scheduling coordinators, to
submit RA plans. CCAs may use energy supply providers to satisfy these requirements. The RA plans
identify the specific resources upon which the LSE is relying to satisfy forecasted monthly peak demand
and reserve margin for the relevant reporting period7. To meet the current RA reporting requirements,
CCAs must demonstrate the following reserve capacity requirements:
• Resource Adequacy Requirement (RAR) planning reserves are required to bring total capacity,
including ISO required ancillary services, up to 115% of forecast load. Forecast load is based on a
1 in 2 (50% probability) year and baselined against the CEC forecast.
• Initially during early phases of CCA implementation, submit a load forecast two months before
load serving begins and submit RA Filings specifying capacity to meet RA obligations one month
before load serving begins.
• Once the CCA is established, demonstrate procurement of 90% of RAR one year ahead of time
(due October 31) and demonstrate 100% of RAR each month. Monthly reports are due 1 -1.5
months ahead and summer months require 2 reports. The RAR is equivalent to 1.15 * the peak
coincident load * .9 which is equivalent to 1.035 of the peak coincident demand.
• Submit RA compliance filings to the CPUC, CEC and CAISO using Excel 2007 (not 2003) format
over the CPUC Secure FTP connection.
• Provide load forecast updates to the CEC yearly in January and March.
• Schedule the RA obligation into the Market Redesign and Technology Upgrade (MRTU) system8;
or bid into day-ahead market, if not scheduled.
• RA obligation must be available in real time and is subject to the CAISO Residual Unit
Commitment process at a $0 bid.
According to the CPUC9:
“A resource’s Qualifying Capacity (QC) is the number of Megawatts eligible to be counted towards
meeting a load serving entity’s (LSE’s) System and Local Resource Adequacy (RA) requirements. The
6 CPUC Resource Adequacy: http://www.cpuc.ca.gov/ra/ 7 CAISO Resource Adequacy Criteria and Must-Offer Obligations http://www.caiso.com/Documents/IberdrolaComments-
FlexibleResourceAdequacyCriteriaMustOfferObligation-FourthRevisedStrawProposal.pdf 8 MRTU modification in 2009 to CAISO markets was intended to increase grid and market efficiencies, a reduction of barriers to
alternative resources of power, and better management of transmission bottlenecks and dispatching the least cost power
plants. The modification also assists in determining how much of a generation resource’s capacity should be provided through
PPA, and CAISO day-ahead, and real-time markets. The MRTU optimization of this balance is intended to ensure an efficient
supply chain for each aspect of power procurement.:
https://www.caiso.com/Documents/MarketsandPerformance_MAP_InitiativeSummary.pdf 9 CPUC Energy Division, Draft Staff Proposal Resource Adequacy Proceeding R.11-10-023, Qualifying Capacity and Effective
Flexible Capacity Calculation Methodologies for Energy Storage and Supply-Side Demand Response Resources, September 13,
2013: www.cpuc.ca.gov/WorkArea/DownloadAsset.aspx?id=6553

APPENDIX E
City of San Diego Community Choice Aggregate Feasibility Study E-8| P a g e
revised QC that incorporates deliverability constraints is called the Net Qualifying Capacity (NQC).
A resource’s Effective Flexible Capacity (EFC) is the number of Megawatts eligible to be counted
towards meeting an LSE’s Flexible Resource Adequacy (RA) requirements10.”
This new flexible RA requirement is intended to ensure capacity is contracted with resources that can
quickly respond if renewable resources do not perform as expected or come on line quickly when there is
a rapid change in renewable output (like the PV generation decrease at sunset).
ENERGY STORAGE CONSIDERATIONS
Assembly Bill 2514, and the corresponding CPUC Storage Rulemaking (R.10-12-007 11), requires electric
service providers to acquire energy storage. 12 The CPUC has determined that this law also applies to
CCAs. Thus, a CCA will need to procure energy storage, which it may then be able to use to satisfy RA
requirements.
The CPUC decision sets a target for CCAs and other LSEs to procure energy storage equal to 1% of their
yearly peak load by 2020, with installations being operational no later than 2024. Beginning in January
2016, all LSEs are required to file a report demonstrating their compliance to meet the target and
describing their methodologies for cost-effective projects.
For purposes of this Study, we assumed that the San Diego CCA maintains energy storage capacity
equivalent to the 1% of the annual peak load in compliance with AB 2514.
ENERGY SUPPLY MANAGEMENT CONSIDERATIONS
Energy procurement is similar to other commodity trading. When demand is high and capacity to supply
is approaching 100% utilization, the prices are high. When demand is low and capacity to supply is
substantially underutilized, pricing is low. However, electricity is different because the consumers do not
receive direct or immediate feedback regarding the cost of supply. The retail electricity rates are instead
based in part on the average pricing of the electricity supply determined over some period of time.
The CCA will procure power through a variety of mechanisms including bilateral agreements of varying
term lengths and spot market purchases. The CCA will seek to optimize its power procurement strategy
to balance cost and risk. For example, PPAs lock in a specific volume of supply at defined pricing terms.
When consumer electricity demand exceeds PPA quantities, the LSE (CCA or IOU) must procure supply
from the California Independent System Operator (CAISO) day-ahead and real-time markets and will be
exposed to price risk. Similarly, over-procurement through PPAs, exposes the LSE to price risk when the
excess supply is sold at the prevailing CAISO day-ahead and real-time market prices.
10 CAISO Flexible resource adequacy criteria and must offer obligations:
https://www.caiso.com/informed/Pages/StakeholderProcesses/FlexibleResourceAdequacyCriteria-MustOfferObligations.aspx
11 CPUC Order Instituting Rulemaking R.10-12-007 Pursuant to Assembly Bill 2514 to Consider the Adoption of Procurement
Targets for Viable and Cost-Effective Energy Storage Systems:
http://docs.cpuc.ca.gov/word_pdf/FINAL_DECISION/128658.pdf
12 CPUC Energy Storage Overview: http://www.cpuc.ca.gov/General.aspx?id=3462

APPENDIX E
City of San Diego Community Choice Aggregate Feasibility Study E-9| P a g e
Power market prices are continually changing, even for longer term, multi-year supply contracts.
Generally, the shorter the contract term, the higher the potential is for over-all portfolio price volatility.
This is why a supply portfolio will consist of a mixture of long-term, mid-term and short-term supply
contracts.
The development and management of this supply portfolio can be managed in numerous ways by the
CCA Program. The CCA Program can take a proactive management role and develop all the electric
operations functions internally, including. electric supply procurement which include capacity, resource
adequacy requirements, ancillary services, risk management processes and programs required to
manage the supply portfolio, long- and short-term load forecasting and scheduling coordination. As an
alternative, these functions can be outsourced to third parties. A “full requirements” contract structure
could be created where a third party performs all the operations necessary to deliver the minute-to-
minute shaped energy, including all required market components to the CCA Program’s delivery point at
a fixed price. While convenient, these types of contracts will generally come with a premium price, in
particular if pricing is fixed and/or over a longer term, and may end up being more expensive than the
IOU generation costs as the supplier has to take on price and volumetric risk for all energy and market
products and services.
A slightly different outsourcing structure could have a third party provide shaped energy or a simple
volume-of-energy product at a fixed price over one, two, or three-year terms. The shaped energy product
would be delivered to the CCA Program delivery point with the monthly fixed volumes based on CCA’s
historic load profile, at either 100% of historic load or some equally weighted percentage of load. Any
actual use above or below the historic load levels would be purchased or sold into the CAISO Day Ahead
market. Purchases and sales could be settled at the actual CAISO Day Ahead price or another settlement
formula (e.g., the load-weighted average of the CAISO hourly Day Ahead market prices at the SCE load
aggregation point). Other energy supply-related products and their associated costs could be broken out
as separate products (e.g. resource adequacy, ancillary services, schedule coordination services, etc.) to
create price transparency for San Diego CCA. This approach will carry a premium to cover the supplier’s
risk exposure, but because volumes are fixed, the exposure is less thus the premium will be lower
compared to the full requirements approach.
Other portfolio management structures are certainly possible. However, the structure that will work best
for the CCA Program is a function of risk appetite and tolerance, resource availability, skill set, and cost
structure. A third party outsourcing approach may make sense in the early years of the CCA Program
which allows it to gain experience and confidence as customer groups are phased into the program.
Because power market prices are continually changing, realistic costs can only become known when the
CCA’s power requirements, cost structure, and basic terms and conditions are known and providers
respond with binding proposals. The goal of evaluating various procurement scenarios is to identify
current and potential options for the CCA Program to meet forecasted electricity demand. This includes
evaluation of a power procurement strategy, alternative generation resources available, and the
attributes and performance characteristics of the available generation resources. Just as correlated
factors (such as time of year, day of the week, and temperature) can be used to estimate varying
electricity demand, similar correlated factors can be used to estimate variable renewable resource
generation. The CCA Program will need to examine how these potential resource options best fit within

APPENDIX E
City of San Diego Community Choice Aggregate Feasibility Study E-10| P a g e
the procurement strategy. The CCA Program will likely seek to incorporate local renewable energy into
its supply portfolio by potentially contracting for utility scale solar and/or wind generation, as well
tapping into the growing portfolio of distributed generation resources in and around San Diego. In order
to develop CCA business and implementation plans, the CCA will need an understanding of the
renewable generation resources currently in the area as well as a forecast for new generation.
ENERGY SUPPLY COST DEVELOPMENT
The load forecast outlined in Appendix D provides the basis to develop the City CCA program’s energy
supply costs. The following factors for developing the energy supply portfolio costs of the City CCA
program were analyzed as a part of this initial feasibility analysis. Each of the bulleted items below was
analyzed to identify the average and standard deviation for any given hour of every month. This average
and variation were used to identify the potential range of operating conditions.:
• Electricity Load – As discussed in Appendix D, load forecasts were based on the 2013-15 data
provided by SDG&E, and the customer load for each rate classification of customer was analyzed.
The time of year has a significant impact on energy demand and resulting energy supply costs.
For example, in Southern California, summer hours in late afternoon have typically the highest
demand and highest market prices due to the air conditioning system load. In late December,
there is a noticeable demand increase at sunset due to the number of holiday lights that are
switched on by daylight sensors. These month and time of day factors were considered as part
of the analysis.
• Customer-Owned Solar PV Output – Based on the National Renewable Energy Laboratory
(NREL) PVWatts13 analysis tool, an estimated solar output was developed based on historical and
projected numbers of solar installations.
o The projected growth in Customer-Owned Solar PV Output is detailed in Appendix D
Load Forecast Development.
o The NREL PVWatts tool estimates the output of fixed panel solar photovoltaic based on
the forecasted capacity of customer owned solar PV systems and time of day throughout
the year. The output from customer owned solar was deducted from the amount of load
served by the CCA.
o The variability of the customer owned solar was also included in the MCSM model to
which adds to the variability of the customer load itself.
• Power Procurement Costs
o Renewable PPAs as described further in segment titled “Renewable Power Purchase
Agreement Costs”
o Natural Gas PPAs as described further in segment titled “Natural Gas Power Purchase
Agreement Costs”
o CAISO market purchases/sales as described further in segment titled “CAISO Market
Costs”
• Day Ahead market prices – Historic locational marginal pricing (LMP) was used as the basis for
future years’ price forecast and expected volatility
13 National Renewable Energy Laboratory (NREL) PVWattsTM Site Specific Data Calculator http://pvwatts.nrel.gov/

APPENDIX E
City of San Diego Community Choice Aggregate Feasibility Study E-11| P a g e
• Real-time market prices - Historic Real-time LMP was used as the basis for future years’ price
forecast and expected volatility
The following additional assumptions and qualifications were made:
• No separate operating and maintenance responsibilities or resultant costs were included in the
estimated cost of power procurement as these costs are assumed to be included in the
negotiated PPA pricing.
• With bilateral energy and resource adequacy contracts there are often credit and collateral
provisions in the contract. For example, suppliers may provide options for extending financial
credit to the CCA. However, no costs associated with establishing needed credit capacity were
included in this Study.
• The cost estimates developed for PPAs for renewable and natural-gas fired generation will vary
from the existing IOU portfolio costs which incorporate self-generation and confidential PPA
contracts with varying origination dates, durations, and prices. These existing contracts could
have been signed any time after the year 2001 and the California electricity crisis.14 Additionally,
the estimated procurement costs may vary with other CCAs due to each CCA’s PPA contract
provisions in addition to the locational marginal pricing of the CAISO as described in the segment
titled “CAISO Market Costs.”
Once the various cost components were developed, a Monte Carlo simulation was run to evaluate a range
of possible outcomes for energy supply costs. The Monte Carlo simulation (discussed further in the
segment titled “Monte Carlo Energy Supply Portfolio Cost Analysis”) combined the variability in load with
the load growth forecast, the customer-owned solar PV forecast, and other variables to estimate short-
term, medium-term and long-term electricity demand that the City CCA Program will have to supply.
The following segments provide the assumptions and methodology used to develop the various
components of the energy supply costs including renewable generation PPAs, natural gas generation
PPAs, CAISO market purchases/sales, as well as capacity and resource adequacy costs. The cost forecasts
discussed here provide the basis for the Monte Carlo energy supply portfolio cost analysis.
RENEWABLE POWER PURCHASE AGREEMENT COSTS
Historical data provides a general understanding that the cost of renewable energy is decreasing. The
2016 NREL U.S. Solar Photovoltaic System Cost Benchmark Report15 states that utility-scale (> 2MW)
photovoltaic systems have reached $1.42 per Watt DC (or $1.99 per Watt AC) for fixed-tilt systems, and
$1.49 per Watt DC (or $1.79 per Watt AC) for one-axis-tracking systems. NREL’s historical PV system cost
trends, for residential, commercial, and utility-scale installations, are illustrated in Figure E-1.
14 EIA Subsequent Events California's Energy Crisis summary:
https://www.eia.gov/electricity/policies/legislation/california/subsequentevents.html 15 NREL U.S. Solar Photovoltaic System Cost Benchmark: Q1 2016 http://www.nrel.gov/docs/fy16osti/66532.pdf

APPENDIX E
City of San Diego Community Choice Aggregate Feasibility Study E-12| P a g e
Figure E-1: Replica of NREL PV System Cost Benchmark Summary (inflation
adjusted), Q4 2009 – Q1 201616
However, according to the CPUC’s Q1 2016: Biennial RPS Program Update,22 the California IOUs’ RPS
procurement costs have been increasing since 2011 as shown in Figure E-2. This disconnect between
national trends and actual RPS procurement costs in California may be in part due to the RPS program
itself.17 The initial 2002 RPS applied only to IOUs. RPS procurement costs initially increased until 2008
and then declined until 2011. In 2011, Senate Bill X1-2 (SBX) expanded RPS to municipal utilities, electric
service providers, and CCAs.18 Prior to SBX, many of these LSEs had not been aggressively pursuing
renewable generation portfolios.
As a result of the expansion of the RPS mandate in 2011, there appears to be a classic supply and demand
interplay: increased demand for RPS-compliant resources may be driving up cost due to supply
16 Figure from NREL Report shows U.S. solar PV costs continuing to fall in 2016, September 28, 2016:
http://www.nrel.gov/news/press/2016/37745
USD = United States Dollar; DC = Direct Current; PV = Photovoltaic; PII = permitting, inspection and interconnection; BOS =
balance of system; Q1 = 1st Quarter; Q4 = 4th Quarter 17 CPUC RPS Program Overview http://www.cpuc.ca.gov/RPS_Overview/ 18 CEC Renewables Portfolio Standard Reports and Notices from Publicly Owned Utilities:
http://www.energy.ca.gov/portfolio/rps_pou_reports.html ; CPUC RPS Program Overview:
http://www.cpuc.ca.gov/RPS_Overview/

APPENDIX E
City of San Diego Community Choice Aggregate Feasibility Study E-13| P a g e
constraints. The Padilla Report19 to the California Legislature for 2015 Renewable Procurement Costs
begins to show that supply may be increasing to meet the additional demand, as depicted in Figure E-2.20
This Study combined all of the data sources identified in Figure E-2, including the IOUs’ RPS filings and
the Padilla report, to develop the forecasted utility scale renewable generation cost forecast21used in the
Monte Carlo energy supply portfolio cost analysis.
Figure E-2: IOU RPS Compliance Cost22
19 May 2016: Report on 2015 Renewable Procurement Costs in Compliance with Senate Bill 836 (Padilla, 2011)
http://www.cpuc.ca.gov/uploadedFiles/CPUC_Website/Content/Utilities_and_Industries/Energy/Reports_and_White_Papers/
Padilla Report 2016 -Final - Print.pdf 20 When asked about the difference in prices, the CPUC staff replied “There is a very simple explanation for the difference
between the prices on p. 8 and the language on p. 20. Specifically, RPS contracts typically don’t come online for 3-10 years, so
while the prices of contracts approved by the CPUC have declined between 2003 to 2014 (in terms of real dollars) the savings
from these less expensive RPS contracts won’t be realized until 2017-2020 when lower priced contracts from 2012-2015 come
online. The table on p. 8 displays the actual procurement expenditures for 2011-2014, i.e., the payment made on RPS contracts
that were executed between 2003-2010.” 21 In this instance, a regression analysis using logarithmic least squares fitting was used:
http://mathworld.wolfram.com/LeastSquaresFittingLogarithmic.html 22 CPUC RPS Reports, Presentations and Charts http://www.cpuc.ca.gov/RPS_Reports_Docs/ ; Biennial RPS Program Update In
Compliance with Public Utilities Code Section 913.6, January, 2016
http://www.cpuc.ca.gov/WorkArea/DownloadAsset.aspx?id=8323

APPENDIX E
City of San Diego Community Choice Aggregate Feasibility Study E-14| P a g e
An AB67 legislative report23 also speculated on the reason for the increasing and decreasing cost for
utility scale bulk renewable generation:
“From 2003 to 2014, the average TOD-adjusted price of contracts approved by the
CPUC has increased from 5.4 cents to 7.6 cents/kWh in nominal dollars, and decreased
from 8.2 cents to 7.6 cents/kWh in real dollars. One reason for this increase in nominal
pricing is that the IOUs contracted with existing renewable facilities at the beginning of
the RPS program and with mostly new facilities in more recent years in order to meet
the 20% and 33% RPS targets. These new facilities typically result in higher contract
costs in order to recover the capital needed to develop new facilities. Having said that,
the decrease in RPS contract prices in terms of real dollars indicates that the renewable
market in California is robust and competitive and has matured since the start of the
RPS program.”
NATURAL GAS POWER PURCHASE AGREEMENT COSTS
A large portion of the annual electricity supply in California and the SDG&E service territory comes from
natural gas. Table E-3 depicts the sources of energy supply by type for SDG&E, with natural gas
comprising 54% of the power mix for 2015.
23 CPUC Electric and Gas Utility Cost Report, April 2016:
http://www.cpuc.ca.gov/uploadedFiles/CPUC_Website/Content/Utilities_and_Industries/Energy/Reports_and_White_Papers/
AB67_Leg_Report_3-28.pdf, pg. 23-24
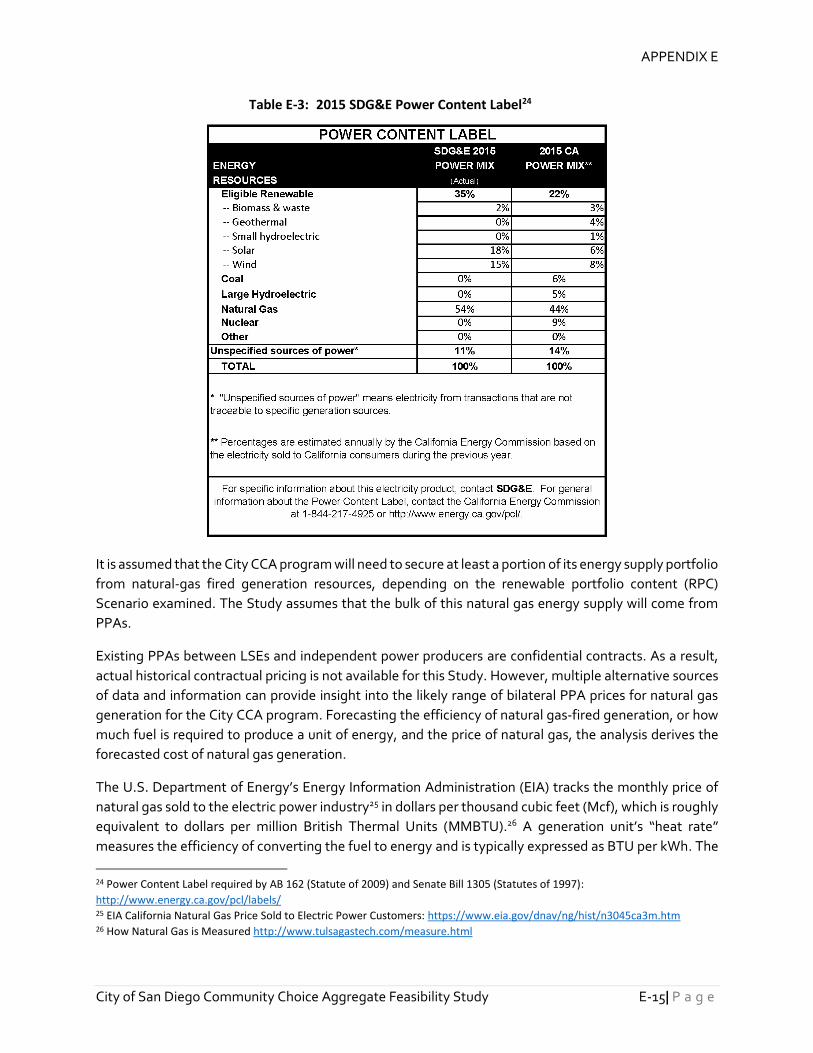
APPENDIX E
City of San Diego Community Choice Aggregate Feasibility Study E-15| P a g e
Table E-3: 2015 SDG&E Power Content Label24
It is assumed that the City CCA program will need to secure at least a portion of its energy supply portfolio
from natural-gas fired generation resources, depending on the renewable portfolio content (RPC)
Scenario examined. The Study assumes that the bulk of this natural gas energy supply will come from
PPAs.
Existing PPAs between LSEs and independent power producers are confidential contracts. As a result,
actual historical contractual pricing is not available for this Study. However, multiple alternative sources
of data and information can provide insight into the likely range of bilateral PPA prices for natural gas
generation for the City CCA program. Forecasting the efficiency of natural gas-fired generation, or how
much fuel is required to produce a unit of energy, and the price of natural gas, the analysis derives the
forecasted cost of natural gas generation.
The U.S. Department of Energy’s Energy Information Administration (EIA) tracks the monthly price of
natural gas sold to the electric power industry25 in dollars per thousand cubic feet (Mcf), which is roughly
equivalent to dollars per million British Thermal Units (MMBTU).26 A generation unit’s “heat rate”
measures the efficiency of converting the fuel to energy and is typically expressed as BTU per kWh. The
24 Power Content Label required by AB 162 (Statute of 2009) and Senate Bill 1305 (Statutes of 1997):
http://www.energy.ca.gov/pcl/labels/ 25 EIA California Natural Gas Price Sold to Electric Power Customers: https://www.eia.gov/dnav/ng/hist/n3045ca3m.htm 26 How Natural Gas is Measured http://www.tulsagastech.com/measure.html

APPENDIX E
City of San Diego Community Choice Aggregate Feasibility Study E-16| P a g e
CEC 2015 Update of the Thermal Efficiency of Gas-Fired Generation in California27 estimates the 2014
average heat rate to be 7,760 BTU per kWh. Combining these data results in an approximate natural gas
supply cost, expressed in $ per MW, and as shown in Figure E-3 with the lower gray line labeled “Natural
Gas Supply Cost for Electricity Generation.”
Figure E-3: California Natural Gas Generation Cost based on Natural Gas Price and
Heat Rate Conversion
Additionally, the monthly CAISO Market Performance Metric Catalog28 derives a Daily Integrated
Forward Market Default Load Aggregation Point (DLAP) Market Implied Heat Rate as shown in Figure
E-4. While the EIA heat rate data indicated a recent range of 7,500 to 8,000 BTU per kWh for California,
the CAISO market implied heat rate for 2016 shows a range of 10,000 to 15,000 BTU per kWh.
27 CEC 2015 Update of the Thermal Efficiency of Gas-Fired Generation in California:
http://www.energy.ca.gov/2016publications/CEC-200-2016-002/CEC-200-2016-002.pdf 28 CAISO Market Performance Metric Catalog: https://www.caiso.com/Pages/documentsbygroup.aspx?GroupID=AF1E04BD-
C7CE-4DCB-90D2-F2ED2EE8F6E9
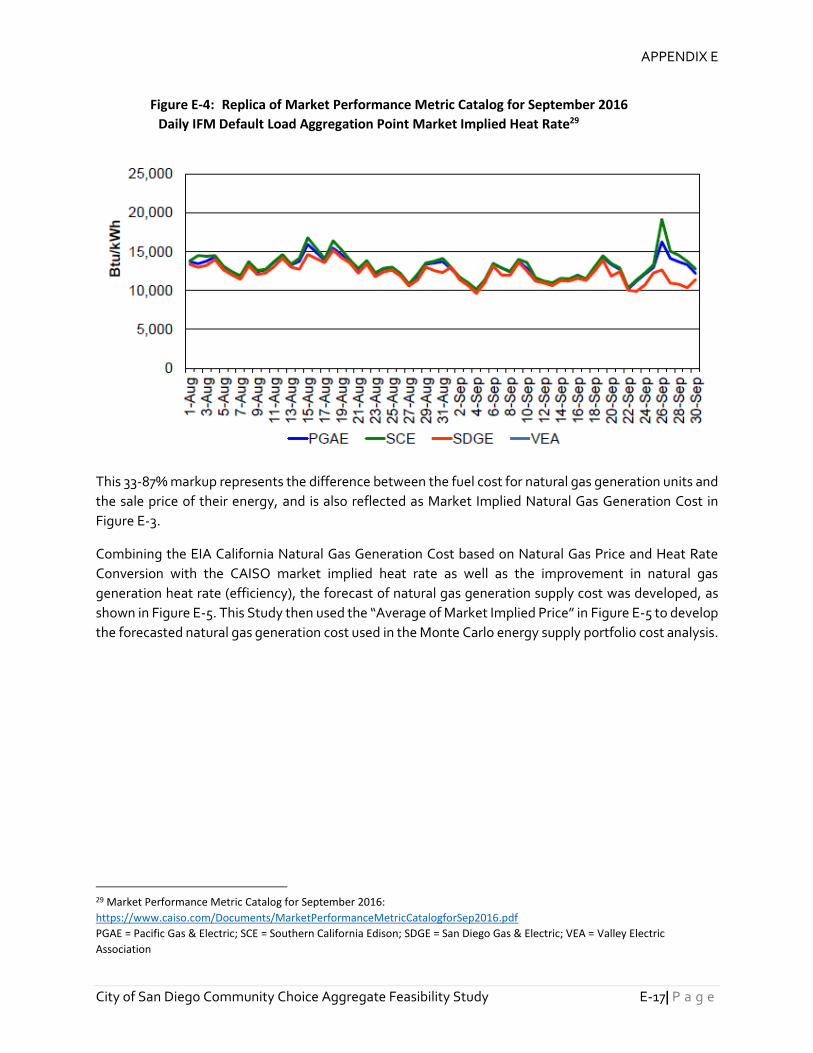
APPENDIX E
City of San Diego Community Choice Aggregate Feasibility Study E-17| P a g e
Figure E-4: Replica of Market Performance Metric Catalog for September 2016
Daily IFM Default Load Aggregation Point Market Implied Heat Rate29
This 33-87% markup represents the difference between the fuel cost for natural gas generation units and
the sale price of their energy, and is also reflected as Market Implied Natural Gas Generation Cost in
Figure E-3.
Combining the EIA California Natural Gas Generation Cost based on Natural Gas Price and Heat Rate
Conversion with the CAISO market implied heat rate as well as the improvement in natural gas
generation heat rate (efficiency), the forecast of natural gas generation supply cost was developed, as
shown in Figure E-5. This Study then used the “Average of Market Implied Price” in Figure E-5 to develop
the forecasted natural gas generation cost used in the Monte Carlo energy supply portfolio cost analysis.
29 Market Performance Metric Catalog for September 2016:
https://www.caiso.com/Documents/MarketPerformanceMetricCatalogforSep2016.pdf
PGAE = Pacific Gas & Electric; SCE = Southern California Edison; SDGE = San Diego Gas & Electric; VEA = Valley Electric
Association

APPENDIX E
City of San Diego Community Choice Aggregate Feasibility Study E-18| P a g e
Figure E-5: Natural Gas Generation Supply Cost
CAISO MARKET COSTS
The Study assumes that the CCA will generate power and/or use PPAs to purchase the majority of energy
to serve customer needs, rather than buying from the short-term market. However, load forecasts are
never perfect and PPAs will never exactly align with demand. Quantities to supplement self-generation
and PPA supply are purchased from the CAISO day-ahead and real-time markets that balance supply and
demand for participating LSEs. This Section discusses how pricing for CCA supply from day-ahead and
real-time markets was determined.
CAISO utilizes locational marginal pricing to calculate the cost to deliver electricity to specified locations.
The local cost of electricity varies based on generation price and proximity to the generation resource,
due to both line losses and congestion on transmission infrastructure. The City of San Diego is served by
multiple price nodes (pNodes) with different LMPs as can be seen in the CAISO LMP contour map30
illustrated in Figure E-6. The SDG&E DLAP is the weighted average price for all pNodes within SDG&E
service territory.
30 California ISO Market price maps: http://www.caiso.com/pages/pricemaps.aspx
Forecast

APPENDIX E
City of San Diego Community Choice Aggregate Feasibility Study E-19| P a g e
Figure E-6: March 26, 2017 CAISO LMP Map for San Diego.
Using a map of the City of San Diego boundary in combination with the CAISO market price map, pNodes
were identified (listed in Table E-4) to analyze the CAISO day-ahead and real-time energy costs within
the City of San Diego. The San Diego pNode analysis essentially develops a San Diego DLAP and provides
insight into historical prices and price volatility. This analysis also determines whether the prices and
volatility are less than or greater to that in the larger SDG&E service territory DLAP or, more broadly, the
State of California.
Table E-4: CAISO pNodes identified within the City of San Diego
CAISO pNodes identified within the City of San Diego
ARTESN_6_N001 B_6_N003 B_6_N005 B_6_N007 BERNARDO_6_N001
BERNARDO_6_N009 BERNARDO_6_N014 CABRILLO_1_N001 CABRILLO_6_N001 CABRILLO_6_N004
CABRILLO_6_N011 CARLTNHS_1_N004 CARLTNHS_1_N011 CARLTNHS_1_N012 CENTERS_6_N004
CENTERS_6_N008 CHCARITA_1_N004 CHCARITA_1_N008 CHCARITA_1_N012 CHOLLAS_6_N001
CHOLLAS_6_N008 CLAIRMNT_6_N001 CLAIRMNT_6_N008 DELMAR_6_N001 DELMAR_6_N010
DELMAR_6_N011 EASTGATE_6_N004 EASTGATE_6_N101 EASTGATE_6_N201 ELLIOTT_6_N001
ELLIOTT_6_N004 F_6_N001 F_6_N002 F_6_N005 FENTON_6_N001
FRIARS_1_N001 GENESEE_6_N001 GENESEE_6_N005 GENESEE_6_N011 GENESEE_6_N015

APPENDIX E
City of San Diego Community Choice Aggregate Feasibility Study E-20| P a g e
CAISO pNodes identified within the City of San Diego
KEARNEY_7_N001 KETTNER_6_N001 KETTNER_6_N004 KYOCERA_6_N001 LAJOLLA_6_N001
LAJOLLA_6_N007 MESAHGTS_6_N007 MESAHGTS_6_N011 MESARIM_6_N001 MESARIM_6_N007
MESARIM_6_N008 MIRAMAR_6_N001 MIRAMAR_6_N004 MIRAMAR_6_N017 MIRAMREF_7_B1
MISSION_2_N035 MISSION_6_N031 MISSION_6_N040 MISSION_6_N049 MISSON_1_N015
MRGT_6_NODE1 OLDTOWN_6_N002 OLDTOWN_6_N003 PACFCBCH_6_N001 PACFCBCH_6_N004
POINTLMA_6_N001 POINTLMA_6_N014 POINTLMA_6_N021 RCARMEL_6_N001 RCARMEL_6_N004
RCARMEL_6_N011 ROSECYN_6_N017 SAMPSON_6_N010 SCRIPPS_6_N001 SCRIPPS_6_N008
SCRIPPS_6_N013 STREAMVW_6_N007 TOREYPNS_6_N001 TOREYPNS_6_N007 TOREYPNS_6_N008
TOREYPNS_6_N008 UCM_6_N001 UCM_6_N002 UCM_6_N006 URBAN_6_N001
URBAN_6_N009
Day-Ahead Market Locational Marginal Price
A portion of the CCA market purchases will be made in the CAISO day-ahead market. The CAISO day-
ahead pricing is posted on a platform known as the Open Access Same-time Information System
(OASIS).31 CAISO day-ahead prices obtained from OASIS, as shown in Figure E-7, show significant
variability and volatility when compared to the range of likely costs for the PPA contracts shown in Figure
E-5.
31 California ISO Open Access Same-time Information System (OASIS) http://oasis.caiso.com/mrioasis

APPENDIX E
City of San Diego Community Choice Aggregate Feasibility Study E-21| P a g e
Figure E-7: San Diego Average CAISO Day-Ahead Pricing
Figure E-8 illustrates the maximum, average and minimum range for CAISO DLAP pricing for SDG&E.
Illustrating the volatility of recent day-ahead market activity, SDG&E DLAP pricing in May of 2016 ranged
from $-0.70 to $194.53 per MWh. Negative pricing indicates the CAISO has excess generation that cannot
go offline and will pay to either have a generator curtail output or incentivize a market participant to use
more energy. The day-ahead price of $194.53 translates to $0.19453 per kWh.

APPENDIX E
City of San Diego Community Choice Aggregate Feasibility Study E-22| P a g e
Figure E-8: Maximum, Average and Minimum Hourly CAISO Day-Ahead SDG&E
DLAP Pricing
CAISO Real-time Market CCA Pricing
A portion of the City CCA program’s market purchases will be procured in the CAISO real-time market.
The CAISO real-time market is comprised of multiple market processes and market products. The Hour
Ahead Scheduling Process, is used to dispatch non-dynamic system resources to meet near-term system
balancing requirements. Ancillary services are market products that serve the real-time balancing needs
for electricity supply and demand.
Real-time market costs for the CCA were estimated using the real-time five-minute interval LMP data
from CAISO OASIS.32 As can be seen by comparing Figures E-8 and E-10, the volatility and price
magnitude of the real-time market is significantly greater than that of the day-ahead market.
32 California Independent System Operator (CAISO) Open Access Same-time Information System (OASIS)
http://oasis.caiso.com/mrioasis

APPENDIX E
City of San Diego Community Choice Aggregate Feasibility Study E-23| P a g e
Figure E-9: Hourly Average of CAISO Real-Time SDG&E DLAP Cost
Figure E-10: Maximum, Average and Minimum CAISO Real-Time SDG&E DLAP
Pricing
APPENDIX E
City of San Diego Community Choice Aggregate Feasibility Study E-24| P a g e
CAISO Price Extremes and Volatility
The amount of renewable resources on the system impacts CAISO power prices which impacts the City
CCA program’s energy supply costs. Essentially, if there is more renewable generation than expected
from customer-owned solar PV DG and/or utility scale renewable generation, then prices can be very low
or negative as long as the supply exceeds demand. Similarly, if renewable generation is less than
expected, then CAISO prices increase to entice additional generation resources to make up the shortfall.
The following conditions drive price extremes:
• The variable output from customer-owned solar PV DG results in less predictable demand
resulting in load forecasts that are either too high or too low because the variable output modifies
the amount of energy that the LSE must provide.
• During hours when solar irradiation at ground level is high, generation from customer-owned
solar PV DG reduces overall system demand while at the same time utility-scale solar PV,
purchased through PPAs, is likely overproducing relative to its nominal output. This dampened
demand/over supply condition drives CAISO pricing downward as supply exceeds demand.
• During hours with less solar irradiation at ground level, less generation from customer-owned PV
DG increases overall system demand while at the same time utility-scale solar PV, is likely
underproducing relative to its nominal output. This increased demand/reduced supply condition
increases overall CAISO pricing as marginally more expensive resources are dispatched to serve
this load.
Unfortunately, this variability of renewable generation drives the increasing volatility of the CAISO
market prices and this requires more complex CAISO market products to mitigate the volatility. The
implication for the City CCA program’s energy supply portfolio management will be to hedge CCA load
variability, taking into consideration the increased volatility of the spot/short term markets. Higher spot
volatility may imply higher hedge percentages (i.e. fixed price products even for short-term
requirements) to mitigate exposure to the CAISO market prices.
The CAISO now tracks the amount of statewide renewable resources that contribute to the total
electricity needs for participating LSEs in California.33 This analysis includes renewable resources from all
participants and does not include customer-owned DG (which have the effect of reducing demand).
Figure E-11 illustrates the mid-day ramping of utility-scale solar resources with other renewable
resources continuing to generate throughout the day.
33 CAISO Renewables Watch: http://www.caiso.com/market/Pages/ReportsBulletins/DailyRenewablesWatch.aspx

APPENDIX E
City of San Diego Community Choice Aggregate Feasibility Study E-25| P a g e
Figure E-11: Replica of CAISO’s November 10, 2016 Renewables Watch Renewable
Portfolio
The Study assumes that the energy cost forecasts, which are based on current trends, still apply with
increasing levels of renewable generation. However, the intermittency of renewable generation
resources combined with the variability of solar generation output during daylight hours may make these
assumptions change going forward. For example:
• As more solar generation capacity is added to the system, the value of that daytime capacity
diminishes.
• When renewable generation, including solar PV, has enough capacity to meet daytime electricity
demand, natural gas generation will still be required to be on-line to provide local and system
reliability reserve, area frequency and voltage support and to provide additional generation when
renewable output is less than expected. While natural gas-fired generation output is low, the
resulting effective heat rates are suboptimal and will tend to increase the cost of energy supplied
by these natural gas-fired resources. The economic and financial impacts on natural gas-fired
generation may result in large shifts from historical pricing patterns and cause additional cost
uncertainty for future energy supply portfolios.
• When renewable generation exceeds demand, CAISO prices will be negative (i.e., the CAISO will
pay takers of energy) requiring energy storage charging, demand response resources to increase
demand, and potentially the curtailment of renewable generation to keep the electricity grid in
balance.
Resource Adequacy
LSEs can procure RA capacity through various processes, but most will require a specific solicitation
because currently there is no liquid market for capacity products in California and all RA transactions

APPENDIX E
City of San Diego Community Choice Aggregate Feasibility Study E-26| P a g e
occur in the bilateral marketplace.34 The most straightforward approach is the use of the “full
requirements load following” type of PPAs that provide all energy (renewable and conventional including
base load and shaped load requirements), capacity (system and local RA), distribution losses, uplift and
any ancillary charges. LSEs can issue requests for proposals for procurement of RA capacity, soliciting a
capacity amount, price, and term from qualified power marketers and/or generation owners, either as
stand-alone requests or as part of a larger, more comprehensive procurement initiative. California
utilities go through this process annually using a request for offer (RFO) process to procure RA products
for their bundled service customers. LSEs can require RA be provided as part of PPAs covering purchased
energy and capacity through one solicitation. Most power marketers and all generation owners are
potential suppliers of RA products. Because the RA capacity market is illiquid, price discovery is difficult.
However, the CPUC’s 2013 – 2014 Resource Adequacy Report35 estimates a range of capacity pricing.
Table E-5 shows the Southern California region or South of Path 26 Zone (known as SP-26) pricing from
this report.
Table E-5: SP-26 Aggregated RA Contract Prices 2013-1735
SP-26 Aggregated RA Contract Prices 2013-1735 $/kW Month
Weighted Average Price $3.60
Average Price $3.61
Minimum Price $0.09
Maximum Price $26.54
85th Percentile $8.20
34 Note that the CPUC is considering a Demand Response Auction Mechanism (DRAM) for demand response resources after
bifurcation of Demand Response (DR) resources into “load modifying” and “supply side” DR. 35 CPUC 2013 – 2014 Resource Adequacy Report, August 2015, www.cpuc.ca.gov/WorkArea/DownloadAsset.aspx?id=6325

APPENDIX E
City of San Diego Community Choice Aggregate Feasibility Study E-27| P a g e
Figure E-12: Resource Adequacy Price Forecast
This Study used the historical data from the 2013 – 2014 Resource Adequacy Report to develop the
forecasted RA cost used in the Monte Carlo energy supply portfolio cost analysis illustrated in Figure E-
12. This decreasing trend in RA cost is consistent with the increase in DG PV. A decade ago, the peak
demand and most expensive RA resources were required slightly before the solar PV output peak. As DG
PV has increased, this daytime peak capacity requirement has decreased.
MONTE CARLO ENERGY SUPPLY PORTFOLIO COST ANALYSIS
Managing power purchases to serve varying customer demand for electricity at any given hour of any
given month is the primary responsibility of a CCA. The Monte Carlo Simulation Model (MCSM) runs
assist these decisions by evaluating the likely load based on statistical probability of occurrence. For
purposes of this feasibility Study, the MCSM ran ten simulated 15-year load forecasts to estimate the
potential variability in future customer load based on past behavior. The variability of both customer-
owned variable generation as well as utility scale bulk renewable generation on the power supply side
has also been modeled in the MCSM. These simulations bound the City CCA program’s exposure to
volatile market prices.
The Monte Carlo energy supply portfolio cost analysis used the load forecast, energy supply portfolio
cost estimates and a statistical interpretation of the associated variables to estimate both demand and

APPENDIX E
City of San Diego Community Choice Aggregate Feasibility Study E-28| P a g e
power supply costs for every hour of every day in the 2020-2035 time horizon of this Study. The following
RPC Scenarios were run in the MCSM:
• Base Case Scenario - 50% Renewable Portfolio Content power supply for 98% of CCA customers
with the remaining 2% of CCA customers opting up to the 100% Renewable Portfolio Content
optional program
• Scenario 2 - 50% Renewable Portfolio Content power supply for all customers
• Scenario 3 - 80% Renewable Portfolio Content power supply for all customers
• Scenario 4 - 100% Renewable Portfolio Content power supply for all customers
• Scenario 5 - 80% Renewable Portfolio Content power supply for 98% of CCA customers with the
remaining 2% of CCA customers opting up to the 100% Renewable Portfolio Content optional
program
Ten MCSM simulations for each Scenario were run to determine the 95% confidence interval for both
usage and energy supply portfolio costs. The following outlines the basic tasks conducted as part of the
Monte Carlo energy supply portfolio cost analysis.
• Load Forecast
o The load analysis used historical hourly usage data to determine the historical average
and standard deviation with confidence intervals to inform the expected load and
quantity of power needed to be purchased in advance through PPAs.
o The Study relied on the annual electricity usage for SDG&E’s entire service territory from
2001 to 2015, as reported in the U.S. Department of Energy’s Energy Information
Administration’s Form EIA-826,36 to develop a curve fit forecast of electric energy
consumption through 2035. This load forecast was then adjusted for future years to
include only bundled customers within the City CCA program’s territory.
o Every hour of every day for the 2020-2035 Study period was then simulated using a
normal statistical distribution with the average and standard deviation of demand for
any given hour of any given month, with differentiation between weekdays and
weekends/holidays.
• Customer Owned DG
o The simulated days for 2020-2035 then estimate customer Solar PV output with a normal
statistical distribution for variable output for any given hour of any given month, with
differentiation between weekdays and weekends/holidays.
• Utility-Scale Renewable Generation
o The actual output from bulk renewable generation is considered variable generation. To
simulate this, the output was adjusted randomly relative to expected electricity delivery
between -6% and +6% with the average output meeting expectations.
o When excess bulk renewable generation is provided, the excess is modeled as sold into
the CAISO market.
o When bulk renewable generation provides less energy than expected, additional energy
is modeled as being procured from the CAISO market.
36 DOE Energy Information Agency, Form EIA-826Monthly SDG&E Delivery & Sales 2010-2015:
http://www.eia.gov/electricity/data/eia826/

APPENDIX E
City of San Diego Community Choice Aggregate Feasibility Study E-29| P a g e
• CAISO Supply Costs
o CAISO Supply Costs were simulated for the 2020-2035 Study period using day-ahead and
real-time LMP pricing from January 2013 through October 2016 combined with a beta
distribution constrained by the maximum and minimum market prices encountered for
any given hour of any given month, with differentiation between weekdays and
weekends/holidays.
• Results for the various renewable portfolio content Scenarios were developed.
50% RENEWABLE PORTFOLIO CONTENT SCENARIO
Table E-6 reflects the 95% confidence interval power procurement costs developed from the ten MCSM
runs for the 50% RPC Scenario.
Table E-6: 95% Confidence Interval Procurement Costs for 50% RPC Scenario
Year Net
Simulated
Annual
MWh
RA
$
Natural
Gas
PPA
$
Renewable
Energy
PPA
$
CPUC
Day-Ahead
$
CPUC
Real-Time
$
Storage
Cost
per
Year
Total $ per
MWh
2020 7,129,503 $62,818,232 $146,769,569 $317,485,266 $1,804,609 $12,571,731 $1,832,089 $543,281,496 $76
2021 7,098,102 $62,935,459 $138,295,339 $316,068,351 $1,903,095 $13,130,050 $1,693,839 $534,026,134 $75
2022 7,086,700 $63,046,446 $136,120,446 $305,226,331 $1,541,333 $12,398,022 $1,565,905 $519,898,484 $73
2023 7,077,799 $63,151,915 $134,704,909 $308,854,246 $1,829,207 $12,171,631 $1,447,536 $522,159,444 $74
2024 7,084,168 $63,252,454 $127,050,582 $306,974,962 $1,930,975 $12,509,876 $1,338,031 $513,056,880 $72
2025 7,048,318 $63,348,549 $122,648,919 $308,523,420 $1,781,923 $12,070,619 $1,236,740 $509,610,170 $72
2026 7,044,270 $63,440,612 $120,437,828 $298,836,043 $1,798,237 $12,214,744 $1,143,057 $497,870,520 $71
2027 7,038,783 $63,528,992 $118,017,247 $299,335,993 $1,935,875 $12,366,483 $1,056,419 $496,241,008 $71
2028 7,050,206 $63,613,996 $113,897,268 $304,004,208 $1,846,091 $11,842,244 $976,303 $496,180,110 $70
2029 7,026,284 $63,695,886 $110,129,045 $302,456,296 $1,820,032 $12,659,898 $902,226 $491,663,383 $70
2030 7,026,740 $63,774,897 $106,951,693 $301,659,656 $1,870,970 $12,762,843 $833,737 $487,853,795 $69
2031 7,024,550 $63,851,234 $103,162,930 $294,832,146 $1,800,228 $11,891,459 $770,419 $476,308,415 $68
2032 7,048,259 $63,925,082 $102,895,509 $293,790,454 $1,747,557 $12,943,428 $711,885 $476,013,915 $68
2033 7,040,691 $63,996,604 $99,792,289 $299,500,554 $1,887,195 $12,398,799 $657,778 $478,233,219 $68
2034 7,047,360 $64,065,950 $98,321,589 $290,779,404 $1,968,940 $12,356,425 $607,764 $468,100,073 $66
2035 7,050,004 $64,133,254 $96,194,791 $291,866,047 $1,725,923 $11,662,946 $561,538 $466,144,498 $66
Tables E-7 through E-12 provide the range of simulated power procurement results for the 50% RPC
Scenario that fed into the procurement costs that were displayed in Table E-6. The minimum, average,
and maximum columns provide the range and mean of the Monte Carlo results from 10 simulation runs.
The 95% CI column takes the variation from those 10 runs, and prescribes the upper end of a 95%
confidence interval. That is, there is a 95% probability that expected costs will be less than the 95% CI
value.

APPENDIX E
City of San Diego Community Choice Aggregate Feasibility Study E-30| P a g e
Table E-7: Range of Simulated Annual Natural Gas Generation Procurement Costs
Year Minimum Natural Gas
PPA $
Average Natural Gas
PPA $
95% CI Natural Gas
PPA $
Maximum Natural Gas
PPA $
2020 $115,771,809 $137,793,485 $146,769,569 $161,879,546
2021 $102,296,057 $128,766,572 $138,295,339 $151,321,540
2022 $104,465,657 $126,794,685 $136,120,446 $152,134,806
2023 $95,436,062 $124,242,917 $134,704,909 $149,411,255
2024 $95,973,182 $118,452,444 $127,050,582 $140,601,901
2025 $87,543,057 $112,129,038 $122,648,919 $140,556,885
2026 $85,555,144 $110,439,157 $120,437,828 $135,904,214
2027 $84,079,020 $108,787,735 $118,017,247 $131,561,710
2028 $82,360,651 $105,214,111 $113,897,268 $126,660,820
2029 $76,767,483 $100,412,643 $110,129,045 $127,988,938
2030 $68,776,599 $96,584,939 $106,951,693 $126,201,069
2031 $65,015,853 $92,983,125 $103,162,930 $117,204,621
2032 $71,122,240 $93,763,698 $102,895,509 $115,849,538
2033 $62,530,653 $89,538,866 $99,792,289 $114,403,696
2034 $63,933,714 $88,637,631 $98,321,589 $113,320,193
2035 $60,336,327 $86,080,309 $96,194,791 $111,355,990
Table E-8: Range of Simulated Annual 50% Renewable Portfolio Content
Generation Procurement Costs
Year Minimum RPC PPA $ Average RPC PPA $ 95% CI RPC PPA $ Maximum RPC PPA $
2020 $227,259,645 $293,531,944 $317,485,266 $354,204,321
2021 $232,953,462 $292,750,204 $316,068,351 $351,703,571
2022 $233,465,108 $284,821,809 $305,226,331 $338,181,427
2023 $241,112,467 $290,094,848 $308,854,246 $335,261,463
2024 $239,959,372 $287,366,065 $306,974,962 $340,583,452
2025 $243,936,483 $288,945,789 $308,523,420 $343,162,030
2026 $241,959,301 $281,319,527 $298,836,043 $334,348,617
2027 $234,118,806 $280,945,149 $299,335,993 $325,115,409

APPENDIX E
City of San Diego Community Choice Aggregate Feasibility Study E-31| P a g e
Year Minimum RPC PPA $ Average RPC PPA $ 95% CI RPC PPA $ Maximum RPC PPA $
2028 $239,995,337 $287,060,167 $304,004,208 $328,284,622
2029 $245,671,514 $287,104,107 $302,456,296 $326,534,443
2030 $234,919,468 $283,732,914 $301,659,656 $328,949,907
2031 $245,095,501 $280,582,208 $294,832,146 $314,192,618
2032 $244,323,469 $279,781,576 $293,790,454 $316,381,377
2033 $252,731,571 $285,986,718 $299,500,554 $323,077,571
2034 $250,376,814 $279,454,899 $290,779,404 $304,701,083
2035 $252,103,606 $280,532,622 $291,866,047 $311,885,183
Table E-9: Range of Simulated Annual CAISO Day-Ahead Market Procurement
Costs
Year Minimum CPUC Day-
Ahead $
Average CPUC Day-
Ahead $
95% CI CPUC Day-
Ahead $
Maximum CPUC Day-
Ahead $
2020 -$1,612,526 $922,094 $1,804,609 $2,852,253
2021 -$1,173,914 $1,065,591 $1,903,095 $3,158,766
2022 -$1,368,274 $734,901 $1,541,333 $2,720,405
2023 -$1,029,270 $1,056,511 $1,829,207 $3,031,909
2024 -$2,325,442 $862,272 $1,930,975 $3,506,164
2025 -$1,303,131 $934,251 $1,781,923 $3,363,036
2026 -$1,336,071 $908,196 $1,798,237 $3,138,924
2027 -$1,087,950 $1,098,043 $1,935,875 $3,426,908
2028 -$884,481 $1,035,063 $1,846,091 $3,121,345
2029 -$1,082,446 $952,398 $1,820,032 $3,161,237
2030 -$1,015,524 $1,060,536 $1,870,970 $2,921,772
2031 -$1,193,871 $975,589 $1,800,228 $2,898,998
2032 -$1,562,406 $878,904 $1,747,557 $3,114,965
2033 -$1,151,512 $1,006,452 $1,887,195 $3,339,670
2034 -$1,295,099 $1,067,647 $1,968,940 $3,467,311
2035 -$1,236,078 $873,262 $1,725,923 $3,123,977

APPENDIX E
City of San Diego Community Choice Aggregate Feasibility Study E-32| P a g e
Table E-10: Range of Simulated Annual CAISO Real-Time Market Procurement
Costs
Year Minimum CPUC Real-
Time $
Average CPUC Real-
Time $
95% CI CPUC Real-
Time $
Maximum CPUC Real-
Time $
2020 $6,271,216 $10,755,604 $12,571,731 $15,510,329
2021 $6,684,189 $11,077,374 $13,130,050 $17,045,334
2022 $6,005,053 $10,499,011 $12,398,022 $15,259,649
2023 $4,912,558 $10,172,544 $12,171,631 $15,164,439
2024 $5,984,957 $10,569,991 $12,509,876 $15,961,060
2025 $6,253,521 $10,518,918 $12,070,619 $14,023,423
2026 $5,492,464 $10,436,608 $12,214,744 $14,516,937
2027 $5,958,669 $10,469,487 $12,366,483 $15,340,129
2028 $5,285,024 $9,941,517 $11,842,244 $15,217,005
2029 $6,472,486 $10,848,708 $12,659,898 $15,972,715
2030 $5,978,789 $10,847,267 $12,762,843 $15,670,081
2031 $5,718,637 $9,955,816 $11,891,459 $15,094,496
2032 $6,550,740 $11,041,442 $12,943,428 $15,888,624
2033 $6,243,655 $10,634,143 $12,398,799 $14,817,535
2034 $6,612,913 $10,577,986 $12,356,425 $15,438,506
2035 $6,049,012 $9,985,330 $11,662,946 $14,700,336
Table E-11: Range of Simulated Total Power Supply Portfolio Procurement Costs
Year Minimum $ Average $ 95% CI $ Maximum $
2020 $412,340,465 $507,653,449 $543,281,496 $599,096,771
2021 $405,389,093 $498,289,041 $534,026,134 $587,858,510
2022 $407,179,895 $487,462,756 $519,898,484 $572,908,638
2023 $405,031,268 $490,166,271 $522,159,444 $567,468,517
2024 $404,182,555 $481,841,256 $513,056,880 $565,243,062
2025 $401,015,220 $477,113,285 $509,610,170 $565,690,663
2026 $396,254,506 $467,687,155 $497,870,520 $552,492,361
2027 $387,653,957 $465,885,825 $496,241,008 $540,029,567

APPENDIX E
City of San Diego Community Choice Aggregate Feasibility Study E-33| P a g e
Year Minimum $ Average $ 95% CI $ Maximum $
2028 $391,346,831 $467,841,158 $496,180,110 $537,874,091
2029 $392,427,149 $463,915,969 $491,663,383 $538,255,446
2030 $373,267,965 $456,834,289 $487,853,795 $538,351,462
2031 $379,257,774 $449,118,390 $476,308,415 $514,012,387
2032 $385,071,009 $450,102,586 $476,013,915 $515,871,471
2033 $385,008,750 $451,820,561 $478,233,219 $520,292,854
2034 $384,302,056 $444,411,877 $468,100,073 $501,600,807
2035 $381,947,659 $442,166,315 $466,144,498 $505,760,277
Table E-12: Range of Simulated Total Power Supply Portfolio Procurement Cost
per MW
Year Minimum $/MW Average $/MW 95% CI $/MW Maximum $/MW
2020 $58 $71 $76 $84
2021 $58 $70 $75 $82
2022 $58 $69 $73 $80
2023 $58 $69 $74 $80
2024 $57 $68 $72 $80
2025 $57 $68 $72 $80
2026 $57 $66 $71 $78
2027 $55 $66 $70 $76
2028 $56 $66 $70 $76
2029 $56 $66 $70 $76
2030 $53 $65 $69 $76
2031 $54 $64 $68 $73
2032 $55 $64 $67 $73
2033 $55 $64 $68 $74
2034 $55 $63 $66 $71
2035 $54 $63 $66 $71
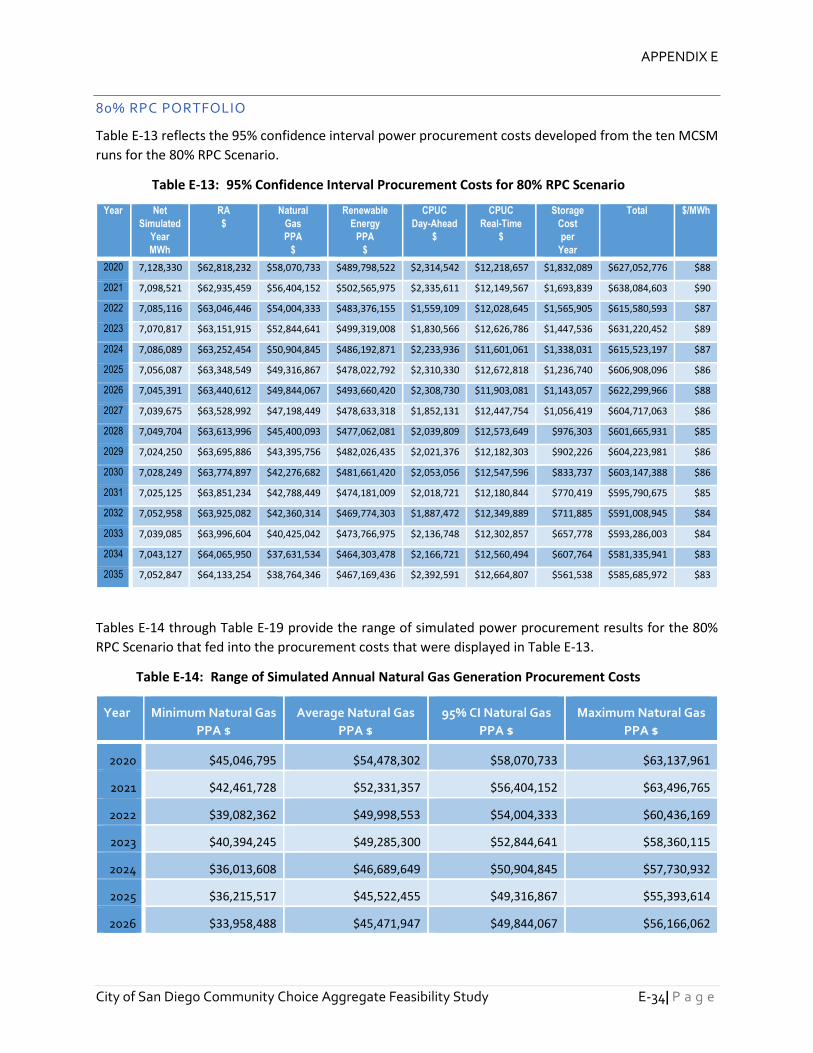
APPENDIX E
City of San Diego Community Choice Aggregate Feasibility Study E-34| P a g e
80% RPC PORTFOLIO
Table E-13 reflects the 95% confidence interval power procurement costs developed from the ten MCSM
runs for the 80% RPC Scenario.
Table E-13: 95% Confidence Interval Procurement Costs for 80% RPC Scenario
Year Net
Simulated
Year
MWh
RA
$
Natural
Gas
PPA
$
Renewable
Energy
PPA
$
CPUC
Day-Ahead
$
CPUC
Real-Time
$
Storage
Cost
per
Year
Total $/MWh
2020 7,128,330 $62,818,232 $58,070,733 $489,798,522 $2,314,542 $12,218,657 $1,832,089 $627,052,776 $88
2021 7,098,521 $62,935,459 $56,404,152 $502,565,975 $2,335,611 $12,149,567 $1,693,839 $638,084,603 $90
2022 7,085,116 $63,046,446 $54,004,333 $483,376,155 $1,559,109 $12,028,645 $1,565,905 $615,580,593 $87
2023 7,070,817 $63,151,915 $52,844,641 $499,319,008 $1,830,566 $12,626,786 $1,447,536 $631,220,452 $89
2024 7,086,089 $63,252,454 $50,904,845 $486,192,871 $2,233,936 $11,601,061 $1,338,031 $615,523,197 $87
2025 7,056,087 $63,348,549 $49,316,867 $478,022,792 $2,310,330 $12,672,818 $1,236,740 $606,908,096 $86
2026 7,045,391 $63,440,612 $49,844,067 $493,660,420 $2,308,730 $11,903,081 $1,143,057 $622,299,966 $88
2027 7,039,675 $63,528,992 $47,198,449 $478,633,318 $1,852,131 $12,447,754 $1,056,419 $604,717,063 $86
2028 7,049,704 $63,613,996 $45,400,093 $477,062,081 $2,039,809 $12,573,649 $976,303 $601,665,931 $85
2029 7,024,250 $63,695,886 $43,395,756 $482,026,435 $2,021,376 $12,182,303 $902,226 $604,223,981 $86
2030 7,028,249 $63,774,897 $42,276,682 $481,661,420 $2,053,056 $12,547,596 $833,737 $603,147,388 $86
2031 7,025,125 $63,851,234 $42,788,449 $474,181,009 $2,018,721 $12,180,844 $770,419 $595,790,675 $85
2032 7,052,958 $63,925,082 $42,360,314 $469,774,303 $1,887,472 $12,349,889 $711,885 $591,008,945 $84
2033 7,039,085 $63,996,604 $40,425,042 $473,766,975 $2,136,748 $12,302,857 $657,778 $593,286,003 $84
2034 7,043,127 $64,065,950 $37,631,534 $464,303,478 $2,166,721 $12,560,494 $607,764 $581,335,941 $83
2035 7,052,847 $64,133,254 $38,764,346 $467,169,436 $2,392,591 $12,664,807 $561,538 $585,685,972 $83
Tables E-14 through Table E-19 provide the range of simulated power procurement results for the 80%
RPC Scenario that fed into the procurement costs that were displayed in Table E-13.
Table E-14: Range of Simulated Annual Natural Gas Generation Procurement Costs
Year Minimum Natural Gas
PPA $
Average Natural Gas
PPA $
95% CI Natural Gas
PPA $
Maximum Natural Gas
PPA $
2020 $45,046,795 $54,478,302 $58,070,733 $63,137,961
2021 $42,461,728 $52,331,357 $56,404,152 $63,496,765
2022 $39,082,362 $49,998,553 $54,004,333 $60,436,169
2023 $40,394,245 $49,285,300 $52,844,641 $58,360,115
2024 $36,013,608 $46,689,649 $50,904,845 $57,730,932
2025 $36,215,517 $45,522,455 $49,316,867 $55,393,614
2026 $33,958,488 $45,471,947 $49,844,067 $56,166,062

APPENDIX E
City of San Diego Community Choice Aggregate Feasibility Study E-35| P a g e
2027 $33,968,177 $43,318,840 $47,198,449 $54,128,715
2028 $32,324,362 $41,642,363 $45,400,093 $51,194,353
2029 $30,232,564 $39,539,328 $43,395,756 $49,861,702
2030 $27,463,363 $38,088,266 $42,276,682 $48,575,183
2031 $29,809,653 $38,952,855 $42,788,449 $49,609,504
2032 $28,284,040 $38,515,408 $42,360,314 $48,778,844
2033 $26,892,236 $36,466,455 $40,425,042 $46,930,332
2034 $26,908,379 $34,613,673 $37,631,534 $41,826,537
2035 $23,719,501 $34,445,385 $38,764,346 $46,054,096
Table E-15: Range of Simulated Annual 80% Renewable Portfolio Content
Generation Procurement Costs
Year Minimum RPC PPA $ Average RPC PPA $ 95% CI RPC PPA $ Maximum RPC PPA $
2020 $376,836,614 $455,682,724 $489,798,522 $544,570,854
2021 $376,892,797 $467,399,094 $502,565,975 $554,910,459
2022 $374,954,852 $452,271,028 $483,376,155 $529,770,273
2023 $380,057,826 $465,881,271 $499,319,008 $549,874,026
2024 $358,946,175 $451,967,054 $486,192,871 $534,958,514
2025 $393,208,693 $453,279,341 $478,022,792 $522,630,024
2026 $379,542,577 $460,653,360 $493,660,420 $547,329,124
2027 $380,407,049 $450,357,833 $478,633,318 $527,725,918
2028 $380,368,873 $450,007,380 $477,062,081 $513,726,334
2029 $383,987,141 $455,244,189 $482,026,435 $523,430,991
2030 $406,823,031 $460,633,661 $481,661,420 $511,634,819
2031 $389,151,597 $451,945,080 $474,181,009 $503,346,103
2032 $390,881,691 $447,253,952 $469,774,303 $503,514,988
2033 $395,541,414 $454,048,498 $473,766,975 $498,438,265
2034 $381,684,938 $442,792,701 $464,303,478 $499,142,135
2035 $412,170,755 $451,599,570 $467,169,436 $491,777,113

APPENDIX E
City of San Diego Community Choice Aggregate Feasibility Study E-36| P a g e
Table E-16: Range of Simulated Annual CAISO Day-Ahead Market Procurement
Costs
Year Minimum CPUC Day-
Ahead $
Average CPUC Day-
Ahead $
95% CI CPUC Day-
Ahead $
Maximum CPUC Day-
Ahead $
2020 -$2,367,790 $1,056,079 $2,314,542 $3,986,458
2021 -$1,139,724 $1,292,986 $2,335,611 $3,837,049
2022 -$2,188,874 $538,339 $1,559,109 $3,002,234
2023 -$1,555,795 $883,558 $1,830,566 $3,531,565
2024 -$1,180,612 $1,215,390 $2,233,936 $3,960,447
2025 -$1,879,300 $1,153,256 $2,310,330 $4,221,537
2026 -$1,991,373 $1,222,011 $2,308,730 $3,813,062
2027 -$2,340,431 $745,797 $1,852,131 $3,504,130
2028 -$2,539,443 $782,296 $2,039,809 $4,463,246
2029 -$1,500,382 $944,935 $2,021,376 $3,679,112
2030 -$1,954,709 $938,574 $2,053,056 $3,713,216
2031 -$1,884,504 $917,674 $2,018,721 $4,006,370
2032 -$2,505,706 $737,660 $1,887,472 $3,499,841
2033 -$1,852,784 $1,023,292 $2,136,748 $3,754,803
2034 -$2,135,002 $1,034,041 $2,166,721 $3,914,370
2035 -$2,202,938 $1,158,341 $2,392,591 $4,052,750
Table E-17: Range of Simulated Annual CAISO Real-Time Market Procurement
Costs
Year Minimum CPUC Real-
Time $
Average CPUC Real-
Time $
95% CI CPUC Real-
Time $
Maximum CPUC Real-
Time $
2020 $5,952,932 $10,446,517 $12,218,657 $14,968,282
2021 $5,087,024 $10,283,668 $12,149,567 $14,814,585
2022 $6,137,566 $10,378,521 $12,028,645 $14,759,699
2023 $5,758,427 $10,725,714 $12,626,786 $15,720,910
2024 $6,211,807 $9,957,150 $11,601,061 $14,689,697
2025 $5,822,117 $10,730,100 $12,672,818 $15,942,103
2026 $5,792,849 $10,177,426 $11,903,081 $14,796,725
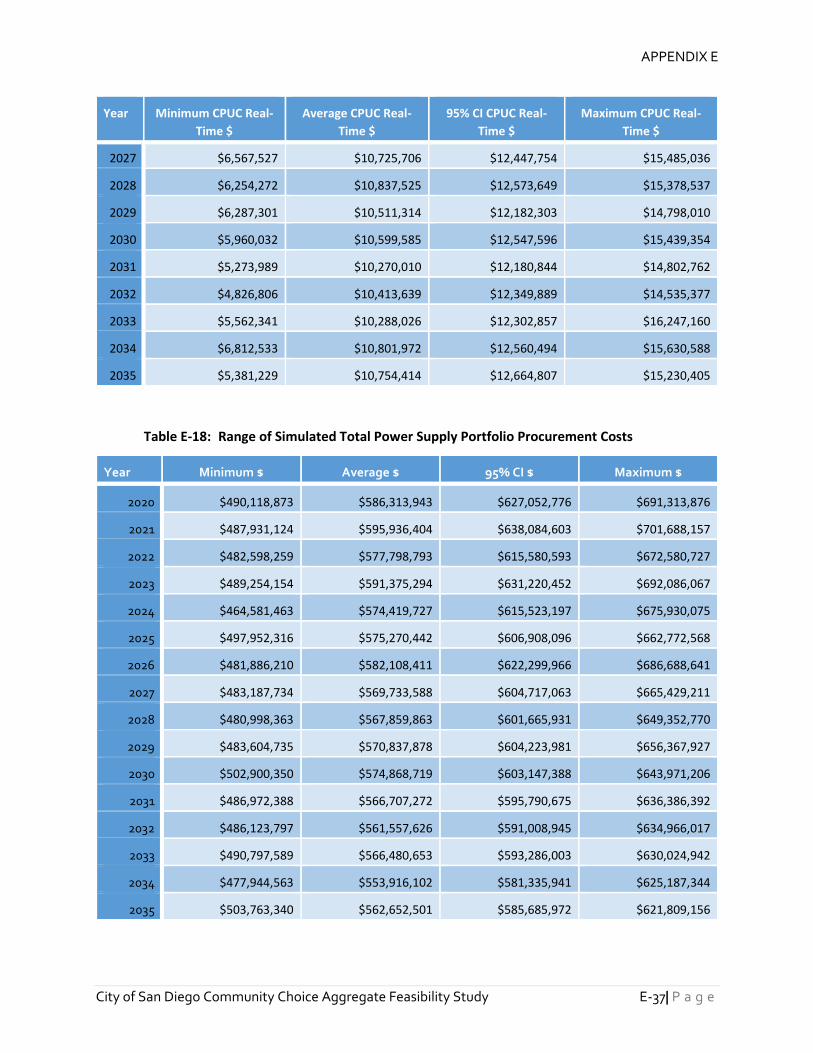
APPENDIX E
City of San Diego Community Choice Aggregate Feasibility Study E-37| P a g e
Year Minimum CPUC Real-
Time $
Average CPUC Real-
Time $
95% CI CPUC Real-
Time $
Maximum CPUC Real-
Time $
2027 $6,567,527 $10,725,706 $12,447,754 $15,485,036
2028 $6,254,272 $10,837,525 $12,573,649 $15,378,537
2029 $6,287,301 $10,511,314 $12,182,303 $14,798,010
2030 $5,960,032 $10,599,585 $12,547,596 $15,439,354
2031 $5,273,989 $10,270,010 $12,180,844 $14,802,762
2032 $4,826,806 $10,413,639 $12,349,889 $14,535,377
2033 $5,562,341 $10,288,026 $12,302,857 $16,247,160
2034 $6,812,533 $10,801,972 $12,560,494 $15,630,588
2035 $5,381,229 $10,754,414 $12,664,807 $15,230,405
Table E-18: Range of Simulated Total Power Supply Portfolio Procurement Costs
Year Minimum $ Average $ 95% CI $ Maximum $
2020 $490,118,873 $586,313,943 $627,052,776 $691,313,876
2021 $487,931,124 $595,936,404 $638,084,603 $701,688,157
2022 $482,598,259 $577,798,793 $615,580,593 $672,580,727
2023 $489,254,154 $591,375,294 $631,220,452 $692,086,067
2024 $464,581,463 $574,419,727 $615,523,197 $675,930,075
2025 $497,952,316 $575,270,442 $606,908,096 $662,772,568
2026 $481,886,210 $582,108,411 $622,299,966 $686,688,641
2027 $483,187,734 $569,733,588 $604,717,063 $665,429,211
2028 $480,998,363 $567,859,863 $601,665,931 $649,352,770
2029 $483,604,735 $570,837,878 $604,223,981 $656,367,927
2030 $502,900,350 $574,868,719 $603,147,388 $643,971,206
2031 $486,972,388 $566,707,272 $595,790,675 $636,386,392
2032 $486,123,797 $561,557,626 $591,008,945 $634,966,017
2033 $490,797,589 $566,480,653 $593,286,003 $630,024,942
2034 $477,944,563 $553,916,102 $581,335,941 $625,187,344
2035 $503,763,340 $562,652,501 $585,685,972 $621,809,156
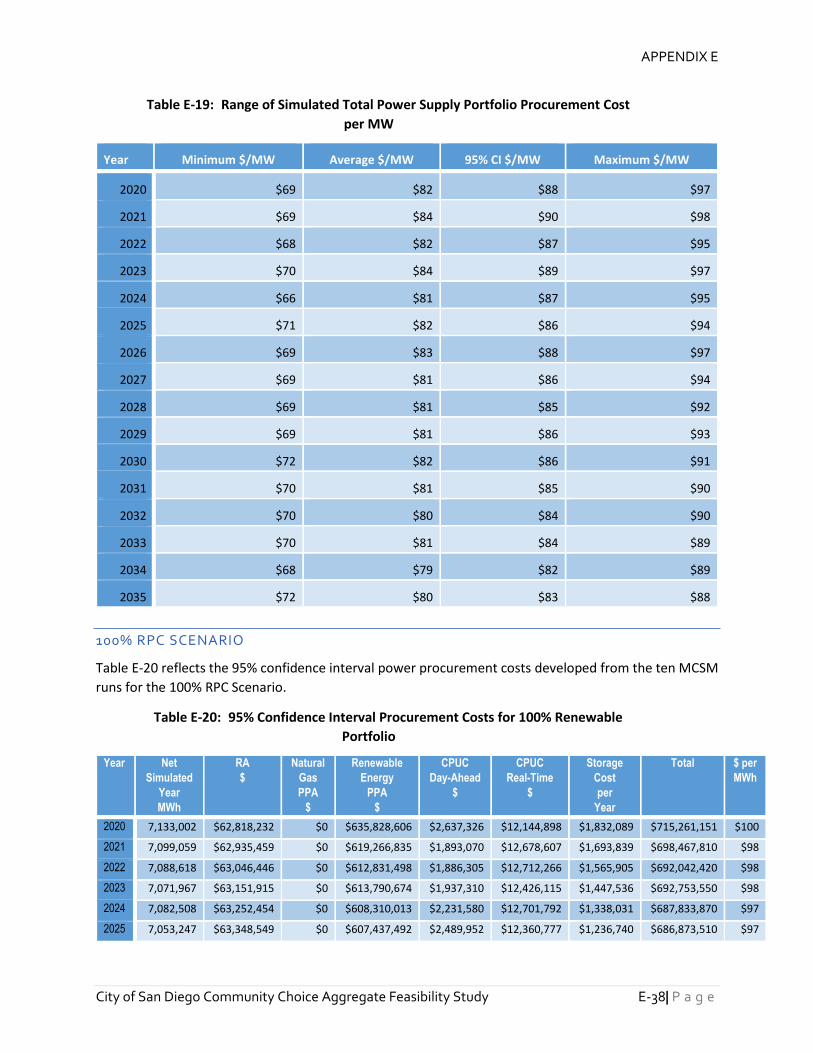
APPENDIX E
City of San Diego Community Choice Aggregate Feasibility Study E-38| P a g e
Table E-19: Range of Simulated Total Power Supply Portfolio Procurement Cost
per MW
Year Minimum $/MW Average $/MW 95% CI $/MW Maximum $/MW
2020 $69 $82 $88 $97
2021 $69 $84 $90 $98
2022 $68 $82 $87 $95
2023 $70 $84 $89 $97
2024 $66 $81 $87 $95
2025 $71 $82 $86 $94
2026 $69 $83 $88 $97
2027 $69 $81 $86 $94
2028 $69 $81 $85 $92
2029 $69 $81 $86 $93
2030 $72 $82 $86 $91
2031 $70 $81 $85 $90
2032 $70 $80 $84 $90
2033 $70 $81 $84 $89
2034 $68 $79 $82 $89
2035 $72 $80 $83 $88
100% RPC SCENARIO
Table E-20 reflects the 95% confidence interval power procurement costs developed from the ten MCSM
runs for the 100% RPC Scenario.
Table E-20: 95% Confidence Interval Procurement Costs for 100% Renewable
Portfolio
Year Net
Simulated
Year
MWh
RA
$
Natural
Gas
PPA
$
Renewable
Energy
PPA
$
CPUC
Day-Ahead
$
CPUC
Real-Time
$
Storage
Cost
per
Year
Total $ per
MWh
2020 7,133,002 $62,818,232 $0 $635,828,606 $2,637,326 $12,144,898 $1,832,089 $715,261,151 $100
2021 7,099,059 $62,935,459 $0 $619,266,835 $1,893,070 $12,678,607 $1,693,839 $698,467,810 $98
2022 7,088,618 $63,046,446 $0 $612,831,498 $1,886,305 $12,712,266 $1,565,905 $692,042,420 $98
2023 7,071,967 $63,151,915 $0 $613,790,674 $1,937,310 $12,426,115 $1,447,536 $692,753,550 $98
2024 7,082,508 $63,252,454 $0 $608,310,013 $2,231,580 $12,701,792 $1,338,031 $687,833,870 $97
2025 7,053,247 $63,348,549 $0 $607,437,492 $2,489,952 $12,360,777 $1,236,740 $686,873,510 $97

APPENDIX E
City of San Diego Community Choice Aggregate Feasibility Study E-39| P a g e
2026 7,041,496 $63,440,612 $0 $612,570,055 $1,745,012 $12,732,216 $1,143,057 $691,630,952 $98
2027 7,035,466 $63,528,992 $0 $600,131,113 $2,100,848 $12,313,337 $1,056,419 $679,130,708 $97
2028 7,048,318 $63,613,996 $0 $595,875,723 $2,317,174 $12,746,072 $976,303 $675,529,268 $96
2029 7,024,550 $63,695,886 $0 $595,091,563 $2,332,556 $12,311,563 $902,226 $674,333,795 $96
2030 7,026,580 $63,774,897 $0 $596,579,556 $2,085,998 $12,352,384 $833,737 $675,626,572 $96
2031 7,027,944 $63,851,234 $0 $601,985,018 $2,426,229 $12,196,747 $770,419 $681,229,647 $97
2032 7,050,873 $63,925,082 $0 $596,442,910 $2,245,995 $12,883,710 $711,885 $676,209,582 $96
2033 7,034,458 $63,996,604 $0 $590,143,067 $1,875,675 $12,524,470 $657,778 $669,197,594 $95
2034 7,043,236 $64,065,950 $0 $593,095,641 $2,741,000 $12,211,807 $607,764 $672,722,163 $96
2035 7,052,563 $64,133,254 $0 $579,629,278 $2,381,154 $12,046,542 $561,538 $658,751,765 $93
Tables E-21 through E-25 provide the range of simulated power procurement results for the 100% RPC
Scenario that fed into the procurement costs that were displayed in Table E-20.
Table E-21: Range of Simulated Annual 100% Renewable Portfolio Content
Generation Procurement Costs
Year Minimum RPC PPA $ Average RPC PPA $ 95% CI RPC PPA $ Maximum RPC PPA $
2020 $458,931,120 $585,135,327 $635,828,606 $702,180,313
2021 $472,365,839 $577,477,212 $619,266,835 $687,305,485
2022 $454,161,574 $573,107,162 $612,831,498 $663,473,962
2023 $454,847,030 $568,815,621 $613,790,674 $685,101,013
2024 $465,783,453 $569,851,422 $608,310,013 $657,907,504
2025 $482,783,904 $568,153,831 $607,437,492 $667,442,261
2026 $475,699,440 $574,489,687 $612,570,055 $670,067,369
2027 $487,261,774 $565,431,804 $600,131,113 $657,916,383
2028 $477,311,092 $563,110,932 $595,875,723 $650,363,933
2029 $479,013,583 $563,352,308 $595,091,563 $646,864,632
2030 $502,379,818 $569,315,139 $596,579,556 $633,846,412
2031 $494,624,379 $570,592,286 $601,985,018 $656,440,858
2032 $498,915,111 $568,217,735 $596,442,910 $641,250,724
2033 $497,595,965 $562,346,921 $590,143,067 $631,174,619
2034 $506,970,523 $568,656,032 $593,095,641 $633,410,640
2035 $502,132,630 $557,336,078 $579,629,278 $616,929,574

APPENDIX E
City of San Diego Community Choice Aggregate Feasibility Study E-40| P a g e
Table E-22: Range of Simulated Annual CAISO Day-Ahead Market Procurement
Costs
Year Minimum CPUC Day-
Ahead $
Average CPUC Day-
Ahead $
95% CI CPUC Day-
Ahead $
Maximum CPUC Day-
Ahead $
2020 -$2,557,200 $1,200,407 $2,637,326 $4,787,441
2021 -$2,630,560 $626,530 $1,893,070 $3,919,417
2022 -$2,405,078 $634,227 $1,886,305 $3,717,676
2023 -$2,395,078 $685,875 $1,937,310 $3,806,540
2024 -$3,146,997 $851,436 $2,231,580 $4,337,777
2025 -$2,256,977 $1,138,709 $2,489,952 $4,436,448
2026 -$1,801,619 $791,309 $1,745,012 $3,141,506
2027 -$2,531,890 $812,959 $2,100,848 $3,960,242
2028 -$1,464,396 $1,144,926 $2,317,174 $4,216,750
2029 -$2,062,055 $1,075,234 $2,332,556 $4,549,882
2030 -$2,097,002 $864,484 $2,085,998 $3,724,981
2031 -$2,252,081 $1,004,346 $2,426,229 $4,829,575
2032 -$2,283,480 $992,193 $2,245,995 $4,176,765
2033 -$2,439,861 $661,785 $1,875,675 $3,695,942
2034 -$2,835,169 $1,326,187 $2,741,000 $4,693,523
2035 -$2,244,261 $1,164,675 $2,381,154 $4,190,481
Table E-23: Range of Simulated Annual CAISO Real-Time Market Procurement
Costs
Year Minimum CPUC Real-
Time $
Average CPUC Real-
Time $
95% CI CPUC Real-
Time $
Maximum CPUC Real-
Time $
2020 $5,453,620 $10,333,347 $12,144,898 $14,651,239
2021 $6,572,531 $10,854,173 $12,678,607 $15,956,763
2022 $4,943,423 $10,693,968 $12,712,266 $16,051,849
2023 $5,267,488 $10,515,067 $12,426,115 $15,003,102
2024 $5,893,529 $10,652,315 $12,701,792 $16,300,576
2025 $5,395,608 $10,439,699 $12,360,777 $15,432,713
2026 $7,089,580 $11,064,617 $12,732,216 $15,469,777

APPENDIX E
City of San Diego Community Choice Aggregate Feasibility Study E-41| P a g e
Year Minimum CPUC Real-
Time $
Average CPUC Real-
Time $
95% CI CPUC Real-
Time $
Maximum CPUC Real-
Time $
2027 $5,944,501 $10,612,469 $12,313,337 $14,975,310
2028 $6,393,367 $10,815,702 $12,746,072 $16,160,657
2029 $5,396,936 $10,225,272 $12,311,563 $16,531,328
2030 $5,706,633 $10,530,595 $12,352,384 $15,159,494
2031 $4,800,185 $10,037,962 $12,196,747 $15,732,261
2032 $5,450,509 $10,816,793 $12,883,710 $16,176,592
2033 $5,477,304 $10,553,189 $12,524,470 $15,516,026
2034 $5,145,294 $10,421,204 $12,211,807 $14,995,876
2035 $5,712,913 $10,412,006 $12,046,542 $14,532,348
Table E-24: Range of Simulated Total Power Supply Portfolio Procurement Costs
Year Minimum $ Average $ 95% CI $ Maximum $
2020 $526,477,861 $661,319,403 $715,261,151 $786,269,314
2021 $540,937,108 $653,587,214 $698,467,810 $771,810,963
2022 $521,312,271 $649,047,708 $692,042,420 $747,855,839
2023 $522,318,890 $644,616,014 $692,753,550 $768,510,107
2024 $533,120,471 $645,945,658 $687,833,870 $743,136,343
2025 $550,507,824 $644,317,528 $686,873,510 $751,896,711
2026 $545,571,068 $650,929,280 $691,630,952 $753,262,320
2027 $555,259,796 $641,442,643 $679,130,708 $741,437,346
2028 $546,830,362 $639,661,859 $675,529,268 $735,331,639
2029 $546,946,575 $639,250,926 $674,333,795 $732,543,954
2030 $570,598,083 $645,318,851 $675,626,572 $717,339,521
2031 $561,794,136 $646,256,247 $681,229,647 $741,624,346
2032 $566,719,107 $644,663,687 $676,209,582 $726,241,048
2033 $565,287,791 $638,216,278 $669,197,594 $715,040,968
2034 $573,954,362 $645,077,138 $672,722,163 $717,773,755
2035 $570,296,073 $633,607,551 $658,751,765 $700,347,194
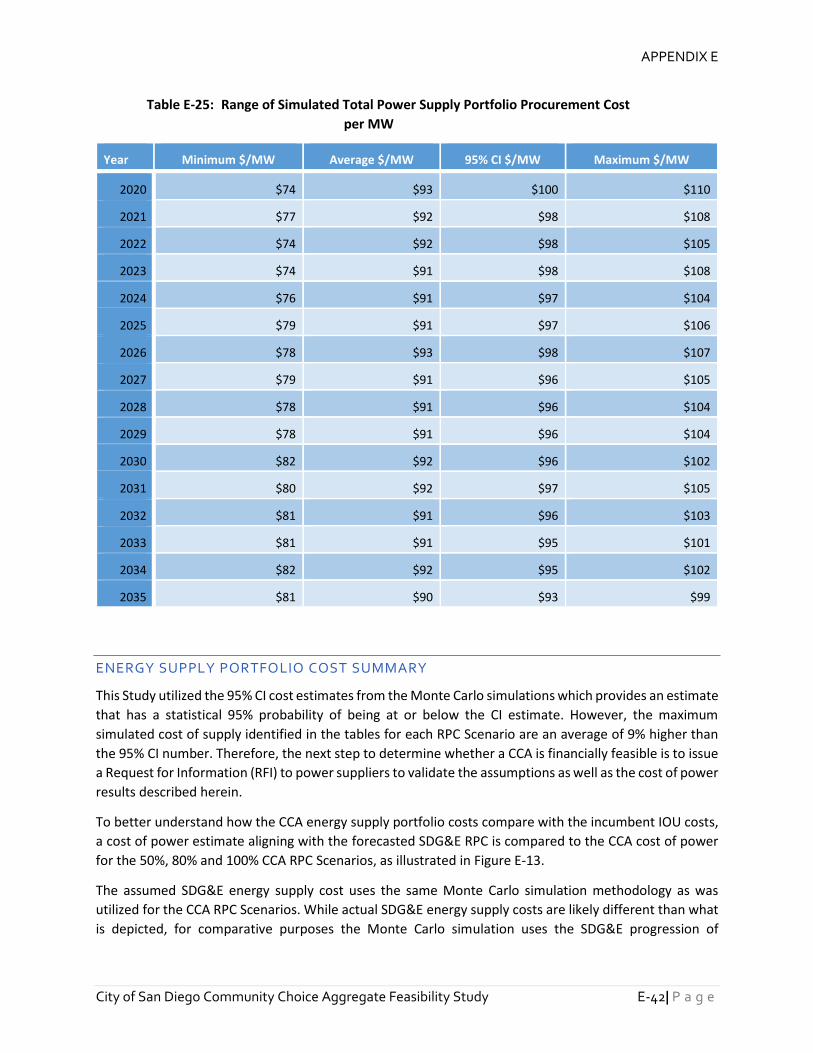
APPENDIX E
City of San Diego Community Choice Aggregate Feasibility Study E-42| P a g e
Table E-25: Range of Simulated Total Power Supply Portfolio Procurement Cost
per MW
Year Minimum $/MW Average $/MW 95% CI $/MW Maximum $/MW
2020 $74 $93 $100 $110
2021 $77 $92 $98 $108
2022 $74 $92 $98 $105
2023 $74 $91 $98 $108
2024 $76 $91 $97 $104
2025 $79 $91 $97 $106
2026 $78 $93 $98 $107
2027 $79 $91 $96 $105
2028 $78 $91 $96 $104
2029 $78 $91 $96 $104
2030 $82 $92 $96 $102
2031 $80 $92 $97 $105
2032 $81 $91 $96 $103
2033 $81 $91 $95 $101
2034 $82 $92 $95 $102
2035 $81 $90 $93 $99
ENERGY SUPPLY PORTFOLIO COST SUMMARY
This Study utilized the 95% CI cost estimates from the Monte Carlo simulations which provides an estimate
that has a statistical 95% probability of being at or below the CI estimate. However, the maximum
simulated cost of supply identified in the tables for each RPC Scenario are an average of 9% higher than
the 95% CI number. Therefore, the next step to determine whether a CCA is financially feasible is to issue
a Request for Information (RFI) to power suppliers to validate the assumptions as well as the cost of power
results described herein.
To better understand how the CCA energy supply portfolio costs compare with the incumbent IOU costs,
a cost of power estimate aligning with the forecasted SDG&E RPC is compared to the CCA cost of power
for the 50%, 80% and 100% CCA RPC Scenarios, as illustrated in Figure E-13.
The assumed SDG&E energy supply cost uses the same Monte Carlo simulation methodology as was
utilized for the CCA RPC Scenarios. While actual SDG&E energy supply costs are likely different than what
is depicted, for comparative purposes the Monte Carlo simulation uses the SDG&E progression of

APPENDIX E
City of San Diego Community Choice Aggregate Feasibility Study E-43| P a g e
contracted RPS-generation amounts37 through 2020 and assuming compliance with the 2030 goal of 50%
RPC.
The peaks and troughs in power supply costs each year is due to the simulation results where customer
usage and cost of power vary per the methodology described earlier. Therefore, we have included the
dotted linear lines to indicate a smoothed linear trend in power supply costs between the various RPC
Scenarios for the City CCA program and SDG&E.
Figure E-13: Cost of Power Comparison 2020-2035
37 CPUC RPS Home Page - Renewable Procurement Status Percentages show SDG&E’s RPS eligible resource mix to be: 31.6%
RPS in 2014, 35.2% RPS in 2015 and 45.2% RPS in 2020: http://www.cpuc.ca.gov/RPS_Homepage/
0
20
40
60
80
100
120
2020 2021 2022 2023 2024 2025 2026 2027 2028 2029 2030 2031 2032 2033 2034 2035
$/M
Wh
Year
100% Renewable CCA Portfolio
80% Renewable CCA Portfolio
50% Renewable CCA Portfolio
Estimated Based on SDG&E Renewable Portfolio Standard Compliance
Linear (100% Renewable CCA Portfolio)
Linear (80% Renewable CCA Portfolio)
Linear (50% Renewable CCA Portfolio)
Linear (Estimated Based on SDG&E Renewable Portfolio Standard Compliance)

This page intentionally left blank.

APPENDIX F
CARBON DIOXIDE EMISSIONS DEVELOPMENT

This page intentionally left blank.
APPENDIX F CARBON DIOXIDE EMISSIONS DEVELOPMENT
Appendix F provides the methodology and assumptions used to develop the estimates of carbon dioxide
(CO2) emissions by Scenario.
This section discusses the current trends in national and California-specific generation emissions. These
trends are important as they provide the context for pursuing a higher renewable portfolio content (RPC)
for energy supplied to the City CCA Program. While the cost of renewable generation has been
decreasing over the last decade, so has the cost of the primary fuel source (natural gas) used to produce
the majority of electric energy in California. In addition, the state of California’s RPS is driving lower
greenhouse gas emissions. SDG&E is currently exceeding the California RPS requirements. Therefore,
the greenhouse gas considerations for pursuing a higher RPC via the City CCA program must be weighed
against the projections based on current and developing trends (or the “as-is” case).
The environmental analysis established within this Study assesses greenhouse gas emissions under a
multitude of different future scenarios, including varying IOU generation portfolios. The analysis began
by analyzing the emissions impact of natural gas generation on a per MWh basis. Then, the proportion
of demand served by natural gas was altered to understand the impact of the different levels of
renewable generation within the RPC Scenarios.
The generation and emissions resulting from the CAISO market is not considered in this analysis. Rather,
the simple assumption was made that each MWh that is not served by renewable generation is served by
natural gas. This is not a perfect analysis for a variety of reasons, including that it does not consider
hydroelectric or nuclear production, nor does it consider the efficiency of natural gas generation under
different operating circumstances (always-on vs. only at peak periods). However, these figures are
intended to provide an indicative approximation of GHG impact for decision makers.
Utilizing available state or multiple-state level emissions data, such as EPA’s eGRID data, is not ideal for
this type of analysis as those data sets combine a variety of resource types (renewable, natural gas, hydro,
coal, etc.) along with line losses to provide a single static statewide average GHG-emissions figure. The
average emissions factor may or may not align with utility-specific supply portfolios given the
performance of various plants operating. Furthermore, this data lends little insight into the effects of
increasing renewable generation content. Because of these issues, the analysis was conducted to
compare environmental impacts based on natural gas generation emission factors. This approach allows
for an apples-to-apples comparison of the different CCA RPC Scenarios and SDG&E RPS scenarios.
ZERO GHG EMISSIONS GENERATION
According to preliminary Energy Information Administration (EIA) data for 2016,1 California generated
47.2% of electricity with zero emission sources including:
1 US EIA Electric Power Monthly https://www.eia.gov/electricity/monthly/

APPENDIX F
City of San Diego Community Choice Aggregate Feasibility Study F-2| P a g e
• Nuclear : 9.2%
• Conventional Hydroelectric: 14.8%
• Solar Thermal and Photovoltaic: 9.8%
• Wind: 7.3%
• Geothermal: 6.1%
Including nuclear and hydroelectric generation, California ranks tenth compared to other states in terms
of zero emission generation sources. However, California also has the most diverse portfolio of zero
emission generation sources as illustrated in FigureF-1.
Figure F-1: Percentage of Zero Emissions Electricity Consumption by State

APPENDIX F
City of San Diego Community Choice Aggregate Feasibility Study F-3| P a g e
EMISSION REDUCTION COMPARISON WITH THE CLIMATE ACTION PLAN
The City of San Diego Climate Action Plan (CAP) 2 assumed a certain level of Net Energy for Load (GWh)
based on linear load growth from 2010 to 2020; and then to 2035. This Study’s load forecast, however,
estimates 25% lower usage in 2035 than was estimated in the CAP, as depicted in Figure F-2 and Table
F-1.
Figure F-2: Climate Action Plan and CCA Feasibility Report Forecast Comparison
2 City of San Diego Climate Action Plan https://www.sandiego.gov/sites/default/files/final_july_2016_cap.pdf

APPENDIX F
City of San Diego Community Choice Aggregate Feasibility Study F-4| P a g e
Table F-1: City of San Diego Climate Action Plan Table 2, Net Energy and Generation Estimate and CCA
Forecast Comparison
Forecast (MWh) 2010 2013 2014 2015 2020 2035
CAP Table 2 Net Energy for
Load3
9,505,000
10,220,000 12,061,000
CAP Gross Generation4 9,580,000
10,826,000 13,910,000
City of San Diego Total Usage
Forecast
8,921,014 8,942,709 8,962,954 9,047,866 9,215,353
City of San Diego Historical
Usage
8,665,605 8,836,536 8,695,795
City of San Diego Total
Bundled Customer Usage
Forecast
7,115,749 7,133,054 7,149,202 7,216,931 7,350,526
City of San Diego Bundled
Customer Historical Usage
Total
6,926,341 7,050,745 6,919,251
Two primary factors contribute to this lower usage: 1. Lower load growth forecast in comparison with the CAP as detailed in Appendix D; and 2. Increasing customer adoption of PV system which reduces the amount of electricity provided
by the LSE.
EMISSIONS FROM NATURAL GAS GENERATION
According to the EIA, “Carbon dioxide emissions from electricity generation in 2015 were lowest since
1993.”5 Figure F-3 from the EIA illustrates the increase in natural gas fueled generation and associated
reduction in CO2 emissions.
3 San Diego CAP notation: Kavalec, Chris, Nicholas Fugate, Bryan Alcorn, Mark Ciminelli, Asish Gautam, Kate Sullivan, and
Malachi Weng‐Gutierrez, 2013. California Energy Demand 2014‐2024 Final Forecast, Volume 1: Statewide Electricity Demand,
End‐User Natural Gas Demand, and Energy Efficiency. California Energy Commission, Electricity Supply Analysis. Division.
Publication Number: CEC‐200‐2013‐004‐SF‐VI. Values beyond 2024 are extrapolated. 4 San Diego CAP notation: Gross generation is the sum of net energy for load (GWh), additional electricity load in the City of San
Diego from CA Electric Vehicle Policies and Program (includes transmission and distribution losses), and electricity generation
from CA Solar Programs (does not include transmission and distribution losses). 5 Carbon Dioxide emissions from the electric power sector: http://www.eia.gov/todayinenergy/detail.php?id=26232

APPENDIX F
City of San Diego Community Choice Aggregate Feasibility Study F-5| P a g e
Figure F-3: Comparison of Coal and Natural Gas Generation
According to the EIA,6 in 2016 with a heat rate of 10,408, natural gas generation results in 1.22 pounds of
CO2 per kWh. As the domestic supply of natural gas has been increasing, and associated cost decreasing,
the heat rate (or efficiency) of producing electricity from natural gas has also been improving. Per the
CEC’s Quarterly Fuels and Energy Report, 7 the heat rate for natural gas emissions in California in 2014
was 7,760, or 25% better than the EIA cited heat rate. This translates to an associated reduction in CO2
emissions to 0.91 pounds of CO2 per kWh. Additionally, the heat rate for natural gas generation has been
improving over time and this Study assumes that it will continue to do so, as illustrated in Figure F-4.
6 EIA: Carbon dioxide is produced per kWh when generating electricity http://www.eia.gov/tools/faqs/faq.cfm?id=74&t=11 7 CEC Quarterly Fuels and Energy Report (QFER) CEC-1304 Power Plant Data Reporting - Thermal Efficiency of Gas-Fired
Generation in California: 2015 Update:
http://www.energy.ca.gov/2016publications/CEC-200-2016-002/CEC-200-2016-002.pdf

APPENDIX F
City of San Diego Community Choice Aggregate Feasibility Study F-6| P a g e
Figure F-4: Natural Gas Generation Heat Rate (Efficiency)
As a result, the CO2 output from natural gas is continuing to improve compared to the prior San Diego
baseline CAP emissions factor assumptions, as depicted in Table F-2. Even without the increase in RPC,
combined with a citywide load forecast summarized in the same table, there is a significant improvement
in emissions, which further reduce the weighted emissions factor.

APPENDIX F
City of San Diego Community Choice Aggregate Feasibility Study F-7| P a g e
Table F-2: Emissions Improvement Relative to San Diego CAP,
Without Increased RPC
Year CAP Gross
Generation
(MWh)
Baseline
CAP
Emissions
Factor
(lbs.
CO2e/MWh
CAP Baseline
Emissions
(CO2e/MWh)
This
Study’s
Forecasted
All City
Generation
(MWh)
This Study’s
Forecasted
Emissions
Factor with
NG Heat Rate
Improvements
(lbs.
CO2e/MWh)
This Study’s
Emissions,
without
additional
RPC
(CO2e/MWh)
Combined %
Improvement
in
Emissions,
without
additional
RPC
2010 9,580,000 730 6,993,400,000
2020 10,826,000 730 7,902,980,000 9,047,866 488 4,415,358,608 44%
2035 13,910,000 730 10,154,300,000 9,215,353 420 3,870,448,260 62%
CCA GREENHOUSE GAS EMISSIONS REDUCTION POTENTIAL
Consistent with direction from the State of California, the City has established a greenhouse gas
reduction target of 50% below a 2010 baseline by 2035. Long-term reductions established by the state
extend these targets to an 80% reduction by 2050. The largest sources of emissions in the City are from
electricity, natural gas, and fossil fuel-based transportation. The City established its renewable energy
policy and is pursuing a 100% renewable electricity goal in support of its overall greenhouse gas emissions
reductions target. To determine the extent to which a CCA would achieve greenhouse gas emissions
reductions through the use of renewable generation, forecasts of SDG&E’s RPC need to be compared to
the City CCA program’s RPC Scenarios.
SDG&E currently has two major sources of energy supply: RPS-eligible resources and natural gas-fired
resources as illustrated in Table F-3, its 2015 SDG&E Power Content Label.

APPENDIX F
City of San Diego Community Choice Aggregate Feasibility Study F-8| P a g e
Table F-3: 2015 SDG&E Power Content Label8
The 11% of unspecified sources of power in SDG&E’s 2015 energy portfolio shown is likely comprised of
CAISO supplied power, which was comprised of the following generation mix:9
• 40% Natural Gas
• 28% Import from other states
• 18% Non-Hydro Renewables
• 8% Nuclear
• 5% Hydroelectric
Per the CPUC RPS homepage,10 SDG&E had actual past RPS compliance and forward contracts in place
that exceed the California RPS requirements as shown in Table F-4.
8 Power Content Label required by AB 162 (Statute of 2009) and Senate Bill 1305 (Statutes of 1997):
http://www.energy.ca.gov/pcl/labels/ 9 CAISO Annual Market Report: http://www.caiso.com/Documents/2015AnnualReportonMarketIssuesandPerformance.pdf 10 California Renewables Portfolio Standard (RPS) http://www.cpuc.ca.gov/RPS_Homepage/

APPENDIX F
City of San Diego Community Choice Aggregate Feasibility Study F-9| P a g e
Table F-4: Actual and Contracted SDG&E RPS-Compliant Resources Relative to California RPS Requirements
Year RPS Requirement11 Actual and Contracted SDG&E RPS %
2014 21.7% 31.6%
2015 23.3% 35.2%
2020 33% 45.2%
2030 50%
Figure F-5 summarizes and forecasts the estimated SDG&E RPS-compliant generation for 2003 through
2030 based on SDG&E’s contracted RPS PPAs. The Study assumes that SDG&E meets the 50% RPS goal
in 2030 and maintains the 50% RPS until 2035. The Study forecast is shown in the light blue dotted line,
labeled SDG&E Renewable Portfolio Standard Compliant. The assumption that SDG&E will only meet
the 2030 50% RPS requirement may underestimate SDG&E’s actual RPS for 2030, considering that
SDG&E exceeded the 2014 goal by almost 10%, exceeded the 2015 goal by almost 12% and already has
RPS contracts in place to exceed the 2020 RPS goal by over 12%. An alternative forecast for SDG&E’s
RPC, taking into account the history of exceeding RPS goals, is represented by the SDG&E Renewable
Portfolio Content Trend line. This trend line, included solely for illustrative purposes, indicates that
SDG&E could exceed 60% RPS by 2030 rather than just meeting the 50% RPS requirement. Both of these
scenarios are considered in comparison with the CCA RPC Scenarios. However, SDG&E has not indicated
it would exceed RPS requirements and this data is not used in Study results.
11 California 33% RPS Procurement Rules: http://www.cpuc.ca.gov/RPS_Procurement_Rules_33/
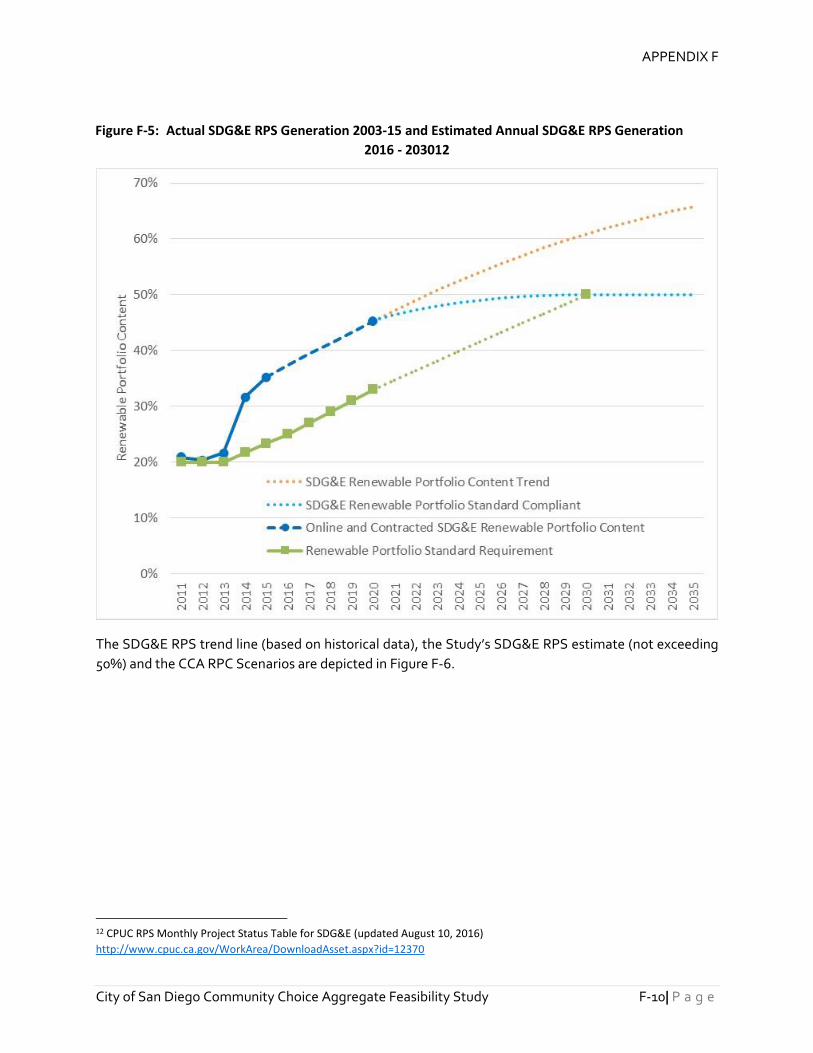
APPENDIX F
City of San Diego Community Choice Aggregate Feasibility Study F-10| P a g e
Figure F-5: Actual SDG&E RPS Generation 2003-15 and Estimated Annual SDG&E RPS Generation
2016 - 203012
The SDG&E RPS trend line (based on historical data), the Study’s SDG&E RPS estimate (not exceeding
50%) and the CCA RPC Scenarios are depicted in Figure F-6.
12 CPUC RPS Monthly Project Status Table for SDG&E (updated August 10, 2016)
http://www.cpuc.ca.gov/WorkArea/DownloadAsset.aspx?id=12370

APPENDIX F
City of San Diego Community Choice Aggregate Feasibility Study F-11| P a g e
Figure F-6: SDG&E RPS Estimate, SDG&E RPS Trend, and CCA RPC Scenarios
Including the improving heat rate for natural gas generation and increasing RPC for SDG&E yields a CO2
equivalent per MWh comparison between the SDG&E RPS Trend, the Study’s SDG&E RPS Estimate, and
the CCA RPC Scenarios13 as summarized in Table F-5. The emissions continue to decline post 2030, even
in those Scenarios where the RPC meets the 2030 RPS requirement and then continues unchanged, due
to the declining heat rate of natural gas-fired generation.
Table F-5: Estimated Weighted Emissions Factor for SDG&E and CCA RPC Scenarios
Year Emissions Factor CO2e
Study Forecast of SDG&E Pounds of
CO2e/MWh
SDG&E RPS Trend Pounds of CO2e/MWh
CCA 50% RPC Pounds of
CO2e/MWh
CCA 80% RPC Pounds of
CO2e/MWh
CCA 100% RPC Pounds of
CO2e/MWh
2020 488 488 486 445 178 0
2021 481 481 468 443 177 0
2022 475 475 449 441 176 0
13 It is assumed that direct access customer LSEs will also comply with RPS requirements. However, for the purposes of this
Study it is assumed that direct access customers opt-out of CCA service.

APPENDIX F
City of San Diego Community Choice Aggregate Feasibility Study F-12| P a g e
Year Emissions Factor CO2e
Study Forecast of SDG&E Pounds of
CO2e/MWh
SDG&E RPS Trend Pounds of CO2e/MWh
CCA 50% RPC Pounds of
CO2e/MWh
CCA 80% RPC Pounds of
CO2e/MWh
CCA 100% RPC Pounds of
CO2e/MWh
2023 468 468 432 439 175 0
2024 462 462 415 437 175 0
2025 456 456 400 435 174 0
2026 450 450 385 433 173 0
2027 444 444 371 432 173 0
2028 438 438 358 430 172 0
2029 433 433 346 428 171 0
2030 427 427 334 427 171 0
2031 426 426 323 426 170 0
2032 424 424 313 424 170 0
2033 423 423 304 423 169 0
2034 421 421 296 421 169 0
2035 420 420 288 420 168 0
Table F-6 provides a comparison of the SDG&E RPS Trend forecast and the CCA RPC Scenarios with the
Study’s forecast of SDG&E emissions. This data indicates:
• The SDG&E trend line forecast with more than 60% RPS by 2030 results in a 15% reduction in
CO2 emissions compared to the Study’s forecast of SDG&E emissions.
• The 50% RPC CCA Scenario results in a 3% reduction in CO2 emissions output compared to the
Study’s forecast of SDG&E emissions from 2020-2035.
• The 80% RPC CCA Scenario results in a 61% reduction in CO2 emissions output compared to the
Study’s forecast of SDG&E emissions from 2020-2035.
• The 100% RPC CCA Scenario results in a 100% reduction in CO2 emissions output compared to
the Study’s forecast of SDG&E emissions from 2020-2035.
• A hypothetical progression from 50% RPC in 2020 to 80% RPC in 2030 and 100% RPS in 2035
results in a 46% reduction in CO2 emissions compared to the Study’s forecast of SDG&E
emissions from 2020-2035.

APPENDIX F
City of San Diego Community Choice Aggregate Feasibility Study F‐13| P a g e
Table F‐6: CO2 Output Comparison with SDG&E
Year SDG&E RPS Compliant Content Estimate
SDG&E RPS Trend [*]
CCA 50% RPC
CCA 80% RPC
CCA 100% RPC
Progressive CCA RPC
(a) (b) (c) (d) (e) (f) (g) (h) (i) (j)
2020 45.2% 1.6 45.3% 1.6 1.4 0.6 ‐ 50% 1.4
2021 45.7% 1.5 47.2% 1.5 1.4 0.6 ‐ 52% 1.4
2022 46.2% 1.5 49.0% 1.4 1.4 0.6 ‐ 55% 1.3
2023 46.6% 1.5 50.8% 1.4 1.4 0.6 ‐ 58% 1.2
2024 47.1% 1.5 52.4% 1.3 1.4 0.6 ‐ 60% 1.1
2025 47.6% 1.5 54.0% 1.3 1.4 0.6 ‐ 63% 1.0
2026 48.1% 1.4 55.6% 1.2 1.4 0.6 ‐ 66% 0.9
2027 48.6% 1.4 57.0% 1.2 1.4 0.6 ‐ 70% 0.8
2028 49.0% 1.4 58.4% 1.1 1.4 0.6 ‐ 73% 0.7
2029 49.5% 1.4 59.7% 1.1 1.4 0.5 ‐ 76% 0.6
2030 50.0% 1.4 60.9% 1.1 1.4 0.5 ‐ 80% 0.5
2031 50.0% 1.4 62.0% 1.0 1.4 0.5 ‐ 84% 0.4
2032 50.0% 1.4 63.1% 1.0 1.4 0.5 ‐ 88% 0.3
2033 50.0% 1.4 64.0% 1.0 1.4 0.5 ‐ 92% 0.2
2034 50.0% 1.3 64.9% 0.9 1.3 0.5 ‐ 96% 0.1
2035 50.0% 1.3 65.7% 0.9 1.3 0.5 ‐ 100% ‐
TOTAL 22.9 19.0 [*] 22.2 8.9 ‐ 11.9
CO2 Reduction over (c) 3% 61% 100% 48%
CO2 Reduction over (c) (MMT) 0.7 14.0 22.9 11.0
[*] For Illustrative purposes only; SDG&E has not indicated it would exceed RPS mandates. Key: RPS—California Renewable Portfolio Standard MMT—Million Metric Tons CO2—Carbon Dioxide CCA—Community Choice Aggregation RPC—Renewable Portfolio Content
Within the CAP,14 the City identified a roughly 60% reduction in total GHG emissions in 2035 as a result
of the CAP. This emissions reduction can be compared with the CO2 reduction percentages displayed in
Table F‐6 for the different CCA RPC Scenarios. This data is illustrated graphically in Figure F‐7.
14 https://www.sandiego.gov/sites/default/files/final_july_2016_cap.pdf

APPENDIX F
City of San Diego Community Choice Aggregate Feasibility Study F-14| P a g e
Figure F-7: RPC Scenario Carbon Dioxide Emissions Comparison with SDG&E Projected RPS

APPENDIX G
SAN DIEGO GAS AND ELECTRIC RATES

This page intentionally left blank.
APPENDIX G SAN DIEGO GAS AND ELECTRIC RATES
The fundamental measure of CCA feasibility is the achievement of the CCA goals and objectives while
maintaining competitive generation rates with SDG&E. SDG&E rate tariffs are regulated by the
California Public Utilities Commission (CPUC). For residential customers, there are two primary
components to the electricity rates: delivery service and electric commodity (generation), both assessed
on a $ per kWh basis. For commercial and industrial customers, a demand charge may also be applicable,
assessed on a $ per kW basis. SDG&E bundled customers receive both delivery and energy services from
SDG&E and pay the applicable delivery service, demand, and generation rates. Direct Access and CCA
customers pay SDG&E the delivery component while paying their CCA or energy service provider for the
electric commodity (generation).
At the onset of electrification and for many decades after, a flat rate structure was used for electric utility
services with a single price for each kWh consumed, no matter the amount. However, as energy efficiency
and conservation goals came to the fore of public policy decision-making, utilities started implementing
a tiered rate structure that encourages lower energy use. For years, the CPUC has required that California
IOUs use a tiered rate structure, with the lowest rates applied to a set amount of initial use and increasing
rates with increased energy consumption. The intent of this tiered rate structure was to encourage
energy conservation and efficiency.
In October 2013, Governor Jerry Brown signed Assembly Bill (AB) 327 into law which made several
changes to the IOU rate structures. First, AB 327 allows a new fixed monthly charge of up to $10, or up to
$5 for California Alternate Rates for Energy (CARE)1 customers. In addition, it requires a default
residential rate with at least 2 tiers, with the Tier 1 usage level being no less than the mandated baseline
allocation.2
AB 327 also authorizes the CPUC to potentially raise the required percentages of renewable energy,
known as the Renewable Portfolio Standard (RPS), higher than the previously required 25% by 2016 and
33% by 2020 and 50% by 2030. For example, the CPUC could decide to raise the required RPS, to say,
45% by 2025. Changes under AB 327 will not go into effect until they are approved by the CPUC.
SDG&E files general rate cases with the CPUC with each covering a three-year period of operations. 2016
is a “test year” for the current SDG&E general rate case cycle3. A general rate case provides SDG&E
funding application details for infrastructure investment, customer service, and power procurement. The
SDG&E 2016 general rate case is considered by the CPUC in two phases:
1 SDG&E California Alternate Rates for Energy (CARE): http://www.sdge.com/residential/care-video 2 SDG&E Understanding Rates: http://www.sdge.com/understanding-rates 3 San Diego Gas and Electric (SDG&E) General Rate Case (GRC) Proceedings (Phase I):
http://www.cpuc.ca.gov/General.aspx?id=10434

APPENDIX G
City of San Diego Community Choice Aggregate Feasibility Study G-2| P a g e
• Phase 1 Application 14-11-0034 determining the total amount the utility is authorized to collect;
and
• Phase 2 Application 15-04-0125 determining the share of the cost each customer class is
responsible and the rate schedules for each class.
SDG&E also files Rate Design Window applications with the CPUC in intermittent years for changes to
rates.
SDG&E RESIDENTIAL GENERATION RATES
The generation rate is the component of the SDG&E rate tariffs that the City CCA program customers
would stop paying and begin paying the CCA, based on the rates developed and approved by the San
Diego City Council or another CCA oversight board option. Figure G-1 provides an overview of the SDG&E
residential generation rates since 2012 based on a “SDG&E Commodity Rates” summary provided by
SDG&E.
4 SDG&E 2016 GRC Phase 1: http://www.sdge.com/regulatory-filing/12931/sdge-grc-testimony-exhibit-list 5 SDG&E 2016 GRC Phase 2: http://www.sdge.com/sdge-2016-GRC-Phase-2

APPENDIX G
City of San Diego Community Choice Aggregate Feasibility Study G-3| P a g e
Figure G-1: SDG&E Residential Generation Rates
SDG&E COMMERCIAL AND INDUSTRIAL GENERATION RATES
The CPUC ordered SDG&E to implement mandatory Time of Use (TOU) rates for small and medium
commercial customers with up to 200 kW demand starting in 20146 and mandatory Critical Peak Pricing
(CPP) rates for large commercial customers with over 200 kW demand starting in 2007.7 SDG&E
customers are defaulted to a certain rate, but have the option of selecting an alternative rate:
• CPP rates seek to impose higher electricity prices on the days of highest electricity usage (peak
days). Generation capacity needs to be available to meet the demand on those peak days despite
the fact that only six to twelve peak days occur per year. Electricity tends to get more expensive
as demand approaches the available capacity (as would be expected in a typical commodity supply
and demand market). Therefore, imposing higher prices on the days that high demand is
forecasted should result in a lower demand. CPP rates became default for SDG&E customers in
2007.
• Real Time Pricing (RTP) seeks to align retail electricity pricing with the real-time cost of supply.
True RTP programs have been limited to date for a variety of reasons including:
• The market prices available through a Regional Transmission Organizations (RTO) or Independent
System Operators, like CAISO, reflect day-ahead and real-time market prices that are not
6 SDG&E Application 11-10-002 and subsequent CPUC Decision 14-01-002, January 16, 2014 7 CPUC Decision 05-04-053 addressed CPP rates for customers with greater than 200 kW of demand; SDG&E Application 05-01-
017 followed Decision 05-04-053 and proposed a default CPP Structure for commercial and industrial customers with peak
demands exceeding 300 kW; CPUC Decision D0605038 adopted default critical peak pricing for 2007.

APPENDIX G
City of San Diego Community Choice Aggregate Feasibility Study G-4| P a g e
necessarily correlated with the total supply portfolio at any given time. For instance, ample supply
may be available, but if non-dispatchable (renewable) generation deviates from the expected
output, market prices may spike or drop drastically to incentivize immediate response and keep
electricity supply and demand in balance.
• The demand response technology needed for customers to respond to fluctuations in real-time
market prices is still maturing
• The Federal Energy Regulatory Commission (FERC) is the ISO and RTO regulatory authority while
state utility commissions, such as the CPUC, have jurisdiction over IOU retail rates.
SDG&E classifies commercial and industrial customers based on the industry or use for the electricity, as
well as the amount of demand by the customer. In keeping with the logic to promote conservation and
energy efficiency through increased prices for higher usage, often larger customers pay higher rates than
smaller customers. The different SDG&E commercial and industrial rate classes applicable within the City
CCA program’s territory are described and summarized in the following bulleted discussion points and
Figures. Supplemental data used to create these Figures is provided in the last segment of this Appendix.
Small Commercial Customers - Schedule A (General Service)
This rate class includes single- and three-phase commercial and three-phase residential service including
lighting and power, except that the customer whose monthly maximum demand exceeds or is expected
to exceed 20 kW or has exceeded 20 kW for 12 consecutive months.
Figure G-2: Schedule A Electric Energy Commodity Cost (EECC)

APPENDIX G
City of San Diego Community Choice Aggregate Feasibility Study G-5| P a g e
Large Commercial Customer - Schedule AL-TOU (General Service – Time Metered)
Applicable to all metered non-residential customers whose Monthly Maximum Demand equals,
exceeds, or is expected to equal or exceed 20 kW. This schedule is the utility's standard tariff for
commercial and industrial customers with a Monthly Maximum Demand equaling or exceeding
20 kW. Customers on this Schedule whose Monthly Maximum Demand is not less than 20 kW for
three consecutive months will also take commodity service on Schedule EECC-CPP-D. Figure G-3
provides Schedule AL, EECC, by service level, season, and time period from September 2011
through August 2016. Figure G-4 provides the Critical Peak Pricing Commodity Cost, by service
level, season, and time period from September 2012 through August 2016.
Schedule AY-TOU (General Service – Time Metered)
• As of September, 1999, this schedule is closed to any new customers. This schedule is optionally
available to all metered non-residential customers who request service on this schedule and
whose maximum annual demand does not exceed 500 kW. Customers on this Schedule whose
Monthly Maximum Demand is not less than 20 kW for three consecutive months will also take
commodity service on Schedule EECC-CPP-D.
• Large Commercial & Industrial - Schedule A6- TOU (General Service – Time Metered Optional)
• This schedule is optionally available to customers receiving service at Primary, Primary Substation,
or Transmission service voltage level, as defined in Rule 1, whose maximum demand is 500 kW or
greater during any 15-minute interval of the most recent 12-month period.
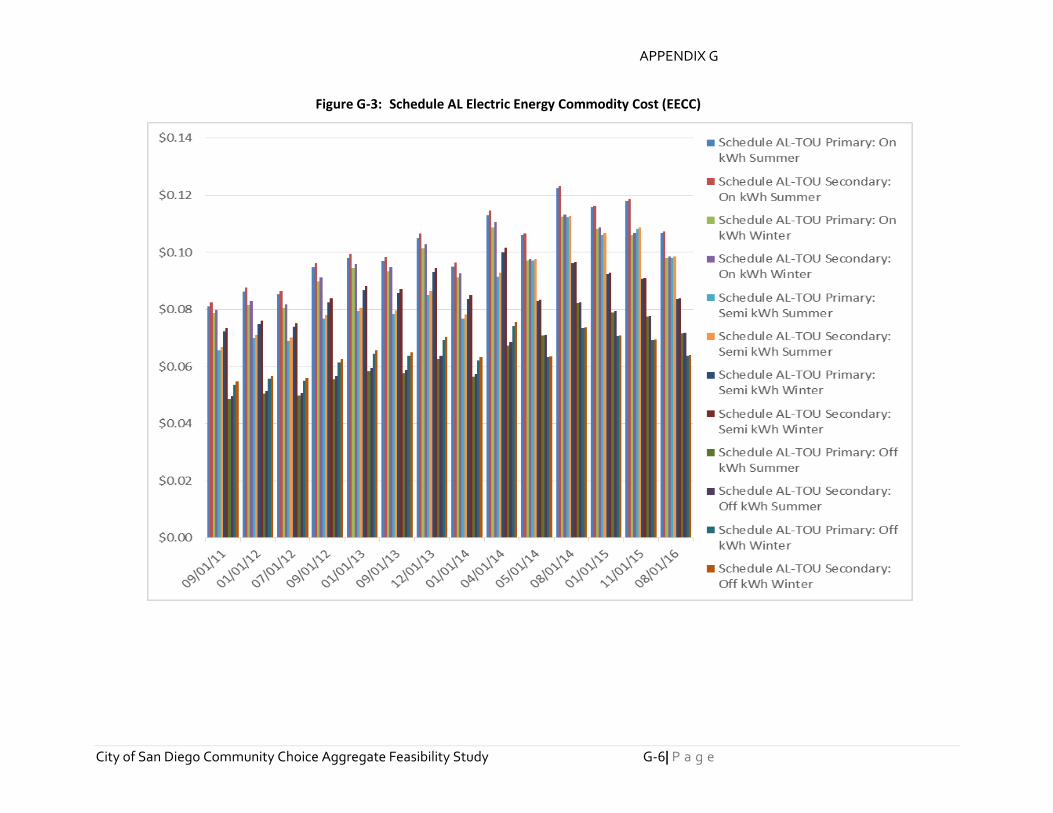
APPENDIX G
City of San Diego Community Choice Aggregate Feasibility Study G-6| P a g e
Figure G-3: Schedule AL Electric Energy Commodity Cost (EECC)
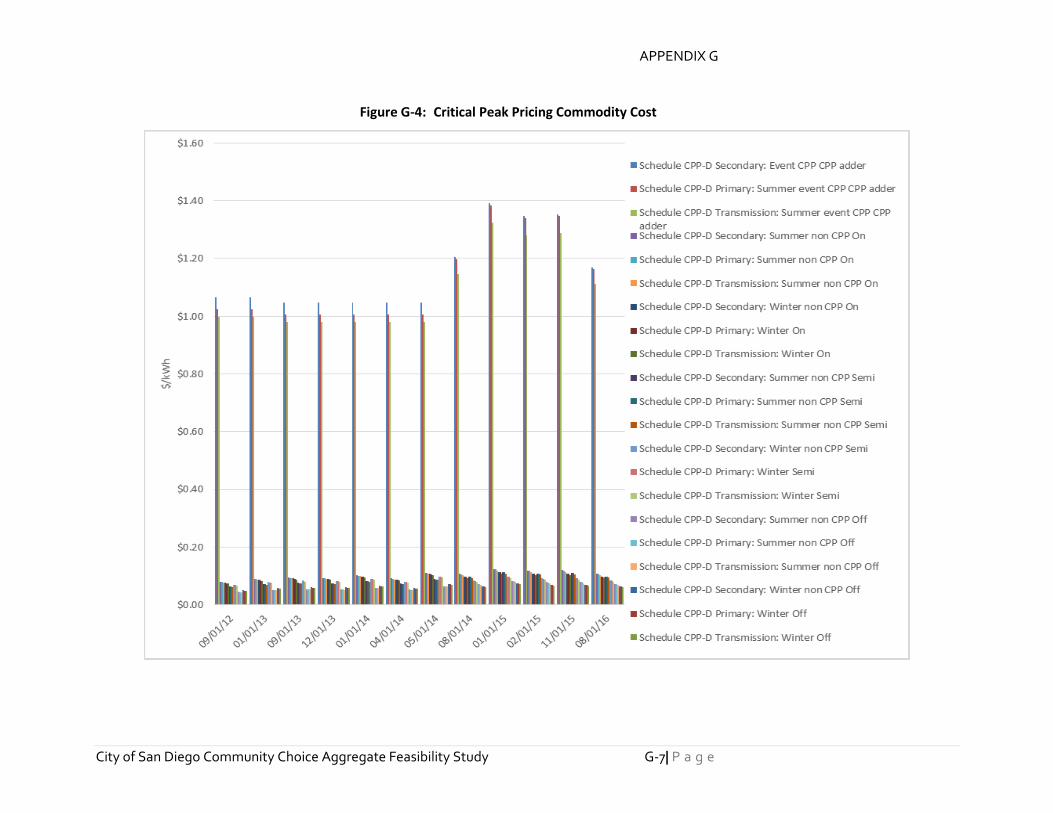
APPENDIX G
City of San Diego Community Choice Aggregate Feasibility Study G-7| P a g e
Figure G-4: Critical Peak Pricing Commodity Cost

APPENDIX G
City of San Diego Community Choice Aggregate Feasibility Study G-8| P a g e
PA-T-1 (Experimental Power - Agricultural - Optional Time-Of-Use)
• This is an optional schedule provided by the utility, on an experimental basis, for the purpose of
evaluating time varying rates. Available to agricultural and water pumping customers whose
Maximum Monthly Demand is expected to be above 500 kW. This schedule is also available to
those agricultural and water pumping customers whose maximum demand is less than 500 kW
who are installing or have installed facilities or procedures to reduce their annual on-peak energy
consumption by 1,500 kWh. Customers on this Schedule whose Monthly Maximum Demand is
not less than 200 kW will also take commodity service on Schedule EECC-CPP-D-AG.
Schedule DG-R, Distributed Generation Renewable - Time Metered
Service under this Schedule is available on a voluntary basis for all metered non-residential
customers whose peak annual load is equal to or less than 2MW, and who have operational,
distributed generation, and the capacity of that operational distributed generation is equal to or
greater than 10% of their peak annual load. Distributed generation that qualifies for service under
this Schedule is limited to solar, fuel cells (regardless of fuel source), and other renewable
distributed generation, as more fully defined in Special Condition 17, fueled with gas derived from
biomass, digester gas, or landfill gas. Figure G-5 provides Schedule DG-R, the Distributed
Generation Renewable EECC, by service level, season, and time period from July 2012 through
August 2016.

APPENDIX G
City of San Diego Community Choice Aggregate Feasibility Study G-9| P a g e
Figure G-5: Schedule DG-R Distributed Generation Renewable Electric Energy Commodity Cost (EECC)
APPENDIX G
City of San Diego Community Choice Aggregate Feasibility Study G-10| P a g e
A-TC (Traffic Control Service)
• Applicable to local, state or other governmental agencies for service to traffic signal systems
utilized 24 hours per day, located on streets, highways or other public thoroughfares. This
schedule is closed to new customers with non-residential loads that maintain a minimum annual
load factor of at least 90 percent, as demonstrated by load sampling, and to customer owned
outdoor area lighting furnished from dusk to dawn where photo cells have been installed on all
loads.
• Schedule OL-TOU, Outdoor Lighting - Time Metered.
• LS2 (Lighting - Street and Highway Customer-Owned System).
• Applicable for service to governmental agencies and lighting districts for the lighting of streets,
highways and other thoroughfares, and to other corporate agencies for the lighting of non-
dedicated streets which are accessible to the public, where the customer owns the entire
installation, including underground lines from a central point of connection with utility facilities.
BILLING OPTIONS FOR CUSTOMERS
In addition to the tariff rates described above, there are payment programs available to customers:
• Low income discount programs like the CARE program charge lower delivery rates to low income
customers under certain qualifying criteria. This SDG&E program is applicable to the delivery
charge and would still be available to CCA customers after implementation.
• Level pay plans seek to provide customers with a consistent bill to assist customers in their
monthly budgeting. Level pay plans are based on the forecasted average annual bill with
scheduled true-up periods to adjust for actual usage that is either above or below the forecasted
usage.
• Pre-pay programs enable customers to purchase their electricity prior to consumption. This has
been a growing trend for the telecom industry, with pre-paid cell phones and long distance cards.
IOUs operating in the State are exploring pre-pay options but have not yet implemented any
programs.
COST RESPONSIBILITY SURCHARGE AND POWER CHARGE INDIFFERENCE
ADJUSTMENT
The Cost Responsibility Surcharge (CRS) and Power Charge Indifference Adjustment (PCIA) are intended
to facilitate the CPUC Section 366.2(c)(3) requirements prohibiting cost shifting between bundled and
CCA customers:
“It is the intent of the Legislature that each retail end-use customer that has purchased
power from an electrical corporation on or after February 1, 2001, should bear a fair
share of the Department of Water Resources’ electricity purchase costs, as well as
electricity purchase contract obligations incurred as of the effective date of the act
adding this section, that are recoverable from electrical corporation customers in
commission-approved rates. It is further the intent of the Legislature to prevent any
shifting of recoverable costs between customers.

APPENDIX G
City of San Diego Community Choice Aggregate Feasibility Study G-11| P a g e
A retail end-use customer purchasing electricity from a community choice aggregator
pursuant to this section shall reimburse the electrical corporation that previously served
the customer for all of the following:
The electrical corporation’s unrecovered past undercollections for electricity purchases,
including any financing costs, attributable to that customer, that the commission
lawfully determines may be recovered in rates.
Any additional costs of the electrical corporation recoverable in commission-approved
rates, equal to the share of the electrical corporation’s estimated net unavoidable
electricity purchase contract costs attributable to the customer, as determined by the
commission, for the period commencing with the customer’s purchases of electricity
from the community choice aggregator, through the expiration of all then existing
electricity purchase contracts entered into by the electrical corporation.”
SUPPLEMENTAL COMMERCIAL AND INDUSTRIAL RATE SCHEDULES
The detailed data forming the basis for Figures pertaining to commercial and industrial customers within
this Appendix are provided in the following supplemental Tables G-1 through G-9.
Table G-1: Small Commercial Customers - Schedule A (General Service)
Primary Voltage Secondary Voltage
Effective Date Summer Winter Summer Winter
9/1/2011 $0.08304 $0.05922 $0.08449 $0.06026
1/1/2012 $0.08609 $0.06139 $0.08760 $0.06248
7/1/2012 $0.08499 $0.06061 $0.08648 $0.06168
9/1/2012 $0.09488 $0.06766 $0.09654 $0.06886
1/1/2013 $0.09973 $0.07112 $0.10148 $0.07238
9/1/2013 $0.09850 $0.07024 $0.10023 $0.07149
12/1/2013 $0.10694 $0.07626 $0.10882 $0.07761
1/1/2014 $0.09621 $0.06861 $0.09790 $0.06983
4/1/2014 $0.11487 $0.08192 $0.11688 $0.08337
5/1/2014 $0.12749 $0.06580 $0.12781 $0.06605
8/1/2014 $0.14774 $0.07625 $0.14810 $0.07655
1/1/2015 $0.13971 $0.07210 $0.14006 $0.07239
11/1/2015 $0.13945 $0.07197 $0.13979 $0.07225
8/1/2016 $0.11786 $0.06083 $0.11815 $0.06106

APPENDIX G
City of San Diego Community Choice Aggregate Feasibility Study G-12| P a g e
Table G-2: Large Commercial Customer - Schedule AL-TOU (General Service – Time
Metered), Primary Voltage
Primary Voltage
Summer Winter
Effective Date Off Peak On Peak Semi Peak Off Peak On Peak Semi Peak
9/1/2011 $0.04870 $0.08115 $0.06572 $0.05373 $0.07873 $0.07231
1/1/2012 $0.05047 $0.08634 $0.06993 $0.05569 $0.08160 $0.07495
7/1/2012 $0.04983 $0.08528 $0.06907 $0.05498 $0.08056 $0.07400
9/1/2012 $0.05562 $0.09481 $0.07679 $0.06137 $0.08993 $0.08260
1/1/2013 $0.05847 $0.09808 $0.07943 $0.06451 $0.09453 $0.08682
9/1/2013 $0.05775 $0.09689 $0.07847 $0.06372 $0.09336 $0.08575
12/1/2013 $0.06269 $0.10503 $0.08506 $0.06918 $0.10136 $0.09310
1/1/2014 $0.05641 $0.09495 $0.07690 $0.06224 $0.09120 $0.08377
4/1/2014 $0.06734 $0.11293 $0.09146 $0.07431 $0.10887 $0.10000
5/1/2014 $0.07094 $0.10607 $0.09711 $0.06338 $0.09719 $0.08297
8/1/2014 $0.08220 $0.12256 $0.11226 $0.07344 $0.11262 $0.09614
1/1/2015 $0.07904 $0.11577 $0.10626 $0.07061 $0.10829 $0.09244
11/1/2015 $0.07756 $0.11800 $0.10831 $0.06929 $0.10626 $0.09071
8/1/2016 $0.07154 $0.10682 $0.09805 $0.06391 $0.09801 $0.08366
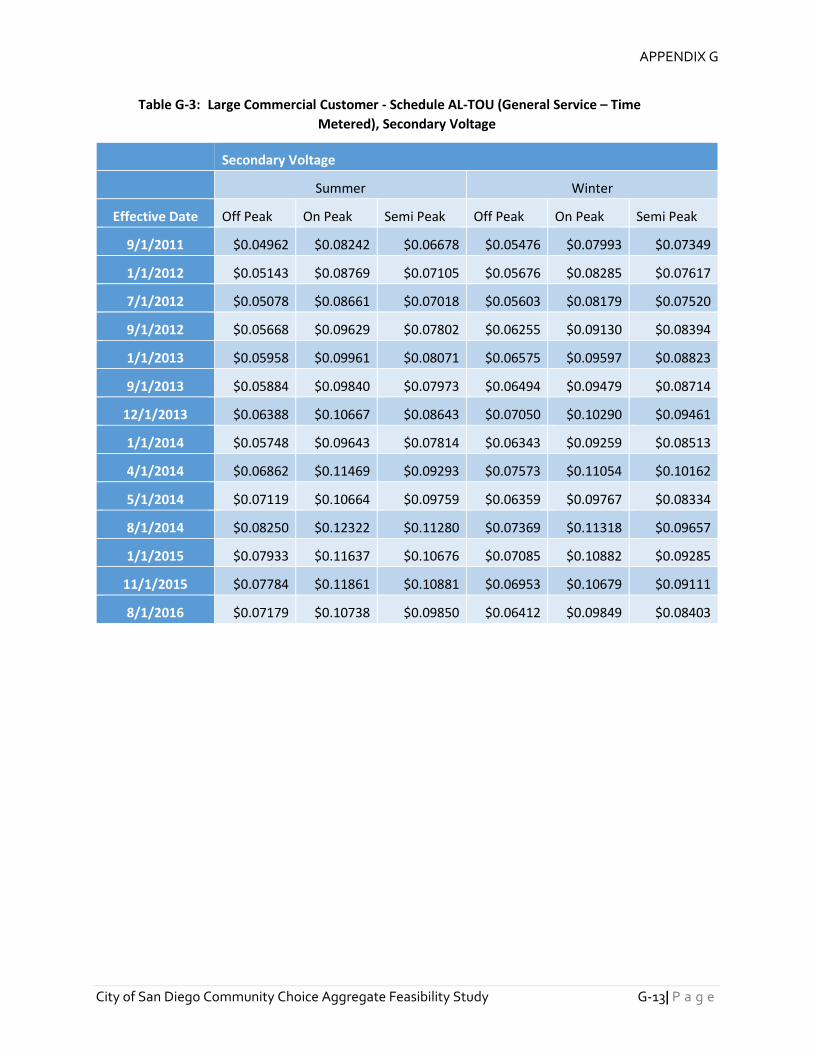
APPENDIX G
City of San Diego Community Choice Aggregate Feasibility Study G-13| P a g e
Table G-3: Large Commercial Customer - Schedule AL-TOU (General Service – Time
Metered), Secondary Voltage
Secondary Voltage
Summer Winter
Effective Date Off Peak On Peak Semi Peak Off Peak On Peak Semi Peak
9/1/2011 $0.04962 $0.08242 $0.06678 $0.05476 $0.07993 $0.07349
1/1/2012 $0.05143 $0.08769 $0.07105 $0.05676 $0.08285 $0.07617
7/1/2012 $0.05078 $0.08661 $0.07018 $0.05603 $0.08179 $0.07520
9/1/2012 $0.05668 $0.09629 $0.07802 $0.06255 $0.09130 $0.08394
1/1/2013 $0.05958 $0.09961 $0.08071 $0.06575 $0.09597 $0.08823
9/1/2013 $0.05884 $0.09840 $0.07973 $0.06494 $0.09479 $0.08714
12/1/2013 $0.06388 $0.10667 $0.08643 $0.07050 $0.10290 $0.09461
1/1/2014 $0.05748 $0.09643 $0.07814 $0.06343 $0.09259 $0.08513
4/1/2014 $0.06862 $0.11469 $0.09293 $0.07573 $0.11054 $0.10162
5/1/2014 $0.07119 $0.10664 $0.09759 $0.06359 $0.09767 $0.08334
8/1/2014 $0.08250 $0.12322 $0.11280 $0.07369 $0.11318 $0.09657
1/1/2015 $0.07933 $0.11637 $0.10676 $0.07085 $0.10882 $0.09285
11/1/2015 $0.07784 $0.11861 $0.10881 $0.06953 $0.10679 $0.09111
8/1/2016 $0.07179 $0.10738 $0.09850 $0.06412 $0.09849 $0.08403

APPENDIX G
City of San Diego Community Choice Aggregate Feasibility Study G-14| P a g e
Table G-4: Large Commercial & Industrial - Schedule A6- TOU (General Service –
Time Metered Optional), Primary Voltage
Primary Voltage
Summer Winter
Effective
Date
CPP Adder Off Peak On Peak Semi
Peak
Off Peak On Peak Semi Peak
9/1/2012 $1.02448 $0.04384 $0.07897 $0.06278 $0.04899 $0.07455 $0.06799
1/1/2013 $1.02448 $0.05036 $0.08923 $0.07123 $0.05611 $0.08465 $0.07732
9/1/2013 $1.00644 $0.05356 $0.09315 $0.07449 $0.05960 $0.08960 $0.08190
12/1/2013 $1.00644 $0.05275 $0.09187 $0.07344 $0.05871 $0.08834 $0.08074
1/1/2014 $1.00644 $0.05831 $0.10063 $0.08065 $0.06479 $0.09696 $0.08870
4/1/2014 $1.00657 $0.05124 $0.08977 $0.07173 $0.05707 $0.08601 $0.07858
5/1/2014 $1.00657 $0.06354 $0.10912 $0.08766 $0.07050 $0.10505 $0.09618
8/1/2014 $1.19759 $0.07094 $0.10608 $0.09713 $0.06338 $0.09719 $0.08297
1/1/2015 $1.38452 $0.08220 $0.12258 $0.11227 $0.07344 $0.11262 $0.09614
2/1/2015 $1.33946 $0.07771 $0.11821 $0.10850 $0.06942 $0.10646 $0.09088
11/1/2015 $1.34606 $0.07810 $0.11878 $0.10903 $0.06977 $0.10700 $0.09134
8/1/2016 $1.16246 $0.07154 $0.10679 $0.09802 $0.06391 $0.09801 $0.08366

APPENDIX G
City of San Diego Community Choice Aggregate Feasibility Study G-15| P a g e
Table G-5: Large Commercial & Industrial - Schedule A6- TOU (General Service –
Time Metered Optional), Secondary Voltage
Secondary Voltage
Summer Winter
Effective
Date
CPP Adder Off Peak On Peak Semi
Peak
Off Peak On Peak Semi
Peak
9/1/2012 $1.06575 $0.04478 $0.08030 $0.06389 $0.05004 $0.07578 $0.06919
1/1/2013 $1.06575 $0.05141 $0.09071 $0.07246 $0.05728 $0.08602 $0.07866
9/1/2013 $1.04698 $0.05467 $0.09468 $0.07577 $0.06083 $0.09104 $0.08331
12/1/2013 $1.04698 $0.05384 $0.09338 $0.07470 $0.05993 $0.08977 $0.08213
1/1/2014 $1.04698 $0.05950 $0.10227 $0.08202 $0.06611 $0.09851 $0.09021
4/1/2014 $1.04712 $0.05231 $0.09125 $0.07297 $0.05826 $0.08740 $0.07994
5/1/2014 $1.04712 $0.06482 $0.11088 $0.08913 $0.07192 $0.10671 $0.09781
8/1/2014 $1.20453 $0.07119 $0.10665 $0.09760 $0.06359 $0.09767 $0.08334
1/1/2015 $1.39243 $0.08250 $0.12323 $0.11281 $0.07369 $0.11318 $0.09657
2/1/2015 $1.34641 $0.07799 $0.11882 $0.10901 $0.06966 $0.10699 $0.09128
11/1/2015 $1.35304 $0.07838 $0.11940 $0.10954 $0.07001 $0.10752 $0.09174
8/1/2016 $1.16848 $0.07179 $0.10734 $0.09848 $0.06412 $0.09849 $0.08403

APPENDIX G
City of San Diego Community Choice Aggregate Feasibility Study G-16| P a g e
Table G-6: Large Commercial & Industrial - Schedule A6- TOU (General Service –
Time Metered Optional), Transmission Voltage
Effective Date Transmission Voltage
Summer Winter
CPP Adder Off Peak On Peak Semi Peak Off Peak On Peak Semi Peak
9/1/2012 $0.99849 $0.04318 $0.07751 $0.06167 $0.04827 $0.07312 $0.06681
1/1/2013 $0.99849 $0.04962 $0.08760 $0.06999 $0.05530 $0.08304 $0.07601
9/1/2013 $0.98091 $0.05279 $0.09146 $0.07321 $0.05875 $0.08792 $0.08052
12/1/2013 $0.98091 $0.05198 $0.09020 $0.07217 $0.05788 $0.08668 $0.07937
1/1/2014 $0.98091 $0.05749 $0.09882 $0.07927 $0.06388 $0.09515 $0.08722
4/1/2014 $0.98103 $0.05049 $0.08814 $0.07049 $0.05625 $0.08438 $0.07725
5/1/2014 $0.98103 $0.06265 $0.10718 $0.08618 $0.06952 $0.10311 $0.09459
8/1/2014 $1.14523 $0.06806 $0.10147 $0.09306 $0.06082 $0.09301 $0.07952
1/1/2015 $1.32393 $0.07887 $0.11724 $0.10756 $0.07048 $0.10778 $0.09215
2/1/2015 $1.28046 $0.07456 $0.11300 $0.10390 $0.06662 $0.10189 $0.08711
11/1/2015 $1.28678 $0.07493 $0.11355 $0.10441 $0.06696 $0.10239 $0.08754
8/1/2016 $1.11128 $0.06864 $0.10209 $0.09386 $0.06133 $0.09379 $0.08019
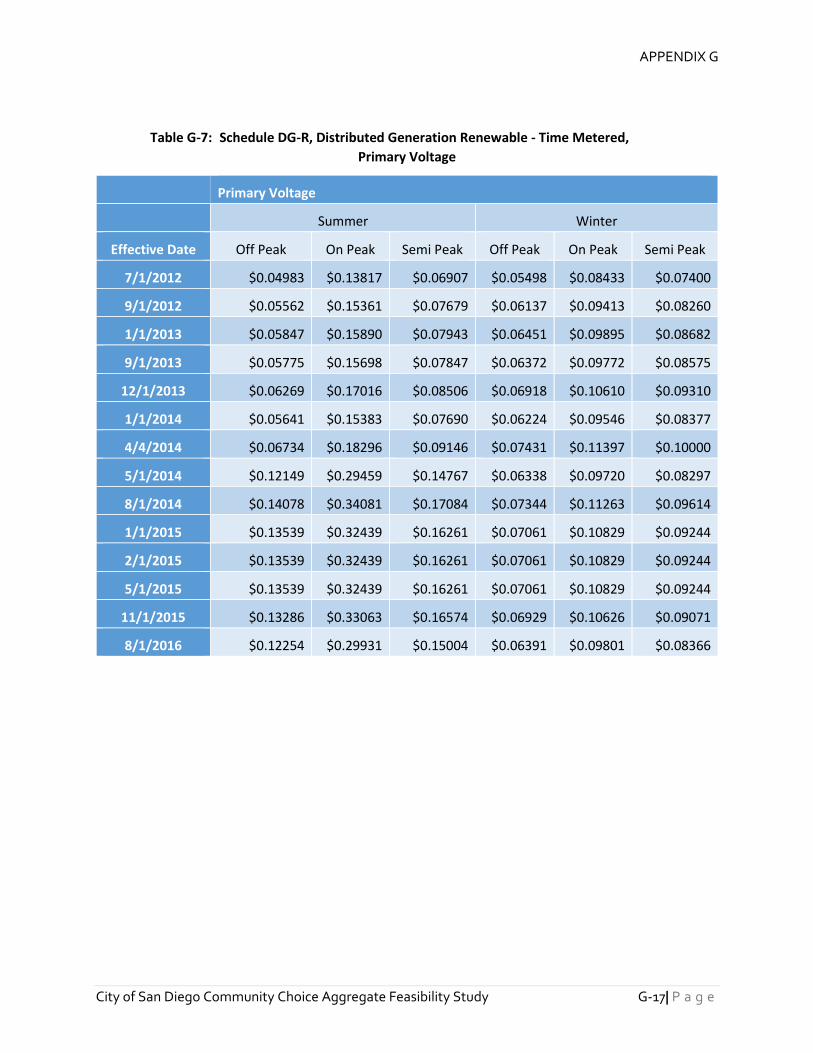
APPENDIX G
City of San Diego Community Choice Aggregate Feasibility Study G-17| P a g e
Table G-7: Schedule DG-R, Distributed Generation Renewable - Time Metered,
Primary Voltage
Primary Voltage
Summer Winter
Effective Date Off Peak On Peak Semi Peak Off Peak On Peak Semi Peak
7/1/2012 $0.04983 $0.13817 $0.06907 $0.05498 $0.08433 $0.07400
9/1/2012 $0.05562 $0.15361 $0.07679 $0.06137 $0.09413 $0.08260
1/1/2013 $0.05847 $0.15890 $0.07943 $0.06451 $0.09895 $0.08682
9/1/2013 $0.05775 $0.15698 $0.07847 $0.06372 $0.09772 $0.08575
12/1/2013 $0.06269 $0.17016 $0.08506 $0.06918 $0.10610 $0.09310
1/1/2014 $0.05641 $0.15383 $0.07690 $0.06224 $0.09546 $0.08377
4/4/2014 $0.06734 $0.18296 $0.09146 $0.07431 $0.11397 $0.10000
5/1/2014 $0.12149 $0.29459 $0.14767 $0.06338 $0.09720 $0.08297
8/1/2014 $0.14078 $0.34081 $0.17084 $0.07344 $0.11263 $0.09614
1/1/2015 $0.13539 $0.32439 $0.16261 $0.07061 $0.10829 $0.09244
2/1/2015 $0.13539 $0.32439 $0.16261 $0.07061 $0.10829 $0.09244
5/1/2015 $0.13539 $0.32439 $0.16261 $0.07061 $0.10829 $0.09244
11/1/2015 $0.13286 $0.33063 $0.16574 $0.06929 $0.10626 $0.09071
8/1/2016 $0.12254 $0.29931 $0.15004 $0.06391 $0.09801 $0.08366

APPENDIX G
City of San Diego Community Choice Aggregate Feasibility Study G-18| P a g e
Table G-8: Schedule DG-R, Distributed Generation Renewable - Time Metered,
Secondary Voltage
Secondary Voltage
Summer Winter
Effective Date Off Peak On Peak Semi Peak Off Peak On Peak Semi Peak
9/1/2012 $0.05078 $0.13950 $0.07018 $0.05603 $0.08556 $0.07520
1/1/2013 $0.05668 $0.15508 $0.07802 $0.06255 $0.09550 $0.08394
9/1/2013 $0.05958 $0.16042 $0.08071 $0.06575 $0.10039 $0.08823
12/1/2013 $0.05884 $0.15849 $0.07973 $0.06494 $0.09915 $0.08714
1/1/2014 $0.06388 $0.17179 $0.08643 $0.07050 $0.10765 $0.09461
4/4/2014 $0.05748 $0.15531 $0.07814 $0.06343 $0.09686 $0.08513
5/1/2014 $0.06862 $0.18472 $0.09293 $0.07573 $0.11563 $0.10162
8/1/2014 $0.12175 $0.29516 $0.14814 $0.06359 $0.09767 $0.08334
1/1/2015 $0.14108 $0.34147 $0.17139 $0.07369 $0.11318 $0.09657
2/1/2015 $0.13568 $0.32499 $0.16311 $0.07085 $0.10882 $0.09285
5/1/2015 $0.13314 $0.33124 $0.16625 $0.06953 $0.10679 $0.09111
11/1/2015 $0.13406 $0.33344 $0.16735 $0.07001 $0.10752 $0.09174
8/1/2016 $0.12280 $0.29986 $0.15050 $0.06412 $0.09849 $0.08403

APPENDIX G
City of San Diego Community Choice Aggregate Feasibility Study G-19| P a g e
Table G-9: Schedule DG-R, Distributed Generation Renewable - Time Metered,
Transmission Voltage
Transmission Voltage
Summer Winter
Effective Date Off Peak On Peak Semi Peak Off Peak On Peak Semi Peak
7/1/2012 $0.04917 $0.13670 $0.06795 $0.05426 $0.08290 $0.07282
9/1/2012 $0.05489 $0.15198 $0.07555 $0.06057 $0.09253 $0.08128
1/1/2013 $0.05770 $0.15721 $0.07815 $0.06367 $0.09726 $0.08544
9/1/2013 $0.05698 $0.15531 $0.07720 $0.06288 $0.09606 $0.08439
12/1/2013 $0.06187 $0.16835 $0.08369 $0.06827 $0.10429 $0.09162
1/1/2014 $0.05567 $0.15220 $0.07566 $0.06143 $0.09384 $0.08244
4/4/2014 $0.06645 $0.18102 $0.08998 $0.07333 $0.11203 $0.09841
5/1/2014 $0.11862 $0.28997 $0.14360 $0.06082 $0.09302 $0.07952
8/1/2014 $0.13745 $0.33547 $0.16613 $0.07048 $0.10778 $0.09215
1/1/2015 $0.13219 $0.31929 $0.15811 $0.06776 $0.10363 $0.08860
2/1/2015 $0.13219 $0.31929 $0.15811 $0.06776 $0.10363 $0.08860
5/1/2015 $0.13219 $0.31929 $0.15811 $0.06776 $0.10363 $0.08860
11/1/2015 $0.12972 $0.32543 $0.16115 $0.06650 $0.10169 $0.08694
8/1/2016 $0.11964 $0.29460 $0.14589 $0.06133 $0.09379 $0.08019

This page intentionally left blank.

APPENDIX H
REFERENCE DOCUMENTS

This page intentionally left blank.

APPENDIX H REFERENCE DOCUMENTS
STATE OF CALIFORNIA
1. Assembly Bill 1890, Chapter 856: http://www.leginfo.ca.gov/pub/01-02/bill/asm/ab_0101-0150/ab_117_cfa_20020625_115107_sen_comm.html
a. Authorizes retail competition within investor-owned utility (IOU) service areas (direct access).
b. Authorizes marketers, public agencies, cities, counties, and special districts to offer electric service to customers aggregated on a voluntary basis, provided that each customer in their jurisdiction agrees to participate by a positive written declaration (community aggregation).
2. Assembly Bill 1X Chapter 4: http://www.leginfo.ca.gov/pub/01-02/bill/asm/ab_0001-0050/abx1_1_bill_20010201_chaptered.pdf
a. Suspends the right of retail customers of IOUs to acquire electric power service from non-IOU providers until the Department of Water Resources (DWR) no longer supplies power to IOU customers.
b. Pursuant to AB 1X, the CPUC has suspended direct access as of September 20, 2001.
3. Assembly Bill 80 (April, 2002): http://leginfo.ca.gov/pub/01-02/bill/asm/ab_0051-0100/ab_80_cfa_20020829_030636_asm_floor.html
a. Establishes an exemption from the direct access suspension which would authorize two cities (Cerritos and San Marcos) in SCE's service area to act as community aggregators and provide direct access service to their residents.
4. Assembly Bill 1169 (July, 2003): ftp://leginfo.ca.gov/pub/03-04/bill/asm/ab_1151-1200/ab_1169_cfa_20030706_170501_sen_comm.html
5. Modifies the statute enacted by AB 80 to limit its application to one city (Cerritos), to permit Cerritos to offer direct access service to specified school facilities outside its jurisdiction, and to provide that the statute doesn't require Cerritos to rely solely on output of the Magnolia power plant.
6. Assembly Bill No. 117 Chapter 838: http://www.leginfo.ca.gov/pub/01-02/bill/asm/ab_0101-0150/ab_117_bill_20020924_chaptered.html
a. Amends Sections 218.3, 366, 394, and 394.25 and added Sections 331.1, 366.2, and 381.1 to the Public Utilities Code thereby establishing the CCA option.
b. PDF copy of the bill: http://www.leginfo.ca.gov/pub/01-02/bill/asm/ab_0101-0150/ab_117_bill_20020924_chaptered.pdf
7. Senate Bill No. 695, Chapter 337 (October 2009): ftp://www.leginfo.ca.gov/pub/09-10/bill/sen/sb_0651-0700/sb_695_bill_20091011_chaptered.html
a. Allows new Non-Residential customers to take direct access service from an Electric Service Provider.

APPENDIX H
City of San Diego Community Choice Aggregate Feasibility Study H-2| P a g e
8. California Proposition 16 (2010): DEFEATED constitutional amendment that would have required a two-thirds vote of the electorate before a public agency could utilize public funds for electric service. http://en.wikipedia.org/wiki/California_Proposition_16_%282010%29
9. CPUC’s CCA Information page: http://www.cpuc.ca.gov/general.aspx?id=2567
SDG&E CCA INFORMATION
1. SDG&E Rules: http://regarchive.sdge.com/tm2/ssi/inc_elec_rules.html
2. SDG&E Miscellaneous Tariffs: https://www.sdge.com/rates-regulations/current-and-effective-tariffs/electric-tariff-book-miscellaneous-rates
EXISTING AND PAST CCA ACTIVITY
Currently Active CCA’s
1. Marin Clean Energy (Formerly Marin Energy Authority): https://www.mcecleanenergy.org
a. Joint Powers Agreement: http://marin.granicus.com/MetaViewer.php?view_id=36&clip_id=3449&meta_id=366049
i. City of Belvedere
ii. Town of Corte Madera
iii. Town of Fairfax
iv. City of Larkspur
v. City of Mill Valley
vi. City of Novato
vii. City of Richmond
viii. Town of Ross
ix. Town of San Anselmo
x. City of San Rafael
xi. City of Sausalito
xii. Town of Tiburon
xiii. County of Marin
b. Ordinances: https://www.mcecleanenergy.org/wp-content/uploads/ordinances.pdf
c. Operating Rules & Regulations:
https://www.mcecleanenergy.org/wp-content/uploads/operating-rules-regulations-asammended.pdf
d. 2012 Integrated Resource Plan:
e. http://www.leanenergyus.org/wp-content/uploads/2013/10/Marin.2012_Integrated_Resource_Plan.pdf

APPENDIX H
City of San Diego Community Choice Aggregate Feasibility Study H-3| P a g e
f. MCE Implementation Plan (October 2012):
g. https://www.mcecleanenergy.org/wp-content/uploads/2016/06/Addendum-No.-4-to-the-MCE-Revised-CCA-I-Plan-and-SOI-24-Communities.pdf
h. Certification from the California Public Utilities Commission (September 2012): http://www.cpuc.ca.gov/WorkArea/DownloadAsset.aspx?id=5875
2. Sonoma Clean Power: http://www.sonomacleanpower.org/ - A new CCA modeled on the Marin Energy Authority with the planned Phase 1 enrollment notices to be sent in February 2014. Like MCE, this CCA is focused on delivering a high percentage (options for 50% and 100%) of renewable energy.
a. Joint Powers Agreement:
https://sonomacleanpower.org/wp-content/uploads/2015/01/SCPA-Second-Amended-Joint-Powers-Agreement-Approved-7-25-13.pdf
i. City of Cotati
ii. City of Santa Rosa
iii. City of Sebastopol
iv. City of Sonoma
v. Sonoma Country/SCWA
vi. Town of Windsor
b. Implementation Plan:
https://sonomacleanpower.org/wp-content/uploads/2015/01/2015-SCP-Implementation-Plan.pdf
c. feasibility study: http://www.scwa.ca.gov/files/docs/carbon-free-water/cca/CCA%20Feasibility%20Report%20101211.pdf
3. Community Aggregation Cerritos
a. While not a CCA, Assembly Bill 80 allowed San Diego CCA of Cerritos to act as an Electricity Service Provider (ESP) which became a template for the subsequent AB 117 establishing CCA.
b. CPUC Decision 10-01-012 Determining San Diego CCA of Cerritos’ Rights Under Assembly Bill 80: http://docs.cpuc.ca.gov/PublishedDocs/WORD_PDF/FINAL_DECISION/112848.PDF
c. Cerritos Magnolia Power Plant – Electric Provider: http://www.cerritos.us/NEWS_INFO/green_cerritos/current_green_efforts/energy_efficiency.php
d. Cerritos Magnolia Power Project: http://www.cerritos.us/GOVERNMENT/city_organization/departments/water_and_power/magnolia_power_project.php
4. CleanPowerSF (http://cleanpowersf.org/) - This program is in the initial stages of enrollment after numerous politically motivated delays. The program’s website is transitioning to the SF

APPENDIX H
City of San Diego Community Choice Aggregate Feasibility Study H-4| P a g e
Public Utilities Commission and few reference documents are publicly available as of this writing.
a. Business Plan and Risk Assessment: https://www.mcecleanenergy.org/wp-content/uploads/2016/01/CleanPowerSF-Business-Plan.pdf
b. CPUC Implementation Plan certification:
i. May 2010: http://www.cpuc.ca.gov/WorkArea/DownloadAsset.aspx?id=5790
ii. June 2013: http://www.cpuc.ca.gov/WorkArea/DownloadAsset.aspx?id=5773
iii. August 2015: http://www.cpuc.ca.gov/WorkArea/DownloadAsset.aspx?id=5769
5. Lancaster Community Choice Aggregation (http://www.lancasterchoiceenergy.com/) – CCA was rolled out to all municipal accounts in May, 2015 and citywide in October 2015. Lancaster has the goal to become the nation’s first net-zero city.
a. Initial Feasibility Report (August 2013) - http://www.lancasterchoiceenergy.com/wp-content/uploads/2016/11/City-of-Lancaster-CCA-Initial-Feasibility-Report-August-2013-1.pdf
b. Implementation Plan (February 2015) - http://www.cityoflancasterca.org/home/showdocument?id=24349
Explored or Exploring CCA (have not filed documents with CPUC)
1. City of Victorville: http://www.ci.victorville.ca.us/site/popup.aspx?id=2768
2. San Diego Energy District Foundation: http://www.sandiegoenergydistrict.org/index.html
3. City of Davis: http://cityofdavis.org/city-hall/community-development-and-sustainability/sustainability-program/community-choice-energy
4. City of Chula Vista:
a. Deal set to end power fight between Chula Vista, SDG&E: http://www.sandiegouniontribune.com/sdut-chula-vista-sdge-sign-10-year-utility-contract-2004oct13-story.html
5. City of San Jose (2011): http://www3.sanjoseca.gov/clerk/Agenda/20111004/20111004_0701.pdf
6. East Bay Municipal Utility District (EBMUD):
Article on decision to not pursue CCA: http://www.mercurynews.com/2012/12/13/berkeley-advocates-disappointed-as-ebmud-drowns-community-choice-2/
7. City of Berkeley: http://www.ci.berkeley.ca.us/communitychoice/
a. Base Case Feasibility Evaluation (2005): http://www.ci.berkeley.ca.us/uploadedFiles/Planning_and_Development/Level_3_-_Energy_and_Sustainable_Development/Base%20Case%20Feasibilty%20Evaluation,%20Berkeley.pdf

APPENDIX H
City of San Diego Community Choice Aggregate Feasibility Study H-5| P a g e
b. City of Albany (2012): www.albanyca.org/Modules/ShowDocument.aspx?documentid=22194
Suspended CCA
San Joaquin Valley Power Authority – First active CCA in California with service commencing in May, 2010.
a. CPUC authorization (April 2007) - http://www.cpuc.ca.gov/WorkArea/DownloadAsset.aspx?id=5882
CCA RESEARCH
1. Public Interest Energy Research (PIER) Program - Community Choice Aggregation Pilot Project - http://www.energy.ca.gov/2009publications/CEC-500-2009-003/CEC-500-2009-003.PDF
a. Assisted twelve California communities in their investigation of Community Choice Aggregation (CCA) feasibility:
i. Berkeley:
ii. Beverly Hills: http://www.beverlyhills.org/cbhfiles/storage/files/filebank/2572--GP-TBR-Chp-3-3-3-4-3-5.pdf
iii. Emeryville
iv. Los Angeles County
v. Marin County
vi. Oakland
vii. Pleasanton
viii. Richmond
ix. San Diego County
x. San Marcos
xi. Vallejo
xii. West Hollywood
b. Independent peer review of Navigant Consulting’s Community Choice Aggregation Feasibility Studies: http://nature.berkeley.edu/classes/es196/projects/2010final/FaulknerK_2010.pdf
c. Final Report: http://www.energy.ca.gov/2008publications/CEC-500-2008-091/CEC-500-2008-091.PDF
d. Appendix A: Roadmap for Renewable Energy Development Procurement, publication # CEC-500-2008-091-APA: http://www.energy.ca.gov/2008publications/CEC-500-2008-091/CEC-500-2008-091-APA.PDF
e. Appendix B: Project Reports on California Public Utilities Commission Decisions on Community Choice Aggregation, publication # CEC-500-2008-091-APB: http://www.energy.ca.gov/2008publications/CEC-500-2008-091/CEC-500-2008-091-APB.PDF

APPENDIX H
City of San Diego Community Choice Aggregate Feasibility Study H-6| P a g e
e. Appendix B: Project Reports on California Public Utilities Commission Decisions on Community Choice Aggregation, publication # CEC-500-2008-091-APB: http://www.energy.ca.gov/2008publications/CEC-500-2008-091/CEC-500-2008-091-APB.PDF
f. Appendix C: Sample Data Request Letters from Local Governments to Investor-Owned Utilities, publication # CEC-500-2008-091-APC: http://www.energy.ca.gov/2008publications/CEC-500-2008-091/CEC-500-2008-091-APC.PDF
g. Appendix D: Key Assumptions Used in the Base Case Feasibility Reports, publication # CEC-500-2008-091-APD: http://www.energy.ca.gov/2008publications/CEC-500-2008-091/CEC-500-2008-091-APD.PDF
h. Appendix E: Community Choice Aggregation Implementation Plan Template, publication # CEC-500-2008-091-APE: http://www.energy.ca.gov/2008publications/CEC-500-2008-091/CEC-500-2008-091-APE.PDF
i. Appendix F: Community Choice Aggregation Fact Sheet, publication # CEC-500-2006-082. Published August 2006, republished April 2009: http://www.energy.ca.gov/2006publications/CEC-500-2006-082/CEC-500-2006-082.PDF
j. Appendix G: Community Choice Aggregation Guidebook, publication # CEC-500-2009-003: http://www.energy.ca.gov/2009publications/CEC-500-2009-003/CEC-500-2009-003.PDF
k. Appendix H: Berkeley, Emeryville, Oakland Business Plan, publication # CEC-500-2008-091-APH: http://www.energy.ca.gov/2008publications/CEC-500-2008-091/CEC-500-2008-091-APH.PDF

APPENDIX H
City of San Diego Community Choice Aggregate Feasibility Study H-7| P a g e
CPUC REQUIREMENTS
Table H-1 lists the detailed CPUC requirements for establishing a CCA in the state of California.
Requirements include developing an implementation plan, preparing a Statement of Intent, registering
the implementation plan with the CPUC, providing evidence of a bond, and ensuring resource adequacy.
Table H-1: CPUC Requirements for CCAs
Requirement Note
Develop an implementation plan
• An organizational structure of the program, its
operations, and its funding
• Rate setting and other costs to participants
• Provisions for disclosure and due process in
setting rates and allocating costs among
participants
• The methods for entering and terminating
agreements with other entities
• The rights and responsibilities of program
participants, including, but not limited to,
consumer protection procedures, credit issues,
and shutoff procedures
• Termination of the program
• A description of the third parties that will be
supplying electricity under the program,
including, but not limited to, information about
financial, technical, and operational capabilities
A CCA shall develop an Implementation
Plan, as defined in PU Code Section
366.2(c)(3)
Prepare a Statement of Intent providing for the
following:
• Universal access
• Reliability
• Equitable treatment of all classes of customers
• Any requirements established by state law or
by the Commission concerning aggregated
service
Register and file an implementation plan with the CPUC Within 90 days after the Community
Choice Aggregator establishing load
aggregation files its implementation plan,
the Commission is required to certify that
it has received the implementation plan,
including any additional information
necessary to determine a cost recovery
mechanism

APPENDIX H
City of San Diego Community Choice Aggregate Feasibility Study H-8| P a g e
Requirement Note
Provide evidence of Bond/Insurance Pursuant to Resolution-E-4133, the
Commission adopted an interim bond
amount of $100,000 (or that amount in
cash) that CCAs shall post with the
Commission as part of their registration
packet pursuant to Decision 05-12-041
Ensure resource adequacy

This page intentionally left blank.

27368 Via Industria, Suite 200Temecula, California 92590-4856
800.755.6864 | 951.587.3500 | Fax: 951.587.3510www.willdan.com