Embed Size (px)
Citation preview
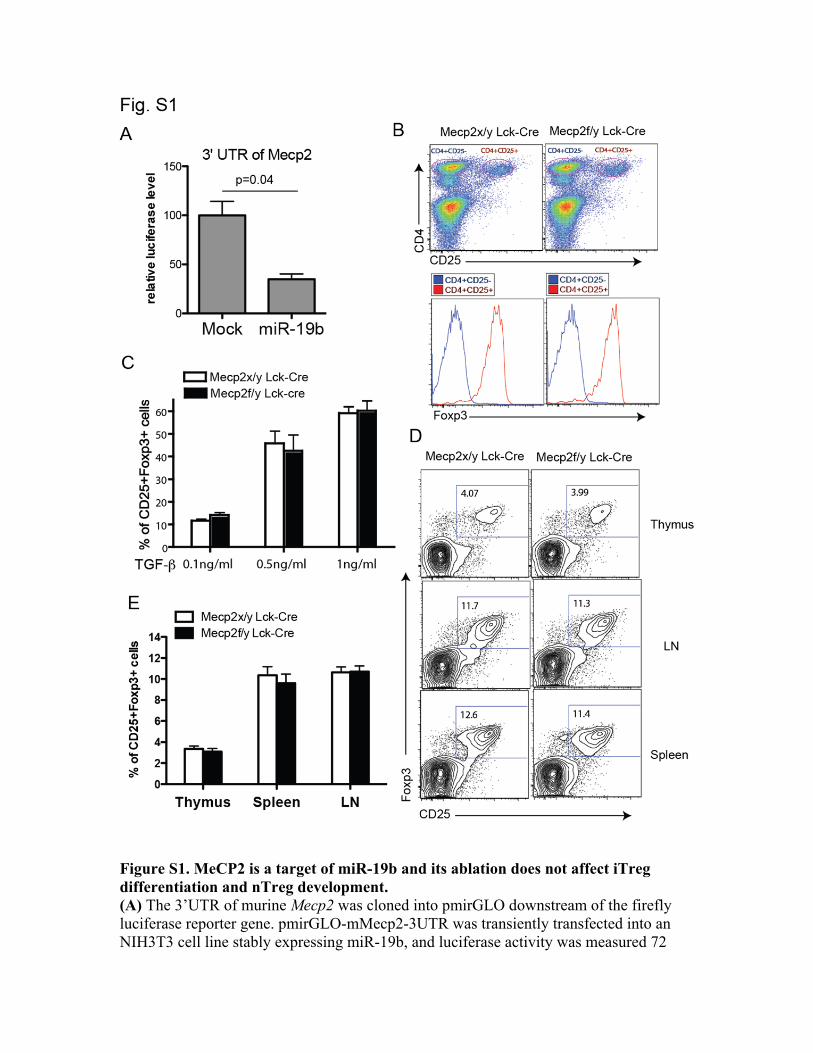
Figure S1. MeCP2 is a target of miR-19b and its ablation does not affect iTreg differentiation and nTreg development. (A) The 3’UTR of murine Mecp2 was cloned into pmirGLO downstream of the firefly luciferase reporter gene. pmirGLO-mMecp2-3UTR was transiently transfected into an NIH3T3 cell line stably expressing miR-19b, and luciferase activity was measured 72
hours post- transfection. Data was first normalized to the activity of a control renilla luciferase and then normalized to mock-transduced cells. Bar graphs show the means ± SEM of three independent experiments. (B-C) CD4+CD25- conventional T cells were sorted from the lymph nodes and spleens of Mecp2f/y Lck-Cre mice or their wild type littermates and cultured under iTreg differentiation conditions for 5 days (1ug/ml anti-CD3 & anti-CD28, 0.1 -1.0 ng/ml recombinant human TGFβ (Peprotech), 50U/ml recombinant mouse IL-2 (Peprotech), 10 μg/ml anti-IL-4 (11B11), 10 μg/ml anti-IFN-γ (XMG1.2), and 10 μg/ml anti-IL-6 (BD)). The percentage of Treg cells was measured by CD25 and Foxp3 staining. (B) Gating of CD4+CD25- conventional T cells and CD4+CD25+ Tregs during sorting and their Foxp3 expression. (C) Summary of iTreg differentiation showing means ± SEM of three independent experiments. (D-E) Percentage of CD25+Foxp3+ Tregs in the thymi and peripheral lymphoid organs of Mecp2f/y Lck-Cre mice or their wild type littermates. Bar graph shows means± SEM of data from three mice per group.
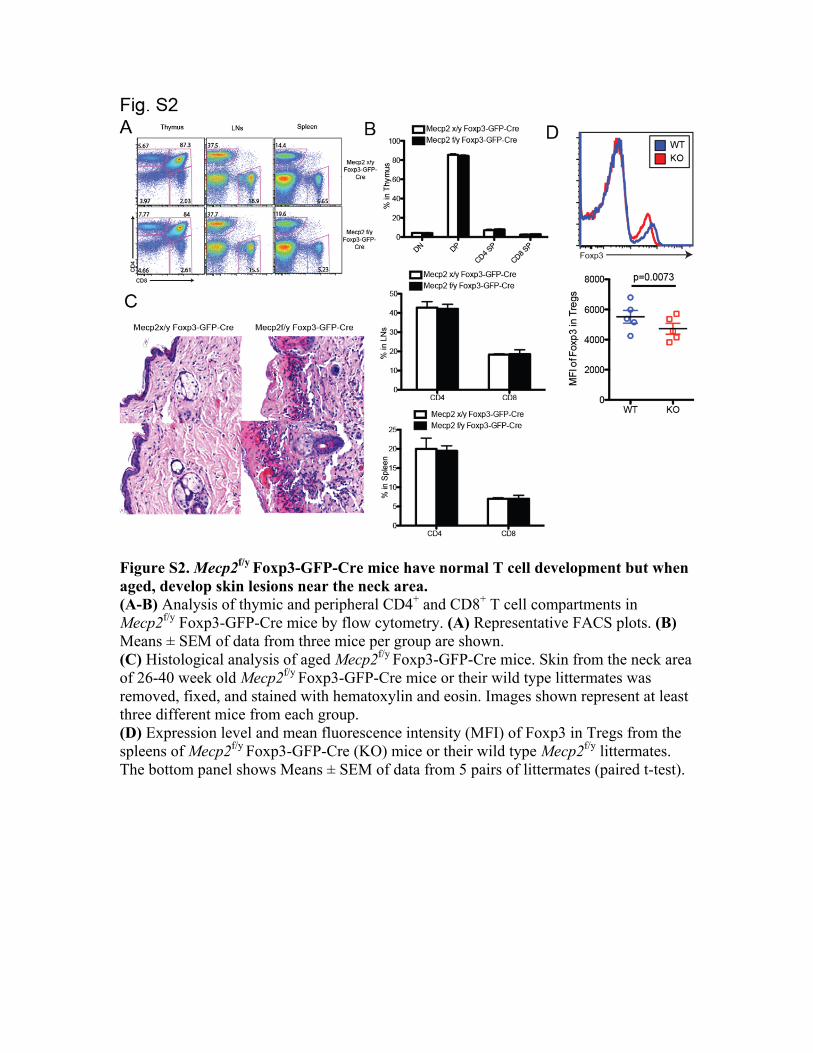
Figure S2. Mecp2f/y Foxp3-GFP-Cre mice have normal T cell development but when aged, develop skin lesions near the neck area. (A-B) Analysis of thymic and peripheral CD4+ and CD8+ T cell compartments in Mecp2f/y Foxp3-GFP-Cre mice by flow cytometry. (A) Representative FACS plots. (B) Means ± SEM of data from three mice per group are shown. (C) Histological analysis of aged Mecp2f/y Foxp3-GFP-Cre mice. Skin from the neck area of 26-40 week old Mecp2f/y Foxp3-GFP-Cre mice or their wild type littermates was removed, fixed, and stained with hematoxylin and eosin. Images shown represent at least three different mice from each group. (D) Expression level and mean fluorescence intensity (MFI) of Foxp3 in Tregs from the spleens of Mecp2f/y Foxp3-GFP-Cre (KO) mice or their wild type Mecp2f/y littermates. The bottom panel shows Means ± SEM of data from 5 pairs of littermates (paired t-test).
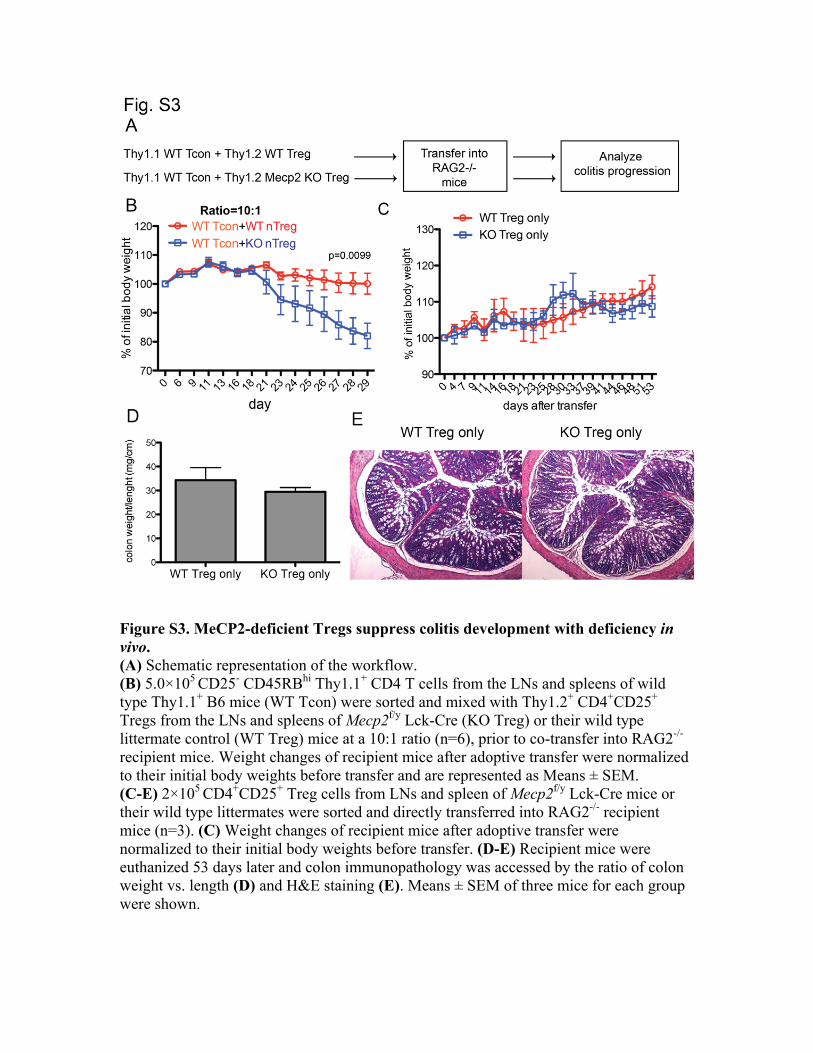
Figure S3. MeCP2-deficient Tregs suppress colitis development with deficiency in vivo. (A) Schematic representation of the workflow. (B) 5.0×10⁵ CD25- CD45RBhi Thy1.1+ CD4 T cells from the LNs and spleens of wild type Thy1.1+ B6 mice (WT Tcon) were sorted and mixed with Thy1.2+ CD4+CD25+ Tregs from the LNs and spleens of Mecp2f/y Lck-Cre (KO Treg) or their wild type littermate control (WT Treg) mice at a 10:1 ratio (n=6), prior to co-transfer into RAG2-/- recipient mice. Weight changes of recipient mice after adoptive transfer were normalized to their initial body weights before transfer and are represented as Means ± SEM. (C-E) 2×10⁵ CD4+CD25+ Treg cells from LNs and spleen of Mecp2f/y Lck-Cre mice or their wild type littermates were sorted and directly transferred into RAG2-/- recipient mice (n=3). (C) Weight changes of recipient mice after adoptive transfer were normalized to their initial body weights before transfer. (D-E) Recipient mice were euthanized 53 days later and colon immunopathology was accessed by the ratio of colon weight vs. length (D) and H&E staining (E). Means ± SEM of three mice for each group were shown.
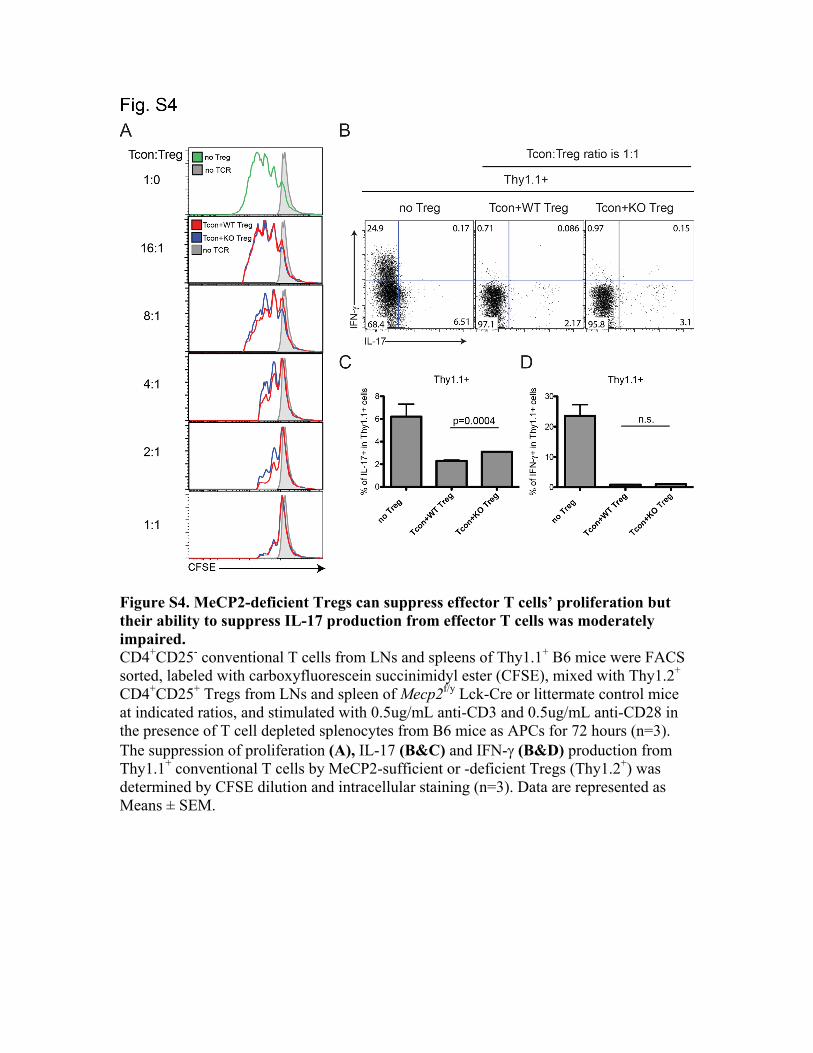
Figure S4. MeCP2-deficient Tregs can suppress effector T cells’ proliferation but their ability to suppress IL-17 production from effector T cells was moderately impaired. CD4+CD25- conventional T cells from LNs and spleens of Thy1.1+ B6 mice were FACS sorted, labeled with carboxyfluorescein succinimidyl ester (CFSE), mixed with Thy1.2+ CD4+CD25+ Tregs from LNs and spleen of Mecp2f/y Lck-Cre or littermate control mice at indicated ratios, and stimulated with 0.5ug/mL anti-CD3 and 0.5ug/mL anti-CD28 in the presence of T cell depleted splenocytes from B6 mice as APCs for 72 hours (n=3). The suppression of proliferation (A), IL-17 (B&C) and IFN- (B&D) production from Thy1.1+ conventional T cells by MeCP2-sufficient or -deficient Tregs (Thy1.2+) was determined by CFSE dilution and intracellular staining (n=3). Data are represented as Means ± SEM.
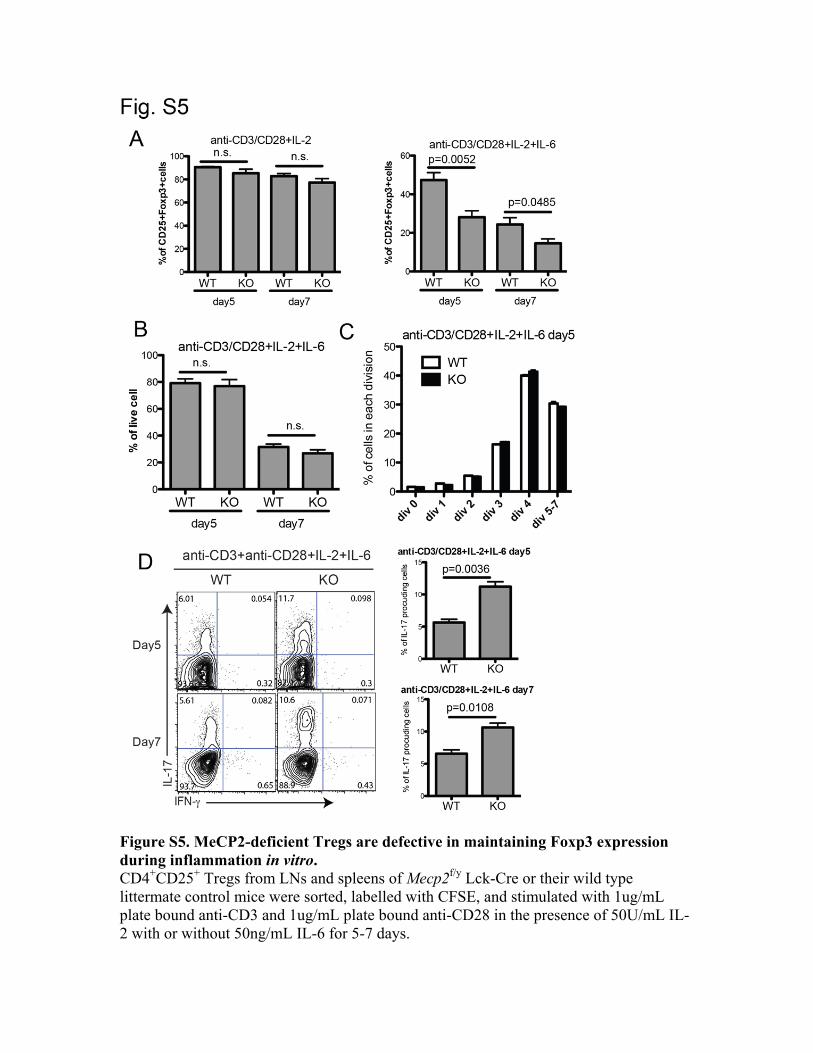
Figure S5. MeCP2-deficient Tregs are defective in maintaining Foxp3 expression during inflammation in vitro. CD4+CD25+ Tregs from LNs and spleens of Mecp2f/y Lck-Cre or their wild type littermate control mice were sorted, labelled with CFSE, and stimulated with 1ug/mL plate bound anti-CD3 and 1ug/mL plate bound anti-CD28 in the presence of 50U/mL IL-2 with or without 50ng/mL IL-6 for 5-7 days.
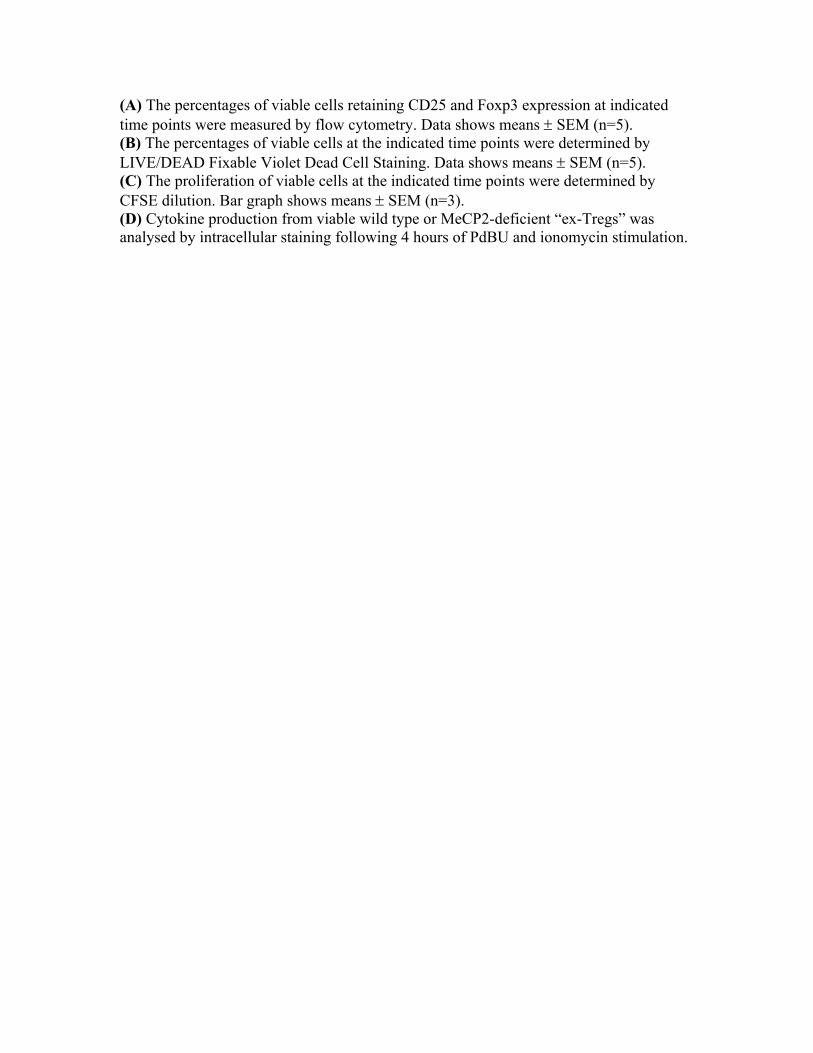
(A) The percentages of viable cells retaining CD25 and Foxp3 expression at indicated time points were measured by flow cytometry. Data shows means SEM (n=5). (B) The percentages of viable cells at the indicated time points were determined by LIVE/DEAD Fixable Violet Dead Cell Staining. Data shows means SEM (n=5). (C) The proliferation of viable cells at the indicated time points were determined by CFSE dilution. Bar graph shows means SEM (n=3). (D) Cytokine production from viable wild type or MeCP2-deficient “ex-Tregs” was analysed by intracellular staining following 4 hours of PdBU and ionomycin stimulation.
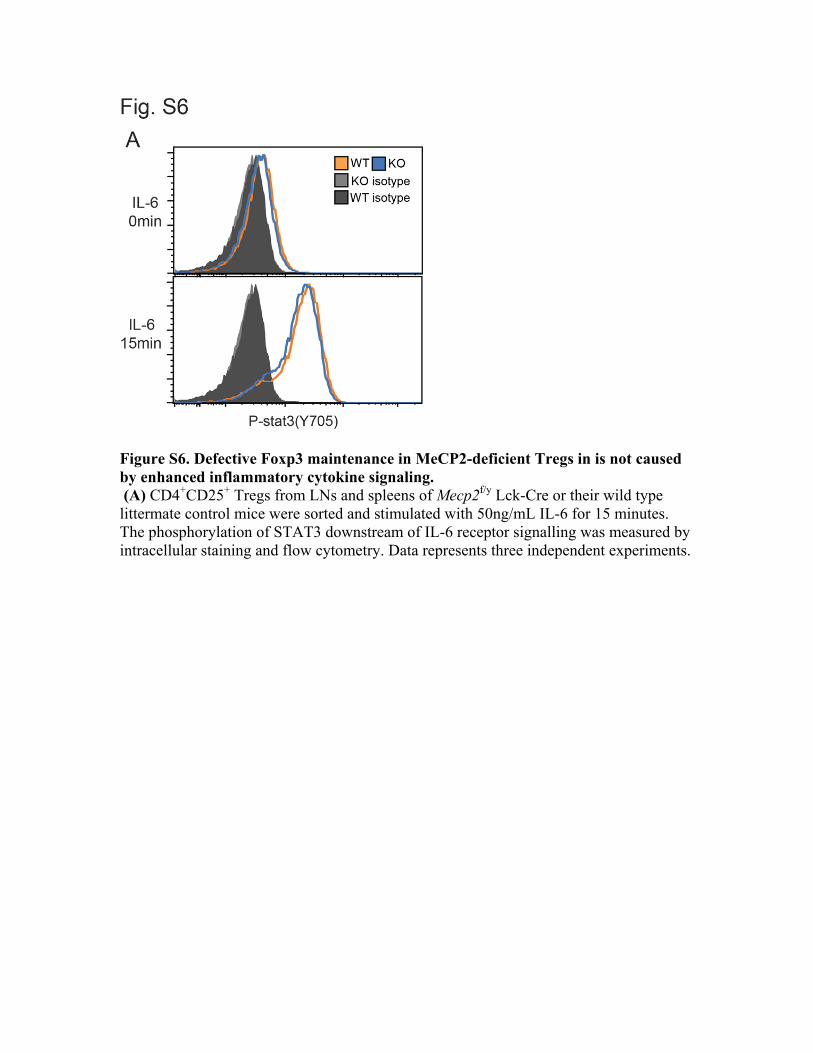
Figure S6. Defective Foxp3 maintenance in MeCP2-deficient Tregs in is not caused by enhanced inflammatory cytokine signaling. (A) CD4+CD25+ Tregs from LNs and spleens of Mecp2f/y Lck-Cre or their wild type littermate control mice were sorted and stimulated with 50ng/mL IL-6 for 15 minutes. The phosphorylation of STAT3 downstream of IL-6 receptor signalling was measured by intracellular staining and flow cytometry. Data represents three independent experiments.
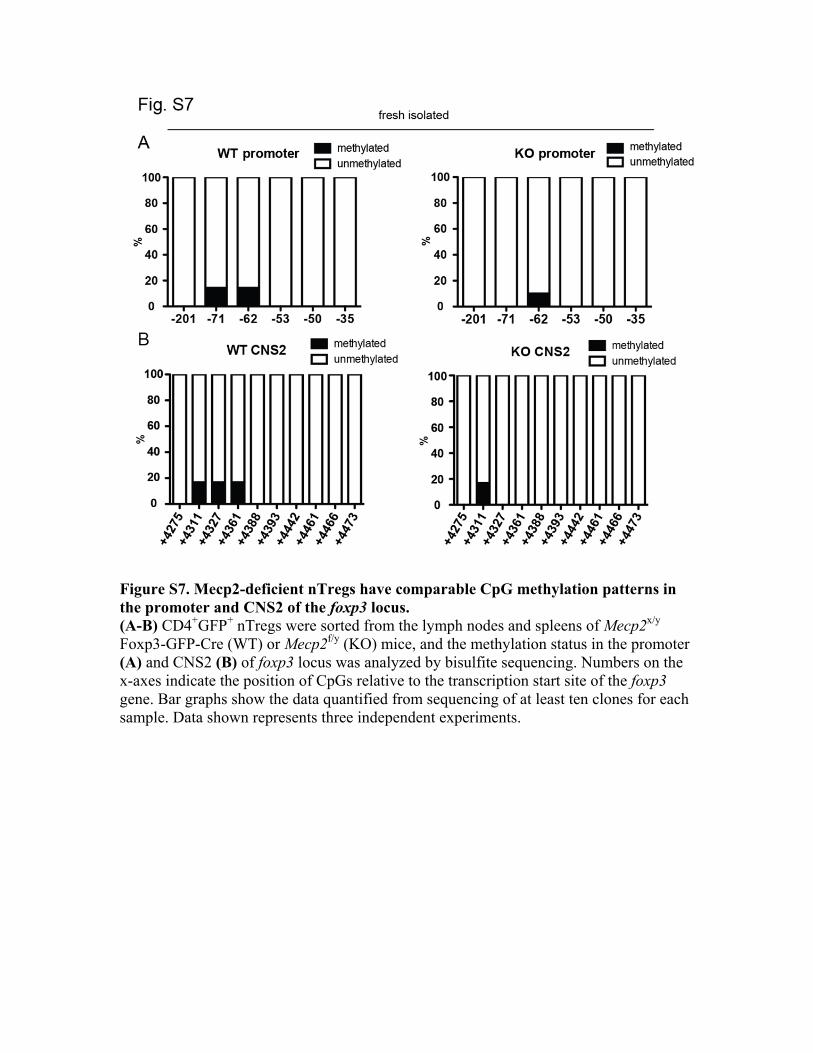
Figure S7. Mecp2-deficient nTregs have comparable CpG methylation patterns in the promoter and CNS2 of the foxp3 locus. (A-B) CD4+GFP+ nTregs were sorted from the lymph nodes and spleens of Mecp2x/y Foxp3-GFP-Cre (WT) or Mecp2f/y (KO) mice, and the methylation status in the promoter (A) and CNS2 (B) of foxp3 locus was analyzed by bisulfite sequencing. Numbers on the x-axes indicate the position of CpGs relative to the transcription start site of the foxp3 gene. Bar graphs show the data quantified from sequencing of at least ten clones for each sample. Data shown represents three independent experiments.
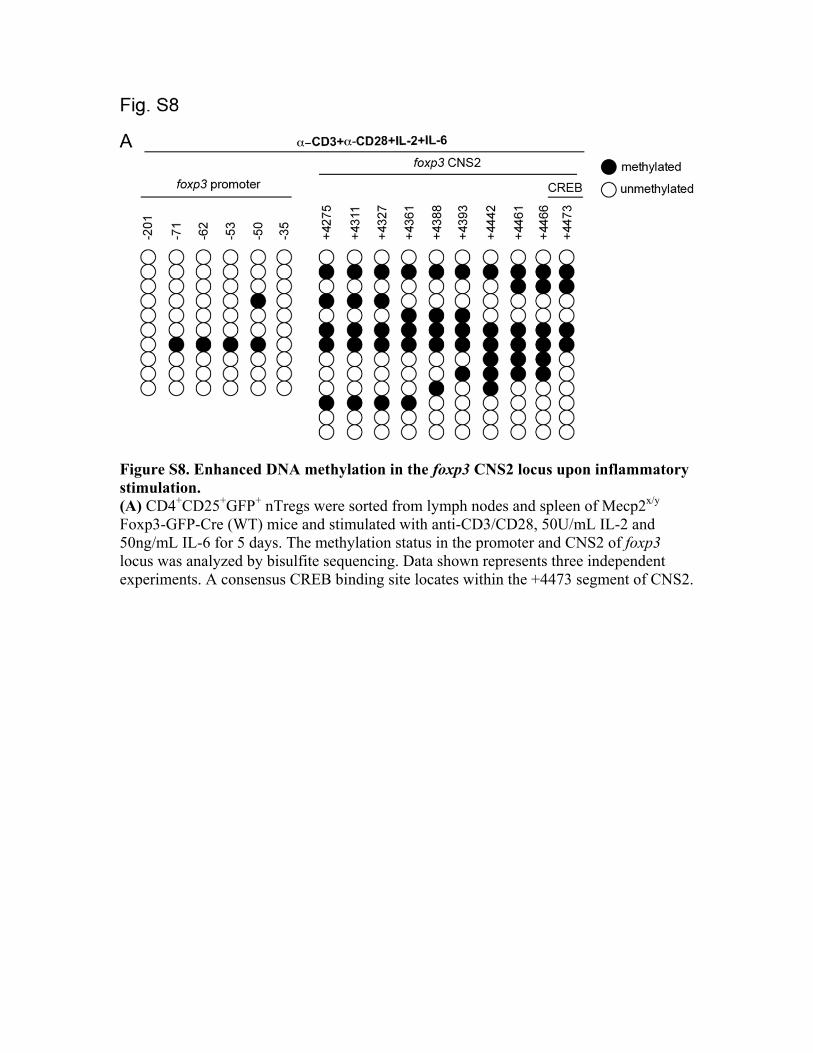
Figure S8. Enhanced DNA methylation in the foxp3 CNS2 locus upon inflammatory stimulation. (A) CD4+CD25+GFP+ nTregs were sorted from lymph nodes and spleen of Mecp2x/y Foxp3-GFP-Cre (WT) mice and stimulated with anti-CD3/CD28, 50U/mL IL-2 and 50ng/mL IL-6 for 5 days. The methylation status in the promoter and CNS2 of foxp3 locus was analyzed by bisulfite sequencing. Data shown represents three independent experiments. A consensus CREB binding site locates within the +4473 segment of CNS2.
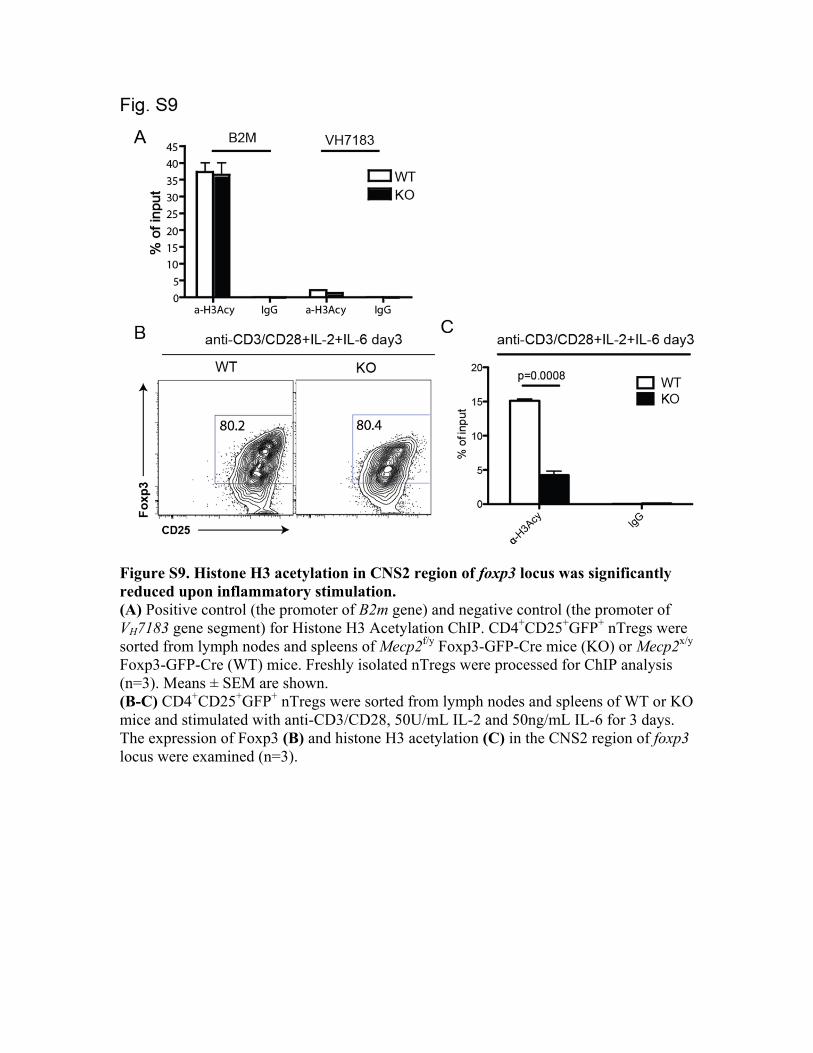
Figure S9. Histone H3 acetylation in CNS2 region of foxp3 locus was significantly reduced upon inflammatory stimulation. (A) Positive control (the promoter of B2m gene) and negative control (the promoter of VH7183 gene segment) for Histone H3 Acetylation ChIP. CD4+CD25+GFP+ nTregs were sorted from lymph nodes and spleens of Mecp2f/y Foxp3-GFP-Cre mice (KO) or Mecp2x/y Foxp3-GFP-Cre (WT) mice. Freshly isolated nTregs were processed for ChIP analysis (n=3). Means ± SEM are shown. (B-C) CD4+CD25+GFP+ nTregs were sorted from lymph nodes and spleens of WT or KO mice and stimulated with anti-CD3/CD28, 50U/mL IL-2 and 50ng/mL IL-6 for 3 days. The expression of Foxp3 (B) and histone H3 acetylation (C) in the CNS2 region of foxp3 locus were examined (n=3).
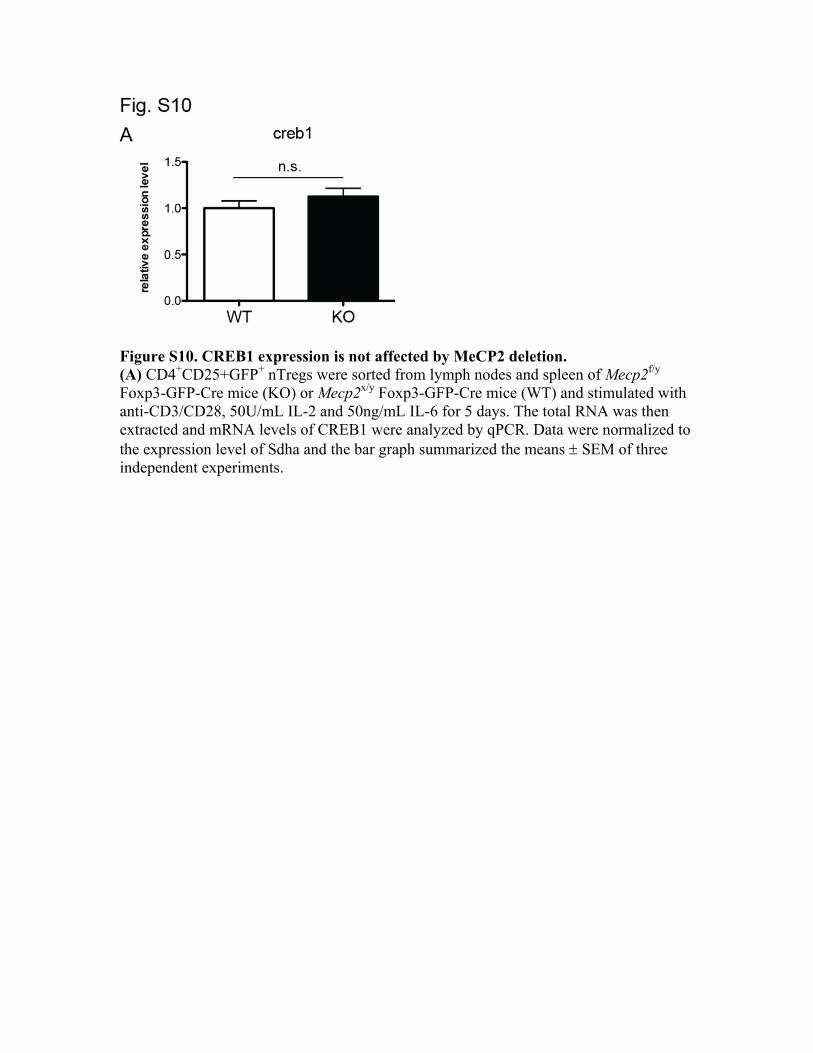
Figure S10. CREB1 expression is not affected by MeCP2 deletion. (A) CD4+CD25+GFP+ nTregs were sorted from lymph nodes and spleen of Mecp2f/y Foxp3-GFP-Cre mice (KO) or Mecp2x/y Foxp3-GFP-Cre mice (WT) and stimulated with anti-CD3/CD28, 50U/mL IL-2 and 50ng/mL IL-6 for 5 days. The total RNA was then extracted and mRNA levels of CREB1 were analyzed by qPCR. Data were normalized to the expression level of Sdha and the bar graph summarized the means SEM of three independent experiments.
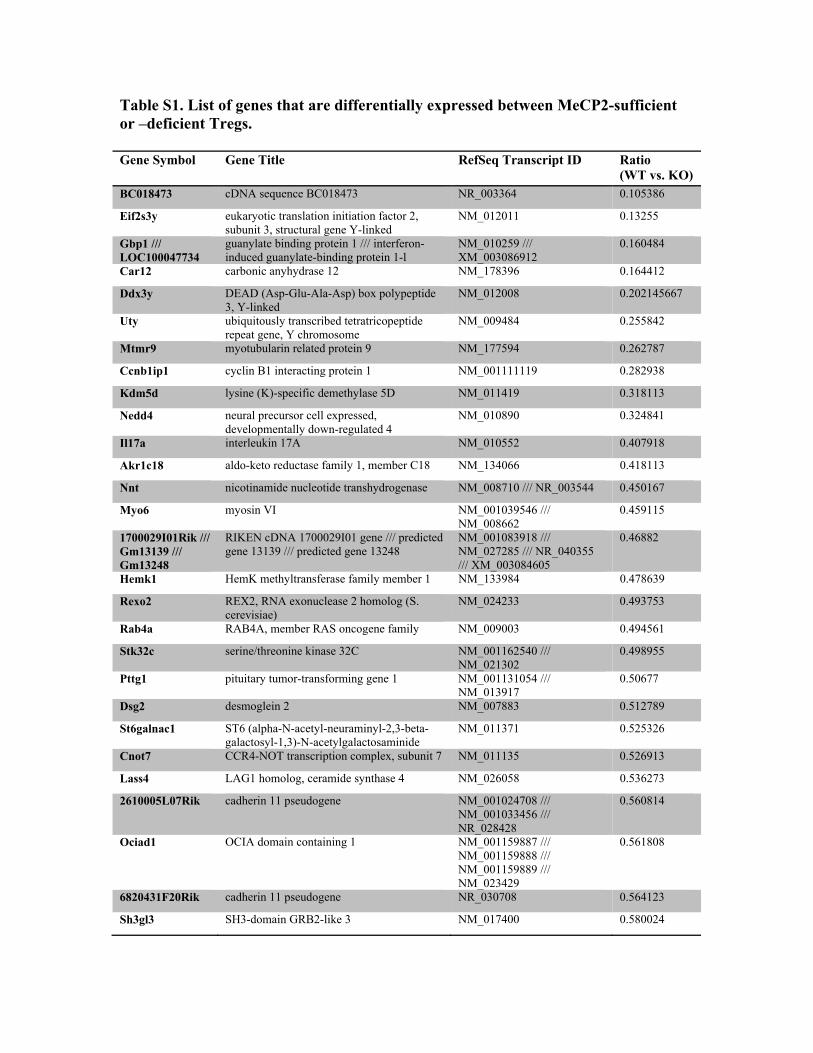
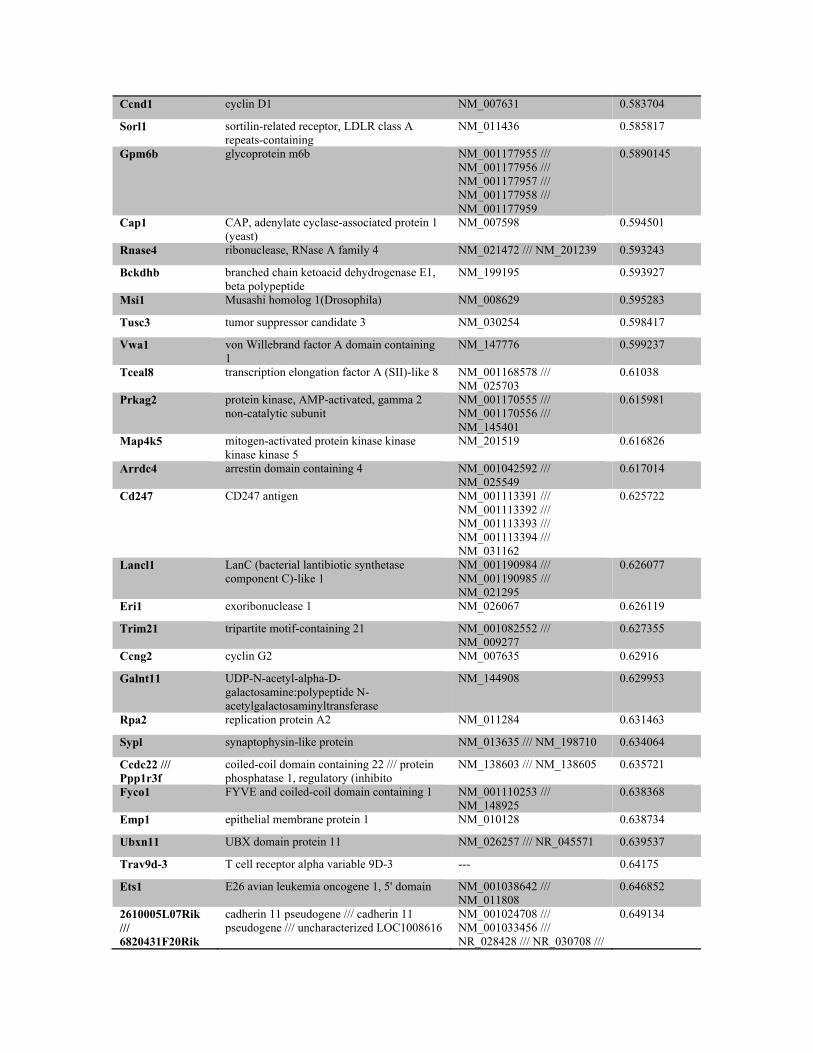
Table S1. List of genes that are differentially expressed between MeCP2-sufficient or –deficient Tregs. Gene Symbol Gene Title RefSeq Transcript ID Ratio
(WT vs. KO) BC018473 cDNA sequence BC018473 NR_003364 0.105386
Eif2s3y eukaryotic translation initiation factor 2, subunit 3, structural gene Y-linked
NM_012011 0.13255
Gbp1 /// LOC100047734
guanylate binding protein 1 /// interferon-induced guanylate-binding protein 1-l
NM_010259 /// XM_003086912
0.160484
Car12 carbonic anyhydrase 12 NM_178396 0.164412
Ddx3y DEAD (Asp-Glu-Ala-Asp) box polypeptide 3, Y-linked
NM_012008 0.202145667
Uty ubiquitously transcribed tetratricopeptide repeat gene, Y chromosome
NM_009484 0.255842
Mtmr9 myotubularin related protein 9 NM_177594 0.262787
Ccnb1ip1 cyclin B1 interacting protein 1 NM_001111119 0.282938
Kdm5d lysine (K)-specific demethylase 5D NM_011419 0.318113
Nedd4 neural precursor cell expressed, developmentally down-regulated 4
NM_010890 0.324841
Il17a interleukin 17A NM_010552 0.407918
Akr1c18 aldo-keto reductase family 1, member C18 NM_134066 0.418113
Nnt nicotinamide nucleotide transhydrogenase NM_008710 /// NR_003544 0.450167
Myo6 myosin VI NM_001039546 /// NM_008662
0.459115
1700029I01Rik /// Gm13139 /// Gm13248
RIKEN cDNA 1700029I01 gene /// predicted gene 13139 /// predicted gene 13248
NM_001083918 /// NM_027285 /// NR_040355 /// XM_003084605
0.46882
Hemk1 HemK methyltransferase family member 1 NM_133984 0.478639
Rexo2 REX2, RNA exonuclease 2 homolog (S. cerevisiae)
NM_024233 0.493753
Rab4a RAB4A, member RAS oncogene family NM_009003 0.494561
Stk32c serine/threonine kinase 32C NM_001162540 /// NM_021302
0.498955
Pttg1 pituitary tumor-transforming gene 1 NM_001131054 /// NM_013917
0.50677
Dsg2 desmoglein 2 NM_007883 0.512789
St6galnac1 ST6 (alpha-N-acetyl-neuraminyl-2,3-beta-galactosyl-1,3)-N-acetylgalactosaminide
NM_011371 0.525326
Cnot7 CCR4-NOT transcription complex, subunit 7 NM_011135 0.526913
Lass4 LAG1 homolog, ceramide synthase 4 NM_026058 0.536273
2610005L07Rik cadherin 11 pseudogene NM_001024708 /// NM_001033456 /// NR_028428
0.560814
Ociad1 OCIA domain containing 1 NM_001159887 /// NM_001159888 /// NM_001159889 /// NM_023429
0.561808
6820431F20Rik cadherin 11 pseudogene NR_030708 0.564123
Sh3gl3 SH3-domain GRB2-like 3 NM_017400 0.580024
Ccnd1 cyclin D1 NM_007631 0.583704
Sorl1 sortilin-related receptor, LDLR class A repeats-containing
NM_011436 0.585817
Gpm6b glycoprotein m6b NM_001177955 /// NM_001177956 /// NM_001177957 /// NM_001177958 /// NM_001177959
0.5890145
Cap1 CAP, adenylate cyclase-associated protein 1 (yeast)
NM_007598 0.594501
Rnase4 ribonuclease, RNase A family 4 NM_021472 /// NM_201239 0.593243
Bckdhb branched chain ketoacid dehydrogenase E1, beta polypeptide
NM_199195 0.593927
Msi1 Musashi homolog 1(Drosophila) NM_008629 0.595283
Tusc3 tumor suppressor candidate 3 NM_030254 0.598417
Vwa1 von Willebrand factor A domain containing 1
NM_147776 0.599237
Tceal8 transcription elongation factor A (SII)-like 8 NM_001168578 /// NM_025703
0.61038
Prkag2 protein kinase, AMP-activated, gamma 2 non-catalytic subunit
NM_001170555 /// NM_001170556 /// NM_145401
0.615981
Map4k5 mitogen-activated protein kinase kinase kinase kinase 5
NM_201519 0.616826
Arrdc4 arrestin domain containing 4 NM_001042592 /// NM_025549
0.617014
Cd247 CD247 antigen NM_001113391 /// NM_001113392 /// NM_001113393 /// NM_001113394 /// NM_031162
0.625722
Lancl1 LanC (bacterial lantibiotic synthetase component C)-like 1
NM_001190984 /// NM_001190985 /// NM_021295
0.626077
Eri1 exoribonuclease 1 NM_026067 0.626119
Trim21 tripartite motif-containing 21 NM_001082552 /// NM_009277
0.627355
Ccng2 cyclin G2 NM_007635 0.62916
Galnt11 UDP-N-acetyl-alpha-D-galactosamine:polypeptide N-acetylgalactosaminyltransferase
NM_144908 0.629953
Rpa2 replication protein A2 NM_011284 0.631463
Sypl synaptophysin-like protein NM_013635 /// NM_198710 0.634064
Ccdc22 /// Ppp1r3f
coiled-coil domain containing 22 /// protein phosphatase 1, regulatory (inhibito
NM_138603 /// NM_138605 0.635721
Fyco1 FYVE and coiled-coil domain containing 1 NM_001110253 /// NM_148925
0.638368
Emp1 epithelial membrane protein 1 NM_010128 0.638734
Ubxn11 UBX domain protein 11 NM_026257 /// NR_045571 0.639537
Trav9d-3 T cell receptor alpha variable 9D-3 --- 0.64175
Ets1 E26 avian leukemia oncogene 1, 5' domain NM_001038642 /// NM_011808
0.646852
2610005L07Rik /// 6820431F20Rik
cadherin 11 pseudogene /// cadherin 11 pseudogene /// uncharacterized LOC1008616
NM_001024708 /// NM_001033456 /// NR_028428 /// NR_030708 ///
0.649134
/// LOC100861653
XR_140874 /// XR_1
Bdh1 3-hydroxybutyrate dehydrogenase, type 1 NM_001122683 /// NM_175177
0.652783
Msn moesin NM_010833 0.653201
Fbxo17 F-box protein 17 NM_015796 0.653235
ptp4a2//Gm13422 predicted gene 13422; protein tyrosine phosphatase 4a2
NM_008974//NM_001164745
0.658707
Tlcd2 TLC domain containing 2 NM_027249 0.65929
1810032O08Rik RIKEN cDNA 1810032O08 gene NM_025472 /// NR_027819 /// NR_027820 /// NR_027821
0.661014
Prg4 proteoglycan 4 (megakaryocyte stimulating factor, articular superficial zone pro
NM_001110146 /// NM_021400
0.661163
Siah1a seven in absentia 1A NM_009172 0.662938
Gpr137b /// Gpr137b-ps
G protein-coupled receptor 137B /// G protein-coupled receptor 137B, pseudogene
NM_031999 /// NR_003568 0.663274
Paip1 polyadenylate binding protein-interacting protein 1
NM_001079849 /// NM_145457
0.664866
Ifnz interferon zeta NM_197889 /// XM_003689353
0.665233
Adat2 adenosine deaminase, tRNA-specific 2 NM_025748 0.666664
Tcrg-V4 T cell receptor gamma, variable 4 --- 1.50096
S100a4 S100 calcium binding protein A4 NM_011311 1.50544
Pou2af1 POU domain, class 2, associating factor 1 NM_011136 1.50843
G0s2 G0/G1 switch gene 2 NM_008059 1.51345
Id2 inhibitor of DNA binding 2 NM_010496 1.52293
Tesc tescalcin NM_021344 1.52579
Cyb561 cytochrome b-561 NM_007805 1.54434
Pvrl2 poliovirus receptor-related 2 NM_001159724 /// NM_008990
1.54672
2700089E24Rik RIKEN cDNA 2700089E24 gene NM_001163445 1.54904
Ccl5 chemokine (C-C motif) ligand 5 NM_013653 1.55274
Rpgrip1 retinitis pigmentosa GTPase regulator interacting protein 1
NM_001168515 /// NM_023879
1.55378
Gsr glutathione reductase NM_010344 1.55802
Gmfb glia maturation factor, beta NM_022023 1.55939
Kdm6a lysine (K)-specific demethylase 6A NM_009483 1.56354
Tgm1 transglutaminase 1, K polypeptide NM_001161714 /// NM_001161715 /// NM_019984
1.56725
Pmaip1 phorbol-12-myristate-13-acetate-induced protein 1
NM_021451 1.5836
Cxcr5 chemokine (C-X-C motif) receptor 5 NM_007551 1.59695
Ptgr1 prostaglandin reductase 1 NM_025968 1.60276
Gzmc granzyme C NM_010371 1.60678
Mlh1 mutL homolog 1 (E. coli) NM_026810 1.61002
Galnt10 UDP-N-acetyl-alpha-D-galactosamine:polypeptide N-acetylgalactosaminyltransferase
NM_134189 1.610305
Il1rn interleukin 1 receptor antagonist NM_001039701 /// NM_001159562 /// NM_031167
1.61453
Selm selenoprotein M NM_053267 1.61878
Ighm immunoglobulin heavy constant mu --- 1.62377
Chn2 chimerin (chimaerin) 2 NM_001163640 /// NM_023543
1.62644
Rnd2 Rho family GTPase 2 NM_009708 1.62718
Tmem66 transmembrane protein 66 NM_026432 1.63031
Rps25 ribosomal protein S25 NM_024266 1.63567
Rec8 REC8 homolog (yeast) NM_020002 1.63603
Zdhhc2 zinc finger, DHHC domain containing 2 NM_178395 1.64576
Eps8 epidermal growth factor receptor pathway substrate 8
NM_007945 1.64627
Hmgn3 high mobility group nucleosomal binding domain 3
NM_026122 /// NM_175074 1.65238
Marcks myristoylated alanine rich protein kinase C substrate
NM_008538 1.65769
Pink1 PTEN induced putative kinase 1 NM_026880 1.66867
Kif23 kinesin family member 23 NM_024245 1.66964
Atp7a ATPase, Cu++ transporting, alpha polypeptide
NM_001109757 /// NM_009726
1.67578
Bmp7 bone morphogenetic protein 7 NM_007557 1.67594
Clec2i C-type lectin domain family 2, member i NM_020257 1.68088
Trim34a tripartite motif-containing 34A NM_030684 1.7006
Fam132a family with sequence similarity 132, member A
NM_026125 1.70515
Trim12a tripartite motif-containing 12A NM_023835 1.73498
LOC665506 T-cell receptor beta-2 chain C region-like XM_977361 1.73796
Bmp2k BMP2 inducible kinase NM_080708 1.73976
Enpp2 ectonucleotide pyrophosphatase/phosphodiesterase 2
NM_001136077 /// NM_015744
1.740335
Rell1 RELT-like 1 NM_145923 1.75289
Gstt1 glutathione S-transferase, theta 1 NM_008185 1.77806
Abhd14b abhydrolase domain containing 14b NM_029631 1.77956
Klrg1 killer cell lectin-like receptor subfamily G, member 1
NM_016970 1.79163
Tiparp TCDD-inducible poly(ADP-ribose) polymerase
NM_178892 1.80169
Atp8a1 ATPase, aminophospholipid transporter (APLT), class I, type 8A, member 1
NM_001038999 /// NM_009727
1.80832
BC005512 /// F630007L15Rik /// Gm6958
cDNA sequence BC005512 /// RIKEN cDNA F630007L15 gene /// predicted gene 6958
XM_001479180 /// XM_001480210 /// XM_989008 /// XR_141229 /// XR_141757
1.82055
Smo smoothened homolog (Drosophila) NM_176996 1.86253
Snx5 sorting nexin 5 NM_001199188 /// NM_024225
1.86353
Havcr2 hepatitis A virus cellular receptor 2 NM_134250 1.86924
Rpl39l ribosomal protein L39-like NM_026594 1.87776
Atm ataxia telangiectasia mutated homolog (human)
NM_007499 1.88606
Acp1 /// LOC631286
acid phosphatase 1, soluble /// low molecular weight phosphotyrosine protein pho
NM_001110239 /// NM_021330 /// XM_905648
1.9331
S100a6 S100 calcium binding protein A6 (calcyclin) NM_011313 1.95154
Tex15 testis expressed gene 15 NM_031374 1.95572
Mns1 meiosis-specific nuclear structural protein 1 NM_008613 2.0016
Ppcdc phosphopantothenoylcysteine decarboxylase NM_176831 2.00935
Il1rl1 interleukin 1 receptor-like 1 NM_001025602 /// NM_010743
2.05178
Gm6293 /// Uqcr10
predicted pseudogene 6293 /// ubiquinol-cytochrome c reductase, complex III subu
NM_001047158 /// NM_197979 /// XM_003086110 /// XM_886587
2.1135
X83313 EST X83313 --- 2.12305
Slc15a2 solute carrier family 15 (H+/peptide transporter), member 2
NM_001145899 /// NM_021301
2.15419
Ccr2 chemokine (C-C motif) receptor 2 NM_009915 2.21126
Mt2 metallothionein 2 NM_008630 2.23565
Zfp386 zinc finger protein 386 (Kruppel-like) NM_001004066 /// NM_019565
2.33473
Slc37a4 solute carrier family 37 (glucose-6-phosphate transporter), member 4
NM_008063 2.34108
Ccr5 chemokine (C-C motif) receptor 5 NM_009917 2.38981
Timd2 T cell immunoglobulin and mucin domain containing 2
NM_001161355 /// NM_001161356 /// NM_134249
2.48517
Mpzl2 myelin protein zero-like 2 NM_007962 2.57172
Camk2b calcium/calmodulin-dependent protein kinase II, beta
NM_007595 2.63103
Hspa1b heat shock protein 1B NM_010478 2.63125
Cd99l2 CD99 antigen-like 2 NM_001199349 /// NM_138309
2.70229
Klrd1 killer cell lectin-like receptor, subfamily D, member 1
NM_010654 2.72044
Mecp2 methyl CpG binding protein 2 NM_001081979 /// NM_010788
2.81313
Gm3579 predicted gene 3579 XM_001477842 2.82117
Hspa1a heat shock protein 1A NM_010479 2.91709
Casp3 caspase 3 NM_009810 2.96601
Klrc1 killer cell lectin-like receptor subfamily C, member 1
NM_001136068 /// NM_010652
2.97197
Galc galactosylceramidase NM_008079 3.40356
2810417H13Rik RIKEN cDNA 2810417H13 gene NM_026515 4.00218
Xist inactive X specific transcripts NR_001463 /// NR_001570 4.36581
Rab6b RAB6B, member RAS oncogene family NM_173781 6.36512
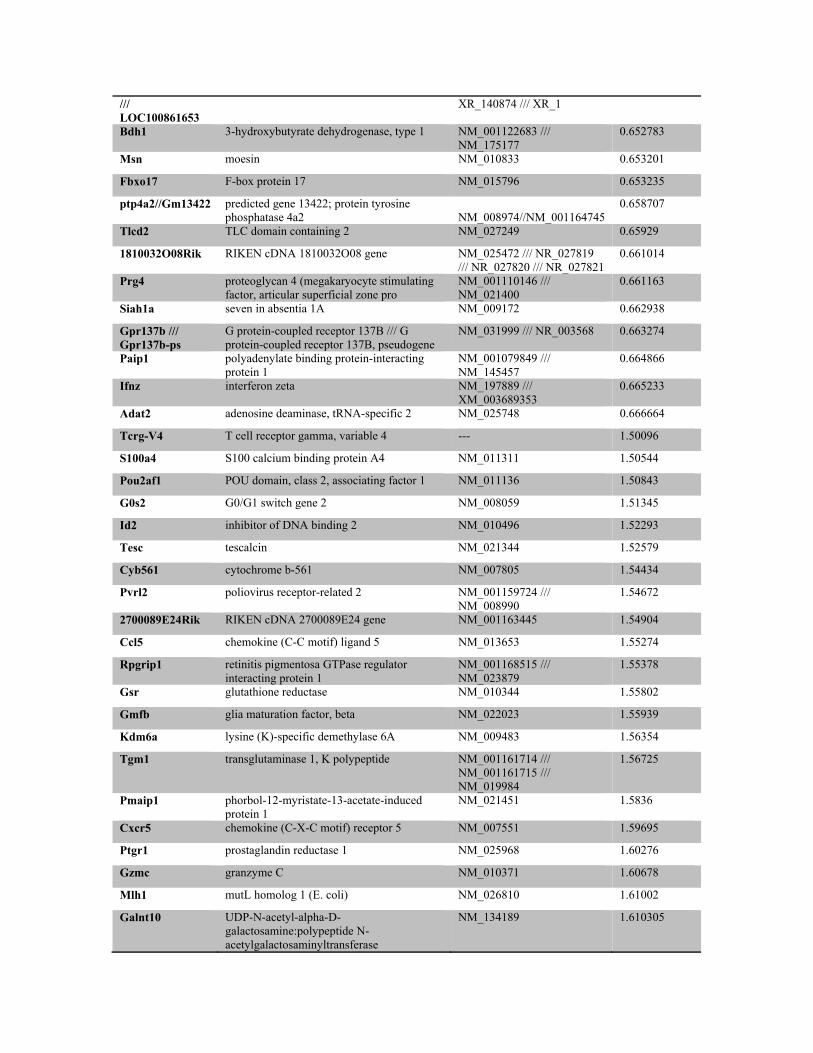
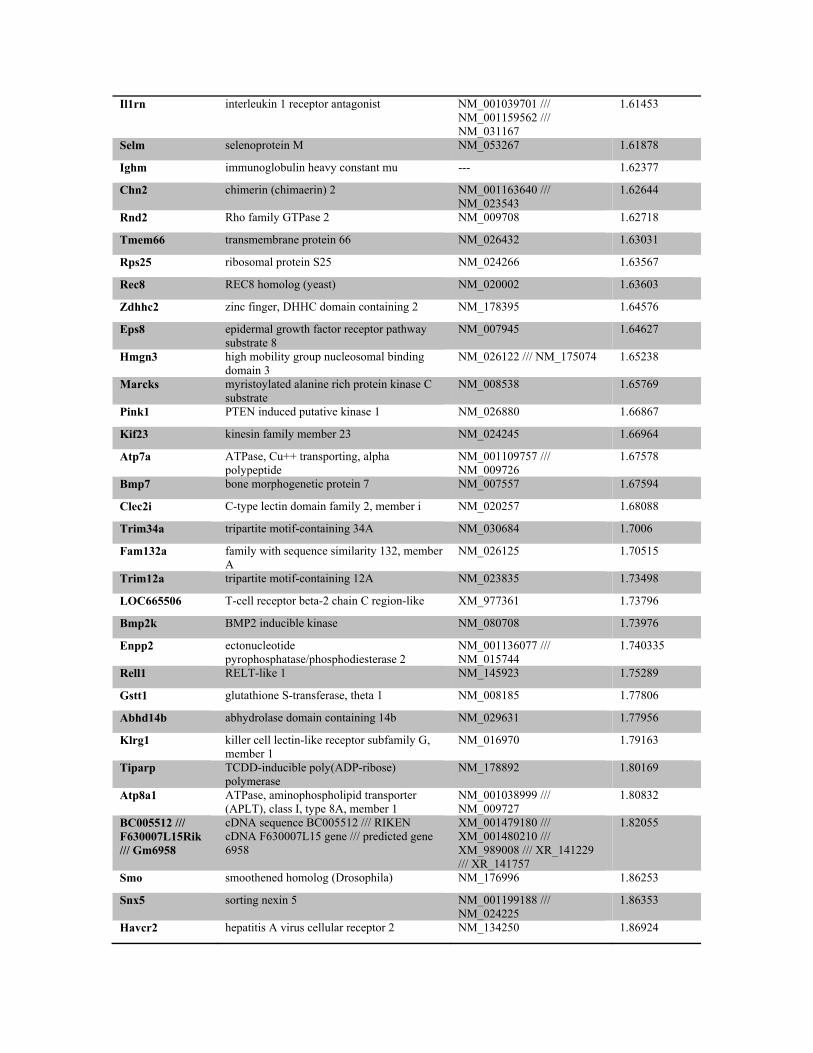
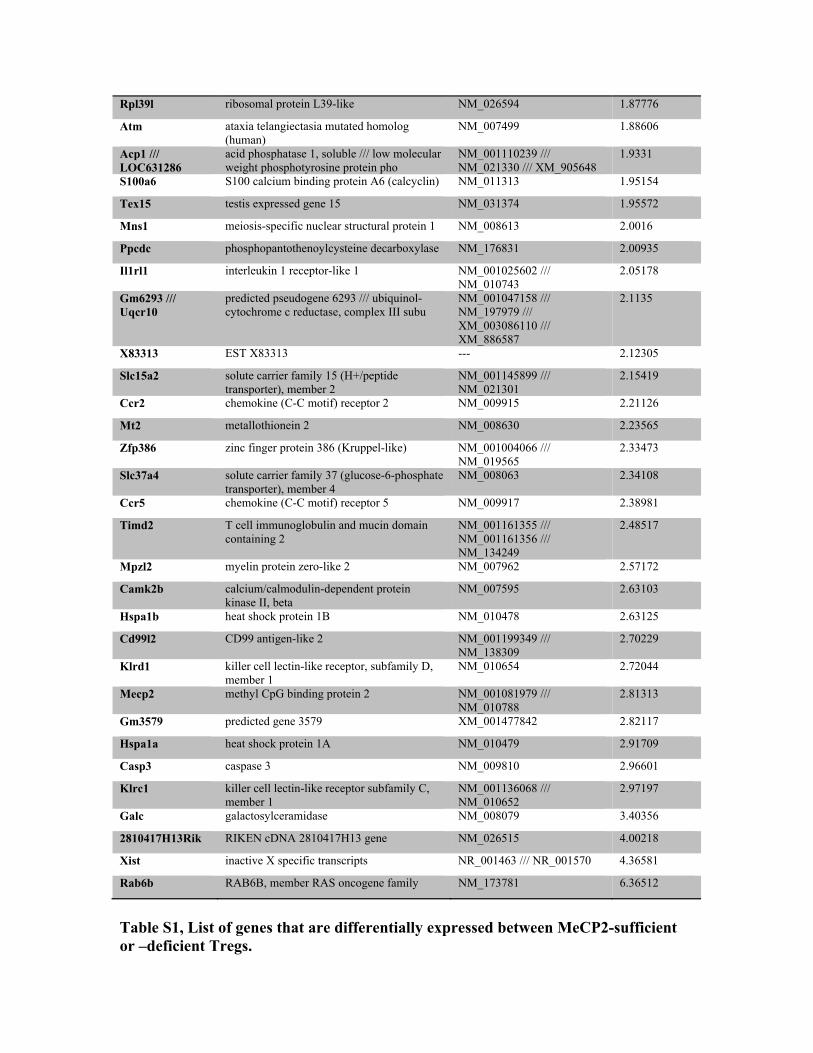
Table S1, List of genes that are differentially expressed between MeCP2-sufficient or –deficient Tregs.
Thy1.2+ CD4+CD25+ Tregs from LNs and spleen of 6-8 week old Mecp2f/y Lck-Cre or littermate control mice were sorted and mixed with CD4+CD25- conventional T cells from LNs and spleens of Thy1.1+ B6 mice at ratio of 1 to 4, and stimulated for 72 hours with 0.5ug/mL anti-CD3 and 0.5ug/mL anti-CD28 in the presence of T cell depleted splenocytes from B6 mice that served as APCs. At the end of culture, viable Thy1.2+ wild type and MeCP2-deficient Treg cells were sorted and lysed for RNA. Two rounds of samples from different mice were independently collected. The global gene expression was assessed by GeneChip Mouse Genome 430 2.0 Array from affymetrix using service from the Duke DNA Microarray Core Facility. Microarray data was analyzed using the Partek Genomics Suite, with RMA background correction and mean probeset summarization analysis parameters used. Only non-cross-hybridizing probes that were declared present or marginal in at least one sample (according to the MAS5 file) were considered for analysis. The normalized expression levels were then compared between WT Tregs and MeCP2 KO Tregs. An average fold-change of 1.5 was used as a threshold for differential expression between the two samples. For genes with multiple probes, the fold changes were averaged, resulting in 154 unique, differentially expressed genes.


![Circulating MiR-16-5p and MiR-19b-3p as Two Novel ... · annual report on status of cancer in China in 2010 [2], GC was ranked as the second among the most com-mon cancers and the](https://img.pdfslide.us/doc/110x75/5fa91e8828f50d3d9e4b7a77/circulating-mir-16-5p-and-mir-19b-3p-as-two-novel-annual-report-on-status-of.jpg)