Embed Size (px)
Citation preview
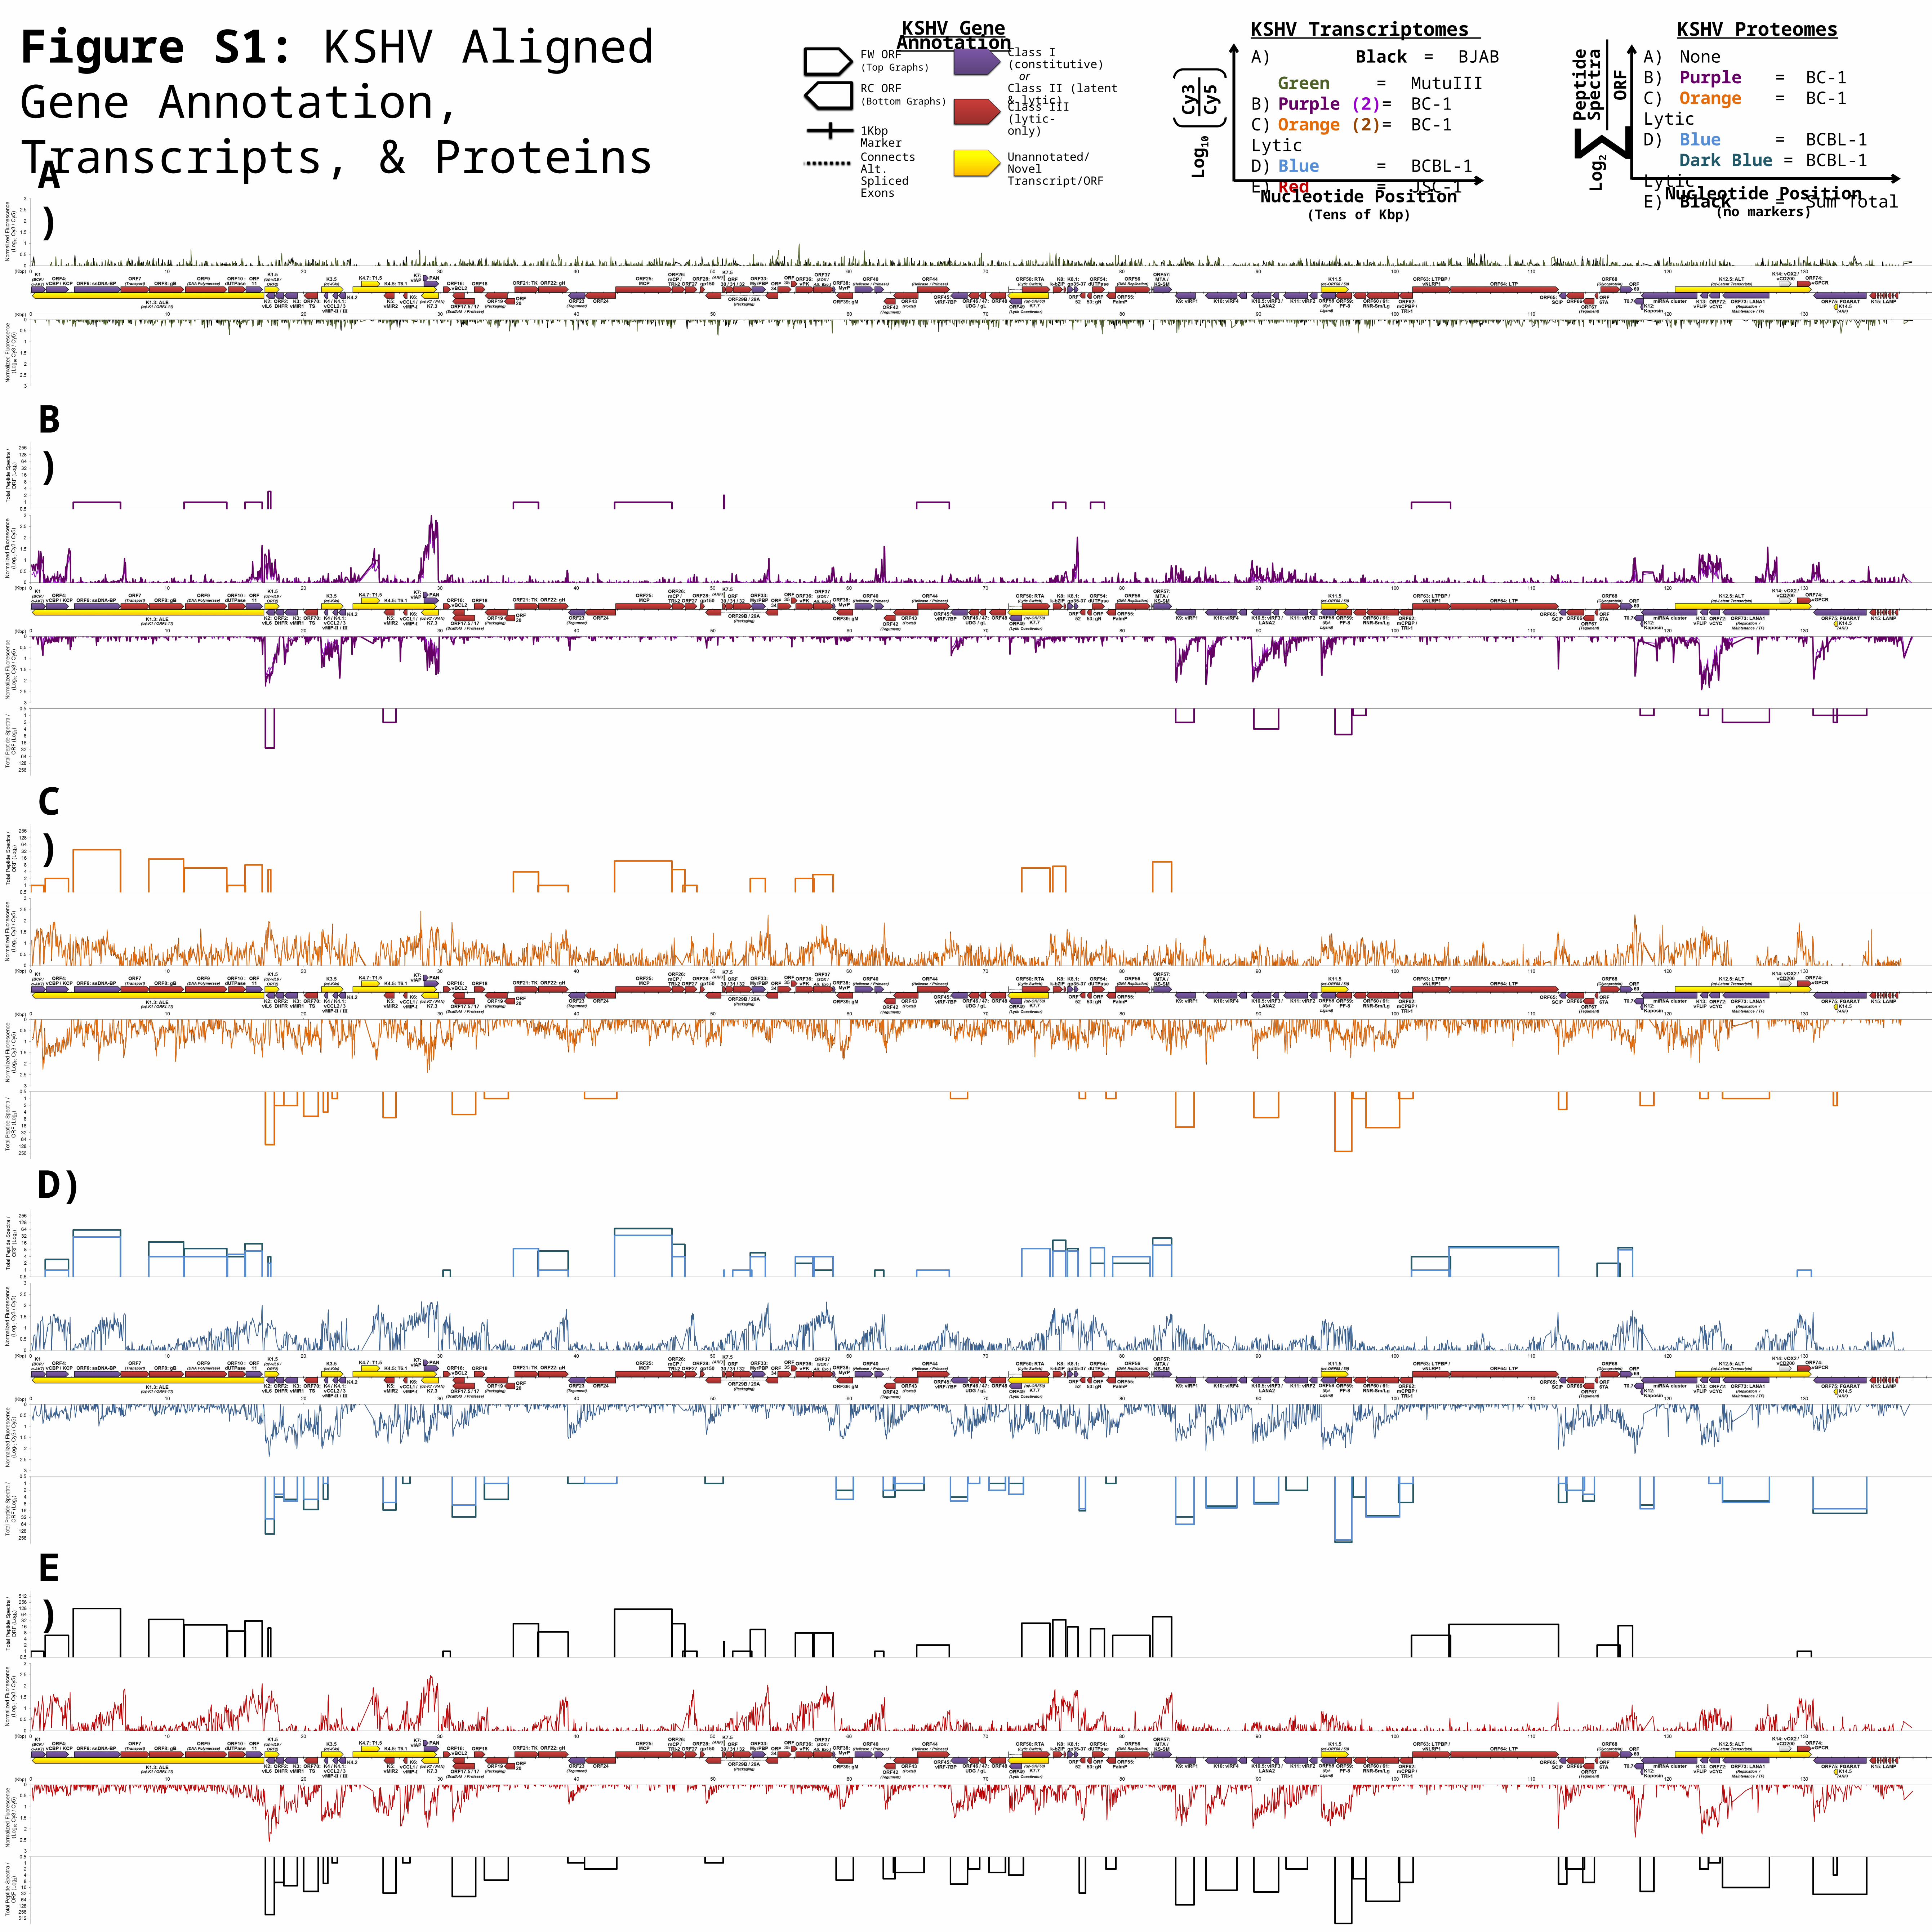
Figure S1: KSHV Aligned Gene Annotation, Transcripts, & Proteins
KSHV Gene Annotation
FW ORF (Top Graphs)
RC ORF(Bottom Graphs)
Connects Alt. Spliced Exons
Class I (constitutive) or
Class II (latent & lytic)Class III (lytic-only)
Unannotated/NovelTranscript/ORF
1Kbp Marker
A)
B)
C)
D)
E)
KSHV Transcriptomes A) Black = BJAB
Green = MutuIIIB) Purple (2)= BC-1C) Orange (2)= BC-1 LyticD) Blue = BCBL-1E) Red = JSC-1L
og
10
Nucleotide Position(Tens of Kbp)
Cy3
Cy5
KSHV ProteomesA) NoneB) Purple = BC-1 C) Orange = BC-1 LyticD) Blue = BCBL-1
Dark Blue = BCBL-1 LyticE) Black = Sum Total L
og
2
Nucleotide Position(no markers)
Pep
tid
e
Sp
ectr
a
OR
FΣ
Figure S1: KSHV Aligned Gene Annotation, Transcripts, & Proteins. The tiling array for KSHV and
EBV was used to assess transcript expression of cell lines containing either: EBV-alone (MutuIII; green),
KSHV-alone (BCBL-1; blue), both EBV and KSHV (JSC-1; red / BC-1 latent; purple, 2 tones / BC-1 lytic;
orange, 2 tones), or neither (BJAB; black). RNA from these experimental samples was prepared and labeled
for detection in the Cy3 channel; the Cy5 channel (BJAB) served as a normalization control for each array.
BC-1 latent and lytic samples were analyzed as technical replicates. Additionally, LC-MS/MS was used to
assess viral protein expression from the cell lines BC-1 and BCBL-1 under latent and lytic culture conditions.
Panels A-E correspond to the cell lines and conditions as indicated in the legend. Expression of the detected
transcripts and proteins is displayed in three parts. 1) Transcripts or ORFs are depicted as arrows
corresponding to their direction and their length relative to the position along the KSHV genome
(NC_009333), where tick-marks represent one kilobase-pair (kbp). Arrows are color-coded as follows:
purple = KSHV class I (constitutive) or KSHV class II (latent and lytic), red = KSHV class III (lytic-only),
and yellow = unannotated/novel transcript/ORF. 2) The graph above the depicted transcripts/ORFs
corresponds to the transcriptional data from the forward (top) strand; the graph below the depicted
transcripts/ORFs corresponds to the transcriptional data from the reverse complement (bottom) strand. The
y-axis represents the Log10-ratio of average fluorescent signal (three probes per array) from the experimental
sample (Cy3) normalized to the control channel (Cy5). The x-axis represents the nucleotide position of
KSHV in kbp. 3) And finally, the graphs outside the transcriptional data correspond to the proteomic data for
these samples on a Log2 scale. The width of each raised line corresponds to the ORF . The height of each
raised line is indicated as the sum total of all peptide spectra per ORF; observed spectra from unique peptide
sequences are totaled together per ORF. Colored lines correspond to the RNA samples as indicated; the dark
blue lines represent BCBL-1 lytic proteins which lack corresponding transcriptional data. The final graph
depicts the sum total of all peptide spectra per ORF from all tested cell lines and conditions (black line).