Embed Size (px)
Citation preview
Stimulation Technologies for Deep Well Completions DE-FC26-02NT41663
4. Case History of Hydraulic Fracturing in Jennings Ranch Field, TX
Pinnacle Technologies, Inc. 75
Multiple Hydraulic Fractures vs. Tortuosity
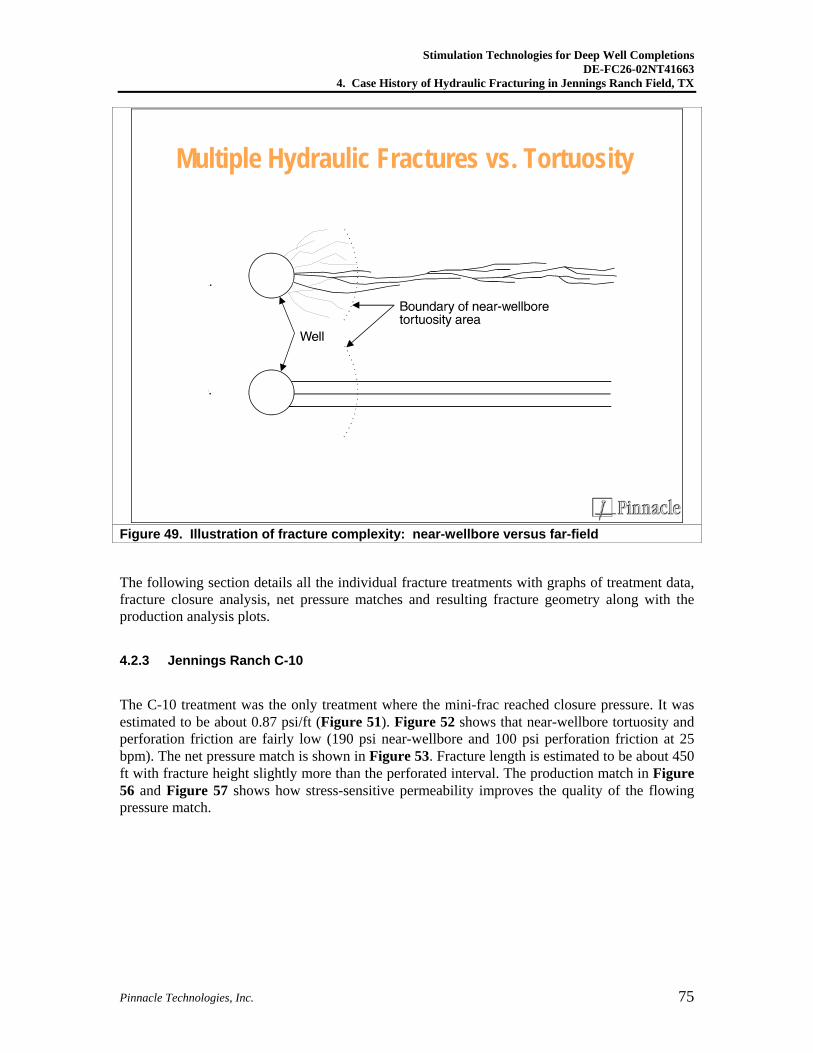
Figure 49. Illustration of fracture complexity: near-wellbore versus far-field
The following section details all the individual fracture treatments with graphs of treatment data, fracture closure analysis, net pressure matches and resulting fracture geometry along with the production analysis plots.
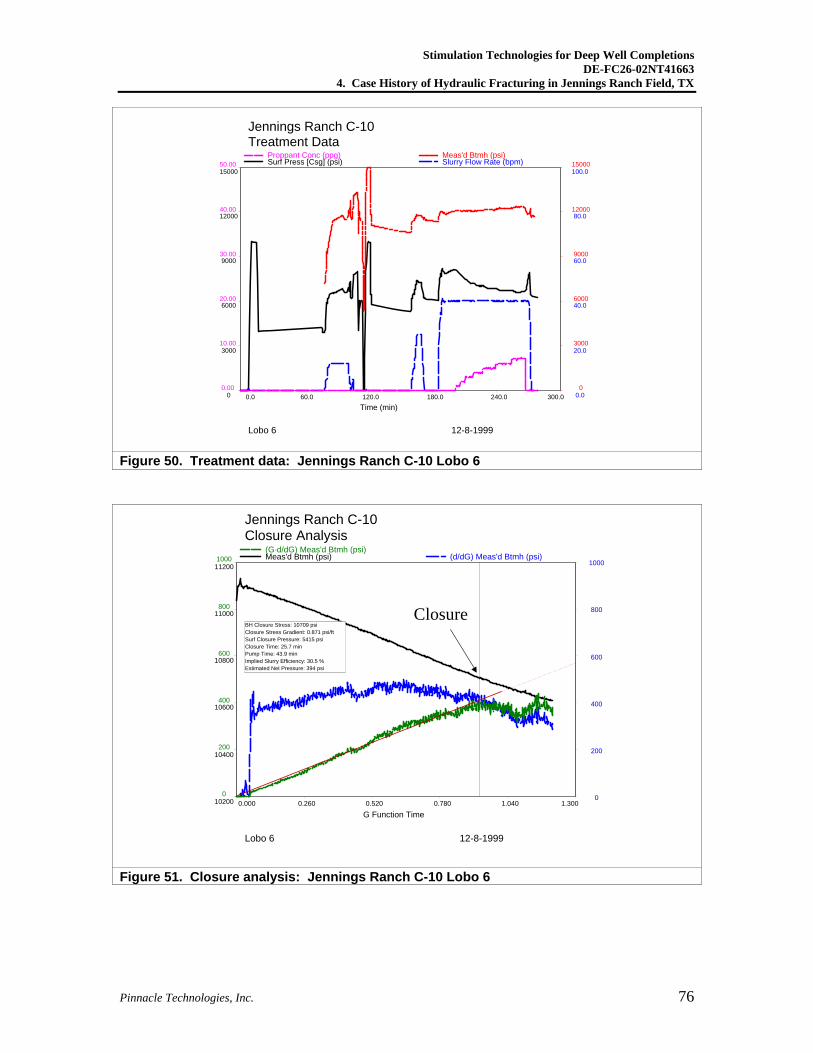
4.2.3 Jennings Ranch C-10
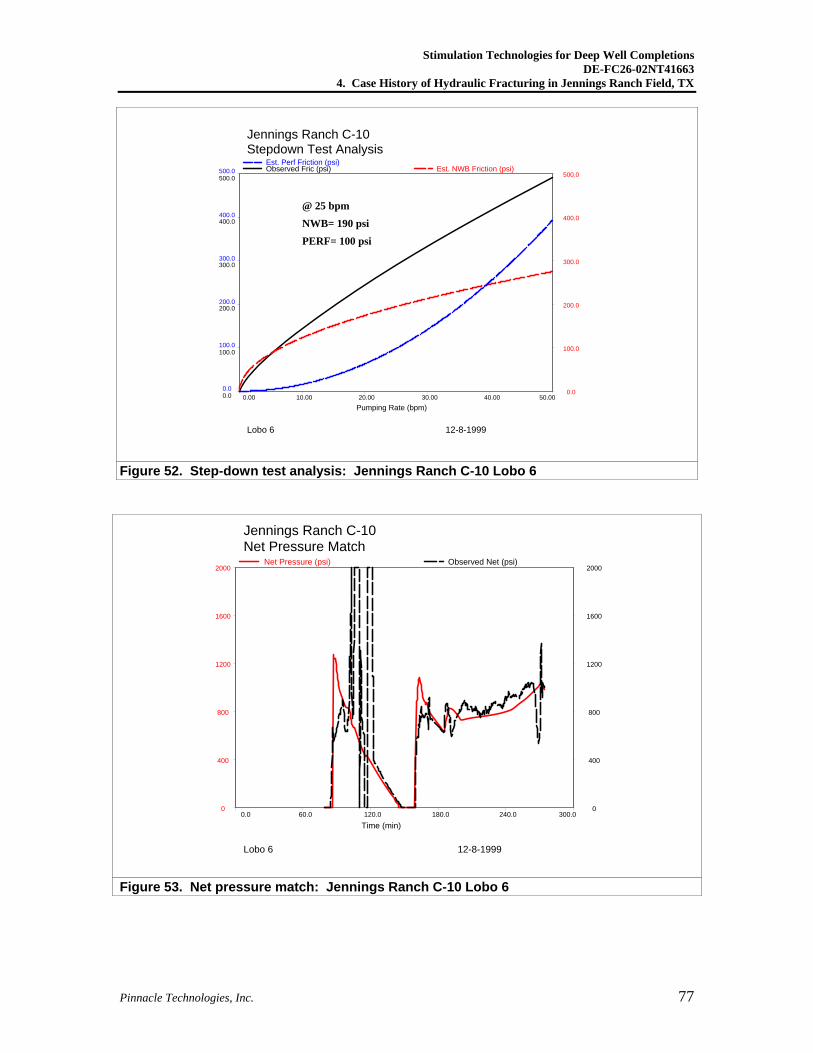
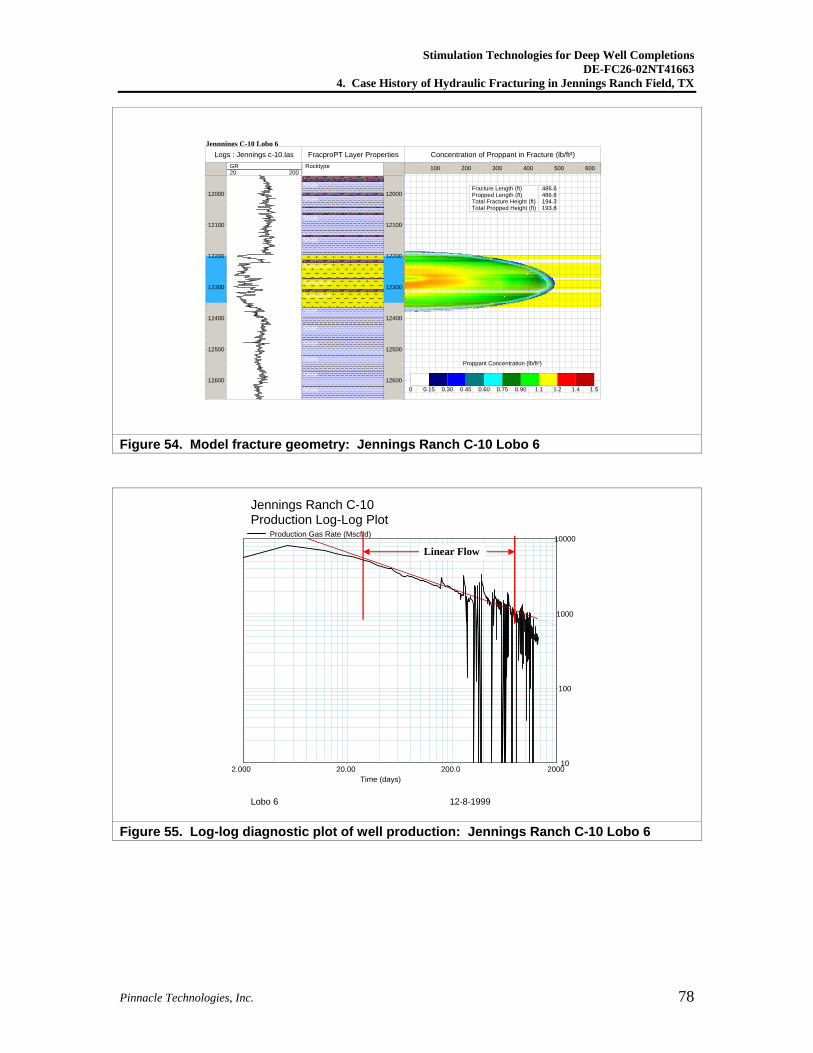
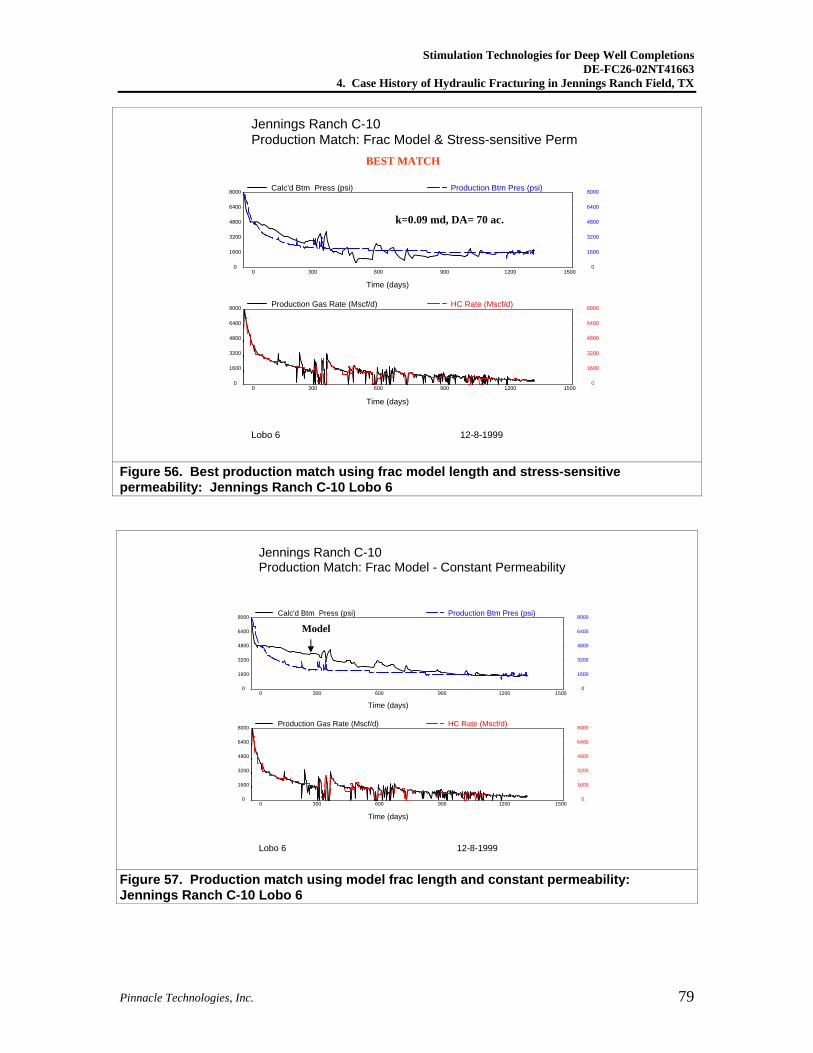
The C-10 treatment was the only treatment where the mini-frac reached closure pressure. It was estimated to be about 0.87 psi/ft (Figure 51). Figure 52 shows that near-wellbore tortuosity and perforation friction are fairly low (190 psi near-wellbore and 100 psi perforation friction at 25 bpm). The net pressure match is shown in Figure 53. Fracture length is estimated to be about 450 ft with fracture height slightly more than the perforated interval. The production match in Figure 56 and Figure 57 shows how stress-sensitive permeability improves the quality of the flowing pressure match.
Stimulation Technologies for Deep Well Completions DE-FC26-02NT41663
4. Case History of Hydraulic Fracturing in Jennings Ranch Field, TX
Pinnacle Technologies, Inc. 76
Jennings Ranch C-10Treatment Data
Lobo 6 12-8-1999
Time (min)
Surf Press [Csg] (psi) Slurry Flow Rate (bpm)Proppant Conc (ppg) Meas'd Btmh (psi)
0.0 60.0 120.0 180.0 240.0 300.0 0
3000
6000
9000
12000
15000
0.0
20.0
40.0
60.0
80.0
100.0
0.00
10.00
20.00
30.00
40.00
50.00
0
3000
6000
9000
12000
15000
Figure 50. Treatment data: Jennings Ranch C-10 Lobo 6
Jennings Ranch C-10Closure Analysis
Lobo 6 12-8-1999
G Function Time
Meas'd Btmh (psi) (d/dG) Meas'd Btmh (psi)(G·d/dG) Meas'd Btmh (psi)
0.000 0.260 0.520 0.780 1.040 1.300 10200
10400
10600
10800
11000
11200
0
200
400
600
800
1000
0
200
400
600
800
1000
BH Closure Stress: 10709 psiClosure Stress Gradient: 0.871 psi/ftSurf Closure Pressure: 5415 psiClosure Time: 25.7 minPump Time: 43.9 minImplied Slurry Efficiency: 30.5 %Estimated Net Pressure: 394 psi
Closure
Figure 51. Closure analysis: Jennings Ranch C-10 Lobo 6
Stimulation Technologies for Deep Well Completions DE-FC26-02NT41663
4. Case History of Hydraulic Fracturing in Jennings Ranch Field, TX
Pinnacle Technologies, Inc. 77
Jennings Ranch C-10Stepdown Test Analysis
Lobo 6 12-8-1999
Pumping Rate (bpm)
Observed Fric (psi) Est. NWB Friction (psi)Est. Perf Friction (psi)
0.00 10.00 20.00 30.00 40.00 50.00 0.0
100.0
200.0
300.0
400.0
500.0
0.0
100.0
200.0
300.0
400.0
500.0
0.0
100.0
200.0
300.0
400.0
500.0
@ 25 bpmNWB= 190 psiPERF= 100 psi
Figure 52. Step-down test analysis: Jennings Ranch C-10 Lobo 6
Jennings Ranch C-10Net Pressure Match
Lobo 6 12-8-1999
Time (min)
Net Pressure (psi) Observed Net (psi)
0.0 60.0 120.0 180.0 240.0 300.0 0
400
800
1200
1600
2000
0
400
800
1200
1600
2000
Figure 53. Net pressure match: Jennings Ranch C-10 Lobo 6
Stimulation Technologies for Deep Well Completions DE-FC26-02NT41663
4. Case History of Hydraulic Fracturing in Jennings Ranch Field, TX
Pinnacle Technologies, Inc. 78
Jennnings C-10 Lobo 6
12000
12100
12200
12300
12400
12500
12600
20 200GR
Logs : Jennings c-10.las
12000
12100
12200
12300
12400
12500
12600
Rocktype
FracproPT Layer Properties
Shale
Shale
Shale
Shale
Sandstone
Sandstone
Sandstone
Shale
Shale
Shale
Shale
Shale
Shale
100 200 300 400 500 600
Concentration of Proppant in Fracture (lb/ft²)
0 0.15 0.30 0.45 0.60 0.75 0.90 1.1 1.2 1.4 1.5
Proppant Concentration (lb/ft²)
Fracture Length (ft)Propped Length (ft)Total Fracture Height (ft)Total Propped Height (ft)
486.6 486.6 194.3 193.8
Figure 54. Model fracture geometry: Jennings Ranch C-10 Lobo 6
Jennings Ranch C-10Production Log-Log Plot
Lobo 6 12-8-1999
Time (days)
Production Gas Rate (Mscf/d)
2.000 20.00 200.0 2000 10
100
1000
10000
Linear Flow
Figure 55. Log-log diagnostic plot of well production: Jennings Ranch C-10 Lobo 6
Stimulation Technologies for Deep Well Completions DE-FC26-02NT41663
4. Case History of Hydraulic Fracturing in Jennings Ranch Field, TX
Pinnacle Technologies, Inc. 79
Jennings Ranch C-10Production Match: Frac Model & Stress-sensitive Perm
Lobo 6 12-8-1999
Time (days)
Calc'd Btm Press (psi) Production Btm Pres (psi)
0 300 600 900 1200 1500 0
1600
3200
4800
6400
8000
0
1600
3200
4800
6400
8000
Time (days)
Production Gas Rate (Mscf/d) HC Rate (Mscf/d)
0 300 600 900 1200 1500 0
1600
3200
4800
6400
8000
0
1600
3200
4800
6400
8000
BEST MATCH
k=0.09 md, DA= 70 ac.
Figure 56. Best production match using frac model length and stress-sensitive permeability: Jennings Ranch C-10 Lobo 6
Jennings Ranch C-10Production Match: Frac Model - Constant Permeability
Lobo 6 12-8-1999
Time (days)
Calc'd Btm Press (psi) Production Btm Pres (psi)
0 300 600 900 1200 1500 0
1600
3200
4800
6400
8000
0
1600
3200
4800
6400
8000
Time (days)
Production Gas Rate (Mscf/d) HC Rate (Mscf/d)
0 300 600 900 1200 1500 0
1600
3200
4800
6400
8000
0
1600
3200
4800
6400
8000
Model
Figure 57. Production match using model frac length and constant permeability: Jennings Ranch C-10 Lobo 6
Stimulation Technologies for Deep Well Completions DE-FC26-02NT41663
4. Case History of Hydraulic Fracturing in Jennings Ranch Field, TX
Pinnacle Technologies, Inc. 80
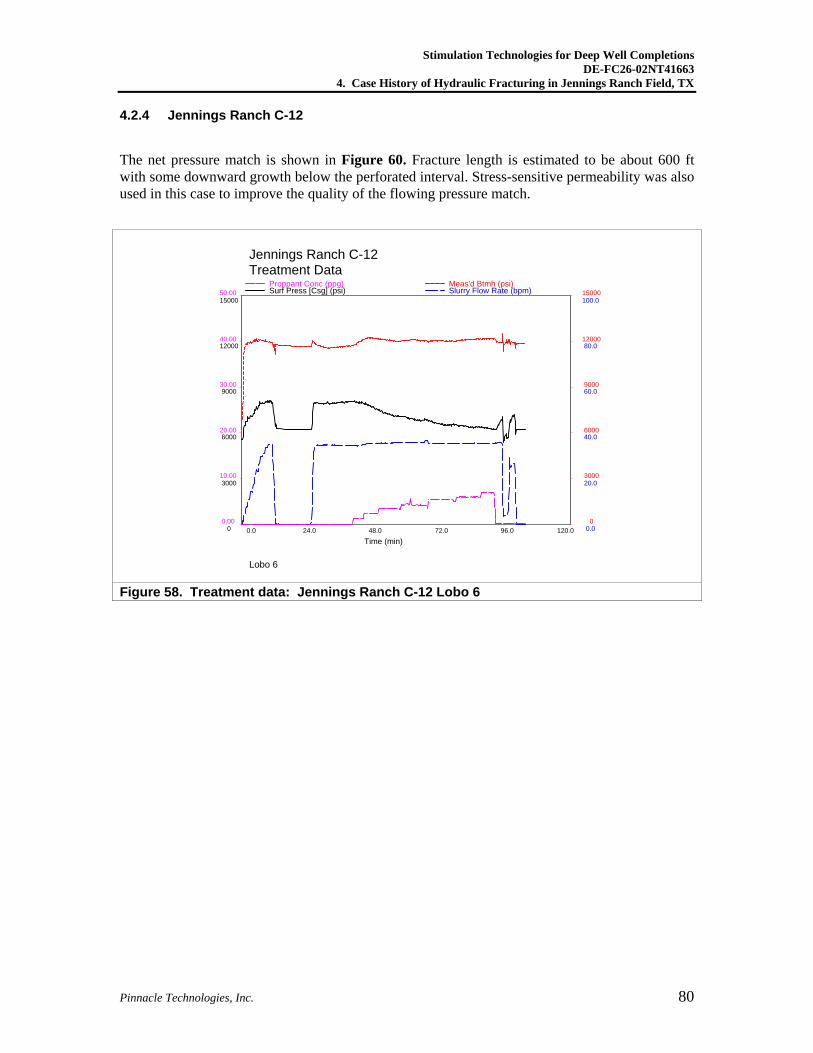
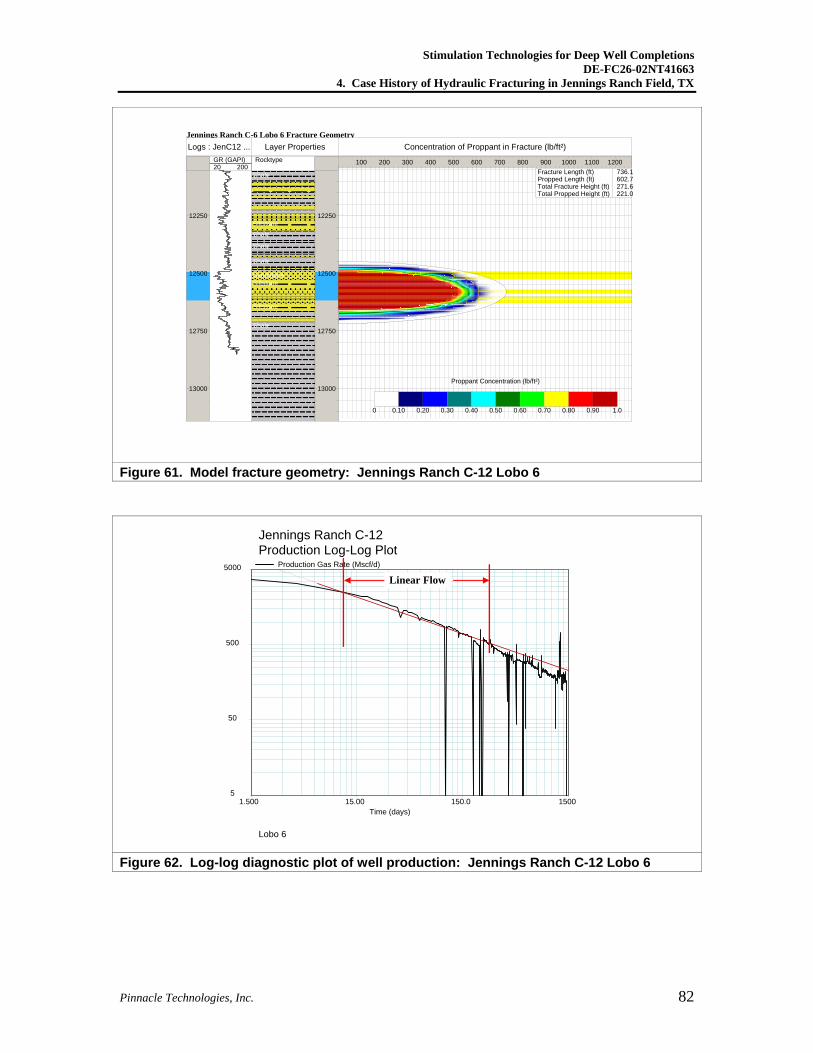
4.2.4 Jennings Ranch C-12
The net pressure match is shown in Figure 60. Fracture length is estimated to be about 600 ft with some downward growth below the perforated interval. Stress-sensitive permeability was also used in this case to improve the quality of the flowing pressure match.
Jennings Ranch C-12Treatment Data
Lobo 6
Time (min)
Surf Press [Csg] (psi) Slurry Flow Rate (bpm)Proppant Conc (ppg) Meas'd Btmh (psi)
0.0 24.0 48.0 72.0 96.0 120.0 0
3000
6000
9000
12000
15000
0.0
20.0
40.0
60.0
80.0
100.0
0.00
10.00
20.00
30.00
40.00
50.00
0
3000
6000
9000
12000
15000
Figure 58. Treatment data: Jennings Ranch C-12 Lobo 6
Stimulation Technologies for Deep Well Completions DE-FC26-02NT41663
4. Case History of Hydraulic Fracturing in Jennings Ranch Field, TX
Pinnacle Technologies, Inc. 81
Jennings Ranch C-12Closure Analysis
Lobo 6
G Function Time
Meas'd Btmh (psi) (d/dG) Meas'd Btmh (psi)(G·d/dG) Meas'd Btmh (psi)
0.000 0.300 0.600 0.900 1.200 1.500 0
2700
5400
8100
10800
13500
0
200
400
600
800
1000
0.0
40.0
80.0
120.0
160.0
200.0
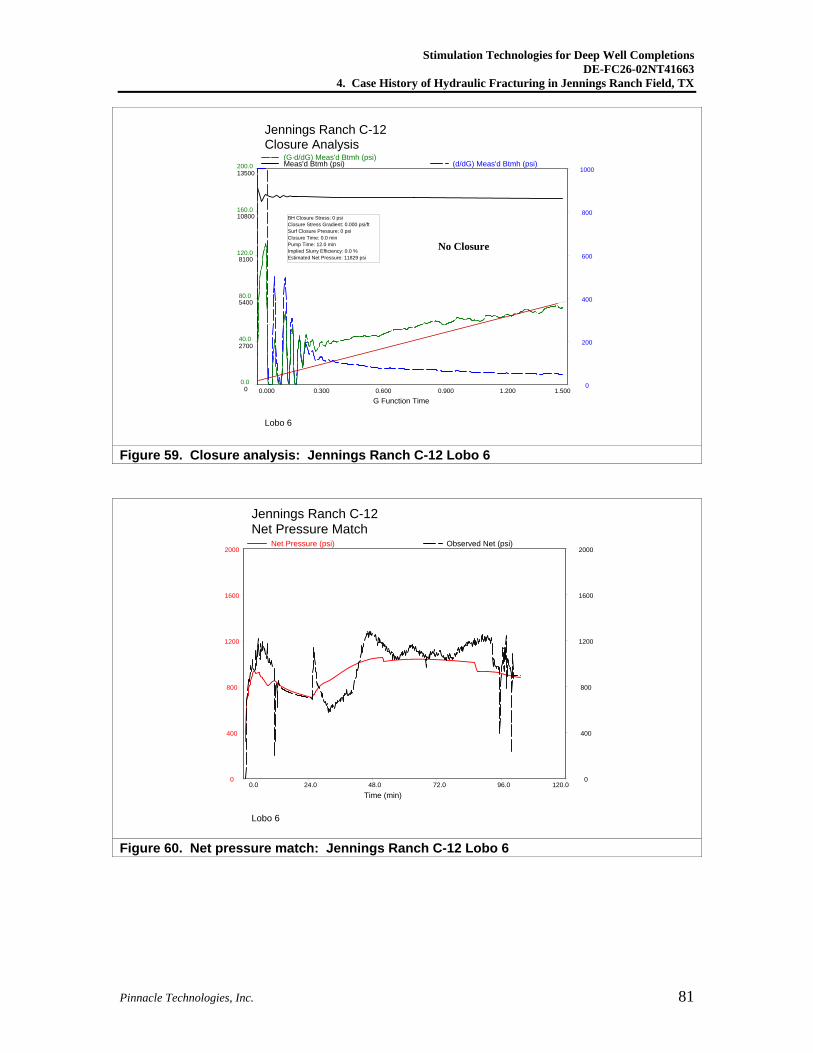
BH Closure Stress: 0 psiClosure Stress Gradient: 0.000 psi/ftSurf Closure Pressure: 0 psiClosure Time: 0.0 minPump Time: 12.0 minImplied Slurry Efficiency: 0.0 %Estimated Net Pressure: 11829 psi
No Closure
Figure 59. Closure analysis: Jennings Ranch C-12 Lobo 6
Jennings Ranch C-12Net Pressure Match
Lobo 6
Time (min)
Net Pressure (psi) Observed Net (psi)
0.0 24.0 48.0 72.0 96.0 120.0 0
400
800
1200
1600
2000
0
400
800
1200
1600
2000
Figure 60. Net pressure match: Jennings Ranch C-12 Lobo 6
Stimulation Technologies for Deep Well Completions DE-FC26-02NT41663
4. Case History of Hydraulic Fracturing in Jennings Ranch Field, TX
Pinnacle Technologies, Inc. 82
Jennings Ranch C-6 Lobo 6 Fracture Geometry
12250
12500
12750
13000
20 200GR (GAPI)
Logs : JenC12 ...
12250
12500
12750
13000
Rocktype
Layer Properties
Shale
SiltstoneShale
Shale
Shale
SandstoneSiltstone
Siltstone
Shale
100 200 300 400 500 600 700 800 900 1000 1100 1200
Concentration of Proppant in Fracture (lb/ft²)
0 0.10 0.20 0.30 0.40 0.50 0.60 0.70 0.80 0.90 1.0
Proppant Concentration (lb/ft²)
Fracture Length (ft)Propped Length (ft)Total Fracture Height (ft)Total Propped Height (ft)
736.1 602.7 271.6 221.0
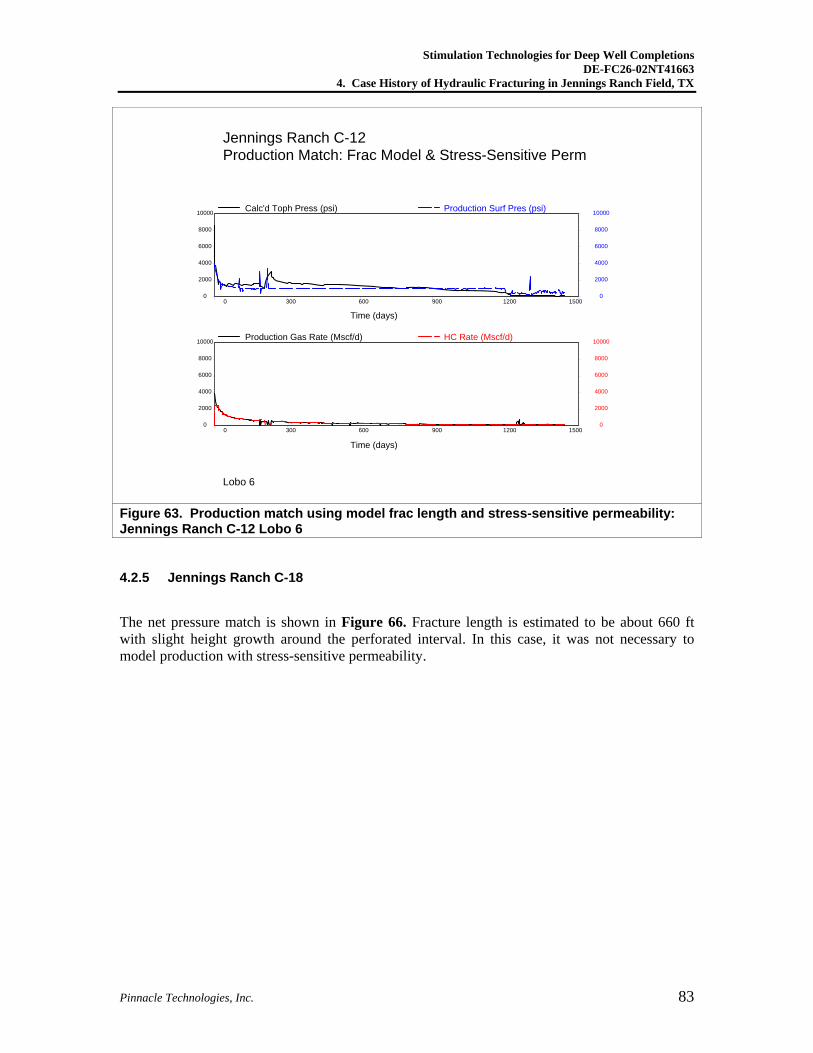
Figure 61. Model fracture geometry: Jennings Ranch C-12 Lobo 6
Jennings Ranch C-12Production Log-Log Plot
Lobo 6
Time (days)
Production Gas Rate (Mscf/d)
1.500 15.00 150.0 1500 5
50
500
5000
Linear Flow
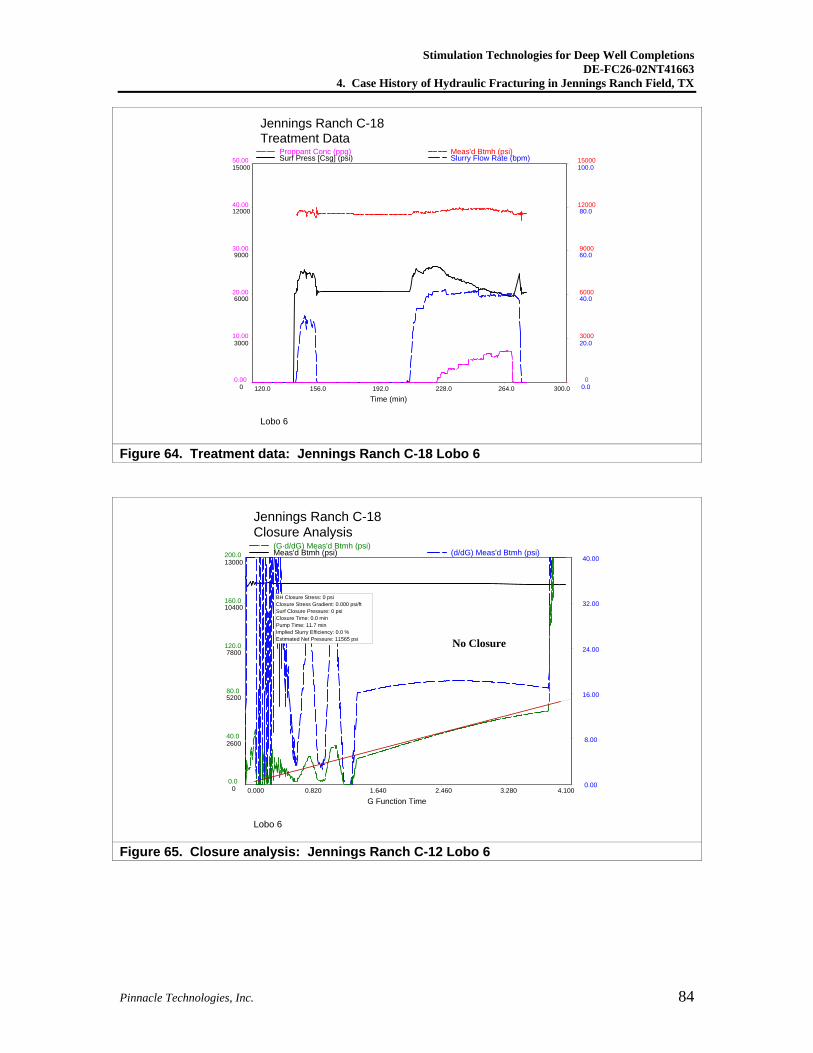
Figure 62. Log-log diagnostic plot of well production: Jennings Ranch C-12 Lobo 6
Stimulation Technologies for Deep Well Completions DE-FC26-02NT41663
4. Case History of Hydraulic Fracturing in Jennings Ranch Field, TX
Pinnacle Technologies, Inc. 83
Jennings Ranch C-12Production Match: Frac Model & Stress-Sensitive Perm
Lobo 6
Time (days)
Calc'd Toph Press (psi) Production Surf Pres (psi)
0 300 600 900 1200 1500 0
2000
4000
6000
8000
10000
0
2000
4000
6000
8000
10000
Time (days)
Production Gas Rate (Mscf/d) HC Rate (Mscf/d)
0 300 600 900 1200 1500 0
2000
4000
6000
8000
10000
0
2000
4000
6000
8000
10000
Figure 63. Production match using model frac length and stress-sensitive permeability: Jennings Ranch C-12 Lobo 6
4.2.5 Jennings Ranch C-18
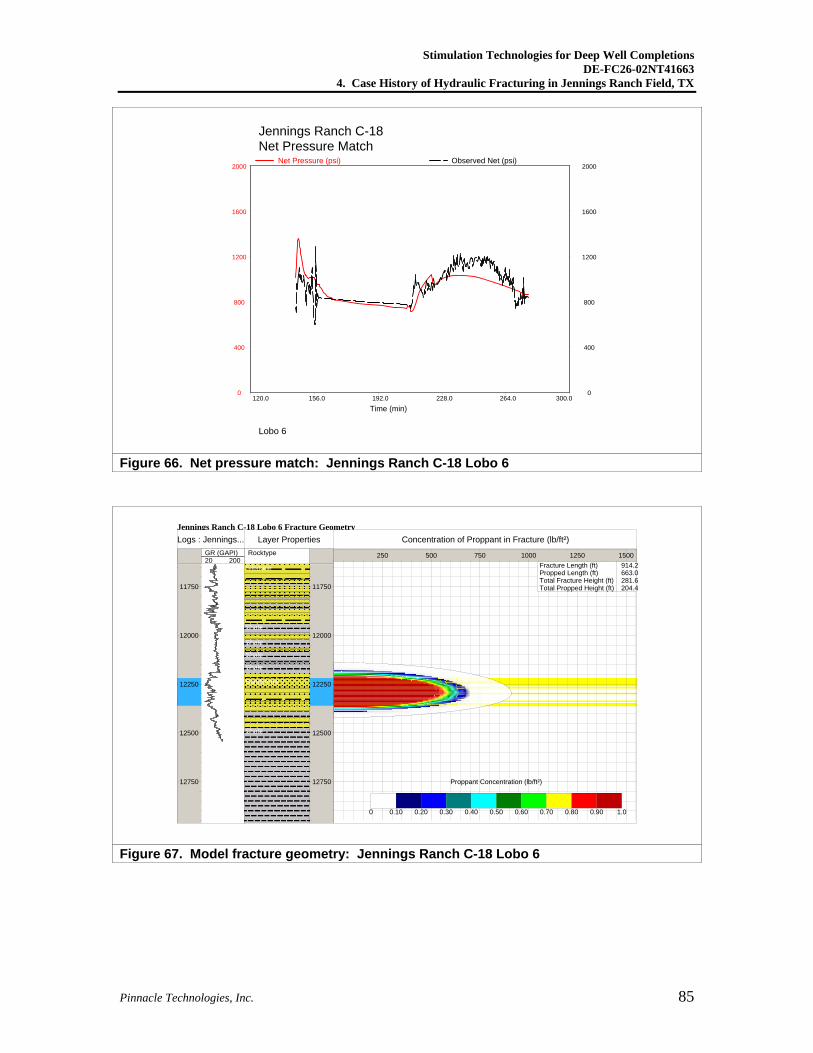
The net pressure match is shown in Figure 66. Fracture length is estimated to be about 660 ft with slight height growth around the perforated interval. In this case, it was not necessary to model production with stress-sensitive permeability.
Stimulation Technologies for Deep Well Completions DE-FC26-02NT41663
4. Case History of Hydraulic Fracturing in Jennings Ranch Field, TX
Pinnacle Technologies, Inc. 84
Jennings Ranch C-18Treatment Data
Lobo 6
Time (min)
Surf Press [Csg] (psi) Slurry Flow Rate (bpm)Proppant Conc (ppg) Meas'd Btmh (psi)
120.0 156.0 192.0 228.0 264.0 300.0 0
3000
6000
9000
12000
15000
0.0
20.0
40.0
60.0
80.0
100.0
0.00
10.00
20.00
30.00
40.00
50.00
0
3000
6000
9000
12000
15000
Figure 64. Treatment data: Jennings Ranch C-18 Lobo 6
Jennings Ranch C-18Closure Analysis
Lobo 6
G Function Time
Meas'd Btmh (psi) (d/dG) Meas'd Btmh (psi)(G·d/dG) Meas'd Btmh (psi)
0.000 0.820 1.640 2.460 3.280 4.100 0
2600
5200
7800
10400
13000
0.00
8.00
16.00
24.00
32.00
40.00
0.0
40.0
80.0
120.0
160.0
200.0
BH Closure Stress: 0 psiClosure Stress Gradient: 0.000 psi/ftSurf Closure Pressure: 0 psiClosure Time: 0.0 minPump Time: 11.7 minImplied Slurry Efficiency: 0.0 %Estimated Net Pressure: 11565 psi No Closure
Figure 65. Closure analysis: Jennings Ranch C-12 Lobo 6
Stimulation Technologies for Deep Well Completions DE-FC26-02NT41663
4. Case History of Hydraulic Fracturing in Jennings Ranch Field, TX
Pinnacle Technologies, Inc. 85
Jennings Ranch C-18Net Pressure Match
Lobo 6
Time (min)
Net Pressure (psi) Observed Net (psi)
120.0 156.0 192.0 228.0 264.0 300.0 0
400
800
1200
1600
2000
0
400
800
1200
1600
2000
Figure 66. Net pressure match: Jennings Ranch C-18 Lobo 6
Jennings Ranch C-18 Lobo 6 Fracture Geometry
11750
12000
12250
12500
12750
20 200GR (GAPI)
Logs : Jennings...
11750
12000
12250
12500
12750
Rocktype
Layer Properties
Siltstone
Shale
Shale
Shale
Shale
Sandstone
Shale
250 500 750 1000 1250 1500
Concentration of Proppant in Fracture (lb/ft²)
0 0.10 0.20 0.30 0.40 0.50 0.60 0.70 0.80 0.90 1.0
Proppant Concentration (lb/ft²)
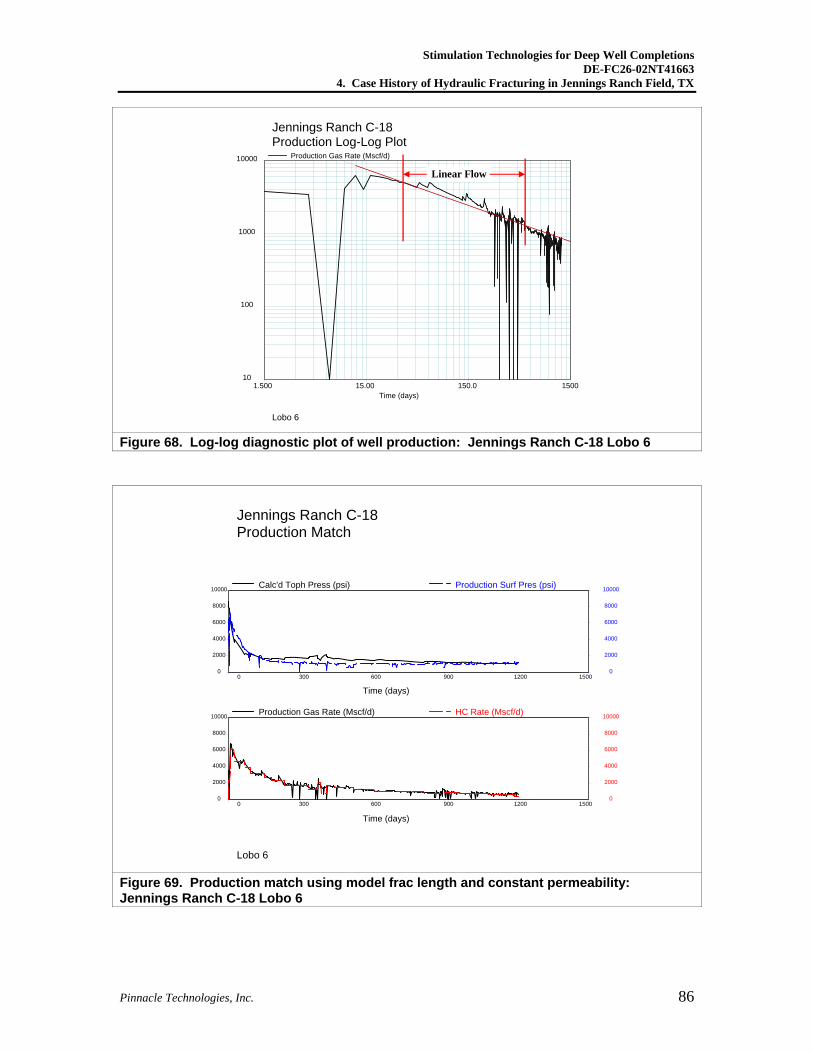
Fracture Length (ft)Propped Length (ft)Total Fracture Height (ft)Total Propped Height (ft)
914.2 663.0 281.6 204.4
Figure 67. Model fracture geometry: Jennings Ranch C-18 Lobo 6
Stimulation Technologies for Deep Well Completions DE-FC26-02NT41663
4. Case History of Hydraulic Fracturing in Jennings Ranch Field, TX
Pinnacle Technologies, Inc. 86
Jennings Ranch C-18Production Log-Log Plot
Lobo 6
Time (days)
Production Gas Rate (Mscf/d)
1.500 15.00 150.0 1500 10
100
1000
10000
Linear Flow
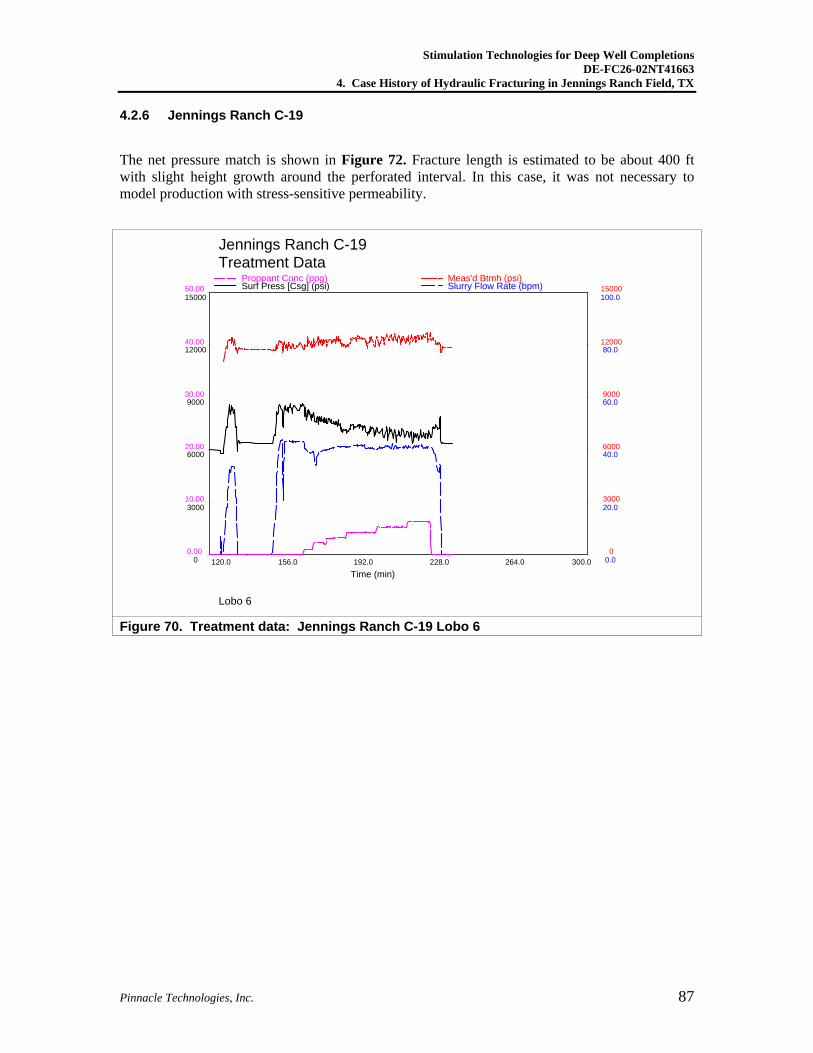
Figure 68. Log-log diagnostic plot of well production: Jennings Ranch C-18 Lobo 6
Jennings Ranch C-18Production Match
Lobo 6
Time (days)
Calc'd Toph Press (psi) Production Surf Pres (psi)
0 300 600 900 1200 1500 0
2000
4000
6000
8000
10000
0
2000
4000
6000
8000
10000
Time (days)
Production Gas Rate (Mscf/d) HC Rate (Mscf/d)
0 300 600 900 1200 1500 0
2000
4000
6000
8000
10000
0
2000
4000
6000
8000
10000
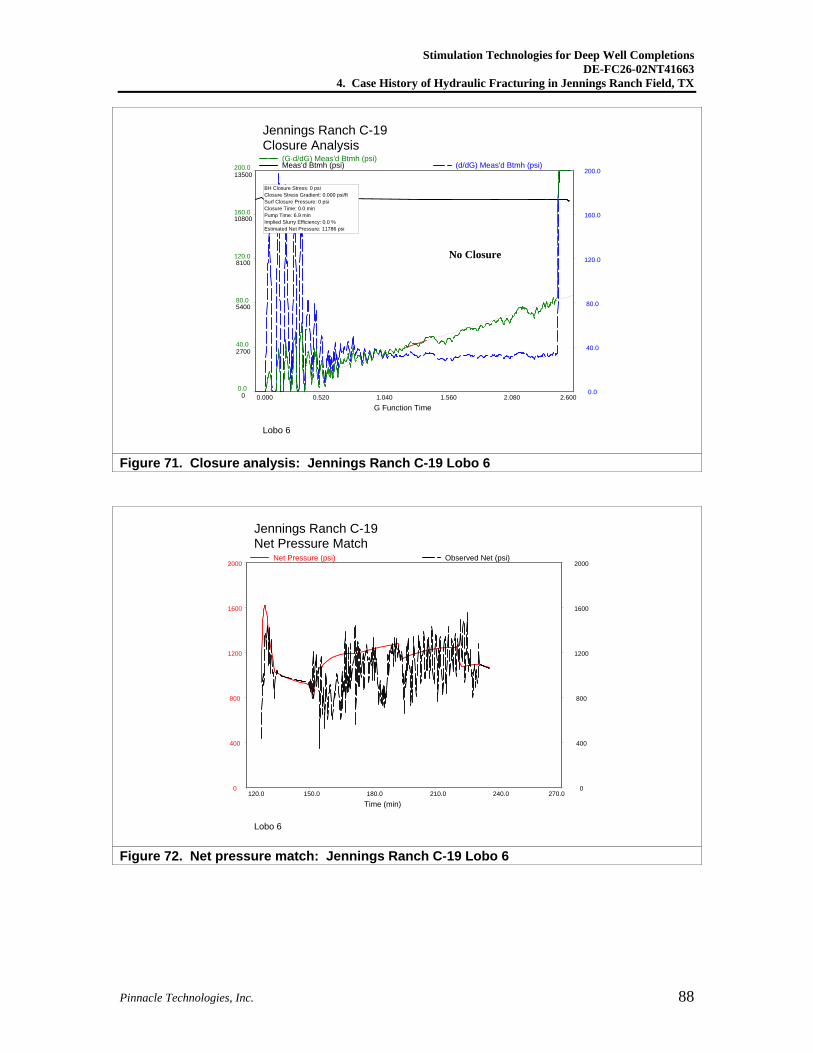
Figure 69. Production match using model frac length and constant permeability: Jennings Ranch C-18 Lobo 6
Stimulation Technologies for Deep Well Completions DE-FC26-02NT41663
4. Case History of Hydraulic Fracturing in Jennings Ranch Field, TX
Pinnacle Technologies, Inc. 87
4.2.6 Jennings Ranch C-19
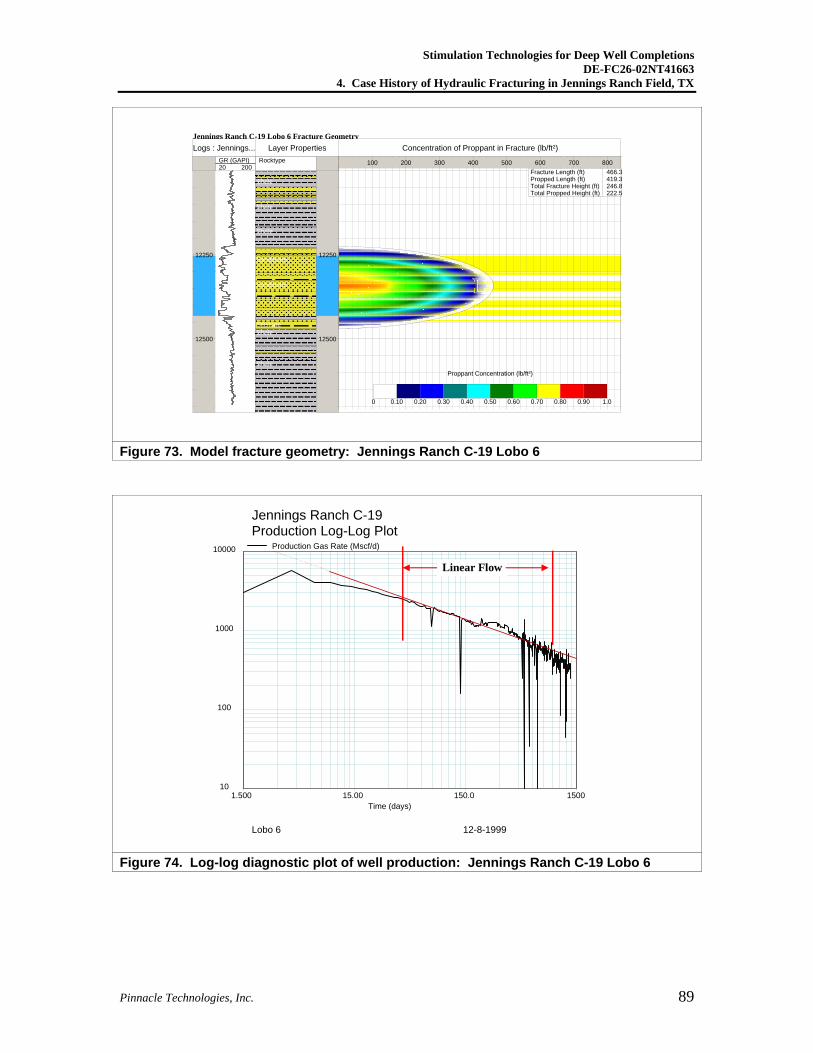
The net pressure match is shown in Figure 72. Fracture length is estimated to be about 400 ft with slight height growth around the perforated interval. In this case, it was not necessary to model production with stress-sensitive permeability.
Jennings Ranch C-19Treatment Data
Lobo 6
Time (min)
Surf Press [Csg] (psi) Slurry Flow Rate (bpm)Proppant Conc (ppg) Meas'd Btmh (psi)
120.0 156.0 192.0 228.0 264.0 300.0 0
3000
6000
9000
12000
15000
0.0
20.0
40.0
60.0
80.0
100.0
0.00
10.00
20.00
30.00
40.00
50.00
0
3000
6000
9000
12000
15000
Figure 70. Treatment data: Jennings Ranch C-19 Lobo 6
Stimulation Technologies for Deep Well Completions DE-FC26-02NT41663
4. Case History of Hydraulic Fracturing in Jennings Ranch Field, TX
Pinnacle Technologies, Inc. 88
Jennings Ranch C-19Closure Analysis
Lobo 6
G Function Time
Meas'd Btmh (psi) (d/dG) Meas'd Btmh (psi)(G·d/dG) Meas'd Btmh (psi)
0.000 0.520 1.040 1.560 2.080 2.600 0
2700
5400
8100
10800
13500
0.0
40.0
80.0
120.0
160.0
200.0
0.0
40.0
80.0
120.0
160.0
200.0
BH Closure Stress: 0 psiClosure Stress Gradient: 0.000 psi/ftSurf Closure Pressure: 0 psiClosure Time: 0.0 minPump Time: 6.9 minImplied Slurry Efficiency: 0.0 %Estimated Net Pressure: 11786 psi
No Closure
Figure 71. Closure analysis: Jennings Ranch C-19 Lobo 6
Jennings Ranch C-19Net Pressure Match
Lobo 6
Time (min)
Net Pressure (psi) Observed Net (psi)
120.0 150.0 180.0 210.0 240.0 270.0 0
400
800
1200
1600
2000
0
400
800
1200
1600
2000
Figure 72. Net pressure match: Jennings Ranch C-19 Lobo 6
Stimulation Technologies for Deep Well Completions DE-FC26-02NT41663
4. Case History of Hydraulic Fracturing in Jennings Ranch Field, TX
Pinnacle Technologies, Inc. 89
Jennings Ranch C-19 Lobo 6 Fracture Geometry
12250
12500
20 200GR (GAPI)
Logs : Jennings...
12250
12500
Rocktype
Layer Properties
Shale
Shale
Shale
Sandstone
Sandstone
SiltstoneShale
Shale
100 200 300 400 500 600 700 800
Concentration of Proppant in Fracture (lb/ft²)
0 0.10 0.20 0.30 0.40 0.50 0.60 0.70 0.80 0.90 1.0
Proppant Concentration (lb/ft²)
Fracture Length (ft)Propped Length (ft)Total Fracture Height (ft)Total Propped Height (ft)
466.3 419.3 246.8 222.5
Figure 73. Model fracture geometry: Jennings Ranch C-19 Lobo 6
Jennings Ranch C-19Production Log-Log Plot
Lobo 6 12-8-1999
Time (days)
Production Gas Rate (Mscf/d)
1.500 15.00 150.0 1500 10
100
1000
10000
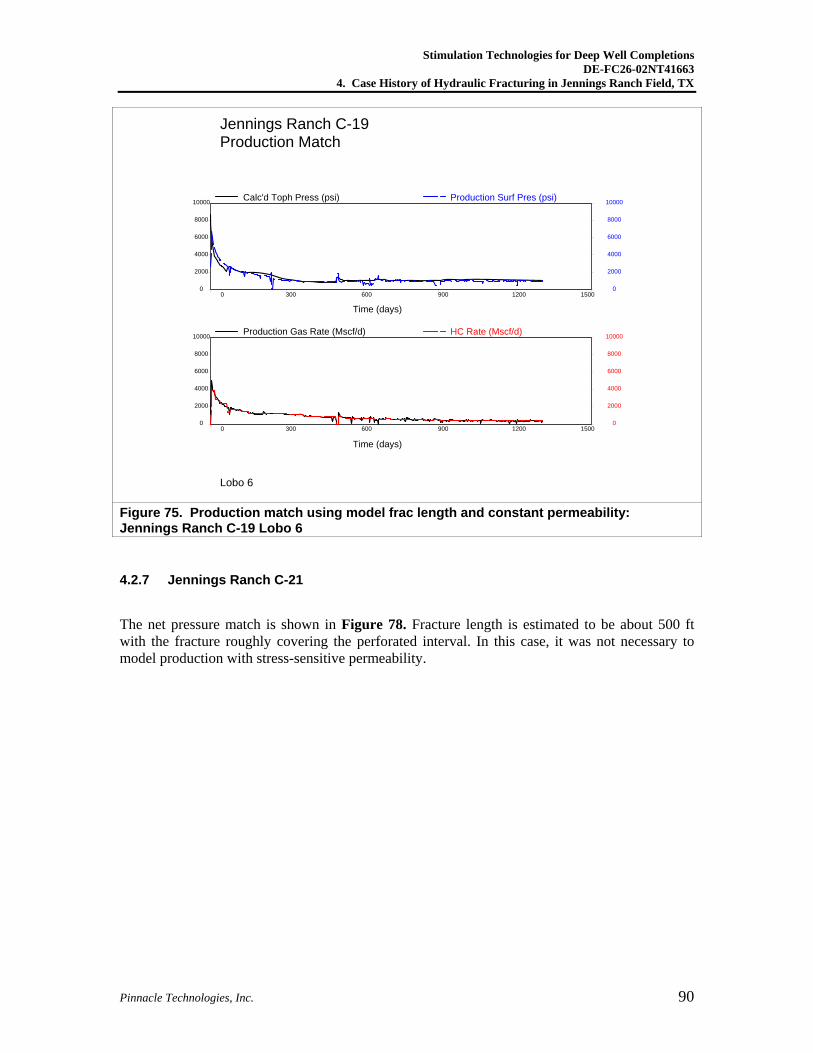
Linear Flow
Figure 74. Log-log diagnostic plot of well production: Jennings Ranch C-19 Lobo 6
Stimulation Technologies for Deep Well Completions DE-FC26-02NT41663
4. Case History of Hydraulic Fracturing in Jennings Ranch Field, TX
Pinnacle Technologies, Inc. 90
Jennings Ranch C-19Production Match
Lobo 6
Time (days)
Calc'd Toph Press (psi) Production Surf Pres (psi)
0 300 600 900 1200 1500 0
2000
4000
6000
8000
10000
0
2000
4000
6000
8000
10000
Time (days)
Production Gas Rate (Mscf/d) HC Rate (Mscf/d)
0 300 600 900 1200 1500 0
2000
4000
6000
8000
10000
0
2000
4000
6000
8000
10000
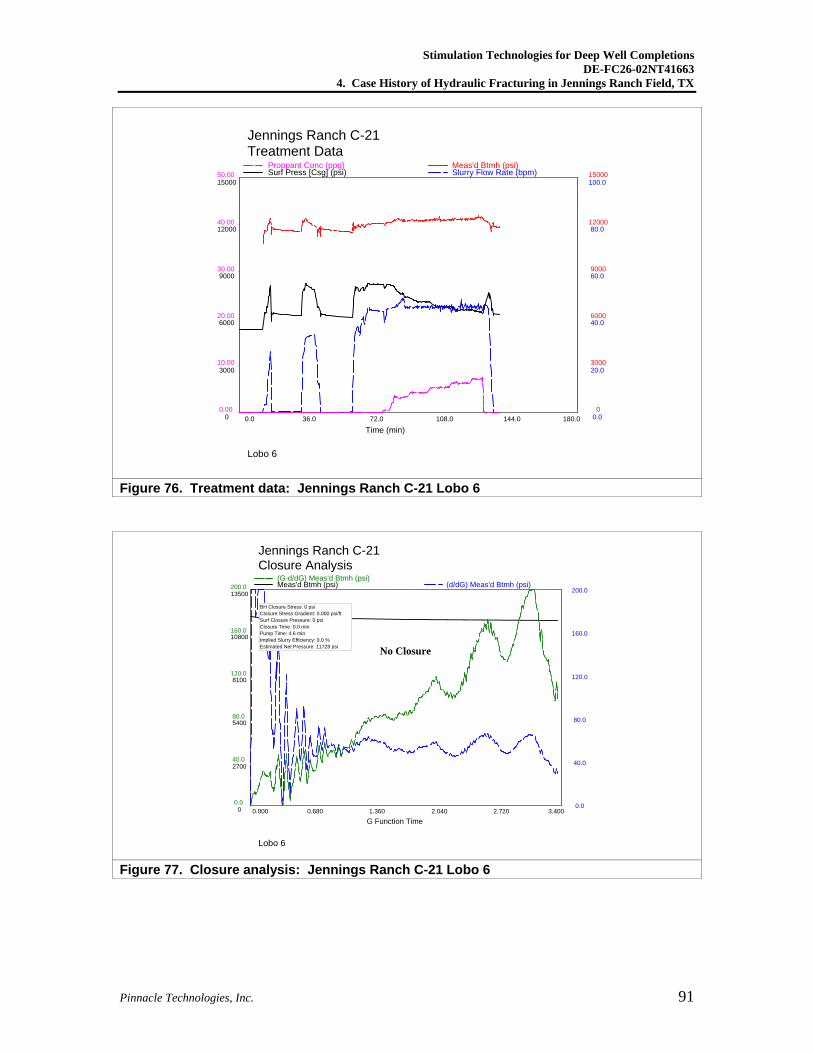
Figure 75. Production match using model frac length and constant permeability: Jennings Ranch C-19 Lobo 6
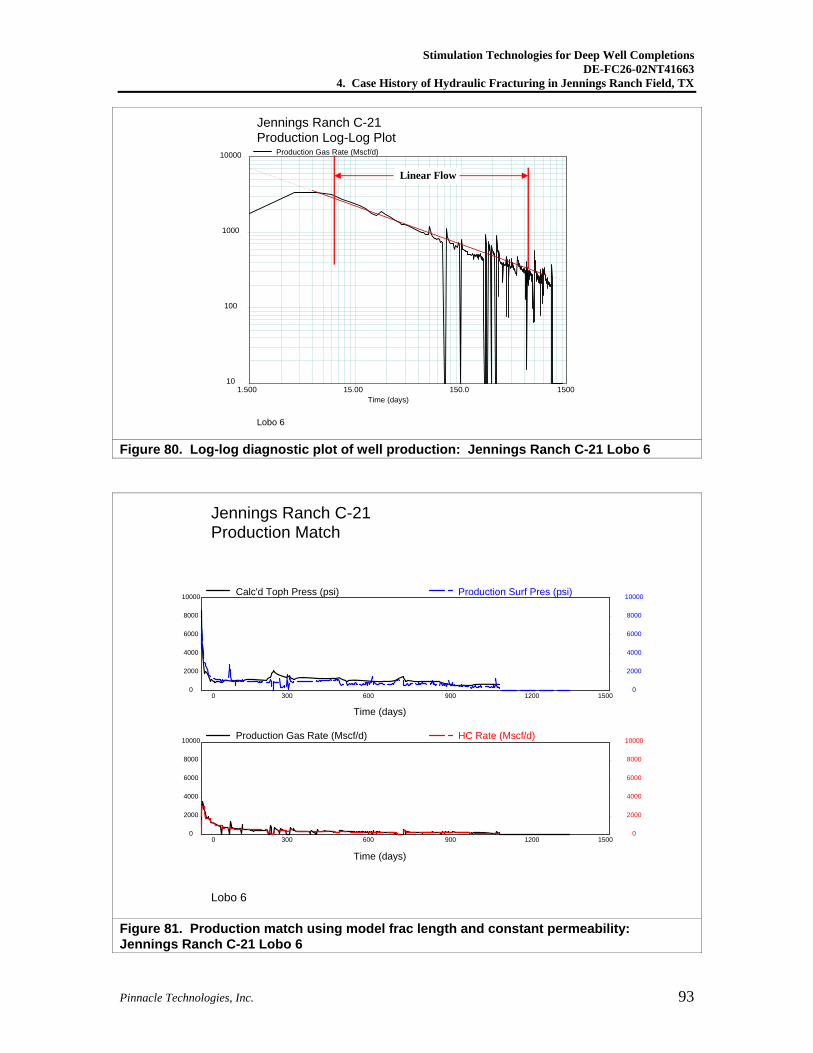
4.2.7 Jennings Ranch C-21
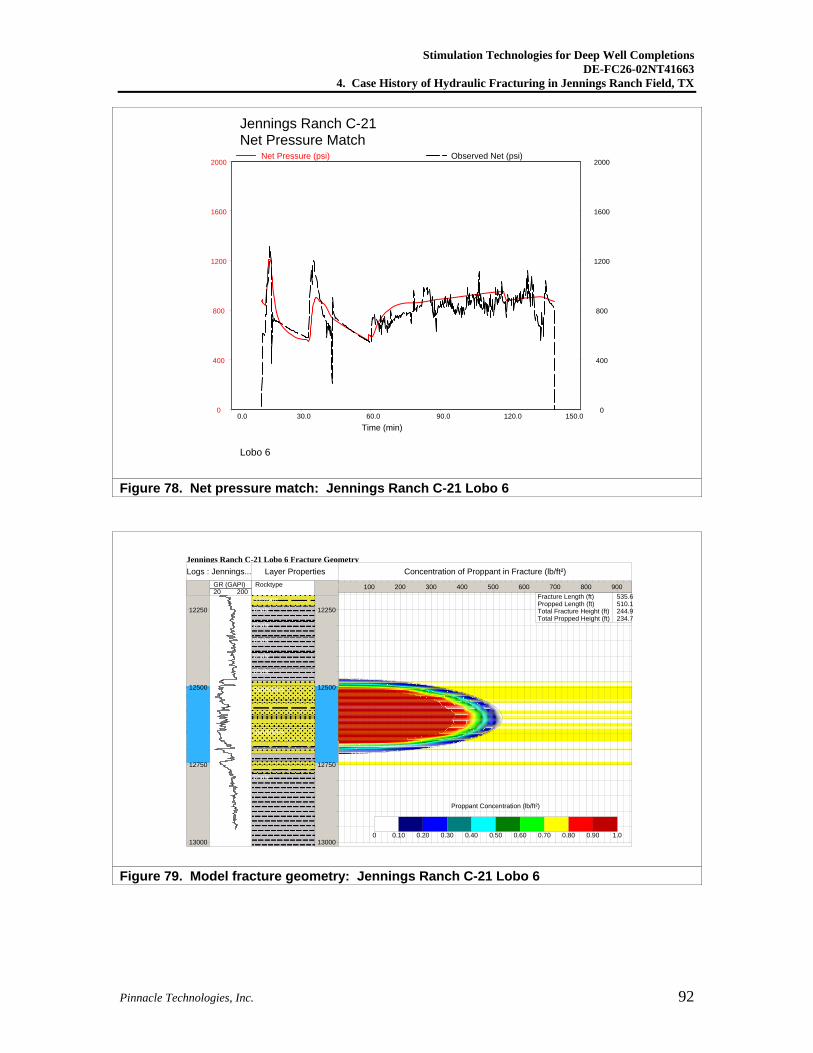
The net pressure match is shown in Figure 78. Fracture length is estimated to be about 500 ft with the fracture roughly covering the perforated interval. In this case, it was not necessary to model production with stress-sensitive permeability.
Stimulation Technologies for Deep Well Completions DE-FC26-02NT41663
4. Case History of Hydraulic Fracturing in Jennings Ranch Field, TX
Pinnacle Technologies, Inc. 91
Jennings Ranch C-21Treatment Data
Lobo 6
Time (min)
Surf Press [Csg] (psi) Slurry Flow Rate (bpm)Proppant Conc (ppg) Meas'd Btmh (psi)
0.0 36.0 72.0 108.0 144.0 180.0 0
3000
6000
9000
12000
15000
0.0
20.0
40.0
60.0
80.0
100.0
0.00
10.00
20.00
30.00
40.00
50.00
0
3000
6000
9000
12000
15000
Figure 76. Treatment data: Jennings Ranch C-21 Lobo 6
Jennings Ranch C-21Closure Analysis
Lobo 6
G Function Time
Meas'd Btmh (psi) (d/dG) Meas'd Btmh (psi)(G·d/dG) Meas'd Btmh (psi)
0.000 0.680 1.360 2.040 2.720 3.400 0
2700
5400
8100
10800
13500
0.0
40.0
80.0
120.0
160.0
200.0
0.0
40.0
80.0
120.0
160.0
200.0
BH Closure Stress: 0 psiClosure Stress Gradient: 0.000 psi/ftSurf Closure Pressure: 0 psiClosure Time: 0.0 minPump Time: 4.6 minImplied Slurry Efficiency: 0.0 %Estimated Net Pressure: 11728 psi No Closure
Figure 77. Closure analysis: Jennings Ranch C-21 Lobo 6
Stimulation Technologies for Deep Well Completions DE-FC26-02NT41663
4. Case History of Hydraulic Fracturing in Jennings Ranch Field, TX
Pinnacle Technologies, Inc. 92
Jennings Ranch C-21Net Pressure Match
Lobo 6
Time (min)
Net Pressure (psi) Observed Net (psi)
0.0 30.0 60.0 90.0 120.0 150.0 0
400
800
1200
1600
2000
0
400
800
1200
1600
2000
Figure 78. Net pressure match: Jennings Ranch C-21 Lobo 6
Jennings Ranch C-21 Lobo 6 Fracture Geometry
12250
12500
12750
13000
20 200GR (GAPI)
Logs : Jennings...
12250
12500
12750
13000
Rocktype
Layer Properties
SiltstoneShale
Shale
Shale
Shale
Shale
Sandstone
Sandstone
Shale
100 200 300 400 500 600 700 800 900
Concentration of Proppant in Fracture (lb/ft²)
0 0.10 0.20 0.30 0.40 0.50 0.60 0.70 0.80 0.90 1.0
Proppant Concentration (lb/ft²)
Fracture Length (ft)Propped Length (ft)Total Fracture Height (ft)Total Propped Height (ft)
535.6 510.1 244.9 234.7
Figure 79. Model fracture geometry: Jennings Ranch C-21 Lobo 6
Stimulation Technologies for Deep Well Completions DE-FC26-02NT41663
4. Case History of Hydraulic Fracturing in Jennings Ranch Field, TX
Pinnacle Technologies, Inc. 93
Jennings Ranch C-21Production Log-Log Plot
Lobo 6
Time (days)
Production Gas Rate (Mscf/d)
1.500 15.00 150.0 1500 10
100
1000
10000
Linear Flow
Figure 80. Log-log diagnostic plot of well production: Jennings Ranch C-21 Lobo 6
Jennings Ranch C-21Production Match
Lobo 6
Time (days)
Calc'd Toph Press (psi) Production Surf Pres (psi)
0 300 600 900 1200 1500 0
2000
4000
6000
8000
10000
0
2000
4000
6000
8000
10000
Time (days)
Production Gas Rate (Mscf/d) HC Rate (Mscf/d)
0 300 600 900 1200 1500 0
2000
4000
6000
8000
10000
0
2000
4000
6000
8000
10000
Figure 81. Production match using model frac length and constant permeability: Jennings Ranch C-21 Lobo 6
Stimulation Technologies for Deep Well Completions DE-FC26-02NT41663
4. Case History of Hydraulic Fracturing in Jennings Ranch Field, TX
Pinnacle Technologies, Inc. 94
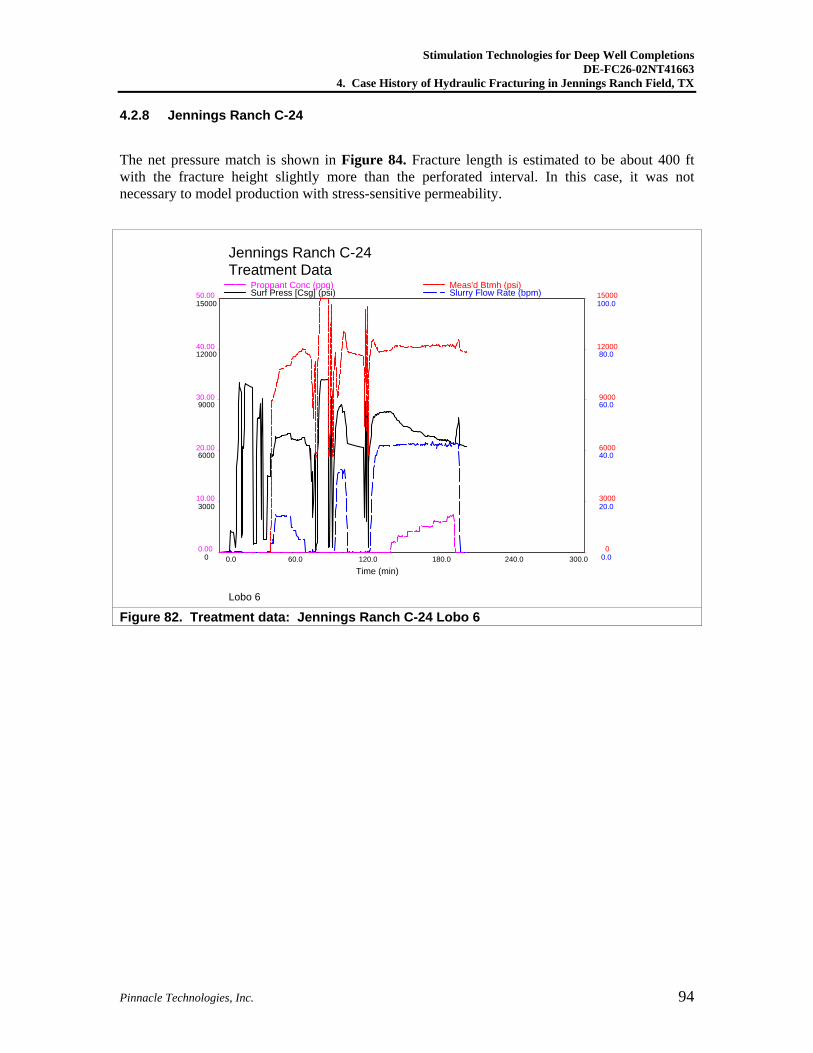
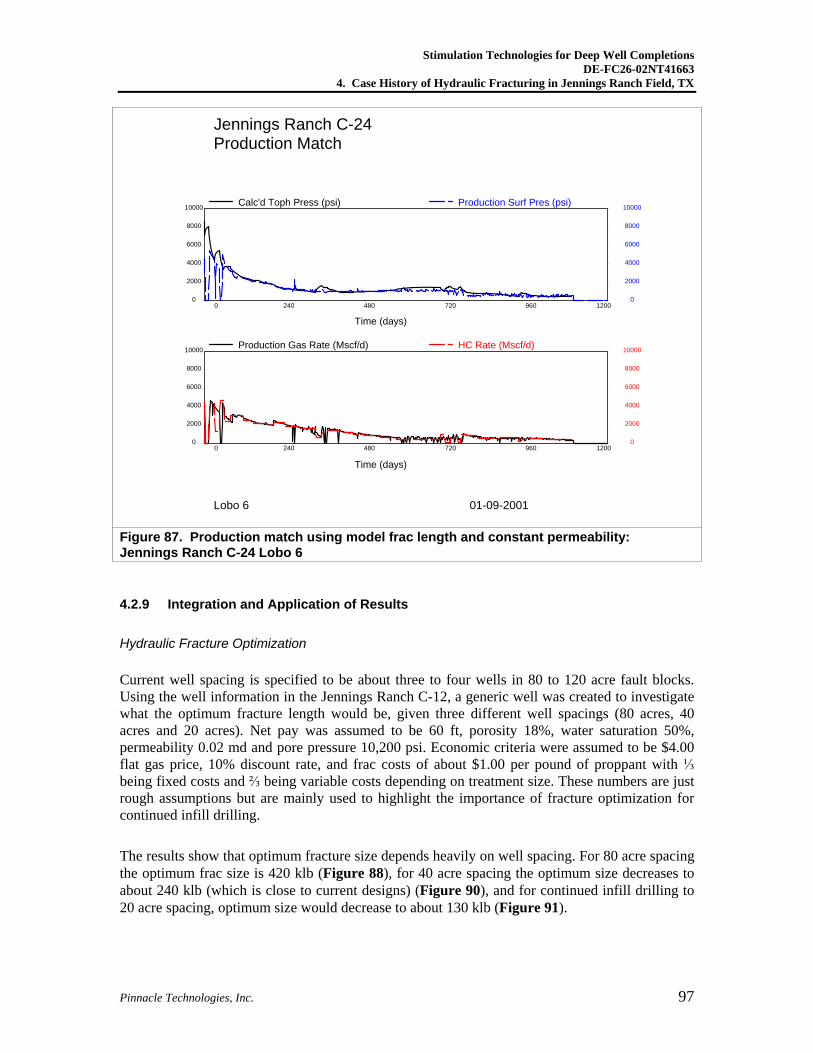
4.2.8 Jennings Ranch C-24
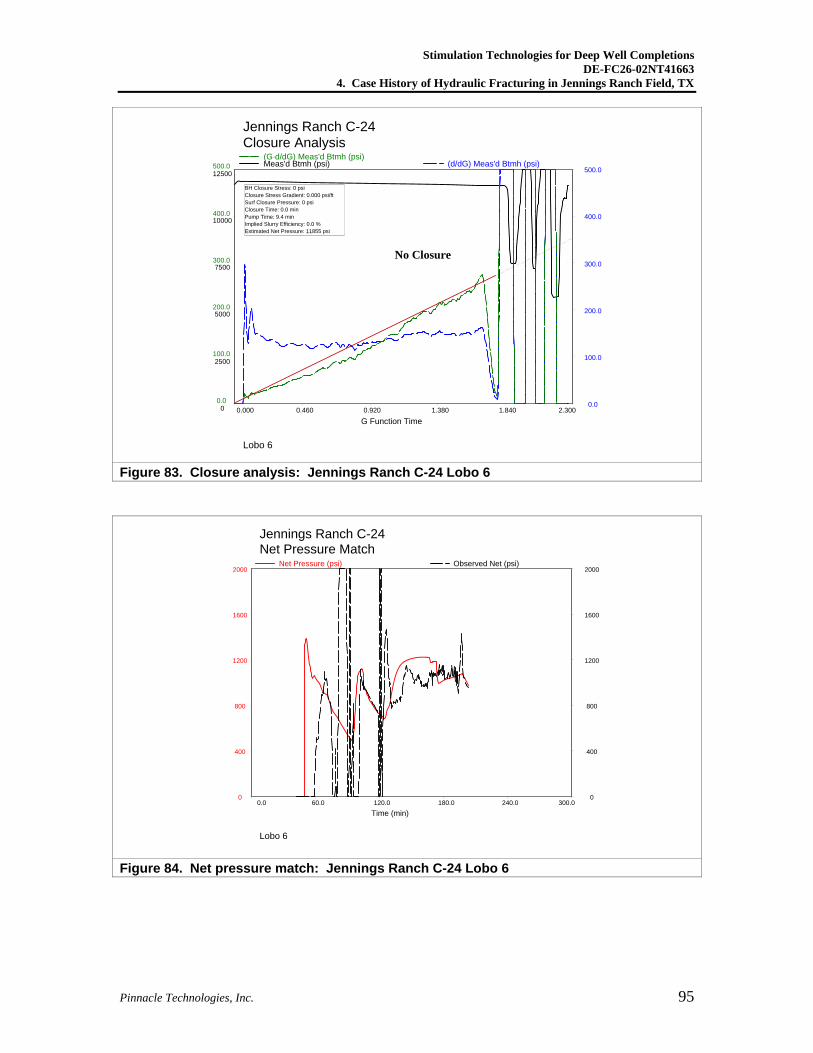
The net pressure match is shown in Figure 84. Fracture length is estimated to be about 400 ft with the fracture height slightly more than the perforated interval. In this case, it was not necessary to model production with stress-sensitive permeability.
Jennings Ranch C-24Treatment Data
Lobo 6
Time (min)
Surf Press [Csg] (psi) Slurry Flow Rate (bpm)Proppant Conc (ppg) Meas'd Btmh (psi)
0.0 60.0 120.0 180.0 240.0 300.0 0
3000
6000
9000
12000
15000
0.0
20.0
40.0
60.0
80.0
100.0
0.00
10.00
20.00
30.00
40.00
50.00
0
3000
6000
9000
12000
15000
Figure 82. Treatment data: Jennings Ranch C-24 Lobo 6
Stimulation Technologies for Deep Well Completions DE-FC26-02NT41663
4. Case History of Hydraulic Fracturing in Jennings Ranch Field, TX
Pinnacle Technologies, Inc. 95
Jennings Ranch C-24Closure Analysis
Lobo 6
G Function Time
Meas'd Btmh (psi) (d/dG) Meas'd Btmh (psi)(G·d/dG) Meas'd Btmh (psi)
0.000 0.460 0.920 1.380 1.840 2.300 0
2500
5000
7500
10000
12500
0.0
100.0
200.0
300.0
400.0
500.0
0.0
100.0
200.0
300.0
400.0
500.0
BH Closure Stress: 0 psiClosure Stress Gradient: 0.000 psi/ftSurf Closure Pressure: 0 psiClosure Time: 0.0 minPump Time: 9.4 minImplied Slurry Efficiency: 0.0 %Estimated Net Pressure: 11855 psi
No Closure
Figure 83. Closure analysis: Jennings Ranch C-24 Lobo 6
Jennings Ranch C-24Net Pressure Match
Lobo 6
Time (min)
Net Pressure (psi) Observed Net (psi)
0.0 60.0 120.0 180.0 240.0 300.0 0
400
800
1200
1600
2000
0
400
800
1200
1600
2000
Figure 84. Net pressure match: Jennings Ranch C-24 Lobo 6
Stimulation Technologies for Deep Well Completions DE-FC26-02NT41663
4. Case History of Hydraulic Fracturing in Jennings Ranch Field, TX
Pinnacle Technologies, Inc. 96
Jennings Ranch C-24 Lobo 6 Fracture Geometry
12200
12300
12400
12500
12600
12700
20 200GR (GAPI)
Logs : jennings ...
12200
12300
12400
12500
12600
12700
Rocktype
Layer Properties
Shale
Shale
Shale
Shale
Shale
Sandstone
Sandstone
Sandstone
Shale
Shale
Shale
Shale
100 200 300 400 500 600 700
Concentration of Proppant in Fracture (lb/ft²)
0 0.10 0.20 0.30 0.40 0.50 0.60 0.70 0.80 0.90 1.0
Proppant Concentration (lb/ft²)
Fracture Length (ft)Propped Length (ft)Total Fracture Height (ft)Total Propped Height (ft)
432.2 430.8 208.0 207.2
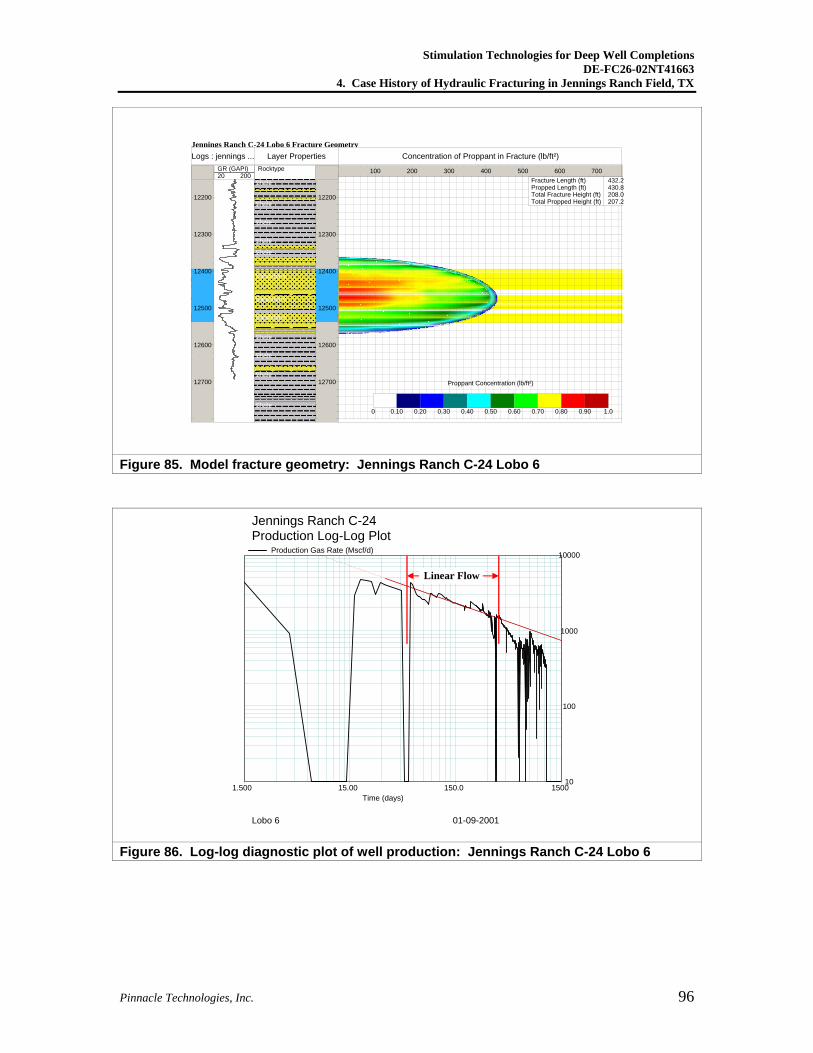
Figure 85. Model fracture geometry: Jennings Ranch C-24 Lobo 6
Jennings Ranch C-24Production Log-Log Plot
Lobo 6 01-09-2001
Time (days)
Production Gas Rate (Mscf/d)
1.500 15.00 150.0 1500 10
100
1000
10000
Linear Flow
Figure 86. Log-log diagnostic plot of well production: Jennings Ranch C-24 Lobo 6
Stimulation Technologies for Deep Well Completions DE-FC26-02NT41663
4. Case History of Hydraulic Fracturing in Jennings Ranch Field, TX
Pinnacle Technologies, Inc. 97
Jennings Ranch C-24Production Match
Lobo 6 01-09-2001
Time (days)
Calc'd Toph Press (psi) Production Surf Pres (psi)
0 240 480 720 960 1200 0
2000
4000
6000
8000
10000
0
2000
4000
6000
8000
10000
Time (days)
Production Gas Rate (Mscf/d) HC Rate (Mscf/d)
0 240 480 720 960 1200 0
2000
4000
6000
8000
10000
0
2000
4000
6000
8000
10000
Figure 87. Production match using model frac length and constant permeability: Jennings Ranch C-24 Lobo 6
4.2.9 Integration and Application of Results
Hydraulic Fracture Optimization
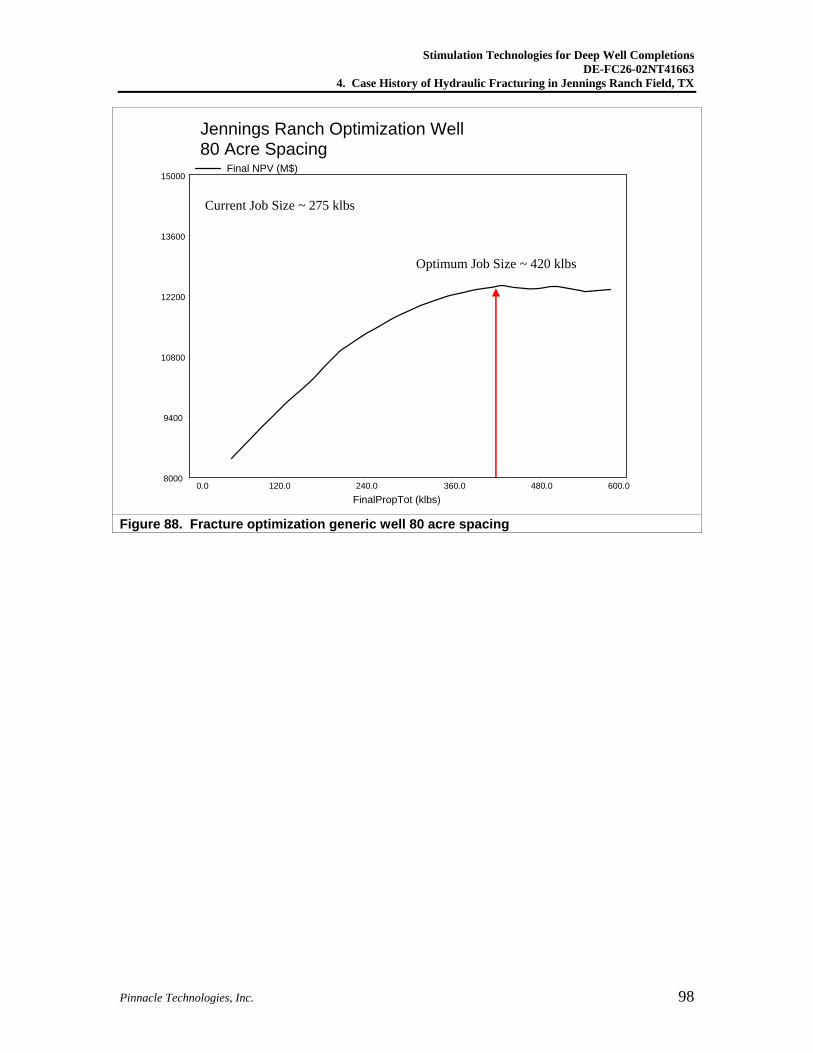
Current well spacing is specified to be about three to four wells in 80 to 120 acre fault blocks. Using the well information in the Jennings Ranch C-12, a generic well was created to investigate what the optimum fracture length would be, given three different well spacings (80 acres, 40 acres and 20 acres). Net pay was assumed to be 60 ft, porosity 18%, water saturation 50%, permeability 0.02 md and pore pressure 10,200 psi. Economic criteria were assumed to be $4.00 flat gas price, 10% discount rate, and frac costs of about $1.00 per pound of proppant with ⅓ being fixed costs and ⅔ being variable costs depending on treatment size. These numbers are just rough assumptions but are mainly used to highlight the importance of fracture optimization for continued infill drilling.
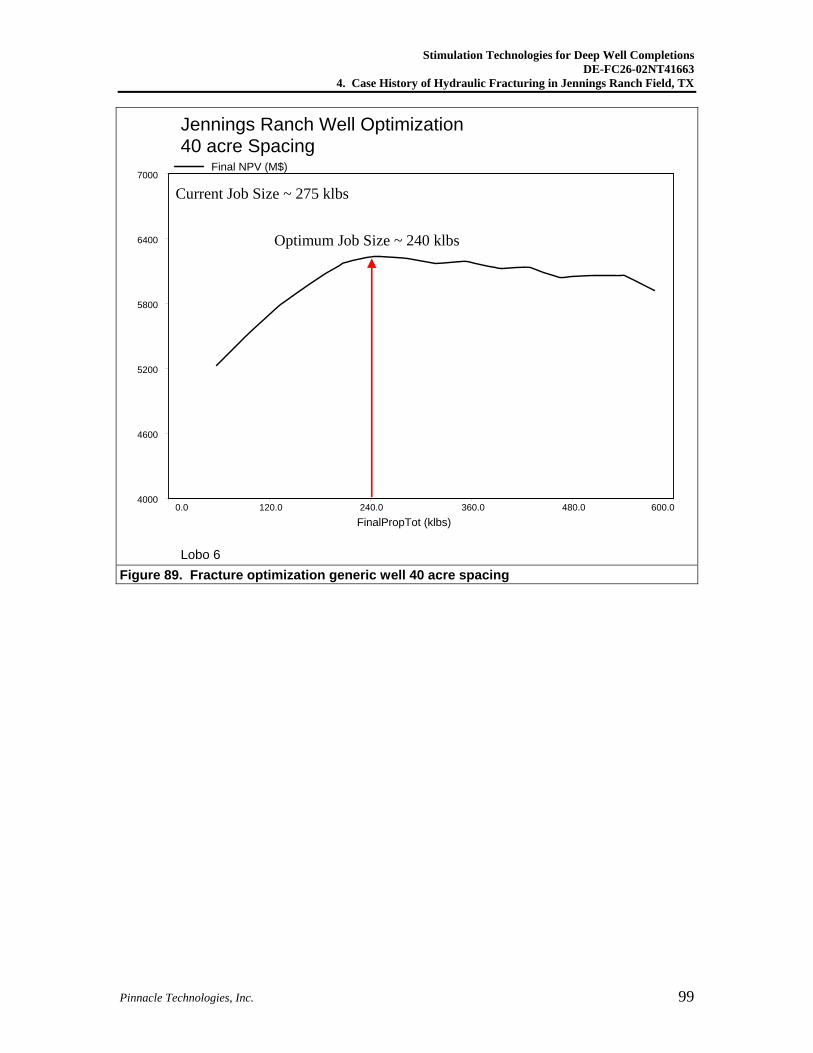
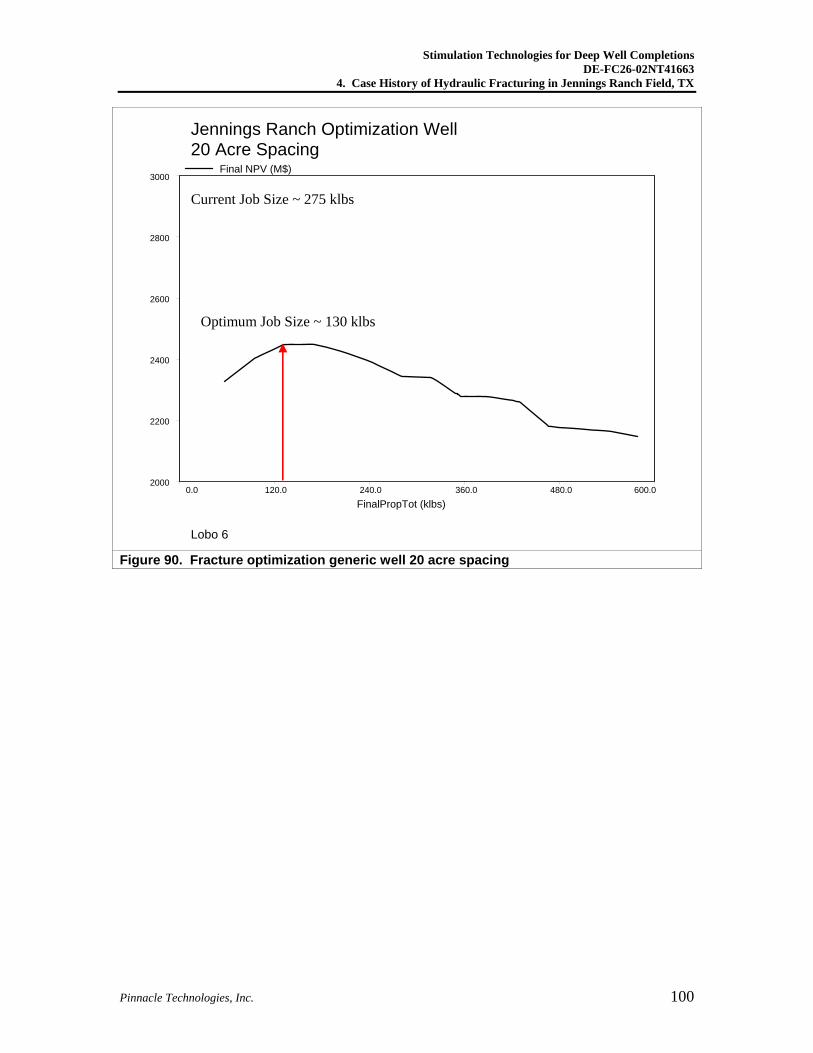
The results show that optimum fracture size depends heavily on well spacing. For 80 acre spacing the optimum frac size is 420 klb (Figure 88), for 40 acre spacing the optimum size decreases to about 240 klb (which is close to current designs) (Figure 90), and for continued infill drilling to 20 acre spacing, optimum size would decrease to about 130 klb (Figure 91).
Stimulation Technologies for Deep Well Completions DE-FC26-02NT41663
4. Case History of Hydraulic Fracturing in Jennings Ranch Field, TX
Pinnacle Technologies, Inc. 98
Jennings Ranch Optimization Well80 Acre Spacing
FinalPropTot (klbs)
Final NPV (M$)
0.0 120.0 240.0 360.0 480.0 600.0 8000
9400
10800
12200
13600
15000
Optimum Job Size ~ 420 klbs
Current Job Size ~ 275 klbs
Figure 88. Fracture optimization generic well 80 acre spacing
Stimulation Technologies for Deep Well Completions DE-FC26-02NT41663
4. Case History of Hydraulic Fracturing in Jennings Ranch Field, TX
Pinnacle Technologies, Inc. 99
Jennings Ranch Well Optimization40 acre Spacing
Lobo 6
FinalPropTot (klbs)
Final NPV (M$)
0.0 120.0 240.0 360.0 480.0 600.0 4000
4600
5200
5800
6400
7000
Optimum Job Size ~ 240 klbs
Current Job Size ~ 275 klbs
Figure 89. Fracture optimization generic well 40 acre spacing
Stimulation Technologies for Deep Well Completions DE-FC26-02NT41663
4. Case History of Hydraulic Fracturing in Jennings Ranch Field, TX
Pinnacle Technologies, Inc. 100
Jennings Ranch Optimization Well20 Acre Spacing
Lobo 6
FinalPropTot (klbs)
Final NPV (M$)
0.0 120.0 240.0 360.0 480.0 600.0 2000
2200
2400
2600
2800
3000
Current Job Size ~ 275 klbs
Optimum Job Size ~ 130 klbs
Figure 90. Fracture optimization generic well 20 acre spacing
Stimulation Technologies for Deep Well Completions DE-FC26-02NT41663
5. Case History of Hydraulic Fracturing in Table Rock Field, WY
Pinnacle Technologies, Inc. 101
5. Case History of Hydraulic Fracturing in Table Rock Field, Wyoming
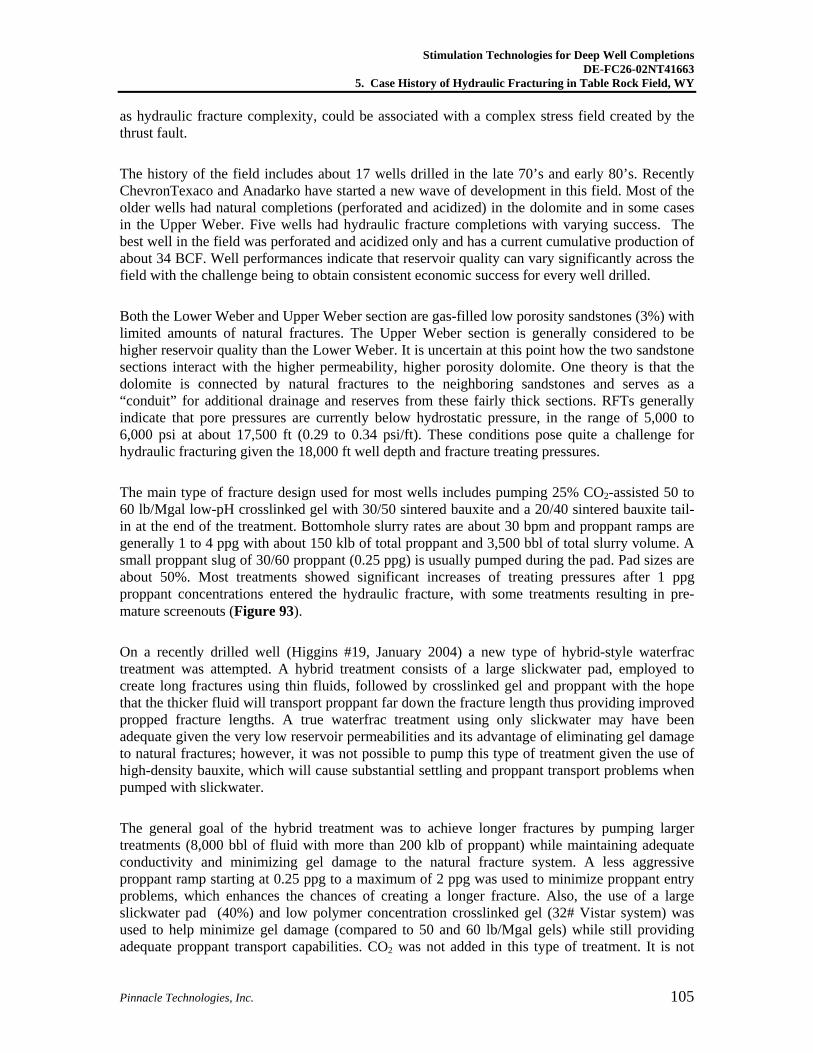
This study focused on three deep gas productive targets in the Table Rock Field in Wyoming. The primary target is a higher permeability dolomite layer (20 to 30 ft thick) surrounded by thick (150 to 200 ft) low permeability/porosity sandstones (secondary targets) designated as the Lower Weber (below dolomite), and Upper Weber (above dolomite) at depths of roughly 17,300 to 18,100 ft. While the dolomite provides the majority of the gas flow rate (75 to 90% of total without hydraulic fracturing), it is limited in reserves due to its smaller thickness. The Weber Sands, on the other hand, are very thick and potentially contain vast amounts of gas reserves but are limited in flow rate and require hydraulic fracture stimulation. Natural fractures are believed to play a role in the production of both Weber Sands and Dolomite. One theory is that the dolomite could actually be serving as a high permeability conduit, with the Weber Sands feeding gas through a natural fracture system. Decline curve estimates and gas-in-place calculations indicate that gas reserves are higher than can be attributed to the dolomite alone; however, the current reserve estimates are very uncertain, having a large spread, which is partly due to uncertain delineation of the field and location of a water-contact. Studies are currently being performed to ascertain the reserve base.
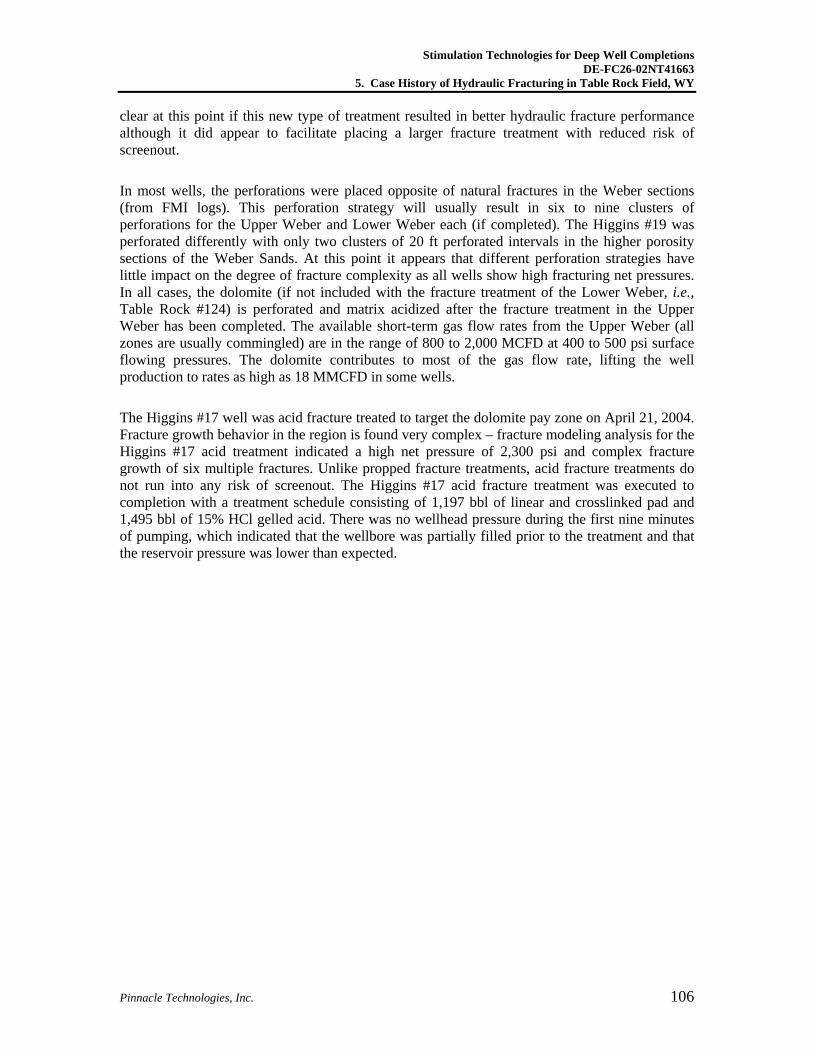
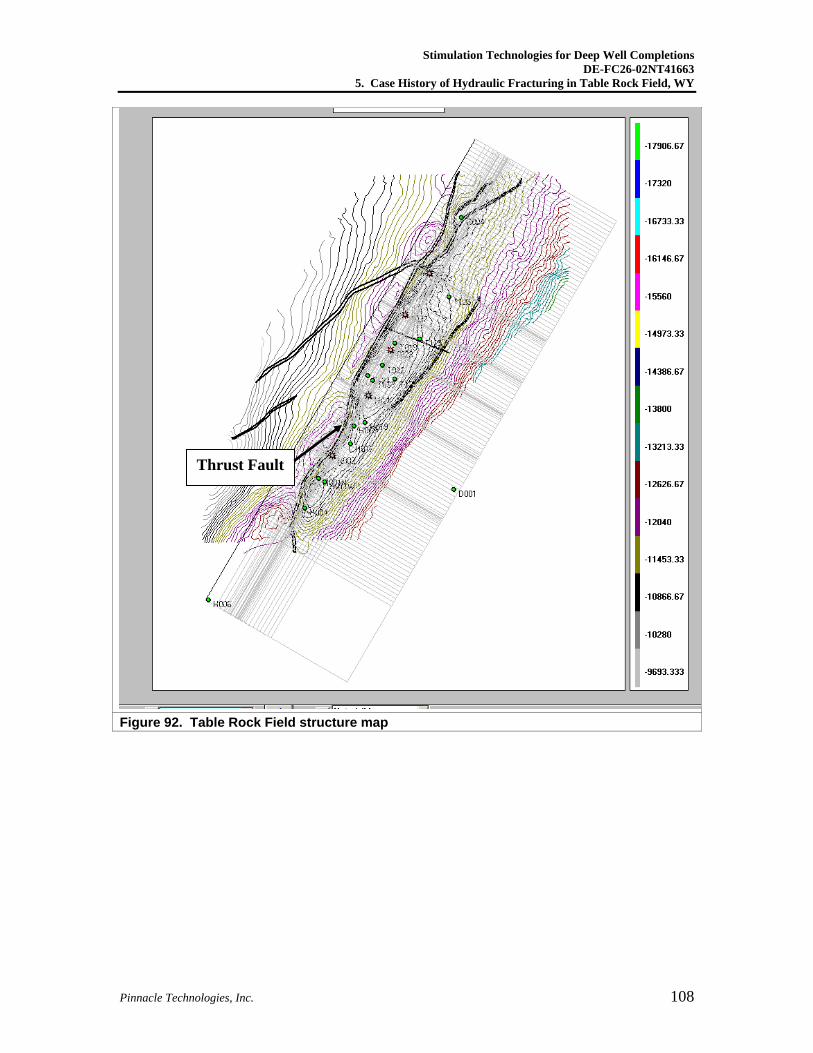
The field includes 17 wells drilled in the late 70’s and early 80’s. All wells are located to the east of a NNE to SSW trending thrust fault. Recently ChevronTexaco and Anadarko have started a new wave of development in this field. Most of the older wells had natural completions in the dolomite (perforated and acidized) and in some cases in the Upper Weber. Five of the older wells had hydraulic fracture completions with varying success. Currently the Upper Weber and sometimes the Lower Weber are stimulated with hydraulic fractures followed by a natural completion in the dolomite (perforate and acidize). The best well in the field was perforated and acidized only, and has a current cumulative production of about 34 BCF in twelve years. Well performances indicate that reservoir quality can vary significantly across the field, with the challenge being to obtain consistent economic success for every well drilled. Being able to exploit the large Weber gas reserves with effective hydraulic fracture stimulation would be an important “add-on” to the high productivity dolomite.
The general problem with treatments in this area appears to be the creation of complex, multiple fracture systems during hydraulic fracturing. This causes fracture widths to be very small, which is problematic for pumping higher concentrations of proppant and has led to screenouts in the majority of treatments. The propagation of complex fractures and the inability to transport proppant deep into the hydraulic fracture will result in low quality fracture stimulation due to short, low conductivity fractures, which is aggravated by the high stress environment at large depths. This conclusion was supported by a post-frac pressure buildup test, which revealed largely ineffective fracture stimulation. The fracture complexity may also be related to the close proximity of a thrust fault, which can create complex stress fields. In addition, the normal- to even under-pressured pore pressure poses a severe challenge for effective hydraulic fracture stimulation and production.
Three different types of fracture treatments were reviewed in this study. The most frequently pumped design is a CO2-assisted heavy crosslinked gel treatment with moderate concentrations of
Stimulation Technologies for Deep Well Completions DE-FC26-02NT41663
5. Case History of Hydraulic Fracturing in Table Rock Field, WY
Pinnacle Technologies, Inc. 102
bauxite (up to 4 ppg). In January of 2004, one well was completed with a hybrid-frac design, which uses a large slickwater pad followed by a “low gel loading” crosslinked fluid and lower proppant concentrations of bauxite (up to 2 ppg). The hope was that the hybrid design would increase fracture length, which is the most important design parameter in low permeability rock, while also reducing potential polymer damage to the natural fractures. In April 2004, an acid fracture treatment was pumped to target the dolomite reservoir formation.
It is unclear at this point which type of treatment provides the best fracture stimulation. Fracture modeling indicates that the hybrid treatment may have created longer fractures but production was not better than in the other conventional Upper Weber completions. The key to economic development of this field is high-grade drilling locations that ensure a high quality dolomite zone. Completion technology and stimulation of the low permeability Weber Sands provides added value in these wells. The completion and stimulation of these wells are challenging and it appears that every attempt at improved stimulation does not result in a significant enhancement of well production as reservoir quality is the key driver for performance. It is highly recommended to more frequently employ diagnostic technologies such as pressure buildup tests to segregate completion effectiveness from reservoir quality and estimate pore pressure as this will help both in the optimization of well completion and reserves quantification.
5.1 Conclusions
1. There is strong evidence that created hydraulic fractures are very complex multiple fracture systems. The fracture complexity causes created fracture widths to be very small, which is problematic for pumping higher concentrations of proppant. The majority of treatments in this study had problems with severe increases of treating pressures during the proppant stages leading to screenouts in some cases. The fracture complexity may also be related to the close proximity of a thrust fault, which can create complex stress fields.
2. The propagation of a complex fracture system and the inability to transport proppant deeply into the fractures will result in low quality fracture stimulation due to short, low conductivity fractures. The post-frac pressure buildup in the Table Rock #124 (Lower Weber and Dolomite) supports this conclusion as it revealed largely ineffective fracture stimulation along with a permeability of about 0.63 md and formation flow capacity of 19 md-ft (mainly from dolomite).
3. Fracture complexity was modeled both as multiple branches and increasing leakoff due to opening of natural fissures as injection pressures rise above initiation pressures of oblique oriented natural fractures. The hydraulic fracturing process at this point may actually be a mixed mode of shear and tensile fracturing. The opening of natural fissures is confirmed by pressure-dependent leakoff during the mini-frac falloffs. In addition, radioactive tracer logs also indicate separate fractures at each set of perforations.
4. There is no evidence that any of the Weber fracture treatments (except for the Table Rock #124 where the dolomite was intentionally perforated with the Lower Weber) physically fractured into the dolomite; however, it is unclear at this point if the
Stimulation Technologies for Deep Well Completions DE-FC26-02NT41663
5. Case History of Hydraulic Fracturing in Table Rock Field, WY
Pinnacle Technologies, Inc. 103
Weber Sands will eventually feed into the dolomite through natural fractures as the dolomite is depleted.
5. Three different types of fracture treatments were performed:
a. 25% CO2-assisted 50 to 60 lb/Mgal low-pH crosslinked gel with 30/50 bauxite and a 20/40 bauxite tail-in
b. Hybrid job with a large slickwater pad followed by a crosslinked 32 lb/Mgal gel and lower proppant concentrations of 0.25 to 2 ppg 30/60 bauxite and 20/40 bauxite
c. Acid fracturing using a pad (linear or crosslinked gel) followed by 15% HCl gelled acid
It is unclear at this point which type of treatment provides the best fracture stimulation as only one hybrid treatment was successfully placed so far and initial flow back data indicators are uncertain due to reservoir quality issues; however, the successful hybrid treatment provided a production response that was on the lower end of comparable Upper Weber completions, showing that the desired goal of achieving a clearly better stimulation and flow response was not achieved. The other hybrid fracture attempt was unsuccessful as very high treating pressures precluded any type of propped stimulation. From a treating pressure perspective, it appears that the hybrid fracture was able to avoid proppant transport related pressure increases and place larger amounts of fluid and proppant. Modeling also indicated that a longer fracture was created, which could be a key issue in very low permeability rock.
6. In the study wells, the majority of the production is coming from the permeable dolomite, with some limited contribution (0.8 to 2.0 MMCFD) from the Weber Sands. In one case (Table Rock #125) perforating and acidizing the dolomite lifted production from about 1.5 to 17 MMCFD. It is common procedure to complete the dolomite after the Upper Weber has been fractured (exception is Table Rock #124, where dolomite was fractured with Lower Weber). The high gas flow rates from the dolomite will serve as a natural gas lift for the continued frac water cleanup from the Weber Sands.
7. The most important issue in developing this field is to identify well locations that will ensure a high quality dolomite zone as this is the key to economic well production. The completion and stimulation of these wells are challenging and it appears that every attempt at improved stimulation does not result in a significant enhancement of well production as reservoir quality is the key driver for performance.
8. The goal to stimulate the dolomite pay zone in the Higgins #17 was achieved, though the near-wellbore conductivity could have been improved by a Closed Fracture Acidizing (CFA) stage.
Stimulation Technologies for Deep Well Completions DE-FC26-02NT41663
5. Case History of Hydraulic Fracturing in Table Rock Field, WY
Pinnacle Technologies, Inc. 104
9. The short-term production forecast in the Higgins #17 is consistent with actual post-treatment production data of 2 MMscfd. The reservoir permeability has dramatic impacts on gas production, and the dolomite zone seems to have a permeability of 0.5 mD based on early post-treatment production match.
10. Significant fracture upward growth in the Higgins #17 was observed and caused by a poor cement job in the upper intervals. The reservoir pressure was lower than expected as the wellbore was only filled with one- third of the completion fluid prior to the acid fracture treatment.
11. It is highly recommended to more frequently employ diagnostic technologies such as pressure buildup tests to segregate completion effectiveness from reservoir quality and estimate pore pressure, as this will help both in the optimization of well completion and reserves quantification.
12. The study did not evaluate reservoir characterization and well location strategies but understanding reservoir quality, especially natural fracturing, is important in this field.
13. Hydraulic fracture mapping would assist in optimizing treatments in this field and assist in answering the following questions:
a. How does fracture azimuth vary with proximity to the thrust fault?
b. What complexities are evident with fracture mapping and how do they relate to screenout problems?
c. What is the overall fracture height growth and how effective is pay zone coverage using various treatment types?
d. What is the created fracture length and how does it compare to estimates for effective fracture length from production?
5.2 Discussion
5.2.1 Introduction
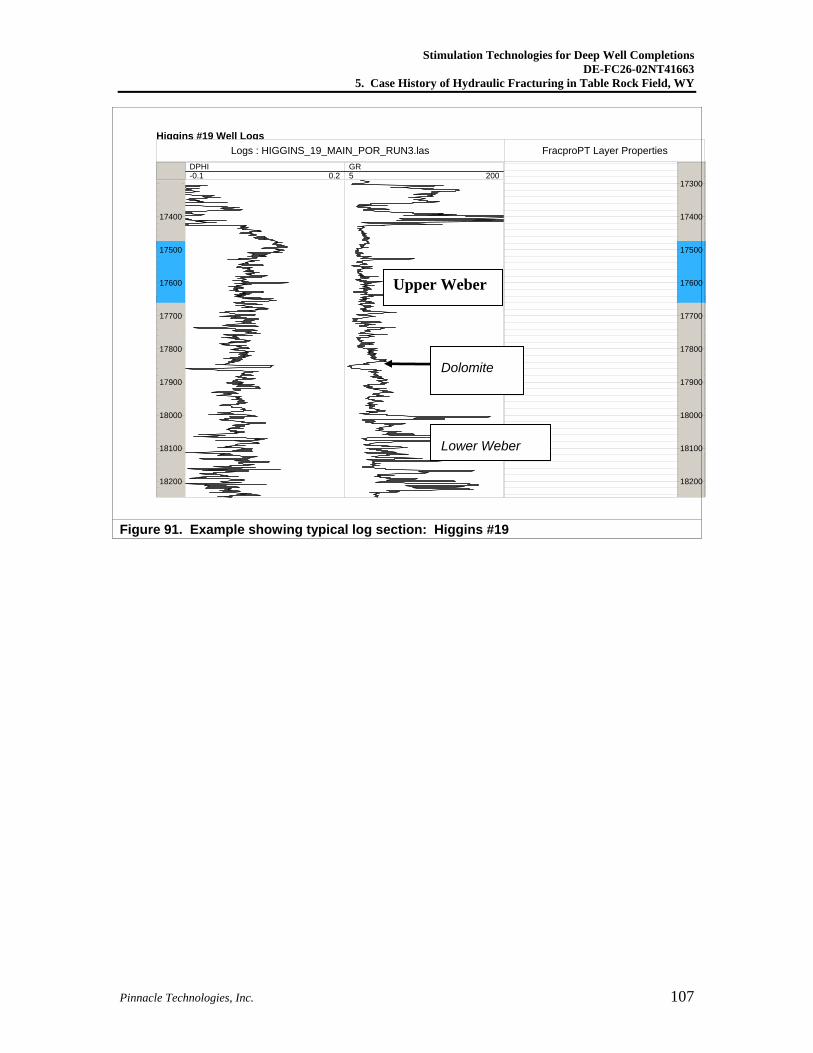
This study focused on three deep gas productive targets in the Table Rock Field. The primary target is a higher permeability dolomite layer (20 ft thick) surrounded by low permeability sandstones (secondary targets) designated as the Lower Weber (below dolomite), and Upper Weber (above dolomite) at depths of roughly 17,300 to 18,100 ft (Figure 91). A field structure map is shown in Figure 92. The most significant feature is a NNE to SSW trending thrust fault. All wells are located on the east side of this fault. Some of the issues outlined in this study, such
Stimulation Technologies for Deep Well Completions DE-FC26-02NT41663
5. Case History of Hydraulic Fracturing in Table Rock Field, WY
Pinnacle Technologies, Inc. 105
as hydraulic fracture complexity, could be associated with a complex stress field created by the thrust fault.
The history of the field includes about 17 wells drilled in the late 70’s and early 80’s. Recently ChevronTexaco and Anadarko have started a new wave of development in this field. Most of the older wells had natural completions (perforated and acidized) in the dolomite and in some cases in the Upper Weber. Five wells had hydraulic fracture completions with varying success. The best well in the field was perforated and acidized only and has a current cumulative production of about 34 BCF. Well performances indicate that reservoir quality can vary significantly across the field with the challenge being to obtain consistent economic success for every well drilled.
Both the Lower Weber and Upper Weber section are gas-filled low porosity sandstones (3%) with limited amounts of natural fractures. The Upper Weber section is generally considered to be higher reservoir quality than the Lower Weber. It is uncertain at this point how the two sandstone sections interact with the higher permeability, higher porosity dolomite. One theory is that the dolomite is connected by natural fractures to the neighboring sandstones and serves as a “conduit” for additional drainage and reserves from these fairly thick sections. RFTs generally indicate that pore pressures are currently below hydrostatic pressure, in the range of 5,000 to 6,000 psi at about 17,500 ft (0.29 to 0.34 psi/ft). These conditions pose quite a challenge for hydraulic fracturing given the 18,000 ft well depth and fracture treating pressures.
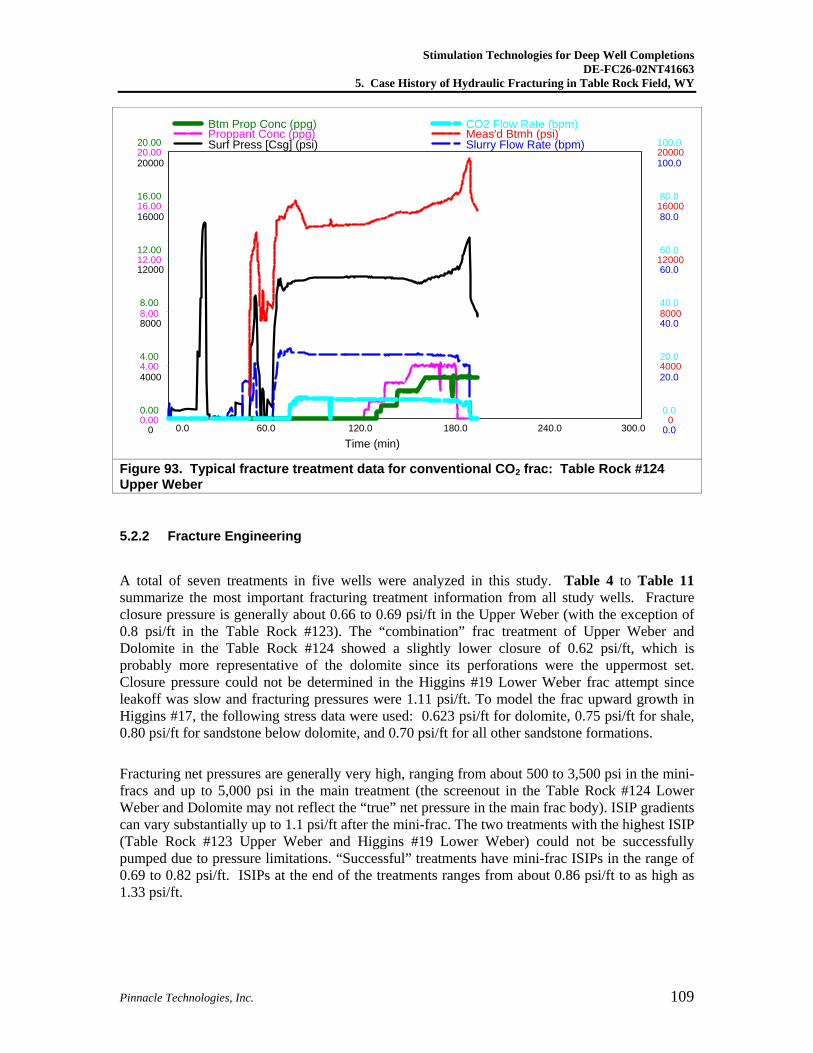
The main type of fracture design used for most wells includes pumping 25% CO2-assisted 50 to 60 lb/Mgal low-pH crosslinked gel with 30/50 sintered bauxite and a 20/40 sintered bauxite tail-in at the end of the treatment. Bottomhole slurry rates are about 30 bpm and proppant ramps are generally 1 to 4 ppg with about 150 klb of total proppant and 3,500 bbl of total slurry volume. A small proppant slug of 30/60 proppant (0.25 ppg) is usually pumped during the pad. Pad sizes are about 50%. Most treatments showed significant increases of treating pressures after 1 ppg proppant concentrations entered the hydraulic fracture, with some treatments resulting in pre-mature screenouts (Figure 93).
On a recently drilled well (Higgins #19, January 2004) a new type of hybrid-style waterfrac treatment was attempted. A hybrid treatment consists of a large slickwater pad, employed to create long fractures using thin fluids, followed by crosslinked gel and proppant with the hope that the thicker fluid will transport proppant far down the fracture length thus providing improved propped fracture lengths. A true waterfrac treatment using only slickwater may have been adequate given the very low reservoir permeabilities and its advantage of eliminating gel damage to natural fractures; however, it was not possible to pump this type of treatment given the use of high-density bauxite, which will cause substantial settling and proppant transport problems when pumped with slickwater.
The general goal of the hybrid treatment was to achieve longer fractures by pumping larger treatments (8,000 bbl of fluid with more than 200 klb of proppant) while maintaining adequate conductivity and minimizing gel damage to the natural fracture system. A less aggressive proppant ramp starting at 0.25 ppg to a maximum of 2 ppg was used to minimize proppant entry problems, which enhances the chances of creating a longer fracture. Also, the use of a large slickwater pad (40%) and low polymer concentration crosslinked gel (32# Vistar system) was used to help minimize gel damage (compared to 50 and 60 lb/Mgal gels) while still providing adequate proppant transport capabilities. CO2 was not added in this type of treatment. It is not
Stimulation Technologies for Deep Well Completions DE-FC26-02NT41663
5. Case History of Hydraulic Fracturing in Table Rock Field, WY
Pinnacle Technologies, Inc. 106
clear at this point if this new type of treatment resulted in better hydraulic fracture performance although it did appear to facilitate placing a larger fracture treatment with reduced risk of screenout.
In most wells, the perforations were placed opposite of natural fractures in the Weber sections (from FMI logs). This perforation strategy will usually result in six to nine clusters of perforations for the Upper Weber and Lower Weber each (if completed). The Higgins #19 was perforated differently with only two clusters of 20 ft perforated intervals in the higher porosity sections of the Weber Sands. At this point it appears that different perforation strategies have little impact on the degree of fracture complexity as all wells show high fracturing net pressures. In all cases, the dolomite (if not included with the fracture treatment of the Lower Weber, i.e., Table Rock #124) is perforated and matrix acidized after the fracture treatment in the Upper Weber has been completed. The available short-term gas flow rates from the Upper Weber (all zones are usually commingled) are in the range of 800 to 2,000 MCFD at 400 to 500 psi surface flowing pressures. The dolomite contributes to most of the gas flow rate, lifting the well production to rates as high as 18 MMCFD in some wells.
The Higgins #17 well was acid fracture treated to target the dolomite pay zone on April 21, 2004. Fracture growth behavior in the region is found very complex – fracture modeling analysis for the Higgins #17 acid treatment indicated a high net pressure of 2,300 psi and complex fracture growth of six multiple fractures. Unlike propped fracture treatments, acid fracture treatments do not run into any risk of screenout. The Higgins #17 acid fracture treatment was executed to completion with a treatment schedule consisting of 1,197 bbl of linear and crosslinked pad and 1,495 bbl of 15% HCl gelled acid. There was no wellhead pressure during the first nine minutes of pumping, which indicated that the wellbore was partially filled prior to the treatment and that the reservoir pressure was lower than expected.
Stimulation Technologies for Deep Well Completions DE-FC26-02NT41663
5. Case History of Hydraulic Fracturing in Table Rock Field, WY
Pinnacle Technologies, Inc. 107
Higgins #19 Well Logs
17400
17500
17600
17700
17800
17900
18000
18100
18200
-0.1 0.2DPHI
5 200GR
Logs : HIGGINS_19_MAIN_POR_RUN3.las
17300
17400
17500
17600
17700
17800
17900
18000
18100
18200
FracproPT Layer Properties
Figure 91. Example showing typical log section: Higgins #19
Dolomite
Upper Weber
Lower Weber
Stimulation Technologies for Deep Well Completions DE-FC26-02NT41663
5. Case History of Hydraulic Fracturing in Table Rock Field, WY
Pinnacle Technologies, Inc. 108
Figure 92. Table Rock Field structure map
Thrust Fault
Stimulation Technologies for Deep Well Completions DE-FC26-02NT41663
5. Case History of Hydraulic Fracturing in Table Rock Field, WY
Pinnacle Technologies, Inc. 109
Time (min)
Surf Press [Csg] (psi) Slurry Flow Rate (bpm)Proppant Conc (ppg) Meas'd Btmh (psi)Btm Prop Conc (ppg) CO2 Flow Rate (bpm)
0.0 60.0 120.0 180.0 240.0 300.0 0
4000
8000
12000
16000
20000
0.0
20.0
40.0
60.0
80.0
100.0
0.00
4.00
8.00
12.00
16.00
20.00
0
4000
8000
12000
16000
20000
0.00
4.00
8.00
12.00
16.00
20.00
0.0
20.0
40.0
60.0
80.0
100.0
Figure 93. Typical fracture treatment data for conventional CO2 frac: Table Rock #124 Upper Weber
5.2.2 Fracture Engineering
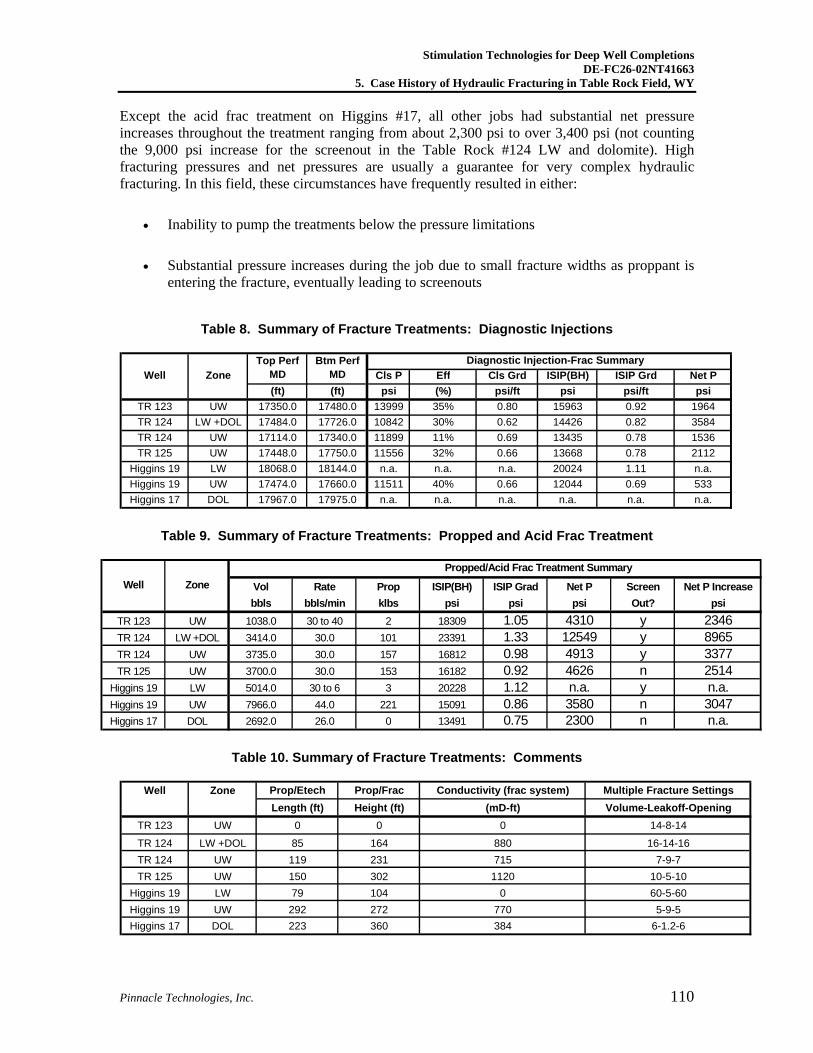
A total of seven treatments in five wells were analyzed in this study. Table 4 to Table 11 summarize the most important fracturing treatment information from all study wells. Fracture closure pressure is generally about 0.66 to 0.69 psi/ft in the Upper Weber (with the exception of 0.8 psi/ft in the Table Rock #123). The “combination” frac treatment of Upper Weber and Dolomite in the Table Rock #124 showed a slightly lower closure of 0.62 psi/ft, which is probably more representative of the dolomite since its perforations were the uppermost set. Closure pressure could not be determined in the Higgins #19 Lower Weber frac attempt since leakoff was slow and fracturing pressures were 1.11 psi/ft. To model the frac upward growth in Higgins #17, the following stress data were used: 0.623 psi/ft for dolomite, 0.75 psi/ft for shale, 0.80 psi/ft for sandstone below dolomite, and 0.70 psi/ft for all other sandstone formations.
Fracturing net pressures are generally very high, ranging from about 500 to 3,500 psi in the mini-fracs and up to 5,000 psi in the main treatment (the screenout in the Table Rock #124 Lower Weber and Dolomite may not reflect the “true” net pressure in the main frac body). ISIP gradients can vary substantially up to 1.1 psi/ft after the mini-frac. The two treatments with the highest ISIP (Table Rock #123 Upper Weber and Higgins #19 Lower Weber) could not be successfully pumped due to pressure limitations. “Successful” treatments have mini-frac ISIPs in the range of 0.69 to 0.82 psi/ft. ISIPs at the end of the treatments ranges from about 0.86 psi/ft to as high as 1.33 psi/ft.
Stimulation Technologies for Deep Well Completions DE-FC26-02NT41663
5. Case History of Hydraulic Fracturing in Table Rock Field, WY
Pinnacle Technologies, Inc. 110
Except the acid frac treatment on Higgins #17, all other jobs had substantial net pressure increases throughout the treatment ranging from about 2,300 psi to over 3,400 psi (not counting the 9,000 psi increase for the screenout in the Table Rock #124 LW and dolomite). High fracturing pressures and net pressures are usually a guarantee for very complex hydraulic fracturing. In this field, these circumstances have frequently resulted in either:
• Inability to pump the treatments below the pressure limitations
• Substantial pressure increases during the job due to small fracture widths as proppant is entering the fracture, eventually leading to screenouts
Table 8. Summary of Fracture Treatments: Diagnostic Injections
Cls P Eff Cls Grd ISIP(BH) ISIP Grd Net P(ft) (ft) psi (%) psi/ft psi psi/ft psi
TR 123 UW 17350.0 17480.0 13999 35% 0.80 15963 0.92 1964TR 124 LW +DOL 17484.0 17726.0 10842 30% 0.62 14426 0.82 3584TR 124 UW 17114.0 17340.0 11899 11% 0.69 13435 0.78 1536TR 125 UW 17448.0 17750.0 11556 32% 0.66 13668 0.78 2112
Higgins 19 LW 18068.0 18144.0 n.a. n.a. n.a. 20024 1.11 n.a.Higgins 19 UW 17474.0 17660.0 11511 40% 0.66 12044 0.69 533Higgins 17 DOL 17967.0 17975.0 n.a. n.a. n.a. n.a. n.a. n.a.
Diagnostic Injection-Frac SummaryWell Zone
Top Perf MD
Btm Perf MD
Table 9. Summary of Fracture Treatments: Propped and Acid Frac Treatment
Vol Rate Prop ISIP(BH) ISIP Grad Net P Screen Net P Increasebbls bbls/min klbs psi psi psi Out? psi
TR 123 UW 1038.0 30 to 40 2 18309 1.05 4310 y 2346TR 124 LW +DOL 3414.0 30.0 101 23391 1.33 12549 y 8965TR 124 UW 3735.0 30.0 157 16812 0.98 4913 y 3377TR 125 UW 3700.0 30.0 153 16182 0.92 4626 n 2514
Higgins 19 LW 5014.0 30 to 6 3 20228 1.12 n.a. y n.a.Higgins 19 UW 7966.0 44.0 221 15091 0.86 3580 n 3047Higgins 17 DOL 2692.0 26.0 0 13491 0.75 2300 n n.a.
Propped/Acid Frac Treatment SummaryWell Zone
Table 10. Summary of Fracture Treatments: Comments
Well Zone Prop/Etech Prop/Frac Conductivity (frac system) Multiple Fracture SettingsLength (ft) Height (ft) (mD-ft) Volume-Leakoff-Opening
TR 123 UW 0 0 0 14-8-14
TR 124 LW +DOL 85 164 880 16-14-16TR 124 UW 119 231 715 7-9-7TR 125 UW 150 302 1120 10-5-10
Higgins 19 LW 79 104 0 60-5-60Higgins 19 UW 292 272 770 5-9-5Higgins 17 DOL 223 360 384 6-1.2-6
Stimulation Technologies for Deep Well Completions DE-FC26-02NT41663
5. Case History of Hydraulic Fracturing in Table Rock Field, WY
Pinnacle Technologies, Inc. 111
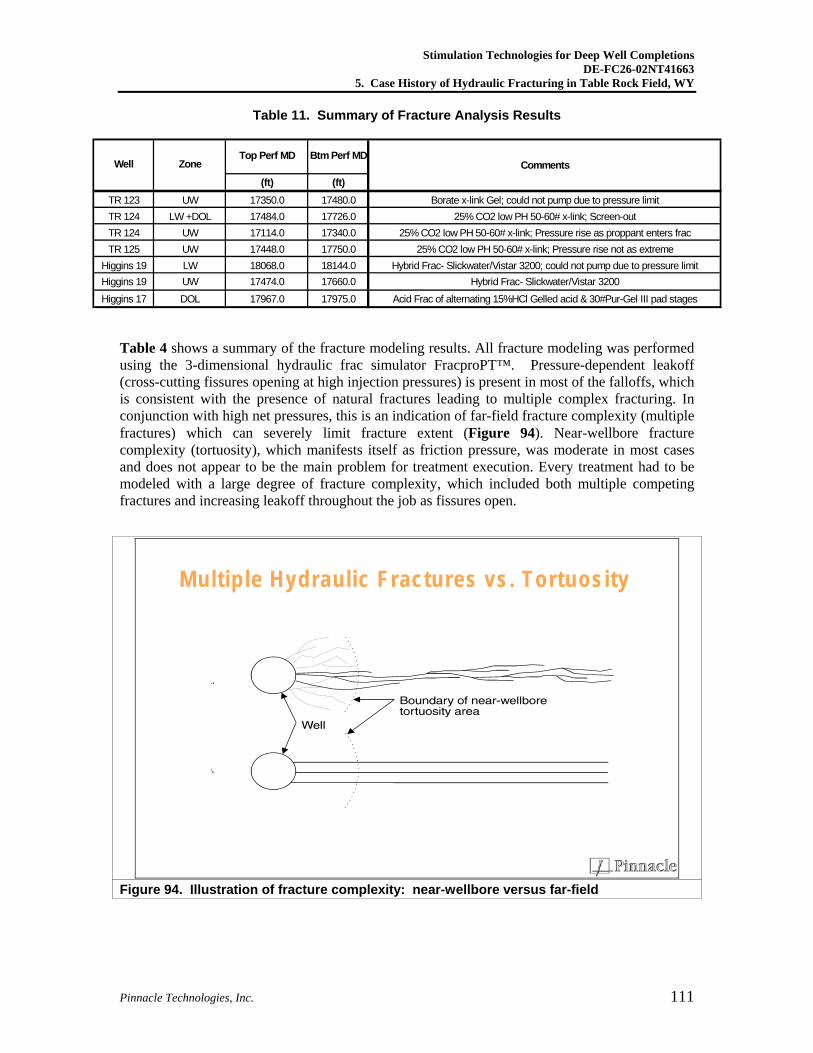
Table 11. Summary of Fracture Analysis Results
Comments(ft) (ft)
TR 123 UW 17350.0 17480.0 Borate x-link Gel; could not pump due to pressure limitTR 124 LW +DOL 17484.0 17726.0 25% CO2 low PH 50-60# x-link; Screen-outTR 124 UW 17114.0 17340.0 25% CO2 low PH 50-60# x-link; Pressure rise as proppant enters fracTR 125 UW 17448.0 17750.0 25% CO2 low PH 50-60# x-link; Pressure rise not as extreme
Higgins 19 LW 18068.0 18144.0 Hybrid Frac- Slickwater/Vistar 3200; could not pump due to pressure limitHiggins 19 UW 17474.0 17660.0 Hybrid Frac- Slickwater/Vistar 3200Higgins 17 DOL 17967.0 17975.0 Acid Frac of alternating 15%HCl Gelled acid & 30#Pur-Gel III pad stages
Btm Perf MDWell Zone
Top Perf MD
Table 4 shows a summary of the fracture modeling results. All fracture modeling was performed using the 3-dimensional hydraulic frac simulator FracproPT™. Pressure-dependent leakoff (cross-cutting fissures opening at high injection pressures) is present in most of the falloffs, which is consistent with the presence of natural fractures leading to multiple complex fracturing. In conjunction with high net pressures, this is an indication of far-field fracture complexity (multiple fractures) which can severely limit fracture extent (Figure 94). Near-wellbore fracture complexity (tortuosity), which manifests itself as friction pressure, was moderate in most cases and does not appear to be the main problem for treatment execution. Every treatment had to be modeled with a large degree of fracture complexity, which included both multiple competing fractures and increasing leakoff throughout the job as fissures open.
M ultip le H ydraulic Fractures vs. Tortuosity
Figure 94. Illustration of fracture complexity: near-wellbore versus far-field
Stimulation Technologies for Deep Well Completions DE-FC26-02NT41663
5. Case History of Hydraulic Fracturing in Table Rock Field, WY
Pinnacle Technologies, Inc. 112
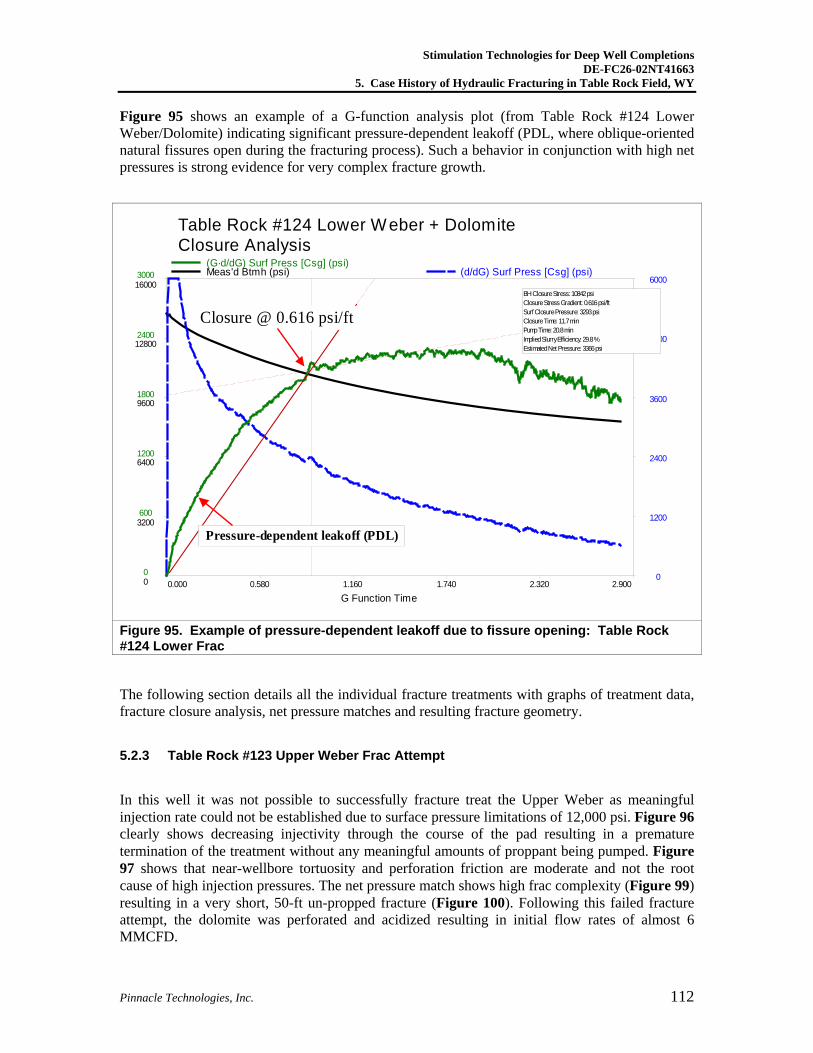
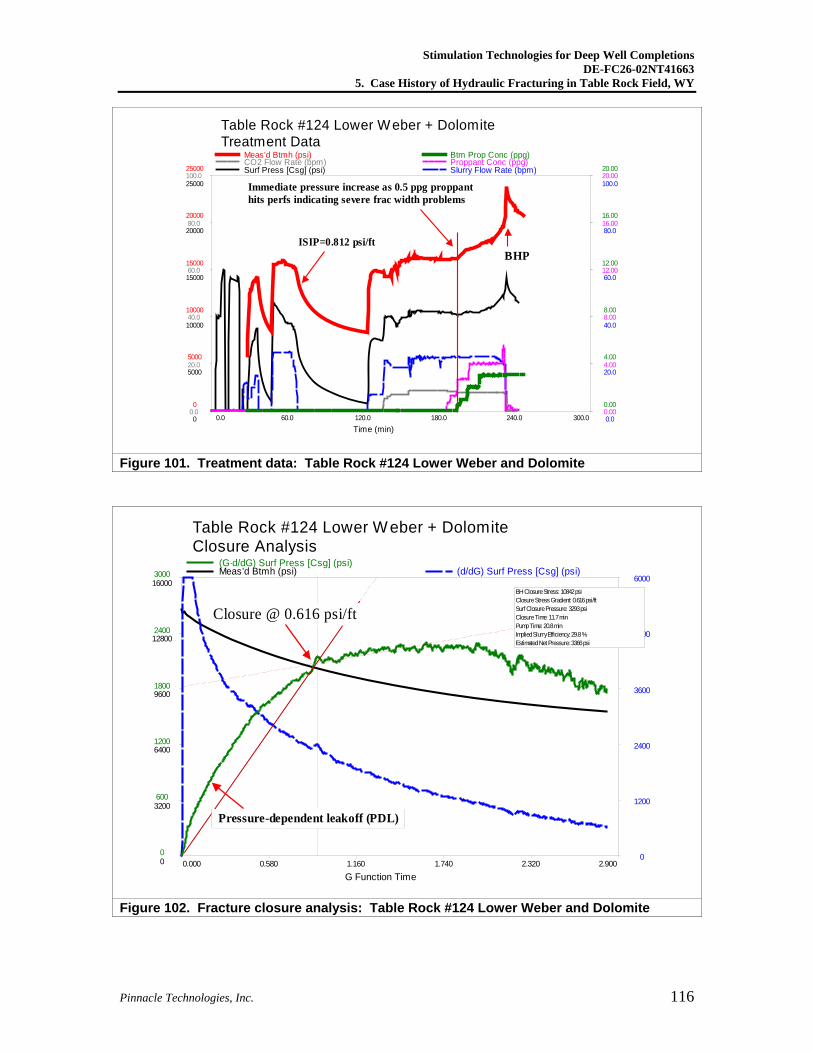
Figure 95 shows an example of a G-function analysis plot (from Table Rock #124 Lower Weber/Dolomite) indicating significant pressure-dependent leakoff (PDL, where oblique-oriented natural fissures open during the fracturing process). Such a behavior in conjunction with high net pressures is strong evidence for very complex fracture growth.
Table Rock #124 Lower Weber + DolomiteClosure Analysis
G Function Time
Meas'd Btmh (psi) (d/dG) Surf Press [Csg] (psi)(G·d/dG) Surf Press [Csg] (psi)
0.000 0.580 1.160 1.740 2.320 2.900 0
3200
6400
9600
12800
16000
0
1200
2400
3600
4800
6000
0
600
1200
1800
2400
3000
BH Closure Stress: 10842 psiClosure Stress Gradient: 0.616 psi/ftSurf Closure Pressure: 3293 psiClosure Time: 11.7 minPump Time: 20.8 minImplied Slurry Efficiency: 29.8 %Estimated Net Pressure: 3366 psi
Closure @ 0.616 psi/ft
Pressure-dependent leakoff (PDL)
Figure 95. Example of pressure-dependent leakoff due to fissure opening: Table Rock #124 Lower Frac
The following section details all the individual fracture treatments with graphs of treatment data, fracture closure analysis, net pressure matches and resulting fracture geometry.
5.2.3 Table Rock #123 Upper Weber Frac Attempt
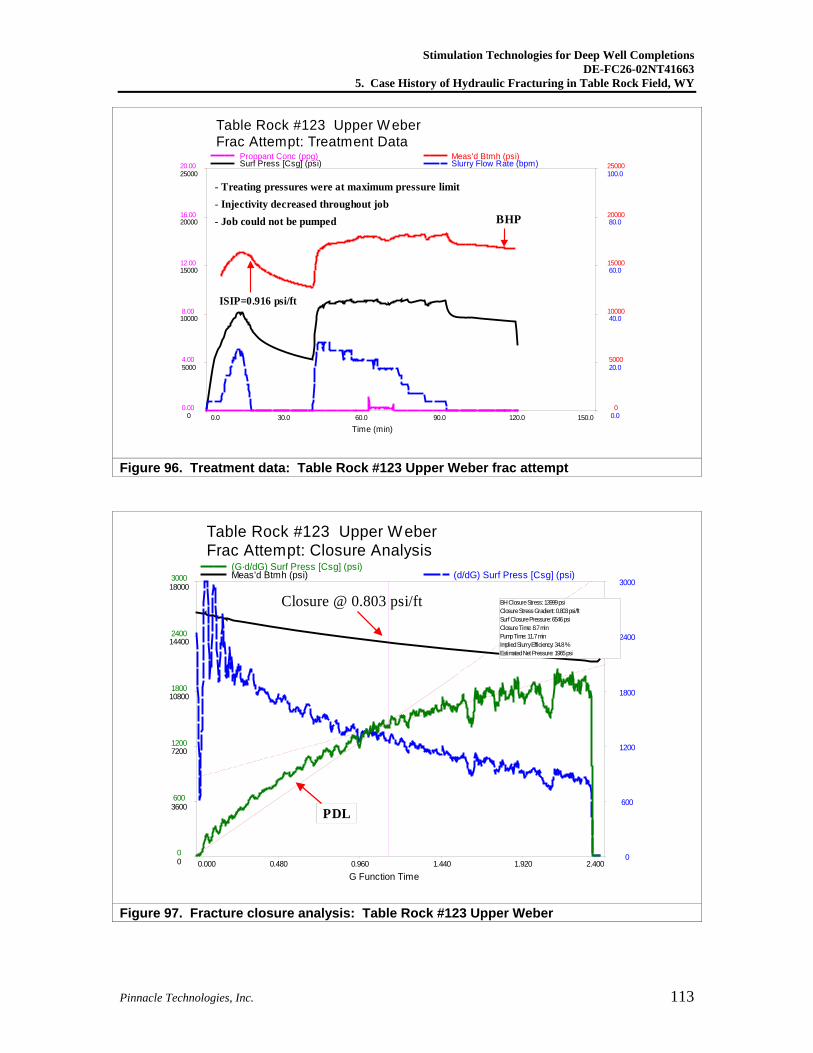
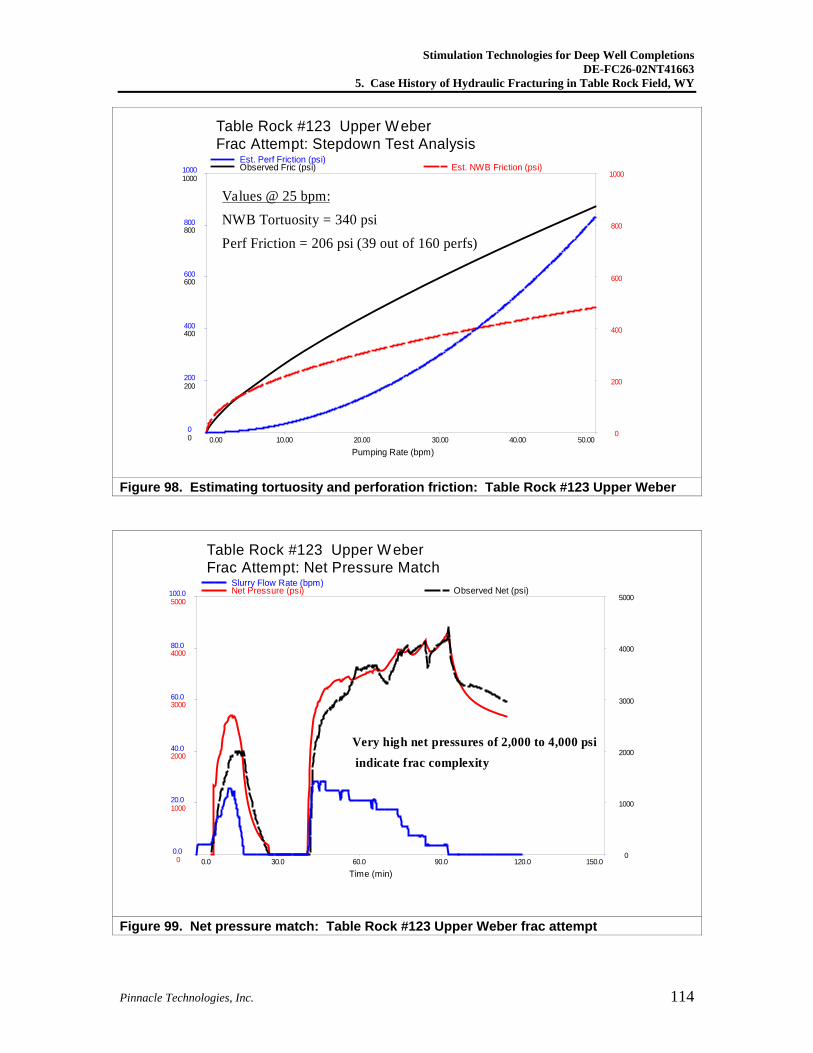
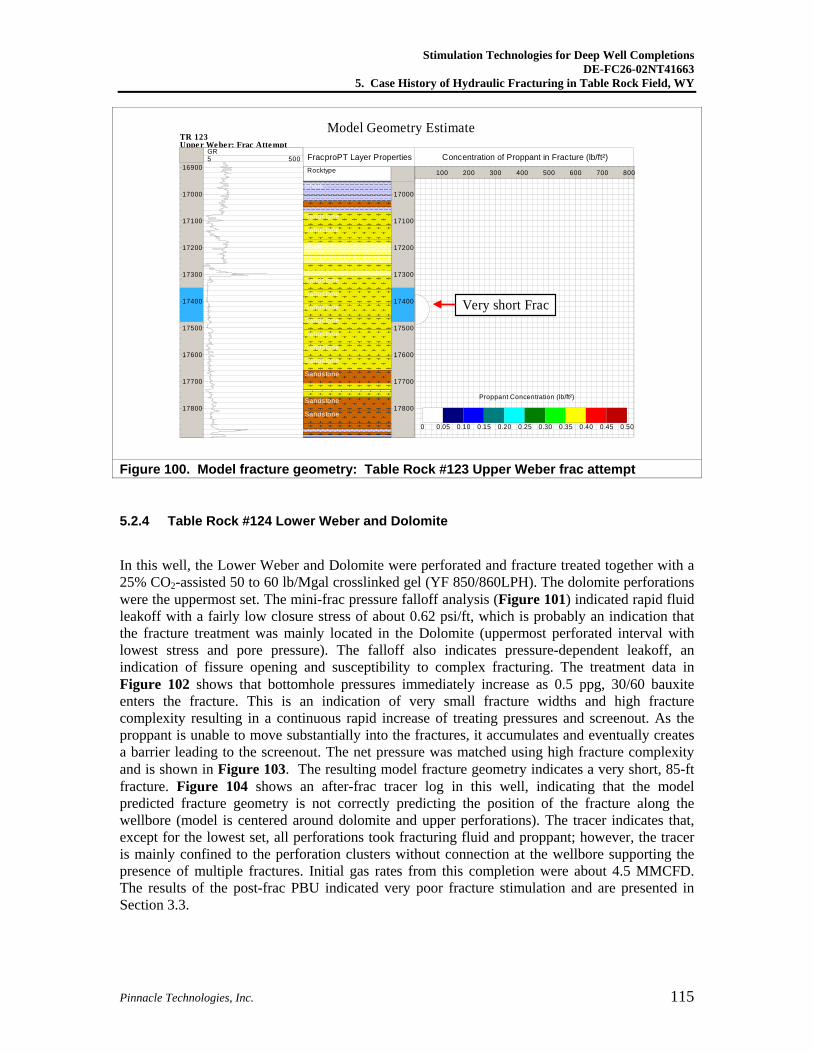
In this well it was not possible to successfully fracture treat the Upper Weber as meaningful injection rate could not be established due to surface pressure limitations of 12,000 psi. Figure 96 clearly shows decreasing injectivity through the course of the pad resulting in a premature termination of the treatment without any meaningful amounts of proppant being pumped. Figure 97 shows that near-wellbore tortuosity and perforation friction are moderate and not the root cause of high injection pressures. The net pressure match shows high frac complexity (Figure 99) resulting in a very short, 50-ft un-propped fracture (Figure 100). Following this failed fracture attempt, the dolomite was perforated and acidized resulting in initial flow rates of almost 6 MMCFD.
Stimulation Technologies for Deep Well Completions DE-FC26-02NT41663
5. Case History of Hydraulic Fracturing in Table Rock Field, WY
Pinnacle Technologies, Inc. 113
Table Rock #123 Upper W eberFrac Attempt: Treatment Data
Time (min)
Surf Press [Csg] (psi) Slurry Flow Rate (bpm)Proppant Conc (ppg) Meas'd Btmh (psi)
0.0 30.0 60.0 90.0 120.0 150.0 0
5000
10000
15000
20000
25000
0.0
20.0
40.0
60.0
80.0
100.0
0.00
4.00
8.00
12.00
16.00
20.00
0
5000
10000
15000
20000
25000
- Treating pressures were at maximum pressure limit- Injectivity decreased throughout job- Job could not be pumped
ISIP=0.916 psi/ft
BHP
Figure 96. Treatment data: Table Rock #123 Upper Weber frac attempt
Table Rock #123 Upper WeberFrac Attempt: Closure Analysis
G Function Time
Meas'd Btmh (psi) (d/dG) Surf Press [Csg] (psi)(G·d/dG) Surf Press [Csg] (psi)
0.000 0.480 0.960 1.440 1.920 2.400 0
3600
7200
10800
14400
18000
0
600
1200
1800
2400
3000
0
600
1200
1800
2400
3000
BH Closure Stress: 13999 psiClosure Stress Gradient: 0.803 psi/ftSurf Closure Pressure: 6546 psiClosure Time: 8.7 minPump Time: 11.7 minImplied Slurry Efficiency: 34.8 %Estimated Net Pressure: 1965 psi
Closure @ 0.803 psi/ft
PDL
Figure 97. Fracture closure analysis: Table Rock #123 Upper Weber
Stimulation Technologies for Deep Well Completions DE-FC26-02NT41663
5. Case History of Hydraulic Fracturing in Table Rock Field, WY
Pinnacle Technologies, Inc. 114
Table Rock #123 Upper WeberFrac Attempt: Stepdown Test Analysis
Pumping Rate (bpm)
Observed Fric (psi) Est. NWB Friction (psi)Est. Perf Friction (psi)
0.00 10.00 20.00 30.00 40.00 50.00 0
200
400
600
800
1000
0
200
400
600
800
1000
0
200
400
600
800
1000
Values @ 25 bpm:NWB Tortuosity = 340 psiPerf Friction = 206 psi (39 out of 160 perfs)
Figure 98. Estimating tortuosity and perforation friction: Table Rock #123 Upper Weber
Table Rock #123 Upper WeberFrac Attempt: Net Pressure Match
Time (min)
Net Pressure (psi) Observed Net (psi)Slurry Flow Rate (bpm)
0.0 30.0 60.0 90.0 120.0 150.0 0
1000
2000
3000
4000
5000
0
1000
2000
3000
4000
5000
0.0
20.0
40.0
60.0
80.0
100.0
Very high net pressures of 2,000 to 4,000 psiindicate frac complexity
Figure 99. Net pressure match: Table Rock #123 Upper Weber frac attempt
Stimulation Technologies for Deep Well Completions DE-FC26-02NT41663
5. Case History of Hydraulic Fracturing in Table Rock Field, WY
Pinnacle Technologies, Inc. 115
Uppe r Weber: Frac AttemptTR 123
16900
17000
17100
17200
17300
17400
17500
17600
17700
17800
5 500GR
17000
17100
17200
17300
17400
17500
17600
17700
17800
Rocktype
FracproPT Layer Properties
Shale
Sands tone
Sands tone
Shale
Sands tone
Sands tone
Sands tone
Sands tone
Sands tone
Sands tone
Sands tone
Sands tone
Sands tone
Sands tone
100 200 300 400 500 600 700 800
Concentration of Proppant in Fracture (lb/ft²)
0 0.05 0.10 0.15 0.20 0.25 0.30 0.35 0.40 0.45 0.50
Proppant Concentration (lb/ft²)
Model Geometry Estimate
Very short Frac
Figure 100. Model fracture geometry: Table Rock #123 Upper Weber frac attempt
5.2.4 Table Rock #124 Lower Weber and Dolomite
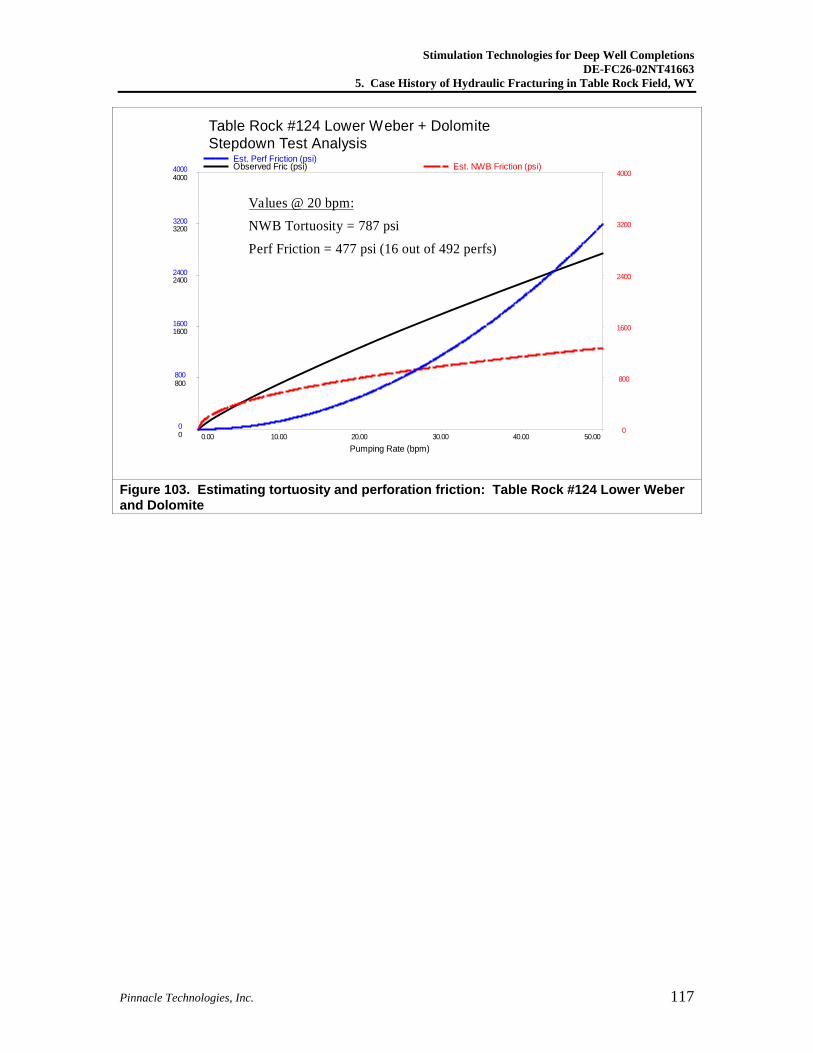
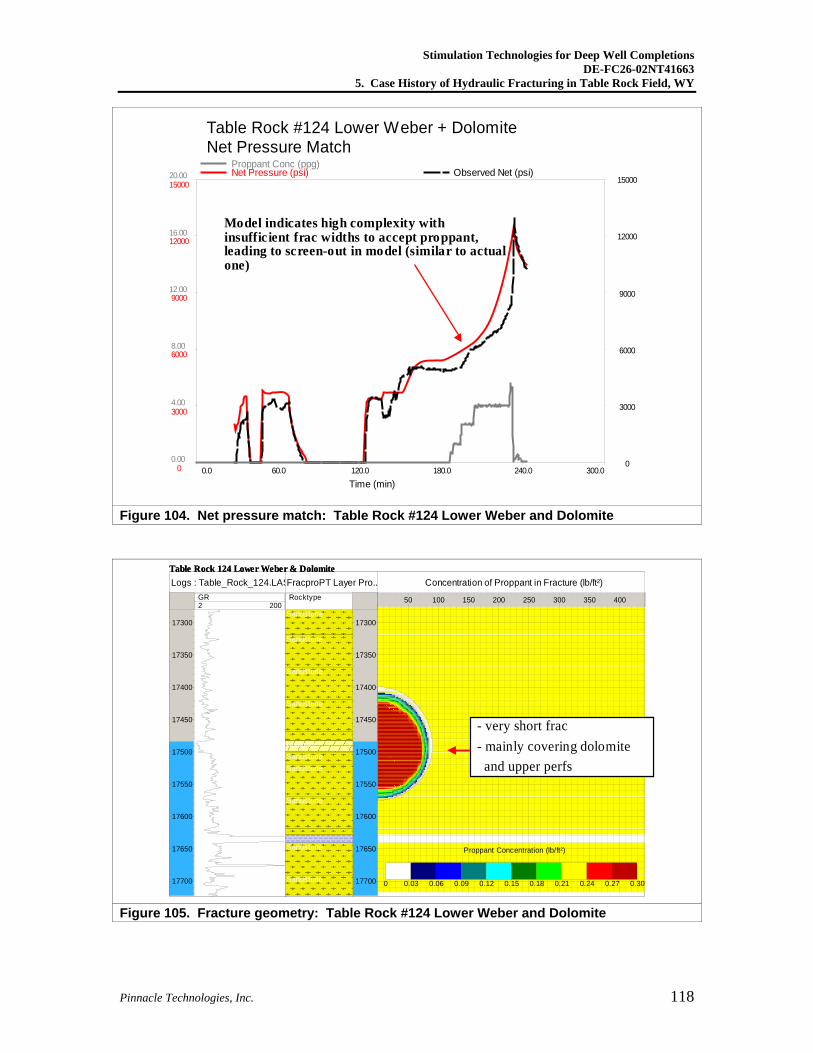
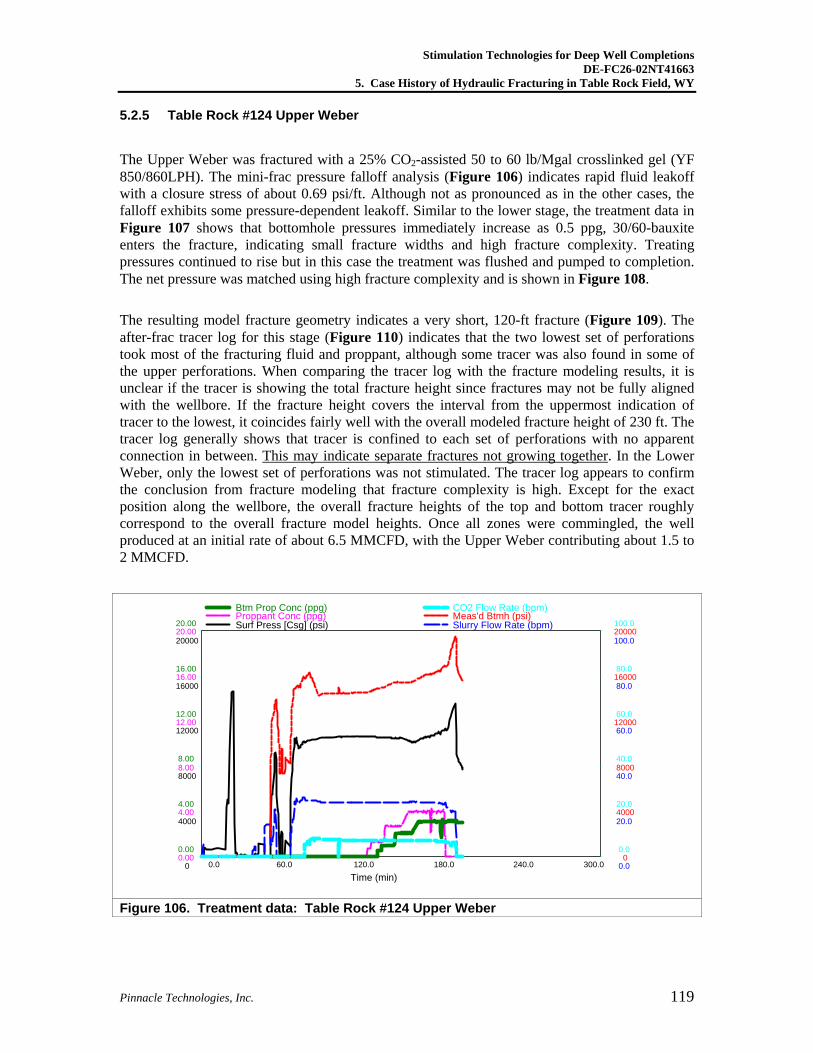
In this well, the Lower Weber and Dolomite were perforated and fracture treated together with a 25% CO2-assisted 50 to 60 lb/Mgal crosslinked gel (YF 850/860LPH). The dolomite perforations were the uppermost set. The mini-frac pressure falloff analysis (Figure 101) indicated rapid fluid leakoff with a fairly low closure stress of about 0.62 psi/ft, which is probably an indication that the fracture treatment was mainly located in the Dolomite (uppermost perforated interval with lowest stress and pore pressure). The falloff also indicates pressure-dependent leakoff, an indication of fissure opening and susceptibility to complex fracturing. The treatment data in Figure 102 shows that bottomhole pressures immediately increase as 0.5 ppg, 30/60 bauxite enters the fracture. This is an indication of very small fracture widths and high fracture complexity resulting in a continuous rapid increase of treating pressures and screenout. As the proppant is unable to move substantially into the fractures, it accumulates and eventually creates a barrier leading to the screenout. The net pressure was matched using high fracture complexity and is shown in Figure 103. The resulting model fracture geometry indicates a very short, 85-ft fracture. Figure 104 shows an after-frac tracer log in this well, indicating that the model predicted fracture geometry is not correctly predicting the position of the fracture along the wellbore (model is centered around dolomite and upper perforations). The tracer indicates that, except for the lowest set, all perforations took fracturing fluid and proppant; however, the tracer is mainly confined to the perforation clusters without connection at the wellbore supporting the presence of multiple fractures. Initial gas rates from this completion were about 4.5 MMCFD. The results of the post-frac PBU indicated very poor fracture stimulation and are presented in Section 3.3.
Stimulation Technologies for Deep Well Completions DE-FC26-02NT41663
5. Case History of Hydraulic Fracturing in Table Rock Field, WY
Pinnacle Technologies, Inc. 116
Table Rock #124 Lower Weber + DolomiteTreatment Data
Time (min)
Surf Press [Csg] (psi) Slurry Flow Rate (bpm)CO2 Flow Rate (bpm) Proppant Conc (ppg)Meas'd Btmh (psi) Btm Prop Conc (ppg)
0.0 60.0 120.0 180.0 240.0 300.0 0
5000
10000
15000
20000
25000
0.0
20.0
40.0
60.0
80.0
100.0
0.0
20.0
40.0
60.0
80.0
100.0
0.00
4.00
8.00
12.00
16.00
20.00
0
5000
10000
15000
20000
25000
0.00
4.00
8.00
12.00
16.00
20.00
Immediate pressure increase as 0.5 ppg proppant hits perfs indicating severe frac width problems
ISIP=0.812 psi/ftBHP
Figure 101. Treatment data: Table Rock #124 Lower Weber and Dolomite
Table Rock #124 Lower Weber + DolomiteClosure Analysis
G Function Time
Meas'd Btmh (psi) (d/dG) Surf Press [Csg] (psi)(G·d/dG) Surf Press [Csg] (psi)
0.000 0.580 1.160 1.740 2.320 2.900 0
3200
6400
9600
12800
16000
0
1200
2400
3600
4800
6000
0
600
1200
1800
2400
3000
BH Closure Stress: 10842 psiClosure Stress Gradient: 0.616 psi/ftSurf Closure Pressure: 3293 psiClosure Time: 11.7 minPump Time: 20.8 minImplied Slurry Efficiency: 29.8 %Estimated Net Pressure: 3366 psi
Closure @ 0.616 psi/ft
Pressure-dependent leakoff (PDL)
Figure 102. Fracture closure analysis: Table Rock #124 Lower Weber and Dolomite
Stimulation Technologies for Deep Well Completions DE-FC26-02NT41663
5. Case History of Hydraulic Fracturing in Table Rock Field, WY
Pinnacle Technologies, Inc. 117
Table Rock #124 Lower Weber + DolomiteStepdown Test Analysis
Pumping Rate (bpm)
Observed Fric (psi) Est. NWB Friction (psi)Est. Perf Friction (psi)
0.00 10.00 20.00 30.00 40.00 50.00 0
800
1600
2400
3200
4000
0
800
1600
2400
3200
4000
0
800
1600
2400
3200
4000
Values @ 20 bpm:NWB Tortuosity = 787 psiPerf Friction = 477 psi (16 out of 492 perfs)
Figure 103. Estimating tortuosity and perforation friction: Table Rock #124 Lower Weber and Dolomite
Stimulation Technologies for Deep Well Completions DE-FC26-02NT41663
5. Case History of Hydraulic Fracturing in Table Rock Field, WY
Pinnacle Technologies, Inc. 118
Table Rock #124 Lower Weber + DolomiteNet Pressure Match
Time (min)
Net Pressure (psi) Observed Net (psi)Proppant Conc (ppg)
0.0 60.0 120.0 180.0 240.0 300.0 0
3000
6000
9000
12000
15000
0
3000
6000
9000
12000
15000
0.00
4.00
8.00
12.00
16.00
20.00
Model indicates high complexity with insuffic ient frac widths to accept proppant, leading to screen-out in model (similar to actual one)
Figure 104. Net pressure match: Table Rock #124 Lower Weber and Dolomite
Table Rock 124 Lower Weber & Dolomite
17300
17350
17400
17450
17500
17550
17600
17650
17700
2 200GR
Logs : Table_Rock_124.LAS
17300
17350
17400
17450
17500
17550
17600
17650
17700
Rocktype
FracproPT Layer Pro...
Sandstone
Sandstone
Sandstone
Sandstone
DolomiteSandstoneSandstone
Sandstone
Sandstone
Sandstone
50 100 150 200 250 300 350 400
Concentration of Proppant in Fracture (lb/ft²)
0 0.03 0.06 0.09 0.12 0.15 0.18 0.21 0.24 0.27 0.30
Proppant Concentration (lb/ft²)
- very short frac - mainly covering dolomite
and upper perfs
Figure 105. Fracture geometry: Table Rock #124 Lower Weber and Dolomite
Stimulation Technologies for Deep Well Completions DE-FC26-02NT41663
5. Case History of Hydraulic Fracturing in Table Rock Field, WY
Pinnacle Technologies, Inc. 119
5.2.5 Table Rock #124 Upper Weber
The Upper Weber was fractured with a 25% CO2-assisted 50 to 60 lb/Mgal crosslinked gel (YF 850/860LPH). The mini-frac pressure falloff analysis (Figure 106) indicates rapid fluid leakoff with a closure stress of about 0.69 psi/ft. Although not as pronounced as in the other cases, the falloff exhibits some pressure-dependent leakoff. Similar to the lower stage, the treatment data in Figure 107 shows that bottomhole pressures immediately increase as 0.5 ppg, 30/60-bauxite enters the fracture, indicating small fracture widths and high fracture complexity. Treating pressures continued to rise but in this case the treatment was flushed and pumped to completion. The net pressure was matched using high fracture complexity and is shown in Figure 108.
The resulting model fracture geometry indicates a very short, 120-ft fracture (Figure 109). The after-frac tracer log for this stage (Figure 110) indicates that the two lowest set of perforations took most of the fracturing fluid and proppant, although some tracer was also found in some of the upper perforations. When comparing the tracer log with the fracture modeling results, it is unclear if the tracer is showing the total fracture height since fractures may not be fully aligned with the wellbore. If the fracture height covers the interval from the uppermost indication of tracer to the lowest, it coincides fairly well with the overall modeled fracture height of 230 ft. The tracer log generally shows that tracer is confined to each set of perforations with no apparent connection in between. This may indicate separate fractures not growing together. In the Lower Weber, only the lowest set of perforations was not stimulated. The tracer log appears to confirm the conclusion from fracture modeling that fracture complexity is high. Except for the exact position along the wellbore, the overall fracture heights of the top and bottom tracer roughly correspond to the overall fracture model heights. Once all zones were commingled, the well produced at an initial rate of about 6.5 MMCFD, with the Upper Weber contributing about 1.5 to 2 MMCFD.
Time (min)
Surf Press [Csg] (psi) Slurry Flow Rate (bpm)Proppant Conc (ppg) Meas'd Btmh (psi)Btm Prop Conc (ppg) CO2 Flow Rate (bpm)
0.0 60.0 120.0 180.0 240.0 300.0 0
4000
8000
12000
16000
20000
0.0
20.0
40.0
60.0
80.0
100.0
0.00
4.00
8.00
12.00
16.00
20.00
0
4000
8000
12000
16000
20000
0.00
4.00
8.00
12.00
16.00
20.00
0.0
20.0
40.0
60.0
80.0
100.0
Figure 106. Treatment data: Table Rock #124 Upper Weber
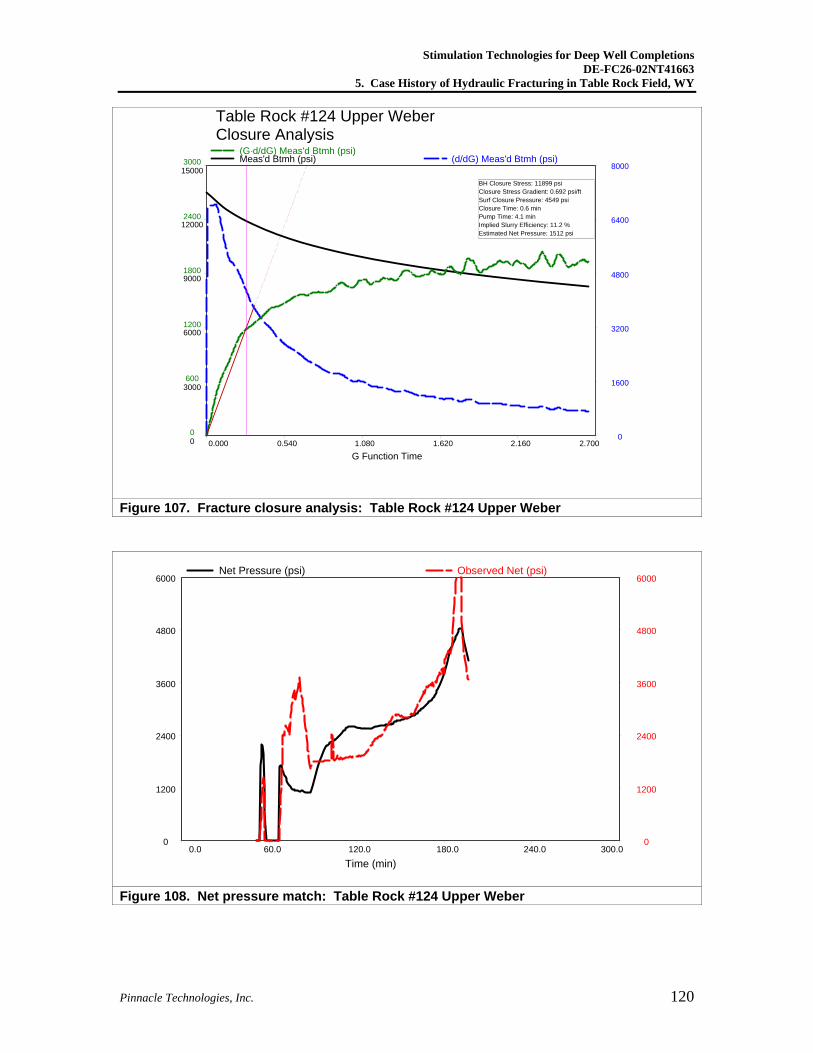
Stimulation Technologies for Deep Well Completions DE-FC26-02NT41663
5. Case History of Hydraulic Fracturing in Table Rock Field, WY
Pinnacle Technologies, Inc. 120
Table Rock #124 Upper WeberClosure Analysis
G Function Time
Meas'd Btmh (psi) (d/dG) Meas'd Btmh (psi)(G·d/dG) Meas'd Btmh (psi)
0.000 0.540 1.080 1.620 2.160 2.700 0
3000
6000
9000
12000
15000
0
1600
3200
4800
6400
8000
0
600
1200
1800
2400
3000
BH Closure Stress: 11899 psiClosure Stress Gradient: 0.692 psi/ftSurf Closure Pressure: 4549 psiClosure Time: 0.6 minPump Time: 4.1 minImplied Slurry Efficiency: 11.2 %Estimated Net Pressure: 1512 psi
Figure 107. Fracture closure analysis: Table Rock #124 Upper Weber
Time (min)
Net Pressure (psi) Observed Net (psi)
0.0 60.0 120.0 180.0 240.0 300.0 0
1200
2400
3600
4800
6000
0
1200
2400
3600
4800
6000
Figure 108. Net pressure match: Table Rock #124 Upper Weber
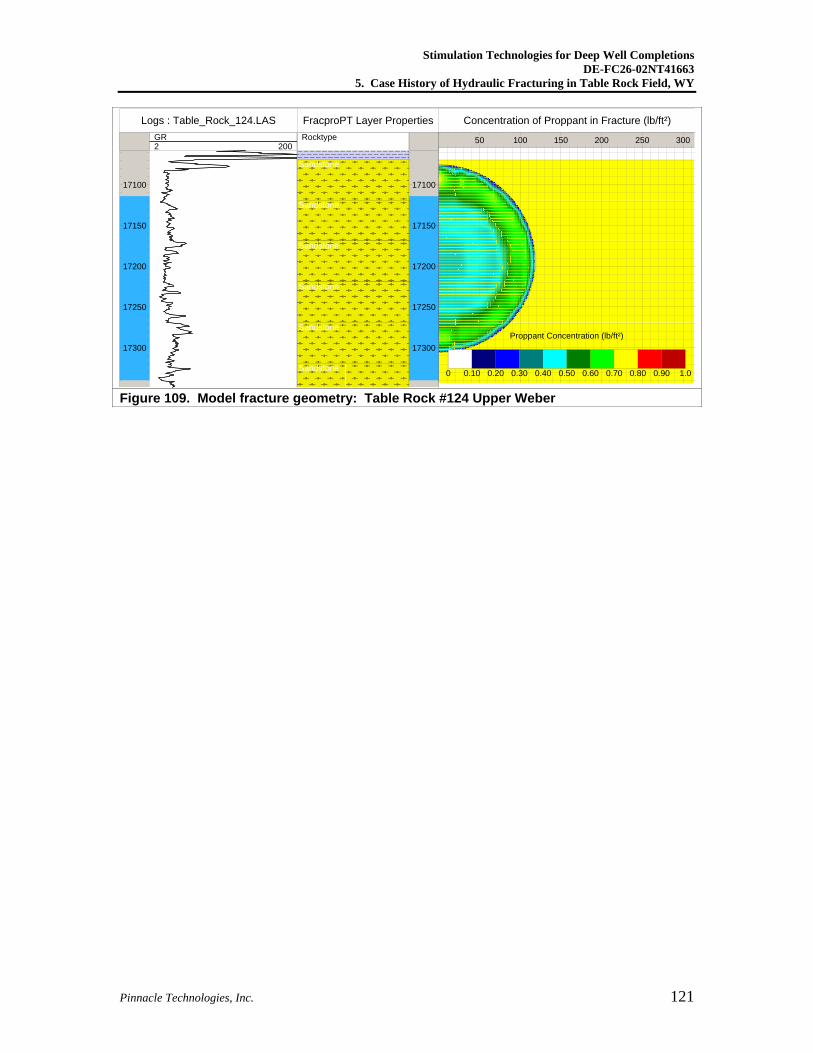
Stimulation Technologies for Deep Well Completions DE-FC26-02NT41663
5. Case History of Hydraulic Fracturing in Table Rock Field, WY
Pinnacle Technologies, Inc. 121
17100
17150
17200
17250
17300
2 200GR
Logs : Table_Rock_124.LAS
17100
17150
17200
17250
17300
Rocktype
FracproPT Layer Properties
Sandstone
Sandstone
Sandstone
Sandstone
Sandstone
Sandstone
50 100 150 200 250 300
Concentration of Proppant in Fracture (lb/ft²)
0 0.10 0.20 0.30 0.40 0.50 0.60 0.70 0.80 0.90 1.0
Proppant Concentration (lb/ft²)
Figure 109. Model fracture geometry: Table Rock #124 Upper Weber
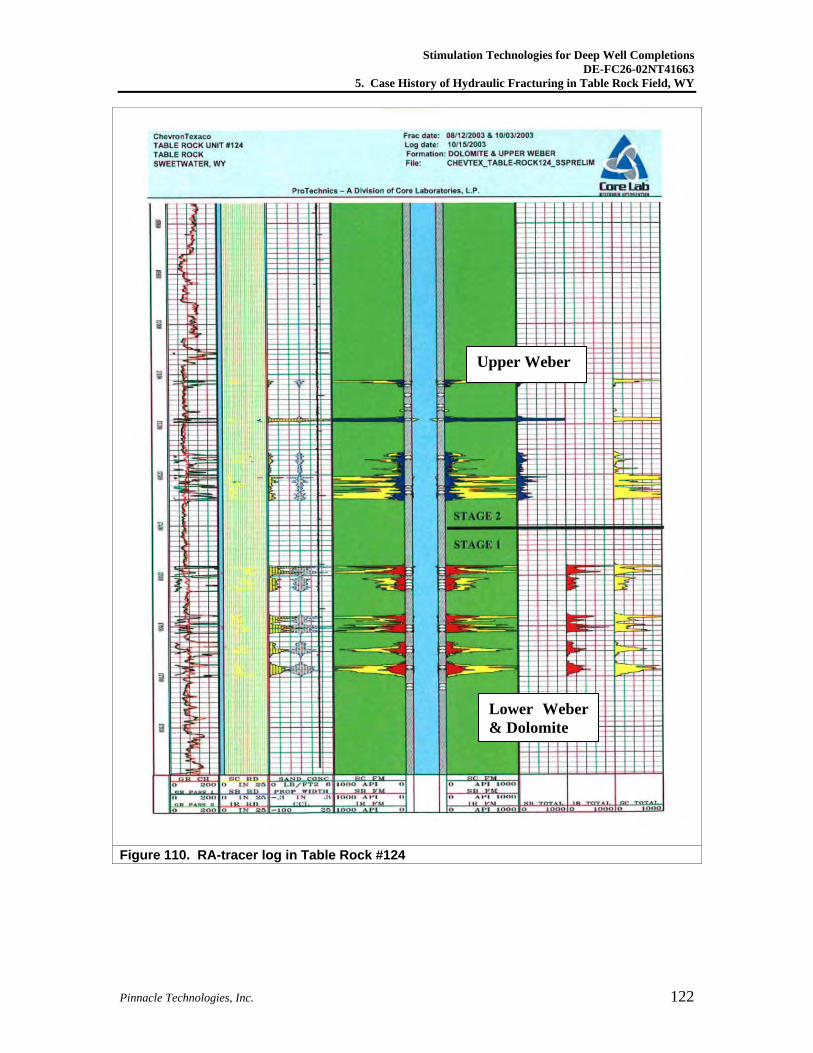
Stimulation Technologies for Deep Well Completions DE-FC26-02NT41663
5. Case History of Hydraulic Fracturing in Table Rock Field, WY
Pinnacle Technologies, Inc. 122
Figure 110. RA-tracer log in Table Rock #124
Upper Weber
Lower Weber & Dolomite
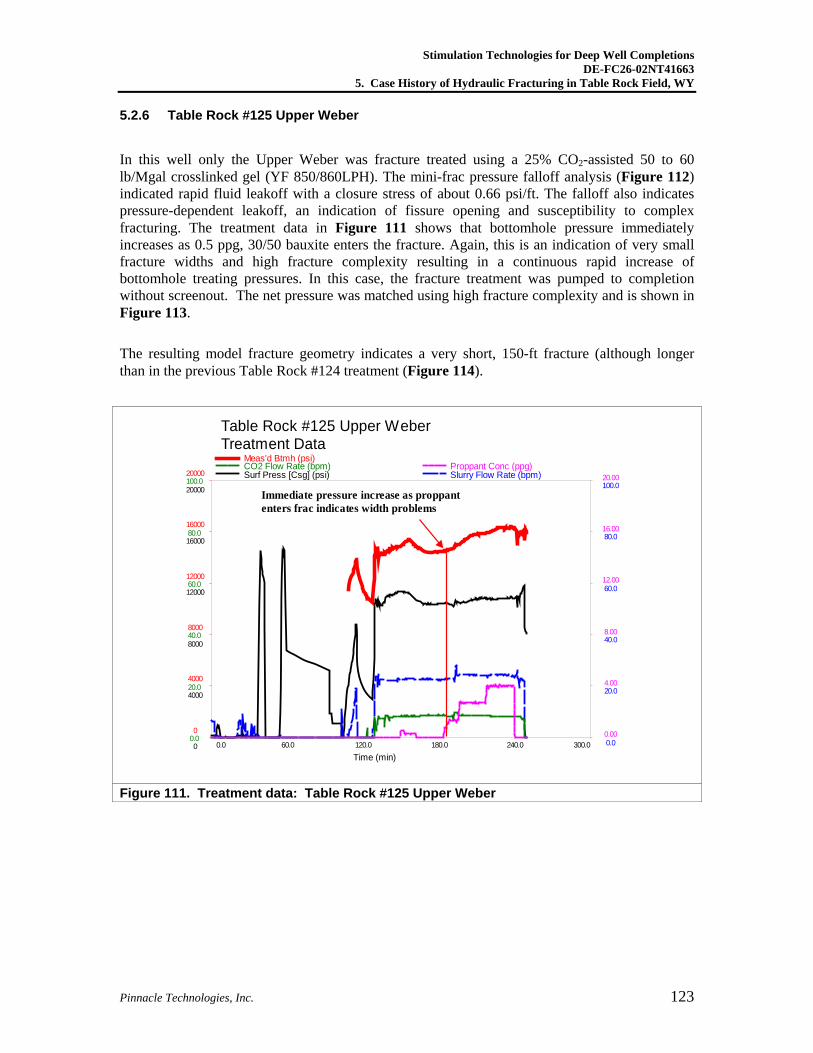
Stimulation Technologies for Deep Well Completions DE-FC26-02NT41663
5. Case History of Hydraulic Fracturing in Table Rock Field, WY
Pinnacle Technologies, Inc. 123
5.2.6 Table Rock #125 Upper Weber
In this well only the Upper Weber was fracture treated using a 25% CO2-assisted 50 to 60 lb/Mgal crosslinked gel (YF 850/860LPH). The mini-frac pressure falloff analysis (Figure 112) indicated rapid fluid leakoff with a closure stress of about 0.66 psi/ft. The falloff also indicates pressure-dependent leakoff, an indication of fissure opening and susceptibility to complex fracturing. The treatment data in Figure 111 shows that bottomhole pressure immediately increases as 0.5 ppg, 30/50 bauxite enters the fracture. Again, this is an indication of very small fracture widths and high fracture complexity resulting in a continuous rapid increase of bottomhole treating pressures. In this case, the fracture treatment was pumped to completion without screenout. The net pressure was matched using high fracture complexity and is shown in Figure 113.
The resulting model fracture geometry indicates a very short, 150-ft fracture (although longer than in the previous Table Rock #124 treatment (Figure 114).
Table Rock #125 Upper WeberTreatment Data
Time (min)
Surf Press [Csg] (psi) Slurry Flow Rate (bpm)CO2 Flow Rate (bpm) Proppant Conc (ppg)Meas'd Btmh (psi)
0.0 60.0 120.0 180.0 240.0 300.0 0
4000
8000
12000
16000
20000
0.0
20.0
40.0
60.0
80.0
100.0
0.0
20.0
40.0
60.0
80.0
100.0
0.00
4.00
8.00
12.00
16.00
20.00
0
4000
8000
12000
16000
20000
Immediate pressure increase as proppant enters frac indicates width problems
Figure 111. Treatment data: Table Rock #125 Upper Weber
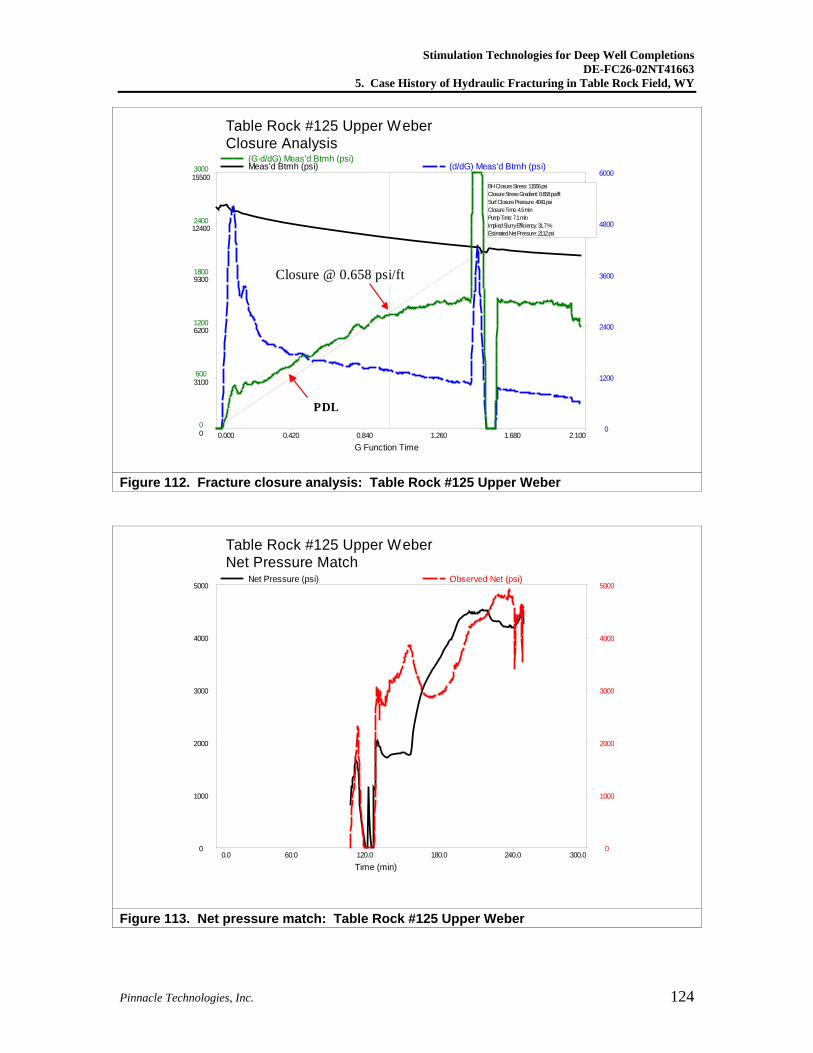
Stimulation Technologies for Deep Well Completions DE-FC26-02NT41663
5. Case History of Hydraulic Fracturing in Table Rock Field, WY
Pinnacle Technologies, Inc. 124
Table Rock #125 Upper WeberClosure Analysis
G Function Time
Meas'd Btmh (psi) (d/dG) Meas'd Btmh (psi)(G·d/dG) Meas'd Btmh (psi)
0.000 0.420 0.840 1.260 1.680 2.100 0
3100
6200
9300
12400
15500
0
1200
2400
3600
4800
6000
0
600
1200
1800
2400
3000
BH Closure Stress: 11556 psiClosure Stress Gradient: 0.658 psi/ftSurf Closure Pressure: 4041 psiClosure Time: 4.5 minPump Time: 7.1 minImplied Slurry Efficiency: 31.7 %Estimated Net Pressure: 2112 psi
Closure @ 0.658 psi/ft
PDL
Table Rock #125 Upper WeberClosure Analysis
G Function Time
Meas'd Btmh (psi) (d/dG) Meas'd Btmh (psi)(G·d/dG) Meas'd Btmh (psi)
0.000 0.420 0.840 1.260 1.680 2.100 0
3100
6200
9300
12400
15500
0
1200
2400
3600
4800
6000
0
600
1200
1800
2400
3000
BH Closure Stress: 11556 psiClosure Stress Gradient: 0.658 psi/ftSurf Closure Pressure: 4041 psiClosure Time: 4.5 minPump Time: 7.1 minImplied Slurry Efficiency: 31.7 %Estimated Net Pressure: 2112 psi
Closure @ 0.658 psi/ft
PDL
Figure 112. Fracture closure analysis: Table Rock #125 Upper Weber
Table Rock #125 Upper WeberNet Pressure Match
Time (min)
Net Pressure (psi) Observed Net (psi)
0.0 60.0 120.0 180.0 240.0 300.0 0
1000
2000
3000
4000
5000
0
1000
2000
3000
4000
5000
Figure 113. Net pressure match: Table Rock #125 Upper Weber
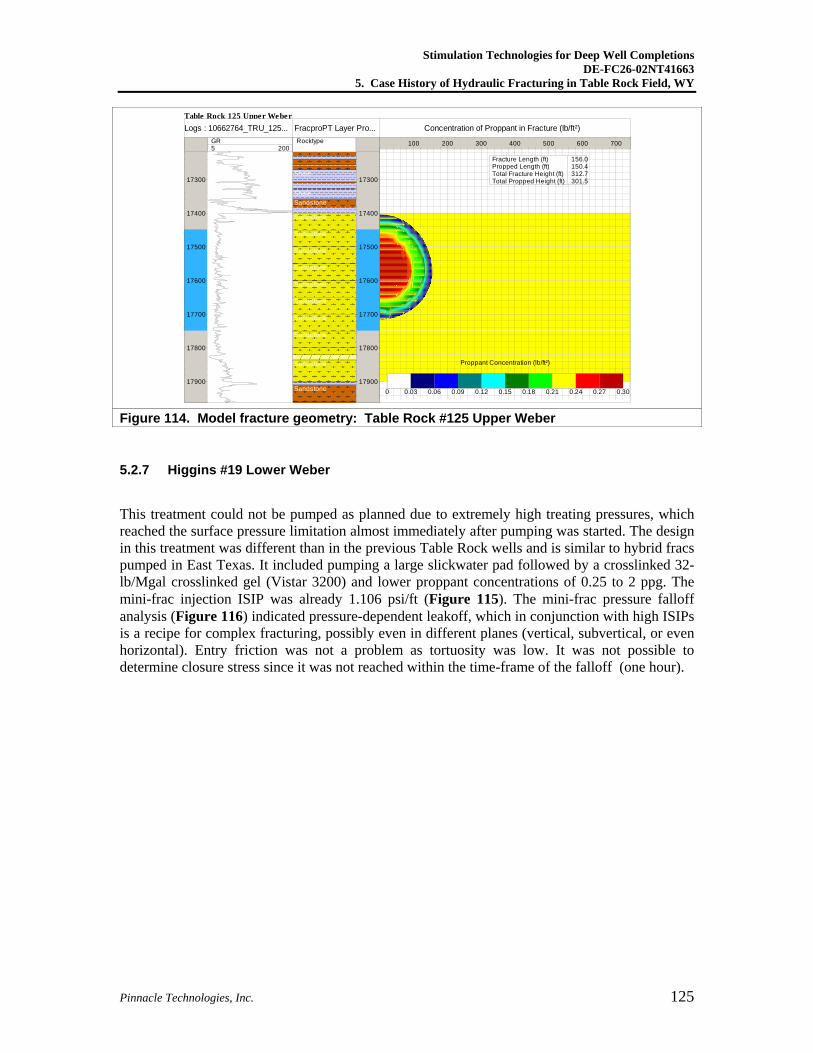
Stimulation Technologies for Deep Well Completions DE-FC26-02NT41663
5. Case History of Hydraulic Fracturing in Table Rock Field, WY
Pinnacle Technologies, Inc. 125
Table Rock 125 Upper Weber
17300
17400
17500
17600
17700
17800
17900
5 200GR
Logs : 10662764_TRU_125...
17300
17400
17500
17600
17700
17800
17900
Rocktype
FracproPT Layer Pro...
Shale
ShaleSandstone
Sandstone
Sandstone
Sandstone
Sandstone
Sandstone
Sandstone
Sandstone
Sandstone
Sandstone
Sandstone
100 200 300 400 500 600 700
Concentration of Proppant in Fracture (lb/ft²)
0 0.03 0.06 0.09 0.12 0.15 0.18 0.21 0.24 0.27 0.30
Proppant Concentration (lb/ft²)
Fracture Length (ft)Propped Length (ft)Total Fracture Height (ft)Total Propped Height (ft)
156.0 150.4 312.7 301.5
Figure 114. Model fracture geometry: Table Rock #125 Upper Weber
5.2.7 Higgins #19 Lower Weber
This treatment could not be pumped as planned due to extremely high treating pressures, which reached the surface pressure limitation almost immediately after pumping was started. The design in this treatment was different than in the previous Table Rock wells and is similar to hybrid fracs pumped in East Texas. It included pumping a large slickwater pad followed by a crosslinked 32-lb/Mgal crosslinked gel (Vistar 3200) and lower proppant concentrations of 0.25 to 2 ppg. The mini-frac injection ISIP was already 1.106 psi/ft (Figure 115). The mini-frac pressure falloff analysis (Figure 116) indicated pressure-dependent leakoff, which in conjunction with high ISIPs is a recipe for complex fracturing, possibly even in different planes (vertical, subvertical, or even horizontal). Entry friction was not a problem as tortuosity was low. It was not possible to determine closure stress since it was not reached within the time-frame of the falloff (one hour).
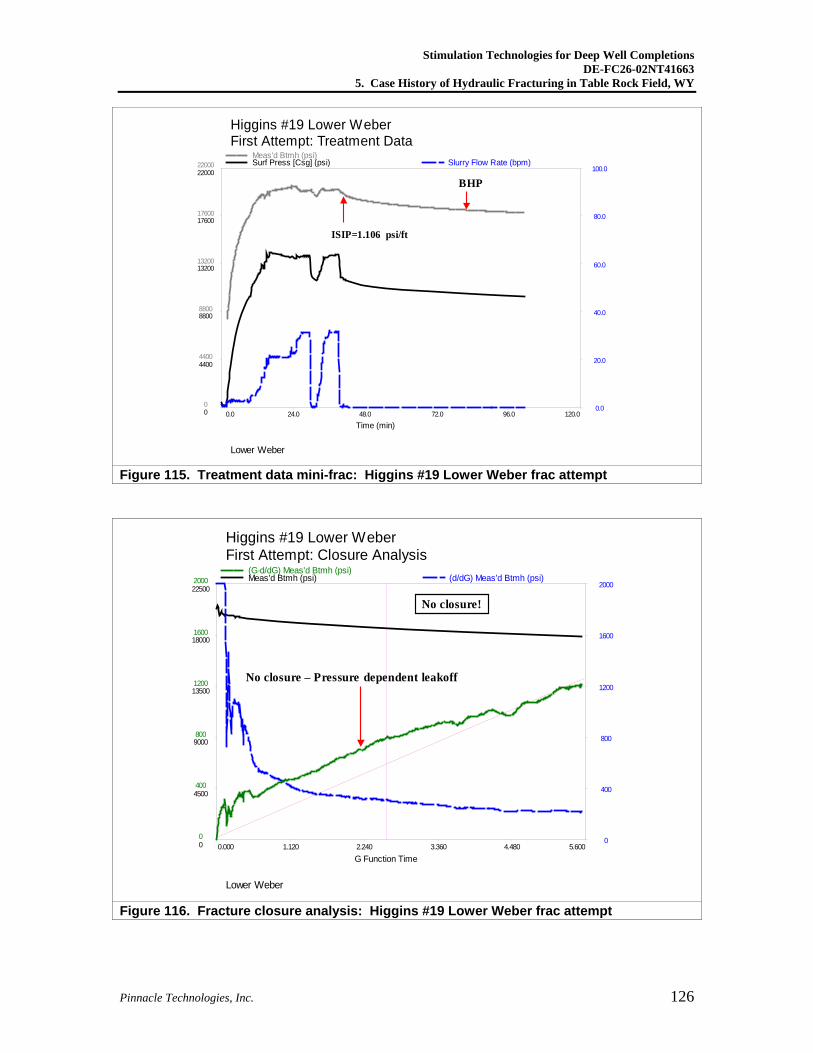
Stimulation Technologies for Deep Well Completions DE-FC26-02NT41663
5. Case History of Hydraulic Fracturing in Table Rock Field, WY
Pinnacle Technologies, Inc. 126
Higgins #19 Lower Weber First Attempt: Treatment Data
Lower Weber
Time (min)
Surf Press [Csg] (psi) Slurry Flow Rate (bpm)Meas'd Btmh (psi)
0.0 24.0 48.0 72.0 96.0 120.0 0
4400
8800
13200
17600
22000
0.0
20.0
40.0
60.0
80.0
100.0
0
4400
8800
13200
17600
22000
BHP
ISIP=1.106 psi/ft
Higgins #19 Lower Weber First Attempt: Treatment Data
Lower Weber
Time (min)
Surf Press [Csg] (psi) Slurry Flow Rate (bpm)Meas'd Btmh (psi)
0.0 24.0 48.0 72.0 96.0 120.0 0
4400
8800
13200
17600
22000
0.0
20.0
40.0
60.0
80.0
100.0
0
4400
8800
13200
17600
22000
BHP
ISIP=1.106 psi/ft
Figure 115. Treatment data mini-frac: Higgins #19 Lower Weber frac attempt
Higgins #19 Lower Weber First Attempt: Closure Analysis
Lower Weber
G Function Time
Meas'd Btmh (psi) (d/dG) Meas'd Btmh (psi)(G·d/dG) Meas'd Btmh (psi)
0.000 1.120 2.240 3.360 4.480 5.600 0
4500
9000
13500
18000
22500
0
400
800
1200
1600
2000
0
400
800
1200
1600
2000
No closure – Pressure dependent leakoff
No closure!
Higgins #19 Lower Weber First Attempt: Closure Analysis
Lower Weber
G Function Time
Meas'd Btmh (psi) (d/dG) Meas'd Btmh (psi)(G·d/dG) Meas'd Btmh (psi)
0.000 1.120 2.240 3.360 4.480 5.600 0
4500
9000
13500
18000
22500
0
400
800
1200
1600
2000
0
400
800
1200
1600
2000
No closure – Pressure dependent leakoff
No closure!
Figure 116. Fracture closure analysis: Higgins #19 Lower Weber frac attempt
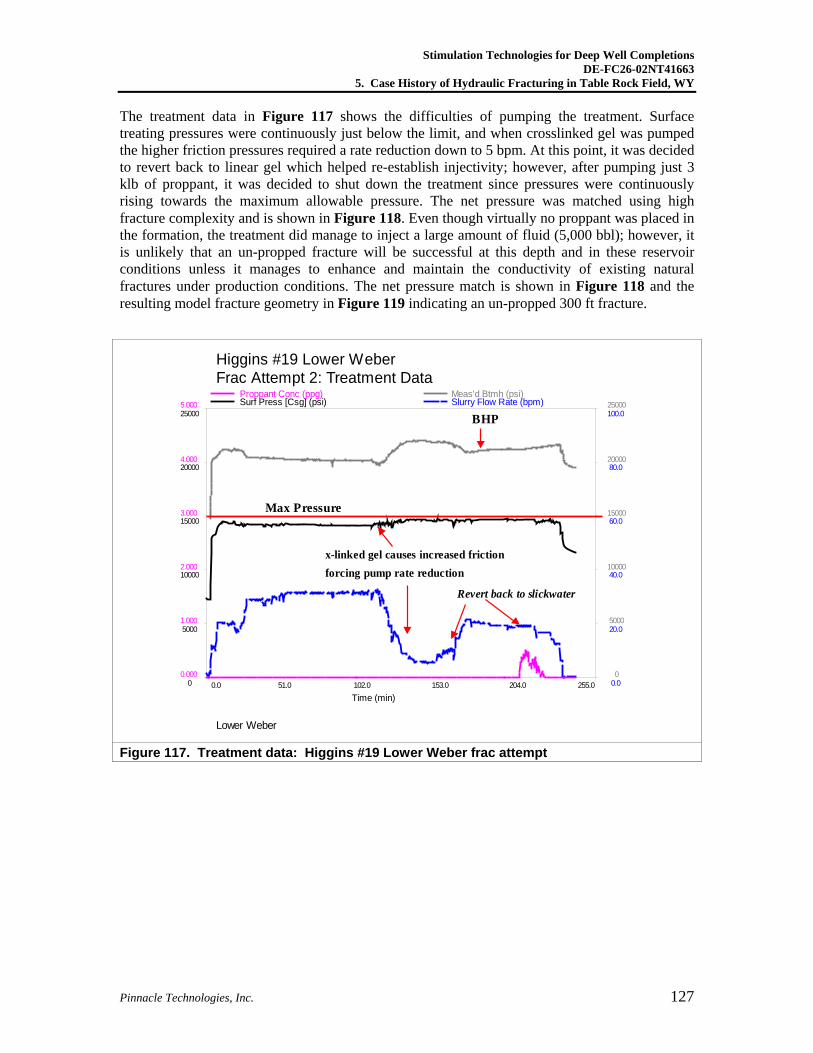
Stimulation Technologies for Deep Well Completions DE-FC26-02NT41663
5. Case History of Hydraulic Fracturing in Table Rock Field, WY
Pinnacle Technologies, Inc. 127
The treatment data in Figure 117 shows the difficulties of pumping the treatment. Surface treating pressures were continuously just below the limit, and when crosslinked gel was pumped the higher friction pressures required a rate reduction down to 5 bpm. At this point, it was decided to revert back to linear gel which helped re-establish injectivity; however, after pumping just 3 klb of proppant, it was decided to shut down the treatment since pressures were continuously rising towards the maximum allowable pressure. The net pressure was matched using high fracture complexity and is shown in Figure 118. Even though virtually no proppant was placed in the formation, the treatment did manage to inject a large amount of fluid (5,000 bbl); however, it is unlikely that an un-propped fracture will be successful at this depth and in these reservoir conditions unless it manages to enhance and maintain the conductivity of existing natural fractures under production conditions. The net pressure match is shown in Figure 118 and the resulting model fracture geometry in Figure 119 indicating an un-propped 300 ft fracture.
Higgins #19 Lower Weber Frac Attempt 2: Treatment Data
Lower Weber
Time (min)
Surf Press [Csg] (psi) Slurry Flow Rate (bpm)Proppant Conc (ppg) Meas'd Btmh (psi)
0.0 51.0 102.0 153.0 204.0 255.0 0
5000
10000
15000
20000
25000
0.0
20.0
40.0
60.0
80.0
100.0
0.000
1.000
2.000
3.000
4.000
5.000
0
5000
10000
15000
20000
25000
BHP
x-linked gel causes increased friction forcing pump rate reduction
Max Pressure
Revert back to slickwater
Figure 117. Treatment data: Higgins #19 Lower Weber frac attempt
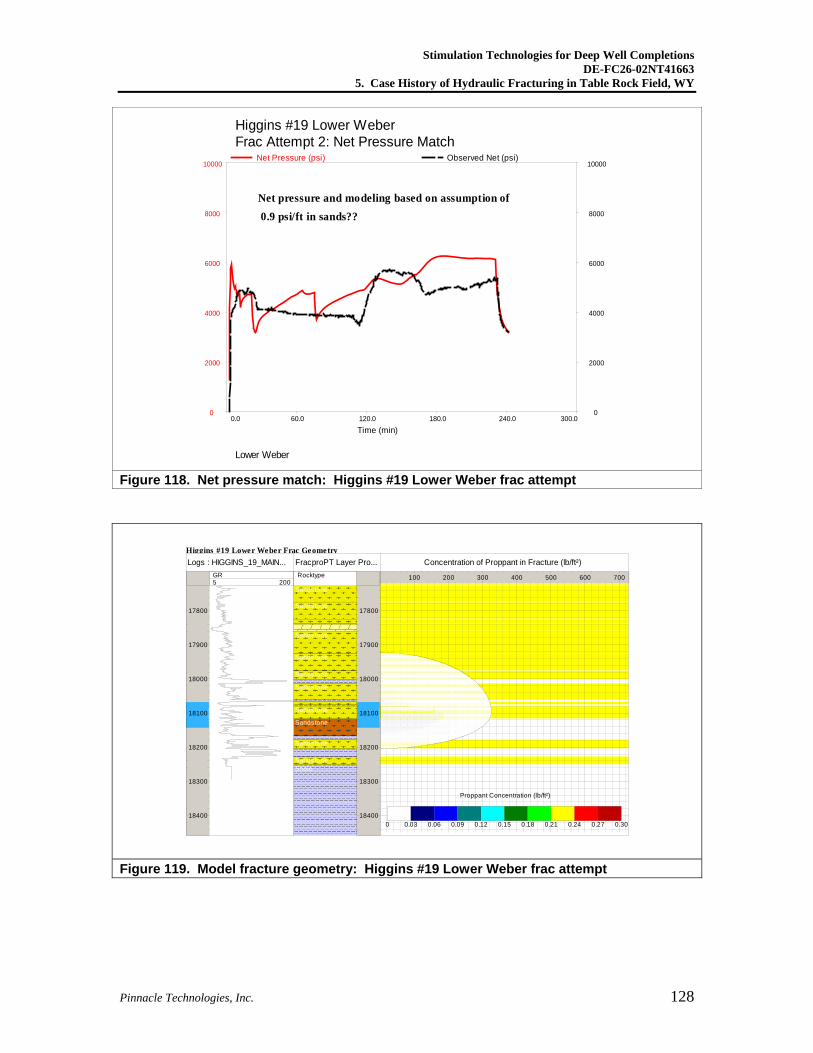
Stimulation Technologies for Deep Well Completions DE-FC26-02NT41663
5. Case History of Hydraulic Fracturing in Table Rock Field, WY
Pinnacle Technologies, Inc. 128
Higgins #19 Lower Weber Frac Attempt 2: Net Pressure Match
Lower Weber
Time (min)
Net Pressure (psi) Observed Net (psi)
0.0 60.0 120.0 180.0 240.0 300.0 0
2000
4000
6000
8000
10000
0
2000
4000
6000
8000
10000
Net pressure and modeling based on assumption of0.9 psi/ft in sands??
Higgins #19 Lower Weber Frac Attempt 2: Net Pressure Match
Lower Weber
Time (min)
Net Pressure (psi) Observed Net (psi)
0.0 60.0 120.0 180.0 240.0 300.0 0
2000
4000
6000
8000
10000
0
2000
4000
6000
8000
10000
Net pressure and modeling based on assumption of0.9 psi/ft in sands??
Figure 118. Net pressure match: Higgins #19 Lower Weber frac attempt
Higgins #19 Lower Weber Frac Geometry
17800
17900
18000
18100
18200
18300
18400
5 200GR
Logs : HIGGINS_19_MAIN...
17800
17900
18000
18100
18200
18300
18400
Rocktype
FracproPT Layer Pro...
Sandstone
Sandstone
Sandstone
Sandstone
Sandstone
Sandstone
Sandstone
Sandstone
Sandstone
SandstoneShale
100 200 300 400 500 600 700
Concentration of Proppant in Fracture (lb/ft²)
0 0.03 0.06 0.09 0.12 0.15 0.18 0.21 0.24 0.27 0.30
Proppant Concentration (lb/ft²)
Figure 119. Model fracture geometry: Higgins #19 Lower Weber frac attempt
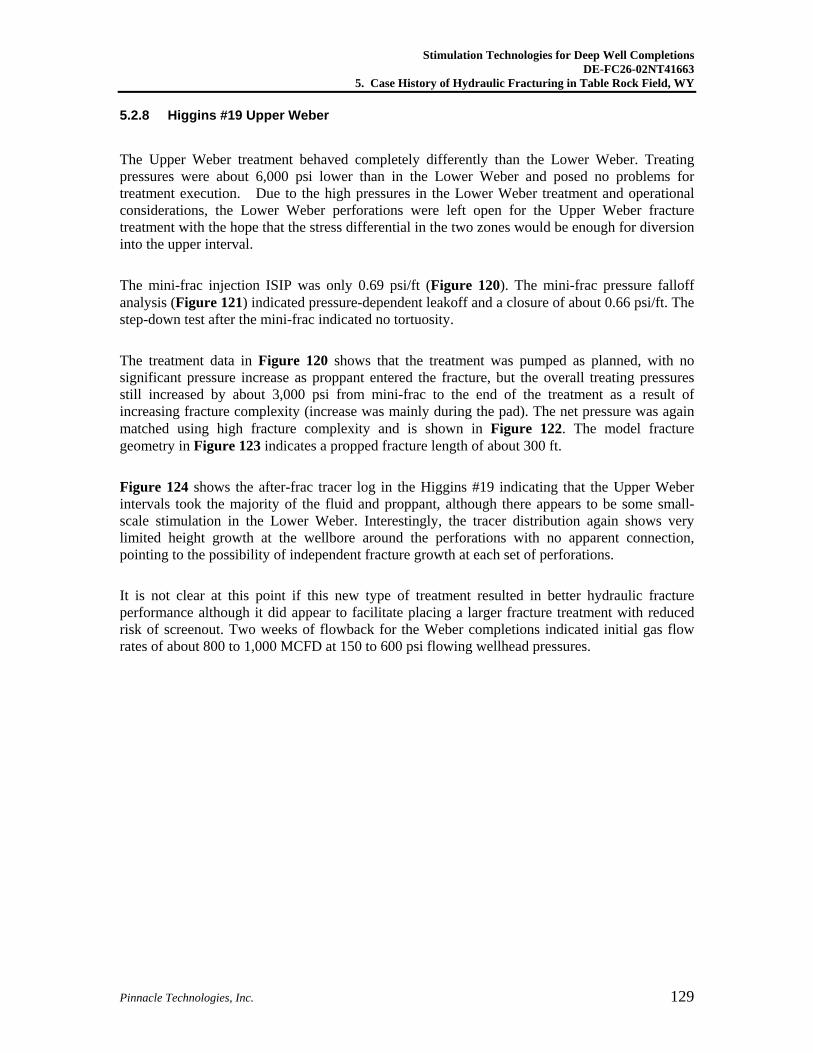
Stimulation Technologies for Deep Well Completions DE-FC26-02NT41663
5. Case History of Hydraulic Fracturing in Table Rock Field, WY
Pinnacle Technologies, Inc. 129
5.2.8 Higgins #19 Upper Weber
The Upper Weber treatment behaved completely differently than the Lower Weber. Treating pressures were about 6,000 psi lower than in the Lower Weber and posed no problems for treatment execution. Due to the high pressures in the Lower Weber treatment and operational considerations, the Lower Weber perforations were left open for the Upper Weber fracture treatment with the hope that the stress differential in the two zones would be enough for diversion into the upper interval.
The mini-frac injection ISIP was only 0.69 psi/ft (Figure 120). The mini-frac pressure falloff analysis (Figure 121) indicated pressure-dependent leakoff and a closure of about 0.66 psi/ft. The step-down test after the mini-frac indicated no tortuosity.
The treatment data in Figure 120 shows that the treatment was pumped as planned, with no significant pressure increase as proppant entered the fracture, but the overall treating pressures still increased by about 3,000 psi from mini-frac to the end of the treatment as a result of increasing fracture complexity (increase was mainly during the pad). The net pressure was again matched using high fracture complexity and is shown in Figure 122. The model fracture geometry in Figure 123 indicates a propped fracture length of about 300 ft.
Figure 124 shows the after-frac tracer log in the Higgins #19 indicating that the Upper Weber intervals took the majority of the fluid and proppant, although there appears to be some small-scale stimulation in the Lower Weber. Interestingly, the tracer distribution again shows very limited height growth at the wellbore around the perforations with no apparent connection, pointing to the possibility of independent fracture growth at each set of perforations.
It is not clear at this point if this new type of treatment resulted in better hydraulic fracture performance although it did appear to facilitate placing a larger fracture treatment with reduced risk of screenout. Two weeks of flowback for the Weber completions indicated initial gas flow rates of about 800 to 1,000 MCFD at 150 to 600 psi flowing wellhead pressures.
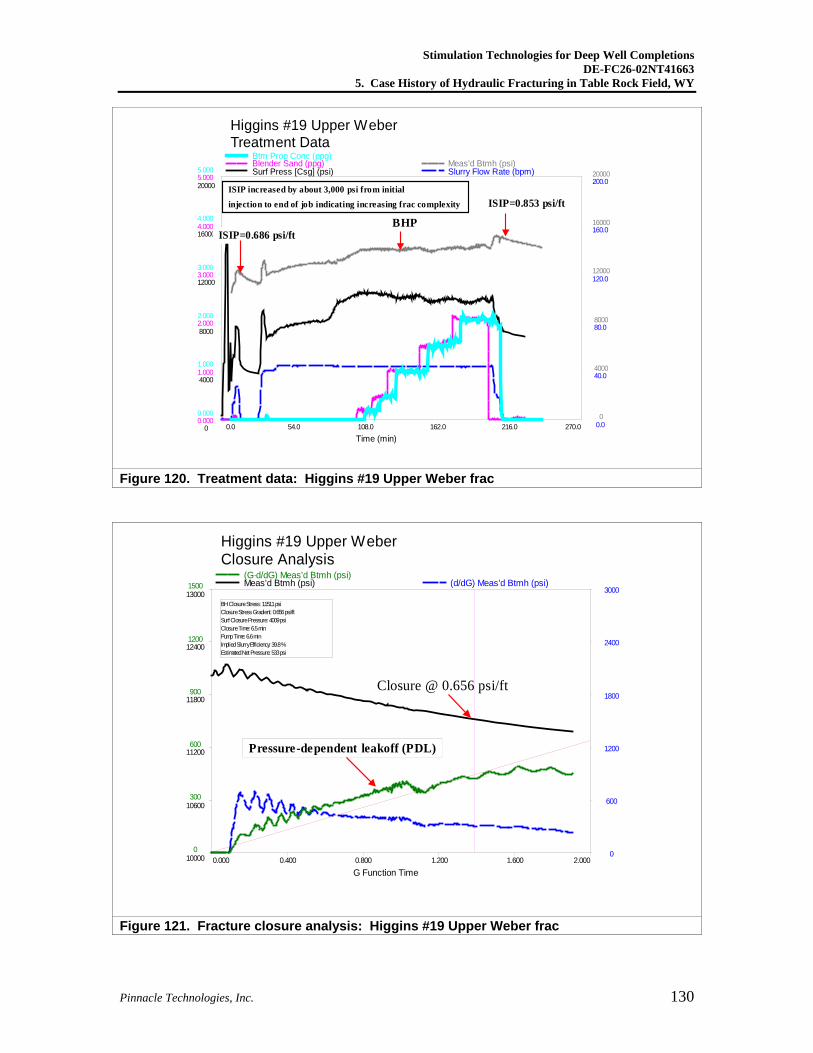
Stimulation Technologies for Deep Well Completions DE-FC26-02NT41663
5. Case History of Hydraulic Fracturing in Table Rock Field, WY
Pinnacle Technologies, Inc. 130
Higgins #19 Upper Weber Treatment Data
Time (min)
Surf Press [Csg] (psi) Slurry Flow Rate (bpm)Blender Sand (ppg) Meas'd Btmh (psi)Btm Prop Conc (ppg)
0.0 54.0 108.0 162.0 216.0 270.0 0
4000
8000
12000
16000
20000
0.0
40.0
80.0
120.0
160.0
200.0
0.000
1.000
2.000
3.000
4.000
5.000
0
4000
8000
12000
16000
20000
0.000
1.000
2.000
3.000
4.000
5.000
BHPISIP=0.686 psi/ft
ISIP=0.853 psi/ftISIP increased by about 3,000 psi from initial injection to end of job indicating increasing frac complexity
Figure 120. Treatment data: Higgins #19 Upper Weber frac
Higgins #19 Upper Weber Closure Analysis
G Function Time
Meas'd Btmh (psi) (d/dG) Meas'd Btmh (psi)(G·d/dG) Meas'd Btmh (psi)
0.000 0.400 0.800 1.200 1.600 2.000 10000
10600
11200
11800
12400
13000
0
600
1200
1800
2400
3000
0
300
600
900
1200
1500
BH Closure Stress: 11511 psiClosure Stress Gradient: 0.656 psi/ftSurf Closure Pressure: 4009 psiClosure Time: 6.5 minPump Time: 6.6 minImplied Slurry Efficiency: 39.8 %Estimated Net Pressure: 533 psi
Closure @ 0.656 psi/ft
Pressure-dependent leakoff (PDL)
Figure 121. Fracture closure analysis: Higgins #19 Upper Weber frac
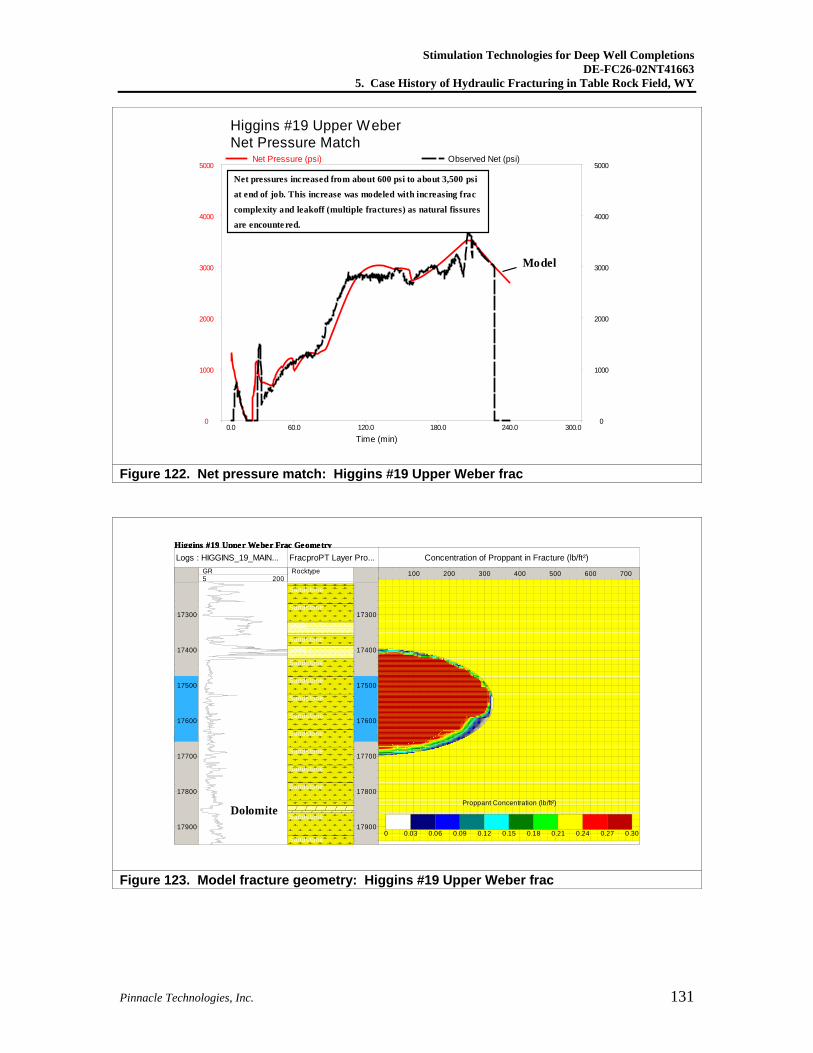
Stimulation Technologies for Deep Well Completions DE-FC26-02NT41663
5. Case History of Hydraulic Fracturing in Table Rock Field, WY
Pinnacle Technologies, Inc. 131
Higgins #19 Upper Weber Net Pressure Match
Time (min)
Net Pressure (psi) Observed Net (psi)
0.0 60.0 120.0 180.0 240.0 300.0 0
1000
2000
3000
4000
5000
0
1000
2000
3000
4000
5000
Net pressures increased from about 600 psi to about 3,500 psiat end of job. This increase was modeled with increasing frac complexity and leakoff (multiple fractures) as natural fissures are encounte red.
Model
Figure 122. Net pressure match: Higgins #19 Upper Weber frac
Higgins #19 Upper Weber Frac Geometry
17300
17400
17500
17600
17700
17800
17900
5 200GR
Logs : HIGGINS_19_MAIN...
17300
17400
17500
17600
17700
17800
17900
Rocktype
FracproPT Layer Pro...
Sandstone
Sandstone
Shale
SandstoneShale
Sandstone
Sandstone
Sandstone
Sandstone
Sandstone
Sandstone
Sandstone
Sandstone
Sandstone
Sandstone
100 200 300 400 500 600 700
Concentration of Proppant in Fracture (lb/ft²)
0 0.03 0.06 0.09 0.12 0.15 0.18 0.21 0.24 0.27 0.30
Proppant Concentration (lb/ft²)Dolomite
Figure 123. Model fracture geometry: Higgins #19 Upper Weber frac
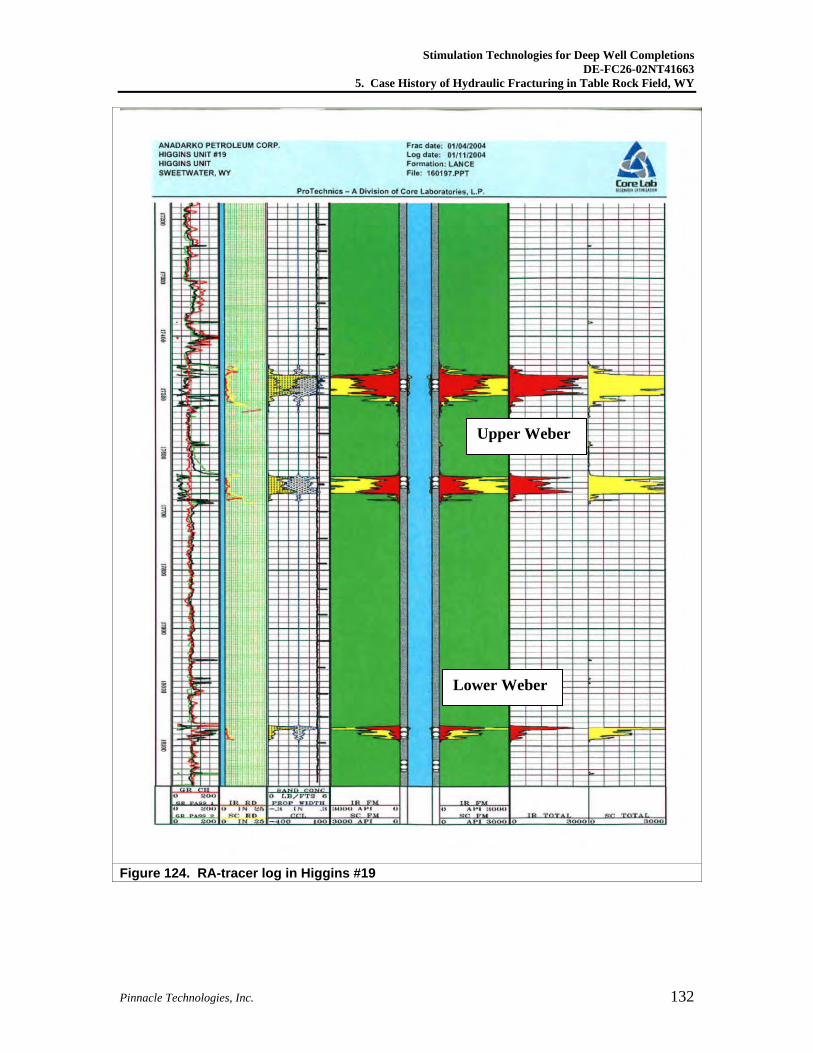
Stimulation Technologies for Deep Well Completions DE-FC26-02NT41663
5. Case History of Hydraulic Fracturing in Table Rock Field, WY
Pinnacle Technologies, Inc. 132
Figure 124. RA-tracer log in Higgins #19
Upper Weber
Lower Weber
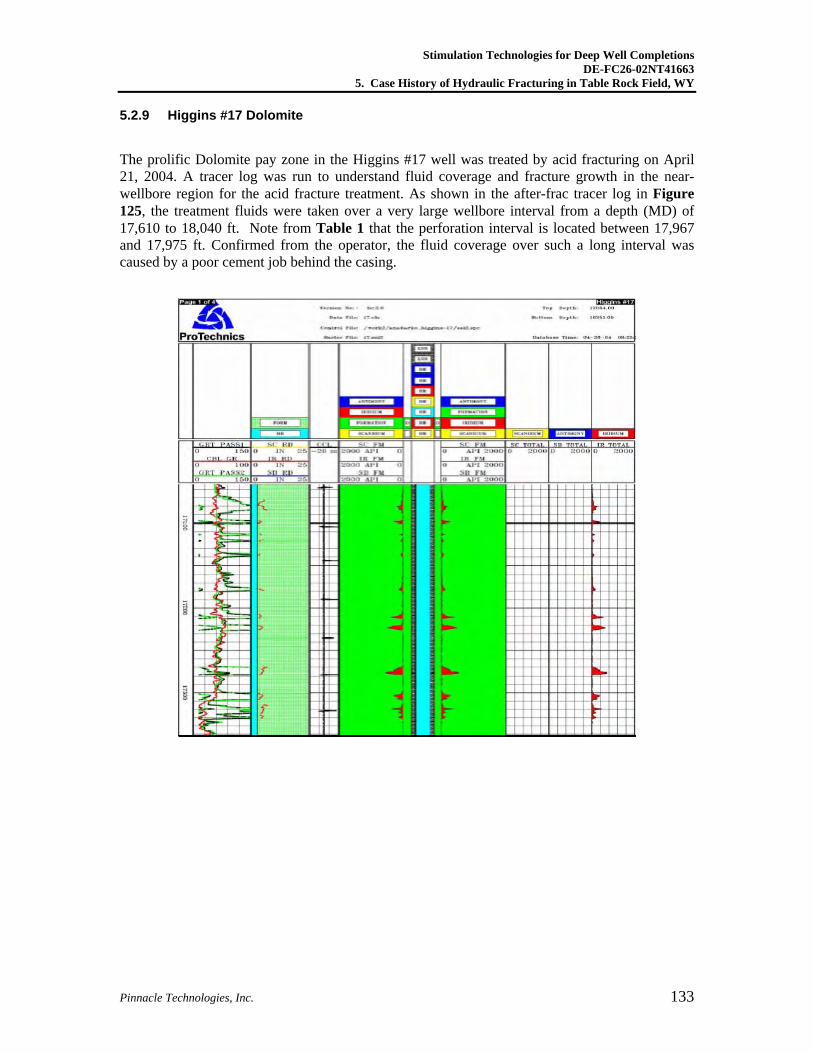
Stimulation Technologies for Deep Well Completions DE-FC26-02NT41663
5. Case History of Hydraulic Fracturing in Table Rock Field, WY
Pinnacle Technologies, Inc. 133
5.2.9 Higgins #17 Dolomite
The prolific Dolomite pay zone in the Higgins #17 well was treated by acid fracturing on April 21, 2004. A tracer log was run to understand fluid coverage and fracture growth in the near-wellbore region for the acid fracture treatment. As shown in the after-frac tracer log in Figure 125, the treatment fluids were taken over a very large wellbore interval from a depth (MD) of 17,610 to 18,040 ft. Note from Table 1 that the perforation interval is located between 17,967 and 17,975 ft. Confirmed from the operator, the fluid coverage over such a long interval was caused by a poor cement job behind the casing.
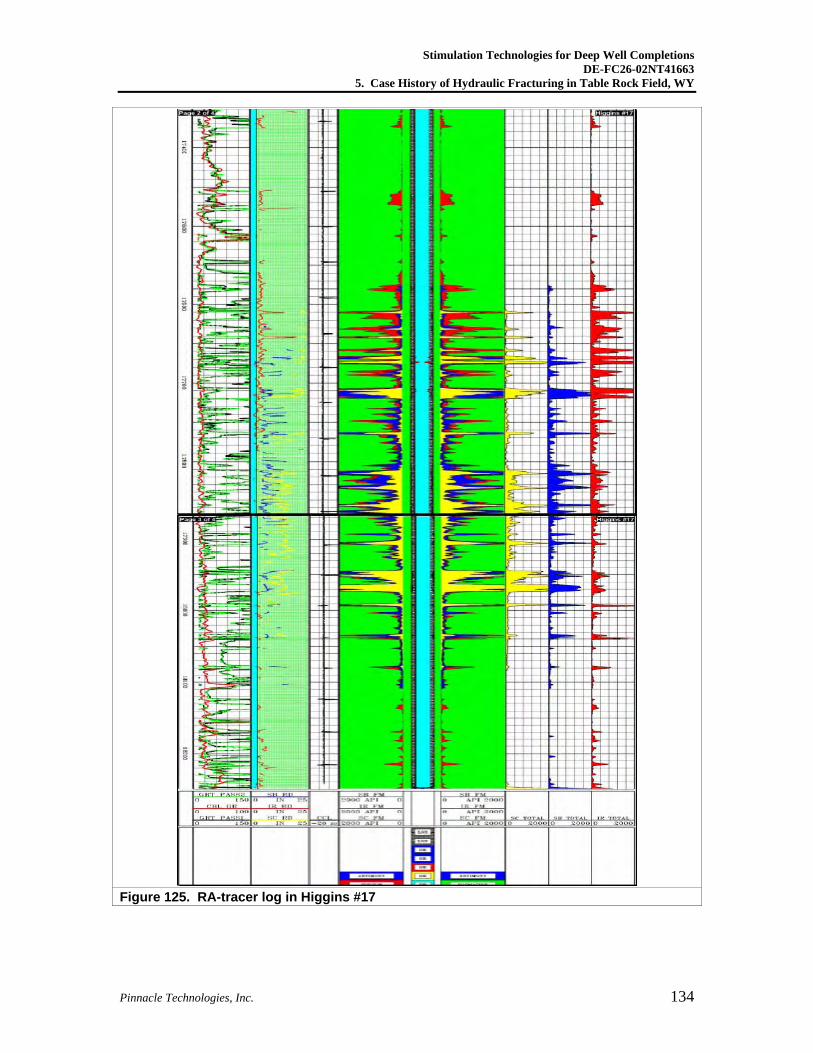
Stimulation Technologies for Deep Well Completions DE-FC26-02NT41663
5. Case History of Hydraulic Fracturing in Table Rock Field, WY
Pinnacle Technologies, Inc. 134
Figure 125. RA-tracer log in Higgins #17
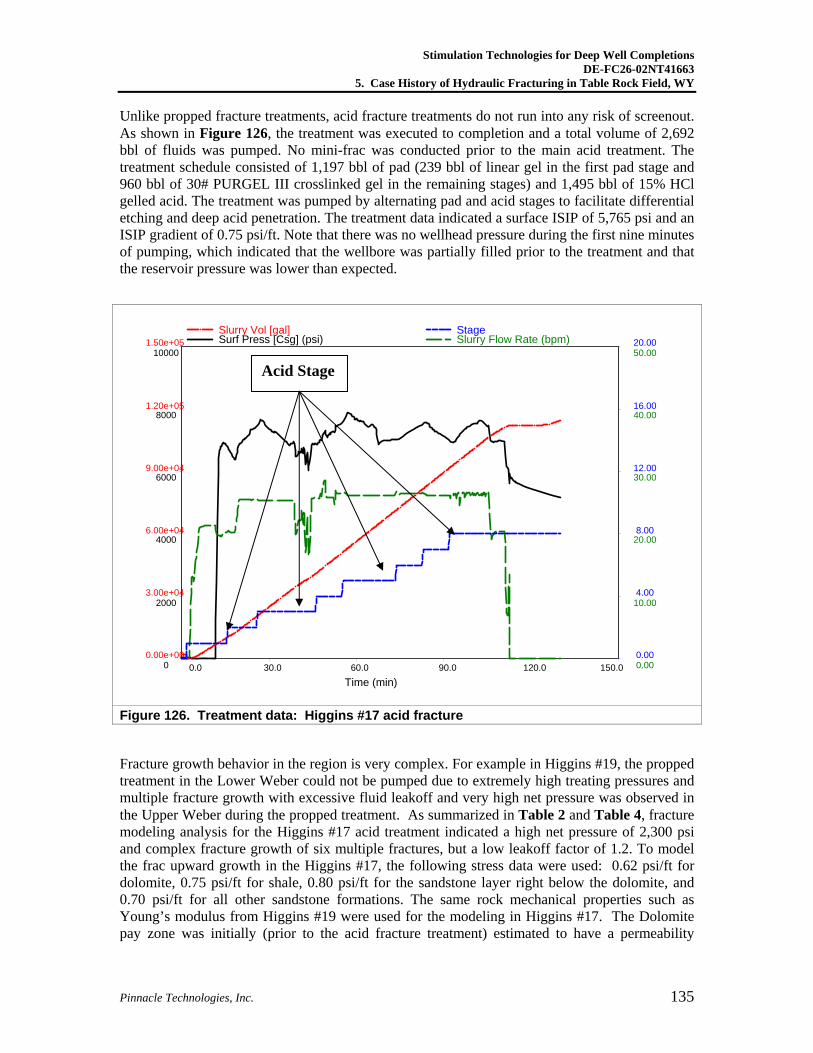
Stimulation Technologies for Deep Well Completions DE-FC26-02NT41663
5. Case History of Hydraulic Fracturing in Table Rock Field, WY
Pinnacle Technologies, Inc. 135
Unlike propped fracture treatments, acid fracture treatments do not run into any risk of screenout. As shown in Figure 126, the treatment was executed to completion and a total volume of 2,692 bbl of fluids was pumped. No mini-frac was conducted prior to the main acid treatment. The treatment schedule consisted of 1,197 bbl of pad (239 bbl of linear gel in the first pad stage and 960 bbl of 30# PURGEL III crosslinked gel in the remaining stages) and 1,495 bbl of 15% HCl gelled acid. The treatment was pumped by alternating pad and acid stages to facilitate differential etching and deep acid penetration. The treatment data indicated a surface ISIP of 5,765 psi and an ISIP gradient of 0.75 psi/ft. Note that there was no wellhead pressure during the first nine minutes of pumping, which indicated that the wellbore was partially filled prior to the treatment and that the reservoir pressure was lower than expected.
Time (min)
Surf Press [Csg] (psi) Slurry Flow Rate (bpm)Slurry Vol [gal] Stage
0.0 30.0 60.0 90.0 120.0 150.0 0
2000
4000
6000
8000
10000
0.00
10.00
20.00
30.00
40.00
50.00
0.00e+00
3.00e+04
6.00e+04
9.00e+04
1.20e+05
1.50e+05
0.00
4.00
8.00
12.00
16.00
20.00
Figure 126. Treatment data: Higgins #17 acid fracture
Fracture growth behavior in the region is very complex. For example in Higgins #19, the propped treatment in the Lower Weber could not be pumped due to extremely high treating pressures and multiple fracture growth with excessive fluid leakoff and very high net pressure was observed in the Upper Weber during the propped treatment. As summarized in Table 2 and Table 4, fracture modeling analysis for the Higgins #17 acid treatment indicated a high net pressure of 2,300 psi and complex fracture growth of six multiple fractures, but a low leakoff factor of 1.2. To model the frac upward growth in the Higgins #17, the following stress data were used: 0.62 psi/ft for dolomite, 0.75 psi/ft for shale, 0.80 psi/ft for the sandstone layer right below the dolomite, and 0.70 psi/ft for all other sandstone formations. The same rock mechanical properties such as Young’s modulus from Higgins #19 were used for the modeling in Higgins #17. The Dolomite pay zone was initially (prior to the acid fracture treatment) estimated to have a permeability
Acid Stage
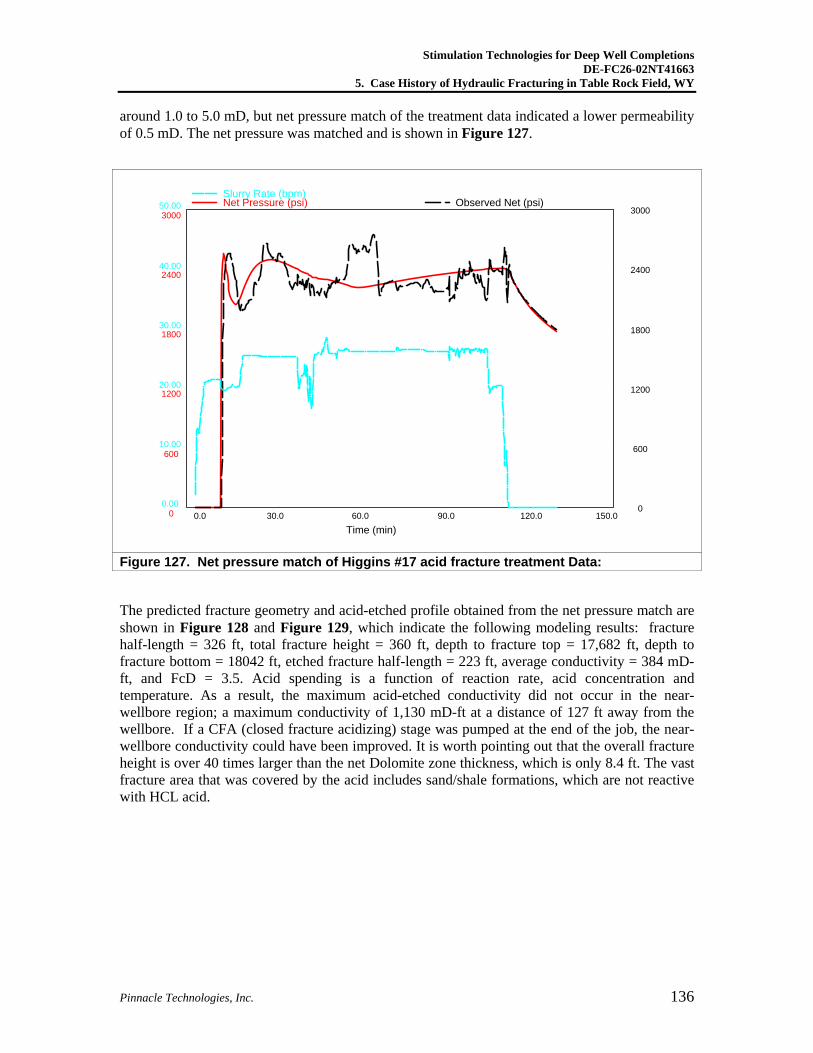
Stimulation Technologies for Deep Well Completions DE-FC26-02NT41663
5. Case History of Hydraulic Fracturing in Table Rock Field, WY
Pinnacle Technologies, Inc. 136
around 1.0 to 5.0 mD, but net pressure match of the treatment data indicated a lower permeability of 0.5 mD. The net pressure was matched and is shown in Figure 127.
Time (min)
Net Pressure (psi) Observed Net (psi)Slurry Rate (bpm)
0.0 30.0 60.0 90.0 120.0 150.0 0
600
1200
1800
2400
3000
0
600
1200
1800
2400
3000
0.00
10.00
20.00
30.00
40.00
50.00
Figure 127. Net pressure match of Higgins #17 acid fracture treatment Data:
The predicted fracture geometry and acid-etched profile obtained from the net pressure match are shown in Figure 128 and Figure 129, which indicate the following modeling results: fracture half-length = 326 ft, total fracture height = 360 ft, depth to fracture top = 17,682 ft, depth to fracture bottom = 18042 ft, etched fracture half-length = 223 ft, average conductivity = 384 mD-ft, and FcD = 3.5. Acid spending is a function of reaction rate, acid concentration and temperature. As a result, the maximum acid-etched conductivity did not occur in the near-wellbore region; a maximum conductivity of 1,130 mD-ft at a distance of 127 ft away from the wellbore. If a CFA (closed fracture acidizing) stage was pumped at the end of the job, the near-wellbore conductivity could have been improved. It is worth pointing out that the overall fracture height is over 40 times larger than the net Dolomite zone thickness, which is only 8.4 ft. The vast fracture area that was covered by the acid includes sand/shale formations, which are not reactive with HCL acid.
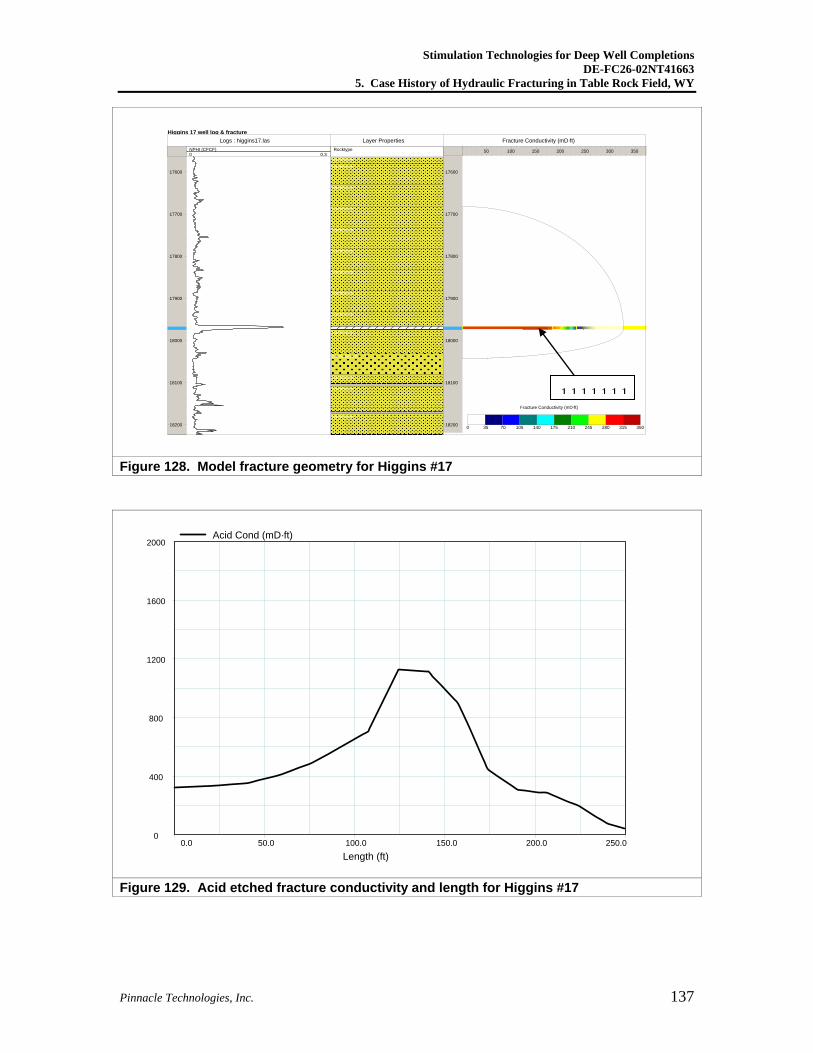
Stimulation Technologies for Deep Well Completions DE-FC26-02NT41663
5. Case History of Hydraulic Fracturing in Table Rock Field, WY
Pinnacle Technologies, Inc. 137
Higgins 17 well log & fracture
17600
17700
17800
17900
18000
18100
18200
0 0.3NPHI (CFCF)
Logs : higgins17.lasRocktype
Layer Properties
SandstoneSandstone
Sandstone
Sandstone
Sandstone
Sandstone
Sandstone
Sandstone
Sandstone
Sandstone
Sandstone-A
Sandstone
Sandstone
Sandstone
17600
17700
17800
17900
18000
18100
18200
50 100 150 200 250 300 350
Fracture Conductivity (mD·ft)
0 35 70 105 140 175 210 245 280 315 350
Fracture Conductivity (mD·ft)
Figure 128. Model fracture geometry for Higgins #17
Length (ft)
Acid Cond (mD·ft)
0.0 50.0 100.0 150.0 200.0 250.0 0
400
800
1200
1600
2000
Figure 129. Acid etched fracture conductivity and length for Higgins #17
1 1 1 1 1 1 1
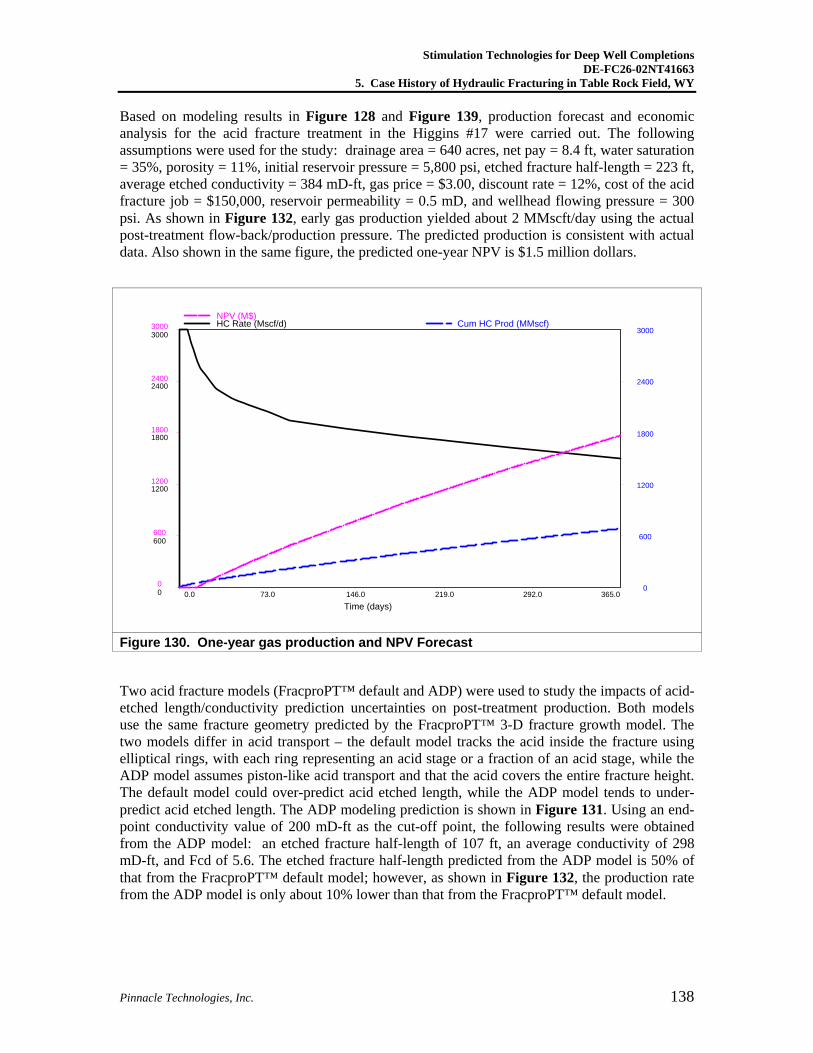
Stimulation Technologies for Deep Well Completions DE-FC26-02NT41663
5. Case History of Hydraulic Fracturing in Table Rock Field, WY
Pinnacle Technologies, Inc. 138
Based on modeling results in Figure 128 and Figure 139, production forecast and economic analysis for the acid fracture treatment in the Higgins #17 were carried out. The following assumptions were used for the study: drainage area = 640 acres, net pay = 8.4 ft, water saturation = 35%, porosity = 11%, initial reservoir pressure = 5,800 psi, etched fracture half-length = 223 ft, average etched conductivity = 384 mD-ft, gas price = $3.00, discount rate = 12%, cost of the acid fracture job = $150,000, reservoir permeability = 0.5 mD, and wellhead flowing pressure = 300 psi. As shown in Figure 132, early gas production yielded about 2 MMscft/day using the actual post-treatment flow-back/production pressure. The predicted production is consistent with actual data. Also shown in the same figure, the predicted one-year NPV is $1.5 million dollars.
Time (days)
HC Rate (Mscf/d) Cum HC Prod (MMscf)NPV (M$)
0.0 73.0 146.0 219.0 292.0 365.0 0
600
1200
1800
2400
3000
0
600
1200
1800
2400
3000
0
600
1200
1800
2400
3000
Figure 130. One-year gas production and NPV Forecast
Two acid fracture models (FracproPT™ default and ADP) were used to study the impacts of acid-etched length/conductivity prediction uncertainties on post-treatment production. Both models use the same fracture geometry predicted by the FracproPT™ 3-D fracture growth model. The two models differ in acid transport – the default model tracks the acid inside the fracture using elliptical rings, with each ring representing an acid stage or a fraction of an acid stage, while the ADP model assumes piston-like acid transport and that the acid covers the entire fracture height. The default model could over-predict acid etched length, while the ADP model tends to under-predict acid etched length. The ADP modeling prediction is shown in Figure 131. Using an end-point conductivity value of 200 mD-ft as the cut-off point, the following results were obtained from the ADP model: an etched fracture half-length of 107 ft, an average conductivity of 298 mD-ft, and Fcd of 5.6. The etched fracture half-length predicted from the ADP model is 50% of that from the FracproPT™ default model; however, as shown in Figure 132, the production rate from the ADP model is only about 10% lower than that from the FracproPT™ default model.
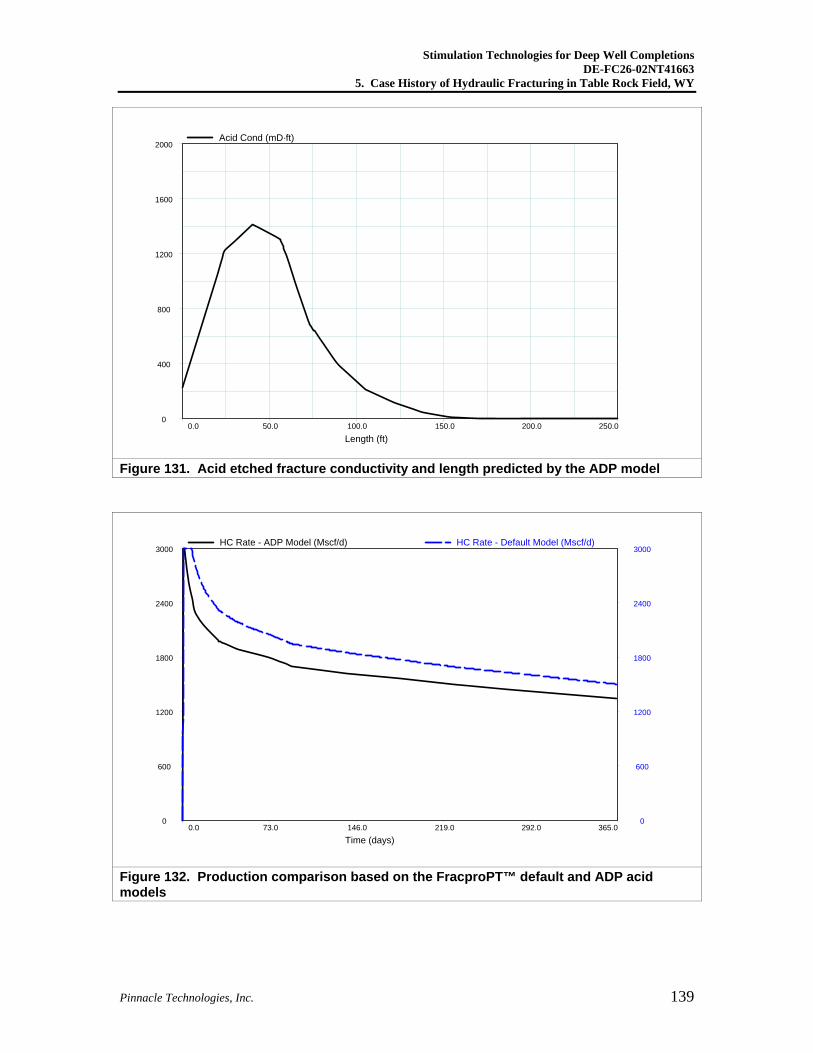
Stimulation Technologies for Deep Well Completions DE-FC26-02NT41663
5. Case History of Hydraulic Fracturing in Table Rock Field, WY
Pinnacle Technologies, Inc. 139
Length (ft)
Acid Cond (mD·ft)
0.0 50.0 100.0 150.0 200.0 250.0 0
400
800
1200
1600
2000
Figure 131. Acid etched fracture conductivity and length predicted by the ADP model
Time (days)
HC Rate - ADP Model (Mscf/d) HC Rate - Default Model (Mscf/d)
0.0 73.0 146.0 219.0 292.0 365.0 0
600
1200
1800
2400
3000
0
600
1200
1800
2400
3000
Figure 132. Production comparison based on the FracproPT™ default and ADP acid models
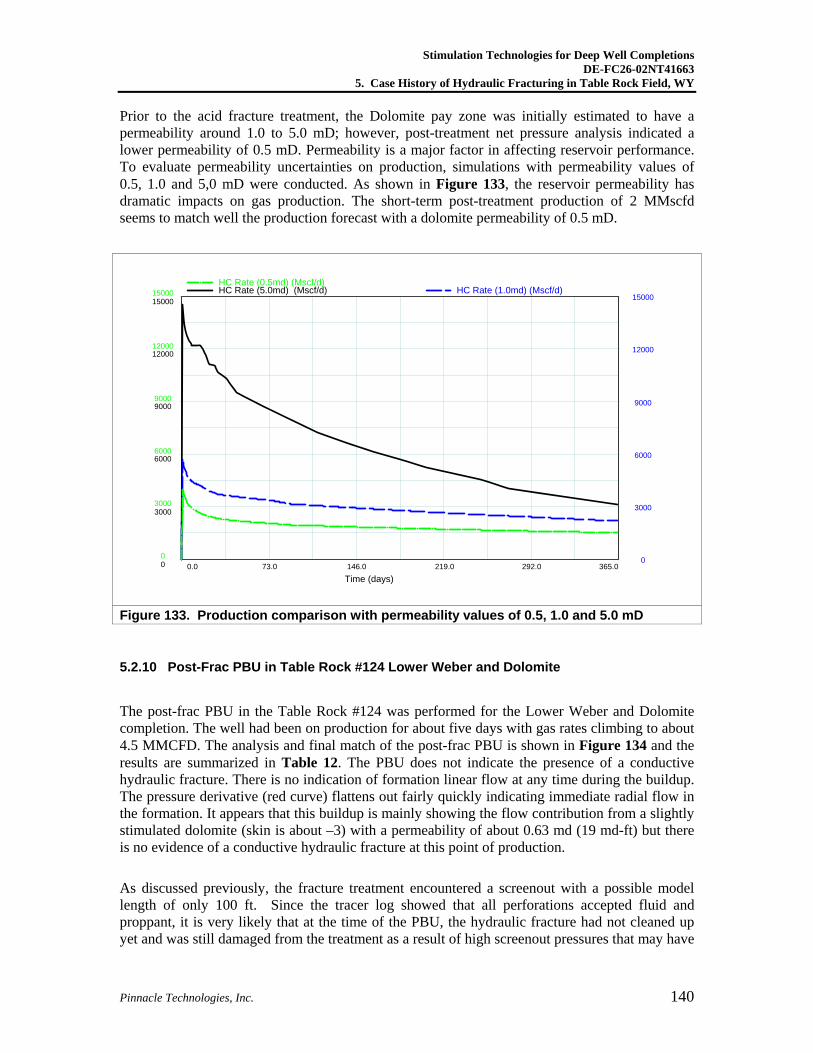
Stimulation Technologies for Deep Well Completions DE-FC26-02NT41663
5. Case History of Hydraulic Fracturing in Table Rock Field, WY
Pinnacle Technologies, Inc. 140
Prior to the acid fracture treatment, the Dolomite pay zone was initially estimated to have a permeability around 1.0 to 5.0 mD; however, post-treatment net pressure analysis indicated a lower permeability of 0.5 mD. Permeability is a major factor in affecting reservoir performance. To evaluate permeability uncertainties on production, simulations with permeability values of 0.5, 1.0 and 5,0 mD were conducted. As shown in Figure 133, the reservoir permeability has dramatic impacts on gas production. The short-term post-treatment production of 2 MMscfd seems to match well the production forecast with a dolomite permeability of 0.5 mD.
Time (days)
HC Rate (5.0md) (Mscf/d) HC Rate (1.0md) (Mscf/d)HC Rate (0.5md) (Mscf/d)
0.0 73.0 146.0 219.0 292.0 365.0 0
3000
6000
9000
12000
15000
0
3000
6000
9000
12000
15000
0
3000
6000
9000
12000
15000
Figure 133. Production comparison with permeability values of 0.5, 1.0 and 5.0 mD
5.2.10 Post-Frac PBU in Table Rock #124 Lower Weber and Dolomite
The post-frac PBU in the Table Rock #124 was performed for the Lower Weber and Dolomite completion. The well had been on production for about five days with gas rates climbing to about 4.5 MMCFD. The analysis and final match of the post-frac PBU is shown in Figure 134 and the results are summarized in Table 12. The PBU does not indicate the presence of a conductive hydraulic fracture. There is no indication of formation linear flow at any time during the buildup. The pressure derivative (red curve) flattens out fairly quickly indicating immediate radial flow in the formation. It appears that this buildup is mainly showing the flow contribution from a slightly stimulated dolomite (skin is about –3) with a permeability of about 0.63 md (19 md-ft) but there is no evidence of a conductive hydraulic fracture at this point of production.
As discussed previously, the fracture treatment encountered a screenout with a possible model length of only 100 ft. Since the tracer log showed that all perforations accepted fluid and proppant, it is very likely that at the time of the PBU, the hydraulic fracture had not cleaned up yet and was still damaged from the treatment as a result of high screenout pressures that may have
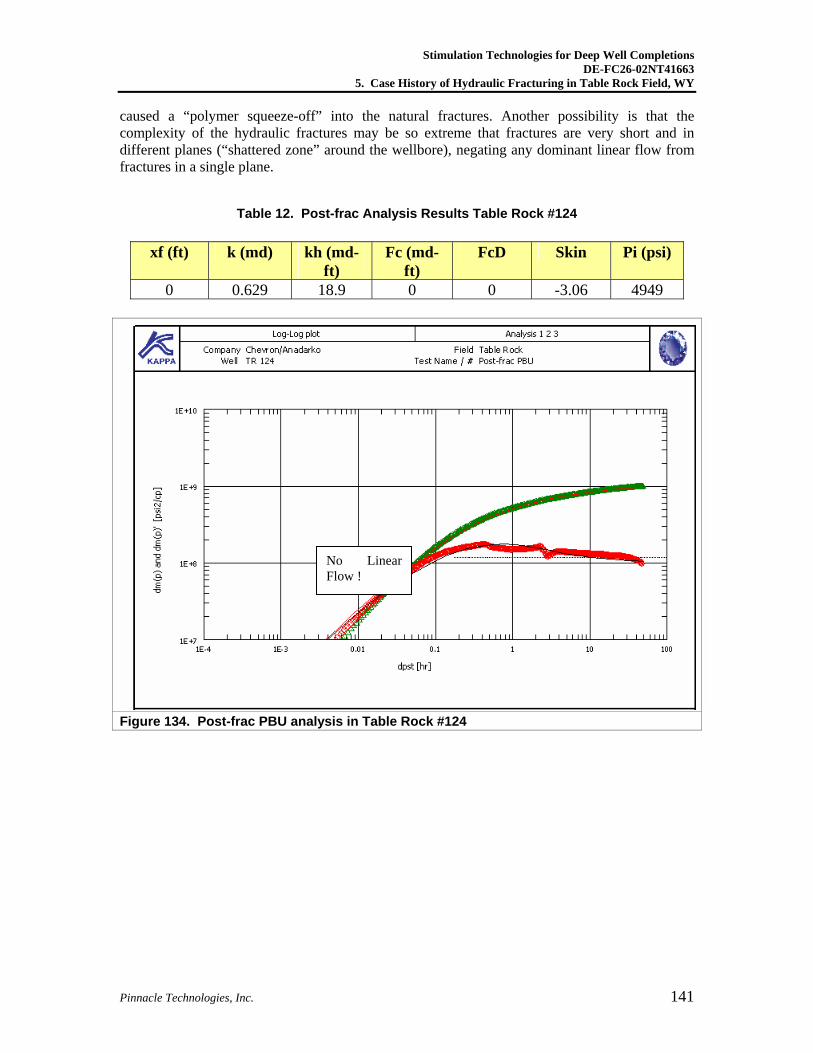
Stimulation Technologies for Deep Well Completions DE-FC26-02NT41663
5. Case History of Hydraulic Fracturing in Table Rock Field, WY
Pinnacle Technologies, Inc. 141
caused a “polymer squeeze-off” into the natural fractures. Another possibility is that the complexity of the hydraulic fractures may be so extreme that fractures are very short and in different planes (“shattered zone” around the wellbore), negating any dominant linear flow from fractures in a single plane.
Table 12. Post-frac Analysis Results Table Rock #124
Figure 134. Post-frac PBU analysis in Table Rock #124
xf (ft) k (md) kh (md-ft)
Fc (md-ft)
FcD Skin Pi (psi)
0 0.629 18.9 0 0 -3.06 4949
No Linear Flow !
Stimulation Technologies for Deep Well Completions DE-FC26-02NT41663
6. Case History of Hydraulic Fracturing in the Springer, Granite Wash and Arbuckle Formations in Oklahoma
Pinnacle Technologies, Inc. 142
6. Case History of Hydraulic Fracturing in the Springer, Granite Wash and Arbuckle Formations in Oklahoma
This study focused on deep gas productive horizons in Stephens and Caddo County, Oklahoma operated by Marathon Oil Company. The primary targets are the Springer and Granite Wash Sands and Arbuckle Carbonate Formations (dolomitic limestone) at depths of roughly 15,000 to 18,700 ft. The Arbuckle is the deepest target and produces gas with a sour gas content of 2 to 4.5%. The study shows treatment examples from all three formations. Less information was available for these wells, compared to the other two case studies, so a reduced engineering effort was spent on this area of the project.
The geologic setting of the Arbuckle is an anticline with possible thrust faulting and is believed to contain a fine network of natural fractures. The Springer and Granite Wash Sands are a seismic stratigraphic play removed from structure. Temperatures range from about 240 F to 270 F and pore pressures from about 7,000 to 13,000 psi, with most target zones being over-pressured (0.65 to 0.75 psi/ft). The Springer and Granite Wash Sands are usually completed with crosslinked gel fracture treatments and high strength proppants. The carbonates in the Arbuckle are completed with acid fractures (some are hybrid treatments including high-strength proppant).
Fracture treatments in the Springer and Granite Wash Sands show fairly high fracturing net pressures and, in some cases, high tortuosity (near-wellbore fracture complexity). This indicates a tendency towards fracture complexity (multiple fractures) and higher risk of screenouts. Marathon has been combating some of these challenging issues with specific perforating strategies (such as low-density, zero-degree phasing) that can limit the amount of multiple fractures. In addition, large pad sizes with lower proppant concentrations are employed to reduce the risk of early screenouts.
Completions in the deep (17,900 to 18,700 ft) Arbuckle Carbonate Formations face the challenge of achieving economically successful wells in a challenging environment with 2 to 4.5% sour gas production. So far, four wells have been completed with mixed success. Initial production can be fairly high (10 to 12 MMCFD) followed by a rapid decline. From a completion point of view, the biggest challenge is to find the best acid fracture stimulation technique that will maintain enough fracture conductivity at these large depths.
6.1 Discussion
6.1.1 Introduction
This study focused on deep gas productive horizons in Stephens and Caddo County, Oklahoma operated by Marathon Oil Company. The primary targets are the Springer and Granite Wash Sands and Arbuckle Carbonate Formations (dolomitized limestone) at depths of roughly 15,000
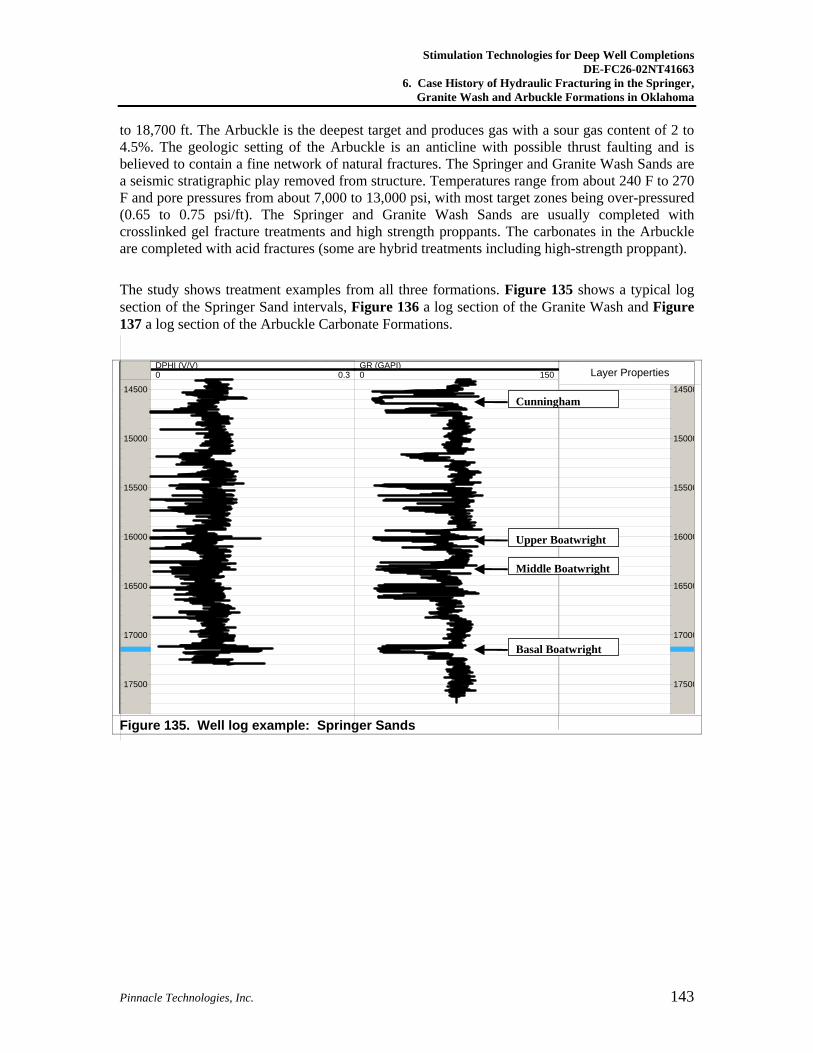
Stimulation Technologies for Deep Well Completions DE-FC26-02NT41663
6. Case History of Hydraulic Fracturing in the Springer, Granite Wash and Arbuckle Formations in Oklahoma
Pinnacle Technologies, Inc. 143
to 18,700 ft. The Arbuckle is the deepest target and produces gas with a sour gas content of 2 to 4.5%. The geologic setting of the Arbuckle is an anticline with possible thrust faulting and is believed to contain a fine network of natural fractures. The Springer and Granite Wash Sands are a seismic stratigraphic play removed from structure. Temperatures range from about 240 F to 270 F and pore pressures from about 7,000 to 13,000 psi, with most target zones being over-pressured (0.65 to 0.75 psi/ft). The Springer and Granite Wash Sands are usually completed with crosslinked gel fracture treatments and high strength proppants. The carbonates in the Arbuckle are completed with acid fractures (some are hybrid treatments including high-strength proppant).
The study shows treatment examples from all three formations. Figure 135 shows a typical log section of the Springer Sand intervals, Figure 136 a log section of the Granite Wash and Figure 137 a log section of the Arbuckle Carbonate Formations.
g
14500
15000
15500
16000
16500
17000
17500
0 0.3DPHI (V/V)
0 150GR (GAPI)
14500
15000
15500
16000
16500
17000
17500
Layer Properties
Basal Boatwright
Middle Boatwright
Upper Boatwright
Cunningham
Figure 135. Well log example: Springer Sands
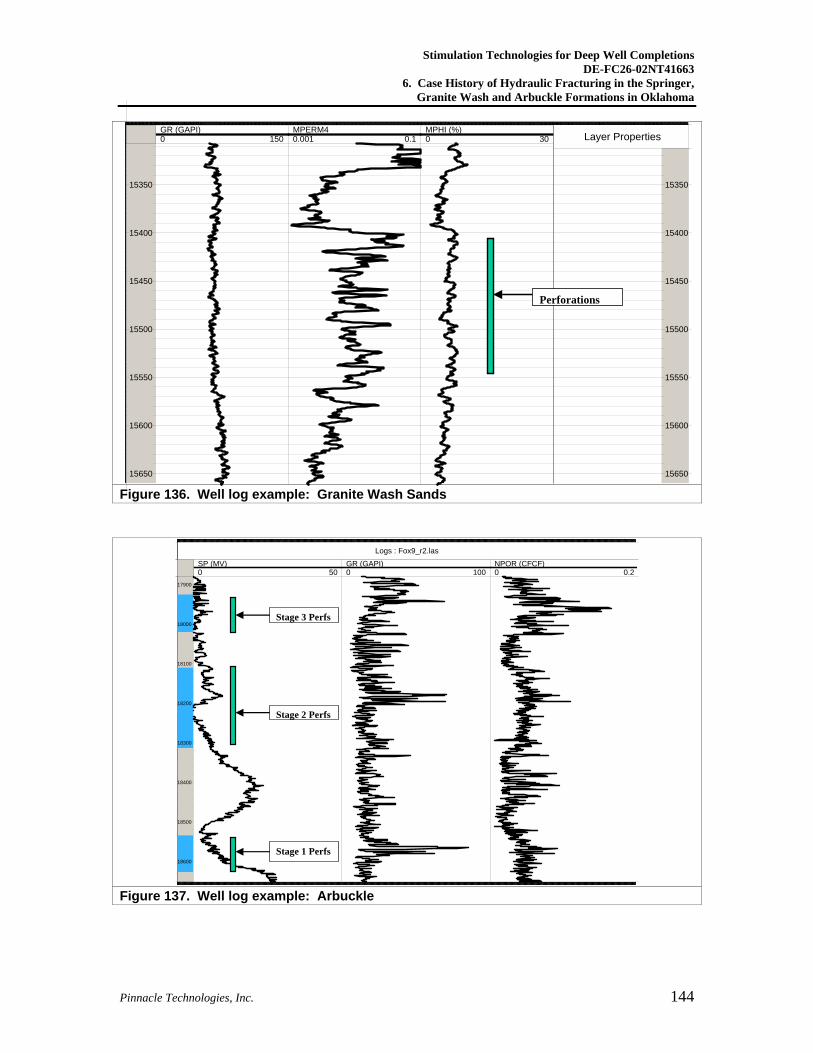
Stimulation Technologies for Deep Well Completions DE-FC26-02NT41663
6. Case History of Hydraulic Fracturing in the Springer, Granite Wash and Arbuckle Formations in Oklahoma
Pinnacle Technologies, Inc. 144
Graves 2-12 Log
15350
15400
15450
15500
15550
15600
15650
0 150GR (GAPI)
0.001 0.1MPERM4
0 30MPHI (%)
15350
15400
15450
15500
15550
15600
15650
Layer Properties
Perforations
Figure 136. Well log example: Granite Wash Sands
F 9 3
17900
18000
18100
18200
18300
18400
18500
18600
0 50SP (MV)
0 100GR (GAPI)
0 0.2NPOR (CFCF)
Logs : Fox9_r2.las
Stage 1 Perfs
Stage 3 Perfs
Stage 2 Perfs
Figure 137. Well log example: Arbuckle
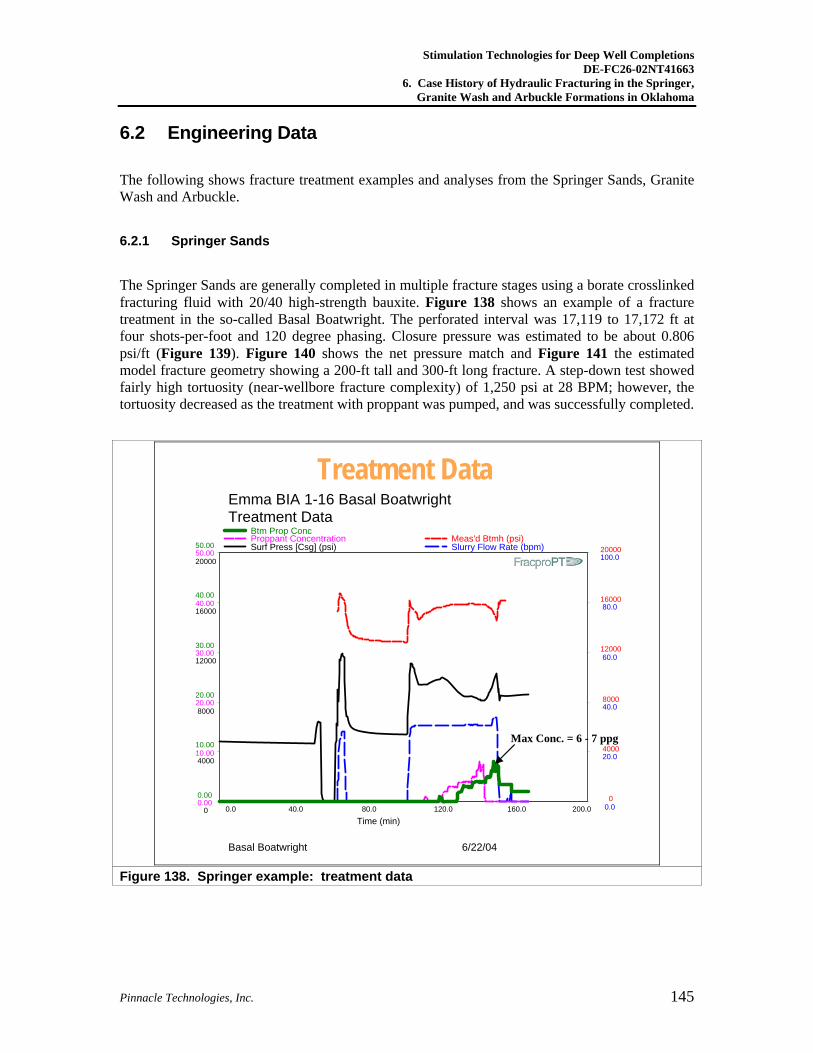
Stimulation Technologies for Deep Well Completions DE-FC26-02NT41663
6. Case History of Hydraulic Fracturing in the Springer, Granite Wash and Arbuckle Formations in Oklahoma
Pinnacle Technologies, Inc. 145
6.2 Engineering Data
The following shows fracture treatment examples and analyses from the Springer Sands, Granite Wash and Arbuckle.
6.2.1 Springer Sands
The Springer Sands are generally completed in multiple fracture stages using a borate crosslinked fracturing fluid with 20/40 high-strength bauxite. Figure 138 shows an example of a fracture treatment in the so-called Basal Boatwright. The perforated interval was 17,119 to 17,172 ft at four shots-per-foot and 120 degree phasing. Closure pressure was estimated to be about 0.806 psi/ft (Figure 139). Figure 140 shows the net pressure match and Figure 141 the estimated model fracture geometry showing a 200-ft tall and 300-ft long fracture. A step-down test showed fairly high tortuosity (near-wellbore fracture complexity) of 1,250 psi at 28 BPM; however, the tortuosity decreased as the treatment with proppant was pumped, and was successfully completed.
Treatment DataEmma BIA 1-16 Basal BoatwrightTreatment Data
Basal Boatwright 6/22/04
Time (min)
Surf Press [Csg] (psi) Slurry Flow Rate (bpm)Proppant Concentration Meas'd Btmh (psi)Btm Prop Conc
0.0 40.0 80.0 120.0 160.0 200.0 0
4000
8000
12000
16000
20000
0.0
20.0
40.0
60.0
80.0
100.0
0.00
10.00
20.00
30.00
40.00
50.00
0
4000
8000
12000
16000
20000
0.00
10.00
20.00
30.00
40.00
50.00
Max Conc. = 6 - 7 ppg
Figure 138. Springer example: treatment data
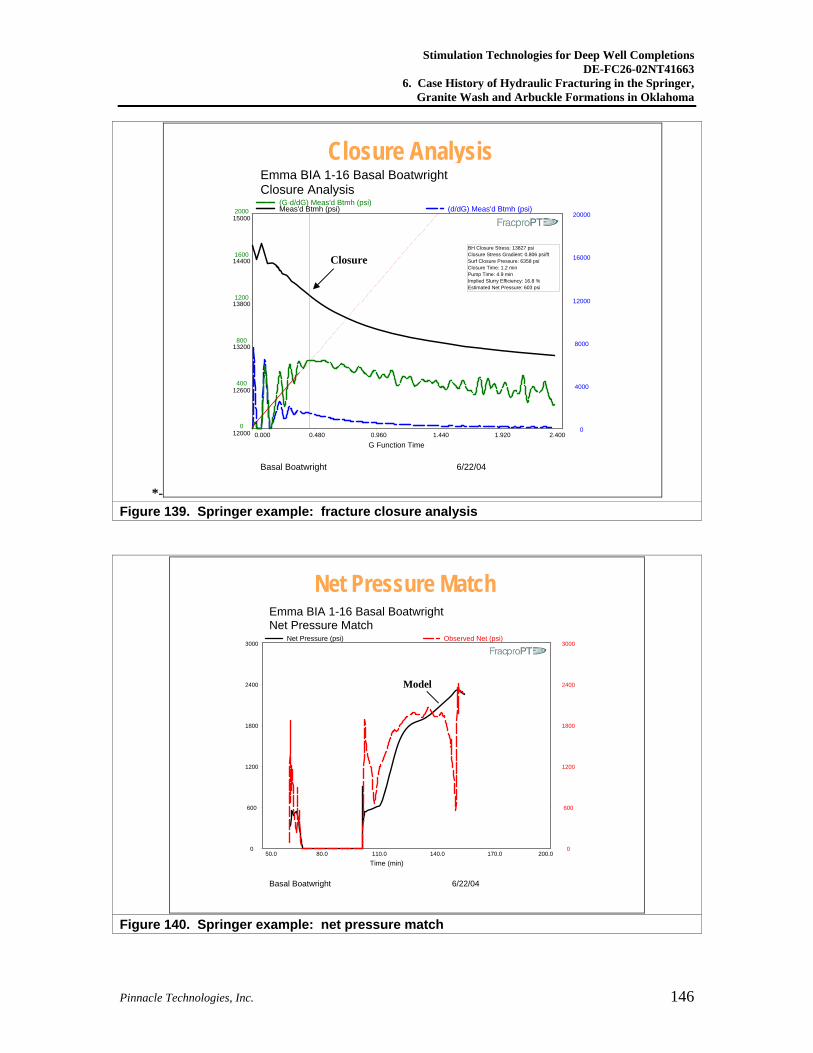
Stimulation Technologies for Deep Well Completions DE-FC26-02NT41663
6. Case History of Hydraulic Fracturing in the Springer, Granite Wash and Arbuckle Formations in Oklahoma
Pinnacle Technologies, Inc. 146
*-
Closure AnalysisEmma BIA 1-16 Basal BoatwrightClosure Analysis
Basal Boatwright 6/22/04
G Function Time
Meas'd Btmh (psi) (d/dG) Meas'd Btmh (psi)(G·d/dG) Meas'd Btmh (psi)
0.000 0.480 0.960 1.440 1.920 2.400 12000
12600
13200
13800
14400
15000
0
4000
8000
12000
16000
20000
0
400
800
1200
1600
2000
BH Closure Stress: 13827 psiClosure Stress Gradient: 0.806 psi/ftSurf Closure Pressure: 6358 psiClosure Time: 1.2 minPump Time: 4.9 minImplied Slurry Efficiency: 16.8 %Estimated Net Pressure: 603 psi
Closure
Figure 139. Springer example: fracture closure analysis
Net Pressure Match
Closure
Emma BIA 1-16 Basal BoatwrightNet Pressure Match
Basal Boatwright 6/22/04
Time (min)
Net Pressure (psi) Observed Net (psi)
50.0 80.0 110.0 140.0 170.0 200.0 0
600
1200
1800
2400
3000
0
600
1200
1800
2400
3000
Model
Figure 140. Springer example: net pressure match
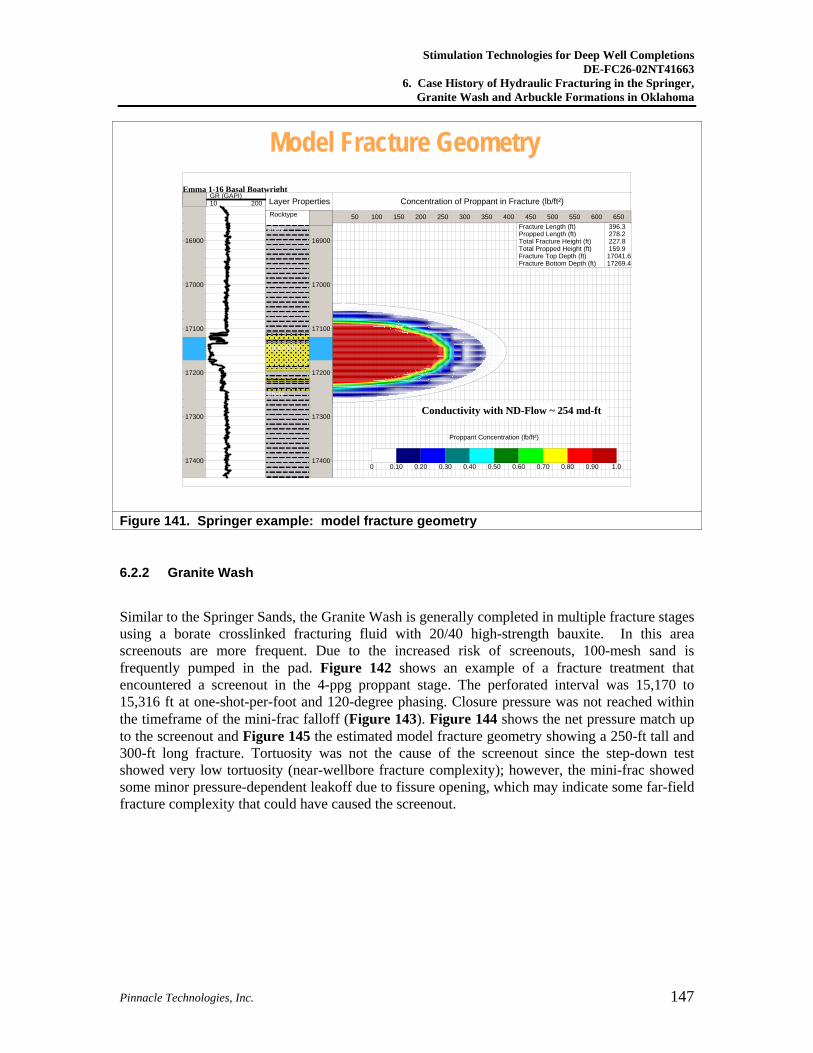
Stimulation Technologies for Deep Well Completions DE-FC26-02NT41663
6. Case History of Hydraulic Fracturing in the Springer, Granite Wash and Arbuckle Formations in Oklahoma
Pinnacle Technologies, Inc. 147
Model Fracture Geometry
Closure Model
Emma 1-16 Basal Boatwright
16900
17000
17100
17200
17300
17400
10 200GR (GAPI)
16900
17000
17100
17200
17300
17400
Rocktype
Layer Properties
Shale
Sandstone
Shale
50 100 150 200 250 300 350 400 450 500 550 600 650
Concentration of Proppant in Fracture (lb/ft²)
0 0.10 0.20 0.30 0.40 0.50 0.60 0.70 0.80 0.90 1.0
Proppant Concentration (lb/ft²)
Fracture Length (ft)Propped Length (ft)Total Fracture Height (ft)Total Propped Height (ft)Fracture Top Depth (ft)Fracture Bottom Depth (ft)
396.3 278.2 227.8 159.917041.617269.4
Conductivity with ND-Flow ~ 254 md-ft
Figure 141. Springer example: model fracture geometry
6.2.2 Granite Wash
Similar to the Springer Sands, the Granite Wash is generally completed in multiple fracture stages using a borate crosslinked fracturing fluid with 20/40 high-strength bauxite. In this area screenouts are more frequent. Due to the increased risk of screenouts, 100-mesh sand is frequently pumped in the pad. Figure 142 shows an example of a fracture treatment that encountered a screenout in the 4-ppg proppant stage. The perforated interval was 15,170 to 15,316 ft at one-shot-per-foot and 120-degree phasing. Closure pressure was not reached within the timeframe of the mini-frac falloff (Figure 143). Figure 144 shows the net pressure match up to the screenout and Figure 145 the estimated model fracture geometry showing a 250-ft tall and 300-ft long fracture. Tortuosity was not the cause of the screenout since the step-down test showed very low tortuosity (near-wellbore fracture complexity); however, the mini-frac showed some minor pressure-dependent leakoff due to fissure opening, which may indicate some far-field fracture complexity that could have caused the screenout.
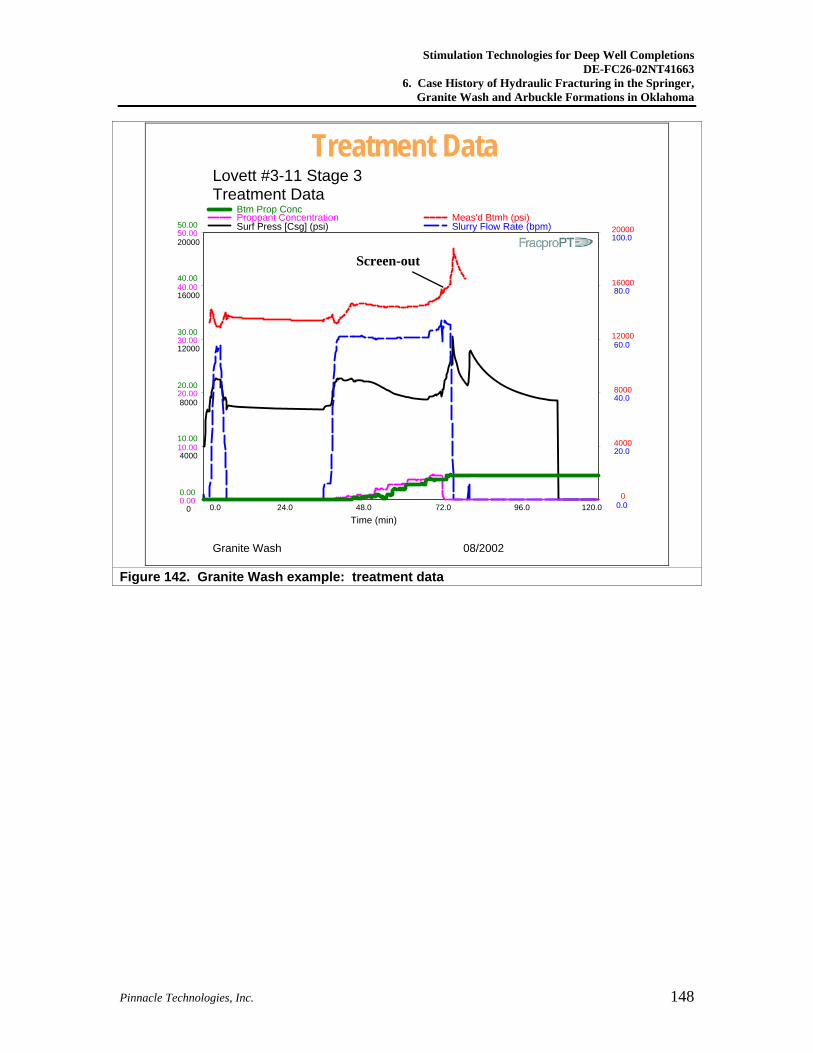
Stimulation Technologies for Deep Well Completions DE-FC26-02NT41663
6. Case History of Hydraulic Fracturing in the Springer, Granite Wash and Arbuckle Formations in Oklahoma
Pinnacle Technologies, Inc. 148
Treatment DataLovett #3-11 Stage 3Treatment Data
Granite Wash 08/2002
Time (min)
Surf Press [Csg] (psi) Slurry Flow Rate (bpm)Proppant Concentration Meas'd Btmh (psi)Btm Prop Conc
0.0 24.0 48.0 72.0 96.0 120.0 0
4000
8000
12000
16000
20000
0.0
20.0
40.0
60.0
80.0
100.0
0.00
10.00
20.00
30.00
40.00
50.00
0
4000
8000
12000
16000
20000
0.00
10.00
20.00
30.00
40.00
50.00
Screen-out
Figure 142. Granite Wash example: treatment data
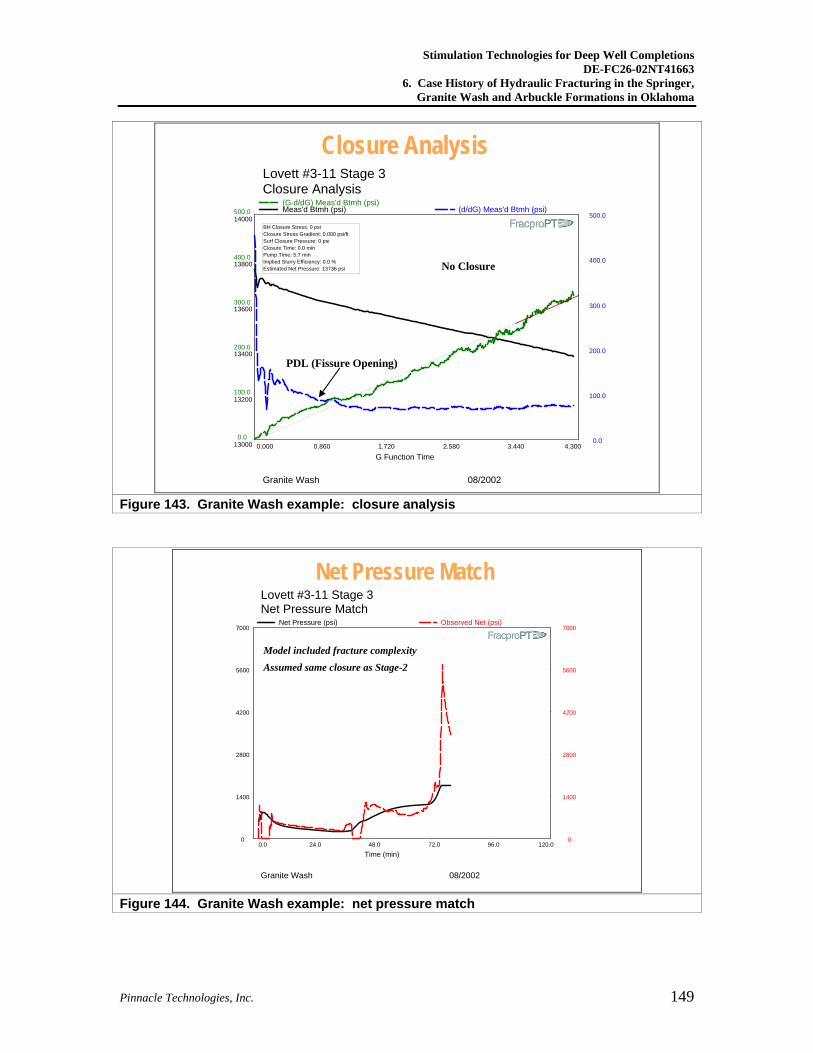
Stimulation Technologies for Deep Well Completions DE-FC26-02NT41663
6. Case History of Hydraulic Fracturing in the Springer, Granite Wash and Arbuckle Formations in Oklahoma
Pinnacle Technologies, Inc. 149
Closure Analysis
Fracture Height Recession
Lovett #3-11 Stage 3Closure Analysis
Granite Wash 08/2002
G Function Time
Meas'd Btmh (psi) (d/dG) Meas'd Btmh (psi)(G·d/dG) Meas'd Btmh (psi)
0.000 0.860 1.720 2.580 3.440 4.300 13000
13200
13400
13600
13800
14000
0.0
100.0
200.0
300.0
400.0
500.0
0.0
100.0
200.0
300.0
400.0
500.0
BH Closure Stress: 0 psiClosure Stress Gradient: 0.000 psi/ftSurf Closure Pressure: 0 psiClosure Time: 0.0 minPump Time: 5.7 minImplied Slurry Efficiency: 0.0 %Estimated Net Pressure: 13736 psi No Closure
PDL (Fissure Opening)
Figure 143. Granite Wash example: closure analysis
Net Pressure Match
Closure Model
Lovett #3-11 Stage 3Net Pressure Match
Granite Wash 08/2002
Time (min)
Net Pressure (psi) Observed Net (psi)
0.0 24.0 48.0 72.0 96.0 120.0 0
1400
2800
4200
5600
7000
0
1400
2800
4200
5600
7000
Model included fracture complexityAssumed same closure as Stage-2
Figure 144. Granite Wash example: net pressure match
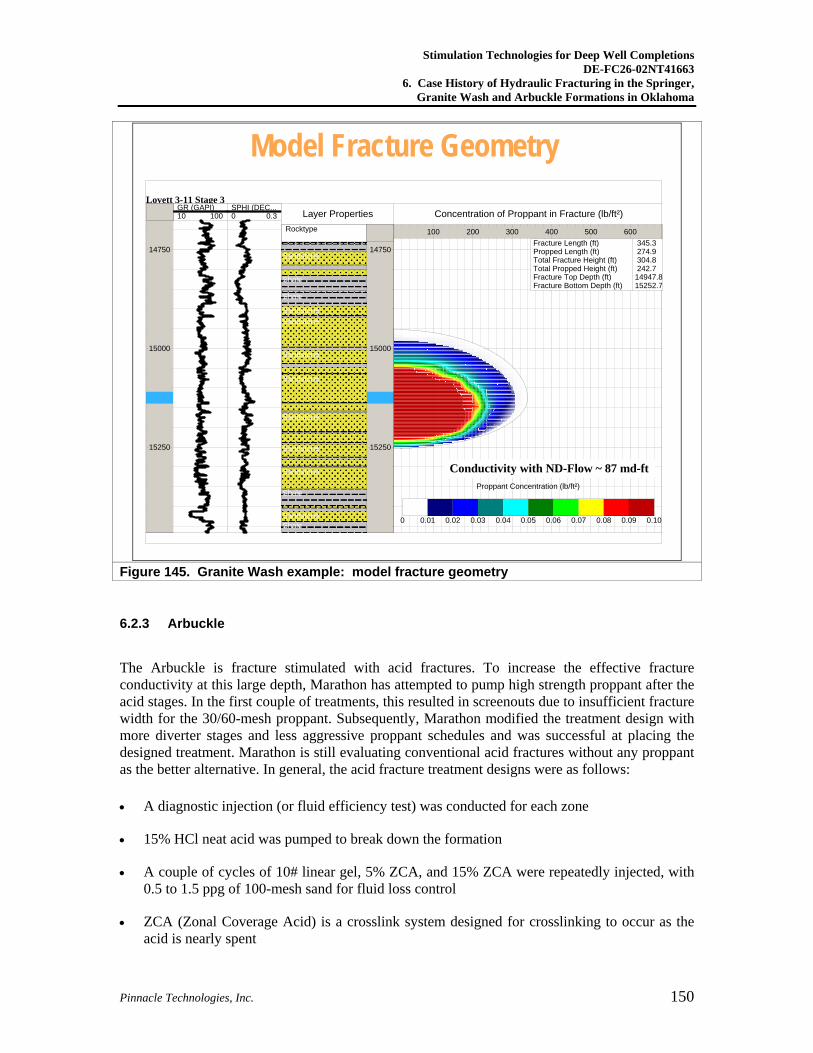
Stimulation Technologies for Deep Well Completions DE-FC26-02NT41663
6. Case History of Hydraulic Fracturing in the Springer, Granite Wash and Arbuckle Formations in Oklahoma
Pinnacle Technologies, Inc. 150
Model Fracture Geometry
Closure Model
Lovett 3-11 Stage 3
14750
15000
15250
10 100GR (GAPI)
0 0.3SPHI (DEC...
14750
15000
15250
Rocktype
Layer Properties
Sandstone
Shale
Shale
SandstoneSandstone
Sandstone
Sandstone
Sandstone
Sandstone
Sandstone
Shale
SandstoneShale
100 200 300 400 500 600
Concentration of Proppant in Fracture (lb/ft²)
0 0.01 0.02 0.03 0.04 0.05 0.06 0.07 0.08 0.09 0.10
Proppant Concentration (lb/ft²)
Fracture Length (ft)Propped Length (ft)Total Fracture Height (ft)Total Propped Height (ft)Fracture Top Depth (ft)Fracture Bottom Depth (ft)
345.3 274.9 304.8 242.714947.815252.7
Conductivity with ND-Flow ~ 87 md-ft
Figure 145. Granite Wash example: model fracture geometry
6.2.3 Arbuckle
The Arbuckle is fracture stimulated with acid fractures. To increase the effective fracture conductivity at this large depth, Marathon has attempted to pump high strength proppant after the acid stages. In the first couple of treatments, this resulted in screenouts due to insufficient fracture width for the 30/60-mesh proppant. Subsequently, Marathon modified the treatment design with more diverter stages and less aggressive proppant schedules and was successful at placing the designed treatment. Marathon is still evaluating conventional acid fractures without any proppant as the better alternative. In general, the acid fracture treatment designs were as follows:
• A diagnostic injection (or fluid efficiency test) was conducted for each zone
• 15% HCl neat acid was pumped to break down the formation
• A couple of cycles of 10# linear gel, 5% ZCA, and 15% ZCA were repeatedly injected, with 0.5 to 1.5 ppg of 100-mesh sand for fluid loss control
• ZCA (Zonal Coverage Acid) is a crosslink system designed for crosslinking to occur as the acid is nearly spent

Stimulation Technologies for Deep Well Completions DE-FC26-02NT41663
6. Case History of Hydraulic Fracturing in the Springer, Granite Wash and Arbuckle Formations in Oklahoma
Pinnacle Technologies, Inc. 151
• The stage of 5% ZCA is used as diverter as it is spent quickly
• 15% ZCA was the main stimulation acid
• 25# linear gel was then pumped with 30/60 proppant at 0.5 to 2.0 ppg (eliminated in some treatments)
Figure 146 shows an example of an Arbuckle acid fracture treatment. The perforated interval had five clusters (18,110 to 18,130 ft; 18,150 to 18,170 ft; 18,210 to 18,230 ft; 18,250 to 18,270 ft; 18,295 to 18,315 ft) perforated with one-shot-per-foot and spiral phasing. Closure pressure was estimated at about 0.57 psi/ft (Figure 147). Figure 148 shows the net pressure match and Figure 149 the estimated model fracture geometry showing a 300-ft tall and 300-ft long fracture.
Fox Alliance 9-3 Stage 2 Treatment Data
Fox 9-3 Stage 2
Time (min)
Surf Press [Tbg] (psi) Slurry Flow Rate (bpm)Proppant Conc (ppg) Slurry Density (lbm/gal)
0.0 40.0 80.0 120.0 160.0 200.0 -40
1968
3976
5984
7992
10000
0.00
10.00
20.00
30.00
40.00
50.00
0.000
1.000
2.000
3.000
4.000
5.000
8.00
10.40
12.80
15.20
17.60
20.00
Slurry Rate
Surface Pressure
Slurry Density
Figure 146. Arbuckle example: treatment data
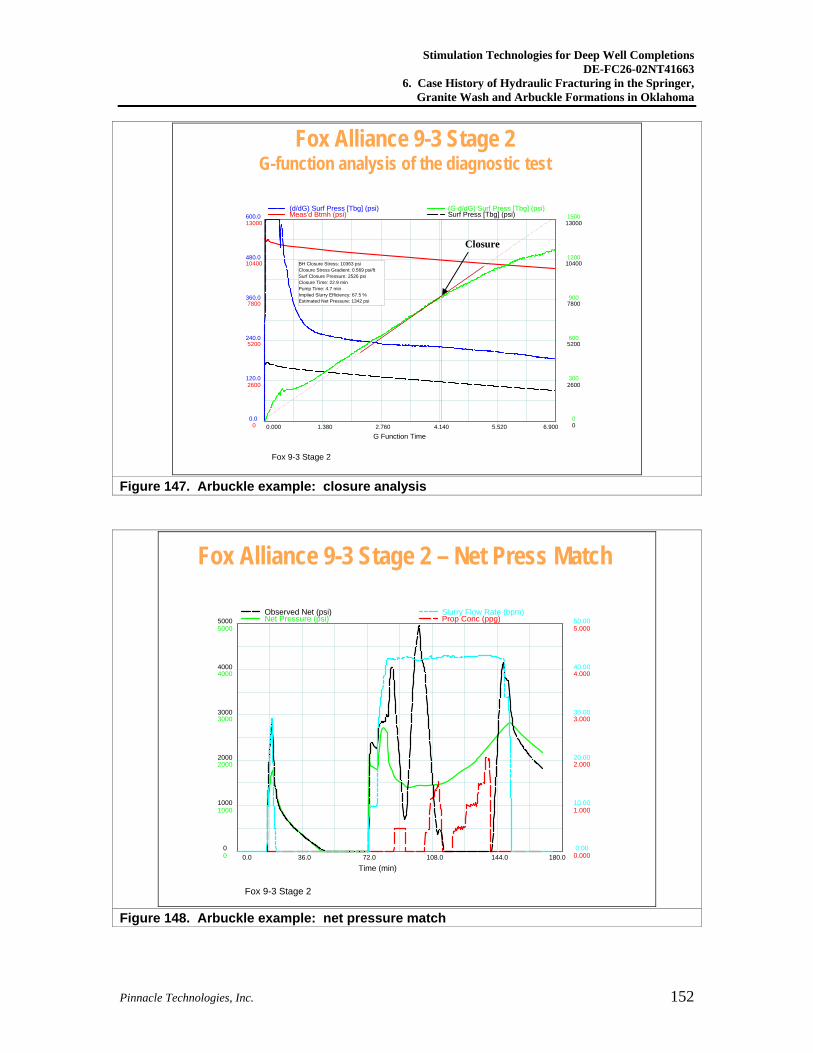
Stimulation Technologies for Deep Well Completions DE-FC26-02NT41663
6. Case History of Hydraulic Fracturing in the Springer, Granite Wash and Arbuckle Formations in Oklahoma
Pinnacle Technologies, Inc. 152
Fox Alliance 9-3 Stage 2 G-function analysis of the diagnostic test
Fox 9-3 Stage 2
G Function Time
Meas'd Btmh (psi) Surf Press [Tbg] (psi)(d/dG) Surf Press [Tbg] (psi) (G·d/dG) Surf Press [Tbg] (psi)
0.000 1.380 2.760 4.140 5.520 6.900 0
2600
5200
7800
10400
13000
0
2600
5200
7800
10400
13000
0.0
120.0
240.0
360.0
480.0
600.0
0
300
600
900
1200
1500
BH Closure Stress: 10363 psiClosure Stress Gradient: 0.569 psi/ftSurf Closure Pressure: 2526 psiClosure Time: 22.9 minPump Time: 4.7 minImplied Slurry Efficiency: 67.5 %Estimated Net Pressure: 1342 psi
Closure
Figure 147. Arbuckle example: closure analysis
Fox Alliance 9-3 Stage 2 – Net Press Match
Fox 9-3 Stage 2
Time (min)
Net Pressure (psi) Prop Conc (ppg)Observed Net (psi) Slurry Flow Rate (bpm)
0.0 36.0 72.0 108.0 144.0 180.0 0
1000
2000
3000
4000
5000
0.000
1.000
2.000
3.000
4.000
5.000
0
1000
2000
3000
4000
5000
0.00
10.00
20.00
30.00
40.00
50.00
Figure 148. Arbuckle example: net pressure match
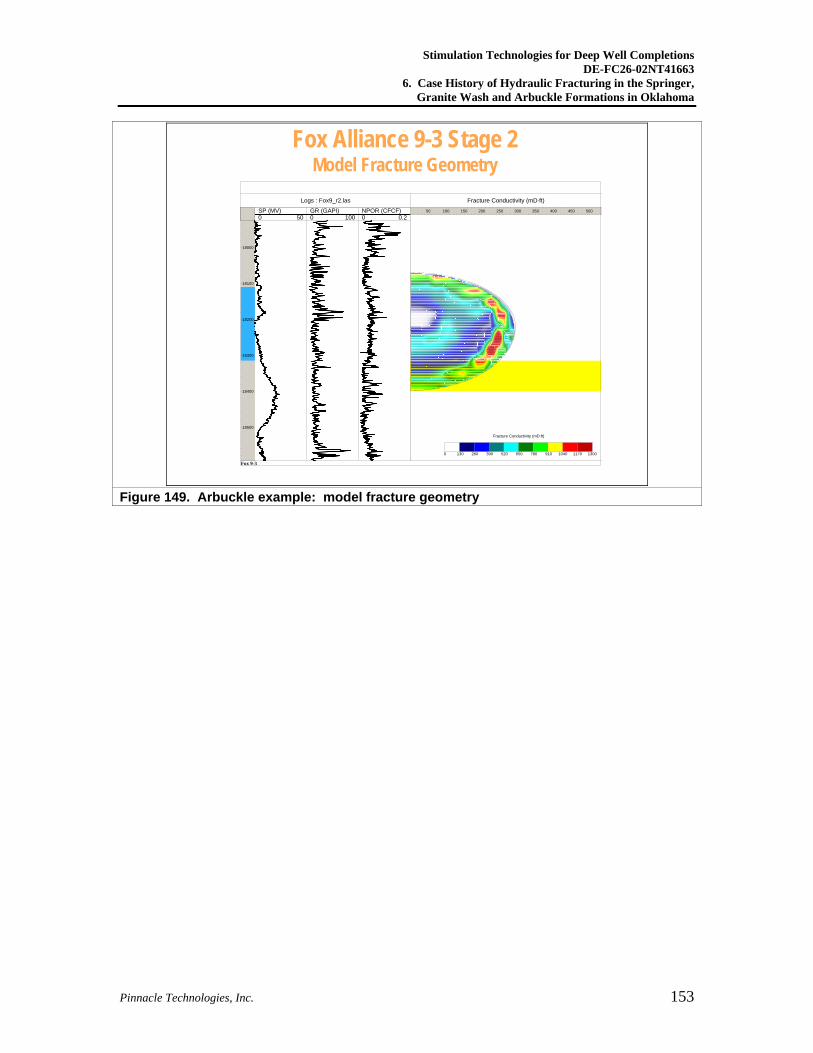
Stimulation Technologies for Deep Well Completions DE-FC26-02NT41663
6. Case History of Hydraulic Fracturing in the Springer, Granite Wash and Arbuckle Formations in Oklahoma
Pinnacle Technologies, Inc. 153
Fox Alliance 9-3 Stage 2 Model Fracture Geometry
Fox 9-3
18000
18100
18200
18300
18400
18500
0 50SP (MV)
0 100GR (GAPI)
0 0.2NPOR (CFCF)
Logs : Fox9_r2.las50 100 150 200 250 300 350 400 450 500
Fracture Conductivity (mD·ft)
0 130 260 390 520 650 780 910 1040 1170 1300
Fracture Conductivity (mD·ft)
Figure 149. Arbuckle example: model fracture geometry
Stimulation Technologies for Deep Well Completions DE-FC26-02NT41663
7. Bibliography: Deep Gas Well Stimulation
Pinnacle Technologies, Inc. 154
7. Bibliography: Deep Gas Well Stimulation
This bibliography was prepared as part of the U.S. Department of Energy’s Deep Trek Program. The bibliography focuses on published material related to deep gas well stimulation. Some publications on domestic deep gas resources are included to provide information on the type of reservoirs that must be stimulated during deep gas field development. A few early publications (1960’s to 1970’s) are also listed to provide a historical view of deep gas well stimulation.
Ali, A. H. A., Frenier, W.W., Xiao, Z. and Ziauddin, M. (2002): “Chelating Agent-Based Fluids For Optimal Stimulation of High-Temperature Wells,” SPE paper 77366. Key words: matrix stimulation, chelating agents, acidizing, sandstones, carbonates Content: Chelating agents are often used to formulate systems for matrix stimulation and to prevent precipitation of solids. Chelating agents with low corrosion rates at high temperature are discussed in this paper. Laboratory and field test results are presented. Anderson, R. W., Johnson, D.E. and Diep, T. (2002): “New Resin Technology Improves Proppant Flowback Control in HP/HT Environments,” SPE paper 77745. Key words: proppant, proppant flowback, resin coating Content: Discusses a new resin system for proppant flowback control under extreme conditions of stress, temperature and flow rate. The basics of resin coating are presented and laboratory testing of the new system is presented. No field results are shown. Bilia, R., Gordon, D., Watterson, E. and Mota, J. (2003): “South Texas Hybrid Monobore High-Pressure, High-Temperature Well Design,” SPE paper 84267. Key words: completion, South Texas, Wilcox Formation, tubing-less wells Content: This paper covers tubing-less well completions in deep Wilcox wells in the Fandango Field. Conventional (tubing/packer) and tubing-less well designs and costs are compared. Brannon, H.D. and Ault, M.G. (1991): “New, Delayed Borate-Crosslinked Fluid Provides Improved Fracture Conductivity in High-Temperature Applications,” SPE paper 22838. Key words: frac fluids, crosslinked fluids, Red Fork Formation, Oklahoma, Wilcox Formation, South Texas Content: This paper talks about a borate-crosslinked fluid developed for high-temperature application. The evolution of high-temperature fracturing fluids is reviewed along with the chemistry of the new fluid. Laboratory data is presented along with case histories. Chambers, M.R., Mueller, M.W. and Grossmann, A. (1995): Well Completion Design and Operations for a Deep Horizontal Well with Multiple Fractures,” SPE paper 30417. Key words: case history, horizontal well Content: Case history of a horizontal well stimulated with multiple hydraulic fracture treatments. Design considerations are presented to optimize completion operations (perforating, stimulation and zonal isolation). Well depth is over 15,000 ft (TVD) with a horizontal section over 2,000 ft in length. Cikes, M. and Economides, M.J. (1992): “Fracturing of High-Temperature, Naturally-Fissured, Gas-Condensate Reservoirs,” SPE paper 20973. Key words: case history, naturally fissured, gas-condensate, low permeability Content: This paper discusses eleven fracture treatments that were completed in extremely high-temperature (355 to 385oF), low-permeability zones. The paper covers the completion and stimulation treatment design, treatment execution and post-fracture evaluation. Cikes, M. (1996): “Long-term Hydraulic-Fracture Conductivities Under Extreme Conditions,” SPE paper 66549.
Stimulation Technologies for Deep Well Completions DE-FC26-02NT41663
7. Bibliography: Deep Gas Well Stimulation
Pinnacle Technologies, Inc. 155
Key words: proppant, conductivity, case history Content: This paper evaluates the performance of proppants subject to severe conditions of stress and temperature. Production histories and pressure buildup tests are evaluated from four wells completed in a hot, high-pressure reservoir. Reservoir temperatures ranged from 354 to 383oF and effective closure stress from 3,640 to 7,395 psi. Cochener, J.C., and Hill, D.G. (2001): “Big League Potential Has Industry Going Deep for Gas,” American Oil & Gas Reporter, V. 44, N. 3, pp 68-70, 72, 75-77. Key words: deep gas resource, key deep gas regions, gas quality Content: Overview of deep gas resource in the lower 48 U.S. Provides an assessment of resource and gas quality by region along with emerging plays. Cochener, J. and Brandenburg, C. (1998): “Expanding the Role of Onshore Deep Gas,” GasTIPS, V. 4, N. 3, pp 4-8. Key words: deep gas resource, key deep gas regions, gas quality Content: Overview of deep gas resource in the lower 48 U.S. Provides an assessment of resource and gas quality by region along with emerging plays along with a quick review of challenges in bringing deep gas to the market. Collins, J.C. and Graves, J.R. (1989): “The Bighorn No. 1-5: A 25,000-ft Precambrian Test in Central Wyoming,” SPE paper 14987. Key words: case history, Wind River Basin, Madison Formation Content: This paper reports on a deep (25,000 ft TVD) well drilled on the Madden anticline in 1983 to 1985. Drilling performance by section is discussed and production testing of the Madison is briefly described. Conway, M.W. and Harris, L.E. (1982): “A Laboratory and Field Evaluation of a Technique for Hydraulic Fracturing Stimulation of Deep Wells,” SPE paper 10964. Key words: fracturing fluids Content: This paper discusses treating fluids for stimulating deep wells. It covers a laboratory method and test results to evaluate the time-temperature stability of a crosslinked gel fluid system. Field results from Oklahoma and Texas wells are presented. Cooke, C.E. (1976): “Hydraulic Fracturing with a High-Strength Proppant," SPE paper 6213. Key words: proppant, high-strength proppant, conductivity Content: This paper discusses laboratory studies of high-strength proppant and describes field applications of the proppant and summarizes factors affecting gas well stimulation. Crow, R. and Craig, B.D. (1992): “Drilling and Completion Practices for Deep Sour Gas Wells in the Madden Deep Unit of Wyoming,” SPE paper 24604. Key words: Madison Formation, sour gas, completion design, Madden Deep Unit Content: This paper presents the drilling and completion practices for two deep and hot sour gas wells in the Madison Formation of the Madden Deep Unit in Wyoming. The wells were drilled to approximately 25,000 ft. A corrosion study and tubular selection is discussed. Crenshaw, P.L. and Flippen, F.F. (1968): “Stimulation of the Deep Ellenburger in the Delaware Basin,” SPE paper 2075. Key words: Delaware basin, acid fracturing, Ellenburger Formation, dolomite, limestone, case history Content: This early paper covers problems stimulating deep wells completed in the Ellenburger Formation in West Texas. Problems include lack of treatment height confinement, lack of fluid-loss control and lack of knowledge about acid reaction at high temperatures and pressures. Cutler, R.A., Jones, A.H., Swanson, S.R. and Carroll Jr., H.B. (1981): “New Proppants For Deep Gas Well Stimulation,” SPE paper 9869.
Stimulation Technologies for Deep Well Completions DE-FC26-02NT41663
7. Bibliography: Deep Gas Well Stimulation
Pinnacle Technologies, Inc. 156
Key words: proppants, conductivity Content: This paper discussed the manufacturing and testing of high-strength proppants. Laboratory test results for conductivity under simulated downhole conditions are shown. Davis Jr., W.E (1975): “Considerations for Fracture Stimulation of the Deep Morrow in the Anadarko Basin,” SPE paper 5391. Key words: case history, Anadarko Basin, Morrow Formation Content: This paper discusses stimulation of the Morrow Formation in the Anadarko Basin of Oklahoma. Fluids, proppant, equipment and techniques for deep well stimulation are discussed. Results from four wells are shown. de Pater, C.J., Zoback, M.D., Wright, C.A. and Engeser, B. (1996): “Complications with Stress Tests - Insights from a Fracture Experiment in the Ultra-deep KTB Borehole,” SPE paper 36437. Key words: in situ stress, stress tests, fracture mechanics Content: This paper documents injection tests that were conducted in a 9,000-meter deep borehole to measure in situ stress. Dyman, T.S. and Kuuskraa, V.A. (2003): “Geologic Studies of Deep Natural Gas Resources,” USGS Digital Data Series 67, DDS-67 http://geology.cr.usgs.gov/energy/DDS-67/ as of 6/26/03, CD-ROM. Key words: deep gas resource, plays, deep gas potential Content: This report summarizes major conclusions from ongoing USGS work on deep gas resources. The report includes chapters on the location and description of deep sedimentary basins, geochemical work on source rock and gas generation, assessment of Gulf Coast plays and deep gas drilling in the 1990’s. Dyman, T. S., Rice, D. D. and P. A. Westcott (1997): “Geologic Controls of Deep Natural Gas Resources in the United States,” USGS Bulletin 2146, http://pubs.usgs.gov/bul/b2146/b2146.pdf as of 6/26/03. Key words: deep gas resource, plays, deep gas potential Content: This is an extensive collection of papers. Papers in this bulletin address major areas of geologic research funded by the United States Geologic Survey (USGS) Onshore Oil & Gas Program and the Gas Research Institute. During the first phase of the work, deep well data were tabulated and summarized, preliminary reservoir properties and structural settings for deep gas accumulations were identified and porosity and source-rock geochemistry studies were conducted. During the second phase of the work, general geologic controls governing natural gas distribution were determined, geologic and production data for significant reservoirs were tabulated and summarized, diagenetic controls for select reservoirs were established, production and pressure-test data were interpreted, geochemical controls and geologic settings for non-hydrocarbon gases were identified, the setting and controls of unusually high porosity in deeply buried rocks were defined, the source rock potential of Precambrian sedimentary rocks was investigated and the range of potential of kerogen at high levels of maturation was studied. Papers in this bulletin summarize major conclusions reached in both phases of work on deep natural gas resources. Economides, M.J., Cikes, M., Pforter, H., Udick, T.H. and Uroda, P. (1989): “The Stimulation of a Tight, Very High-Temperature Gas-Condensate Well,” SPE paper 15239. Key words: case history, gas-condensate reservoir, low permeability, frac fluid selection Content: This paper presents a pre-treatment analysis of the well, thermal and lithologic considerations for selection of the fracture-fluid system, treatment execution and post-frac analysis. Well performance is analyzed and the effects of gas condensate on production and refracture potential are discussed. Economides, M.J. and Nolte, K.G. (editors) (2000): “Reservoir Stimulation – Third Edition, Schlumberger” Key words: hydraulic fracturing, rock mechanics, formation evaluation, fracturing fluids, proppants, conductivity, fracture modeling, fracture diagnostics, treatment design, completion design, treatment analysis, economics, acidizing, formation damage Content: Comprehensive publication covering formation stimulation including hydraulic fracturing, acid fracturing and matrix acidizing.
Stimulation Technologies for Deep Well Completions DE-FC26-02NT41663
7. Bibliography: Deep Gas Well Stimulation
Pinnacle Technologies, Inc. 157
Ely, J.W., Martin, M.A. Duenas, J.J. and Trythall, J.R. (2003): “Enhanced Fracture Stimulation in the Deep Morrow Sandstone in Western Oklahoma,” SPE paper 80932. Key words: case history, Oklahoma, Morrow Content: This paper covers a project to optimize treatments in the Deep Morrow Sandstone in western Oklahoma. Offset well results and diagnostic injections were used to optimize treatment design and to identify potential treatment execution problems. Production data is compared to offset wells fractured with other job designs. Ely, J.W., Cobb, W.J., Elkin, B. and Bell, D.D. (1989): “Successful Proppant Fracturing of Ultradeep Sour Gas Reservoir,” SPE paper 19768. Key words: case history, Mississippi, Smackover, sour gas Content: This paper reports on hydraulic fracturing of four sour gas wells completed in the deep (19,000 ft), hot (330°F) Smackover Formation in Mississippi. Stimulation treatment design and execution is discussed along with production results for each well. Gibbs, M.A. (1968): “Ellenburger Stimulation – Past, Present and Future,” SPE paper 2347. Key words: Delaware basin, completion, dolomite, limestone, case history Content: This early paper reviews stimulation practices in deep wells (up to 20,000 ft TVD) in the Delaware Basin in West Texas. A variety of completion techniques have been used to cope with the depth, high-temperature and large gross pay thickness of these wells. Gidley, J.L., Holditch, S.A. Nierode, D.E. and Veatch, R.W. (editors) (1989): “Recent Advances in Hydraulic Fracturing,” SPE Monograph Vol. 12. Key words: hydraulic fracturing, rock mechanics, formation evaluation, fracturing fluids, proppants, conductivity, fracture modeling, fracture diagnostics, treatment design, completion design, treatment analysis, economics Content: Comprehensive SPE monograph on hydraulic fracturing with contributions from 23 authors. Griffin, L.G., Sullivan, R.B., Wolhart, S.L., Waltman, C.K., Wright, C.A., Weijers, L. and Warpinski, N.R. (2003): Hydraulic Fracture Mapping of the High-temperature, High-pressure Bossier Sands in East Texas,” SPE paper 84489. Key words: case history, Bossier Sand, East Texas Basin, flowback, microseismic hydraulic fracture mapping, fracture diagnostics Content: This paper presents the results of microseismic hydraulic fracture mapping for three wells completed in the Bossier tight gas sand play in the East Texas Basin. The paper shows fracture geometry (azimuth, height and length) results from monitoring both waterfrac and hybrid waterfrac treatments. Fracture length development and pay zone coverage is discussed. Hahn, D.E., Pearson, R.M. and Hancock, S.H. (2000): “Importance of Completion Design Considerations for Complex, Hostile, and HP/HT Wells in Frontier Areas,” SPE papers 59750. Key words: completion design, frontier wells, tubular selection, sour gas Content: This paper shows an engineering design approach for planning deep, difficult and complex wells. A methodology is presented that accounts for stress due to thermal effects, axial loads and pressure differentials. Selection of tubulars is emphasized but other aspects of completion design are discussed (packers, other downhole equipment, completion fluids and perforating). Hahn, D.E., Burke, L.H. Mackenzie, S.F. and Archibald, K.H. (2003): “Completion Design and Implementation in Challenging HP/HT Wells in California,” December 2003 SPE Drilling & Completion. Key words: case history, completion design, tubular selection, California Content: This paper covers the well design for deep (>20,000 ft), high-temperature (425°F) and high-pressure (18,000 psi) wells in the East Lost Hills field in California. Completion design (tubulars, packers, completion fluids and perforating) and operations are discussed.
Stimulation Technologies for Deep Well Completions DE-FC26-02NT41663
7. Bibliography: Deep Gas Well Stimulation
Pinnacle Technologies, Inc. 158
Hickey, J.W. and Crittenden, S.J. (1981): “The Comparative Effectiveness of Propping Agents in the Red Fork Formation of the Anadarko Basin,” SPE paper 10132. Key words: proppant, conductivity, Red Fork Formation, Anadarko Basin, case history Content: The paper presents the results comparing the effectiveness of various proppants and their relationship to production performance. The analysis is based on 25 wells completed in the Red Fork Formation in the Anadarko Basin. Holditch, S.A. and Ely, J. (1973): “Successful Stimulation of Deep Wells Using High Proppant Concentrations,” SPE paper 4118. Key words: South Texas, Vicksburg Formation, case history Content: This early paper on deep well stimulation discusses hydraulic fracturing of deep, hot, low permeability formations. Results from several formations are presented with an emphasis on the Vicksburg. Jennings, A.R. (1996): “Fracturing Fluids – Then and Now,” Journal of Petroleum Technology, Vol. 48, No. 7. Key words: fracturing fluids Content: This article, part of the JPT Technology Today Series, covers the evolution of fracturing fluids. Key technological advances are discussed and key references are listed. Lindsey Jr., H.E. (1972): “Deep Gas Well Completion Practices,” SPE paper 3908. Key words: completion design, tubulars, Delaware Basin, Anadarko Basin Content: This paper discusses early deep well completion designs and the evolution of practices in the Delaware and Anadarko Basins. Mayerhofer, M.J., Wolhart, S.L. and Rogers, J.D. (2005): “Results of U.S. Department of Energy Deep Gas Wells Stimulation Study,” SPE paper 95639. Key words: deep gas well drilling activity, rock mechanics, Lobo, South Texas, Weber, Wyoming Content: This paper summarizes deep gas well activity, review key rock mechanics issues in deep reservoirs and shows case histories from Wyoming and South Texas. McDermott, J.R. and Martin III, B.L. (1992): “Completion Design for Deep, Sour Norphlet Gas Wells Offshore Mobile, Alabama,” SPE paper 24772. Key words: Norphlet Formation, Mobile Bay area, corrosive gas, sour gas Content: This paper describes the evolution of completion design and equipment during the drilling of Norphlet gas wells in two fields in the Mobile Bay area. Conditions in this formation can be very challenging with well depths and temperatures exceeding 20,000 ft (TVD) and 400oF respectively. Highly corrosive gas is produced containing hydrogen sulfide and carbon dioxide. McMechan, D.E. (1991): “Fracturing Fluid Loss at High ΔP: Laboratory Tests and Field Applications,” SPE paper 21873. Key words: fracturing fluids, fluid loss, fluid leakoff , frac design Content: This paper reports on laboratory fluid loss tests conducted at high differential pressures (up to 9,000 psi) to determine the nature of fluid loss during fracture treatments. Results from field cases are reviewed to show where high fluid loss differential pressures have been observed. National Energy Technology Laboratory, 2001, Deep Trek Workshop Proceedings, March 20-21, 2001, Houston, TX., http://www.netl.doe.gov/scng/explore/ref-shelf/DeepTrek5-3%20FINAL.PDF as of 6/26/02, 97 p. Key words: deep gas resource, completion fluids, completion design Content: The proceedings on this report include presentations made during the workshop; the breakout session results for the advanced smart drilling systems, drilling and completion fluids, completion-based well design and drilling diagnostics and sensor systems; and a list of workshop participants.
Stimulation Technologies for Deep Well Completions DE-FC26-02NT41663
7. Bibliography: Deep Gas Well Stimulation
Pinnacle Technologies, Inc. 159
Osborne, M.W., McLeod Jr., H.O., Schroeder, H.D. (1981): “The Analysis and Control of Hydraulic Fracturing Problems,” SPE paper 9868. Key words: case history, South Texas, Anadarko Basin Content: This paper analyzes problems fracturing wells in South Texas and the Anadarko Basin. Modifications to fracture fluid systems, treatment design and operations to improve results are documented. Petzet, A.: “Ekho Deep Test Is Spud Amid San Joaquin Valley Uncertainty,” Oil & Gas Journal, v. 98, n. 10, pp 71-72. Key words: California, case history, Temblor sandstone Content: Summary of recent (1999 to 2000) deep gas well activity in the San Joaquin Valley in California. Target formation is the Temblor sandstone. Popov, M.A., Nuccio, V.F., Dyman, T.S., Gognat, T.A., Johnson, R.C., Schmoker, J.W., Wilson, M.S. and Bartberger, C. (2001): “Basin-Centered Gas Systems of the U.S.,” USGS Open File Report 01-135, Version 1.0, CD-ROM. Key words: basin-centered gas, deep gas resource, deep gas potential Content: Many deep gas plays are basin-centered gas accumulations. This study identifies and characterizes 33 potential basin-centered gas accumulations throughout the U.S. Rushing, J.A. and Sullivan, R.B. (2003): “Evaluation of a Hybrid Water-Frac Stimulation Technology in the Bossier Tight Gas Sand Play,” SPE paper 84394. Key words: case history, Bossier Sand, East Texas Basin, waterfrac, hybrid waterfrac Content: This paper presents results from an evaluation of stimulation treatments in the Bossier tight gas sand play in the East Texas Basin. Detailed pressure buildup test and production data analysis is shown to evaluate and compare the performance of waterfracs, gelled fluid fracs, light sand fracs and hybrid waterfracs. Fracture half-length and conductivity estimates are used to evaluate stimulation effectiveness. Samuelson, M.L. and Constien, V.G. (1996): “Effects of High Temperature on Polymer Degradation and Cleanup,” SPE paper 36495. Key words: fracturing fluids, fracture cleanup, conductivity Content: This papers presents laboratory data of degraded fracturing fluids at temperatures up to 275oF. Field data is also shown to indicate trends in polymer cleanup at these temperatures and a procedure for polymer sampling during flowback is described. Schueler, S. and Santos, R. (1996): “Fractured Horizontal Well Shows Potential of Deep Tight Gas,” Oil & Gas Journal, v. 94, n. 2, pp 46-49, 52-43. Key words: horizontal well, fracture stimulation, multiple-stage fracturing Content: Article on horizontal well in NW Germany that was stimulated with multiple hydraulic fractures. The article summarizes formation evaluation, well design, drilling, completion, stimulation and production results for the well. This well demonstrated the technical feasibility of fracturing long horizontal sections completed in tight gas formations. Sinclair, A.R. (1971): “Heat Transfer Effects in Deep Well Fracturing,” SPE paper 3011. Key words: fracture fluids Content: This early paper considers heat transfer in the design of stimulation treatments. Temperature profiles for different fracture fluids are presented and fracture growth is discussed. Soza, R. (2000): “Burlington Drills Ultradeep Wyoming Well,” Oil & Gas Journal, v. 98, n. 50, pp 50-53, 56, 58-59. Key words: Wyoming, case history, Madden Formation, Wind River Basin Content: Summary of a deep well (25,000 ft TVD) drilled by Burlington in the Madden Formation in Wyoming. The history of deep well activity in the area is summarized and drilling of the Big Horn #5-6 is covered. This well achieved $10 million in cost savings compared to earlier wells in the field.
Stimulation Technologies for Deep Well Completions DE-FC26-02NT41663
7. Bibliography: Deep Gas Well Stimulation
Pinnacle Technologies, Inc. 160
Stephenson, C., Ward, B, Taylor, D.M., Brannon, H. and Rickards, A. (2002): “Exceptional Flowback Control for Most Extreme Well Environments: The Shape of Things to Come,” SPE paper 77681. Key words: proppant flowback, proppant, Lobo Formation, Wilcox Formation, South Texas Content: Discusses the development of a deformable material for proppant flowback control under extreme conditions of stress, temperature and flow rate. Laboratory testing is discussed and case histories from South Texas are presented. Tucker, R.L. (1979): “Practical Pressure Analysis in Evaluation of Proppant Selection for the Low-Permeability, Highly Geopressured Reservoirs of the McAllen Ranch (Vicksburg) Field,” SPE paper 7925. Key words: South Texas, Vicksburg Formation, proppant Content: The paper presents an evaluation on proppant selection the McAllen Ranch Field. Historical fracture stimulation practices and effectiveness are also reviewed. Volk, L.J., Raible, C.J., Carroll, H.B. and Spears, J.S. (1981): “Embedment Of High Strength Proppant Into Low-Permeability Reservoir Rock,” SPE paper 9867. Key words: proppant, conductivity, embedment Content: Embedment of sintered bauxite into sandstone (Berea and Mesaverde) and shale (Mesaverde) cores is reported. Variables such as closure pressure, proppant size and distribution, proppant concentration, formation hardness and surface roughness are examined. Comparison is made with sand proppant. Weijers, L., Griffin, L.G., Wright, C.A., Sugiyama, H., Shimamoto, T., Takada, S., Chong K.K. and Terracina, J.M. (2002): “The First Successful Fracture Treatment Campaign Conducted in Japan: Stimulation Challenges in a Deep, Naturally Fractured Volcanic Rock,” SPE paper 77678. Key words: case history, naturally fractured rock, fracture modeling, complex fracturing, real-time data analysis Content: Case history of fracture treatments in a naturally fractured rock in Japan. Severe treatment placement problems and remedies are discussed. Pre-frac design, on-site operations and post-frac analysis are detailed. West, E.R. and Lindsey, H.E. (1968): “Completion Practices and Techniques in Deep Gas Producers of the Delaware Basin,” SPE paper 2078. Key words: Delaware basin, completion, acid stimulation, dolomite, limestone, case history Content: This early paper reviews completion practices in deep wells (up to 20,000 ft TVD) in the Delaware Basin in West Texas. Several deep completion types are discussed along with tubing expansion problems and acid treatment design. Whitsitt, N.F. and Dysart, G.R. (1970): “The Effect of Temperature on Stimulation Design,” SPE paper 2497. Key words: fracturing fluids, acidizing Content: This early paper looks at calculations of fracture fluid temperature distribution and the effect of high temperatures on fracture fluid properties and acid reaction rates. Woodruff, R.A., Asadi, M., Leonard, R.S. and Rainbolt, M (2003): “Monitoring Fracturing Fluid Flowback and Optimizing Fracturing Fluid Cleanup in the Bossier Sand Using Chemical Frac Tracers,” SPE paper 84484. Key words: case history, Bossier Sand, East Texas Basin, flowback, chemical tracers, fracture diagnostics Content: This paper discusses the use of chemical tracers to evaluate treatment effectiveness. Chemical tracers are pumped during the stimulation treatment and their recovery is monitored during fluid flowback. Results from wells in the Bossier tight gas sand play in the East Texas Basin are presented.
Stimulation Technologies for Deep Well Completions DE-FC26-02NT41663
7. Bibliography: Deep Gas Well Stimulation
Pinnacle Technologies, Inc. 161
Xiong, H., Green, T.W., Guo, X. and Wang, M.: “Field Applications of Advanced Stimulation Technology in Deep and Hot Wells in Dagang Oilfield, China – Diagnostic Tests Made Fracturing Tests Successful,” SPE paper 51074. Key words: case history, China, frontier areas, frac design, real-time data analysis Content: This paper reviews fracture treatments in China and the utilization of diagnostics injections, real-time analysis and advanced fracture modeling to optimize stimulation treatments. Pre-frac design, on-site operations and post-frac analysis are detailed. Challenges that were overcome due to local operational limitations are covered.