Embed Size (px)
Citation preview
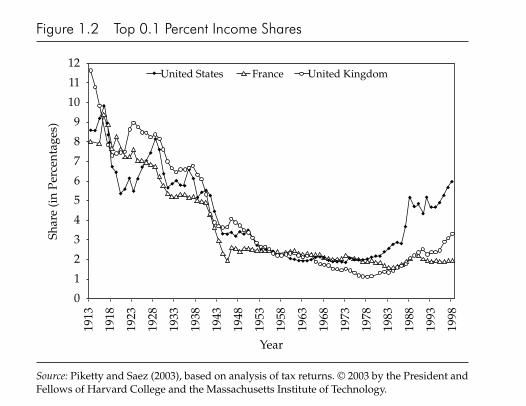
distribution of household income and net worth (total family assets minusits liabilities such as mortgages and other forms of debt). The top 1 percentof households drew 16.6 percent of all income but wielded control overmore than double this percentage of the country’s wealth (38.1 percent).By contrast, the supermajority of the country—the “bottom” 90 percent ofhouseholds—earned the majority of household income (58.8 percent) butcontrolled less than half this percentage (29 percent).4
4 Inequality and American Democracy
Figure 1.1 U.S. Family Income Growth
Source: Reprinted from Mishel, Bernstein, and Boushey (2003, 57), based on U.S. census data.Copyright © 2003 by Cornell University. Used by permission of the publisher, Cornell Uni-versity Press.
LowestFifth
SecondFifth
MiddleFifth
FourthFifth
TopFifth
140%
120%
100%
80%
60%
40%
20%
0%
Gro
wth
1947 to 1973
LowestFifth
SecondFifth
MiddleFifth
FourthFifth
TopFifth
70%
60%
50%
40%
30%
20%
10%
0%
Gro
wth
1973 to 2000
115.3%
97.1% 97.7% 102.9%
84.0%
10.3%15.5%
24.1%
33.6%
61.6%
times the wealth of the median black household. Nearly two-thirds ofblack households (61 percent) and half of Hispanic households have nonet worth, compared with only a quarter of their white counterparts.5
Even young, married, black couples in which both adults work—the shin-ing beacons of progress toward racial equality—still earn 20 percent lessthan their white counterparts and have a staggering 80 percent less networth. These figures are based on an unfortunately all-too-infrequent in-depth analysis of income and wealth among African Americans from 1987to 1989. More recent analyses, however, still show a similar pattern: im-provement in absolute terms but continuing racial disparities. Accordingto an analysis of the Federal Reserve Board’s Survey of Consumer Finances,the median net worth of African Americans nearly quadrupled, from$5,300 in 1989 to $19,000 in 2001. Nonetheless, the median net worth ofwhites in 2001 was more than ten times greater ($121,000) than for AfricanAmericans ($19,000). At nearly every level of wealth, whites continued toenjoy much greater net worth than African Americans in 2001 (Kennickell2003, 34–36).
6 Inequality and American Democracy
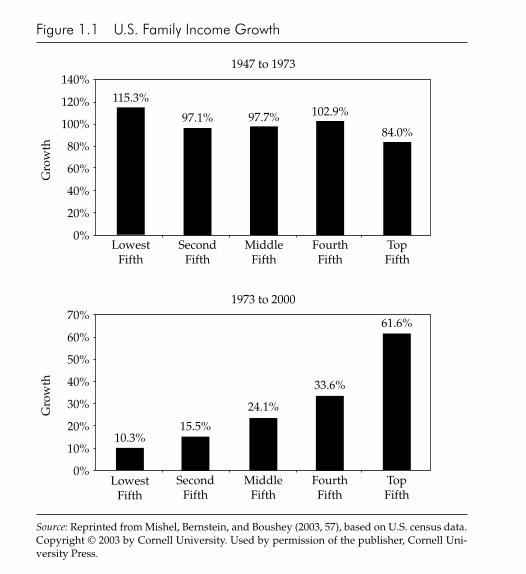
Figure 1.2 Top 0.1 Percent Income Shares
Source: Piketty and Saez (2003), based on analysis of tax returns. © 2003 by the President andFellows of Harvard College and the Massachusetts Institute of Technology.
1913
1918
1923
1928
1933
1938
1943
1948
1953
1958
1963
1968
1973
1978
1983
1988
1993
1998
12
11
10
9
8
7
6
5
4
3
2
1
0
Shar
e (i
n Pe
rcen
tage
s)
Year
United States France United Kingdom
Disparities in wealth and income in the United States are much sharperand have grown faster than in other advanced industrial Western democ-racies. Figure 1.2 presents information about income trends for Americanfamilies compared against families in Britain and France. The proportionof income accruing to the top one-tenth of 1 percent of families ran alongparallel tracks for much of the twentieth century. All three countries re-duced inequality from the end of World War I through World War II anduntil the 1960s. But from the mid-1970s on, the United States rapidly di-verged from both Britain and France and became far more unequal. By1998, the share of income held by the very rich was two or three timeshigher in the United States than in Britain and France.
The bottom line is clear: the resident of an American penthouse on the toptwentieth floor is doing much better than his neighbors not only in the base-ment but also on the sixteenth floor and, for that matter, any floor. The debateamong analysts is no longer about whether inequality has risen and reachedunparalleled levels in the United State. Discussion has shifted to pinpointingwhy economic inequality rose. A range of demographic, technological, andpolitical factors have contributed to rising economic gaps, and we leave it toanalysts of economic distributions to sort out their relative impact (see thediscussions in Burtless 1999; and Mishel, Bernstein, and Boushey 2003,56–82). In chapter 4, we will assess some of the ways in which governmentpolicies have contributed to the emergence and persistence of greater in-equality in the United States compared with other advanced nations.
Economic disparities are particularly striking when it comes to com-parisons across races. The Civil Rights era helped lift the absolute levels ofincome and wealth enjoyed by African Americans and Hispanics. Thesetwo groups, however, remain far behind white America. In the late 1980s,the median white household earned 62 percent more and had twelve
American Democracy in an Era of Rising Inequality 5
Table 1.1 Distribution of Income and Wealth, 1998
Household Income Net Worth(Percentage) (Percentage)
All 100.0 100.0Top 1 percent 16.0 38.1Bottom 90 percent 58.5 29.0
Source: Reprinted from Mishel, Bernstein, and Boushey (2003, 279), based on Federal ReserveBoard Survey of Consumer Finances. Copyright © 2003 by Cornell University. Used by per-mission of the publisher, Cornell University Press.Note: Net worth is the sum of all of a family’s assets—checking and savings accounts, prop-erty ownership, stock holdings, retirement funds and other assets—minus all of the family’sliabilities—debt owed for credit cards and loans for college, property, and other purchases.
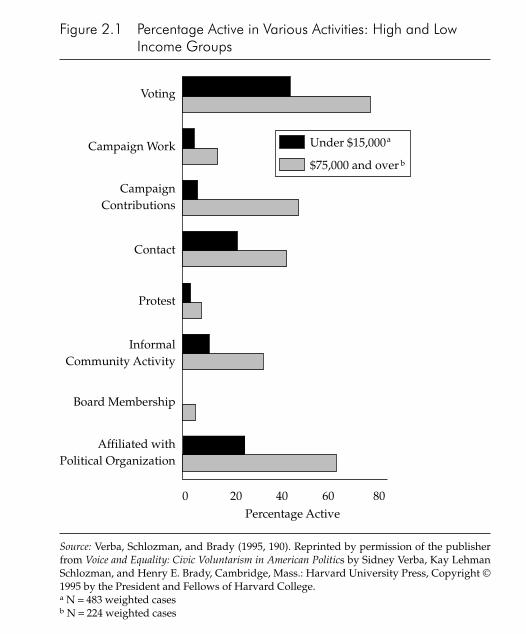
ity between the two income groups is especially wide when it comes tomaking campaign contributions.
Interestingly, even protesting—which demands little in the way ofskills or money and is often thought of as “the weapon of the weak”—is
Inequalities of Political Voice 35
Figure 2.1 Percentage Active in Various Activities: High and LowIncome Groups
Source: Verba, Schlozman, and Brady (1995, 190). Reprinted by permission of the publisherfrom Voice and Equality: Civic Voluntarism in American Politics by Sidney Verba, Kay LehmanSchlozman, and Henry E. Brady, Cambridge, Mass.: Harvard University Press, Copyright ©1995 by the President and Fellows of Harvard College.a N = 483 weighted casesb N = 224 weighted cases
Voting
Campaign Work
CampaignContributions
Contact
Protest
InformalCommunity Activity
Board Membership
Affiliated withPolitical Organization
0 20 40 60 80Percentage Active
Under $15,000a
$75,000 and over b
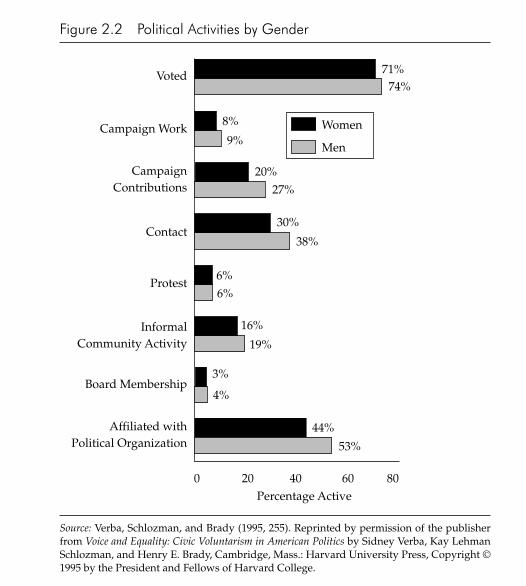
were slightly more likely than women to have taken part in each of the po-litical activities on the list.22 The pattern of gender differences in figure 2.2is, however, somewhat unexpected. It has sometimes been argued that themasculine advantage with respect to political participation derives froman emphasis on electoral forms of activity. However, when the definitionof political activity is expanded to encompass informal community activ-ity and organizational affiliation—forms of involvement in which women
Inequalities of Political Voice 37
Figure 2.2 Political Activities by Gender
Source: Verba, Schlozman, and Brady (1995, 255). Reprinted by permission of the publisherfrom Voice and Equality: Civic Voluntarism in American Politics by Sidney Verba, Kay LehmanSchlozman, and Henry E. Brady, Cambridge, Mass.: Harvard University Press, Copyright ©1995 by the President and Fellows of Harvard College.
Voted
Campaign Work
CampaignContributions
Contact
Protest
InformalCommunity Activity
Board Membership
Affiliated withPolitical Organization
0 20 40 60 80Percentage Active
Women
Men
53%
44%
4%
3%
16%
19%
6%6%
30%
38%
20%27%
9%
8%
71%74%
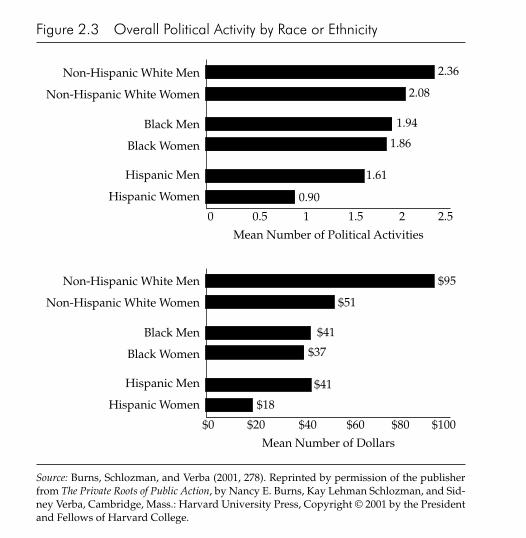
Figure 2.3 Overall Political Activity by Race or Ethnicity
Source: Burns, Schlozman, and Verba (2001, 278). Reprinted by permission of the publisherfrom The Private Roots of Public Action, by Nancy E. Burns, Kay Lehman Schlozman, and Sid-ney Verba, Cambridge, Mass.: Harvard University Press, Copyright © 2001 by the Presidentand Fellows of Harvard College.
have been presumed to specialize—the gender gap in participation doesnot disappear.
Figure 2.3 considers the overall activity, as measured by the averagescore on an additive scale of these eight activities and the average numberof dollars donated to political campaigns and causes, of the groups de-fined by race or ethnicity and gender. When it comes to various kinds ofpolitical activity, both race or ethnicity and gender play a role. In a patternthat is repeated over and over, when the scale is taken apart into its indi-vidual components, non-Hispanic white men are the most active, Latina
38 Inequality and American Democracy
0 0.5 1 1.5 2 2.5
Mean Number of Political Activities
Non-Hispanic White Men
Non-Hispanic White Women
Black Men
Black Women
Hispanic Men
Hispanic Women
$0 $20 $40 $60 $80 $100
Mean Number of Dollars
Non-Hispanic White Men
Non-Hispanic White Women
Black Men
Black Women
Hispanic Men
Hispanic Women
2.36
2.08
1.94
1.86
1.61
0.90
$95
$51
$41
$37
$41
$18
women the least. Overall, non-Hispanic whites are more active thanAfrican Americans, who are, in turn, more active than Hispanics. Withineach group defined by race or ethnicity, women are less active than men.However, the size of the gender gap varies across the groups defined bytheir race or ethnicity and is widest, by far, among Latinos and narrowestamong African Americans. With respect to political giving, non-Hispanicwhite men donate the largest amounts, and the gender disparity is widestin absolute dollars among non-Hispanic whites, whose levels of contribu-tions are highest, and in relative terms among Latinos.
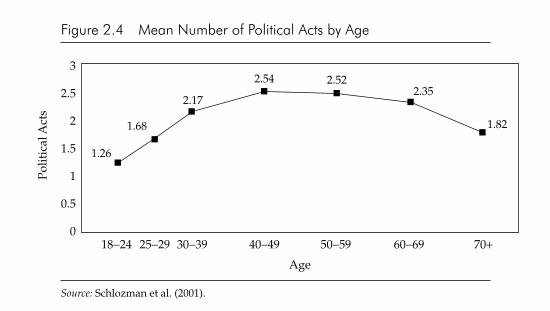
Figure 2.4 confirms the widely observed pattern of life-cycle variationin political activity: participation rates are low among younger citizens,rise steadily before peaking in middle age, and drop off somewhat amongthe elderly. The age disparities are substantial: the gap in activity betweenthose under twenty-five and the forty-somethings is wider than that be-tween non-Hispanic white men and Latina women. This curvilinear pat-tern is remarkably consistent when particular political acts are consideredseparately. However, as usual, there are variations. While those underthirty generally post very low rates of political activity, they are about av-erage in their rate of campaign participation and are the age group mostlikely to take part in a protest. At the other end of the life cycle, as we sawin table 2.1, the elderly continue to go to the polls. In contrast, the declinein senior participation is especially steep when it comes to informal com-munity activity and contacts with public officials.
Inequalities of Political Voice 39
Figure 2.4 Mean Number of Political Acts by Age
Source: Schlozman et al. (2001).
3
2.5
2
1.5
1
0.5
0
Polit
ical
Act
s
18−24 25−29 30−39 40−49 50−59 60−69 70+
1.26
1.68
2.17
2.54 2.522.35
1.82
Age
Inequalities of Political Voice 47
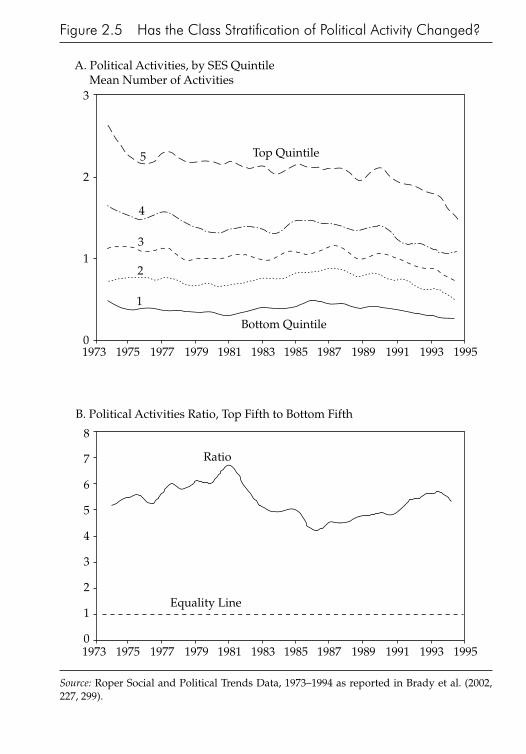
Figure 2.5 Has the Class Stratification of Political Activity Changed?
Source: Roper Social and Political Trends Data, 1973–1994 as reported in Brady et al. (2002,227, 299).
199519931991198919871985198319811979197719751973
3
2
1
0
A. Political Activities, by SES Quintile Mean Number of Activities
Top Quintile
Bottom Quintile
5
4
3
2
1
199519931991198919871985198319811979197719751973
B. Political Activities Ratio, Top Fifth to Bottom Fifth
8
7
6
5
4
3
2
1
0
Ratio
Equality Line
absentee ballot were designed to raise turnout. One factor that has oper-ated in a contrary direction and may have contributed to downward pres-sure on turnout is the erosion in union power and in the share of Ameri-can workers who are union members.44
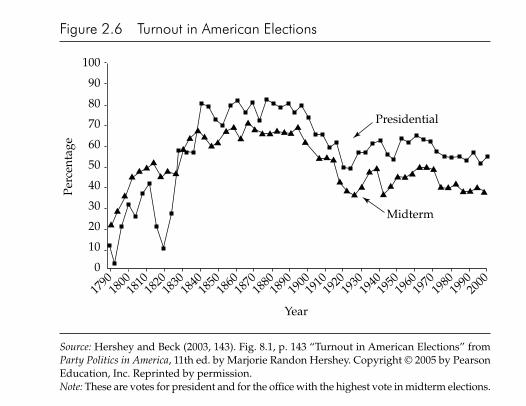
Our political parties are in many ways enjoying a period of revitaliza-tion: party voting in Congress has risen over the past two decades, and theparties are more ideologically coherent at both the elite and the mass level.The party organizations provide services and funding for candidates. Still,an important part of the explanation for the erosion in electoral turnoutone is the weakened role of the political parties as vote mobilizers. Effortsby party workers to contact potential voters to urge them to vote have de-clined.45 Campaigns are increasingly run by professionals rather than partyactivists.46 Using poll data, campaign consultants have the technologicalwherewithal to target carefully selected small groups of citizens with tar-geted messages that seek to raise money or to activate voters to turn out.
The weakness of parties as mass institutions results in greater stratifi-cation of the activists who get involved in elections as campaign workers
Inequalities of Political Voice 59
Figure 2.6 Turnout in American Elections
Source: Hershey and Beck (2003, 143). Fig. 8.1, p. 143 “Turnout in American Elections” fromParty Politics in America, 11th ed. by Marjorie Randon Hershey. Copyright © 2005 by PearsonEducation, Inc. Reprinted by permission.Note: These are votes for president and for the office with the highest vote in midterm elections.
Midterm
Presidential
Year
1790
1800
1810
1820
1830
1840
1850
1860
1870
1880
1890
1900
1910
1920
1930
1940
1950
1960
1970
1980
1990
2000
100
90
80
70
60
50
40
30
20
10
0
Perc
enta
ge
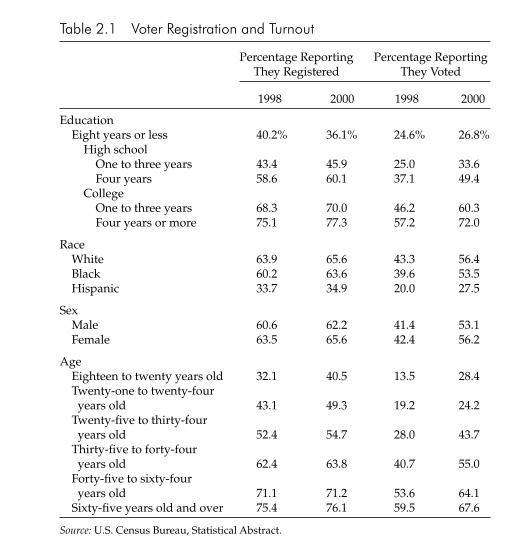
shown in table 2.1, there are significant group differences in turnout. Nev-ertheless, the extent of participatory inequality is much less pronouncedwhen it comes to voting than it is for political activities that demand morein the way of resources or skills—for example, contacting a public official,getting involved in a campaign, or sitting on the local zoning board.
At the other end of the continuum, campaign contributors, especiallythose who make large donations, are the least representative group of ac-tivists. Not only are campaign donors an unrepresentative group of indi-
Inequalities of Political Voice 33
Table 2.1 Voter Registration and Turnout
Percentage Reporting Percentage ReportingThey Registered They Voted
1998 2000 1998 2000
EducationEight years or less 40.2% 36.1% 24.6% 26.8%
High schoolOne to three years 43.4 45.9 25.0 33.6Four years 58.6 60.1 37.1 49.4
CollegeOne to three years 68.3 70.0 46.2 60.3Four years or more 75.1 77.3 57.2 72.0
RaceWhite 63.9 65.6 43.3 56.4Black 60.2 63.6 39.6 53.5Hispanic 33.7 34.9 20.0 27.5
SexMale 60.6 62.2 41.4 53.1Female 63.5 65.6 42.4 56.2
AgeEighteen to twenty years old 32.1 40.5 13.5 28.4Twenty-one to twenty-four years old 43.1 49.3 19.2 24.2
Twenty-five to thirty-four years old 52.4 54.7 28.0 43.7
Thirty-five to forty-fouryears old 62.4 63.8 40.7 55.0
Forty-five to sixty-four years old 71.1 71.2 53.6 64.1
Sixty-five years old and over 75.4 76.1 59.5 67.6
Source: U.S. Census Bureau, Statistical Abstract.
characterized by the pattern of socioeconomic bias. The successes of thelabor and civil rights movements illustrate the possibilities for the disad-vantaged when they mobilize collectively. However, the United Statesalso has a long tradition of middle-class protest movements ranging fromabolition and temperance to environmentalism and disarmament. Thebottom line is that, even when it comes to protest, the well-educated andwell-heeled are more likely to take part. In fact, when the protesters in thissurvey were asked about the issue or problem at stake in their activity,those who had demonstrated about a national issue were far more likelyto mention abortion than any other issue.
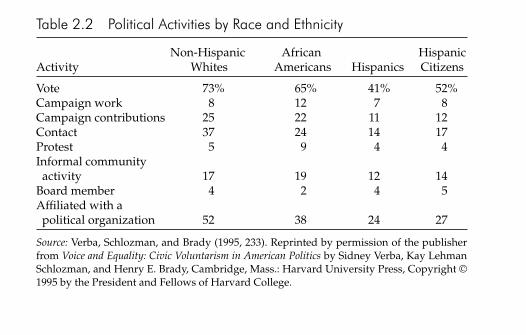
Participatory input is associated not only with socioeconomic statusbut also with race or ethnicity, gender, and age. In terms of overall partic-ipation, non-Hispanic whites are more politically active than AfricanAmericans and, especially, Hispanics. However, as shown in table 2.2, thisrank order does not always obtain when we consider particular forms ofpolitical activity, and the differences between African Americans and non-Hispanic whites are, for most activities, small in magnitude and inconsistentin direction. Blacks are more likely to have reported taking part in a protest,engaging in informal community activity and, perhaps, reflecting the timingof the survey in the aftermath of Jesse Jackson’s 1988 presidential bid, work-ing in a political campaign. In contrast, for most of the activities, Hispanics,even Hispanic citizens, were less likely to report having taken part.
When it comes to gender, as shown in figure 2.2, the differences aresmall in magnitude and consistent in direction: except for protesting, men
36 Inequality and American Democracy
Table 2.2 Political Activities by Race and Ethnicity
Non-Hispanic African Hispanic Activity Whites Americans Hispanics Citizens
Vote 73% 65% 41% 52%Campaign work 8 12 7 8Campaign contributions 25 22 11 12Contact 37 24 14 17Protest 5 9 4 4Informal community activity 17 19 12 14
Board member 4 2 4 5Affiliated with a political organization 52 38 24 27
Source: Verba, Schlozman, and Brady (1995, 233). Reprinted by permission of the publisherfrom Voice and Equality: Civic Voluntarism in American Politics by Sidney Verba, Kay LehmanSchlozman, and Henry E. Brady, Cambridge, Mass.: Harvard University Press, Copyright ©1995 by the President and Fellows of Harvard College.
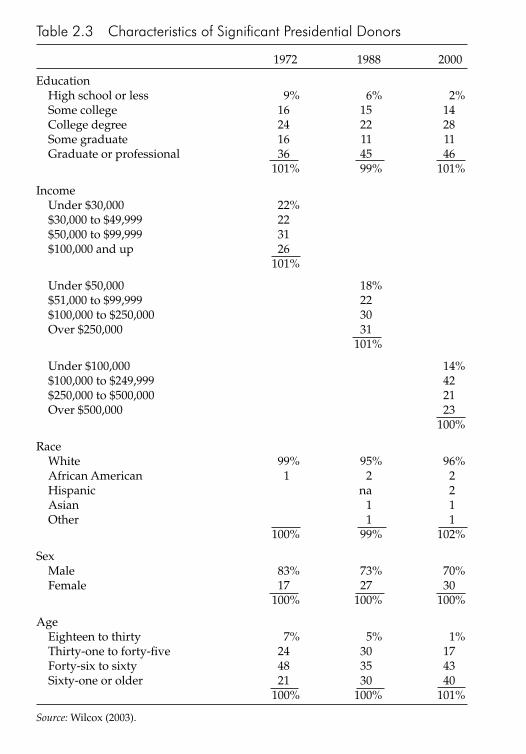
Table 2.3 Characteristics of Significant Presidential Donors
1972 1988 2000
EducationHigh school or less 9% 6% 2%Some college 16 15 14College degree 24 22 28Some graduate 16 11 11Graduate or professional 36 45 46
101% 99% 101%
IncomeUnder $30,000 22%$30,000 to $49,999 22$50,000 to $99,999 31$100,000 and up 26
101%
Under $50,000 18%$51,000 to $99,999 22$100,000 to $250,000 30Over $250,000 31
101%
Under $100,000 14%$100,000 to $249,999 42$250,000 to $500,000 21Over $500,000 23
100%
RaceWhite 99% 95% 96%African American 1 2 2Hispanic na 2Asian 1 1Other 1 1
100% 99% 102%
SexMale 83% 73% 70%Female 17 27 30
100% 100% 100%
AgeEighteen to thirty 7% 5% 1%Thirty-one to forty-five 24 30 17Forty-six to sixty 48 35 43Sixty-one or older 21 30 40
100% 100% 101%
Source: Wilcox (2003).
and contributors. Those who ask others to take part in political campaignsact as “rational prospectors” recruiting from among those who have theresources to make a substantial contribution of time, effort, or money andwho are likely to say yes if asked. In particular, they will ask people whohave demonstrated those attributes by having taken part in the past(Brady, Schlozman, and Verba 1999).47
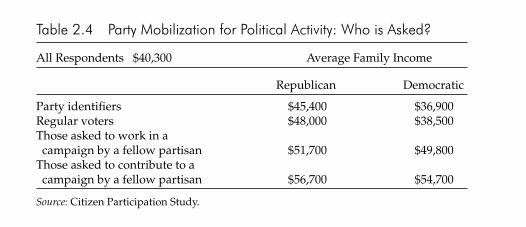
As table 2.4 shows, the result of these processes of targeted recruitment isto exacerbate the bias of the electoral process toward the more advantaged cit-izens rather than to correct it. The two parties differ in their support bases: interms of average family income, Democratic identifiers and voters are sub-stantially less affluent than their Republican counterparts. However, whenparty activists, whether Republican or Democratic, seek campaign workersand campaign contributors, they search among the more affluent members oftheir support bases. The Democratic identifiers and voters may be differentfrom their Republican counterparts, but the economic profiles of those askedby a fellow partisan to get involved in a campaign—or, especially, to make acampaign donation—are much more similar.
The search for political money by both political parties has turned up-side down the role of electoral politics as entertainment. In the nineteenthcentury, the rallies and parades stimulated political interest and activityamong Americans of all classes, perhaps disproportionately among thepoorer members of society for whom political spectacle was one of the fewforms of entertainment available and for whom patronage and the otherbenefits that parties provided were particularly valuable. Today, the en-tertainment is likely to be a fund raiser where affluent guests are winedand dined and given an opportunity to rub elbows with political celebri-ties. At the same time, in a media-saturated society, mass political com-munications no longer stimulate political engagement among ordinary
60 Inequality and American Democracy
Table 2.4 Party Mobilization for Political Activity: Who is Asked?
All Respondents $40,300 Average Family Income
Republican Democratic
Party identifiers $45,400 $36,900Regular voters $48,000 $38,500Those asked to work in a campaign by a fellow partisan $51,700 $49,800
Those asked to contribute to a campaign by a fellow partisan $56,700 $54,700
Source: Citizen Participation Study.
98 Inequality and American Democracy
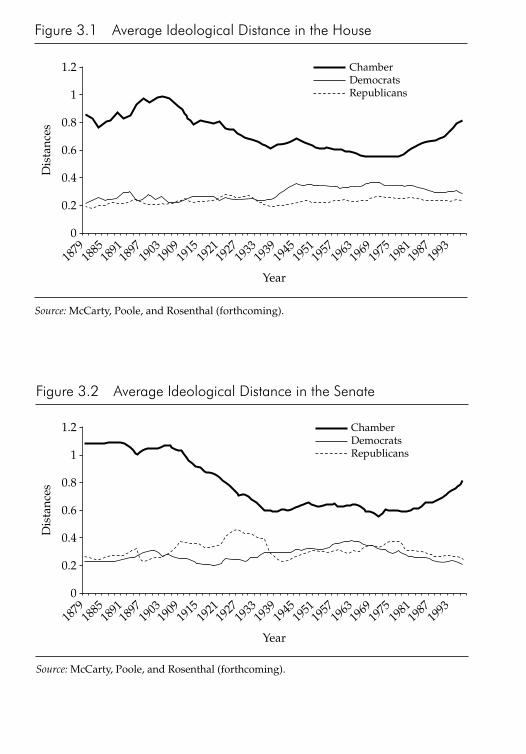
Figure 3.1 Average Ideological Distance in the House
Source: McCarty, Poole, and Rosenthal (forthcoming).
1.2
1
0.8
0.6
0.4
0.2
0
Dis
tanc
es
1879
1885
1891
1897
1903
1909
1915
1921
1927
1933
1939
1945
1951
1957
1963
1969
1975
1981
1987
1993
Year
ChamberDemocratsRepublicans
Figure 3.2 Average Ideological Distance in the Senate
Source: McCarty, Poole, and Rosenthal (forthcoming).
1.2
1
0.8
0.6
0.4
0.2
0
Dis
tanc
es
1879
1885
1891
1897
1903
1909
1915
1921
1927
1933
1939
1945
1951
1957
1963
1969
1975
1981
1987
1993
Year
ChamberDemocratsRepublicans
government in offsetting economic disparities that are generated by struc-tural changes in the economy.
The Process Approach The process approach to parties and inequalityhas origins in V. O. Key’s famous argument in Southern Politics in State andNation that well-organized party competition (defined as stable, program-matically coherent, and “factional[ly] responsible”) facilitates the politicalparticipation and influence of the economically disadvantaged. For Key,“over the long run the have-nots lose in a disorganized politics (Key 1949,307).” Key’s “have not” hypothesis was inspired by his close study of theone-party politics of the South in the Jim Crow era, which suggested thatthe southern states with the most stable, cohesive factional structures hadmore genuine competition between “ins” and “outs,” a greater “sense ofcorporate responsibility” among elected officials, less “favoritism andgraft” in the conduct of government business, and more “power to disci-pline wild-eyed men” on the explosive issue of race—all factors con-
100 Inequality and American Democracy
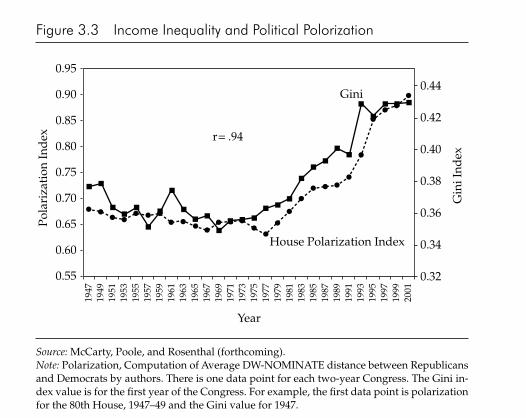
Figure 3.3 Income Inequality and Political Polorization
Source: McCarty, Poole, and Rosenthal (forthcoming).Note: Polarization, Computation of Average DW-NOMINATE distance between Republicansand Democrats by authors. There is one data point for each two-year Congress. The Gini in-dex value is for the first year of the Congress. For example, the first data point is polarizationfor the 80th House, 1947–49 and the Gini value for 1947.
0.95
0.90
0.85
0.80
0.75
0.70
0.65
0.60
0.55
Pola
riza
tion
Ind
ex
0.44
0.42
0.40
0.38
0.36
0.34
0.32
Gin
i Ind
ex
1947
1949
1951
1953
1955
1957
1959
1961
1963
1965
1967
1969
1971
1973
1975
1977
1979
1981
1983
1985
1987
1989
1991
1993
1995
1997
1999
2001
Year
House Polarization Index
Gini
r= .94
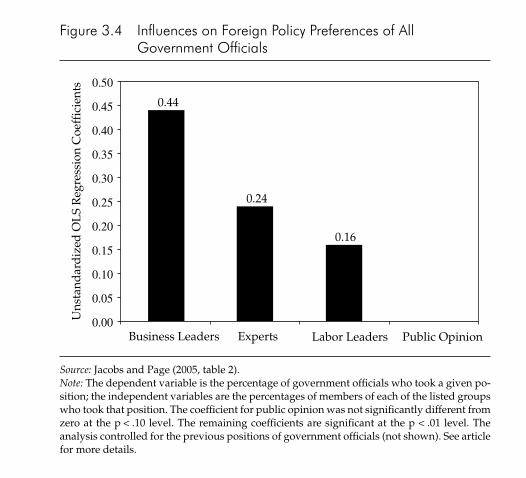
cil on Foreign Relations between 1974 and 2002, this research found thatthe views of policy experts and, especially, business leaders have a signif-icant impact on the views of government officials, but that the views of or-dinary citizens had very little discernible impact. (Modest positive effectsof public opinion appeared on economic issues and on issues that werehighly salient.) Figure 3.4 illustrates a consistent pattern of statistically sig-nificant effects on government officials: the policy stands of foreign policydecisionmakers are most influenced by business leaders, with the generalpublic exerting no significant effect. Foreign policy “experts” from acade-mia and think tanks appear to play a role, but additional analysis suggeststhat experts themselves are influenced by other elites (including business).
While systematic comparisons of the influence of elites and ordinarycitizens are unhappily rare, there is even less work to survey on disparities
Inequality and American Governance 125
Figure 3.4 Influences on Foreign Policy Preferences of AllGovernment Officials
Source: Jacobs and Page (2005, table 2).Note: The dependent variable is the percentage of government officials who took a given po-sition; the independent variables are the percentages of members of each of the listed groupswho took that position. The coefficient for public opinion was not significantly different fromzero at the p < .10 level. The remaining coefficients are significant at the p < .01 level. Theanalysis controlled for the previous positions of government officials (not shown). See articlefor more details.
0.50
0.45
0.40
0.35
0.30
0.25
0.20
0.15
0.10
0.05
0.00Uns
tand
ard
ized
OL
S R
egre
ssio
n C
oeff
icie
nts
Business Leaders Experts Labor Leaders Public Opinion
0.44
0.24
0.16
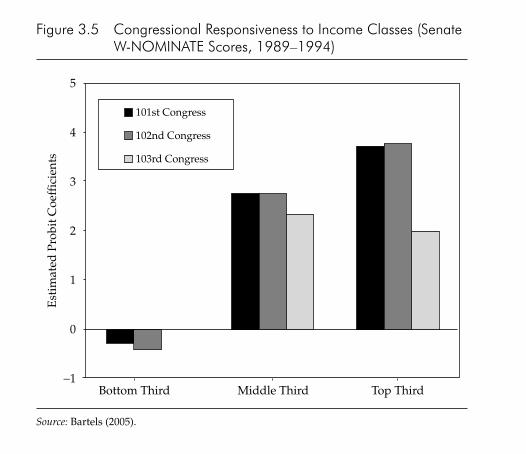
in political influence within the mass public. One unpublished study re-lates the roll call votes cast by U.S. senators in the late 1980s and early1990s to the policy views of their constituents in much the same way as inMiller and Stokes’s pioneering article, but allowing for the possibility ofdifferential responsiveness to the views of rich and poor constituents (Bar-tels 2005). This analysis suggests that income-weighted preferences weremuch more influential than simple averages of state opinion, especiallyfor Republican senators. Indeed, the related analysis summarized in fig-ure 3.5 suggests that constituents in the bottom third of the income distri-bution had no discernible impact on their senators’ general voting pat-terns across three congresses. Similar disparities appear in specific salientroll call votes on the minimum wage, civil rights, government spending,and abortion. These discrepancies in influence were partly, but by nomeans entirely, attributable to differences in political participation be-
126 Inequality and American Democracy
Figure 3.5 Congressional Responsiveness to Income Classes (SenateW-NOMINATE Scores, 1989–1994)
Source: Bartels (2005).
101st Congress
102nd Congress
103rd Congress
5
4
3
2
1
0
−1
Est
imat
ed P
robi
t Coe
ffic
ient
s
Bottom Third Middle Third Top Third
tax code worth more to high-income tax filers—who generally receivemore generous private benefits, are more likely to itemize their deduc-tions, and are in higher income tax brackets.
In recent decades, moreover, the private side of America’s hybrid bene-fit system has eroded as corporations have eliminated and restructuredbenefits to cut costs and encourage self-reliance. This erosion has takentwo forms: drops in benefit coverage and generosity, and changes in thecharacter of benefits that have shifted risk from collective intermediaries,
168 Inequality and American Democracy
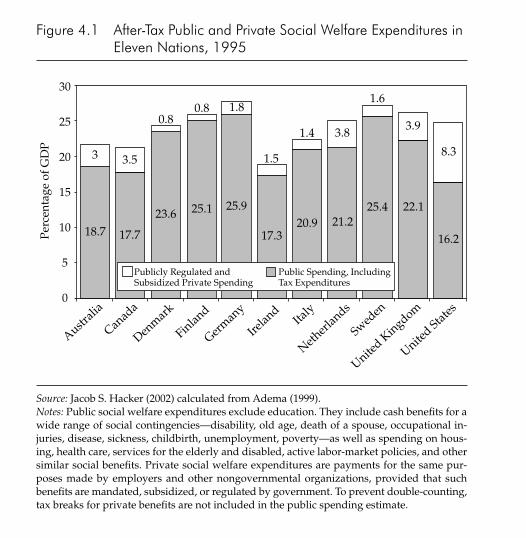
Figure 4.1 After-Tax Public and Private Social Welfare Expenditures inEleven Nations, 1995
Source: Jacob S. Hacker (2002) calculated from Adema (1999).Notes: Public social welfare expenditures exclude education. They include cash benefits for awide range of social contingencies—disability, old age, death of a spouse, occupational in-juries, disease, sickness, childbirth, unemployment, poverty—as well as spending on hous-ing, health care, services for the elderly and disabled, active labor-market policies, and othersimilar social benefits. Private social welfare expenditures are payments for the same pur-poses made by employers and other nongovernmental organizations, provided that suchbenefits are mandated, subsidized, or regulated by government. To prevent double-counting,tax breaks for private benefits are not included in the public spending estimate.
30
25
20
15
10
5
0
Perc
enta
ge o
f GD
P
3
18.7
3.5
17.7
0.8
23.6
0.8
25.1
1.8
25.9
1.5
17.3
1.4
20.9
3.8
21.2
1.6
25.4
3.9
22.1
8.3
16.2
United Stat
es
United K
ingdom
Sweden
Netherl
ands
Italy
Irelan
d
German
y
Finland
Denmar
k
Canad
a
Australi
a
Publicly Regulated andSubsidized Private Spending
Public Spending, IncludingTax Expenditures
160 Inequality and American Democracy
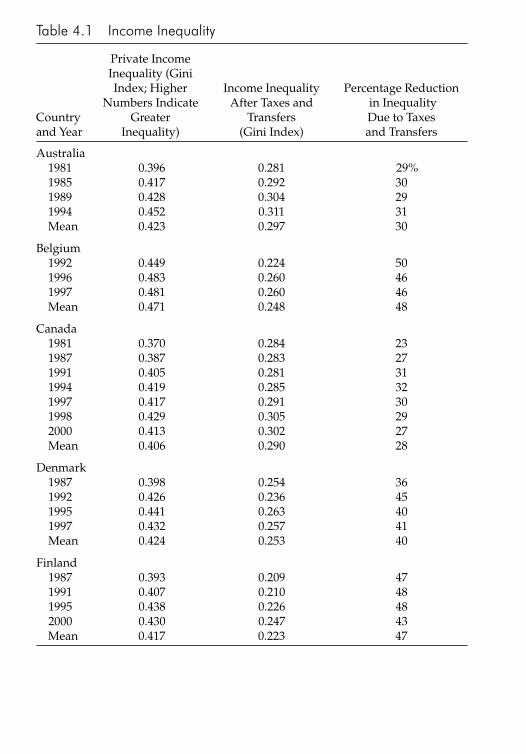
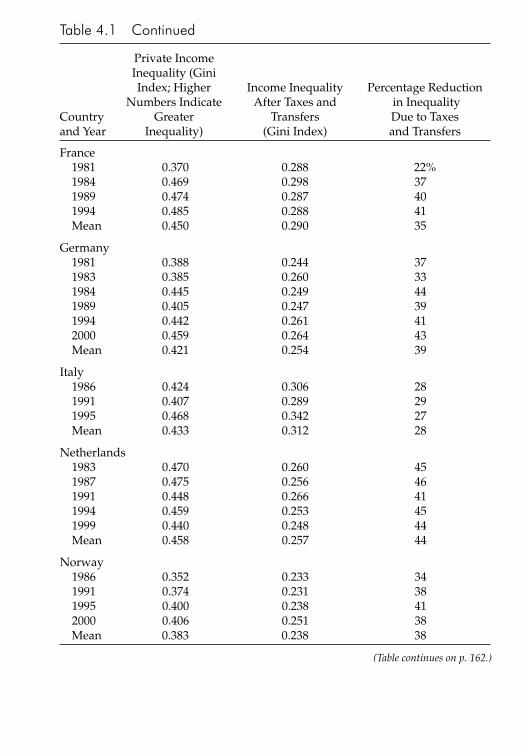
Table 4.1 Income Inequality
Private IncomeInequality (GiniIndex; Higher Income Inequality Percentage Reduction
Numbers Indicate After Taxes and in Inequality Country Greater Transfers Due to Taxesand Year Inequality) (Gini Index) and Transfers
Australia1981 0.396 0.281 29%1985 0.417 0.292 301989 0.428 0.304 291994 0.452 0.311 31Mean 0.423 0.297 30
Belgium1992 0.449 0.224 501996 0.483 0.260 461997 0.481 0.260 46Mean 0.471 0.248 48
Canada1981 0.370 0.284 231987 0.387 0.283 271991 0.405 0.281 311994 0.419 0.285 321997 0.417 0.291 301998 0.429 0.305 292000 0.413 0.302 27Mean 0.406 0.290 28
Denmark1987 0.398 0.254 361992 0.426 0.236 451995 0.441 0.263 401997 0.432 0.257 41Mean 0.424 0.253 40
Finland1987 0.393 0.209 471991 0.407 0.210 481995 0.438 0.226 482000 0.430 0.247 43Mean 0.417 0.223 47
Inequality and Public Policy 161
Table 4.1 Continued
Private IncomeInequality (GiniIndex; Higher Income Inequality Percentage Reduction
Numbers Indicate After Taxes and in Inequality Country Greater Transfers Due to Taxesand Year Inequality) (Gini Index) and Transfers
France1981 0.370 0.288 22%1984 0.469 0.298 371989 0.474 0.287 401994 0.485 0.288 41Mean 0.450 0.290 35
Germany1981 0.388 0.244 371983 0.385 0.260 331984 0.445 0.249 441989 0.405 0.247 391994 0.442 0.261 412000 0.459 0.264 43Mean 0.421 0.254 39
Italy1986 0.424 0.306 281991 0.407 0.289 291995 0.468 0.342 27Mean 0.433 0.312 28
Netherlands1983 0.470 0.260 451987 0.475 0.256 461991 0.448 0.266 411994 0.459 0.253 451999 0.440 0.248 44Mean 0.458 0.257 44
Norway1986 0.352 0.233 341991 0.374 0.231 381995 0.400 0.238 412000 0.406 0.251 38Mean 0.383 0.238 38
(Table continues on p. 162.)
162 Inequality and American Democracy
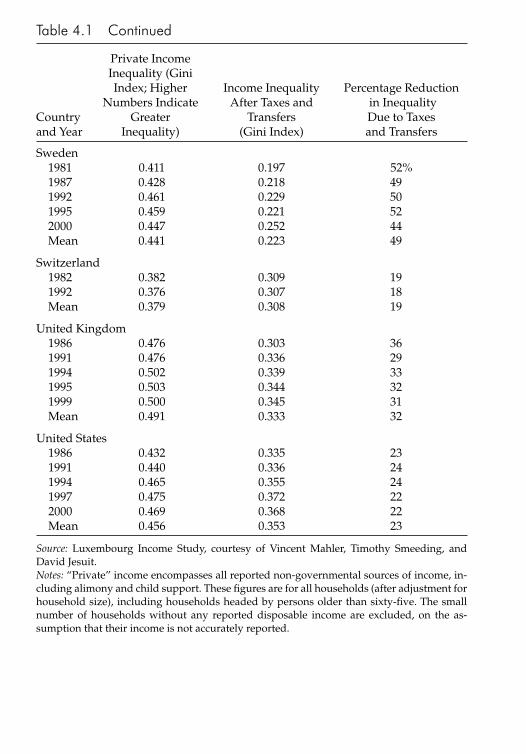
Table 4.1 Continued
Private IncomeInequality (GiniIndex; Higher Income Inequality Percentage Reduction
Numbers Indicate After Taxes and in Inequality Country Greater Transfers Due to Taxesand Year Inequality) (Gini Index) and Transfers
Sweden1981 0.411 0.197 52%1987 0.428 0.218 491992 0.461 0.229 501995 0.459 0.221 522000 0.447 0.252 44Mean 0.441 0.223 49
Switzerland1982 0.382 0.309 191992 0.376 0.307 18Mean 0.379 0.308 19
United Kingdom1986 0.476 0.303 361991 0.476 0.336 291994 0.502 0.339 331995 0.503 0.344 321999 0.500 0.345 31Mean 0.491 0.333 32
United States1986 0.432 0.335 231991 0.440 0.336 241994 0.465 0.355 241997 0.475 0.372 222000 0.469 0.368 22Mean 0.456 0.353 23
Source: Luxembourg Income Study, courtesy of Vincent Mahler, Timothy Smeeding, andDavid Jesuit.Notes: “Private” income encompasses all reported non-governmental sources of income, in-cluding alimony and child support. These figures are for all households (after adjustment forhousehold size), including households headed by persons older than sixty-five. The smallnumber of households without any reported disposable income are excluded, on the as-sumption that their income is not accurately reported.