Embed Size (px)
Citation preview

Figure 1.1: The labor market in the destination and origin countries before and after immigration
The Economics of Immigration, by Bansak, Simpson & Zavodny ©2015
Wage LS LS’ Wage LS’ LS A WD F B D WD+M WO-M I G C E WO LD LD H J LD LD+M Labor LO-M LO Labor (a) Destination country (b) Origin country
The Economics of Immigration, by Bansak, Simpson & Zavodny ©2015
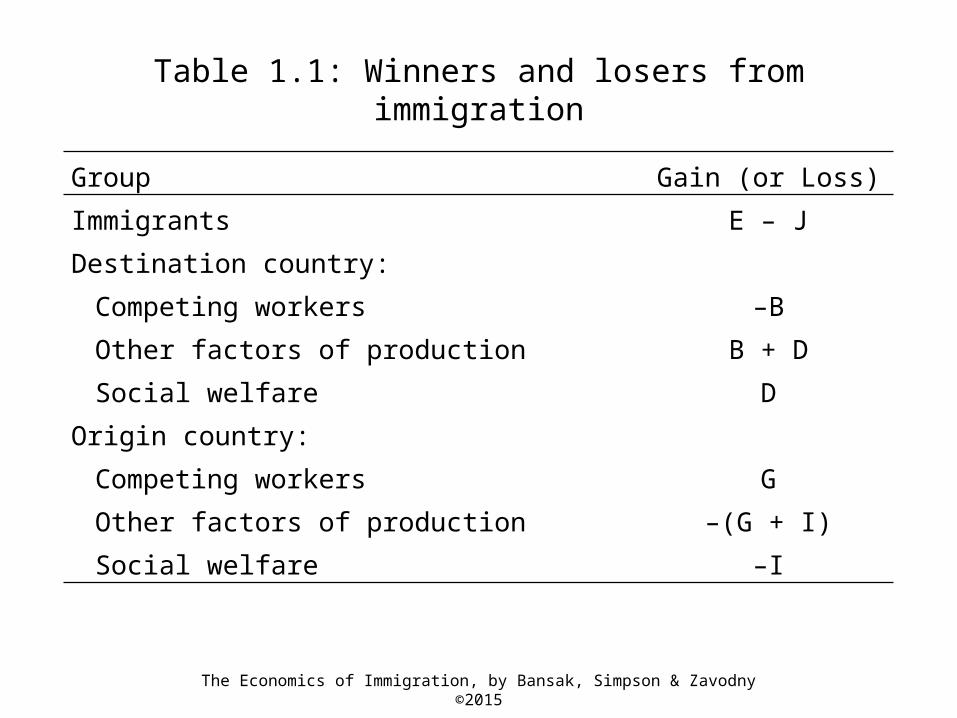
Table 1.1: Winners and losers from immigration
Group Gain (or Loss)
Immigrants E – J
Destination country:
Competing workers –B
Other factors of production B + D
Social welfare D
Origin country:
Competing workers G
Other factors of production –(G + I)
Social welfare –I
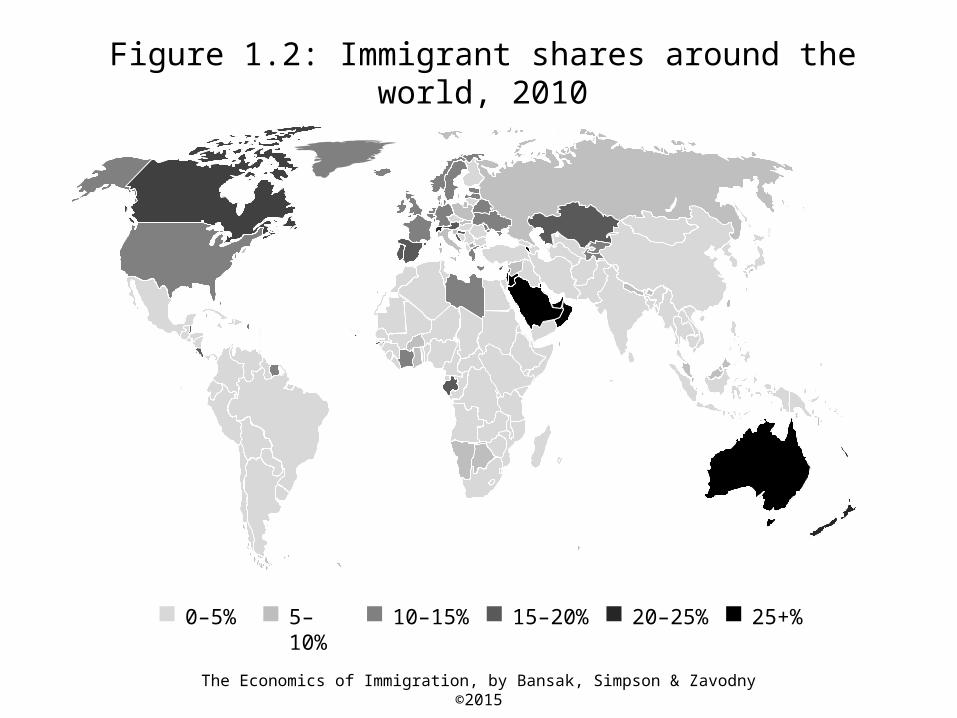
0–5% 5–10% 10–15% 15–20% 20–25% 25+%
Figure 1.2: Immigrant shares around the world, 2010
The Economics of Immigration, by Bansak, Simpson & Zavodny ©2015

0–5% 5–10% 10–15% 15–20% 20–25% 25+%
The Economics of Immigration, by Bansak, Simpson & Zavodny ©2015
Figure 1.3: Emigrant shares around the world, 2010

Figure A1.1: Consumer and producer surplus
The Economics of Immigration, by Bansak, Simpson & Zavodny ©2015
Price S Consumer Surplus Producer Surplus D Quantity