Embed Size (px)
Citation preview

Lord Howe Island Coastal Study Issue 5
© 2014 Haskoning Australia Pty Ltd - 23 - Final
Figure 11: Position and elevation (m AHD) of reef crests south of Blackburn Island (red), with
deeper Lagoon areas shown in blue

Lord Howe Island Coastal Study Issue 5
© 2014 Haskoning Australia Pty Ltd - 24 - Final
4.2.2 Coral Reef Processes
In discussing coral reef processes it is important to realise the dominant role of biological factors in
reef development, and also the importance of understanding these processes for coastal
management. Coral reefs are complex ecosystems, which have high diversity and productivity, an
interdependence of animals and other organisms, and many symbiotic relationships (Harvey and
Caton, 2010). As Harvey and Caton (2010) describe further:
reef-building (hermatypic) corals have zooxanthellae, which are minute unicellular algae living
within the coral tissue, and these have a symbiotic relationship with the coral polyp by
assisting it to lay down its skeleton (a corralite) through photosynthesis, taking up polyp
wastes, and supplying the coral with about 98% of its food requirements;
over thousands of years the build-up of corallite forms a porous limestone which is the basis
for reef building, along with calcareous algae;
growth rates of corals are fastest in shallow, well-lit waters, and can be up to 20mm/year for
massive corals and up to 100mm/year for branching corals;
coral reefs depend on other organisms, particularly algae, which are the primary energy
source through photosynthesis;
there are also crustose corraline algae which are important reef-builders, and in some places
algae can form up to 80% of reef sediments, particularly the platey Halimeda;
boring algae are important in reef breakdown;
corals have an asexual reproduction phase involving major spawning events;
corals grow in warm water down to a depth of 100m, where they become light limited, and
other factors restricting their growth are excessive freshwater and sediment deposition;
there is great variation in coral growth rates, depending on the position of the reef surface
relative to sea level, and vertical reef growth may be negligible on most reef surfaces that are
exposed at low tide;
vertical reef growth will also be significantly altered once it comes directly under the modifying
influence of surface wave conditions, and it has been observed that most reef flats are
between 100m and 400m wide; and
another important factor in reef growth is the role of corraline algae.
Reefs are composed almost entirely of skeletal carbonate sediments produced by marine plants and
animals (that is, biogenic sediments), incorporated either as the rigid framework or as unconsolidated
detrital (eroded and transported ) sediments (Woodroffe, 2003). The process of reef growth is
complex, involving calcification by the organisms that contribute to reef, various stages of
breakdown26
, transport, redistribution and cementation (Woodroffe, 2003). Woodroffe (2003) noted
that numerous higher latitude (more southerly) reefs in Australia, including at Lord Howe Island,
showed a similar pattern of colonisation and vertical reef growth to more tropical reefs.
Harriott et al (1995) completed a quantitative survey of the reef communities at Lord Howe Island,
against which future anthropogenic impacts and natural disturbances could be assessed, and to
determine whether the coral communities had changed in the 16 years since the only previous survey
by Veron and Done (1979). It is recommended that ongoing monitoring and management of these
coral communities is undertaken.
26
Erosion occurs by physical processes, including wave damage, as well as biological processes (such as grazing and boring organisms).
Lord Howe Island Coastal Study Issue 5
© 2014 Haskoning Australia Pty Ltd - 25 - Final
4.2.3 Long Term Evolution
Martin et al (2014) analysed sediments that have accumulated in four Lord Howe Island coastal
wetlands over the last 5,500 years27
. They found that sediment began to accumulate over basalt
bedrock about 4,500 calibrated years before 195028
, with greater sediment availability after 2,800
calibrated years before 1950 as sediment filled sinks in the Lagoon floor and reached a shallow
enough depth to be reworked by waves.
Kennedy and Woodroffe (2000) estimated that by 4,000 radiocarbon years before present most of the
Lagoon had accreted to a level close to the modern Lagoon bed surface, having accumulated (in the
preceding 2,500 years) over 11m of sediment in the northern part of the Lagoon and possibly up to
30m in the southern part.
Martin et al (2014) considered that increasing westerly wind strength from 600 calibrated years before
1950, combined with falling sea levels29
and this lagoon infilling, facilitated increased sediment
movement from the reef crest and the Lagoon bed to the western shore of Lord Howe Island. They
noted that this caused rapid growth of the coastal plain (development of beaches) at about 500
calibrated years before 1950.
Kennedy and Woodroffe (2000) considered that the only features of the Lagoon still experiencing
sediment infill were at various “holes” such as Comets Hole and Sylphs Hole. Martin et al (2014)
suggested that these holes could be affecting sediment transport within the Lagoon and delaying
shoreline accretion at nearby locations by acting as a sink for sediment moving between the reef crest
and shoreline. Haskoning Australia independently came to the same conclusion by observation of
bathymetric and sediment features in the Lagoon (Section 4.2.1).
Colin Woodroffe (School of Earth and Environmental Sciences, University of Wollongong, personal
communication) considered that sediment may still be moving landward across the Lagoon bed and
adding to subaerial beach sediments.
4.3 World Heritage Listing
The Lord Howe Island Group was included in the World Heritage List in 1982, as “an outstanding
example of oceanic islands of volcanic origin containing a unique biota of plants and animals, as well
as the world’s most southerly true coral reef” (UNESCO World Heritage Centre, 2014).
All World Heritage properties in Australia are ‘matters of national environmental significance’ protected
and managed under national legislation, namely the Environment Protection and Biodiversity
Conservation Act 1999.
27
With years reported by Martin et al (2014) as calibrated radiocarbon ages before the year 1950 AD, and denoted as “calibrated years before 1950” herein. Calibrated years are identical to calendar years (Dr Scott Mooney, School of Biological, Earth and Environmental Sciences, personal communication), so for example 500 calibrated years before 1950 was a calendar year of 1450 AD. 28
Kennedy and Woodroffe (2000) estimated that sediments were first deposited in the Lagoon about 6,500 radiocarbon years before present, with growth of the reef crest between 6,000 and 5,000 radiocarbon years before present causing a reduction in wave energy in the Lagoon and facilitating sediment deposition. 29
Martin et al (2014) considered that sea level may have been 1.5m higher about 2,000 calibrated years before 1950. Woodroofe et al (1995) similarly noted sea levels about 1m to 1.5m higher than present around 3,000 years ago, and probably still 1m above present levels around 900 years ago.

Lord Howe Island Coastal Study Issue 5
© 2014 Haskoning Australia Pty Ltd - 26 - Final
As further noted by UNESCO World Heritage Centre (2014):
“The Lord Howe Island Group is grandiose in its topographic relief and has an exceptional
diversity of spectacular and scenic landscapes within a small area, including sheer mountain
slopes, a broad arc of hills enclosing the lagoon and Balls Pyramid rising abruptly from the
ocean.
It is considered to be an outstanding example of an island system developed from submarine
volcanic activity and demonstrates the nearly complete stage in the destruction of a large
shield volcano. Having the most southerly coral reef in the world, it demonstrates a rare
example of a zone of transition between algal and coral reefs. Many species are at their
ecological limits, endemism is high, and unique assemblages of temperate and tropical forms
cohabit.
The islands support extensive colonies of nesting seabirds, making them significant over a
wide oceanic region. They are the only major breeding locality for the Providence Petrel
(Pterodroma solandri), and contain one of the world’s largest breeding concentrations of
Red-tailed Tropicbird (Phaethon rubricauda).
The Lord Howe Island Group is an outstanding example of the development of a characteristic
insular biota that has adapted to the island environment through speciation. A significant
number of endemic species or subspecies of plants and animals have evolved in a very
limited area. The diversity of landscapes and biota and the high number of threatened and
endemic species make these islands an outstanding example of independent evolutionary
processes.
Lord Howe Island supports a number of endangered endemic species or subspecies of plants
and animals, for example the Lord Howe Woodhen, which at time of inscription was
considered one of the world’s rarest birds. While sadly a number of endemic species
disappeared with the arrival of people and their accompanying species, the Lord Howe Island
Phasmid, the largest stick insect in the world, still exists on Balls Pyramid. The islands are an
outstanding example of an oceanic island group with a diverse range of ecosystems and
species that have been subject to human influences for a relatively limited period.
UNESCO World Heritage Centre (2014) noted that key threats requiring ongoing attention include
fishing; tourism; invasive animals, plants and pathogens; and anthropogenic climate change. The
latter is significant to the consideration of coastal processes and coastline hazards herein.
4.4 Land Use
The entire Lord Howe Island foreshore is zoned as either “Zone No. 7 – Environment Protection” or
“Zone No. 8 – Permanent Park Preserve” in the Lord Howe Island Local Environmental Plan 2010. A
Foreshore Building Line also applies along the Lagoon foreshore, and from Neds Beach to Middle
Beach inclusive on the eastern foreshore.
Most of the foreshore is also Crown Reserve, except for a length of foreshore south of Cobbys Beach
which has a number of Portions or Lots used for recreation and agriculture/grazing as Special Leases.
Under Section 31A of the Lord Howe Island Act 1953, the Minister may grant permission to occupy
crown land or vacant crown land, known as Permissive Occupancy. For example, the boatsheds at
the northern end of Lagoon Beach, the Aquatic Club and Pinetrees boatshed are all Permissive
Occupancies. Improvements on Permissive Occupancy land are generally privately owned.

Lord Howe Island Coastal Study Issue 5
© 2014 Haskoning Australia Pty Ltd - 27 - Final
5. PLANNING FRAMEWORK
Lord Howe Island is part of New South Wales. Although administered under the Lord Howe Island Act
1953, it comprises Crown Land and is subject to the provisions of the:
Crown Lands Act 1989;
Environmental Planning & Assessment Act 1979; and
Roads Act 1993 (NSW Land & Property Information, 2014).
All land on the island is vested in the Crown, under the management of the Lord Howe Island Board.
Islanders (those persons so deemed in Section 3 of the Lord Howe Island Act 1953) may be granted a
lease in perpetuity for residential purposes (NSW Land & Property Information, 2014).
Land may also be reserved or dedicated to the public by the publication of a notification in the
Government Gazette by the Minister Administering the Lord Howe Island Act 1953. Special leases,
not exceeding 10 years, may also be granted to Islanders for grazing, cultivation or other approved
purposes (NSW Land & Property Information, 2014).
The Lord Howe Island Board is the consent authority for all development and subdivision activity that
takes place on the island (NSW Land & Property Information, 2014).
Lord Howe Island (in its entirety) is within the “coastal zone” as defined in the Coastal Protection Act
1979, as shown on maps outlining the coastal zone30
.
30
Specifically “New South Wales Coastal Policy 1997, Map 41 of 117” prepared by the Department of Urban Affairs and Planning.

Lord Howe Island Coastal Study Issue 5
© 2014 Haskoning Australia Pty Ltd - 28 - Final
6. COLLECTION AND REVIEW OF DATA
6.1 Aerial Photography and Photogrammetric Data
A review of aerial photography and photogrammetric data from Lagoon Beach and Cobbys Beach is
provided in Appendix B. To summarise, rates of change of volume per year in various compartments
along Lagoon Beach and Cobbys Beach (based on data from 5 dates from 1965 to 2011 and
measured above 0m AHD) were as depicted in Figure 12.
It is evident that most of length of the beaches along the Lagoon at Lord Howe Island (Lagoon Beach
north of the runway, and Cobbys Beach south of the runway) have been growing in sand volume or
moving seaward (prograding). The only two areas reducing in volume or moving landward (receding)
are located immediately north and south of the runway revetment, Seabee revetment, and bag wall
structures. This is depicted in Figure 12.
Lagoon Beach has been approximately in balance (gain in the north about equal to the loss in the
south, of magnitude around 550m3/year), while the gain at the southern end of Cobbys Beach exceeds
the loss at the north of that beach by about 460m3/year. These volumes are calculated above
Australian Height Datum (0m AHD), with the mean Lagoon water level equal to about 1.2 m AHD.
Review of aerial photography provides evidence that sediment is naturally mobile in the wider Lagoon
and may be building up over reef areas within the Lagoon. An example of far less distinct reef
features in 2011 compared to 2001 (which may be from smothering by sediment) is depicted in
Figure 13 (northern end of Lagoon Beach) and Figure 14 (Cobbys Beach), at identical locations and
scales for both years at each site.
Further investigation of the sources and transport direction of sediment in the wider Lagoon would be
warranted to inform a longer term understanding of coastal processes and to inform the design of any
future beach nourishment campaigns or other works. A preliminary conceptual model of sediment
transport processes that is an attempt to document the observed beach changes and is consistent
with observed circulation patterns is developed in Section 7.8.

Lord Howe Island Coastal Study Issue 5
© 2014 Haskoning Australia Pty Ltd - 29 - Final
Figure 12: Summary of long term (1965 to 2011) sand volume changes at Lagoon Beach and
Cobbys Beach

Lord Howe Island Coastal Study Issue 5
© 2014 Haskoning Australia Pty Ltd - 30 - Final
Figure 13: Evidence of sediment smothering reef areas at northern end of Lagoon Beach (2001
top, and 2011 bottom), with main areas of potential smothering within red boxes

Lord Howe Island Coastal Study Issue 5
© 2014 Haskoning Australia Pty Ltd - 31 - Final
Figure 14: Evidence of sediment smothering reef areas at Cobbys Beach (2001 top, and 2011
bottom), with main area of potential smothering within red box

Lord Howe Island Coastal Study Issue 5
© 2014 Haskoning Australia Pty Ltd - 32 - Final
6.2 Sediment Data
Coastal sediments may be of either terrigenous (land) origin or biogenic (living) origin. In the former
case, they often are formed predominantly of silica sand. In the latter case they are predominantly
calcium carbonate derived from marine organisms, either directly from detrital skeletal material and
shells or indirectly from limestone rocks (NCCOE, 2012).
At Lord Howe Island, 99% of the beach and lagoon sediments were found to be composed of skeletal
carbonates. Analysis of sediment samples that were collected from beaches and the Lagoon at Lord
Howe Island is provided in Appendix C. Samples were collected in August 2012 and May 2013.
The sample locations from August 2012 and May 2013, and median particle size (d50) of the tested
samples, are depicted in Figure 15 (northern end of Lagoon Beach), Figure 16 (southern end of
Lagoon Beach) and Figure 17 (Cobbys Beach). Kennedy (1999) has also analysed samples from the
Lagoon area, and his mean particle size testing results31
are also depicted in these Figures. Note that
all particle sizes are shown in microns (that is 10-6
m or μm, where 1mm equals 1000μm).
Extensive spatial sediment transport pathways could be inferred from the particle size testing results.
That is, there was evidence of the continuity of the Lagoon bed and beaches, with sediment being
transported from the Lagoon to the beaches. Coarser sediments were generally evident near the
waterline, but otherwise there were generally similar sizes in the Lagoon and on the beach. Some of
the finer sediments were at Cobbys Beach, which may be evidence of its general progradation in
recent years.
Given the postulated significant infeed (onshore transport) of lagoonal sediments on to Lagoon Beach
and Cobbys Beach in around 1450 AD (Section 4.2.3), and general similarity of the Lagoon and beach
sediments, it can be postulated that sediments on the Lagoon bed may still be moving onshore at
these beaches. Indeed, the review of photogrammetric data (Section 6.1) indicated that most of the
length of these beaches has prograded over the last 50 or so years, and aerial photography
(Section 6.1) gives evidence of sediment mobility in the Lagoon.
31
Note that Kennedy (1999) used a method of Folk and Ward (1957) to determine the mean grain size, in which the mean size was determined as (d16+d50+d84)/3, where d16 and d84 are the 16
th and 84
th percentile particle sizes
respectively.

Lord Howe Island Coastal Study Issue 5
© 2014 Haskoning Australia Pty Ltd - 33 - Final
Figure 15: Sample locations and particle sizes (in microns) at north end of Lagoon Beach

Lord Howe Island Coastal Study Issue 5
© 2014 Haskoning Australia Pty Ltd - 34 - Final
Figure 16: Sample locations and particle sizes (in microns) at south end of Lagoon Beach and
adjacent to runway revetment

Lord Howe Island Coastal Study Issue 5
© 2014 Haskoning Australia Pty Ltd - 35 - Final
Figure 17: Sample locations and particle sizes (in microns) at Cobbys Beach

Lord Howe Island Coastal Study Issue 5
© 2014 Haskoning Australia Pty Ltd - 36 - Final
Figure 18: Sample locations and particle sizes (in microns) at Blinky Beach

Lord Howe Island Coastal Study Issue 5
© 2014 Haskoning Australia Pty Ltd - 37 - Final
6.3 Hydrographic (Bathymetric) Data
The two most recent extensive hydrographic (bathymetric) surveys of the Lagoon area at Lord Howe
Island were completed by:
the Australian Hydrographic Service in March 1997; and
NSW Maritime in October 2008 (see Figure 19).
The shallowness of the Lagoon, particularly east of Blackburn Island, is evident in Figure 19.
Patterson Britton & Partners (1998) also depicted Lagoon bed contours in 1990. The Australian
Hydrographic Office hydrographic chart covering Lord Howe Island is AUS 610.
Based on the 2008 data, two cross sections through the Lagoon (at the locations shown in Figure 20)
are depicted in Figure 21.

Lord Howe Island Coastal Study Issue 5
© 2014 Haskoning Australia Pty Ltd - 38 - Final
Figure 19: Bathymetric contours at 1m interval derived from 2008 survey, with depths shown
relative to AHD (red areas are above 0m AHD)

Lord Howe Island Coastal Study Issue 5
© 2014 Haskoning Australia Pty Ltd - 39 - Final
Figure 20: Locations of northern and southern profiles across Lagoon bed, depicted in cross
section in Figure 21

Lord Howe Island Coastal Study Issue 5
© 2014 Haskoning Australia Pty Ltd - 40 - Final
Figure 21: Example cross sections through dune and Lagoon, with profile locations depicted
in Figure 20
6.4 Water Levels
Water levels in the Lagoon vary with astronomical tide and other processes, with water flowing (mainly
out) through the three main reef passages (Figure 4) and in via wave overtopping and direct oceanic
ingress over the coral reef at higher stages of the tide (with the reef crest being about 0.2m below
mean sea level on average).
Manly Hydraulics Laboratory (MHL) has operated a water level recorder at the jetty at Lord Howe
Island since 1994 on behalf of OEH. Based on review of data collected every 15 minutes from 1994 to
2013, various statistics were derived including tidal planes (Table 1) and exceedance probabilities

Lord Howe Island Coastal Study Issue 5
© 2014 Haskoning Australia Pty Ltd - 41 - Final
(Table 2). From this analysis, the mean neap range is 0.85m, and the mean spring range is 1.55m.
The highest water level recorded was 2.84m AHD on 14 July 1995. The largest positive residuals in
the record (where measured water levels were above predicted tide levels) were found to be about
0.8m.
Table 1: Tidal planes in Lagoon at Lord Howe Island
Tidal plane Water level (m AHD)
High High Water Solstice Springs 2.31
Mean High Water Springs 2.01
Mean High Water 1.83
Mean High Water Neaps 1.66
Mean Sea Level 1.23
Mean Low Water Neaps 0.81
Mean Low Water 0.63
Mean Low Water Springs 0.46
Indian Springs Low Water 0.24
Table 2: Exceedance probabilities for water levels in Lagoon at Lord Howe Island
Probability of exceedance (%) Water level (m AHD)
0.1 2.53
1 2.30
5 2.05
10 1.91
50 1.23
90 0.58
Besides astronomical tide, water levels in the Lagoon at Lord Howe Island are strongly dependent on
regional oceanographic circulation patterns. The Bureau of Meteorology provides forecasts of sea
level anomalies (and other parameters such as sea surface temperature) based on an Ocean General
Circulation Model and real-time observations, known as BLUElink Ocean Forecasts produced by the
Ocean Model, Analysis and Prediction System version 2.0 (OceanMAPSv2.0).
As described by Bureau of Meteorology (2014a), variations in the elevation of the ocean are mainly
caused by the earth's rotation and changes in water density at depth. A phenomenon that has a
dominant influence on the general circulation of the ocean is the so-called 'eddy'. This term refers to a
cyclonic motion (in the form of a vortex) on the scale 10 to 200km in diameter that forms, propagates
throughout the ocean and later decays. Throughout this cycle the eddies redistribute heat and salt.
Common forms of eddies found in the Australian region are 'warm-core' and 'cold-core' eddies (where
the interior of the eddy is either warmer or colder than the surrounding ocean respectively). A warmer,
less dense water column has a larger specific volume leading to an increase in surface height and
pressure compared to the surrounding ocean. In the presence of the earth's rotation, this pressure
gradient radiating out from the warm core of the eddy is 'geostrophically' balanced by vortical currents

Lord Howe Island Coastal Study Issue 5
© 2014 Haskoning Australia Pty Ltd - 42 - Final
circulating around the core. The term 'geostrophic' refers to the situation where, for an observer on the
earth's surface, the vortical currents (the circulating currents flowing around the eddy) induce an equal
and opposite Coriolis force to balance the gradient in pressure. A warm-core eddy, which has a
pressure gradient radiating out, leads to anticyclonic motion, which is anticlockwise in the southern
hemisphere. A cold-core eddy has a pressure gradient force that is focused toward the core, which
leads to cyclonic motion that is clockwise in the southern hemisphere. Good examples of these can be
found in the Tasman Sea as part of the East Australian Current. The change in density between the
eddy core and the surrounding ocean can be detected as a change in the surface height of the ocean
of the order of one metre.
An example of sea surface temperature and sea level anomaly results from BLUElink is provided in
Figure 22 for offshore of NSW (including Lord Howe Island), and in Figure 23 for a more zoomed in
area surrounding Lord Howe Island. The considerable variability in sea level is evident, for example
where Lord Howe Island has a sea level anomaly of -0.2m, and a few hundred kilometres towards the
mainland there is a sea level anomaly of +0.5m (that is, 0.7m higher).
A plot of the daily average water level at Lord Howe Island (as measured by MHL) versus the sea
level anomaly at Lord Howe Island (from BLUElink) is provided in Figure 24 for the April 2011 to
February 2013 period32
. It is evident that the daily average water level at Lord Howe Island is strongly
influenced by the regional oceanographic water level.
32
The assistance of Mr Ben Modra of MHL in providing the plotted data is gratefully acknowledged. The measured data was normalised against the full record average, and the BLUElink data was adjusted to have the same average water level as the measured data.

Lord Howe Island Coastal Study Issue 5
© 2014 Haskoning Australia Pty Ltd - 43 - Final
Figure 22: Example of sea surface temperature (top) and sea level anomaly results (bottom)
from BLUElink for offshore of NSW
Lord Howe Island
Lord Howe Island

Lord Howe Island Coastal Study Issue 5
© 2014 Haskoning Australia Pty Ltd - 44 - Final
Figure 23: Example of sea surface temperature (top) and sea level anomaly results (bottom)
from BLUElink for area surrounding Lord Howe Island

Lord Howe Island Coastal Study Issue 5
© 2014 Haskoning Australia Pty Ltd - 45 - Final
Figure 24: Comparison of measured daily average sea level anomalies in Lagoon and regional
oceanographic sea level anomalies (from BLUElink) at Lord Howe Island
6.5 Wave Data
There are no known long term wave measurements offshore of or within the Lagoon at Lord Howe
Island. However, there are simulated numerical hindcasts of wave conditions for most of the world’s
oceans that have been developed by the National Centers for Environmental Prediction in the United
States (specifically the Marine Modeling and Analysis Branch of the Environmental Modeling Center)
using the WAVEWATCH III® model. Details of the WAVEWATCH III® model are provided in Tolman
(2009), but in essence it can be noted that the model uses winds from an atmospheric model to
generate the waves.
Lord Howe Island Coastal Study Issue 5
© 2014 Haskoning Australia Pty Ltd - 46 - Final
A 31 year (from 1979 to 2009 inclusive) WAVEWATCH III® model so-called “Climate Forecast System
Reanalysis Reforecast” wave hindcast at the closest model output location to Lord Howe Island33
was
downloaded from the National Centers for Environmental Prediction (2013). Details on the derivation
of this time series are provided in Chawla et al (2011, 2012) and Spindler (2011). This 31 year time
series had a 3 hourly time step, with output variables comprising wind speed and direction, significant
wave height (Hs) and direction (θ), and peak spectral wave period (Tp). The resulting time series was
analysed, with various statistics determined as listed in Table 3.
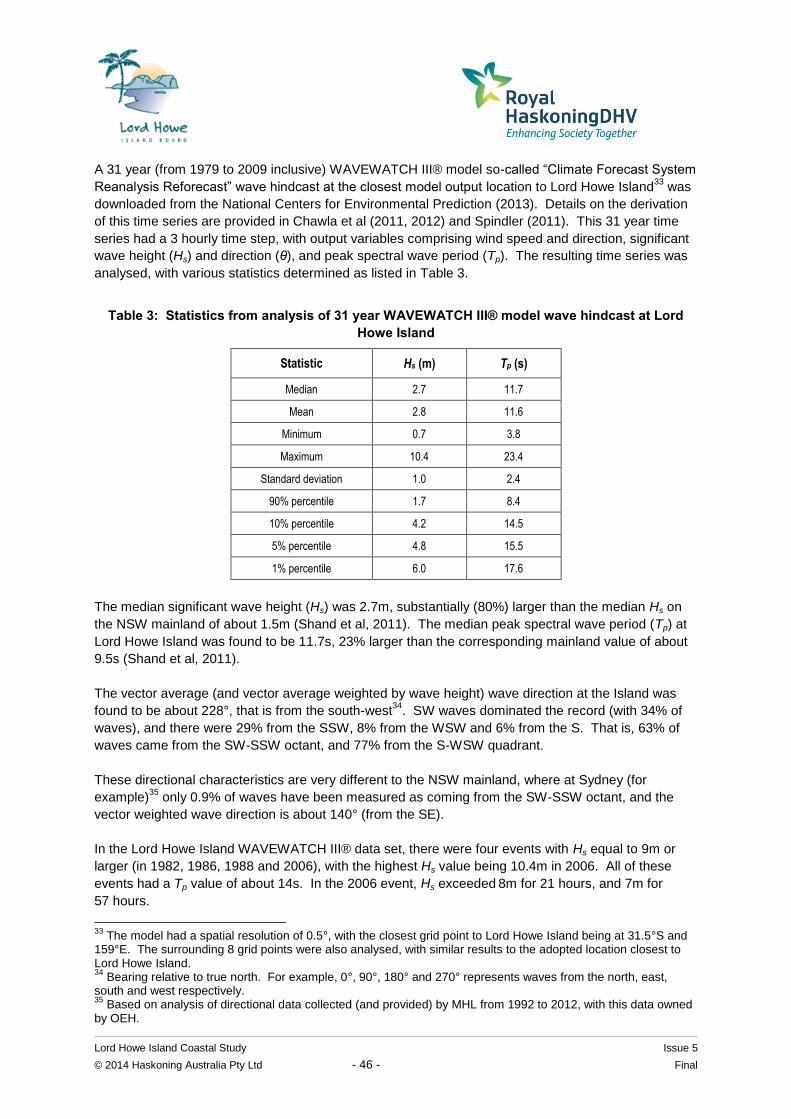
Table 3: Statistics from analysis of 31 year WAVEWATCH III® model wave hindcast at Lord
Howe Island
Statistic Hs (m) Tp (s)
Median 2.7 11.7
Mean 2.8 11.6
Minimum 0.7 3.8
Maximum 10.4 23.4
Standard deviation 1.0 2.4
90% percentile 1.7 8.4
10% percentile 4.2 14.5
5% percentile 4.8 15.5
1% percentile 6.0 17.6
The median significant wave height (Hs) was 2.7m, substantially (80%) larger than the median Hs on
the NSW mainland of about 1.5m (Shand et al, 2011). The median peak spectral wave period (Tp) at
Lord Howe Island was found to be 11.7s, 23% larger than the corresponding mainland value of about
9.5s (Shand et al, 2011).
The vector average (and vector average weighted by wave height) wave direction at the Island was
found to be about 228°, that is from the south-west34
. SW waves dominated the record (with 34% of
waves), and there were 29% from the SSW, 8% from the WSW and 6% from the S. That is, 63% of
waves came from the SW-SSW octant, and 77% from the S-WSW quadrant.
These directional characteristics are very different to the NSW mainland, where at Sydney (for
example)35
only 0.9% of waves have been measured as coming from the SW-SSW octant, and the
vector weighted wave direction is about 140° (from the SE).
In the Lord Howe Island WAVEWATCH III® data set, there were four events with Hs equal to 9m or
larger (in 1982, 1986, 1988 and 2006), with the highest Hs value being 10.4m in 2006. All of these
events had a Tp value of about 14s. In the 2006 event, Hs exceeded 8m for 21 hours, and 7m for
57 hours.
33
The model had a spatial resolution of 0.5°, with the closest grid point to Lord Howe Island being at 31.5°S and 159°E. The surrounding 8 grid points were also analysed, with similar results to the adopted location closest to Lord Howe Island. 34
Bearing relative to true north. For example, 0°, 90°, 180° and 270° represents waves from the north, east, south and west respectively. 35
Based on analysis of directional data collected (and provided) by MHL from 1992 to 2012, with this data owned by OEH.

Lord Howe Island Coastal Study Issue 5
© 2014 Haskoning Australia Pty Ltd - 47 - Final
It can be concluded that the south-western side of Lord Howe Island is exposed to a higher wave
energy wave climate than the NSW mainland, emphasising the importance of the coral reef in
protecting the Lagoon and its beaches from wave action.
6.6 Meteorological Data
Based on statistics from the Bureau of Meteorology Lord Howe Island Airport station, derived from
data collected between 1988 and 2014 (Bureau of Meteorology, 2014b):
mean annual rainfall at Lord Howe Island is about 1500mm, with about 150 days of daily
rainfall exceeding 1mm each year (on average);
the wettest months (on average) are June and May, and the driest months (on average) are
October and December, without an overly distinct wet and dry season;
mean minimum temperatures vary from 13.5°C in August to 21.0°C in February (17.1°C
annual average);
mean maximum temperatures vary from 18.9°C in August to 25.7°C in February (22.1°C
annual average); and
the most dominant winds are from the south-west and east.
Figure 25: Mean monthly rainfall at Lord Howe Island Airport based on data from 1988 to 2014
The Bureau of Meteorology currently records meteorological data at two sites at Lord Howe Island,
namely the Airport36
(Station 200839) and at Windy Point37
(Station 200715), with the station locations
shown in Figure 26. The Airport site was established in 1988, with temperature, dew point, wind
speed and direction , rainfall, mean sea level pressure and cloud amount recorded. The Windy Point
site was opened in November 2003 (says 2010 in daily file), and only wind data has been recorded at
this site.
36
Denoted as “Lord Howe Island Aero” by the Bureau of Meteorology, with a station elevation of 5m. 37
Denoted as “Lord Howe Island Windy Point” by the Bureau of Meteorology, with a station elevation of 4m.


![Syncope AHD[1]](https://img.pdfslide.us/doc/110x75/577d36611a28ab3a6b92ec10/syncope-ahd1.jpg)