Embed Size (px)
Citation preview

- 16 -
Figure 1. Jamaica Exchange Rate Developments
(1995=100)
50
75
100
125
150
175
200
1995 1996 1997 1998 1999 2000
50
75
100
125
150
175
200
Relative price index 2/
Real Effective exchange rate 1/
Nominal effective exchange rate 3/
Source: IMF Information Notice System.
1/ Nominal effective exchange rate deflated by relative prices; increase means appreciation.2/ Measured by seasonally adjusted consumer price indices.3/ Trade weighted index of nominal exchange rates.
- 17 -
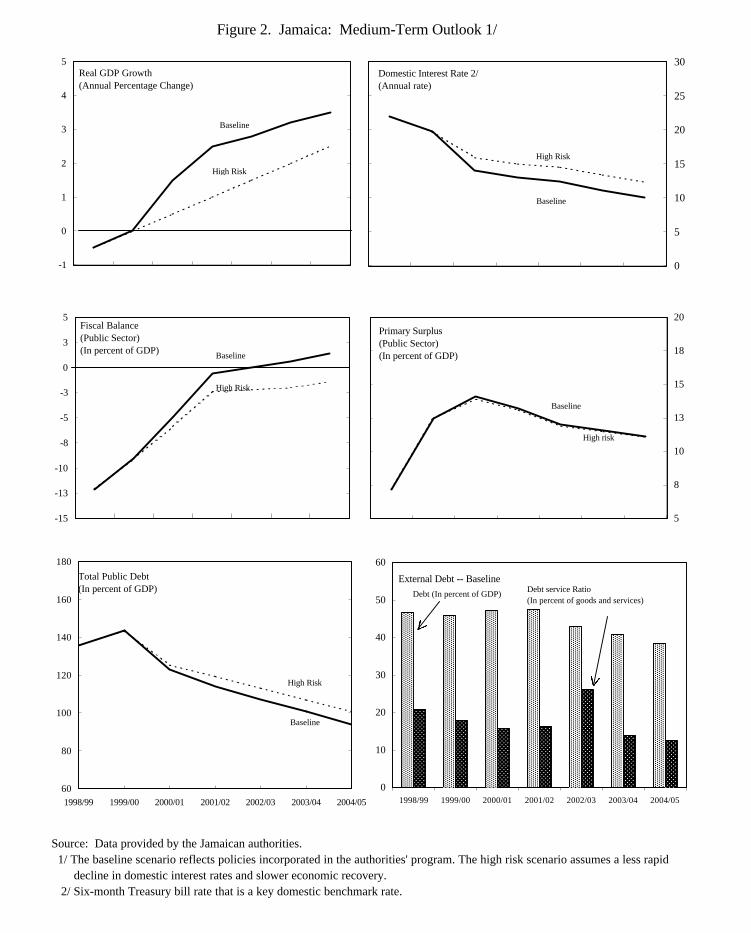
Source: Data provided by the Jamaican authorities. 1/ The baseline scenario reflects policies incorporated in the authorities' program. The high risk scenario assumes a less rapid decline in domestic interest rates and slower economic recovery. 2/ Six-month Treasury bill rate that is a key domestic benchmark rate.
Figure 2. Jamaica: Medium-Term Outlook 1/
-1
0
1
2
3
4
5Real GDP Growth(Annual Percentage Change)
High Risk
Baseline
0
5
10
15
20
25
30
Baseline
Domestic Interest Rate 2/ (Annual rate)
-15
-13
-10
-8
-5
-3
0
3
5Fiscal Balance (Public Sector) (In percent of GDP)
Baseline
High Risk
5
8
10
13
15
18
20Primary Surplus (Public Sector) (In percent of GDP)
High risk
60
80
100
120
140
160
180
1998/99 1999/00 2000/01 2001/02 2002/03 2003/04 2004/05
Total Public Debt (In percent of GDP)
0
10
20
30
40
50
60
1998/99 1999/00 2000/01 2001/02 2002/03 2003/04 2004/05
External Debt -- Baseline
High Risk
Baseline
High Risk
Baseline
Debt (In percent of GDP)Debt service Ratio (In percent of goods and services)

- 18 -
Prel. Proj. 2/ Proj. 2/1997/98 1998/99 1999/2000 2000/01 2001/02
GDP, prices, wages and interest ratesGDP at constant prices -1.7 -0.5 0.0 1.5 2.5GDP deflator 10.5 6.8 7.9 6.8 6.6
Nominal GDP(U.S. dollars billions) 6.9 7.1 7.2 7.4 7.8(Jamaica dollars billions) 246.4 262.2 289.4 313.3 343.7
Per capita GDP (in U.S. dollars) 2,712 2,772 2,789 2,831 2,995
Consumer prices (end of period) 8.8 6.0 8.4 7.0 6.5 (period average) 9.1 8.1 6.3 7.7 6.8
Nominal wages 3/Large establishments 22.5 12.3 16.1 … …Government wage bill (cash basis) 20.9 9.8 -0.1 8.1 8.0
Interest rate (six-month treasury bills, end of period) 24.6 22.0 19.7 14.0 12.9Lending rate (weighted average, end of period) 35.3 32.1 27.7 19.8 17.8
Money and credit 4/Net domestic assets of the banking system 5/ 7.5 8.8 6.2 -3.4 3.7 Public sector 54.9 25.2 9.0 -4.5 2.4 Private sector -6.3 -6.0 -4.9 2.6 2.9Liabilities to private sector 6/ 6.7 11.5 18.6 8.4 9.1Velocity (GDP relative to liabilities to private sector) 2.7 2.5 2.4 2.5 2.4
(In percent of GDP; unless otherwise indicated)
Savings and investmentGross national savings 25.8 26.0 25.1 25.2 25.2Gross investment 31.5 29.0 29.6 30.0 30.5
Public sectorRevenue and grants (central government) 27.0 28.3 31.2 33.4 30.9Expenditures (central government) 35.1 35.6 35.5 34.4 29.6Public sector interest payments 7/ 11.5 19.3 21.5 19.0 13.8Primary balance (central government) 1.9 5.9 10.1 12.6 11.8Primary balance (public sector) 0.6 7.2 12.5 14.1 13.2Central government surplus or deficit (-) 8/ 9/ -8.1 -7.3 -4.3 -1.0 1.3Public sector balance 10/ 11/ -10.9 -12.1 -9.1 -4.9 -0.6
Total debt 12/ 123.5 135.8 143.6 122.9 114.l
External sectorExternal current account (deficit -) -5.6 -3.0 -4.5 -4.8 -5.3Overall balance of payments (millions of U.S. dollars) -53 -14 122 290 161Gross official reserves (millions of U.S. dollars) 729.6 700.1 801.3 1,077.6 1,221.0
(weeks of next year's imports of goods and services) 9.7 9.0 9.7 12.9 14.6(weeks of current year's nonbauxite (industry) imports of goods) 13.0 13.3 14.8 18.6 20.6
Net international reserves (millions of U.S. dollars) 595.1 581.5 703.5 993.2 1,153.8
External terms of trade (percent change) 3.3 -2.4 -4.3 0.6 2.1
External debt (end of period) 48.5 46.8 46.0 47.2 47.6Debt service ratio 13/ 14.9 20.9 17.9 15.7 16.4Short-term external liabilities/reserves 0.7 1.0 0.8 0.5 0.5Interest payments 13/ 5.4 5.4 5.5 6.3 8.2
Exchange ratesJamaica dollar per U.S. dollar
(end of period) 36.39 38.18 42.10 … …(period average) 35.77 36.88 40.14 … …
Real effective exchange rate 7.1 1.5 -3.8 … …Nominal effective exchange rate -0.3 -2.9 -8.4 … …
Sources: Bank of Jamaica; Ministry of Finance; STATIN; and Fund staff estimates and projections.
1/ Fiscal years run from April 1 to March 31.
3/ Calendar year (first year).4/ As of the end of fiscal year.5/ Flow as percent of liabilities to the private sector at the beginning of the period.6/ Currency in circulation plus local and foreign currency demand, time and savings deposits.7/ Includes interest on FINSAC paper from 1997/98 on.8/ Includes grants but excludes proceeds from divestment. 9/ Includes the cash cost of FINSAC/FIS.10/ Includes Bank of Jamaica operating balance and FINSAC/FIS interest due but not paid.11/ The public sector balance for 1997 has been revised to include FINSAC debt; also, it includes the balances of selected public enterprises.12/ Excluding FINSAC liabilities held by the government.13/ In percent of exports of goods and services.
2/ Based on 2000/01 budget estimates and adjustment policy stance.
Table 1. Jamaica: Selected Economic and Financial Indicators 1/
(Annual percentage changes; unless otherwise specified)
- 19 -
Estimate Proj. Proj.1997/98 1998/99 1999/2000 2000/01 2001/02
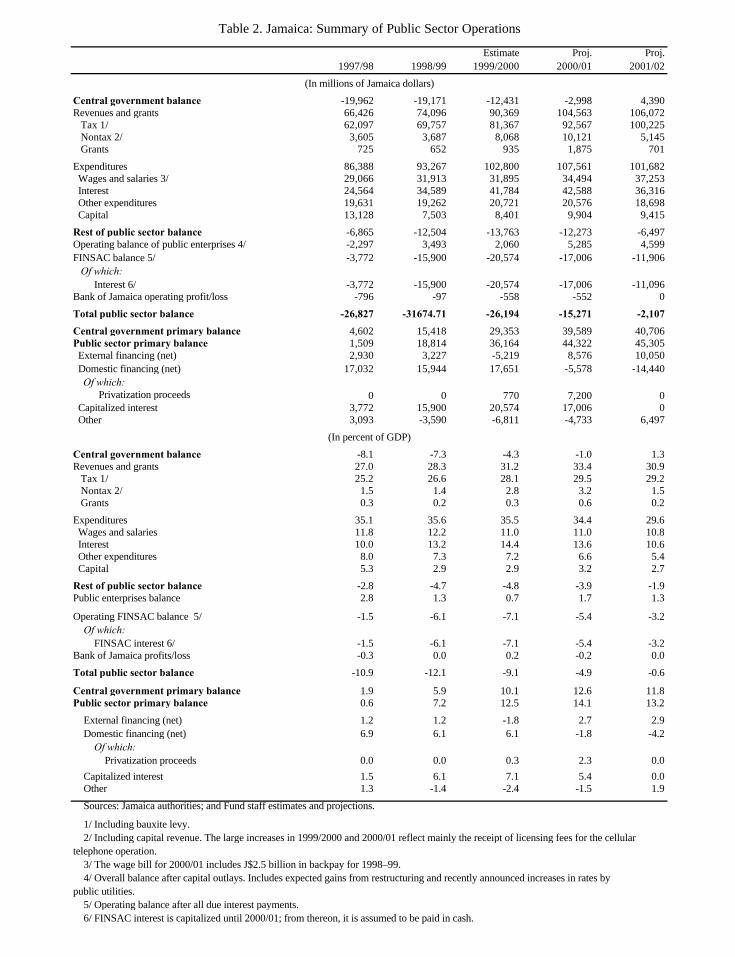
Central government balance -19,962 -19,171 -12,431 -2,998 4,390Revenues and grants 66,426 74,096 90,369 104,563 106,072 Tax 1/ 62,097 69,757 81,367 92,567 100,225 Nontax 2/ 3,605 3,687 8,068 10,121 5,145 Grants 725 652 935 1,875 701 Expenditures 86,388 93,267 102,800 107,561 101,682 Wages and salaries 3/ 29,066 31,913 31,895 34,494 37,253 Interest 24,564 34,589 41,784 42,588 36,316 Other expenditures 19,631 19,262 20,721 20,576 18,698 Capital 13,128 7,503 8,401 9,904 9,415
Rest of public sector balance -6,865 -12,504 -13,763 -12,273 -6,497Operating balance of public enterprises 4/ -2,297 3,493 2,060 5,285 4,599FINSAC balance 5/ -3,772 -15,900 -20,574 -17,006 -11,906 Of which:
Interest 6/ -3,772 -15,900 -20,574 -17,006 -11,096Bank of Jamaica operating profit/loss -796 -97 -558 -552 0
Total public sector balance -26,827 -31674.71 -26,194 -15,271 -2,107
Central government primary balance 4,602 15,418 29,353 39,589 40,706Public sector primary balance 1,509 18,814 36,164 44,322 45,305 External financing (net) 2,930 3,227 -5,219 8,576 10,050 Domestic financing (net) 17,032 15,944 17,651 -5,578 -14,440 Of which:
Privatization proceeds 0 0 770 7,200 0 Capitalized interest 3,772 15,900 20,574 17,006 0 Other 3,093 -3,590 -6,811 -4,733 6,497
Central government balance -8.1 -7.3 -4.3 -1.0 1.3Revenues and grants 27.0 28.3 31.2 33.4 30.9 Tax 1/ 25.2 26.6 28.1 29.5 29.2 Nontax 2/ 1.5 1.4 2.8 3.2 1.5 Grants 0.3 0.2 0.3 0.6 0.2 Expenditures 35.1 35.6 35.5 34.4 29.6 Wages and salaries 11.8 12.2 11.0 11.0 10.8 Interest 10.0 13.2 14.4 13.6 10.6 Other expenditures 8.0 7.3 7.2 6.6 5.4 Capital 5.3 2.9 2.9 3.2 2.7
Rest of public sector balance -2.8 -4.7 -4.8 -3.9 -1.9Public enterprises balance 2.8 1.3 0.7 1.7 1.3 Operating FINSAC balance 5/ -1.5 -6.1 -7.1 -5.4 -3.2
Of which: FINSAC interest 6/ -1.5 -6.1 -7.1 -5.4 -3.2
Bank of Jamaica profits/loss -0.3 0.0 0.2 -0.2 0.0
Total public sector balance -10.9 -12.1 -9.1 -4.9 -0.6
Central government primary balance 1.9 5.9 10.1 12.6 11.8Public sector primary balance 0.6 7.2 12.5 14.1 13.2
External financing (net) 1.2 1.2 -1.8 2.7 2.9Domestic financing (net) 6.9 6.1 6.1 -1.8 -4.2
Of which: Privatization proceeds 0.0 0.0 0.3 2.3 0.0
Capitalized interest 1.5 6.1 7.1 5.4 0.0Other 1.3 -1.4 -2.4 -1.5 1.9
Sources: Jamaica authorities; and Fund staff estimates and projections.
1/ Including bauxite levy.2/ Including capital revenue. The large increases in 1999/2000 and 2000/01 reflect mainly the receipt of licensing fees for the cellular
telephone operation.3/ The wage bill for 2000/01 includes J$2.5 billion in backpay for 1998–99.4/ Overall balance after capital outlays. Includes expected gains from restructuring and recently announced increases in rates by
public utilities.5/ Operating balance after all due interest payments.6/ FINSAC interest is capitalized until 2000/01; from thereon, it is assumed to be paid in cash.
(In millions of Jamaica dollars)
Table 2. Jamaica: Summary of Public Sector Operations
(In percent of GDP)
- 20 -
Est. Proj. Proj. 1/1997/98 1998/99 1999/2000 2000/01 2001/02
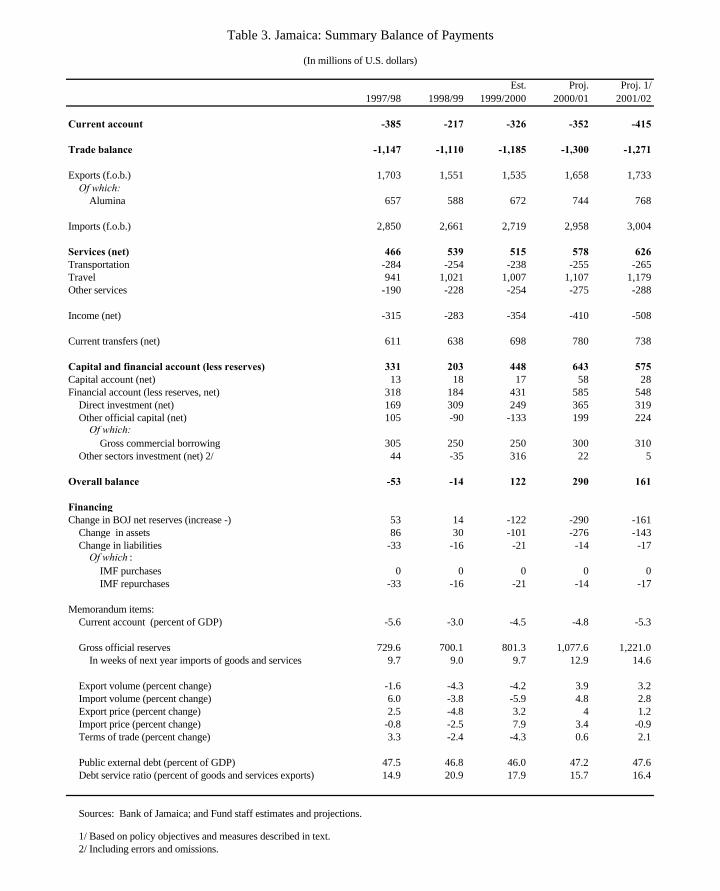
Current account -385 -217 -326 -352 -415
Trade balance -1,147 -1,110 -1,185 -1,300 -1,271
Exports (f.o.b.) 1,703 1,551 1,535 1,658 1,733Of which:
Alumina 657 588 672 744 768
Imports (f.o.b.) 2,850 2,661 2,719 2,958 3,004
Services (net) 466 539 515 578 626Transportation -284 -254 -238 -255 -265Travel 941 1,021 1,007 1,107 1,179Other services -190 -228 -254 -275 -288
Income (net) -315 -283 -354 -410 -508
Current transfers (net) 611 638 698 780 738
Capital and financial account (less reserves) 331 203 448 643 575Capital account (net) 13 18 17 58 28Financial account (less reserves, net) 318 184 431 585 548
Direct investment (net) 169 309 249 365 319Other official capital (net) 105 -90 -133 199 224
Of which: Gross commercial borrowing 305 250 250 300 310
Other sectors investment (net) 2/ 44 -35 316 22 5
Overall balance -53 -14 122 290 161
FinancingChange in BOJ net reserves (increase -) 53 14 -122 -290 -161
Change in assets 86 30 -101 -276 -143Change in liabilities -33 -16 -21 -14 -17
Of which :IMF purchases 0 0 0 0 0IMF repurchases -33 -16 -21 -14 -17
Memorandum items:Current account (percent of GDP) -5.6 -3.0 -4.5 -4.8 -5.3
Gross official reserves 729.6 700.1 801.3 1,077.6 1,221.0In weeks of next year imports of goods and services 9.7 9.0 9.7 12.9 14.6
Export volume (percent change) -1.6 -4.3 -4.2 3.9 3.2Import volume (percent change) 6.0 -3.8 -5.9 4.8 2.8Export price (percent change) 2.5 -4.8 3.2 4 1.2Import price (percent change) -0.8 -2.5 7.9 3.4 -0.9Terms of trade (percent change) 3.3 -2.4 -4.3 0.6 2.1
Public external debt (percent of GDP) 47.5 46.8 46.0 47.2 47.6Debt service ratio (percent of goods and services exports) 14.9 20.9 17.9 15.7 16.4
Sources: Bank of Jamaica; and Fund staff estimates and projections.
1/ Based on policy objectives and measures described in text.2/ Including errors and omissions.
Table 3. Jamaica: Summary Balance of Payments
(In millions of U.S. dollars)
- 21 -
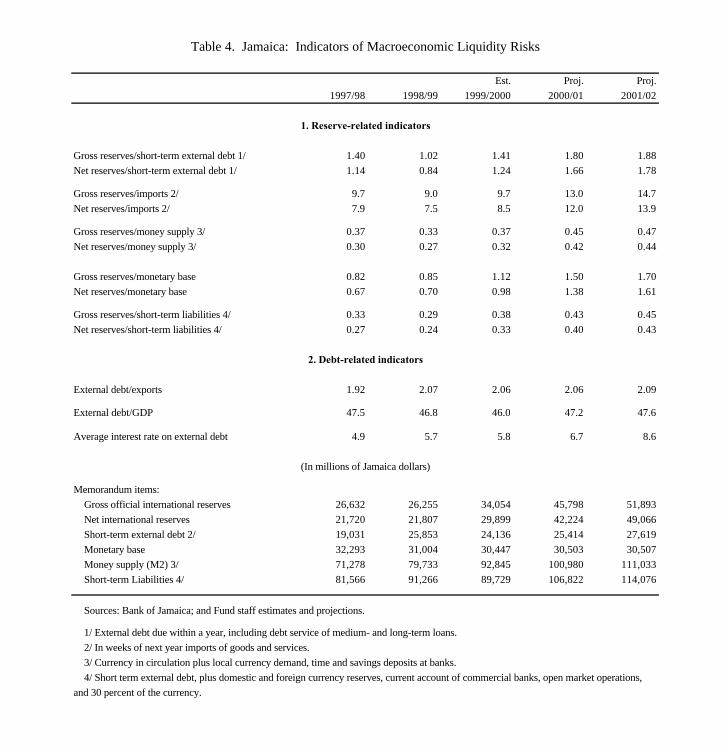
Table 4. Jamaica: Indicators of Macroeconomic Liquidity Risks
Est. Proj. Proj.
1997/98 1998/99 1999/2000 2000/01 2001/02
1. Reserve-related indicators
Gross reserves/short-term external debt 1/ 1.40 1.02 1.41 1.80 1.88
Net reserves/short-term external debt 1/ 1.14 0.84 1.24 1.66 1.78
Gross reserves/imports 2/ 9.7 9.0 9.7 13.0 14.7
Net reserves/imports 2/ 7.9 7.5 8.5 12.0 13.9
Gross reserves/money supply 3/ 0.37 0.33 0.37 0.45 0.47
Net reserves/money supply 3/ 0.30 0.27 0.32 0.42 0.44
Gross reserves/monetary base 0.82 0.85 1.12 1.50 1.70
Net reserves/monetary base 0.67 0.70 0.98 1.38 1.61
Gross reserves/short-term liabilities 4/ 0.33 0.29 0.38 0.43 0.45
Net reserves/short-term liabilities 4/ 0.27 0.24 0.33 0.40 0.43
2. Debt-related indicators
External debt/exports 1.92 2.07 2.06 2.06 2.09
External debt/GDP 47.5 46.8 46.0 47.2 47.6
Average interest rate on external debt 4.9 5.7 5.8 6.7 8.6
(In millions of Jamaica dollars)
Memorandum items:
Gross official international reserves 26,632 26,255 34,054 45,798 51,893
Net international reserves 21,720 21,807 29,899 42,224 49,066
Short-term external debt 2/ 19,031 25,853 24,136 25,414 27,619
Monetary base 32,293 31,004 30,447 30,503 30,507
Money supply (M2) 3/ 71,278 79,733 92,845 100,980 111,033
Short-term Liabilities 4/ 81,566 91,266 89,729 106,822 114,076
Sources: Bank of Jamaica; and Fund staff estimates and projections.
1/ External debt due within a year, including debt service of medium- and long-term loans.
2/ In weeks of next year imports of goods and services.
3/ Currency in circulation plus local currency demand, time and savings deposits at banks.
4/ Short term external debt, plus domestic and foreign currency reserves, current account of commercial banks, open market operations,
and 30 percent of the currency.

- 22 -
Table 5. Jamaica: Summary Monetary Indicators of the Banking System
Est. Proj. 1/ Proj. 1/
1997/98 1998/99 1999/2000 2000/01 2001/02
(End of period stock; in millions of Jamaica dollars)
Net international reserves 23,729 26,182 39,050 53,500 60,767
Net domestic assets 69,228 77,430 83,833 79,644 84,555
Net claims on public sector 2/ 56,698 80,100 89,448 83,861 87,090
Of which:Central government 22,528 22,351 13,506 6,801 10,582
Credit to private sector 42,362 36,763 31,639 34,817 38,618
Of which:Foreign currency 9,039 6,512 7,038 7,745 8,590
Other 3/ -29,831 -39,432 -37,253 -39,034 -41,153
Liabilities to private sector (LPS) 92,957 103,612 122,883 133,144 145,322
Money supply (M2) 4/ 71,278 79,733 92,845 100,980 111,033
Foreign currency deposits 21,679 23,880 30,039 32,164 34,289
(Percentage change from a year earlier) 5/
Net international reserves -0.8 2.6 12.4 11.8 5.5
Net domestic assets 7.5 8.8 6.2 -3.4 3.7
Net claims on public sector 2/ 54.9 25.2 9.0 -4.5 2.4
Open market operations -14.0 -6.2 -1.4 -14.1 -5.2
Credit to private sector -6.3 -6.0 -4.9 2.6 2.9
Of which:Foreign currency -2.2 -2.7 0.5 0.6 0.6
Other 3/ -41.1 -10.3 3.5 12.7 3.7
Liabilites to private sector 6.7 11.5 18.6 8.4 9.1
Memorandum items:
Central bank interest rate 6/ 29.0 20.8 18.4 13.5 12.6
Real interest rate 7/ 18.6 11.4 9.2 6.1 5.7
Average real lending rate 24.4 24.6 17.8 12.0 10.6
Monetary base (millions of Jamaica dollars) 32,293 31,004 30,447 30,503 30,507
LPS/monetary base 2.9 3.3 4.0 4.4 4.8
M2/monetary base 2.2 2.6 3.0 3.3 3.6
LPS velocity 2.7 2.5 2.4 2.4 2.4
Sources: Bank of Jamaica; and Fund staff estimates and projections.
1/ Projections based on policy objectives and measures described in the text.
2/ Includes Bank of Jamaica net profit and net unclassified assets.
3/ Includes net credit to nonbank financial institutions, capital accounts, valuation adjustment, and net unclassifed assets.
4/ Currency in circulation plus local currency demand deposits, and time and savings deposits at banks.
5/ M2 plus other local currency deposits at banks.
5/ In relation to liabilities to private sector at beginning of period.
6/ Central bank 30-day reverse repurchase rate; end of period.
7/ Reverse repurchase rate deflated by previous 12-month change in consumer price index.
- 23 -
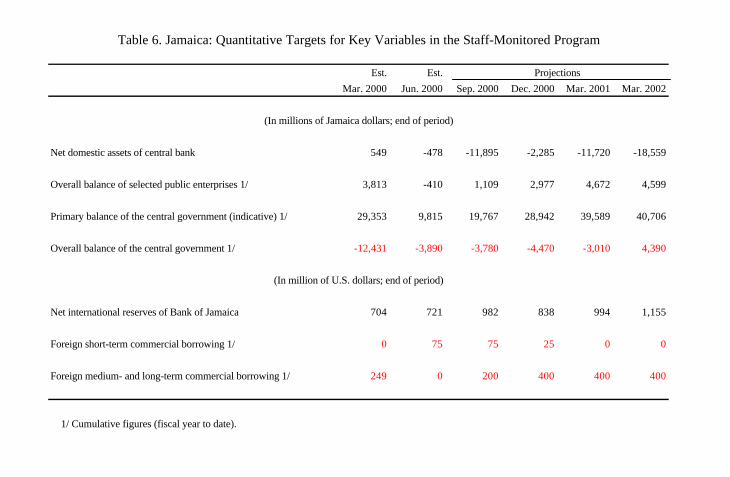
Table 6. Jamaica: Quantitative Targets for Key Variables in the Staff-Monitored Program
Est. Est. Projections
Mar. 2000 Jun. 2000 Sep. 2000 Dec. 2000 Mar. 2001 Mar. 2002
(In millions of Jamaica dollars; end of period)
Net domestic assets of central bank 549 -478 -11,895 -2,285 -11,720 -18,559
Overall balance of selected public enterprises 1/ 3,813 -410 1,109 2,977 4,672 4,599
Primary balance of the central government (indicative) 1/ 29,353 9,815 19,767 28,942 39,589 40,706
Overall balance of the central government 1/ -12,431 -3,890 -3,780 -4,470 -3,010 4,390
(In million of U.S. dollars; end of period)
Net international reserves of Bank of Jamaica 704 721 982 838 994 1,155
Foreign short-term commercial borrowing 1/ 0 75 75 25 0 0
Foreign medium- and long-term commercial borrowing 1/ 249 0 200 400 400 400
1/ Cumulative figures (fiscal year to date).

24 - -
Table 7. Jamaica: Structural Benchmarks for 2000/01–2001/02
Sector
Measures
Timetable
Financial sector reform
Bring to the point of sale Union Bank Reduce cash reserve requirement to 12 percent and liquidity requirement to 30 percent. Reduce cash reserve requirement to 9 percent and liquidity requirement to 27 percent. Write-off FINSAC debt owed to the Ministry of Finance. Offset FINSAC debt to Bank of Jamaica, and other government agencies against liabilities to government. Start paying cash interest payments on outstanding FINSAC paper. Government to assume explicitly outstanding FINSAC liabilities or their conversion to marketable securities. Reorganize FINSAC shareholding structure in NCB to provide FINSAC with direct controlling stake in NCB’s equity. Appoint new management team for NCB. Table in parliament the appropriate legislation to establish the Financial Services Commission for Integrated Supervision of securities, pensions, and insurance industries to strengthen oversight of financial services industry.
June 30, 2000 March 31, 2001 March 31, 2002 July 31, 2000 July 31, 2000 April 1, 2001 April 1, 2001 December 31, 2000 June 30, 2000 March 31, 2001
Privatization
Bring to the point of sale Jamaica Public Service Company (JPSCo).
March 31, 2001
Public enterprise reform
National Housing Trust (NHT): Reduction in staff to 445 (as envisaged in the “Jamaica Public Entities” publication of the Ministry of Finance and Planning, April 2000). National Water Commission (NWC): implement the performance targets approved by the Office of Utility Regulation (OUR) set for end-2000/01 year. National Insurance Fund (NIF): Implement the Insurance Management Database to ensure more efficient payment of benefits.
March 31, 2001 March 31, 2001 March 31, 2001
Social safety nets
Social safety net expenditures in the 2000/01 budget will be maintained in real terms in 2001/02.
March 31, 2002
Statistics
Implement the new quarterly national accounts.
March 31, 2001
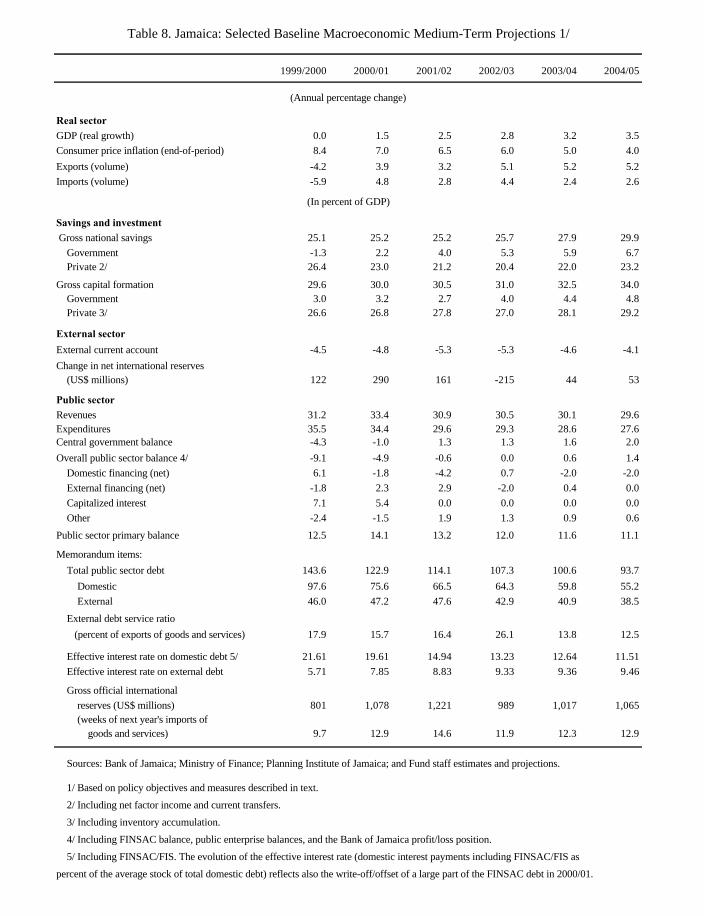
Table 8. Jamaica: Selected Baseline Macroeconomic Medium-Term Projections 1/
1999/2000 2000/01 2001/02 2002/03 2003/04 2004/05
(Annual percentage change)
Real sector
GDP (real growth) 0.0 1.5 2.5 2.8 3.2 3.5
Consumer price inflation (end-of-period) 8.4 7.0 6.5 6.0 5.0 4.0
Exports (volume) -4.2 3.9 3.2 5.1 5.2 5.2
Imports (volume) -5.9 4.8 2.8 4.4 2.4 2.6
(In percent of GDP)
Savings and investment
Gross national savings 25.1 25.2 25.2 25.7 27.9 29.9
Government -1.3 2.2 4.0 5.3 5.9 6.7Private 2/ 26.4 23.0 21.2 20.4 22.0 23.2
Gross capital formation 29.6 30.0 30.5 31.0 32.5 34.0Government 3.0 3.2 2.7 4.0 4.4 4.8Private 3/ 26.6 26.8 27.8 27.0 28.1 29.2
External sector
External current account -4.5 -4.8 -5.3 -5.3 -4.6 -4.1
Change in net international reserves(US$ millions) 122 290 161 -215 44 53
Public sector
Revenues 31.2 33.4 30.9 30.5 30.1 29.6Expenditures 35.5 34.4 29.6 29.3 28.6 27.6Central government balance -4.3 -1.0 1.3 1.3 1.6 2.0
Overall public sector balance 4/ -9.1 -4.9 -0.6 0.0 0.6 1.4
Domestic financing (net) 6.1 -1.8 -4.2 0.7 -2.0 -2.0
External financing (net) -1.8 2.3 2.9 -2.0 0.4 0.0
Capitalized interest 7.1 5.4 0.0 0.0 0.0 0.0
Other -2.4 -1.5 1.9 1.3 0.9 0.6
Public sector primary balance 12.5 14.1 13.2 12.0 11.6 11.1
Memorandum items:
Total public sector debt 143.6 122.9 114.1 107.3 100.6 93.7
Domestic 97.6 75.6 66.5 64.3 59.8 55.2
External 46.0 47.2 47.6 42.9 40.9 38.5
External debt service ratio
(percent of exports of goods and services) 17.9 15.7 16.4 26.1 13.8 12.5
Effective interest rate on domestic debt 5/ 21.61 19.61 14.94 13.23 12.64 11.51
Effective interest rate on external debt 5.71 7.85 8.83 9.33 9.36 9.46
Gross official international
reserves (US$ millions) 801 1,078 1,221 989 1,017 1,065(weeks of next year's imports of
goods and services) 9.7 12.9 14.6 11.9 12.3 12.9
Sources: Bank of Jamaica; Ministry of Finance; Planning Institute of Jamaica; and Fund staff estimates and projections.
1/ Based on policy objectives and measures described in text.
2/ Including net factor income and current transfers.
3/ Including inventory accumulation.
4/ Including FINSAC balance, public enterprise balances, and the Bank of Jamaica profit/loss position.
5/ Including FINSAC/FIS. The evolution of the effective interest rate (domestic interest payments including FINSAC/FIS as
percent of the average stock of total domestic debt) reflects also the write-off/offset of a large part of the FINSAC debt in 2000/01.
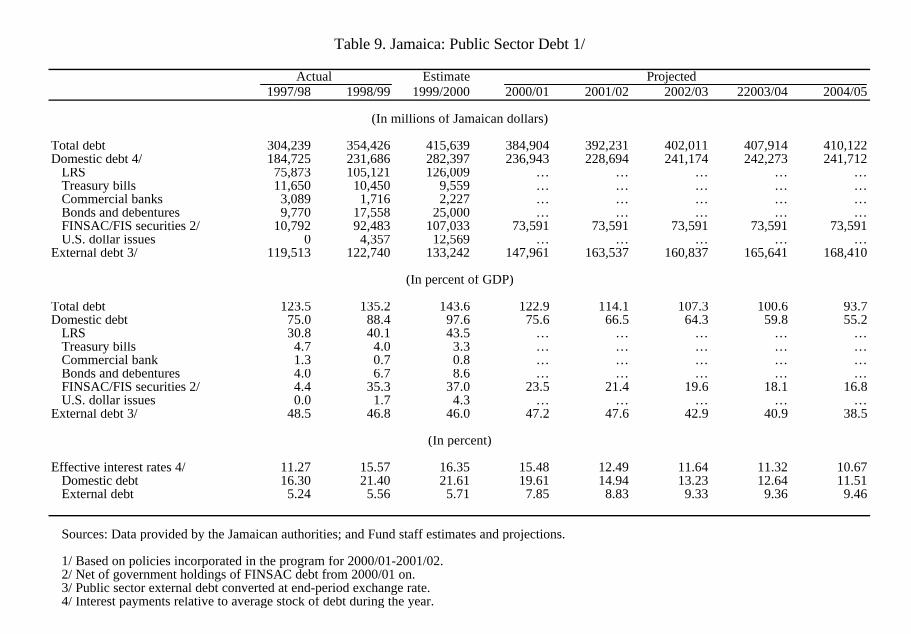
Table 9. Jamaica: Public Sector Debt 1/
Actual Estimate Projected1997/98 1998/99 1999/2000 2000/01 2001/02 2002/03 22003/04 2004/05
(In millions of Jamaican dollars)
Total debt 304,239 354,426 415,639 384,904 392,231 402,011 407,914 410,122Domestic debt 4/ 184,725 231,686 282,397 236,943 228,694 241,174 242,273 241,712
LRS 75,873 105,121 126,009 … … … … …Treasury bills 11,650 10,450 9,559 … … … … …Commercial banks 3,089 1,716 2,227 … … … … …Bonds and debentures 9,770 17,558 25,000 … … … … …FINSAC/FIS securities 2/ 10,792 92,483 107,033 73,591 73,591 73,591 73,591 73,591U.S. dollar issues 0 4,357 12,569 … … … … …
External debt 3/ 119,513 122,740 133,242 147,961 163,537 160,837 165,641 168,410
(In percent of GDP)
Total debt 123.5 135.2 143.6 122.9 114.1 107.3 100.6 93.7Domestic debt 75.0 88.4 97.6 75.6 66.5 64.3 59.8 55.2
LRS 30.8 40.1 43.5 … … … … …Treasury bills 4.7 4.0 3.3 … … … … …Commercial bank 1.3 0.7 0.8 … … … … …Bonds and debentures 4.0 6.7 8.6 … … … … …FINSAC/FIS securities 2/ 4.4 35.3 37.0 23.5 21.4 19.6 18.1 16.8U.S. dollar issues 0.0 1.7 4.3 … … … … …
External debt 3/ 48.5 46.8 46.0 47.2 47.6 42.9 40.9 38.5
(In percent)
Effective interest rates 4/ 11.27 15.57 16.35 15.48 12.49 11.64 11.32 10.67Domestic debt 16.30 21.40 21.61 19.61 14.94 13.23 12.64 11.51External debt 5.24 5.56 5.71 7.85 8.83 9.33 9.36 9.46
Sources: Data provided by the Jamaican authorities; and Fund staff estimates and projections.
1/ Based on policies incorporated in the program for 2000/01-2001/02.
3/ Public sector external debt converted at end-period exchange rate.4/ Interest payments relative to average stock of debt during the year.
2/ Net of government holdings of FINSAC debt from 2000/01 on.
- 25 -

- 26 -
Table 10. Jamaica: Selected High-Risk Scenario Macroeconomic
Medium-Term Projections 1/
1999/2000 2000/01 2001/02 2002/03 2003/04 2004/05
(Percentage change)
Real sector
GDP (real growth) 0.0 0.5 1.0 1.5 2.0 2.5
Consumer price inflation (end-of-period) 8.4 7.0 6.5 6.0 5.0 4.0
Exports (volume) -4.2 2.6 2.6 4.2 3.1 3.3
Imports (volume) -5.9 4.1 2.3 3.8 2.1 2.2
(In percent of GDP)
Savings and investmentGross national savings 25.8 25.9 26.2 27.5 28.7 29.5
Government -1.3 1.4 2.4 3.3 3.5 4.1
Private 2/ 27.1 24.5 23.8 24.2 25.2 25.4
Gross capital formation 29.6 29.8 30.1 30.4 31.5 32.5
Government 3.0 3.2 2.5 3.7 4.1 4.5
Private 3/ 26.6 26.6 27.6 26.7 27.4 28.0
External sector
External current account -4.5 -4.6 -5.0 -5.0 -4.5 -4.4
Change in net international reserves ( US$ millions) 122 280 129 -262 8 9
Public sectorRevenues 31.2 33.3 30.9 30.6 30.2 30.0
Expenditure 35.5 35.1 31.0 31.0 30.8 30.4
Central government balance -4.3 -1.8 -0.1 -0.4 -0.6 -0.4
Overall public sector balance 4/ -9.1 -5.9 -2.4 -2.2 -2.0 -1.4
Domestic financing (net) 6.3 -0.9 -2.9 2.5 0.2 0.3
External financing (net) -2.1 2.8 3.0 -2.1 0.4 0.0
Capitalized interest 7.1 5.6 0.0 0.0 0.0 0.0
Other -2.1 -1.5 2.3 1.8 1.4 1.1
Public sector primary balance 12.5 13.9 13.1 11.9 11.5 11.1
Memorandum items:
Total public sector debt 143.6 125.3 119.4 113.2 107.0 100.9
Domestic 97.6 78.5 72.0 72.5 70.7 68.9
External 46.0 46.6 47.4 41.9 38.3 35.1
External debt service ratio
(percent of exports of goods and services) 17.9 15.8 16.5 26.4 14.2 12.9
Effective interest rate on domestic debt 4/ 21.61 21.51 17.04 15.33 14.94 13.81
Effective interest rate on external debt 5.71 7.85 8.83 9.33 9.36 9.46
Gross official international reserves (US$ millions) 801 1068 1,179 900 876 862
(weeks of next year's imports of goods and services) 9.7 12.9 14.2 10.9 10.6 10.4
Sources: Bank of Jamaica; Ministry of Finance; Planning Institute of Jamaica; and Fund staff estimates and projections.
1/ Based on pessimistic domestic interest rate path and sluggish economic recovery.
2/ Including net factor income and current transfers.
3/ Including inventory accumulation.
4/ Including FINSAC interest. The evolution of the effective interest rate (domestic interest payments including FINSAC/FIS as
percent of the average stock of total domestic debt) reflects also the write-off/offset of a large part of the FINSAC debt in 2000/01.


![Judicial Review-leave Finsac Mangatal J._[1]](https://img.pdfslide.us/doc/110x75/546af9bfb4af9f8e2c8b4a09/judicial-review-leave-finsac-mangatal-j1.jpg)