Embed Size (px)
Citation preview
Figure 1. Comparison of Cancer Incidence Rates1 of Individual Census Tracts with Louisiana, All Cancers Combined, 2005-2015
Louisiana Tumor Registry
The rate is statistically significantly lower than Louisiana
The rate is not statistically significantly different from Louisiana
The rate is statistically significantly higher than Louisiana
The census tract does not meet the requirements (population count > 20,000 and case count ≥ 16 for the 2005-2015 combined data) for publication of cancer incidence data, which is a restriction in state law that is in compliance with HIPAA rules and the standard of United States Cancer Statistics.
1Average annual age-adjusted (2000 US) incidence rates
39
Figure 2. Comparison of Cancer Incidence Rates1 of Individual Census Tracts with Louisiana, Lung & Bronchus, 2005-2015
Louisiana Tumor Registry
The rate is statistically significantly lower than Louisiana.
The rate is not statistically significantly different from Louisiana.
The rate is statistically significantly higher than Louisiana.
The census tract does not meet the requirements (population count > 20,000 and case count ≥ 16 for the 2005-2015 combined data) for publication of cancer incidence data, which is a restriction in state law that is in compliance with HIPAA rules and the standard of United States Cancer Statistics.1Average annual age-adjusted (2000 US) incidence rates
Risk Factors2
• Age• Sex• Cigarette smoking (increases with amount
and years of smoking)• Cigar and pipe smoking• Exposure to secondhand smoke• Taking beta carotene supplements• Exposure to radon gas, asbestos, certain metals
(chromium, cadmium, arsenic), silica, beryllium, nickel chromate, some organic chemicals, radiation, vinyl chloride, mustard gas, coal products, or diesel exhaust
• Air pollution• Occupational exposures, including: rubber
manufacturing, paving, roofing, painting, chimney sweeping
• History of tuberculosis• Personal or family history of lung cancer• Radiation therapy to the chest for other cancers• HIV infection• Multiple endocrine neoplasia type 1 (MEN1)
2American Cancer Society, Cancer Facts & Figures 2019; American Cancer Society, www.cancer.org/cancer.html; National Cancer Institute, www.cancer.gov.
40
Louisiana Tumor Registry
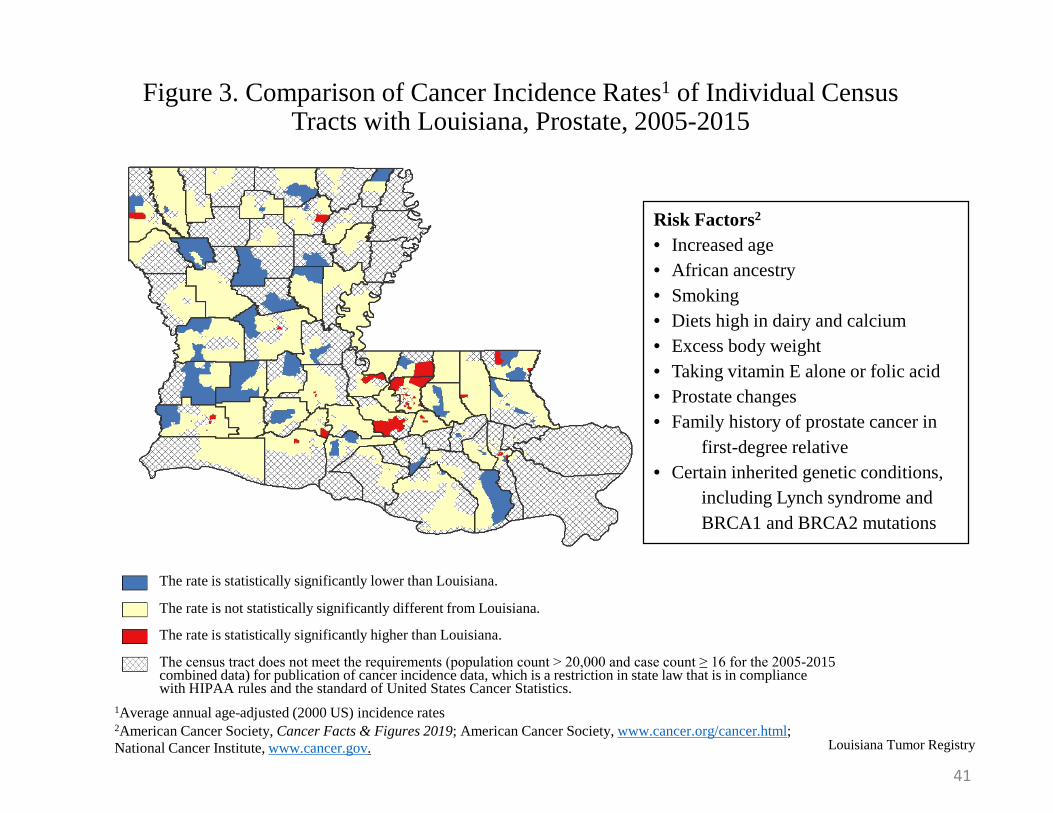
Figure 3. Comparison of Cancer Incidence Rates1 of Individual Census Tracts with Louisiana, Prostate, 2005-2015
The census tract does not meet the requirements (population count > 20,000 and case count ≥ 16 for the 2005-2015 combined data) for publication of cancer incidence data, which is a restriction in state law that is in compliance with HIPAA rules and the standard of United States Cancer Statistics.
The rate is not statistically significantly different from Louisiana.
The rate is statistically significantly higher than Louisiana.
The rate is statistically significantly lower than Louisiana.
Risk Factors2
• Increased age• African ancestry• Smoking• Diets high in dairy and calcium• Excess body weight• Taking vitamin E alone or folic acid• Prostate changes• Family history of prostate cancer in
first-degree relative• Certain inherited genetic conditions,
including Lynch syndrome and BRCA1 and BRCA2 mutations
1Average annual age-adjusted (2000 US) incidence rates2American Cancer Society, Cancer Facts & Figures 2019; American Cancer Society, www.cancer.org/cancer.html; National Cancer Institute, www.cancer.gov.
41
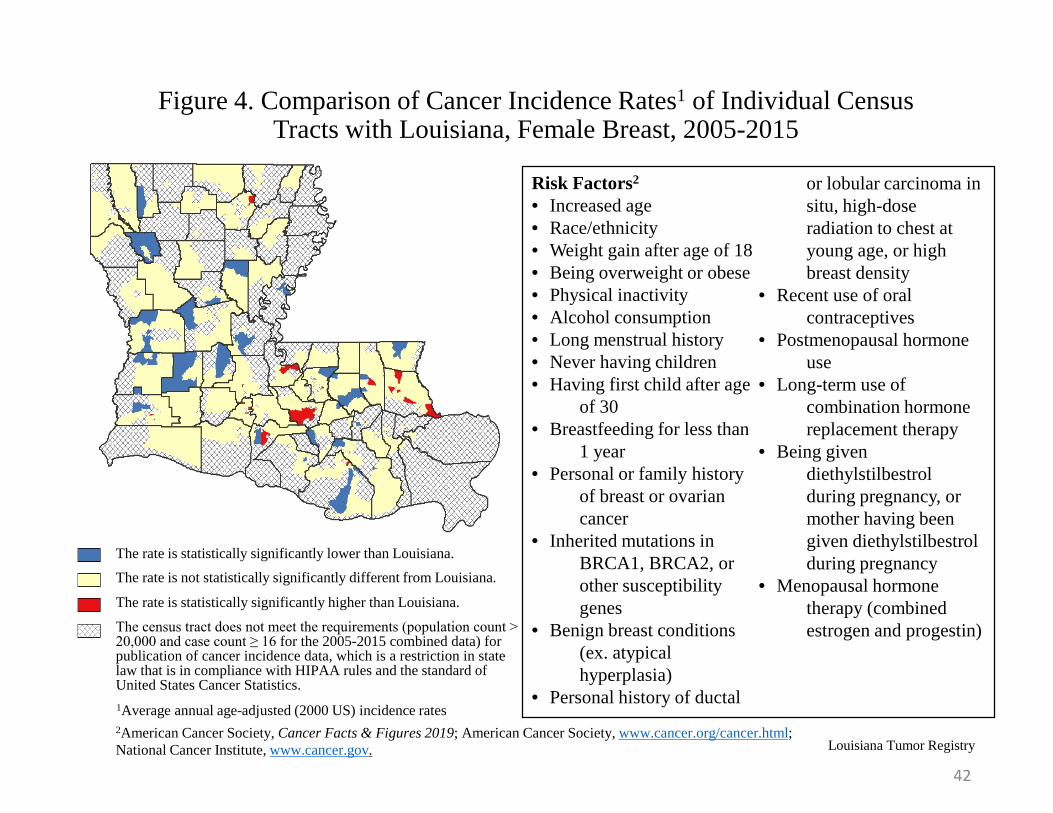
Figure 4. Comparison of Cancer Incidence Rates1 of Individual Census Tracts with Louisiana, Female Breast, 2005-2015
Louisiana Tumor Registry
Risk Factors2
• Increased age• Race/ethnicity• Weight gain after age of 18• Being overweight or obese• Physical inactivity• Alcohol consumption• Long menstrual history• Never having children• Having first child after age
of 30• Breastfeeding for less than
1 year• Personal or family history
of breast or ovarian cancer
• Inherited mutations inBRCA1, BRCA2, or other susceptibilitygenes
• Benign breast conditions(ex. atypical hyperplasia)
• Personal history of ductal
or lobular carcinoma in situ, high-dose radiation to chest at young age, or high breast density
• Recent use of oralcontraceptives
• Postmenopausal hormoneuse
• Long-term use ofcombination hormone replacement therapy
• Being givendiethylstilbestrol during pregnancy, or mother having been given diethylstilbestrol during pregnancy
• Menopausal hormonetherapy (combined estrogen and progestin)
The rate is statistically significantly lower than Louisiana.The rate is not statistically significantly different from Louisiana.
The rate is statistically significantly higher than Louisiana.
The census tract does not meet the requirements (population count > 20,000 and case count ≥ 16 for the 2005-2015 combined data) for publication of cancer incidence data, which is a restriction in state law that is in compliance with HIPAA rules and the standard of United States Cancer Statistics.1Average annual age-adjusted (2000 US) incidence rates2American Cancer Society, Cancer Facts & Figures 2019; American Cancer Society, www.cancer.org/cancer.html; National Cancer Institute, www.cancer.gov.
42
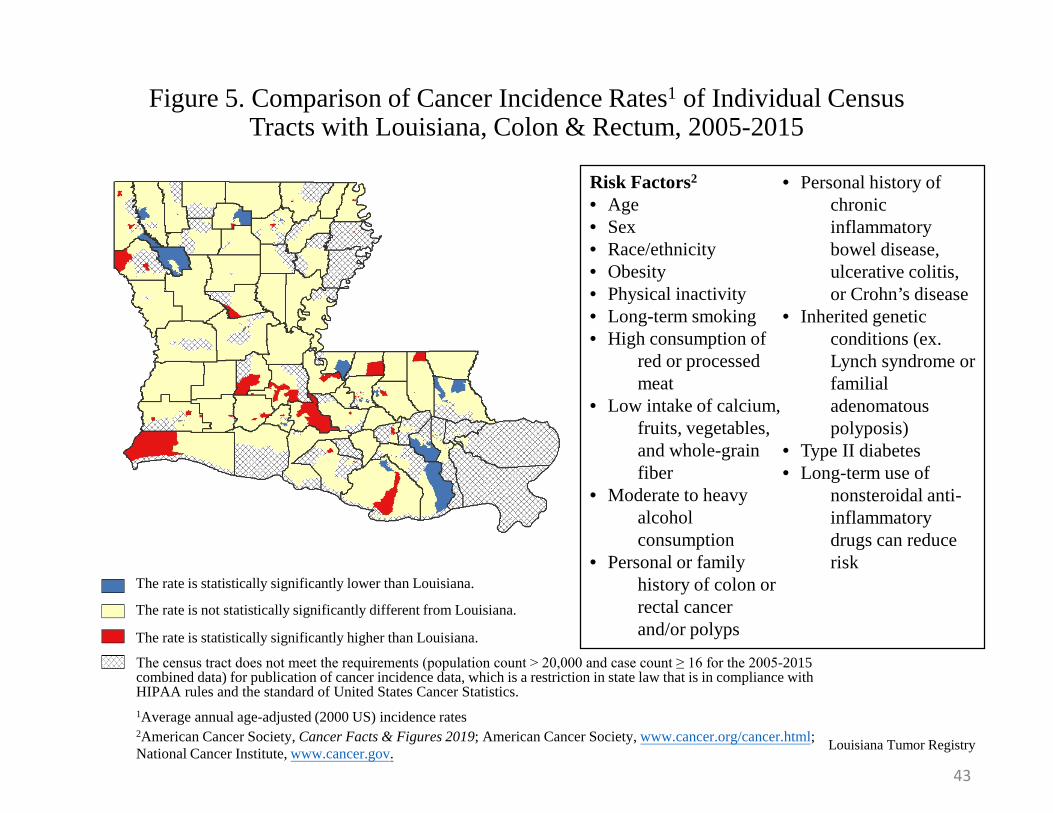
Figure 5. Comparison of Cancer Incidence Rates1 of Individual Census Tracts with Louisiana, Colon & Rectum, 2005-2015
Louisiana Tumor Registry
Risk Factors2
• Age• Sex• Race/ethnicity• Obesity• Physical inactivity• Long-term smoking• High consumption of
red or processed meat
• Low intake of calcium,fruits, vegetables, and whole-grain fiber
• Moderate to heavyalcohol consumption
• Personal or familyhistory of colon or rectal cancer and/or polyps
• Personal history ofchronic inflammatory bowel disease, ulcerative colitis, or Crohn’s disease
• Inherited geneticconditions (ex. Lynch syndrome or familial adenomatous polyposis)
• Type II diabetes• Long-term use of
nonsteroidal anti-inflammatory drugs can reduce risk
The rate is not statistically significantly different from Louisiana.
The rate is statistically significantly higher than Louisiana.
The rate is statistically significantly lower than Louisiana.
The census tract does not meet the requirements (population count > 20,000 and case count ≥ 16 for the 2005-2015 combined data) for publication of cancer incidence data, which is a restriction in state law that is in compliance with HIPAA rules and the standard of United States Cancer Statistics.1Average annual age-adjusted (2000 US) incidence rates2American Cancer Society, Cancer Facts & Figures 2019; American Cancer Society, www.cancer.org/cancer.html; National Cancer Institute, www.cancer.gov.
43
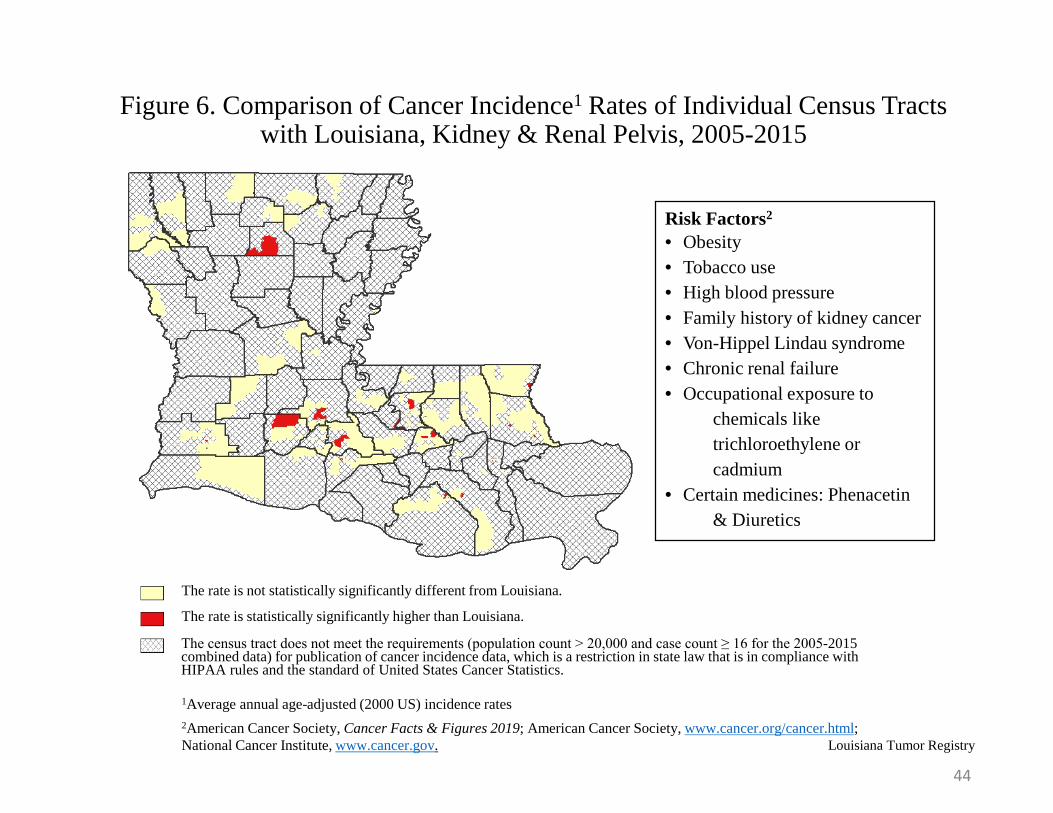
Figure 6. Comparison of Cancer Incidence1 Rates of Individual Census Tracts with Louisiana, Kidney & Renal Pelvis, 2005-2015
Louisiana Tumor Registry
The census tract does not meet the requirements (population count > 20,000 and case count ≥ 16 for the 2005-2015 combined data) for publication of cancer incidence data, which is a restriction in state law that is in compliance with HIPAA rules and the standard of United States Cancer Statistics.
The rate is not statistically significantly different from Louisiana.
The rate is statistically significantly higher than Louisiana.
Risk Factors2
• Obesity• Tobacco use• High blood pressure• Family history of kidney cancer• Von-Hippel Lindau syndrome• Chronic renal failure• Occupational exposure to
chemicals like trichloroethylene or cadmium
• Certain medicines: Phenacetin& Diuretics
1Average annual age-adjusted (2000 US) incidence rates2American Cancer Society, Cancer Facts & Figures 2019; American Cancer Society, www.cancer.org/cancer.html; National Cancer Institute, www.cancer.gov.
44
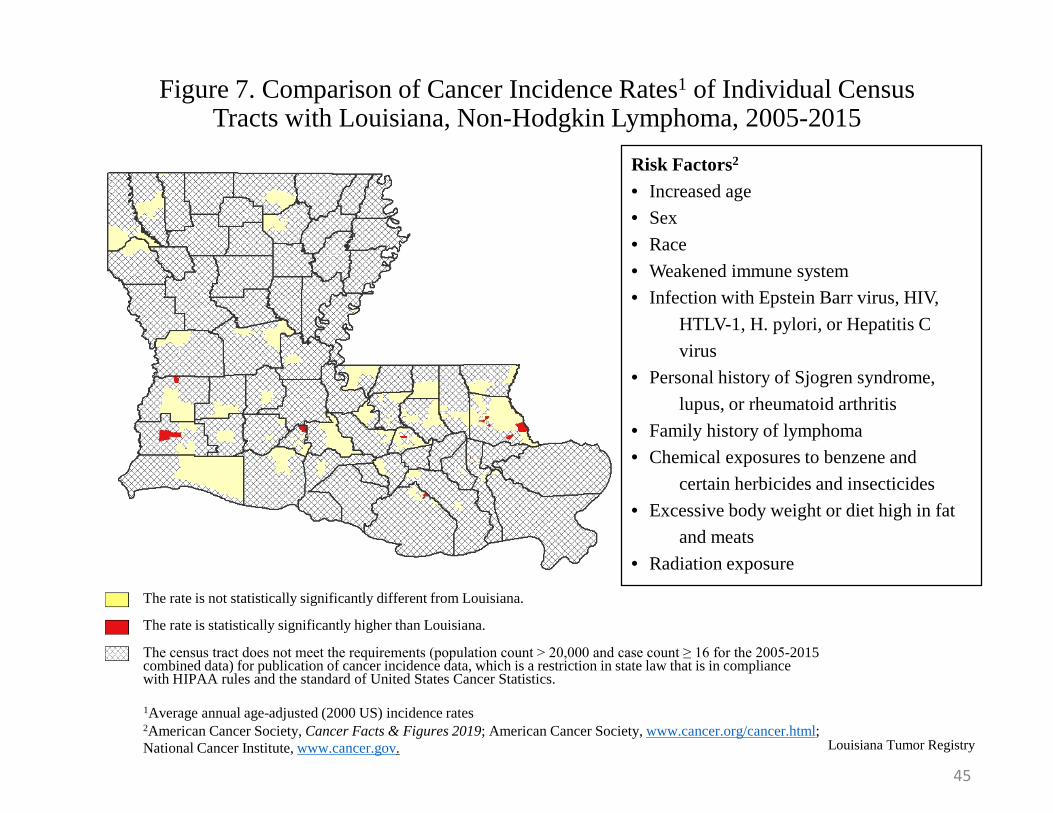
Figure 7. Comparison of Cancer Incidence Rates1 of Individual Census Tracts with Louisiana, Non-Hodgkin Lymphoma, 2005-2015
Louisiana Tumor Registry
The census tract does not meet the requirements (population count > 20,000 and case count ≥ 16 for the 2005-2015 combined data) for publication of cancer incidence data, which is a restriction in state law that is in compliance with HIPAA rules and the standard of United States Cancer Statistics.
The rate is not statistically significantly different from Louisiana.
The rate is statistically significantly higher than Louisiana.
Risk Factors2
• Increased age• Sex• Race• Weakened immune system• Infection with Epstein Barr virus, HIV,
HTLV-1, H. pylori, or Hepatitis C virus
• Personal history of Sjogren syndrome,lupus, or rheumatoid arthritis
• Family history of lymphoma• Chemical exposures to benzene and
certain herbicides and insecticides• Excessive body weight or diet high in fat
and meats• Radiation exposure
1Average annual age-adjusted (2000 US) incidence rates2American Cancer Society, Cancer Facts & Figures 2019; American Cancer Society, www.cancer.org/cancer.html; National Cancer Institute, www.cancer.gov.
45
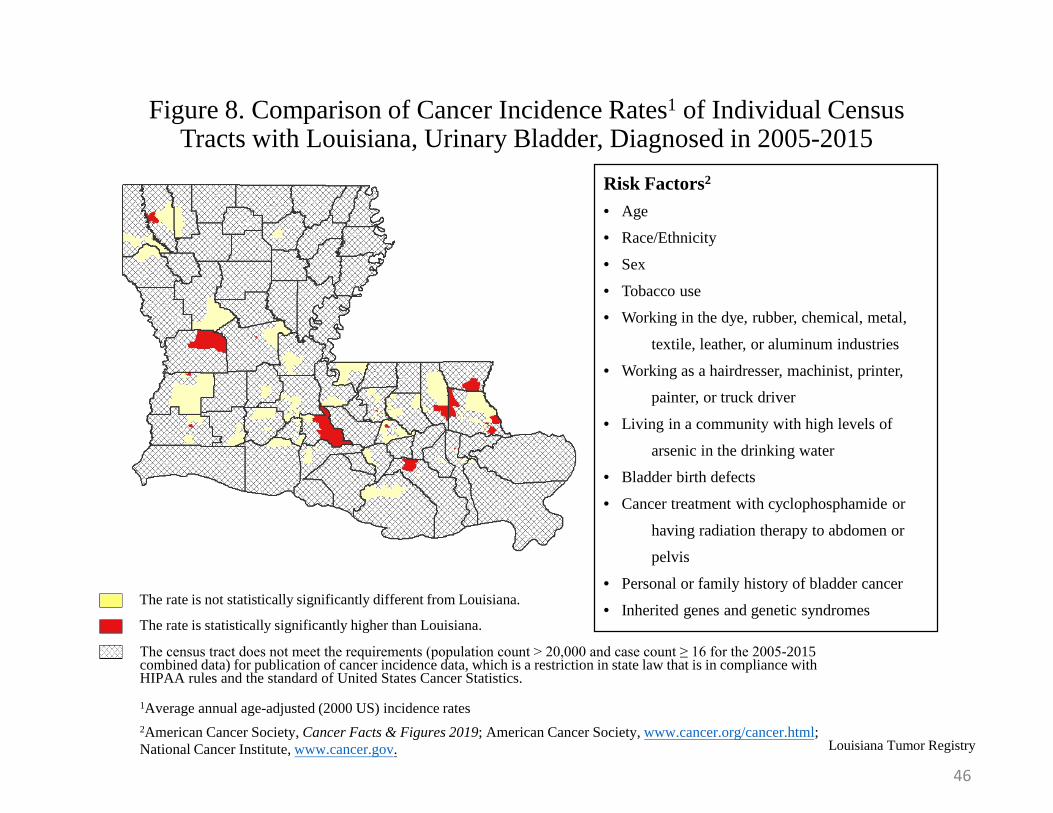
Figure 8. Comparison of Cancer Incidence Rates1 of Individual Census Tracts with Louisiana, Urinary Bladder, Diagnosed in 2005-2015
Louisiana Tumor Registry
The rate is not statistically significantly different from Louisiana.
The rate is statistically significantly higher than Louisiana.
Risk Factors2
• Age
• Race/Ethnicity
• Sex
• Tobacco use
• Working in the dye, rubber, chemical, metal,
textile, leather, or aluminum industries
• Working as a hairdresser, machinist, printer,
painter, or truck driver
• Living in a community with high levels of
arsenic in the drinking water
• Bladder birth defects
• Cancer treatment with cyclophosphamide or
having radiation therapy to abdomen or
pelvis
• Personal or family history of bladder cancer
• Inherited genes and genetic syndromes
The census tract does not meet the requirements (population count > 20,000 and case count ≥ 16 for the 2005-2015 combined data) for publication of cancer incidence data, which is a restriction in state law that is in compliance with HIPAA rules and the standard of United States Cancer Statistics.
1Average annual age-adjusted (2000 US) incidence rates2American Cancer Society, Cancer Facts & Figures 2019; American Cancer Society, www.cancer.org/cancer.html; National Cancer Institute, www.cancer.gov.
46
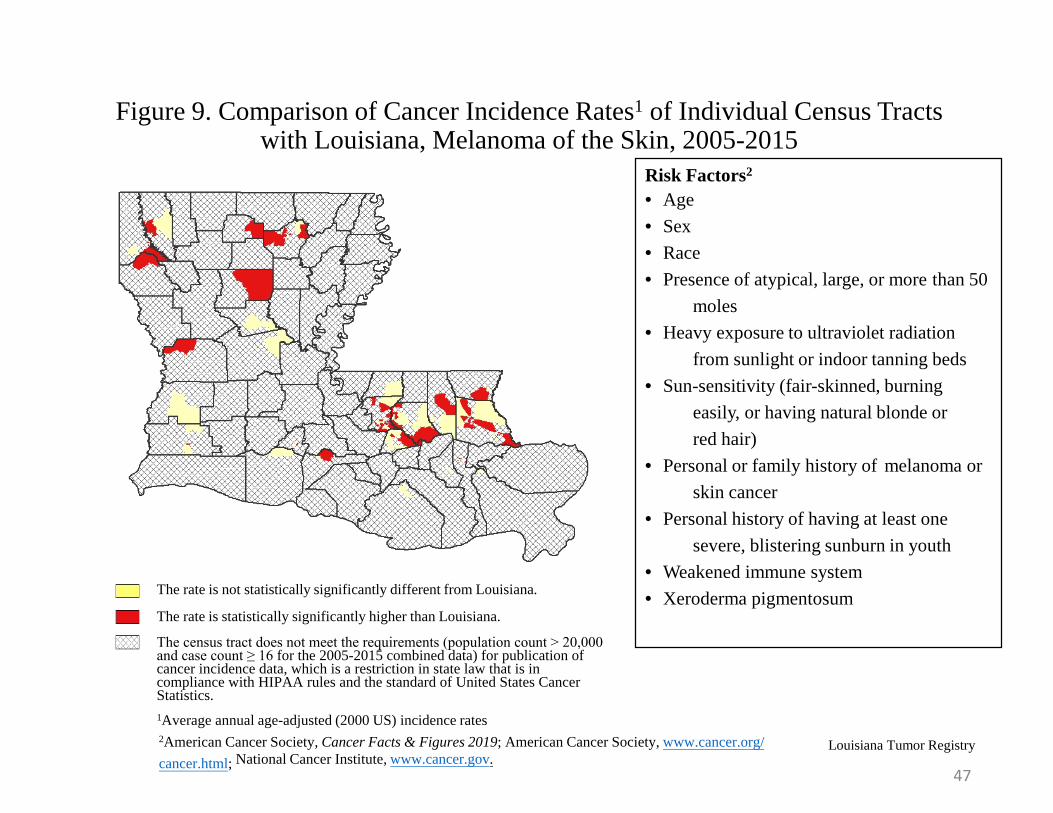
Figure 9. Comparison of Cancer Incidence Rates1 of Individual Census Tracts with Louisiana, Melanoma of the Skin, 2005-2015
Louisiana Tumor Registry
Risk Factors2
• Age• Sex• Race• Presence of atypical, large, or more than 50
moles• Heavy exposure to ultraviolet radiation
from sunlight or indoor tanning beds• Sun-sensitivity (fair-skinned, burning
easily, or having natural blonde or red hair)
• Personal or family history of melanoma orskin cancer
• Personal history of having at least onesevere, blistering sunburn in youth
• Weakened immune system• Xeroderma pigmentosumThe rate is not statistically significantly different from Louisiana.
The rate is statistically significantly higher than Louisiana.
The census tract does not meet the requirements (population count > 20,000 and case count ≥ 16 for the 2005-2015 combined data) for publication of cancer incidence data, which is a restriction in state law that is in compliance with HIPAA rules and the standard of United States Cancer Statistics.1Average annual age-adjusted (2000 US) incidence rates2American Cancer Society, Cancer Facts & Figures 2019; American Cancer Society, www.cancer.org/cancer.html; National Cancer Institute, www.cancer.gov.
47
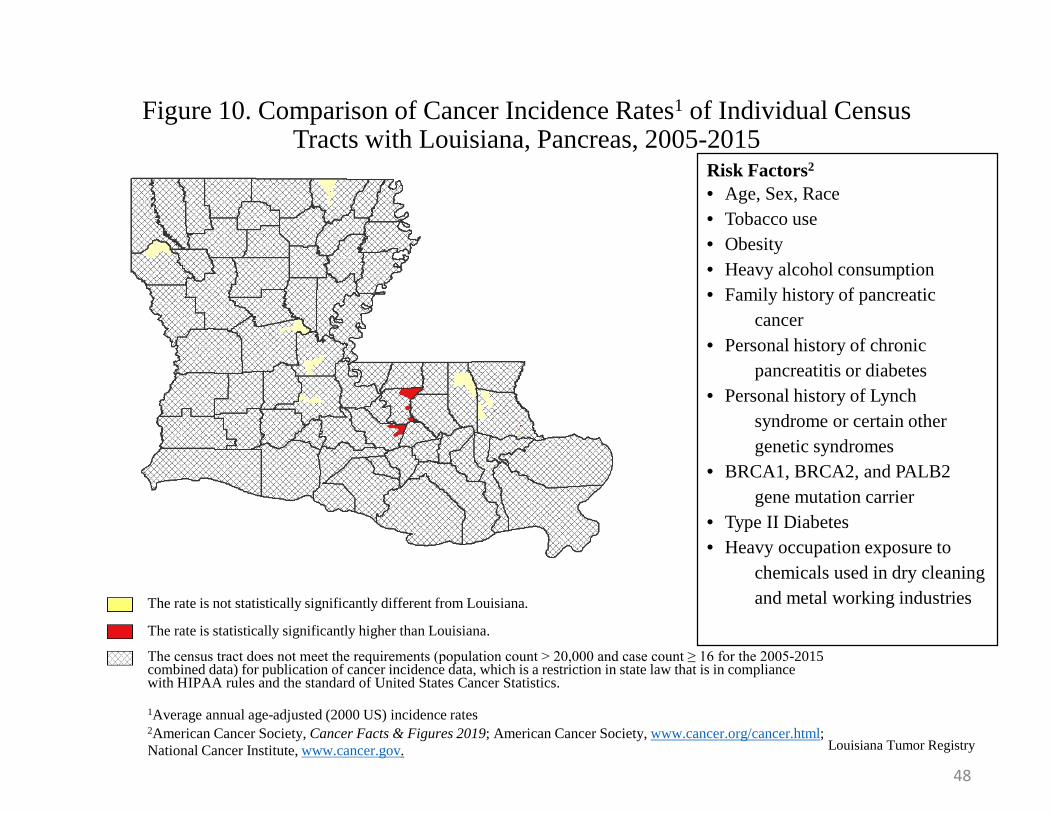
Figure 10. Comparison of Cancer Incidence Rates1 of Individual Census Tracts with Louisiana, Pancreas, 2005-2015
Louisiana Tumor Registry
The census tract does not meet the requirements (population count > 20,000 and case count ≥ 16 for the 2005-2015 combined data) for publication of cancer incidence data, which is a restriction in state law that is in compliance with HIPAA rules and the standard of United States Cancer Statistics.
The rate is not statistically significantly different from Louisiana.
The rate is statistically significantly higher than Louisiana.
Risk Factors2
• Age, Sex, Race• Tobacco use• Obesity• Heavy alcohol consumption• Family history of pancreatic
cancer• Personal history of chronic
pancreatitis or diabetes• Personal history of Lynch
syndrome or certain other genetic syndromes
• BRCA1, BRCA2, and PALB2gene mutation carrier
• Type II Diabetes• Heavy occupation exposure to
chemicals used in dry cleaning and metal working industries
1Average annual age-adjusted (2000 US) incidence rates2American Cancer Society, Cancer Facts & Figures 2019; American Cancer Society, www.cancer.org/cancer.html; National Cancer Institute, www.cancer.gov.
48
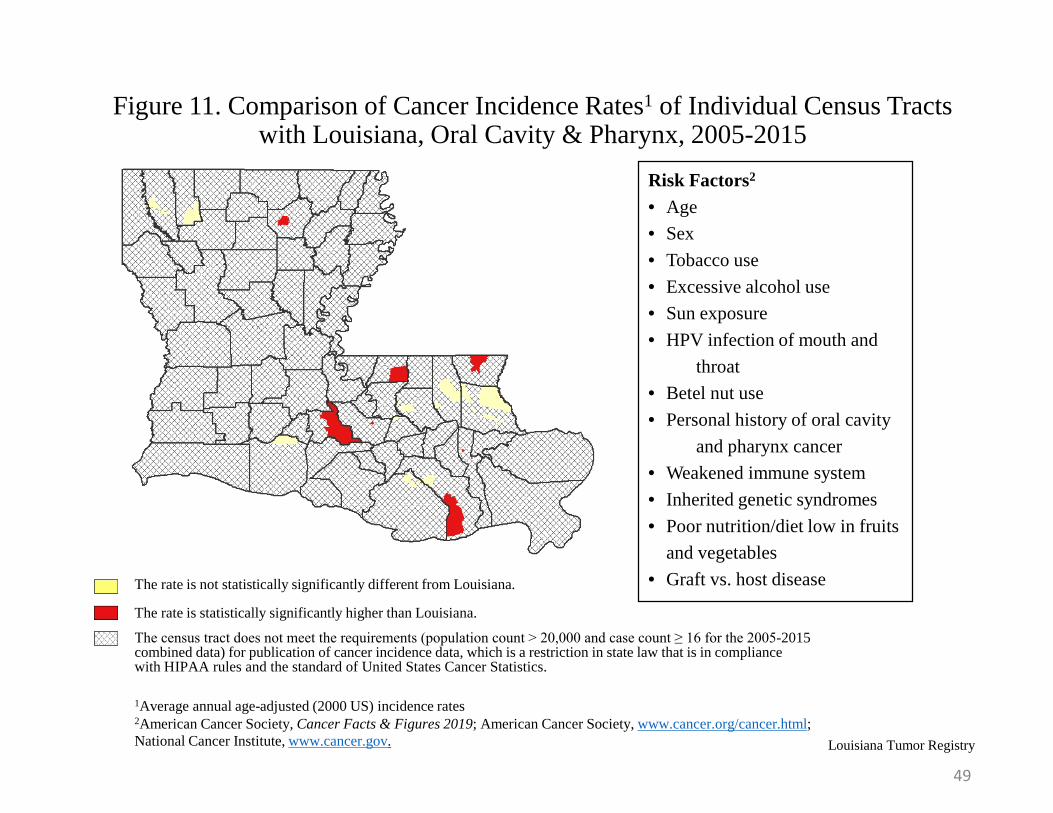
Figure 11. Comparison of Cancer Incidence Rates1 of Individual Census Tracts with Louisiana, Oral Cavity & Pharynx, 2005-2015
Louisiana Tumor Registry
The census tract does not meet the requirements (population count > 20,000 and case count ≥ 16 for the 2005-2015 combined data) for publication of cancer incidence data, which is a restriction in state law that is in compliance with HIPAA rules and the standard of United States Cancer Statistics.
The rate is not statistically significantly different from Louisiana.
The rate is statistically significantly higher than Louisiana.
Risk Factors2
• Age• Sex• Tobacco use• Excessive alcohol use• Sun exposure• HPV infection of mouth and
throat• Betel nut use• Personal history of oral cavity
and pharynx cancer• Weakened immune system• Inherited genetic syndromes• Poor nutrition/diet low in fruits
and vegetables• Graft vs. host disease
1Average annual age-adjusted (2000 US) incidence rates2American Cancer Society, Cancer Facts & Figures 2019; American Cancer Society, www.cancer.org/cancer.html; National Cancer Institute, www.cancer.gov.
49
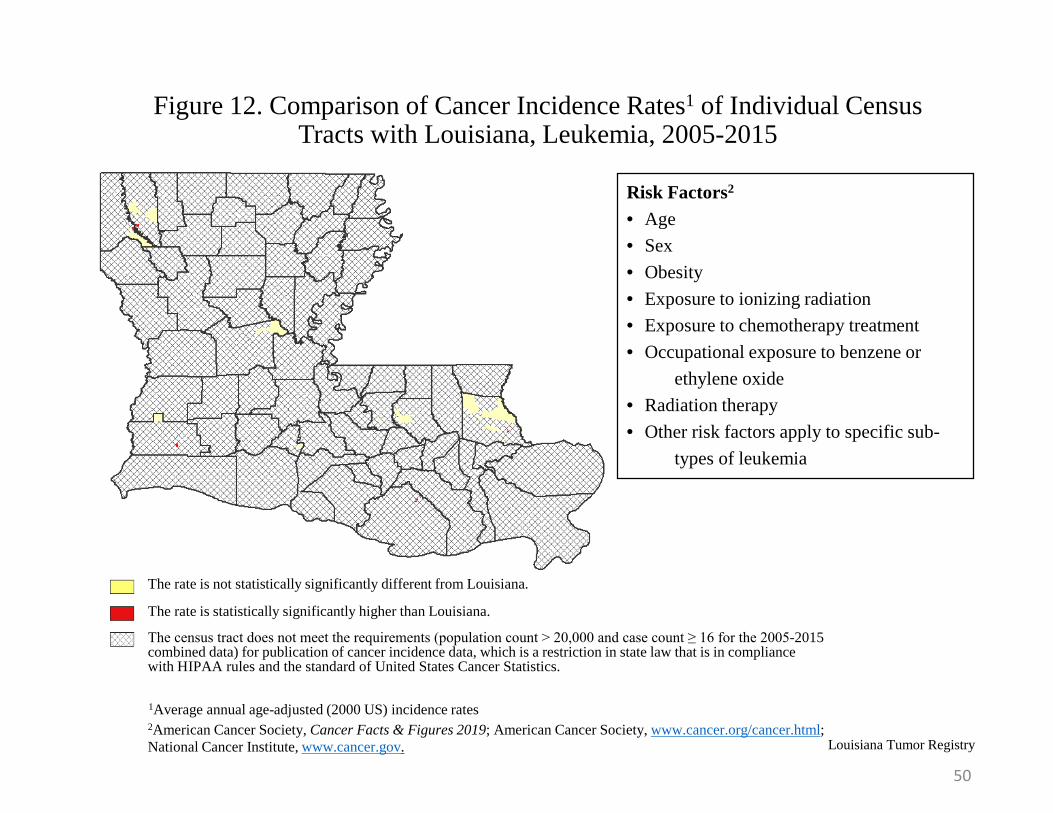
Figure 12. Comparison of Cancer Incidence Rates1 of Individual Census Tracts with Louisiana, Leukemia, 2005-2015
Louisiana Tumor Registry
The census tract does not meet the requirements (population count > 20,000 and case count ≥ 16 for the 2005-2015 combined data) for publication of cancer incidence data, which is a restriction in state law that is in compliance with HIPAA rules and the standard of United States Cancer Statistics.
The rate is not statistically significantly different from Louisiana.
The rate is statistically significantly higher than Louisiana.
Risk Factors2
• Age• Sex• Obesity• Exposure to ionizing radiation• Exposure to chemotherapy treatment• Occupational exposure to benzene or
ethylene oxide• Radiation therapy• Other risk factors apply to specific sub-
types of leukemia
1Average annual age-adjusted (2000 US) incidence rates2American Cancer Society, Cancer Facts & Figures 2019; American Cancer Society, www.cancer.org/cancer.html; National Cancer Institute, www.cancer.gov.
50
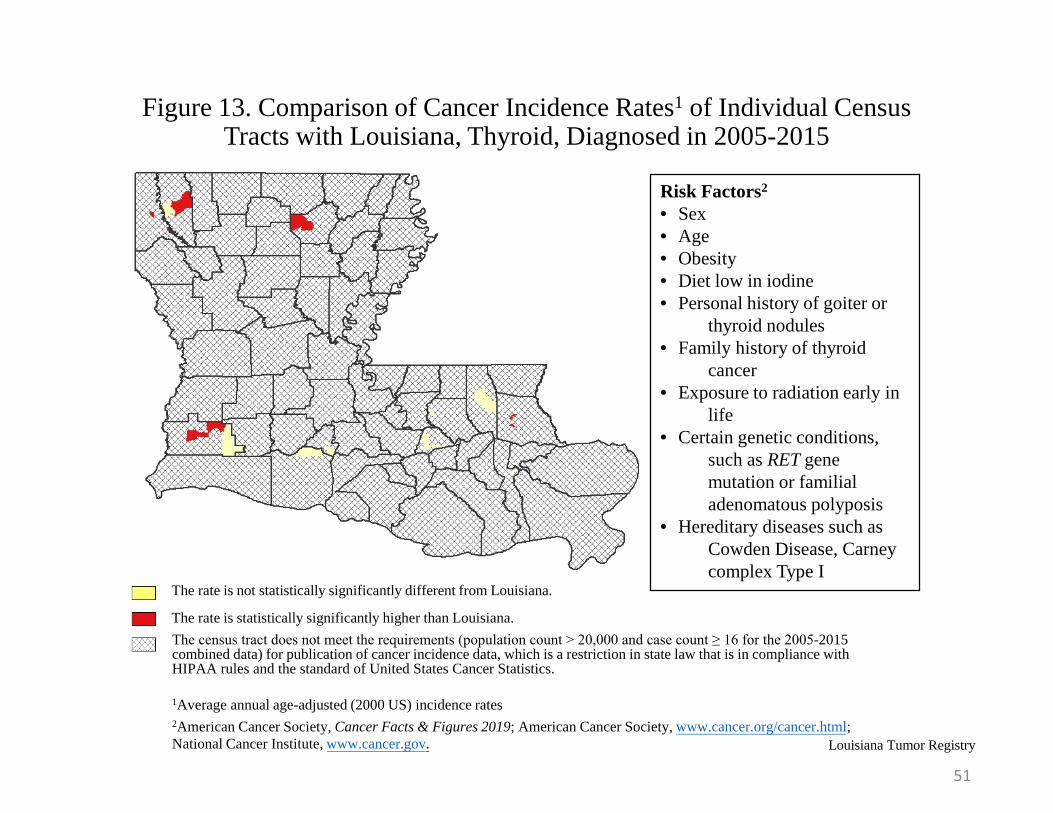
Figure 13. Comparison of Cancer Incidence Rates1 of Individual Census Tracts with Louisiana, Thyroid, Diagnosed in 2005-2015
Louisiana Tumor Registry
The rate is not statistically significantly different from Louisiana.
The rate is statistically significantly higher than Louisiana.
Risk Factors2
• Sex• Age• Obesity• Diet low in iodine• Personal history of goiter or
thyroid nodules• Family history of thyroid
cancer• Exposure to radiation early in
life• Certain genetic conditions,
such as RET gene mutation or familial adenomatous polyposis
• Hereditary diseases such asCowden Disease, Carney complex Type I
The census tract does not meet the requirements (population count > 20,000 and case count ≥ 16 for the 2005-2015 combined data) for publication of cancer incidence data, which is a restriction in state law that is in compliance with HIPAA rules and the standard of United States Cancer Statistics.
1Average annual age-adjusted (2000 US) incidence rates2American Cancer Society, Cancer Facts & Figures 2019; American Cancer Society, www.cancer.org/cancer.html; National Cancer Institute, www.cancer.gov.
51
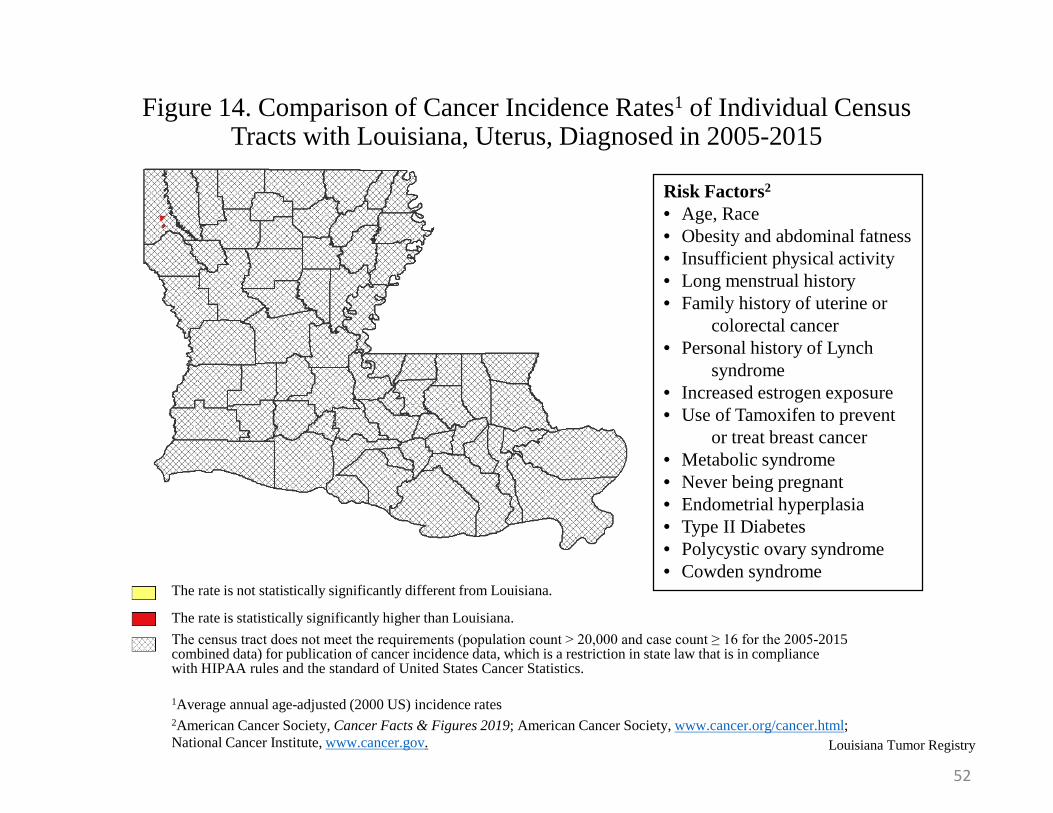
Figure 14. Comparison of Cancer Incidence Rates1 of Individual Census Tracts with Louisiana, Uterus, Diagnosed in 2005-2015
Louisiana Tumor Registry
The census tract does not meet the requirements (population count > 20,000 and case count ≥ 16 for the 2005-2015 combined data) for publication of cancer incidence data, which is a restriction in state law that is in compliance with HIPAA rules and the standard of United States Cancer Statistics.
The rate is not statistically significantly different from Louisiana.
The rate is statistically significantly higher than Louisiana.
Risk Factors2
• Age, Race• Obesity and abdominal fatness• Insufficient physical activity• Long menstrual history• Family history of uterine or
colorectal cancer• Personal history of Lynch
syndrome• Increased estrogen exposure• Use of Tamoxifen to prevent
or treat breast cancer• Metabolic syndrome• Never being pregnant• Endometrial hyperplasia• Type II Diabetes• Polycystic ovary syndrome• Cowden syndrome
1Average annual age-adjusted (2000 US) incidence rates2American Cancer Society, Cancer Facts & Figures 2019; American Cancer Society, www.cancer.org/cancer.html; National Cancer Institute, www.cancer.gov.
52
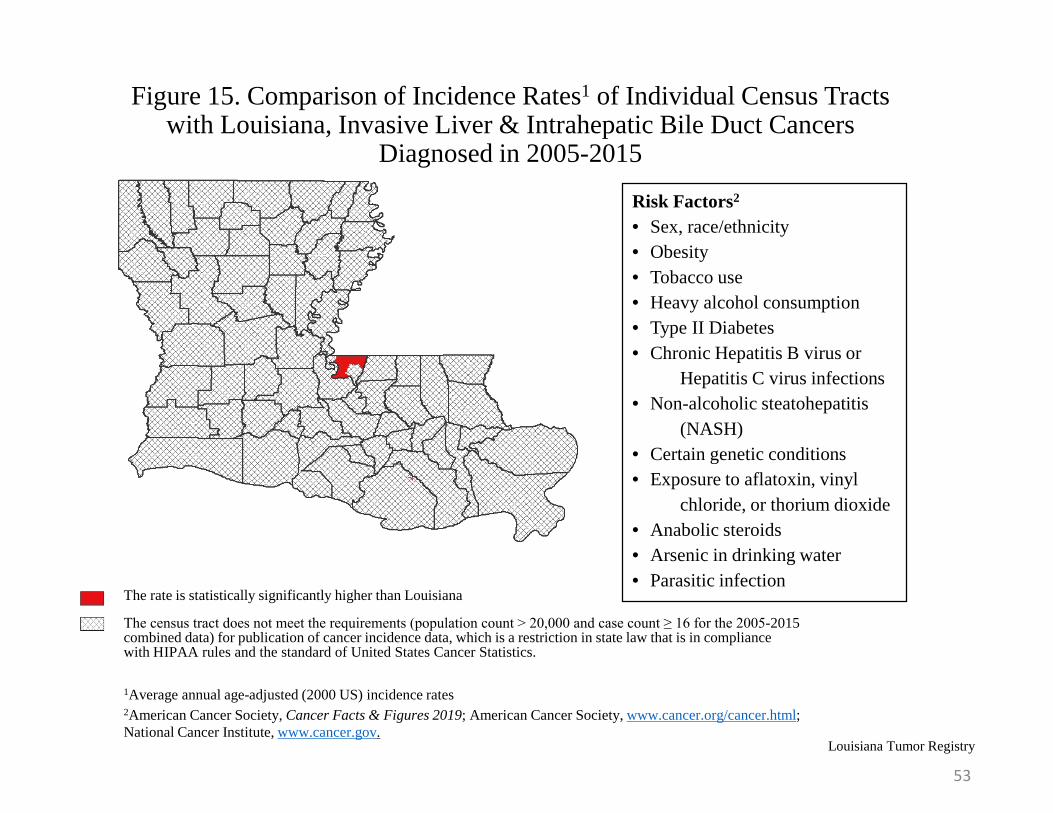
Figure 15. Comparison of Incidence Rates1 of Individual Census Tracts with Louisiana, Invasive Liver & Intrahepatic Bile Duct Cancers
Diagnosed in 2005-2015
Louisiana Tumor Registry
The census tract does not meet the requirements (population count > 20,000 and case count ≥ 16 for the 2005-2015 combined data) for publication of cancer incidence data, which is a restriction in state law that is in compliance with HIPAA rules and the standard of United States Cancer Statistics.
The rate is statistically significantly higher than Louisiana
Risk Factors2
• Sex, race/ethnicity• Obesity• Tobacco use• Heavy alcohol consumption• Type II Diabetes• Chronic Hepatitis B virus or
Hepatitis C virus infections• Non-alcoholic steatohepatitis
(NASH)• Certain genetic conditions• Exposure to aflatoxin, vinyl
chloride, or thorium dioxide• Anabolic steroids• Arsenic in drinking water• Parasitic infection
1Average annual age-adjusted (2000 US) incidence rates2American Cancer Society, Cancer Facts & Figures 2019; American Cancer Society, www.cancer.org/cancer.html; National Cancer Institute, www.cancer.gov.
53
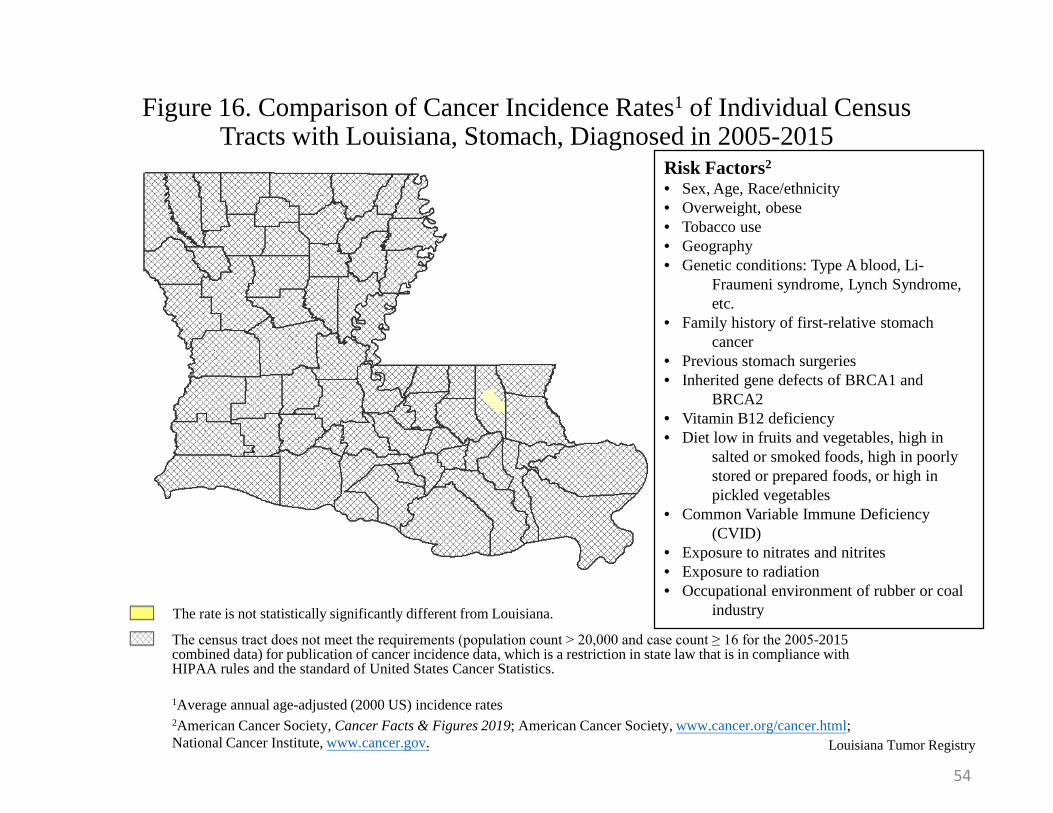
Figure 16. Comparison of Cancer Incidence Rates1 of Individual Census Tracts with Louisiana, Stomach, Diagnosed in 2005-2015
Louisiana Tumor Registry
The rate is not statistically significantly different from Louisiana.
Risk Factors2
• Sex, Age, Race/ethnicity• Overweight, obese• Tobacco use• Geography• Genetic conditions: Type A blood, Li-
Fraumeni syndrome, Lynch Syndrome, etc.
• Family history of first-relative stomachcancer
• Previous stomach surgeries• Inherited gene defects of BRCA1 and
BRCA2• Vitamin B12 deficiency• Diet low in fruits and vegetables, high in
salted or smoked foods, high in poorly stored or prepared foods, or high in pickled vegetables
• Common Variable Immune Deficiency(CVID)
• Exposure to nitrates and nitrites• Exposure to radiation• Occupational environment of rubber or coal
industry
The census tract does not meet the requirements (population count > 20,000 and case count ≥ 16 for the 2005-2015 combined data) for publication of cancer incidence data, which is a restriction in state law that is in compliance with HIPAA rules and the standard of United States Cancer Statistics.
1Average annual age-adjusted (2000 US) incidence rates2American Cancer Society, Cancer Facts & Figures 2019; American Cancer Society, www.cancer.org/cancer.html; National Cancer Institute, www.cancer.gov.
54