Embed Size (px)
Citation preview

International Journal of Economics, Finance and Management Sciences 2015; 3(5): 473-482
Published online October 8, 2015 (http://www.sciencepublishinggroup.com/j/ijefm)
doi: 10.11648/j.ijefm.20150305.19
ISSN: 2326-9553 (Print); ISSN: 2326-9561 (Online)
Fighting Organized Crime in Mexico: 2006-2012
Gerardo Reyes Guzmán1, Ignacio Ibarra López
2, Ariel Alcantara Eguren
3
1Centro de Estudios de Desarrollo Regional, Colegio de Tlaxcala, Tlaxcala, Mexico 2Centro de Estudios Políticosy Sociales, Colegio de Tlaxcala, Tlaxcala, Mexico 3Departamento de Ciencias de la Salud, Universidad Iberoamericana Puebla, Puebla, Mexico
Email address: [email protected] (G. R. Guzmán), [email protected] (I. I. López), [email protected] (A. A. Eguren)
To cite this article: Gerardo Reyes Guzmán, Ignacio Ibarra López, Ariel Alcantara Eguren. Fighting Organized Crime in Mexico: 2006-2012. International Journal of Economics, Finance and Management Sciences. Vol. 3, No. 5, 2015, pp. 473-482. doi: 10.11648/j.ijefm.20150305.19
Abstract: According to the former president Felipe Calderon, the National Security Strategy, designed to overcome violence
related with organized crime, made progress by the end of his Administration and improved security as a whole. This article
sets two hypothesis based on Calderon’s statement: the more money invested in security, the lower the rate of homicides and
the higher the rate of homicides the lower Economic prosperity. We proved these hypotheses by comparing the rate of
homicides during President Calderon with those computed by former president Ernesto Zedillo and Vicente Fox. Our finding
show that President Calderon invested in security a lot more than his predecessors, but could not reduce the rate of homicides.
At the end of his presidency, the country became more violent but more prosperous as well.
Keywords: Federal Expenditure Budget, Security, Homicides, GDP per Head
1. Introduction
The problem of violence in Mexico between 2006 and
2012, has been already addressed by several authors (Astorga,
2012; Paoli, 2010; Buscaglia, 2013; Dillsk, et al, 2008;
Scherer, 2012, Ravelo, Coss, 2011, 2012; Reveles, 2012,
Villalobos, 2012 ). For instance, Alejandro Poire, Calderon’s
former Interior Secretary, pointed out that violence in Mexico
was concentrated in 73 municipalities, being the North the
most dangerous region. Poiré assured the National Press that
the Government Program to fight insecurity was making
progress because homicides were subsiding. The number of
homicides as a whole spiked from 2007 on, reaching its
highest peak in November 2008. Homicides in Mexico
ranked as the tenth cause of death in 2006 but they jumped to
the seventh place in 2012. That was the result of severe
clashes among drug cartels, disputing geographical zones of
influence. These confrontations took place mainly in the
northern part of the country. Poire stated that by the end of
2010, the trend of homicides started to fall. From 2006 to
2010, 50% of homicides occurred in three Mexican Federal
States: Chihuahua (29%), Sinaloa (13%) and Guerrero (8%).
By 2010, 70% of the homicides occurred in 7 Federal
Mexican States: Chihuahua (29%); Sinaloa (12%);
Tamaulipas (8%); Guerrero (7%); Durango (7%); Mexico
(4%) and Nuevo León (4%).
The former President Felipe Calderon Hinojosa published
a book in 2014 in which he explains the tenets and goals of
his National Security Strategy (NSS). He recognizes that the
NSS was not finished, but it had managed to turn down the
high levels of insecurity prevailing when he took office in
2006. By the end of his administration, organized crime was
losing grip, as his Government became even stronger
(Calderon, 2014: 72).
We can derive two hypothesis from Calderon’s statement.
He believed that by reinforcing public forces through more
money, insecurity – in terms of homicides- would subside.
Organized crime was not only causing violence, but it was
also obstructing economic progress by deteriorating business
climate. Thus, the following questions arise: what was the
cost of his NSS in terms of public expenditure? How efficient
was the NSS in terms of homicides reduction? and how did
violence affect the economic progress in terms of GDP per
head? To prove the hypotheses and answer these questions,
we divided the present paper into three sections. The first part
summarizes the tenets of Calderon’s NSS, focusing on those
Federal States in which violence high rocketed. The second
section analyses the Federal Budget Expenditures (FBE) to
estimate the costs of the NSS in the public finances in
relative and absolute terms. In this part, we make emphasis in
the performance of the Security Ministry (Secretaría de Seguridad Pública). In the third section, we will correlate

474 Gerardo Reyes Guzmán et al.: Fighting Organized Crime in Mexico: 2006-2012
security expenditure vs homicides to prove if more resources
available for public security managed to sink the rate
homicides. We also prove here whether violence deteriorated
the levels of wealth in terms of GDP per head. We compare
three Presidential Administrations in Mexico: Ernesto Zedillo
Ponce de León (EZP) 1994-2000; Vicente Fox Quezada
(VFQ) 2000-2006 and Felipe Calderon Hinojosa (FCH)
2006-2012. At the end, we summarize the most important
findings and draw some conclusions.
2. National Security Strategy (NSS)
Felipe Calderón published a book in 2014 in which he
presents the NSS as one of the key policies of his
Government. The NSS aimed at providing Mexican families
with that security status taken away by organized crime. It
pursue to reestablish law and order by fighting impunity and
rebuilding social network. Calderón never declared war
against organized crime, nor began a crusade against drug
consumption or drug trafficking. On the contrary, he made
several drugs legal for nonprofit purposes.
According to Calderon, organized crime evolves from a
first stage by which it focuses on illicit trade - like smuggling,
prostitution, human trafficking, trafficking of migrants, sale
of prohibited substances, stolen merchandise, piracy,
gambling, etc.- into a second stage, by which organized
crime sieges the community and makes profit out of extortion,
kidnapping, etc. The mob reaps big gains out of intimidation
and pursues to monopolize legal trade through violence and
eradication of all sorts of competition. Extortion starts by
victimizing all those economic agents that move outside the
law. They are the most vulnerable since their businesses are
illegal and therefore they cannot resort justice so settle
disputes. Calderon points out that when the rule of law
prevails, those who break the law are brought to justice, but
when that doesn’t happen, normal citizens are helpless and
the government fails to provide safety. Six factors can
explain the outbreak of violence in Mexico (Calderon,
2014:30):
a) The neighborhood with the USA. Because the Caribbean
route to transport drugs from South America to the USA
derailed through security forces, the Mexican-American
border emerged as a surrogate to smuggle drugs into the
US.
b) The transition from drug trafficking into small-scale drug dealing, (Mexico evolved from being a net exporter to become a consumer). This has to do with
the increase of income per head in Mexico and the
advent of a profitable internal market for drugs. For
instance, the consumption of cocaine among youngsters
between 12 and 17 years old in Mexico augmented
from 0.2% in 2002 to 0.4% in 2008 and it remained so
until 2011. Marihuana went from 0.5% in 2002 to 1.2%
in 2008 and 1.3% in 2011, whereas the usage of other
drugs rose from 0.8% to 1.7% and back to 1.6% during
the same period. Calderon explains that drug trafficking
and drug dealing are two different businesses. Drug
trafficking consist on setting up the logistics and
transportation to place illegal substances in the US
market; while drug dealing seeks to expand influence
zones and expel competitors through violence.
c) The clashes among drug cartels. This has to do with
Mexico becoming a drug consuming country and with
different criminal groups becoming suppliers. They
start in a small neighborhood and growth steadily until
they reign up on a region within or through Federal
states. Whereas drug traffickers use routes from south
to north and rarely encounter with each other, drug
dealers necessarily collide with each other, creating a
state of conflict and violence.
d) Corruption. Eventually authorities have to deal with the
problem, but they step back after thugs bribe them or
intimidate them. The increasing number of murders in
Mexico is a consequence of territorial disputes. This
became evident as the Cartel del Pacífico and the
Cartel de Juarez split in 2004. In this year, the Cartel del Pacífico started a war against the Zetas. Homicides
rose vigorously in the Federal States of Chihuahua,
Durango and Sinaloa.
e) The availability of US automatic weapons. Calderon
attributes the spike of homicides after 2004 in Mexico
to the derogation of a US law that prohibited the trade
of assault weapons in 2004. After that, it became easy
to purchase automatic weapons in the US market. The
government found that 85% of the 160,000 weapons
confiscated between 2006 a 2012, were acquired in the
USA. In 2011, there were 8,000 gun shops located near
the Mexican-American border. It is proven that the
availability of weapons in a community, -either because
of warfare, guerrilla or civil war- stirs up homicides and
remains so for a while once the conflict has concluded.
f) Demography. As small-size drug businesses started to
grow, the recruiting process expanded. That took place
simultaneously with the urbanization. Increasing
population demanded public services, including security.
In the midst of the XX Century, 26 million Mexicans
lived in urban areas; in 2010, there were already 77.5
million people living in cities. It emerged a growing
deficit of employment, entertainment and education.
Organized crime lured young people looking for job
opportunities, while Calderon’s government failed to
provide enough employment. There is an inverse
relationship between economic growth and the rate of
crime in Mexico. For instance, by a GDP contraction of
-7.5% in 1994, robbery rate spiked by 56.4%.
Calderon recalls a particular case of violence in the US
during the 90´s. At that time, the rate of homicides suddenly
plunged, thanks to the strengthening of security forces,
mainly through a large number of police officers working in
the streets. Calderón implemented the same model in Ciudad
Juarez, Tijuana and Monterrey, but not in Guerrero,
Tamaulipas and Durango. The NSS had three main objectives:
a) to bring criminals to justice b) to strength and clean policy
departments and c) to rebuild the social network.

International Journal of Economics, Finance and Management Sciences 2015; 3(5): 473-482 475
a) The government conducted Special operations when
local authorities requested it; this intervention aimed at
bringing back law and order, and had a temporally
character. The federal government sent its elite unites of
the Mexican Army, Navy and Federal Police. There
were exceptions like in the case of Chihuahua,
Tamaulipas and Veracruz, where the Federal forces took
control of the whole security issues. The main task was
to dislodge illegal trade operations including drugs,
weapons and corruption among local authorities.
Furthermore, the law against money laundry impaired
banking operations among criminal groups. Progress
was achieved in several areas: leaders of organized
crime were incarcerated (24 out of the 37 most wanted
criminals in 2009 were in jail in 2012 and 540 were
extradited to the USA) and drug shipments as well as
drug precursors were seized; vehicles, weapons and
money were confiscated. In these operations, the Navy
was a key factor. For instance, in Mexico City, federal
authorities seized 205 million USD cash; confiscated 23
tons of cocaine in the port of Manzanillo and snatched
314 small, 113 light weapons, a rocket launcher and
287 hand grenades in Reynosa and Tamaulipas.
Authorities seized such an amount of drugs including
cocaine, heroin and marihuana, that it would have been
possible to supply every young Mexican between 12
and 25 years old with more than 2,000 doses with it.
Criminality diminished in those states where local
authorities cooperated with Federal Security Forces and
by which new members were hired. That was the case
of Baja California up 2008 as well as Chihuahua and
Nuevo León up 2010. In other states, only short term
progress could be achieved, because once the Federal
forces withdrew, criminality rebounded. That was the
case of Guerrero, Tamaulipas and Michoacán. Calderón
emphasized that unless Security forces are reshaped,
criminality will continue thriving because it is well
known that criminals operate under the protection of
long existing justice structure.
b) Calderón initiated his NSS with a new Federal Police. A
new bill entitled the Security forces to carry on
investigations to preempt criminal acts. By the time
Calderon started his Administration, there was 6,000
members of the police with bad reputation. The former
Federal Agency of Investigation (AFI) was removed
and a brand new Public Security staff was set and
equipped with the most modern Technological tools,
software and facilities (Sistema Único de Información Criminal). By the end of 2012, 7,000 out of the new
36,000 members of the police were College graduated.
The new Public Security also hired professionals and
scientists: engineers, detectives, psychologists,
biologists, expert services, programmers, lawyers,
computer experts, etc. The new police force introduced
a brand new system of criminal data to trace suspects
and lawbreakers. By the end of 2012, this unit had
stored more than 500 million data. Mexican Security
Forces were - in terms of technology and facilities - at
the level of the best in its kind worldwide. At the same
time, the NSS launched a policy to fight kidnappings.
Thank to this program, the people who set the Casino
Royal - located in Monterrey 2011- in fire were spotted
and captured. The Federal Government handed
governors of conflict regions 67 bn MXN to modernize
their local Public Security forces. The Mexican Army
acquired planes, armoured vehicles, vessels, logistics,
etc1. Members of the Mexican Army got better salary,
mortgages, and scholarships for their children, as well
as insurance for the families of those fallen in combat.
c) Criminality evolves in three stages: predatory, parasitic
and symbiotic. In the first stage, gangs operate but they
are not able to subdue local authorities; in the second
one, criminals can bribe officials and mingle in politics
and in the third one, criminals acquire so much power
that they already occupy positions in government and
make political decisions. Such stage unfolded in the
state of Michoacán. Criminal groups had expanded
throughout the territory before Calderon took office. In
spite of the efforts to eradicate crime, made by his
predecessor Vicente Fox, criminality did not subside. In
2003, criminal groups were operating in 50
municipalities; three years later, they had already
expanded in 276 municipalities. Criminals had managed
to corrupt local authorities including police, judges and
governors. Lack of opportunities in the labor market for
youngsters combined with situations of poverty and
marginality seemed to be fostering criminality. Thus,
the government set networks composed by citizens to
detect and denounce criminal activities and delinquents.
Furthermore, several programs were implemented to
strengthen communities; among the most famous ones
was Limpiemos México and Todos Somos Juárez. The
government invested 5 bn MXN in Todos Somos Juárez;
74% of the money was designated to support different
projects including medical care, education, sports, and
social development. Furthermore, Todos Somos Juárez supported the jobless, offered scholarships, financed
facilities for education, sport and recreation, and it
enrolled 21,808 families in Oportunidades, a public
program to help the rather poor. This program managed
to sink the number of homicides in Chihuahua by 90%
from 2010 to 2012. The Federal Government
implemented Todos Somos Juárez in Chihuahua and its
municipalities. It turned out to be very successful.
Public spending for crime prevention in Federal States
and municipalities increased twice from 2010 to 2012,
favoring the States of Chihuahua, Guerrero, Michoacán,
1 The Mexican Army acquired a G36, a German machine gun from Heckler &
Koch for several millions euros. However, since German government prohibits
the sell of guns to countries who violet human rights, Hecker & Koch provided
the Mexican Army with know-how, means of productions and inputs, so that
Mexico could produce its own machine guns. In 2006, the Mexican Army proudly
presented a FX05 machine gun as its own. However, it is a version of the original
G36. (Die Zeit, 18 Juni, 2015: 22).
476 Gerardo Reyes Guzmán et al.: Fighting Organized Crime in Mexico: 2006-2012
Nuevo León, Tamaulipas and Veracruz.
3. Federal Expenditure in Security VS
Homicides
Five key areas computed its largest annual rate of growth
between 2006 and 2012 in the Mexican Federal Expenditure
Budget: 1. Provisions for salaries and fringe benefits (589%);
2. Interior Ministry: (500%); 3. Security: (437%); 4. Tourism:
(410%) and 5. Social Development: (319%). Interior
Ministry as well as Security were directly related with Mr.
Calderon’s NSS.
Table 1 shows the share of security areas in the Federal
Budget Expenditure (FBE) in 2000, 2006 and 2012. We must
realize that from 2000 to 2006, Vicente Fox Quezada (VFQ)
run the country and Mr. Calderon was his successor being in
office from 2006 to 2012. The last two columns in the right
indicate the percentage change in the given periods. In time
of VFQ from 2000 to 2006, total Security Expenditure
increased by 26.34%. The main areas of the Security,
measured by its rate of growth, were the Judicial Power
(151%); followed by General Attorney (69.96%) and Police
(40%) in the third place. However, we can also see that
Security Expenditure (SE), diminished by -25.8% and -27.6%
as a share of the FBE and GDP respectively. Conversely,
during the Presidency of Felipe Calderón Hinojosa (FCH),
Security Expenditure increase by 98%. The most favored
areas were Interior Ministry and Police by 313% and 261%
each. The Navy and Army increased as well by almost 77%
percentage respectively. Thus, if SE as a share of the Federal
Expenditure Budget dropped by -25.8% from 2000 to 2006,
it rebounded vigorously by 56.8% with FCH.
Table 1. Security Expenditure as a share of the Federal Expenditure Budget (USD).
2000 2006 2012 2000-2006 (%) 2006-2012 (%)
GDP (trn USD) 0.57 0.95 1.17 65.60 23.74
Federal Budget Expenditure (FBE) (bn USD) 96.98 165.28 209.2 70.43 26.58
Total Security Expenditure (SE) (bn USD) 5.95 7.52 14.95 26.34 98.56
Interior Ministry 0.98 0.43 1.79 -56.10 313.30
Army 2.15 2.38 4.22 10.70 76.91
Public Security (Police) 0.60 0.85 3.07 40.64 261.96
Navy 0.84 0.83 1.49 -0.27 77.85
General Attorney 0.51 0.87 1.13 69.96 29.24
Judicial Power 0.85 2.14 3.23 151.26 50.77
SE as a share of FBE (%) 6.15 4.56 7.15 -25.87 56.86
FBE as a share of GDP (%) 16.88 15.06 17.77 -10.80 18.02
SE as a share of GDP (%) 1.09 0.79 1.27 -27.69 60.46
Source: PEF (Secretaría de Hacienda y Credito Público, 2012).
Source: PFE
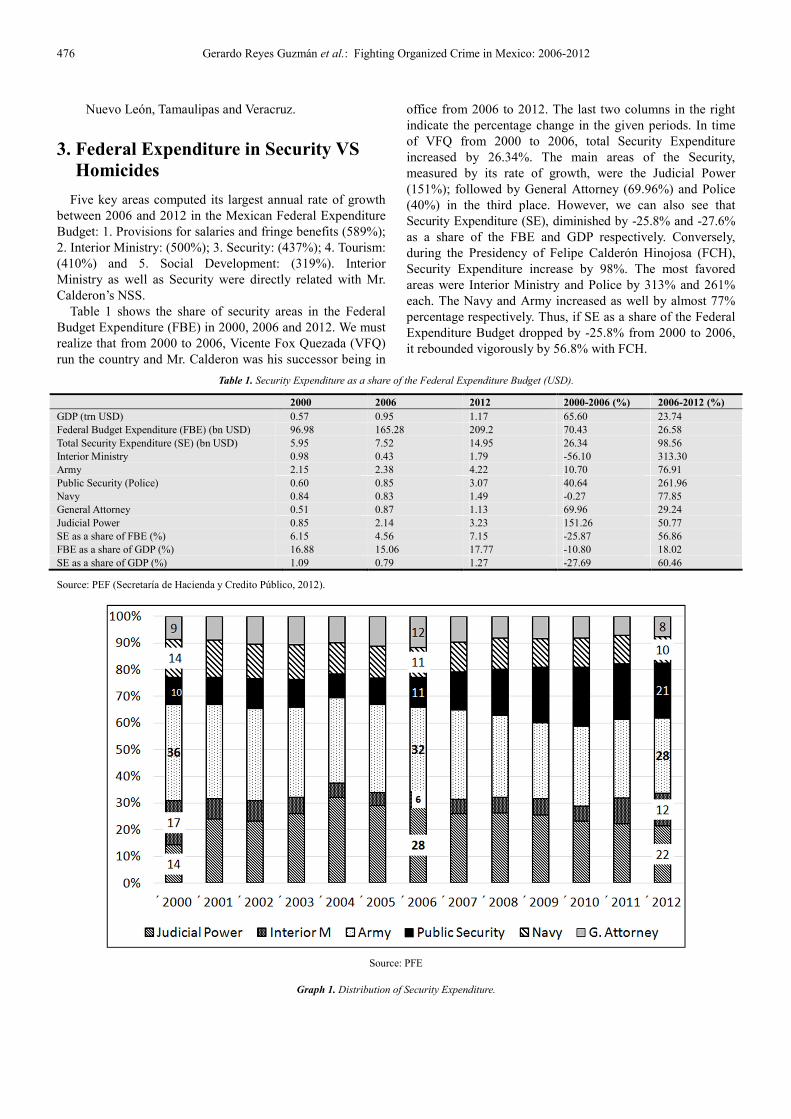
Graph 1. Distribution of Security Expenditure.

International Journal of Economics, Finance and Management Sciences 2015; 3(5): 473-482 477
Graph 1 represents the distribution of SE from 2000 to
2012. By VFQ (2000-2006) only Judicial Power and
General Attorney increased from 14% and 9% in 2000 to 28%
and 12% respectively; whereas the rest of the SE
components sank. Conversely, by FCH Judicial Power,
Army, Navy and General Attorney dropped from 28%, 32%,
11% and 12% in 2006 to 22%, 28%, 10% and 8% in 2012.
The most favored components of SE in relative terms were
again the Interior Ministry and Public Security. Both
increased from 6% and 11% each in 2006 to 12% and 21%
each in 2012 respectively. By the end of FCH’s
Administration, these two components absorbed more than
one third of the SE. Since Public Security was in charge of
the penitentiary system, we can mention that the numbers of
prisoners increased from 210,140 in 2006 to 242,754 in
2012, while the number of jails shrank from 454 to 420
during the same time span. The construction of new jails
could not keep pace with the increasing number of prisoners
in spite of the whopping budget for security. Bergman y
Azola, (2007: 81) point out that the poor infrastructure and
the lack of trained personnel led to a high rate of impunity.
Police jailed poor people for minor crimes. Furthermore,
along the Calderon Administration, hundreds of convicts
fled from Federal jails, due to the high levels of corruption
and two Directors of the Interior Ministry died under
dubious circumstances (Camilo Muriño in 2008 and
Francisco Blake Mora in 2011).
Source: Author´s elaboration based on SSP and SHCP data.
Graph 2. Security Expenditure and Homicides.
Source: Author’s elaboration based on SSP and SHCP data.
Graph 3. Detention of Criminal leader vs Homicides.
4. Public Expenditure, Homicides and
Wealth
As we can see from graph 2, SE had been growing
permanently. On the other hand, homicides per million
people reached a peak of 5280 in 1993 and began to sink
reaching its lowest level in 2007 with 2605 homicides per
million people. From that year on, they rebounded until they
reached a record of 8092 homicides per million in 2010. This
means that, as SE increased, so did the number of homicides.
Graph 3 shows the relationship between criminal leaders
captured by the authorities and the number of homicides.
Before 2007, homicides were diminishing and the number of
criminal leaders detained by the police was no more than
three per year. After 2007, the number of jailed leaders
augmented, but so did the number of homicides.
Being aware that the number of observations is rather
small, we want to determine the influence of SE and
detentions (DE) in homicides by using the following multiple
correlation model:
Y = β0 + β1X1+β2X2+ε
Where Y is the dependent variable representing homicides;
β0 stands for the intercept, β1 is the first independent variable
and stands for the Security Expenditure (SE) and β2 is the
second independent variable and represents the number of
criminal leaders captured by Federal forces (DE). The model
was applied in three different intervals: 1990-1999; 2000-
2005 and 2006-20012. The results can be seen in table 2:

478 Gerardo Reyes Guzmán et al.: Fighting Organized Crime in Mexico: 2006-2012
Table 2. Homicides, Expenditure and Criminal leader detentions.
Period Model Rsq
1990-1999 Homicides= 5614 -0.0001957 (SE) -272.16 (DE) 0.22
2000-2005 Homicides = 4481.50-0.0002364 (SE) +29.71 (DE) 0.24
2006-2012 Homicides=-2523.46+0.0005881(SE)+ 364.09 (DE) 0.90
Source: Calculation on SSP data and local Press.
From 1990 to 1999 there was a negative relationship
between Security Expenditure and homicides. Thus, for every
10,000 USD spent in security, homicides dropped by -1.9 and
for every criminal captured by authorities, homicides
diminished by 272.16. However, since R-sq is only 22%, this
conclusion is still very weak. During the Administration of
Vicente Fox, for every 10,000 USD spent in security,
homicides shrank by -2.3 and for every criminal brought to
justice by police forces, homicides increased by 29.71. This
conclusion is also weak, since R-sq is 24%. Conversely, as
Mr Calderon was in office and implemented his NSS, for
every 10,000 USD spent in SE, homicides increased by 5.8
and for every criminal leader put in jail, homicides increased
by 364. This time R-sq is 90%, which is very strong and
significant. That means, that his NSS based on financing
military and police as well as the incarceration of mob
leaders led to more homicides and therefore to more
insecurity.
Now let’s look at the territory as whole in three historical
moments to see how insecurity evolved in Mexico. Map2 1
shows the evolution of violence in three Presidential periods:
Ernesto Zedillo Ponce de León (EZP): 1994-2000, Vicente
Fox Quezada (VFQ): 2000-2006 and Felipe Calderon
Hinojosa (FCH): 2006-2012. As we can see there are five
average ranking levels of violence per year, each represents
the average annual rate of homicides per million people using
a black white color graduation: high (black): 1000-2000;
light black: 400-1000; grey: 200-400; light grey: 100-200 and
white: 40-100. By EZP, violence focuses in the North Region
at light black levels being the states of Chihuahua, Sinaloa
and Baja California Norte the most violent. With an akin
level scores the Southern region, by which Michoacán,
Guerrero and Oaxaca come up as the most violent. Coahuila,
Zacatecas, Aguascalientes, Guanajuato, Querétaro, Veracruz,
Hidalgo, Nuevo León, Tabasco, Yucatán and Quitana Roo
were peaceful states. Durango, Tamaulipas, San Luis Potosí,
Puebla, State of Mexico, Morelos, Jalisco, Nayarit, Colima,
Campeche and Chiapas appear in grey color. Secondly, by
VFQ the country became more peaceful. The states that
showed a light black color in the first period are now grey,
except for Guerrero, which remains light black. Jalisco and
Colima, Chiapas, Chetumal, Tamaulipas and San Luis Potosí
turn white; that means, more peaceful. Finally, by FCH,
violence spreads all over the country. Chihuahua turned high
black, followed by Durango and Sinaloa, forming what is
known as the Golden Triangle of drug trafficking. Nuevo
León and Tamaulipas turned light black and Guerrero turned
2 To see the names of the 32 Mexican Federal States, please see the Map 3 at the
Appendix.
high black as well. The only states in white (peaceful), are:
Aguascalientes, Guanajuato, Querétaro, México City, Puebla,
Veracruz, Tabasco, Chiapas, Campeche and Yucatan.
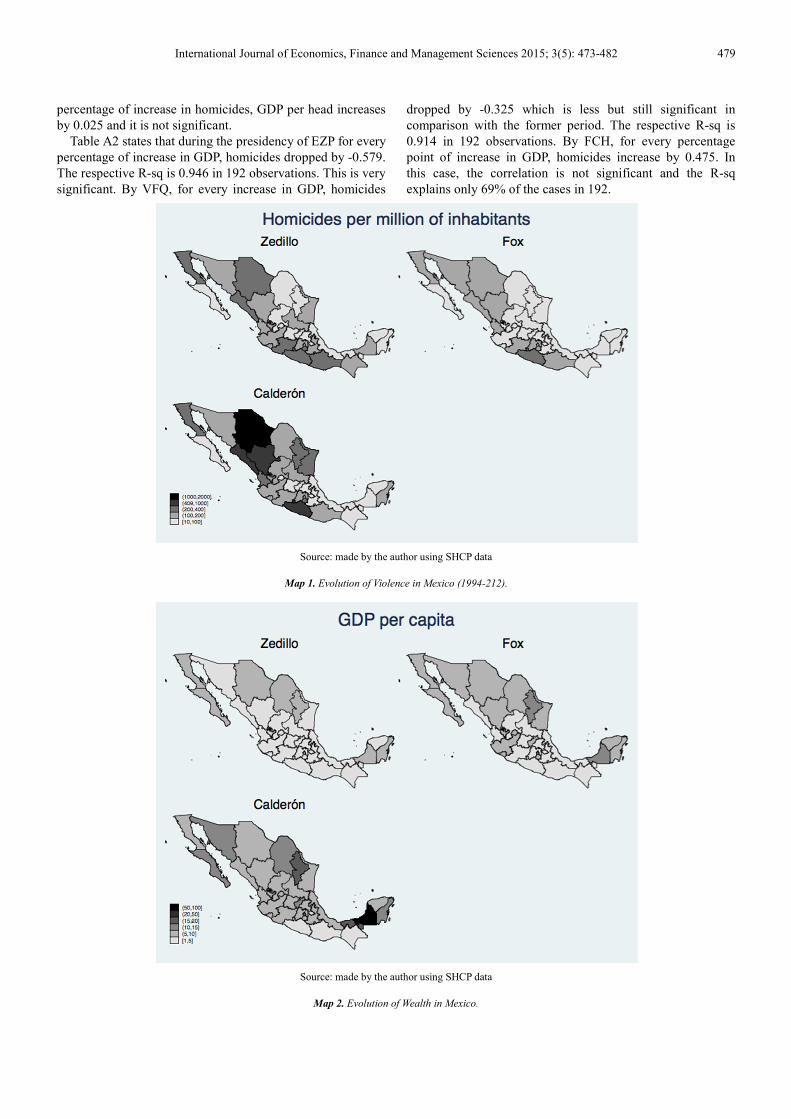
Map 2 shows changes in GDP per head during the same
periods. This time, the darker the color, the higher the level
of wealth in terms of GDP per head. The richest entities by
Zedillo are located in the North; they are Baja California
Norte, Baja California Sur, Chihuahua, Coahuila and Nuevo
Leon. Campeche and Quintana Roo, hosting oil industry and
tourism respectively, jump as the wealthiest states in the
South. During the presidency of VFQ, we observe an
increase in the GDP per head in the country. The wealthy
North expands and becomes more prosperous, including now
the states of Sonora, Durango and Tamaulipas. Nuevo León
emerges as the wealthiest of them. In the South Campeche
and Quitana Roo remained as wealthy states, but this time
Yucatan shows an increase of GDP per head as well. This
betterment includes also the states of the center: Jalisco,
Durango, Colima, Querétaro and Mexico City. By VFQ,
Nuevo Leon and Campeche turned to be the richest states in
Mexico. This has to do with a strong development of
manufacturing and oil industry respectively. Finally, by FCH,
the whole country gets better, except for three states:
Guerrero, Oaxaca and Chiapas. The wealthiest state was
Campeche followed by Nuevo León and Querétaro. This was
already a characteristic of the former period and can be
explained by the high oil prices and a relative stable
economic growth, except for the 2009 Economic downturn,
which was a worldwide phenomenon.
Once we saw the evolution of homicides and GDP along
the three periods, we pose two hypotheses: the high rate of
homicides deteriorates business conditions leading to less
productivity and hence to a lower GDP per head. The second
hypothesis poses the opposite statement: The reduction in the
levels of wealth in terms of GDP per head leads to more
violence. To prove these hypotheses we will use the
following econometric models:
ln (GDP)it= β 0+ β 1 ln (Homicides)it+ γ Z + eit
ln ( Homicides)it= α 0+ α 1 ln (GDP )it+ ϕ Z + uit
i= {1,2,. .. ,31}; k= {1999,2000,. .. ,2012}
Where (GDP)it is the logarithm of GDP per head in the
federal state i for the year t. ln(Homicides)it is the logarithm
of the number of homicides per million i for the year t. The
results of the first and second hypothesis can be read in tables
A1 and A2 at the Appendix.
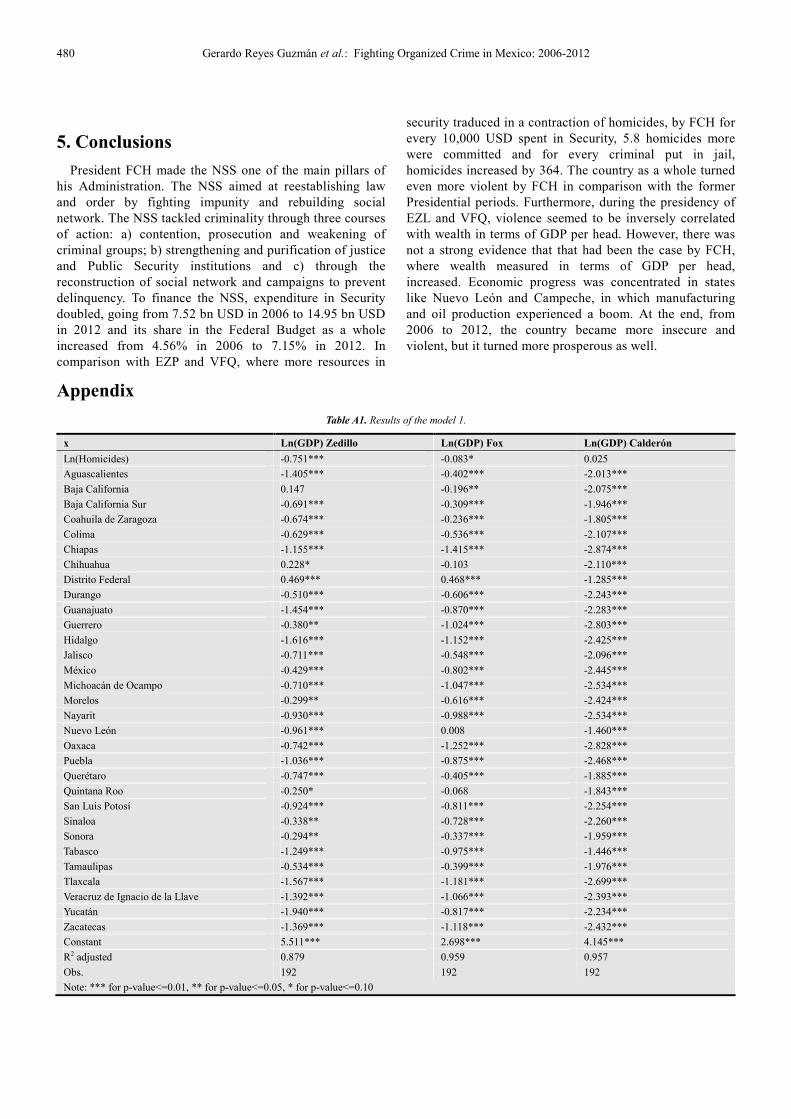
Table A1 shows that during the President EZP we find a
significant correlation, so that for every percentage point of
increase in homicides, GDP per head drops by -0.751. The
respective R-sq is 0.879, which is high among 192
observations. By VFQ, for every percentage point of increase
in homicides, GDP per head drops by -0.083. This is less than
the former period but still significant. The respective R-sq is
0.952, which is high in 192 observations. By FCH for every
International Journal of Economics, Finance and Management Sciences 2015; 3(5): 473-482 479
percentage of increase in homicides, GDP per head increases
by 0.025 and it is not significant.
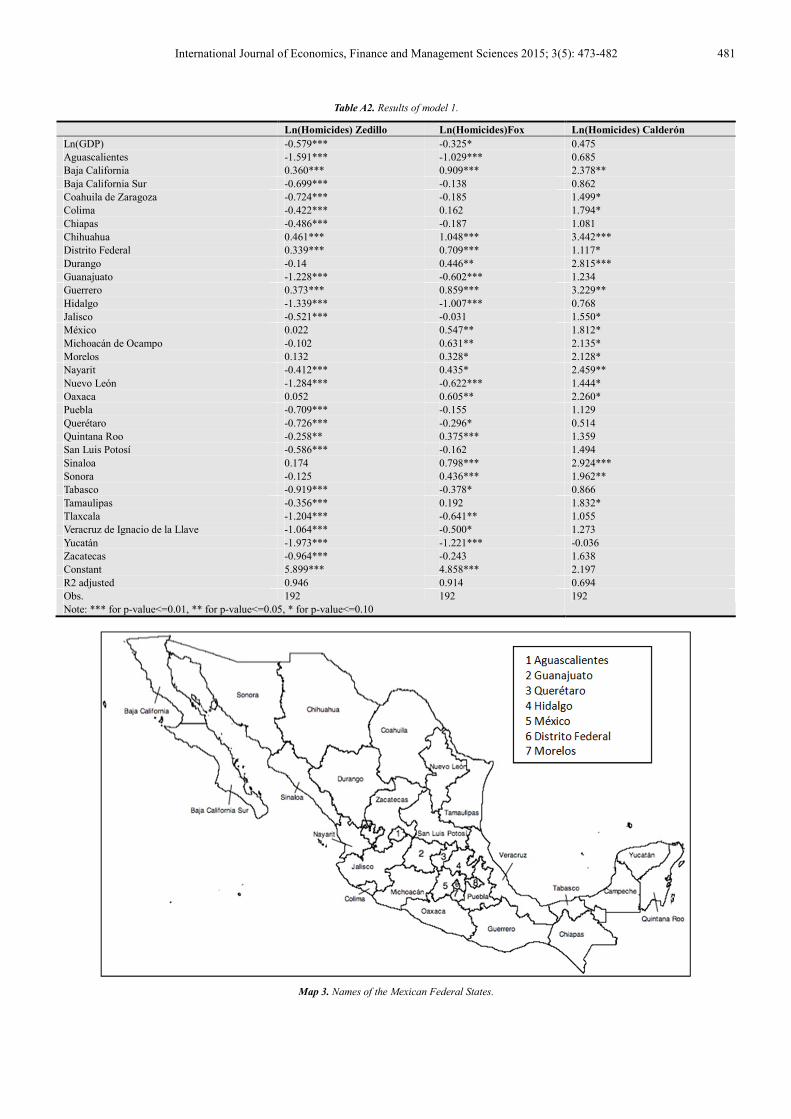
Table A2 states that during the presidency of EZP for every
percentage of increase in GDP, homicides dropped by -0.579.
The respective R-sq is 0.946 in 192 observations. This is very
significant. By VFQ, for every increase in GDP, homicides
dropped by -0.325 which is less but still significant in
comparison with the former period. The respective R-sq is
0.914 in 192 observations. By FCH, for every percentage
point of increase in GDP, homicides increase by 0.475. In
this case, the correlation is not significant and the R-sq
explains only 69% of the cases in 192.
Source: made by the author using SHCP data
Map 1. Evolution of Violence in Mexico (1994-212).
Source: made by the author using SHCP data
Map 2. Evolution of Wealth in Mexico.
480 Gerardo Reyes Guzmán et al.: Fighting Organized Crime in Mexico: 2006-2012
5. Conclusions
President FCH made the NSS one of the main pillars of
his Administration. The NSS aimed at reestablishing law
and order by fighting impunity and rebuilding social
network. The NSS tackled criminality through three courses
of action: a) contention, prosecution and weakening of
criminal groups; b) strengthening and purification of justice
and Public Security institutions and c) through the
reconstruction of social network and campaigns to prevent
delinquency. To finance the NSS, expenditure in Security
doubled, going from 7.52 bn USD in 2006 to 14.95 bn USD
in 2012 and its share in the Federal Budget as a whole
increased from 4.56% in 2006 to 7.15% in 2012. In
comparison with EZP and VFQ, where more resources in
security traduced in a contraction of homicides, by FCH for
every 10,000 USD spent in Security, 5.8 homicides more
were committed and for every criminal put in jail,
homicides increased by 364. The country as a whole turned
even more violent by FCH in comparison with the former
Presidential periods. Furthermore, during the presidency of
EZL and VFQ, violence seemed to be inversely correlated
with wealth in terms of GDP per head. However, there was
not a strong evidence that that had been the case by FCH,
where wealth measured in terms of GDP per head,
increased. Economic progress was concentrated in states
like Nuevo León and Campeche, in which manufacturing
and oil production experienced a boom. At the end, from
2006 to 2012, the country became more insecure and
violent, but it turned more prosperous as well.
Appendix
Table A1. Results of the model 1.
x Ln(GDP) Zedillo Ln(GDP) Fox Ln(GDP) Calderón
Ln(Homicides) -0.751*** -0.083* 0.025
Aguascalientes -1.405*** -0.402*** -2.013***
Baja California 0.147 -0.196** -2.075***
Baja California Sur -0.691*** -0.309*** -1.946***
Coahuila de Zaragoza -0.674*** -0.236*** -1.805***
Colima -0.629*** -0.536*** -2.107***
Chiapas -1.155*** -1.415*** -2.874***
Chihuahua 0.228* -0.103 -2.110***
Distrito Federal 0.469*** 0.468*** -1.285***
Durango -0.510*** -0.606*** -2.243***
Guanajuato -1.454*** -0.870*** -2.283***
Guerrero -0.380** -1.024*** -2.803***
Hidalgo -1.616*** -1.152*** -2.425***
Jalisco -0.711*** -0.548*** -2.096***
México -0.429*** -0.802*** -2.445***
Michoacán de Ocampo -0.710*** -1.047*** -2.534***
Morelos -0.299** -0.616*** -2.424***
Nayarit -0.930*** -0.988*** -2.534***
Nuevo León -0.961*** 0.008 -1.460***
Oaxaca -0.742*** -1.252*** -2.828***
Puebla -1.036*** -0.875*** -2.468***
Querétaro -0.747*** -0.405*** -1.885***
Quintana Roo -0.250* -0.068 -1.843***
San Luis Potosí -0.924*** -0.811*** -2.254***
Sinaloa -0.338** -0.728*** -2.260***
Sonora -0.294** -0.337*** -1.959***
Tabasco -1.249*** -0.975*** -1.446***
Tamaulipas -0.534*** -0.399*** -1.976***
Tlaxcala -1.567*** -1.181*** -2.699***
Veracruz de Ignacio de la Llave -1.392*** -1.066*** -2.393***
Yucatán -1.940*** -0.817*** -2.234***
Zacatecas -1.369*** -1.118*** -2.432***
Constant 5.511*** 2.698*** 4.145***
R2 adjusted 0.879 0.959 0.957
Obs. 192 192 192
Note: *** for p-value<=0.01, ** for p-value<=0.05, * for p-value<=0.10
International Journal of Economics, Finance and Management Sciences 2015; 3(5): 473-482 481
Table A2. Results of model 1.
Ln(Homicides) Zedillo Ln(Homicides)Fox Ln(Homicides) Calderón
Ln(GDP) -0.579*** -0.325* 0.475
Aguascalientes -1.591*** -1.029*** 0.685
Baja California 0.360*** 0.909*** 2.378**
Baja California Sur -0.699*** -0.138 0.862
Coahuila de Zaragoza -0.724*** -0.185 1.499*
Colima -0.422*** 0.162 1.794*
Chiapas -0.486*** -0.187 1.081
Chihuahua 0.461*** 1.048*** 3.442***
Distrito Federal 0.339*** 0.709*** 1.117*
Durango -0.14 0.446** 2.815***
Guanajuato -1.228*** -0.602*** 1.234
Guerrero 0.373*** 0.859*** 3.229**
Hidalgo -1.339*** -1.007*** 0.768
Jalisco -0.521*** -0.031 1.550*
México 0.022 0.547** 1.812*
Michoacán de Ocampo -0.102 0.631** 2.135*
Morelos 0.132 0.328* 2.128*
Nayarit -0.412*** 0.435* 2.459**
Nuevo León -1.284*** -0.622*** 1.444*
Oaxaca 0.052 0.605** 2.260*
Puebla -0.709*** -0.155 1.129
Querétaro -0.726*** -0.296* 0.514
Quintana Roo -0.258** 0.375*** 1.359
San Luis Potosí -0.586*** -0.162 1.494
Sinaloa 0.174 0.798*** 2.924***
Sonora -0.125 0.436*** 1.962**
Tabasco -0.919*** -0.378* 0.866
Tamaulipas -0.356*** 0.192 1.832*
Tlaxcala -1.204*** -0.641** 1.055
Veracruz de Ignacio de la Llave -1.064*** -0.500* 1.273
Yucatán -1.973*** -1.221*** -0.036
Zacatecas -0.964*** -0.243 1.638
Constant 5.899*** 4.858*** 2.197
R2 adjusted 0.946 0.914 0.694
Obs. 192 192 192
Note: *** for p-value<=0.01, ** for p-value<=0.05, * for p-value<=0.10
Map 3. Names of the Mexican Federal States.

482 Gerardo Reyes Guzmán et al.: Fighting Organized Crime in Mexico: 2006-2012
References
[1] Azaola, Elena (Mayo-junio, 2007). Las condiciones de vida en las cárceles mexicanas. Revista Mexicana de Ciencias Políticas y Sociales. Vol. XLIX, No. 200: 87-97.
[2] Astorga, Luis (2012). El siglo de las drogas. El narcotráfico, del porfiriato al nuevo milenio. México: Grijalbo.
[3] Bergman Marcelo y Elena Azaola (Mayo 2007). Cárceles en México. Cuadros de una crisis. Revista Latinoamericana de Seguridad Ciudadana. No. I, Quito: 74-87.
[4] Buscaglia, Edgardo (2013). Vacíos de Poder en México. México: Debate.
[5] Calderón Hinojosa, Felipe (2014). Los retos que enfrentamos. Los problemas de México y las políticas públicas para resolverlos (2006-2012). México: Debate.
[6] Coss Nogueda, Magda (2011). Tráfico de armas en México. México: Grijalbo.
[7] Die Zeit. (2015). Gewehre für den Drogenkrieg. 18, Juni: 22.
[8] Dills, K Angela, Jeffrey A. Miron, Garret Summers (2008). What do economist know about crime. National Bureau of Economic Research. Working Paper 13759, January. http://www.nber.org/papers/w13759.
[9] El Universal (2012). Cronología de fugas masivas de reos en México. 7 de septiembre. http://www.eluniversal.com.mx/notas/870947.html Extraído en julio de 2014.
[10] Gasca Serrano, Leticia y Ricardo Aguilar (Octubre-Noviembre de 2012). Casas para presos. Expansión: 70-78.
[11] INEGI (2014). Mortalidad. Conjunto de Datos: defunciones por homicidios. http://www.inegi.org.mx/sistemas/olap/Proyectos/bd/continuas/mortalidad/DefuncionesHom.asp?s=est&c=28820&proy=mort_dh Extraído en mayo de 2014.
[12] INEGI (2003). Encuesta Nacional de Victimización y Percepción sobre Seguridad Pública (ENVIPE). Tabulados básicos.
[13] Levitt, Steven y Stephen J. Dubner (2005). Freakonomics. New York: Harpen Collins Publishers.
[14] Paoli Bolio, Iván (2010). Evolución del Narcotráfico en México. Documentos de Trabajo 355. Fundación Preciado Hernández A. C.
[15] Poiré, Alejandro (Febrero de 2011). Los homicidios y la violencia del crimen organizado. Una revisión a la tendencia nacional. Nexos: 36-42
[16] Ravelo, Ricardo (2012). Osiel. México. Grijalbo.
[17] Reveles, José (2012). El Cartel incómodo. México. Grijalbo.
[18] SESNSP (2014). Incidencia Delictiva. Estadísticas y Herramientas de Análisis. Disponible en: http://www.estadisticadelictiva.secretariadoejecutivo.gob.mx/mondrian/index_fc.htmlExtraído en mayo de 2014.
[19] Scherer García, Julio (2012). La reina del pacífico. México. Grijalbo.
[20] Sota, Alejandra y Miguel Messchasher (2012). Operativos y Violencia. Vol. 20. Nexos: http://www.nexos.com.mx/?p=15087 Extraído el 28 de junio de 2014.
[21] SHCP (2001-2012). Analíticos presupuestarios. Presupuesto de Egresos de la Federación. Análisis por unidad responsable (ramos).
[22] The Economist (2012). Mexico´s Drug War. No so Fast. 21st January. http://www.economist.com/node/21543183.
[23] SSP (2008). Estrategia Penitenciaria 2008-2012. Subsecretaría del Sistema Penitenciario. Gobierno Federal. http://www.redlece.org/IMG/pdf/Manual_Estrategia_Penitenciaria_MX.pdf Extraído en enero 2014.
[24] Villalobos Joaquín (Enero de 2012). Nuevos mitos de la guerra contra el narco. Nexos: 28-41.


![OPCA Active Status Report [20150305]](https://img.pdfslide.us/doc/110x75/568cacde1a28ab186da94cd4/opca-active-status-report-20150305.jpg)