Embed Size (px)
Citation preview
Fighting Fire with Fire: Modeling the Datacenter-ScaleEffects of Targeted Superlattice Thermal Management
Susmit Biswas?, Mohit Tiwari†, Timothy Sherwood†
Luke Theogarajan‡, Frederic T. Chong†
Lawrence Livermore National Laboratory, Livermore, CA - 94550, USA?
Department of Computer Science, UC Santa Barbara, USA†
Department of Electrical and Computer Engineering, UC Santa Barbara, USA‡
[email protected]?, tiwari, sherwood, [email protected]†, [email protected]‡
ABSTRACTLocal thermal hot-spots in microprocessors lead to worst-
case provisioning of global cooling resources, especially inlarge-scale systems. However, efficiency of cooling solutionsdegrade non-linearly with supply temperature, resulting in highpower consumption and cost in cooling – 50∼100% of ITpower. Recent advances in active cooling techniques haveshown on-chip thermoelectric coolers (TECs) to be very ef-ficient at selectively eliminating small hot-spots, where apply-ing current to a superlattice film deposited between silicon andthe heat spreader results in a Peltier effect that spreads the heatand lowers the temperature of the hot-spot significantly to im-prove chip reliability. In this paper, we propose that hot-spotmitigation using thermoelectric coolers can be used as a powermanagement mechanism to allow global coolers to be provi-sioned for a better worst case temperature leading to substan-tial savings in cooling power.
In order to quantify the potential power savings from us-ing TECs in data center servers, we present a detailed powermodel that integrates on-chip dynamic and leakage power sour-ces, heat diffusion through the entire chip, TEC and globalcooler efficiencies, and all their mutual interactions. Our multi-scale analysis shows that, for a typical data center, TECs al-low global coolers to operate at higher temperatures withoutdegrading chip lifetime, and thus save ∼27% cooling poweron average while providing the same processor reliability as adata center running at 288K.
Categories and Subject DescriptorsB.8.1 [Hardware]: Performance and ReliabilityReliability,
Testing, and Fault-Tolerance; I.6.5 [Computing Methodolo-gies]: SIMULATION AND MODELINGModel Development
General TermsDesign, Management, Reliability, Measurement
KeywordsData center, cooling power, active cooling, TEC
Permission to make digital or hard copies of all or part of this work forpersonal or classroom use is granted without fee provided that copies arenot made or distributed for profit or commercial advantage and that copiesbear this notice and the full citation on the first page. To copy otherwise, torepublish, to post on servers or to redistribute to lists, requires prior specificpermission and/or a fee.ISCA’11, June 4–8, 2011, San Jose, California, USA.Copyright 2011 ACM 978-1-4503-0472-6/11/06 ...$10.00.
1. IntroductionThe running costs of data centers are dominated by the need
to dissipate heat generated by thousands of server machines.Higher temperatures are undesirable as they lead to prematuresilicon wear-out; in fact, mean time to failure has been shownto decrease exponentially with temperature (Black’s law [7]).Although other server resources also generate heat, micropro-cessors still dominate in most server configurations [4] andare also the most vulnerable to wear-out as the feature sizesshrink. Even as processor complexity and technology scalinghas increased the average energy density inside a processor tomaximally tolerable levels, modern microprocessors make ex-tensive use of hardware structures such as the load-store queueand other CAM-based units, and the peak temperatures on chipcan be much worse than even the average temperature of thechip. In recent studies, it has been shown that hot-spots insidea processor can generate ∼800W/cm2 heat flux whereas theaverage heat flux is only 10− 50W/cm2 [36], and due to thisdisparity in heat generation, the temperature in hot spots maybe up to 30C more than average chip temperature.
The key problem processor hot-spots create is that in orderto prevent some critical hardware structures from wearing outfaster, the air conditioners in a data center have to be provi-sioned for worst case requirements. Worse yet, air conditionerefficiencies decrease non-linearly as the desired ambient tem-perature decreases relative to the air outside. As a result, theglobal cooling costs in data centers are directly correlated withthe maximum hot-spot temperatures of processors, and thereis a distinct requirement for a cooling technique to mitigatehot-spots selectively so that the global coolers can operate athigher temperatures while providing the same chip reliability.
We observe that localized cooling via superlattice microre-frigeration presents exactly this opportunity whereby hot-spotscan be cooled selectively, allowing global coolers to operate ata higher temperature with higher efficiency. Recent advancesin processor cooling technologies have demonstrated that ther-moelectric coolers, which use the Peltier effect to form heatpumps, can be used to reduce the temperature of hot spots,and thereby increase the reliability of processors. By placinga thermoelectric cooler layer between the heat spreader andthe processor die, and applying current selectively to the cool-ers over the hot spots, heat from the hot-spots can be spreadmuch more effectively. The ability to implement such ther-moelectric coolers on a real silicon device has been demon-strated recently [11], albeit for small prototype chips. In thispaper, we propose that superlattice coolers can be used for ac-tive cooling power management by mitigating hot-spots and
AC Efficiency
Supply Temp
Total Heat Generated (Load)
CPU Fan
Application Hot Spots
Die Heat Flux TEC Heat Flux
TEC Controller (current applied)
Heat sink Temp
Die Temp
TEC Layer Temp
Heat Spreader Temp
Thermal Paste Temp
TEC Efficiency
Total Power Consumption
(1)
(2)
(3)
(4)
(5)
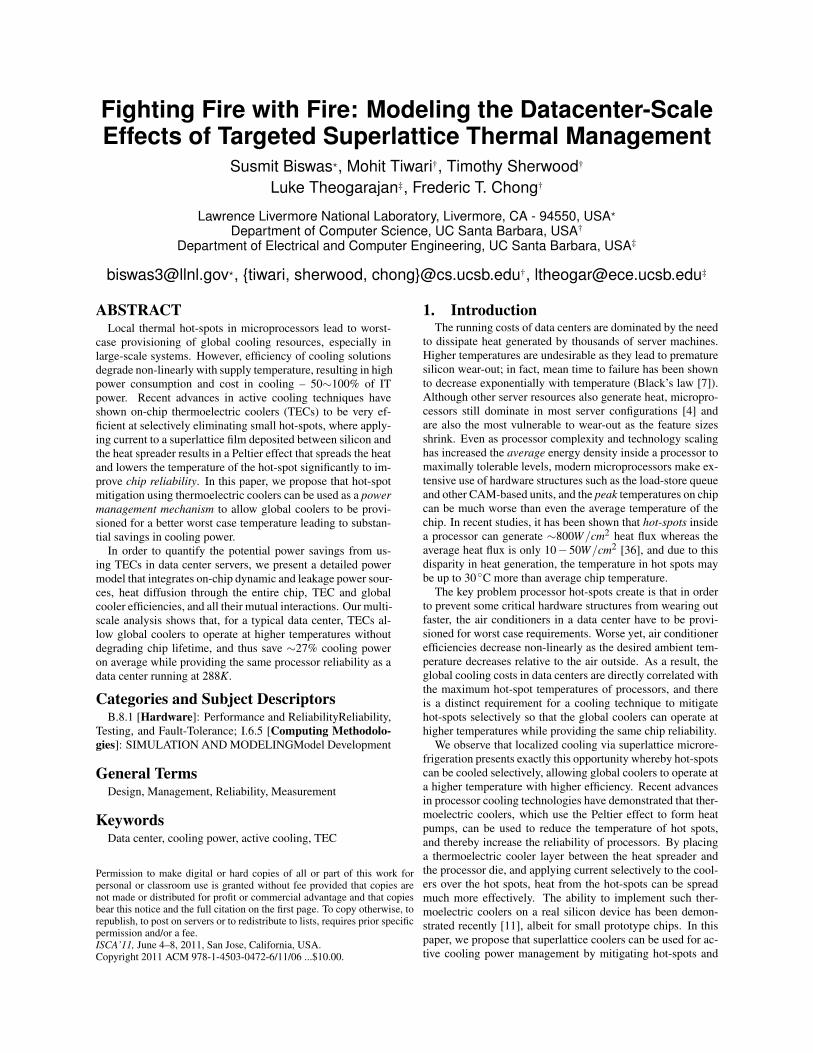
Figure 1: Heat Ecosystem
running the data centers at a higher temperature while attain-ing the same level of chip reliability. Before such thermoelec-tric coolers can be integrated in commodity server processors,we must ask the key question: “What is the potential for su-perlattice microrefrigeration to reduce global cooling costs indata centers?”. In order to answer this question, our researchmakes the following specific contributions:
•We propose to use superlattice thermo-electric coolers (TEC)as an active cooling power management device instead ofas a reliability enhancing device. By mitigating hot-spotsin servers, TEC devices enable global coolers to maintainpower-efficient ambient temperatures, while the TEC keepshot-spots closer to temperatures usually attained through moreaggressive air conditioning.•We present a comprehensive analysis of the impact of ther-
moelectric coolers on global cooling costs. In Figure 1, weshow an overview of the modeled system. Our analysis cov-ers all aspects of cooling a server in a data center, and in-tegrates on-chip dynamic and leakage power sources with adetailed heat diffusion model of a processor (that models thesilicon to the thermoelectric cooler to the heat spreader andthe heat sink) and finally the data-center cooling efficiency.•We find that TEC devices are very effective in spreading
the heat away from hot-spots in a processor, but careful de-sign choices are required to use them as cooling power man-agement mechanism. Evaluating over 43 application phasesfrom SPEC CPU 2000 benchmark suite, we report that byadding an energy efficient TEC layer in chip package and in-creasing the supply air temperature in a data center from atypical temperature of 294K (70F), on average 12% cool-ing power could be saved. In conservative data centers with288K (60F) supply air temperature, (e.g. HPC data cen-ters [1]), we observe ∼27% cooling power savings by run-ning the data center at 297.5K(75.2F) temperature with-out affecting life span of processors. We find that selec-tively activating TECs can be effective for low-efficiencyTEC devices. When using energy-efficient TECs [11], how-ever, more cooling power can be saved by increasing datacenter temperature even higher while switching on all or ma-jority of the TEC blocks.
The remainder of the paper is organized as follows. We mo-tivate this work in Section 2, present an overview of the modelsin Section 3 and further details in Section 4. We describe the
experimental methodology in Section 5, present the results inSection 6, and finally conclude in Section 8.
2. MotivationData centers house thousands of servers for running Inter-
net and high-performance applications. When an applicationexecutes in a processor, often the components in the processordo not get used uniformly, leading to hot-spots in it. The heatfluxes from different segments of a processor differ signifi-cantly, often by an order of magnitude as reported by Chrysler[12]. For example, an average heat flux inside a processor is10−50W/cm2 [36], where as the heat flux in a specific 400µmx 400µm area can be as high as 800W/cm2. Due to this dif-ference in heat flux density, the temperature inside a chip canvary 5C∼ 30C.
In a data center, the cooling subsystem is designed consid-ering the hottest point in the processors. However, a coolingunit operates at low efficiency if the target supply air tempera-ture is low, and requires large amount of power to cool a datacenter. By increasing the temperature of the supply air, thecooling power could be reduced significantly. In a data cen-ter, this results in saving millions of dollars, but running thedata center at a higher temperature can induce higher compo-nent failure, which increases exponentially with the operatingtemperature following Black’s equation [7]. An increase in10C in a component can reduce its lifetime to 1/2 or evenless. Therefore, cooling units in many state of the art data cen-ters (primarily HPC data centers) supply air at 15C (∼ 59F)or lower temperature to the servers [1, 14, 20], though newercommercial data centers supply relatively warm air (∼ 70F)to reduce cooling power at the cost of reduced reliability.
Recent advances in active cooling technology have demon-strated the feasibility of using Peltier-effect-based Thermo-electric Cooling (TEC) [11, 3, 36] devices for eliminating thehot-spots from a processor. A typical TEC device is ∼70µmin thickness [11] and resides between heat spreader and the sil-icon die. Metal contacts are deposited on n and p substrates,which are soldered to electroplated Cu contacts. The otherends of the junctions are connected to power supply to form atransistor-level Peltier micro-cooling device, as shown in Fig-ure 2. TEC blocks are most efficient when their sizes are small(< 100µm a side)[36]. In order to cover a larger hot-spot, acollection of tiles of these coolers can be built as a superlatticeon top of the die as shown in Figure 2. TEC devices have beendemonstrated to have ∼5µs response time [3], which makesthem suitable for rapid cooling of hotspots. While pumpingthe heat out of the die, the flow of current through the super-lattice produces a heating effect (the Joule effect) that adds tothe heat flux, but overall the hot spot temperature and hence thetemperature profile of the die becomes nearly uniform. Thesecoolers are able to sustain heat flux up to 1250W/cm2 [11].By absorbing heat from the areas close to hot-spots, TECs areable to reduce the temperature of the hot-spots on die, improv-ing the mean time to failure (MTTF) of the die.
In this paper, we propose that TEC devices can be used indata centers as a cooling power management mechanism in-stead of a way to enhance reliability. By cooling hot-spotsselectively, a data center can be run at a higher ambient tem-perature and still attain similar hot-spot temperature achiev-able by aggressive air-conditioning, leading to a reduction incooling power without affecting chip life span. We build andintegrate thermal models of different components of a whole
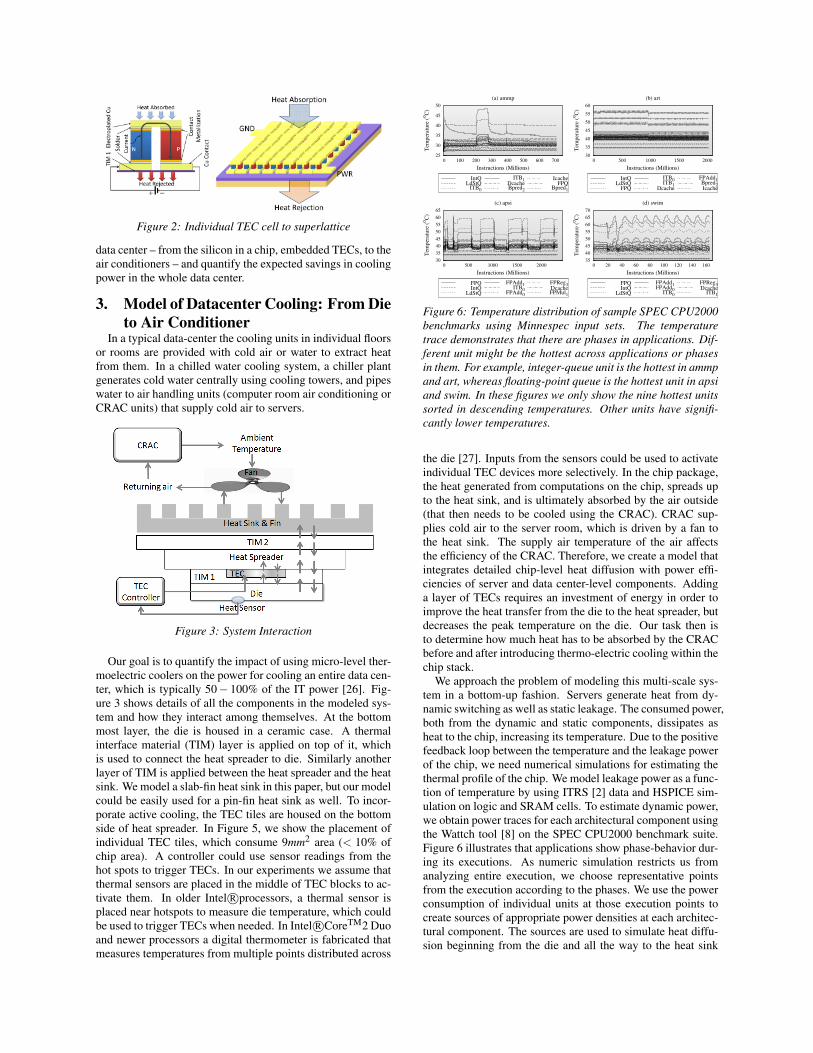
Figure 2: Individual TEC cell to superlattice
data center – from the silicon in a chip, embedded TECs, to theair conditioners – and quantify the expected savings in coolingpower in the whole data center.
3. Model of Datacenter Cooling: From Dieto Air Conditioner
In a typical data-center the cooling units in individual floorsor rooms are provided with cold air or water to extract heatfrom them. In a chilled water cooling system, a chiller plantgenerates cold water centrally using cooling towers, and pipeswater to air handling units (computer room air conditioning orCRAC units) that supply cold air to servers.
Figure 3: System Interaction
Our goal is to quantify the impact of using micro-level ther-moelectric coolers on the power for cooling an entire data cen-ter, which is typically 50− 100% of the IT power [26]. Fig-ure 3 shows details of all the components in the modeled sys-tem and how they interact among themselves. At the bottommost layer, the die is housed in a ceramic case. A thermalinterface material (TIM) layer is applied on top of it, whichis used to connect the heat spreader to die. Similarly anotherlayer of TIM is applied between the heat spreader and the heatsink. We model a slab-fin heat sink in this paper, but our modelcould be easily used for a pin-fin heat sink as well. To incor-porate active cooling, the TEC tiles are housed on the bottomside of heat spreader. In Figure 5, we show the placement ofindividual TEC tiles, which consume 9mm2 area (< 10% ofchip area). A controller could use sensor readings from thehot spots to trigger TECs. In our experiments we assume thatthermal sensors are placed in the middle of TEC blocks to ac-tivate them. In older Intel R©processors, a thermal sensor isplaced near hotspots to measure die temperature, which couldbe used to trigger TECs when needed. In Intel R©CoreTM2 Duoand newer processors a digital thermometer is fabricated thatmeasures temperatures from multiple points distributed across
25
30
35
40
45
50
0 100 200 300 400 500 600 700
Tem
per
atu
re (
ο C)
Instructions (Millions)
(a) ammp
IntQLdStQ
ITB0
ITB1DcacheBpred2
IcacheFPQ
Bpred1
30
35
40
45
50
55
60
65
0 500 1000 1500 2000
Tem
per
atu
re (
ο C)
Instructions (Millions)
(c) apsi
FPQIntQ
LdStQ
FPAdd1ITB0
FPAdd0
FPReg3DcacheFPMul1
30
35
40
45
50
55
60
0 500 1000 1500 2000
Tem
per
atu
re (
ο C)
Instructions (Millions)
(b) art
IntQLdStQ
FPQ
ITB0ITB1
Dcache
FPAdd1Bpred2Icache
35
40
45
50
55
60
65
70
0 20 40 60 80 100 120 140 160
Tem
per
atu
re (
ο C)
Instructions (Millions)
(d) swim
FPQIntQ
LdStQ
FPAdd1FPAdd0
ITB0
FPReg3Dcache
ITB1
Figure 6: Temperature distribution of sample SPEC CPU2000benchmarks using Minnespec input sets. The temperaturetrace demonstrates that there are phases in applications. Dif-ferent unit might be the hottest across applications or phasesin them. For example, integer-queue unit is the hottest in ammpand art, whereas floating-point queue is the hottest unit in apsiand swim. In these figures we only show the nine hottest unitssorted in descending temperatures. Other units have signifi-cantly lower temperatures.
the die [27]. Inputs from the sensors could be used to activateindividual TEC devices more selectively. In the chip package,the heat generated from computations on the chip, spreads upto the heat sink, and is ultimately absorbed by the air outside(that then needs to be cooled using the CRAC). CRAC sup-plies cold air to the server room, which is driven by a fan tothe heat sink. The supply air temperature of the air affectsthe efficiency of the CRAC. Therefore, we create a model thatintegrates detailed chip-level heat diffusion with power effi-ciencies of server and data center-level components. Addinga layer of TECs requires an investment of energy in order toimprove the heat transfer from the die to the heat spreader, butdecreases the peak temperature on the die. Our task then isto determine how much heat has to be absorbed by the CRACbefore and after introducing thermo-electric cooling within thechip stack.
We approach the problem of modeling this multi-scale sys-tem in a bottom-up fashion. Servers generate heat from dy-namic switching as well as static leakage. The consumed power,both from the dynamic and static components, dissipates asheat to the chip, increasing its temperature. Due to the positivefeedback loop between the temperature and the leakage powerof the chip, we need numerical simulations for estimating thethermal profile of the chip. We model leakage power as a func-tion of temperature by using ITRS [2] data and HSPICE sim-ulation on logic and SRAM cells. To estimate dynamic power,we obtain power traces for each architectural component usingthe Wattch tool [8] on the SPEC CPU2000 benchmark suite.Figure 6 illustrates that applications show phase-behavior dur-ing its executions. As numeric simulation restricts us fromanalyzing entire execution, we choose representative pointsfrom the execution according to the phases. We use the powerconsumption of individual units at those execution points tocreate sources of appropriate power densities at each architec-tural component. The sources are used to simulate heat diffu-sion beginning from the die and all the way to the heat sink
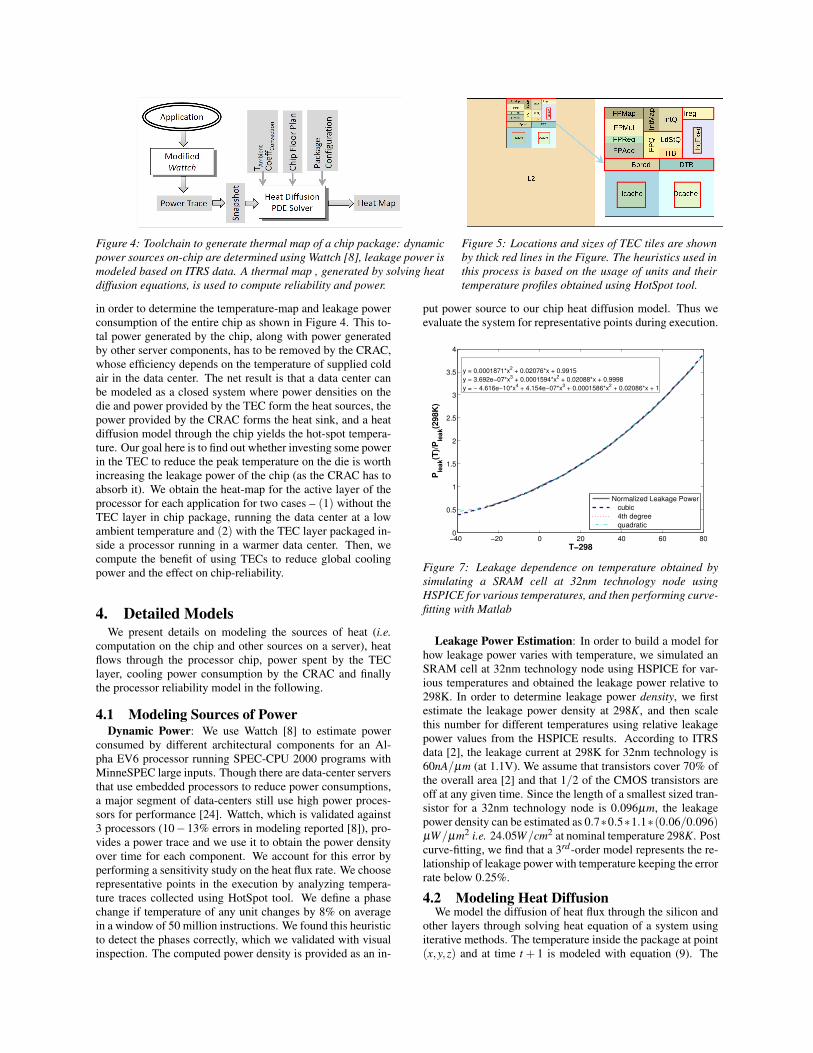
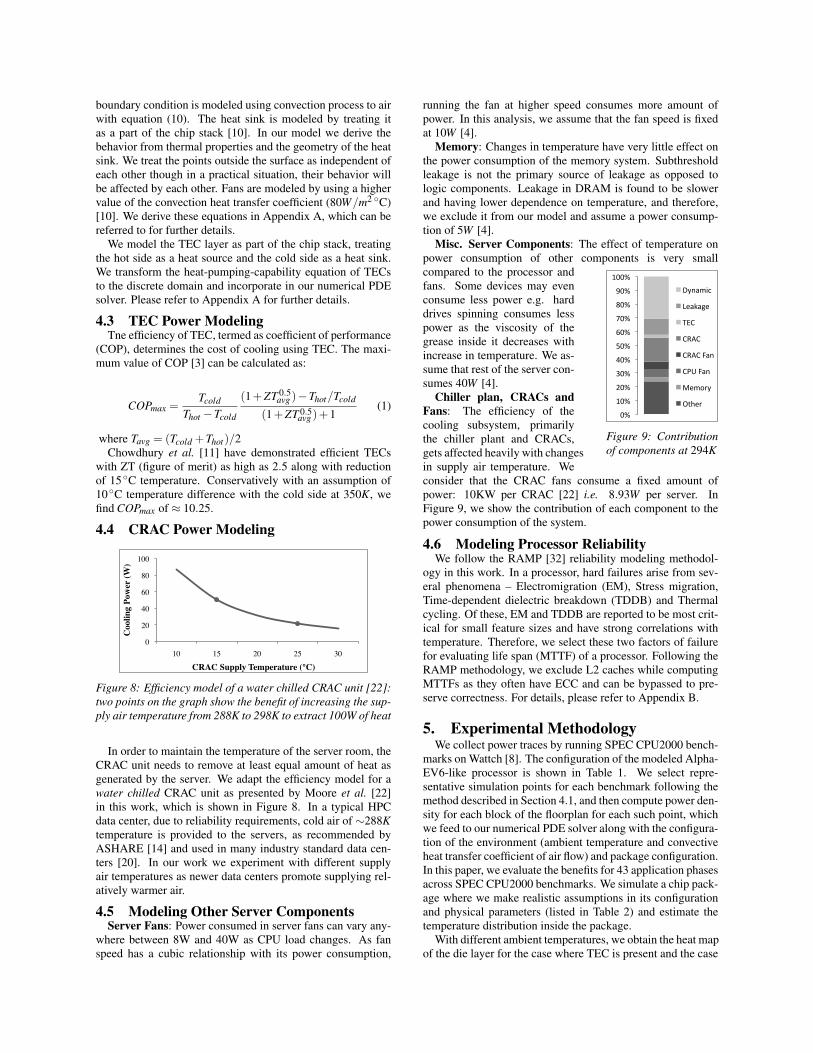
Figure 4: Toolchain to generate thermal map of a chip package: dynamicpower sources on-chip are determined using Wattch [8], leakage power ismodeled based on ITRS data. A thermal map , generated by solving heatdiffusion equations, is used to compute reliability and power.
Figure 5: Locations and sizes of TEC tiles are shownby thick red lines in the Figure. The heuristics used inthis process is based on the usage of units and theirtemperature profiles obtained using HotSpot tool.
in order to determine the temperature-map and leakage powerconsumption of the entire chip as shown in Figure 4. This to-tal power generated by the chip, along with power generatedby other server components, has to be removed by the CRAC,whose efficiency depends on the temperature of supplied coldair in the data center. The net result is that a data center canbe modeled as a closed system where power densities on thedie and power provided by the TEC form the heat sources, thepower provided by the CRAC forms the heat sink, and a heatdiffusion model through the chip yields the hot-spot tempera-ture. Our goal here is to find out whether investing some powerin the TEC to reduce the peak temperature on the die is worthincreasing the leakage power of the chip (as the CRAC has toabsorb it). We obtain the heat-map for the active layer of theprocessor for each application for two cases – (1) without theTEC layer in chip package, running the data center at a lowambient temperature and (2) with the TEC layer packaged in-side a processor running in a warmer data center. Then, wecompute the benefit of using TECs to reduce global coolingpower and the effect on chip-reliability.
4. Detailed ModelsWe present details on modeling the sources of heat (i.e.
computation on the chip and other sources on a server), heatflows through the processor chip, power spent by the TEClayer, cooling power consumption by the CRAC and finallythe processor reliability model in the following.
4.1 Modeling Sources of PowerDynamic Power: We use Wattch [8] to estimate power
consumed by different architectural components for an Al-pha EV6 processor running SPEC-CPU 2000 programs withMinneSPEC large inputs. Though there are data-center serversthat use embedded processors to reduce power consumptions,a major segment of data-centers still use high power proces-sors for performance [24]. Wattch, which is validated against3 processors (10−13% errors in modeling reported [8]), pro-vides a power trace and we use it to obtain the power densityover time for each component. We account for this error byperforming a sensitivity study on the heat flux rate. We chooserepresentative points in the execution by analyzing tempera-ture traces collected using HotSpot tool. We define a phasechange if temperature of any unit changes by 8% on averagein a window of 50 million instructions. We found this heuristicto detect the phases correctly, which we validated with visualinspection. The computed power density is provided as an in-
put power source to our chip heat diffusion model. Thus weevaluate the system for representative points during execution.
−40 −20 0 20 40 60 800
0.5
1
1.5
2
2.5
3
3.5
4
T−298
Ple
ak(T
)/P
lea
k(2
98
K)
y = 0.0001871*x2 + 0.02076*x + 0.9915
y = 3.692e−07*x3 + 0.0001594*x
2 + 0.02088*x + 0.9998
y = − 4.616e−10*x4 + 4.154e−07*x
3 + 0.0001586*x
2 + 0.02086*x + 1
Normalized Leakage Power
cubic
4th degree
quadratic
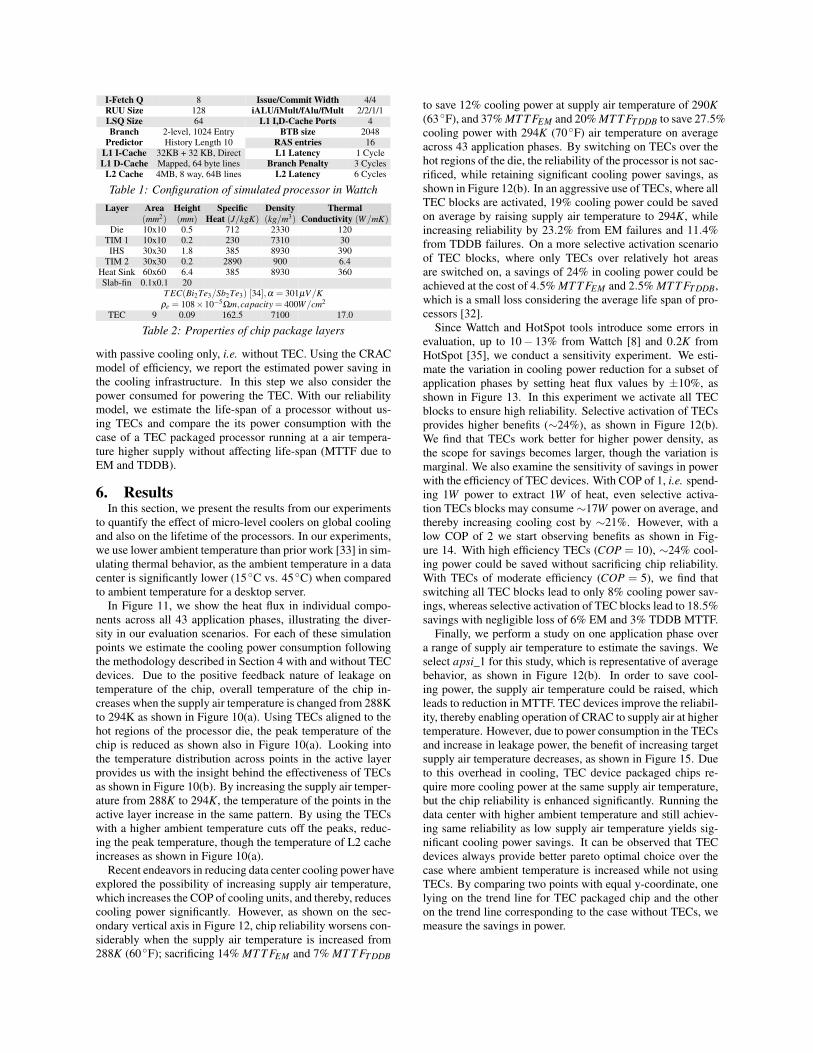
Figure 7: Leakage dependence on temperature obtained bysimulating a SRAM cell at 32nm technology node usingHSPICE for various temperatures, and then performing curve-fitting with Matlab
Leakage Power Estimation: In order to build a model forhow leakage power varies with temperature, we simulated anSRAM cell at 32nm technology node using HSPICE for var-ious temperatures and obtained the leakage power relative to298K. In order to determine leakage power density, we firstestimate the leakage power density at 298K, and then scalethis number for different temperatures using relative leakagepower values from the HSPICE results. According to ITRSdata [2], the leakage current at 298K for 32nm technology is60nA/µm (at 1.1V). We assume that transistors cover 70% ofthe overall area [2] and that 1/2 of the CMOS transistors areoff at any given time. Since the length of a smallest sized tran-sistor for a 32nm technology node is 0.096µm, the leakagepower density can be estimated as 0.7∗0.5∗1.1∗(0.06/0.096)µW/µm2 i.e. 24.05W/cm2 at nominal temperature 298K. Postcurve-fitting, we find that a 3rd-order model represents the re-lationship of leakage power with temperature keeping the errorrate below 0.25%.
4.2 Modeling Heat DiffusionWe model the diffusion of heat flux through the silicon and
other layers through solving heat equation of a system usingiterative methods. The temperature inside the package at point(x,y,z) and at time t + 1 is modeled with equation (9). The
boundary condition is modeled using convection process to airwith equation (10). The heat sink is modeled by treating itas a part of the chip stack [10]. In our model we derive thebehavior from thermal properties and the geometry of the heatsink. We treat the points outside the surface as independent ofeach other though in a practical situation, their behavior willbe affected by each other. Fans are modeled by using a highervalue of the convection heat transfer coefficient (80W/m2 C)[10]. We derive these equations in Appendix A, which can bereferred to for further details.
We model the TEC layer as part of the chip stack, treatingthe hot side as a heat source and the cold side as a heat sink.We transform the heat-pumping-capability equation of TECsto the discrete domain and incorporate in our numerical PDEsolver. Please refer to Appendix A for further details.
4.3 TEC Power ModelingTne efficiency of TEC, termed as coefficient of performance
(COP), determines the cost of cooling using TEC. The maxi-mum value of COP [3] can be calculated as:
COPmax =Tcold
Thot −Tcold
(1+ZT 0.5avg )−Thot/Tcold
(1+ZT 0.5avg )+1
(1)
where Tavg = (Tcold +Thot)/2Chowdhury et al. [11] have demonstrated efficient TECs
with ZT (figure of merit) as high as 2.5 along with reductionof 15C temperature. Conservatively with an assumption of10C temperature difference with the cold side at 350K, wefind COPmax of ≈ 10.25.
4.4 CRAC Power Modeling
0
20
40
60
80
100
10 15 20 25 30
Coo
ling
Pow
er (W
)
CRAC Supply Temperature (°C)
Figure 8: Efficiency model of a water chilled CRAC unit [22]:two points on the graph show the benefit of increasing the sup-ply air temperature from 288K to 298K to extract 100W of heat
In order to maintain the temperature of the server room, theCRAC unit needs to remove at least equal amount of heat asgenerated by the server. We adapt the efficiency model for awater chilled CRAC unit as presented by Moore et al. [22]in this work, which is shown in Figure 8. In a typical HPCdata center, due to reliability requirements, cold air of ∼288Ktemperature is provided to the servers, as recommended byASHARE [14] and used in many industry standard data cen-ters [20]. In our work we experiment with different supplyair temperatures as newer data centers promote supplying rel-atively warmer air.
4.5 Modeling Other Server ComponentsServer Fans: Power consumed in server fans can vary any-
where between 8W and 40W as CPU load changes. As fanspeed has a cubic relationship with its power consumption,
running the fan at higher speed consumes more amount ofpower. In this analysis, we assume that the fan speed is fixedat 10W [4].
Memory: Changes in temperature have very little effect onthe power consumption of the memory system. Subthresholdleakage is not the primary source of leakage as opposed tologic components. Leakage in DRAM is found to be slowerand having lower dependence on temperature, and therefore,we exclude it from our model and assume a power consump-tion of 5W [4].
Misc. Server Components: The effect of temperature onpower consumption of other components is very small
0%
10%
20%
30%
40%
50%
60%
70%
80%
90%
100%
Dynamic
Leakage
TEC
CRAC
CRAC Fan
CPU Fan
Memory
Other
Figure 9: Contributionof components at 294K
compared to the processor andfans. Some devices may evenconsume less power e.g. harddrives spinning consumes lesspower as the viscosity of thegrease inside it decreases withincrease in temperature. We as-sume that rest of the server con-sumes 40W [4].
Chiller plan, CRACs andFans: The efficiency of thecooling subsystem, primarilythe chiller plant and CRACs,gets affected heavily with changesin supply air temperature. Weconsider that the CRAC fans consume a fixed amount ofpower: 10KW per CRAC [22] i.e. 8.93W per server. InFigure 9, we show the contribution of each component to thepower consumption of the system.
4.6 Modeling Processor ReliabilityWe follow the RAMP [32] reliability modeling methodol-
ogy in this work. In a processor, hard failures arise from sev-eral phenomena – Electromigration (EM), Stress migration,Time-dependent dielectric breakdown (TDDB) and Thermalcycling. Of these, EM and TDDB are reported to be most crit-ical for small feature sizes and have strong correlations withtemperature. Therefore, we select these two factors of failurefor evaluating life span (MTTF) of a processor. Following theRAMP methodology, we exclude L2 caches while computingMTTFs as they often have ECC and can be bypassed to pre-serve correctness. For details, please refer to Appendix B.
5. Experimental MethodologyWe collect power traces by running SPEC CPU2000 bench-
marks on Wattch [8]. The configuration of the modeled Alpha-EV6-like processor is shown in Table 1. We select repre-sentative simulation points for each benchmark following themethod described in Section 4.1, and then compute power den-sity for each block of the floorplan for each such point, whichwe feed to our numerical PDE solver along with the configura-tion of the environment (ambient temperature and convectiveheat transfer coefficient of air flow) and package configuration.In this paper, we evaluate the benefits for 43 application phasesacross SPEC CPU2000 benchmarks. We simulate a chip pack-age where we make realistic assumptions in its configurationand physical parameters (listed in Table 2) and estimate thetemperature distribution inside the package.
With different ambient temperatures, we obtain the heat mapof the die layer for the case where TEC is present and the case
I-Fetch Q 8 Issue/Commit Width 4/4RUU Size 128 iALU/iMult/fAlu/fMult 2/2/1/1LSQ Size 64 L1 I,D-Cache Ports 4Branch 2-level, 1024 Entry BTB size 2048
Predictor History Length 10 RAS entries 16L1 I-Cache 32KB + 32 KB, Direct L1 Latency 1 CycleL1 D-Cache Mapped, 64 byte lines Branch Penalty 3 Cycles
L2 Cache 4MB, 8 way, 64B lines L2 Latency 6 Cycles
Table 1: Configuration of simulated processor in WattchLayer Area Height Specific Density Thermal
(mm2) (mm) Heat (J/kgK) (kg/m3) Conductivity (W/mK)Die 10x10 0.5 712 2330 120
TIM 1 10x10 0.2 230 7310 30IHS 30x30 1.8 385 8930 390
TIM 2 30x30 0.2 2890 900 6.4Heat Sink 60x60 6.4 385 8930 360Slab-fin 0.1x0.1 20
T EC(Bi2Te3/Sb2Te3) [34],α = 301µV/Kρe = 108×10−5Ωm,capacity = 400W/cm2
TEC 9 0.09 162.5 7100 17.0
Table 2: Properties of chip package layers
with passive cooling only, i.e. without TEC. Using the CRACmodel of efficiency, we report the estimated power saving inthe cooling infrastructure. In this step we also consider thepower consumed for powering the TEC. With our reliabilitymodel, we estimate the life-span of a processor without us-ing TECs and compare the its power consumption with thecase of a TEC packaged processor running at a air tempera-ture higher supply without affecting life-span (MTTF due toEM and TDDB).
6. ResultsIn this section, we present the results from our experiments
to quantify the effect of micro-level coolers on global coolingand also on the lifetime of the processors. In our experiments,we use lower ambient temperature than prior work [33] in sim-ulating thermal behavior, as the ambient temperature in a datacenter is significantly lower (15C vs. 45C) when comparedto ambient temperature for a desktop server.
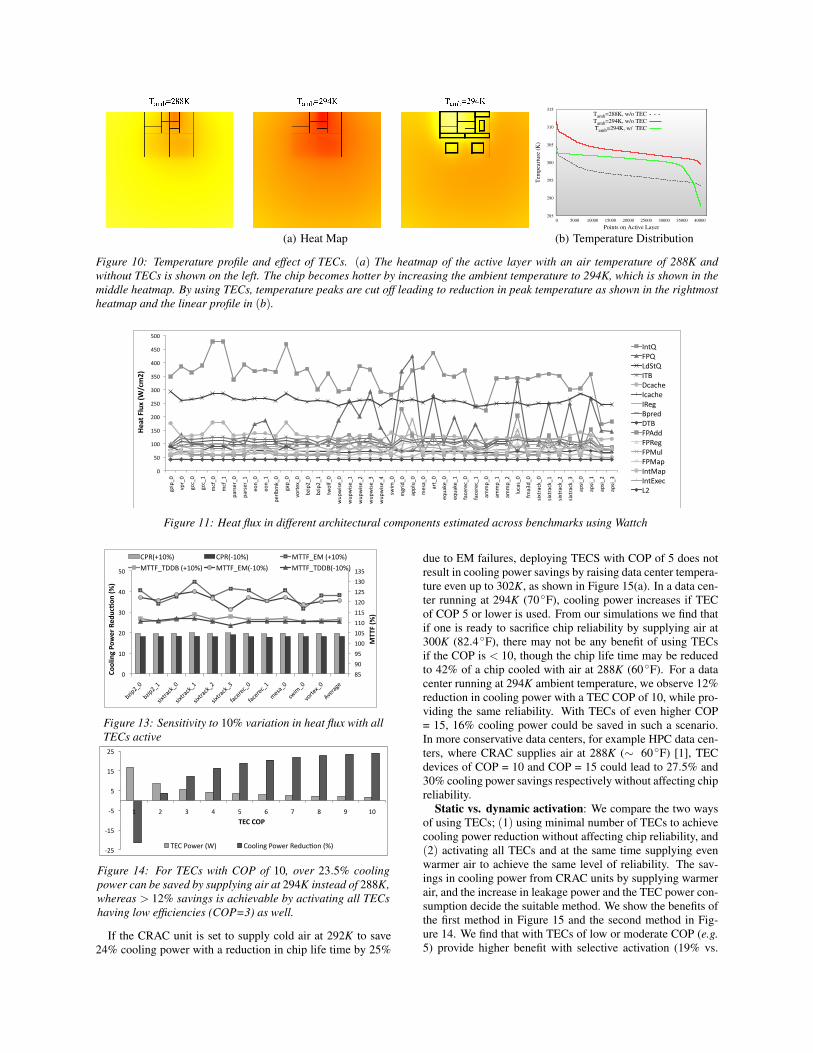
In Figure 11, we show the heat flux in individual compo-nents across all 43 application phases, illustrating the diver-sity in our evaluation scenarios. For each of these simulationpoints we estimate the cooling power consumption followingthe methodology described in Section 4 with and without TECdevices. Due to the positive feedback nature of leakage ontemperature of the chip, overall temperature of the chip in-creases when the supply air temperature is changed from 288Kto 294K as shown in Figure 10(a). Using TECs aligned to thehot regions of the processor die, the peak temperature of thechip is reduced as shown also in Figure 10(a). Looking intothe temperature distribution across points in the active layerprovides us with the insight behind the effectiveness of TECsas shown in Figure 10(b). By increasing the supply air temper-ature from 288K to 294K, the temperature of the points in theactive layer increase in the same pattern. By using the TECswith a higher ambient temperature cuts off the peaks, reduc-ing the peak temperature, though the temperature of L2 cacheincreases as shown in Figure 10(a).
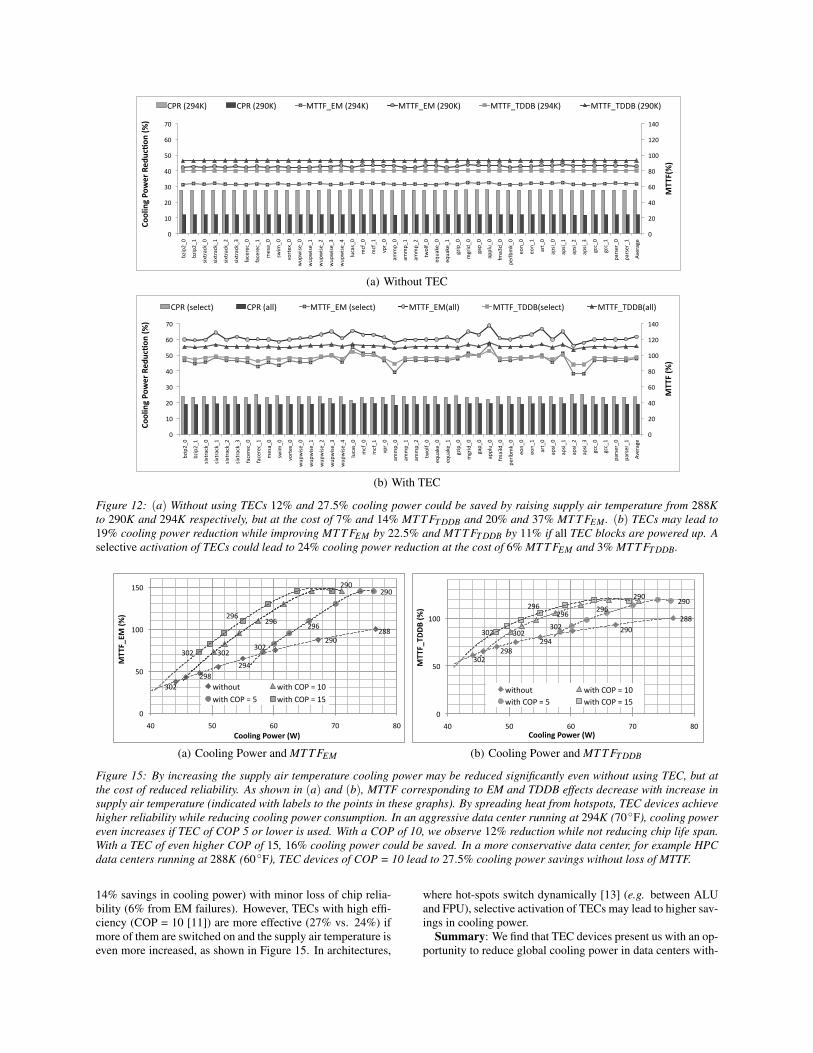
Recent endeavors in reducing data center cooling power haveexplored the possibility of increasing supply air temperature,which increases the COP of cooling units, and thereby, reducescooling power significantly. However, as shown on the sec-ondary vertical axis in Figure 12, chip reliability worsens con-siderably when the supply air temperature is increased from288K (60F); sacrificing 14% MT T FEM and 7% MT T FT DDB
to save 12% cooling power at supply air temperature of 290K(63F), and 37% MT T FEM and 20% MT T FT DDB to save 27.5%cooling power with 294K (70F) air temperature on averageacross 43 application phases. By switching on TECs over thehot regions of the die, the reliability of the processor is not sac-rificed, while retaining significant cooling power savings, asshown in Figure 12(b). In an aggressive use of TECs, where allTEC blocks are activated, 19% cooling power could be savedon average by raising supply air temperature to 294K, whileincreasing reliability by 23.2% from EM failures and 11.4%from TDDB failures. On a more selective activation scenarioof TEC blocks, where only TECs over relatively hot areasare switched on, a savings of 24% in cooling power could beachieved at the cost of 4.5% MT T FEM and 2.5% MT T FT DDB,which is a small loss considering the average life span of pro-cessors [32].
Since Wattch and HotSpot tools introduce some errors inevaluation, up to 10− 13% from Wattch [8] and 0.2K fromHotSpot [35], we conduct a sensitivity experiment. We esti-mate the variation in cooling power reduction for a subset ofapplication phases by setting heat flux values by ±10%, asshown in Figure 13. In this experiment we activate all TECblocks to ensure high reliability. Selective activation of TECsprovides higher benefits (∼24%), as shown in Figure 12(b).We find that TECs work better for higher power density, asthe scope for savings becomes larger, though the variation ismarginal. We also examine the sensitivity of savings in powerwith the efficiency of TEC devices. With COP of 1, i.e. spend-ing 1W power to extract 1W of heat, even selective activa-tion TECs blocks may consume ∼17W power on average, andthereby increasing cooling cost by ∼21%. However, with alow COP of 2 we start observing benefits as shown in Fig-ure 14. With high efficiency TECs (COP = 10), ∼24% cool-ing power could be saved without sacrificing chip reliability.With TECs of moderate efficiency (COP = 5), we find thatswitching all TEC blocks lead to only 8% cooling power sav-ings, whereas selective activation of TEC blocks lead to 18.5%savings with negligible loss of 6% EM and 3% TDDB MTTF.
Finally, we perform a study on one application phase overa range of supply air temperature to estimate the savings. Weselect apsi_1 for this study, which is representative of averagebehavior, as shown in Figure 12(b). In order to save cool-ing power, the supply air temperature could be raised, whichleads to reduction in MTTF. TEC devices improve the reliabil-ity, thereby enabling operation of CRAC to supply air at highertemperature. However, due to power consumption in the TECsand increase in leakage power, the benefit of increasing targetsupply air temperature decreases, as shown in Figure 15. Dueto this overhead in cooling, TEC device packaged chips re-quire more cooling power at the same supply air temperature,but the chip reliability is enhanced significantly. Running thedata center with higher ambient temperature and still achiev-ing same reliability as low supply air temperature yields sig-nificant cooling power savings. It can be observed that TECdevices always provide better pareto optimal choice over thecase where ambient temperature is increased while not usingTECs. By comparing two points with equal y-coordinate, onelying on the trend line for TEC packaged chip and the otheron the trend line corresponding to the case without TECs, wemeasure the savings in power.
(a) Heat Map
285
290
295
300
305
310
315
0 5000 10000 15000 20000 25000 30000 35000 40000
Tem
pea
rture
(K
)
Points on Active Layer
Tamb=288K, w/o TEC
Tamb=294K, w/o TEC
Tamb=294K, w/ TEC
(b) Temperature Distribution
Figure 10: Temperature profile and effect of TECs. (a) The heatmap of the active layer with an air temperature of 288K andwithout TECs is shown on the left. The chip becomes hotter by increasing the ambient temperature to 294K, which is shown in themiddle heatmap. By using TECs, temperature peaks are cut off leading to reduction in peak temperature as shown in the rightmostheatmap and the linear profile in (b).
0
50
100
150
200
250
300
350
400
450
500
gzip_0
vpr_0
gcc_0
gcc_1
mcf_0
mcf_1
parser_0
parser_1
eon_
0
eon_
1
perlbm
k_0
gap_
0
vortex_0
bzip2_0
bzip2_1
twolf_0
wup
wise_0
wup
wise_1
wup
wise_2
wup
wise_3
wup
wise_4
swim
_0
mgrid_0
applu_
0
mesa_0
art_0
equake_0
equake_1
facerec_0
facerec_1
ammp_
0
ammp_
1
ammp_
2
lucas_0
fma3d_
0
sixtrack_0
sixtrack_1
sixtrack_2
sixtrack_3
apsi_0
apsi_1
apsi_2
apsi_3
Heat F
lux (W
/cm2)
IntQ FPQ LdStQ ITB Dcache Icache IReg Bpred DTB FPAdd FPReg FPMul FPMap IntMap IntExec L2
Figure 11: Heat flux in different architectural components estimated across benchmarks using Wattch
85
90
95
100
105
110
115
120
125
130
135
0
10
20
30
40
50
bzip2_0
bzip2_1
sixtrack_0
sixtrack_1
sixtrack_2
sixtrack_3
facerec_0
facerec_1
mesa_0
swim_0
vortex_0
Average
MTTF (%
)
Cooling Po
wer Red
uc6on
(%)
CPR(+10%) CPR(-‐10%) MTTF_EM (+10%)
MTTF_TDDB (+10%) MTTF_EM(-‐10%) MTTF_TDDB(-‐10%)
Figure 13: Sensitivity to 10% variation in heat flux with allTECs active
-‐25
-‐15
-‐5
5
15
25
1 2 3 4 5 6 7 8 9 10
TEC COP
TEC Power (W) Cooling Power Reduc@on (%)
Figure 14: For TECs with COP of 10, over 23.5% coolingpower can be saved by supplying air at 294K instead of 288K,whereas > 12% savings is achievable by activating all TECshaving low efficiencies (COP=3) as well.
If the CRAC unit is set to supply cold air at 292K to save24% cooling power with a reduction in chip life time by 25%
due to EM failures, deploying TECS with COP of 5 does notresult in cooling power savings by raising data center tempera-ture even up to 302K, as shown in Figure 15(a). In a data cen-ter running at 294K (70F), cooling power increases if TECof COP 5 or lower is used. From our simulations we find thatif one is ready to sacrifice chip reliability by supplying air at300K (82.4F), there may not be any benefit of using TECsif the COP is < 10, though the chip life time may be reducedto 42% of a chip cooled with air at 288K (60F). For a datacenter running at 294K ambient temperature, we observe 12%reduction in cooling power with a TEC COP of 10, while pro-viding the same reliability. With TECs of even higher COP= 15, 16% cooling power could be saved in such a scenario.In more conservative data centers, for example HPC data cen-ters, where CRAC supplies air at 288K (∼ 60F) [1], TECdevices of COP = 10 and COP = 15 could lead to 27.5% and30% cooling power savings respectively without affecting chipreliability.
Static vs. dynamic activation: We compare the two waysof using TECs; (1) using minimal number of TECs to achievecooling power reduction without affecting chip reliability, and(2) activating all TECs and at the same time supplying evenwarmer air to achieve the same level of reliability. The sav-ings in cooling power from CRAC units by supplying warmerair, and the increase in leakage power and the TEC power con-sumption decide the suitable method. We show the benefits ofthe first method in Figure 15 and the second method in Fig-ure 14. We find that with TECs of low or moderate COP (e.g.5) provide higher benefit with selective activation (19% vs.
0
20
40
60
80
100
120
140
0
10
20
30
40
50
60
70
bzip2_0
bzip2_1
sixtrack_0
sixtrack_1
sixtrack_2
sixtrack_3
facerec_0
facerec_1
mesa_0
swim
_0
vortex_0
wup
wise_0
wup
wise_1
wup
wise_2
wup
wise_3
wup
wise_4
lucas_0
mcf_0
mcf_1
vpr_0
ammp_
0
ammp_
1
ammp_
2
twolf_0
equake_0
equake_1
gzip_0
mgrid_0
gap_
0
applu_
0
fma3d_
0
perlbm
k_0
eon_
0
eon_
1
art_0
apsi_0
apsi_1
apsi_2
apsi_3
gcc_0
gcc_1
parser_0
parser_1
Average
MTTF(%)
Cooling Po
wer Red
uc6on
(%)
CPR (294K) CPR (290K) MTTF_EM (294K) MTTF_EM (290K) MTTF_TDDB (294K) MTTF_TDDB (290K)
(a) Without TEC
0
20
40
60
80
100
120
140
0
10
20
30
40
50
60
70
bzip2_0
bzip2_1
sixtrack_0
sixtrack_1
sixtrack_2
sixtrack_3
facerec_0
facerec_1
mesa_0
swim
_0
vortex_0
wup
wise_0
wup
wise_1
wup
wise_2
wup
wise_3
wup
wise_4
lucas_0
mcf_0
mcf_1
vpr_0
ammp_
0
ammp_
1
ammp_
2
twolf_0
equake_0
equake_1
gzip_0
mgrid_0
gap_
0
applu_
0
fma3d_
0
perlbm
k_0
eon_
0
eon_
1
art_0
apsi_0
apsi_1
apsi_2
apsi_3
gcc_0
gcc_1
parser_0
parser_1
Average
MTTF (%
)
Cooling Po
wer Red
uc6on
(%)
CPR (select) CPR (all) MTTF_EM (select) MTTF_EM(all) MTTF_TDDB(select) MTTF_TDDB(all)
(b) With TEC
Figure 12: (a) Without using TECs 12% and 27.5% cooling power could be saved by raising supply air temperature from 288Kto 290K and 294K respectively, but at the cost of 7% and 14% MT T FT DDB and 20% and 37% MT T FEM . (b) TECs may lead to19% cooling power reduction while improving MT T FEM by 22.5% and MT T FT DDB by 11% if all TEC blocks are powered up. Aselective activation of TECs could lead to 24% cooling power reduction at the cost of 6% MT T FEM and 3% MT T FT DDB.
288 290
294 298
302
290
296
302
290
296
302
296
302
0
50
100
150
40 50 60 70 80
MTTF_EM
(%)
Cooling Power (W)
without with COP = 10
with COP = 5 with COP = 15
(a) Cooling Power and MT T FEM
288 290
294 298
302
296
302
290 296
302
290 296
302
0
50
100
40 50 60 70 80
MTTF_TD
DB (%
)
Cooling Power (W)
without with COP = 10 with COP = 5 with COP = 15
(b) Cooling Power and MT T FT DDB
Figure 15: By increasing the supply air temperature cooling power may be reduced significantly even without using TEC, but atthe cost of reduced reliability. As shown in (a) and (b), MTTF corresponding to EM and TDDB effects decrease with increase insupply air temperature (indicated with labels to the points in these graphs). By spreading heat from hotspots, TEC devices achievehigher reliability while reducing cooling power consumption. In an aggressive data center running at 294K (70F), cooling powereven increases if TEC of COP 5 or lower is used. With a COP of 10, we observe 12% reduction while not reducing chip life span.With a TEC of even higher COP of 15, 16% cooling power could be saved. In a more conservative data center, for example HPCdata centers running at 288K (60F), TEC devices of COP = 10 lead to 27.5% cooling power savings without loss of MTTF.
14% savings in cooling power) with minor loss of chip relia-bility (6% from EM failures). However, TECs with high effi-ciency (COP = 10 [11]) are more effective (27% vs. 24%) ifmore of them are switched on and the supply air temperature iseven more increased, as shown in Figure 15. In architectures,
where hot-spots switch dynamically [13] (e.g. between ALUand FPU), selective activation of TECs may lead to higher sav-ings in cooling power.
Summary: We find that TEC devices present us with an op-portunity to reduce global cooling power in data centers with-
out affecting chip life time. However, energy efficient super-lattice coolers are required to leverage this savings. TECs withlow or moderate efficiency (e.g. COP = 5) may not provideany reduction in cooling power due to the increase in leakagepower when supply air temperature is increased. Even withpower efficient TECs (e.g. COP = 10), the reduction in cool-ing power will be negligible if reliability is already largely sac-rificed in the base case to save cooling power by raising datacenter temperature to ∼85F. If chip reliability is important,e.g. in HPC data centers, efficient TEC devices (with COP= 10, demonstrated by Chowdhury et al. [11]), could lead tosavings in cooling power by ∼27% while providing the samechip life span as running the data center at 288K (60F).
7. Related WorkOur work touches on different areas of research including
thermal modeling of processors, hot spot management and tech-niques for reducing the power usage in data centers. In thissection, we describe prior work in these domains and comparethem to our work.
Thermal Modeling of Processors: The increase of powerdensity inside processors has led to higher device failure rates.At the architecture level, Brooks et al. [8] introduced Wattch,which estimates power usage of a processor on the basis of itscomponent activity. The components are modeled at a blocklevel and coarse-grain power usage statistics are derived. Stanet al. [33] proposed the HotSpot model, which uses a lumpedmodeling technique to model the thermal paths inside a pro-cessor and computes the temperature at a block granularity us-ing power density statistics. Li et al. [19] use geometric multi-grid methods to efficiently solve a large number of heat PDEsefficiently. Monchiero et al. [21] evaluate thermal/power/per-formance design choices in multicore architectures by model-ing heat diffusion in them. Our work builds upon the full chipthermal model using fundamental heat equations and solvingit for the steady state. While the previous work models pro-cessors in isolation, our model integrates TEC and CRAC ef-ficiencies to determine power savings at the data center level.
Hot-Spot Removal: There has been a significant body ofwork in finding solutions to mitigate hot spots. Processors(e.g. Transmeta Crusoe) often use dynamic voltage scaling(DVS) or deactivation techniques to control the temperature ofprocessors. Skadron et al. [31] introduced thermal-behavior-aware microarchitecture and floorplanning techniques to re-duce hot-spots. Puttaswamy et al. [25] propose Thermal Herd-ing technique that reduces 3D power density by placing highlyswitching 16-bits closer to the heat sink, and thereby, reducingthe occurrences of hot-spots as well. Since hot spots arise fromhigh transistor switching rates, Heo et al. [15] propose that mi-grating the computations frequently across multiple locationscan reduce the hot-spots. Task migration approach is orthogo-nal to active cooling technique that we analyze in this paper. Infact, both of these techniques could work well with each other,where TEC could be used to prevent wear out at high loads.Task migration could be used in presence of redundant struc-tures. Adding such structures, e.g. extra ld/st queue) wouldbe intrusive to processor design. Huang et al. [16] propose aframework to control the performance of a chip for keeping thetemperature of the processor below a target. We find that sinceTECs target hot-spots directly, it can be used in conjunctionwith the above more indirect means of mitigating hot-spots.
Modeling Microprocessor Reliability: We build our reli-ability models following the RAMP [32] modeling methodol-ogy, which considers four phenomena behind processor wear-outs. In this work, we consider failures due to EM and TDDBas other mechanisms have lower effect on modern micropro-cessors [32]. We extend this model by computing the jointprobability distribution of failure by incorporating the MTTFfunction for EM and TDDB, which are found to show lognor-mal [18] and Weibull distributions [17] respectively.
Reducing the Power Usage in Data Centers: On a datacenter level, where thousands of processors are cooled con-stantly using CRAC units, conserving power has both ecolog-ical and financial benefits. Patel et al. [23] and Schmidt etal. [28] modeled CFD simulations of a data center air flowand report that careful design and air cooling provisioning isimportant for sustained operation of a data center. Chaparroet al. [9] present a quantitative model of data center powerefficiency and report that reducing supply air temperature pro-vides larger energy savings than running the blowers at highspeed. However, due to non-uniformity in resource usage, hotspots at lower granularities cannot be removed. Sharma etal. [29] propose thermal monitoring and thermal load balanc-ing techniques by scheduling jobs to balance the temperatureacross a data center through prediction of utilization of serverresources. Moore et al. [22] propose techniques (zone-baseddiscretization and minimized heat recirculation) to create pri-oritized lists of servers for proper scheduling of jobs, takinginto account the efficiency of CRAC units for supplying coldair. Bash et al. [5, 6] propose an architecture and control mech-anism for reducing cooling cost using dynamic thermal man-agement based on a cooling cost model. Sharma et al. [30]report that power consumption for cooling a data center canbe reduced significantly by designing the air flow path to pre-vent mixing of hot and cold air and present non-dimensionalparameter based models of the air flow inside aisles. Thesetechniques improve the efficiency of the global coolers andshould work well in conjunction with direct hot-spot mitiga-tion using TECs.
8. ConclusionsIn a data center with thousands of servers, the cooling sys-
tem plays a major role in reliability of the servers, and alsoin the cost of running a data center, which is typically in theorder of millions of dollars per year. In a typical data center,the cooling power is nearly equal to the total power of runningthe IT equipment. Cooling units show higher efficiency withthe increase in the target supply air temperature. However,the cooling units are provisioned for the worst case, i.e. thehot-spots inside the processors. As reliability is exponentiallyrelated to the operating temperature, increasing the supply airtemperature reduces the lifetime of the hottest processor com-ponent, and in turn, of the entire processor.
Localized cooling via superlattice thermoelectric coolers pro-vides the capability to reduce the temperature of the hot-spots,and thereby, increase the lifetime of the critical components.Recent advances suggest the feasibility of integrating high ef-ficiency thermoelectric coolers [11] with the chip package tocreate high efficiency heat pumps for cooling hot-spots. In thispaper, we propose that TEC devices could be used as a cool-ing power management mechanism to reduce global coolingcost. We integrate a multi-scale model of the system, con-sidering different thermal components of a data center, from
chip package to the cooling units. Then, we perform numer-ical analysis to obtain the chip thermal behavior and quantifythe benefit of incorporating a TEC inside the chip package. Weshow that∼27% of global cooling power could be saved, com-pared supply air temperature of 288K, by running data centersat a higher temperature while cooling the hot-spots selectivelywith superlattice TECs.
AcknowledgementsPart of this work was performed under the auspices of the
U.S. Department of Energy by Lawrence Livermore NationalLaboratory under contract DE-AC52-07NA27344 (LLNL-CONF-474345), and Grant No. FA9550-07-1-0532 (AFOSR MURI),a Google Directed Research Grant for Energy-ProportionalComputing and NSF 0627749 to Frederic T. Chong, Grant No.CCF-0448654, CNS-0524771 and CCF-0702798 to TimothySherwood.
9. References[1] Comp turns up the heat on energy conservation.
https://newsline.llnl.gov/_rev02/articles/2009/oct/10.02.09-energy.php.
[2] The International Technology Roadmap forSemiconductors. http://www.itrs.net/.
[3] A. Bar-Cohen and P. Wang. On-Chip ThermalManagement and Hot-Spot Remediation. In Nano-Bio-Electronic, Photonic and MEMS Packaging, pages349–429. Springer Science+Business Media, LLC,2010.
[4] L. A. Barroso and U. Hölzle. The Case forEnergy-Proportional Computing. IEEE Computer,40(12):33 –37, Dec. 2007.
[5] C. Bash and G. Forman. Cool Job Allocation:Measuring the Power Savings of Placing Jobs atCooling-efficient Locations in the Data Center. InATC’07: 2007 USENIX Annual Technical Conference.
[6] C. Bash, C. Patel, and R. Sharma. Dynamic ThermalManagement of Air Cooled Data Centers. In ITHERM’06, pages 445–452.
[7] J. Black. Electromigration - A Brief Survey and SomeRecent Results. IEEE Transactions on Electron Devices,16(4):338–347, 1969.
[8] D. Brooks, V. Tiwari, and M. Martonosi. Wattch: AFramework for Architectural-level Power Analysis andOptimizations. ACM SIGARCH Computer ArchitectureNews, 28(2):83–94, 2000.
[9] P. Chaparro, J. Gonzalez, and A. Gonzalez.Thermal-aware Clustered Microarchitectures. In ICCD2004, pages 48–53.
[10] C. Chen, C. Wu, and C. Hwang. Optimal Design andControl of CPU Heat Sink Processes. IEEETransactions on Components and PackagingTechnologies, 31(1):184, 2008.
[11] I. Chowdhury, R. Prasher, K. Lofgreen, G. Chrysler,S. Narasimhan, R. Mahajan, D. Koester, R. Alley, andR. Venkatasubramanian. On-chip Cooling bySuperlattice-based Thin-film Thermoelectrics. NatureNanotechnology, 2009.
[12] G. Chrysler. Building Blocks for Thermal Managementof Electronics. Next-Generation Thermal ManagementMaterials and Systems, 2002.
[13] S. Chung and K. Skadron. Using On-Chip EventCounters For High-Resolution, Real-Time TemperatureMeasurement. In ITHERM’06, pages 114–120.
[14] D. Garday and D. Costello. Air-CooledHigh-Performance Data Centers: Case Studies and BestMethods. Technology@Intel Magazine,http://www.intel.com/it/pdf/air-cooled-data-centers.pdf.
[15] S. Heo, K. Barr, and K. Asanovic. Reducing PowerDensity Through Activity Migration. In ISPLED 2003,pages 217–222.
[16] M. Huang, J. Renau, S. Yoo, and J. Torrellas. TheDesign of DEETM: a Framework for Dynamic EnergyEfficiency and Temperature Management. Journal ofInstruction-Level Parallelism, 3:1–31, 2002.
[17] M. Kimura. Field and Temperature Acceleration Modelfor Time-Dependent Dielectric Breakdown. IEEETransactions on Electron Devices, 46(1):220–229, 2002.
[18] M. Lane, E. Liniger, and J. Lloyd. Relationship BetweenInterfacial Adhesion and Electromigration in CuMetallization. Journal of Applied Physics, 93:1417,2003.
[19] P. Li, L. Pileggi, M. Asheghi, and R. Chandra. EfficientFull-chip Thermal Modeling and Analysis. In ICCAD2004, pages 326–331.
[20] P. Mathew, S. Greenberg, S. Ganguly, D. Sartor, andW. Tschudi. How Does Your Data Center Measure Up?Energy Efficiency Metrics and Benchmarks for DataCenter Infrastructure Systems. Technical ReportLBNL-1960E, April 2009.
[21] M. Monchiero, R. Canal, and A. Gonzalez.Power/Performance/Thermal Design-Space Explorationfor Multicore Architectures. IEEE Transactions onParallel and Distributed Systems, 19(5):666 –681, 2008.
[22] J. Moore, J. Chase, P. Ranganathan, and R. Sharma.Making Scheduling “Cool”: Temperature-AwareWorkload Placement in Data Centers. In ATEC’05:2005 USENIX Annual Technical Conference.
[23] C. Patel, R. Sharma, C. Bash, and A. Beitelmal.Thermal Considerations in Cooling Large Scale HighCompute Density Data Centers. In ITHERM 2002,pages 767–776.
[24] J. Pflueger and A. Esser. The Energy Smart Data Center.in Dell Power Solutions,http://www.dell.com/downloads/global/power/ps1q08-20080179-CoverStory.pdf,February 2008.
[25] K. Puttaswamy and G. Loh. Thermal Herding:Microarchitecture Techniques for Controlling Hotspotsin High-performance 3d-Integrated Processors. InHPCA, pages 193–204, 2007.
[26] N. Rasmussen. Electrical Efficiency Modeling of DataCenters. APC. White paper, 2006.
[27] E. Rotem, J. Hermerding, A. Cohen, and H. Cain.Temperature measurement in the Intel (R) CoreTM DuoProcessor. Arxiv preprint arXiv:0709.1861, 2007.
[28] R. R. Schmidt, E. E. Cruz, and M. K. Iyengar.Challenges of Data Center Thermal Management. IBMJournal of Research and Development,49(4/5):709–723, 2005.
[29] R. K. Sharma, C. E. Bash, C. D. Patel, R. J. Friedrich,and J. S. Chase. Balance of Power: Dynamic ThermalManagement for Internet Data Centers. IEEE InternetComputing, 9(1):42–49, 2005.
[30] R. K. Sharma, C. E. Bash, and R. D. Patel.Dimensionless Parameters For Evaluation Of ThermalDesign And Performance Of Large-Scale Data Centers.In 8th ASME/AIAA Joint Thermophysics and HeatTransfer Conference, 2002.
[31] K. Skadron, M. Stan, K. Sankaranarayanan, W. Huang,S. Velusamy, and D. Tarjan. Temperature-awareMicroarchitecture: Modeling and Implementation. ACMTACO, 1(1):94–125, 2004.
[32] J. Srinivasan, S. V. Adve, P. Bose, and J. A. Rivers. TheCase for Lifetime Reliability-Aware Microprocessors.In ISCA ’04, pages 276–287.
[33] M. R. Stan, K. Skadron, M. Barcella, W. Huang,K. Sankaranarayanan, and S. Velusamy. HotSpot: aDynamic Compact Thermal Model at theProcessor-Architecture Level. Microelectronics Journal,34:1153–1165, 2003.
[34] F. Takahashi, Y. Hamada, T. Mori, and I. Hatta. ThermalCharacteristics at Interface of Bi2Te3/Sb2Te3Superlattices. Japanese Journal of Applied Physics,43(12):8325–8330, 2004.
[35] S. Velusamy, W. Huang, J. Lach, M. Stan, andK. Skadron. Monitoring temperature in FPGA basedSoCs. In ICCD 2005, pages 634 – 637.
[36] Y. Zhang, J. Christofferson, A. Shakouri, G. Zeng,J. Bowers, and E. Croke. On-Chip High SpeedLocalized Cooling Using SuperlatticeMicro-Refrigerators. IEEE Transactions on Componentsand Packaging Technologies, 29(2):395, 2006.
APPENDIXA. Modeling Heat Diffusion
From the second law of thermodynamics, we use equation (2), where A is thesurface area and n is the direction normal to it. T is the temperature distributionand k is the thermal conductivity of the material. We assume k to be a constantacross layer. It has been shown that the temperature dependence of thermal con-ductivity of silicon is low, and even a change is temperature by 20 C resultsin only 6.67% change in k, which does not affect the results significantly. Simi-larly, from Newton’s law of cooling we find equation (3) for convection heat lossfrom surface, where h is the convection-heat-transfer-coefficient, Tsur f ace is thetemperature at the surface and Tamb is the temperature a distance of infinity fromthat surface. Equation (2) and (3) can be rewritten in a continuous form as apartial differential equation as equations (4) and (5). In these two equations, Cpis the heat capacity (J/gmK), k is the thermal conductivity (W/mK) and ρ is thedensity (gm/m3) of the material. g(x,y,z, t) is the heat generation rate (J/m3s)at point (x,y,z), which includes the leakage and dynamic power. For simplicity,we assume k to be constant across a layer and g to be a step function inside thelayer. At the hot spot, g(x,y,z) is larger to other points by an order of magnitude.Transforming the equations to a discrete form we obtain equations (6) and (7),where Mx, My, Mz are linear operator in x, y and z directions as described inequation (8).
We assume that there is no heat flow towards the bottom of the die as the rateof heat flow in that direction negligible compared to other directions. We modelit by Neumann boundary condition where Mz is treated as 2× (T1,y,z − T0,y,z).Simplifying the equations further by assuming the unit length in all directions tobe same, we obtain equations 9 and 10. Thermoelectric cooler’s heat pumpingcapability is described by equation (12), where ρe is the electrical resistivityof the TEC material. In order to model the heat flow in TEC layer, followingthe law of conservation of energy, we rewrite equation (12) as equation (11).Rewriting the equation in a discrete form, we obtain equations (13) and (14).We approximate the solution by ignoring the x and y direction heat propagationthrough Peltier effect in thermoelectric cooling layer as the geometry dictatesflow in vertical direction primarily. The model has been simplified by assuming
that the thickness of the TEC layer is the length of the cubes in the 3D mesh. Thesimple explanation of the TEC layer is that the cold side absorbs the heat at thecold side and transmits to the hot side (which is larger in area and thus spreadsthe heat, reducing the peak temperature of the hot spot). The temperature at thecold side continues decreasing until the Peltier heat flux from cold to hot sideequals the conduction heat flux from hot side to the cold side. We solve thisproblem iteratively to find the stable temperature.
Rate o f conduction (W ) =−kA∂T∂n
(2)
Rate o f heat convection (W ) = hA(Tsur f ace−Tamb) (3)
ρCp∂
∂ tT (x,y,z, t) = ∇.[k(x,y,z, t)∇T (x,y,z, t)+g(x,y,z, t)] (4)
k(x,y,z, t)∂
∂nT (x,y,z, t) = h[T (x,y,z, t)−Tamb] (5)
T t+1 = T t +∆t(
kρCp
)[(Mx
∆x2 +My
∆y2 +Mz
∆z2
)T t]+∆t
gρCp
(6)
Tn = Tamb +(Tsur f ace−Tamb).e− hn
k (7)
MxTx,y,z = Tx−1,y,z +Tx+1,y,z−2.Tx+1,y,z (8)
T t+1 = T t +∆t(
kρCp
)[(1
∆x2
)(Mx +My +Mz)T t
]+∆t
gρCp
(9)
Tsur f ace+1 = Tsur f ace−∆x.hk.(Tsur f ace−Tamb) (10)
ρCp∂T∂ t
= ∇.1l
(0.5
α2
ρeT 2
cold−side−∇2.kT )
)(11)
q =1l
(0.5
α2
ρeT 2
cold−side− k(Thot−side−Tcold−side)
)(12)
T t+1cold−side = T t
cold−side +k∆t
ρCp∆x2 [(Mx +My +Mz)T t ]− ∆tρCp∆x2
α2
2ρeT 2
cold (13)
T t+1hot−side = T t
hot−side +k∆t
ρCp∆x2 [(Mx +My +Mz)T t ]+∆t
ρCp∆x2α2
2ρeT 2
cold (14)
In this work we use the explicit method and solve it by using a threshold forterminating simulation. We define steady state when the average temperature ofthe structure does not change by more than 1e−6 C.
B. Failure ModelIn this section we present the reliability model based on RAMP [32]. Two
major factors for processor failure, which have strong correlation with operat-ing temperature, are Electromigration and Time-dependent dielectric breakdown(TDDB). Stress migration, which arises due to mechanical stress and Thermalcycling, which is caused by processor state change (e.g. power state change,shut-down, power-up etc.), have lower effect than Electromigration and TDDBfor processors with small feature size [32]. Electromigration occurs due to masstransport of metal atoms in copper interconnects, resulting in depletion of metalin one region and pile up in other, which might lead to resistance variation oropen circuits. According to Black’s equation, mean time to failure at tempera-ture T with respect to temperature T can be modeled as equation (15), where Eais the activation energy and k is a constant depending on the interconnect metal.TDDB or gate-oxide breakdown is due to the breakdown of gate dielectric layerleading to a conductive path. MTTF due to TDDB, as shown in RAMP method-ology, could be modeled as equation (16), where V is the Vdd , and a, b, X, Yand Z are fitting parameters with values of 78,−0081,0.759ev,−66.8evK and−8.37e−4ev/K respectively (adapted from RAMP model [32]).
MT T FEM(T )MT T FEM(T )
= eEakT −
EakT (15)
MT T FT DDB(T )MT T FT DDB(T )
= (1V)(bT−bT )e
(X+Y/T+ZT )kT
− (X+Y/T+ZT )kT (16)
In a system with independent components, the failure of the chip will be re-lated to the fastest failing point in it. Therefore the probability of a working chipat time t can be formulated as Pworking(t) =
∏c∈C(1−CDFf ailure(c, t)), whereC represents all components in a chip and CDFf ailure(c, t) is the cumulative dis-tribution function for failure rate of component c at time t. MTTF due to Elec-tromigration follow lognormal distribution [18], for which we use σ = 0.25,and failures due to TDDB follow Weibull distribution [17], for which we usek = 9. We estimate MTTF of the processor when the probability of its workingis > 0.95. We have performed a sensitivity study on these parameters and foundsimilar correlation with processor reliability.