Embed Size (px)
Citation preview

F I F T Y F I F T H A N N U A L R E P O R T 1 9 9 9 I 2 0 0 0

contentsChairman’s Letter 4
Board of Directors 9
Management Discussion & Analysis 10
Corporate Governance 26
Shareholder Information 36
Highlights 40
Directors’ Report 43
Auditors’ Report 51
Balance Sheet & Profit and Loss Account 54
Reconcilitations under US GAAP & IAS 94
Bajaj Auto Holdings Ltd—22nd Annual Report 99

r i d i n g c h a n g e

highlights

Turnover at Rs.42,155 million — 7.9 per cent
higher than 1998-99
Profit before tax at Rs.8,252 million — 8.8 per
cent higher than 1998-99
Profit after tax at Rs.6,137 million — 13.5 per
cent more than 1998-99
Earnings per share at Rs.53.17 — up from
Rs.46.31 in 1998-99
Dividend for the year at Rs.10 per share, or
100 per cent of the face value
Reserves at Rs.30,847 million
State-of-the-art plant commissioned at Chakan
New products launched — a new Boxer, the
Saffire, M80 Major and a range of four-stroke
three wheelers using petrol and CNG

F I F T Y F I F T H A N N U A L R E P O R T 1 9 9 9 | 2 0 0 0
4
It was in last year’s annual report of your
company that I had first used a ‘Chairman’s
Letter’ to communicate with you the
performance, prospects and business focus of
Bajaj Auto. Several of you liked this innovation.
As your chief fiduciary, I, too, felt that this was a
useful way of discussing various aspects of the
company. Therefore, we have decided to
continue with the trend. In fact, the ‘Chairman’s
Letter’ and a detailed chapter on ‘Management
Discussion and Analysis’ will be a permanent
feature of Bajaj Auto Annual Reports.
The financial performance of your company
for 1999-2000 is not as good as I would have
liked it to be. On the plus side, your company
witnessed a 5 per cent increase in sales revenue in
1999-2000 — Rs.37,051 million compared to
Rs.35,269 million in the previous year. This
occurred despite a marginal decline in the
number of vehicles sold, and was caused by
growth of motorcycle sales, which is relatively
higher priced compared to traditional scooters
and other two-wheelers.
Your company’s profit after tax increased by
13.6 per cent from Rs.5,405 million in 1998-99
to Rs.6,137 million in 1999-2000. However,
this does not tell the story of operating profit. In
1999-2000, operating profit was Rs.5,827
chairman’s letter Dear Shareholders


million — less by Rs.610 million compared to
the previous year. This 9 per cent drop requires
explanation. Much of it is given in the
Management Discussion and Analysis that
follows. However, it is also my duty to give you
my views on this matter.
Before going any further, let me make one
thing very clear. Even today, your company’s
operating profit as a percentage of operating
income is higher than that of any two wheeler
company in India and, indeed, any company in
the automotive industry. Nevertheless, as the
chairman of your company, I am disappointed
with the fall in operating profits from 20.9 per
cent of operating income in 1998-99 to 18.2 per
cent in 1999-2000. And it is important for me to
explain why this has happened.
It has everything to do with ‘change’. As many
of you may be aware, the structure of the two-
wheeler market is changing at a rapid pace. Some
clear trends have emerged. The most important
of these is the marked change in the customer
profile. Younger people and those with
significantly greater purchasing power now
constitute an important segment of the market.
In turn, this has led to two significant
developments:
� First, there has been a major shift away from
scooters to motorcycles. Over the last five years,
the market for basic scooters has declined
marginally, while that of motorcycles has
increased at a compound annual rate of 25 per
cent. In 1995-96, almost 1.2 million scooters
were being sold, versus 661,000 motorcycles.
In 1999-2000, scooter sales clocked 1.1
million, while motorcycles had taken off to
cross 1.6 million.
� Second, even within the scooter segment, there
has been a shift away from traditional metal
bodied models to the sleeker scooterettes. In
1994-95, a little over 96,000 scooterettes were
sold. Five years later in 1999-2000, sales had
more than doubled to over 258,000.
It is no secret that Bajaj Auto’s mainstay was
the traditional, metal bodied, side-engine
mounted, kick-start scooters. Over the last five
years, the company has had to face a stagnant —
even declining — market for these models.
The writing was on the wall. We realised five
years ago that the days of resting easy on the high
margins from Chetaks and Supers were coming
to an end. Expanding the market for our basic
scooters would be necessary, but not sufficient in

F I F T Y F I F T H A N N U A L R E P O R T 1 9 9 9 | 2 0 0 0
7
the long term. We refused to be a great but
slowly shrinking scooter company. We had to
make major inroads into the motorcycle and
scooterette markets — and that required new
products, new branding, new marketing and new
investments.
In last year’s annual report, I had written that
over the last few years we had quietly started re-
engineering the company. What are these
changes?
It is useful to begin with changes that have
taken place in Bajaj Auto’s manufacturing
capacity and production processes. The Chakan
plant was commissioned in 1999-2000. Your
company’s desire to manufacture world class
products is exemplified by this new, state-of-the-
art facility, located approximately 20 kilometres
away from Akurdi. Chakan has already started
producing two sleek, new generation, plastic
bodied scooters — the 60 cc. Sunny Spice and
the 92 cc. Saffire. During 2000-01, the plant will
begin to produce a brand new motorcycle called
the Pulsar. In addition, capacity of the Waluj
plant is being substantially increased so that your
company can capitalise on the growing market
for quality motorcycles.
During 1999-2000, your company launched
several new products: the Saffire, the new 100 cc.
four-stroke Boxer, the new M80 Major and four-
stroke three wheelers. Launched in the first half
of the year, the Boxer and the M80 Major are
already major success stories. An aggressively
priced, rugged product, the Boxer is primarily
targeted at the rapidly growing rural and semi-
urban markets, and has notched very impressive
sales within the first eight months of its launch.
The M80 Major has helped us to increase our
market share in the step-thru segment.
The year 2000-01 will see four new two-
wheelers: two motorcycles (the Pulsar and the
175 cc. Eliminator), a four-stroke version of the
M80, and an entirely new look 150 cc, four-
stroke scooter called the Fusion. Many more
models are in the pipeline.
How have these changes affected your
company’s operating profits for 1999-2000? The
answer lies in the change in product mix. As
explained earlier, motorcycles and scooterette
markets are expanding, and Bajaj Auto must
aggressively go after these markets. However, the
fact is that motorcycles and scooterettes enjoy
lower margins compared to traditional scooters.
Reading the Management Discussion and
Analysis will substantiate that this is one of the
major factors behind the fall in operating
margins.
Increasing competition invariably leads to a
decline in margins per unit of sale. But that does
not necessarily translate to a fall in overall
operating profits. Bajaj Auto has a definite
strategy in place to increase the top line, market
share, operating profits and the bottom line. It
consists of four major components:
� Aggressively expanding the traditional scooter
market. It is a very profitable segment and
cannot be ignored. We will pursue market
expansion by introducing new four-stroke
models and offering attractive finance schemes.
I do not believe that this market will die the way
some pundits have predicted. A country of a
billion people shall always have enough
families who will begin their motoring lives
with traditional, low cost scooters. The trick is
to target these people.
� Rapidly ramping up capacities and production
of motorcycles and new generation scooters
and scooterettes. This is a major area where we
will target higher top line growth and greater
market share.
� Actively optimise on input costs, especially of
bought out items. In 1998-99, Bajaj Auto
launched an ambitious vendor development
During 1999-2000,
your company launched
several new products:
the Saffire, the new 100
cc. four-stroke Boxer,
the M80 Major and
four-stroke three
wheelers. Of these, the
Boxer and the M80
Major are already major
success stories.

8
programme called Scorpio, aimed at improving
quality of supplies, enhancing product
development capability of vendors, and
reducing costs by restructuring the vendor
base. I believe that Scorpio will play a role in
enhancing quality at lower unit costs.
Moreover, Bajaj Auto’s Cell-level Cost
Management (CCM) activity has yielded cost
savings in power consumption, cutting tools
and consumables. It will be extended across-
the-board to all elements of the manufacturing
process.
� More global technology tie-ups. These will play
a major role in developing and commercially
launching new models in successively shorter
time cycles.
It is important for us to realise that the process
of change which I have described takes some
time. In the interregnum, there can be
occasional blips in financial performance.
Moreover, while the operating margin per unit of
two-wheeler sold is unlikely to be as high as in
the good old days, the strategy outlined above
should eventually deliver higher overall profits.
Now it is time for me to discuss the issue of
share buyback. Last year, I had written that
buyback is not a closed chapter at Bajaj Auto.
Accordingly, at a meeting held on 28 March
2000, the board of directors of your company
approved a buyback of around 18 million shares
at a price not exceeding Rs.450 per share, or a
budget of Rs.8,100 million. The company’s
philosophy behind the buyback is
straightforward. It gives those shareholders who
wish to exit a fair price, without hurting the
interest of the very many who wish to continue
with the company.
Even so, you might ask what your company
proposes to do with its additional surplus funds.
The coming years will see much more intense
competition in the two-wheeler market. Two
international players are entering the arena:
Piaggio and Honda. Your company is
determined to do everything that is needed to
fight for greater market share in a far more
competitive milieu. This requires funds — for
capacity creation, brand building, market
expansion, new dealer and distribution services,
maintaining prices, export efforts, collaborating
with partners for new products and technologies,
and for financing mergers and acquisitions that
are sure to become a reality. Bajaj Auto’s surplus
is one of its weapons to fight competition. We
will use this weapon judiciously to ensure that
you — the shareholder — are a long term gainer.
Your company’s commitment to corporate
governance is as strong as always. Last year, we
had benchmarked ourselves vis-à-vis the code
published by the Confederation of Indian
Industry. This year, we have measured ourselves
against the new SEBI code as well, which will
come into effect from 2000-01.
Times are changing. Let me assure you that
Bajaj Auto will lead this change. We are here to
stay, to grow, and to remain a household name in
India.
R A H U L B A J A J
Chairman and Managing Director
Your company is
determined to do
everything that is
needed to fight for
greater market share in
a far more competitive
milieu. This requires
funds — for capacity
creation, brand
building, market
expansion, new dealer
and distribution
services, maintaining
prices, export efforts,
collaborating with
partners for new
products and
technologies...

F I F T Y F I F T H A N N U A L R E P O R T 1 9 9 9 | 2 0 0 0
9
Board of Directors
Rahul BajajChairman and Managing Director
D. S. Mulla
Viren J. Shah(up to 30 November 1999)
Kantikumar R. Podar
Atul C. Kirloskar
Shekhar Bajaj
Madhur BajajExecutive Director
D. J. Balaji Rao
D. S. MehtaWhole time Director
J. N. Godrej
S. H. Khan
Secretary
N. J. Joshi
Auditors
Dalal and ShahChartered Accountants
International AccountantsKPMG
Cost Auditors
A. P. RamanCost Accountant
Bankers
Central Bank of India
State Bank of India
Citibank N.A.
ANZ Grindlays Bank
Bank of America
Registered under The IndianCompanies Act, VII of 1913
Registered Office
Akurdi, Pune, 411 035
Works� Akurdi, Pune, 411 035
� Bajaj Nagar, Waluj,Aurangabad, 431 136
� Chakan Industrial Area,Chakan, Pune 410 501
Management
Rahul BajajManaging Director
R. A. JainExecutive Director
Madhur BajajExecutive Director(w.e.f. 17 May 2000)
D. S. MehtaWhole time Director
Rajiv BajajPresident (w.e.f. 17 May 2000)
Ranjit GuptaVice President (HRD)
C. P. TripathiVice President (Waluj)
R. L. RavichandranVice President (Business andProduct Development)
N. H. HingoraniVice President (Purchase)
G. B. LaddhaGeneral Manager (Finance)
From left: C.P. Tripathi, R.L. Ravichandran, Rahul Bajaj, Ranjit Gupta, Madhur Bajaj, Rajiv Bajaj, D.S. Mehta, N.H. Hingorani, R.A. Jain

THE THEME OF THIS YEAR’S ANNUAL REPORT IS
‘CHANGE’. Not surprisingly, Bajaj Auto’s
Management Discussion and Analysis looks at
three major aspects of change. The first relates to
the market place. What are the changes that have
occurred in the market in the last decade? How
have these accelerated in the past few years? And
what do they mean for Bajaj Auto’s marketing,
production, branding and sales strategies? The
second describes changes in operations. To what
extent has the company re-engineered itself and
streamlined its production processes to deal with
today’s and tomorrow’s changes in the market?
10
management discussion and analysis

F I F T Y F I F T H A N N U A L R E P O R T 1 9 9 9 | 2 0 0 0
11
1600000
1400000
1200000
1000000
800000
600000
400000
200000
Scooters Motorcycles (left axis)
19
90
19
91
19
92
19
93
19
94
19
95
19
96
19
97
19
98
19
99
20
00
3500000
3000000
2500000
2000000
1500000
1000000
500000
Two Wheelers ( Right Axis)
CHART A |OvertakingComposition Shifts in the Two WheelerMarket, units sold
The third and final aspect relates to financial
performance. How have changes in the market
and product-mix affected the company’s
bottom-line? How much of this is part of a
planned process of transition? And what does the
future hold for the financials of Bajaj Auto?
While much of this chapter focuses on 1999-
2000 — the year under review — it also goes
backward and forward in time. We believe that
Bajaj Auto’s performance in 1999-2000 cannot
be looked at in isolation. It reflects a planned
transition from the company’s image of being a
mega-producer of sturdy workhorse scooters and
three-wheelers to an integrated, highly flexible
and market driven supplier of various models of
scooters, scooterettes, motorcycles, step-thrus
and three-wheelers — where each model focuses
on capturing large shares of highly
heterogeneous and differentiated product
segments. Such transition takes time. It also
carries additional costs. But it is inevitable, and
must be implemented in dead earnest for Bajaj
Auto to recapture the imagination of this
country.
Markets
To appreciate the changes that have occurred at
Bajaj Auto during the last year, and understand
why these will intensify in the future, it is
necessary to recognise the transformation that is
taking place in India’s two-wheeler market.
Three major factors are driving the change in
market structure:
▼ Significant growth in disposable income in
urban as well as rural India. This has led to a
quantum jump in consumer demand for better
two-wheelers — vehicles with good looks,
greater power and higher quality, but with fuel
economy as well.

▼ Sharp growth in the population of 18-25 year
old consumers. This category is buying more
‘wheels’ than before.
▼ Major shifts in consumer preference. The most
fundamental is the shift from scooters to
motorcycles. Less important but not
insignificant is the shift within the scooter
market from the ‘perennial hardies’ to the
sleeker stuff.
These changes were imperceptible five years
ago. Today, they are obvious even to a casual
observer of the market. The simplest indicator of
change is apparent in Chart A. After a dip during
1991-92 and 1992-93, the two-wheeler market
has been growing at a compound annual rate in
excess of 14 per cent. This growth has been
driven largely by a huge expansion in the market
for motor cycles. In 1992-93, motor cycles
accounted for just a bit over 20 per cent of the
market, while scooters had the pride of place at
47 per cent. The tables have turned. In 1999-
2000, motor cycles accounted for almost 43 per
cent of the sales of 3.78 million two-wheelers; the
share of scooters was down to 29 per cent
Changes in market composition are not limited
to scooters versus motorcycles. These permeate
to scooters as well, and have created a distinct
product-customer-market category for
scooterettes. Interestingly, it was Bajaj Auto that
created the scooterette segment in India with the
launch of Sunny in the last quarter of 1990-91. In
1991-92, total sale of scooterettes was 34,574
units. Today, there are five players in the market;
total sale of scooterettes in 1999-2000 was
258,458 units; and this segment now accounts
for 19 per cent of the combined sale for scooters
and scooterettes. See chart B.
These two charts suffice to illustrate the extent
to which the two-wheeler market has changed in
India over the last decade. Indeed, the change has
been much more pronounced over the last five
years, and the process will accelerate in the future.
At the margin, one class of consumers will
increasingly opt for various types of motor cycles,
while another growing customer segment will
prefer sleek scooterettes.
How has the company responded to the
changing market environment during the year
under review? And what does it propose to do in
the future?
Traditional scooters
Scooter is a good starting point for this
discussion. It is hardly a market secret that
traditional, metal bodied, geared, kick-start
scooters are Bajaj Auto’s most profitable two-
wheelers. These are hardy, no-frills, utility
vehicles — the workhorse of the Bajaj stable.
They are very attractively priced, and Bajaj Auto
continues to dominate this market in no
uncertain terms.
This market is serviced by two producers: Bajaj
Auto and LML. Two features are evident from
Chart C. First, that the sale of traditional scooters
has been stagnating, if not declining over the last
four years. Second, despite the decline, Bajaj
Auto still has almost 75 per cent market share in
this segment.
What is Bajaj Auto’s strategy for its traditional
scooters — the company’s large and highly
profitable ‘bread-and-butter’ product line? The
company has set a simple goal: to aggressively
expand and excite the market via well-targeted
sales promotion schemes, and through the
launch of a new range of scooters.
In December 1999, Bajaj Auto introduced a
scratch-card scheme called the Crorepati
Hungama to promote the sale of scooters. The
scheme was popular, and generated record
scooter sales for December 1999 and January
F I F T Y F I F T H A N N U A L R E P O R T 1 9 9 9 | 2 0 0 0
1200000
900000
600000
300000
1990
1991
1992
1993
1994
1995
1996
1997
1998
1999
2000
Scooters Scooterettes
111000000
800000
600000
400000
200000
1990
1991
1992
1993
1994
1995
1996
1997
1998
1999
2000
Bajaj LML
CHART C |Still LeadingTraditional Scooter Sales, units sold
CHART B |The Growing Market forScooterettesScooterettes vs Scooters, units sold
12


2000. The company has also launched a new low-
cost ‘999’ financing scheme for scooters.
These measures seem to be paying off. In the
first half of 1999-2000, Bajaj Auto’s scooter sale
was 342,145 units, and its market share was 65
per cent. During the second half, when these
schemes kicked in, sales increased by 16 per cent
to 397,914 units, and market share rose to 68 per
cent. Although it is too early to predict whether
this upturn in Bajaj Auto’s sales and market share
will continue through 2000-01 and beyond, the
company is determined to leverage its powerful
financial resources to constantly expand the
traditional scooter market and regain market
share.
Regarding the new models of scooters the
company’s strategy is to capture higher shares by
better market positioning. This refers to the
Classic SL, Bravo, as well as four-stroke models
such as Legend and the new Saffire, which has
begun to be produced in the new state-of-the-art
plant at Chakan.
With the April 2000 emission norms for two-
wheelers — which rank among the toughest in
the world — scooter manufacturers will have only
two choices open to them. They can either
manufacture existing two-stroke vehicles with
catalytic converters, or produce four-stroke
scooters. Here, Bajaj Auto is in a uniquely
advantageous position of not only having all its
two-stroke vehicles fitted with catalytic
converters, but also having two four-stroke
models already in the market — the 145 cc. four-
stroke Legend and the brand new 92 cc. Saffire.
In addition, the third quarter of 2000-01 will see
yet another new look, four-stroke scooter — the
150 cc. Fusion. Bajaj Auto believes that the
combined effect of the Legend, Saffire and
Fusion will create substantial new demand in the
market for scooters.
Scooterettes
As mentioned earlier, Bajaj Auto created the
market for scooterettes when it introduced the
Sunny in 1990-91. Up to 1993-94 there were no
competitors. Thereafter, the market saw the entry
of TVS Scooty and Kinetic Pride. With
competition, the overall market expanded from a
SAFFIREProduced exclusively in Bajaj Auto’s brand new Chakan plant,
the sleek new Saffire has a 92 cc. four-stroke centrally mounted
engine that generates six horsepower at 7,000 rpm. It has a
three-speed automatic transmission, high fuel efficiency and
comes at an unbelievable price.
14
SPIRITLaunched in 1998-99, the
60 cc. Spirit has won the
Scooter of the Year Award
2000 and the Best
Indigenous Product
Design of the Year Award
by Overdrive, an automo-
bile magazine.

F I F T Y F I F T H A N N U A L R E P O R T 1 9 9 9 | 2 0 0 0
little over 68,000 in 1993-94 to over 258,000 in
1999-2000.
For nine years, Bajaj Auto had only the Sunny
to offer in this segment. Not surprisingly, the
company’s sales fell from a peak of almost 74,000
units in 1994-95 to a bit under 48,000 in 1998-
99. Last year, there was a shift in strategy, when
Bajaj Auto introduced the Spirit — an attractive,
contemporary looking 60 cc. model with two-
speed automatic transmission and electric start.
Thanks to the success of Spirit, Bajaj Auto’s
scooterette sales have jumped by almost 45 per
cent from 47,844 units in 1998-99 to 69,192
during the year under review. This growth
exceeded the industry average of 41 per cent.
April 2000 saw the launch of a totally re-
designed version of Sunny called the Sunny Spice.
It has a 60 cc. two-stroke engine fitted with a
catalytic convertor, and generates 3.6
horsepower at 6,500 rpm. The Sunny Spice has a
single speed automatic transmission and electric
starter. It is expected that the combined presence
of Spirit and Sunny Spice will not only boost Bajaj
Auto’s scooterette sales in the future, but also
increase the company’s market share in this
category.
SUNNY SPICEA cute 60 cc scooterette with an electric starter and an automatic
transmission, the Sunny Spice was introduced in April, 2000.
15


Motorcycles
This is where the action is, and will be in the years
to come. Chart D shows the size of the two-
wheeler market, which has been growing at a
compound annual rate of 7.9 per cent over the
last decade. Motor cycles have grown at 15.8 per
cent over the same period. In fact, the growth has
been much more pronounced over the last five
years — over 25 per cent per year between 1994-
95 and 1999-2000. Consequently, motorcycles
account for the largest chunk of the two-wheeler
market. In 1989-90, its market share was 21 per
cent; in 1999-2000, this has more than doubled
to 43 per cent.
The exponentially growing demand for
motorcycles is not confined to urban India.
Depending upon models and their
characteristics, motorcycles have swept rural,
semi-urban and urban India in a way that would
have been inconceivable even a few years ago.
Being a scooter manufacturer, Bajaj Auto was a
relatively late entrant in the game of four-stroke
motorcycles. Up to 1997-98, the company had
only two models on offer: the two-stroke RTZ
and the four-stroke 4S Champion. In the
meanwhile, competitors introduced new models.
Thus, while Bajaj Auto’s market share was rising
imperceptibly, it didn’t produce the kind of
volumes needed to be the number one or a
serious number two in this segment.
As of 1998-99, Bajaj Auto’s motorcycle
strategy has undergone a sea change. The
company’s objective now is to be a major player
in the motorcycle segment through the
introduction of a wide range of new models —
each catering to different market segments.
June 1998 saw the launch of the Caliber, a 111
cc. four-stroke motorcycle. The model has been
well appreciated by customers. Caliber sold its
first 100,000 units within the first twelve months;
the second 100,000 was sold within nine months.
The year under review saw Caliber sales of
149,986 units.
The other major success has been the Boxer. A
new variant of Boxer launched in August 1999
was primarily targeted for the rapidly growing
rural and semi-urban markets. A very rugged
product with a 100 cc. four-stroke engine, this
variant has been very aggressively priced to
rapidly increase market penetration and, thus,
ramp up volumes. In the short period of eight
months in 1999-2000, the Boxer has sold 71,108
units.
Bajaj Auto’s motorcycle sales during the year
under review were 255,176 units, versus 200,183
in 1998-99. There has been a distinct increase in
the growth rate of the company’s motorcycle
sales between the two halves of 1999-2000. The
first half saw a sales of 99,241 units, while the
sales in second half were 155,935 — driven
largely by the success of the Boxer.
As Chart F shows, there has been a distinct shift
in favour of motorcycles in Bajaj Auto. In 1989-
90, motorcycles accounted for a bit over 5 per
cent of its total volume of two-wheeler sales. By
1999-2000, this share had risen to almost 21 per
cent. The share of motorcycles would have been
even greater during the year under review had the
company not faced capacity constraints at the
company’s Waluj plant. In 2000-01, this
constraint will be a thing of the past. The Waluj
capacity is being enhanced to produce
approximately 700,000 motorcycles per year.
Moreover, additional capacity is being installed at
the Chakan plant.
In order to increase presence as well as market
share of Bajaj Auto’s motorcycles, the company
proposes to introduce two brand new models in
2000-01. These are:
▼ The Pulsar. There will be two variants of this
four-stroke model. Both have been developed
in collaboration with Tokyo R&D, and will be
F I F T Y F I F T H A N N U A L R E P O R T 1 9 9 9 | 2 0 0 0
3500000
3000000
2500000
2000000
1500000
100000
500000
19
90
19
91
19
92
19
93
19
94
19
95
19
96
19
97
19
98
19
99
20
00
CHART D |Two Wheelers Still Zoom…The two wheeler market, units sold
CHART E |…with Motorcycles Rulingthe Roost%share of total two wheeler market
17

produced at the Chakan plant. The Pulsar is
scheduled for launch in the third quarter of
2000-01.
▼ The Eliminator. This will be a 175 cc four-
stroke chopper style motorcycle with a five
speed gearbox. It will produce 16 horsepower
at 8,500 rpm. Developed by Kawasaki, the
Eliminator is also slated for launch in the third
quarter of 2000-01.
The company has a well-defined motorcycle
strategy that will become apparent with every
passing year. The company will continuously
introduce new products, have a presence in every
price band of this segment, use its financial
strength to aggressively increase manufacturing
capacity, and aim to be a major player in the
motorcycle market.
Step-thrus
Bajaj Auto is the leader in this segment, and
accounts for almost 64 per cent of the market.
During the year under review, Bajaj Auto sold
176,194 units, versus 182,581 in 1998-99. In
the second half of 1999-2000, the company
introduced the M80 Major, which is an upgrade
of the tried and tested M80. This was well
received and in a shrinking overall market
segment, helped Bajaj Auto increase its market
share from 58.5 per cent in the first half of 1999-
2000 to 68.4 per cent in the second half. The
year 2000-01 will see the launch of a four-stroke
version of the M80.
Three-wheelers
Bajaj Auto continues to dominate this market,
with a share of 81 per cent. The problem with this
market, however, is that it is by and large stagnant
at around 215,000 vehicles per year. Much of this
stagnancy is due to regulatory regimes of various
state governments and municipal authorities,
which are the source of licensing for auto-
rickshaws.
In order to grow this market and to reduce
pollution, Bajaj Auto has environmentally re-
engineered its three-wheelers. It has launched a
range of four-stroke petrol and diesel models,
and has recently introduced the CNG version.
The LPG version is also under development.
During the year under review, the company sold
171,977 three-wheelers, compared to 181,452
in 1998-99.
Operations
Chakan — the plant for the future
Commissioned during 1999-2000, nothing
demonstrates Bajaj Auto’s desire and ability to
manufacture world class products more than its
new, state-of-the-art manufacturing facility at
Chakan. Situated around 20 kms away from its
Akurdi plant, Chakan has a built up area of over
55,000 square metres. The plant has a targeted
output of 600 vehicles per direct employee year,
compared to 160 at Akurdi.
Created out of barren land, Chakan’s super-
clean epoxy painted floors, controlled air
environment, flexible machining centers and
lines, and fully computerised equipment blend
harmoniously with its landscaped surroundings.
Chakan sets the tone for Bajaj Auto’s totally new
ethos aimed at world class production quality and
efficiency.
In the first instance, the plant has been
producing two new products — the Saffire and
the Sunny Spice. In 2000-01, the plant will also
produce the Pulsar and the Spirit.
Capacities
During the year under review, Bajaj Auto has
spent Rs.2,956 million on its plants at Akurdi,
18
19
90
19
91
19
92
19
93
19
94
19
95
19
96
19
97
19
98
19
99
20
00
20.9
16.3%
12.1%
10.5%
7.8
%7
.4%
6.1
%
4.1
% 4.9
%
5.1
%
5.1
%
300000
250000
200000
150000
100000
50000
Bajaj Total step thru market
19
90
19
91
19
92
19
93
19
94
19
95
19
96
19
97
19
98
19
99
20
00
CHART F |AcceleratingMotorcycles as % of number of twowheelers sold by Bajaj Auto
CHART G |Stepping UpBajaj Auto’s share of the Step thru marketin numbers

Waluj and Chakan for improving productivity
and quality, and enhancing capacities. Most of
this investment was in creating flexible facilities,
keeping in mind the current trend of reduced
product life cycles in the market. Flexibility also
facilitates quick improvements and upgrades in
products. The installed capacity across the three
plants is shown in Table 1.
However, this capacity is not enough,
especially for motorcycles. Bajaj Auto is
expanding its motorcycle capacity to 50,000
vehicles per month (600,000 per year) by
September 2000, and then onto 70,000 per
month (840,000 per year) by July 2001. This
expansion is being process engineered by
Kawasaki who will implement Kawasaki systems
and controls. The company is also in the process
of tying products with plants to optimise output
and simplify production planning.
Productivity and quality improvements
Bajaj Auto has adopted Total Productive
Maintenance (TPM), a process that continuously
sets new standards for quality and productivity
through the elimination of losses. Under the
guidance of the Japanese Institute of Plant
Maintenance (JIPM), the company adopted
TPM at its Akurdi plant on 11 March 2000. The
exercise has started with a pilot project in the
press and gear shops, and will be extended to
other shops in Akurdi as well as plants in Waluj
and Chakan in the coming years.
Bajaj Auto has continued its efforts to improve
productivity through better utilisation of man
and machine. These have occurred due to two
factors: value engineering initiatives which were
identified and implemented by members at the
F I F T Y F I F T H A N N U A L R E P O R T 1 9 9 9 | 2 0 0 0
19
TABLE 1 | Plant Capacities
Plant Capacity as at 31 March 2000in units per year
Akurdi 1,000,000
Waluj 1,000,000
Chakan 90,000
Total 2,090,000
TPM declaration
We at Bajaj Auto adopt "Total Productive
Maintenance" as a means of creating a safe
and participative work environment in which
all employees target the elimination of losses
in order to continuously enhance the
capacity, flexibility, reliability and capability
of its processes, leading to higher employee
morale and greater organisational
profitability.

20
cell level; and a focused off-loading of non-
critical manufacturing activities. Efficiency
improvement shows up in the steady decline in
employee requirement per vehicle produced at
Akurdi (Table 2).
Cost management
The Cell-level Cost Management (CCM) activity
has resulted in a per vehicle saving of around 5
per cent in power consumption, 10 per cent in
cutting tools consumption and around 12 per
cent in direct consumables consumption. CCM
was expanded during the year to cover direct
material costs, so as to identify, measure and
eliminate rejections.
Bajaj Auto also uses the target costing
methodology. This procedure estimates and
iterates vehicle cost at the design stage — which
ensures that the costing of the final product is in
line with pre-planned vehicle pricing and
profitability. Started in 1996, target costing has
helped to reduce final costs of Bajaj Auto’s new
diesel version of the rear engine three-wheeler
(called the RE-Diesel) by as much as 10 per cent.
As the method has evolved, the initial costing
estimates have improved considerably, leading to
reductions in final costs of products like the Spirit
and Legend by around 5 per cent.
Our partners — vendors and dealers
Over the last few years, Bajaj Auto has
consciously increased the proportion of out-
sourced components in its products. For one, this
is often cheaper than producing in-house. For
another, this helps the company to concentrate
on what matters — assembly operations and the
manufacture of precision components. Today,
over 80 per cent of total material cost of a ‘typical’
Bajaj Auto vehicle consists of bought out
components. Given this ratio, vendors naturally
play a key role. The improvement in the quality of
Bajaj products reflects the ability of our vendors
to enhance their manufacturing systems and
quality standards.
In 1998-99, Bajaj Auto launched the pilot
phase of an ambitious vendor development
programme called Scorpio. It was aimed at
improving quality of supplies, enhancing
product development capability of vendors, and
reducing costs by restructuring the vendor base.
Last year and in 1999-2000, Scorpio targeted
vendors of electricals, forgings and cutting tools.
During 2000-01, Scorpio will be expanded to
cover the entire range of raw materials, tools, and
stores and spares. All initial indicators point to
satisfactory progress.
Dealers are Bajaj Auto’s other major partners.
The company feeds its 378 dealers through its
three plants as well as from 12 depots spread
across the country. An approach to having
standardised dealer showrooms was launched a
few years ago. As of now, 111 dealers have
completed the process, with remaining expected
to do so by the end of 2000-2001. The company
has 1,304 authorised service centers across the
country to provide efficient and effective after
sales service within easy reach of the customer.
Already, over 240 dealers communicate with the
company through e-mail. During 2000-2001 a
larger number will move on to the internet
exchange that is being planned.
Finance
Bajaj Auto’s turnover for the year under review
was Rs.42,155 million, compared to Rs.39,072
million in 1998-99 — a top line increase of 7.9
per cent in the course of a year. Sales from
vehicles and parts for 1999-2000 accounted for
Rs.37,051 million versus Rs.35,269 million in
1998-1999, and represented an increase of 5.1
TABLE 2| Fewer Workers
Workers per vehicle; Akurdi
Worker per vehicle
April 1997 2.25
April 1998 2.19
April 1999 2.07
April 2000 1.59

F I F T Y F I F T H A N N U A L R E P O R T 1 9 9 9 | 2 0 0 0
per cent. The rest of the turnover was accounted
for by ‘Other Income’, which grew by over 34
per cent from Rs.3,803 million in 1998-99 to
Rs.5,104 million in 1999-2000.
Despite a fall in volumes by 0.8 % — from
1,423,501 units in 1998-1999 to 1,412,598
units in 1999-2000, the value of sales registered a
growth of 5.1%. This is attributed to the change
in product mix in favour of motorcycles, which
are relatively higher priced compared to
traditional scooters and other two-wheelers. The
year under review saw motorcycles account for
22.6 per cent of the value of total sales, compared
to 18.9 per cent in 1998-99.
Analysis of sales
Table 3 gives the break-up of sales in volume as
well as value across Bajaj Auto’s various product
categories.
The figures in Table 3 emphasise the discussion
in the section on markets. The year under review
has seen a sharp fall in the volume and value of
sales of traditional scooters — which reflects the
overall market shift from scooters to motorcycles
on the one hand and sleeker scooterettes on the
other. Bajaj Auto’s volume of scooter sales has
dropped by 8.8 per cent; and value has dropped
by 5.5 per cent. Equally, the shift in market
preferences helped the company to more than
make up for the loss in scooters by a growth in the
volume and value of scooterettes and
motorcycles sales. The value growth in
scooterette sales alone recouped 77 per cent of
the loss on account of traditional scooters. And
the rise in motorcycle sales was more than double
that of the fall in the value of scooter sales. Had
Bajaj Auto not faced acute capacity constraints in
its Waluj plant in the last quarter of 1999-2000
— when the demand for motorcycles was at its
peak — the company could have notched a
significantly higher sales figure.
TABLE 3 | Break up of Sales | VALUE IN RS. MILLION
1999-2000 1998-1999 % to total valueProduct Units Value Units Value 1999-2000 1998-1999
Scooters 740059 13824 811441 14636 37.3% 41.5%
Japanese motorcycles 255176 8360 200183 6680 22.6% 18.9%
Step-thrus 176194 3078 182581 3058 8.3% 8.7%
Scooterettes 69192 1269 47844 640 3.4% 1.8%
Three-wheelers 171977 8583 181452 8408 23.2% 23.8%
Total vehicles 1412598 35114 1423501 33422 94.8% 94.7%
Spare parts NA 1937 NA 1847 5.2% 5.3%
Total sales 1412598 37051 1423501 35269 100.0% 100.0%

Summarised profit and loss account
for 1999-2000
Before discussing what the changed product- and
sales-mix has meant for the company’s bottom
line, it is useful to give a brief overview of Bajaj
Auto’s profit and loss account for the year under
review. This is given in Table 4.
At first glance, the results for 1999-2000 look
disappointing compared to the previous year.
Operating profits have fallen by 9.5 per cent —
from Rs.6,437 million in 1998-1999 to Rs.5,827
million for the year under review. Sceptics may
only see the hefty Rs.1,400 million increase in
non-operating income when accounting for the
higher pre- and post-tax profits relative to last
year.
And yet, the very same figures tell the story of
the beginnings of a major shift in sales strategy,
brand building and market positioning for the
changing two-wheeler environment. The clue is
to be found in sales and after sales expenses. In
1998-99 this accounted for Rs.1,972 million.
This year it has increased by Rs.533 million to
Rs.2,505 million. Why so?
Almost 57 per cent of this increment is due to a
rise in advertisement and brand building outlay,
and another 35 per cent is on sales promotion
programmes. The fact is that the days of selling
two-wheelers without systematic advertisement
campaigns and promotions are things of the past.
Today’s consumers have far more choices than
before. In order to create market bridgeheads,
Bajaj Auto will have to spend more on
advertisement and brand awareness, buttressed
by well targeted sales promotion campaigns. Of
course, the per unit selling cost will fall as new
models establish the required volumes.
The other determinant of the fall in operating
profit is the change in product mix away from
traditional scooters to motorcycles. The material
cost element in Bajaj Auto’s motorcycles is
comparable to the industry while in traditional
scooters it is far lower than the industry average.
Also, the company’s material cost for scooters is
significantly lower than for its motorcycles.
Hence, every substitution at margin from a
Chetak or a Classic to a Caliber or a Boxer raises
material costs. Indeed, much of the growth in
material costs — from 57.5 per cent of operating
income in 1998-99 to 58.9 per cent in 1999-
2000 — is attributable to the change in product-
mix in favour of motorcycles vis-a-vis traditional
scooters.
In the medium term, this effect can be
countered by two strategies. First, to use a
22
TABLE 4| Profit and loss for 1999-2000
compared to the previous year
In Rs. millions 1999-2000 1998-1999
Sales 37051 35269
Less: Excise duty 6078 5649
Net sales 30973 29620
Other operating income 1053 1152
Total Operating Income 32026 30772
Cost of materials, net of expenses capitalised 18864 17705
Share of material cost 58.9% 57.5%
Stores and tools 546 555
Share of stores and tools 1.7% 1.8%
Employee cost 2347 2309
Share of employee cost 7.3% 7.5%
Factory and administrative expenses 1937 1794
Share of factory and administrative expenses 6.1% 5.9%
Sales and after sales expenses 2505 1972
Share of sales and after sales expenses 7.8% 6.4%
Total expenditure 26199 24335
Operating profit 5827 6437
Operating profit as share of total operating income 18.2% 20.9%
Interest 41 46
Depreciation 1453 1327
Net operating profit 4333 5064
Non-operating income 4051 2651
Non-operating expenses 132 130
Profit before tax 8252 7585
Provision for taxation 2115 2180
Profit after tax 6137 5405
Prior years adjustments 211 123
Disposable surplus 6348 5528

F I F T Y F I F T H A N N U A L R E P O R T 1 9 9 9 | 2 0 0 0
23
combination of advertisement campaigns and
cost-effective sales promotions to excite the
traditional scooter market. And second, to build
strong motorcycle brands which can then
demand higher unit values for better quality and
greater customer satisfaction. Even so,
shareholders must appreciate that competition is
about higher productivity, greater volumes, and
about exerting pressures on margins. What is
true for the rest of the world cannot be an
exception for Bajaj Auto.
A positive element in the company’s cost
structure is the fall in employee cost — from 7.5
per cent of operating income in 1998-99 to 7.3
per cent during the year under review. Ongoing
measures initiated to control costs through Cell-
level Cost Management have also resulted in a fall
in unit cost on account of stores and tools.
To comply with the revised accounting
standards AS-2 issued by the Institute of
Chartered Accountants, Bajaj Auto has changed
its method of valuation of stocks from direct cost
basis to full absorption basis. This has raised
closing stock valuation, and hence profits, by
Rs.142.2 million. Another difference in
valuation incorporates changes in accounting of
excise duty on the closing stock of finished
goods. This, however, is fully revenue neutral
and does not affect profits either way.
During the course of the year, Bajaj Auto
capitalised a cumulative outlay of Rs.38.9 million
on account of expenditure incurred during the
construction phase of the Chakan project.
Cash flows
The summarised cash flow statement for the year
in review is given in Table 5.
Long Term Debt
Bajaj Auto is debt-free and carries no interest
bearing borrowings. The amount of Rs.3,864
million represents sales tax collected by the
company under the Government of
Maharashtra’s package schemes of incentives for
undertakings set up in identified backward
zones. These schemes cover the Waluj and
Chakan plant. Of this amount of Rs.3,864
million, the sales tax incentive for 1999-2000
amount to Rs.867 million. The accumulated
sales tax incentives are interest free and repayable
in five/six equal annual instalments after a period
of ten/twelve years. Repayment commences
from 1st May 2002.
Surplus funds
At the end of 1998-99, Bajaj Auto’s surplus
funds stood at Rs.20,897 million. This year, the
surplus has risen to Rs.24,811 million. Given its
size, it is important to explain the company’s
philosophy about managing this surplus.
In the Management Review of last year’s
annual report, it was written, “The guiding
principle of the company’s investment strategy
has been that of prudence.” This principle
TABLE 5|Cash flow of Bajaj Auto |IN RS. MILLION
1999-2000 1998-99
From operations
Inflows:
Cash from operating activities 3,315 3,298
Increase in Sales tax deferral 867 794
Sub-total 4,182 4,092
Outflows:
Capital expenditure, net (3,279) (2,240)
Dividend paid (949) (953)
Repayment of Fixed deposits and debentures (12) (152)
Sub-total (4,240) (3,345)
Net Change (A) (58) 747
From non-operating activities
Inflows: Non-operating income 3,978 2,561
Outflows: Investments of surplus funds (4,101) (3,692)
Net change (B) (123) (1,131)
Total net change in cash: (A) + (B) (181) (384)

remains inviolate (Table 6). Subject to adequate
safeguards for such shareholders’ funds, Bajaj
Auto’s investment team has striven to increase
returns on the investible surplus. As can be seen
in Table 7, the strategy has paid off.
Wind Farm Project
Bajaj Auto has set up a wind-farm project of 19.6
MW at Vankusavade (district of Satara) in two
phases of 9.8 MW each. The first phase was fully
commissioned in March 2000 at a cost of
Rs.445.7 million. The power generated from
these windmills will feed into the grid of the
Maharashtra State Electricity Board. The second
phase is expected to be commissioned in June
2000.
The power generated will be used for captive
consumption at Bajaj Auto’s three plants.
Moreover, the capital expenditure incurred by
the company is entitled for sales tax and income
tax benefits.
Reconciliation of accounts under US GAAP and
IAS
This is the third year in succession that Bajaj Auto
has reconciled its accounts according to US
Generally Accepted Accounting Principles
(GAAP), and has reported the results in its
annual report. The company has also continued
the practice of reconciliation with the
International Accounting Standards (IAS). The
items for reconciliation and reasons for variation
are fully explained in the relevant section of this
report. The exercise has been reviewed by
KPMG.
Cautionary statement
Statements in this Management Discussion and
Analysis describing the company’s objectives,
projections, estimates and expectations may be a
‘forward looking statement’ within the meaning
of applicable laws and regulations. Actual results
might differ materially from those either
expressed or implied.
24
TABLE 6| Investment of Bajaj Auto’s surplus funds |IN RS. MILLION
As at % to total As at % to total31 March 2000 31 March 1999
Govt securities and bank deposits 1981 8.0 1405 6.7
Mutual funds including UTI 2575 10.3 2130 10.2
Debentures and bonds 6392 25.8 6432 30.8
Preference shares 2231 9.0 1947 9.3
Inter-corporate deposits 4337 17.5 4958 23.7
Leased Assets 915 3.7 1274 6.1
Fixed income investments 18431 74.3 18146 86.8
Equity shares 6380 25.7 2751 13.2
Total 24811 100.0 20897 100.0

F I F T Y F I F T H A N N U A L R E P O R T 1 9 9 9 | 2 0 0 0
25
TABLE 7| Income from Investment of Surplus Funds | RS. MILLION
1999-2000 1998-1999
Dividends 379 271
Interest on Debentures & Bonds 716 527
Interest on Government Securities 46 62
Interest on Inter-Corporate Deposits & Other Loans 562 522
Discounting Charges – 12
Income from Units of Mutual Funds 228 231
Lease Rent 393 488
Lease Equalisation 72 3
Profit on Sale of Investment 1,434 274
Surplus on redemption of T-Bills 19 60
Interest received on Fixed Deposits 2 14
Other Interest 13 –
Income from investment of surplus funds 3864 2464
Interest on Tax refunds 179 99
Premium received – Tenancy rights 8 88
Total Non-operating Income 4,051 2,651

26
THE CHANGING FACE of Bajaj Auto’s annual
reports over the last few years represents a
significant attempt at incorporating the best
practices of corporate governance. Even before
the publication of Report of the Working Group
on The Companies Act (March 1997) and CII’s
Desirable Corporate Governance: A Report, (April
1998), Bajaj Auto had voluntarily introduced a
number of additional disclosures in its annual
report.
In last year’s annual report, the company had
measured its progress in corporate governance
not only with reference to the CII code, but also
disclosed information that went well beyond the
CII recommendations.
The movement for better corporate
governance in India recently got a fillip with the
Securities and Exchange Board of India (SEBI)
adopting most of recommendations of the report
submitted by the Kumar Mangalam Birla
Committee. Like the CII code, the SEBI
provisions relate to listed companies. Unlike the
CII code — which is, by its very nature, voluntary
— SEBI has mandatory as well as voluntary
clauses.
SEBI’s provisions come into play in a time-
tabled manner with effect from 31 March 2001.
The first set of companies that have to follow the
rules will be newly listed ones, and those that
belong to Group A of the Bombay Stock
Exchange and the NSE-50 index of the National
Stock Exchange. The provisions will be
monitored by the stock exchanges, which have
been directed to incorporate appropriate changes
in their listing agreements.
Although, strictly speaking, Bajaj Auto has a
full year left to fully incorporate all the mandated
aspects of the SEBI code, the company has
decided to measure its corporate governance
performance with the SEBI yardstick from this
year itself. In what follows, the SEBI code and the
corresponding CII recommendation are first
stated, and then checked against Bajaj Auto’s
actual practice for the year 1999-2000.
corporate governance

F I F T Y F I F T H A N N U A L R E P O R T 1 9 9 9 | 2 0 0 0
27
Number of board meetings
During 1999-2000, the board of directors met seven times
on the following dates: 11 May 1999, 17 July 1999, 13
September 1999, 20 October 1999, 21 January 2000, 14
March 2000 and 28 March 2000. The maximum time gap
between any two meetings was not more than 3 months. In
addition, on an urgent matter, one resolution was passed by
the board of directors by circular on 10 December 1999.
SEBI The board meeting shall be held at least four times a
year, with a maximum time gap of four months between any
two meetings.
CII The full board should meet a minimum of six times a
year, preferably at an interval of two months, and each
meeting should have agenda items that require at least half
a day’s discussion.
Attendance record of directors
SEBI The attendance record of each director at the board
meetings and the last AGM should be disclosed.
CII While re-appointing members of the board, companies
should give the attendance record of the concerned
directors.As a general practice, one should not re-appoint
non-executive directors who have not attended even one
half of the meetings.
Outside Directorships or Membershipsof Board Committees
SEBI A director shall not be a member in more than 10
committees or act as Chairman of more than five
committees across all companies in which he is a director.
CII No single person should hold directorships in more than
10 listed companies.This ceiling excludes directorships in
subsidiaries or associate companies.
Table 2 gives the outside directorships held by the directors
of Bajaj Auto.The number of board committee
memberships and chairmanships held by directors was well
within the limits of 10 and 5 respectively.
TABLE 1 | Attendance Record | 1999-2000
Name of director meetings attended lastattended AGM, 17 July ’99
Rahul Bajaj 7 Yes
D.S. Mulla 7 Yes
Viren J. Shah* 3 Yes
Kantikumar R. Podar 3 Yes
Atul C. Kirloskar 5 Yes
Shekhar Bajaj 5 Yes
Madhur Bajaj 7 Yes
D.J. Balaji Rao 6 Yes
D.S. Mehta 6 Yes
J.N. Godrej 5 Yes
S.H. Khan 6 Yes
Note: Seven meetings were held in all.
*Ceased to be director with effect from 30 November 1999, attended 3 out
of four meetings in his tenure.
TABLE 2 | Outside Directorship | 1999-2000
Name of director in listed in public limitedcompanies companies
Rahul Bajaj 3 4
D.S. Mulla 8 12
Viren J. Shah* 1 1
Kantikumar R. Podar 6 7
Atul C. Kirloskar 7 16
Shekhar Bajaj 3 8
Madhur Bajaj 3 7
D.J. Balaji Rao 1 1
D.S. Mehta 5 14
J.N. Godrej 4 19
S.H. Khan 3 5
Note: *Ceased to be director with effect from 30 November 1999.

28
Notes:
* According to SEBI, ‘Independent Director’
means a director who apart from receiving director’s
remuneration does not have any other material
pecuniary relationship or transactions with the
company, its promoters, its management or its
subsidiaries, which in the judgement of the board
may affect independence of judgement of the
director.
**Ceased to be a director with effect from 30
November 1999.
Information supplied to the board
The board of Bajaj Auto is presented with all the relevant
and necessary information at their meetings, such as
production, sales and capital expenditure budgets, review
of product-wise and plant-wise business, staff matters
including senior appointments and extensions, any legal
proceedings by or against the company, foreign tours of
whole-time directors, share transfer and demat
compliance, quarterly financial results, details of any joint
venture arrangements, etc.
SEBI Similar to the CII recommendation given below.
CII In the interest of good corporate governance, certain key
information must be placed before the board and must form
part of the agenda papers.This includes annual operating
plans, budgets, internal audit reports, litigation, safety and
pollution problems, loan defaults, appointment and
removal of senior management personnel, labour
problems, etc.
Composition of the board
As on date, Bajaj Auto has a board consisting of 10
directors.Mr.Viren J.Shah resigned with effect from 30
November 1999 to become the Governor of West
Bengal.Six of the 10 directors are independent.Hence, the
board of Bajaj Auto complies with the SEBI and the CII
code.Moreover, the company has no nominee director from
any bank or financial institution.Table 3 gives the data.
SEBI The board of directors shall have an optimum
combination of executive and non-executive directors with
not less than fifty percent of the board comprising non-
executive directors.In case the board has a non-executive
chairman, at least one-third of the board should comprise
independent directors; and in case of an executive
chairman, at least half of the board should comprise
independent directors.
CII The company should have professionally competent
and acclaimed non-executive directors who should
constitute at least 30 per cent of the board if the chairman is
a non-executive director, and at least 50 per cent of the
board if the chairman and managing director is the same
person.
TABLE 3 | Composition of the Board of Directors | 1999-2000
Name of director Promoter, executive, Materially significant pecuniary ornon-executive, independent* business relationship with the company
Rahul Bajaj Promoter, executive Not applicableChairman and Managing Director
D.S. Mulla Non-executive, independent None
Viren J. Shah** Non-executive Joint venture with the Bajaj family in Mukand
KantikumarR. Podar Non-executive, independent None
Atul C. Kirloskar Non-executive, independent None
Shekhar Bajaj Promoter, non-executive Director of vendor company
Madhur Bajaj Promoter, executive, President Not applicable
D.J. Balaji Rao Non-executive, independent None
D.S. Mehta Executive Not applicable
J.N. Godrej Non-executive, independent Director of vendor company but not materially significant
S.H. Khan Non-executive, independent None

F I F T Y F I F T H A N N U A L R E P O R T 1 9 9 9 | 2 0 0 0
29
The business relationship of non-executive directors vis-a-
vis the company is given in Table 3.It should be mentioned
that Shekhar Bajaj and J N Godrej are, respectively,
directors and shareholders of Bajaj Electricals Limited and
Godrej & Boyce Manufacturing Company Limited.Both
these are vendor companies of Bajaj Auto.
SEBI All materially relevant pecuniary relationship or
transactions of the non-executive directors vis-a-vis the
company should be disclosed in the annual report.
CII No specific comment.
Remuneration of directors
SEBI Remuneration of non-executive directors shall be
decided by the board of directors.The following disclosures
on the remuneration of directors shall be made in the
section on the corporate governance of the annual report:
� All elements of remuneration package of all directors,
i.e.salary, benefits, bonuses, stock options, pension etc.
� Details of fixed component and performance linked
incentives, along with the performance criteria.
� Service contracts, notice period, severance fees.
� Stock option details, if any — and whether issued at a
discount, as well as the period over which accrued and over
which exercisable.
CII No specific recommendation.
Table 4 gives full details of remuneration paid to each
director.It also gives the relationships of the directors, where
applicable.During 1999-2000 the company did not
advance any loans to any of the directors.
Bajaj Auto does not have any pension plans in its package
of remuneration for directors.The perquisites of the
managing director and the president, however, include
superannuation benefit under which these two directors are
entitled to an annuity from LIC on their retirement.
There are no performance-linked incentives payable to
any of the directors.At present, the company does not have
any stock option plan as a part of remuneration package for
any director.
Bajaj Auto has entered into agreements with its
managing director and other whole-time directors, which
cover their respective tenures, and lay down detailed terms
of appointment.
Three relatives of directors are employees of Bajaj
Auto.These are:
1.Rajiv Bajaj, son of Rahul Bajaj, who is Vice President
(Products).He was paid Rs.1,002,834 as salary and
perquisites for the year 1999-2000.
2.Sanjiv Bajaj, son of Rahul Bajaj, who is General Manager
(Corporate Finance).He was paid Rs.731,152 as salary and
perquisites for the year 1999-2000.
3.Neelima Bajaj, daughter of Madhur Bajaj, who is
Assistant Manager (Marketing Services).She was paid
Rs.110,908 as salary and perquisites for the year 1999-
2000.
TABLE 4 | Remuneration Paid/Payable to Directors, and Relationship | 1999-2000
Director Relationship Sitting fees Salaries Commission Totalwith other and perquisitesdirectors Rupees
Rahul Bajaj Cousin ofShekhar Bajaj& Madhur Bajaj — 2,362,867 1,200,000 3,562,867
D.S. Mulla None 18,000 — 180,000 198,000
Viren J. Shah* None 6,000 — 60,000 66,000
Kantikumar R.Podar None 6,000 — 60,000 66,000
Atul C. Kirloskar None 10,000 — 100,000 110,000
Shekhar Bajaj Cousin of Rahul Bajaj andBrother ofMadhur Bajaj 10,000 — 100,000 110,000
Madhur Bajaj Cousin ofRahul Bajaj &Brother ofShekhar Bajaj — 1,268,755 480,000 1,748,755
D.J. Balaji Rao None 16,000 — 160,000 176,000
D.S. Mehta None — 1,155,703 — 1,155,703
J.N. Godrej None 14,000 — 140,000 154,000
S.H. Khan None 12,000 — 120,000 132,000
Note: *: Ceased to be a director with effect from 30 November 1999

30
Remuneration Committee
Bajaj Auto does not have a formal remuneration
committee.However, all decisions regarding the
remuneration of executive and non-executive directors are
taken by the entire board of directors.As of now, non-
executive directors are paid sitting fees at the rate of
Rs.2,000 for each meeting of the board or board-level
committee attended by them.
In addition, with the approval of Central Government and
shareholders, all non-executive directors are remunerated
with a commission on net profits.This is based on their
attendance in board and committee meetings held during
the year.The board of directors of Bajaj Auto has put a cap of
Rs.1.2 million per year on such commission, which is well
below the statutory ceiling of 1 per cent of net profits.
SEBI In part mandated, and in part treated as a voluntary.
CII.No recommendation.
The remuneration of the managing director and other
whole-time directors is fixed by the board, subject to
ceilings mandated under Schedule XIII to the Companies
Act, 1956, and also subject to the approval of shareholders
in the annual general meeting.Further, when the
remuneration of any wholetime director is being discussed
or decided in a board meeting, the concerned director
neither participates in the discussion, nor votes on the
resolution.In such instances, their presence is not counted
for the purpose of quorum.
Audit Committee
SEBI A qualified and independent audit committee shall be
set up and:
� The audit committee shall have minimum three
members, all being non-executive directors, with the
majority of them being independent, and at least one
director having financial and accounting knowledge.
� The chairman of the committee shall be an independent
director.
� The chairman shall be present at the annual general
meeting to answer shareholder queries.
� The audit committee should invite such of the executives
as it considers appropriate (and particularly the head of the
finance function) to be present at the meetings of the
committee, but on occasions it may also meet without the
presence of any executives of the company.The finance
director, head of internal audit and when required, a
representative of the external auditor shall be present as
invitees for the meetings of the audit committee.
� The company secretary shall act as the secretary to the
committee.
� The audit committee shall meet at least thrice a year.One
meeting shall be held before finalisation of annual accounts
and one every six months.The quorum shall be either two
members or one-third of the members of the audit
committee, whichever is higher, and minimum of two
independent directors.
� The audit committee shall have various powers such as
investigating any activity, seeking information from
employee etc., as detailed in the relevant clause of the
listing agreement, and it shall play the accounts-and-audit
related role as described in such an agreement.
CII Listed companies with either a turnover of over Rs.100
crores or a paid-up capital of Rs.20 crores—whichever is
less—should set up Audit Committees within two years.
� Audit Committees should consist of at least three
members, all drawn from a company’s non-executive
directors, who should have adequate knowledge of finance,
accounts and basic elements of company law.
� To be effective, members of Audit Committees must be
willing to spend more time on the company’s work vis-à-vis
other non-executive directors.
� Audit Committees should assist the board in fulfilling its
functions relating to corporate accounting and reporting
practices, financial and accounting controls, and financial
statements and proposals that accompany the public issue

F I F T Y F I F T H A N N U A L R E P O R T 1 9 9 9 | 2 0 0 0
31
of any security—and thus provide effective supervision of
the financial reporting process.
� Audit Committees should periodically interact with the
statutory auditors and the internal auditors to ascertain the
quality and veracity of the company’s accounts as well as
the capability of the auditors themselves.
� For Audit Committees to discharge their fiduciary
responsibilities with due diligence, it must be incumbent
upon management to ensure that members of the
committee have full access to financial data of the
company, its subsidiary and associated companies,
including data on contingent liabilities, debt exposure,
current liabilities, loans and investments.
Bajaj Auto has had an audit committee since 1987.The
present committee consists of three directors: D.S.Mulla
(chairman), D.J.Balaji Rao and J.N.Godrej, all of whom are
independent directors.Mr.Balaji Rao has a strong financial
and accounting background.The meetings of the audit
committee are attended by other senior executives,
namely, general manager (finance), general manager
(corporate finance) and senior manager (internal audit).
The company secretary acts as secretary to the committee.
During the year under review, the audit committee of the
company met twice — on 11 May 1999 and 21 January
2000.The meeting on 11 May 1999 considered the audited
annual accounts of the company for the year 1998-99
before adoption by the board.Both meetings were attended
by all three members.It is proposed to increase the
frequency of the committee meetings during the
forthcoming year, so that at least three meetings are held in
a year.
Apart from considering the audited annual accounts on
11 May 1999, the audit committee focused its attention on
other topics.Some of these were: the level of outstandings of
company’s dealers, internal control systems at the
company’s new plant at Chakan, preparations for Y2K
compliance and matters concerning inter-corporate
deposits and investments.
Management discussion and analysis
This information is set out in a separate section included in
this annual report.
SEBI A management discussion and analysis report should
form part of the annual report.It should include matters
such as industry structure and developments, opportunities
and threats, segment-wise and product-wise performance,
outlook, risks and concerns, etc.
CII No comments.
Disclosures by management to theboard
SEBI Disclosures must be made by the management to the
board with regard to all material financial and commercial
transactions, where they have personal interest, which may
have a potential conflict with the interest of the company at
large.
CII.No specific comments.
Among the materially significant related-party transactions
are contracts or arrangement made by the company from
time to time with other directors or interested companies.
For the year 1999-2000, these include the purchases of
goods and services made by Bajaj Auto from (i) Bajaj
Electricals Limited, (ii) Godrej and Boyce Manufacturing
Company Limited, and (iii) Hind Musafir Agency Private
Limited.All these contracts or arrangements are entered in
a Register of Contracts under section 301 of the Companies
Act, 1956, and the register is placed before every board
meeting.Regarding the travel facilitation services availed
from Hind Musafir Agency Private Limited, necessary
Government approval has also been obtained, which is
valid up to 31December 2000.

32
Disclosure regarding appointment orre-appointment of directors
No new director is proposed to be appointed in the 55th
Annual General Meeting of Bajaj Auto.D.S.Mulla and
D.J.Balaji Rao are retiring by rotation, and are eligible for
reappointment.Their brief particulars are:
D S Mulla, B.Sc Engineering (London University) is a
Chartered Engineer of the UK and a Fellow of the Institute of
Engineers of India.He has been on the board of directors of
Bajaj Auto since 1970.He has extensive industry
experience, and has been a consulting engineer and
technical advisor to a number of machine tool and other
engineering undertakings.He has also served as a
consultant on the advisory committees of various banks and
financial institutions, and on government bodies and
panels.D.S.Mulla presently holds directorships/committee
memberships in the following listed companies:
� Bajaj Auto Limited
� Balkrishna Industries Limited
� Graham Firth Steel Products (India) Limited
� Hindustan Hardy Spicer Limited
� Mukand Limited
� Mukand Engineers Limited.
D.J.Balaji Rao, B E (Mechanical) and Post Graduate
Diploma holder in Industrial Engineering, has had extensive
experience in various engineering companies such as
Kamani Engineering Corporation and Associated Cement
Company.He had a long career in various positions in ICICI
and recently retired as managing director of Infrastructure
Development Finance Company Limited.He presently
holds directorships/committee membership in the following
listed companies:
� Bajaj Auto Limited
� Peerless Shipping and Offshore Services Limited.
In addition, Rahul Bajaj who has been proposed for his
seventh five-year tenure as managing director of the
company with effect from 1 April 2000 needs no elaborate
introduction.An honours graduate in economics and law
with an MBA from Harvard Business School, he had the
distinction of leading Bajaj Auto to its present status.He is
associated with a number of trade and industry
organisations at national and international levels, including
having been the president of Confederation of Indian
Industry twice.Presently, he holds directorships/ committee
memberships in the following listed companies:
� Bajaj Auto Limited
� Bajaj Auto Finance Limited
� Maharashtra Scooters Limited
� Mukand Limited.
Madhur Bajaj’s present 5-year term as President and Whole
time Director will expire on 5 November 2000.His
reappointment for a fresh 5-year tenure commencing from
6 November 2000 with the designation as executive
director will also come up for the approval of shareholders in
the forthcoming Annual General Meeting. Madhur Bajaj, is
an MBA from the Institute of Management Development,
Lausanne, Switzerland.He took charge of Waluj
(Aurangabad) plant of Bajaj Auto in 1988.He shifted to
Pune effective from 1 July 1995.Presently he holds
Directorship in the following listed companies.
� Bajaj Auto Limited
� Bajaj Auto Finance Limited
� Maharashtra Scooters Limited
� Bajaj Electricals Limited.
SEBI In case of an appointment of a new director or
reappointment of a director the shareholders must be
provided with the following information:
� a brief resume of the director;
� nature of his expertise in specific functional areas; and
� name of companies in which the person also holds the
directorship and the membership of committees of the
board.
CII.No specific recommendation.

F I F T Y F I F T H A N N U A L R E P O R T 1 9 9 9 | 2 0 0 0
Communicating to shareholdersthrough web-site
Bajaj Auto has its own web-site and all the vital information
relating to the company and its performance is immediately
put on the web-site for the benefit of the public at large.The
company’s web-site address is www.bajajauto.com.
SEBI.Information like quarterly results, presentation made
by companies to analysts shall be put on company’s web-
site, or shall be sent in such a form so as to enable the stock
exchange on which the company is listed to put it on its own
web-site.
CII.No comments.
Investor grievances
Bajaj Auto has not formed any formal committee to look into
investors’ grievances.However, the share department of the
company, under the supervision of the company secretary
(who is also appointed as compliance officer) attends to any
such queries or grievances from shareholders and investors
in such matters.Moreover, all matters pertaining to
investors, including their grievances and redress, are
placed before the board of directors at its meetings.
During 1999-2000, Bajaj Auto received 23
shareholder/investor complaints through SEBI and two
through the Department of Company Affairs/Registrar of
Companies.
SEBI A board committee under the chairmanship of a non-
executive director shall be formed to specifically look into
the redressing of shareholder and investors complaints like
transfer of shares, non-receipt of balance sheet, non-
receipt of declared dividends etc.This committee shall be
designated as ‘Shareholders/Investors Grievance
Committee’.
CII No specific recommendation for a committee.
Some of these were unrelated to the company. Even so,
every one of these were looked into and fully resolved.
Action taken by the company regarding each complaint was
promptly intimated to SEBI and the Department of
Company Affairs.
Share transfers
The power of share transfer has been delegated to the
managing director of the company, and all transfers
received are processed and approved on a weekly basis.In
a period of long absence of managing director from
company’s headquarters, D.S. Mulla, an independent non-
executive director, has been authorised to exercise these
powers.Bajaj Auto has not appointed any registrar or share
transfer agents.
SEBI To expedite the process of share transfers the board of
the company shall delegate the power of share transfer to
an officer or a committee or to the registrar and share
transfer agents.The delegated authority shall attend to
share transfer formalities at least once in a fortnight.
CII No recommendation.
Information on general body meetings
The last three annual general meetings of the company
were held at the registered office of the company at
Mumbai-Pune Road, Akurdi, Pune 411 035 on the
following dates and time:
� 52nd AGM 26/7/1997, 12.15 p m
� 53rd AGM 25/7/1998, 11.30 a m
� 54th AGM 17/7/1999, 11.15 a m

34
Postal ballot
As of now, there is no enabling provision in the Companies
Act by which shareholders who are unable to attend a
meeting can cast their votes by postal ballot.As and when
any such provision is incorporated, Bajaj Auto will review
the matter, decide whether and to what extent postal ballot
system should be adopted, and make appropriate
amendments in the articles of association of the company if
deemed necessary.
SEBI Shareholders who are unable to attend the meetings
should be in a position to vote by postal ballot for key
decisions such as alteration to memorandum of
association, sale of an undertaking, etc.This is a non-
mandatory requirement.
CII No comments.
Details of non-compliance
There was no non-compliance during the last three years by
Bajaj Auto on any matter related to capital
markets.Consequently, there were no penalties imposed
nor strictures passed on the company by stock exchanges,
SEBI or any statutory authority.
SEBI Details of non-compliance by the company, including
penalties and strictures imposed by stock exchanges, SEBI
or any statutory authority on any matter related to capital
markets during the last three years must be disclosed to
shareholders.
CII No specific comments, except that serious defaults and
non-compliance must be disclosed to the board.
Circulation of half-yearly results
Results of the second quarter, which contain cumulative
figures for the first half of the financial year, are advertised
by Bajaj Auto in a large number of newspapers to ensure
wide national circulation.
SEBI The half-yearly declaration of financial performance
including summary of the significant events in last six-
months should be sent to each household of
shareholders.This is a non-mandatory recommendation.
CII No comments.
Report on corporate governance
This section of the report — together with the information
given under ‘Management Discussion and Analysis’ and
‘Additional Shareholder Information’ — constitutes a
detailed compliance report on corporate governance during
1999-2000.Bajaj Auto has been doing this for two
consecutive years.
SEBI There shall be a separate section on corporate
governance in the annual reports of company, with a
detailed compliance report on corporate governance.Non-
compliance of any mandatory requirement with reasons,
and the extent to which the non-mandatory requirements
have been adopted should be specifically highlighted.
CII Has been voluntarily inducing listed companies to have
a detailed corporate governance section in their annual
report.

Auditor’s certificate on corporate governance
This provision of the SEBI code will become applicable to
Bajaj Auto for the year 2000-01, and must be reflected in
next year’s annual report.The company has already begun
the process of implementation of corporate governance
standards that adhere to SEBI’s guidelines and, on
occasions, go beyond them.As required, next year will see a
detailed compliance certificate, duly certified by the
company’s statutory auditor.
SEBI There should be an auditor’s certificate on corporate
governance accompanying every annual report, as an
annex to the Directors’ Report.
CII Major Indian stock exchanges should gradually insist
upon a compliance certificate signed by the CEO and the
CFO of the listed company.
F I F T Y F I F T H A N N U A L R E P O R T 1 9 9 9 | 2 0 0 0

Annual General Meeting
Date 29 July 2000
Time 12:15 p.m.
Venue Registered office at Mumbai-Pune
Road, Akurdi, Pune 411035
Dates of Book Closure
18 July 2000 to 29 July 2000, both days inclusive
Date of Dividend Payment
The board of directors had a meeting on
14 March 2000, where it announced an interim
dividend for 1999-2000 at the rate of Rs.10 per
share. All eligible shareholders recorded as on
13 April 2000 were paid this dividend on 26 April
2000. This interim dividend will be treated by the
board of directors as the dividend payable for
1999-2000, upon declaration by shareholders at
the ensuing annual general meeting.
shareholder information
TABLE 1 | Monthly highs and lows of Bajaj Auto Shares |IN RUPEES
on BSE on NSE on London Stock Exch (GDRs)*
High Low High Low High Low
Apr-99 650.00 515.00 650.00 504.00 792.40 736.90
May-99 625.00 517.00 629.35 511.00 776.90 706.77
Jun-99 578.00 532.00 577.95 527.00 772.12 701.78
Jul-99 573.00 490.00 570.00 491.00 734.46 561.82
Aug-99 518.00 471.00 512.65 471.10 596.95 521.64
Sep-99 517.90 432.05 519.00 428.00 580.10 435.01
Oct-99 490.00 434.00 490.00 432.00 586.98 469.04
Nov-99 448.00 394.20 445.90 385.20 532.14 485.32
Dec-99 430.00 325.30 425.00 328.00 537.36 391.45
Jan-00 437.00 341.00 435.00 340.00 528.16 433.34
Feb-00 382.00 295.00 384.90 292.15 468.28 381.85
Mar-00 399.95 256.70 405.00 260.20 456.96 336.85
20406080
100120140160
1 Ap
r15
Apr
29 A
pr13
May
27 M
ay10
Jun
24 J
un8
Jul
22 J
ul5
Aug
19 A
ug2
Sep
16 S
ep30
Sep
14 O
ct28
Oct
11 N
ov25
Nov
9 De
c23
Dec
6 Ja
n20
Jan
3 Fe
b17
Feb
2 M
ar16
Mar
30 M
ar
1999 20001 Apr 1999=100
Sensex
Bajaj Auto
CHART A |Stock Performance of Bajaj AutoBajaj Auto vs the Sensex
36
* Source: Depositary receipt activity report from Deutsche Bank.

F I F T Y F I F T H A N N U A L R E P O R T 1 9 9 9 | 2 0 0 0
37
32.9% 42.7%
10.0%6.8%
5.5%
Promoter and associatesForeign institutional investorsPublic financial institutionsGDRs0.9%Mutual funds0.8% Nationalised, other banks0.5% NRIs and OCBsOthers
Stock Exchanges
Shares of Bajaj Auto Limited are listed on the
Pune, Mumbai (The Stock Exchange, Bombay),
Delhi and the National Stock Exchange. Global
Depository Receipts (GDRs) of the company are
listed on the London Stock Exchange.
Stock Code
1. The Stock Exchange, Bombay (BSE): 490
2. Reuters: BJAT.BO
3. Bloomberg: BJA IN
4. ISIN–INE118A01012
Stock Price Data
Table 1 gives the monthly highs and lows of Bajaj
Auto’s shares on the Bombay Stock Exchange
(BSE) and the National Stock Exchange (NSE),
and of its GDRs on the London Stock Exchange.
Chart A compares Bajaj Auto’s daily closing
prices at the Bombay Stock Exchange with the
BSE Sensex.
Registrars and Transfer Agents
Bajaj Auto has no external registrar or share
transfer agent. All such work is done in-house at
the registered office of the company.
Share Transfer System
Share transfers are registered and returned within
a period of 30 days from the date of receipt, if the
documents are clear in all respects. The total
number of shares transferred in the physical
(non-dematerialised) segment during
1999-2000 was 4,214,963 compared to
10,610,810 in 1998-99.
Distribution of Shares
Tables 2 and 3 and Charts B and C give details
about the shareholding pattern and the
distribution of Bajaj Auto’s shares.
Dematerialisation of Shares
During the year under review 13.52 million
shares were dematerialised. This has increased the
demat level of Bajaj Auto’s shares at the National
Securities Depository Limited (NSDL) from
31.6 million shares (26.5 per cent of the total) as
at 11 May 1999 to 45.12 million (37.8 per cent)
as at 31 March 2000. NSDL has ranked Bajaj
Auto as one of the top ten performers in terms of
timely disposal of the demat requests.
The company has also entered into an agreement
with the other depository, namely the Central
Depository Services of India Limited (CDSL), and
<100
101-500
501-1000 5001-1000
1001-5001 >10000
7%10
20
30
40
50
60
70
80
81%
51%
1%
31%
3% 2%8% 7%
1%4% 2%
% of shareholders % of shares held
TABLE 3 | Distribution of Shareholding |Number of shares Number of Shares held as on 31 March 2000 shareholders in each class
1 to 100 23058 1257530
50.75% 1.05%
101 to 500 14034 3390206
30.89% 2.84%
501 to 1000 3282 2327413
7.22% 1.95%
1001 to 5000 3626 7863504
7.98% 6.59%
5001 to 10000 678 4718597
1.49% 3.95%
10001 & above 758 96480233
1.67% 80.81%
In transit in NSDL system 1 3353331
2.81%
Total 45437 119390814
100.00% 100.00%
CHART C |Distribution of Shareholding%
TABLE 2 | Shareholding pattern | 31 MAR 2000
Number of shares %
Promoter and associates 50921843 42.65
Foreign institutional investors 11996371 10.05
Public financial institutions 8159601 6.83
GDRs 6514014 5.46
Mutual funds 1015870 0.85
Nationalised and other banks 956534 0.80
NRIs and OCBs 609560 0.51
Others 39217021 32.85
Total 119390814 100.00
CHART B |Shareholding Pattern%

38
F I F T Y F I F T H A N N U A L R E P O R T 1 9 9 9 | 2 0 0 0
has gone live on the CDSL system from 25 April
2000. Shareholders now have the choice to
dematerialise their shares through either NSDL
or CDSL.
GDRs
In November 1994, Bajaj Auto had issued
4,342,676 GDRs at the rate of one GDR equal to
one share. In 1997-98, 2,171,338 bonus GDRs
were issued in the proportion of one bonus GDR
for every two GDRs held. So far, none of the
GDR holders has withdrawn from the depository.
Plant Location
Bajaj Auto’s plants are located at :
1) Mumbai-Pune Road, Akurdi, Pune 411035
2) Bajaj Nagar, Waluj, Aurangabad 431136
3) MIDC, Plot No A1, Mahalunge Village,
Chakan 410501
Investor Correspondence
Shareholders can correspond at the registered
office of the company at Akurdi, Mumbai-Pune
Road, Pune 411035. The e-mail address is:
[email protected]. The company also has a
website: www.bajajauto.com

39

40
Rs in millions
1999-2000 1998-99 1997-98 1996-97 1995-96
Income
Sales and Other Income 42,156 39,072 35,041 34,541 29,320
Gross Profit after Interest butbefore Depreciation & Tax 9,705 8,912 8,327 7,949 6,688
Net Profit 6,349 5,528 4,626 4,400 4,168
Dividends & Corporate Dividend Tax 1,325 1,060 1,051 876 796
Assets Employed
Net Fixed Assets 11,143 9,218 6,829 6,039 5,597Technical Know-how 4 7 7 10 12Investments 19,524 14,591 11,432 9,944 6,802Net Working Capital 6,327 6,698 5,496 3,753 3,723
Total 36,998 30,514 23,764 19,746 16,134
Financed by
A. Borrowed Funds(i) Cash Credit & Commercial Paper 1,016 411 127 72 104(ii) Debentures - - 148 149 149(iii) Foreign Currency Loans - - - - 35(iv) Sales Tax Deferral 3,864 2,996 2,202 1,739 1,485(v) Others 77 90 105 179 278
Total 4,957 3,497 2,582 2,139 2,051
B. Shareholders’ Funds(i) Shareholders’ Investment 52 52 52 52 52(ii) Bonus shares 1,142 1,142 1,142 744 744(iii) Reserves 30,847 25,823 19,988 16,811 13,287
Total 32,041 27,017 21,182 17,607 14,083
Others
Gross Fixed Assets 21,216 18,023 15,725 13,603 12,183
Contribution to Country’s Exchequer 7,403 7,538 7,107 6,959 6,223
Exports 1,378 1,584 1,408 1,582 1,895
Employee Cost 2,347 2,309 2,198 1,986 1,727
bajaj auto highlights I

F I F T Y F I F T H A N N U A L R E P O R T 1 9 9 9 | 2 0 0 0
41
Rs in millions
1999-2000 1998-99 1997-98 1996-97 1995-96
Production
Two-wheelers Nos. 1,259,248 1,202,150 1,161,743 1,256,833 1,151,523
Three-wheelers Nos. 173,223 179,615 192,739 182,341 150,508
Employees Nos. 17,213 18,585 18,589 21,273 22,891
Equity Shares Data
Sales & other income per equity share Rs. 353 327 293@ 434 368
Earnings per equity share Rs. 53 46 39@ 55 52
Cash earnings per equity share Rs. 65 57 51@ 70 62
Book value of equity share Rs. 268 226 177@ 221 177
Market Price: Bombay Stock Exchange(a) High Rs. 650 690 969 1121 876
(b) Low Rs. 257 483 474@ 661 602
Dividend %. 100 80 80@ 100 100
Dividend Cover(including Corporate Dividend tax) Times 4.8 5.2 4.4 5.0 5.2
Ratios
Gross Profit % 23.02 22.81 23.77 23.01 22.81Sales and Other Income
Net Profit % 19.82 20.46 21.84 24.99 29.60Net Worth
Net worth % 59 59 58 59 57Total Assets
Long term Debt Times 0.12 0.11 0.11 0.11 0.12Net worth
@ After bonus issue in the ratio of 1:2.
bajaj auto highlights I (CONTD.)


F I F T Y F I F T H A N N U A L R E P O R T 1 9 9 9 | 2 0 0 0
43
1. Introduction
1.1 The directors present their fifty-fifth annual report andthe audited statements of accounts for the year endedMarch 31, 2000.
1.2 The total vehicle sales were fractionally lower at 1.412million units during the year under review as against1.423 million units last year, which has so far been thehighest ever performance.
2. Operations1999-2000 1998-1999
(Nos.) (Nos.)2.1 Production
a) Scooters 757,965 790,066out of which ckd packs (164,447) (167,464)
b) Motorcycles 254,847 194,039out of which ckd packs (1,420) (785)
c) Scooterettes 69,475 38,211out of which ckd packs (nil) (15)
d) Step- thru’s 176,961 179,834out of which ckd packs (1,000) (1,800)
e) Three-wheelers 173,223 179,615out of which ckd packs (138) (1,804)
Total 1,432,471 1,381,765
3. Financial Results 1999-2000 1998-1999
Rs in Millions Rs in Millions
Sales and other income 42,156 39,072
Gross profit before interest
and depreciation 9,746 8,958
Interest 41 46
Profit before depreciation 9,705 8,912
Depreciation 1,453 1,327
Profit before taxation 8,252 7,585
Provision for taxation 2,115 2,180
Balance profit 6,137 5,405
Disposable surplus after
adjustment for earlier years 6,348 5,528
Transfer to contingency reserve — 18
Proposed / interim dividend
(inclusive of dividend tax) 1,325 1,060
Balance carried to general reserve 5,023 4,450
3.1 The earning per share for the year 1999-2000 was Rs. 53.17 and cash earning per share was Rs.65.35 asagainst Rs.46.31 and Rs.57.42 respectively for theprevious year.
4. Dividend
4.1 At their meeting held on March 14, 2000, the directorsannounced an interim dividend at Rs.10/- per share (i.e.100%) for the year 1999-2000. The interim dividendwas paid to all the shareholders in April 2000. Theamount of dividend and the tax thereon at 11%aggregated to Rs.1,325 million. The directors do notrecommend any additional dividend and the interimdividend already paid should be taken as final dividendfor the year ended March 31, 2000.
5. Buy-Back of Shares
5.1 The directors at their meeting held on March 28, 2000,decided to buy back, subject to the approval ofshareholders, around 18 million equity sharesrepresenting approximately 15% of the total number ofshares comprised in the paid-up share capital of thecompany at a price not exceeding Rs.450 per share.
5.2 The main object of buy-back is to utilise a portion of thesurplus cash to buy back shares at a price below itsconservatively computed intrinsic value. This offers areasonably attractive exit option to those shareholderswishing to do so while ensuring that the buy-back price isvalue enhancing to those shareholders who prefer toretain ownership of their stock.
5.3 The buy-back proposal is being placed before theshareholders for their approval in the annual generalmeeting. The directors will thereafter take appropriatedecisions on the method of buy-back and the time-tablefor the same.
6. Expansion
6.1 The third manufacturing plant of the company at Chakannear Pune was inaugurated on 20 October 1999. In thecurrent year the plant will manufacture Saffire, SunnySpice, Spirit and Pulsar.
6.2 The first phase of the capacity creation at Chakan of300,000 vehicles per year is likely to be completed in2000-2001. The second phase envisages an additionalcapacity of 420,000 vehicles per year.
6.3 Akurdi and Waluj plants already have an annual capacityof one million units each.
directors’ report I
— —— —— —

44
7. Competition and Market Share
7.1 The company recognises the changing marketpreference from scooters to motorcycles and has takenappropriate steps to align its product portfolio andmanufacturing capacities with the same. The marketshares in the individual product segments haveundergone marginal changes with an overall drop from38.92% to 34.99%
7.2 In the three wheeler segment, the company has takensteps to develop environment friendly 4 stroke, petrol,diesel and alternative fuel vehicles. The CNG poweredRE autorickshaw has recently received the ARAIcertification and was cleared by Delhi RTO authorities forregistration. The company plans to introduce this vehiclein the Delhi market soon.
8. Research & Development and Technology Absorption
8.1 From April 1, 2000 began the new era of stringentemission norms for vehicles as notified by the CentralGovernment. All products of the company comfortablymeet these norms – while 2-stroke vehicles were fittedwith catalytic convertors well ahead of the April deadline,the 4-stroke products were already compliant.
8.2 The sophisticated 175 cc 4-stroke engine fitted on three-wheelers has been developed indigenously by thecompany's R & D. A patent has also been applied foradaptation of a 4-stroke engine on front engine three-wheeler.
8.3 The company has also developed a three wheeler with a4-stroke engine fuelled by Compressed Natural Gas(CNG) and a pilot batch has already been manufactured,Substantial work on the development of a three-wheelervehicle working on LPG has also been done.
8.4 Other new products—like the cute Sunny Spice, theirresistible Saffire, the handsome Fusion, and a highlyfuel efficient 4 stroke step thru motorcycle —as well as arange of Japanese motorcycles including a new 100ccone, an upgraded Caliber, 2 sporty street bikes and thechopper type Eliminator are just being or will belaunched in the current year.
8.5 The company continued to receive and assimilatetechnology inputs from its foreign partners - Kawasaki,Kubota and Tokyo R & D of Japan and Cagiva of Italy.
8.6 Expenditure on research and development during theyear under review was :
(Rs. in millions)1999-2000 1998-1999
a. Capital 25.2 78.4b. Recurring 316.2 236.0c. Total research and
development expenditure as a percentage of total sales,net of excise duty 1.10 1.06
9. Conservation of energy
9.1 The company continues to identify and implementvarious initiatives for the conservation of energy like theuse of energy saving devices in production shops,installation of high mast lighting systems that light largerareas at lower costs than the conventional lightingequipment, utilisation of waste heat recovery fromincinerators for thermic fluid heating system for paintshops, etc.
9.2 The company has undertaken a project for generation ofwind energy at Vankusavade near Satara and is installing56 windmills over two phases at a total investment ofRs.900 millions. The first phase of 28 windmills wascompleted in March 2000. The total power generatedannually from both phases should exceed 350 millionunits and will be available to the 3 plants through theMSEB distribution network. The company is eligible toreceive various state government incentives for settingup this project.
10. Foreign exchange earning & outgo
10.1 The year under review saw a decline in company'sexports from Rs.1,584 million in 1998-99 to Rs. 1,378million i.e.by 13%. Exports during the year consisted of32,730 two and three wheelers (including CKD packs) asagainst 40,603 two and three wheelers (including CKDpacks) last year.
10.2 Among the major export destinations, Sri Lanka, Egyptand Sudan performed consistently while adverseeconomic conditions affected the performance in LatinAmerican markets. The ban on 2-stroke three wheelersin Bangladesh also contributed to the reduced volumes.The company plans to re-enter this important marketwith its new range of environmentally friendlier threewheelers in the current year.
directors’ report I

F I F T Y F I F T H A N N U A L R E P O R T 1 9 9 9 | 2 0 0 0
45
10.3 The total foreign exchange earned by the companyduring the year under review was Rs.1,430 million asagainst Rs.1,647 million earned during the last year.
10.4 The total foreign exchange outgo during the year underreview was Rs.2,358 million towards import of rawmaterials, components, machinery spares, capitalequipment and other expenditure, as against Rs. 2,621million during the last year. An amount of Rs. 52 millionwas paid to ICICI as custodian of the depository for GDRholders by way of dividend for 1998-99. This amount isto be remitted to the depository for distribution amongGDR holders.
10.5 The litigation initiated by SIAM, the company's erstwhiledistributor in Italy against Piaggio and later extended byPiaggio for claiming compensation from Bajaj Auto, foralleged infringement of trademark and unfaircompetition, is still continuing.
11. Rural development
11.1 During the year, the company continued its ruraldevelopment activities through Jankidevi Bajaj GramVikas Sanstha (JBGVS). JBGVS makes concentratedefforts for the integrated development of 25 villages inKhed and Maval Talukas of Pune district and 6 villages inGangapur and Paithan Talukas of Aurangabad district.Stress is laid on active participation by the villagers anddevelopment of local leadership, with JBGVS acting as acatalyst. All previously reported programmes werecontinued during the year under review and the followingwere the highlights of additional activities:
a) JBGVS, in association with Council for Advancement ofPeople's Action and Rural Technology (CAPART)supported a programme for dairy development in villageSaindane Thakarwadi in Khed Taluka and for watersheddevelopment in Karla area of Maval Taluka.
b) Drinking water schemes were implemented withgovernment support in 3 villages; none of the villageswhere JBGVS works are now tanker-fed in summer.
c) 32 students of the College of Agriculture, Pune wereattached for 6 months to 5 villages where JBGVS worksfor gaining practical knowledge as well as impartingmodern technology to the villagers.
12. Industrial Relations
12.1 The wage settlement dated September 28, 1996 fordaily-rated workmen at Waluj, Aurangabad expired onFebruary 29, 2000. Industrial Court, Aurangabad hasgranted recognition to Bharatiya Kamgar Sena, BAL
Waluj Unit on November 3, 1999. The negotiations withthe recognised union for wage and other benefits and forthe company’s demands for higher productivity, etc.have commenced.
12.2 Relations with staff and workmen at Akurdi, Waluj andChakan plants continued to be peaceful and cordial.
13. Directors
13.1 Viren J Shah, your director for over 22 years resigned onNovember 30, 1999 consequent to his appointment asGovernor of West Bengal. The directors place on recordtheir appreciation for the services rendered by Shri Shahduring his long stint with the Company.
13.2 D S Mulla and D J Balaji Rao retire from the board byrotation and being eligible offer themselves forreappointment.
13.3 Rahul Bajaj who has already served six five-year tenureswith the Company has been reappointed by the board asManaging Director for the seventh five-year tenurecommencing from April 1, 2000. A resolution for hisappointment and remuneration as set out therein isproposed for shareholders' approval in the annualgeneral meeting.
13.4 Madhur Bajaj’s present 5-year term as President andWhole time Director will expire on November 5, 2000. Heis being proposed for a reappointment for a further termof 5 years commencing from November 6, 2000 with thedesignation as Executive Director. A resolution for hisreappointment and remuneration as set out therein isproposed for shareholders’ approval in the annualgeneral meeting.
14. Reconciliation of Accounts under US GAAP and IAS
14.1 The directors continue to review the accounts in theirpresentation under:
(a) Generally Accepted Accounting Principles (GAAP) in theUS and
(b) International Accounting Standards (IAS)
A statement of reconciliation of significant differences inshareholders' equity and net income as at and for theyears ended on March 31, 2000 and 1999 betweenIndian Generally Accepted Accounting Standards(Indian GAAS), US GAAP and IAS, notes to reconciliationand an independent Accountants' Review Report are setout in this annual report.
directors’ report I

46
15. Statutory Disclosures
15.1 A statement relating to subsidiary company, Bajaj AutoHoldings Ltd pursuant to section 212 of the CompaniesAct, 1956 is attached to the Balance Sheet.
15.2 Particulars of employees required under section 217(2A) of the Companies Act, 1956 and the Companies(Particulars of Employees) Rules, 1975, as amended,are given in the statement attached.
15.3 Particulars regarding technology absorption,conservation of energy and foreign exchange earningand outgo required under section 217 (1)(e) of theCompanies Act, 1956 and Companies (Disclosure ofparticulars in the report of board of directors) Rules,1988 have been given in paras 8, 9 and 10 above.
15.4 A cash flow statement for the year 1999-2000 isattached to the Balance Sheet.
15.5 The business systems, hardware, machines, equipment,process control and embedded systems of the companyrolled over to the year 2000 smoothly and are functioningnormally.
16. Corporate Governance
16.1 Pursuant to clause 49 added to the listing agreementwith stock exchanges, a separate section titled "Corporate Governance" has been included in thisannual report.
17. Auditors’ Report
17.1 With reference to notes 10,11,13(a) and 17 to theaccounts referred to by the auditors in their report to themembers, the directors wish to state that the said notesare self-explanatory.
18. Auditors
18.1 You are requested to appoint auditors for the period fromthe conclusion of the ensuing annual general meeting tillthe conclusion of the next annual general meeting and tofix their remuneration.
On behalf of the board of directors,
Date : May 16, 2000 CHAIRMAN
directors’ report I

A) EMPLOYED THROUGHOUT THE FINANCIAL YEAR
1 Agarwal P K Sr Manager (Sales Support) 603,719 B Tech (Elec) 55 33 20-05-1986 Auto Meters Ltd,Marketing Manager
2 Agrawal C K Deputy General Manager (PPC) 890,677 B E (Mech), MMS 52 31 03-02-1969 —
3 Athale S M Sr Manager ( E&T - Motorcycles) 672,760 DPT,B Sc 50 27 02-11-1984 Bajaj Tempo LtdAsst Manager
4 Bajaj Madhur President & Wholetime Director 1,748,755 B Com, MBA 47 20 21-06-1986 Bajaj International Pvt LtdChief Executive
5 Bajaj Rahul Chairman & Managing Director 3,562,867 BA (Hons.), LLB, MBA (Harvard) 62 40 01-04-1970 Bajaj Tempo LtdStationed as Director - Dy Gen ManagerManaging Agents atPune from 01-01-1965
6 Bajaj Rajiv Vice President (Products) 1,002,834 B E (Mech), M Sc (M S E) 33 9 19-12-1990 —
7 Bajaj Sanjiv General Manager (Corporate Finance) 731,152 BE (Mech), M Sc (M S E), MBA (Harvard) 30 5 01-08-1994 —
8 Balaraman T M Deputy General Manager (Product Engg. ) 699,457 BSc (Engg), M. Tech 53 31 13-06-1992 Automotive Research Asso. of IndiaDy. Director R & D
9 Banerjee N K General Manager (Corporate Affairs) 1,358,338 BA (Hons) ECON ASC 59 38 01-02-1993 ICI (India) Ltd(LONDON) Deputy General Manager (Corp Relations)
10 Basu T Deputy General Manager (Electric Vehicles) 670,550 B Tech 55 32 15-01-1990 Jaihind Industries LtdManager. (Elec. Div)
11 Bhadesher A S Sr Manager (Motorcycle Project) 742,955 LME 52 36 16-12-1984 Bajaj Tempo LtdAsst Manager (Body Shop)
12. Bhan Pyarelal G Dept. Manager (ME-Toolroom) 621,699 FIE, AMIE, DME 51 29 27-12-1986 HMT Ltd KashmirManager
13 Bhargava R S Deputy General Manager (Quality Control) 843,318 BE (Mech), PGDIEM 58 34 22-06-1986 Mahindra Owen LtdManager Planning
14 Bhargava Ramesh General Manager ( International Marketing) 1,507,694 M Sc, PGDIT 48 23 08-04-1994 Hero MotorsSr. Gen. Manager (Export)
15 Chiplonkar S J (Mrs) Dept Mgr (Product Engg. ) 635.139 BE (Elec & Tele). DBM 47 25 15-10-1993 TelcoManager (Development)
16 Chitnis A B Deputy General Manager (Administration) 707,949 BE (Elec), BE (Mech), DBM, MIE 55 33 18-11-1977 Trinity Engineers P LtdPlant Engineer
17 D’Sa K P Deputy General Manager (Finance) 1,036,091 B Com, ACA, AICWA 46 21 05-09-1978 —
18 Dani S P Sr Manager (Personnel) 655,831 MA (Soc,) MA (SW), LLB 57 33 07-06-1967 —
19 Dattawadkar S B Sr Manager (3 Wheelers) 623,504 DME,DEE, AMIE 56 36 01-07-1973 Ammunition FactorySupervisor A Grade
20 Deshpande C Y Deputy General Manager (Product Engg. ) 631,589 BE (Mech) 48 25 17-03-1995 LML LimitedDy. General Manager
21 Deshpande S M Sr Manager (Elect Lab) 776,927 DEE 59 37 16-03-1964 MSEB, Sub Engineer
22 Dhoot N N Deputy General Manager (Project Mgmt) 1,178,213 DAE 59 36 01-12-1984 —
23 Ghose D Deputy General Manager (Product Engg. ) 612,523 B.Tech. (Hons) 47 25 21-10-1991 Telco, PuneChief Development Engineer
24 Gopalkrishnan S Deputy General Manager (Spare Parts) 645,303 B.Tech, PGDM 50 25 25-10-1996 Brakes India LtdManager (Parts & Services)
25 Gupta Arvind General Manager (Mfg. Engg) 1,362,490 B.E. (Mech.) DIM 53 29 30-04-1991 Telco PuneDy. Div. Mgr. (Projects)
26 Gupta R S General Manager (Motorcycle Project) 1,188,310 B.E.(Mech) 58 36 02-11-1989 Telco (Jamshedpur)Dy. Divn. Manager
27 Gupta Ranjit Vice President (Materials) 2,793,258 Inter SC, MIME, AMIPE , FIEE 57 34 19-03-1988 Maruti Udyog Ltd.General Manager
28 Hingorani N H Vice President (Purchase) 2,188,337 B.E. (Mech) 51 28 01-03-1997 LML Ltd.Executive Director (Commercial)
29 Iyer N V General Manager (Engg. Support) 1,378,138 B.Sc (Engg), DIIP 57 34 10-03-1997 Ashok LeylandGeneral Manager (Prod. Engg.)
30 Jagannathan M Sr Manager (Internal Audit) 705,487 B. Com, Inter CA 55 27 05-04-1983 VIP Industries Ltd Asst Manager Audit
Information as per section 217 (2A)(b)(ii) read with the Companies (particulars of employees) I rules, 1975 and forming part of Director’s report for the year ended 31st March, 2000.
S.NO NAME DESIGNATION/ GROSS QUALIFICATIONS AGE TOTAL DATE OF LAST EMPLOYMENT AND
NATURE OF DUTIES REMUNERATION (YEARS) EXPERIENCE COMMENCEMENT DESIGNATION
(RUPEES) (YEARS) 0F EMPLOYMENT
1 I2 I3 I4 I5 I6 I7 I8 I9
annexure 1 IF I F T Y F I F T H A N N U A L R E P O R T 1 9 9 9 | 2 0 0 0
47

48
31 Jain R A Executive Director 1,563,725 B.E. (Elec), BE (Mech.) 66 41 02-08-1962 Kirloskar Pneumatic Co. Ltd.Development Engineer
32 Joshi N J Company Secretary 1,528,072 M. Com ACS 59 39 26-12-1973 CTR Mfg. Industries Ltd.Asst. Company Secretary
33 Kachru V K Sr Manager (Heat Treatment) 641,756 B. Sc (Met Engg) 55 32 01-06-1968 ——
34 Kane Vijay A Sr. Mgr (Veh -Scooters) 643,708 ME (Mech), DBM 50 27 30-09-1984 Gajra Gears Pvt LtdPlant Engineer
35 Keyyath M D PS To Managing Director 619,800 B Com, LLB, DBM 45 26 19-05-1978 The Rajabahadur Motilal PoonaMills Ltd, Sr Steno
36 Khopkar A G Deputy General Manager(MIS) 842,046 B.E. (Mech), PGDM 45 18 29-03-1994 AL Information Technology LtdSystems Manager
37 Kothari S N Deputy General Manager (Materials) 922,322 B.E. (Mech.), MMS, DBM 54 30 14-07-1980 TelcoEngineer, Auto Materials
38 Kulkarni S S Deputy General Manager 917,321 B.E. (Mech.), MDBA, DME 53 30 01-12-1975 Cooper Engg. Ltd.(Mfg.Engg–Akrudi) Suptd. Machine Shop
39 Laddha G B General Manager (Finance) 1,787,541 B.Com, AICWA 56 36 18-08-1969 Bajaj Tempo Ltd.Costing Officer
40 Mahajan M L Deputy General Manager 759,436 ME(Auto),BE(Mech),DB&IM 60 37 10-08-1984 Girnar Scooters Ltd(Quality Control) Dy.Gen Manager (Tech)
41 Mali V D Deputy General Manager(Mfg Engg) 688,793 DME 59 40 07-09-1984 Sandvik Asia LtdProject Superintendent
42 Malshe K N General Manager (Corporate) 1,307,434 B Tech PGDM 47 21 01-03-1988 Stallion Shoxs LtdRegional Manager Mktg
43 Mani L K S PS To General Manager 838,651 S S L C 56 37 09-04-1963 —(Corp Affairs)
44 Marathe S R General Manager (Product Engg. ) 1,570,211 ME(Mech) 50 27 15-06-1990 TVS Suzuki LtdMember R&D
45 Mehta D S Wholetime Director 1,155,703 B Com, FCA, ACS 63 39 16-07-1986 Mukand Iron & Steel Works LtdSecretary
46 Mengane N G Deputy General Manager 1,015,754 D M E 55 33 16-05-1980 David Brown Greaves Ltd(Motorcycle, Moped & 3 Whlr. Div.) Shift Engineer
47 Naik M M Deputy General Manager (Service) 747,672 B E(Mech) MMS 59 34 04-06-1973 Ruston & Hornsby (I) LtdAsst Tool Room Engineer
48 Nair K P Dr. General Manager 1,162,024 BE(Mech), M Tech, 55 31 20-04-1997 Elgi Equipments Ltd(Quality Assurance) Auto, MSc (Auto) P HD (Auto) Director-Technical
49 Nanda C R Deputy General Manager 622,151 DIT., MSc 48 22 01-01-1997 Datar Switchgear Ltd.(Concurrent Eng) General Manager (CAD-CAM Systems)
50 Nulkar V G Deputy General Manager(Export) 714,806 D M E 50 30 20-05-1981 Swastik Rubber Products LtdExport Manager
51 Panchal D K Sr Manager(Materials) 643,618 S S C 58 40 14-10-1959 Bajaj Tempo LtdForeman
52 Pandit Prakash H Sr Manager (Central Maintenance) 653,824 DCE 54 25 05-01-1975 Shastri Const.Pvt.LtdSite Engineer
53 Panse D V Sr Manager (Quality Control) 783,947 B Tech 51 30 20-10-1984 Precision Bearing (I) LtdChief Metallurgist
54 Paranjape M B Sr Manager (QC Services) 674,513 DME 59 37 14-11-1962 —
55 Parthasarathy B Deputy General Manager(Costing) 760,855 B.Com, FICWA , FCS 55 34 10-11-1989 Brakes India LimitedManager(Cost Accounts)
56 Prasad B H K Deputy General Manager 676,325 BE(Mech),PGTD 51 26 27-12-1989 Hero Honda Motors Ltd(FE-Services) Sr.Divn Manager (T/R)
57 Prasad M S H Deputy General Manager 707,770 BE(Mech), BSc, MBA 53 27 29-08-1993 H M T (Hyderabad)(Machine Tool Division) Asst GM (Design)
58 Raghavan V S Deputy General Manager 993,712 B Sc, ACA, MAC I 47 20 09-03-1984 Self Employed as Chartered(Corp orate Finance) Accountant
59 Rao B P General Manager 1,478,397 B.A.,PGDPM, PGDT&D 48 24 02-05-1997 Fujitsu-ICIM Ltd(Human Resource Development) Vice-President (HR)
60 Rao C H Sr Manager (E&T - Scooters) 636,362 DME 51 30 01-01-1987 Associated Bearing Co Ltd,Asst.Manager
I S.NO NAME DESIGNATION/ GROSS QUALIFICATIONS AGE TOTAL DATE OF LAST EMPLOYMENT AND
NATURE OF DUTIES REMUNERATION (YEARS) EXPERIENCE COMMENCEMENT DESIGNATION
(RUPEES) (YEARS) 0F EMPLOYMENT
1 I2 I3 I4 I5 I6 I7 I8 I9
annexure 1 I (CONTD.)

F I F T Y F I F T H A N N U A L R E P O R T 1 9 9 9 | 2 0 0 0
49
61 Rao P M Deputy General Manager(Materials) 871,264 L M E 58 37 23-03-1964 Central Distributors LtdTechnical Assistant
62 Rao S P Deputy General Manager 750,123 BE(Mech), MS(Engg) 52 28 01-01-1993 Telco(Product Engg. ) Manager (Development)
63 Rao V M General Manager (Akurdi) 1,510,830 B E(Mech), B E (Elec) 58 36 10-08-1974 David Brown Greaves LtdHead Of Indl Engg Deptt
64 Rath P K General Manager (Chakan) 1,704,196 B.Sc.(Hons), B.Sc.(Engg) 53 31 25-09-1996 STI India Ltd.Vice President
65 Ravichandran R L Vice President 2,513,483 B.Com, PGDBM 50 30 27-01-1998 TVS Suzuki Ltd.(Business & Product Development) Vice-President(Marketing & Sales)
66 Rege S R General Manager 1,338,029 BE(Mech),M Tech, MMS, MIE, MIS, ME 61 36 14-01-1985 Godrej & Boyce Mfg Co Pvt Ltd(Maharashtra Scooters Ltd) Asst Plant Manager
67 S.Narayana Prasad Deputy General Manager 634,689 BE(Elec) 56 36 30-08-1998 BPL Refrigerations, Bangalore(Scooter, Step-thru & 3 wheeler) Gen Manager
68 Sarin V K Dept Manager 610,643 DME 55 35 06-11-1989 Kay International Pvt LtdWorks Manager
69 Sasidharan E K Deputy General Manager 865,368 B Sc(Engg)(Mech) 58 34 01-11-1968 National Machinery Mfgrs(Central Maintenance) Jr Engr
70 Saxena Ashok Deputy General Manager 893,027 BE(Mech) 49 26 02-03-1991 Kinetic Engg Ltd(Product Engg. ) Purchase Manager
71 Sharma D K General Manager (Production) 1,338,925 D M E 59 38 09-03-1975 Tata ExportsPlant Manager Maint
72 Sharma M L Deputy General Manager 951,837 B Com, MA , LL B 64 43 12-04-1962 Indian Oxygen Ltd(Corporate Personal) Accounts Clerk
73 Shrivastava Pradeep Deputy General Manager 837,375 B Tech,PGDM 40 14 25-04-1986 Tata Engineering & Locomotive Co Ltd(Production-Chakan) Asst Engineer
74 Sole Sudhir W Sr. Manager (Motorcycle Project) 855,563 BE(Mech) 50 26 20-03-1974 Vanaz Engg LtdJr.Engr.
75 Talapatra A S Deputy General Manager 760,232 L M E 54 34 02-09-1968 The Raja Bahadur Motilal Poona (Tool Engineering) Mills Ltd., (Engg Divn), Asst. Engineer
76 Thadani P B Dept Manager (Finance) 661,701 BA, CA 41 15 01-01-1989 Maharashtra Scooers LtdDy Manager (Audit)
77 Tripathi C P Vice President (Waluj) 2,547,295 B Tech, B Sc, DIIP 58 34 22-01-1996 Escorts LtdChief GM (Mat & Prod)
78 Upadhyaya K K General Manager 1,488,535 BE(Mech) 63 36 17-06-1991 HMT Ltd (Bangalore)(Machine Tool Division) Chief Of Horz Boring Divn
79 Venkatachalam A R Deputy General Manager (Prod Support) 785,577 B Tech 43 20 06-04-1998 Wipro Ltd Waluj,AurangabadGeneral Manager (Operations
B) EMPLOYED FOR THE PART OF THE YEAR
1 *Bhoir J K Sr Manager(Maint-Service) 266,502 B E (Elect) 61 37 26-08-1979 Walchandnagar Ind Ltd
Asst Manager Maint
2 Chander K P General Manager (MTD) 236,733 B.Tech (Mech) 45 23 19-01-2000 WIDIA India Ltd.BangaloreGeneral Manager (SPM)
3 *Chopra L C Sr.Assistant 407,779 B.Com 53 34 13-08-1965 —
4 *Gabbar Singh Peon 356,167 Non Matric 52 30 09-08-1969 —
5 *Hongekar G L Opn Mgr(Sp Mktg) 166,290 DME, PDAE 61 36 01-07-1964 Tech. Dev. Estt. Vehicle WingJr. Scientific Asst. Gr-ii
6 *Jacob C K Sr Manager(2W Sales) 508,663 BE, PGDM 42 19 25-06-1995 Bajaj Tempo Ltd.Sr Manager (Mktg)
7 *Janak Lal Watchman 342,135 — 54 31 26-12-1967 —
8 *John Morris Painter 395,950 Matric 56 36 01-03-1963 —
9 *Karunakaran V Regional Sales Manager 148,744 B.A. 38 16 15-06-1992 Usha International LtdSales Manager
10 *Maheshwari G Sr Clerk 367,501 B.Com 48 26 15-09-1973 —
11 *Monga S K Sr Assistant 406,517 B.A. 52 28 18-02-1971 —
IS.NO NAME DESIGNATION/ GROSS QUALIFICATIONS AGE TOTAL DATE OF LAST EMPLOYMENT AND
NATURE OF DUTIES REMUNERATION (YEARS) EXPERIENCE COMMENCEMENT DESIGNATION
(RUPEES) (YEARS) 0F EMPLOYMENT
1 I2 I3 I4 I5 I6 I7 I8 I9
annexure 1 I (CONTD.)

50
12 *Nair R V Dept Mgr(Product Engg. ) 41,962 B Tech, M. Design 32 7 22-03-1992 IIT, Powai, MumbaiDesign Associate
13 *Prem Kumar Mechanic 361,808 Matric 57 32 16-05-1967 —
14 *Sahasrabudhe G N Sr.Mgr (Kaizen) 285,197 DEE, DAE, MIAE 61 36 23-07-1964 —
15 Srinivas K Deputy General Manager 206,319 BE (Elect), DMS 38 17 07-01-2000 Gilbert Tweed Mgmt Group Pvt Ltd(Human Resource Development) Chief Executive Officer
16 *Srinivasan L K Clerk II 316,186 B Com 48 24 05-05-1975 —
17 *Tribhuvannath Peon 378,057 7th Std. 53 33 14-07-1966 —
18 *Verma H C Typist Clerk - I 354,081 B Com 50 26 28-08-1973 —
19 *Walia A K Sr.Assistant 369,995 B Sc 49 27 19-07-1972 —
* These employees have left the service
Notes :
1) Gross remuneration includes Salary, Bonus, Allowances, Commission, cost of other perquisites calculated on the basis of rules prescribed in this behalf by the Department of Company Affairs and Company’s contribution to Provident Fund, Superannuation Fund and other Funds.
2) All employees have adequate experience to discharge the responsibilities assigned to them.
3) The nature of employment in all cases is contractual. Appointment of Rahul Bajaj is for a period of five years with effect from April 1, 1995. Appointment of Madhur Bajaj is for a period of five years with effect from November 6, 1995. Appointment of D S Mehta is for a period of five years with effect from February 6, 1998
4) The services of employees are terminable by either side by giving three months' notice, except employees mentioned at Sr. Nos. 35 & 43 under 'A' whose services are terminable by either side by giving one month notice.
5) None of the emloyees mentioned above is a relative of any Directors of the Company, other than Madhur Bajaj (Sr. No. 4 under 'A') who is the brother of Shekhar Bajaj, Director of the Company and Rajiv Bajaj (Sr. No. 6 under 'A') and Sanjiv Bajaj (Sr. No 7 under ‘A’) who are the sons of Rahul Bajaj, Chairman and Managing Director of the company.
I S.NO NAME DESIGNATION/ GROSS QUALIFICATIONS AGE TOTAL DATE OF LAST EMPLOYMENT AND
NATURE OF DUTIES REMUNERATION (YEARS) EXPERIENCE COMMENCEMENT DESIGNATION
(RUPEES) (YEARS) 0F EMPLOYMENT
1 I2 I3 I4 I5 I6 I7 I8 I9
annexure 1 I (C O N T D. )

51
F I F T Y F I F T H A N N U A L R E P O R T 1 9 9 9 | 2 0 0 0
We have audited the attached Balance Sheet of BAJAJ AUTOLIMITED, as at 31st March,2000 and also the annexed Profitand Loss Account of the Company for the year ended on thatdate annexed thereto:
(1) As required by the Manufacturing and OtherCompanies (Auditor’s Report) Order, 1988, issued bythe Company Law Board in terms of Section 227(4A) ofthe Companies Act,1956, we annex hereto a Statementon the matters specified in paragraphs 4 and 5 of thesaid Order;
(2) Further to our comments in Annexure referred to inparagraph 1 above, we report that:
(a) We have obtained all the information and explanationswhich to the best of our knowledge and belief werenecessary for the purposes of our audit;
(b) In our opinion, proper books of account as required bylaw have been kept by the Company so far as appearsfrom our examination of the Books of the Company;
(c) The Balance Sheet and Profit and Loss Account dealtwith by the report are in agreement with the Books ofAccount of the Company;
(d) In our opinion, the Profit and Loss Account and theBalance Sheet read with Note No.17 relating to non-applicability of Accounting Standard AS 15 issued bythe Institute of Chartered Accountants of India, complywith the Accounting Standards referred to in Section211 (3C) of the Companies Act,1956, to the extentapplicable.
(e) In our opinion and to the best of our information andaccording to the explanations given to us, theAccounts, read with Note No.10- relating to provision ofexcise duty on closing stock of finished goods as perrevised guidance Note on "Accounting Treatment ofExcise Duty" and Note No.11 relating to change inbasis of valuation of inventories in accordance withrevised Accounting Standard AS-2 "Valuation ofInventories" and its effect on year-end inventories andProfit for the year as detailed in the note, Note No.13(a)relating to the manner of disclosure of details ofInvestments in Schedule 7 relating to Investmentsannexed to the Accounts, for which approval ofGovernment is awaited, and read together with otherrelevant notes thereon, give the information required bythe Companies Act,1956, in the manner so requiredand present a true and fair view:
(i) in the case of the Balance Sheet, of the state of theaffairs of the Company as at 31st March,2000; and
(ii) in the case of the Profit and Loss Account, of the Profitfor the year ended on that date.
For and on behalf ofDALAL & SHAH
Chartered Accountants
Y. C. Amin Partner
MUMBAI: 16th May, 2000.
report of the auditors to the members I

52
Statement referred to in Paragraph 1 of the Auditors’ Report ofeven date to the Members of BAJAJ AUTO LIMITED on theAccounts for the year ended 31st March,2000.
On the basis of such checks as we considered appropriate andin terms of information and explanations given to us, we statethat:
i) The Company has maintained proper records showingfull particulars including quantitative details andsituation of fixed assets. As explained to us, all theassets have been physically verified by themanagement at reasonable intervals during the year.According to the information and explanations given tous, discrepancies noticed on such physical verificationwere not significant and the same have been properlydealt with in the Books of Account;
ii) None of the fixed assets have been revalued during theyear;
iii) (a) The stocks of finished goods, stores, spare parts,raw materials, components and auto spare partshave been physically verified by the managementat reasonable intervals during the year and / or atthe close of the year;
(b) As explained to us, the procedures of physicalverification of Stocks referred to in (a) abovefollowed by the management are, in our opinion,reasonable and adequate in relation with the size ofthe Company and the nature of its business;
(c) According to the records produced to us for ourverification, there were no material discrepanciesnoticed on physical verification of stocks referred toin (a) above, as compared to book records and thesame have been properly dealt with in the books ofaccount;
(d) We have examined and verified the stockverification records of the Company and alsowherever necessary, we have physically verified thestocks and taken assistance from the technicalstaff of the Company. On the basis of suchexamination and verification, we are satisfied thatthe valuation of stocks is fair and proper inaccordance with the normally accepted accountingprinciples and is on the same basis as in thepreceding year; except the changes stated in NoteNo.10 & 11 in Schedule 14 to the Accounts;
iv) The rate of interest and other terms and conditions onwhich unsecured loans have been taken fromcompanies listed in the register maintained underSection 301 of the Companies Act,1956, are, in our
opinion, not prima facie prejudicial to the interest of theCompany. The Company has not taken any loans,secured or unsecured, from firms or other parties listedin the said register. As explained to us, there are nocompanies under the same management within themeaning of Section 370(1-B) of the CompaniesAct,1956;
v) Loans and Advances in the nature of loans given bythe Company:
(a) The rate of interest and other terms and conditionson which unsecured loans have been granted toCompanies listed in the register maintained underSection 301 of the Companies Act,1956, are, inour opinion, not prima facie prejudicial to theinterest of the Company. No loans, secured orunsecured, have been granted to firms or otherparties listed in the said register. As explained tous, there are no companies under the samemanagement within the meaning of Section 370(1-B) of the Companies Act,1956;
(b) (1) A sum of Rs.47.000 Million was outstanding ason 1st April,1999 against unsecured loansrepayable on demand given to Bajaj AutoHoldings Limited, the Company’s wholly ownedsubsidiary and a further loan amounting toRs.151.500 Million has been given during theyear, total loans of Rs.137.500 Million havebeen demanded and received during the year.Interest is being recovered regularly;
(2) Employees and other parties to whom loanshave been given by the Company are repayingthe principal amount as stipulated and are alsoregular in payment of interest whereapplicable, except in the case of certain partiesfor which the Company has taken legal andother reasonable steps to secure recovery ofthe principal and interest;
vi) In our opinion and according to the information andexplanations given to us, there are adequate internalcontrol procedures commensurate with the size of theCompany and the nature of its business with regard tothe purchase of stores, raw materials includingcomponents, plant and machinery, equipments andother assets and also for the sale of goods and autospare parts;
annexure to auditors’ report I

53
F I F T Y F I F T H A N N U A L R E P O R T 1 9 9 9 | 2 0 0 0
vii) According to the information and explanations given tous, the transactions of purchase and sale of goods andmaterials made in pursuance of contracts orarrangements entered during the year in the registermaintained under Section 301 of the CompaniesAct,1956, aggregating to Rs.50,000/- or more inrespect of each party, have been made at prices whichare reasonable having regard to prevailing marketprices as available with the Company for such goodsand materials or prices at which transactions for similargoods have been made with other parties. Asexplained to us, there were no transactions during theyear for supply of services with any party listed in abovereferred register;
viii) As explained to us, the Company has a regularprocedure for determination of unserviceable ordamaged stores, raw materials, components, autospare parts or finished goods and necessary provisionfor the loss arising on the items so determined, havebeen made in the books of account of the Company;
ix) In our opinion, the Company has complied with theprovisions of Section 58A of the Companies Act,1956and the Companies (Acceptance of Deposits)Rules,1975 with regard to the deposits accepted by itfrom the public;
x) In our opinion, the Company has maintainedreasonable records for the sale and disposal ofrealisable scrap. The Company has no by-products;
xi) In our opinion, the Company has an adequate internalaudit system commensurate with the size and nature ofits business;
xii) We have broadly reviewed the Books of Accountmaintained by the Company pursuant to the rulesmade by the Central Government for the maintenanceof Cost Records under Section 209(1)(d) of theCompanies Act,1956, and are of the opinion that primafacie the prescribed accounts and records have beenmade and maintained. We have, however, not made adetailed examination of the records with a view todetermine whether they are accurate;
xiii) According to the records of the Company, the ProvidentFund dues and the Employees’ State Insurance dues,wherever applicable, have been regularly depositedduring the year with the appropriate authorities;
xiv) According to the records of the Company, noundisputed amounts payable in respect of Income-tax,Wealth-tax, Sales Tax, Customs Duty and Excise Dutywere outstanding as at the last day of the financial year,for a period of more than six months from the date theybecame payable;
xv) On the basis of ( i ) the examination of the Books ofAccount, (ii) the vouchers produced to us for ourverification, (iii) the explanations given andrepresentations made to us on our inquiries and (iv) thecheck and control relating to authorising theexpenditure on the basis of contractual obligations tothe employees, accepted business practices havingregard to the Company’s needs and exigencies, wehave not come across any expenses charged torevenue, which, in our opinion and judgement and tothe best of our knowledge and belief, could beregarded as personal expenses;
xvi) The Company does not fall within the meaning ofclause (o) of Section 3(1) of the Sick IndustrialCompanies (Special Provisions) Act,1985;
xvii) In respect of the trading activities of the Companywhich form an insignificant part of its income, therewere no damaged goods during the year.
For and on behalf ofDALAL & SHAH
Chartered Accountants
Y. C. AminPartner
MUMBAI: 16th May,2000.
annexure to auditors’ report I

54
balance sheet IAS AT 31ST MARCH
2000 I 1999
Schedule Rupees Rupees Rupees
I. Sources of Funds 1. Shareholders’ Funds
a) Capital 1 1,193,908,140 1,193,908,140b) Reserves & Surplus 2 30,846,870,016 25, 823,520,903
32,040,778,156 27,017,429,043
2. Loan Fundsa) Secured Loans 3 1,015,826,193 410,820,636b) Unsecured Loans 4 3,940,894,688 3,086,138,283
4,956,720,881 3,496,958,919Total 36,997,499,037 30,514,387,962
II.Application of Funds1. Fixed Assets
a) Gross Block 20,411,482,261 17,171,866,754b) Less: Depreciation 10,323,442,917 8,982,862,545c) Net Block 5 10,088,039,344 8,189,004,209d) Lease Adjustment Account-Plant & Machinery 249,963,537 177,876,264
10,338,002,881 8,366,880,473e) Capital Work in progress, expenditure
to date (including Machinery in transitRs. 653,634,990/- [Previous year Rs 1,284,182/-] and Expenditure during construction period Rs. NIL [Previous year Rs. 27,158,988/–]) 804,447,900 851,246,155
11,142,450,781 9,218,126,6282. Technical Know-how 6 4,389,420 7,326,0243. Investments 7 19,523,606,622 14,590,585,1664. Current Assets, Loans & Advances 8
a) Inventories 2,611,260,130 1,775,006,193b)Sundry Debtors 1,857,986,491 2,146,638,979c) Cash and Bank Balances 359,840,420 540,774,159d)Other Current Assets 512,285,533 812,445,984e) Loans and Advances 18,389,424,031 16,695,247,740
23,730,796,605 21,970,113,055Less: Current Liabilities and Provisions 9a) Liabilities 6,594,414,495 4,212,072,482b)Provisions 10,809,329,896 11,059,690,429
17,403,744,391 15,271,762,911Net Current Assets 6,327,052,214 6,698,350,144
Total 36,997,499,037 30,514,387,962
Notes forming part of the Accounts 14
As per our attached report of even date Rahul Bajaj Chairman & Managing Director
For and on behalf of Dalal & Shah D.J. Balaji RaoChartered Accountants D.S. Mulla
D.S. Mehta DirectorsMadhur Bajaj
Y.C. Amin N.J.Joshi S.H. KhanPartner Secretary Kantikumar R. Podar
Shekhar BajajMumbai: 16th May, 2000 J.N. Godrej

55
F I F T Y F I F T H A N N U A L R E P O R T 1 9 9 9 | 2 0 0 0
profit and loss account IFOR THE YEAR ENDED 31ST MARCH
2000 I 1999
Schedule Rupees Rupees Rupees
Income
Sales including Excise Duty 37,051,501,389 35,269,122,910Other Income 10 5,096,526,610 3,715,164,779Premium on surrender of Tenancy Rights 7,500,000 87,668,577
42,155,527,999 39,071,956,266
Expenditure
Materials 11 19,153,298,457 17,933,858,686Excise Duty 6,078,289,309 5,649,340,324Other Expenses 12 7,466,279,353 6,759,659,840Interest 13 41,274,232 45,913,472Depreciation 1,453,067,618 1,326,996,151
34,192,208,969 31,715,768,473Less: Expenses, included in above items, capitalised 289,019,942 228,984,570
33,903,189,027 31,486,783,903
Profit before Taxation 8,252,338,972 7,585,172,363Provision for Taxation [ including Rs.3,100,000/-
for Wealth tax (previous year Rs. 3,200,000/- )] 2,115,000,000 2,180,000,000Profit for the year 6,137,338,972 5,405,172,363
Excess Depreciation in earlier year written back — 1,155Tax adjustments relating to earlier years 239,758,045 146,229,013
6,377,097,017 5,551,402,531Expenses relating to earlier years 28,509,868 22,971,289
6,348,587,149 5,528,431,242
Transfer to Contingency Reserve — 17,500,000Transfer to General Reserve 5,023,349,113 4,450,740,813
Interim Dividend - Since paid 1,193,908,140 —Corporate Dividend Tax thereon 131,329,896 —
1,325,238,036 —Proposed Dividend — 955,126,512Corporate Dividend Tax thereon — 105,063,917
— 1,060,190,429
Balance carried to Balance Sheet — —
Notes forming part of the Accounts 14
As per our attached report of even date Rahul Bajaj Chairman & Managing Director
For and on behalf of Dalal & Shah D.J. Balaji RaoChartered Accountants D.S. Mulla
D.S. Mehta DirectorsMadhur Bajaj
Y.C. Amin N.J.Joshi S.H. KhanPartner Secretary Kantikumar R. Podar
Shekhar BajajMumbai: 16th May, 2000 J.N. Godrej

56
Authorised:
150,000,000 Equity Shares of Rs. 10 each 1,500,000,000 1,500,000,000
Issued:
119,390,814 Equity Shares of Rs 10 each 1,193,908,140 1,193,908,140
Subscribed:
119,390,814 Equity Shares of Rs 10 each 1,193,908,140 1,193,908,140
Total 1,193,908,140 1,193,908,140
Notes
1. Includes 114,174,388 Equity Shares of Rs 10/- each alloted as fully paid Bonus Shares byway of capitalisation of Share Premium Account and Reserves.
2. Includes 4,342,676 Shares issued by way of Euro Equity Issue represented by GlobalDepository Shares evidencing Global Depository Shares at a price of U.S.$ 25.33 per Share (inclusive of premium).
Debenture Redemption Reserve:As per last account — 71,300,000Less: Transferred to General Reserve — 71,300,000
— —
Security Premium Account (Share Premium Account):As per last account 2,892,103,727 2,892,103,727
Contingency Reserve:As per last account 17,500,000 —
Set aside this year — 17,500,00017,500,000 17,500,000
General Reserve:As per last account 22,913,917,176 17,024,897,893Add: Debenture Redemption Reserve, transferred — 71,300,000Add: Excess on recomputaion of depreciation — 1,366,978,470Set aside this year 5,023,349,113 4,450,740,813
27,937,266,289 22,913,917,176
Total 30,846,870,016 25,823,520,903
Schedule 1 Share Capital As atI 31 st March 1999
Rupees Rupees
Schedule 2 Reserves and Surplus As atI 31 st March 1999
Rupees Rupees Rupees
schedules no. 1-14 IANNEXED TO AND FORMING PART OF THE BALANCE SHEET AS AT AND THE PROFIT AND LOSS ACCOUNT FOR THE YEAR ENDED 31ST MARCH 2000

57
F I F T Y F I F T H A N N U A L R E P O R T 1 9 9 9 | 2 0 0 0
3,509,968 16% Secured Non-Convertible RedeemableDebentures of Rs. 100 each, to be redeemed after seven years i.e. on 31st December, 1998 [see note 9] — 350,996,800
Less:(i) 176,853 16% (Previously 15%)
Debentures repurchasedbut not cancelled, to be reissued — 17,685,300
(ii) 2,241,643 16% (Previously 15%) Debentures redeemed on the date of redemptionon exercise of an option by Debentureholders — 224,164,300
(iii) 408,799 16% (Previously 15%) Debentures redeemed on non-exercise of any option by Debenture holders (including 22,736 Debentures pending surrenderof Debenture Certificates by Debentureholders) — 40,879,900
— 282,729,500— 68,267,300
Add: 743,531 16% Debentures re-issued (including 566,678 16% Debentures out of the Debenturesredeemed as above) — 74,353,100
— 142,620,400Less: 16% Debentures repurchased during the year NIL[ Previous year 51,821 ] — 5,182,100
— 137,438,300
Less: Redeemed during the year — 137,438,300— —
From Banks, against hypothecation of Stores, Raw Materials,Finished Goods, Stock in Processand Book Debts 1,015,826,193 410,820,636
Total 1,015,826,193 410,820,636
Sales Tax Deferral Liability under Package Scheme of Incentive 1983,1988 and 1993 3,863,553,673 2,996,467,878
Fixed Deposits 77,341,015 89,670,405
Total 3,940,894,688 3,086,138,283
Schedule 3 Secured Loans As atI 31 st March 1999
Rupees Rupees Rupees
Schedule 4 Unsecured Loans As atI 31 st March 1999
Rupees Rupees

58
Schedule 5 Fixed Assets As at I 31 st March 1999
Schedule 6 Technical Know-How As atI 31 st March 1999
Rupees Rupees
Gross Block (a) Depreciation Net Block
Particulars As at 31st Additions Deductions As at 31st Upto 31st Adjustments on Deductions For the Upto 31st As at 31st As at 31stMarch,1999 and March, 2000 March,1999 Recomputation and year March, 2000 March, 2000 March, 1999
Adjustments Adjustment (e)
Rupees Rupees Rupees Rupees Rupees Rupees Rupees Rupees Rupees Rupees Rupees
Land Freehold 7,408,820 9,645,000(f)
17,053,820 — — — — — 17,053,820 7,408,820
Land Leasehold (b) 384,349,757 — 4,205,728 380,144,029 — — — — — 380,144,029 384,349,757
Building (c) 1,368,390,866 499,271,123 2,321,039 1,865,340,950 437,321,724 — 569,006 44,562,034 481,314,752 1,384,026,198 931,069,142
Water-pumps,
Reservoirs and Mains 42,474,842 8,423,477 — 50,898,319 17,348,706 — — 1,463,966 18,812,672 32,085,647 25,126,136
Plant & Machinery 9,675,095,282 2,067,485,759 125,550,441 11,617,030,600 5,505,417,802 — 98,002,912 656,443,631 6,063,858,521 5,553,172,079 4,169,677,480
Dies & Jigs 1,423,410,991 489,613,837 5,504,056 1,907,520,772 693,071,856 — 416,497 128,597,387 821,252,746 1,086,268,026 730,339,135
Electric Installations 252,174,656 92,486,319 175,305 344,485,670 159,463,472 — — 7,918,277 167,381,749 177,103,921 92,711,184
Factory Equipment 549,458,593 68,381,004 3,504,038 614,335,559 313,548,959 — 3,281,537 38,087,839 348,355,261 265,980,298 235,909,634
Furniture & Fixtures 297,493,051 26,514,658 2,798,610 321,209,099 155,621,984 — 1,410,639 20,594,810 174,806,155 146,402,944 141,871,067
Electric Fittings 66,267,337 15,600,752 — 81,868,089 38,406,832 — — 6,365,789 44,772,621 37,095,468 27,860,505
Vehicles & Aircraft 267,013,589 46,385,168 19,235,343 294,163,414 73,313,852 — 10,354,503 19,773,122 82,732,471 211,430,943 193,699,737
Leased Assets:
Plant & Machinery 2,611,372,335 — — 2,611,372,335 1,515,009,883 — — 431,702,800 1,946,712,683 664,659,652 1,096,362,452
Dies & Moulds 226,956,635 78,295,505 (807,465) 306,059,605 74,337,475 — — 99,105,811 173,443,286 132,616,319 152,619,160
As at 31st (d)
March, 2000 Total 17,171,866,754 3,402,102,602 162,487,095 20,411,482,261 8,982,862,545 — 114,035,094 1,454,615,466 10,323,442,917 10,088,039,344 8,189,004,209
As at 31st
March, 1999 Total 15,615,716,421 1,627,888,944 71,738,611 17,171,866,754 9,070,758,572 1,366,978,470 48,074,855 1,327,157,298 8,982,862,545 8,189,004,209
a) At cost, except leasehold land which is at cost, less amounts written off.
b) Lease Deeds in respect of 50 hectares are still under execution.
c) Includes Premises on ownership basis Rs. 87,370,463/- [Previous year Rs. 78,088,939/-] and cost of shares in Co-operative Society Rs. 750/- [Previous year Rs. 500/-]
Sale deeds in respect of Premises (At Delhi) of the value of Rs. 925,044/- is under execution.
d) Includes Depreciation amounting to Rs. 1,547,848/- [Previous year Rs. 161,147/-] on the assets used during construction period of
Chakan Plant transferred to "Expenditure during Construction Account". and capitalised.
e) Refer Para 2(B) of Statement on Significant Accounting Policies annexed to the Accounts.
f) Out of this Rs. 1,731,796/- pertaining to Chakan Plant Leasehold Land has been transferred to “Expenditure during Construction Account” and capitalised.
As per last account 7,326,024 7,357,000
Add: Cost of technical know-how acquired during the year — 2,905,630
7,326,024 10,262,630
Less: Written off 2,936,604 2,936,606
Total 4,389,420 7,326,024

59
F I F T Y F I F T H A N N U A L R E P O R T 1 9 9 9 | 2 0 0 0
Schedule 7 Investments, at cost (Unless otherwise stated) As at I 31 st March 1999
Rupees Rupees Rupees
In Government and Trust Securities
Quoted
* 12.08% Government of India Compensation(Project Exports to Iraq) Bonds, 2001 of the face value of Rs.65,300,000 (previous year face value of Rs.55,300,000) 59,894,499 48,636,832
* 11.10% Government of India Stock 2003 of face value of Rs.100,000,000 102,769,163 —
* 11.98% Government of India Stock 2004 of face value of Rs.100,000,000 108,487,472 —
* 12% Government of India Stock 2008 of face value of Rs.200,000,000 223,363,611 —
* 11.99% Government of India Stock 2009of face value of Rs.150,000,000 161,151,308 —
* 12.29% Government of India Stock 2010of face value of Rs.250,000,000 277,541,967 —
* 12.32% Government of India Stock 2011 of face value of Rs.250,000,000 275,809,835 —
* 12.40% Government of India Stock 2013of face value of Rs.150,000,000 176,798,055 —
* 11.83% Government of India Stock 2014 of face value of Rs.400,000,000 440,053,555 —
50,000,000 (90,357,390) Units of Rs.10 each of Unit Trustof India under Unit Scheme 1964 732,585,229 1,342,665,155
* 10,000,000 (—) Units of Rs.10 each of Unit Trust of India under Monthly Income Plan 1999 100,000,000 —
Other 213,723,381 1,376,469,577
2,872,178,075 2,767,771,564
Unquoted :
6 Years National Savings Certificates of the Face Value of Rs. 11,500 (Previous year Rs.76,500) 11,500 76,500
4,480 (5,360) Units of Rs.100 each of Unit Trust of India under Venture Capital Unit Scheme 1990 Vecaus II ( 880 Units redeemed during the year ) 448,000 536,000
459,500 612,500
Carried Over 2,872,637,575 2,768,384,064

60
Schedule 7 Investments, at cost (CONTD.)(Unless otherwise stated) As atI 31 st March 1999
Rupees Rupees Rupees
Carried Over 455,230,000 290,230,000
Carried Over 2,872,637,575 2,768,384,064
Brought Over 2,872,637,575 2,768,384,064In Fully Paid Preference Shares
Unquoted
500,000 13.5% Redeemable Cumulative Non ConvertiblePreference Shares of Rs.100 each in The Arvind Mills Ltd. 50,000,000 50,000,000
300,000 13% Redeemable Cumulative Preference Shares of Rs.100 each in Atul Limited 30,000,000 30,000,000
— (100,000) 15% Non-Convertible CumulativeRedeemable Preference Shares of Rs.100 each in Atco Industries Limited — 10,000,000
50,000 (-) 13% Optionally Convertible Cumulative Redeemable Preference Shares of Rs.100 each inAurangabad Electricals Private Limited 5,000,000 —
3,000,000 11% Cumulative Non-participating Redeemable Preference Shares of Rs.10 each in Bajaj Electricals Limited 30,000,000 30,000,000
300,000 12% Redeemable Non Convertible Cumulative Pre- ference Shares of Rs.100 each in Birla VXL Limited 30,000,000 30,000,000
200,000 11% Cumulative Redeemable Preference Shares of Rs.100 each in BSES Limited 20,230,000 20,230,000
2,000,000 (-) 10.5% Cumulative Redeemable PreferenceShares of Rs.10 each in Dani Trading and
Investments Limited 20,000,000 —
300,000 12% Non Convertible Cumulative RedeemablePreference Shares of Rs.100 each in The DhampurSugar Mills Limited 30,000,000 30,000,000
— (200,000) 13% Redeemable Cumulative Preference Shares of Rs.100 each in Duncans Industries Limited — 20,000,000
100,000 15% Cumulative Redeemable Preference Shares of Rs.100 each in Elbee Services Limited 10,000,000 10,000,000
8,000,000 (-) 10.5% Cumulative Redeemable Preference Shares of Rs.10 each in Geetanjali Trading and Investments Private Limited 80,000,000 —
— (300,000) 12% Redeemable Cumulative Preference Shares of Rs.100 each in Global Tele-Systems Limited — 30,000,000
1,200,000 (-) 12% Redeemable Cumulative Preference Shares of Rs.100 each in Global Wireless Technology Limited 120,000,000 —
3,000,000 16% Redeemable Cumulative Preference Shares of Rs.10 each in Good Value Marketing Company Limited 30,000,000 30,000,000

F I F T Y F I F T H A N N U A L R E P O R T 1 9 9 9 | 2 0 0 0
Schedule 7 Investments, at cost (CONTD.)(Unless otherwise stated) As atI 31 st March 1999
Rupees Rupees Rupees
Brought Over 2,872,637,575 2,768,384,064In Fully Paid Preference Shares (contd.)
Unquoted (contd.) Brought Over 455,230,000 290,230,000
750,000 14.5% Cumulative Redeemable Preference Shares of Rs. 100 each in Himachal Futuristic Communications Limited 72,800,000 72,800,000
250,000 (-) 12% Cumulative Redeemable PreferenceShares of Rs.100 each in Himachal Futuristic Communications Limited 25,000,000 —
500,000 12.5% Redeemable Cumulative Preference shares of Rs.100 each in Hotel Leelaventure Limited 49,242,500 49,242,500
25,000,000 11% Redeemable Cumulative Non convertiblePreference shares of Rs.10 each in ICICI Limited 250,000,000 250,000,000
25,000,000 10.5% Redeemable Cumulative Non convertiblePreference shares of Rs.10 each in ICICI Limited 250,000,000 250,000,000
5,000,000 (-) 10% Redeemable Cumulative Non convertiblePreference shares of Rs.10 each in ICICI Limited 51,125,000 —
20,661,200 10.5% Redeemable Cumulative Preference Sharesof Rs.10 each in IFCI Limited, Formerly - TheIndustrial Finance Corporation of India Limited 206,612,000 206,612,000
— (140,000) 13.5% Cumulative RedeemablePreference Shares of Rs.100 each inKhandwala Securities Limited — 14,000,000
140,000 (-) 12% Cumulative Redeemable Preference Sharesof Rs.100 each in Khandwala Securities Limited 14,000,000 —
170,000 13.5% Cumulative Redeemable Preference Sharesof Rs.100 each in KJMC Financial Services Limited 17,000,000 17,000,000
100,000 13.5% Cumulative Redeemable Preference Sharesof Rs.100 each in KJMC Financial Services Limited 10,000,000 10,000,000
2,000,000 (-) 12% Non Convertible Cumulative Redeemable Preference Shares of Rs.10 each in Kopran Limited 20,000,000 —
7,000,000 (-) 12% Optionally Convertible Cumulative Pre-ference Shares of 100 each in Kopran Drugs Limited 74,675,000 —
— (150,000) 16.5% Redeemable CumulativePreference Shares of Rs.100 each in Leela Scotish Lace Limited — 15,000,000
400,000 (-) 12% Non Convertible Redeemable Preference Shares of Rs.100 each in Makan Investments &Trading Company Limited 40,000,000 —
2,000,000 13.5% Redeemable Cumulative Preference Sharesof Rs.10 each in Marvel Industries Limited 20,000,000 20,000,000
Carried Over 1,555,684,500 1,194,884,500
Carried Over 2,872,637,575 2,768,384,064
61

62
Schedule 7 Investments, at cost (CONTD.)(Unless otherwise stated) As atI 31 st March 1999
Rupees Rupees Rupees
Brought Over 2,872,637,575 2,768,384,064In Fully Paid Preference Shares (contd.)
Unquoted (contd.) Brought Over 1,555,684,500 1,194,884,500
100,000 (-) 12% Cumulative Redeemable Preference Shares of Rs.100 each in Mastek Limited 10,000,000 —
— (200,000) 11.25% Cumulative Redeemable Preference Shares of Rs.100 each in MIRC Electronics Limited — 20,000,000
— (200,000) 13.5% Redeemable Cumulative Preference Shares of Rs.100 each in Morepen Laboratories Limited — 20,000,000
— (2,000,000) 16% Cumulative RedeemableNon Convertible Preference Shares of Rs.10 eachin Nicco Uco Financial Services Limited (Series `A') — 20,000,000
100,000 14.75% Cumulative Redeemable PreferenceShares of Rs.100 each in Pentafour Products Limited - balance after part redemption 5,000,000 10,000,000
100,000 16% Redeemable Cumulative Preference Shares of Rs.100 each in The Pharmaceutical Products of India Limited 10,000,000 10,000,000
5,000,000 11% Cumulative Redeemable PreferenceShares of Rs.10 each in Rallis India Limited 50,000,000 50,000,000
1,000,000 10% Cumulative Redeemable Non ConvertiblePreference Shares of Rs.100 each inReliance Industries Limited 100,000,000 100,000,000
— (300,000) 13.5% Non-Convertible Redeemable Cumulative Preference Shares of Rs.100 each in Search Chem Industries Limited — 30,000,000
10,000,000 11.5% Cumulative Redeemable PreferenceShares of Rs.10 each in SICOM Limited 100,000,000 100,000,000
5,000,000 11% Cumulative Redeemable PreferenceShares of Rs.10 each in SICOM Limited 50,000,000 50,000,000
300,000 14.5% Redeemable Cumulative Non Convertible Preference Shares of Rs.100 each in SouthernPetrochemical Industries Corporation Limited 29,955,000 29,955,000
500,000 17% Redeemable Non Convertible CumulativePreference Shares of Rs.100 each in Sterling Holiday Resorts (India) Limited 50,000,000 50,000,000
— (50,000) 14% Cumulative Redeemable PreferenceShares of Rs.100 each in Sun Earth Ceramics Limited — 5,000,000
100,000 (-) 13% Cumulative Redeemable Preference Shares of Rs.100 each in Sun Earth Ceramics Limited 10,000,000 —
Carried Over 1,970,639,500 1,689,839,500
Carried Over 2,872,637,575 2,768,384,064

F I F T Y F I F T H A N N U A L R E P O R T 1 9 9 9 | 2 0 0 0
Schedule 7 Investments, at cost (CONTD.)(Unless otherwise stated) As atI 31 st March 1999
Rupees Rupees Rupees
Brought Over 2,872,637,575 2,768,384,064In Fully Paid Preference Shares (contd.)
Unquoted (contd.) Brought Over 1,970,639,500 1,689,839,500
— (5,000,000) 13% Cumulative RedeemablePreference Shares of Rs.10 each inSushmita Holdings Limited — 50,000,000
10,000,000 (-) 13% Cumulative Redeemable PreferenceShares of Rs.10 each in Sushmita Holdings Limited 100,000,000 —
1,000,000 11% Cumulative Redeemable Non-Convertible Preference Shares of Rs.100 each in Tata Finance Limited 97,000,000 97,000,000
300,000 10.5% Cumulative Redeemable Preference Shares of Rs.100 each in Titan Industries Limited 30,000,000 30,000,000
— (75,000) 13.75% Cumulative RedeemablePreference Shares of Rs.100/- each in United Shippers Limited — 7,500,000
750,000 (-) 12.25% Redeemable CumulativePreference Shares of Rs.10/- each inUnited Shippers Limited (Series I) 7,500,000 —
750,000 (-) 12.25% Redeemable Cumulative Preference Shares of Rs.10/- each in United Shippers Limited (Series II) 7,500,000 —
300,000 (-) 10.75% Redeemable Cumulative PreferenceShares of Rs.100/- each in Usha Beltron Limited 30,000,000 —
— (5,000,000) 13.5% Cumulative RedeemablePreference Shares of Rs.10 each in Vibhadeep Investments & Trading Limited — 50,000,000
200,000 15% Cumulative Redeemable PreferenceShares of Rs.100/- each in Viral FilamentsLimited - balance after part redemption 19,500,000 20,000,000
2,262,139,500 1,944,339,500
In Fully Paid Equity Shares
TradeQuoted
4,693,800 (4,536,800) Shares of Rs.10 each inBajaj Auto Finance Limited 180,786,257 175,457,632
2,742,848 Shares of Rs.10 each in Maharashtra Scooters Limited 2,400,000 2,400,000
183,186,257 177,857,632
Carried Over 5,317,963,332 4,890,581,196
63

Schedule 7 Investments, at cost (CONTD.)(Unless otherwise stated) As atI 31 st March 1999
Rupees Rupees Rupees
Brought Over 5,317,963,332 4,890,581,196In Fully Paid Equity Shares (contd.)
In Subsidiary Company
Unquoted
24,500 Shares of Rs.100 each in Bajaj AutoHoldings Limited–a Wholly Owned Subsidiary 2,450,000 2,450,000
OtherQuoted
2,026,301 (1,650,084) Shares of Rs.10 each in Bajaj Tempo Limited 427,096,857 336,277,727
300,000 (-) Shares of Rs.10 each in DSQ Bio-tech Limited 246,193,208 —
105,000 (40,000) Shares of Rs.10 each in Global Tele-Systems Limited 135,845,016 5,341,390
42,968,473 (18,258,248) Shares of Rs.10 each in ICICI Limited, (including 300,000 received on conversion of12.5% Fully Convertible Debentures) 2,714,729,953 879,178,316
1,288,046 (338,046) Shares of Rs.10 each in The Tata Iron & Steel Company Limited 228,826,229 70,144,922
Other 2,320,693,118 1,161,492,601
6,073,384,381 2,452,434,956
Unquoted
1 Share of Rs.100 in The Poona District MotorTransport Co-operative Society Limited 100 100
21,700 (-) Shares of Rs.10 each in Cadila Healthcare Limited 5,425,000 —
— (24,000) Shares of Rs.100 each in Catalyst Finance Limited — 2,400,000
200 (-) Shares of Rs.10 each inCinevista Communications Limited 60,000 —
565,000 Shares of Rs.10 each in Durovalves India Private Limited 5,650,000 5,650,000
— (24,000) Shares of Rs.100 each inEconium Investments & Finance Limited — 2,400,000
300,000 Shares of Rs.10 each inEndurance Systems India Private Limited 3,000,000 3,000,000
— (24,000) Shares of Rs.100 each inFusion Investments & Financial Services Limited — 2,400,000
Carried Over 14,135,100 15,850,100
Carried Over 11,393,797,713 7,345,466,152
64

F I F T Y F I F T H A N N U A L R E P O R T 1 9 9 9 | 2 0 0 0
Schedule 7 Investments, at cost (CONTD.)(Unless otherwise stated) As atI 31 st March 1999
Rupees Rupees Rupees
Brought Over 11,393,797,713 7,345,466,152In Fully Paid Equity Shares (contd.)
Other (contd.)Unquoted (contd.) Brought Over 14,135,100 15,850,100
34,341 (-) Shares of Rs.10 each in GESCO Corporation Limited (Shares received on account of holding of 343,408 shares of ertswhile The Great Eastern Ship- ping Company Limited, pursuant to its demerger) 1,129,766 —
98,221 (-) Shares of Rs.10 each in Kanco Enterprises Limited (Shares received on account of holding of151,110 shares of ertswhile Bengal Tea & Fabrics Limited, pursuant to its demerger) 5,870,263 —
300,000 Shares of Rs.10 each in Kowa Spinning Limited 5,250,000 5,250,000
— (24,000) Shares of Rs.100 each in Lineage Investments Limited — 2,400,000
1,026,000 (855,000) Shares of Rs.10 each in Monotona Tyres Limited 10,260,000 8,550,000
— (24,000) Shares of Rs.100 each in Primus Investments & Finance Limited — 2,400,000
600,000 Shares of Rs.10 each in SICOM Limited 48,230,988 48,230,988
235,000 Shares of Rs.10 each in Sukumar Estates Limited 35,984,588 35,984,588120,860,705 118,665,676
In Debentures and Secured Premium NotesFully Paid
Quoted
Other 863,517,514 869,943,715
Unquoted
500,000 16% Redeemable Secured Non Convertible Debentures of Rs.100 each of Ashima Limited
- balance Non Convertible Portion ofRs.33.34 each after second redemption 16,833,095 33,666,190
2,302 15% Secured Redeemable Partly Convertible Debentures of Rs.400 each of Ballarpur IndustriesLimited - balance Non Convertible Portion of Rs.120each, after third redemption 130,178 390,534
— (10,000) 19.5% Secured Redeemable Non-Convertible Debentures of Rs.5,000 each of BinaniIndustries Limited - balance fully redeemedduring the year — 36,937,500
Carried Over 16,963,273 70,994,224
Carried Over 12,378,175,932 8,334,075,543
65

Schedule 7 Investments, at cost (CONTD.)(Unless otherwise stated) As atI 31 st March 1999
Rupees Rupees Rupees
Brought Over 12,378,175,932 8,334,075,543In Debentures and Secured Premium Notes (contd.)Fully Paid (contd.)Unquoted (contd.) Brought Over 16,963,273 70,994,224
1,000 (-) 13.25% Redeemable Non ConvertibleDebentures of Rs.100,000 each ofCiticorp Finance (India) Limited 99,979,800 99,979,800
500 18.75% Secured Redeemable Non Convertible Debentures of Rs.100,000 each of Core Healthcare Limited, balance after part redemption 45,500,000 45,500,000
100,000 18% Non Convertible Debentures of Rs.100 each of Goodearth Organic (India) Limited 9,500,000 9,500,000
100 11% Secured Redeemable Non Convertible Debentures of Rs.1,000,000 each ofGujarat Industries Power Company Limited 99,975,000 99,975,000
1,000 15.25% Secured Redeemable Non-Convertible Debentures of Rs.50,000 each of Gujarat Industries Power Company Limite 49,500,000 49,500,000
2,788,354 18% Secured Redeemable Non-Convertible Debentures of Rs.45 each ofGujarat Industries Power Company Limited 149,750,733 —
243,000 16.5% Secured Redeemable Partly Convertible Debentures of Rs.200 each of Hindustan Construction Company Limited - balance NonConvertible portion of Rs.155 each 33,052,065 33,052,065
20 15.25% Secured Redeemable Non-Convertible Debentures of Rs.500,000 each (Series III) of Indo Gulf Corporation Limited 10,000,000 10,000,000
2,500,000 16% Secured Non-Convertible Debentures of Rs.100 each of Information Technology Park Limited 250,000,000 250,000,000
1,000 15% Bonds of Rs.100,000 each of Madhya Pradesh Electricity Board 100,000,000 100,000,000
20,000 18% Secured Non Convertible Debentures of Rs.1,000 each of Mafatlal Finance Limited 20,000,000 20,000,000
690 Unsecured Redeemable Non ConvertibleDebentures of Rs.3,625 each of MahadevIndustries Limited (Scheme C-DeepDiscount Debenture) 2,501,250 2,501,250
1,000,000 15% Secured Non Convertible Debenture of Rs.100 each of Nishkalp Investments &Trading Company Limited 100,000,000 100,000,000
500,000 14% Secured Non Convertible Debenture ofRs.100 each of Nishkalp Investments &Trading Company Limited 50,000,000 —
Carried Over 1,036,722,121 891,002,339
Carried Over 12,378,175,932 8,334,075,543
66

F I F T Y F I F T H A N N U A L R E P O R T 1 9 9 9 | 2 0 0 0
Schedule 7 Investments, at cost (CONTD.)(Unless otherwise stated) As atI 31 st March 1999
Rupees Rupees Rupees
Brought Over 12,378,175,932 8,334,075,543In Debentures and Secured Premium Notes (contd.)Fully Paid (contd.)Unquoted (contd.) Brought Over 1,036,722,121 891,002,339
300,000 18% Secured Redeemable Non-Convertible Debentures of Rs.100 each of Punjab Wireless Systems Limited 30,000,000 30,000,000
500 10.25% (Non Taxable) Secured Redeemable Non Convertible Debentures of Rs.500,000 each of Reliance Telecom Limited 250,000,000 250,000,000
100,000 20% Non Convertible Debentures of Rs.100 each - Series-1 of Shaan Interwell (India) Limited 6,490,272 10,000,000
500,000 (1,000,000) Secured Fully Convertible Debentures of Rs.20 each of Shriram Transport Finance Company Limited 10,452,887 20,902,886
— (3,200) Exchangeable Premium Bonds of Rs.100,000 each of Tata Industries Limited — 308,100,000
1,333,665,280 1,510,005,225
In BondsOther
Fully PaidQuoted
* 400,000 (500,000) 9% Tax Free Secured Redeemable NonConvertible Bonds of Rs.1,000 each of IndianRailway Finance Corporation Limited- Series 5A (2000) 388,554,641 485,693,303
* 220,000 9% Tax Free Secured Redeemable Non ConvertibleBonds of Rs.1,000 each of Indian Railway FinanceCorporation Limited - Series 6A (2001) 199,299,639 199,299,639
* 250,000 (150,000) 10.5% Tax Free Secured Redeemable Non Convertible Bonds of Rs.1,000 each of Indian Railway Finance Corporation Limited - Series 12A (2004) 247,282,055 138,750,000
* 2,079 10.5% Tax Free 10 23(g) Secured RedeemableNon Convertible Bonds of Rs. 100,000 each ofKonkan Railway Corporation Limited - Series 6D (2006) 207,900,000 207,900,000
* 200,000 10.5% Tax Free Secured Redeemable NonConvertible Bonds of Rs. 100,000 each of Konkan Railway Corporation Limited - Series 2C (2004) 200,000,000 —
* 6,000 Secured Redeemable Non Convertible Bonds ofRs.50,000 each of Sardar Sarovar Narmada NigamLimited, Type C, Infrastructure I 300,000,000 —
Carried Over 1,543,036,335 1,031,642,942
Carried Over 13,711,841,212 9,844,080,768
67

68
Schedule 7 Investments, at cost (CONTD.)(Unless otherwise stated) As atI 31 st March 1999
Rupees Rupees Rupees
Brought Over 13,711,841,212 9,844,080,768In Debentures and Secured Premium Notes (contd.)Fully Paid (contd.)Unquoted (contd.) Brought Over 1,543,036,335 1,031,642,942
* 2,000 (-) 11.25% Unsecured Redeemable Bonds in thenature of Promissory Notes of ICICI Limited of facevalue of Rs.100,000 each - Series BPNQ 299 200,163,288 —
* 2,000 11.5% Secured Redeemable Non ConvertibleInfrastructure Bonds of Maharashtra State RoadDevelopment Corporation Limited of face value ofRs.100,000 each - Series I 200,000,000 200,000,000
* 20,000 14% Omni Bonds in the nature of PromissoryNote of The Industrial Development Bank of Indiaof face value of Rs.10,000 each (2005) 198,740,000 198,740,000
Other 1,860,825,562 2,571,336,584
4,002,765,185 4,001,719,526
In Mutual Fund Units
Quoted
11,173,907.982 (8,026,695.526) Units of Rs.10 each in DSP Merrill LynchMutual Fund under Bond Fund Growth - Regular 145,172,719 100,000,000
17,320,644.217 (-) Units of Rs.10 each in Prudential ICICI Mutual Fund under Balanced Fund - Dividend 198,050,000 —
Other 1,165,161,030 590,978,2901,508,383,749 690,978,290
Unquoted
250 Units of Rs.5,000 each of Auto Ancilary Fund 1,250,000 1,250,000
19,224,240,146 14,538,028,584
Less: Provision for diminution in value of Investments 104,133,524 22,443,41819,120,106,622 14,515,585,166
Application Money for Investment in Shares and Bonds 403,500,000 75,000,000
19,523,606,622 14,590,585,166
Book Value as at Market Value as at31st March 31st March 31st March 31st March
2000 1999 2000 1999Rupees Rupees Rupees Rupees
Quoted 15,493,168,683 10,960,263,512 * 18,788,766,463 * 10,518,403,889Unquoted 3,626,937,939 3,555,321,654Total 19,120,106,622 14,515,585,166

69
Notes to Investment Schedule
1. The following Investments are in the process ofbeing transferred in the name of the Company
(a) Equity SharesName of the Company Face Value No. of
Rupees Shares
Atco Industries Limited 10 800Bajaj Hindustan Limited 10 1,400Bajaj Tempo Limited 10 223,099Cybertech Systems & Software Limited 10 200Data Soft Applications Limited 10 100,000DSQ Software Limited 10 900Electrolux Kelvinator Limited 10 200,000Essar Steels Limited 10 100FDC Limited 10 900IFCI Limited - Formerly The Industrial FinanceCorporation of India Limited 10 100
MIRC Electronics Limited 10 1,000Mukand Limited 10 1,300Nilkamal Plastics Limited 10 100Nirma Limited 10 3,300Sharp Industries Limited 10 14,260Shree Rama Multi-Tech Limited 10 20,700Sterlite Industries (India) Limited 10 600SUL India Limited 10 149,950Tata Finance Limited 10 300Tata Tea Limited 10 50Torrent Pharmaceuticals Limited 10 2,100Uniflex Cables Limited 10 100Vakrangee Software Limited 10 25,800VJIL Consulting Limited 10 25,000Zandu Pharmaceuticals Limited 100 305Zuari Industries Limited 10 50
(b) Trust SecuritiesName Face Value No. of Units
Rupees
Unit Trust of India - Mastergain - 1992 10 53,300Unit Trust of India - Master Plus Unit
Scheme - 1991 (Masterplus) 10 1,400
(c) Mutual Fund UnitsName Face Value No. of Units
Rupees
Morgan Stanley Growth Fund 10 262,000
(d) Preference SharesName Face Value No. of Shares
Rupees
12% Kopran Drugs Limited 100 500,000
Schedule 7 Investments, at cost (CONTD.)(Unless otherwise stated) I
F I F T Y F I F T H A N N U A L R E P O R T 1 9 9 9 | 2 0 0 0

70
Notes to Investment Schedule (contd.)
2. Trust Securities - Units, Shares and Debentures held by the Broker spending clearance of objectionregarding transfer forms
(a) Trust SecuritiesName Face Value No. of Units
Rupees
Unit Trust of India Mastergain 1992 10 6,400Unit Trust of India - Master Plus UnitScheme - 1991 (Masterplus) 10 9,800
(b) Equity SharesName of the Company Face Value No of Units
Rupees Shares
Atco Industries Limited 10 200Austin Engineering Company Limited 10 8,200Bajaj Hindustan Limited 10 14Bajaj Tempo Limited 10 3,869Bank of Rajasthan Limited 10 200Cummins India Limited 10 5Cybertech Systems & Software Limited 10 300DSQ Software Limited 10 200ITC Limited 10 100ICICI Limited 10 350MIRC Electronics Limited 10 450Mukand Limited 10 2,434Peerless Shipping & Oilfield Services Limited 10 600Reliance Petroleum Limited 10 200Sharp Industries Limited 10 100Silverline Technologies Limited 10 500Tamilnadu Petroproducts Limited 10 100Torrent Pharmaceuticals Limited 10 200Vakrangee Software Limited 10 100Wockhardt Limited 10 200
(c) DebenturesName of the Company Face Value No. of
Rupees Debentures
16% Mangalore Refinery & PetrochemicalCorporation Limited 76 400
(d) Mutual Fund UnitsName Face Value No. of Units
Rupees
Morgan Stanley Growth Fund 10 14,100
3. Certificates for the following are yet to be received/credited to our Demat Account with ANZ Grindlays BankName Face Value No. of
Rupees Shares/Units
Aurobindo Pharmaceuticals Limited 10 75,000Cadila Healthcare Limited 10 21,700Cybertech Systems & Software Limited 10 121,255Mahadeo Corporation (India) Limited 10 300The Great Eastern Shipping Company Limited 10 228Unit Trust of India - Mastershares 10 180
Schedule 7 Investments, at cost (CONTD.)(Unless otherwise stated) I

71
F I F T Y F I F T H A N N U A L R E P O R T 1 9 9 9 | 2 0 0 0
Notes to Investment Schedule (contd.)
4. Following Shares were in the process of Dematerialisationafter being transferred in the name of the Company
Name Face Value No. of Date of ReceiptRupees Shares/Units in Demat
Exide Industries Limited 10 926 —
Global Tele-Systems Limited 10 400 08.04.2000ICICI Limited 10 811,627 08.04.2000Kopran Limited 10 11,000 15.04.2000Kopran Drugs Limited 10 5,500 —
Nilkamal Plastics Limited 10 800 08.04.2000Pidilite Industries Limited 10 4,000 15.04.2000Reliance Capital Limited 10 100 —
Reliance Industries Limited 10 3 —
Tamilnadu Petroproducts Limited 10 300 08.04.2000The Great Eastern Shipping Company Limited 10 100 —
Torrent Pharmaceuticals Limited 10 200 —
Wockhardt Limited 10 200 15.04.2000
5. Securities for the following are yet to be received fromBrokers against purchases during the yearName of the Company Face Value No. of
Rupees Shares/Units
Bajaj Tempo Limited 10 7,350Global Tele-Systems Limited 10 15,000ICICI Limited 10 431,880Mukand Limited 10 100Shree Rama Multi-Tech Limited 10 159,300Spectra Industries Limited 10 10,000
6. Following Investments were purchased and sold during the year
(a) Equity SharesName of the Company No. of Equity Purchase Cost Sale Proceeds
shares Rupees Rupees
Aftek Infosys Limited 50,000 9,875,925 50,400,000Amtek Auto Limited 3,100 114,731 81,191Aurobindo Pharma Limited 75,000 74,341,485 35,820,000Bank of Baroda 25,000 1,304,950 1,855,618Bengal Tea & Fabrics Limited 600 3,690 3,588BFL Software Limited 9,800 9,799,936 11,438,952Century Textiles & Industries Limited 80,450 2,930,519 5,527,048Cybertech Systems & Software Limited 219,496 121,699,170 98,672,575Cummins India Limited 6,550 2,468,051 3,407,703Digital Equipments (India) Limited 139,800 79,886,872 110,023,007DSQ Software Limited 286,900 80,483,998 155,680,852Essel Packaging Limited 8,110 4,477,937 4,733,516Global Tele-Systems Limited 390,000 205,796,144 442,783,685Goldstone Technologies Limited 20,000 1,591,800 8,688,800Hughes Software Limited 4,900 3,087,000 8,470,459ICICI Banking Corporation Limited 275,100 17,723,609 62,683,421Kale Consultants Limited 4,450 534,000 904,129Mastek Limited 5,000 6,613,125 10,746,288MIRC Electronics Limited 15,000 5,432,918 10,465,934Nestle India Limited 5,000 2,762,950 2,240,900NIIT Limited 17,000 38,097,027 54,764,980Peerless Shipping & Oilfield Services Limited 100,000 12,113,958 15,914,289Pentamedia Graphics Limited 5,000 4,619,950 8,752,150Polaris Software Lab Limited 6,900 1,449,000 2,296,421Priyadarshini Cement Limited 10,000 332,000 288,600
Schedule 7 Investments, at cost (CONTD.)(Unless otherwise stated) I

72
Notes to Investment Schedule (contd.)
(a) Equity Shares(contd.)Name of the Company No. of Equity Purchase Cost Sale Proceeds
shares Rupees Rupees
Ranbaxy Laboratories Limited 30,000 19,580,482 31,962,796Rolta India Limited 30,000 4,952,400 18,693,170Satyam Computer Services Limited 25,000 26,122,900 55,418,293Silverline Technologies Limited 89,600 20,454,239 67,731,028Snowcem India Limited 20,000 2,279,150 3,329,992Sonata Software Limited 10,000 4,509,836 22,988,375Tata Finance Limited 187,800 10,628,619 29,982,018Wellwin Industries Limited 100,000 26,135,030 24,300,313Wipro Limited 22,000 24,473,805 90,622,358Zee Telefilm Limited 5,000 24,390,824 27,367,476
(b) DebenturesName of the Company Quantity Purchase Cost Sale Proceeds
Nos Rupees Rupees
Reliance Petroleum Limited - TOCD 1,544,000 102,728,271 95,315,010
(c) Mutual Fund UnitsName Quantity Purchase Cost Sale Proceeds
Nos Rupees Rupees
DSP Merrill Lynch - Liquidity Fund 9,009,252.502 100,000,000 100,317,126J M GSEC Mutual Fund 14,647,150.153 150,000,000 150,766,046J M Debt Fund Growth Fund 8,277,734.550 100,000,000 101,986,719Kothari Pioneer Infotech Fund 2,365,107.248 89,003,422 125,772,521Kothari Pioneer Treasury Management Fund 108,159.612 125,772,521 125,869,481Kothari Pioneer Blue Chip Fund - Dividend Option 3,890,293.717 98,250,000 85,222,330
(d) BondsName Quantity Purchase Cost Sale Proceeds
Nos Rupees Rupees
13.5% Maharashtra Krishna Valley DevelopmentCorporation Limited 650 64,566,450 67,698,668
Zero Coupon ICICI Limited 10,000 94,675,000 100,000,000
7. The following Investments have been purchased and sold during the year, before transferring the same in the name of the Company
(a) Trust SecuritiesName Quantity Purchase Cost Sale Proceeds
Nos Rupees Rupees
Unit Trust of India - UTI UGS 2000 50 731 637
(b) Equity SharesName of the Company Quantity Purchase Cost Sale Proceeds
Nos Rupees Rupees
BPL Limited 2,400 1,075,000 1,011,218Britannia Industries Limited 100 147,690 140,109Cummins India Limited 250 94,200 130,065Cybermate Infotech Limited 100,000 5,026,250 5,524,250Goldstone Technologies Limited 20,000 2,067,200 3,349,600Gujarat Flourochemicals Limited 100 5,819 5,295HCL Infosystems Limited 10,000 4,657,580 4,090,885India Cement Limited 25,000 1,021,250 2,238,750
Schedule 7 Investments, at cost (CONTD.)(Unless otherwise stated) I

73
F I F T Y F I F T H A N N U A L R E P O R T 1 9 9 9 | 2 0 0 0
Schedule 7 Investments, at cost (CONTD.)(Unless otherwise stated) I
Notes to Investment Schedule (contd.)
(b) Equity SharesName of the Company Quantity Purchase Cost Sale Proceeds
Nos Rupees Rupees
Indian Aluminium Company Limited 6,000 554,280 516,519Jindal Strips Limited 200 7,923 7,327MIRC Electronics Limited 6,950 2,317,617 3,796,069NEPC Micon Limited 5,000 16,140 13,480Peerless Shipping & Oilfield Services Limited 25,000 3,028,490 8,706,250Tata Finance Limited 150,000 8,489,312 9,211,175Torrent Pharmaceuticals Limited 3,648 1,867,594 2,900,999Trent Limited 10,000 2,206,675 2,275,850VXL Instruments Limited 25,000 3,679,586 5,344,425
8. The following Government Securities have been purchasedand sold during the year, through SGL Accounts withBank of America and Citibank N.A., Mumbai.
Particulars Purchase Cost Sale ProceedsRupees Rupees
Zero Coupon Government of India Loan, 2000 311,130,250 322,003,35011.15% Government of India Loan, 2002 207,306,875 209,861,04211.19% Government of India Loan, 2005 154,902,167 158,587,41711.40% Government of India Loan, 2000 466,472,500 471,105,83311.47% Government of India Loan, 2001 50,981,861 52,691,72211.55% Government of India Loan, 2005 52,971,667 53,138,12511.15% Government of India Loan, 2001 53,410,625 53,469,79211.68% Government of India Loan, 2006 211,061,333 217,135,33311.90% Government of India Loan, 2007 270,840,694 272,833,33311.98% Government of India Loan, 2004 160,739,611 161,921,41711.99% Government of India Loan, 2009 582,699,525 600,714,87512.00% Government of India Loan, 2008 279,493,056 280,348,33312.29% Government of India Loan, 2010 55,576,047 54,954,06912.32% Government of India Loan, 2011 275,250,665 275,660,22212.50% Government of India Loan, 2004 377,600,972 387,468,88914 Days Treasury Bill 56,372,802 56,447,39991 Days Treasury Bill 277,866,245 278,783,000182 Days Treasury Bill 397,159,320 399,098,630364 Days Treasury Bill 4,865,213,252 4,949,577,279
9. National Savings Certificates of the face value ofRs.11,500 deposited with Government Department
10. Following Investments held in the name of the Companyare refused by respective Companies for dematerialisationas the same are now found to be defective
Equity SharesName of the Company No.Of Shares Face Value Cost
Rupees Rupees
The Great Eastern Shipping Co Limited 200 10 9,064Larsen & Toubro Limited 250 10 60,825Tata Chemicals Limited 249 10 52,903The Tata Iron & Steel Company Limited 100 10 20,750Unit Trust of India - Master Plus Unit
Scheme - 1991 (Masterplus) 1,600 10 26,224
*11. Quoted Investments for which quotations are not available have been included in market value at the face value/paid up value, whichever is lower, as the quotations are not available
12. Units of Unit Trust of India have been included in market value at the Repurchase value13. See note ‘13’ in Schedule ‘14’ to the Accounts

74
(a) InventoriesStores and spares, at cost 57,904,758 41,359,900Tools 315,763,132 227,388,020Stock-in-trade, at cost or market value
whichever is lower: Raw Materials 1,139,465,447 934,348,124Work-in-progress (including factory
made components Rs. 24,427,970/- Previous Year Rs. 15,427,946/-) 283,840,907 193,986,236
Finished Goods 469,175,047 62,919,043Auto Spare parts, etc. 308,335,699 284,475,391
2,574,484,990 1,744,476,714Stock of slow moving Raw Materials,
at estimated realisable value 26,099 107,467As valued and certified by Managing
Director 2,574,511,089 1,744,584,181Goods in transit, at cost to date 36,749,041 30,422,012
2,611,260,130 1,775,006,193
(b) Sundry Debtors, UnsecuredOutstanding for a period
exceeding six months:Good 11,331,800 8,522,741
Doubtful 9,341,963 7,278,519Less: Provision 9,341,963 7,278,519
— —11,331,800 8,522,741
Other, Good 1,846,654,691 2,138,116,2381,857,986,491 2,146,638,979
(c) Cash and Bank BalancesCash on hand (including cheques
on hand Rs. 24,386,213/-Previous Year Rs 7,242,831/-) 26,579,425 8,405,184
Remittances in transit — 2,856,623Cheques in hand with banks
as collecting agencies in terms of an arrangement 199,239,739 300,727,350
Balances with scheduled banks:* In current account 92,661,846 154,410,541
In margin deposits 5,985,325 —In fixed deposits 35,016,000 73,167,500Interest accrued on fixed deposits 358,085 1,206,961
134,021,256 228,785,002359,840,420 540,774,159
Carried Over 4,829,087,041 4,462,419,331
Schedule 8 Current Assets, Loans and Advances As atI 31st March 1999
Rupees Rupees Rupees Rupees

75
F I F T Y F I F T H A N N U A L R E P O R T 1 9 9 9 | 2 0 0 0
Brought Over 4,829,087,041 4,462,419,331(d) Other Current Assets
Dividend and interest receivable on Investments
Good 111,336,888 46,225,028
Doubtful 486,470 172,550Less: Provision 486,470 172,550
— —111,336,888 46,225,028
Debentures & Bonds Redemption Money receivable 93,702,583 409,427,611
Interest receivable on Loans etcGood 254,304,038 331,974,819Doubtful 82,487,790 61,287,275Less: Provision 82,487,790 61,287,275
— —254,304,038 331,974,819
Lease Rent Recievable 52,942,024 24,818,526
512,285,533 812,445,984
(e) Loans and Advances, unsecured good(Unless otherwise stated)
Loan to Bajaj Auto Holdings Limitedthe wholly owned subsidiary 61,000,000 47,000,000Loan to Others: (including Rs 40,000,000/-Against pledge of shares. Previous Year Rs 89,547,650/-)Good 2,497,309,547 2,185,709,751Doubtful 56,240 56,240Less: Provision 56,240 56,240
— —2,497,309,547 2,185,709,751
Deposits with Joint Stock Companies:(including Rs 1,006,034,920/- against pledge
of securities Previous Year Rs. 1,197,261,399/-)
Good 1,778,631,406 2,725,339,324Doubtful 193,470,222 174,728,850Less: Provision 193,470,222 174,728,850
— —1,778,631,406 2,725,339,324
Due from the wholly owned subsidary 12,086 —Advances recoverable in cash or in kind or
for value to be receivedGood 2,026,079,581 1,184,824,314Doubtful 21,049,524 11,246,963Less: Provision 21,049,524 11,246,963
— —2,026,079,581 1,184,824,314
Balances with Customs & Central ExciseDepartments 220,369,548 60,187,626Sundry Deposits 97,639,491 93,840,148Tax paid in Advance 11,708,382,372 10,398,346,577
18,389,424,031 16,695,247,740Total 23,730,796,605 21,970,113,055
* including for sale proceeds of Fractional Bonus Coupons Rs. 5,595/- as per Contra (Previous Year Rs. 5,595/-)
Schedule 8 Current Assets, Loans and Advances (CONTD.)As atI 31st March 1999
Rupees Rupees Rupees Rupees

76
Schedule 9 Current Liabilities and Provisions As atI 31 st March 1999
Rupees Rupees Rupees
(a) Liabilities
Acceptances 744,888,703 141,812,662Sundry Creditors:Due to Small Scale Industrial Undertakings [See note 19] 203,492,158 102,215,416Other 3,363,426,845 2,805,129,542
3,566,919,003 2,907,344,958Advances against Orders 144,248,370 215,521,899Interim Dividend payable-since paid 1,193,908,140 —Unclaimed Dividends 16,602,439 10,710,123Deposit from Dealers and others 918,483,580 918,036,998Unclaimed amount of sale proceeds of
fractional coupons of Bonus Shares 5,595 5,595Due to Debentureholders on account ofDebentures Redeemed in 1991 [See note 9]
(i) Unencashed cheques issued by the Company 1,103,649 1,135,779(ii) Debenture certificates yet to be surrendered 2,084,100 2,164,100
3,187,749 3,299,879Debentures Redeemed in 1998 [See note 9]
Unencashed Cheques issued by the Company 4,591,260 13,424,7577,779,009 16,724,636
Overdrawn Current Account Balancesas per Books only — 1,104
Interest accrued but not due on loans 1,579,656 1,914,507
6,594,414,495 4,212,072,482
(b) Provisions
Provision for Taxation 10,678,000,000 9,999,500,000Provision for Corporate Dividend Tax
on Interim Dividend 131,329,896 —Proposed Dividend — 955,126,512Provision for Corporate Dividend Tax on
Proposed Dividend — 105,063,91710,809,329,896 11,059,690,429
Total 17,403,744,391 15,271,762,911

F I F T Y F I F T H A N N U A L R E P O R T 1 9 9 9 | 2 0 0 0
77
Schedule 10 Other Income PreviousI Year
Rupees Rupees Rupees
Workshop Receipts 4,420,347 2,604,680Technical Know-how 43,866,301 45,777,672Dividends [Gross-Tax deducted Rs. Nil
Previous Year Rs.896/-]From Subsidiary 1,225,000 11,025,000 From Trade Investments 16,827,696 15,084,736Other 360,397,166 245,433,336
378,449,862 271,543,072
Interest [Gross-Tax deducted Rs.237,677,655/-Previous Year Rs.99,801,902/-]
On Government Securities 46,396,724 61,545,275On Debentures and Bonds 715,722,373 527,083,525Other 895,819,620 800,620,041
1,657,938,717 1,389,248,841
Discounting charges on Bills purchased — 12,132,226Income From Units of Mutual Funds
[Gross-Tax deducted Rs.NilPrevious Year Rs. 46,141,472 /-] 228,037,349 230,723,465
Leasing Business :Lease Rent 392,974,150 488,060,783Add: Lease Equalisation 72,087,273 2,853,764
465,061,423 490,914,547
Rent 5,186,568 5,687,467Insurance Claims 10,509,269 3,789,316Export Incentives 203,093,616 229,568,396Miscellaneous Receipts 483,222,619 507,736,264Surplus on Sale of Assets 37,420,607 27,417,960Profit on Sale of Investments,net 1,433,375,361 274,497,212Surplus on Redemption of Securities,TreasuryBills etc. on maturity 19,419,926 60,415,151Bad Debts recovered 32,858 —Sundry Credit balances appropriated 4,006,317 1,918,654Provisions for Doubtful Debts and Advances written back 10,290,900 4,527,488Provisions no longer required 112,194,570 156,662,368
Total 5,096,526,610 3,715,164,779

78
Schedule 11 MaterialsPreviousI Year
Rupees Rupees Rupees
(a) Raw materials and components consumed
Stocks at commencement [includingslow moving Rs.107,467/Previous Year Rs. 23,495/-] 934,455,591 933,738,052
Purchases 18,692,846,357 16,405,655,027
19,627,301,948 17,339,393,079
Less: Stocks at close [includingslow moving Rs.26,099 /-Previous Year Rs.107,467/-] 1,139,491,546 934,455,591
18,487,810,402 16,404,937,488
(b) Finished Goods purchases
Two Wheelers/Trailers 541,639 622,033Auto Spare-Parts 533,859,280 533,889,507Machinery for resale — 2,890,559
534,400,919 537,402,099
(c) Conversion and Machining Charges 571,149,069 481,064,908
(d) Excise duty on year end inventory ofFinished Goods [see note 10] 79,909,050 —
(e) (Increase)/Decrease in Stocks
Stocks at close:Work in progress [including factory madecomponents Rs.24,427,970/-Previous Year Rs.15,427,946/-] 283,840,907 193,986,236
Finished Goods 469,175,047 62,919,043
Auto Spare Parts 308,335,699 284,475,391
1,061,351,653 541,380,670
Less: Stocks at commencement:
Work in progress [including factory madecomponents Rs. 15,427,946/-Previous Year Rs.30,045,165/-] 193,986,236 207,546,061
Finished Goods 62,919,043 561,361,658
Auto Spare Parts 284,475,391 282,927,142
541,380,670 1,051,834,861(519,970,983) 510,454,191
Total 19,153,298,457 17,933,858,686

F I F T Y F I F T H A N N U A L R E P O R T 1 9 9 9 | 2 0 0 0
79
Stores,spares and tools consumed 546,303,585 555,214,013Power,fuel and water 679,639,155 652,615,063Repairs:
Buildings and Roads 91,541,314 132,008,022Machinery 371,919,578 358,946,289Other 35,962,679 37,632,013
499,423,571 528,586,324Employees' Emoluments:
Salaries,wages,bonus etc. 1,871,407,990 1,846,376,742Contribution to Provident and other funds and schemes 245,907,337 246,850,697Welfare expenses [ see note 14(a)] 229,463,503 215,688,110
2,346,778,830 2,308,915,549
Rent 18,512,908 14,787,096Rates and taxes 8,261,663 8,435,053Insurance 28,188,796 21,664,399Auditors' remuneration 3,695,497 2,573,925Directors' fees and travelling expenses 102,563 74,551Managing Director's remuneration
Salary 600,000 600,000Commission 1,200,000 1,200,000
1,800,000 1,800,000Wholetime Directors' remuneration
Salary 1,500,000 1,500,000Commission 480,000 480,000
1,980,000 1,980,000Commission to Non Executive Directors 920,000 600,000Miscellaneous expenses 648,631,261 563,625,878Electricity service connection charges written off 20,690,000 —Packing,forwarding etc. 390,526,050 381,986,924Advertisment 902,410,398 600,302,381Vehicle service charges and other expenses 593,216,756 580,310,712Commission and Discount 138,164,389 137,621,977Incentives and Sales Promotion 345,849,968 161,945,674Royalty 109,491,898 69,174,865Donations [ see note 14 (b)] 14,065,000 11,824,638Bad debts and other irrecoverable debit balances written off 8,257,076 6,071,302Sundry credit balances previously appropriated,now paid 1,250,701 200,434Premium on Redemption of Debentures — 759,915Loss on assets sold,demolished,discarded and scrapped 8,605,934 4,886,864Provision for Doubtful Debts and Advances 62,412,712 117,580,143Provision for Diminution in value of Investments 81,690,106 22,443,418Amount written off against Technical Know-how 2,936,604 2,936,606Amount written off against leasehold land 2,473,932 742,136
Total 7,466,279,353 6,759,659,840
InterestDebentures — 16,493,648Fixed Loans 9,714,589 11,905,722Other 31,559,643 17,514,102
Total 41,274,232 45,913,472
Schedule 12 Other Expenses PreviousI Year
Rupees Rupees Rupees
Schedule 13 Interest PreviousI Year
Rupees Rupees

80
1. (A) Contingent liabilities not provided for in respect of:(i) Sales Bills Discounted 71,932,867 81,316,705(ii) Claims against the Company not acknowledged as debts 2,146,604,111 1,319,156,933(iii) Guarantees given by Company's Bankers 4,858,010 13,523,700(iv) Guarantees given by the Company to Housing Development
Finance Corporation Ltd. - for loans to employees 94,975,064 80,698,181(v) Excise and Customs demand - matters under dispute 751,162,442 712,329,123(vi) Claims for refund of Excise Duty, if any, against Excise
Duty Refund received in the earlier year 55,638,819 55,638,819(vii) Customs Duty on imports at concessional rates of duty 19,802,451 19,802,451(viii) Tax matters under dispute -
Appeal by Company 948,463,379 888,968,245Appeal by Department 429,466,957 190,203,490
1,377,930,336 1,079,171,735(B) Uncalled liability on partly paid Investments — 1,858,000
2. Estimated amounts of contracts remaining to be executed on CapitalAccount and not provided for 1,870,894,403 1,023,824,916
3. Payments to Auditors :Auditors Cost Auditors
1999-2000 1998-99 1999-2000 1998-99Rupees Rupees Rupees Rupees
(i) As Auditors 2,520,000 1,890,000 147,000 147,000(ii) In other capacity:
For tax audit 472,500 315,000 — —For Provident Fund & OtherCertificates 462,926 156,503 — —
Sub-Total 3,455,426 2,361,503 147,000 147,000(iii) For expenses 240,071 212,422 5,733 9,190
Total 3,695,497 2,573,925 152,733 156,190
4. C.I.F Value of Imports, Expenditure and Earnings in Foreign Currencies: 1999-2000 1998-99Rupees Rupees
(a) C.I.F. Value of Imports *(i) Raw materials:
Steel and Non-Ferrous Material 343,160,855 874,588,681Components 812,300,994 559,657,699
1,155,461,849 1,434,246,380(ii) Machinery Spares 67,356,212 77,780,048(iii) Capital Goods 741,852,572 825,496,945
* Excluding C.I.F. Value of Stores, Tools, etc Rs 81,832,739/- (Previous Year Rs. 68,154,658/-)
(b) Expenditure in foreign currencies:(i) Travelling expenses 7,074,073 10,618,330(ii) Royalty, net of tax 87,567,029 55,323,447(iii) Technical Consultancy, net of tax 85,651,058 58,150,040(iv) Commission on Exports 1,878,328 4,356,925(v) Research and Development Expenses, under an arrangement 21,202,263 25,891,429(vi) Advertisment and publicity 89,042,748 29,580,824(vii) Other matters 19,484,962 31,568,145
(c) Earnings in foreign currencies:(i) F.O.B.Value of exports 1,378,076,113 1,579,257,821(ii) F.O.B.Value of exports - goods traded in 118,629 4,709,864(iii) Interest 3,178,816 2,434,141(iv) Others 49,269,524 60,891,584
Schedule 14 Notes forming part of the AccountsAs at As at
As at I 31st March 2000 31st March 1999
Rupees Rupees

81
F I F T Y F I F T H A N N U A L R E P O R T 1 9 9 9 | 2 0 0 0
5. Total Exports during the yearExports in Foreign Currency 1,378,076,113 1,579,257,821Exports in Foreign Currency - goods traded in 118,629 4,709,864Sales to Recognised Export House - for Exports — 107,139
1,378,194,742 1,584,074,824
6. Managerial Renumeration: Rupees Rupees
(a) Computation of Managerial RemunerationProfit as per Profit and loss Account 6,137,338,972Add: Managing Director's Remuneration (including perquisites) 2,458,008
Wholetime Director's Remuneration(including perquisites) 2,454,711Commission to Non-Executive Directors 920,000Depreciation 1,453,067,618Provision for Taxation 2,115,000,000
3,573,900,3379,711,239,309
Less: Section 350 Depreciation 1,994,775,949Excess of Sales price over cost of assets sold 3,717,965Provision for doubtful debts and advances written back 10,290,900Provisions no longer required 112,194,570Profit on sale of Investments, net 1,433,375,361Premium on surrender of Tenancy Rights 7,500,000
3,561,854,745Profit on which commission is payable 6,149,384,564(i) Managing Directors Commission:
Commission @ 1% on Rs.6,149,384,564/- 61,493,846Maximum Commission payable as determined by the Board ofDirectors 1,200,000
(ii) Commission to Wholetime Director - Shri Madhur BajajCommission @ 1% on Rs.6,149,384,564/- 61,493,846Maximum Commission payable as determined by the Board ofDirectors 480,000
(iii) Commission to Non-Executive DirectorsCommission @ 1% on Rs.6,149,384,564/- 61,493,846Maximum Commission restricted to Rs.20,000/- per meetingattended, per person, subject to an overall ceiling of Rs.1,200,000/- 920,000
(b) The Profit & Loss Account also includes payments and provisions on account of the Managing Director and Wholetime Directors as under
Managing Director Wholetime Directors
1999-2000 1998-99 1999-2000 1998-99Rupees Rupees Rupees Rupees
(i) Salary 600,000 600,000 1,500,000 1,500,000(ii) Commission 1,200,000 1,200,000 480,000 480,000(iii) Leave Encashment 200,000 — — —(iv) Contribution to Provident Fund,
Superannuation & Gratuity 212,000 212,000 292,000 292,000(v) Other perquisites 246,008 282,689 182,711 334,246
2,458,008 2,294,689 2,454,711 2,606,246
(c) Estimated monetary value of perquisite in form of:
Unfurnished Accommodation 204,800 184,800 100,800 100,800Furniture at Residence 886,859 886,738 324,947 324,477Personal use of Company's car 13,200 13,200 24,000 24,000
1,104,859 1,084,738 449,747 449,277
Schedule 14 Notes forming part of the Accounts (CONTD.)As at As atI 1999-2000 1998-1999
Rupees Rupees

82
7. Details of raw materials consumption, goods traded in and machinery spares consumption
(i) Raw materials (including components) consumed:
Unit Qty Rupees Qty Rupees
(a) Ferrous Metal M.T. 49,460 1,226,465,183 54,237 1,368,925,269Mtrs. 97,680 1,700,383 422,748 27,645,080Nos. 524 623
(b) Non-Ferrous Metal M.T. 16,082 1,264,826,907 15,092 1,122,606,717Mtrs. 1,203 1,511Nos. 12 10
(c) Tyres & tubes Nos. 6,984,683 993,253,839 6,805,119 960,961,999
(d) Other Components 14,415,229,112 12,412,747,722
(e) Others 586,334,978 512,050,701
Total 18,487,810,402 16,404,937,488
(ii) Imported and indigenous raw material consumption (including components):
Rupees Percentage Rupees Percentage(a) Imported (including Customs
Duty and other related charges ) 1,544,106,481 8.35 1,742,993,035 10.62(b) Indigenous 16,943,703,921 91.65 14,661,944,453 89.38
Total 18,487,810,402 100.00 16,404,937,488 100.00
(iii) Imported and indigenous machinery spares consumed:
Rupees Percentage Rupees Percentage(a) Imported (including Customs
Duty and other related charges ) 88,634,758 45.11 104,853,689 45.96(b) Indigenous 107,847,905 54.89 123,311,939 54.04
Total 196,482,663 100.00 228,165,628 100.00
(iv) Details of goods traded in-PurchasesNos. Rupees Nos. Rupees
Two Wheelers 20 541,639 29 598,233Trailers — — 1 23,800Machinery — — 1 2,890,559
541,639 3,512,592Auto Spare Parts 533,859,280 533,889,507
Total 534,400,919 537,402,099
Schedule 14 Notes forming part of the Accounts (CONTD.)As at As at I 1999-2000 1998-1999
}}
}}

83
F I F T Y F I F T H A N N U A L R E P O R T 1 9 9 9 | 2 0 0 0
8. Details of Licensed & Installed Capacity, Production, Stocks and Turnover:
Class of Goods:(I) Motorised Two Wheelers & Three Wheelers upto
350 CC Engine capacityNos. Rupees Nos. Rupees
(i) Licensed Capacity( including two Wheelers c.k.d packs-200,000 Nos.) (a) 1,639,350 1,639,350
(ii) Installed Capacity (b) 2,090,000 2,000,000(iii) Production 1,432,471 1,381,765(iv) Stocks:
At commencementTwo & Three-Wheelers (including
Motor Cycles) 4,303 62,852,119 46,048 561,199,941Goods Traded in
Two Wheelers 3 66,924 7 142,110Trailers — — 1 19,607Auto Spare Parts (c) — 284,475,391 — 282,927,142
Total 347,394,434 844,288,800At Close
Two & Three-Wheelers (includingMotor Cycles) 24,098 469,126,777 4,303 62,852,119
Goods Traded inTwo Wheelers 2 48,270 3 66,924Auto Spare Parts (c) — 308,335,699 — 284,475,391
Total 777,510,746 347,394,434(v) Turnover (d)
Two & Three-Wheelers (includingMotor Cycles) 1,412,598 35,113,685,115 1,423,501 33,421,021,339
Goods Traded inTwo Wheelers 21 541,876 33 677,354Trailers — — 2 52,864Machinery — — 1 4,709,864Auto Spare Parts (including factory
made parts) — 1,937,274,398 — 1,842,661,489
Total 37,051,501,389 35,269,122,910(vi) Other:
Dismantled, Scrapped 26 9Lost in Transit-Insurance Claim Lodged 51 —Free of Charge for Sales Promotion 1 —
(vii) Details of c.k.d.packs included in above:Stocks at commencement 2 2Production 167,005 171,868Turnover:
Maharastra Scooters Ltd. 163,500 166,860Export 3,427 5,008Converted into CBU Vehicle 2 —
Stocks at Close 78 2
(II) Special Purpose Machine Tools(i) Licensed Capacity (a) 80 80(ii) Installed Capacity (b) 40 40(iii) Production 32 36(iv) Capitalised 32 36
Schedule 14 Notes forming part of the Accounts (CONTD.)As at As at I 1999-2000 1998-1999

8. Details of Licensed & Installed Capacity, Production, Stocks and Turnover (Contd.):
Notes
(a) Licensed Capacity stated above is as per the Original Licence held by the Company, however, the Company's products are exempt from Licencingrequirements under New Industrial Policy in terms of notification no. s.o. 477 (E) dated 25th July, 1991.
(b) As certified by the General Manager (Manufacturing Engineering) and being a technical matter, accepted by the Auditors as correct.(c) Stocks at Commencement and at Close include stock of factory made Auto Spare Parts of value Rs.81,418,109/- and Rs.116,164,576/- respectively
(Previous Year Rs. 82,356,121/- and Rs. 81,418,109/- respectively).(d) Includes 92 Nos. Capitalised at cost Rs. 2,461,004/- (Previous Year 64 Nos.: Rs. 1,614,401/-).
9. (i) 3,509,968 16 % Secured Non-Convertible Redeemable Debentures of Rs. 100 each, originally issued in terms of Trust Deed dated 23rd August,1985, have, in terms of Supplemental Agreement by way of modification dated 5th July, 1993 been modified as to increase in rate of interest andextension of period of redemption, to be redeemed on 31st December, 1998 at a premium of Rs. 5/- per Debenture secured against: (i) first legalmortgage of all immovable properties both present and future situated at Village Vithalpura, Dist. Panchmahal, Gujarat and a floating charge onthe other assets of the company at Village Vithalpura, Dist. Panchmahal, Gujarat, subject to a prior charge in favour of the Company's bankersover Bankers goods, (ii) equitable mortgage of the immovable property of the Company's Division at Akurdi, Dist. Pune (present and future)excluding Land and Buildings at P.C.N.T.D.A., Nigdi, Pune, specifically hypothecated Diesel Generating Sets, Capital Equipment and Computersystem to ICICI and (iii) hypothecation of all tangible movable assets of the company (save and except book debts) including all movable Plantand Machinery, Machinery Spares and Stores, Tools and Accessories and other movables both (present and future) pertaining to the Company'sDivision at Akurdi, Dist. Pune, subject to prior charge on specified movables in favour of Company's bankers for working capital facilities.
(ii) The charge on the above securities extends to amount remaining outstanding and due to Debentureholders of 15% Secured Non-ConvertibleDebentures redeemed in 1991 on account of (a) unencashed cheques issued by the company (b) Debenture Certificates yet to be surrenderedand due to Debentureholders of 16% Secured Non-Convertible Debentures redeemed in 1998 on account of unencashed cheques issued by thecompany.
(iii) With the redemption of Secured Debentures on 31st December,1991 and 31st December,1998, the Company has , in consultation with CentralBank of India, Trustees for debentureholders, initiated steps for satisfaction of charge referred above.
10. Excise Duty in respect of goods manufactured by the Company and remaining in stock hitherto accounted at the time of removal of goods from thefactory for sale and/or captive consumption has, this year, been provided in the accounts, as required by revised guidance note on " AccountingTreatment of Excise Duty " issued by the Institute of Chartered Accountants of India . This change in accounting policy has no impact on the Profit forthe year.
11. Hitherto the Company was valuing closing stocks of Raw Materials , Stores, etc. at procurement cost and Work in Progress & Finished Goods at costarrived at on direct variable cost basis ( i.e material cost plus direct expenses). From this year to comply with the revised Accounting Standard (AS-2)‘Valuation of Inventories’ issued by the Institute of Chartered Accountants of India, Company has valued closing stock of Raw Materials , Stores etc. atprocurement cost plus freight , octroi etc. and Work in Progress & Finished Goods at the cost arrived at on full absorption basis. This change has resultedin value of closing stocks of Raw Materials, Stores, Work in Progress and Finished Goods being higher by Rs 142,275,545/- having its consequent effecton profit for the Year to the same extent.
12. Expenditure during Construction period-Chakan plant included in Capital work in progress: 1999-2000 1998-1999Rupees Rupees
Items of Expenditure:As per last Account 27,158,988 —Stores, spares and tools consumed — 16,847,860Power, Fuel & Water 5,362,937 3,614,031Repairs :
Machinery 439,868 18,452Other — 30,728
439,868 49,180Employee’s Emoluments 1,245,160 1,034,003Insurance 371,776 287,145Miscellaneous Expenses 1,029,709 1,800,779Amount written off against Leasehold Land 1,731,796 3,463,593Depreciation 1,547,848 161,147
38,888,082 27,257,738Less:
Other IncomeInterest — 47,493Miscellaneous scrap sales — 51,257
— 98,75038,888,082 27,158,988
Less : Capitalised during the yearBuildings 4,979,775 —Waterpumps, Reservoirs and Mains 384,557 —Plant and Machinery 29,937,800 —Electric Installations 3,585,950 —
38,888,082 —Total — 27,158,988
84
Schedule 14 Notes forming part of the Accounts (CONTD.)As at I 31 st March 2000 st h9
pees

13. Investments:(a) Disclosure of details of Investments in Investment Schedule-annexed to the Accounts is made in accordance with the approvals received for the
last three years from the Department of Company Affairs, Ministry of Law, Justice & Company Affairs, Government of India, under Section 211(4) of the Companies Act, 1956.The application for approval of above referred disclosure for the year 1999-2000 is pending with the government, permission for which is awaited.
(b) Investments made by the Company being of long term nature, Diminution in the value of Investments are generally, not considered to be of a permanent nature, however, provision of Rs.81,690,106/- (previous year Rs.22,443,418/- ) for such Diminution, as considered necessary by the management, has been made in the Accounts.
14. (a) Welfare expenses include Rs.850,000/- being the contribution to a Fund created for the welfare of the employees.(b) Donations include Rs.5,000,000/- given to a Political party – All India Congress Committee.
15. Significant Accounting Policies followed by the Company are as stated in the Statement annexed to this schedule.
16. In order to obtain Import Licences under Export Promotion Capital Goods Schemes of the Government of India, company has given an undertaking tofulfill certain quantified export obligations. Non fulfillment of such obligations entails Government to confiscate capital goods imported under the saidLicences and other penalties under the above referred scheme. As on 31st March, 2000, Company is not in default under the scheme.
17. The Company extends the benefit of encashment of leave to its employees while in service as well as on retirement. As the Company does not haveany defined retirement benefit scheme in this respect, Accounting Standard AS-15 issued by the Institute of Chartered Accountants of India is notconsidered applicable. Encashment of leave accumulated while in service is at the option of employee and is accounted for, as and when claimed,hence not provided for .
18. Year 2000 (Y2K) Compliance status:The Company’s Business systems, hardware, machines, equipment, process control and embedded systems have rolled over to year 2000 smoothly and are functioning normally.
.19. (a) This disclosure is based on the information available with the Company regarding the status of the Suppliers as defined under the "Interest on
Delayed Payments to Small Scale and Ancilliary Industrial Undertakings Act, 1993."
(b) There are no dues to any party over Rs.1 lakh outstanding for more than thirty days.
(c) Unpaid interest as on 31st March,2000 Rs. Nil.(previous year Rs. Nil.)
20. Previous year's figures have been regrouped wherever necessary.
Signature to Schedules "1" to "14"
As per our attached report of even date Rahul Bajaj Chairman & Managing Director
For and on behalf of Dalal & Shah D.J. Balaji RaoChartered Accountants D.S. Mulla
D.S. Mehta DirectorsMadhur Bajaj
Y.C. Amin N.J.Joshi S.H. KhanPartner Secretary Kantikumar R. Podar
Shekhar BajajMumbai: 16th May, 2000 J.N. Godrej
F I F T Y F I F T H A N N U A L R E P O R T 1 9 9 9 | 2 0 0 0
85
Schedule 14 Notes forming part of the Accounts (CONTD.)As at I 31 st March 2000 31 st March 1999

Statement of Significant Accounting Policies
1. System of Accounting
i) The Company follows the mercantile system of accounting and recognises income and expenditure on an accrual basis except in caseof significant uncertainties
ii) Financial Statements are based on historical cost. These costs are not adjusted to reflect the impact of changing value in thepurchasing power of money
2. Fixed Assets and Depreciation
(A) Fixed Assets:Fixed Assets are carried at cost of acquisition or construction or at manufacturing cost in the case of Company manufactured assets, lessaccumulated depreciation ( except freehold land) and amortisation. Also refer para 6.
(B) Depreciation and Amortisation:(a) Leasehold land:
Premium on leasehold land is amortised over the period of lease.(b) On Plant & Machinery given on Lease:
Depreciation on Plant & Machinery and Dies and Moulds given on lease is being provided at the rates worked out on Straight LineMethod over the primary period of lease as stated in the Lease Agreement or at the rates specified in Schedule XIV to the Companies Act, 1956 whichever is higher, on Pro-rata basis with reference to the month of commencement of lease period.
Rate on Straight Line Method
Assets Over the primary As Specified inperiod of lease Schedule XIV
% %
Plant & MachineryCo-generation System 16.00 * 5.28High Efficiency Boiler 16.67 * 5.28Others 20.00 4.75
Dies and MouldsPrimary period 3 years 33.33 11.31Primary period 5 years 20.00 11.31
* at the rates applicable to Continuous Process machinery
(C) Other Fixed Assets:i) Depreciation on all assets is provided on ' Straight Line basis ' in accordance with the provisions of Section 205 (2) (b) of the
Companies Act 1956 in the manner and at the rates specified in Schedule XIV to the said Act.ii) Depreciation on additions is being provided on prorata basis from the month of such additions.iii) Depreciation on assets sold, discarded or demolished during the year is being provided at their rates upto the month in which such
assets are sold, discarded or demolished.iv) Depreciation on additions on account of increase in rupee value due to revalorisation of foreign currency loan is being provided at
respective rates of depreciation of related assets with retrospective effect from the date of addition of said asset.
3. Technical know-how fees:
Expenditure on acquiring technical know-how (including Income-tax and R& D cess) is being amortised over a period of six years.
4. Investments:
Investments are valued at cost of acquisition. Investments made by the Company are of a long term nature and hence diminution in value of quoted Investments are not considered to be permanent. Management, however, makes suitable provision where considered necessary
86
Annexure referred to in Note 15 in Schedule 14 to the Accounts for the year
ended 31st March, 2000

5. Inventories:
i) Finished stocks, Factory made auto spare parts and Work-in-progress are valued at full absorption cost or net realisable value whicheveris lower. Finished stocks lying in the factory premises, Branches, Depots are valued inclusive of excise duty . For change & effect seenote 10 in schedule 15 to the Accounts.(*)
ii) Stores and Tools are valued at cost or net realisable value whichever is lower.(*)iii) Raw materials and Bought out Auto spare parts are valued at procurement cost inclusive of freight and octroi or net realisable value,
whichever is lower. Cost is arrived at on weighted average basis except that of slow moving which are valued at estimated realisablevalue.(*)
iv) Machinery spares and maintenance material are charged out as expense in the year of purchase.v) Goods in transit are stated at actual cost upto the date of Balance Sheet.*vi) For change and effect see note no. 11 in Schedule 15 to the Accounts.
6. Exchange fluctuations:
i) Foreign Currency loans for financing fixed assets outstanding at the close of financial year are revalorised at the contracted and/orappropriate exchange rates at the close of the year. The gain or loss due to decrease/increase in rupee liability due to fluctuations inrates of exchange is adjusted to the cost of assets acquired through these loans.
ii) Current Assets and Liabilities in Foreign Currency outstanding at the close of the Financial year are valued at the contracted and/orappropriate exchange rate at the close of the year. The loss or gain due to fluctuation of exchange rates is charged to Profit and LossAccount.
7. Sales:
(a) Export sales are accounted on the basis of the dates of the Mate's Receipt.(b) Benefit on account of entitlement to import goods free of duty under the " Duty Entitlement Pass Book under the Duty Exemption Scheme"
is being accounted in the year of export.
8. Leasing Business:
(a) Lease Rental income is recognised on accrual basis.(b) The Company follows the recommendations of the Institute of Chartered Accountants of India contained in the 'Guidance Note on
Accounting for Lease', for finance lease. Accordingly a matching annual charge is made to the Profit and Loss Account representingrecovery of net investment of leased Assets. The said charge is calculated by deducting Finance Income for the year (arrived at byapplying the rate of interest implicit in the lease to the net investment in the lease during the year) from the lease rentals in respect offinance leased assets. This annual charge comprises of book depreciation [ as per policy stated in para 2(B) (b)] and a leaseequalisation charge when the annual lease charge is more than the book depreciation. When the annual charge is less than bookdepreciation, a lease equalisation charge credit is taken. The balance standing in the Lease Adjustment Account has been adjusted inthe net book value of leased assets.
9. Research & Development Expenditure:
Research & Development Expenditure is charged to revenue under the natural heads of account in the year in which it is incurred and R&Dexpenditure on Fixed Assets is treated in the same way as expenditure on other fixed assets. Payments for R&D work by outside agency isbeing charged out upto the stage of completion.
10. Retirement Benefits:
(a) Gratuity:Payment for present liability of future payment of gratuity is being made to approved Gratuity Funds which fully covers the same underCash Accumulation Policy of the Life Insurance Corporation of India.
(b) Superannuation:Contribution to superannuation fund is being made as per the Scheme of the Company.
(c) Provident Fund Contributions are made to Company's Provident Fund Trust.(d) Contribution to Employees Pension Scheme 1995 are made to Government Provident Fund Authority.
F I F T Y F I F T H A N N U A L R E P O R T 1 9 9 9 | 2 0 0 0
87

88
BALANCE SHEET ABSTRACT AND COMPANY'S GENERAL BUSINESS PROFILE: (PART IV)
I. REGISTRATION DETAILS
Registration No. 4656State Code 11Balance Sheet date 31st March,2000
II. CAPITAL RAISED DURING THE YEAR ENDED 31st MARCH, 2000: Rs. in ’000s
Public Issue —Rights Issue —Bonus Issue —Private Placement —Others —
Total —
III. POSITION OF MOBILISATION AND DEPLOYMENT OF FUNDS AS AT 31ST MARCH, 2000:
Total liabilities 36,997,499
Total assets 36,997,499
Sources of Funds:Paid-up capital 1,193,908Reserves and surplus 30,846,870Secured loans 1,015,826Unsecured loans 3,940,895
Total 36,997,499
Application of Funds:Net Fixed Assets 11,142,451Investments 19,523,607Net Current Assets 6,327,052Misc.Expenditure-Technical Know-how 4,389
Total 36,997,499
IV. PERFORMANCE OF THE COMPANY FOR THE YEAR ENDED 31ST MARCH, 2000: Rs. in ’000s
i) Turnover (sale of products and other income) 42,155,528ii) Total Expenditure 33,903,189iii) Profit before tax 8,252,339iv) Profit after tax 6,137,339v) Accrual for earlier years 211,248vi) Net Profit 6,348,587vii) Earning per share Rs.(See Note 2)(Face Value Rs.10/-) 53.17viii) Dividend Rate (%) 100
Statement showing particulars as prescribed in the amendment to Schedule VI to the
Companies Act, 1956 vide Notification No.G.S.R.388 (E) dated May 15, 1995

BALANCE SHEET ABSTRACT AND COMPANY'S GENERAL BUSINESS PROFILE (CONTD.)
V. PRODUCTS OF THE COMPANY:
Item Code No. (ITC Code) : 8711 Product Description : Scooters, Autorikshas, Motorcycles and Mopeds
Notes 1. The above particulars should be read along with the balance sheet as at 31st March, 2000, the profit and loss account for the year ended on that date and the schedules forming part thereof.
2. Earning per share is arrived at by dividing the Net Profit [Item IV(vi)] by total number of sharesissued and subscribed as at the end of the year.
Rahul Bajaj Chairman & Managing Director
D.J. Balaji RaoD.S. Mulla
D.S. MehtaMadhur Bajaj Directors
S.H. KhanKantikumar R. Podar
N.J.Joshi Shekhar BajajMumbai: 16th May, 2000 Secretary J.N. Godrej
F I F T Y F I F T H A N N U A L R E P O R T 1 9 9 9 | 2 0 0 0
89

I) Cash Flow from Operating Activities
A) Profit before Taxation 8,252,338,972 7,585,172,363B) Adjustments
Add
i) Depreciation 1,453,067,618 1,326,996,151
ii) Amount written off against Technical know-how 2,936,604 2,936,606
iii) Amount written off against Leasehold land 2,473,932 742,136
iv) Loss on Assets Sold, Demolished, Discarded
and Scrapped 8,605,934 4,886,864
v) Provision for Diminution in Value of Investments 81,690,106 22,443,418
vi) Provision for Doubtful Debts,Advances 62,412,712 117,580,143
vii) Premium on Redemption of Debentures — 759,915
viii) Excess Depreciation in earlier year written back — 1,155
1,611,186,906 1,476,346,388
9,863,525,878 9,061,518,751
Less
i) Investment and Other Non-operating Income
included in above:
Dividends 378,449,862 271,543,072
Interest on Debenture and Bonds 715,722,373 527,083,525
Interest on Government Securities 46,396,724 61,545,275
Interest on Inter-Corporate Deposits and Others 562,157,766 521,783,730
Discounting Charges — 12,132,226
Income from Units of Mutual Funds 228,037,349 230,723,465
Lease Rent 392,974,150 488,060,783
Lease Equalisation 72,087,273 2,853,764
Profit on Sale of Investments, net 1,433,375,361 274,497,212
Surplus on Redemption of Securities,
Treasury Bills, etc.on maturity 19,419,926 60,415,151
Interest received on Fixed Deposits 2,085,011 14,632,032
Interest on Tax refunds 179,095,898 98,564,284
Other Interest 13,265,675 —
Premium received - Tenancy rights 7,500,000 87,668,577
4,050,567,368 2,651,503,096
ii) Surplus on Sale of Assets 37,420,607 27,417,960
iii) Expenses relating to earlier years 28,509,868 22,971,289
iv) Income Tax, Wealth Tax and Dividend Tax paid 2,611,841,667 2,382,386,638
v) Provision for Doubtful Debts and Advances
written back 10,290,900 4,527,488
(6,738,630,410) (5,088,806,471)
carried forward 3,124,895,468 3,972,712,280
90
1999-2000I 1998-1999
Rupees Rupees Rupees
cash flow statement I

brought forward 3,124,895,468 3,972,712,280
C) (Increase)/Decrease in Current Assets
i) Inventories (836,253,937) 558,886,029
ii) Sundry Debtors 286,589,044 (879,613,106)
iii) Other Current Assets and Loans and Advances (1,048,004,959) (1,108,714,563)
(1,597,669,852) (1,429,441,640)
Increase/(Decrease) in Current Liabilities
i) Liabilities 1,182,541,557 471,053,243
ii) Cash Credit from Banks 605,005,557 283,418,346
1,787,547,114 754,471,589
189,877,262 (674,970,051)
NET CASH FLOW FROM OPERATING ACTIVITIES 3,314,772,730 3,297,742,229
II) Investment Activities
i) (Increase)/Decrease in Investment, net (5,014,711,562) (3,180,693,594)
ii) Capital Expenditure (3,355,304,347) (2,282,334,668)
iii) Sales Proceeds of Assets/Adjustment to Gross block 76,340,590 45,613,862
iv) Technical know-how — (2,905,630)
v) (Increase)/Decrease in Deposits with Joint Stock
Companies, Loan to Bajaj Auto Holdings Ltd and
Bills purchased 913,966,546 (511,173,356)
(7,379,708,773) (5,931,493,386)
vi) Investment and other Non-operating Income
included in above
Dividends 378,449,862 271,543,072
Interest on Debenture and Bonds 715,722,373 527,083,525
Interest on Government Securities 46,396,724 61,545,275
Interest on Inter-Corporate Deposits and Others 562,157,766 521,783,730
Discounting Charges — 12,132,226
Income from Units of Mutual Funds 228,037,349 230,723,465
Lease Rent 392,974,150 488,060,783
Profit on Sale of Investments, net 1,433,375,361 274,497,212
Surplus on Redemption of Securities,
Treasury Bills, etc.on maturity 19,419,926 60,415,151
Interest received on Fixed Deposits 2,085,011 14,632,032
Interest on Tax refunds 179,095,898 98,564,284
Other Interest 13,265,675 —
Premium received - Tenancy rights 7,500,000 —
3,978,480,095 2,560,980,755
NET CASH FLOW FROM INVESTING ACTIVITIES (3,401,228,678) (3,370,512,631)
Carried forward (86,455,948) (72,770,402)
F I F T Y F I F T H A N N U A L R E P O R T 1 9 9 9 | 2 0 0 0
91
1999-2000 I 1998-1999
Rupees Rupees Rupees
cash flow statement I (CONTD.)

brought forward (86,455,948) (72,770,402)
III)Financing Activities
i) Payment of Secured Loans — (137,456,800)
ii) Repayment of Fixed Deposits (12,329,390) (15,157,697)
iii) Increase in Unsecured Loans -Sales tax
deferral liability 867,085,795 794,616,888
iv) Dividend Paid (949,234,196) (953,548,047)
NET CASH FLOW FROM FINANCING ACTIVITIES (94,477,791) (311,545,656)
NET CHANGE IN CASH & CASH EQUIVALENTS (180,933,739) (384,316,058)
Cash and Cash Equivalents as at 01.04.1999 540,774,159 925,090,217
[Opening Balance]
Cash and Cash Equivalents as at 31.03.2000 359,840,420 540,774,159
[Closing Balance]
Rahul Bajaj Chairman & Managing Director
D.J. Balaji RaoD.S. Mulla
D.S. Mehta DirectorsMadhur Bajaj
N.J.Joshi S.H. KhanSecretary Kantikumar R. Podar
Shekhar BajajMumbai: 16th May, 2000 J.N. Godrej
AUDITORS' CERTIFICATETo,The Board of Directors,Bajaj Auto Limited,Akurdi, Pune 411 035.
We have examined the above Cash Flow Statement of Bajaj Auto Limited for the year ended 31st March, 2000. The Statement has been preparedby the Company in accordance with the requirement of Listing Agreement Clause 32 with Stock Exchanges and is based on and in agreementwith the corresponding Profit & Loss Account and Balance Sheet of the Company covered by our report of 16th May, 2000 to the members ofthe Company and reallocation required for the purpose are as made by the Company.
For and on behalf ofDALAL & SHAHChartered Accountants
Y. C. Amin
Partner
Mumbai:16th May, 2000
92
cash flow statement I (CONTD.)
1999-2000 I 1998-1999
Rupees Rupees Rupees

F I F T Y F I F T H A N N U A L R E P O R T 1 9 9 9 | 2 0 0 0
93
1. Name of the Subsidiary : Bajaj Auto Holdings Limited.
2. Financial year of the Subsidiary ended on : 31st March,2000
3. Holding Company's interest : Equity Share Capital : 100%
4. Profit or Loss for the current financial year so far as concernthe Members of the Holding Company, not dealt with or providedfor in the Accounts of the Holding Company : Profit Rs.9,950,366/-
5. Net aggregate Profits or Losses for the previous financial yearssince becoming subsidiary so far as concern the Members of theHolding Company,not dealt with or provided for in the Accountsof the Holding Company : Profit Rs.246,241,856/-
6. Net aggregate amounts received as dividends for previous financialyears since becoming subsidiary dealt with in the accounts of theHolding Company in relevent years : Rs.79,162,500/-
Rahul Bajaj Chairman & Managing Director
D.J. Balaji RaoD.S. Mulla
D.S. Mehta DirectorsMadhur Bajaj
S.H. KhanKantikumar R. Podar
Shekhar BajajN.J.Joshi J.N. GodrejSecretary
Mumbai: 16th May, 2000
Statement pursuant to Section 212 of the Companies Act, 1956 relating to
Subsidiary Companies

The Board of DirectorsBajaj Auto Limited
We have reviewed the accompanying Reconciliations ofSignificant Differences in Shareholders' Equity and NetIncome Between Indian Generally Accepted AccountingStandards ("Indian GAAS"), US Generally AcceptedAccounting Principles ("US GAAP") and InternationalAccounting Standards ("IAS") of Bajaj Auto Limited as ofMarch 31, 2000 and 1999 and for the years then ended, inaccordance with Statements on Standards for Accounting andReview Services issued by the American Institute of CertifiedPublic Accountants. All information included in theseReconciliations is the representation of the management ofBajaj Auto Limited.
A review consists principally of inquiries of Companypersonnel and analytical procedures applied to financial data.It is substantially less in scope than an audit in accordancewith generally accepted auditing standards, the objective ofwhich is the expression of an opinion regarding theReconciliations taken as a whole. Accordingly, we do notexpress such an opinion.
Based on our review, we are not aware of any materialmodifications that should be made to the accompanyingReconciliations in order for the reconciling amounts to be inconformity with US GAAP and IAS.
As discussed in Note 5 to the Reconciliations, the Companychanged its method of computing depreciation in the year 1999.
KPMG
Mumbai: 16 May 2000
94
Independent Accountants’ Review Report
reconciliations of accounts under US GAAP and IAS I

F I F T Y F I F T H A N N U A L R E P O R T 1 9 9 9 | 2 0 0 0
95
(Rs in millions) (US Dollars in thousands)*31 March 31 March
2000 1999 2000 1999
1. Reconciliation of shareholders' equity
Shareholders' equity as per Indian GAAS 32,041 27,018 731,196 616,568
US GAAP adjustmentsConsolidation of subsidiary 64 53 1,460 1,209Equity method of accounting 825 704 18,827 16,066Amortisation of investment in debt securities 8 52 182 1,186Unrealised investment gains/(losses), net of tax effect 2,383 (129) 54,382 (2,944)Impairment of investments (132) (94) (3,012) (2,145)Fixed assets and depreciation (25) 124 (570) 2,830Non-monetary exchange of asset (88) (88) (2,008) (2,008)Deferred income taxes (1,166) (999) (26,609) (22,798)Proposed dividend (including dividend tax thereon) — 1,060 — 24,190
Total adjustments as per US GAAP 1,869 683 42,652 15,586
Shareholders' equity as per US GAAP 33,910 27,701 773,848 632,154
IAS adjustments
Proposed dividend (including dividend tax thereon) — (1,060) — (24,190)Additional unrealised investment gains/(losses), net of tax effect- on current investments 232 61 5,294 1,392- on longterm investments (2,383) (64) (54,382) (1,460)
Total adjustments as per IAS (2,151) (1,063) (49,088) (24,258)
Shareholders' equity as per IAS 31,759 26,638 724,760 607,896
* Exchange rate used for conversion of rupees into dollars is Rs 43.82 per US Dollar
Reconciliations of Significant Differences in Shareholders' Equity and Net Income Between
Indian Generally Accepted Accounting Standards ("Indian GAAS"), US Generally Accepted
Accounting Principles ("US GAAP") and International Accounting Standards ("IAS")

96
(Rs in millions) (US Dollars in thousands) *1999-2000 1998-1999 1999-2000 1998-1999
2 Reconciliation of net income
Net income as per Indian GAAS 6,349 5,528 144,888 126,152
US GAAP adjustmentsConsolidation of subsidiary 11 4 251 91Equity method of accounting 121 93 2,761 2,122Amortisation of investment in debt securities (44) (5) (1,004) (114)Impairment of investments (38) (94) (867) (2,145)Fixed assets and depreciation (149) (72) (3,400) (1,643)Non-monetary exchange of asset — (88) — (2,008)Deferred income taxes (167) 145 (3,811) 3,309
Total adjustments as per US GAAP (266) (17) (6,070) (388)
Net income before cumulative effect of accounting change 6,083 5,511 138,818 125,764
Cumulative effect of accounting change, net of tax effect — 1,147 — 26,175
Net income as per US GAAP 6,083 6,658 138,818 151,939
IAS adjustments
Cumulative effect of accounting change, net of tax effect — (1,147) — (26,175)Unrealised gain/(loss) on investments 283 (41) 6,458 (936)Deferred income taxes (112) 14 (2,556) 320
Total adjustments as per IAS 171 (1,174) 3,902 (26,791)
Net income as per IAS 6,254 5,484 142,720 125,148
(Rs) (US Dollars)
3 Earnings per share
As per US GAAPBefore cumulative effect of accounting change 50.95 46.16 1.16 1.05Cumulative effect of accounting change — 9.61 — 0.22Earnings per share 50.95 55.77 1.16 1.27
As per IASEarnings per share 52.38 45.94 1.20 1.05
* Exchange rate used for conversion of rupees into dollars is Rs 43.82 per US Dollar
Reconciliations of Significant Differences in Shareholders' Equity and Net Income Between
Indian Generally Accepted Accounting Standards ("Indian GAAS"), US Generally Accepted
Accounting Principles ("US GAAP") and International Accounting Standards ("IAS") (Cont’d)

F I F T Y F I F T H A N N U A L R E P O R T 1 9 9 9 | 2 0 0 0
97
Notes to the Reconciliations of Significant Differences Between Indian Generally Accepted
Accounting Standards ("Indian GAAS"), US Generally Accepted Accounting Principles ("US
GAAP") and International Accounting Standards ("IAS") for the year ended 31 March 2000
1. Basis of preparation of the ReconciliationsBajaj Auto Limited (‘the Company’) prepares its financial
statements in accordance with Indian GAAS which differ in
certain respects from US GAAP and IAS. Significant differences
between Indian GAAS, US GAAP and IAS which impact
shareholders’ equity as at 31 March 2000 and 1999 and net
income for the years ended on that date have been shown as
reconciling amounts in the Reconciliations. Such differences are
discussed below.
2. Consolidation of subsidiaryUS GAAP and IAS require the consolidation of majority owned
subsidiaries’ financial statements with the financial statements of
the Company. Accordingly, the financial statements of Bajaj Auto
Holdings Limited, a wholly owned subsidiary, have been
consolidated with the financial statements of Company and all
inter-company transactions have been eliminated. The practice
of consolidation is not followed under Indian GAAS
3. Equity method of accountingGenerally, investments in which the investor company holds 20%
to 50% of the investee's voting securities are accounted for by the
equity method under US GAAP. Under IAS, if the investor
company has the power to participate in the financial and
operating policies of the investee, the investments are accounted
for by the equity method of accounting. Under the equity method
of accounting, the investor company accounts for its share of net
income or loss of the investee.
Accordingly, the Company’s investments of 46% in Bajaj Auto
Finance Limited and 24 % in Maharashtra Scooters Limited have
been accounted for by the equity method for both US GAAP and
IAS. Under Indian GAAS, investments in associates are
accounted for at cost.
4. Investment in debt and equity securitiesUnder Indian GAAS, all investments are considered as long term
in nature.
Under US GAAP, debt securities held for investment purposes to
maturity are stated at amortised cost. Impairments of debt
securities, other than temporary, are recognised in the income
statement. Trading and available-for-sale securities are recorded
at fair value. Unrealised holding gains and losses, net of the
related tax effect, on available-for-sale securities are excluded
from earnings and are reported as a separate component of
shareholders’ equity until realised.
Under IAS, current investments are stated at market values. In
case market value is not readily ascertainable, management’s
estimates of fair value are substituted as market values.
Adjustments to the carrying values are recognised in the income
statement.
Long-term investments, except for marketable equities, are
stated at cost and any premium or discount arising on purchase
is amortised or accreted to interest expense and interest income
respectively. Quoted marketable equities are stated at lower of
cost or market value determined on an aggregate basis.
Temporary reductions and reversals of such reductions are
included in shareholders’ equity. Unquoted equity securities are
stated at cost.
In addition to the above the carrying amount of all long-term
investments is reduced to recognise any decline other than
temporary and any such reductions are charged against
earnings.
Under Indian GAAS, investments in debt and equity securities
are accounted for at cost less adjustments if any other than
temporary decline or impairments in carrying value, which are
charged against earnings.
5. Fixed assets and depreciationThe Company calculated a depreciation charge for fixed assets
under Indian GAAS and US GAAP on the written-down value
basis for all years upto 31 March 1998. For IAS reporting the
Company adopted the straight-line depreciation method from
inception. Under both US GAAP and IAS, fixed assets are
recorded at historical cost and depreciated on a systematic basis
over their estimated useful lives. Under Indian GAAS,
depreciation is provided based on the asset lives specified in the
Companies Act that may not necessarily be reflective of the useful
lives of the assets. Accordingly, the Reconciliations provide for a
depreciation adjustment based on the estimated useful lives of
fixed assets.
In 1999, the Company changed its depreciation policy from the
written-down value depreciation method to the straight-line
method for both Indian GAAS and US GAAP. Under Indian GAAS
the cumulative effect of the accounting change on prior years has
been recorded directly to shareholders’ equity. Under US GAAP
the cumulative effect of this change is recorded in net income.
Accordingly, the amount of Rs 1,147 million, net of tax of Rs 617
million, has been shown in the Reconciliation of net income as
the cumulative effect of the accounting change. Shareholders’
equity under Indian GAAS, US GAAP and IAS is not impacted by
the change at 31 March 1999.
6. Non-monetary exchange of assetUnder US GAAP and IAS, the exchange of a non-monetary asset
for a similar non-monetary asset used in the earnings process, is
recorded at the carrying value of the asset surrendered. During
the previous year, the Company exchanged its tenancy rights in a
property, which had no recorded value, for ownership rights in a
similar property. Accordingly, for both US GAAP and IAS
purposes, the transaction has been recorded at zero value
whereas under Indian GAAS, the excess of fair value of acquired

property over the carrying value of tenancy rights surrendered has
been recorded as a gain.
7. Deferred taxationUnder US GAAP and IAS, deferred tax assets and liabilities are
recognized for the future tax consequences of differences
between the carrying amounts of existing assets and liabilities as
compared to their respective tax bases, using enacted tax rates.
The effect on deferred tax assets and liabilities of a change in tax
rates is recognized in income in the period of change and equity if
it relates to item recognised in equity. Deferred tax assets are
recognized to the extent that it is probable that future taxable
profits will be available against which the unused tax losses or
deductible temporary differences can be utilised. Deferred
income taxes are not accounted for under Indian GAAS.
8. Proposed DividendUnder Indian GAAS and IAS, dividends on equity shares and the
related dividend tax are recorded as liabilities at the point of their
proposal by the Board of Directors although such dividend liability
does not crystalize unless approved by the shareholders.
Accordingly under US GAAP, such dividends have been restored
to shareholders equity in the reconciliation.
9. Earnings per shareUnder US GAAP and IAS, earnings per share is calculated by
dividing net income by the weighted average number of common
stocks outstanding.
98
Notes to the Reconciliations of Significant Differences Between Indian Generally Accepted
Accounting Standards ("Indian GAAS"), US Generally Accepted Accounting Principles ("US
GAAP") and International Accounting Standards ("IAS") for the year ended 31 March 2000 (CONTD’)

99
T W E N T Y S E C O N D A N N U A L R E P O R T 1 9 9 9 I 2 0 0 0

100
BOARD OF DIRECTORS
D. S. Mehta
R. A. Jain
Madhur Bajaj
G. B. Laddha
Rajiv Bajaj
AuditorsDalal and Shah
Chartered Accountants
BankersCentral Bank of India
Regd. OfficeC/o Bajaj Auto Limited
Mumbai- Pune Road
Akurdi, Pune 411 035.
DIRECTORS’ REPORT
1. The directors present their twenty-second annual report and the
audited statements of accounts for the year ended March 31,
2000.
2. During the year under review, the company earned a profit of
Rs. 14,811,578 as against Rs. 20,080,386 in the previous year.
After making provision for taxation of Rs.3,625,000, the net profit
was Rs.11,186,578 as against Rs. 16,430,386 in the previous
year.
3. After considering the estimated financial results of the company
for the year under review, the directors at their meeting held on
March 12, 2000, had recommended and paid an interim dividend
of Rs.1,225,000 on 24,500 equity shares of the company of
Rs.100/- each (at the rate of Rs.50/- per share). The directors do
not recommend any further dividend and the interim dividend
already paid will be the final dividend for the year 1999-2000
which will be proposed for declaration at the ensuing annual
general meeting.
Dividend along with tax thereon absorbs Rs. 1,359,750.
4. An amount of Rs.2,262,100 has been transferred to reserve fund
in terms of the provisions of Section 45-IC(1) of Reserve Bank of
India Act, 1934.
5. The balance profit of Rs.7,688,266 (inclusive of tax adjustments
relating to earlier years) as against Rs.2,364,286 during the
previous year, has been transferred to General Reserve.
6. Being an investment company with no manufacturing activity, the
directors have nothing to report on conservation of energy,
research & development and technology absorption.
7. There are no employees of the company whose particulars are
required to be reported under Section 217(2A) of the Companies
Act, 1956 and the rules thereunder.
8. Shri R. A. Jain and Shri G. B. Laddha, directors of the company
retire by rotation and being eligible offer themselves for
reappointment.
9. You are requested to appoint auditors for the period from the
conclusion of the ensuing annual general meeting till the
conclusion of the next annual general meeting and to fix their
remuneration.
On behalf of the Board of Directors
Mumbai, 15th May, 2000 Chairman of the meeting
board of directors I directors’ report I

101
T W E N T Y S E C O N D A N N U A L R E P O R T 1 9 9 9 | 2 0 0 0
We have audited the attached Balance Sheet of Bajaj Auto HoldingsLimited as at 31st March,2000 and also the annexed Profit and LossAccount of the Company for the year ended on that date and reportas under :
(a) We have obtained all the information and explanations which tothe best of our knowledge and belief were necessary for thepurposes of our audit;
(b) In our opinion, proper Books of Account as required by lawhave been kept by the Company so far as appears from ourexamination of the Books of the Company;
(c) The Balance Sheet and Profit & Loss Account dealt with by thereport are in agreement with the Books of Account of theCompany;
(d) In our opinion, the Profit and Loss Account and the BalanceSheet comply with the accounting Standard referred to inSection 211 (3C) of the Companies Act,1956, to the extentapplicable;
(e) In our opinion, and to the best of our information and accord-ing to the explanations given to us, the Accounts read togetherwith notes thereon, give the information required by theCompanies Act, 1956, in the manner so required and presenta true and fair view:
(i) in the case of the Balance Sheet of the state of affairs of the Company as at 31st March, 2000; and
(ii) in the case of the Profit and Loss Account of the Profit for the year ended on that date.
As required by the Manufacturing and Other Companies (Auditor’sReport) Order, 1988, and in terms of the information and explana-tions given to us and on the basis of such checks as we consideredappropriate, we further state that:-
(i) The Company has maintained proper records showing full par-ticulars including quantitative details and situation of fixedassets. As explained to us, the same have been physically veri-fied by the Management during the year. As per the informa-tion and explanations given to us no discrepancies werenoticed on such physical verification as compared with theBooks records;
(ii) None of the fixed assets have been revalued during the year.
(iii) The Company has not taken any loans, secured or unsecured,from Companies, Firms and Other parties listed in the Registermaintained under Section 301 of the Companies Act, 1956. Asexplained to us there is no Company under the same manage-ment within the meaning of Section 370(1-B) of theCompanies Act, 1956;
(iv) (a) The Register maintained under Section 301 of theCompanies Act,1956 does not disclose any loans,secured or unsecured, given to companies, firms orother parties listed in the said register. As explained to usthere is no Company under the same management, with-
in the meaning of Section 370(1-B) of the CompaniesAct 1956;
(b) Other parties to whom Loans and Advances in nature ofloans have been given by the Company are repaying theprincipal amount as stipulated and are also regular inpayment of interest, except, in case of few parties wherethe Company has taken reasonable steps to recover theprincipal amount and interest;
(v) The Company has not accepted any deposits from Public dur-ing the year;
(vi) In our opinion, the Company has an adequate internal auditsystem commensurate with the size and the nature of its busi-ness;
(vii) Since the Company did not have any employee on its payrollduring the year, the requirements of clause (xvii) of Paragraph4(A) of the Order are not applicable to the Company;
(viii) No undisputed amounts payable in respect of Income - tax andWealth – tax were outstanding as at the last day of the year, fora period of more than six months from the date they becamepayable. Considering the nature of business carried on at pres-ent by the Company, there can be no dues pertaining to ExciseDuty, Customs Duty and Sales Tax;
(ix) On the basis of (i) the examination of the Books of Account,(ii) the vouchers produced to us for our verification, (iii) theexplanations given and the representations made to us on ourinquiries and (iv) the checks and control relating to authorisingthe expenditure on the basis of accepted business practiceshaving regard to the Company’s needs and exigencies, we havenot come across any expenses charged to revenue, which, inour opinion and judgement and to the best of our knowledgeand belief, could be regarded as personal expenses;
(x) The Company has maintained adequate documents andrecords in respect of loans and advances granted on the basisof pledge of securities.
(xi) The Company has maintained proper records of the transac-tions and contracts in respect of investments and has alsomade timely entries therein. The investments are held by theCompany in its own name or are in the process of being trans-ferred in the name of the Company.
Considering the nature of business being carried on at present by theCompany and also the nature of matters referred to in various clausesof the Manufacturing and Other Companies (Auditor’s Report) Order,1988, Clauses (iii), (iv), (v), (vi), (x), (xi), (xii), (xiv), (xvi) and (xx) ofpara 4(A) and 4(D) (iii) of the aforesaid Order are, in our opinion, notapplicable to the Company.
For and on behalf ofDALAL & SHAH
Chartered Accountants
Shishir DalalMumbai, 15th May, 2000 Partner
report of the auditors to the members I

102
balance sheet IAS AT 31ST MARCH
2000 I 1999
Schedule Rupees Rupees Rupees
I. Sources of Funds 1. Shareholders’ Funds
a) Capital 1 2,450,000 2,450,000b) Reserves & Surplus 2 256,192,222 246,241,856
258,642,222 248,691,856
2. Loan FundsUnsecured Loans:a) From Bajaj Auto Limited-
Holding Company 61,000,000 47,000,000b) From a Joint Stock Company 100,000,000 15,000,000
161,000,000 62,000,000Total 419,642,222 310,691,856
II. Application of Funds1. Fixed Assets
Land, at cost 422,435 422,435Ownership Premises, at cost (See Note 3) 906,568 906,568Less: Depreciation 273,482 240,162
633,086 666,4061,055,521 1,088,841
2. Investments 3 240,470,127 231,722,8303. Current Assets, Loans & Advances: 4
a) Sundry Debtors — 1,129,000b)Cash and Bank Balances 3,063,842 428,924c) Other Current Assets 5,654,497 6,478,817d)Loans and Advances 189,129,439 89,679,726
197,847,778 97,716,467Less: Current Liabilities and Provisions: 5a) Liabilities 8,436,204 8,597,282b)Provisions 11,295,000 11,239,000
19,731,204 19,836,282Net Current Assets 178,116,574 77,880,185
Total 419,642,222 310,691,856
Notes forming part of the Accounts 7
As per our attached report of even date
For and on behalf of Dalal & Shah D.S. MehtaChartered Accountants Madhur Bajaj Directors
G.B. Laddha
Shishir DalalPartner
Mumbai: 15th May, 2000 Mumbai: 15th May, 2000
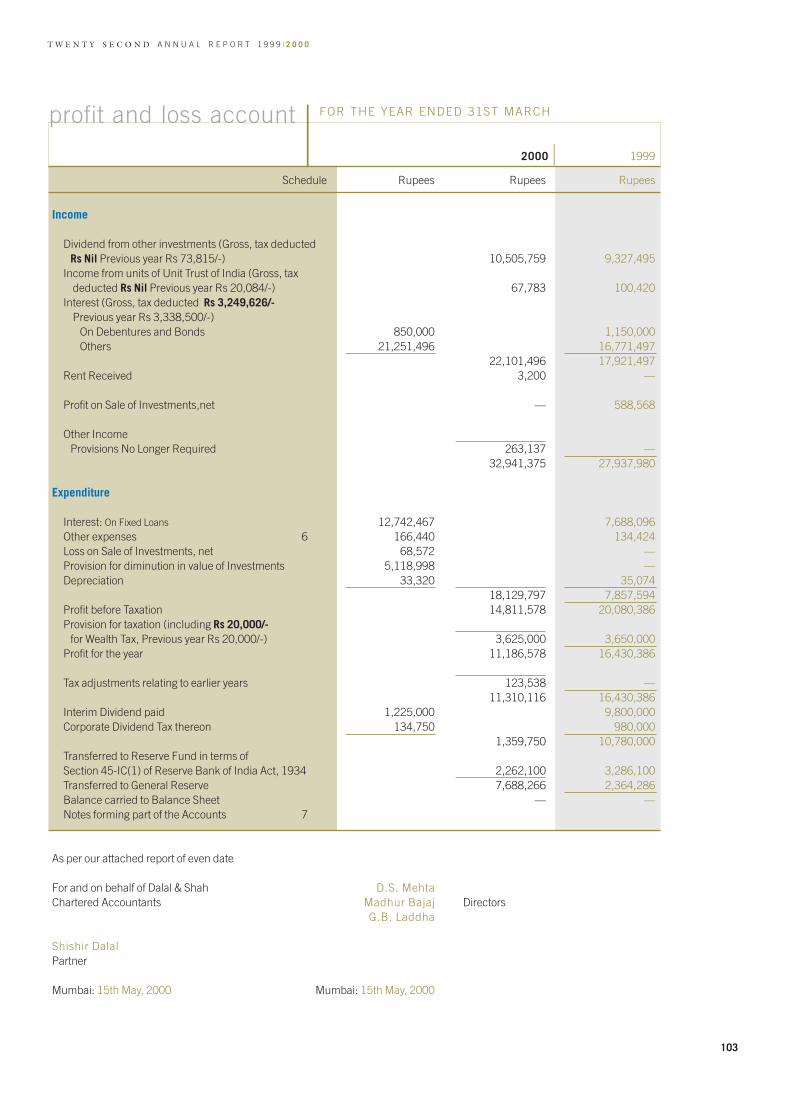
T W E N T Y S E C O N D A N N U A L R E P O R T 1 9 9 9 | 2 0 0 0
103
profit and loss account IFOR THE YEAR ENDED 31ST MARCH
2000 I 1999
Schedule Rupees Rupees Rupees
Income
Dividend from other investments (Gross, tax deducted Rs Nil Previous year Rs 73,815/-) 10,505,759 9,327,495
Income from units of Unit Trust of India (Gross, tax deducted Rs Nil Previous year Rs 20,084/-) 67,783 100,420
Interest (Gross, tax deducted Rs 3,249,626/-Previous year Rs 3,338,500/-)
On Debentures and Bonds 850,000 1,150,000Others 21,251,496 16,771,497
22,101,496 17,921,497Rent Received 3,200 —
Profit on Sale of Investments,net — 588,568
Other IncomeProvisions No Longer Required 263,137 —
32,941,375 27,937,980
Expenditure
Interest: On Fixed Loans 12,742,467 7,688,096Other expenses 6 166,440 134,424Loss on Sale of Investments, net 68,572 —Provision for diminution in value of Investments 5,118,998 —Depreciation 33,320 35,074
18,129,797 7,857,594Profit before Taxation 14,811,578 20,080,386Provision for taxation (including Rs 20,000/-
for Wealth Tax, Previous year Rs 20,000/-) 3,625,000 3,650,000Profit for the year 11,186,578 16,430,386
Tax adjustments relating to earlier years 123,538 —11,310,116 16,430,386
Interim Dividend paid 1,225,000 9,800,000Corporate Dividend Tax thereon 134,750 980,000
1,359,750 10,780,000Transferred to Reserve Fund in terms ofSection 45-IC(1) of Reserve Bank of India Act, 1934 2,262,100 3,286,100Transferred to General Reserve 7,688,266 2,364,286Balance carried to Balance Sheet — —Notes forming part of the Accounts 7
As per our attached report of even date
For and on behalf of Dalal & Shah D.S. MehtaChartered Accountants Madhur Bajaj Directors
G.B. Laddha
Shishir DalalPartner
Mumbai: 15th May, 2000 Mumbai: 15th May, 2000

104
In Government and Trust Securities
Quoted:** 50,210 Units of Rs.10 each in Unit Trust of India
under Unit Scheme 1964 — —
Authorised:50,000 Equity Shares of Rs 100/- each 5,000,000 5,000,000
Issued and Subscribed:24,500 Equity Shares of Rs 100/- eachfully paid-up (All the shares are heldby Holding Company - Bajaj Auto Ltd) 2,450,000 2,450,000
Total 2,450,000 2,450,000
Reserve Fund in terms of Section 45-IC(1)of Reserve Bank of India Act, 1934
as per last account 11,024,300 7,738,200Set aside this year 2,262,100 3,286,100
13,286,400 11,024,300
General Reserve:As per last account 235,217,556 232,853,270Set aside this year 7,688,266 2,364,286
242,905,822 235,217,556Total 256,192,222 246,241,856
Schedule 1 Share Capital As at I 31 st March 1999
Rupees Rupees Rupees
Schedule 2 Reserves and Surplus As atI 31 st March 1999
Rupees Rupees Rupees
schedules no. 1-7 IANNEXED TO AND FORMING PART OF THE BALANCE SHEET AS AT AND THE PROFIT AND LOSS ACCOUNT FOR THE YEAR ENDED 31ST MARCH 2000
Schedule 3 Investments, Other than trade at Cost As atI 31 st March 1999
Rupees Rupees Rupees
Carried over — —

T W E N T Y S E C O N D A N N U A L R E P O R T 1 9 9 9 | 2 0 0 0
105
Brought over — —In Equity Shares
Quoted2,916,900 (2,838,000) Shares of Rs. 10 each in
Bajaj Auto Finance Ltd. 94,211,244 91,420,00025,000 Shares of Rs. 10 each in Colgate
Palmolive India Ltd. 7,475,246 7,475,246135,026 Shares of Rs. 10 each in Hercules
Hoists Ltd. 29,311,738 29,311,73837,500 (25,000) Shares of Rs. 10 each in
Hindustan Petroleum Corporation Ltd.(including 12,500 Bonus sharesreceived during the year) 9,120,125 9,120,125
45,500 (46,350) Shares of Rs. 10 each in NRC Ltd. 5,612,442 5,725,49260,000 Shares of Rs. 10 each in Rallis India Ltd. 12,065,250 12,065,250
201,000 Shares of Rs. 10 each in Saw Pipes Ltd. 7,114,700 7,114,700172,184 (72,184) Shares of Rs. 10 each in Tata
Chemicals Ltd. 16,477,628 8,639,844Other 46,487,050 45,272,474
227,875,423 216,144,869Unquoted170,000 Shares of Rs.10 each in CMM Ltd. 5,100,000 5,100,000
5,000 Shares of Rs.10 each in Sesa Industries Ltd. 112,500 112,500
5,212,500 5,212,500Less: Provision for Diminution in the value of Investments 5,212,498 93,500
2 5,119,000In Bonds
Quoted* 11% Bonds of Industrial Finance
Corporation of India, 2002 (46th Series)of the face value of Rs.5,000,000 5,094,702 5,094,702Other — 5,364,259
5,094,702 10,458,961232,970,127 231,722,830
Application for Investment in Mutual Fund Units 7,500,000 —
Total 240,470,127 231,722,830
Book Value as at Market Value as at31st March 2000 31st March 1999 31 st March 2000 31 st March 1999
Rupees Rupees Rupees RupeesQuoted 232,970,125 226,603,830 *236,362,413 *176,192,885Unquoted 2 5,119,000Total 232,970,127 231,722,830
Notes :1. The following Shares are in the process of being transferred in the name of Company :
Name of the Company Face Value No of EquityRs. Shares
Jindal Vijayanagar Steel Ltd. 10 100,000STI Products (India) Ltd. 10 160,000V B Desai Financial Services Ltd. 10 153,000
* 2. Quoted Investments for which quotations are not available have been included in market value at the face value/paid up value, whichever is lower, as the quotations are not available.
**3. Units of Unit Trust of India have been included in market value at the Repurchase value.4. See note ̀ 4' in Schedule ̀ 7' to the Accounts.
Schedule 3 Investments, Other than trade at Cost (CONTD.) As atI 31 st March 1999
Rupees Rupees Rupees

(a) Sundry Debtors, Unsecured :Outstanding for a period exceeding six months, Good — 1,129,000
(b) Cash and Bank Balances:Cash on hand 544 138Balances with Scheduled Banks:In current account 3,063,298 428,786
3,063,842 428,924(c) Other Current Assets:
Dividend and Interest Receivable on Investments — 446,805Interest Receivable, good :
On loans 5,521,369 5,898,884Other 133,128 133,128
5,654,497 6,032,0125,654,497 6,478,817
(d) Loans and Advances, unsecured, good:Loans to Joint Stock Companies(including Rs.100,000,000 againstpledge of securities. Previous yearRs.Nil) 172,000,000 72,000,000Advances recoverable in cash or inkind or for value to be received 5,112,571 5,670,480Deposit with I.D.B.I under InvestmentDeposit Scheme, 1986 (includinginterest accrued thereon Rs.105,000/-Previous year Rs.105,000/-) 1,155,000 1,155,000
Tax paid in advance 10,861,868 10,854,246
189,129,439 89,679,726Total 197,847,778 97,716,467
106
(a) Liabilities:Sundry Creditors 8,424,118 8,501,118Due to Bajaj Auto Ltd- Holding Company 12,086 —Interest Accrued but not due on Loans — 96,164
8,436,204 8,597,282
(b) Provisions:Provision for Taxation
11,295,000 11,239,000Total 19,731,204 19,836,282
Schedule 4 Current Assets, Loans and Advances As atI 31 st March 1999
Rupees Rupees Rupees
Schedule 5 Current Liabilities and Provisions As atI 31 st March 1999
Rupees Rupees Rupees

T W E N T Y S E C O N D A N N U A L R E P O R T 1 9 9 9 | 2 0 0 0
107
Administration Charges 6,000 6,000Building Repairs 30,000 5,647Rates & Taxes 19,645 38,929Insurance 646 —Auditors' Remuneration:
As Auditors 10,500 10,500In other capacity:
for tax audit 5,250 3,150for certificates — 2,000
15,750 15,650Legal & Professional Charges 54,000 65,000Miscellaneous Expenses 33,594 3,198Sundry Debit Balances written off 6,805 —
Total 166,440 134,424
1. Statement of Significant Accounting Policies :(a) Income and Expenses are accounted on accrual basis,except those associated with significant uncertainities.(b) Investments are valued at cost of acquisition. Provision for diminution in value of unquoted investments is made as
per revised directive of the Reserve Bank of India on prudential norms issued on 12th May, 1998.(c) Profits/Losses on Sale of Investments are recognised on the basis of cost of the specific lot of Investments sold during
the year(d) Fixed Assets :
(A)Fixed Assets are stated at cost of acquisition less accumulated depreciation (except freehold land).(B)Depreciation:(i)Depreciation is being provided on "Written Down Value" basis in accordance with the provisions of Section 205(2)(a) of the Companies Act 1956 in the manner and at the rates specified in Schedule XIV to the said Act.(ii)Depreciation on addition to assets is being provided for the full year instead of pro-rating the same as required by Schedule XIV to the Companies Act 1956.
2. Contingent liabilities not provided in respect of: 1999-2000 1998-1999Disputed Income-tax liability - decided by Income Tax Rupees RupeesAppellete Tribunal in favour of the Company, appealedagaint by the Department 12,257,981 12,257,981
3. Sale deed in respect of ownership premises is yet to be executed. 4. (a) Disclosure of details of Investments in Investments Schedule annexed to the Accounts is made in accordance with
the approval of Department of Company Affairs, Ministry of Law, Justice and Company Affairs of Government of India,under Section 211(4) of the Companies Act, 1956 vide its letter No 46/24/2000/CL-III dated 31st March, 2000
(b) Investments made by the Company being of long term nature, Diminution in the value of Quoted Investments are not considered to be of a permanent nature and thus, in the opinion of management, no provision for the same is considered necessary to be made.
5. Previous year's figures have been regrouped wherever necessary.
Signature to Schedules “1” to “7”
For and on behalf of Dalal & Shah D.S. MehtaChartered Accountants Madhur Bajaj Directors
G.B. Laddha
Shishir DalalPartner
Mumbai: 15th May, 2000 Mumbai: 15th May, 2000
Schedule 6 Other Expenses PreviousI Year
Rupees Rupees Rupees
Schedule 7 Notes forming part of the Accounts
I

108
I. REGISTRATION DETAILS
Registration No. 21066State Code 11Balance Sheet date 31st March,2000
II. CAPITAL RAISED DURING THE YEAR ENDED 31ST MACH 2000 Rs. in ’000s
Public Issue —Rights Issue —Bonus Issue —Private Placement —Others —
Total —
III. POSITION OF MOBILISATION AND DEPLOYMENT OF FUNDS AS AT 31ST MARCH,2000
Total Liabilities 419,642
Total Assets 419,642
Sources of FundsPaid-up capital 2,450Reserves and surplus 256,192Secured loans —Unsecured loans 161,000
Total 419,642
Application of FundsNet Fixed Assets 1,055Investments 240,470Net Current Assets 178,117Misc.Expenditure-Technical —Accumulated losses —
Total 419,642
IV. PERFORMANCE OF THE COMPANY FOR THE YEAR ENDED 31ST MARCH,2000
i) Dividend, interest and Other income 32,941ii) Total Expenditure 18,130iii) Profit before tax 14,811iv) Profit after tax 11,186v) Adjustments for earlier years 124vi) Net Profit 11,310vii) Earning per share Rs. (Face vaue Rs. 100 per share) 462viii) Dividend Rate (%) 50
V. GENERIC NAMES OF THE THREE PRINCIPAL PRODUCTS/SERVICES OF COMPANY(As per monetary terms)Being an investment company, not applicable
Note: Earning per share is arrived at by dividing the Net profit [Item IV (vi)] by total number of shares issued and subscribed atthe end of the year
D.S. MehtaMadhur Bajaj DirectorsG.B. Laddha
Mumbai: 15th May, 2000
Balance Sheet Abstract and Company’s General Business Profile: (Part IV)


Akurdi, Pune, 411 035