Embed Size (px)
Citation preview

Fifth District Economic IndicatorsJune 2020

Labor Pages
Industry Structure ........................................................................................................... 3-9 Industry Growth ........................................................................................................... 10-16 Payroll Employment ..................................................................................................... 17-23 Unemployment Rate .................................................................................................... 24-30 Labor Force Participation Rate ……………………………………………………………..31-37 Initial Unemployment Claims ....................................................................................... 38-44
Regional Surveys of Business Activity Manufacturing .............................................................................................................. 45-46 Service Sector .................................................................................................................. 47 Survey Comparison ..................................................................................................... 48-49
Income Real Personal Income.................................................................................................. 50-56 Wages and Salaries ..................................................................................................... 57-63
Housing Building Permits, Single-Family Housing ..................................................................... 64-70 House Price Index ...……………………………………………………………….…………71-77 Housing Starts ............................................................................................................. 78-83 Mortgage Delinquency Rates ....................................................................................... 84-90 Mortgage Foreclosure Inventory .................................................................................. 91-97 Mortgage Foreclosure Starts ..................................................................................... 98-104
Table of Contents
2

Source: Bureau of Labor Statistics/Haver Analytics
Fifth District Industry Structure
3
5.5
8.7
18.7
2.0
6.5
14.7
16.9
6.6
3.5
16.9
5.6
7.8
17.2
1.6
5.6
16.7
14.6
6.5
4.2
20.1
0 2 4 6 8 10 12 14 16 18 20 22
Natural Resources & Construction
Manufacturing
Trade, Transportation & Utilities
Information
Financial Activities
Professional & Business Services
Education & Health Services
Leisure & Hospitality
Other Services
Government
Employment Share (Percent)
April 2020 U.S.
Fifth District

District of Columbia Industry Structure
4Source: Bureau of Labor Statistics/Haver Analytics
5.5
8.7
18.7
2.0
6.5
14.7
16.9
6.6
3.5
16.9
1.8
0.2
3.8
2.8
4.0
23.0
16.6
4.8
10.6
32.5
0 5 10 15 20 25 30 35
Natural Resources & Construction
Manufacturing
Trade, Transportation & Utilities
Information
Financial Activities
Professional & Business Services
Education & Health Services
Leisure & Hospitality
Other Services
Government
Employment Share (Percent)
April 2020 U.S.
District of Columbia

Maryland Industry Structure
5
5.5
8.7
18.7
2.0
6.5
14.7
16.9
6.6
3.5
16.9
6.6
4.1
17.1
1.1
5.5
17.6
17.5
6.2
3.6
0 2 4 6 8 10 12 14 16 18 20
Natural Resources & Construction
Manufacturing
Trade, Transportation & Utilities
Information
Financial Activities
Professional & Business Services
Education & Health Services
Leisure & Hospitality
Other Services
Government
Employment Share (Percent)
April 2020 U.S.
Maryland
Source: Bureau of Labor Statistics/Haver Analytics

North Carolina Industry Structure
6
0.5
5.0
8.7
18.7
2.0
6.5
14.7
16.9
6.6
3.5
16.9
0.1
5.4
10.5
19.3
1.8
6.2
14.8
14.0
6.5
3.2
18.2
0 2 4 6 8 10 12 14 16 18 20
Natural Resources & Mining
Construction
Manufacturing
Trade, Transportation & Utilities
Information
Financial Activities
Professional & Business Services
Education & Health Services
Leisure & Hospitality
Other Services
Government
Employment Share (Percent)
April 2020 U.S.
North Carolina
Source: Bureau of Labor Statistics/Haver Analytics

South Carolina Industry Structure
7Source: Bureau of Labor Statistics/Haver Analytics
0.5
5.0
8.7
18.7
2.0
6.5
14.7
16.9
6.6
3.5
16.9
0.2
5.3
12.7
19.6
1.4
5.1
13.7
11.9
7.6
3.6
18.9
0 2 4 6 8 10 12 14 16 18 20
Natural Resources and Mining
Construction
Manufacturing
Trade, Transportation & Utilities
Information
Financial Activities
Professional & Business Services
Education & Health Services
Leisure & Hospitality
Other Services
Government
Employment Share (Percent)
April 2020 U.S.
South Carolina

Virginia Industry Structure
8
0.5
5.0
8.7
18.7
2.0
6.5
14.7
16.9
6.6
3.5
16.9
0.2
5.3
6.3
16.4
1.8
5.8
19.8
13.6
6.5
4.9
19.4
0 2 4 6 8 10 12 14 16 18 20
Natural Resources & Mining
Construction
Manufacturing
Trade, Transportation & Utilities
Information
Financial Activities
Professional & Business Services
Education & Health Services
Leisure & Hospitality
Other Services
Government
Employment Share (Percent)
April 2020 U.S.
Virginia
Source: Bureau of Labor Statistics/Haver Analytics

West Virginia Industry Structure
9
0.5
5.0
8.7
18.7
2.0
6.5
14.7
16.9
6.6
3.5
16.9
3.3
4.7
7.0
17.7
1.2
4.3
10.2
19.0
5.8
3.2
23.6
0 2 4 6 8 10 12 14 16 18 20 22 24 26
Natural Resources and Mining
Construction
Manufacturing
Trade, Transportation & Utilities
Information
Financial Activities
Professional & Business Services
Education & Health Services
Leisure & Hospitality
Other Services
Government
Employment Share (Percent)
April 2020 U.S.
West Virginia
Source: Bureau of Labor Statistics/Haver Analytics

Fifth District Industry GrowthPercent Change in Employment from a Year Ago, NSA
10
-2.8
-13.9
-46.7
-10.3
-6.7
-1.8
-6.6
-8.2
-8.5
-4.9
-11.2
-3.6
-21.3
-47.2
-8.7
-9.0
-1.6
-7.2
-10.6
-10.5
-11.3
-12.9
-50 -45 -40 -35 -30 -25 -20 -15 -10 -5 0
Government
Other
Leisure & Hospitality
Education & Health Services
Professional & Business Services
Financial Activities
Information
Trade, Transportation & Utilities
Manufacturing
Natural Resources & Construction
Total
YoY % Chg (NSA)
April 2020 U.S. Fifth District
Source: Bureau of Labor Statistics/Haver Analytics

District of Columbia Industry GrowthPercent Change in Employment from a Year Ago, NSA
11
-12.9
-11.3
-10.5
-10.6
-7.2
-1.6
-9.0
-8.7
-47.2
-21.3
-3.6
-7.9
-9.5
-14.3
-13.8
4.1
-1.7
-0.4
-8.3
-57.9
0.8
0.9
-70 -60 -50 -40 -30 -20 -10 0 10
Total
Natural Resources & Construction
Manufacturing
Trade, Transportation & Utilities
Information
Financial Activities
Professional & Business Services
Education & Health Services
Leisure & Hospitality
Other Services
Government
YoY % Chg (NSA)
April 2020 U.S. District of Columbia
Source: Bureau of Labor Statistics/Haver Analytics
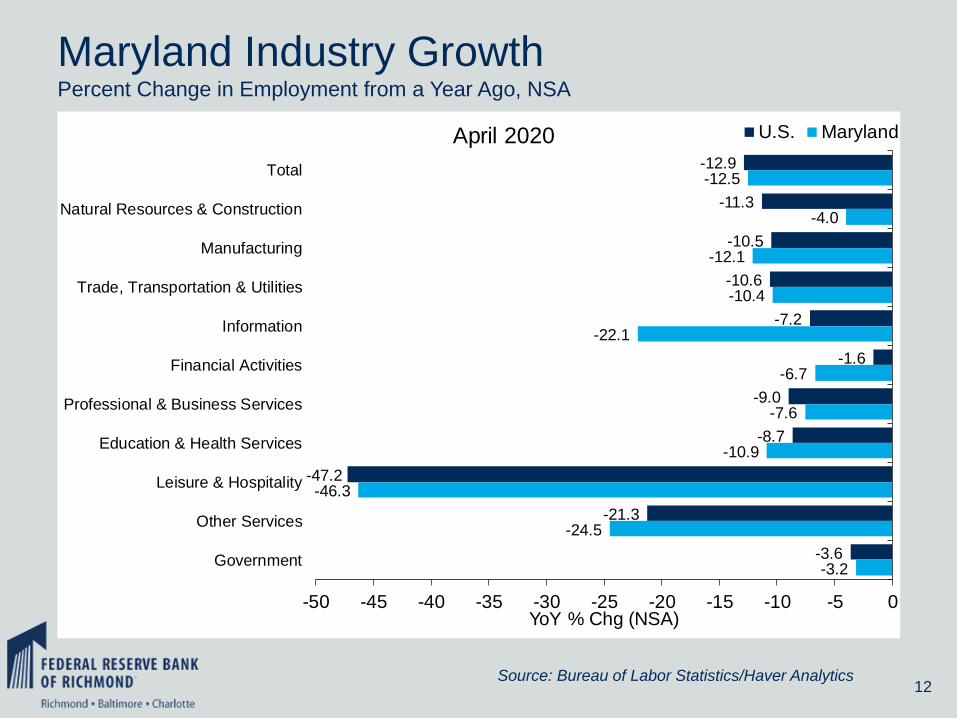
Maryland Industry GrowthPercent Change in Employment from a Year Ago, NSA
12
-12.9
-11.3
-10.5
-10.6
-7.2
-1.6
-9.0
-8.7
-47.2
-21.3
-3.6
-12.5
-4.0
-12.1
-10.4
-22.1
-6.7
-7.6
-10.9
-46.3
-24.5
-3.2
-50 -45 -40 -35 -30 -25 -20 -15 -10 -5 0
Total
Natural Resources & Construction
Manufacturing
Trade, Transportation & Utilities
Information
Financial Activities
Professional & Business Services
Education & Health Services
Leisure & Hospitality
Other Services
Government
YoY % Chg (NSA)
April 2020 U.S. Maryland
Source: Bureau of Labor Statistics/Haver Analytics

North Carolina Industry GrowthPercent Change in Employment from a Year Ago, NSA
13
-12.9
-11.7
-11.3
-10.5
-10.6
-7.2
-1.6
-9.0
-8.7
-47.2
-21.3
-3.6
-12.3
-3.5
-5.4
-11.7
-7.7
-6.6
0.7
-8.6
-10.8
-48.9
-19.1
-2.8
-55 -50 -45 -40 -35 -30 -25 -20 -15 -10 -5 0 5
Total
Natural Resources & Mining
Construction
Manufacturing
Trade, Transportation & Utilities
Information
Financial Activities
Professional & Business Services
Education & Health Services
Leisure & Hospitality
Other Services
Government
YoY % Chg (NSA)
April 2020 U.S. North Carolina
Source: Bureau of Labor Statistics/Haver Analytics

South Carolina Industry GrowthPercent Change in Employment from a Year Ago, NSA
14
-12.9
-11.7
-11.3
-10.5
-10.6
-7.2
-1.6
-9.0
-8.7
-47.2
-21.3
-3.6
-11.6
-2.3
-3.1
-5.0
-6.2
-2.9
-6.1
-10.8
-10.8
-46.5
-11.6
-2.4
-50 -45 -40 -35 -30 -25 -20 -15 -10 -5 0
Total
Natural Resources & Mining
Construction
Manufacturing
Trade, Transportation & Utilities
Information
Financial Activities
Professional & Business Services
Education & Health Services
Leisure & Hospitality
Other Services
Government
YoY % Chg (NSA)
April 2020 U.S. South Carolina
Source: Bureau of Labor Statistics/Haver Analytics

Virginia Industry GrowthPercent Change in Employment from a Year Ago, NSA
15
-12.9
-11.7
-11.3
-10.5
-10.6
-7.2
-1.6
-9.0
-8.7
-47.2
-21.3
-3.6
-8.9
-6.3
-2.9
-4.3
-7.3
-2.5
1.5
-4.2
-9.9
-41.0
-9.5
-3.2
-50 -40 -30 -20 -10 0 10
Total
Natural Resources & Mining
Construction
Manufacturing
Trade, Transportation & Utilities
Information
Financial Activities
Professional & Business Services
Education & Health Services
Leisure & Hospitality
Other Services
Government
YoY % Chg (NSA)
April 2020 U.S. Virginia
Source: Bureau of Labor Statistics/Haver Analytics

West Virginia Industry GrowthPercent Change in Employment from a Year Ago, NSA
16
-12.9
-11.7
-11.3
-10.5
-10.6
-7.2
-1.6
-9.0
-8.7
-47.2
-21.3
-3.6
-14.2
-10.5
-17.7
-7.6
-13.2
-10.0
-8.2
-8.4
-9.2
-52.1
-19.0
-5.6
-55 -50 -45 -40 -35 -30 -25 -20 -15 -10 -5 0
Total
Natural Resources & Mining
Construction
Manufacturing
Trade, Transportation & Utilities
Information
Financial Activities
Professional & Business Services
Education & Health Services
Leisure & Hospitality
Other Services
Government
YoY % Chg (NSA)
April 2020 U.S. West Virginia
Source: Bureau of Labor Statistics/Haver Analytics

-14
-12
-10
-8
-6
-4
-2
0
2
4
2008 2009 2010 2011 2012 2013 2014 2015 2016 2017 2018 2019 2020
YoY % Chg U.S.
Fifth District
Fifth District Payroll Employment
17Source: Bureau of Labor Statistics/Haver Analytics
April 2020
US: -12.9%
FD: -11.3%
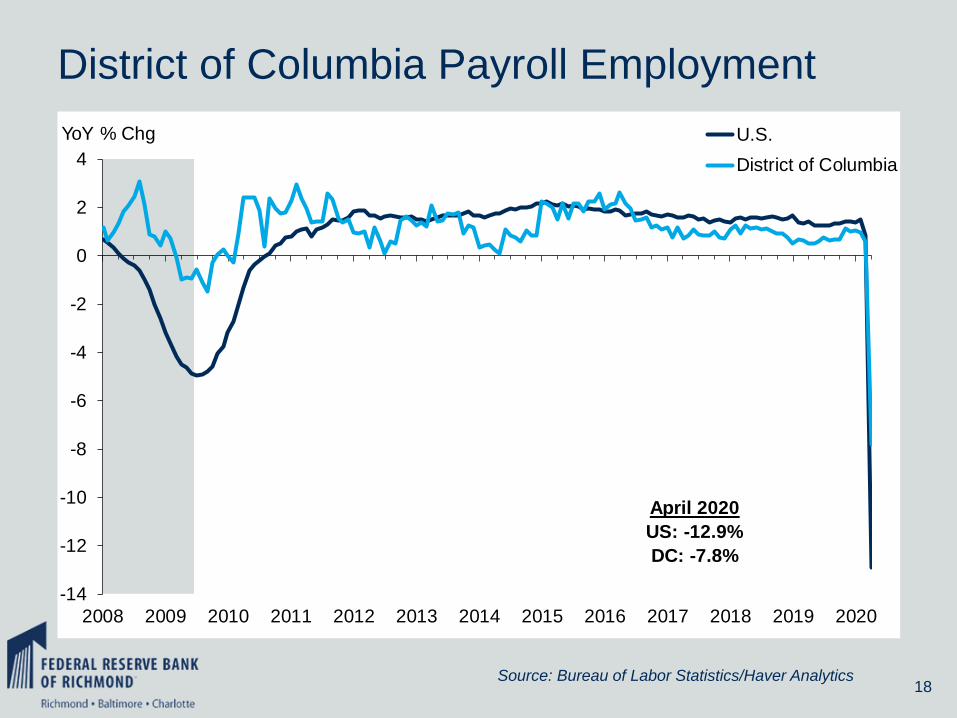
District of Columbia Payroll Employment
18
-14
-12
-10
-8
-6
-4
-2
0
2
4
2008 2009 2010 2011 2012 2013 2014 2015 2016 2017 2018 2019 2020
YoY % Chg U.S.
District of Columbia
Source: Bureau of Labor Statistics/Haver Analytics
April 2020
US: -12.9%
DC: -7.8%

Maryland Payroll Employment
19
-14
-12
-10
-8
-6
-4
-2
0
2
4
2008 2009 2010 2011 2012 2013 2014 2015 2016 2017 2018 2019 2020
YoY % Chg U.S.
Maryland
Source: Bureau of Labor Statistics/Haver Analytics
April 2020
US: -12.9%
MD: -12.7%

North Carolina Payroll Employment
20
-14
-12
-10
-8
-6
-4
-2
0
2
4
2008 2009 2010 2011 2012 2013 2014 2015 2016 2017 2018 2019 2020
YoY % Chg U.S.
North Carolina
Source: Bureau of Labor Statistics/Haver Analytics
April 2020
US: -12.9%
NC: -12.4%
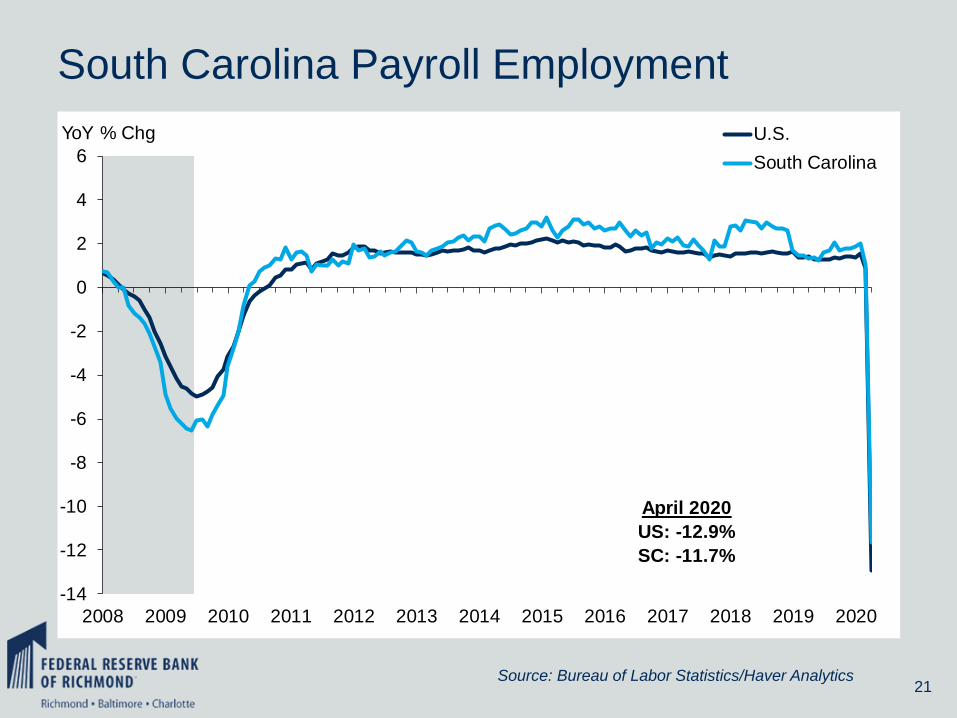
South Carolina Payroll Employment
21
-14
-12
-10
-8
-6
-4
-2
0
2
4
6
2008 2009 2010 2011 2012 2013 2014 2015 2016 2017 2018 2019 2020
YoY % Chg U.S.
South Carolina
Source: Bureau of Labor Statistics/Haver Analytics
April 2020
US: -12.9%
SC: -11.7%

Virginia Payroll Employment
22
-14
-12
-10
-8
-6
-4
-2
0
2
4
2008 2009 2010 2011 2012 2013 2014 2015 2016 2017 2018 2019 2020
YoY % Chg (SA) U.S.
Virginia
Source: Bureau of Labor Statistics/Haver Analytics
April 2020
US: -12.9%
VA: -9.0%

West Virginia Payroll Employment
23Source: Bureau of Labor Statistics/Haver Analytics
-16
-14
-12
-10
-8
-6
-4
-2
0
2
4
2008 2009 2010 2011 2012 2013 2014 2015 2016 2017 2018 2019 2020
YoY % Chg U.S.
West Virginia
April 2020
US: -12.9%
WV: -14.3%

Fifth District Unemployment Rate
24
0
2
4
6
8
10
12
14
16
2008 2009 2010 2011 2012 2013 2014 2015 2016 2017 2018 2019 2020
Unemployment Rate (Percent)
U.S.
Fifth District
Source: Bureau of Labor Statistics/Haver Analytics
April 2020
US: 14.7%
FD: 11.4%

District of Columbia Unemployment Rate
25
0
2
4
6
8
10
12
14
16
2008 2009 2010 2011 2012 2013 2014 2015 2016 2017 2018 2019 2020
Percent U.S.
District of Columbia
Source: Bureau of Labor Statistics/Haver Analytics
April 2020
US: 14.7%
DC: 11.1%

Maryland Unemployment Rate
26
0
2
4
6
8
10
12
14
16
2008 2009 2010 2011 2012 2013 2014 2015 2016 2017 2018 2019 2020
Percent U.S.
Maryland
Source: Bureau of Labor Statistics/Haver Analytics
April 2020
US: 14.7%
MD: 9.9%

North Carolina Unemployment Rate
27Source: Bureau of Labor Statistics/Haver Analytics
April 2020
US: 14.7%
NC: 12.2%
0
2
4
6
8
10
12
14
16
2008 2009 2010 2011 2012 2013 2014 2015 2016 2017 2018 2019 2020
Percent U.S.
North Carolina

South Carolina Unemployment Rate
28
0
2
4
6
8
10
12
14
16
2008 2009 2010 2011 2012 2013 2014 2015 2016 2017 2018 2019 2020
Percent U.S.
South Carolina
Source: Bureau of Labor Statistics/Haver Analytics
April 2020
US: 14.7%
SC: 12.1%

Virginia Unemployment Rate
29
0
2
4
6
8
10
12
14
16
2008 2009 2010 2011 2012 2013 2014 2015 2016 2017 2018 2019 2020
PercentU.S.
Virginia
Source: Bureau of Labor Statistics/Haver Analytics
April 2020
US: 14.7%
VA: 10.6%
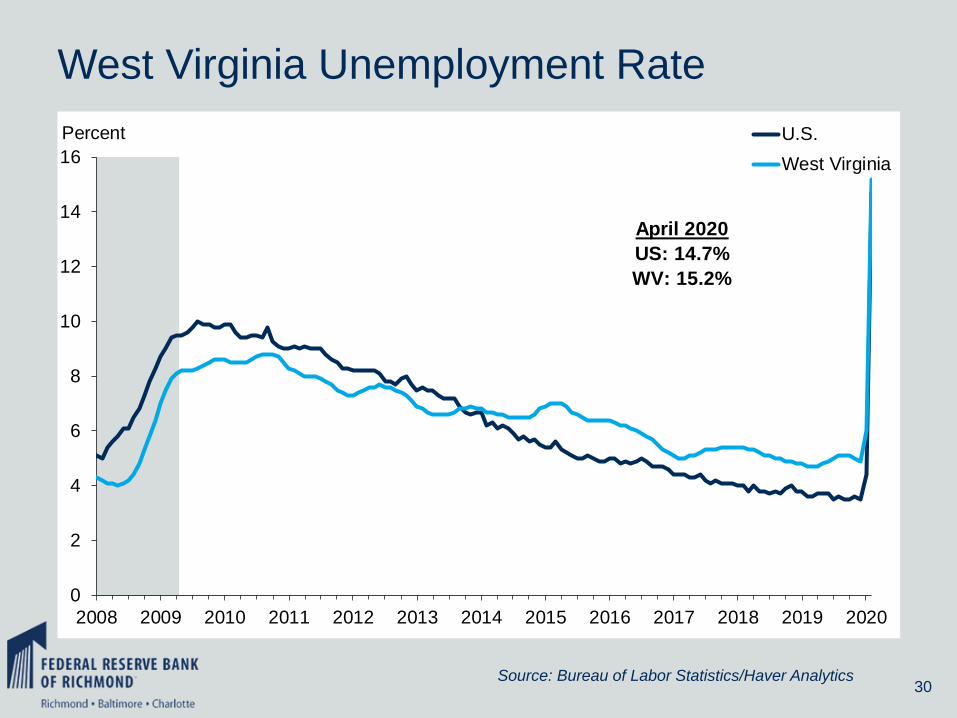
West Virginia Unemployment Rate
30
0
2
4
6
8
10
12
14
16
2008 2009 2010 2011 2012 2013 2014 2015 2016 2017 2018 2019 2020
Percent U.S.
West Virginia
Source: Bureau of Labor Statistics/Haver Analytics
April 2020
US: 14.7%
WV: 15.2%

Fifth District Labor Force Participation Rate
31Source: Bureau of Labor Statistics/Haver Analytics
57
58
59
60
61
62
63
64
65
66
67
2008 2009 2010 2011 2012 2013 2014 2015 2016 2017 2018 2019 2020
Percent U.S.
Fifth District
April 2020
US: 60.2%
FD: 60.2%
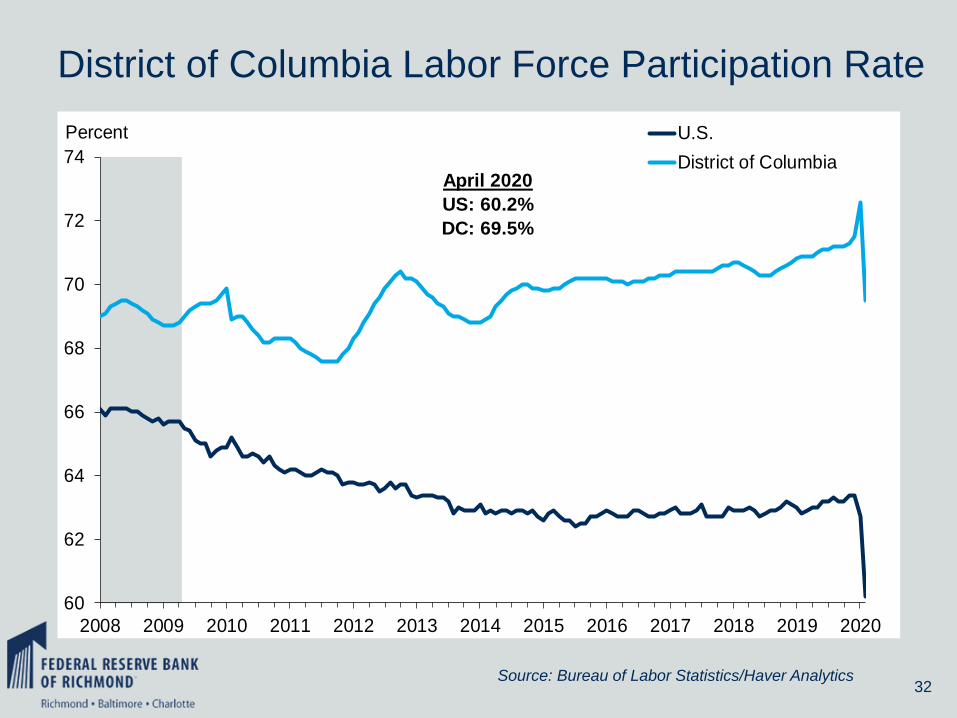
District of Columbia Labor Force Participation Rate
32Source: Bureau of Labor Statistics/Haver Analytics
April 2020
US: 60.2%
DC: 69.5%
60
62
64
66
68
70
72
74
2008 2009 2010 2011 2012 2013 2014 2015 2016 2017 2018 2019 2020
Percent U.S.
District of Columbia

Maryland Labor Force Participation Rate
33Source: Bureau of Labor Statistics/Haver Analytics
54
56
58
60
62
64
66
68
70
2008 2009 2010 2011 2012 2013 2014 2015 2016 2017 2018 2019 2020
Percent U.S.
MarylandApril 2020
US: 60.2%
MD: 64.2%

North Carolina Labor Force Participation Rate
34Source: Bureau of Labor Statistics/Haver Analytics
50
52
54
56
58
60
62
64
66
68
2008 2009 2010 2011 2012 2013 2014 2015 2016 2017 2018 2019 2020
Percent U.S.
North Carolina
April 2020
US: 60.2%
NC: 56.3%

South Carolina Labor Force Participation Rate
35Source: Bureau of Labor Statistics/Haver Analytics
56
57
58
59
60
61
62
63
64
65
66
67
2008 2009 2010 2011 2012 2013 2014 2015 2016 2017 2018 2019 2020
Percent U.S.
South Carolina
April 2020
US: 60.2%
SC: 57.8%

Virginia Labor Force Participation Rate
36Source: Bureau of Labor Statistics/Haver Analytics
54
56
58
60
62
64
66
68
70
72
2008 2009 2010 2011 2012 2013 2014 2015 2016 2017 2018 2019 2020
Percent U.S.
Virginia
April 2020
US: 60.2%
VA: 64.1%

West Virginia Labor Force Participation Rate
37Source: Bureau of Labor Statistics/Haver Analytics
50
52
54
56
58
60
62
64
66
68
2008 2009 2010 2011 2012 2013 2014 2015 2016 2017 2018 2019 2020
Percent U.S.
West Virginia
April 2020
US: 60.2%
WV: 53.6%

Fifth District Initial Unemployment Claims
38
0
200,000
400,000
600,000
800,000
1,000,000
1,200,000
2008 2009 2010 2011 2012 2013 2014 2015 2016 2017 2018 2019 2020
Source: Bureau of Labor Statistics/Haver Analytics

D.C. Initial Unemployment Claims
39
0
10,000
20,000
30,000
40,000
50,000
60,000
2008 2009 2010 2011 2012 2013 2014 2015 2016 2017 2018 2019 2020
Source: Bureau of Labor Statistics/Haver Analytics

Maryland Initial Unemployment Claims
40
0
50,000
100,000
150,000
200,000
250,000
2008 2009 2010 2011 2012 2013 2014 2015 2016 2017 2018 2019 2020
Source: Bureau of Labor Statistics/Haver Analytics

North Carolina Initial Unemployment Claims
41Source: Bureau of Labor Statistics/Haver Analytics
0
50,000
100,000
150,000
200,000
250,000
300,000
350,000
400,000
2008 2009 2010 2011 2012 2013 2014 2015 2016 2017 2018 2019 2020

South Carolina Initial Unemployment Claims
42Source: Bureau of Labor Statistics/Haver Analytics
0
40,000
80,000
120,000
160,000
200,000
2008 2009 2010 2011 2012 2013 2014 2015 2016 2017 2018 2019 2020

Virginia Initial Unemployment Claims
43Source: Bureau of Labor Statistics/Haver Analytics
0
50,000
100,000
150,000
200,000
250,000
300,000
2008 2009 2010 2011 2012 2013 2014 2015 2016 2017 2018 2019 2020

West Virginia Initial Unemployment Claims
44
0
5,000
10,000
15,000
20,000
25,000
30,000
35,000
2008 2009 2010 2011 2012 2013 2014 2015 2016 2017 2018 2019 2020
Source: Bureau of Labor Statistics/Haver Analytics

Fifth District Manufacturing Survey
45Source: Bureau of Labor Statistics/Haver Analytics
-50
-40
-30
-20
-10
0
10
20
30
2008 2009 2010 2011 2012 2013 2014 2015 2016 2017 2018 2019 2020
Diffusion Index3-month Average
Composite Index
New Orders Index
Shipments Index

Fifth District Manufacturing Survey
46Source: The Federal Reserve Bank of Richmond
-50
-40
-30
-20
-10
0
10
20
30
2008 2009 2010 2011 2012 2013 2014 2015 2016 2017 2018 2019 2020
Diffusion Index3-month Average
Composite Index
Employment Index

Fifth District Service Sector Survey
47Source: The Federal Reserve Bank of Richmond
-50
-40
-30
-20
-10
0
10
20
30
40
2008 2009 2010 2011 2012 2013 2014 2015 2016 2017 2018 2019 2020
Diffusion Index3-month Average
Revenues Index
Employment Index

Survey Comparison
48Source: Federal Reserve Bank of Richmond/Institute of Supply Management
30
35
40
45
50
55
60
65
70
-60
-40
-20
0
20
40
60
2008 2009 2010 2011 2012 2013 2014 2015 2016 2017 2018 2019 2020
Richmond Manufacturing Survey (Left Axis) ISM Manufacturing (Right Axis)

Survey Comparison
49Source: Federal Reserve Bank of Richmond/Institute of Supply Management
30
35
40
45
50
55
60
65
70
-90
-70
-50
-30
-10
10
30
2008 2009 2010 2011 2012 2013 2014 2015 2016 2017 2018 2019 2020
Richmond Service Sector Survey (Left Axis) ISM Nonmanufacturing (Right Axis)

Fifth District Real Personal Income
50
-5
-4
-3
-2
-1
0
1
2
3
4
5
6
7
2008 2009 2010 2011 2012 2013 2014 2015 2016 2017 2018 2019
YoY % Chg U.S.
Fifth District
4Q: 2019US: 2.7%
FD: 2.5%
Source: Bureau of Economic Analysis/Haver Analytics

District of Columbia Real Personal Income
51Source: Bureau of Economic Analysis/Haver Analytics
-6
-4
-2
0
2
4
6
8
10
2008 2009 2010 2011 2012 2013 2014 2015 2016 2017 2018 2019 2020
YoY % Chg U.S.
District of Columbia
4Q: 2019US: 2.7%
DC: 2.1%

Maryland Real Personal Income
52
-5
-4
-3
-2
-1
0
1
2
3
4
5
6
7
2008 2009 2010 2011 2012 2013 2014 2015 2016 2017 2018 2019
YoY % Chg U.S.
Maryland
4Q: 2019US: 2.7%
MD: 2.2%
Source: Bureau of Economic Analysis/Haver Analytics

North Carolina Real Personal Income
53
-6
-4
-2
0
2
4
6
8
2008 2009 2010 2011 2012 2013 2014 2015 2016 2017 2018 2019
YoY % Chg U.S.
North Carolina
4Q: 2019US: 2.7%
NC: 2.7%
Source: Bureau of Economic Analysis/Haver Analytics

South Carolina Real Personal Income
54
-5
-4
-3
-2
-1
0
1
2
3
4
5
6
7
8
2008 2009 2010 2011 2012 2013 2014 2015 2016 2017 2018 2019
YoY % Chg U.S.
South Carolina
4Q: 2019US: 2.7%
SC: 3.1%
Source: Bureau of Economic Analysis/Haver Analytics

Virginia Real Personal Income
55
-5
-4
-3
-2
-1
0
1
2
3
4
5
6
7
2008 2009 2010 2011 2012 2013 2014 2015 2016 2017 2018 2019
YoY % Chg U.S.
Virginia
4Q: 2019US: 2.7%
VA: 2.6%
Source: Bureau of Economic Analysis/Haver Analytics

West Virginia Real Personal Income
56
-5
-4
-3
-2
-1
0
1
2
3
4
5
6
7
2008 2009 2010 2011 2012 2013 2014 2015 2016 2017 2018 2019
YoY % Chg U.S.
West Virginia
4Q: 2019US: 2.7%
WV: 0.2%
Source: Bureau of Economic Analysis/Haver Analytics

Fifth District Wages and Salaries
57
-6
-4
-2
0
2
4
6
8
2008 2009 2010 2011 2012 2013 2014 2015 2016 2017 2018 2019
YoY % Chg U.S.
Fifth District
4Q: 2019US: 4.5%
FD: 4.0%
Source: Bureau of Economic Analysis/Haver Analytics

District of Columbia Wages and Salaries
58
-6
-4
-2
0
2
4
6
8
2008 2009 2010 2011 2012 2013 2014 2015 2016 2017 2018 2019 2020
YoY % Chg U.S.
District of Columbia
4Q: 2019US: 4.5%
DC: 3.4%
Source: Bureau of Economic Analysis/Haver Analytics

Maryland Wages and Salaries
59
-6
-4
-2
0
2
4
6
8
2008 2009 2010 2011 2012 2013 2014 2015 2016 2017 2018 2019
YoY % Chg U.S.
Maryland
4Q: 2019US: 4.5%
MD: 4.0%
Source: Bureau of Economic Analysis/Haver Analytics

North Carolina Wages and Salaries
60
-6
-4
-2
0
2
4
6
8
2008 2009 2010 2011 2012 2013 2014 2015 2016 2017 2018 2019
YoY % Chg U.S.
North Carolina
4Q: 2019US: 4.5%
NC: 4.4%
Source: Bureau of Economic Analysis/Haver Analytics

South Carolina Wages and Salaries
61
-6
-4
-2
0
2
4
6
8
2008 2009 2010 2011 2012 2013 2014 2015 2016 2017 2018 2019
YoY % Chg U.S.
South Carolina
4Q: 2019US: 4.5%
SC: 4.7%
Source: Bureau of Economic Analysis/Haver Analytics

Virginia Wages and Salaries
62
-6
-4
-2
0
2
4
6
8
2008 2009 2010 2011 2012 2013 2014 2015 2016 2017 2018 2019
YoY % Chg U.S.
Virginia
4Q: 2019US: 4.5%
VA: 4.4%
Source: Bureau of Economic Analysis/Haver Analytics

West Virginia Wages and Salaries
63Source: Bureau of Economic Analysis/Haver Analytics
-6
-4
-2
0
2
4
6
8
10
12
2008 2009 2010 2011 2012 2013 2014 2015 2016 2017 2018 2019
YoY % Chg U.S.
West Virginia
4Q: 2019US: 4.5%
WV:-1.1%

Fifth District Building PermitsSingle-Family Homes
64
-60
-40
-20
0
20
40
60
2008 2009 2010 2011 2012 2013 2014 2015 2016 2017 2018 2019 2020
YoY % Chg3-month average
U.S.
Fifth District
April 2020US: 5.1%
FD: 9.7%
Source: US Census Bureau/Haver Analytics

Washington, D.C. MSA Building PermitsSingle-Family Homes
65Source: US Census Bureau/Haver Analytics
-60
-40
-20
0
20
40
60
2008 2009 2010 2011 2012 2013 2014 2015 2016 2017 2018 2019 2020
YoY % Chg3-month average
U.S.
Washington, D.C.
April 2020US: 5.1%
DC: -13.0%

Maryland Building PermitsSingle-Family Homes
66
-60
-40
-20
0
20
40
60
2008 2009 2010 2011 2012 2013 2014 2015 2016 2017 2018 2019 2020
YoY % Chg3-month average
U.S.
Maryland
April 2020US: 5.1%
MD:-4.5%
Source: US Census Bureau/Haver Analytics

North Carolina Building PermitsSingle-Family Homes
67
-80
-60
-40
-20
0
20
40
60
2008 2009 2010 2011 2012 2013 2014 2015 2016 2017 2018 2019 2020
YoY % Chg3-month average
U.S.
North Carolina
April 2020US: 5.1%
NC: 13.0%
Source: US Census Bureau/Haver Analytics

South Carolina Building PermitsSingle-Family Homes
68Source: US Census Bureau/Haver Analytics
-60
-40
-20
0
20
40
60
2008 2009 2010 2011 2012 2013 2014 2015 2016 2017 2018 2019 2020
YoY % Chg3-month average
U.S.
South Carolina
April 2020US: 5.1%
SC: 14.4%

Virginia Building PermitsSingle-Family Homes
69Source: US Census Bureau/Haver Analytics
-60
-40
-20
0
20
40
60
2008 2009 2010 2011 2012 2013 2014 2015 2016 2017 2018 2019 2020
YoY % Chg3-month average
U.S.
Virginia
April 2020US: 5.1%
VA: 4.6%

West Virginia Building PermitsSingle-Family Homes
70Source: US Census Bureau/Haver Analytics
-80
-60
-40
-20
0
20
40
60
80
2008 2009 2010 2011 2012 2013 2014 2015 2016 2017 2018 2019 2020
YoY % Chg 3-month average
U.S.
West Virginia
April 2020US: 5.1%
WV: 8.3%

Fifth District House Price Index—FHFA
71
-9
-6
-3
0
3
6
9
2008 2009 2010 2011 2012 2013 2014 2015 2016 2017 2018 2019 2020
YoY % Chg U.S. Fifth District
1Q: 2020US: 5.0%
FD: 5.0%
Source: Federal Housing Finance Agency/Haver Analytics

District of Columbia House Price Index—FHFA
72
-12
-8
-4
0
4
8
12
16
2008 2009 2010 2011 2012 2013 2014 2015 2016 2017 2018 2019 2020
YoY % Chg U.S. District of Columbia
1Q: 2020US: 5.0%
DC: 3.8%
Source: Federal Housing Finance Agency/Haver Analytics

Maryland House Price Index—FHFA
73
-12
-10
-8
-6
-4
-2
0
2
4
6
8
2008 2009 2010 2011 2012 2013 2014 2015 2016 2017 2018 2019 2020
YoY % Chg U.S. Maryland
1Q: 2020US: 5.0%
MD: 4.1%
Source: Federal Housing Finance Agency/Haver Analytics

North Carolina House Price Index—FHFA
74
-8
-6
-4
-2
0
2
4
6
8
10
2008 2009 2010 2011 2012 2013 2014 2015 2016 2017 2018 2019 2020
YoY % Chg U.S. North Carolina
1Q: 2020US: 5.0%
NC: 5.5%
Source: Federal Housing Finance Agency/Haver Analytics

South Carolina House Price Index—FHFA
75
-9
-6
-3
0
3
6
9
2008 2009 2010 2011 2012 2013 2014 2015 2016 2017 2018 2019 2020
YoY % Chg U.S. South Carolina
1Q: 2020US: 5.0%
SC: 6.0%
Source: Federal Housing Finance Agency/Haver Analytics

Virginia House Price Index—FHFA
76
-10
-6
-2
2
6
10
2008 2009 2010 2011 2012 2013 2014 2015 2016 2017 2018 2019 2020
YoY % Chg U.S.
Virginia
1Q: 2020US: 5.0%
VA: 4.9%
Source: Federal Housing Finance Agency/Haver Analytics

West Virginia House Price Index—FHFA
77Source: Federal Housing Finance Agency/Haver Analytics
-9
-6
-3
0
3
6
9
2008 2009 2010 2011 2012 2013 2014 2015 2016 2017 2018 2019 2020
YoY % Chg U.S. West Virginia
1Q: 2020US: 5.0%
WV: 4.5%

Fifth District Housing Starts
78
0
200
400
600
800
1,000
1,200
1,400
1,600
1,800
0
50
100
150
200
250
2008 2009 2010 2011 2012 2013 2014 2015 2016 2017 2018 2019 2020
SAAR, thousandsSAAR, thousands Fifth District (Left Axis)
United States (Right Axis)
Source: Bank of Tokyo-Mitsubishi UFJ/Haver Analytics

Maryland Housing Starts
79
0
200
400
600
800
1,000
1,200
1,400
1,600
1,800
0
5
10
15
20
25
30
35
2008 2009 2010 2011 2012 2013 2014 2015 2016 2017 2018 2019 2020
SAAR, thousandsSAAR, thousands Maryland (Left Axis)
United States (Right Axis)
Source: Bank of Tokyo-Mitsubishi UFJ/Haver Analytics
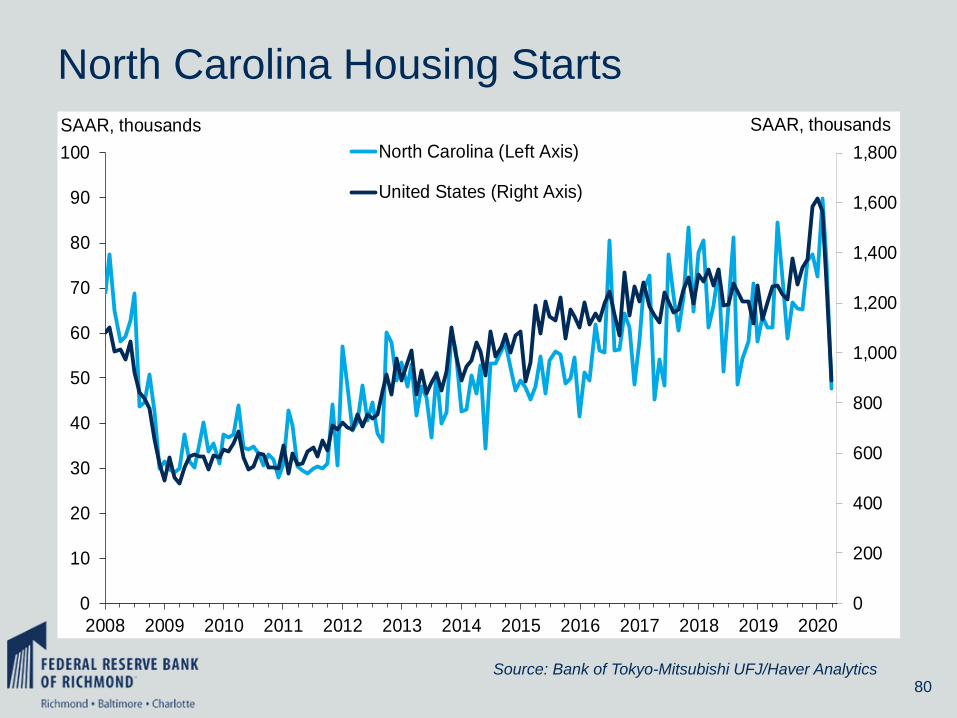
North Carolina Housing Starts
80
0
200
400
600
800
1,000
1,200
1,400
1,600
1,800
0
10
20
30
40
50
60
70
80
90
100
2008 2009 2010 2011 2012 2013 2014 2015 2016 2017 2018 2019 2020
SAAR, thousandsSAAR, thousands
North Carolina (Left Axis)
United States (Right Axis)
Source: Bank of Tokyo-Mitsubishi UFJ/Haver Analytics

South Carolina Housing Starts
81Source: Bank of Tokyo-Mitsubishi UFJ/Haver Analytics
0
200
400
600
800
1,000
1,200
1,400
1,600
1,800
0
10
20
30
40
50
60
2008 2009 2010 2011 2012 2013 2014 2015 2016 2017 2018 2019 2020
SAAR, thousandsSAAR, thousands South Carolina (Left Axis)
United States (Right Axis)

Virginia Housing Starts
82
0
200
400
600
800
1,000
1,200
1,400
1,600
1,800
0
5
10
15
20
25
30
35
40
45
2008 2009 2010 2011 2012 2013 2014 2015 2016 2017 2018 2019 2020
SAAR, thousandsSAAR, thousands Virginia (Left Axis)
United States (Right Axis)
Source: Bank of Tokyo-Mitsubishi UFJ/Haver Analytics

West Virginia Housing Starts
83Source: Bank of Tokyo-Mitsubishi UFJ/Haver Analytics
0
200
400
600
800
1,000
1,200
1,400
1,600
1,800
0
1
2
3
4
5
6
7
8
2008 2009 2010 2011 2012 2013 2014 2015 2016 2017 2018 2019 2020
SAAR, thousandsSAAR, thousands
West Virginia (Left Axis)
United States (Right Axis)

Fifth District Mortgage Delinquency Rate90+ days delinquent
84
0
1
2
3
4
5
6
7
8
9
10
2008 2009 2010 2011 2012 2013 2014 2015 2016 2017 2018 2019 2020
Percent Conventional Adjustable Rate Mortgages
Total Mortgages
Conventional Fixed Rate Mortgages
1Q: 2020Adjustable Rate: 1.7%
Total: 1.0%Fixed Rate: 0.7%
Source: Mortgage Bankers Association/Haver Analytics

D.C. Mortgage Delinquency Rate90+ days delinquent
85
0
1
2
3
4
5
6
7
2008 2009 2010 2011 2012 2013 2014 2015 2016 2017 2018 2019 2020
Percent Conventional Adjustable Rate Mortgages
Total Mortgages
Conventional Fixed Rate Mortgages
1Q: 2020Adjustable Rate: 1.3%
Total: 0.7%Fixed Rate: 0.5%
Source: Mortgage Bankers Association/Haver Analytics

Maryland Mortgage Delinquency Rate90+ days delinquent
86
0
2
4
6
8
10
12
14
2008 2009 2010 2011 2012 2013 2014 2015 2016 2017 2018 2019 2020
Percent Conventional Adjustable Rate Mortgages
Total Mortgages
Conventional Fixed Rate Mortgages
1Q: 2020Adjustable Rate: 2.4%
Total: 1.2%Fixed Rate: 0.8%
Source: Mortgage Bankers Association/Haver Analytics

North Carolina Mortgage Delinquency Rate90+ days delinquent
87
0
1
2
3
4
5
6
7
8
9
2008 2009 2010 2011 2012 2013 2014 2015 2016 2017 2018 2019 2020
Percent Conventional Adjustable Rate Mortgages
Total Mortgages
Conventional Fixed Rate Mortgages
1Q: 2020Adjustable Rate: 1.4%
Total: 0.9%Fixed Rate: 0.7%
Source: Mortgage Bankers Association/Haver Analytics

South Carolina Mortgage Delinquency Rate90+ days delinquent
88
0
1
2
3
4
5
6
7
8
2008 2009 2010 2011 2012 2013 2014 2015 2016 2017 2018 2019 2020
Percent Conventional Adjustable Rate Mortgages
Total Mortgages
Conventional Fixed Rate Mortgages
1Q: 2020Adjustable Rate: 1.5%
Total: 1.1%Fixed Rate: 0.7%
Source: Mortgage Bankers Association/Haver Analytics

Virginia Mortgage Delinquency Rate90+ days delinquent
89
0
1
2
3
4
5
6
7
8
9
2008 2009 2010 2011 2012 2013 2014 2015 2016 2017 2018 2019 2020
Percent Conventional Adjustable Rate Mortgages
Total Mortgages
Conventional Fixed Rate Mortgages
1Q: 2020Adjustable Rate: 1.4%
Total: 0.8%Fixed Rate: 0.5%
Source: Mortgage Bankers Association/Haver Analytics

West Virginia Mortgage Delinquency Rate90+ days delinquent
90
0
1
2
3
4
5
6
7
8
9
10
2008 2009 2010 2011 2012 2013 2014 2015 2016 2017 2018 2019 2020
Percent Conventional Adjustable Rate Mortgages
Total Mortgages
Conventional Fixed Rate Mortgages
1Q: 2020Adjustable Rate: 2.3%
Total: 1.2%Fixed Rate: 1.0%
Source: Mortgage Bankers Association/Haver Analytics

Fifth District Foreclosure Inventory Rate
91
0
1
2
3
4
5
6
7
8
9
10
2008 2009 2010 2011 2012 2013 2014 2015 2016 2017 2018 2019 2020
Percent Conventional Adjustable Rate Mortgages
Total Mortgages
Conventional Fixed Rate Mortgages
1Q: 2020Adjustable Rate: 1.3%
Total: 0.6%Fixed Rate: 0.4%
Source: Mortgage Bankers Association/Haver Analytics

D.C. Foreclosure Inventory Rate
92
0
1
2
3
4
5
6
7
8
2008 2009 2010 2011 2012 2013 2014 2015 2016 2017 2018 2019 2020
Percent
Conventional Adjustable Rate Mortgages
Total Mortgages
Conventional Fixed Rate Mortgages
1Q:2020Adjustable Rate: 1.6%
Total: 0.8%Fixed Rate: 0.5%
Source: Mortgage Bankers Association/Haver Analytics

Maryland Foreclosure Inventory Rate
93
0
2
4
6
8
10
12
14
2008 2009 2010 2011 2012 2013 2014 2015 2016 2017 2018 2019 2020
Percent Conventional Adjustable Rate Mortgages
Total Mortgages
Conventional Fixed Rate Mortgages
1Q: 2020Adjustable Rate: 2.1%
Total: 1.0%Fixed Rate: 0.7%
Source: Mortgage Bankers Association/Haver Analytics

North Carolina Foreclosure Inventory Rate
94
0
1
2
3
4
5
6
7
8
9
2008 2009 2010 2011 2012 2013 2014 2015 2016 2017 2018 2019 2020
Percent Conventional Adjustable Rate Mortgages
Total Mortgages
Conventional Fixed Rate Mortgages
1Q: 2020Adjustable Rate: 0.9%
Total: 0.5%Fixed Rate: 0.4%
Source: Mortgage Bankers Association/Haver Analytics
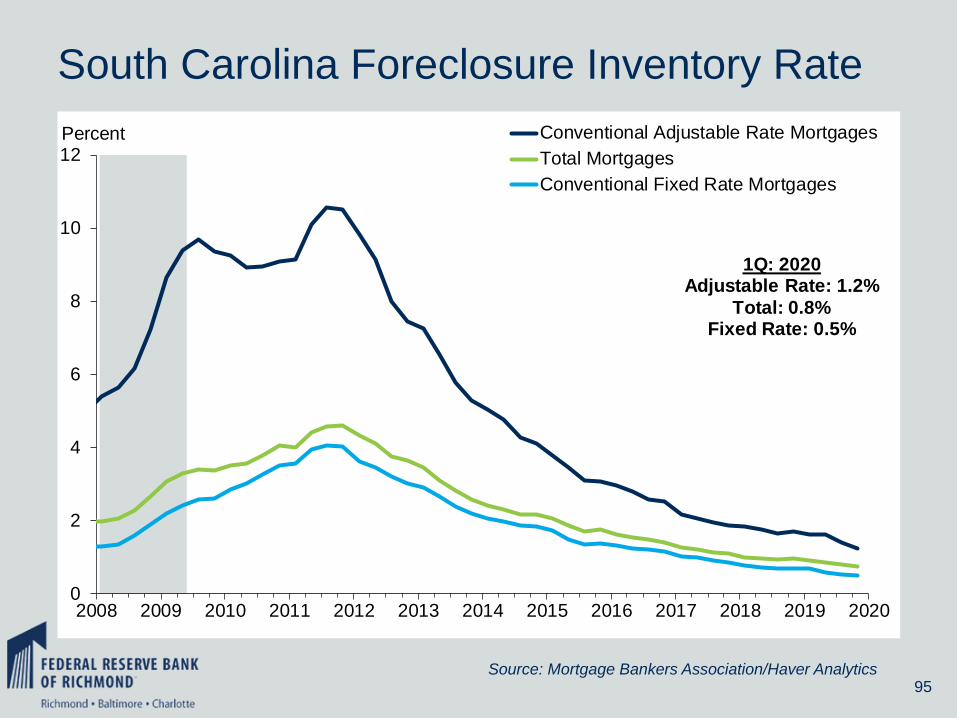
South Carolina Foreclosure Inventory Rate
95
0
2
4
6
8
10
12
2008 2009 2010 2011 2012 2013 2014 2015 2016 2017 2018 2019 2020
Percent Conventional Adjustable Rate Mortgages
Total Mortgages
Conventional Fixed Rate Mortgages
1Q: 2020Adjustable Rate: 1.2%
Total: 0.8%Fixed Rate: 0.5%
Source: Mortgage Bankers Association/Haver Analytics

Virginia Foreclosure Inventory Rate
96
0
1
2
3
4
5
6
7
8
2008 2009 2010 2011 2012 2013 2014 2015 2016 2017 2018 2019 2020
Percent Conventional Adjustable Rate Mortgages
Total Mortgages
Conventional Fixed Rate Mortgages
1Q: 2020Adjustable Rate: 0.8%
Total: 0.4%Fixed Rate: 0.2%
Source: Mortgage Bankers Association/Haver Analytics

West Virginia Foreclosure Inventory Rate
97
0
1
2
3
4
5
6
7
8
9
10
2008 2009 2010 2011 2012 2013 2014 2015 2016 2017 2018 2019 2020
Percent Conventional Adjustable Rate Mortgages
Total Mortgages
Conventional Fixed Rate Mortgages
1Q: 2020Adjustable Rate: 0.8%
Total: 0.8%Fixed Rate: 0.5%
Source: Mortgage Bankers Association/Haver Analytics

Fifth District Foreclosure Starts Rate
98
0
1
2
3
2008 2009 2010 2011 2012 2013 2014 2015 2016 2017 2018 2019 2020
Percent Conventional Adjustable Rate Mortgages
Total Mortgages
Conventional Fixed Rate Mortgages
1Q: 2020Adjustable Rate: 0.3%
Total: 0.2%Fixed Rate: 0.1%
Source: Mortgage Bankers Association/Haver Analytics

D.C. Foreclosure Starts Rate
99
0
1
2
3
2008 2009 2010 2011 2012 2013 2014 2015 2016 2017 2018 2019 2020
Percent Conventional Adjustable Rate Mortgages
Total Mortgages
Conventional Fixed Rate Mortgages
1Q: 2020Adjustable Rate: 0.3%
Total: 0.2%Fixed Rate: 0.1%
Source: Mortgage Bankers Association/Haver Analytics

Maryland Foreclosure Starts Rate
100
0
1
2
3
4
5
6
2008 2009 2010 2011 2012 2013 2014 2015 2016 2017 2018 2019 2020
Percent Conventional Adjustable Rate Mortgages
Total Mortgages
Conventional Fixed Rate Mortgages
1Q: 2020Adjustable Rate: 0.4%
Total: 0.2%Fixed Rate: 0.2%
Source: Mortgage Bankers Association/Haver Analytics

North Carolina Foreclosure Starts Rate
101
0
1
2
3
2008 2009 2010 2011 2012 2013 2014 2015 2016 2017 2018 2019 2020
Percent Conventional Adjustable Rate Mortgages
Total Mortgages
Conventional Fixed Rate Mortgages
1Q: 2020Adjustable Rate: 0.3%
Total: 0.2%Fixed Rate: 0.1%
Source: Mortgage Bankers Association/Haver Analytics

South Carolina Foreclosure Starts Rate
102
0
1
2
3
2008 2009 2010 2011 2012 2013 2014 2015 2016 2017 2018 2019 2020
Percent Conventional Adjustable Rate Mortgages
Total Mortgages
Conventional Fixed Rate Mortgages
1Q: 2020Adjustable Rate: 0.3%
Total: 0.2%Fixed Rate: 0.1%
Source: Mortgage Bankers Association/Haver Analytics

Virginia Foreclosure Starts Rate
103
0
1
2
3
2008 2009 2010 2011 2012 2013 2014 2015 2016 2017 2018 2019 2020
Percent Conventional Adjustable Rate Mortgages
Total Mortgages
Conventional Fixed Rate Mortgages
1Q: 2020Adjustable Rate: 0.3%
Total: 0.2%Fixed Rate: 0.1%
Source: Mortgage Bankers Association/Haver Analytics

West Virginia Foreclosure Starts Rate
104Source: Mortgage Bankers Association/Haver Analytics
0
1
2
3
2008 2009 2010 2011 2012 2013 2014 2015 2016 2017 2018 2019 2020
Percent Conventional Adjustable Rate Mortgages
Total Mortgages
Conventional Fixed Rate Mortgages
1Q: 2020Adjustable Rate: 0.4%
Total: 0.3%Fixed Rate: 0.1%